Cortland, OH
Cortland Map
Cortland Overview
7,073
TOTAL POPULATION
3,382
MALE POPULATION
3,691
FEMALE POPULATION
91.63
MALES / 100 FEMALES
109.14
FEMALES / 100 MALES
51.4
MEDIAN AGE
2.8
AVG FAMILY SIZE
2.2
AVG HOUSEHOLD SIZE
$39,565
PER CAPITA INCOME
$86,607
AVG FAMILY INCOME
$60,767
AVG HOUSEHOLD INCOME
25.9%
WAGE / INCOME GAP [ % ]
74.1¢/ $1
WAGE / INCOME GAP [ $ ]
0.44
INEQUALITY / GINI INDEX
3,246
LABOR FORCE [ PEOPLE ]
55.2%
PERCENT IN LABOR FORCE
1.6%
UNEMPLOYMENT RATE
Cortland Zip Codes
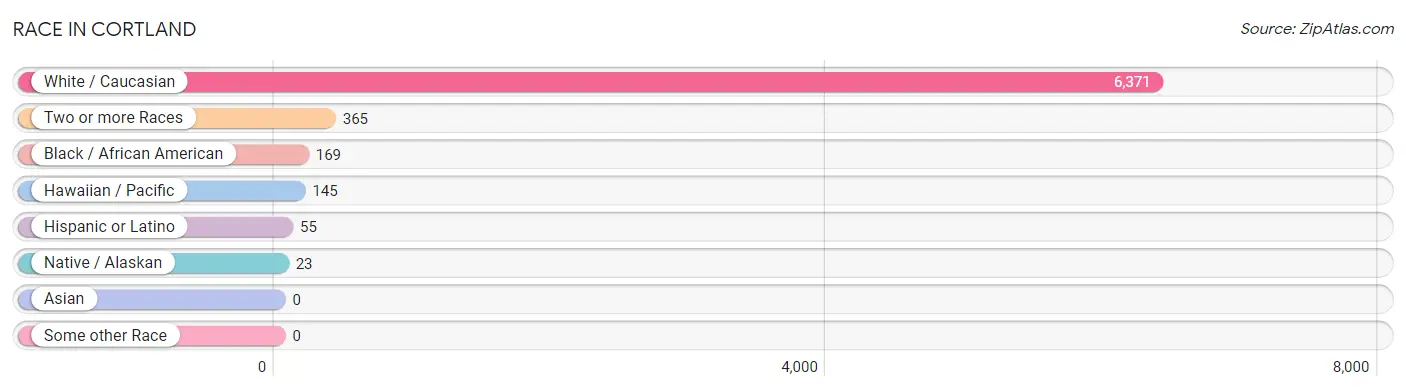
Race in Cortland
The most populous races in Cortland are White / Caucasian (6,371 | 90.1%), Two or more Races (365 | 5.2%), and Black / African American (169 | 2.4%).
| Race | # Population | % Population |
| Asian | 0 | 0.0% |
| Black / African American | 169 | 2.4% |
| Hawaiian / Pacific | 145 | 2.1% |
| Hispanic or Latino | 55 | 0.8% |
| Native / Alaskan | 23 | 0.3% |
| White / Caucasian | 6,371 | 90.1% |
| Two or more Races | 365 | 5.2% |
| Some other Race | 0 | 0.0% |
| Total | 7,073 | 100.0% |
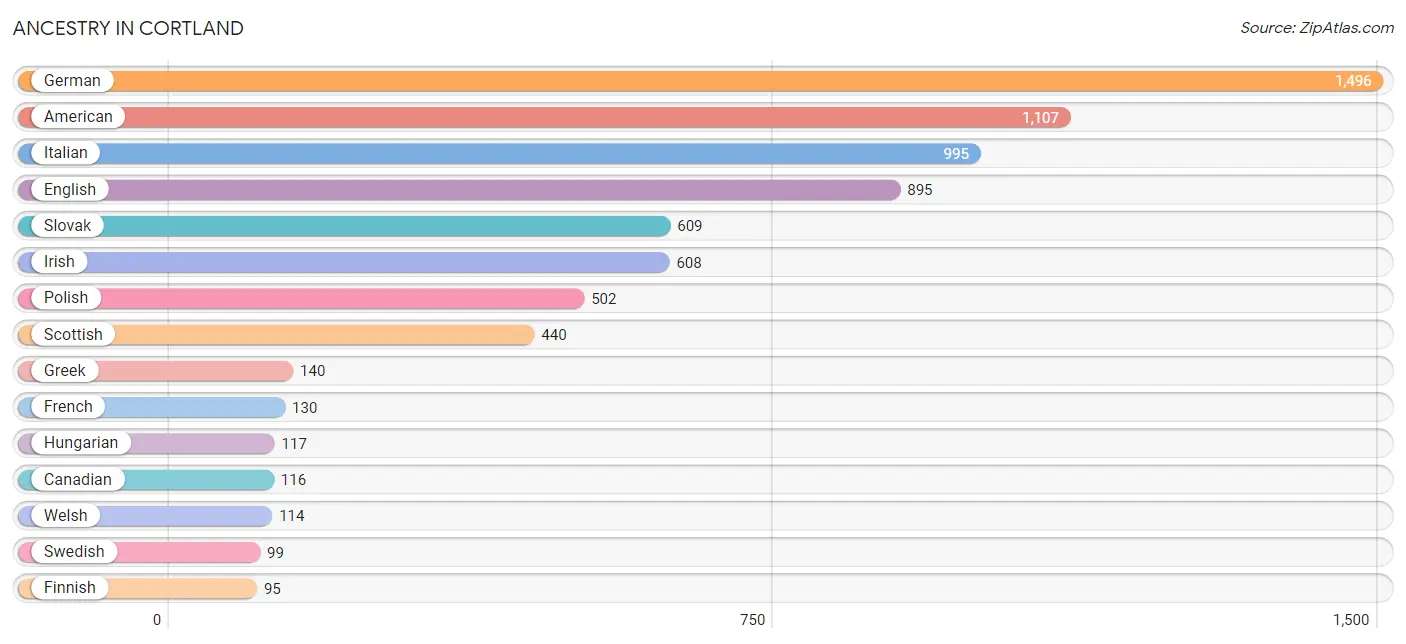
Ancestry in Cortland
The most populous ancestries reported in Cortland are German (1,496 | 21.1%), American (1,107 | 15.7%), Italian (995 | 14.1%), English (895 | 12.7%), and Slovak (609 | 8.6%), together accounting for 72.1% of all Cortland residents.
| Ancestry | # Population | % Population |
| American | 1,107 | 15.7% |
| Arab | 28 | 0.4% |
| British | 51 | 0.7% |
| Canadian | 116 | 1.6% |
| Carpatho Rusyn | 16 | 0.2% |
| Cherokee | 23 | 0.3% |
| Croatian | 77 | 1.1% |
| Czech | 58 | 0.8% |
| Czechoslovakian | 18 | 0.3% |
| Dutch | 46 | 0.6% |
| Egyptian | 5 | 0.1% |
| English | 895 | 12.7% |
| European | 41 | 0.6% |
| Finnish | 95 | 1.3% |
| French | 130 | 1.8% |
| French Canadian | 17 | 0.2% |
| German | 1,496 | 21.1% |
| Greek | 140 | 2.0% |
| Hungarian | 117 | 1.7% |
| Irish | 608 | 8.6% |
| Italian | 995 | 14.1% |
| Lebanese | 11 | 0.2% |
| Mexican | 35 | 0.5% |
| Norwegian | 87 | 1.2% |
| Palestinian | 12 | 0.2% |
| Polish | 502 | 7.1% |
| Puerto Rican | 2 | 0.0% |
| Romanian | 26 | 0.4% |
| Russian | 24 | 0.3% |
| Scandinavian | 16 | 0.2% |
| Scotch-Irish | 90 | 1.3% |
| Scottish | 440 | 6.2% |
| Serbian | 5 | 0.1% |
| Slovak | 609 | 8.6% |
| Slovene | 20 | 0.3% |
| Spaniard | 18 | 0.3% |
| Swedish | 99 | 1.4% |
| Ukrainian | 52 | 0.7% |
| Welsh | 114 | 1.6% | View All 39 Rows |
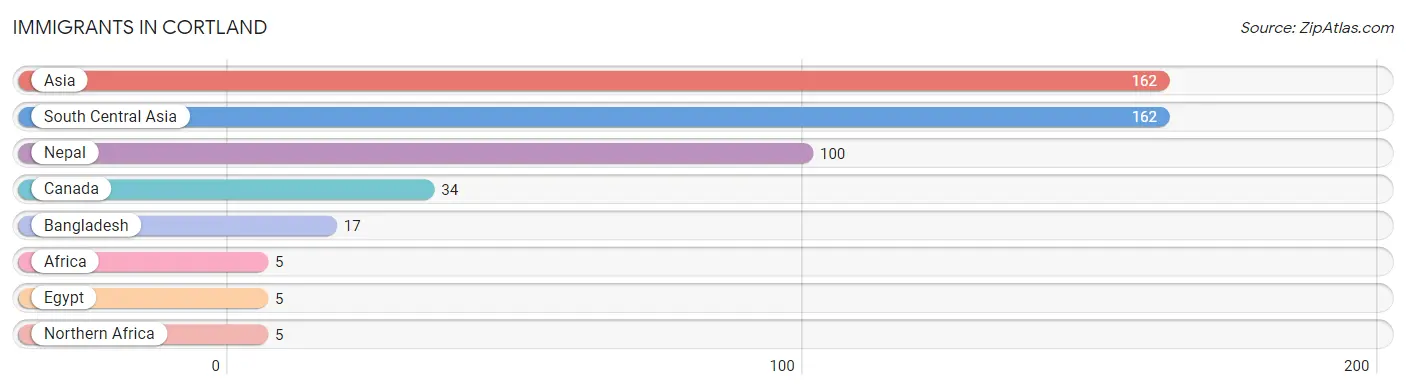
Immigrants in Cortland
The most numerous immigrant groups reported in Cortland came from Asia (162 | 2.3%), South Central Asia (162 | 2.3%), Nepal (100 | 1.4%), Canada (34 | 0.5%), and Bangladesh (17 | 0.2%), together accounting for 6.7% of all Cortland residents.
| Immigration Origin | # Population | % Population |
| Africa | 5 | 0.1% |
| Asia | 162 | 2.3% |
| Bangladesh | 17 | 0.2% |
| Canada | 34 | 0.5% |
| Egypt | 5 | 0.1% |
| Nepal | 100 | 1.4% |
| Northern Africa | 5 | 0.1% |
| South Central Asia | 162 | 2.3% | View All 8 Rows |
Sex and Age in Cortland
Sex and Age in Cortland
The most populous age groups in Cortland are 70 to 74 Years (352 | 10.4%) for men and 70 to 74 Years (435 | 11.8%) for women.
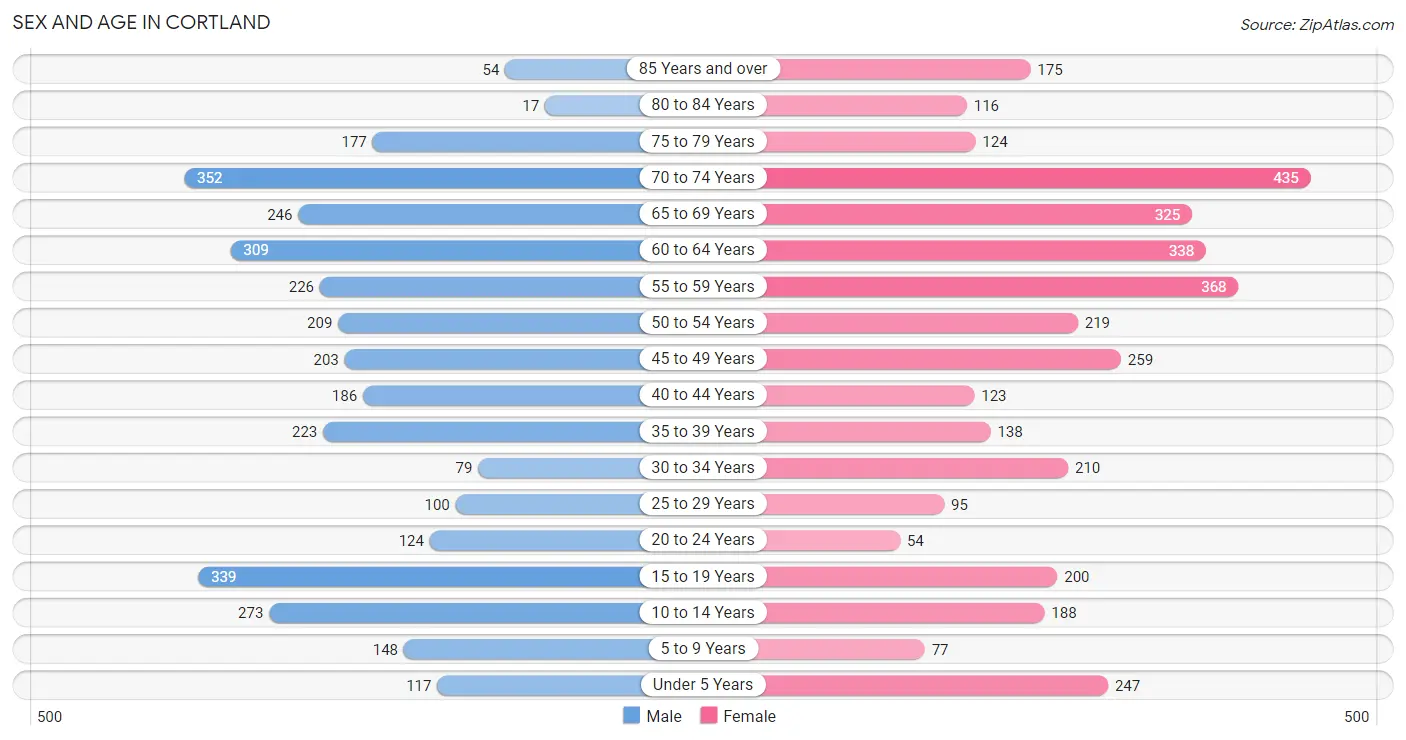
| Age Bracket | Male | Female |
| Under 5 Years | 117 (3.5%) | 247 (6.7%) |
| 5 to 9 Years | 148 (4.4%) | 77 (2.1%) |
| 10 to 14 Years | 273 (8.1%) | 188 (5.1%) |
| 15 to 19 Years | 339 (10.0%) | 200 (5.4%) |
| 20 to 24 Years | 124 (3.7%) | 54 (1.5%) |
| 25 to 29 Years | 100 (3.0%) | 95 (2.6%) |
| 30 to 34 Years | 79 (2.3%) | 210 (5.7%) |
| 35 to 39 Years | 223 (6.6%) | 138 (3.7%) |
| 40 to 44 Years | 186 (5.5%) | 123 (3.3%) |
| 45 to 49 Years | 203 (6.0%) | 259 (7.0%) |
| 50 to 54 Years | 209 (6.2%) | 219 (5.9%) |
| 55 to 59 Years | 226 (6.7%) | 368 (10.0%) |
| 60 to 64 Years | 309 (9.1%) | 338 (9.2%) |
| 65 to 69 Years | 246 (7.3%) | 325 (8.8%) |
| 70 to 74 Years | 352 (10.4%) | 435 (11.8%) |
| 75 to 79 Years | 177 (5.2%) | 124 (3.4%) |
| 80 to 84 Years | 17 (0.5%) | 116 (3.1%) |
| 85 Years and over | 54 (1.6%) | 175 (4.7%) |
| Total | 3,382 (100.0%) | 3,691 (100.0%) |
Families and Households in Cortland
Median Family Size in Cortland
The median family size in Cortland is 2.75 persons per family, with married-couple families (1,543 | 74.6%) accounting for the largest median family size of 2.88 persons per family. On the other hand, single female/mother families (382 | 18.5%) represent the smallest median family size with 2.34 persons per family.
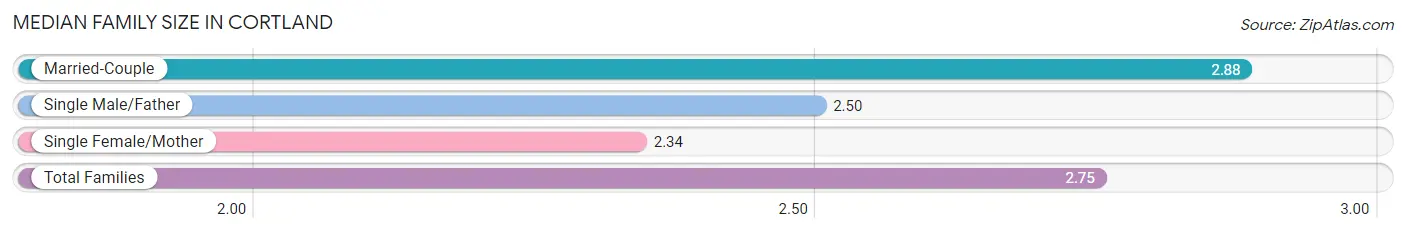
| Family Type | # Families | Family Size |
| Married-Couple | 1,543 (74.6%) | 2.88 |
| Single Male/Father | 144 (7.0%) | 2.50 |
| Single Female/Mother | 382 (18.5%) | 2.34 |
| Total Families | 2,069 (100.0%) | 2.75 |
Median Household Size in Cortland
The median household size in Cortland is 2.16 persons per household, with married-couple households (1,543 | 47.8%) accounting for the largest median household size of 2.88 persons per household. non-family households (1,159 | 35.9%) represent the smallest median household size with 1.04 persons per household.
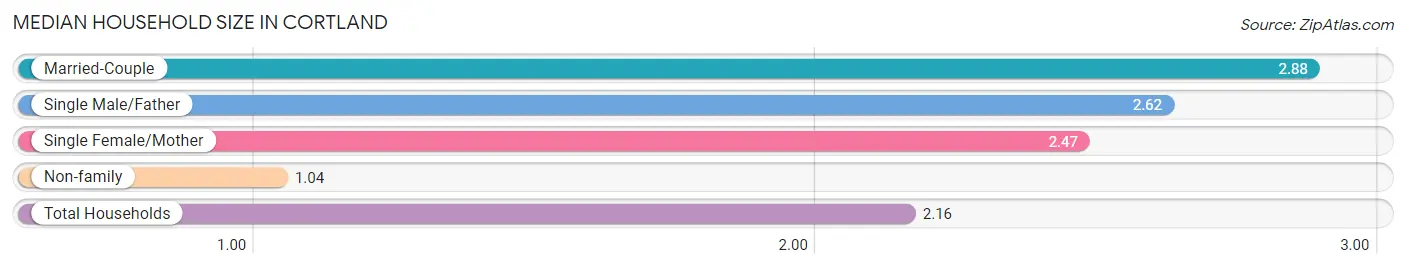
| Household Type | # Households | Household Size |
| Married-Couple | 1,543 (47.8%) | 2.88 |
| Single Male/Father | 144 (4.5%) | 2.62 |
| Single Female/Mother | 382 (11.8%) | 2.47 |
| Non-family | 1,159 (35.9%) | 1.04 |
| Total Households | 3,228 (100.0%) | 2.16 |
Household Size by Marriage Status in Cortland
Out of a total of 3,228 households in Cortland, 2,069 (64.1%) are family households, while 1,159 (35.9%) are nonfamily households. The most numerous type of family households are 2-person households, comprising 1,245, and the most common type of nonfamily households are 1-person households, comprising 1,114.
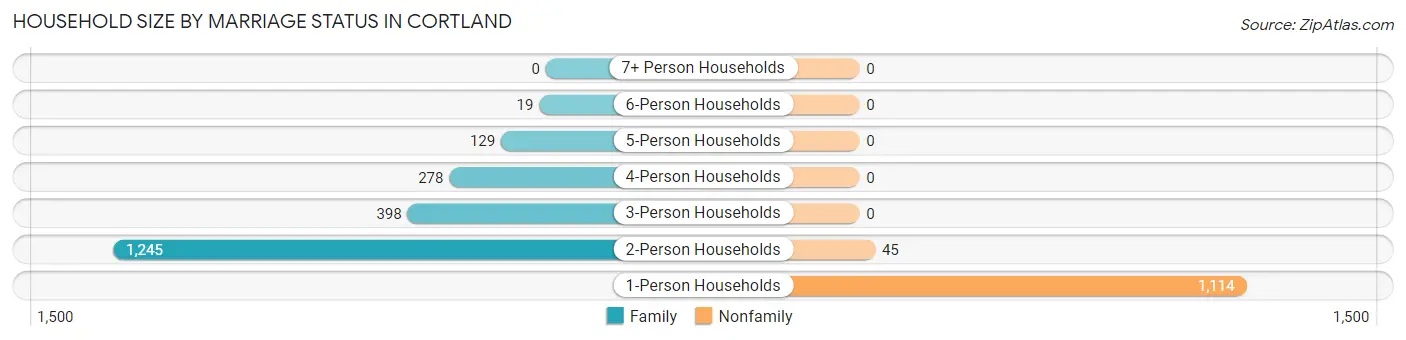
| Household Size | Family Households | Nonfamily Households |
| 1-Person Households | - | 1,114 (34.5%) |
| 2-Person Households | 1,245 (38.6%) | 45 (1.4%) |
| 3-Person Households | 398 (12.3%) | 0 (0.0%) |
| 4-Person Households | 278 (8.6%) | 0 (0.0%) |
| 5-Person Households | 129 (4.0%) | 0 (0.0%) |
| 6-Person Households | 19 (0.6%) | 0 (0.0%) |
| 7+ Person Households | 0 (0.0%) | 0 (0.0%) |
| Total | 2,069 (64.1%) | 1,159 (35.9%) |
Female Fertility in Cortland
Fertility by Age in Cortland
Average fertility rate in Cortland is 149.0 births per 1,000 women. Women in the age bracket of 20 to 34 years have the highest fertility rate with 306.0 births per 1,000 women. Women in the age bracket of 20 to 34 years acount for 63.9% of all women with births.
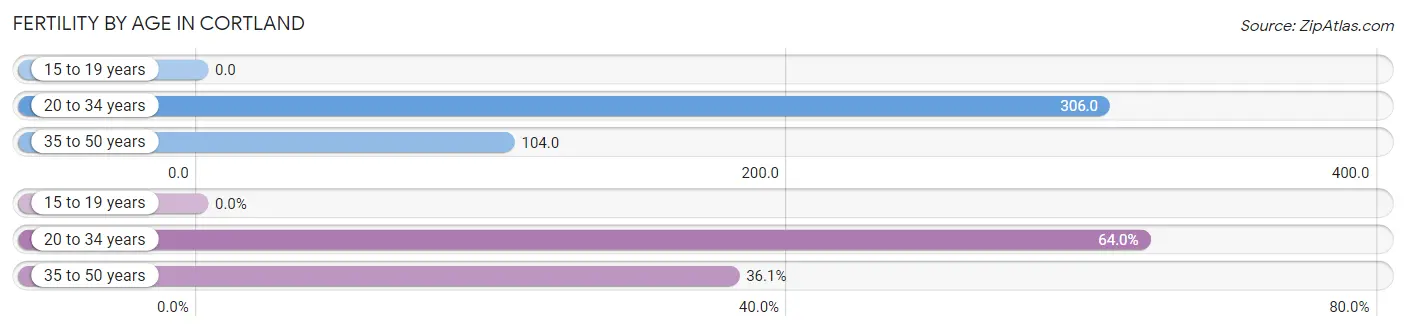
| Age Bracket | Women with Births | Births / 1,000 Women |
| 15 to 19 years | 0 (0.0%) | 0.0 |
| 20 to 34 years | 110 (63.9%) | 306.0 |
| 35 to 50 years | 62 (36.0%) | 104.0 |
| Total | 172 (100.0%) | 149.0 |
Fertility by Age by Marriage Status in Cortland
90.7% of women with births (172) in Cortland are married. The highest percentage of unmarried women with births falls into 20 to 34 years age bracket with 14.5% of them unmarried at the time of birth, while the lowest percentage of unmarried women with births belong to 35 to 50 years age bracket with 0.0% of them unmarried.
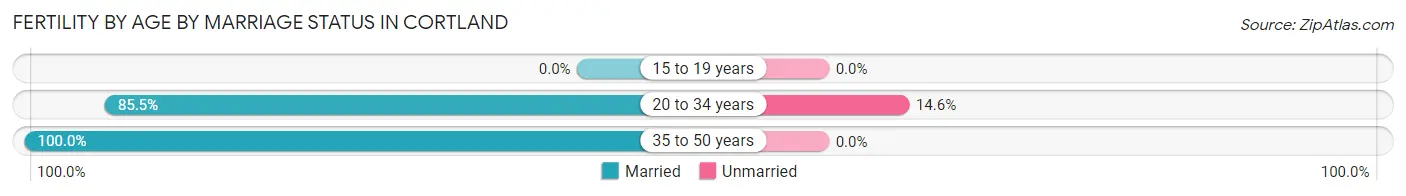
| Age Bracket | Married | Unmarried |
| 15 to 19 years | 0 (0.0%) | 0 (0.0%) |
| 20 to 34 years | 94 (85.5%) | 16 (14.5%) |
| 35 to 50 years | 62 (100.0%) | 0 (0.0%) |
| Total | 156 (90.7%) | 16 (9.3%) |
Fertility by Education in Cortland
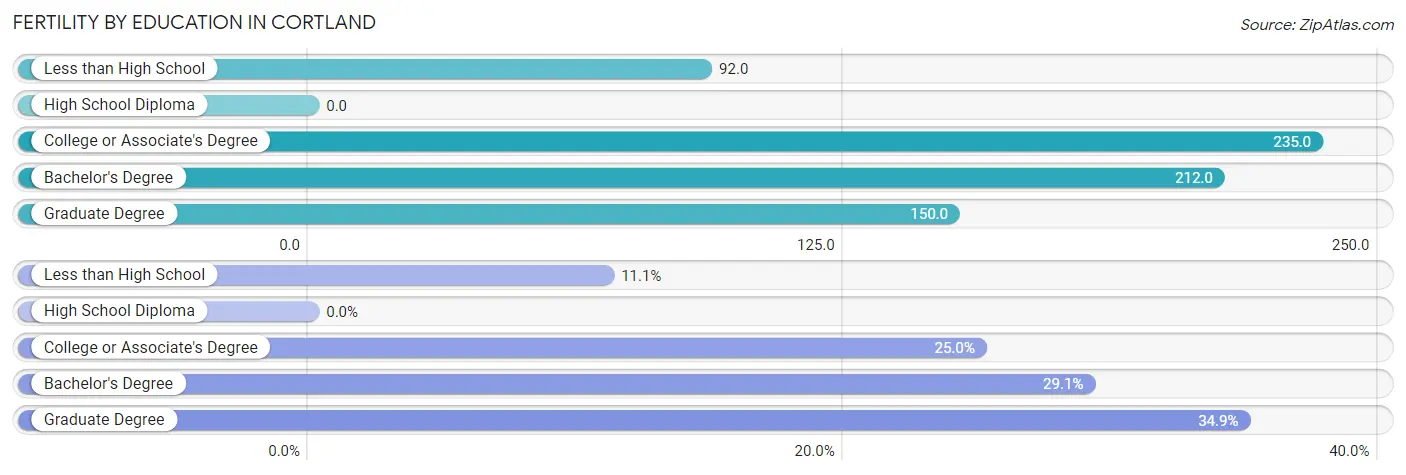
| Educational Attainment | Women with Births | Births / 1,000 Women |
| Less than High School | 19 (11.1%) | 92.0 |
| High School Diploma | 0 (0.0%) | 0.0 |
| College or Associate's Degree | 43 (25.0%) | 235.0 |
| Bachelor's Degree | 50 (29.1%) | 212.0 |
| Graduate Degree | 60 (34.9%) | 150.0 |
| Total | 172 (100.0%) | 149.0 |
Fertility by Education by Marriage Status in Cortland
9.3% of women with births in Cortland are unmarried. Women with the educational attainment of less than high school are most likely to be married with 100.0% of them married at childbirth, while women with the educational attainment of college or associate's degree are least likely to be married with 37.2% of them unmarried at childbirth.
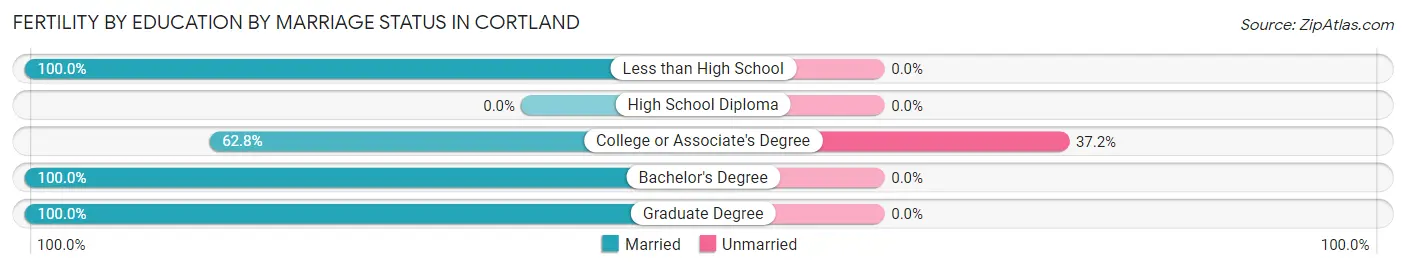
| Educational Attainment | Married | Unmarried |
| Less than High School | 19 (100.0%) | 0 (0.0%) |
| High School Diploma | 0 (0.0%) | 0 (0.0%) |
| College or Associate's Degree | 27 (62.8%) | 16 (37.2%) |
| Bachelor's Degree | 50 (100.0%) | 0 (0.0%) |
| Graduate Degree | 60 (100.0%) | 0 (0.0%) |
| Total | 156 (90.7%) | 16 (9.3%) |
Income in Cortland
Income Overview in Cortland
Per Capita Income in Cortland is $39,565, while median incomes of families and households are $86,607 and $60,767 respectively.
| Characteristic | Number | Measure |
| Per Capita Income | 7,073 | $39,565 |
| Median Family Income | 2,069 | $86,607 |
| Mean Family Income | 2,069 | $107,001 |
| Median Household Income | 3,228 | $60,767 |
| Mean Household Income | 3,228 | $84,488 |
| Income Deficit | 2,069 | $0 |
| Wage / Income Gap (%) | 7,073 | 25.94% |
| Wage / Income Gap ($) | 7,073 | 74.06¢ per $1 |
| Gini / Inequality Index | 7,073 | 0.44 |
Earnings by Sex in Cortland
Average Earnings in Cortland are $53,625, $58,173 for men and $43,083 for women, a difference of 25.9%.
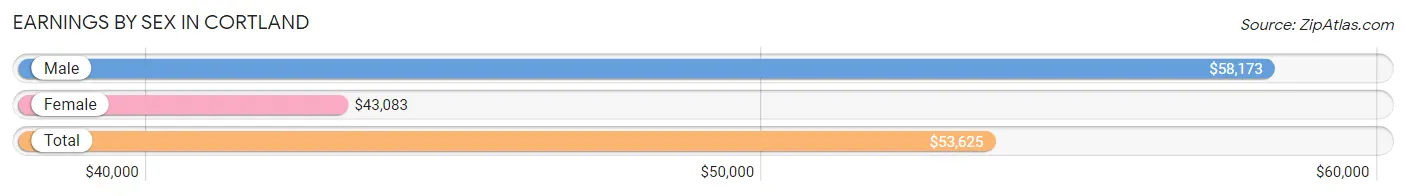
| Sex | Number | Average Earnings |
| Male | 1,688 (51.8%) | $58,173 |
| Female | 1,570 (48.2%) | $43,083 |
| Total | 3,258 (100.0%) | $53,625 |
Earnings by Sex by Income Bracket in Cortland
The most common earnings brackets in Cortland are $100,000+ for men (304 | 18.0%) and $55,000 to $64,999 for women (363 | 23.1%).
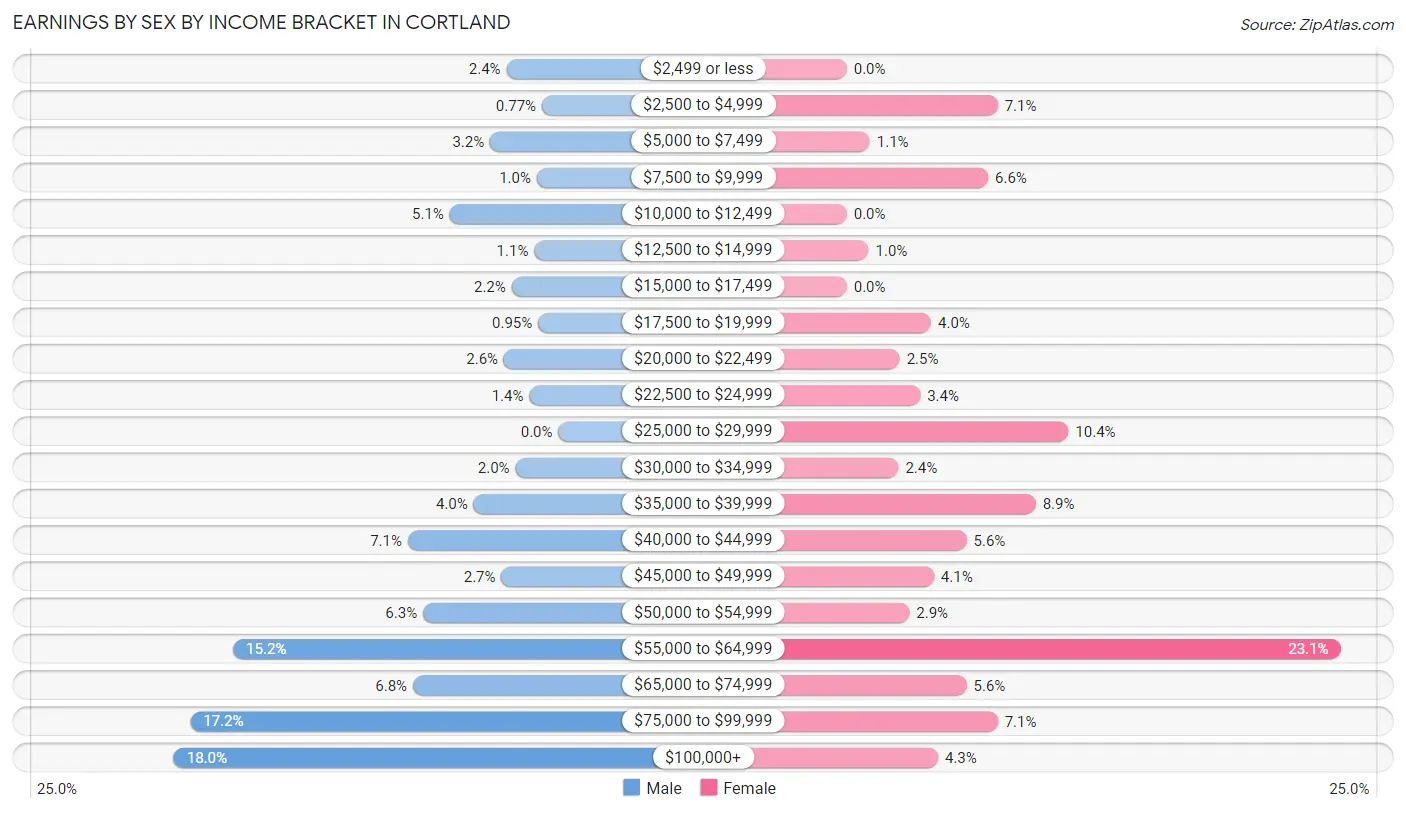
| Income | Male | Female |
| $2,499 or less | 41 (2.4%) | 0 (0.0%) |
| $2,500 to $4,999 | 13 (0.8%) | 111 (7.1%) |
| $5,000 to $7,499 | 54 (3.2%) | 17 (1.1%) |
| $7,500 to $9,999 | 17 (1.0%) | 104 (6.6%) |
| $10,000 to $12,499 | 86 (5.1%) | 0 (0.0%) |
| $12,500 to $14,999 | 19 (1.1%) | 16 (1.0%) |
| $15,000 to $17,499 | 37 (2.2%) | 0 (0.0%) |
| $17,500 to $19,999 | 16 (0.9%) | 62 (4.0%) |
| $20,000 to $22,499 | 43 (2.5%) | 39 (2.5%) |
| $22,500 to $24,999 | 23 (1.4%) | 54 (3.4%) |
| $25,000 to $29,999 | 0 (0.0%) | 163 (10.4%) |
| $30,000 to $34,999 | 34 (2.0%) | 38 (2.4%) |
| $35,000 to $39,999 | 67 (4.0%) | 139 (8.8%) |
| $40,000 to $44,999 | 119 (7.0%) | 88 (5.6%) |
| $45,000 to $49,999 | 45 (2.7%) | 64 (4.1%) |
| $50,000 to $54,999 | 107 (6.3%) | 46 (2.9%) |
| $55,000 to $64,999 | 257 (15.2%) | 363 (23.1%) |
| $65,000 to $74,999 | 115 (6.8%) | 88 (5.6%) |
| $75,000 to $99,999 | 291 (17.2%) | 111 (7.1%) |
| $100,000+ | 304 (18.0%) | 67 (4.3%) |
| Total | 1,688 (100.0%) | 1,570 (100.0%) |
Earnings by Sex by Educational Attainment in Cortland
Average earnings in Cortland are $58,982 for men and $45,118 for women, a difference of 23.5%. Men with an educational attainment of bachelor's degree enjoy the highest average annual earnings of $100,047, while those with high school diploma education earn the least with $51,964. Women with an educational attainment of graduate degree earn the most with the average annual earnings of $59,161, while those with high school diploma education have the smallest earnings of $29,405.
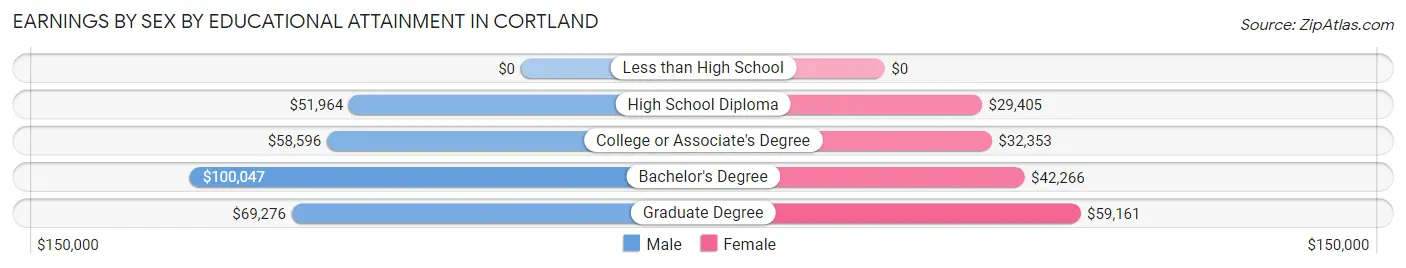
| Educational Attainment | Male Income | Female Income |
| Less than High School | - | - |
| High School Diploma | $51,964 | $29,405 |
| College or Associate's Degree | $58,596 | $32,353 |
| Bachelor's Degree | $100,047 | $42,266 |
| Graduate Degree | $69,276 | $59,161 |
| Total | $58,982 | $45,118 |
Family Income in Cortland
Family Income Brackets in Cortland
According to the Cortland family income data, there are 573 families falling into the $100,000 to $149,999 income range, which is the most common income bracket and makes up 27.7% of all families. Conversely, the $15,000 to $24,999 income bracket is the least frequent group with only 25 families (1.2%) belonging to this category.
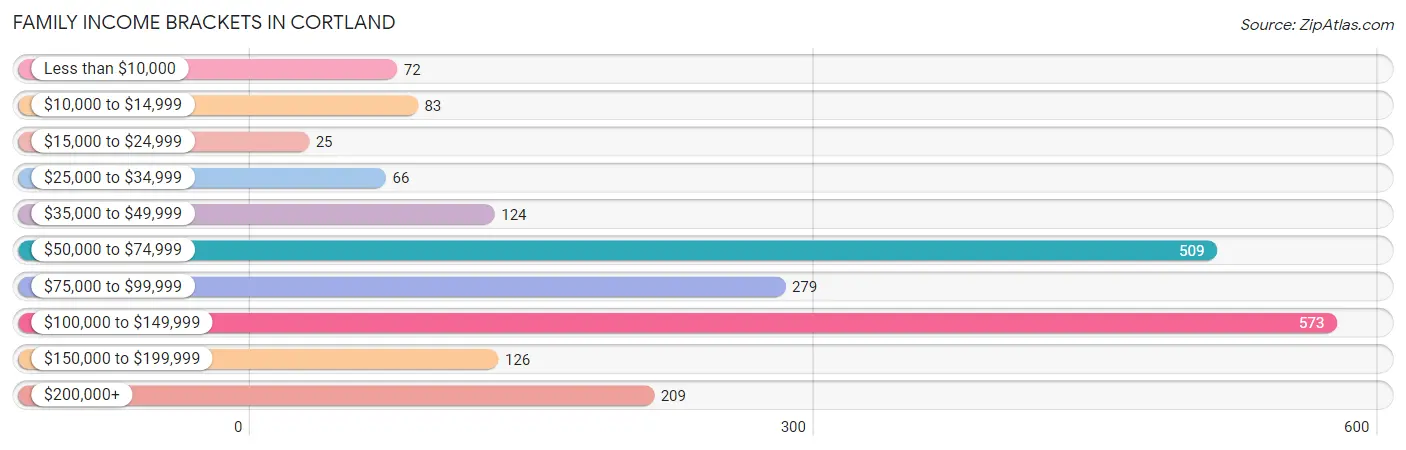
| Income Bracket | # Families | % Families |
| Less than $10,000 | 72 | 3.5% |
| $10,000 to $14,999 | 83 | 4.0% |
| $15,000 to $24,999 | 25 | 1.2% |
| $25,000 to $34,999 | 66 | 3.2% |
| $35,000 to $49,999 | 124 | 6.0% |
| $50,000 to $74,999 | 509 | 24.6% |
| $75,000 to $99,999 | 279 | 13.5% |
| $100,000 to $149,999 | 573 | 27.7% |
| $150,000 to $199,999 | 126 | 6.1% |
| $200,000+ | 209 | 10.1% |
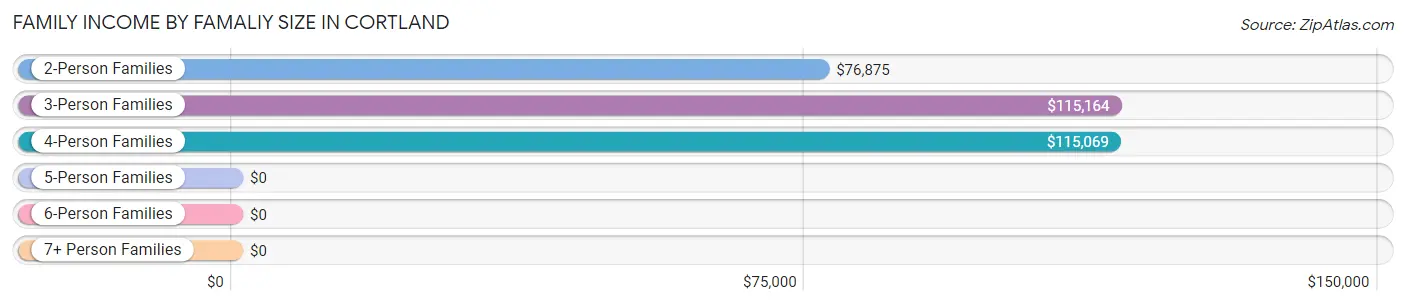
Family Income by Famaliy Size in Cortland
3-person families (347 | 16.8%) account for the highest median family income in Cortland with $115,164 per family, while 2-person families (1,307 | 63.2%) have the highest median income of $38,438 per family member.
| Income Bracket | # Families | Median Income |
| 2-Person Families | 1,307 (63.2%) | $76,875 |
| 3-Person Families | 347 (16.8%) | $115,164 |
| 4-Person Families | 267 (12.9%) | $115,069 |
| 5-Person Families | 129 (6.2%) | $0 |
| 6-Person Families | 19 (0.9%) | $0 |
| 7+ Person Families | 0 (0.0%) | $0 |
| Total | 2,069 (100.0%) | $86,607 |
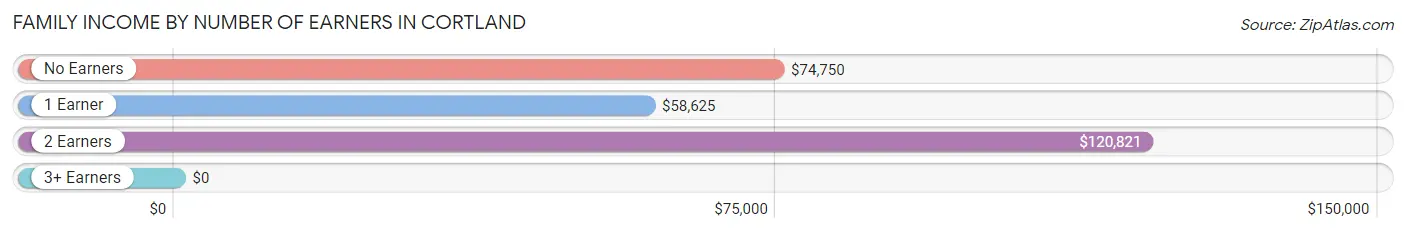
Family Income by Number of Earners in Cortland
| Number of Earners | # Families | Median Income |
| No Earners | 432 (20.9%) | $74,750 |
| 1 Earner | 699 (33.8%) | $58,625 |
| 2 Earners | 827 (40.0%) | $120,821 |
| 3+ Earners | 111 (5.4%) | $0 |
| Total | 2,069 (100.0%) | $86,607 |
Household Income in Cortland
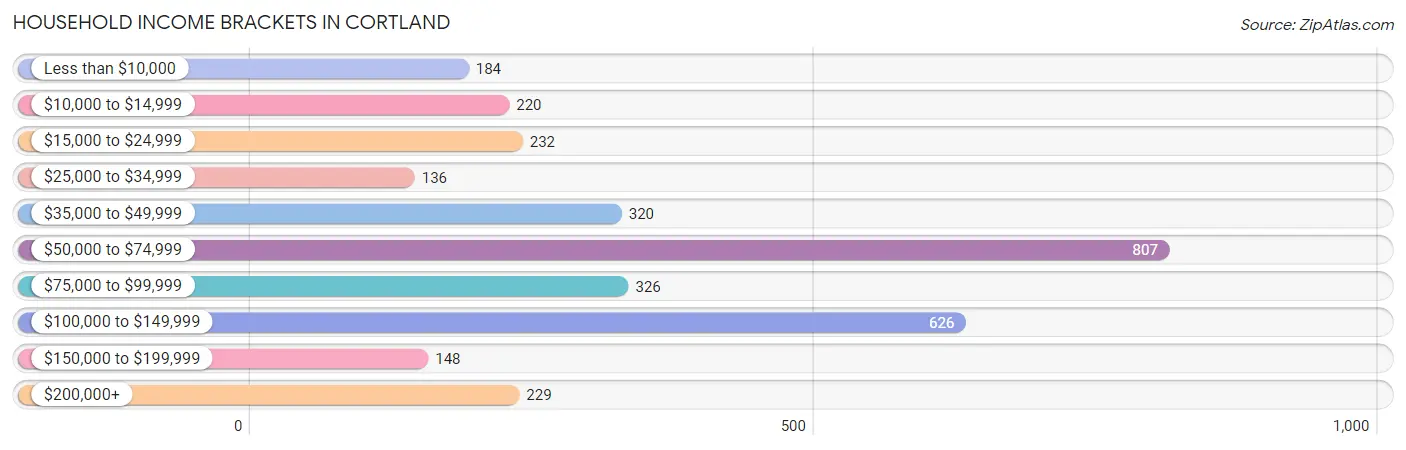
Household Income Brackets in Cortland
With 807 households falling in the category, the $50,000 to $74,999 income range is the most frequent in Cortland, accounting for 25.0% of all households. In contrast, only 136 households (4.2%) fall into the $25,000 to $34,999 income bracket, making it the least populous group.
| Income Bracket | # Households | % Households |
| Less than $10,000 | 184 | 5.7% |
| $10,000 to $14,999 | 220 | 6.8% |
| $15,000 to $24,999 | 232 | 7.2% |
| $25,000 to $34,999 | 136 | 4.2% |
| $35,000 to $49,999 | 320 | 9.9% |
| $50,000 to $74,999 | 807 | 25.0% |
| $75,000 to $99,999 | 326 | 10.1% |
| $100,000 to $149,999 | 626 | 19.4% |
| $150,000 to $199,999 | 148 | 4.6% |
| $200,000+ | 229 | 7.1% |
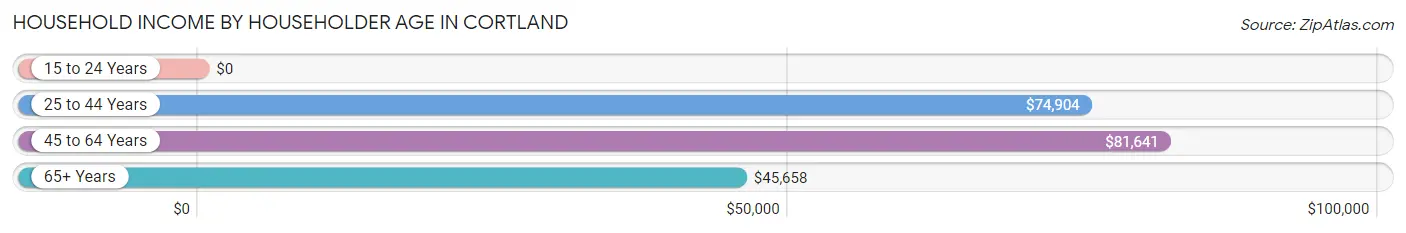
Household Income by Householder Age in Cortland
The median household income in Cortland is $60,767, with the highest median household income of $81,641 found in the 45 to 64 years age bracket for the primary householder. A total of 1,303 households (40.4%) fall into this category. Meanwhile, the 15 to 24 years age bracket for the primary householder has the lowest median household income of $0, with 39 households (1.2%) in this group.
| Income Bracket | # Households | Median Income |
| 15 to 24 Years | 39 (1.2%) | $0 |
| 25 to 44 Years | 608 (18.8%) | $74,904 |
| 45 to 64 Years | 1,303 (40.4%) | $81,641 |
| 65+ Years | 1,278 (39.6%) | $45,658 |
| Total | 3,228 (100.0%) | $60,767 |
Poverty in Cortland
Income Below Poverty by Sex and Age in Cortland
With 10.0% poverty level for males and 10.2% for females among the residents of Cortland, 75 year old and over males and 5 year old females are the most vulnerable to poverty, with 60 males (26.2%) and 13 females (46.4%) in their respective age groups living below the poverty level.
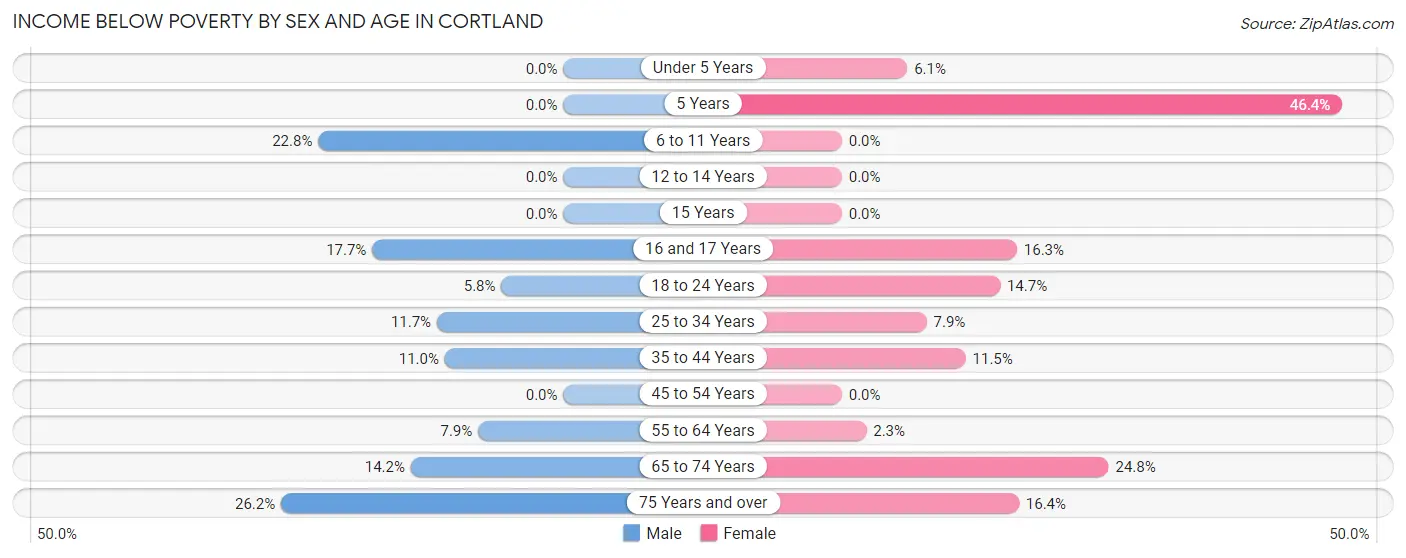
| Age Bracket | Male | Female |
| Under 5 Years | 0 (0.0%) | 15 (6.1%) |
| 5 Years | 0 (0.0%) | 13 (46.4%) |
| 6 to 11 Years | 48 (22.8%) | 0 (0.0%) |
| 12 to 14 Years | 0 (0.0%) | 0 (0.0%) |
| 15 Years | 0 (0.0%) | 0 (0.0%) |
| 16 and 17 Years | 22 (17.7%) | 13 (16.3%) |
| 18 to 24 Years | 15 (5.8%) | 16 (14.7%) |
| 25 to 34 Years | 21 (11.7%) | 24 (7.9%) |
| 35 to 44 Years | 45 (11.0%) | 30 (11.5%) |
| 45 to 54 Years | 0 (0.0%) | 0 (0.0%) |
| 55 to 64 Years | 42 (7.9%) | 16 (2.3%) |
| 65 to 74 Years | 83 (14.2%) | 184 (24.8%) |
| 75 Years and over | 60 (26.2%) | 59 (16.4%) |
| Total | 336 (10.0%) | 370 (10.2%) |
Income Above Poverty by Sex and Age in Cortland
According to the poverty statistics in Cortland, males aged under 5 years and females aged 6 to 11 years are the age groups that are most secure financially, with 100.0% of males and 100.0% of females in these age groups living above the poverty line.
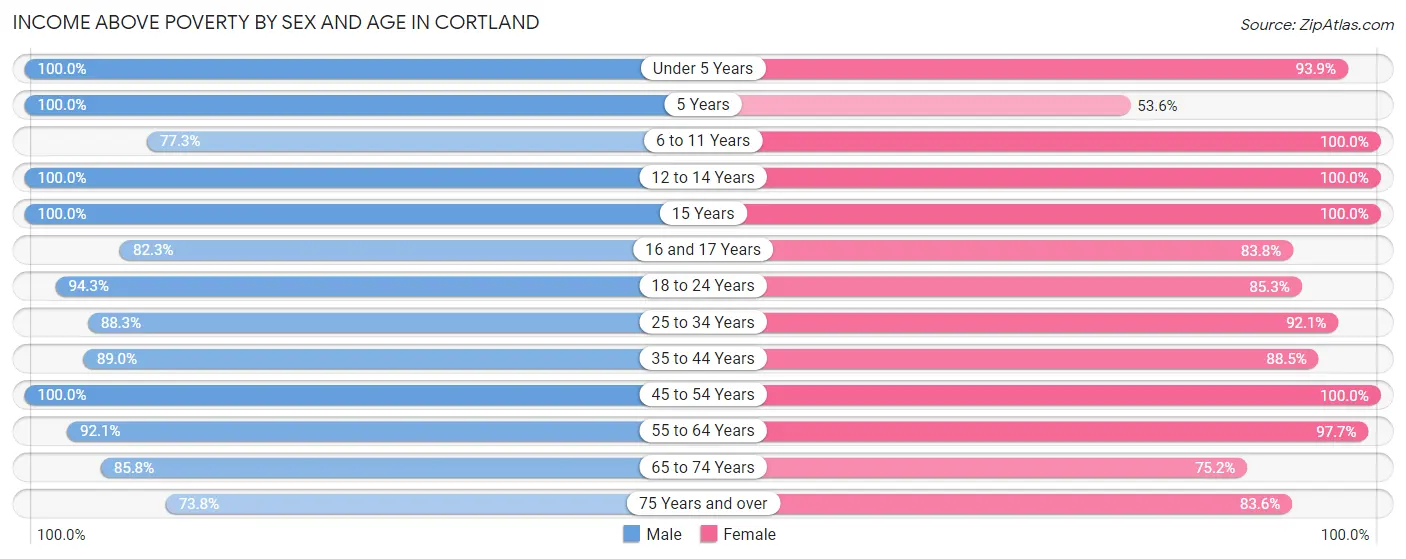
| Age Bracket | Male | Female |
| Under 5 Years | 117 (100.0%) | 232 (93.9%) |
| 5 Years | 16 (100.0%) | 15 (53.6%) |
| 6 to 11 Years | 163 (77.2%) | 130 (100.0%) |
| 12 to 14 Years | 194 (100.0%) | 107 (100.0%) |
| 15 Years | 78 (100.0%) | 65 (100.0%) |
| 16 and 17 Years | 102 (82.3%) | 67 (83.8%) |
| 18 to 24 Years | 246 (94.3%) | 93 (85.3%) |
| 25 to 34 Years | 158 (88.3%) | 281 (92.1%) |
| 35 to 44 Years | 364 (89.0%) | 231 (88.5%) |
| 45 to 54 Years | 412 (100.0%) | 478 (100.0%) |
| 55 to 64 Years | 489 (92.1%) | 688 (97.7%) |
| 65 to 74 Years | 503 (85.8%) | 559 (75.2%) |
| 75 Years and over | 169 (73.8%) | 300 (83.6%) |
| Total | 3,011 (90.0%) | 3,246 (89.8%) |
Income Below Poverty Among Married-Couple Families in Cortland
The poverty statistics for married-couple families in Cortland show that 8.2% or 126 of the total 1,543 families live below the poverty line. Families with no children have the highest poverty rate of 11.6%, comprising of 126 families. On the other hand, families with 1 or 2 children have the lowest poverty rate of 0.0%, which includes 0 families.
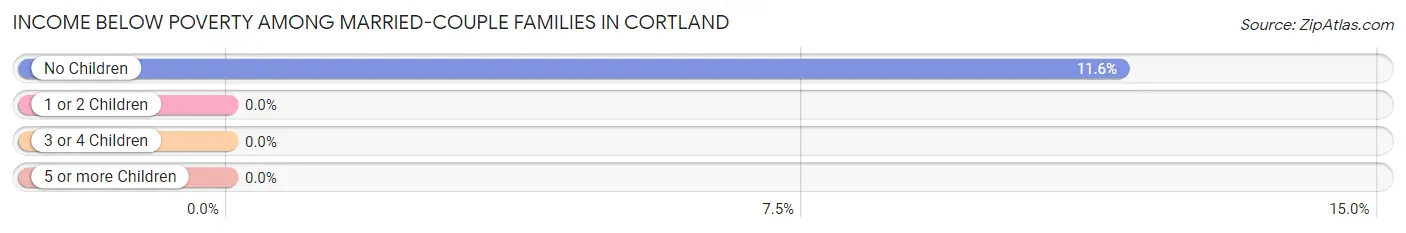
| Children | Above Poverty | Below Poverty |
| No Children | 957 (88.4%) | 126 (11.6%) |
| 1 or 2 Children | 323 (100.0%) | 0 (0.0%) |
| 3 or 4 Children | 137 (100.0%) | 0 (0.0%) |
| 5 or more Children | 0 (0.0%) | 0 (0.0%) |
| Total | 1,417 (91.8%) | 126 (8.2%) |
Income Below Poverty Among Single-Parent Households in Cortland
According to the poverty data in Cortland, 16.7% or 24 single-father households and 10.5% or 40 single-mother households are living below the poverty line. Among single-father households, those with 3 or 4 children have the highest poverty rate, with 11 households (100.0%) experiencing poverty. Likewise, among single-mother households, those with 1 or 2 children have the highest poverty rate, with 40 households (23.0%) falling below the poverty line.
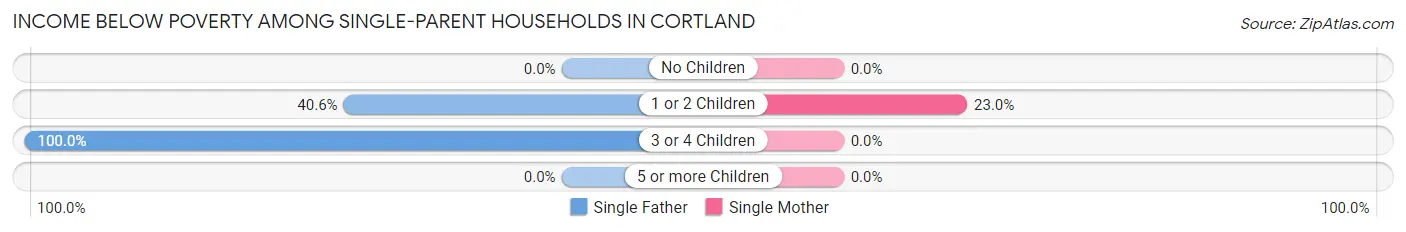
| Children | Single Father | Single Mother |
| No Children | 0 (0.0%) | 0 (0.0%) |
| 1 or 2 Children | 13 (40.6%) | 40 (23.0%) |
| 3 or 4 Children | 11 (100.0%) | 0 (0.0%) |
| 5 or more Children | 0 (0.0%) | 0 (0.0%) |
| Total | 24 (16.7%) | 40 (10.5%) |
Income Below Poverty Among Married-Couple vs Single-Parent Households in Cortland
The poverty data for Cortland shows that 126 of the married-couple family households (8.2%) and 64 of the single-parent households (12.2%) are living below the poverty level. Within the married-couple family households, those with no children have the highest poverty rate, with 126 households (11.6%) falling below the poverty line. Among the single-parent households, those with 3 or 4 children have the highest poverty rate, with 11 household (100.0%) living below poverty.
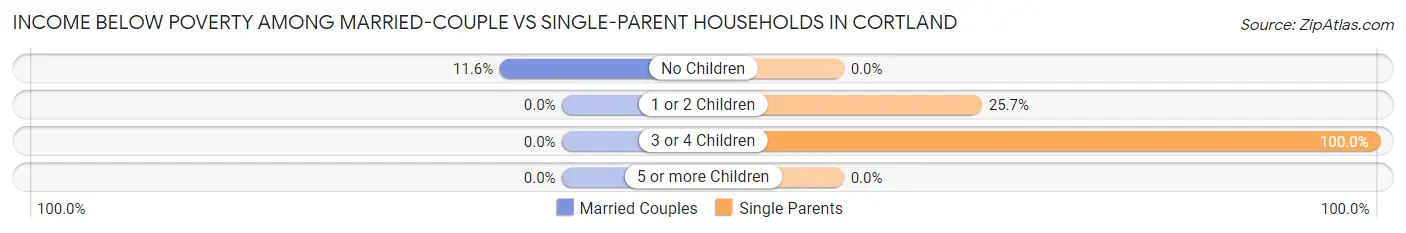
| Children | Married-Couple Families | Single-Parent Households |
| No Children | 126 (11.6%) | 0 (0.0%) |
| 1 or 2 Children | 0 (0.0%) | 53 (25.7%) |
| 3 or 4 Children | 0 (0.0%) | 11 (100.0%) |
| 5 or more Children | 0 (0.0%) | 0 (0.0%) |
| Total | 126 (8.2%) | 64 (12.2%) |
Employment Characteristics in Cortland
Employment by Class of Employer in Cortland
Among the 3,193 employed individuals in Cortland, private company employees (1,856 | 58.1%), local government employees (480 | 15.0%), and not-for-profit organizations (413 | 12.9%) make up the most common classes of employment.
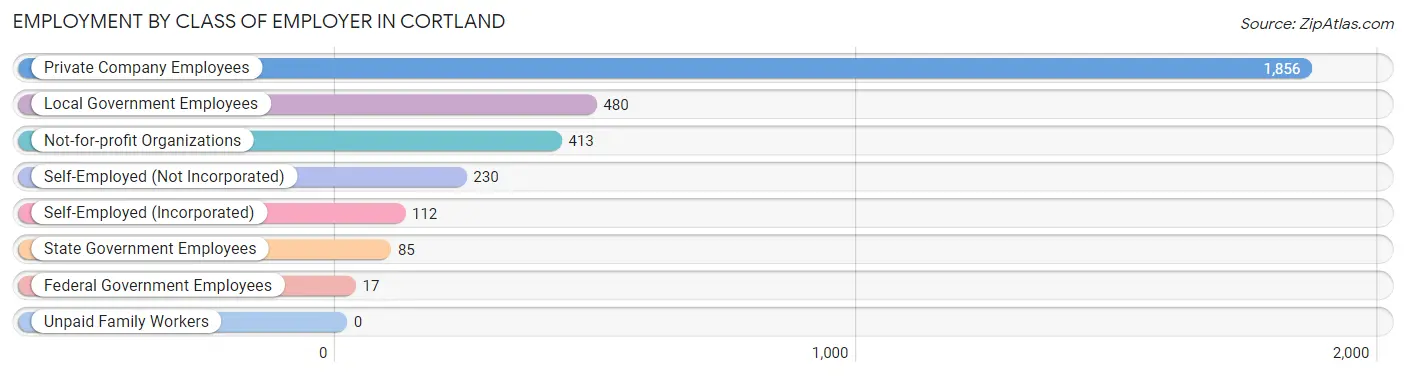
| Employer Class | # Employees | % Employees |
| Private Company Employees | 1,856 | 58.1% |
| Self-Employed (Incorporated) | 112 | 3.5% |
| Self-Employed (Not Incorporated) | 230 | 7.2% |
| Not-for-profit Organizations | 413 | 12.9% |
| Local Government Employees | 480 | 15.0% |
| State Government Employees | 85 | 2.7% |
| Federal Government Employees | 17 | 0.5% |
| Unpaid Family Workers | 0 | 0.0% |
| Total | 3,193 | 100.0% |
Employment Status by Age in Cortland
According to the labor force statistics for Cortland, out of the total population over 16 years of age (5,880), 55.2% or 3,246 individuals are in the labor force, with 1.6% or 52 of them unemployed. The age group with the highest labor force participation rate is 20 to 24 years, with 100.0% or 178 individuals in the labor force. Within the labor force, the 25 to 29 years age range has the highest percentage of unemployed individuals, with 10.8% or 21 of them being unemployed.
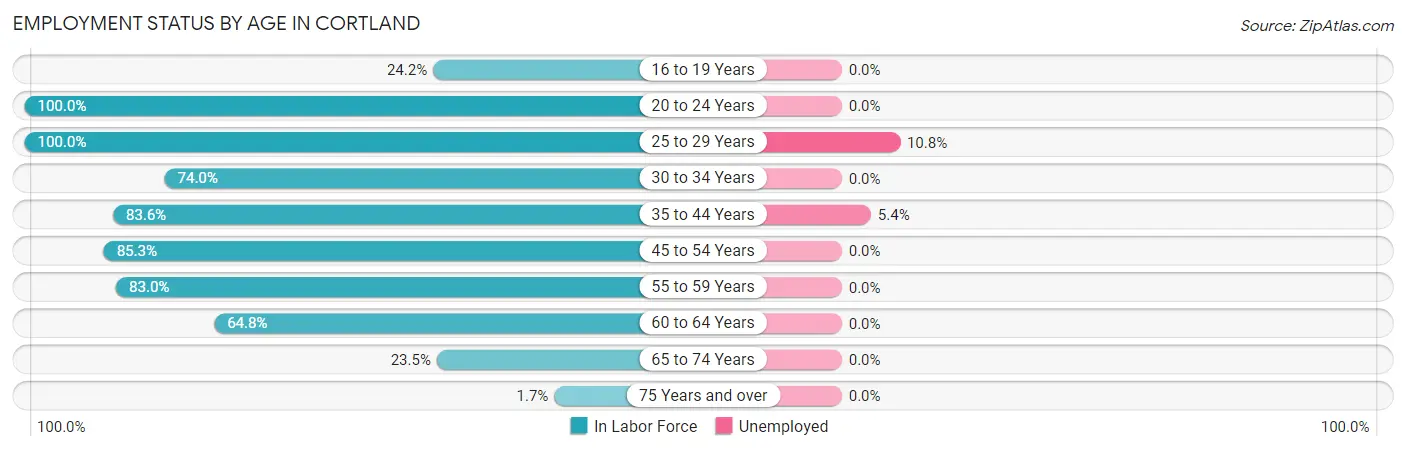
| Age Bracket | In Labor Force | Unemployed |
| 16 to 19 Years | 96 (24.2%) | 0 (0.0%) |
| 20 to 24 Years | 178 (100.0%) | 0 (0.0%) |
| 25 to 29 Years | 195 (100.0%) | 21 (10.8%) |
| 30 to 34 Years | 214 (74.0%) | 0 (0.0%) |
| 35 to 44 Years | 560 (83.6%) | 30 (5.4%) |
| 45 to 54 Years | 759 (85.3%) | 0 (0.0%) |
| 55 to 59 Years | 493 (83.0%) | 0 (0.0%) |
| 60 to 64 Years | 419 (64.8%) | 0 (0.0%) |
| 65 to 74 Years | 319 (23.5%) | 0 (0.0%) |
| 75 Years and over | 11 (1.7%) | 0 (0.0%) |
| Total | 3,246 (55.2%) | 52 (1.6%) |
Employment Status by Educational Attainment in Cortland
According to labor force statistics for Cortland, 80.4% of individuals (2,641) out of the total population between 25 and 64 years of age (3,285) are in the labor force, with 1.9% or 50 of them being unemployed. The group with the highest labor force participation rate are those with the educational attainment of bachelor's degree or higher, with 88.8% or 1,460 individuals in the labor force. Within the labor force, individuals with college / associate degree education have the highest percentage of unemployment, with 4.9% or 30 of them being unemployed.
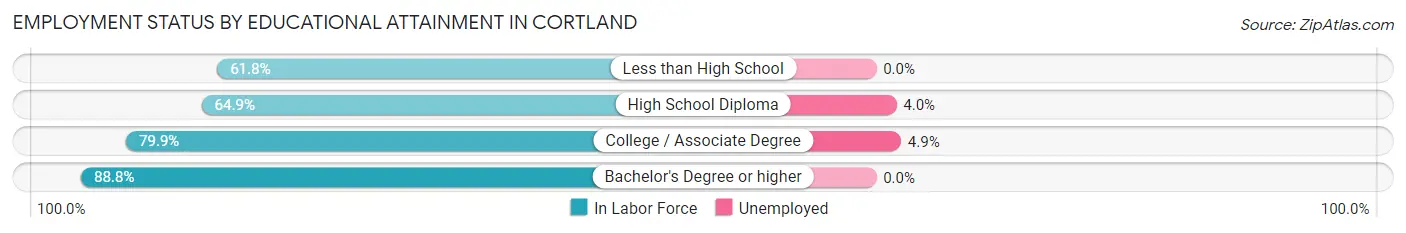
| Educational Attainment | In Labor Force | Unemployed |
| Less than High School | 34 (61.8%) | 0 (0.0%) |
| High School Diploma | 528 (64.9%) | 33 (4.0%) |
| College / Associate Degree | 618 (79.9%) | 38 (4.9%) |
| Bachelor's Degree or higher | 1,460 (88.8%) | 0 (0.0%) |
| Total | 2,641 (80.4%) | 62 (1.9%) |
Employment Occupations by Sex in Cortland
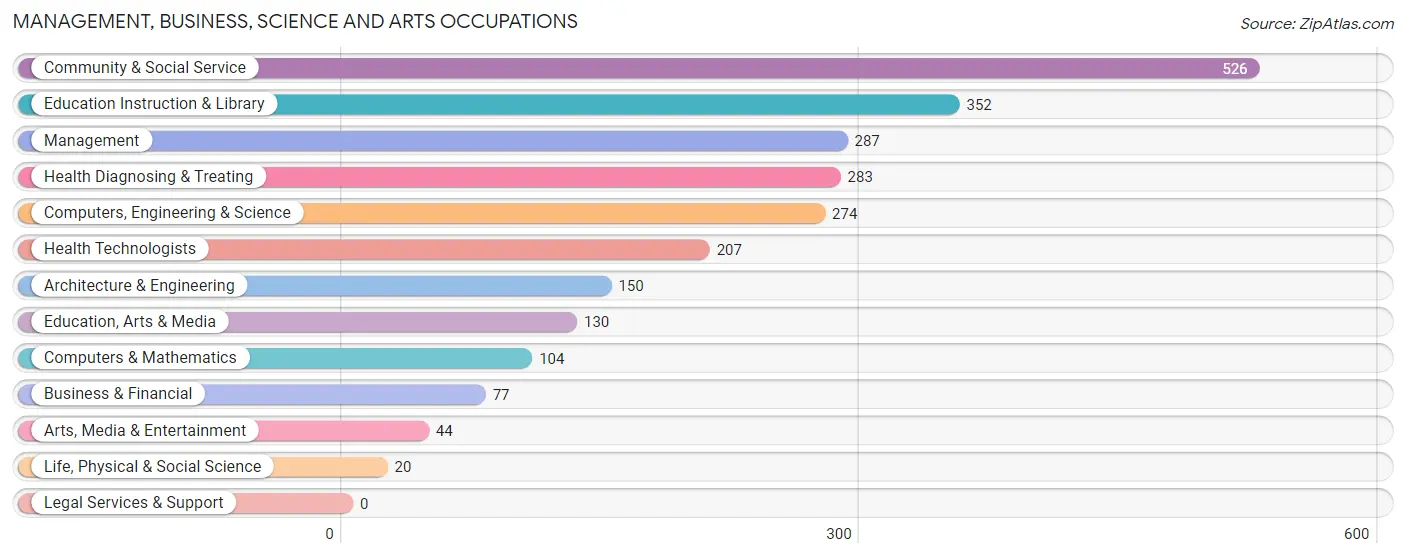
Management, Business, Science and Arts Occupations
The most common Management, Business, Science and Arts occupations in Cortland are Community & Social Service (526 | 16.5%), Education Instruction & Library (352 | 11.0%), Management (287 | 9.0%), Health Diagnosing & Treating (283 | 8.9%), and Computers, Engineering & Science (274 | 8.6%).
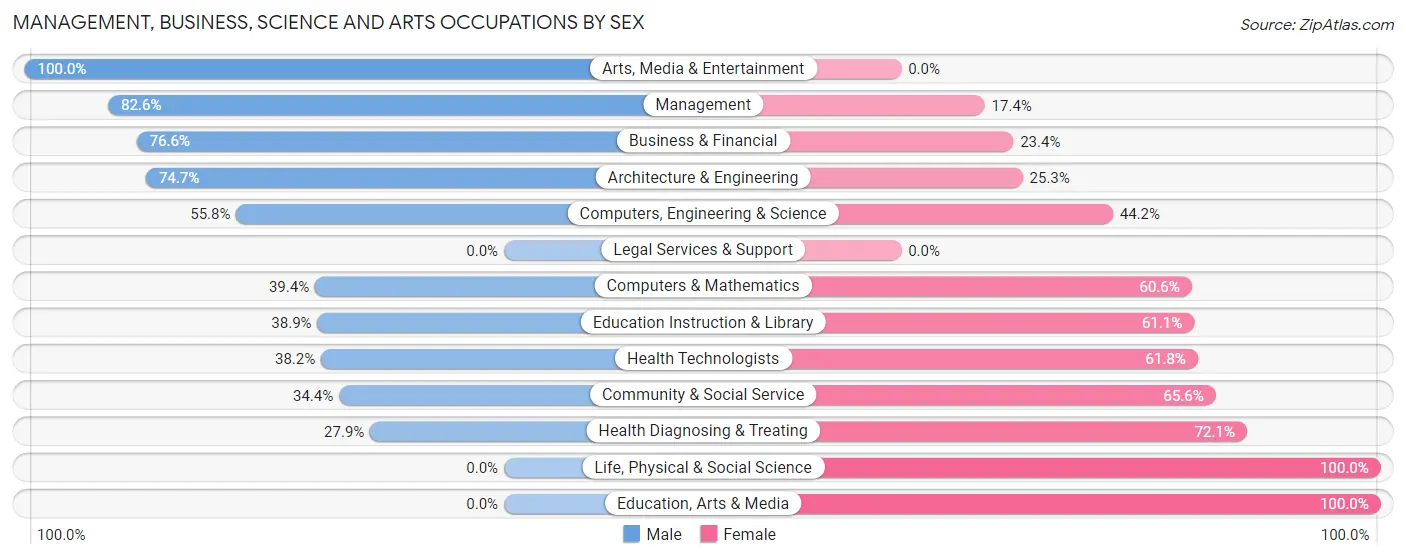
Management, Business, Science and Arts Occupations by Sex
Within the Management, Business, Science and Arts occupations in Cortland, the most male-oriented occupations are Arts, Media & Entertainment (100.0%), Management (82.6%), and Business & Financial (76.6%), while the most female-oriented occupations are Life, Physical & Social Science (100.0%), Education, Arts & Media (100.0%), and Health Diagnosing & Treating (72.1%).
| Occupation | Male | Female |
| Management | 237 (82.6%) | 50 (17.4%) |
| Business & Financial | 59 (76.6%) | 18 (23.4%) |
| Computers, Engineering & Science | 153 (55.8%) | 121 (44.2%) |
| Computers & Mathematics | 41 (39.4%) | 63 (60.6%) |
| Architecture & Engineering | 112 (74.7%) | 38 (25.3%) |
| Life, Physical & Social Science | 0 (0.0%) | 20 (100.0%) |
| Community & Social Service | 181 (34.4%) | 345 (65.6%) |
| Education, Arts & Media | 0 (0.0%) | 130 (100.0%) |
| Legal Services & Support | 0 (0.0%) | 0 (0.0%) |
| Education Instruction & Library | 137 (38.9%) | 215 (61.1%) |
| Arts, Media & Entertainment | 44 (100.0%) | 0 (0.0%) |
| Health Diagnosing & Treating | 79 (27.9%) | 204 (72.1%) |
| Health Technologists | 79 (38.2%) | 128 (61.8%) |
| Total (Category) | 709 (49.0%) | 738 (51.0%) |
| Total (Overall) | 1,675 (52.5%) | 1,518 (47.5%) |
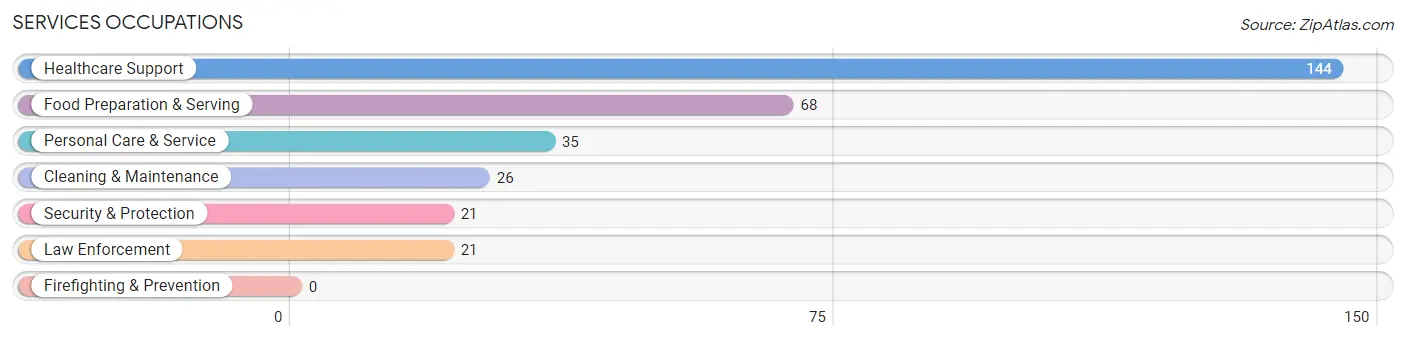
Services Occupations
The most common Services occupations in Cortland are Healthcare Support (144 | 4.5%), Food Preparation & Serving (68 | 2.1%), Personal Care & Service (35 | 1.1%), Cleaning & Maintenance (26 | 0.8%), and Security & Protection (21 | 0.7%).
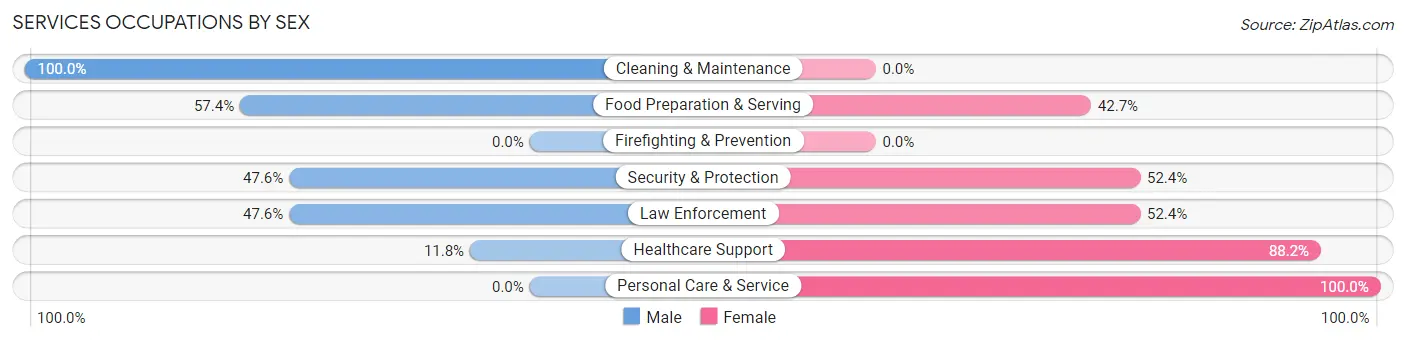
Services Occupations by Sex
Within the Services occupations in Cortland, the most male-oriented occupations are Cleaning & Maintenance (100.0%), Food Preparation & Serving (57.4%), and Security & Protection (47.6%), while the most female-oriented occupations are Personal Care & Service (100.0%), Healthcare Support (88.2%), and Security & Protection (52.4%).
| Occupation | Male | Female |
| Healthcare Support | 17 (11.8%) | 127 (88.2%) |
| Security & Protection | 10 (47.6%) | 11 (52.4%) |
| Firefighting & Prevention | 0 (0.0%) | 0 (0.0%) |
| Law Enforcement | 10 (47.6%) | 11 (52.4%) |
| Food Preparation & Serving | 39 (57.4%) | 29 (42.6%) |
| Cleaning & Maintenance | 26 (100.0%) | 0 (0.0%) |
| Personal Care & Service | 0 (0.0%) | 35 (100.0%) |
| Total (Category) | 92 (31.3%) | 202 (68.7%) |
| Total (Overall) | 1,675 (52.5%) | 1,518 (47.5%) |
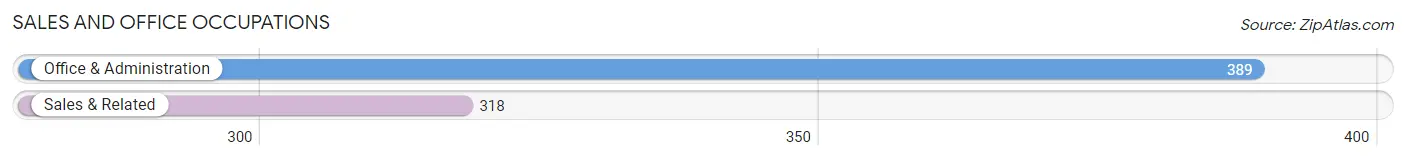
Sales and Office Occupations
The most common Sales and Office occupations in Cortland are Office & Administration (389 | 12.2%), and Sales & Related (318 | 10.0%).
Sales and Office Occupations by Sex
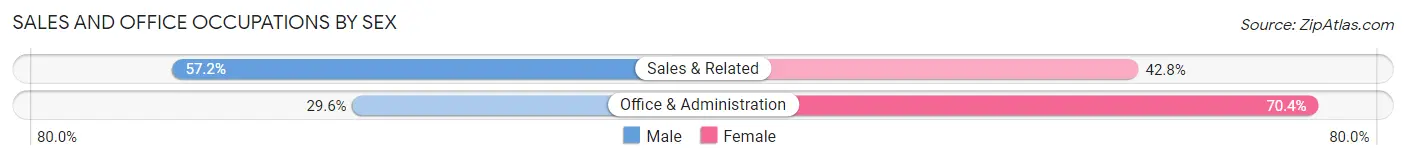
| Occupation | Male | Female |
| Sales & Related | 182 (57.2%) | 136 (42.8%) |
| Office & Administration | 115 (29.6%) | 274 (70.4%) |
| Total (Category) | 297 (42.0%) | 410 (58.0%) |
| Total (Overall) | 1,675 (52.5%) | 1,518 (47.5%) |
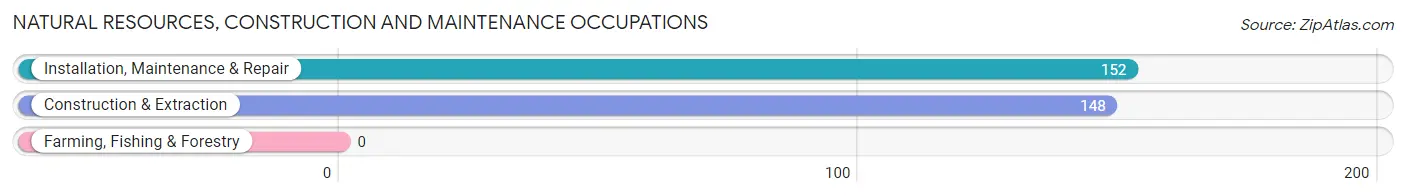
Natural Resources, Construction and Maintenance Occupations
The most common Natural Resources, Construction and Maintenance occupations in Cortland are Installation, Maintenance & Repair (152 | 4.8%), and Construction & Extraction (148 | 4.6%).
Natural Resources, Construction and Maintenance Occupations by Sex
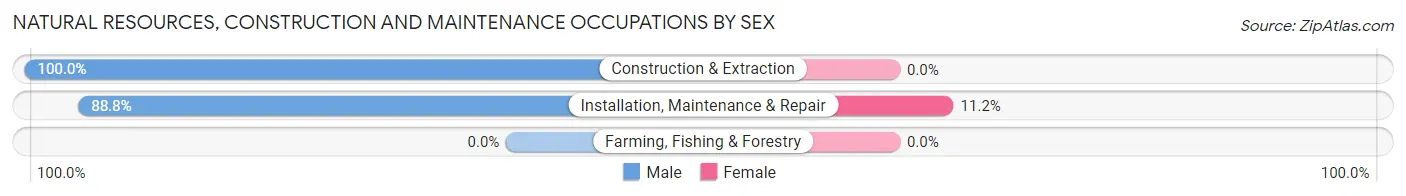
| Occupation | Male | Female |
| Farming, Fishing & Forestry | 0 (0.0%) | 0 (0.0%) |
| Construction & Extraction | 148 (100.0%) | 0 (0.0%) |
| Installation, Maintenance & Repair | 135 (88.8%) | 17 (11.2%) |
| Total (Category) | 283 (94.3%) | 17 (5.7%) |
| Total (Overall) | 1,675 (52.5%) | 1,518 (47.5%) |
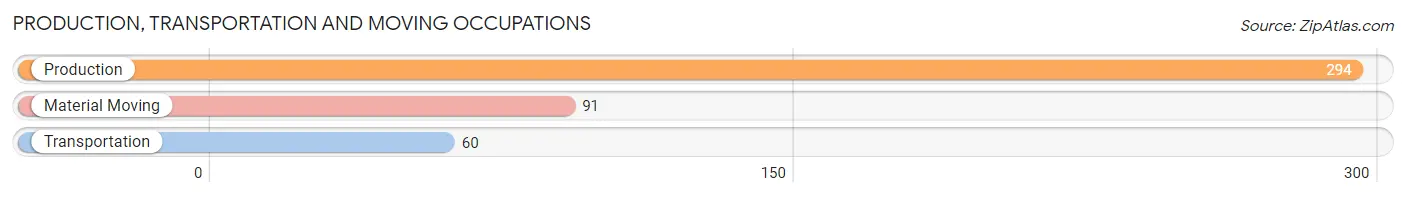
Production, Transportation and Moving Occupations
The most common Production, Transportation and Moving occupations in Cortland are Production (294 | 9.2%), Material Moving (91 | 2.9%), and Transportation (60 | 1.9%).
Production, Transportation and Moving Occupations by Sex
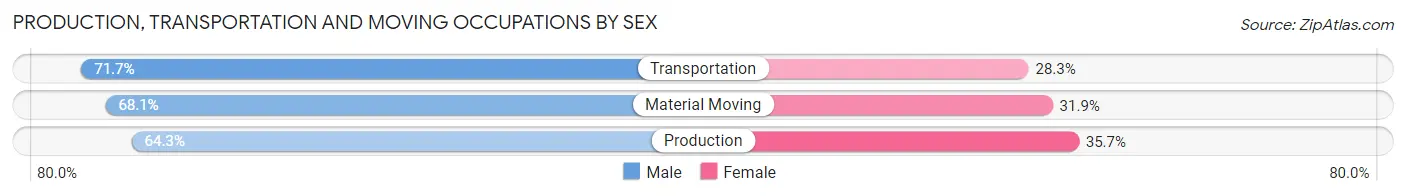
| Occupation | Male | Female |
| Production | 189 (64.3%) | 105 (35.7%) |
| Transportation | 43 (71.7%) | 17 (28.3%) |
| Material Moving | 62 (68.1%) | 29 (31.9%) |
| Total (Category) | 294 (66.1%) | 151 (33.9%) |
| Total (Overall) | 1,675 (52.5%) | 1,518 (47.5%) |
Employment Industries by Sex in Cortland
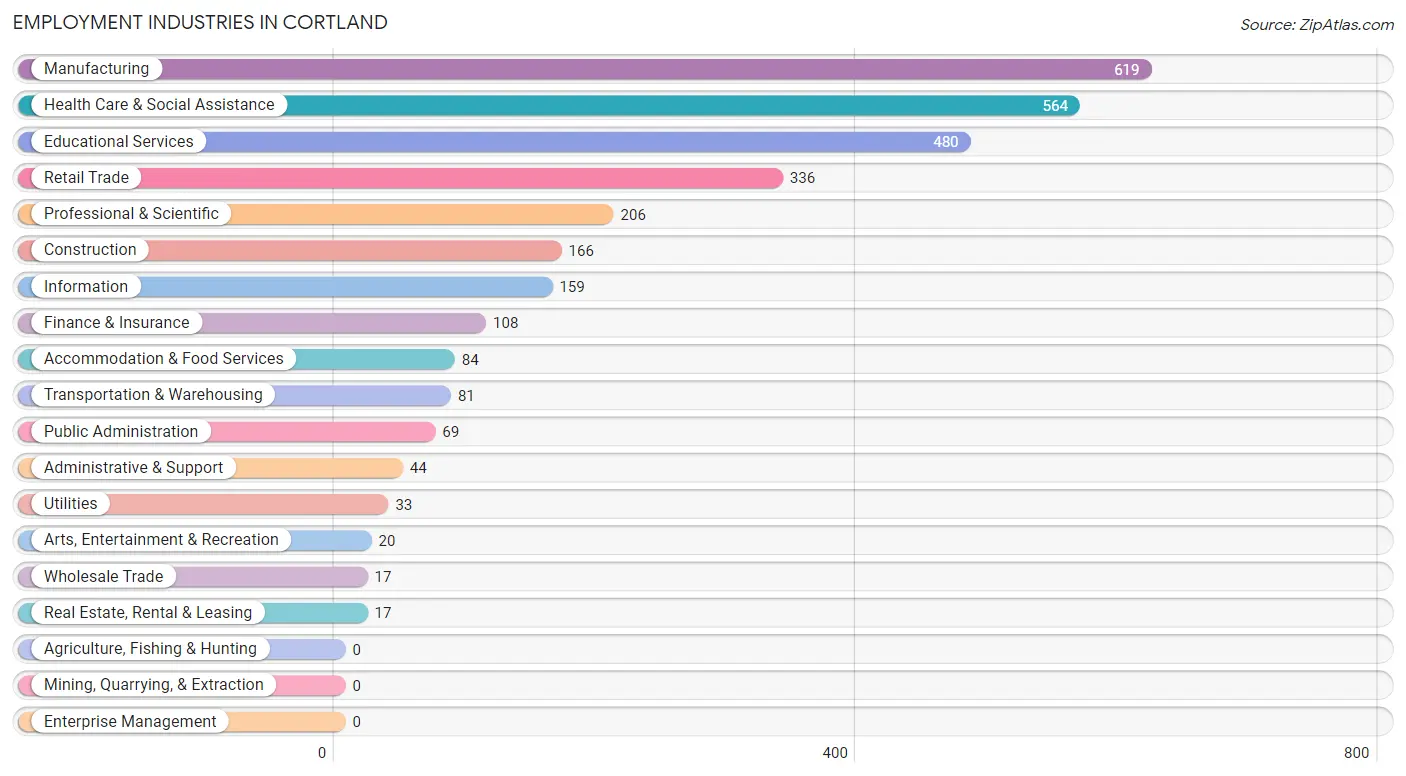
Employment Industries in Cortland
The major employment industries in Cortland include Manufacturing (619 | 19.4%), Health Care & Social Assistance (564 | 17.7%), Educational Services (480 | 15.0%), Retail Trade (336 | 10.5%), and Professional & Scientific (206 | 6.5%).
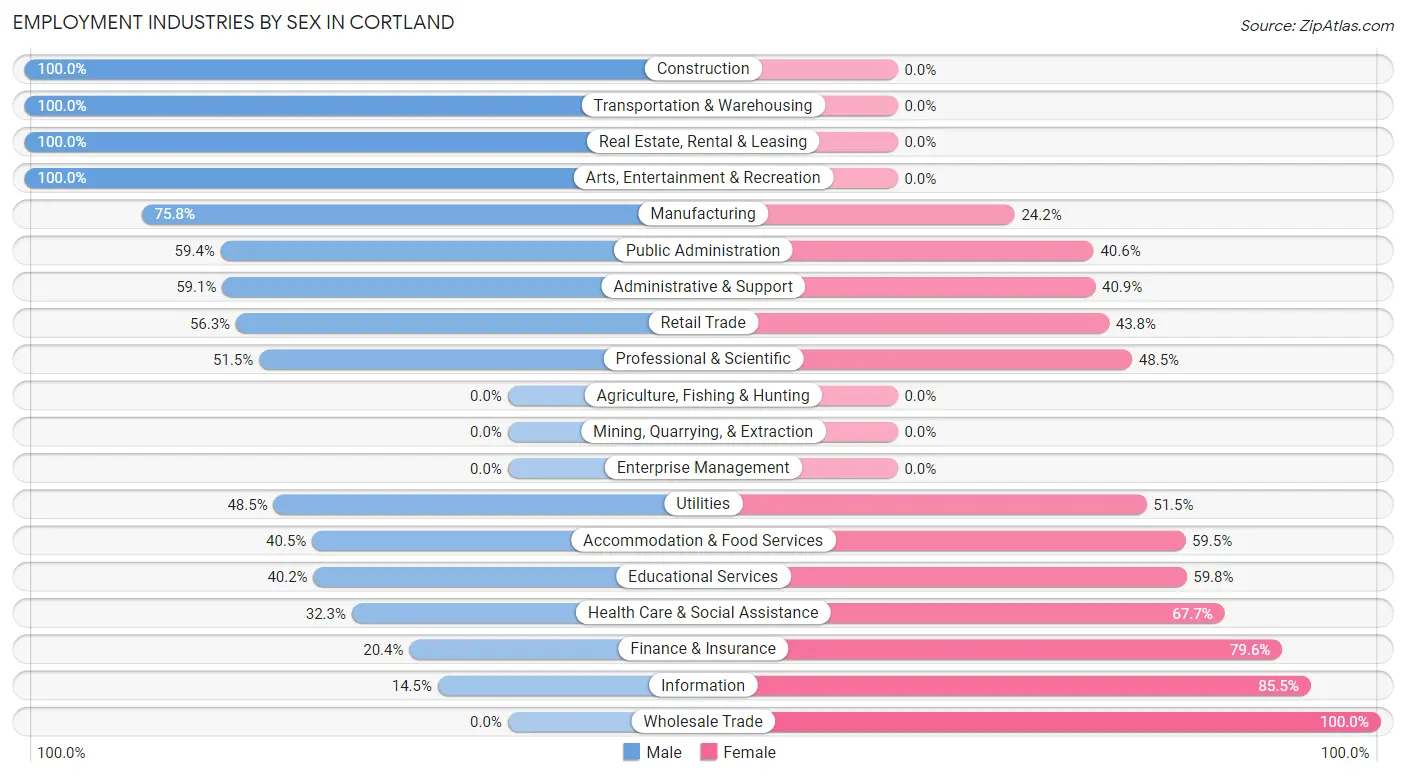
Employment Industries by Sex in Cortland
The Cortland industries that see more men than women are Construction (100.0%), Transportation & Warehousing (100.0%), and Real Estate, Rental & Leasing (100.0%), whereas the industries that tend to have a higher number of women are Wholesale Trade (100.0%), Information (85.5%), and Finance & Insurance (79.6%).
| Industry | Male | Female |
| Agriculture, Fishing & Hunting | 0 (0.0%) | 0 (0.0%) |
| Mining, Quarrying, & Extraction | 0 (0.0%) | 0 (0.0%) |
| Construction | 166 (100.0%) | 0 (0.0%) |
| Manufacturing | 469 (75.8%) | 150 (24.2%) |
| Wholesale Trade | 0 (0.0%) | 17 (100.0%) |
| Retail Trade | 189 (56.2%) | 147 (43.8%) |
| Transportation & Warehousing | 81 (100.0%) | 0 (0.0%) |
| Utilities | 16 (48.5%) | 17 (51.5%) |
| Information | 23 (14.5%) | 136 (85.5%) |
| Finance & Insurance | 22 (20.4%) | 86 (79.6%) |
| Real Estate, Rental & Leasing | 17 (100.0%) | 0 (0.0%) |
| Professional & Scientific | 106 (51.5%) | 100 (48.5%) |
| Enterprise Management | 0 (0.0%) | 0 (0.0%) |
| Administrative & Support | 26 (59.1%) | 18 (40.9%) |
| Educational Services | 193 (40.2%) | 287 (59.8%) |
| Health Care & Social Assistance | 182 (32.3%) | 382 (67.7%) |
| Arts, Entertainment & Recreation | 20 (100.0%) | 0 (0.0%) |
| Accommodation & Food Services | 34 (40.5%) | 50 (59.5%) |
| Public Administration | 41 (59.4%) | 28 (40.6%) |
| Total | 1,675 (52.5%) | 1,518 (47.5%) |
Education in Cortland
School Enrollment in Cortland
The most common levels of schooling among the 1,471 students in Cortland are high school (512 | 34.8%), middle school (369 | 25.1%), and elementary school (238 | 16.2%).
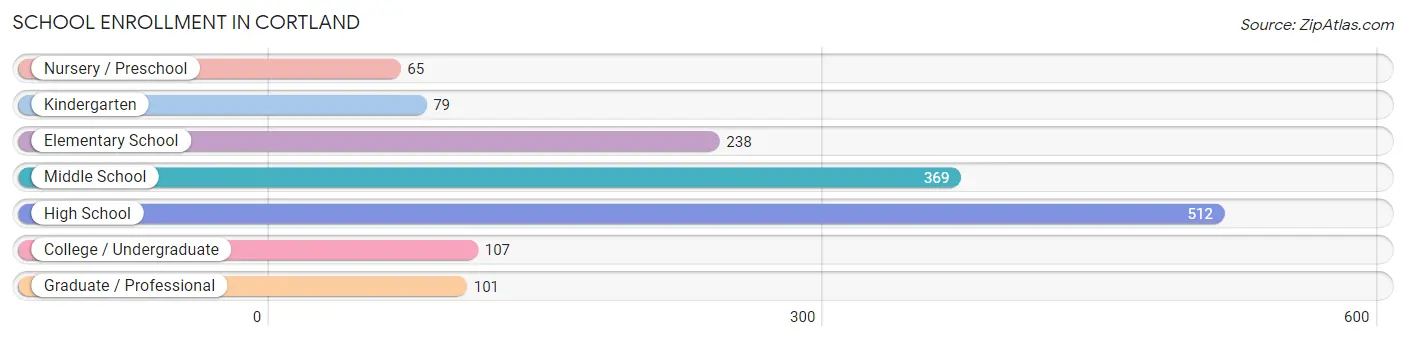
| School Level | # Students | % Students |
| Nursery / Preschool | 65 | 4.4% |
| Kindergarten | 79 | 5.4% |
| Elementary School | 238 | 16.2% |
| Middle School | 369 | 25.1% |
| High School | 512 | 34.8% |
| College / Undergraduate | 107 | 7.3% |
| Graduate / Professional | 101 | 6.9% |
| Total | 1,471 | 100.0% |
School Enrollment by Age by Funding Source in Cortland
Out of a total of 1,471 students who are enrolled in schools in Cortland, 51 (3.5%) attend a private institution, while the remaining 1,420 (96.5%) are enrolled in public schools. The age group of 3 to 4 year olds has the highest likelihood of being enrolled in private schools, with 32 (31.4% in the age bracket) enrolled. Conversely, the age group of 5 to 9 year old has the lowest likelihood of being enrolled in a private school, with 212 (100.0% in the age bracket) attending a public institution.
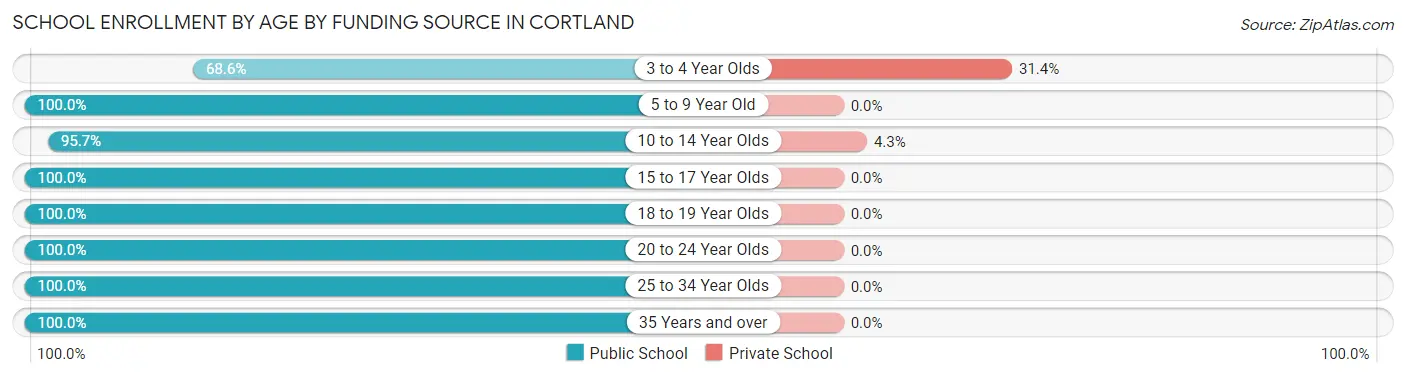
| Age Bracket | Public School | Private School |
| 3 to 4 Year Olds | 70 (68.6%) | 32 (31.4%) |
| 5 to 9 Year Old | 212 (100.0%) | 0 (0.0%) |
| 10 to 14 Year Olds | 441 (95.7%) | 20 (4.3%) |
| 15 to 17 Year Olds | 347 (100.0%) | 0 (0.0%) |
| 18 to 19 Year Olds | 161 (100.0%) | 0 (0.0%) |
| 20 to 24 Year Olds | 58 (100.0%) | 0 (0.0%) |
| 25 to 34 Year Olds | 16 (100.0%) | 0 (0.0%) |
| 35 Years and over | 114 (100.0%) | 0 (0.0%) |
| Total | 1,420 (96.5%) | 51 (3.5%) |
Educational Attainment by Field of Study in Cortland
Education (483 | 22.3%), business (396 | 18.3%), arts & humanities (305 | 14.1%), science & technology (300 | 13.8%), and social sciences (135 | 6.2%) are the most common fields of study among 2,168 individuals in Cortland who have obtained a bachelor's degree or higher.
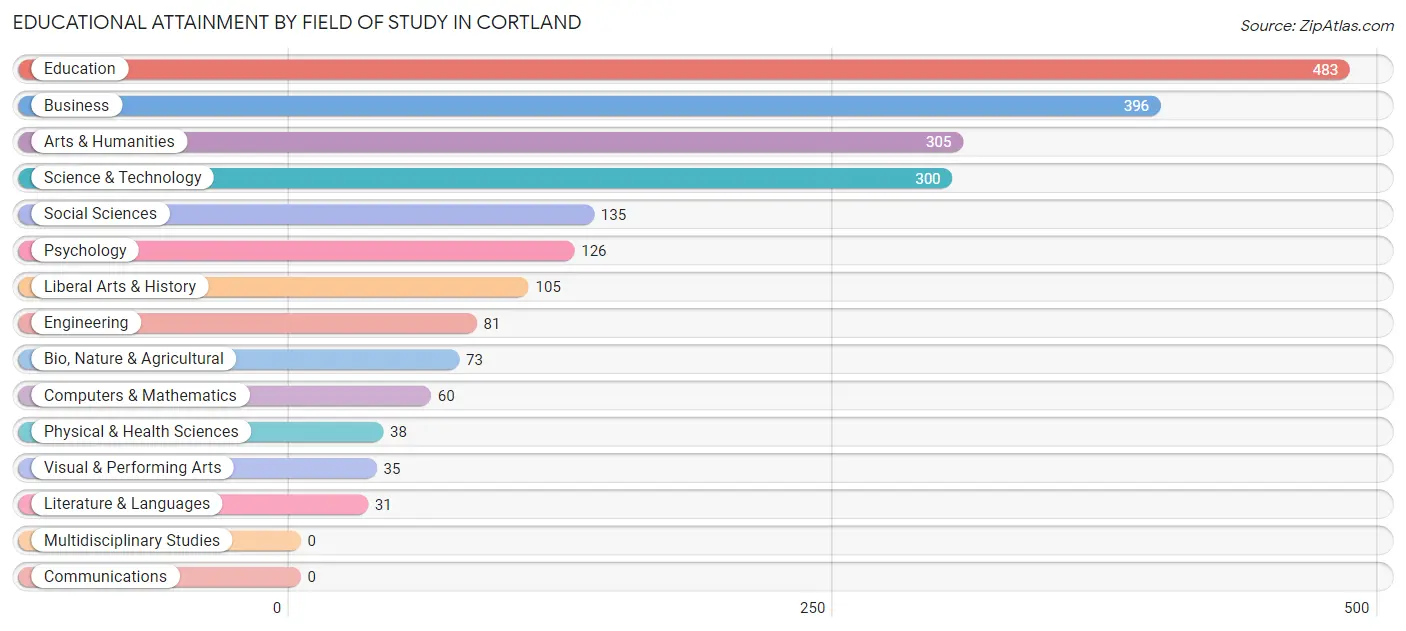
| Field of Study | # Graduates | % Graduates |
| Computers & Mathematics | 60 | 2.8% |
| Bio, Nature & Agricultural | 73 | 3.4% |
| Physical & Health Sciences | 38 | 1.8% |
| Psychology | 126 | 5.8% |
| Social Sciences | 135 | 6.2% |
| Engineering | 81 | 3.7% |
| Multidisciplinary Studies | 0 | 0.0% |
| Science & Technology | 300 | 13.8% |
| Business | 396 | 18.3% |
| Education | 483 | 22.3% |
| Literature & Languages | 31 | 1.4% |
| Liberal Arts & History | 105 | 4.8% |
| Visual & Performing Arts | 35 | 1.6% |
| Communications | 0 | 0.0% |
| Arts & Humanities | 305 | 14.1% |
| Total | 2,168 | 100.0% |
Transportation & Commute in Cortland
Vehicle Availability by Sex in Cortland
The most prevalent vehicle ownership categories in Cortland are males with 2 vehicles (858, accounting for 51.2%) and females with 2 vehicles (785, making up 56.5%).
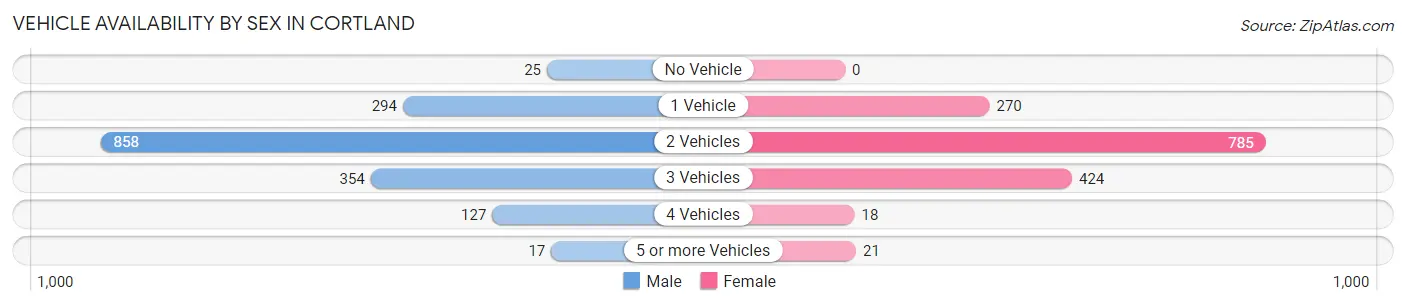
| Vehicles Available | Male | Female |
| No Vehicle | 25 (1.5%) | 0 (0.0%) |
| 1 Vehicle | 294 (17.5%) | 270 (17.8%) |
| 2 Vehicles | 858 (51.2%) | 785 (51.7%) |
| 3 Vehicles | 354 (21.1%) | 424 (27.9%) |
| 4 Vehicles | 127 (7.6%) | 18 (1.2%) |
| 5 or more Vehicles | 17 (1.0%) | 21 (1.4%) |
| Total | 1,675 (100.0%) | 1,518 (100.0%) |
Commute Time in Cortland
The most frequently occuring commute durations in Cortland are 20 to 24 minutes (548 commuters, 18.4%), 30 to 34 minutes (377 commuters, 12.6%), and 15 to 19 minutes (365 commuters, 12.2%).
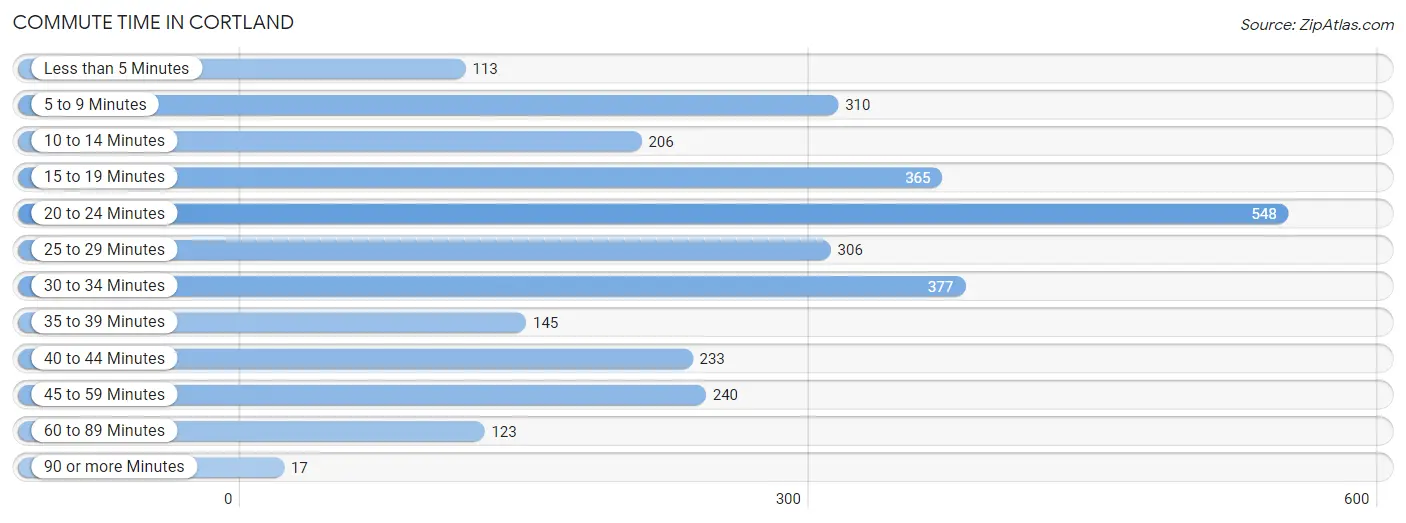
| Commute Time | # Commuters | % Commuters |
| Less than 5 Minutes | 113 | 3.8% |
| 5 to 9 Minutes | 310 | 10.4% |
| 10 to 14 Minutes | 206 | 6.9% |
| 15 to 19 Minutes | 365 | 12.2% |
| 20 to 24 Minutes | 548 | 18.4% |
| 25 to 29 Minutes | 306 | 10.3% |
| 30 to 34 Minutes | 377 | 12.6% |
| 35 to 39 Minutes | 145 | 4.9% |
| 40 to 44 Minutes | 233 | 7.8% |
| 45 to 59 Minutes | 240 | 8.1% |
| 60 to 89 Minutes | 123 | 4.1% |
| 90 or more Minutes | 17 | 0.6% |
Commute Time by Sex in Cortland
The most common commute times in Cortland are 30 to 34 minutes (313 commuters, 20.0%) for males and 20 to 24 minutes (314 commuters, 22.2%) for females.
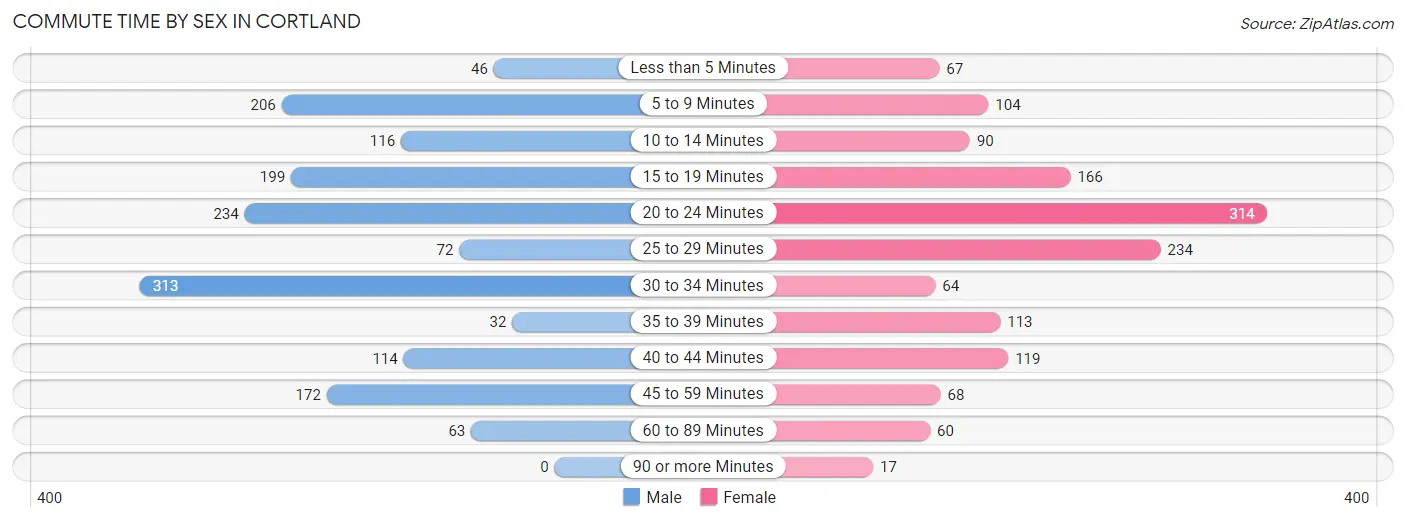
| Commute Time | Male | Female |
| Less than 5 Minutes | 46 (2.9%) | 67 (4.7%) |
| 5 to 9 Minutes | 206 (13.2%) | 104 (7.3%) |
| 10 to 14 Minutes | 116 (7.4%) | 90 (6.4%) |
| 15 to 19 Minutes | 199 (12.7%) | 166 (11.7%) |
| 20 to 24 Minutes | 234 (14.9%) | 314 (22.2%) |
| 25 to 29 Minutes | 72 (4.6%) | 234 (16.5%) |
| 30 to 34 Minutes | 313 (20.0%) | 64 (4.5%) |
| 35 to 39 Minutes | 32 (2.0%) | 113 (8.0%) |
| 40 to 44 Minutes | 114 (7.3%) | 119 (8.4%) |
| 45 to 59 Minutes | 172 (11.0%) | 68 (4.8%) |
| 60 to 89 Minutes | 63 (4.0%) | 60 (4.2%) |
| 90 or more Minutes | 0 (0.0%) | 17 (1.2%) |
Time of Departure to Work by Sex in Cortland
The most frequent times of departure to work in Cortland are 7:00 AM to 7:29 AM (265, 16.9%) for males and 7:30 AM to 7:59 AM (208, 14.7%) for females.
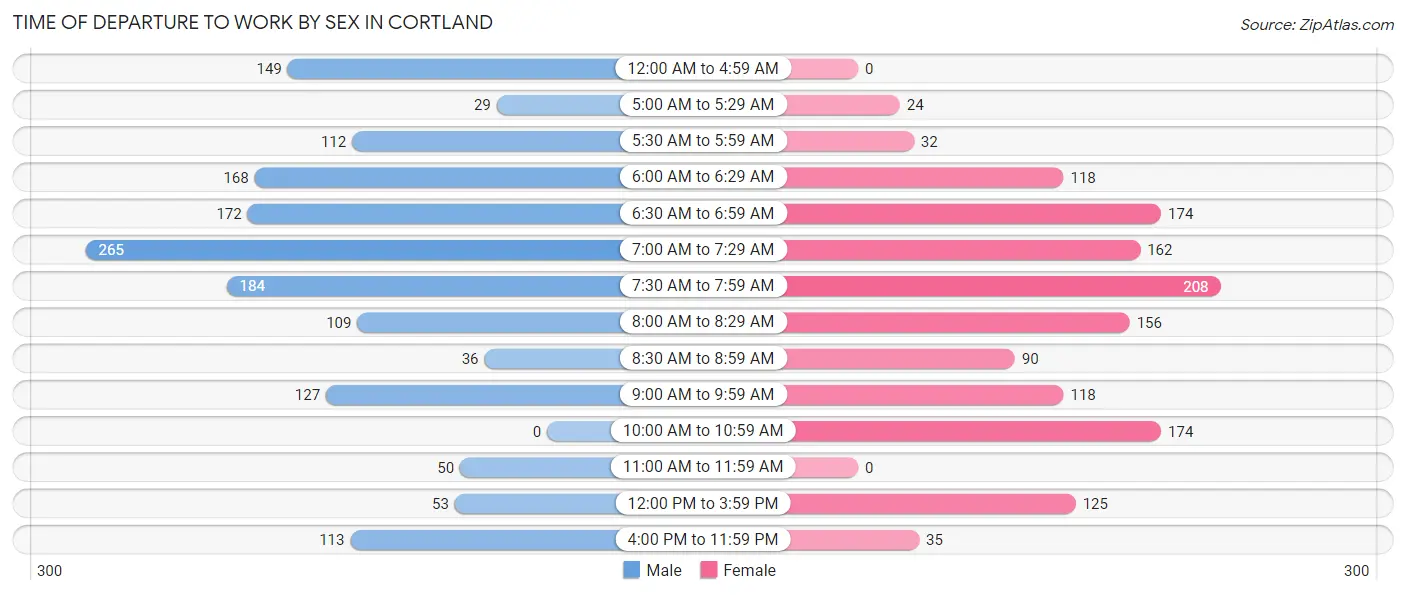
| Time of Departure | Male | Female |
| 12:00 AM to 4:59 AM | 149 (9.5%) | 0 (0.0%) |
| 5:00 AM to 5:29 AM | 29 (1.8%) | 24 (1.7%) |
| 5:30 AM to 5:59 AM | 112 (7.1%) | 32 (2.3%) |
| 6:00 AM to 6:29 AM | 168 (10.7%) | 118 (8.3%) |
| 6:30 AM to 6:59 AM | 172 (11.0%) | 174 (12.3%) |
| 7:00 AM to 7:29 AM | 265 (16.9%) | 162 (11.4%) |
| 7:30 AM to 7:59 AM | 184 (11.7%) | 208 (14.7%) |
| 8:00 AM to 8:29 AM | 109 (7.0%) | 156 (11.0%) |
| 8:30 AM to 8:59 AM | 36 (2.3%) | 90 (6.4%) |
| 9:00 AM to 9:59 AM | 127 (8.1%) | 118 (8.3%) |
| 10:00 AM to 10:59 AM | 0 (0.0%) | 174 (12.3%) |
| 11:00 AM to 11:59 AM | 50 (3.2%) | 0 (0.0%) |
| 12:00 PM to 3:59 PM | 53 (3.4%) | 125 (8.8%) |
| 4:00 PM to 11:59 PM | 113 (7.2%) | 35 (2.5%) |
| Total | 1,567 (100.0%) | 1,416 (100.0%) |
Housing Occupancy in Cortland
Occupancy by Ownership in Cortland
Of the total 3,228 dwellings in Cortland, owner-occupied units account for 2,449 (75.9%), while renter-occupied units make up 779 (24.1%).
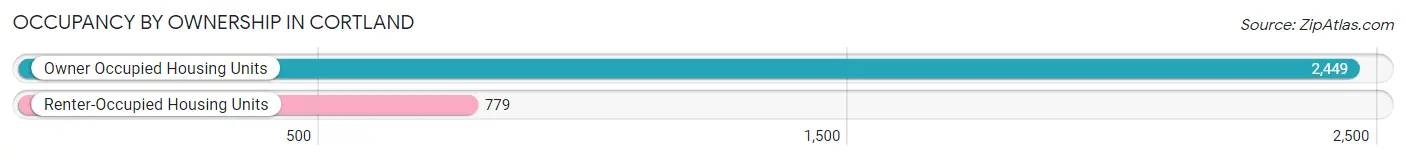
| Occupancy | # Housing Units | % Housing Units |
| Owner Occupied Housing Units | 2,449 | 75.9% |
| Renter-Occupied Housing Units | 779 | 24.1% |
| Total Occupied Housing Units | 3,228 | 100.0% |
Occupancy by Household Size in Cortland
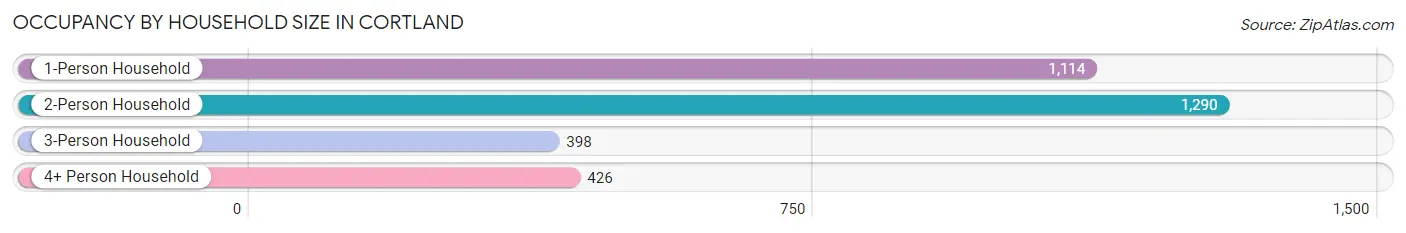
| Household Size | # Housing Units | % Housing Units |
| 1-Person Household | 1,114 | 34.5% |
| 2-Person Household | 1,290 | 40.0% |
| 3-Person Household | 398 | 12.3% |
| 4+ Person Household | 426 | 13.2% |
| Total Housing Units | 3,228 | 100.0% |
Occupancy by Ownership by Household Size in Cortland
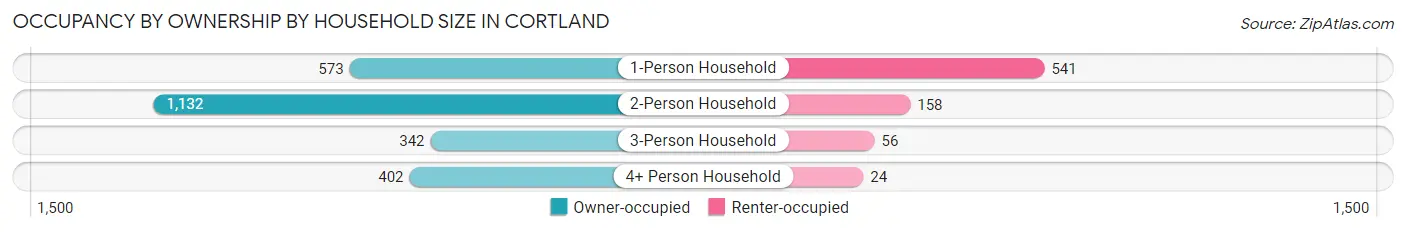
| Household Size | Owner-occupied | Renter-occupied |
| 1-Person Household | 573 (51.4%) | 541 (48.6%) |
| 2-Person Household | 1,132 (87.7%) | 158 (12.2%) |
| 3-Person Household | 342 (85.9%) | 56 (14.1%) |
| 4+ Person Household | 402 (94.4%) | 24 (5.6%) |
| Total Housing Units | 2,449 (75.9%) | 779 (24.1%) |
Occupancy by Educational Attainment in Cortland
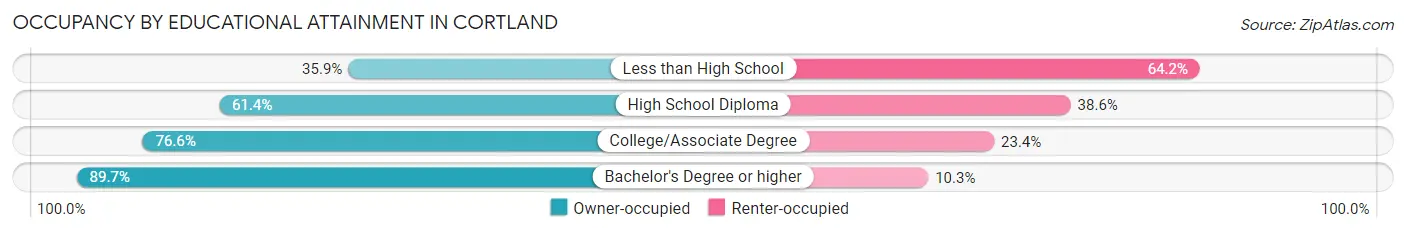
| Household Size | Owner-occupied | Renter-occupied |
| Less than High School | 19 (35.8%) | 34 (64.1%) |
| High School Diploma | 698 (61.4%) | 438 (38.6%) |
| College/Associate Degree | 567 (76.6%) | 173 (23.4%) |
| Bachelor's Degree or higher | 1,165 (89.7%) | 134 (10.3%) |
Occupancy by Age of Householder in Cortland
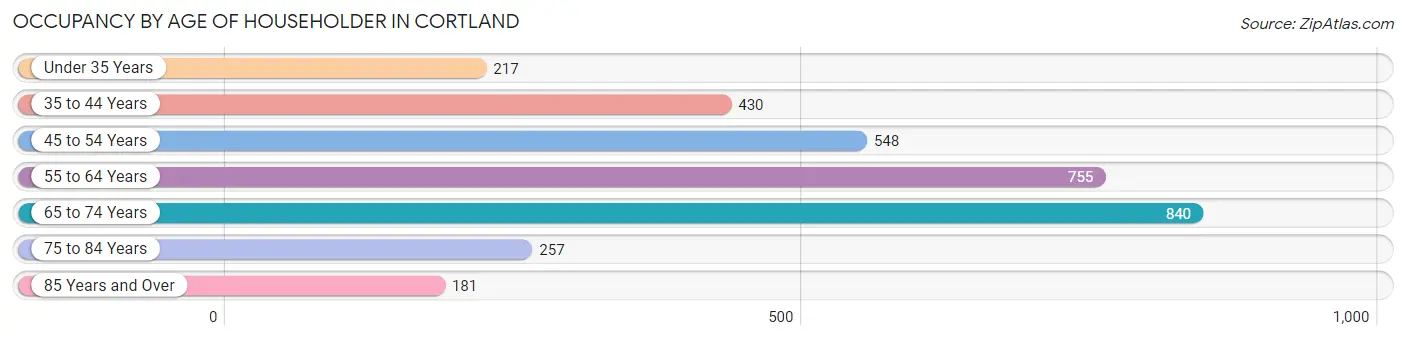
| Age Bracket | # Households | % Households |
| Under 35 Years | 217 | 6.7% |
| 35 to 44 Years | 430 | 13.3% |
| 45 to 54 Years | 548 | 17.0% |
| 55 to 64 Years | 755 | 23.4% |
| 65 to 74 Years | 840 | 26.0% |
| 75 to 84 Years | 257 | 8.0% |
| 85 Years and Over | 181 | 5.6% |
| Total | 3,228 | 100.0% |
Housing Finances in Cortland
Median Income by Occupancy in Cortland
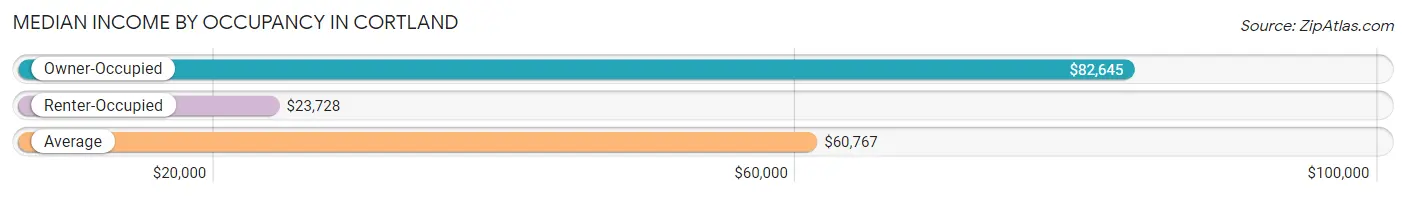
| Occupancy Type | # Households | Median Income |
| Owner-Occupied | 2,449 (75.9%) | $82,645 |
| Renter-Occupied | 779 (24.1%) | $23,728 |
| Average | 3,228 (100.0%) | $60,767 |
Occupancy by Householder Income Bracket in Cortland
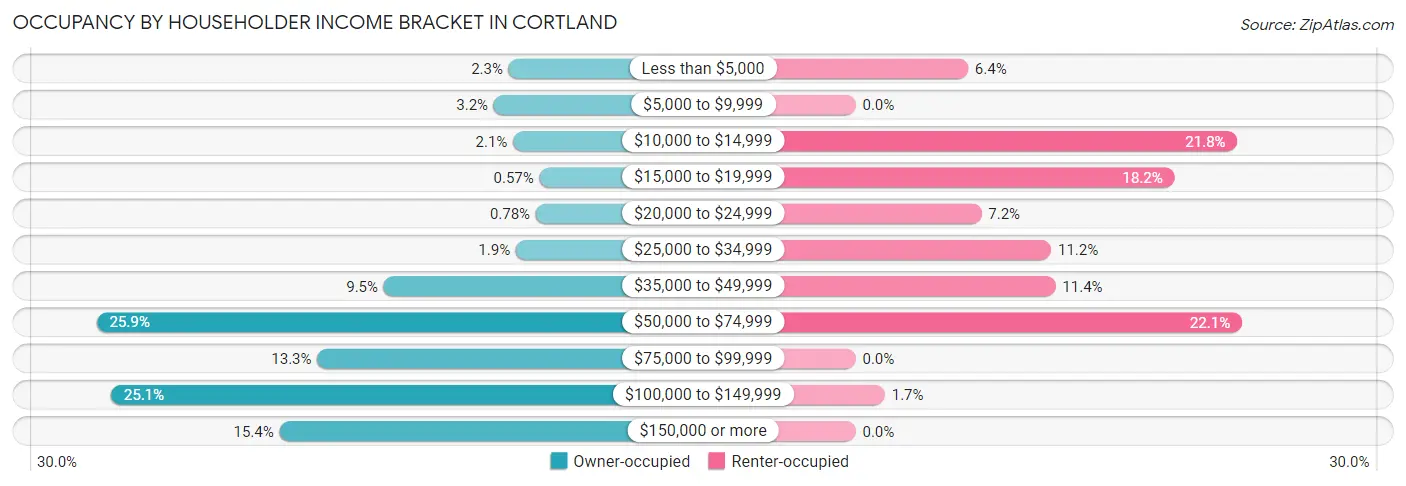
| Income Bracket | Owner-occupied | Renter-occupied |
| Less than $5,000 | 57 (2.3%) | 50 (6.4%) |
| $5,000 to $9,999 | 78 (3.2%) | 0 (0.0%) |
| $10,000 to $14,999 | 51 (2.1%) | 170 (21.8%) |
| $15,000 to $19,999 | 14 (0.6%) | 142 (18.2%) |
| $20,000 to $24,999 | 19 (0.8%) | 56 (7.2%) |
| $25,000 to $34,999 | 47 (1.9%) | 87 (11.2%) |
| $35,000 to $49,999 | 232 (9.5%) | 89 (11.4%) |
| $50,000 to $74,999 | 634 (25.9%) | 172 (22.1%) |
| $75,000 to $99,999 | 325 (13.3%) | 0 (0.0%) |
| $100,000 to $149,999 | 614 (25.1%) | 13 (1.7%) |
| $150,000 or more | 378 (15.4%) | 0 (0.0%) |
| Total | 2,449 (100.0%) | 779 (100.0%) |
Monthly Housing Cost Tiers in Cortland
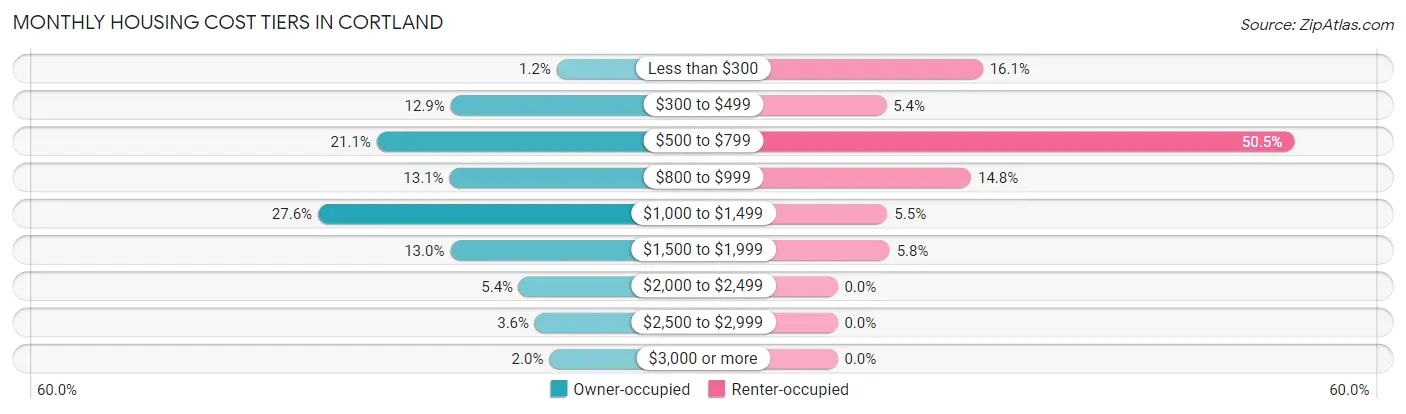
| Monthly Cost | Owner-occupied | Renter-occupied |
| Less than $300 | 30 (1.2%) | 125 (16.1%) |
| $300 to $499 | 317 (12.9%) | 42 (5.4%) |
| $500 to $799 | 517 (21.1%) | 393 (50.4%) |
| $800 to $999 | 320 (13.1%) | 115 (14.8%) |
| $1,000 to $1,499 | 676 (27.6%) | 43 (5.5%) |
| $1,500 to $1,999 | 318 (13.0%) | 45 (5.8%) |
| $2,000 to $2,499 | 132 (5.4%) | 0 (0.0%) |
| $2,500 to $2,999 | 89 (3.6%) | 0 (0.0%) |
| $3,000 or more | 50 (2.0%) | 0 (0.0%) |
| Total | 2,449 (100.0%) | 779 (100.0%) |
Physical Housing Characteristics in Cortland
Housing Structures in Cortland
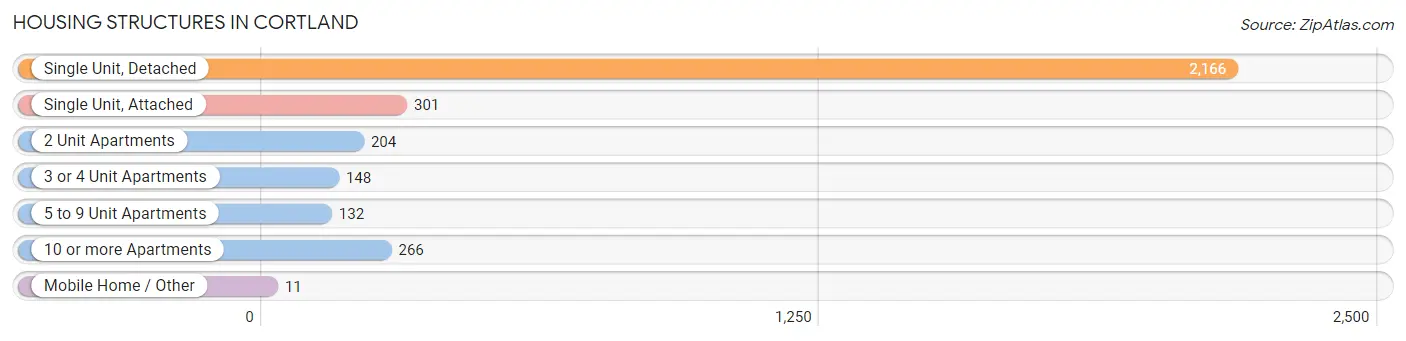
| Structure Type | # Housing Units | % Housing Units |
| Single Unit, Detached | 2,166 | 67.1% |
| Single Unit, Attached | 301 | 9.3% |
| 2 Unit Apartments | 204 | 6.3% |
| 3 or 4 Unit Apartments | 148 | 4.6% |
| 5 to 9 Unit Apartments | 132 | 4.1% |
| 10 or more Apartments | 266 | 8.2% |
| Mobile Home / Other | 11 | 0.3% |
| Total | 3,228 | 100.0% |
Housing Structures by Occupancy in Cortland
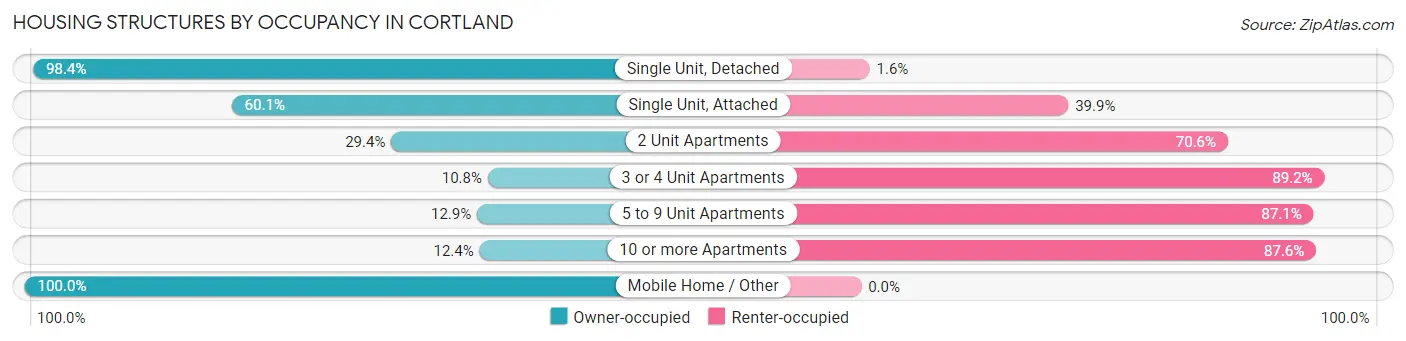
| Structure Type | Owner-occupied | Renter-occupied |
| Single Unit, Detached | 2,131 (98.4%) | 35 (1.6%) |
| Single Unit, Attached | 181 (60.1%) | 120 (39.9%) |
| 2 Unit Apartments | 60 (29.4%) | 144 (70.6%) |
| 3 or 4 Unit Apartments | 16 (10.8%) | 132 (89.2%) |
| 5 to 9 Unit Apartments | 17 (12.9%) | 115 (87.1%) |
| 10 or more Apartments | 33 (12.4%) | 233 (87.6%) |
| Mobile Home / Other | 11 (100.0%) | 0 (0.0%) |
| Total | 2,449 (75.9%) | 779 (24.1%) |
Housing Structures by Number of Rooms in Cortland
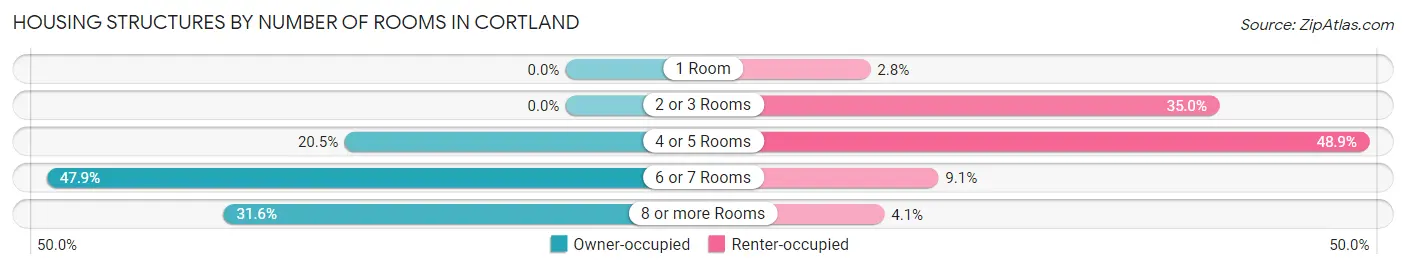
| Number of Rooms | Owner-occupied | Renter-occupied |
| 1 Room | 0 (0.0%) | 22 (2.8%) |
| 2 or 3 Rooms | 0 (0.0%) | 273 (35.0%) |
| 4 or 5 Rooms | 501 (20.5%) | 381 (48.9%) |
| 6 or 7 Rooms | 1,174 (47.9%) | 71 (9.1%) |
| 8 or more Rooms | 774 (31.6%) | 32 (4.1%) |
| Total | 2,449 (100.0%) | 779 (100.0%) |
Housing Structure by Heating Type in Cortland
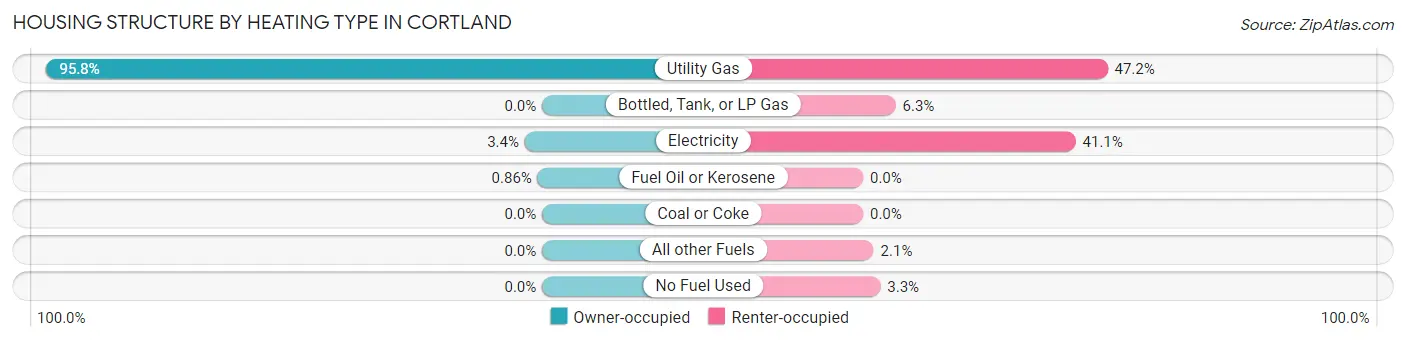
| Heating Type | Owner-occupied | Renter-occupied |
| Utility Gas | 2,346 (95.8%) | 368 (47.2%) |
| Bottled, Tank, or LP Gas | 0 (0.0%) | 49 (6.3%) |
| Electricity | 82 (3.4%) | 320 (41.1%) |
| Fuel Oil or Kerosene | 21 (0.9%) | 0 (0.0%) |
| Coal or Coke | 0 (0.0%) | 0 (0.0%) |
| All other Fuels | 0 (0.0%) | 16 (2.1%) |
| No Fuel Used | 0 (0.0%) | 26 (3.3%) |
| Total | 2,449 (100.0%) | 779 (100.0%) |
Household Vehicle Usage in Cortland
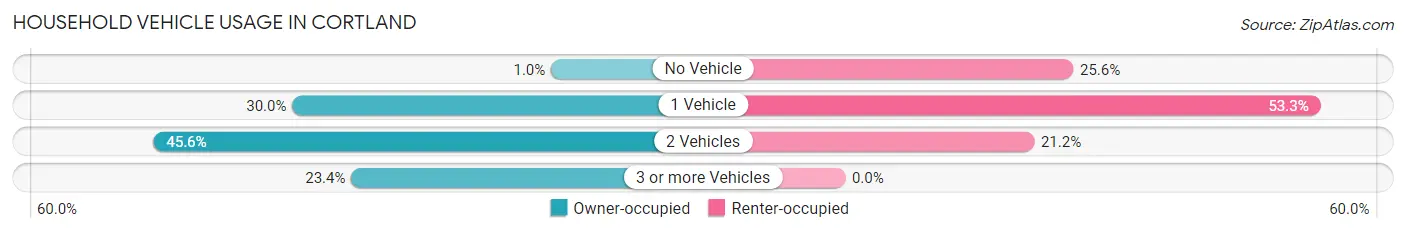
| Vehicles per Household | Owner-occupied | Renter-occupied |
| No Vehicle | 25 (1.0%) | 199 (25.6%) |
| 1 Vehicle | 735 (30.0%) | 415 (53.3%) |
| 2 Vehicles | 1,116 (45.6%) | 165 (21.2%) |
| 3 or more Vehicles | 573 (23.4%) | 0 (0.0%) |
| Total | 2,449 (100.0%) | 779 (100.0%) |
Real Estate & Mortgages in Cortland
Real Estate and Mortgage Overview in Cortland
| Characteristic | Without Mortgage | With Mortgage |
| Housing Units | 927 | 1,522 |
| Median Property Value | $166,600 | $210,000 |
| Median Household Income | $78,224 | $285 |
| Monthly Housing Costs | $578 | $50 |
| Real Estate Taxes | $2,684 | $11 |
Property Value by Mortgage Status in Cortland
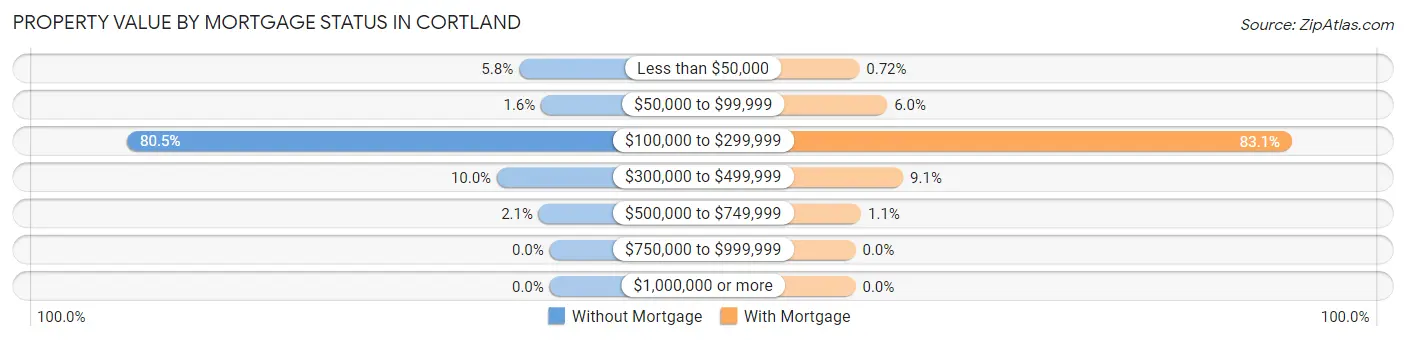
| Property Value | Without Mortgage | With Mortgage |
| Less than $50,000 | 54 (5.8%) | 11 (0.7%) |
| $50,000 to $99,999 | 15 (1.6%) | 92 (6.0%) |
| $100,000 to $299,999 | 746 (80.5%) | 1,265 (83.1%) |
| $300,000 to $499,999 | 93 (10.0%) | 138 (9.1%) |
| $500,000 to $749,999 | 19 (2.1%) | 16 (1.1%) |
| $750,000 to $999,999 | 0 (0.0%) | 0 (0.0%) |
| $1,000,000 or more | 0 (0.0%) | 0 (0.0%) |
| Total | 927 (100.0%) | 1,522 (100.0%) |
Household Income by Mortgage Status in Cortland
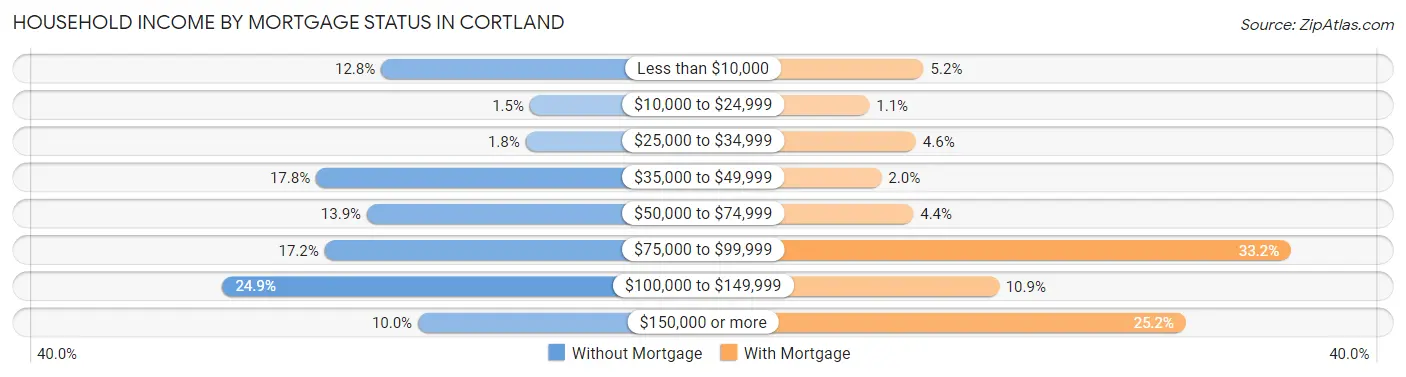
| Household Income | Without Mortgage | With Mortgage |
| Less than $10,000 | 119 (12.8%) | 79 (5.2%) |
| $10,000 to $24,999 | 14 (1.5%) | 16 (1.1%) |
| $25,000 to $34,999 | 17 (1.8%) | 70 (4.6%) |
| $35,000 to $49,999 | 165 (17.8%) | 30 (2.0%) |
| $50,000 to $74,999 | 129 (13.9%) | 67 (4.4%) |
| $75,000 to $99,999 | 159 (17.2%) | 505 (33.2%) |
| $100,000 to $149,999 | 231 (24.9%) | 166 (10.9%) |
| $150,000 or more | 93 (10.0%) | 383 (25.2%) |
| Total | 927 (100.0%) | 1,522 (100.0%) |
Property Value to Household Income Ratio in Cortland
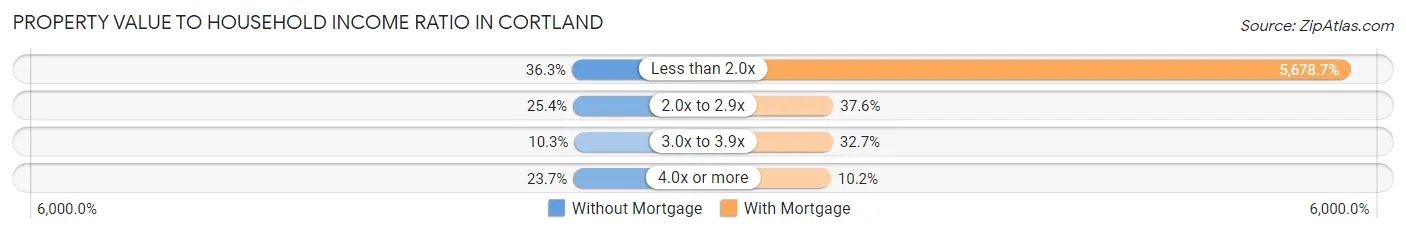
| Value-to-Income Ratio | Without Mortgage | With Mortgage |
| Less than 2.0x | 336 (36.2%) | 86,429 (5,678.6%) |
| 2.0x to 2.9x | 235 (25.4%) | 572 (37.6%) |
| 3.0x to 3.9x | 95 (10.2%) | 498 (32.7%) |
| 4.0x or more | 220 (23.7%) | 155 (10.2%) |
| Total | 927 (100.0%) | 1,522 (100.0%) |
Real Estate Taxes by Mortgage Status in Cortland
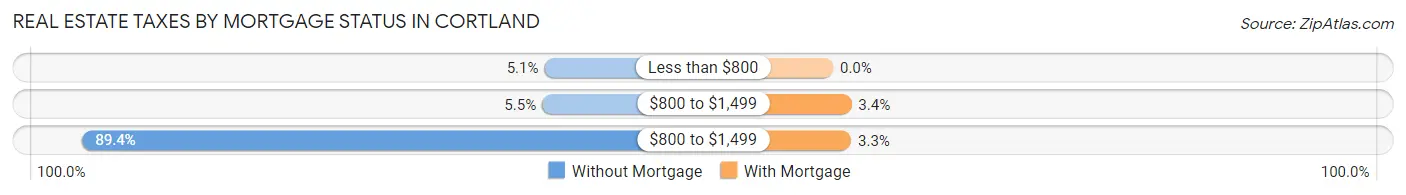
| Property Taxes | Without Mortgage | With Mortgage |
| Less than $800 | 47 (5.1%) | 0 (0.0%) |
| $800 to $1,499 | 51 (5.5%) | 51 (3.4%) |
| $800 to $1,499 | 829 (89.4%) | 50 (3.3%) |
| Total | 927 (100.0%) | 1,522 (100.0%) |
Health & Disability in Cortland
Health Insurance Coverage by Age in Cortland
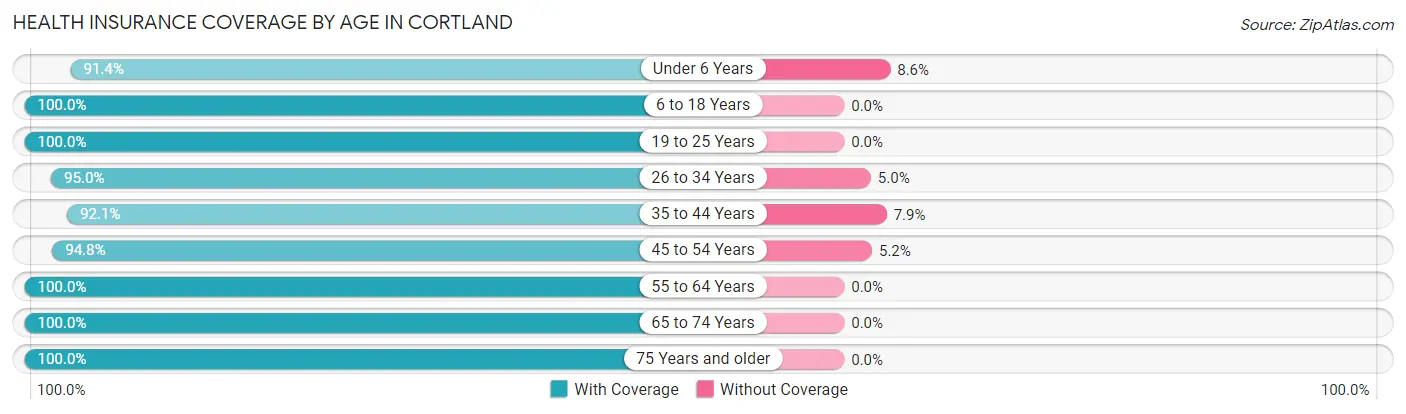
| Age Bracket | With Coverage | Without Coverage |
| Under 6 Years | 373 (91.4%) | 35 (8.6%) |
| 6 to 18 Years | 1,130 (100.0%) | 0 (0.0%) |
| 19 to 25 Years | 229 (100.0%) | 0 (0.0%) |
| 26 to 34 Years | 460 (95.0%) | 24 (5.0%) |
| 35 to 44 Years | 617 (92.1%) | 53 (7.9%) |
| 45 to 54 Years | 844 (94.8%) | 46 (5.2%) |
| 55 to 64 Years | 1,235 (100.0%) | 0 (0.0%) |
| 65 to 74 Years | 1,329 (100.0%) | 0 (0.0%) |
| 75 Years and older | 588 (100.0%) | 0 (0.0%) |
| Total | 6,805 (97.7%) | 158 (2.3%) |
Health Insurance Coverage by Citizenship Status in Cortland
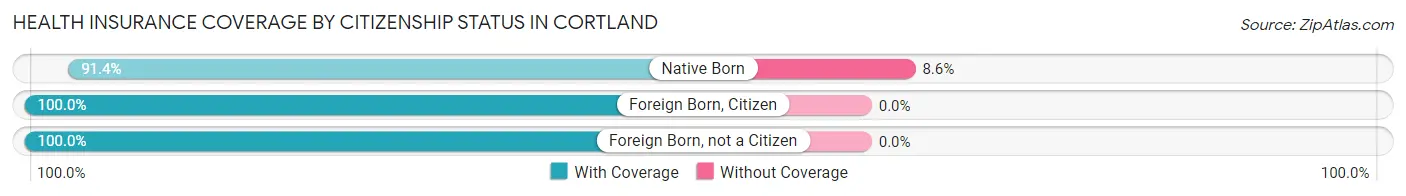
| Citizenship Status | With Coverage | Without Coverage |
| Native Born | 373 (91.4%) | 35 (8.6%) |
| Foreign Born, Citizen | 1,130 (100.0%) | 0 (0.0%) |
| Foreign Born, not a Citizen | 229 (100.0%) | 0 (0.0%) |
Health Insurance Coverage by Household Income in Cortland
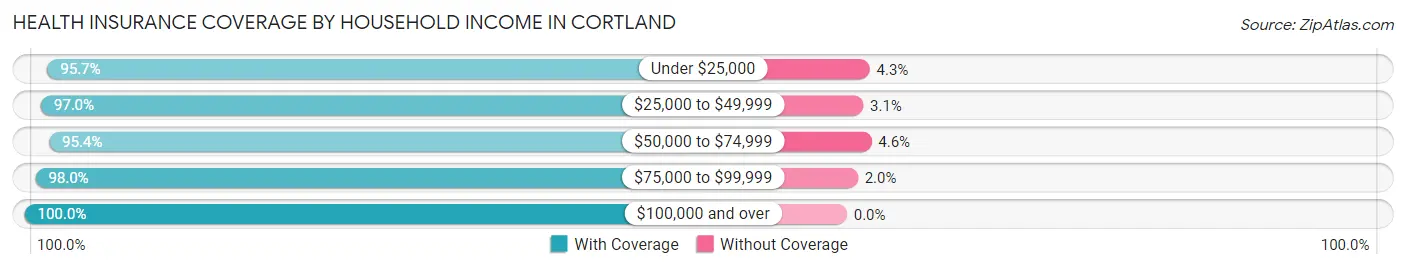
| Household Income | With Coverage | Without Coverage |
| Under $25,000 | 830 (95.7%) | 37 (4.3%) |
| $25,000 to $49,999 | 732 (97.0%) | 23 (3.0%) |
| $50,000 to $74,999 | 1,658 (95.4%) | 80 (4.6%) |
| $75,000 to $99,999 | 866 (98.0%) | 18 (2.0%) |
| $100,000 and over | 2,719 (100.0%) | 0 (0.0%) |
Public vs Private Health Insurance Coverage by Age in Cortland
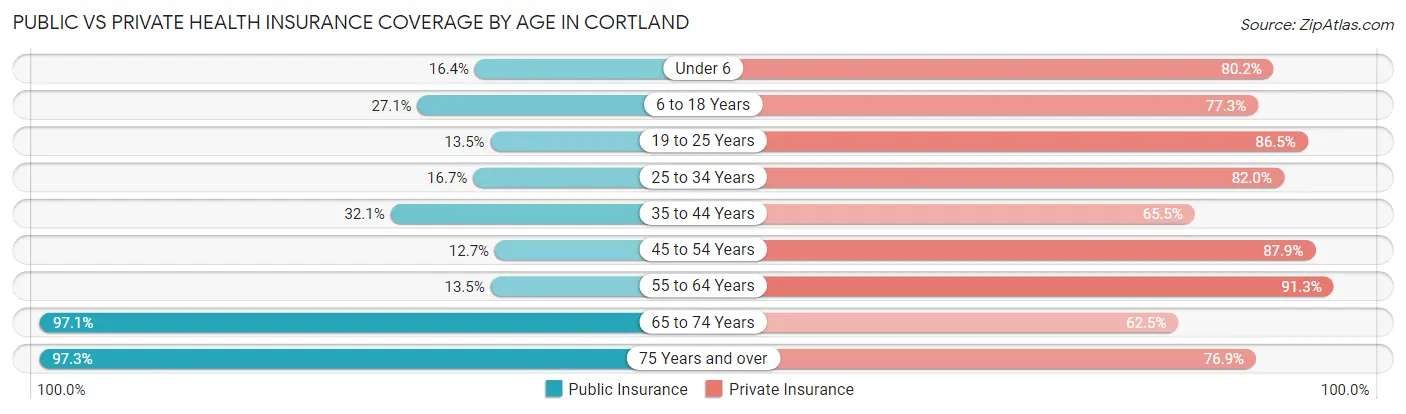
| Age Bracket | Public Insurance | Private Insurance |
| Under 6 | 67 (16.4%) | 327 (80.1%) |
| 6 to 18 Years | 306 (27.1%) | 873 (77.3%) |
| 19 to 25 Years | 31 (13.5%) | 198 (86.5%) |
| 25 to 34 Years | 81 (16.7%) | 397 (82.0%) |
| 35 to 44 Years | 215 (32.1%) | 439 (65.5%) |
| 45 to 54 Years | 113 (12.7%) | 782 (87.9%) |
| 55 to 64 Years | 167 (13.5%) | 1,127 (91.3%) |
| 65 to 74 Years | 1,291 (97.1%) | 830 (62.5%) |
| 75 Years and over | 572 (97.3%) | 452 (76.9%) |
| Total | 2,843 (40.8%) | 5,425 (77.9%) |
Disability Status by Sex by Age in Cortland
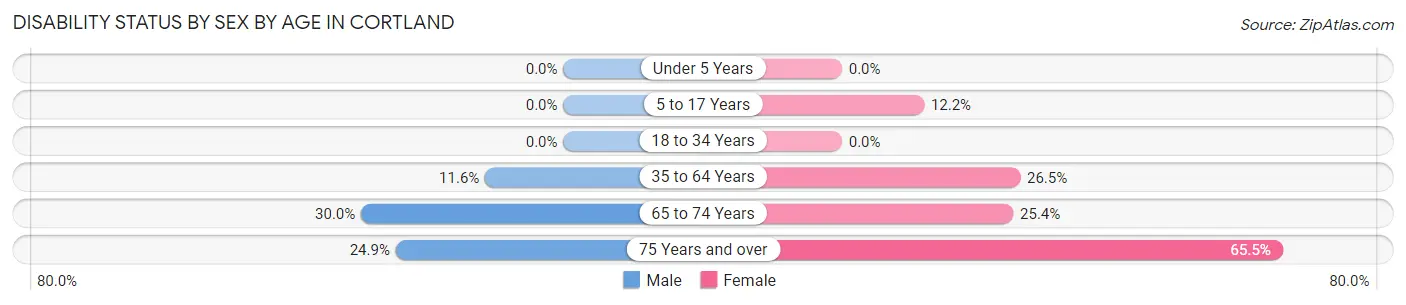
| Age Bracket | Male | Female |
| Under 5 Years | 0 (0.0%) | 0 (0.0%) |
| 5 to 17 Years | 0 (0.0%) | 50 (12.2%) |
| 18 to 34 Years | 0 (0.0%) | 0 (0.0%) |
| 35 to 64 Years | 157 (11.6%) | 382 (26.5%) |
| 65 to 74 Years | 176 (30.0%) | 189 (25.4%) |
| 75 Years and over | 57 (24.9%) | 235 (65.5%) |
Disability Class by Sex by Age in Cortland
Disability Class: Hearing Difficulty
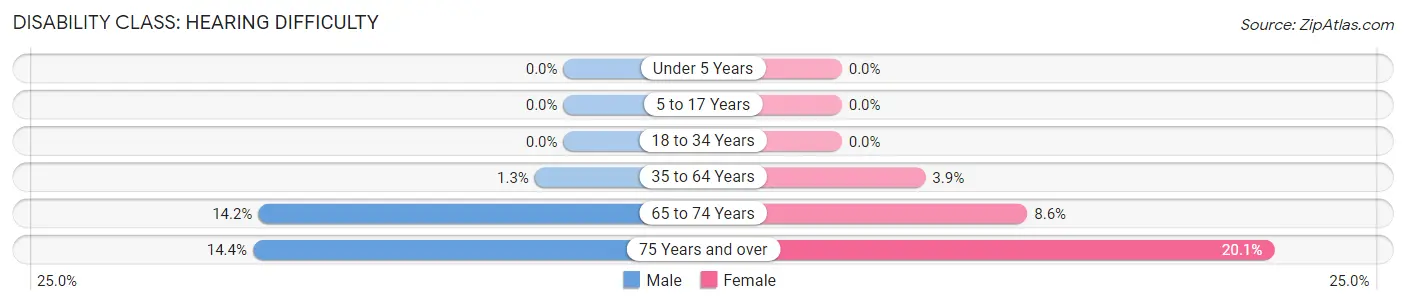
| Age Bracket | Male | Female |
| Under 5 Years | 0 (0.0%) | 0 (0.0%) |
| 5 to 17 Years | 0 (0.0%) | 0 (0.0%) |
| 18 to 34 Years | 0 (0.0%) | 0 (0.0%) |
| 35 to 64 Years | 18 (1.3%) | 56 (3.9%) |
| 65 to 74 Years | 83 (14.2%) | 64 (8.6%) |
| 75 Years and over | 33 (14.4%) | 72 (20.1%) |
Disability Class: Vision Difficulty
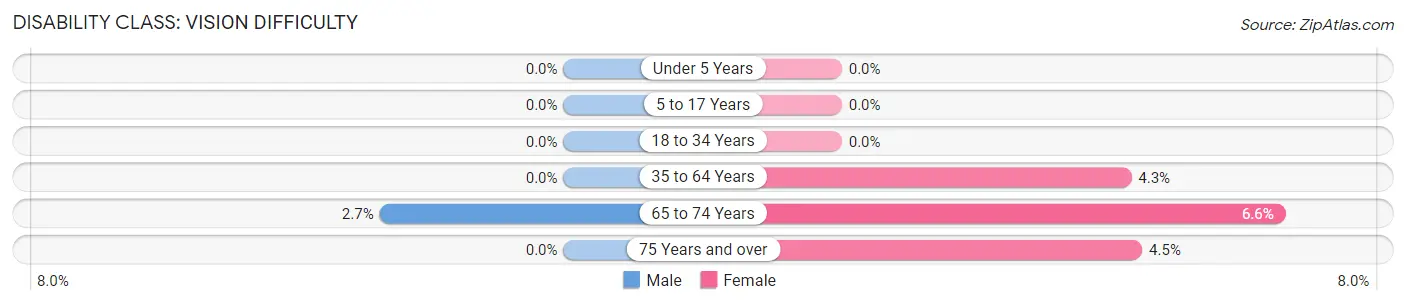
| Age Bracket | Male | Female |
| Under 5 Years | 0 (0.0%) | 0 (0.0%) |
| 5 to 17 Years | 0 (0.0%) | 0 (0.0%) |
| 18 to 34 Years | 0 (0.0%) | 0 (0.0%) |
| 35 to 64 Years | 0 (0.0%) | 62 (4.3%) |
| 65 to 74 Years | 16 (2.7%) | 49 (6.6%) |
| 75 Years and over | 0 (0.0%) | 16 (4.5%) |
Disability Class: Cognitive Difficulty
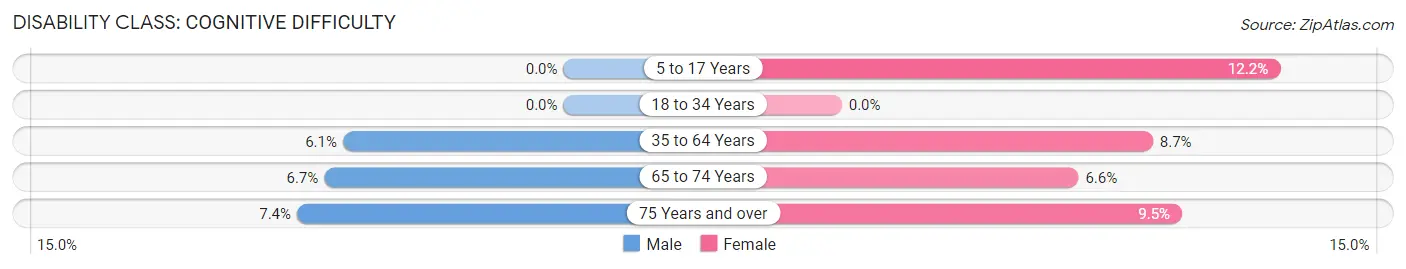
| Age Bracket | Male | Female |
| 5 to 17 Years | 0 (0.0%) | 50 (12.2%) |
| 18 to 34 Years | 0 (0.0%) | 0 (0.0%) |
| 35 to 64 Years | 83 (6.1%) | 125 (8.7%) |
| 65 to 74 Years | 39 (6.7%) | 49 (6.6%) |
| 75 Years and over | 17 (7.4%) | 34 (9.5%) |
Disability Class: Ambulatory Difficulty
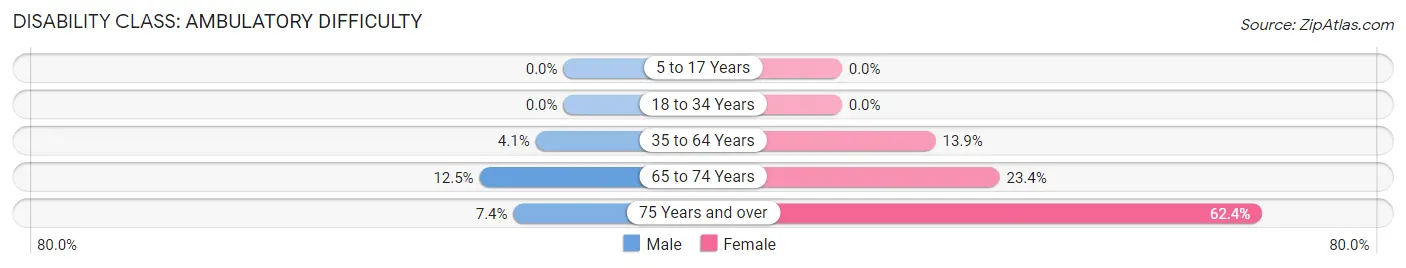
| Age Bracket | Male | Female |
| 5 to 17 Years | 0 (0.0%) | 0 (0.0%) |
| 18 to 34 Years | 0 (0.0%) | 0 (0.0%) |
| 35 to 64 Years | 56 (4.1%) | 201 (13.9%) |
| 65 to 74 Years | 73 (12.5%) | 174 (23.4%) |
| 75 Years and over | 17 (7.4%) | 224 (62.4%) |
Disability Class: Self-Care Difficulty
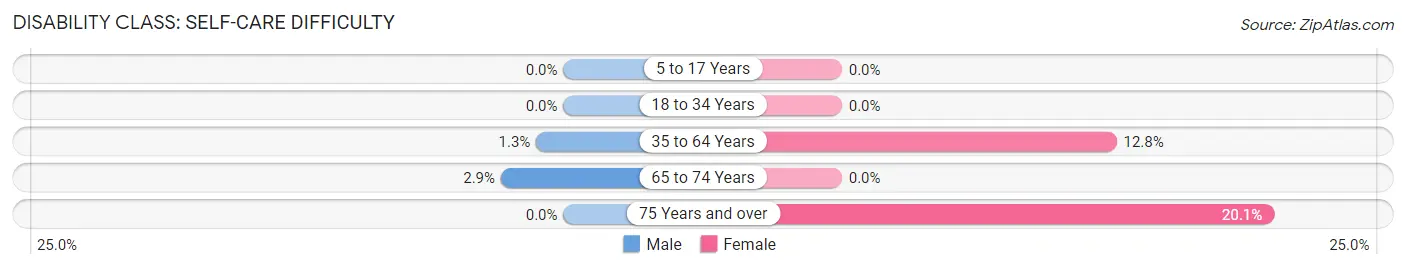
| Age Bracket | Male | Female |
| 5 to 17 Years | 0 (0.0%) | 0 (0.0%) |
| 18 to 34 Years | 0 (0.0%) | 0 (0.0%) |
| 35 to 64 Years | 17 (1.3%) | 184 (12.8%) |
| 65 to 74 Years | 17 (2.9%) | 0 (0.0%) |
| 75 Years and over | 0 (0.0%) | 72 (20.1%) |
Technology Access in Cortland
Computing Device Access in Cortland
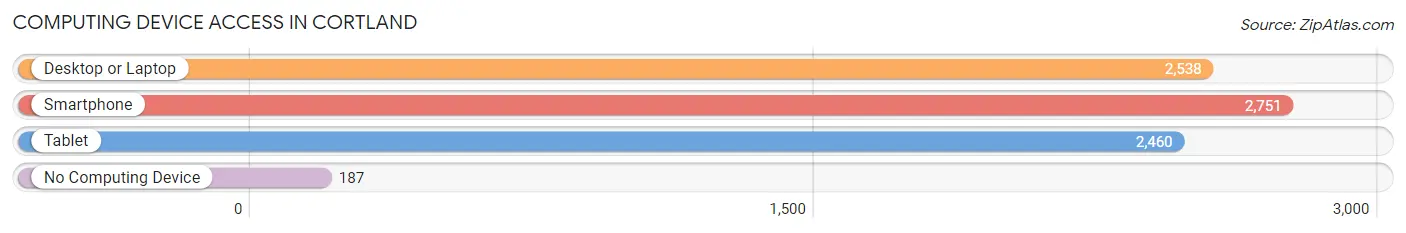
| Device Type | # Households | % Households |
| Desktop or Laptop | 2,538 | 78.6% |
| Smartphone | 2,751 | 85.2% |
| Tablet | 2,460 | 76.2% |
| No Computing Device | 187 | 5.8% |
| Total | 3,228 | 100.0% |
Internet Access in Cortland
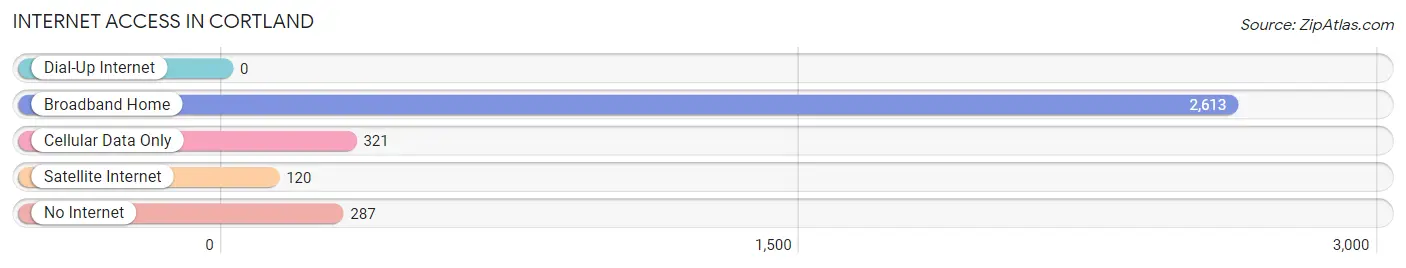
| Internet Type | # Households | % Households |
| Dial-Up Internet | 0 | 0.0% |
| Broadband Home | 2,613 | 80.9% |
| Cellular Data Only | 321 | 9.9% |
| Satellite Internet | 120 | 3.7% |
| No Internet | 287 | 8.9% |
| Total | 3,228 | 100.0% |
Cortland Summary
Cortland, Ohio is a small city located in Trumbull County, Ohio. It is situated on the Mahoning River, approximately 30 miles southeast of Youngstown. The city has a population of approximately 8,000 people and is part of the Youngstown-Warren-Boardman metropolitan area.
History
Cortland was founded in 1805 by a group of settlers from Connecticut. The town was named after the town of Cortland, New York. The settlers were attracted to the area due to its fertile soil and abundant natural resources. The first settlers built a grist mill and a sawmill, which helped to spur the growth of the town.
In 1831, the Ohio and Erie Canal was built, connecting the town to the rest of the state. This allowed for the transportation of goods and people, and helped to further the growth of the town.
In 1845, the town was incorporated as a village. The village was named after the town of Cortland, New York, which was the hometown of one of the original settlers.
In 1875, the village was incorporated as a city. The city was named after the town of Cortland, New York, which was the hometown of one of the original settlers.
Geography
Cortland is located in Trumbull County, Ohio. It is situated on the Mahoning River, approximately 30 miles southeast of Youngstown. The city has a total area of 2.2 square miles, all of which is land.
The city is located in the Appalachian Plateau region of Ohio. The terrain is mostly flat, with some rolling hills. The climate is humid continental, with hot summers and cold winters.
Economy
Cortland’s economy is largely based on manufacturing and agriculture. The city is home to several manufacturing companies, including Cortland Manufacturing, Cortland Plastics, and Cortland Steel.
Agriculture is also an important part of the local economy. The city is home to several farms, which produce a variety of crops, including corn, soybeans, wheat, and hay.
Demographics
As of the 2010 census, the population of Cortland was 8,072. The racial makeup of the city was 95.3% White, 1.2% African American, 0.3% Native American, 0.7% Asian, 0.1% Pacific Islander, 0.7% from other races, and 1.9% from two or more races. Hispanic or Latino of any race were 2.2% of the population.
The median household income in Cortland was $41,944, and the median family income was $50,917. The per capita income for the city was $20,845. About 11.2% of families and 13.3% of the population were below the poverty line, including 17.2% of those under age 18 and 8.2% of those age 65 or over.
Cortland is a small city with a rich history and a diverse economy. It is home to several manufacturing companies and farms, and has a population of approximately 8,000 people. The city is located in the Appalachian Plateau region of Ohio, and has a humid continental climate. The median household income in Cortland is $41,944, and the median family income is $50,917. The racial makeup of the city is 95.3% White, 1.2% African American, 0.3% Native American, 0.7% Asian, 0.1% Pacific Islander, 0.7% from other races, and 1.9% from two or more races. Hispanic or Latino of any race were 2.2% of the population.
Common Questions
What is the Total Population of Cortland?
Total Population of Cortland is 7,073.
What is the Total Male Population of Cortland?
Total Male Population of Cortland is 3,382.
What is the Total Female Population of Cortland?
Total Female Population of Cortland is 3,691.
What is the Ratio of Males per 100 Females in Cortland?
There are 91.63 Males per 100 Females in Cortland.
What is the Ratio of Females per 100 Males in Cortland?
There are 109.14 Females per 100 Males in Cortland.
What is the Median Population Age in Cortland?
Median Population Age in Cortland is 51.4 Years.
What is the Average Family Size in Cortland
Average Family Size in Cortland is 2.8 People.
What is the Average Household Size in Cortland
Average Household Size in Cortland is 2.2 People.
What is Per Capita Income in Cortland?
Per Capita income in Cortland is $39,565.
What is the Median Family Income in Cortland?
Median Family Income in Cortland is $86,607.
What is the Median Household income in Cortland?
Median Household Income in Cortland is $60,767.
What is Income or Wage Gap in Cortland?
Income or Wage Gap in Cortland is 25.9%.
Women in Cortland earn 74.1 cents for every dollar earned by a man.
What is Inequality or Gini Index in Cortland?
Inequality or Gini Index in Cortland is 0.44.
How Large is the Labor Force in Cortland?
There are 3,246 People in the Labor Forcein in Cortland.
What is the Percentage of People in the Labor Force in Cortland?
55.2% of People are in the Labor Force in Cortland.
What is the Unemployment Rate in Cortland?
Unemployment Rate in Cortland is 1.6%.