Stewart, OH
Stewart Map
Stewart Overview
320
TOTAL POPULATION
159
MALE POPULATION
161
FEMALE POPULATION
98.76
MALES / 100 FEMALES
101.26
FEMALES / 100 MALES
65.5
MEDIAN AGE
2.2
AVG FAMILY SIZE
2.4
AVG HOUSEHOLD SIZE
$21,327
PER CAPITA INCOME
$34,104
AVG FAMILY INCOME
$34,646
AVG HOUSEHOLD INCOME
0.28
INEQUALITY / GINI INDEX
140
LABOR FORCE [ PEOPLE ]
46.2%
PERCENT IN LABOR FORCE
Stewart Zip Codes
Stewart Area Codes
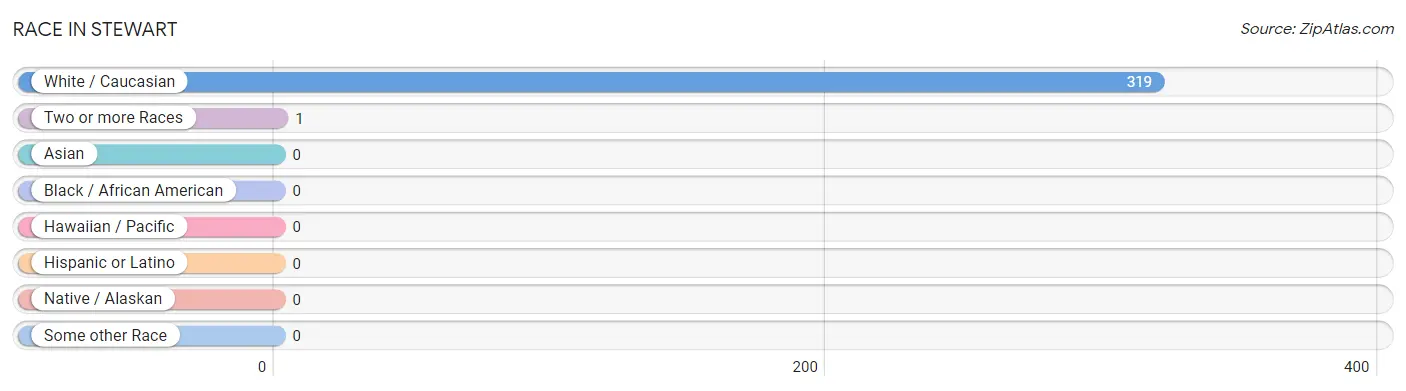
Race in Stewart
The most populous races in Stewart are White / Caucasian (319 | 99.7%), and Two or more Races (1 | 0.3%).
| Race | # Population | % Population |
| Asian | 0 | 0.0% |
| Black / African American | 0 | 0.0% |
| Hawaiian / Pacific | 0 | 0.0% |
| Hispanic or Latino | 0 | 0.0% |
| Native / Alaskan | 0 | 0.0% |
| White / Caucasian | 319 | 99.7% |
| Two or more Races | 1 | 0.3% |
| Some other Race | 0 | 0.0% |
| Total | 320 | 100.0% |
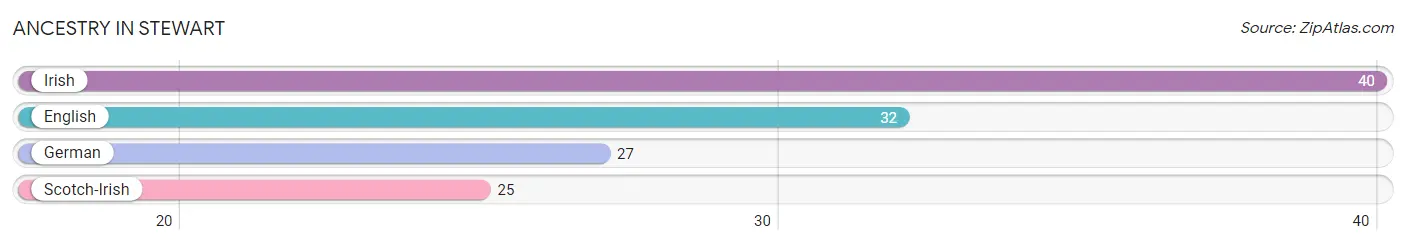
Ancestry in Stewart
The most populous ancestries reported in Stewart are Irish (40 | 12.5%), English (32 | 10.0%), German (27 | 8.4%), and Scotch-Irish (25 | 7.8%), together accounting for 38.8% of all Stewart residents.
| Ancestry | # Population | % Population |
| English | 32 | 10.0% |
| German | 27 | 8.4% |
| Irish | 40 | 12.5% |
| Scotch-Irish | 25 | 7.8% | View All 4 Rows |
Immigrants in Stewart

| Immigration Origin | # Population | % Population | View All 0 Rows |
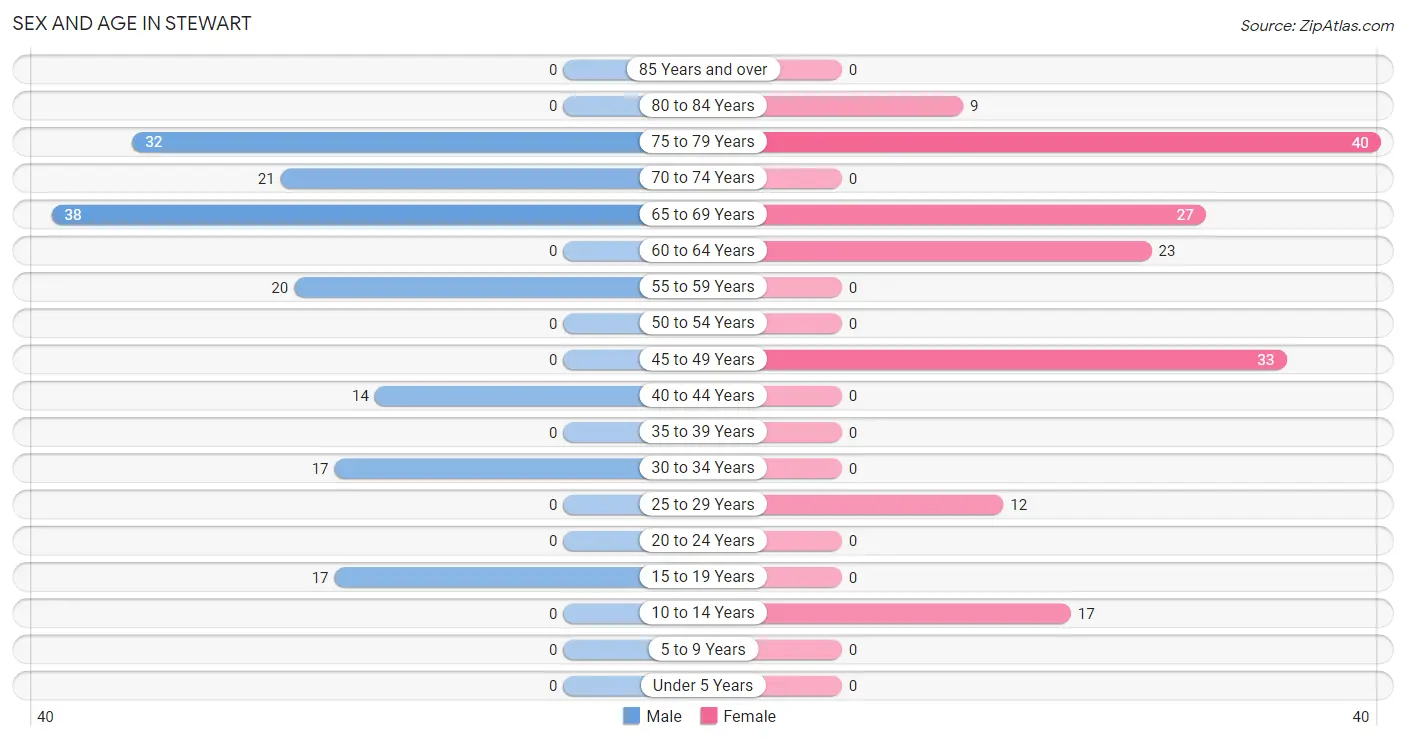
Sex and Age in Stewart
Sex and Age in Stewart
The most populous age groups in Stewart are 65 to 69 Years (38 | 23.9%) for men and 75 to 79 Years (40 | 24.8%) for women.
| Age Bracket | Male | Female |
| Under 5 Years | 0 (0.0%) | 0 (0.0%) |
| 5 to 9 Years | 0 (0.0%) | 0 (0.0%) |
| 10 to 14 Years | 0 (0.0%) | 17 (10.6%) |
| 15 to 19 Years | 17 (10.7%) | 0 (0.0%) |
| 20 to 24 Years | 0 (0.0%) | 0 (0.0%) |
| 25 to 29 Years | 0 (0.0%) | 12 (7.4%) |
| 30 to 34 Years | 17 (10.7%) | 0 (0.0%) |
| 35 to 39 Years | 0 (0.0%) | 0 (0.0%) |
| 40 to 44 Years | 14 (8.8%) | 0 (0.0%) |
| 45 to 49 Years | 0 (0.0%) | 33 (20.5%) |
| 50 to 54 Years | 0 (0.0%) | 0 (0.0%) |
| 55 to 59 Years | 20 (12.6%) | 0 (0.0%) |
| 60 to 64 Years | 0 (0.0%) | 23 (14.3%) |
| 65 to 69 Years | 38 (23.9%) | 27 (16.8%) |
| 70 to 74 Years | 21 (13.2%) | 0 (0.0%) |
| 75 to 79 Years | 32 (20.1%) | 40 (24.8%) |
| 80 to 84 Years | 0 (0.0%) | 9 (5.6%) |
| 85 Years and over | 0 (0.0%) | 0 (0.0%) |
| Total | 159 (100.0%) | 161 (100.0%) |
Families and Households in Stewart
Median Family Size in Stewart
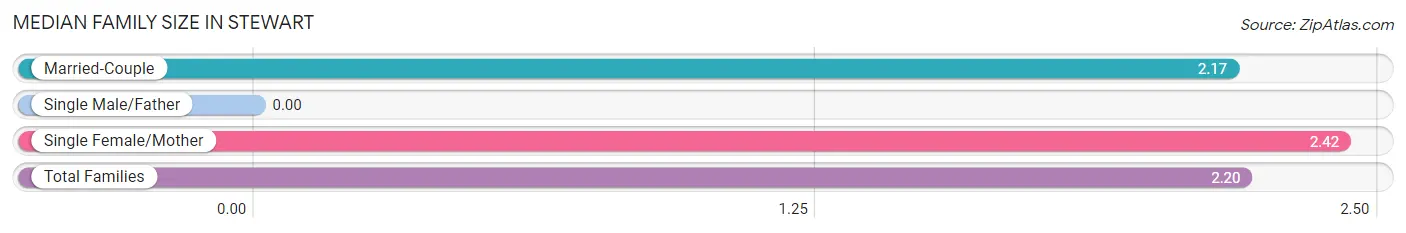
| Family Type | # Families | Family Size |
| Married-Couple | 100 (89.3%) | 2.17 |
| Single Male/Father | 0 (0.0%) | - |
| Single Female/Mother | 12 (10.7%) | 2.42 |
| Total Families | 112 (100.0%) | 2.20 |
Median Household Size in Stewart
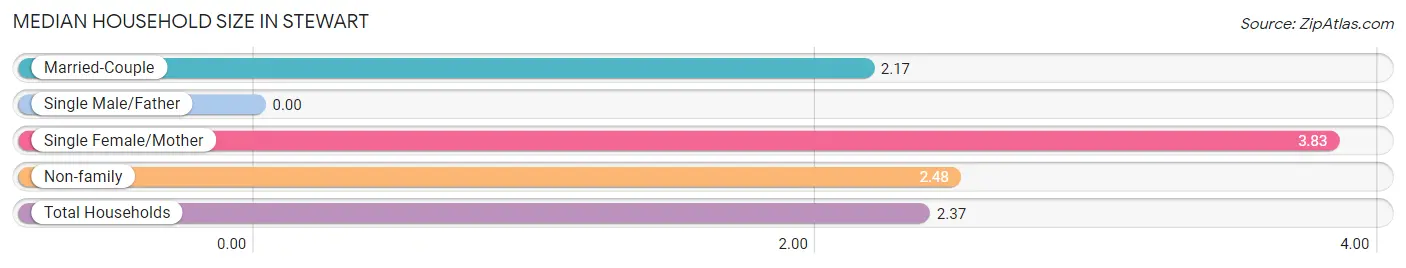
| Household Type | # Households | Household Size |
| Married-Couple | 100 (74.1%) | 2.17 |
| Single Male/Father | 0 (0.0%) | - |
| Single Female/Mother | 12 (8.9%) | 3.83 |
| Non-family | 23 (17.0%) | 2.48 |
| Total Households | 135 (100.0%) | 2.37 |
Household Size by Marriage Status in Stewart
Out of a total of 135 households in Stewart, 112 (83.0%) are family households, while 23 (17.0%) are nonfamily households. The most numerous type of family households are 2-person households, comprising 80, and the most common type of nonfamily households are 3-person households, comprising 14.
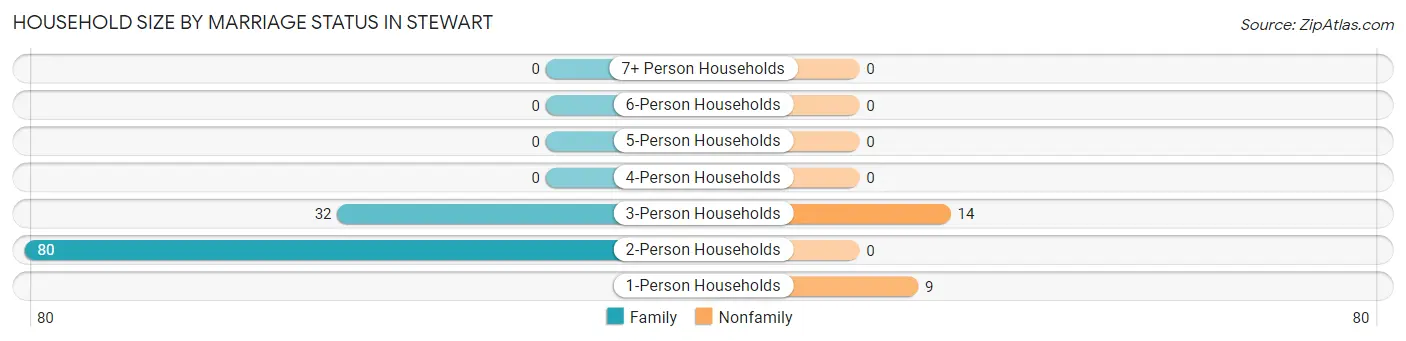
| Household Size | Family Households | Nonfamily Households |
| 1-Person Households | - | 9 (6.7%) |
| 2-Person Households | 80 (59.3%) | 0 (0.0%) |
| 3-Person Households | 32 (23.7%) | 14 (10.4%) |
| 4-Person Households | 0 (0.0%) | 0 (0.0%) |
| 5-Person Households | 0 (0.0%) | 0 (0.0%) |
| 6-Person Households | 0 (0.0%) | 0 (0.0%) |
| 7+ Person Households | 0 (0.0%) | 0 (0.0%) |
| Total | 112 (83.0%) | 23 (17.0%) |
Female Fertility in Stewart
Fertility by Age in Stewart
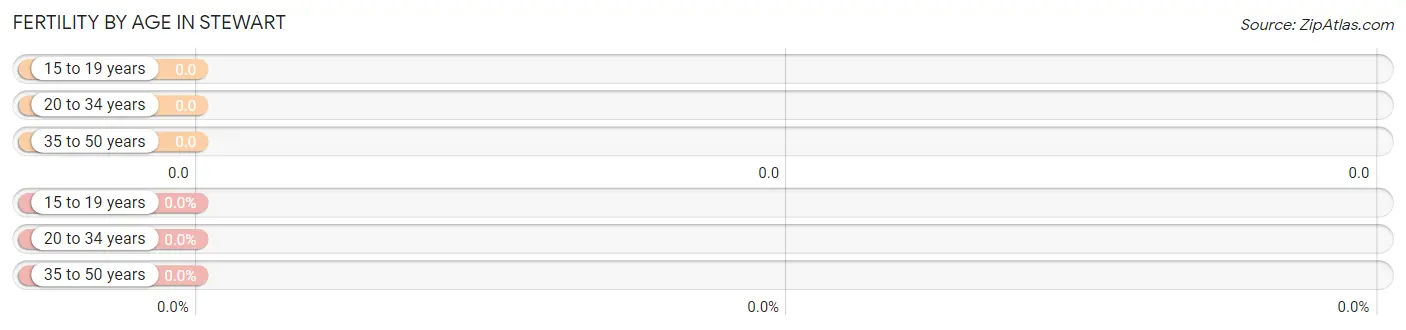
| Age Bracket | Women with Births | Births / 1,000 Women |
| 15 to 19 years | 0 (0.0%) | 0.0 |
| 20 to 34 years | 0 (0.0%) | 0.0 |
| 35 to 50 years | 0 (0.0%) | 0.0 |
| Total | 0 (0.0%) | 0.0 |
Fertility by Age by Marriage Status in Stewart
| Age Bracket | Married | Unmarried |
| 15 to 19 years | 0 (0.0%) | 0 (0.0%) |
| 20 to 34 years | 0 (0.0%) | 0 (0.0%) |
| 35 to 50 years | 0 (0.0%) | 0 (0.0%) |
| Total | 0 (0.0%) | 0 (0.0%) |
Fertility by Education in Stewart
| Educational Attainment | Women with Births | Births / 1,000 Women |
| Less than High School | 0 (0.0%) | 0.0 |
| High School Diploma | 0 (0.0%) | 0.0 |
| College or Associate's Degree | 0 (0.0%) | 0.0 |
| Bachelor's Degree | 0 (0.0%) | 0.0 |
| Graduate Degree | 0 (0.0%) | 0.0 |
| Total | 0 (0.0%) | 0.0 |
Fertility by Education by Marriage Status in Stewart
| Educational Attainment | Married | Unmarried |
| Less than High School | 0 (0.0%) | 0 (0.0%) |
| High School Diploma | 0 (0.0%) | 0 (0.0%) |
| College or Associate's Degree | 0 (0.0%) | 0 (0.0%) |
| Bachelor's Degree | 0 (0.0%) | 0 (0.0%) |
| Graduate Degree | 0 (0.0%) | 0 (0.0%) |
| Total | 0 (0.0%) | 0 (0.0%) |
Income in Stewart
Income Overview in Stewart
Per Capita Income in Stewart is $21,327, while median incomes of families and households are $34,104 and $34,646 respectively.
| Characteristic | Number | Measure |
| Per Capita Income | 320 | $21,327 |
| Median Family Income | 112 | $34,104 |
| Mean Family Income | 112 | $42,992 |
| Median Household Income | 135 | $34,646 |
| Mean Household Income | 135 | $50,141 |
| Income Deficit | 112 | $0 |
| Wage / Income Gap (%) | 320 | 0.00% |
| Wage / Income Gap ($) | 320 | 100.00¢ per $1 |
| Gini / Inequality Index | 320 | 0.28 |
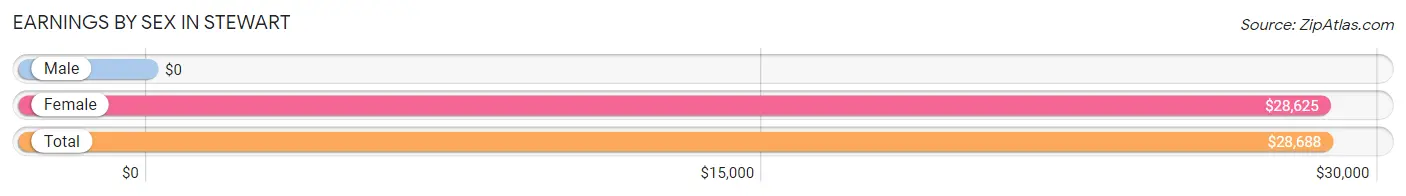
Earnings by Sex in Stewart
| Sex | Number | Average Earnings |
| Male | 85 (54.1%) | $0 |
| Female | 72 (45.9%) | $28,625 |
| Total | 157 (100.0%) | $28,688 |
Earnings by Sex by Income Bracket in Stewart
The most common earnings brackets in Stewart are $35,000 to $39,999 for men (31 | 36.5%) and $15,000 to $17,499 for women (27 | 37.5%).
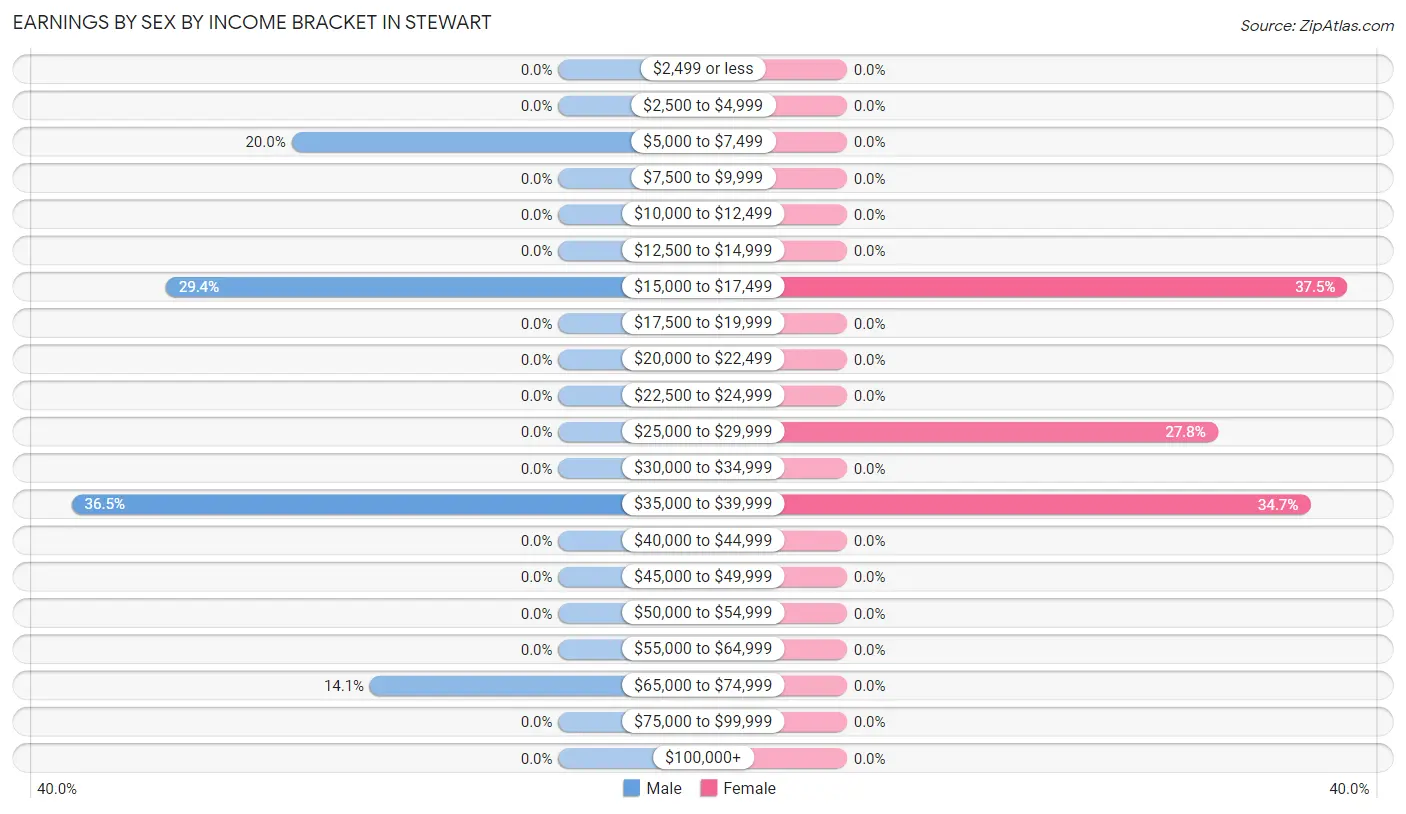
| Income | Male | Female |
| $2,499 or less | 0 (0.0%) | 0 (0.0%) |
| $2,500 to $4,999 | 0 (0.0%) | 0 (0.0%) |
| $5,000 to $7,499 | 17 (20.0%) | 0 (0.0%) |
| $7,500 to $9,999 | 0 (0.0%) | 0 (0.0%) |
| $10,000 to $12,499 | 0 (0.0%) | 0 (0.0%) |
| $12,500 to $14,999 | 0 (0.0%) | 0 (0.0%) |
| $15,000 to $17,499 | 25 (29.4%) | 27 (37.5%) |
| $17,500 to $19,999 | 0 (0.0%) | 0 (0.0%) |
| $20,000 to $22,499 | 0 (0.0%) | 0 (0.0%) |
| $22,500 to $24,999 | 0 (0.0%) | 0 (0.0%) |
| $25,000 to $29,999 | 0 (0.0%) | 20 (27.8%) |
| $30,000 to $34,999 | 0 (0.0%) | 0 (0.0%) |
| $35,000 to $39,999 | 31 (36.5%) | 25 (34.7%) |
| $40,000 to $44,999 | 0 (0.0%) | 0 (0.0%) |
| $45,000 to $49,999 | 0 (0.0%) | 0 (0.0%) |
| $50,000 to $54,999 | 0 (0.0%) | 0 (0.0%) |
| $55,000 to $64,999 | 0 (0.0%) | 0 (0.0%) |
| $65,000 to $74,999 | 12 (14.1%) | 0 (0.0%) |
| $75,000 to $99,999 | 0 (0.0%) | 0 (0.0%) |
| $100,000+ | 0 (0.0%) | 0 (0.0%) |
| Total | 85 (100.0%) | 72 (100.0%) |
Earnings by Sex by Educational Attainment in Stewart
| Educational Attainment | Male Income | Female Income |
| Less than High School | - | - |
| High School Diploma | - | - |
| College or Associate's Degree | - | - |
| Bachelor's Degree | - | - |
| Graduate Degree | - | - |
| Total | $36,324 | $28,625 |
Family Income in Stewart
Family Income Brackets in Stewart
According to the Stewart family income data, there are 67 families falling into the $25,000 to $34,999 income range, which is the most common income bracket and makes up 59.8% of all families.
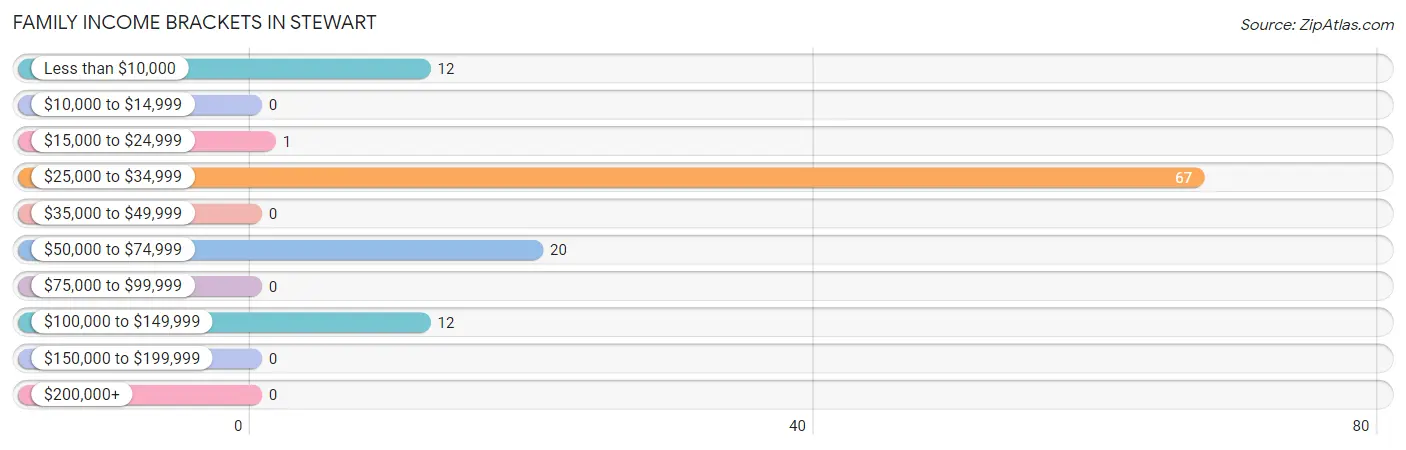
| Income Bracket | # Families | % Families |
| Less than $10,000 | 12 | 10.7% |
| $10,000 to $14,999 | 0 | 0.0% |
| $15,000 to $24,999 | 1 | 0.9% |
| $25,000 to $34,999 | 67 | 59.8% |
| $35,000 to $49,999 | 0 | 0.0% |
| $50,000 to $74,999 | 20 | 17.9% |
| $75,000 to $99,999 | 0 | 0.0% |
| $100,000 to $149,999 | 12 | 10.7% |
| $150,000 to $199,999 | 0 | 0.0% |
| $200,000+ | 0 | 0.0% |
Family Income by Famaliy Size in Stewart
2-person families (92 | 82.1%) account for the highest median family income in Stewart with $33,731 per family, while 2-person families (92 | 82.1%) have the highest median income of $16,866 per family member.
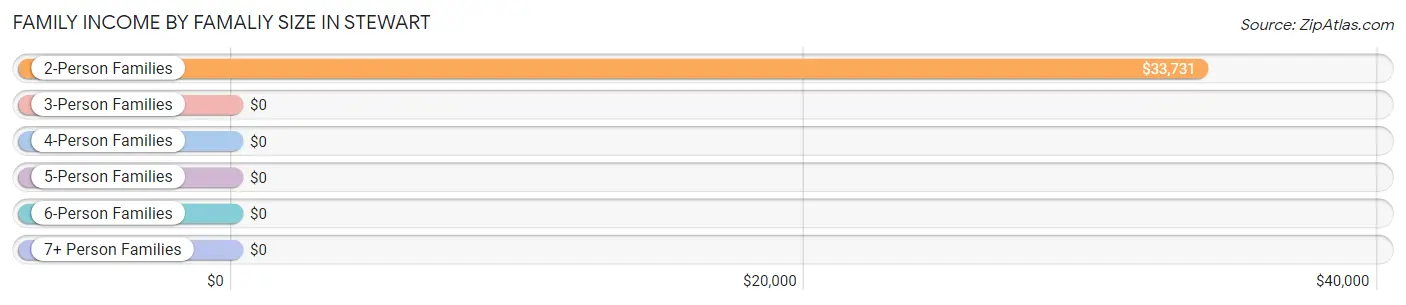
| Income Bracket | # Families | Median Income |
| 2-Person Families | 92 (82.1%) | $33,731 |
| 3-Person Families | 20 (17.9%) | $0 |
| 4-Person Families | 0 (0.0%) | $0 |
| 5-Person Families | 0 (0.0%) | $0 |
| 6-Person Families | 0 (0.0%) | $0 |
| 7+ Person Families | 0 (0.0%) | $0 |
| Total | 112 (100.0%) | $34,104 |
Family Income by Number of Earners in Stewart
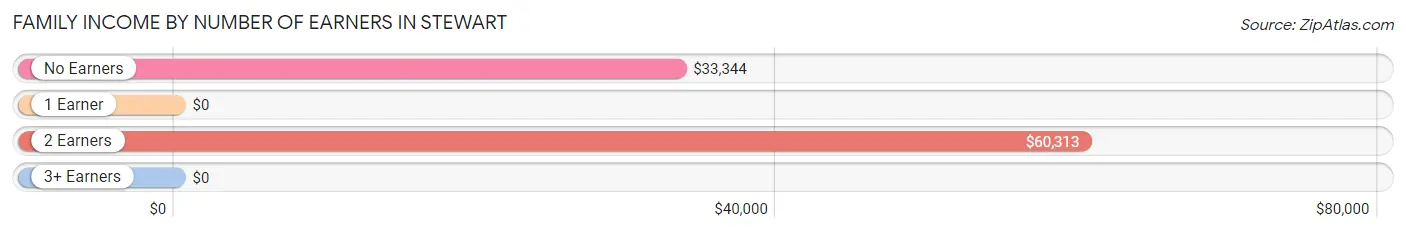
| Number of Earners | # Families | Median Income |
| No Earners | 53 (47.3%) | $33,344 |
| 1 Earner | 0 (0.0%) | $0 |
| 2 Earners | 59 (52.7%) | $60,313 |
| 3+ Earners | 0 (0.0%) | $0 |
| Total | 112 (100.0%) | $34,104 |
Household Income in Stewart
Household Income Brackets in Stewart
With 67 households falling in the category, the $25,000 to $34,999 income range is the most frequent in Stewart, accounting for 49.6% of all households.
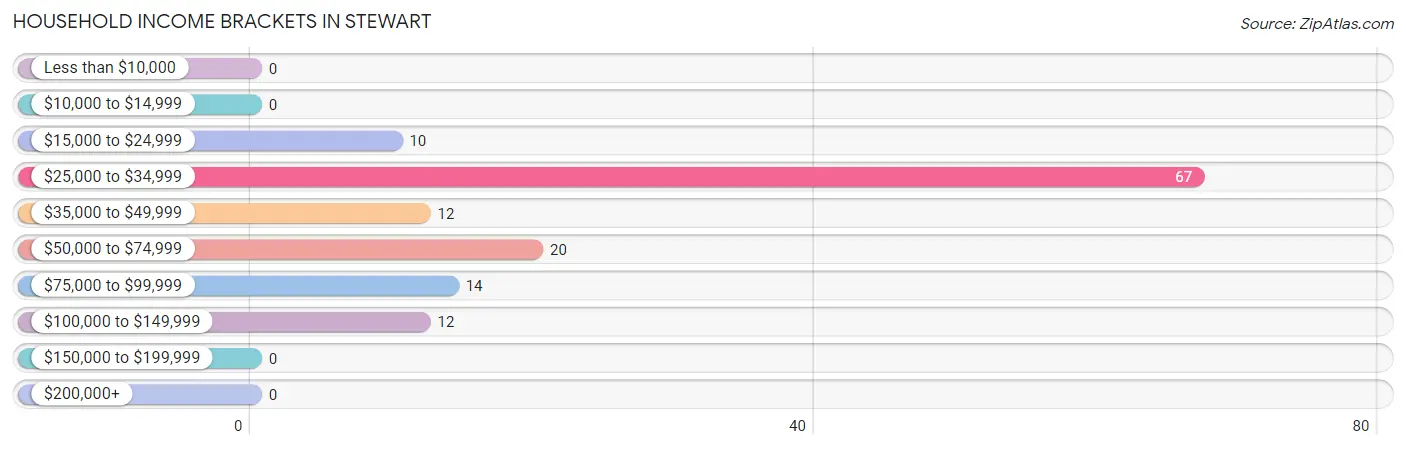
| Income Bracket | # Households | % Households |
| Less than $10,000 | 0 | 0.0% |
| $10,000 to $14,999 | 0 | 0.0% |
| $15,000 to $24,999 | 10 | 7.4% |
| $25,000 to $34,999 | 67 | 49.6% |
| $35,000 to $49,999 | 12 | 8.9% |
| $50,000 to $74,999 | 20 | 14.8% |
| $75,000 to $99,999 | 14 | 10.4% |
| $100,000 to $149,999 | 12 | 8.9% |
| $150,000 to $199,999 | 0 | 0.0% |
| $200,000+ | 0 | 0.0% |
Household Income by Householder Age in Stewart
The median household income in Stewart is $34,646, with the highest median household income of $33,787 found in the 65+ years age bracket for the primary householder. A total of 89 households (65.9%) fall into this category.
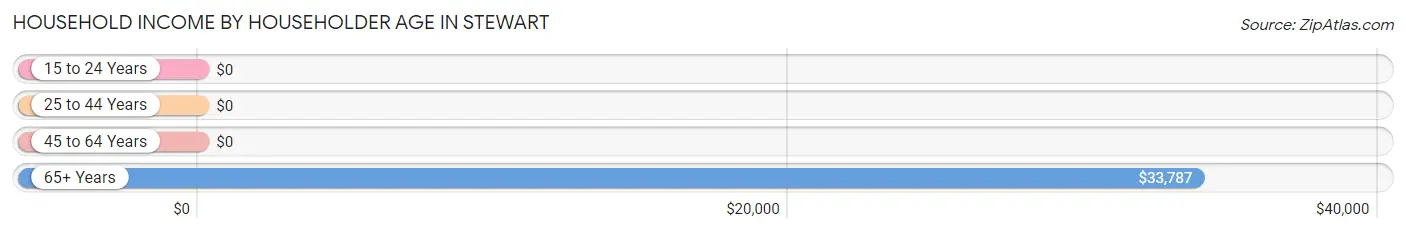
| Income Bracket | # Households | Median Income |
| 15 to 24 Years | 0 (0.0%) | $0 |
| 25 to 44 Years | 26 (19.3%) | $0 |
| 45 to 64 Years | 20 (14.8%) | $0 |
| 65+ Years | 89 (65.9%) | $33,787 |
| Total | 135 (100.0%) | $34,646 |
Poverty in Stewart
Income Below Poverty by Sex and Age in Stewart
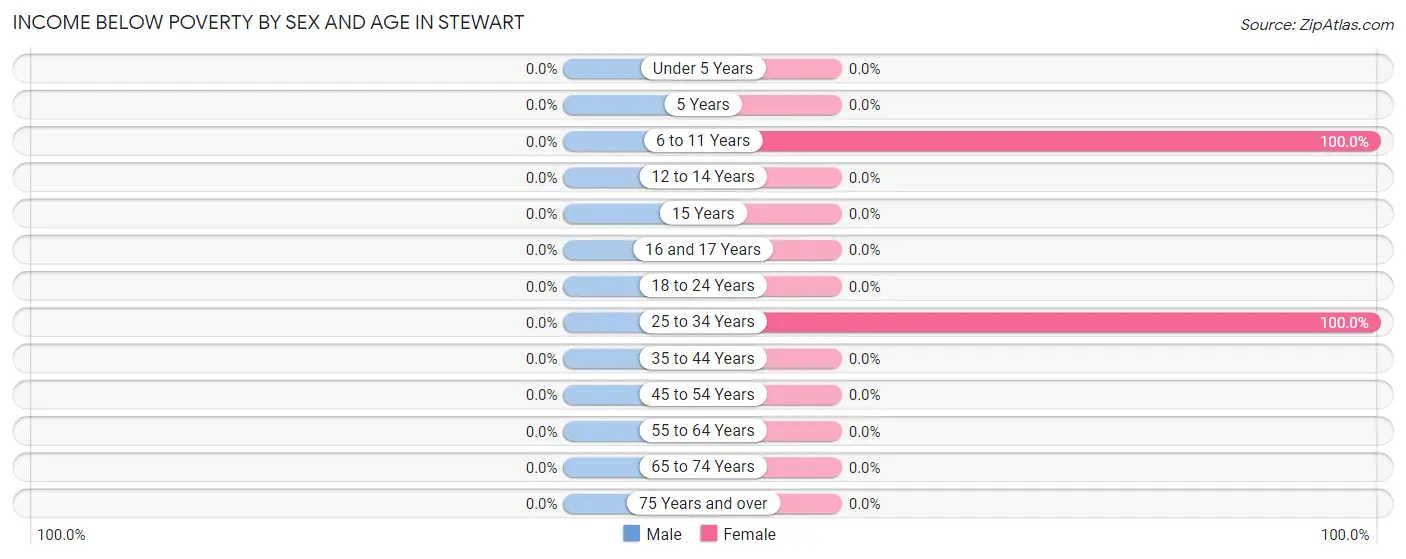
| Age Bracket | Male | Female |
| Under 5 Years | 0 (0.0%) | 0 (0.0%) |
| 5 Years | 0 (0.0%) | 0 (0.0%) |
| 6 to 11 Years | 0 (0.0%) | 17 (100.0%) |
| 12 to 14 Years | 0 (0.0%) | 0 (0.0%) |
| 15 Years | 0 (0.0%) | 0 (0.0%) |
| 16 and 17 Years | 0 (0.0%) | 0 (0.0%) |
| 18 to 24 Years | 0 (0.0%) | 0 (0.0%) |
| 25 to 34 Years | 0 (0.0%) | 12 (100.0%) |
| 35 to 44 Years | 0 (0.0%) | 0 (0.0%) |
| 45 to 54 Years | 0 (0.0%) | 0 (0.0%) |
| 55 to 64 Years | 0 (0.0%) | 0 (0.0%) |
| 65 to 74 Years | 0 (0.0%) | 0 (0.0%) |
| 75 Years and over | 0 (0.0%) | 0 (0.0%) |
| Total | 0 (0.0%) | 29 (18.0%) |
Income Above Poverty by Sex and Age in Stewart
According to the poverty statistics in Stewart, males aged 18 to 24 years and females aged 45 to 54 years are the age groups that are most secure financially, with 100.0% of males and 100.0% of females in these age groups living above the poverty line.
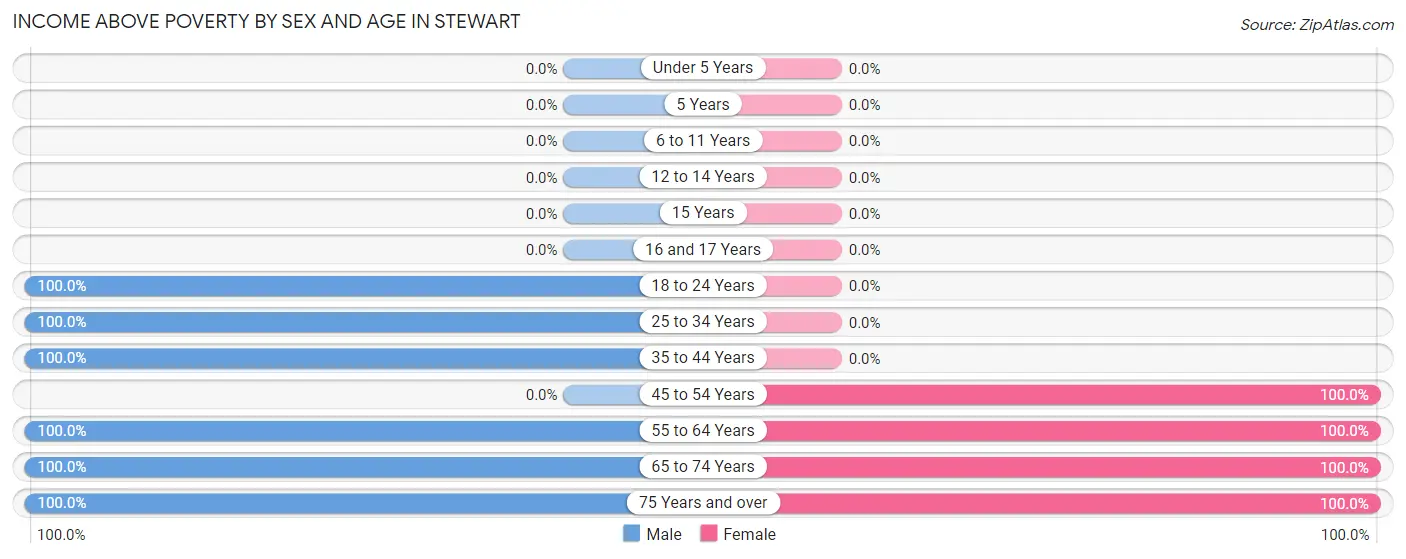
| Age Bracket | Male | Female |
| Under 5 Years | 0 (0.0%) | 0 (0.0%) |
| 5 Years | 0 (0.0%) | 0 (0.0%) |
| 6 to 11 Years | 0 (0.0%) | 0 (0.0%) |
| 12 to 14 Years | 0 (0.0%) | 0 (0.0%) |
| 15 Years | 0 (0.0%) | 0 (0.0%) |
| 16 and 17 Years | 0 (0.0%) | 0 (0.0%) |
| 18 to 24 Years | 17 (100.0%) | 0 (0.0%) |
| 25 to 34 Years | 17 (100.0%) | 0 (0.0%) |
| 35 to 44 Years | 14 (100.0%) | 0 (0.0%) |
| 45 to 54 Years | 0 (0.0%) | 33 (100.0%) |
| 55 to 64 Years | 20 (100.0%) | 23 (100.0%) |
| 65 to 74 Years | 59 (100.0%) | 27 (100.0%) |
| 75 Years and over | 32 (100.0%) | 49 (100.0%) |
| Total | 159 (100.0%) | 132 (82.0%) |
Income Below Poverty Among Married-Couple Families in Stewart
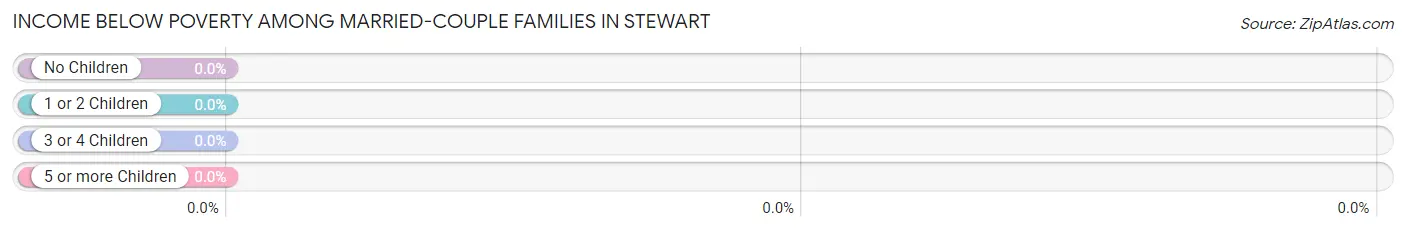
| Children | Above Poverty | Below Poverty |
| No Children | 100 (100.0%) | 0 (0.0%) |
| 1 or 2 Children | 0 (0.0%) | 0 (0.0%) |
| 3 or 4 Children | 0 (0.0%) | 0 (0.0%) |
| 5 or more Children | 0 (0.0%) | 0 (0.0%) |
| Total | 100 (100.0%) | 0 (0.0%) |
Income Below Poverty Among Single-Parent Households in Stewart
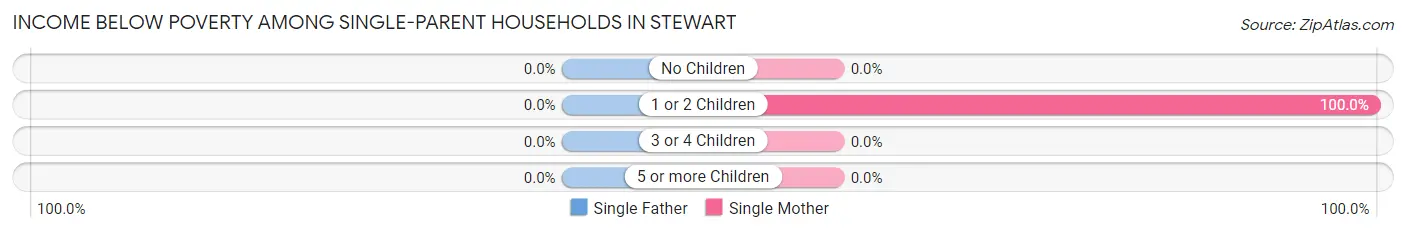
| Children | Single Father | Single Mother |
| No Children | 0 (0.0%) | 0 (0.0%) |
| 1 or 2 Children | 0 (0.0%) | 12 (100.0%) |
| 3 or 4 Children | 0 (0.0%) | 0 (0.0%) |
| 5 or more Children | 0 (0.0%) | 0 (0.0%) |
| Total | 0 (0.0%) | 12 (100.0%) |
Income Below Poverty Among Married-Couple vs Single-Parent Households in Stewart
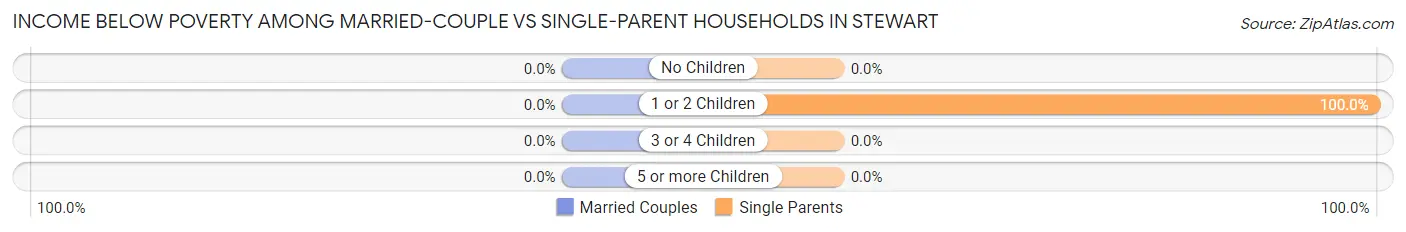
| Children | Married-Couple Families | Single-Parent Households |
| No Children | 0 (0.0%) | 0 (0.0%) |
| 1 or 2 Children | 0 (0.0%) | 12 (100.0%) |
| 3 or 4 Children | 0 (0.0%) | 0 (0.0%) |
| 5 or more Children | 0 (0.0%) | 0 (0.0%) |
| Total | 0 (0.0%) | 12 (100.0%) |
Employment Characteristics in Stewart
Employment by Class of Employer in Stewart
Among the 140 employed individuals in Stewart, private company employees (96 | 68.6%), local government employees (20 | 14.3%), and self-employed (not incorporated) (12 | 8.6%) make up the most common classes of employment.
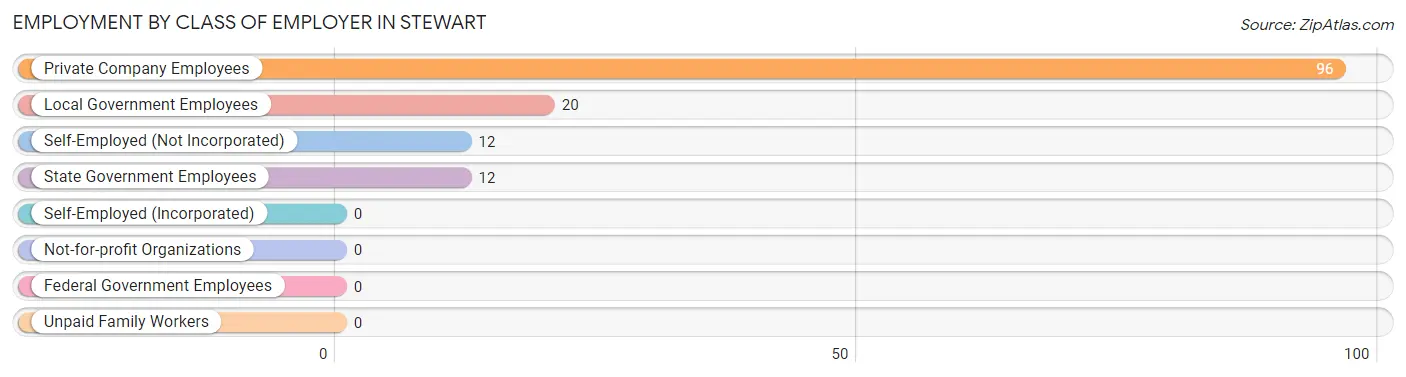
| Employer Class | # Employees | % Employees |
| Private Company Employees | 96 | 68.6% |
| Self-Employed (Incorporated) | 0 | 0.0% |
| Self-Employed (Not Incorporated) | 12 | 8.6% |
| Not-for-profit Organizations | 0 | 0.0% |
| Local Government Employees | 20 | 14.3% |
| State Government Employees | 12 | 8.6% |
| Federal Government Employees | 0 | 0.0% |
| Unpaid Family Workers | 0 | 0.0% |
| Total | 140 | 100.0% |
Employment Status by Age in Stewart
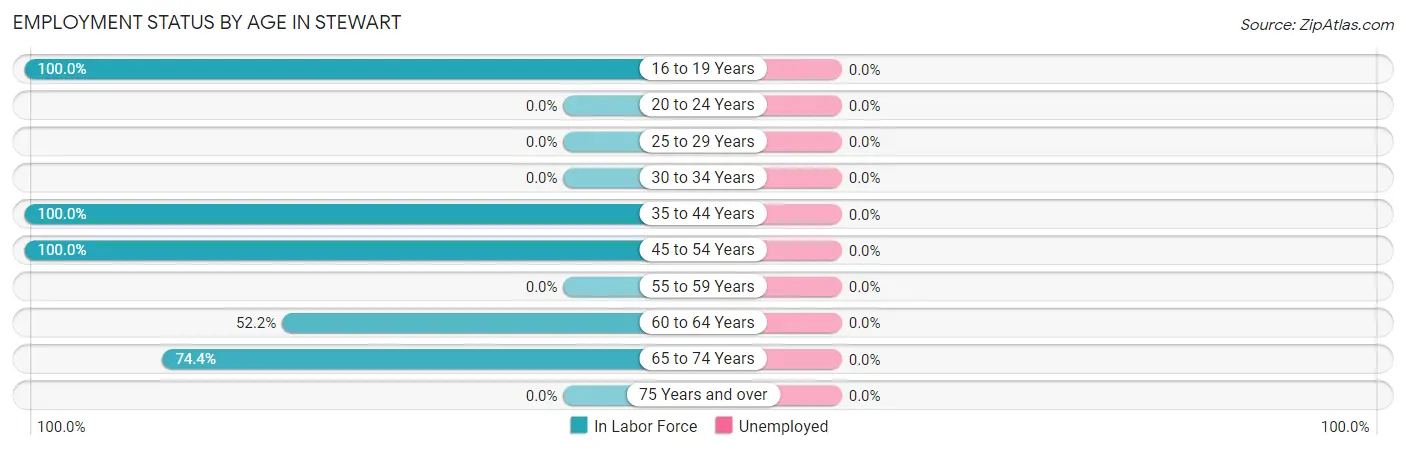
| Age Bracket | In Labor Force | Unemployed |
| 16 to 19 Years | 17 (100.0%) | 0 (0.0%) |
| 20 to 24 Years | 0 (0.0%) | 0 (0.0%) |
| 25 to 29 Years | 0 (0.0%) | 0 (0.0%) |
| 30 to 34 Years | 0 (0.0%) | 0 (0.0%) |
| 35 to 44 Years | 14 (100.0%) | 0 (0.0%) |
| 45 to 54 Years | 33 (100.0%) | 0 (0.0%) |
| 55 to 59 Years | 0 (0.0%) | 0 (0.0%) |
| 60 to 64 Years | 12 (52.2%) | 0 (0.0%) |
| 65 to 74 Years | 64 (74.4%) | 0 (0.0%) |
| 75 Years and over | 0 (0.0%) | 0 (0.0%) |
| Total | 140 (46.2%) | 0 (0.0%) |
Employment Status by Educational Attainment in Stewart
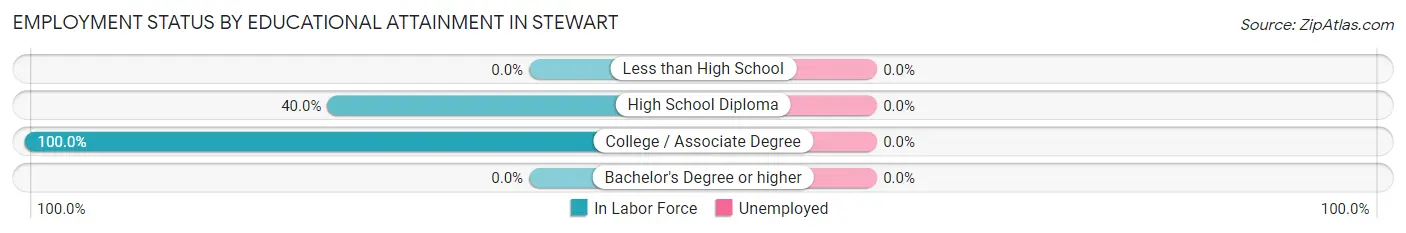
| Educational Attainment | In Labor Force | Unemployed |
| Less than High School | 0 (0.0%) | 0 (0.0%) |
| High School Diploma | 32 (40.0%) | 0 (0.0%) |
| College / Associate Degree | 27 (100.0%) | 0 (0.0%) |
| Bachelor's Degree or higher | 0 (0.0%) | 0 (0.0%) |
| Total | 59 (49.6%) | 0 (0.0%) |
Employment Occupations by Sex in Stewart
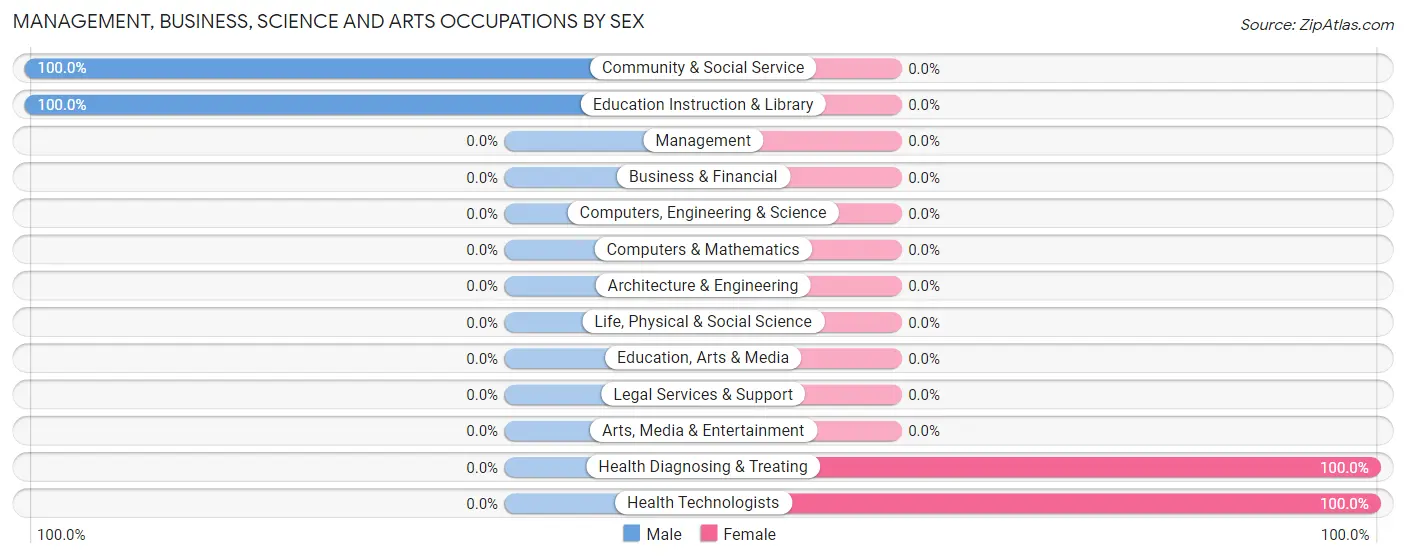
Management, Business, Science and Arts Occupations
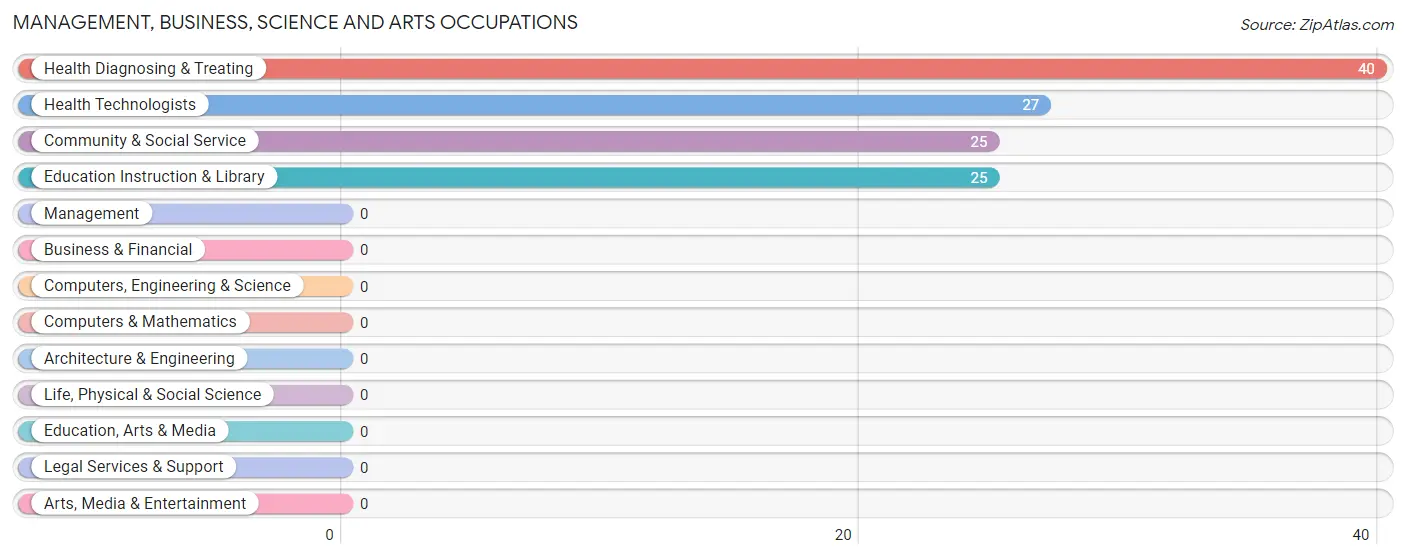
The most common Management, Business, Science and Arts occupations in Stewart are Health Diagnosing & Treating (40 | 28.6%), Health Technologists (27 | 19.3%), Community & Social Service (25 | 17.9%), and Education Instruction & Library (25 | 17.9%).
Management, Business, Science and Arts Occupations by Sex
Within the Management, Business, Science and Arts occupations in Stewart, the most male-oriented occupations are Community & Social Service (100.0%), and Education Instruction & Library (100.0%), while the most female-oriented occupations are Health Diagnosing & Treating (100.0%), and Health Technologists (100.0%).
| Occupation | Male | Female |
| Management | 0 (0.0%) | 0 (0.0%) |
| Business & Financial | 0 (0.0%) | 0 (0.0%) |
| Computers, Engineering & Science | 0 (0.0%) | 0 (0.0%) |
| Computers & Mathematics | 0 (0.0%) | 0 (0.0%) |
| Architecture & Engineering | 0 (0.0%) | 0 (0.0%) |
| Life, Physical & Social Science | 0 (0.0%) | 0 (0.0%) |
| Community & Social Service | 25 (100.0%) | 0 (0.0%) |
| Education, Arts & Media | 0 (0.0%) | 0 (0.0%) |
| Legal Services & Support | 0 (0.0%) | 0 (0.0%) |
| Education Instruction & Library | 25 (100.0%) | 0 (0.0%) |
| Arts, Media & Entertainment | 0 (0.0%) | 0 (0.0%) |
| Health Diagnosing & Treating | 0 (0.0%) | 40 (100.0%) |
| Health Technologists | 0 (0.0%) | 27 (100.0%) |
| Total (Category) | 25 (38.5%) | 40 (61.5%) |
| Total (Overall) | 68 (48.6%) | 72 (51.4%) |
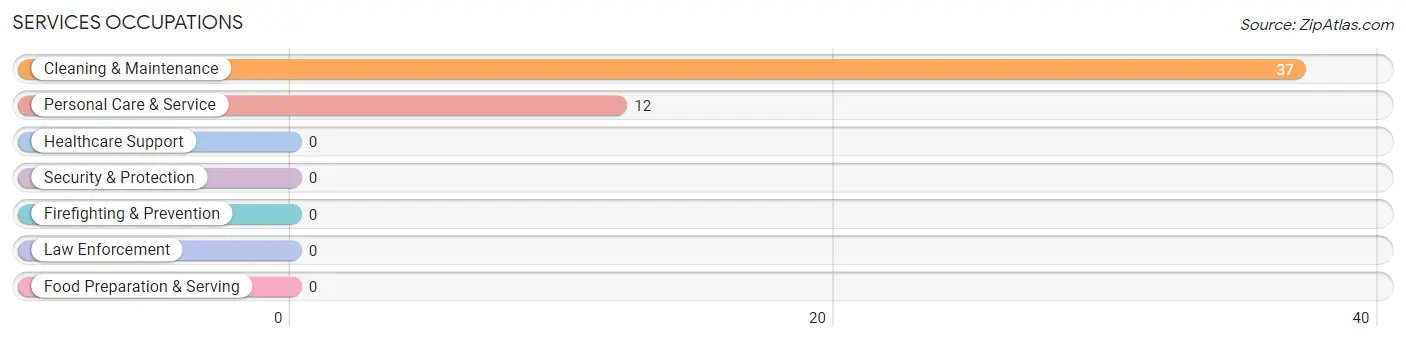
Services Occupations
The most common Services occupations in Stewart are Cleaning & Maintenance (37 | 26.4%), and Personal Care & Service (12 | 8.6%).
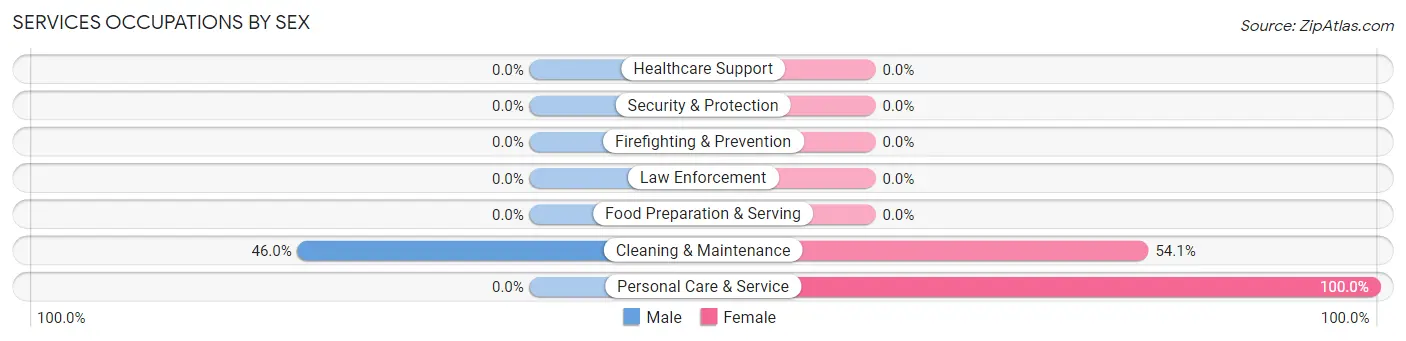
Services Occupations by Sex
| Occupation | Male | Female |
| Healthcare Support | 0 (0.0%) | 0 (0.0%) |
| Security & Protection | 0 (0.0%) | 0 (0.0%) |
| Firefighting & Prevention | 0 (0.0%) | 0 (0.0%) |
| Law Enforcement | 0 (0.0%) | 0 (0.0%) |
| Food Preparation & Serving | 0 (0.0%) | 0 (0.0%) |
| Cleaning & Maintenance | 17 (46.0%) | 20 (54.0%) |
| Personal Care & Service | 0 (0.0%) | 12 (100.0%) |
| Total (Category) | 17 (34.7%) | 32 (65.3%) |
| Total (Overall) | 68 (48.6%) | 72 (51.4%) |
Sales and Office Occupations
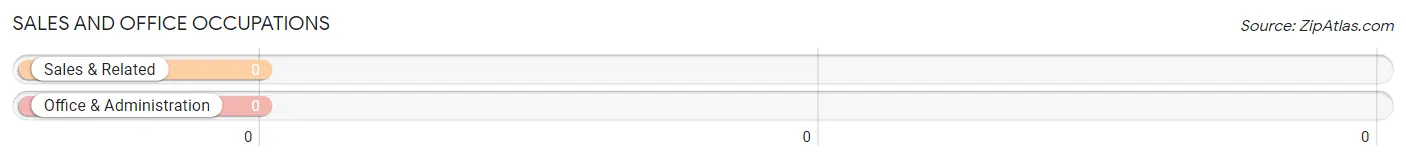
Sales and Office Occupations by Sex
| Occupation | Male | Female |
| Sales & Related | 0 (0.0%) | 0 (0.0%) |
| Office & Administration | 0 (0.0%) | 0 (0.0%) |
| Total (Category) | 0 (0.0%) | 0 (0.0%) |
| Total (Overall) | 68 (48.6%) | 72 (51.4%) |
Natural Resources, Construction and Maintenance Occupations
Natural Resources, Construction and Maintenance Occupations by Sex
| Occupation | Male | Female |
| Farming, Fishing & Forestry | 0 (0.0%) | 0 (0.0%) |
| Construction & Extraction | 0 (0.0%) | 0 (0.0%) |
| Installation, Maintenance & Repair | 0 (0.0%) | 0 (0.0%) |
| Total (Category) | 0 (0.0%) | 0 (0.0%) |
| Total (Overall) | 68 (48.6%) | 72 (51.4%) |
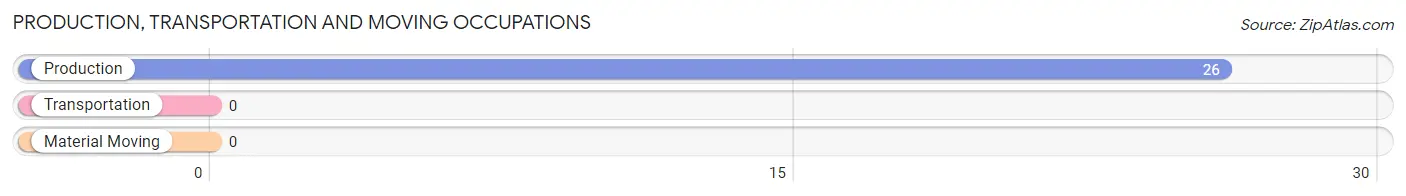
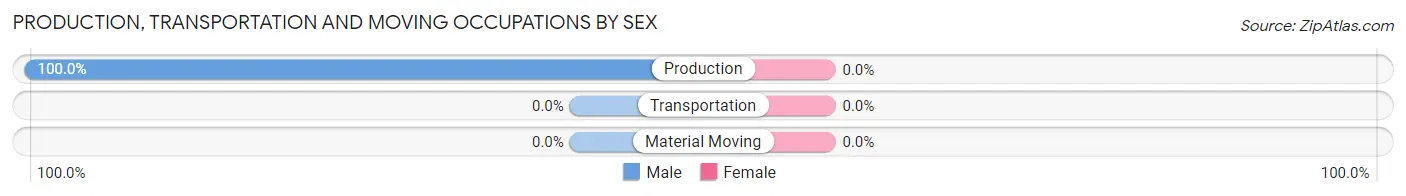
Production, Transportation and Moving Occupations
The most common Production, Transportation and Moving occupations in Stewart are , and Production (26 | 18.6%).
Production, Transportation and Moving Occupations by Sex
| Occupation | Male | Female |
| Production | 26 (100.0%) | 0 (0.0%) |
| Transportation | 0 (0.0%) | 0 (0.0%) |
| Material Moving | 0 (0.0%) | 0 (0.0%) |
| Total (Category) | 26 (100.0%) | 0 (0.0%) |
| Total (Overall) | 68 (48.6%) | 72 (51.4%) |
Employment Industries by Sex in Stewart
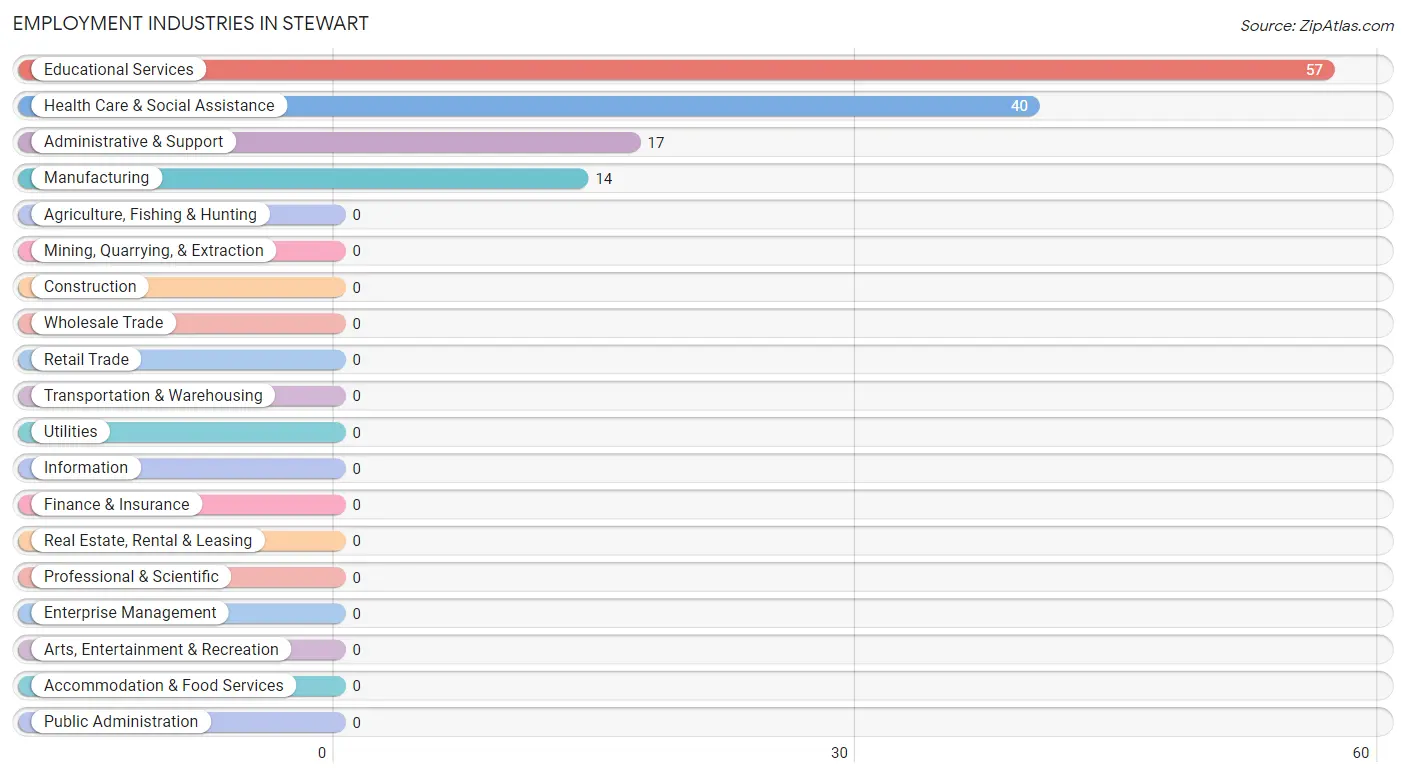
Employment Industries in Stewart
The major employment industries in Stewart include Educational Services (57 | 40.7%), Health Care & Social Assistance (40 | 28.6%), Administrative & Support (17 | 12.1%), and Manufacturing (14 | 10.0%).
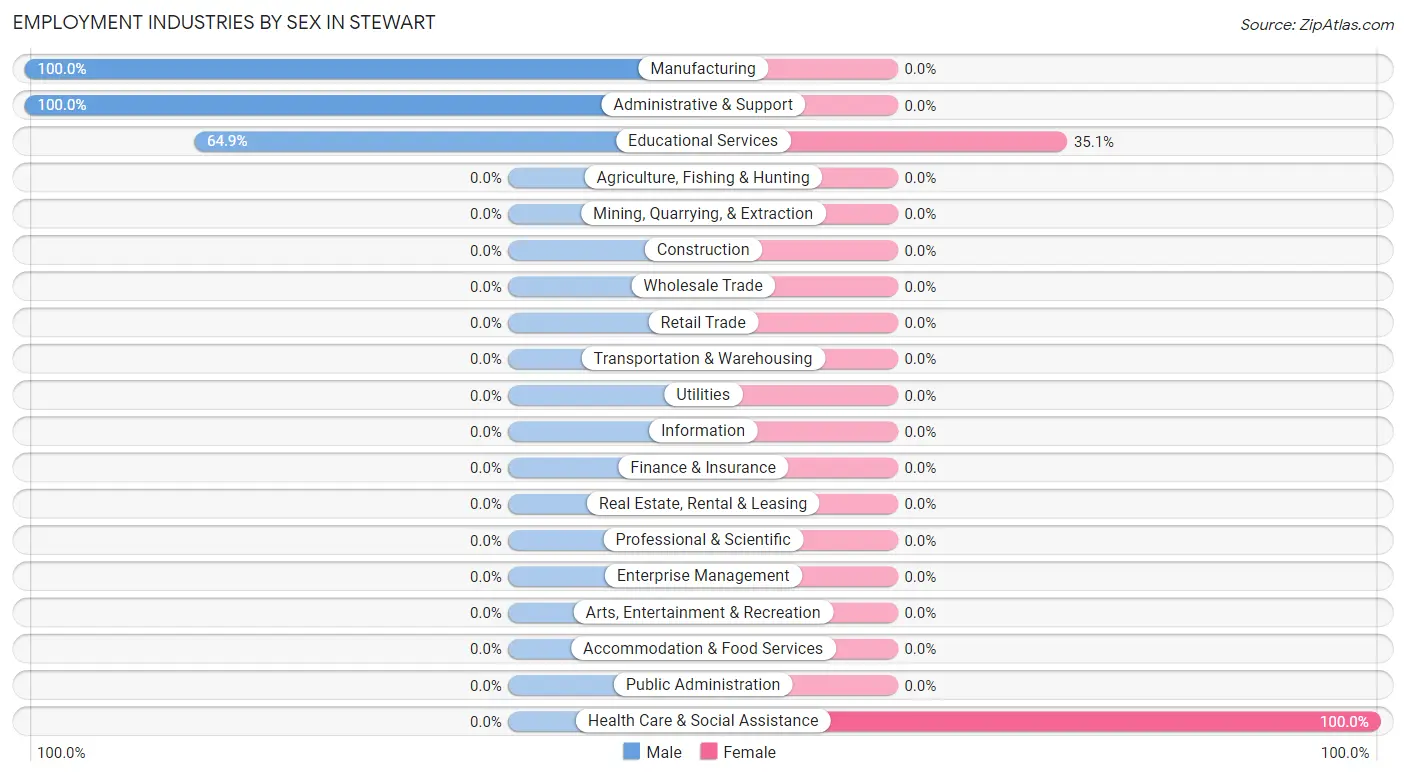
Employment Industries by Sex in Stewart
The Stewart industries that see more men than women are Manufacturing (100.0%), Administrative & Support (100.0%), and Educational Services (64.9%), whereas the industries that tend to have a higher number of women are Health Care & Social Assistance (100.0%), and Educational Services (35.1%).
| Industry | Male | Female |
| Agriculture, Fishing & Hunting | 0 (0.0%) | 0 (0.0%) |
| Mining, Quarrying, & Extraction | 0 (0.0%) | 0 (0.0%) |
| Construction | 0 (0.0%) | 0 (0.0%) |
| Manufacturing | 14 (100.0%) | 0 (0.0%) |
| Wholesale Trade | 0 (0.0%) | 0 (0.0%) |
| Retail Trade | 0 (0.0%) | 0 (0.0%) |
| Transportation & Warehousing | 0 (0.0%) | 0 (0.0%) |
| Utilities | 0 (0.0%) | 0 (0.0%) |
| Information | 0 (0.0%) | 0 (0.0%) |
| Finance & Insurance | 0 (0.0%) | 0 (0.0%) |
| Real Estate, Rental & Leasing | 0 (0.0%) | 0 (0.0%) |
| Professional & Scientific | 0 (0.0%) | 0 (0.0%) |
| Enterprise Management | 0 (0.0%) | 0 (0.0%) |
| Administrative & Support | 17 (100.0%) | 0 (0.0%) |
| Educational Services | 37 (64.9%) | 20 (35.1%) |
| Health Care & Social Assistance | 0 (0.0%) | 40 (100.0%) |
| Arts, Entertainment & Recreation | 0 (0.0%) | 0 (0.0%) |
| Accommodation & Food Services | 0 (0.0%) | 0 (0.0%) |
| Public Administration | 0 (0.0%) | 0 (0.0%) |
| Total | 68 (48.6%) | 72 (51.4%) |
Education in Stewart
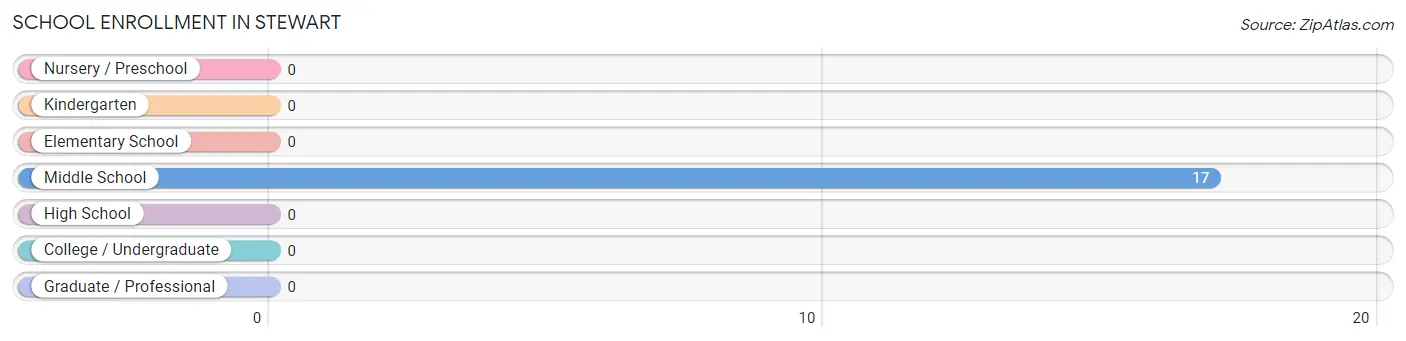
School Enrollment in Stewart
| School Level | # Students | % Students |
| Nursery / Preschool | 0 | 0.0% |
| Kindergarten | 0 | 0.0% |
| Elementary School | 0 | 0.0% |
| Middle School | 17 | 100.0% |
| High School | 0 | 0.0% |
| College / Undergraduate | 0 | 0.0% |
| Graduate / Professional | 0 | 0.0% |
| Total | 17 | 100.0% |
School Enrollment by Age by Funding Source in Stewart
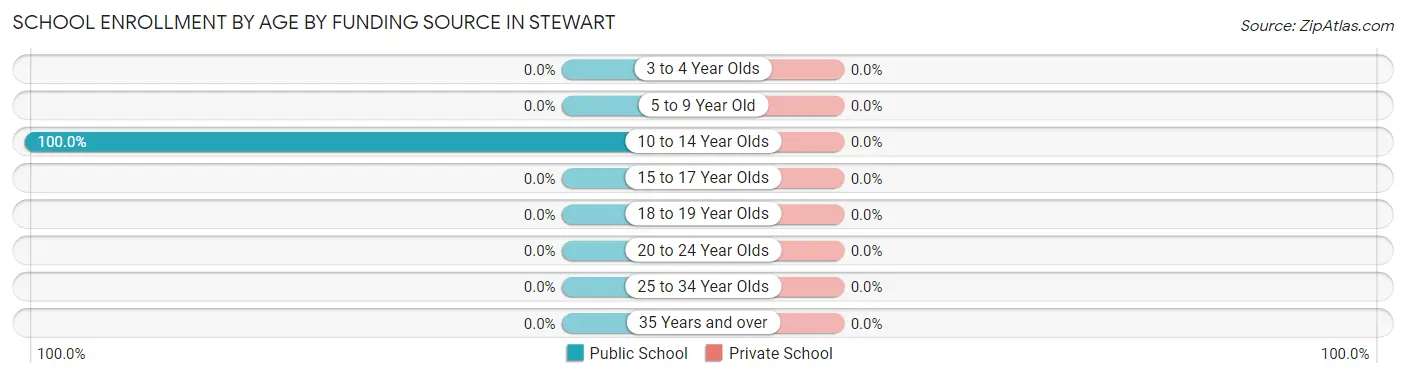
| Age Bracket | Public School | Private School |
| 3 to 4 Year Olds | 0 (0.0%) | 0 (0.0%) |
| 5 to 9 Year Old | 0 (0.0%) | 0 (0.0%) |
| 10 to 14 Year Olds | 17 (100.0%) | 0 (0.0%) |
| 15 to 17 Year Olds | 0 (0.0%) | 0 (0.0%) |
| 18 to 19 Year Olds | 0 (0.0%) | 0 (0.0%) |
| 20 to 24 Year Olds | 0 (0.0%) | 0 (0.0%) |
| 25 to 34 Year Olds | 0 (0.0%) | 0 (0.0%) |
| 35 Years and over | 0 (0.0%) | 0 (0.0%) |
| Total | 17 (100.0%) | 0 (0.0%) |
Educational Attainment by Field of Study in Stewart
, and science & technology (27 | 100.0%) are the most common fields of study among 27 individuals in Stewart who have obtained a bachelor's degree or higher.
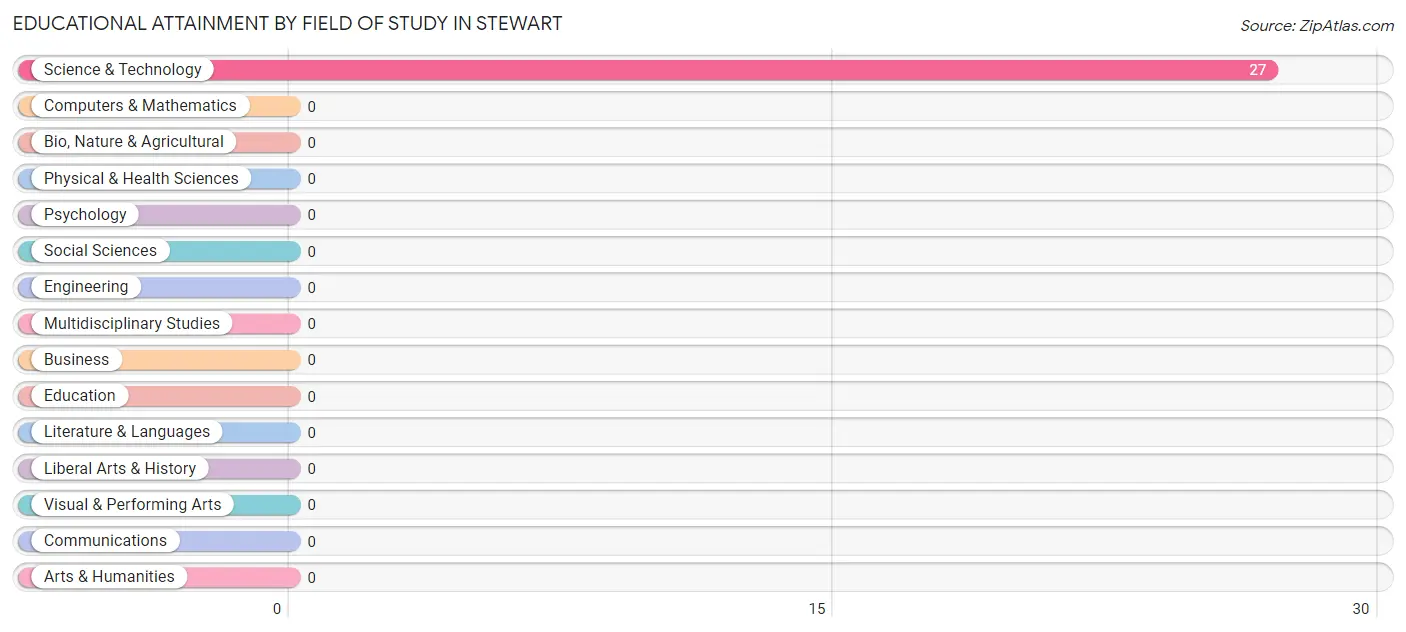
| Field of Study | # Graduates | % Graduates |
| Computers & Mathematics | 0 | 0.0% |
| Bio, Nature & Agricultural | 0 | 0.0% |
| Physical & Health Sciences | 0 | 0.0% |
| Psychology | 0 | 0.0% |
| Social Sciences | 0 | 0.0% |
| Engineering | 0 | 0.0% |
| Multidisciplinary Studies | 0 | 0.0% |
| Science & Technology | 27 | 100.0% |
| Business | 0 | 0.0% |
| Education | 0 | 0.0% |
| Literature & Languages | 0 | 0.0% |
| Liberal Arts & History | 0 | 0.0% |
| Visual & Performing Arts | 0 | 0.0% |
| Communications | 0 | 0.0% |
| Arts & Humanities | 0 | 0.0% |
| Total | 27 | 100.0% |
Transportation & Commute in Stewart
Vehicle Availability by Sex in Stewart
The most prevalent vehicle ownership categories in Stewart are males with 3 vehicles (68, accounting for 100.0%) and females with 3 vehicles (72, making up 94.4%).
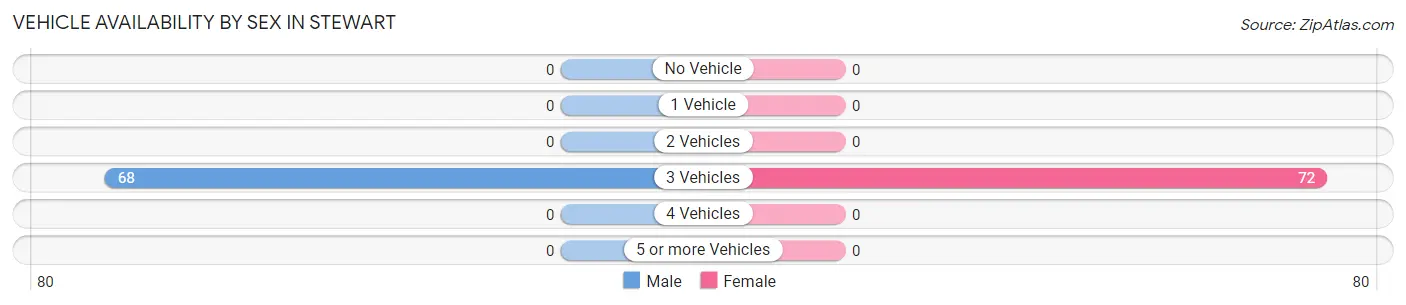
| Vehicles Available | Male | Female |
| No Vehicle | 0 (0.0%) | 0 (0.0%) |
| 1 Vehicle | 0 (0.0%) | 0 (0.0%) |
| 2 Vehicles | 0 (0.0%) | 0 (0.0%) |
| 3 Vehicles | 68 (100.0%) | 72 (100.0%) |
| 4 Vehicles | 0 (0.0%) | 0 (0.0%) |
| 5 or more Vehicles | 0 (0.0%) | 0 (0.0%) |
| Total | 68 (100.0%) | 72 (100.0%) |
Commute Time in Stewart
The most frequently occuring commute durations in Stewart are 15 to 19 minutes (51 commuters, 36.4%), 20 to 24 minutes (39 commuters, 27.9%), and 5 to 9 minutes (20 commuters, 14.3%).
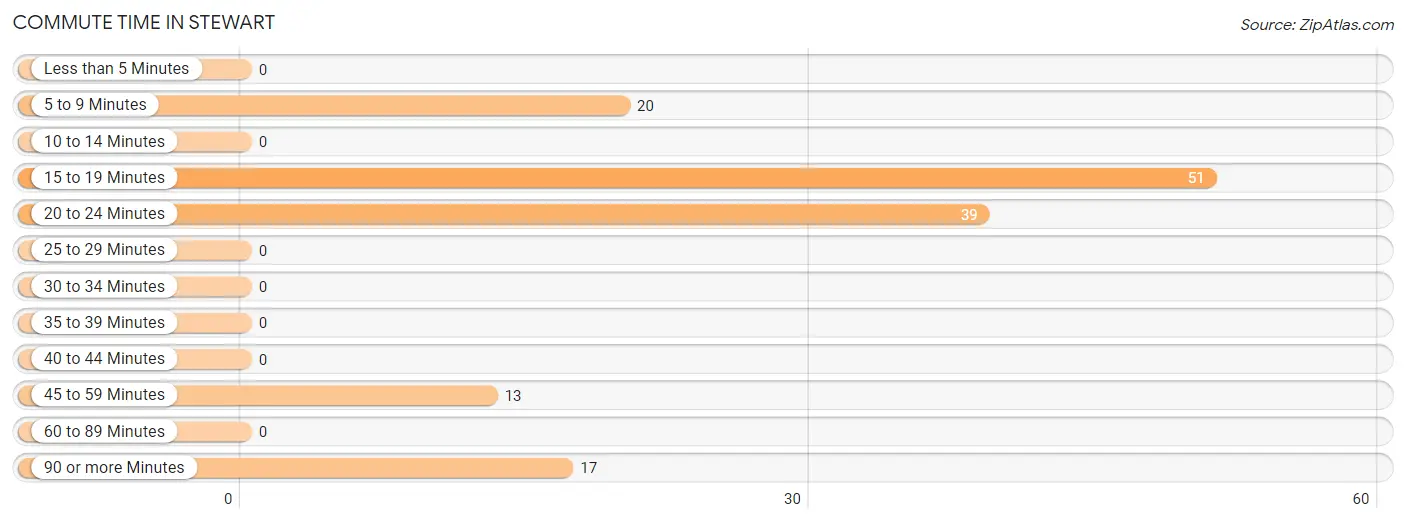
| Commute Time | # Commuters | % Commuters |
| Less than 5 Minutes | 0 | 0.0% |
| 5 to 9 Minutes | 20 | 14.3% |
| 10 to 14 Minutes | 0 | 0.0% |
| 15 to 19 Minutes | 51 | 36.4% |
| 20 to 24 Minutes | 39 | 27.9% |
| 25 to 29 Minutes | 0 | 0.0% |
| 30 to 34 Minutes | 0 | 0.0% |
| 35 to 39 Minutes | 0 | 0.0% |
| 40 to 44 Minutes | 0 | 0.0% |
| 45 to 59 Minutes | 13 | 9.3% |
| 60 to 89 Minutes | 0 | 0.0% |
| 90 or more Minutes | 17 | 12.1% |
Commute Time by Sex in Stewart
The most common commute times in Stewart are 20 to 24 minutes (39 commuters, 57.4%) for males and 15 to 19 minutes (39 commuters, 54.2%) for females.
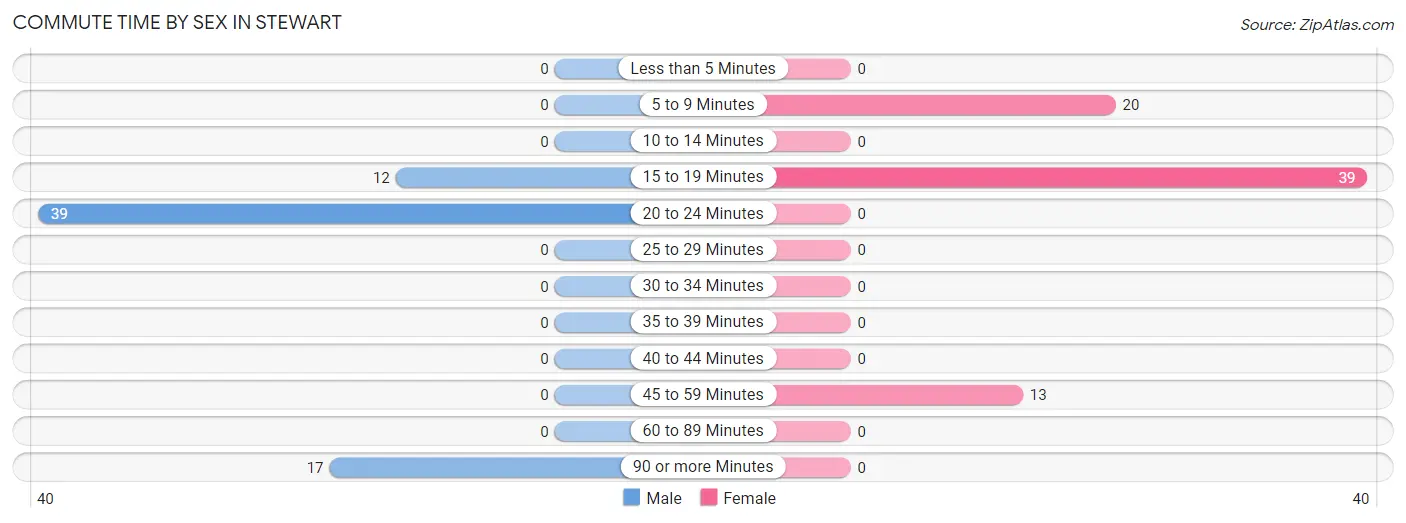
| Commute Time | Male | Female |
| Less than 5 Minutes | 0 (0.0%) | 0 (0.0%) |
| 5 to 9 Minutes | 0 (0.0%) | 20 (27.8%) |
| 10 to 14 Minutes | 0 (0.0%) | 0 (0.0%) |
| 15 to 19 Minutes | 12 (17.6%) | 39 (54.2%) |
| 20 to 24 Minutes | 39 (57.4%) | 0 (0.0%) |
| 25 to 29 Minutes | 0 (0.0%) | 0 (0.0%) |
| 30 to 34 Minutes | 0 (0.0%) | 0 (0.0%) |
| 35 to 39 Minutes | 0 (0.0%) | 0 (0.0%) |
| 40 to 44 Minutes | 0 (0.0%) | 0 (0.0%) |
| 45 to 59 Minutes | 0 (0.0%) | 13 (18.1%) |
| 60 to 89 Minutes | 0 (0.0%) | 0 (0.0%) |
| 90 or more Minutes | 17 (25.0%) | 0 (0.0%) |
Time of Departure to Work by Sex in Stewart
The most frequent times of departure to work in Stewart are 4:00 PM to 11:59 PM (25, 36.8%) for males and 9:00 AM to 9:59 AM (27, 37.5%) for females.
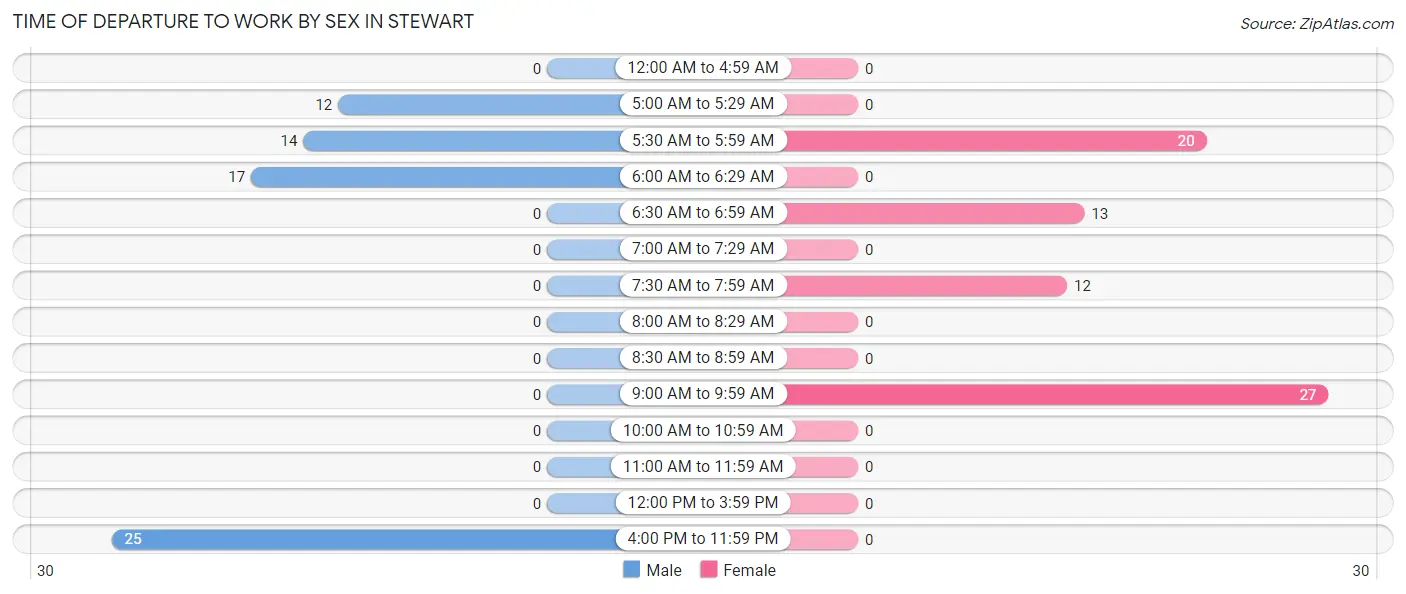
| Time of Departure | Male | Female |
| 12:00 AM to 4:59 AM | 0 (0.0%) | 0 (0.0%) |
| 5:00 AM to 5:29 AM | 12 (17.6%) | 0 (0.0%) |
| 5:30 AM to 5:59 AM | 14 (20.6%) | 20 (27.8%) |
| 6:00 AM to 6:29 AM | 17 (25.0%) | 0 (0.0%) |
| 6:30 AM to 6:59 AM | 0 (0.0%) | 13 (18.1%) |
| 7:00 AM to 7:29 AM | 0 (0.0%) | 0 (0.0%) |
| 7:30 AM to 7:59 AM | 0 (0.0%) | 12 (16.7%) |
| 8:00 AM to 8:29 AM | 0 (0.0%) | 0 (0.0%) |
| 8:30 AM to 8:59 AM | 0 (0.0%) | 0 (0.0%) |
| 9:00 AM to 9:59 AM | 0 (0.0%) | 27 (37.5%) |
| 10:00 AM to 10:59 AM | 0 (0.0%) | 0 (0.0%) |
| 11:00 AM to 11:59 AM | 0 (0.0%) | 0 (0.0%) |
| 12:00 PM to 3:59 PM | 0 (0.0%) | 0 (0.0%) |
| 4:00 PM to 11:59 PM | 25 (36.8%) | 0 (0.0%) |
| Total | 68 (100.0%) | 72 (100.0%) |
Housing Occupancy in Stewart
Occupancy by Ownership in Stewart
Of the total 135 dwellings in Stewart, owner-occupied units account for 109 (80.7%), while renter-occupied units make up 26 (19.3%).
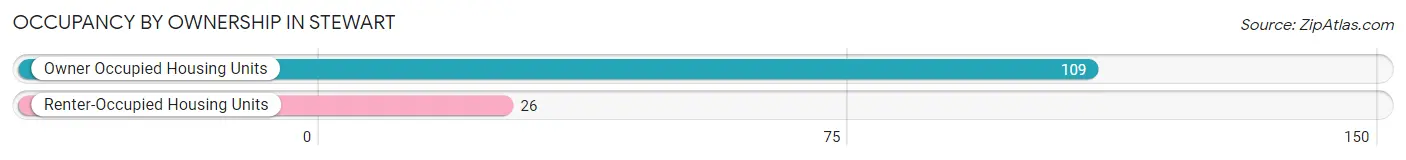
| Occupancy | # Housing Units | % Housing Units |
| Owner Occupied Housing Units | 109 | 80.7% |
| Renter-Occupied Housing Units | 26 | 19.3% |
| Total Occupied Housing Units | 135 | 100.0% |
Occupancy by Household Size in Stewart
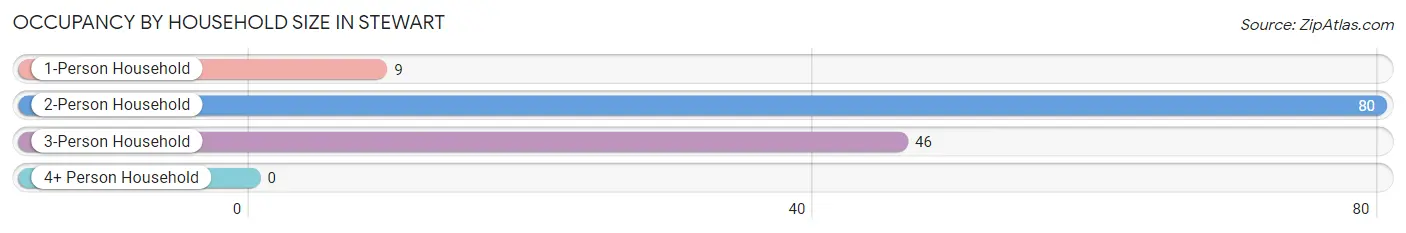
| Household Size | # Housing Units | % Housing Units |
| 1-Person Household | 9 | 6.7% |
| 2-Person Household | 80 | 59.3% |
| 3-Person Household | 46 | 34.1% |
| 4+ Person Household | 0 | 0.0% |
| Total Housing Units | 135 | 100.0% |
Occupancy by Ownership by Household Size in Stewart
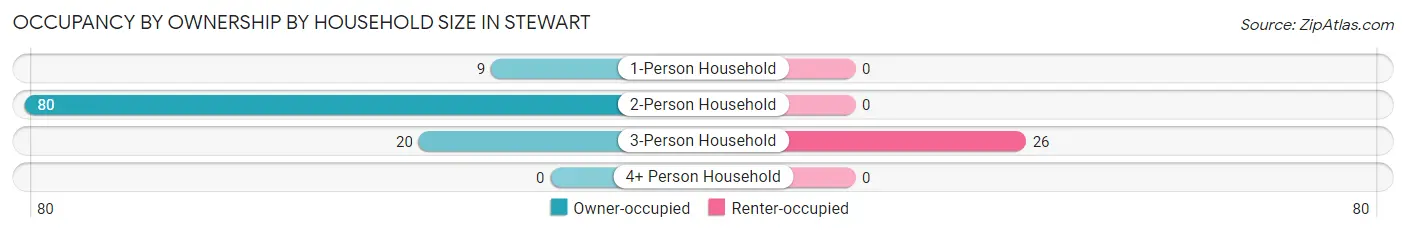
| Household Size | Owner-occupied | Renter-occupied |
| 1-Person Household | 9 (100.0%) | 0 (0.0%) |
| 2-Person Household | 80 (100.0%) | 0 (0.0%) |
| 3-Person Household | 20 (43.5%) | 26 (56.5%) |
| 4+ Person Household | 0 (0.0%) | 0 (0.0%) |
| Total Housing Units | 109 (80.7%) | 26 (19.3%) |
Occupancy by Educational Attainment in Stewart
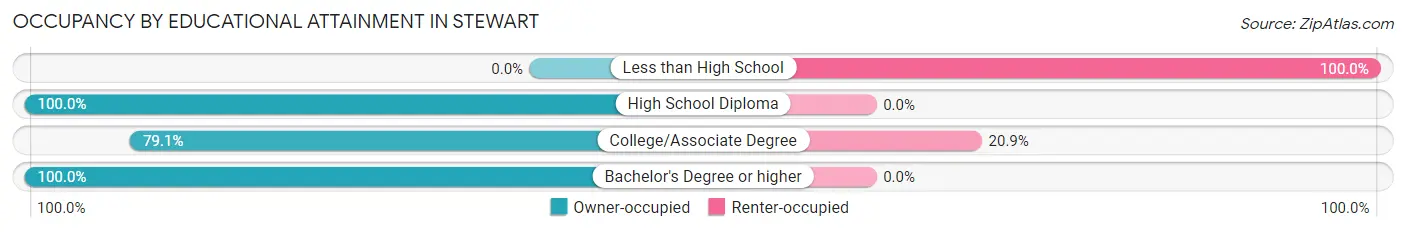
| Household Size | Owner-occupied | Renter-occupied |
| Less than High School | 0 (0.0%) | 12 (100.0%) |
| High School Diploma | 29 (100.0%) | 0 (0.0%) |
| College/Associate Degree | 53 (79.1%) | 14 (20.9%) |
| Bachelor's Degree or higher | 27 (100.0%) | 0 (0.0%) |
Occupancy by Age of Householder in Stewart
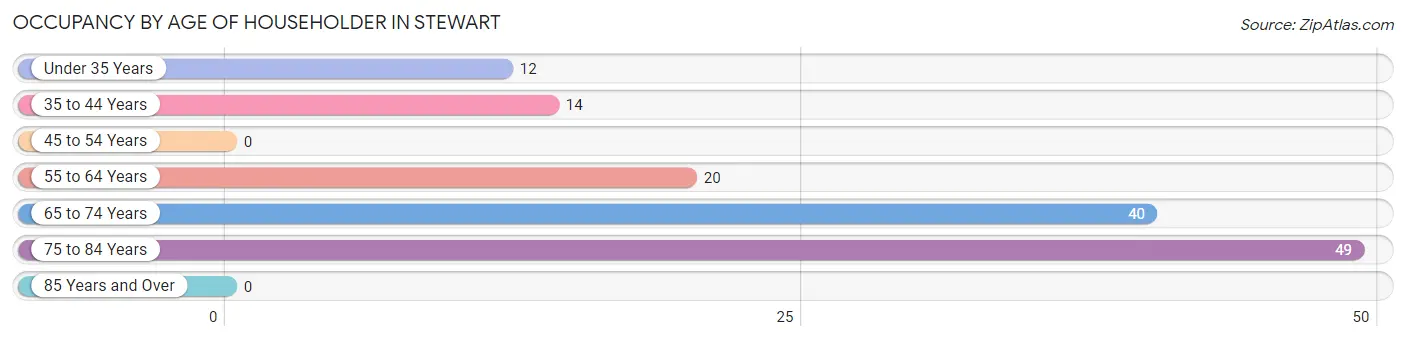
| Age Bracket | # Households | % Households |
| Under 35 Years | 12 | 8.9% |
| 35 to 44 Years | 14 | 10.4% |
| 45 to 54 Years | 0 | 0.0% |
| 55 to 64 Years | 20 | 14.8% |
| 65 to 74 Years | 40 | 29.6% |
| 75 to 84 Years | 49 | 36.3% |
| 85 Years and Over | 0 | 0.0% |
| Total | 135 | 100.0% |
Housing Finances in Stewart
Median Income by Occupancy in Stewart
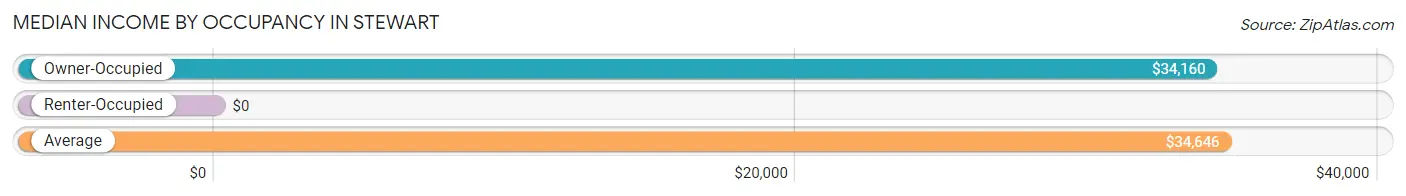
| Occupancy Type | # Households | Median Income |
| Owner-Occupied | 109 (80.7%) | $34,160 |
| Renter-Occupied | 26 (19.3%) | $0 |
| Average | 135 (100.0%) | $34,646 |
Occupancy by Householder Income Bracket in Stewart
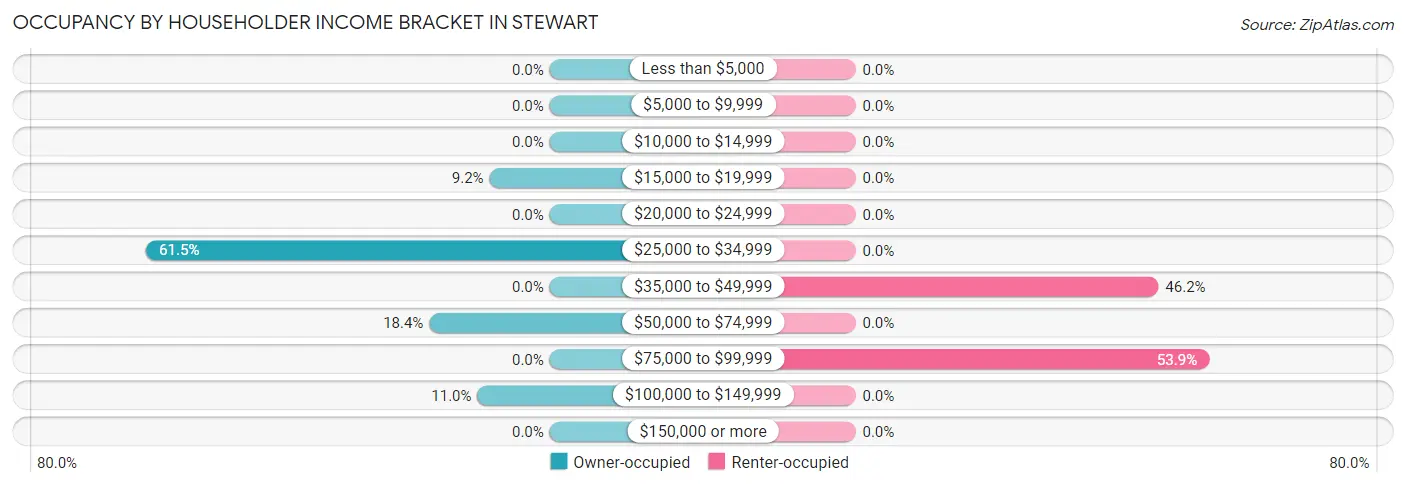
| Income Bracket | Owner-occupied | Renter-occupied |
| Less than $5,000 | 0 (0.0%) | 0 (0.0%) |
| $5,000 to $9,999 | 0 (0.0%) | 0 (0.0%) |
| $10,000 to $14,999 | 0 (0.0%) | 0 (0.0%) |
| $15,000 to $19,999 | 10 (9.2%) | 0 (0.0%) |
| $20,000 to $24,999 | 0 (0.0%) | 0 (0.0%) |
| $25,000 to $34,999 | 67 (61.5%) | 0 (0.0%) |
| $35,000 to $49,999 | 0 (0.0%) | 12 (46.2%) |
| $50,000 to $74,999 | 20 (18.3%) | 0 (0.0%) |
| $75,000 to $99,999 | 0 (0.0%) | 14 (53.8%) |
| $100,000 to $149,999 | 12 (11.0%) | 0 (0.0%) |
| $150,000 or more | 0 (0.0%) | 0 (0.0%) |
| Total | 109 (100.0%) | 26 (100.0%) |
Monthly Housing Cost Tiers in Stewart
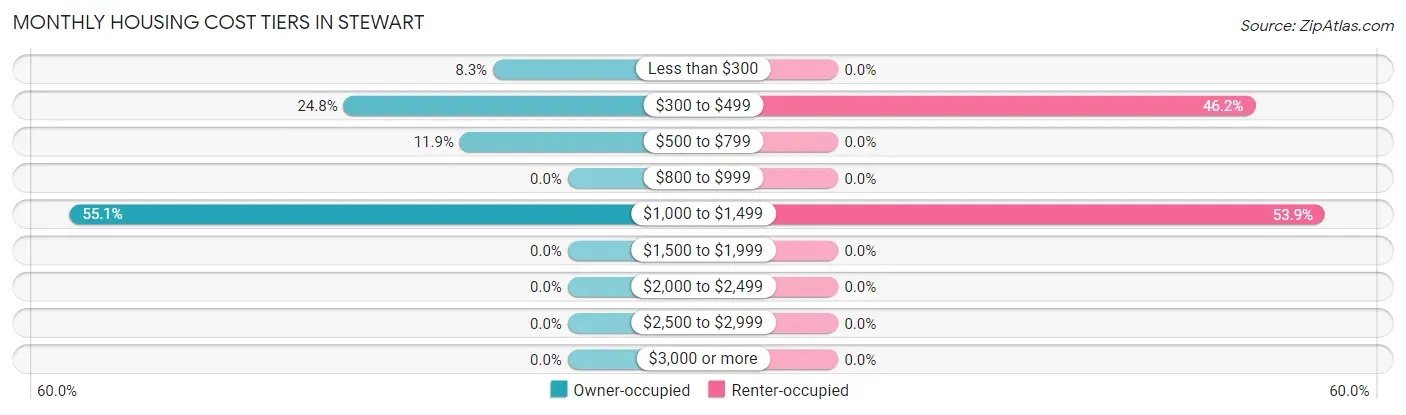
| Monthly Cost | Owner-occupied | Renter-occupied |
| Less than $300 | 9 (8.3%) | 0 (0.0%) |
| $300 to $499 | 27 (24.8%) | 12 (46.2%) |
| $500 to $799 | 13 (11.9%) | 0 (0.0%) |
| $800 to $999 | 0 (0.0%) | 0 (0.0%) |
| $1,000 to $1,499 | 60 (55.0%) | 14 (53.8%) |
| $1,500 to $1,999 | 0 (0.0%) | 0 (0.0%) |
| $2,000 to $2,499 | 0 (0.0%) | 0 (0.0%) |
| $2,500 to $2,999 | 0 (0.0%) | 0 (0.0%) |
| $3,000 or more | 0 (0.0%) | 0 (0.0%) |
| Total | 109 (100.0%) | 26 (100.0%) |
Physical Housing Characteristics in Stewart
Housing Structures in Stewart
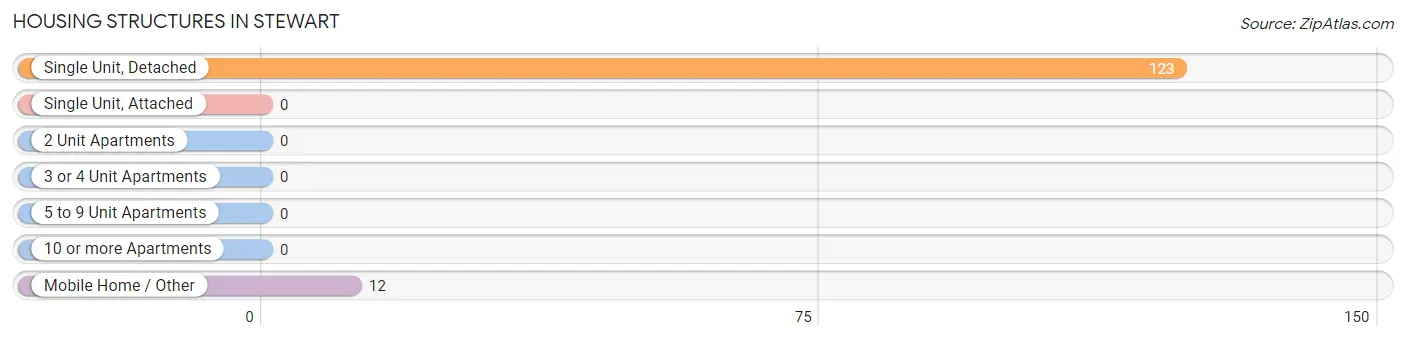
| Structure Type | # Housing Units | % Housing Units |
| Single Unit, Detached | 123 | 91.1% |
| Single Unit, Attached | 0 | 0.0% |
| 2 Unit Apartments | 0 | 0.0% |
| 3 or 4 Unit Apartments | 0 | 0.0% |
| 5 to 9 Unit Apartments | 0 | 0.0% |
| 10 or more Apartments | 0 | 0.0% |
| Mobile Home / Other | 12 | 8.9% |
| Total | 135 | 100.0% |
Housing Structures by Occupancy in Stewart
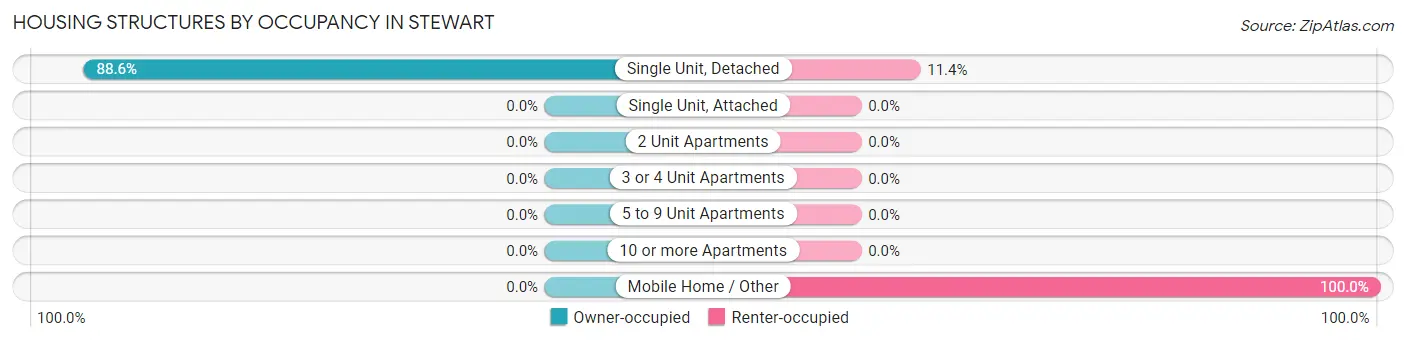
| Structure Type | Owner-occupied | Renter-occupied |
| Single Unit, Detached | 109 (88.6%) | 14 (11.4%) |
| Single Unit, Attached | 0 (0.0%) | 0 (0.0%) |
| 2 Unit Apartments | 0 (0.0%) | 0 (0.0%) |
| 3 or 4 Unit Apartments | 0 (0.0%) | 0 (0.0%) |
| 5 to 9 Unit Apartments | 0 (0.0%) | 0 (0.0%) |
| 10 or more Apartments | 0 (0.0%) | 0 (0.0%) |
| Mobile Home / Other | 0 (0.0%) | 12 (100.0%) |
| Total | 109 (80.7%) | 26 (19.3%) |
Housing Structures by Number of Rooms in Stewart
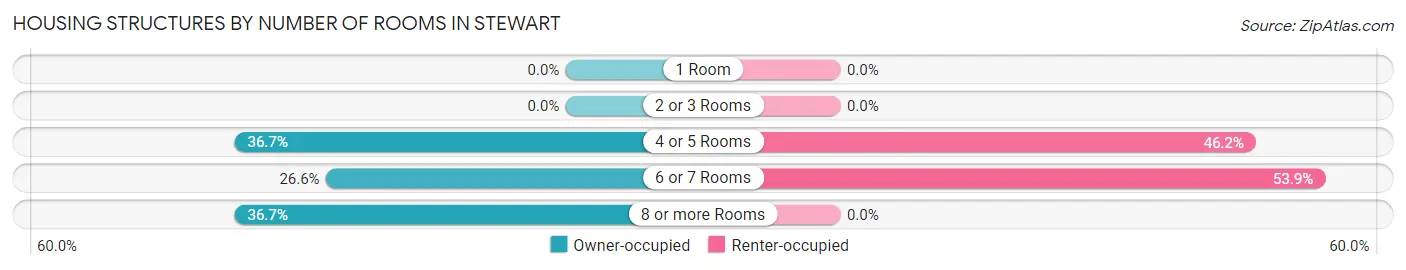
| Number of Rooms | Owner-occupied | Renter-occupied |
| 1 Room | 0 (0.0%) | 0 (0.0%) |
| 2 or 3 Rooms | 0 (0.0%) | 0 (0.0%) |
| 4 or 5 Rooms | 40 (36.7%) | 12 (46.2%) |
| 6 or 7 Rooms | 29 (26.6%) | 14 (53.8%) |
| 8 or more Rooms | 40 (36.7%) | 0 (0.0%) |
| Total | 109 (100.0%) | 26 (100.0%) |
Housing Structure by Heating Type in Stewart
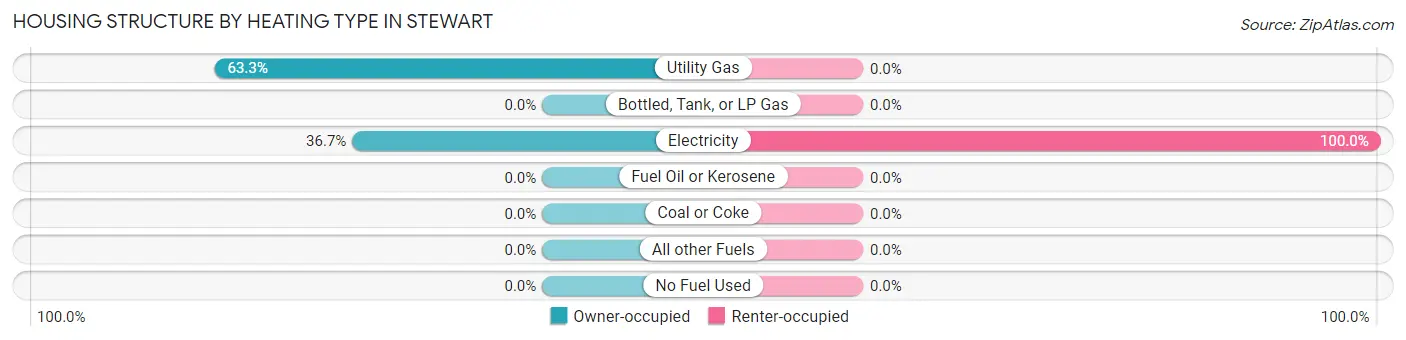
| Heating Type | Owner-occupied | Renter-occupied |
| Utility Gas | 69 (63.3%) | 0 (0.0%) |
| Bottled, Tank, or LP Gas | 0 (0.0%) | 0 (0.0%) |
| Electricity | 40 (36.7%) | 26 (100.0%) |
| Fuel Oil or Kerosene | 0 (0.0%) | 0 (0.0%) |
| Coal or Coke | 0 (0.0%) | 0 (0.0%) |
| All other Fuels | 0 (0.0%) | 0 (0.0%) |
| No Fuel Used | 0 (0.0%) | 0 (0.0%) |
| Total | 109 (100.0%) | 26 (100.0%) |
Household Vehicle Usage in Stewart
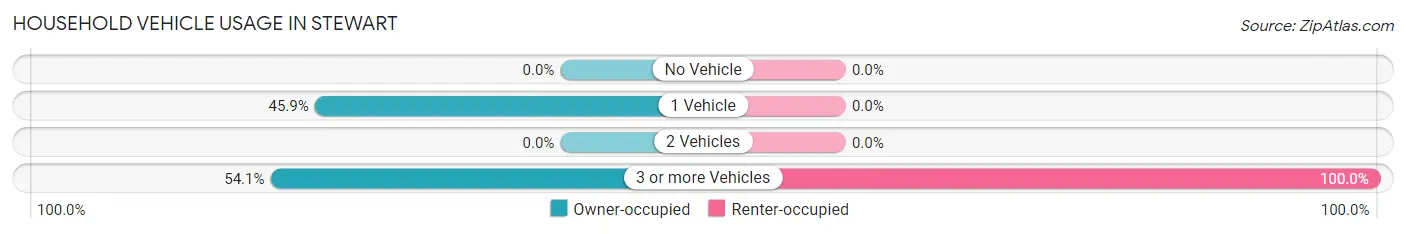
| Vehicles per Household | Owner-occupied | Renter-occupied |
| No Vehicle | 0 (0.0%) | 0 (0.0%) |
| 1 Vehicle | 50 (45.9%) | 0 (0.0%) |
| 2 Vehicles | 0 (0.0%) | 0 (0.0%) |
| 3 or more Vehicles | 59 (54.1%) | 26 (100.0%) |
| Total | 109 (100.0%) | 26 (100.0%) |
Real Estate & Mortgages in Stewart
Real Estate and Mortgage Overview in Stewart
| Characteristic | Without Mortgage | With Mortgage |
| Housing Units | 36 | 73 |
| Median Property Value | - | - |
| Median Household Income | - | - |
| Monthly Housing Costs | - | - |
| Real Estate Taxes | - | - |
Property Value by Mortgage Status in Stewart
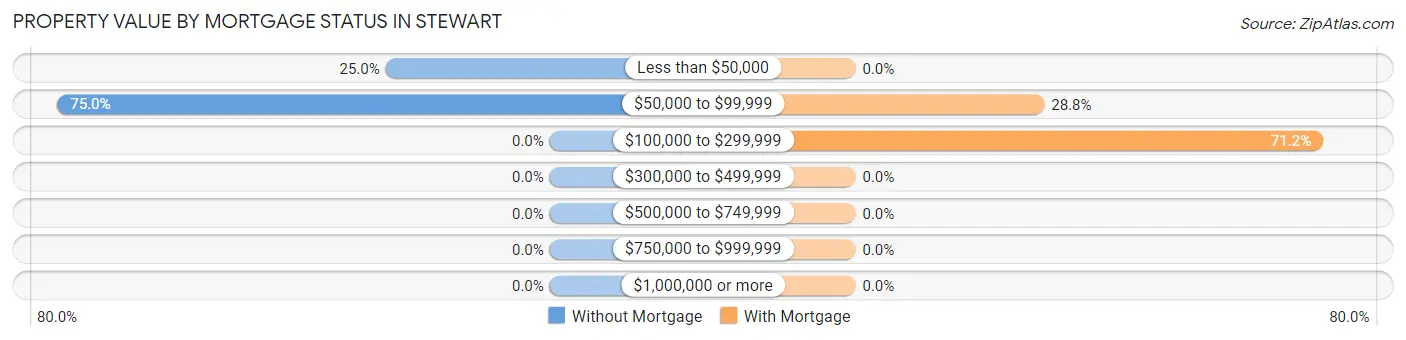
| Property Value | Without Mortgage | With Mortgage |
| Less than $50,000 | 9 (25.0%) | 0 (0.0%) |
| $50,000 to $99,999 | 27 (75.0%) | 21 (28.8%) |
| $100,000 to $299,999 | 0 (0.0%) | 52 (71.2%) |
| $300,000 to $499,999 | 0 (0.0%) | 0 (0.0%) |
| $500,000 to $749,999 | 0 (0.0%) | 0 (0.0%) |
| $750,000 to $999,999 | 0 (0.0%) | 0 (0.0%) |
| $1,000,000 or more | 0 (0.0%) | 0 (0.0%) |
| Total | 36 (100.0%) | 73 (100.0%) |
Household Income by Mortgage Status in Stewart
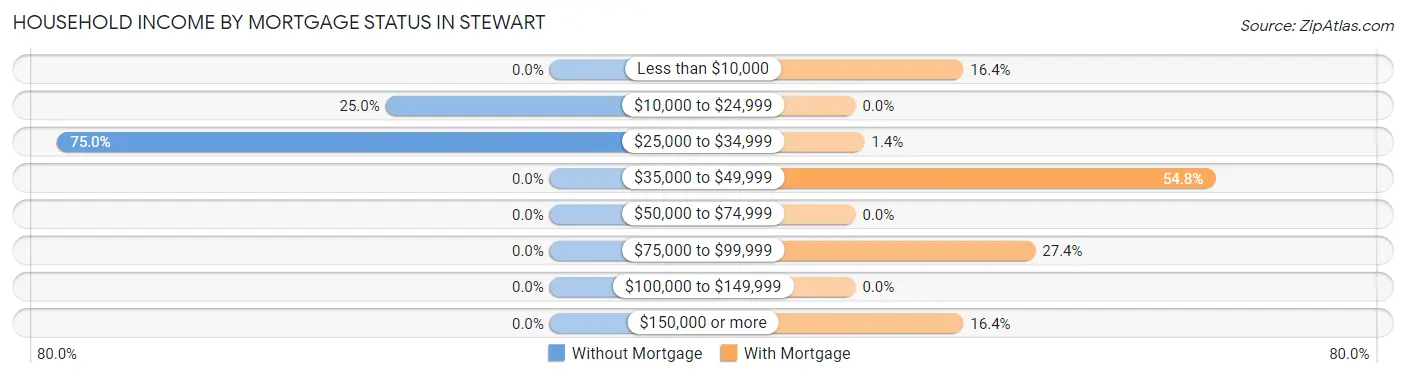
| Household Income | Without Mortgage | With Mortgage |
| Less than $10,000 | 0 (0.0%) | 12 (16.4%) |
| $10,000 to $24,999 | 9 (25.0%) | 0 (0.0%) |
| $25,000 to $34,999 | 27 (75.0%) | 1 (1.4%) |
| $35,000 to $49,999 | 0 (0.0%) | 40 (54.8%) |
| $50,000 to $74,999 | 0 (0.0%) | 0 (0.0%) |
| $75,000 to $99,999 | 0 (0.0%) | 20 (27.4%) |
| $100,000 to $149,999 | 0 (0.0%) | 0 (0.0%) |
| $150,000 or more | 0 (0.0%) | 12 (16.4%) |
| Total | 36 (100.0%) | 73 (100.0%) |
Property Value to Household Income Ratio in Stewart
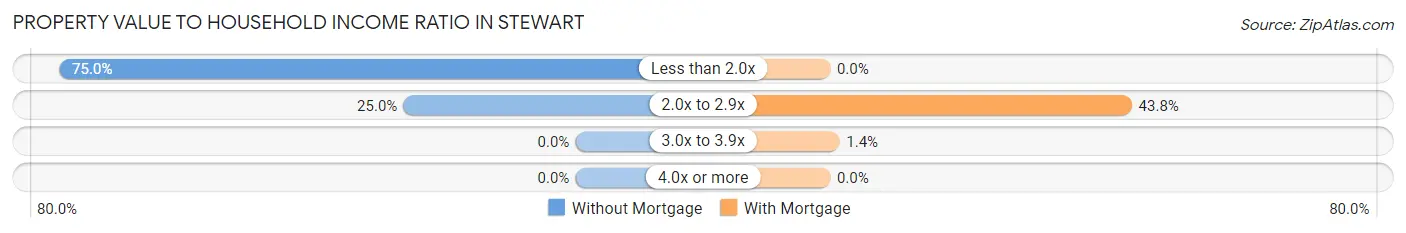
| Value-to-Income Ratio | Without Mortgage | With Mortgage |
| Less than 2.0x | 27 (75.0%) | 0 (0.0%) |
| 2.0x to 2.9x | 9 (25.0%) | 32 (43.8%) |
| 3.0x to 3.9x | 0 (0.0%) | 1 (1.4%) |
| 4.0x or more | 0 (0.0%) | 0 (0.0%) |
| Total | 36 (100.0%) | 73 (100.0%) |
Real Estate Taxes by Mortgage Status in Stewart
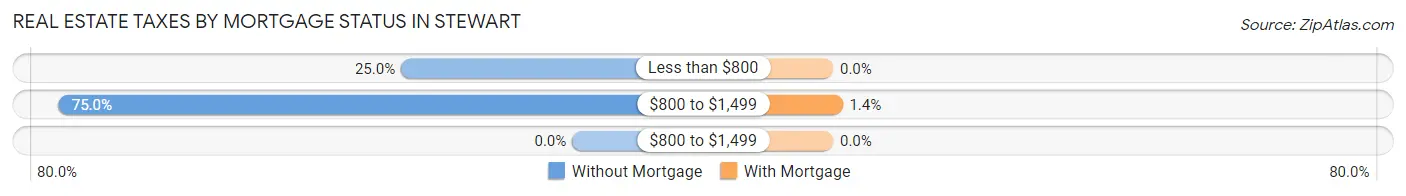
| Property Taxes | Without Mortgage | With Mortgage |
| Less than $800 | 9 (25.0%) | 0 (0.0%) |
| $800 to $1,499 | 27 (75.0%) | 1 (1.4%) |
| $800 to $1,499 | 0 (0.0%) | 0 (0.0%) |
| Total | 36 (100.0%) | 73 (100.0%) |
Health & Disability in Stewart
Health Insurance Coverage by Age in Stewart
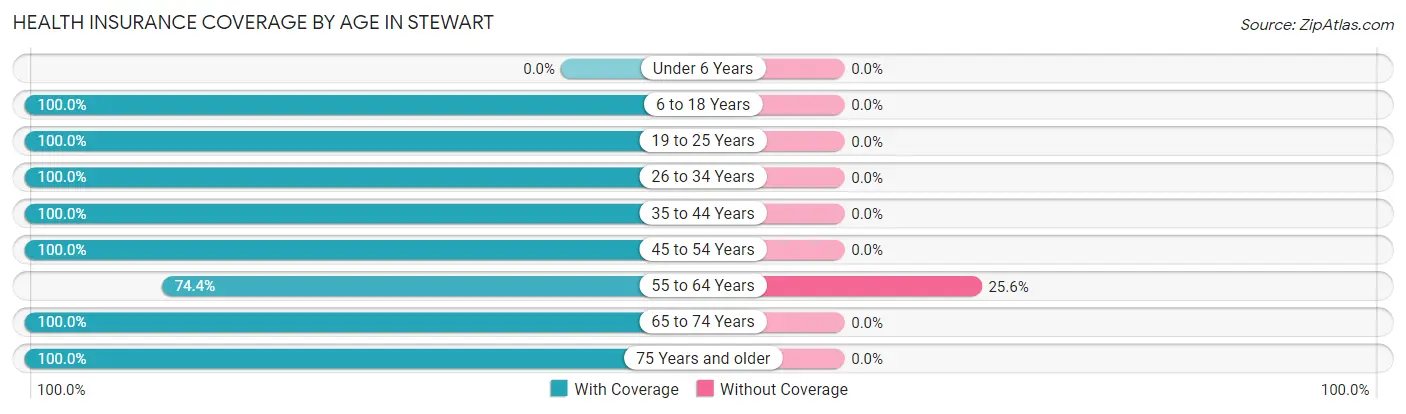
| Age Bracket | With Coverage | Without Coverage |
| Under 6 Years | 0 (0.0%) | 0 (0.0%) |
| 6 to 18 Years | 17 (100.0%) | 0 (0.0%) |
| 19 to 25 Years | 17 (100.0%) | 0 (0.0%) |
| 26 to 34 Years | 29 (100.0%) | 0 (0.0%) |
| 35 to 44 Years | 14 (100.0%) | 0 (0.0%) |
| 45 to 54 Years | 33 (100.0%) | 0 (0.0%) |
| 55 to 64 Years | 32 (74.4%) | 11 (25.6%) |
| 65 to 74 Years | 86 (100.0%) | 0 (0.0%) |
| 75 Years and older | 81 (100.0%) | 0 (0.0%) |
| Total | 309 (96.6%) | 11 (3.4%) |
Health Insurance Coverage by Citizenship Status in Stewart

| Citizenship Status | With Coverage | Without Coverage |
| Native Born | 0 (0.0%) | 0 (0.0%) |
| Foreign Born, Citizen | 17 (100.0%) | 0 (0.0%) |
| Foreign Born, not a Citizen | 17 (100.0%) | 0 (0.0%) |
Health Insurance Coverage by Household Income in Stewart
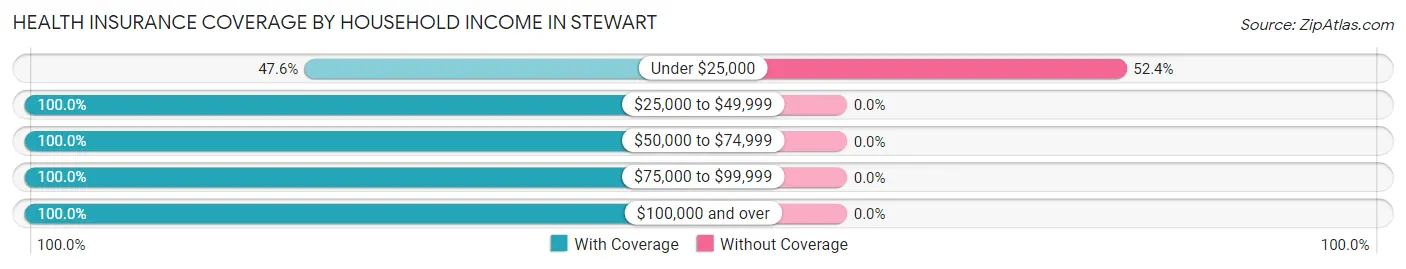
| Household Income | With Coverage | Without Coverage |
| Under $25,000 | 10 (47.6%) | 11 (52.4%) |
| $25,000 to $49,999 | 170 (100.0%) | 0 (0.0%) |
| $50,000 to $74,999 | 57 (100.0%) | 0 (0.0%) |
| $75,000 to $99,999 | 48 (100.0%) | 0 (0.0%) |
| $100,000 and over | 24 (100.0%) | 0 (0.0%) |
Public vs Private Health Insurance Coverage by Age in Stewart
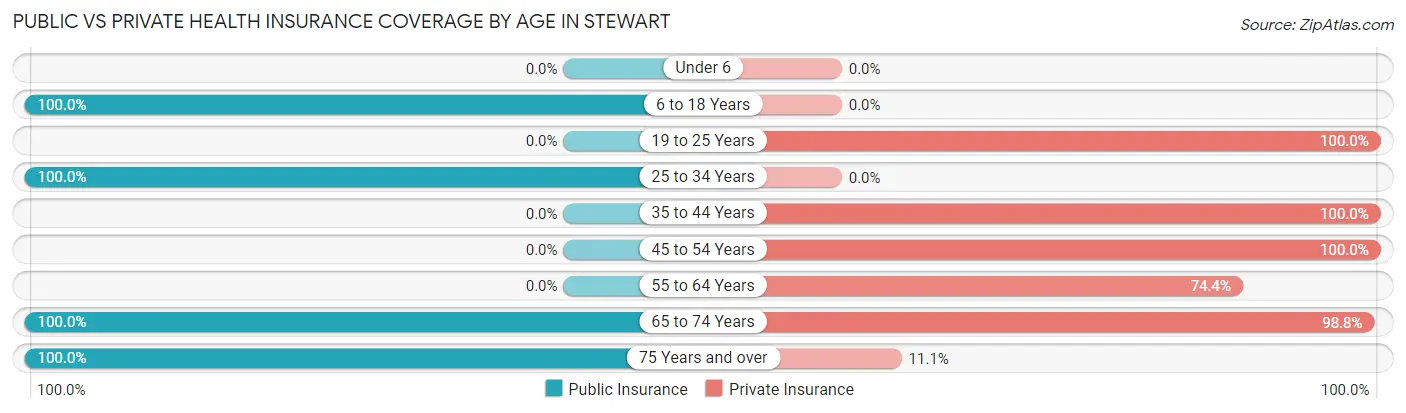
| Age Bracket | Public Insurance | Private Insurance |
| Under 6 | 0 (0.0%) | 0 (0.0%) |
| 6 to 18 Years | 17 (100.0%) | 0 (0.0%) |
| 19 to 25 Years | 0 (0.0%) | 17 (100.0%) |
| 25 to 34 Years | 29 (100.0%) | 0 (0.0%) |
| 35 to 44 Years | 0 (0.0%) | 14 (100.0%) |
| 45 to 54 Years | 0 (0.0%) | 33 (100.0%) |
| 55 to 64 Years | 0 (0.0%) | 32 (74.4%) |
| 65 to 74 Years | 86 (100.0%) | 85 (98.8%) |
| 75 Years and over | 81 (100.0%) | 9 (11.1%) |
| Total | 213 (66.6%) | 190 (59.4%) |
Disability Status by Sex by Age in Stewart
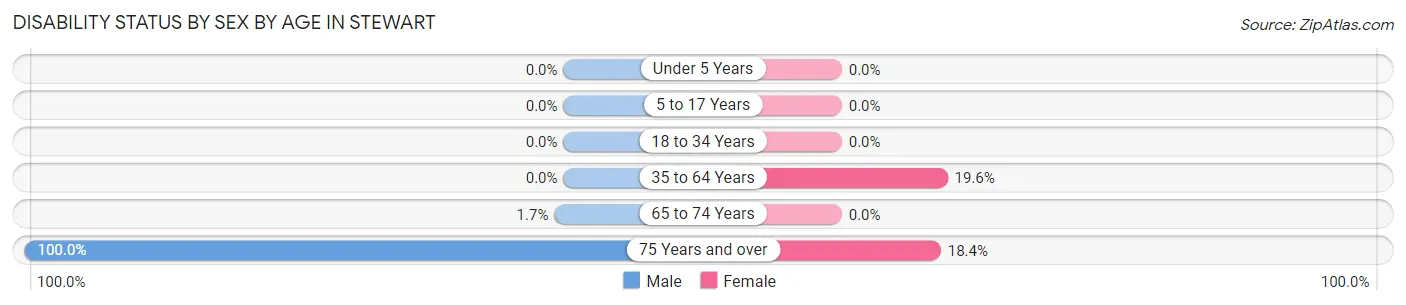
| Age Bracket | Male | Female |
| Under 5 Years | 0 (0.0%) | 0 (0.0%) |
| 5 to 17 Years | 0 (0.0%) | 0 (0.0%) |
| 18 to 34 Years | 0 (0.0%) | 0 (0.0%) |
| 35 to 64 Years | 0 (0.0%) | 11 (19.6%) |
| 65 to 74 Years | 1 (1.7%) | 0 (0.0%) |
| 75 Years and over | 32 (100.0%) | 9 (18.4%) |
Disability Class by Sex by Age in Stewart
Disability Class: Hearing Difficulty
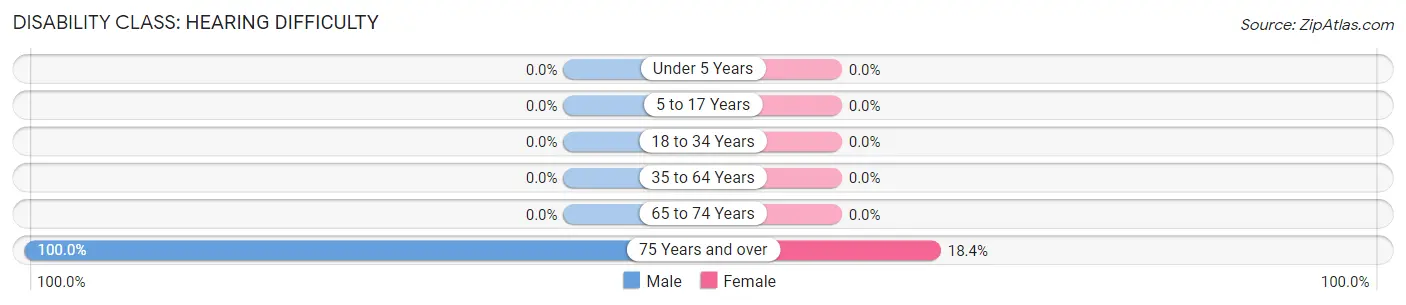
| Age Bracket | Male | Female |
| Under 5 Years | 0 (0.0%) | 0 (0.0%) |
| 5 to 17 Years | 0 (0.0%) | 0 (0.0%) |
| 18 to 34 Years | 0 (0.0%) | 0 (0.0%) |
| 35 to 64 Years | 0 (0.0%) | 0 (0.0%) |
| 65 to 74 Years | 0 (0.0%) | 0 (0.0%) |
| 75 Years and over | 32 (100.0%) | 9 (18.4%) |
Disability Class: Vision Difficulty
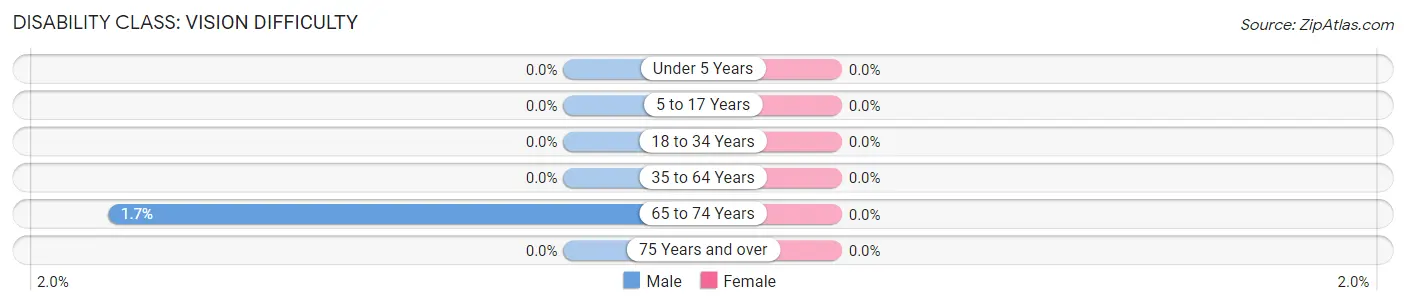
| Age Bracket | Male | Female |
| Under 5 Years | 0 (0.0%) | 0 (0.0%) |
| 5 to 17 Years | 0 (0.0%) | 0 (0.0%) |
| 18 to 34 Years | 0 (0.0%) | 0 (0.0%) |
| 35 to 64 Years | 0 (0.0%) | 0 (0.0%) |
| 65 to 74 Years | 1 (1.7%) | 0 (0.0%) |
| 75 Years and over | 0 (0.0%) | 0 (0.0%) |
Disability Class: Cognitive Difficulty
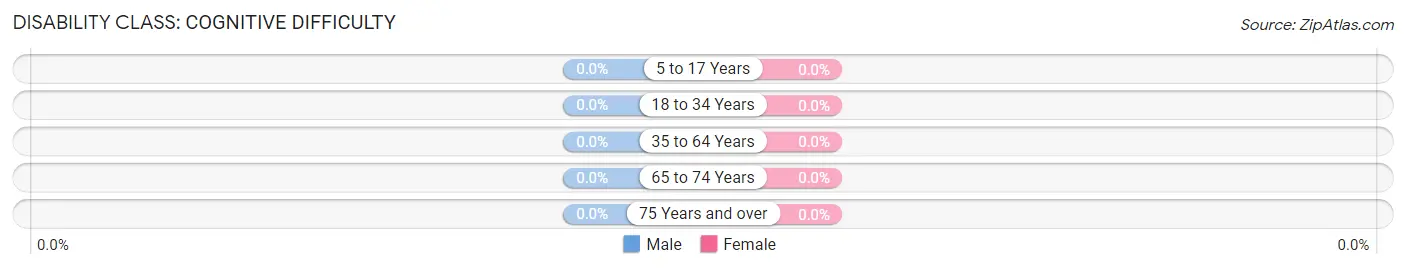
| Age Bracket | Male | Female |
| 5 to 17 Years | 0 (0.0%) | 0 (0.0%) |
| 18 to 34 Years | 0 (0.0%) | 0 (0.0%) |
| 35 to 64 Years | 0 (0.0%) | 0 (0.0%) |
| 65 to 74 Years | 0 (0.0%) | 0 (0.0%) |
| 75 Years and over | 0 (0.0%) | 0 (0.0%) |
Disability Class: Ambulatory Difficulty
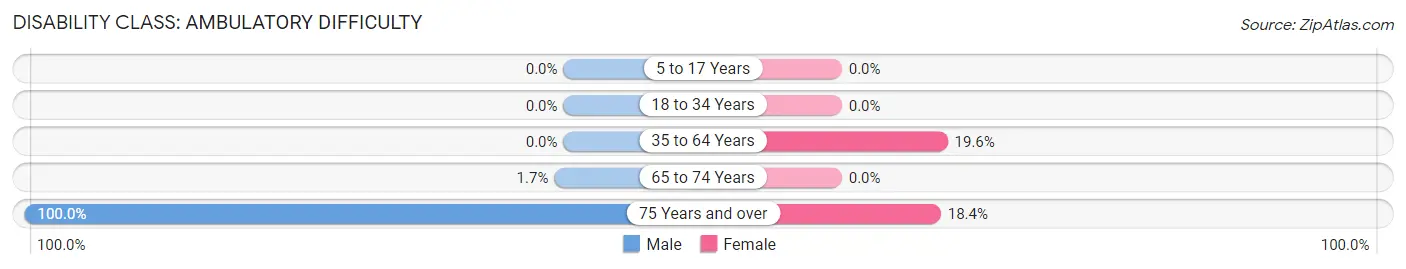
| Age Bracket | Male | Female |
| 5 to 17 Years | 0 (0.0%) | 0 (0.0%) |
| 18 to 34 Years | 0 (0.0%) | 0 (0.0%) |
| 35 to 64 Years | 0 (0.0%) | 11 (19.6%) |
| 65 to 74 Years | 1 (1.7%) | 0 (0.0%) |
| 75 Years and over | 32 (100.0%) | 9 (18.4%) |
Disability Class: Self-Care Difficulty
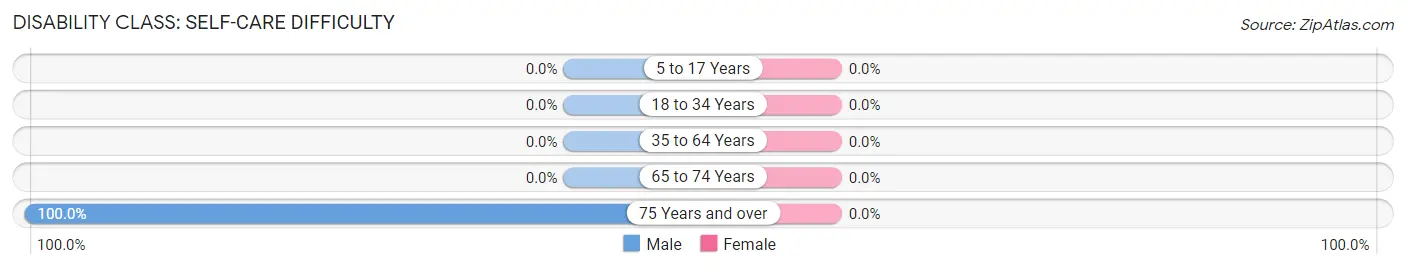
| Age Bracket | Male | Female |
| 5 to 17 Years | 0 (0.0%) | 0 (0.0%) |
| 18 to 34 Years | 0 (0.0%) | 0 (0.0%) |
| 35 to 64 Years | 0 (0.0%) | 0 (0.0%) |
| 65 to 74 Years | 0 (0.0%) | 0 (0.0%) |
| 75 Years and over | 32 (100.0%) | 0 (0.0%) |
Technology Access in Stewart
Computing Device Access in Stewart
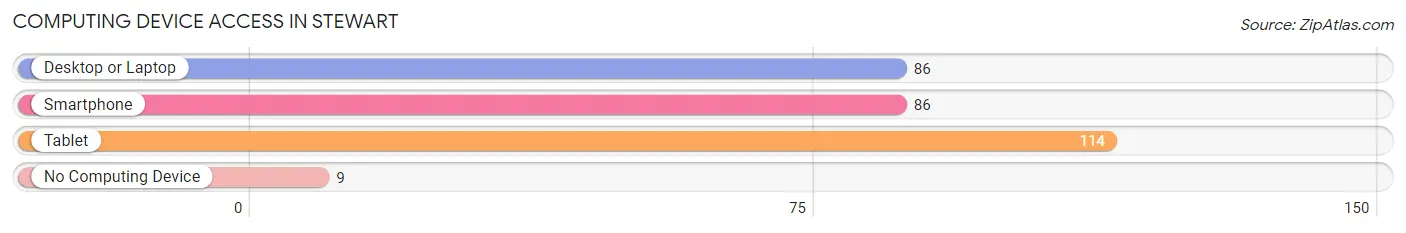
| Device Type | # Households | % Households |
| Desktop or Laptop | 86 | 63.7% |
| Smartphone | 86 | 63.7% |
| Tablet | 114 | 84.4% |
| No Computing Device | 9 | 6.7% |
| Total | 135 | 100.0% |
Internet Access in Stewart
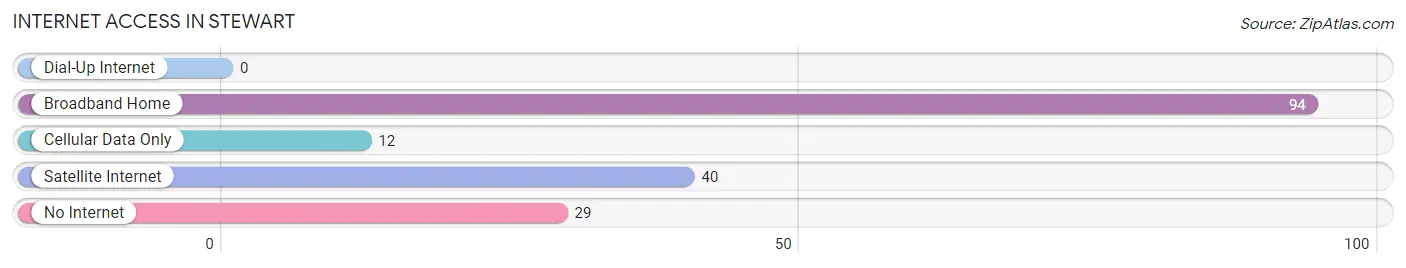
| Internet Type | # Households | % Households |
| Dial-Up Internet | 0 | 0.0% |
| Broadband Home | 94 | 69.6% |
| Cellular Data Only | 12 | 8.9% |
| Satellite Internet | 40 | 29.6% |
| No Internet | 29 | 21.5% |
| Total | 135 | 100.0% |
Stewart Summary
Stewart, Ohio is a small village located in the southeastern corner of Muskingum County, Ohio. It is situated along the Muskingum River, approximately 10 miles south of Zanesville. The village has a population of approximately 500 people and covers an area of 0.6 square miles.
History
The area that is now Stewart was first settled in 1805 by a group of settlers from Pennsylvania. The village was originally known as “Stewart’s Mills”, named after the first settler, John Stewart. The village was officially incorporated in 1837.
In the early 19th century, Stewart was a thriving agricultural community. The village was home to several mills, including a grist mill, a saw mill, and a woolen mill. The village also had a blacksmith shop, a general store, and a post office.
In the late 19th century, the village began to decline. The mills closed and the population began to dwindle. By the early 20th century, the village was in a state of decline.
Geography
Stewart is located in the southeastern corner of Muskingum County, Ohio. It is situated along the Muskingum River, approximately 10 miles south of Zanesville. The village has a total area of 0.6 square miles, all of which is land.
The village is located in a rural area, surrounded by farmland. The terrain is mostly flat, with some rolling hills. The climate is humid continental, with hot summers and cold winters.
Economy
The economy of Stewart is largely based on agriculture. The village is home to several farms, which produce a variety of crops, including corn, soybeans, and wheat. The village also has a few small businesses, including a gas station, a convenience store, and a restaurant.
Demographics
As of the 2010 census, the population of Stewart was 498. The racial makeup of the village was 97.2% White, 0.2% African American, 0.2% Native American, 0.2% Asian, 0.2% from other races, and 1.8% from two or more races. Hispanic or Latino of any race were 0.6% of the population.
The median household income in Stewart was $37,500, and the median family income was $41,250. The per capita income was $17,845. About 11.2% of families and 13.2% of the population were below the poverty line, including 16.7% of those under age 18 and 8.3% of those age 65 or over.
Common Questions
What is the Total Population of Stewart?
Total Population of Stewart is 320.
What is the Total Male Population of Stewart?
Total Male Population of Stewart is 159.
What is the Total Female Population of Stewart?
Total Female Population of Stewart is 161.
What is the Ratio of Males per 100 Females in Stewart?
There are 98.76 Males per 100 Females in Stewart.
What is the Ratio of Females per 100 Males in Stewart?
There are 101.26 Females per 100 Males in Stewart.
What is the Median Population Age in Stewart?
Median Population Age in Stewart is 65.5 Years.
What is the Average Family Size in Stewart
Average Family Size in Stewart is 2.2 People.
What is the Average Household Size in Stewart
Average Household Size in Stewart is 2.4 People.
What is Per Capita Income in Stewart?
Per Capita income in Stewart is $21,327.
What is the Median Family Income in Stewart?
Median Family Income in Stewart is $34,104.
What is the Median Household income in Stewart?
Median Household Income in Stewart is $34,646.
What is Inequality or Gini Index in Stewart?
Inequality or Gini Index in Stewart is 0.28.
How Large is the Labor Force in Stewart?
There are 140 People in the Labor Forcein in Stewart.
What is the Percentage of People in the Labor Force in Stewart?
46.2% of People are in the Labor Force in Stewart.