Cities with the Highest Percentage of Population Employed in Education Instruction & Library in Delaware
RELATED REPORTS & OPTIONS
Education Instruction & Library
Delaware
Compare Cities
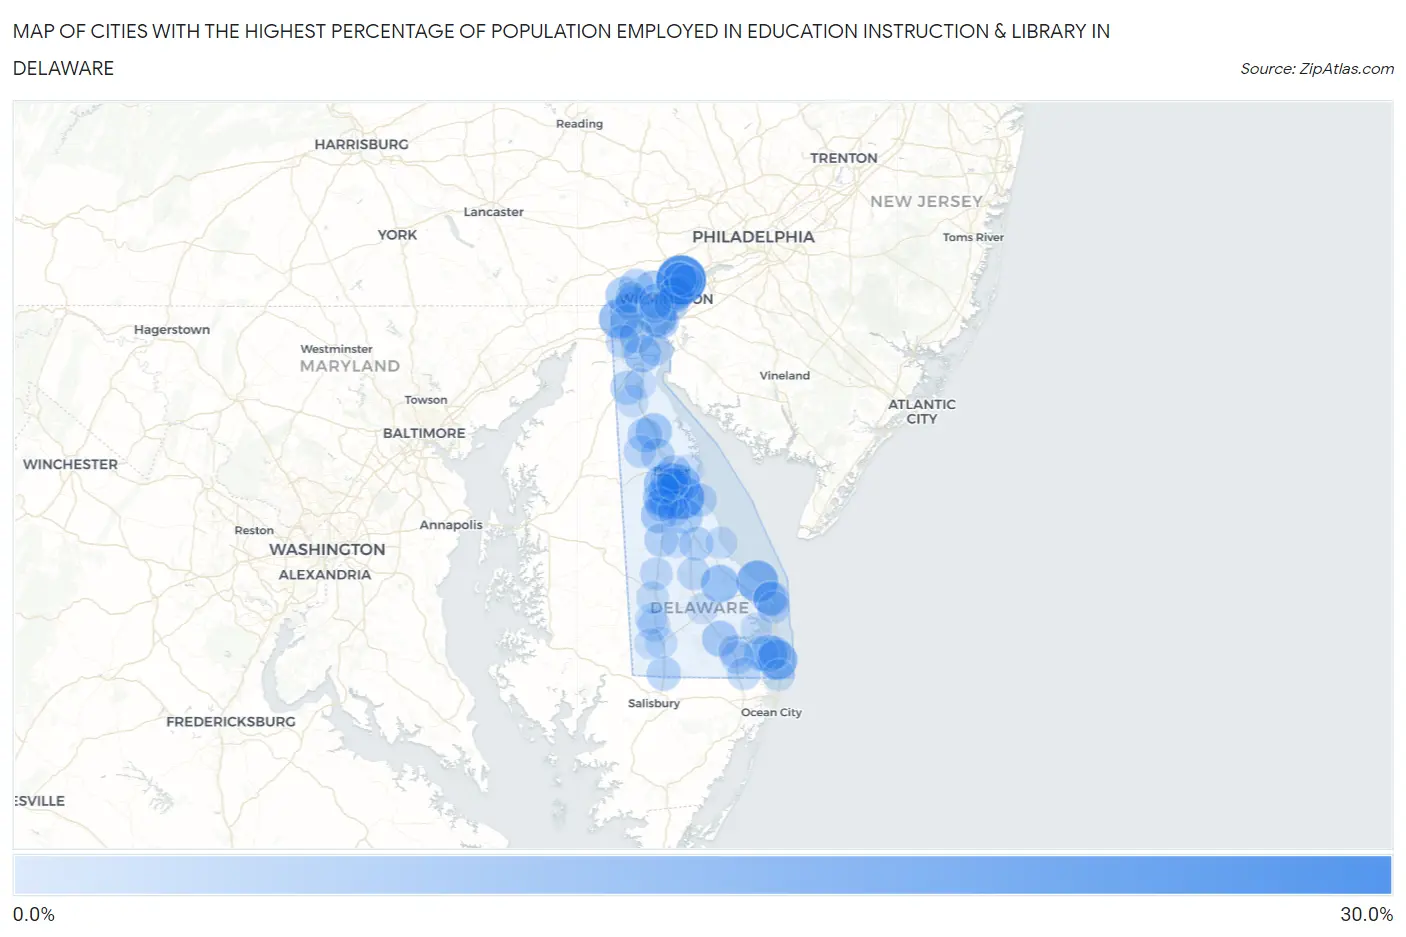
Map of Cities with the Highest Percentage of Population Employed in Education Instruction & Library in Delaware
0.0%
30.0%
Cities with the Highest Percentage of Population Employed in Education Instruction & Library in Delaware
| City | % Employed | vs State | vs National | |
| 1. | Ardentown | 27.0% | 6.3%(+20.7)#1 | 6.2%(+20.8)#424 |
| 2. | Magnolia | 18.4% | 6.3%(+12.1)#2 | 6.2%(+12.2)#1,034 |
| 3. | Lewes | 15.7% | 6.3%(+9.35)#3 | 6.2%(+9.49)#1,541 |
| 4. | Woodside East | 13.9% | 6.3%(+7.55)#4 | 6.2%(+7.68)#2,071 |
| 5. | South Bethany | 13.2% | 6.3%(+6.88)#5 | 6.2%(+7.01)#2,346 |
| 6. | Newark | 13.1% | 6.3%(+6.74)#6 | 6.2%(+6.88)#2,389 |
| 7. | Wilmington Manor | 11.4% | 6.3%(+5.12)#7 | 6.2%(+5.25)#3,261 |
| 8. | Ardencroft | 11.4% | 6.3%(+5.09)#8 | 6.2%(+5.22)#3,286 |
| 9. | Milton | 10.7% | 6.3%(+4.36)#9 | 6.2%(+4.49)#3,861 |
| 10. | Dover Base Housing | 10.3% | 6.3%(+4.03)#10 | 6.2%(+4.16)#4,146 |
| 11. | Ocean View | 10.3% | 6.3%(+4.03)#11 | 6.2%(+4.16)#4,156 |
| 12. | Wyoming | 9.8% | 6.3%(+3.53)#12 | 6.2%(+3.66)#4,698 |
| 13. | St Georges | 9.7% | 6.3%(+3.42)#13 | 6.2%(+3.55)#4,829 |
| 14. | Woodside | 8.9% | 6.3%(+2.61)#14 | 6.2%(+2.75)#5,819 |
| 15. | Smyrna | 8.5% | 6.3%(+2.15)#15 | 6.2%(+2.29)#6,510 |
| 16. | North Star | 8.4% | 6.3%(+2.13)#16 | 6.2%(+2.26)#6,547 |
| 17. | Greenville | 8.2% | 6.3%(+1.93)#17 | 6.2%(+2.06)#6,881 |
| 18. | Felton | 8.2% | 6.3%(+1.88)#18 | 6.2%(+2.01)#6,970 |
| 19. | Millsboro | 8.1% | 6.3%(+1.75)#19 | 6.2%(+1.88)#7,241 |
| 20. | Rising Sun Lebanon | 7.9% | 6.3%(+1.59)#20 | 6.2%(+1.72)#7,542 |
| 21. | Henlopen Acres | 7.8% | 6.3%(+1.50)#21 | 6.2%(+1.63)#7,716 |
| 22. | Pike Creek Valley | 7.4% | 6.3%(+1.12)#22 | 6.2%(+1.25)#8,503 |
| 23. | Frederica | 7.2% | 6.3%(+0.916)#23 | 6.2%(+1.05)#8,933 |
| 24. | Rodney Village | 7.1% | 6.3%(+0.814)#24 | 6.2%(+0.946)#9,168 |
| 25. | New Castle | 7.1% | 6.3%(+0.803)#25 | 6.2%(+0.935)#9,184 |
| 26. | Edgemoor | 6.9% | 6.3%(+0.578)#26 | 6.2%(+0.710)#9,688 |
| 27. | Hockessin | 6.7% | 6.3%(+0.392)#27 | 6.2%(+0.524)#10,163 |
| 28. | Elsmere | 6.6% | 6.3%(+0.286)#28 | 6.2%(+0.418)#10,469 |
| 29. | Bellefonte | 6.5% | 6.3%(+0.230)#29 | 6.2%(+0.362)#10,618 |
| 30. | Clayton | 6.4% | 6.3%(+0.109)#30 | 6.2%(+0.241)#10,963 |
| 31. | Millville | 6.2% | 6.3%(-0.150)#31 | 6.2%(-0.018)#11,706 |
| 32. | Dover | 6.1% | 6.3%(-0.207)#32 | 6.2%(-0.075)#11,884 |
| 33. | Wilmington | 6.0% | 6.3%(-0.266)#33 | 6.2%(-0.134)#12,088 |
| 34. | Kent Acres | 6.0% | 6.3%(-0.289)#34 | 6.2%(-0.157)#12,148 |
| 35. | Delmar | 5.8% | 6.3%(-0.558)#35 | 6.2%(-0.426)#12,900 |
| 36. | Milford | 5.7% | 6.3%(-0.661)#36 | 6.2%(-0.529)#13,205 |
| 37. | Brookside | 5.6% | 6.3%(-0.744)#37 | 6.2%(-0.612)#13,443 |
| 38. | Bear | 5.4% | 6.3%(-0.869)#38 | 6.2%(-0.736)#13,814 |
| 39. | Cheswold | 5.4% | 6.3%(-0.921)#39 | 6.2%(-0.789)#13,960 |
| 40. | Harrington | 5.3% | 6.3%(-0.972)#40 | 6.2%(-0.840)#14,117 |
| 41. | Middletown | 5.3% | 6.3%(-1.01)#41 | 6.2%(-0.874)#14,245 |
| 42. | Rehoboth Beach | 4.9% | 6.3%(-1.39)#42 | 6.2%(-1.26)#15,382 |
| 43. | Bowers | 4.9% | 6.3%(-1.41)#43 | 6.2%(-1.28)#15,457 |
| 44. | Viola | 4.9% | 6.3%(-1.44)#44 | 6.2%(-1.31)#15,541 |
| 45. | Glasgow | 4.8% | 6.3%(-1.52)#45 | 6.2%(-1.39)#15,797 |
| 46. | Frankford | 4.4% | 6.3%(-1.88)#46 | 6.2%(-1.74)#16,903 |
| 47. | Dagsboro | 4.3% | 6.3%(-2.03)#47 | 6.2%(-1.90)#17,395 |
| 48. | Ellendale | 4.3% | 6.3%(-2.06)#48 | 6.2%(-1.93)#17,494 |
| 49. | Bethany Beach | 4.1% | 6.3%(-2.22)#49 | 6.2%(-2.09)#17,978 |
| 50. | Arden | 4.0% | 6.3%(-2.30)#50 | 6.2%(-2.17)#18,214 |
| 51. | Greenwood | 4.0% | 6.3%(-2.32)#51 | 6.2%(-2.19)#18,289 |
| 52. | Claymont | 4.0% | 6.3%(-2.33)#52 | 6.2%(-2.20)#18,316 |
| 53. | Selbyville | 3.8% | 6.3%(-2.48)#53 | 6.2%(-2.35)#18,709 |
| 54. | Blades | 3.7% | 6.3%(-2.59)#54 | 6.2%(-2.46)#18,996 |
| 55. | Kenton | 3.6% | 6.3%(-2.70)#55 | 6.2%(-2.57)#19,287 |
| 56. | Dewey Beach | 3.5% | 6.3%(-2.85)#56 | 6.2%(-2.72)#19,694 |
| 57. | Bridgeville | 3.3% | 6.3%(-2.97)#57 | 6.2%(-2.83)#20,016 |
| 58. | Riverview | 3.2% | 6.3%(-3.12)#58 | 6.2%(-2.98)#20,415 |
| 59. | Delaware City | 3.1% | 6.3%(-3.20)#59 | 6.2%(-3.07)#20,630 |
| 60. | Pike Creek | 3.0% | 6.3%(-3.30)#60 | 6.2%(-3.17)#20,879 |
| 61. | Laurel | 2.9% | 6.3%(-3.37)#61 | 6.2%(-3.24)#21,039 |
| 62. | Townsend | 2.9% | 6.3%(-3.38)#62 | 6.2%(-3.25)#21,086 |
| 63. | Slaughter Beach | 2.9% | 6.3%(-3.44)#63 | 6.2%(-3.31)#21,208 |
| 64. | Fenwick Island | 2.8% | 6.3%(-3.51)#64 | 6.2%(-3.38)#21,371 |
| 65. | Seaford | 2.6% | 6.3%(-3.67)#65 | 6.2%(-3.54)#21,712 |
| 66. | Highland Acres | 2.5% | 6.3%(-3.80)#66 | 6.2%(-3.67)#21,994 |
| 67. | Odessa | 2.4% | 6.3%(-3.91)#67 | 6.2%(-3.77)#22,233 |
| 68. | Newport | 2.4% | 6.3%(-3.91)#68 | 6.2%(-3.78)#22,248 |
| 69. | Long Neck | 2.3% | 6.3%(-3.97)#69 | 6.2%(-3.84)#22,397 |
| 70. | Georgetown | 1.8% | 6.3%(-4.54)#70 | 6.2%(-4.41)#23,485 |
| 71. | Bethel | 1.7% | 6.3%(-4.63)#71 | 6.2%(-4.50)#23,643 |
| 72. | Houston | 1.6% | 6.3%(-4.73)#72 | 6.2%(-4.60)#23,795 |
| 73. | Little Creek | 1.5% | 6.3%(-4.85)#73 | 6.2%(-4.71)#23,974 |
| 74. | Camden | 1.0% | 6.3%(-5.30)#74 | 6.2%(-5.17)#24,608 |
1
Common Questions
What are the Top 10 Cities with the Highest Percentage of Population Employed in Education Instruction & Library in Delaware?
Top 10 Cities with the Highest Percentage of Population Employed in Education Instruction & Library in Delaware are:
#1
27.0%
#2
18.4%
#3
15.7%
#4
13.9%
#5
13.2%
#6
13.1%
#7
11.4%
#8
11.4%
#9
10.7%
#10
10.3%
What city has the Highest Percentage of Population Employed in Education Instruction & Library in Delaware?
Ardentown has the Highest Percentage of Population Employed in Education Instruction & Library in Delaware with 27.0%.
What is the Percentage of Population Employed in Education Instruction & Library in the State of Delaware?
Percentage of Population Employed in Education Instruction & Library in Delaware is 6.3%.
What is the Percentage of Population Employed in Education Instruction & Library in the United States?
Percentage of Population Employed in Education Instruction & Library in the United States is 6.2%.