Skyline Acres, OH
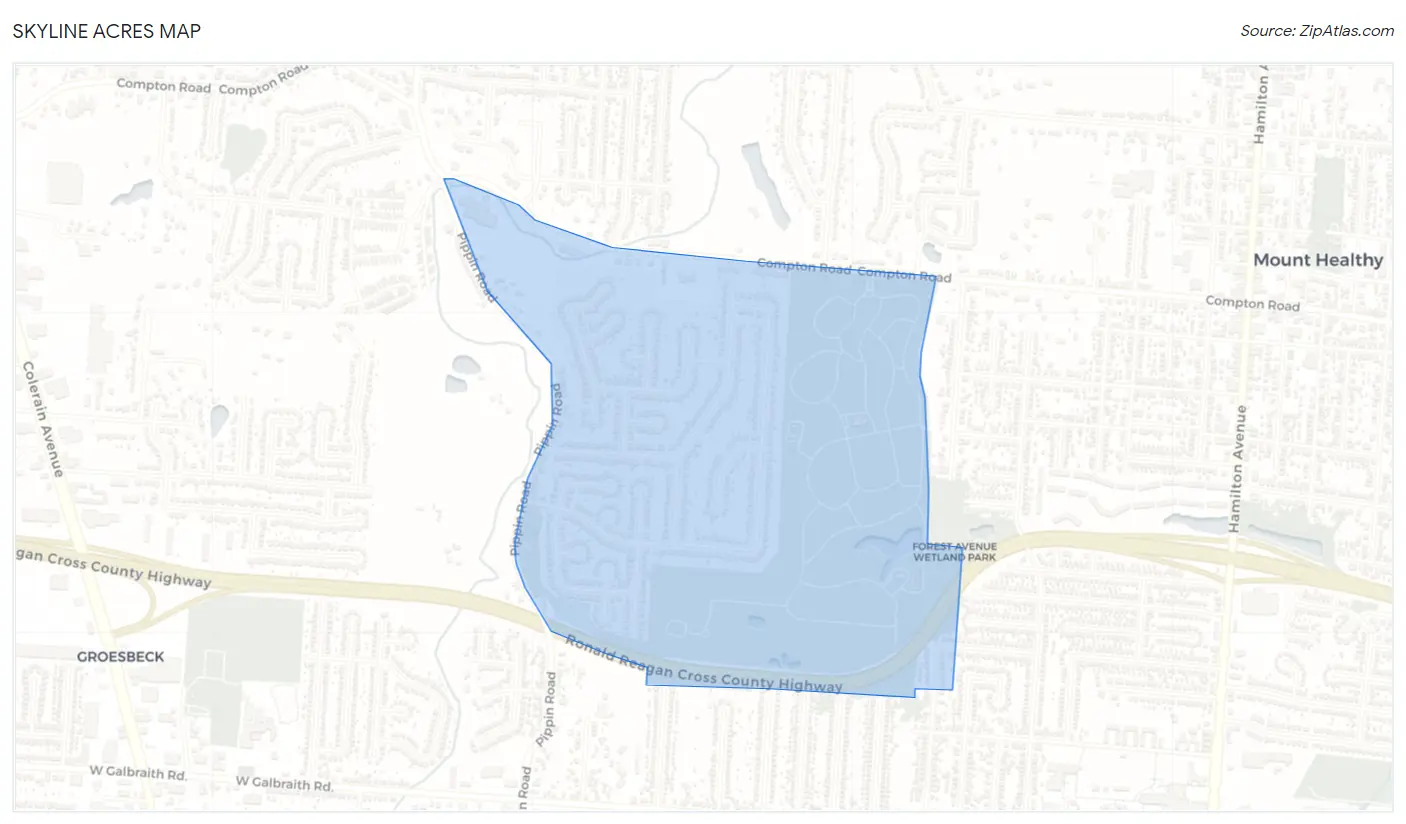
Skyline Acres Map
Skyline Acres Overview
1,189
TOTAL POPULATION
578
MALE POPULATION
611
FEMALE POPULATION
94.60
MALES / 100 FEMALES
105.71
FEMALES / 100 MALES
41.1
MEDIAN AGE
3.8
AVG FAMILY SIZE
2.8
AVG HOUSEHOLD SIZE
$23,834
PER CAPITA INCOME
$38,864
AVG FAMILY INCOME
0.44
INEQUALITY / GINI INDEX
476
LABOR FORCE [ PEOPLE ]
50.6%
PERCENT IN LABOR FORCE
2.7%
UNEMPLOYMENT RATE
Race in Skyline Acres
The most populous races in Skyline Acres are Black / African American (958 | 80.6%), White / Caucasian (141 | 11.9%), and Hispanic or Latino (118 | 9.9%).
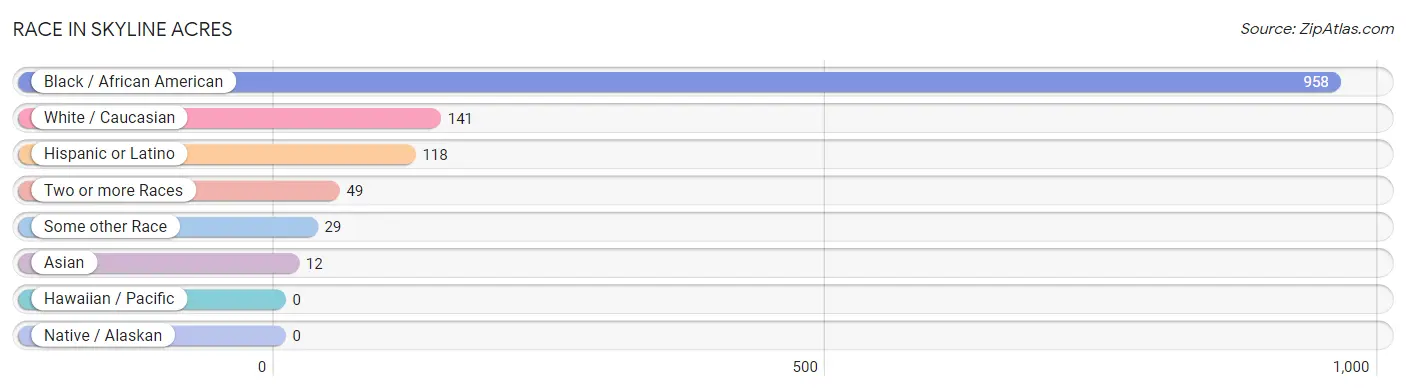
| Race | # Population | % Population |
| Asian | 12 | 1.0% |
| Black / African American | 958 | 80.6% |
| Hawaiian / Pacific | 0 | 0.0% |
| Hispanic or Latino | 118 | 9.9% |
| Native / Alaskan | 0 | 0.0% |
| White / Caucasian | 141 | 11.9% |
| Two or more Races | 49 | 4.1% |
| Some other Race | 29 | 2.4% |
| Total | 1,189 | 100.0% |
Ancestry in Skyline Acres
The most populous ancestries reported in Skyline Acres are Puerto Rican (118 | 9.9%), German (52 | 4.4%), Pakistani (24 | 2.0%), Italian (22 | 1.8%), and Irish (11 | 0.9%), together accounting for 19.1% of all Skyline Acres residents.
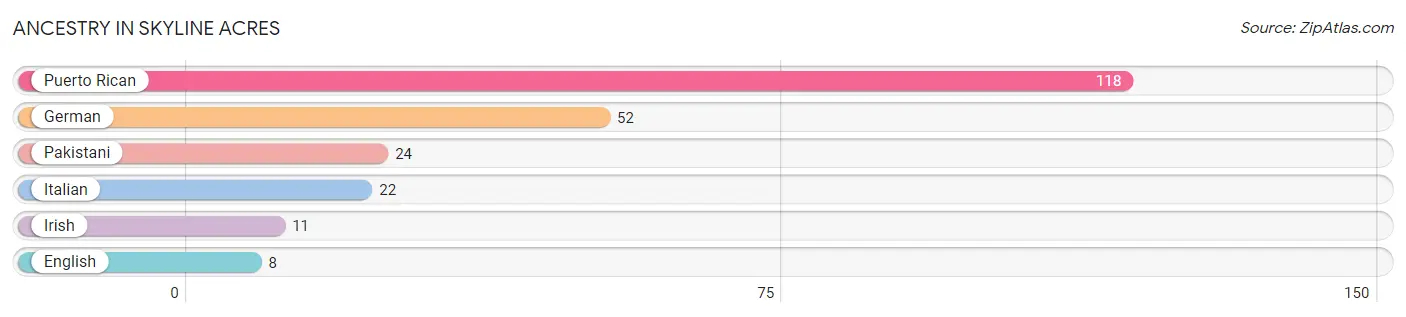
| Ancestry | # Population | % Population |
| English | 8 | 0.7% |
| German | 52 | 4.4% |
| Irish | 11 | 0.9% |
| Italian | 22 | 1.8% |
| Pakistani | 24 | 2.0% |
| Puerto Rican | 118 | 9.9% | View All 6 Rows |
Immigrants in Skyline Acres
The most numerous immigrant groups reported in Skyline Acres came from Asia (12 | 1.0%), South Eastern Asia (12 | 1.0%), and Thailand (12 | 1.0%), together accounting for 3.0% of all Skyline Acres residents.
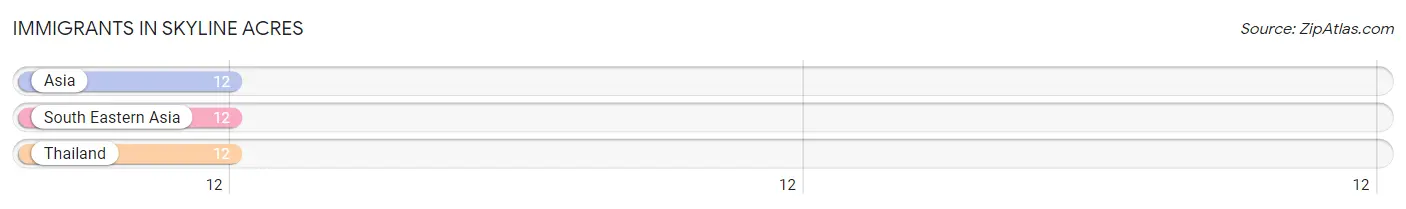
| Immigration Origin | # Population | % Population |
| Asia | 12 | 1.0% |
| South Eastern Asia | 12 | 1.0% |
| Thailand | 12 | 1.0% | View All 3 Rows |
Sex and Age in Skyline Acres
Sex and Age in Skyline Acres
The most populous age groups in Skyline Acres are 10 to 14 Years (93 | 16.1%) for men and 40 to 44 Years (97 | 15.9%) for women.
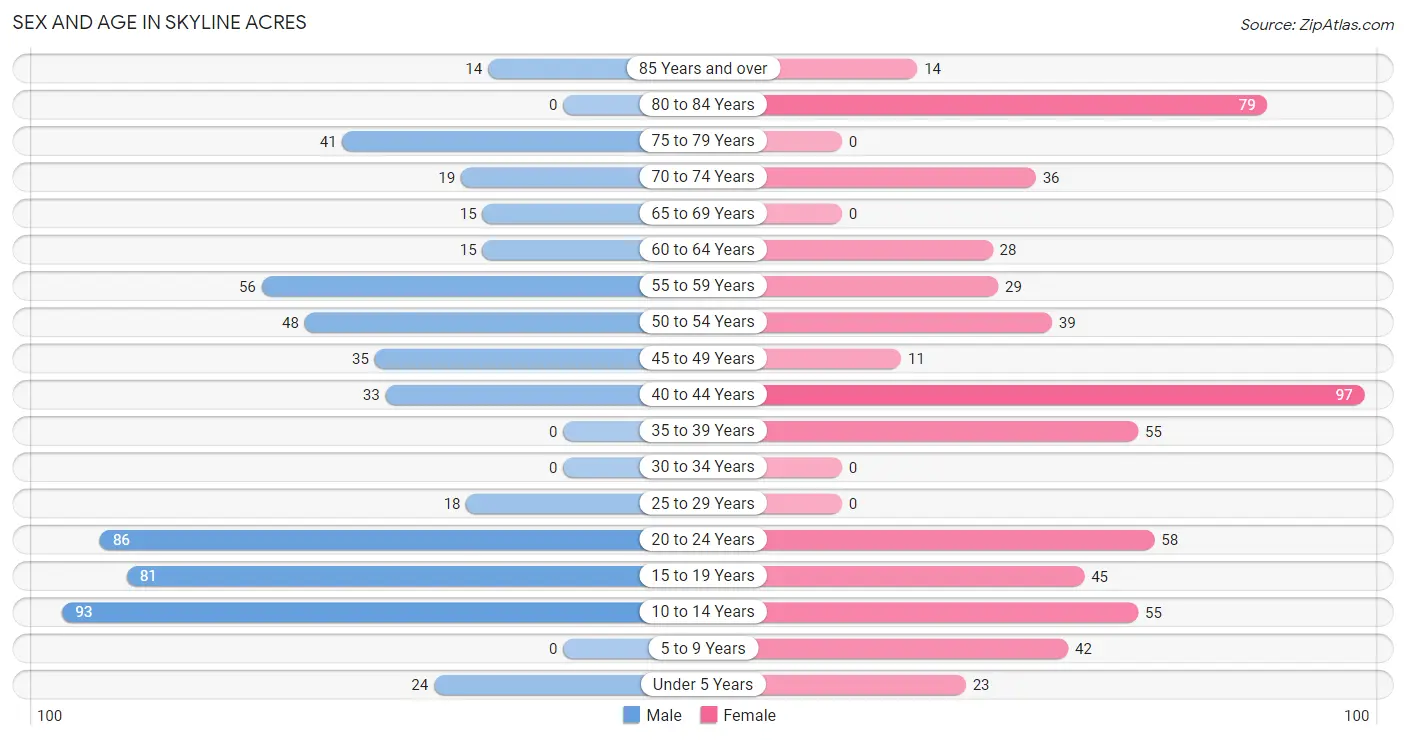
| Age Bracket | Male | Female |
| Under 5 Years | 24 (4.2%) | 23 (3.8%) |
| 5 to 9 Years | 0 (0.0%) | 42 (6.9%) |
| 10 to 14 Years | 93 (16.1%) | 55 (9.0%) |
| 15 to 19 Years | 81 (14.0%) | 45 (7.4%) |
| 20 to 24 Years | 86 (14.9%) | 58 (9.5%) |
| 25 to 29 Years | 18 (3.1%) | 0 (0.0%) |
| 30 to 34 Years | 0 (0.0%) | 0 (0.0%) |
| 35 to 39 Years | 0 (0.0%) | 55 (9.0%) |
| 40 to 44 Years | 33 (5.7%) | 97 (15.9%) |
| 45 to 49 Years | 35 (6.1%) | 11 (1.8%) |
| 50 to 54 Years | 48 (8.3%) | 39 (6.4%) |
| 55 to 59 Years | 56 (9.7%) | 29 (4.8%) |
| 60 to 64 Years | 15 (2.6%) | 28 (4.6%) |
| 65 to 69 Years | 15 (2.6%) | 0 (0.0%) |
| 70 to 74 Years | 19 (3.3%) | 36 (5.9%) |
| 75 to 79 Years | 41 (7.1%) | 0 (0.0%) |
| 80 to 84 Years | 0 (0.0%) | 79 (12.9%) |
| 85 Years and over | 14 (2.4%) | 14 (2.3%) |
| Total | 578 (100.0%) | 611 (100.0%) |
Families and Households in Skyline Acres
Median Family Size in Skyline Acres
The median family size in Skyline Acres is 3.75 persons per family, with single female/mother families (144 | 60.0%) accounting for the largest median family size of 4.26 persons per family. On the other hand, single male/father families (38 | 15.8%) represent the smallest median family size with 2.08 persons per family.
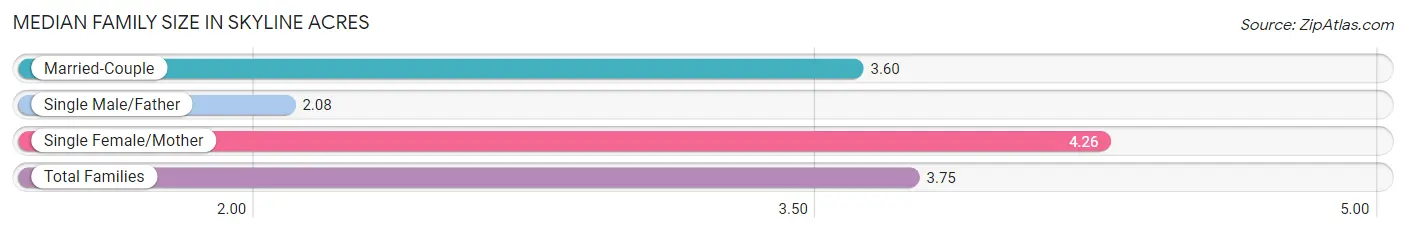
| Family Type | # Families | Family Size |
| Married-Couple | 58 (24.2%) | 3.60 |
| Single Male/Father | 38 (15.8%) | 2.08 |
| Single Female/Mother | 144 (60.0%) | 4.26 |
| Total Families | 240 (100.0%) | 3.75 |
Median Household Size in Skyline Acres
The median household size in Skyline Acres is 2.77 persons per household, with single female/mother households (144 | 33.6%) accounting for the largest median household size of 4.61 persons per household. non-family households (189 | 44.1%) represent the smallest median household size with 1.25 persons per household.
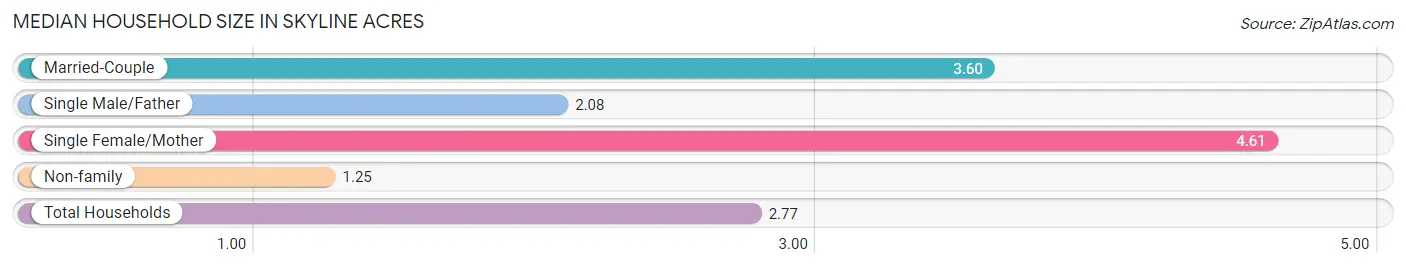
| Household Type | # Households | Household Size |
| Married-Couple | 58 (13.5%) | 3.60 |
| Single Male/Father | 38 (8.9%) | 2.08 |
| Single Female/Mother | 144 (33.6%) | 4.61 |
| Non-family | 189 (44.1%) | 1.25 |
| Total Households | 429 (100.0%) | 2.77 |
Household Size by Marriage Status in Skyline Acres
Out of a total of 429 households in Skyline Acres, 240 (55.9%) are family households, while 189 (44.1%) are nonfamily households. The most numerous type of family households are 4-person households, comprising 110, and the most common type of nonfamily households are 1-person households, comprising 145.
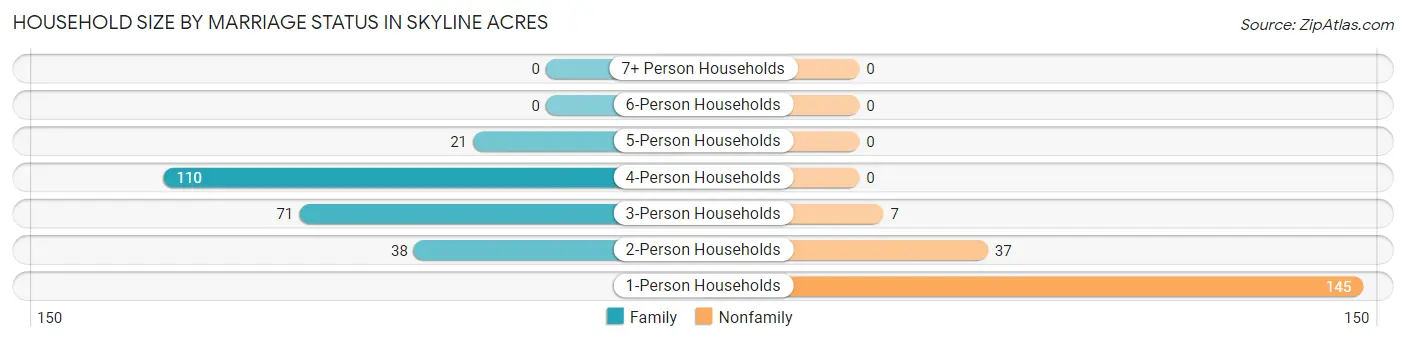
| Household Size | Family Households | Nonfamily Households |
| 1-Person Households | - | 145 (33.8%) |
| 2-Person Households | 38 (8.9%) | 37 (8.6%) |
| 3-Person Households | 71 (16.6%) | 7 (1.6%) |
| 4-Person Households | 110 (25.6%) | 0 (0.0%) |
| 5-Person Households | 21 (4.9%) | 0 (0.0%) |
| 6-Person Households | 0 (0.0%) | 0 (0.0%) |
| 7+ Person Households | 0 (0.0%) | 0 (0.0%) |
| Total | 240 (55.9%) | 189 (44.1%) |
Female Fertility in Skyline Acres
Fertility by Age in Skyline Acres
Average fertility rate in Skyline Acres is 132.0 births per 1,000 women. Women in the age bracket of 20 to 34 years have the highest fertility rate with 241.0 births per 1,000 women. Women in the age bracket of 35 to 50 years acount for 60.0% of all women with births.
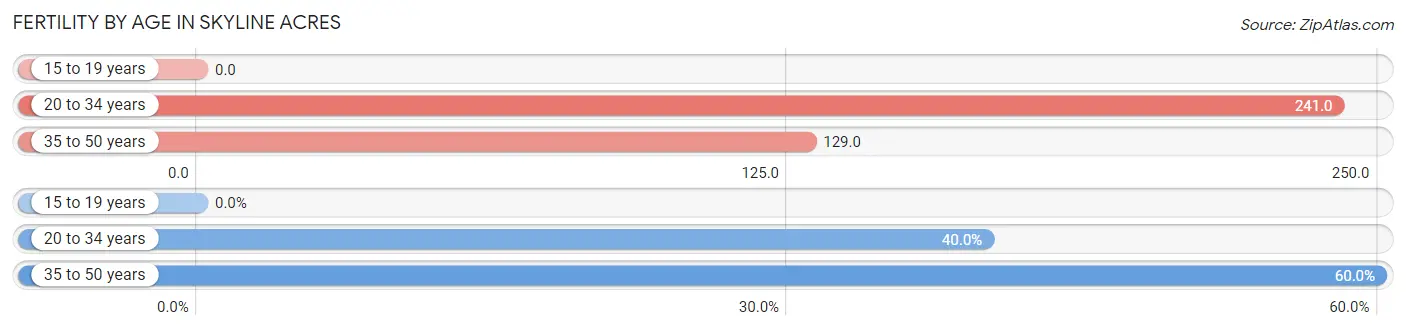
| Age Bracket | Women with Births | Births / 1,000 Women |
| 15 to 19 years | 0 (0.0%) | 0.0 |
| 20 to 34 years | 14 (40.0%) | 241.0 |
| 35 to 50 years | 21 (60.0%) | 129.0 |
| Total | 35 (100.0%) | 132.0 |
Fertility by Age by Marriage Status in Skyline Acres
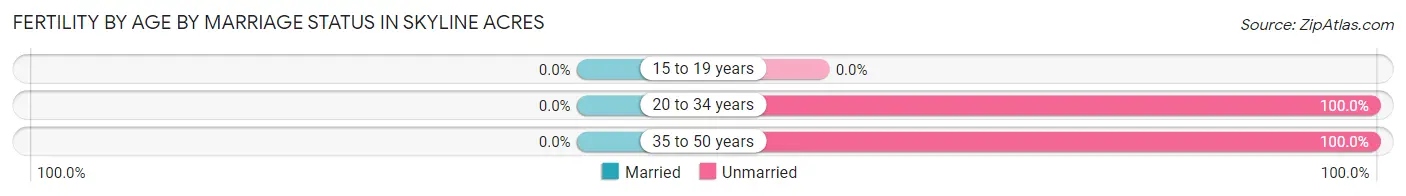
| Age Bracket | Married | Unmarried |
| 15 to 19 years | 0 (0.0%) | 0 (0.0%) |
| 20 to 34 years | 0 (0.0%) | 14 (100.0%) |
| 35 to 50 years | 0 (0.0%) | 21 (100.0%) |
| Total | 0 (0.0%) | 35 (100.0%) |
Fertility by Education in Skyline Acres
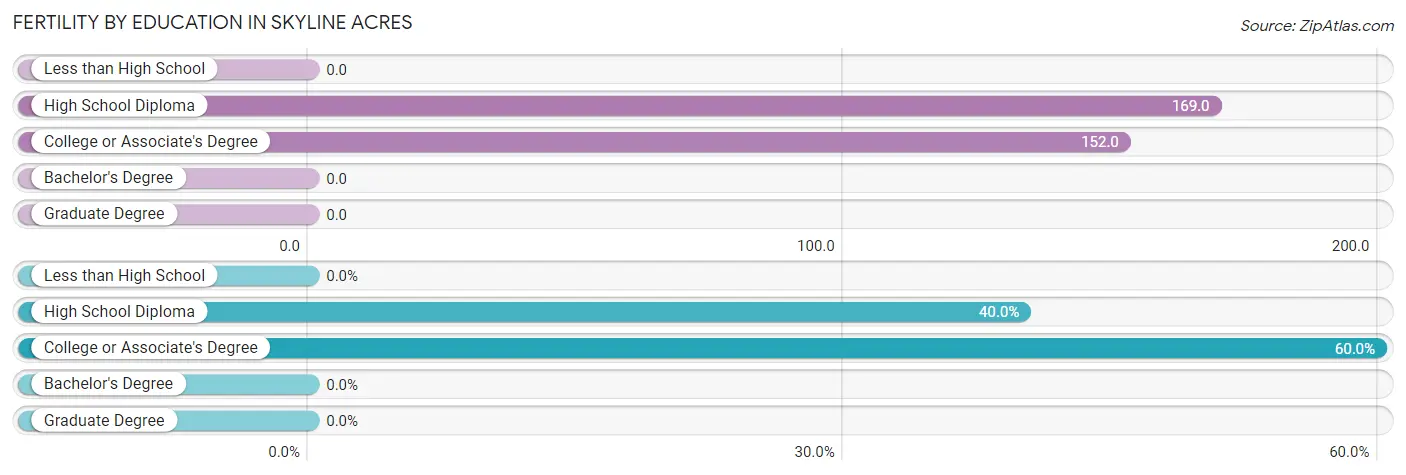
| Educational Attainment | Women with Births | Births / 1,000 Women |
| Less than High School | 0 (0.0%) | 0.0 |
| High School Diploma | 14 (40.0%) | 169.0 |
| College or Associate's Degree | 21 (60.0%) | 152.0 |
| Bachelor's Degree | 0 (0.0%) | 0.0 |
| Graduate Degree | 0 (0.0%) | 0.0 |
| Total | 35 (100.0%) | 132.0 |
Fertility by Education by Marriage Status in Skyline Acres
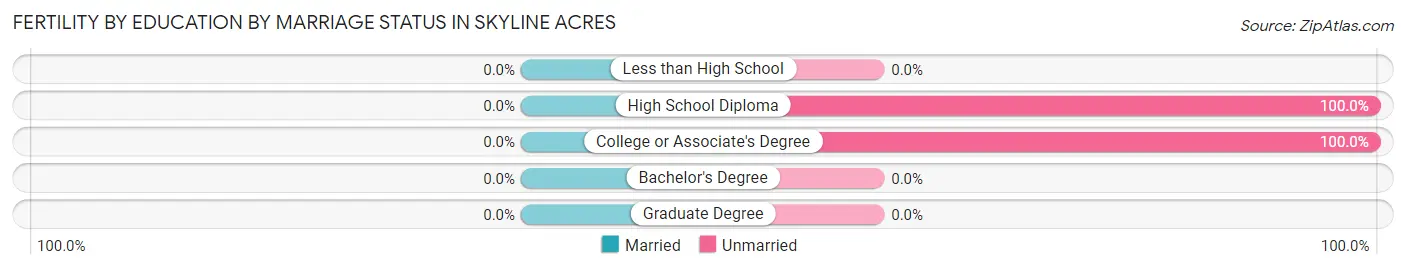
| Educational Attainment | Married | Unmarried |
| Less than High School | 0 (0.0%) | 0 (0.0%) |
| High School Diploma | 0 (0.0%) | 14 (100.0%) |
| College or Associate's Degree | 0 (0.0%) | 21 (100.0%) |
| Bachelor's Degree | 0 (0.0%) | 0 (0.0%) |
| Graduate Degree | 0 (0.0%) | 0 (0.0%) |
| Total | 0 (0.0%) | 35 (100.0%) |
Income in Skyline Acres
Income Overview in Skyline Acres
| Characteristic | Number | Measure |
| Per Capita Income | 1,189 | $23,834 |
| Median Family Income | 240 | $38,864 |
| Mean Family Income | 240 | $52,361 |
| Median Household Income | 429 | $0 |
| Mean Household Income | 429 | $62,519 |
| Income Deficit | 240 | $0 |
| Wage / Income Gap (%) | 1,189 | 0.00% |
| Wage / Income Gap ($) | 1,189 | 100.00¢ per $1 |
| Gini / Inequality Index | 1,189 | 0.44 |
Earnings by Sex in Skyline Acres
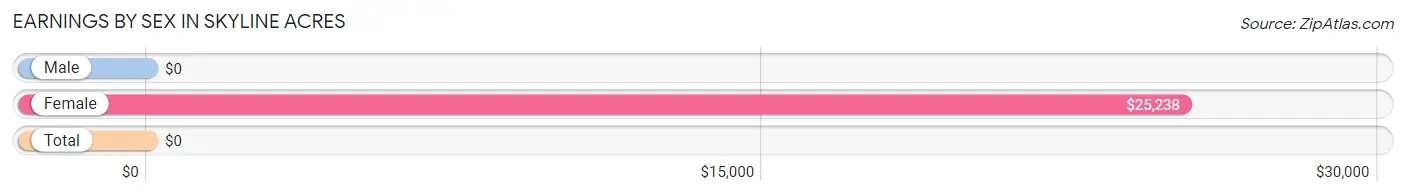
| Sex | Number | Average Earnings |
| Male | 236 (44.5%) | $0 |
| Female | 294 (55.5%) | $25,238 |
| Total | 530 (100.0%) | $0 |
Earnings by Sex by Income Bracket in Skyline Acres
The most common earnings brackets in Skyline Acres are $7,500 to $9,999 for men (73 | 30.9%) and $5,000 to $7,499 for women (70 | 23.8%).
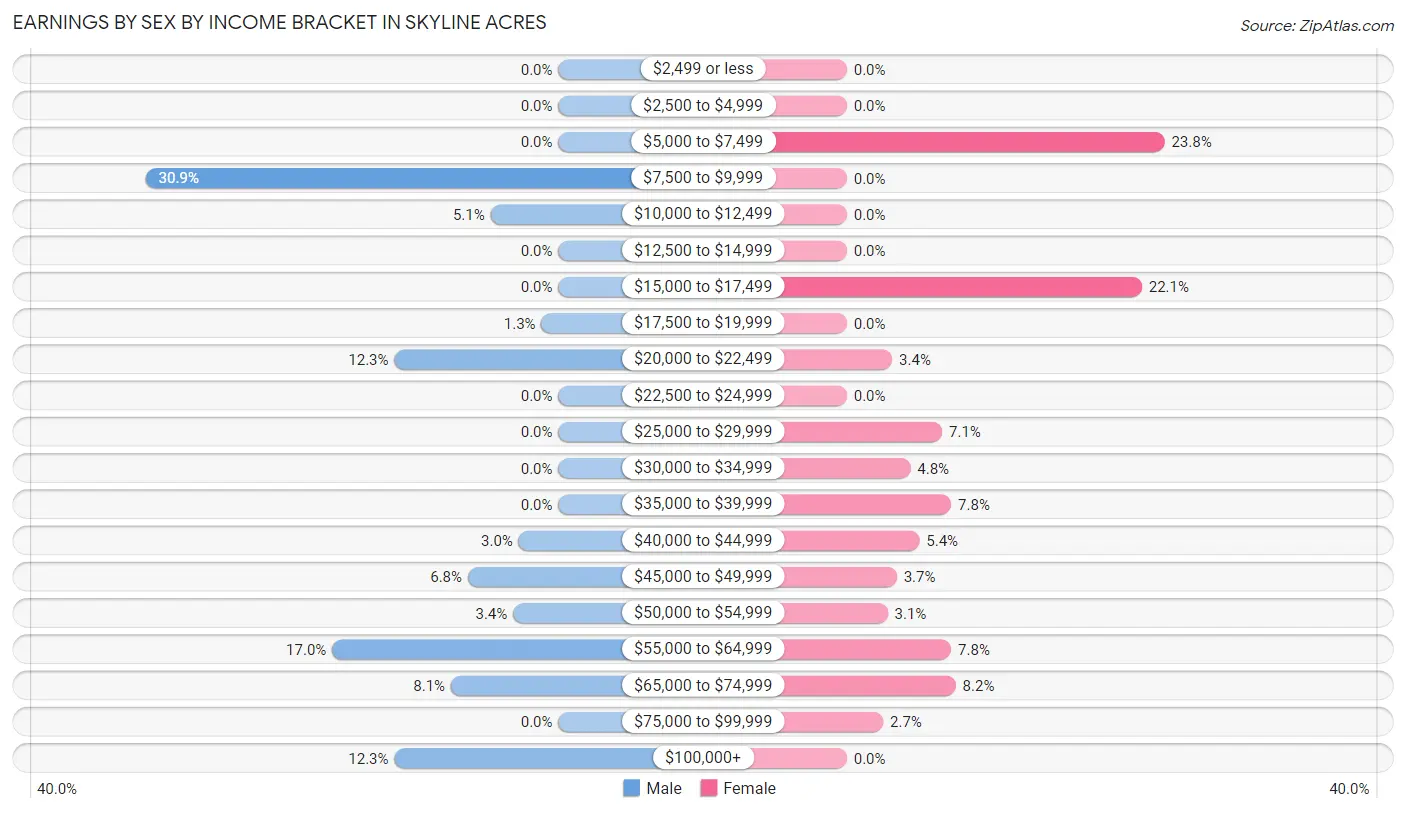
| Income | Male | Female |
| $2,499 or less | 0 (0.0%) | 0 (0.0%) |
| $2,500 to $4,999 | 0 (0.0%) | 0 (0.0%) |
| $5,000 to $7,499 | 0 (0.0%) | 70 (23.8%) |
| $7,500 to $9,999 | 73 (30.9%) | 0 (0.0%) |
| $10,000 to $12,499 | 12 (5.1%) | 0 (0.0%) |
| $12,500 to $14,999 | 0 (0.0%) | 0 (0.0%) |
| $15,000 to $17,499 | 0 (0.0%) | 65 (22.1%) |
| $17,500 to $19,999 | 3 (1.3%) | 0 (0.0%) |
| $20,000 to $22,499 | 29 (12.3%) | 10 (3.4%) |
| $22,500 to $24,999 | 0 (0.0%) | 0 (0.0%) |
| $25,000 to $29,999 | 0 (0.0%) | 21 (7.1%) |
| $30,000 to $34,999 | 0 (0.0%) | 14 (4.8%) |
| $35,000 to $39,999 | 0 (0.0%) | 23 (7.8%) |
| $40,000 to $44,999 | 7 (3.0%) | 16 (5.4%) |
| $45,000 to $49,999 | 16 (6.8%) | 11 (3.7%) |
| $50,000 to $54,999 | 8 (3.4%) | 9 (3.1%) |
| $55,000 to $64,999 | 40 (17.0%) | 23 (7.8%) |
| $65,000 to $74,999 | 19 (8.1%) | 24 (8.2%) |
| $75,000 to $99,999 | 0 (0.0%) | 8 (2.7%) |
| $100,000+ | 29 (12.3%) | 0 (0.0%) |
| Total | 236 (100.0%) | 294 (100.0%) |
Earnings by Sex by Educational Attainment in Skyline Acres
Average earnings in Skyline Acres are $55,656 for men and $27,024 for women, a difference of 51.4%. Men with an educational attainment of college or associate's degree enjoy the highest average annual earnings of $56,250, while those with college or associate's degree education earn the least with $56,250. Women with an educational attainment of college or associate's degree earn the most with the average annual earnings of $21,500, while those with college or associate's degree education have the smallest earnings of $21,500.
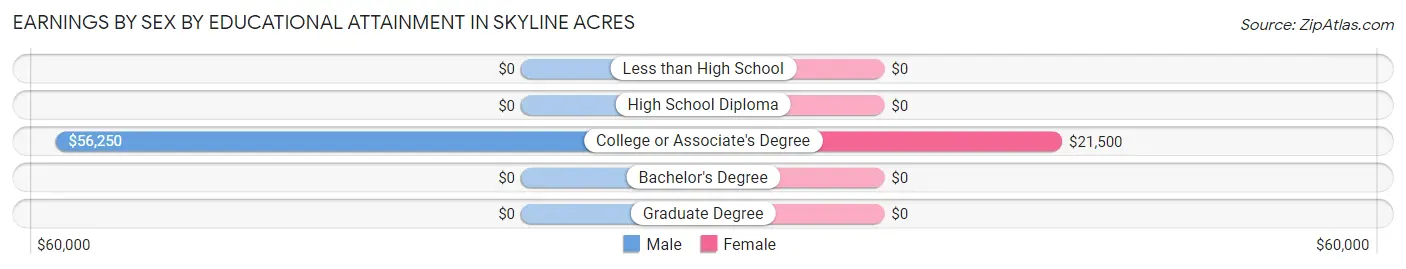
| Educational Attainment | Male Income | Female Income |
| Less than High School | - | - |
| High School Diploma | - | - |
| College or Associate's Degree | $56,250 | $21,500 |
| Bachelor's Degree | - | - |
| Graduate Degree | - | - |
| Total | $55,656 | $27,024 |
Family Income in Skyline Acres
Family Income Brackets in Skyline Acres
According to the Skyline Acres family income data, there are 76 families falling into the $15,000 to $24,999 income range, which is the most common income bracket and makes up 31.7% of all families.
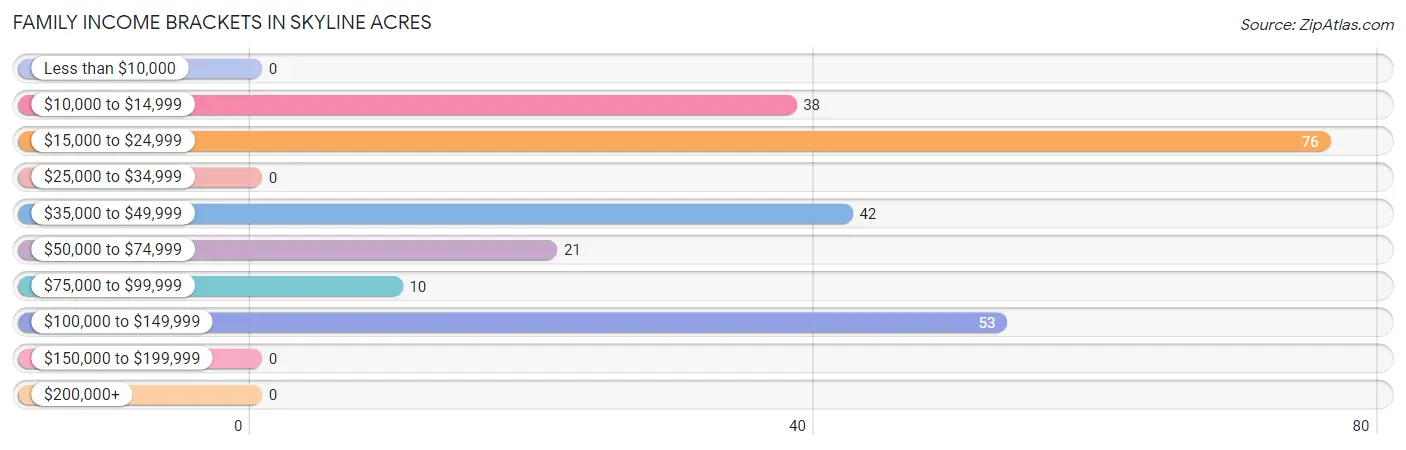
| Income Bracket | # Families | % Families |
| Less than $10,000 | 0 | 0.0% |
| $10,000 to $14,999 | 38 | 15.8% |
| $15,000 to $24,999 | 76 | 31.7% |
| $25,000 to $34,999 | 0 | 0.0% |
| $35,000 to $49,999 | 42 | 17.5% |
| $50,000 to $74,999 | 21 | 8.8% |
| $75,000 to $99,999 | 10 | 4.2% |
| $100,000 to $149,999 | 53 | 22.1% |
| $150,000 to $199,999 | 0 | 0.0% |
| $200,000+ | 0 | 0.0% |
Family Income by Famaliy Size in Skyline Acres
3-person families (114 | 47.5%) account for the highest median family income in Skyline Acres with $50,119 per family, while 3-person families (114 | 47.5%) have the highest median income of $16,706 per family member.
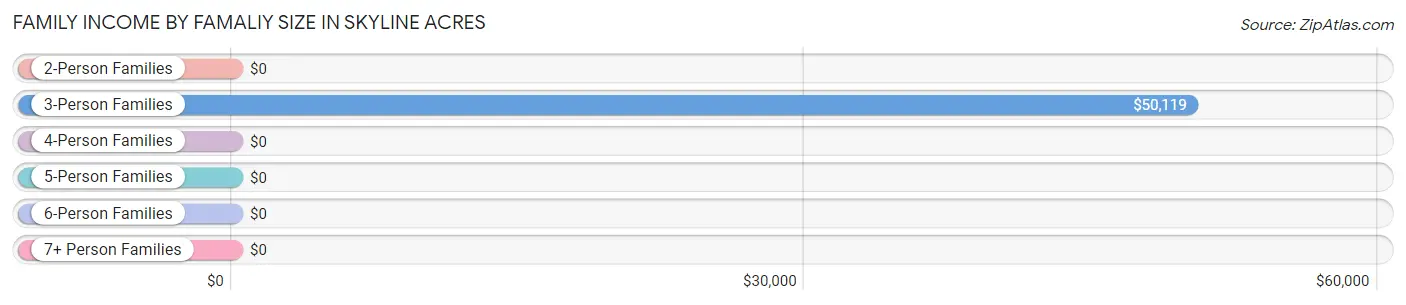
| Income Bracket | # Families | Median Income |
| 2-Person Families | 38 (15.8%) | $0 |
| 3-Person Families | 114 (47.5%) | $50,119 |
| 4-Person Families | 67 (27.9%) | $0 |
| 5-Person Families | 21 (8.7%) | $0 |
| 6-Person Families | 0 (0.0%) | $0 |
| 7+ Person Families | 0 (0.0%) | $0 |
| Total | 240 (100.0%) | $38,864 |
Family Income by Number of Earners in Skyline Acres
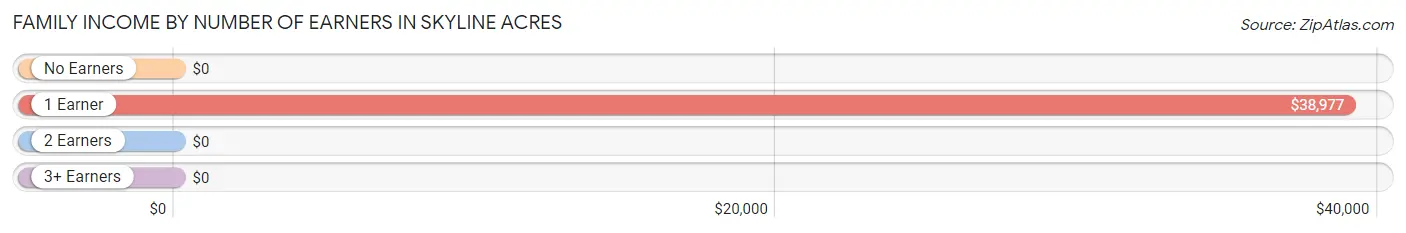
| Number of Earners | # Families | Median Income |
| No Earners | 52 (21.7%) | $0 |
| 1 Earner | 55 (22.9%) | $38,977 |
| 2 Earners | 122 (50.8%) | $0 |
| 3+ Earners | 11 (4.6%) | $0 |
| Total | 240 (100.0%) | $38,864 |
Household Income in Skyline Acres
Household Income Brackets in Skyline Acres
With 180 households falling in the category, the $15,000 to $24,999 income range is the most frequent in Skyline Acres, accounting for 42.0% of all households.
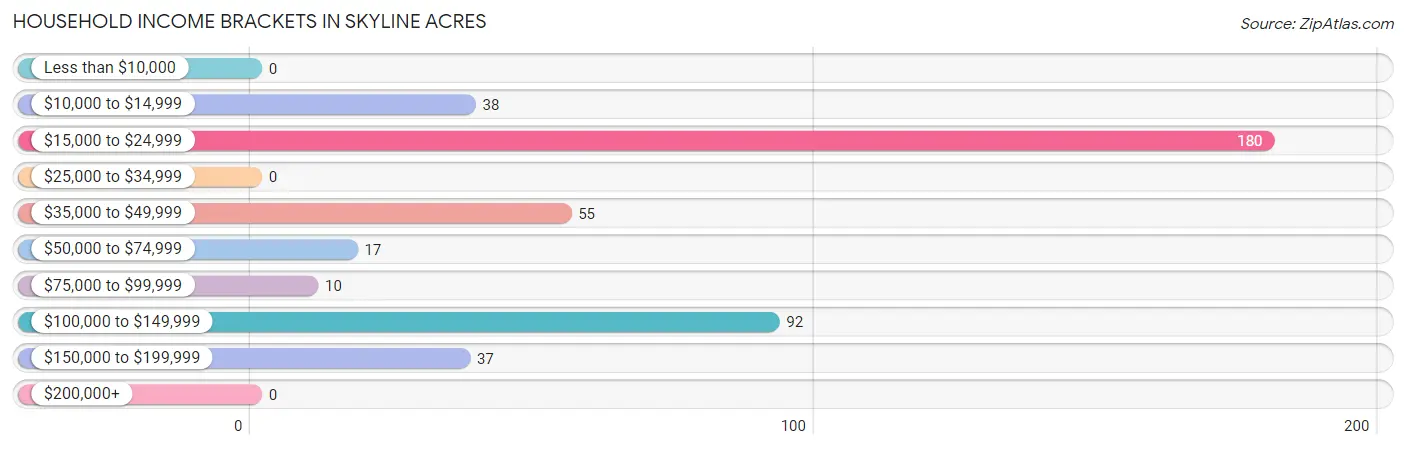
| Income Bracket | # Households | % Households |
| Less than $10,000 | 0 | 0.0% |
| $10,000 to $14,999 | 38 | 8.9% |
| $15,000 to $24,999 | 180 | 42.0% |
| $25,000 to $34,999 | 0 | 0.0% |
| $35,000 to $49,999 | 55 | 12.8% |
| $50,000 to $74,999 | 17 | 4.0% |
| $75,000 to $99,999 | 10 | 2.3% |
| $100,000 to $149,999 | 92 | 21.4% |
| $150,000 to $199,999 | 37 | 8.6% |
| $200,000+ | 0 | 0.0% |
Household Income by Householder Age in Skyline Acres
The median household income in Skyline Acres is $0, with the highest median household income of $121,250 found in the 45 to 64 years age bracket for the primary householder. A total of 132 households (30.8%) fall into this category.
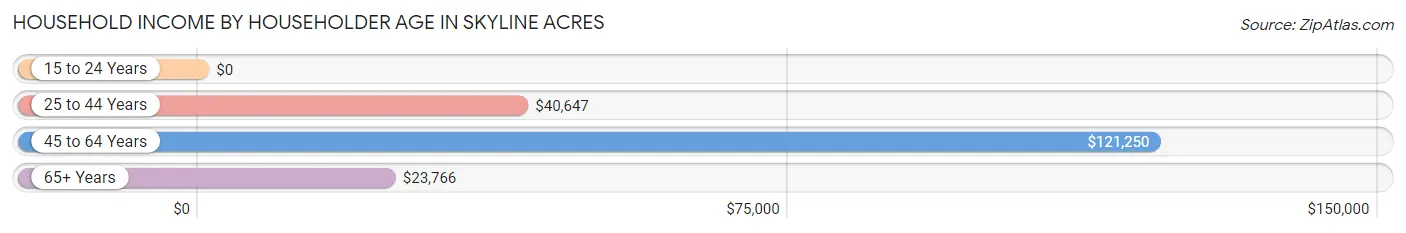
| Income Bracket | # Households | Median Income |
| 15 to 24 Years | 0 (0.0%) | $0 |
| 25 to 44 Years | 139 (32.4%) | $40,647 |
| 45 to 64 Years | 132 (30.8%) | $121,250 |
| 65+ Years | 158 (36.8%) | $23,766 |
| Total | 429 (100.0%) | $0 |
Poverty in Skyline Acres
Income Below Poverty by Sex and Age in Skyline Acres
With 43.9% poverty level for males and 31.3% for females among the residents of Skyline Acres, under 5 year old males and under 5 year old females are the most vulnerable to poverty, with 24 males (100.0%) and 23 females (100.0%) in their respective age groups living below the poverty level.
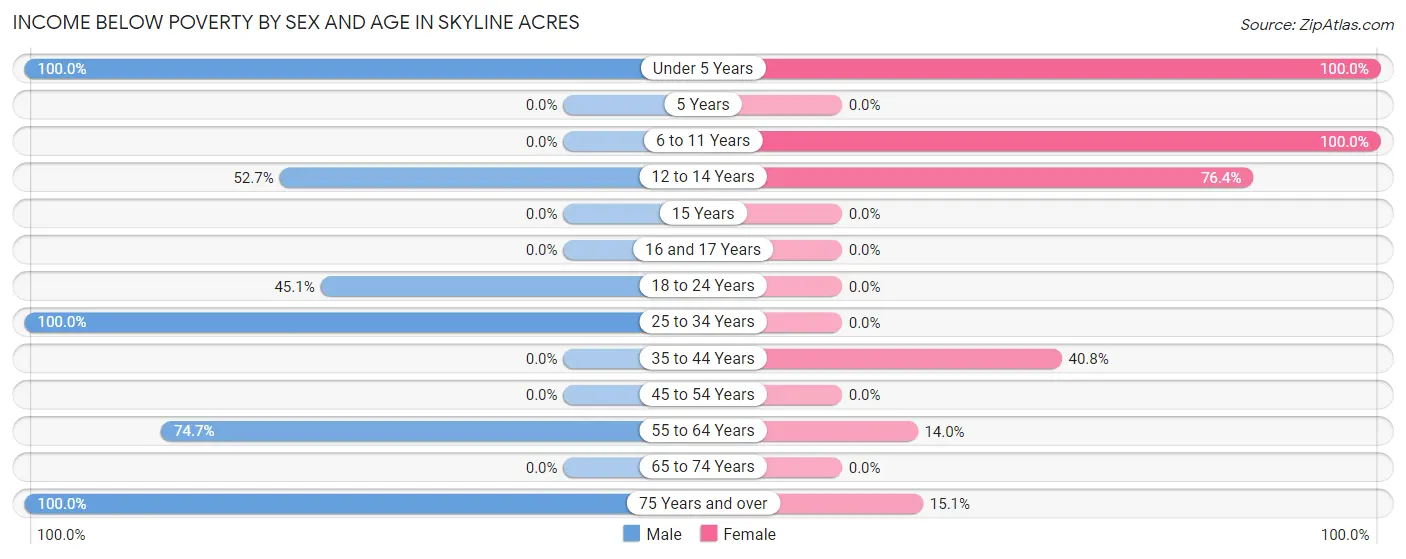
| Age Bracket | Male | Female |
| Under 5 Years | 24 (100.0%) | 23 (100.0%) |
| 5 Years | 0 (0.0%) | 0 (0.0%) |
| 6 to 11 Years | 0 (0.0%) | 42 (100.0%) |
| 12 to 14 Years | 49 (52.7%) | 42 (76.4%) |
| 15 Years | 0 (0.0%) | 0 (0.0%) |
| 16 and 17 Years | 0 (0.0%) | 0 (0.0%) |
| 18 to 24 Years | 55 (45.1%) | 0 (0.0%) |
| 25 to 34 Years | 18 (100.0%) | 0 (0.0%) |
| 35 to 44 Years | 0 (0.0%) | 62 (40.8%) |
| 45 to 54 Years | 0 (0.0%) | 0 (0.0%) |
| 55 to 64 Years | 53 (74.7%) | 8 (14.0%) |
| 65 to 74 Years | 0 (0.0%) | 0 (0.0%) |
| 75 Years and over | 55 (100.0%) | 14 (15.0%) |
| Total | 254 (43.9%) | 191 (31.3%) |
Income Above Poverty by Sex and Age in Skyline Acres
According to the poverty statistics in Skyline Acres, males aged 16 and 17 years and females aged 15 years are the age groups that are most secure financially, with 100.0% of males and 100.0% of females in these age groups living above the poverty line.
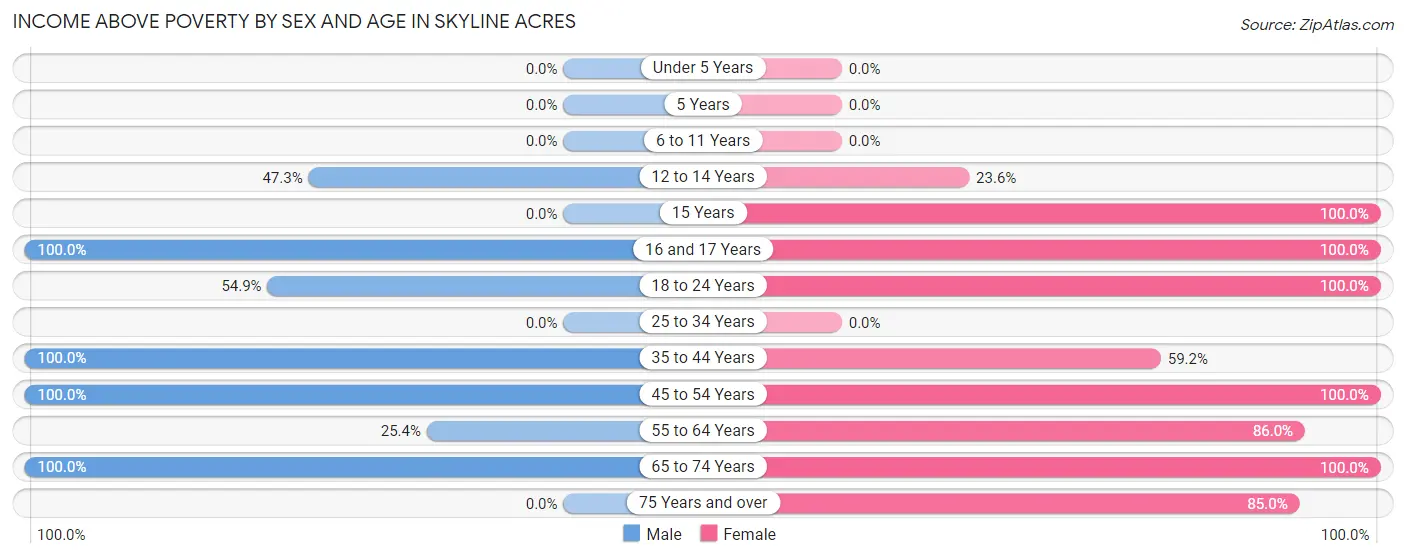
| Age Bracket | Male | Female |
| Under 5 Years | 0 (0.0%) | 0 (0.0%) |
| 5 Years | 0 (0.0%) | 0 (0.0%) |
| 6 to 11 Years | 0 (0.0%) | 0 (0.0%) |
| 12 to 14 Years | 44 (47.3%) | 13 (23.6%) |
| 15 Years | 0 (0.0%) | 12 (100.0%) |
| 16 and 17 Years | 45 (100.0%) | 33 (100.0%) |
| 18 to 24 Years | 67 (54.9%) | 58 (100.0%) |
| 25 to 34 Years | 0 (0.0%) | 0 (0.0%) |
| 35 to 44 Years | 33 (100.0%) | 90 (59.2%) |
| 45 to 54 Years | 83 (100.0%) | 50 (100.0%) |
| 55 to 64 Years | 18 (25.4%) | 49 (86.0%) |
| 65 to 74 Years | 34 (100.0%) | 36 (100.0%) |
| 75 Years and over | 0 (0.0%) | 79 (85.0%) |
| Total | 324 (56.1%) | 420 (68.7%) |
Income Below Poverty Among Married-Couple Families in Skyline Acres
The poverty statistics for married-couple families in Skyline Acres show that 24.1% or 14 of the total 58 families live below the poverty line. Families with no children have the highest poverty rate of 53.8%, comprising of 14 families. On the other hand, families with 1 or 2 children have the lowest poverty rate of 0.0%, which includes 0 families.

| Children | Above Poverty | Below Poverty |
| No Children | 12 (46.2%) | 14 (53.8%) |
| 1 or 2 Children | 32 (100.0%) | 0 (0.0%) |
| 3 or 4 Children | 0 (0.0%) | 0 (0.0%) |
| 5 or more Children | 0 (0.0%) | 0 (0.0%) |
| Total | 44 (75.9%) | 14 (24.1%) |
Income Below Poverty Among Single-Parent Households in Skyline Acres
According to the poverty data in Skyline Acres, 100.0% or 38 single-father households and 43.1% or 62 single-mother households are living below the poverty line. Among single-father households, those with no children have the highest poverty rate, with 38 households (100.0%) experiencing poverty. Likewise, among single-mother households, those with 3 or 4 children have the highest poverty rate, with 21 households (100.0%) falling below the poverty line.
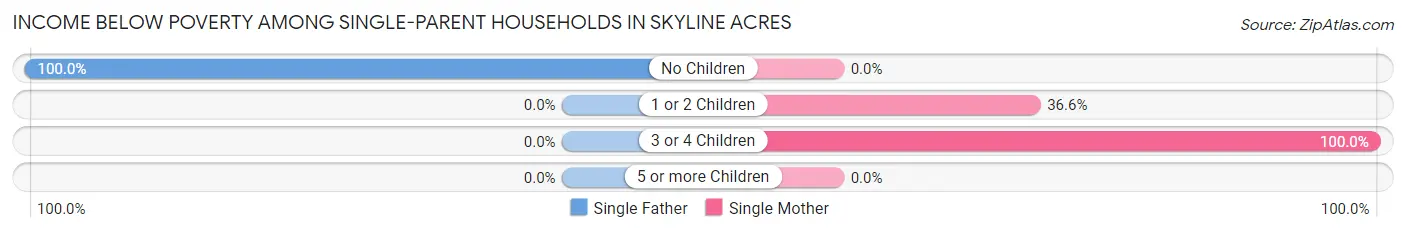
| Children | Single Father | Single Mother |
| No Children | 38 (100.0%) | 0 (0.0%) |
| 1 or 2 Children | 0 (0.0%) | 41 (36.6%) |
| 3 or 4 Children | 0 (0.0%) | 21 (100.0%) |
| 5 or more Children | 0 (0.0%) | 0 (0.0%) |
| Total | 38 (100.0%) | 62 (43.1%) |
Income Below Poverty Among Married-Couple vs Single-Parent Households in Skyline Acres
The poverty data for Skyline Acres shows that 14 of the married-couple family households (24.1%) and 100 of the single-parent households (54.9%) are living below the poverty level. Within the married-couple family households, those with no children have the highest poverty rate, with 14 households (53.8%) falling below the poverty line. Among the single-parent households, those with 3 or 4 children have the highest poverty rate, with 21 household (100.0%) living below poverty.
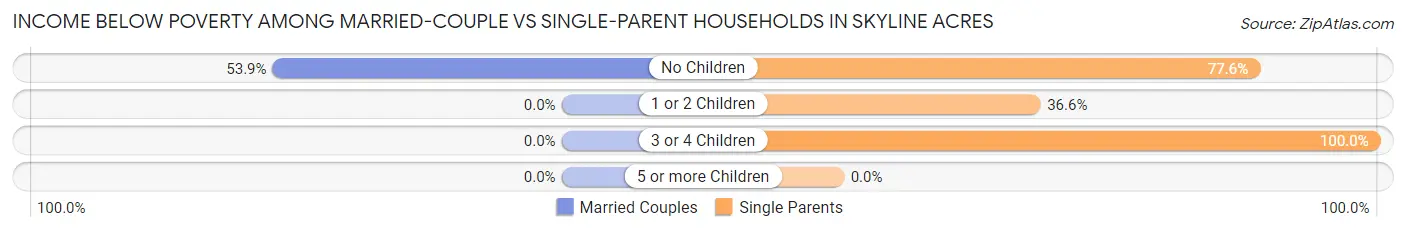
| Children | Married-Couple Families | Single-Parent Households |
| No Children | 14 (53.8%) | 38 (77.5%) |
| 1 or 2 Children | 0 (0.0%) | 41 (36.6%) |
| 3 or 4 Children | 0 (0.0%) | 21 (100.0%) |
| 5 or more Children | 0 (0.0%) | 0 (0.0%) |
| Total | 14 (24.1%) | 100 (54.9%) |
Employment Characteristics in Skyline Acres
Employment by Class of Employer in Skyline Acres
Among the 463 employed individuals in Skyline Acres, private company employees (330 | 71.3%), self-employed (incorporated) (65 | 14.0%), and local government employees (29 | 6.3%) make up the most common classes of employment.
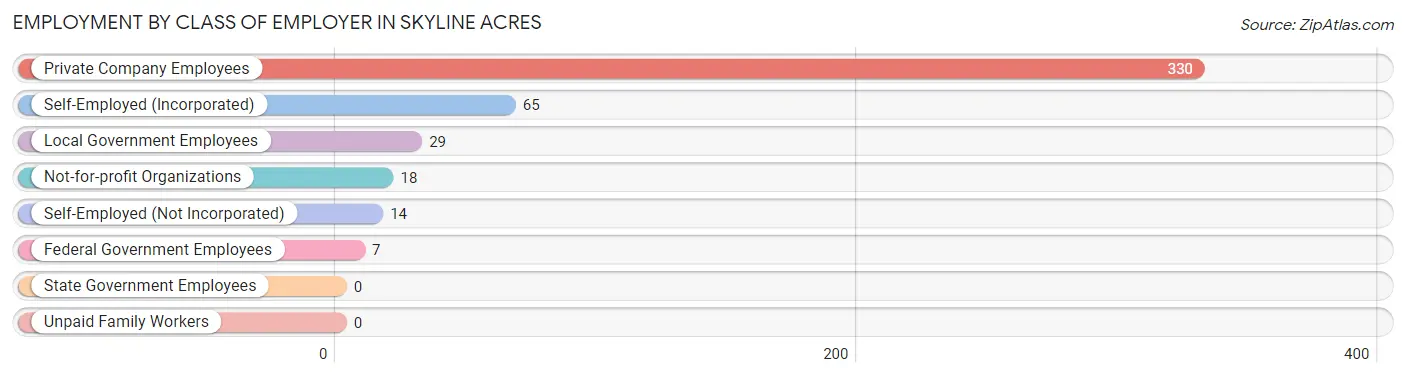
| Employer Class | # Employees | % Employees |
| Private Company Employees | 330 | 71.3% |
| Self-Employed (Incorporated) | 65 | 14.0% |
| Self-Employed (Not Incorporated) | 14 | 3.0% |
| Not-for-profit Organizations | 18 | 3.9% |
| Local Government Employees | 29 | 6.3% |
| State Government Employees | 0 | 0.0% |
| Federal Government Employees | 7 | 1.5% |
| Unpaid Family Workers | 0 | 0.0% |
| Total | 463 | 100.0% |
Employment Status by Age in Skyline Acres
According to the labor force statistics for Skyline Acres, out of the total population over 16 years of age (940), 50.6% or 476 individuals are in the labor force, with 2.7% or 13 of them unemployed. The age group with the highest labor force participation rate is 25 to 29 years, with 100.0% or 18 individuals in the labor force. Within the labor force, the 35 to 44 years age range has the highest percentage of unemployed individuals, with 7.5% or 13 of them being unemployed.
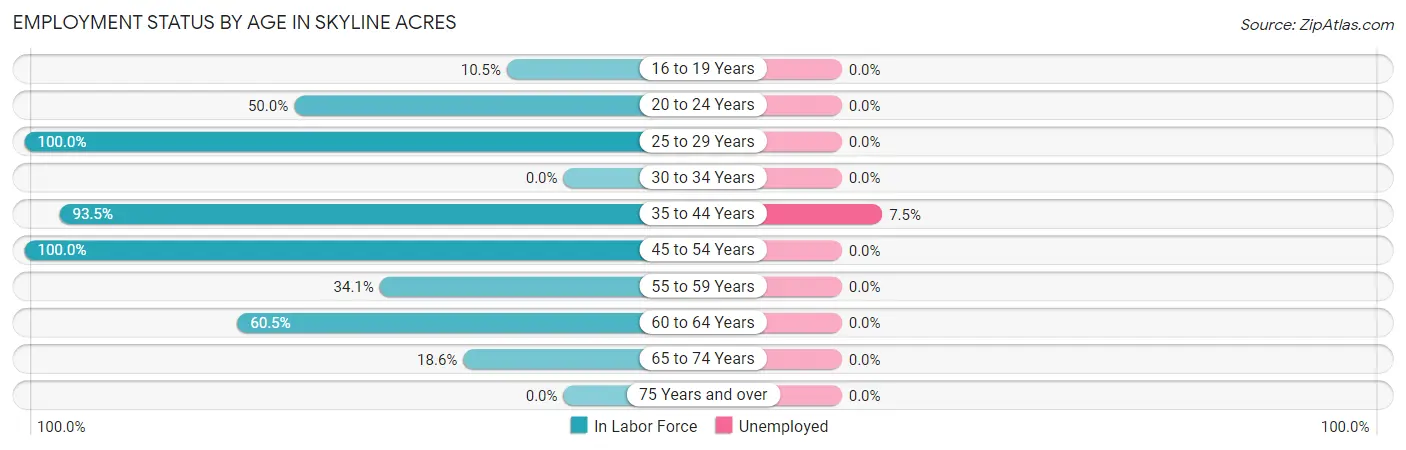
| Age Bracket | In Labor Force | Unemployed |
| 16 to 19 Years | 12 (10.5%) | 0 (0.0%) |
| 20 to 24 Years | 72 (50.0%) | 0 (0.0%) |
| 25 to 29 Years | 18 (100.0%) | 0 (0.0%) |
| 30 to 34 Years | 0 (0.0%) | 0 (0.0%) |
| 35 to 44 Years | 173 (93.5%) | 13 (7.5%) |
| 45 to 54 Years | 133 (100.0%) | 0 (0.0%) |
| 55 to 59 Years | 29 (34.1%) | 0 (0.0%) |
| 60 to 64 Years | 26 (60.5%) | 0 (0.0%) |
| 65 to 74 Years | 13 (18.6%) | 0 (0.0%) |
| 75 Years and over | 0 (0.0%) | 0 (0.0%) |
| Total | 476 (50.6%) | 13 (2.7%) |
Employment Status by Educational Attainment in Skyline Acres
According to labor force statistics for Skyline Acres, 81.7% of individuals (379) out of the total population between 25 and 64 years of age (464) are in the labor force, with 3.4% or 13 of them being unemployed. The group with the highest labor force participation rate are those with the educational attainment of bachelor's degree or higher, with 100.0% or 52 individuals in the labor force. Within the labor force, individuals with high school diploma education have the highest percentage of unemployment, with 9.6% or 13 of them being unemployed.
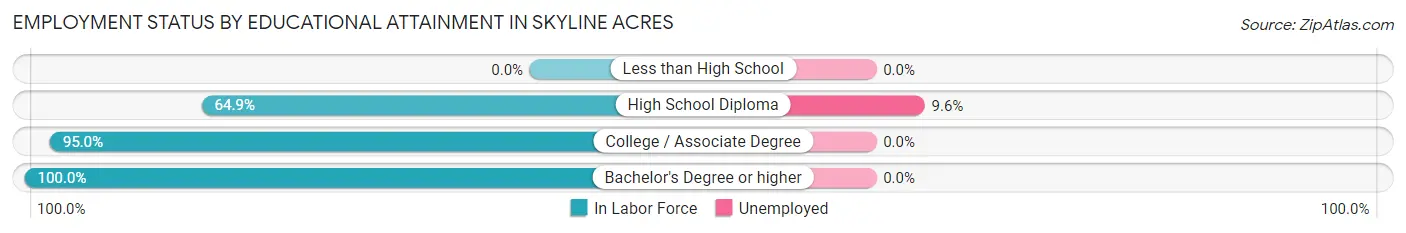
| Educational Attainment | In Labor Force | Unemployed |
| Less than High School | 0 (0.0%) | 0 (0.0%) |
| High School Diploma | 135 (64.9%) | 20 (9.6%) |
| College / Associate Degree | 192 (95.0%) | 0 (0.0%) |
| Bachelor's Degree or higher | 52 (100.0%) | 0 (0.0%) |
| Total | 379 (81.7%) | 16 (3.4%) |
Employment Occupations by Sex in Skyline Acres
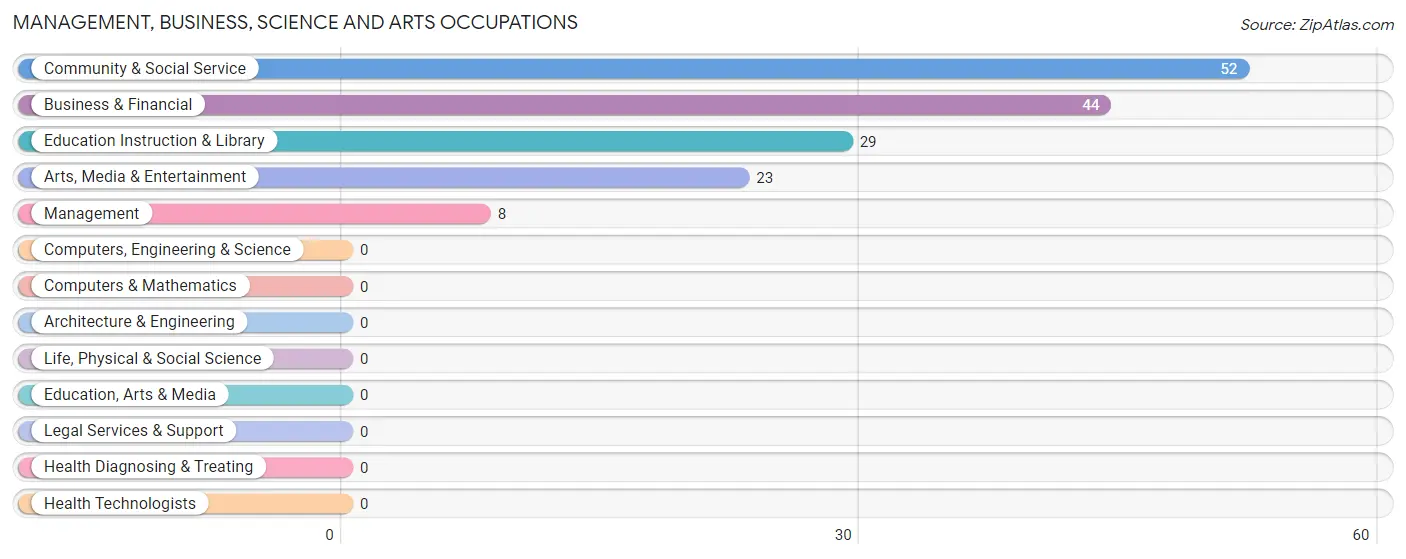
Management, Business, Science and Arts Occupations
The most common Management, Business, Science and Arts occupations in Skyline Acres are Community & Social Service (52 | 11.2%), Business & Financial (44 | 9.5%), Education Instruction & Library (29 | 6.3%), Arts, Media & Entertainment (23 | 5.0%), and Management (8 | 1.7%).
Management, Business, Science and Arts Occupations by Sex
Within the Management, Business, Science and Arts occupations in Skyline Acres, the most male-oriented occupations are Education Instruction & Library (100.0%), and Community & Social Service (55.8%), while the most female-oriented occupations are Management (100.0%), Business & Financial (100.0%), and Arts, Media & Entertainment (100.0%).
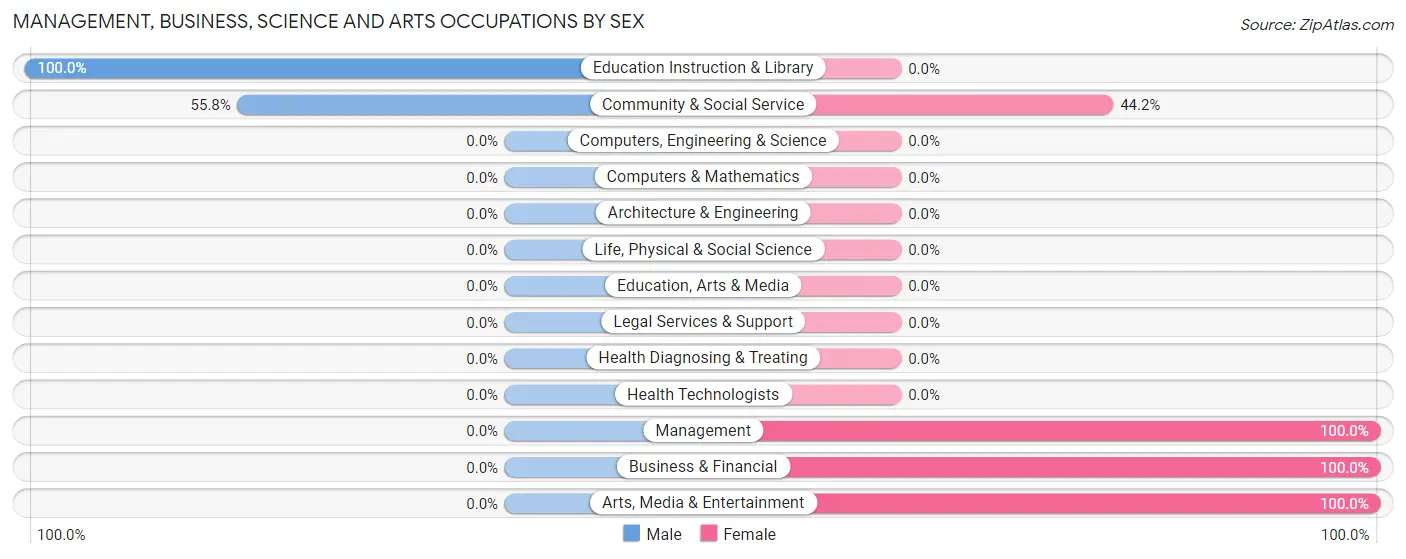
| Occupation | Male | Female |
| Management | 0 (0.0%) | 8 (100.0%) |
| Business & Financial | 0 (0.0%) | 44 (100.0%) |
| Computers, Engineering & Science | 0 (0.0%) | 0 (0.0%) |
| Computers & Mathematics | 0 (0.0%) | 0 (0.0%) |
| Architecture & Engineering | 0 (0.0%) | 0 (0.0%) |
| Life, Physical & Social Science | 0 (0.0%) | 0 (0.0%) |
| Community & Social Service | 29 (55.8%) | 23 (44.2%) |
| Education, Arts & Media | 0 (0.0%) | 0 (0.0%) |
| Legal Services & Support | 0 (0.0%) | 0 (0.0%) |
| Education Instruction & Library | 29 (100.0%) | 0 (0.0%) |
| Arts, Media & Entertainment | 0 (0.0%) | 23 (100.0%) |
| Health Diagnosing & Treating | 0 (0.0%) | 0 (0.0%) |
| Health Technologists | 0 (0.0%) | 0 (0.0%) |
| Total (Category) | 29 (27.9%) | 75 (72.1%) |
| Total (Overall) | 169 (36.5%) | 294 (63.5%) |
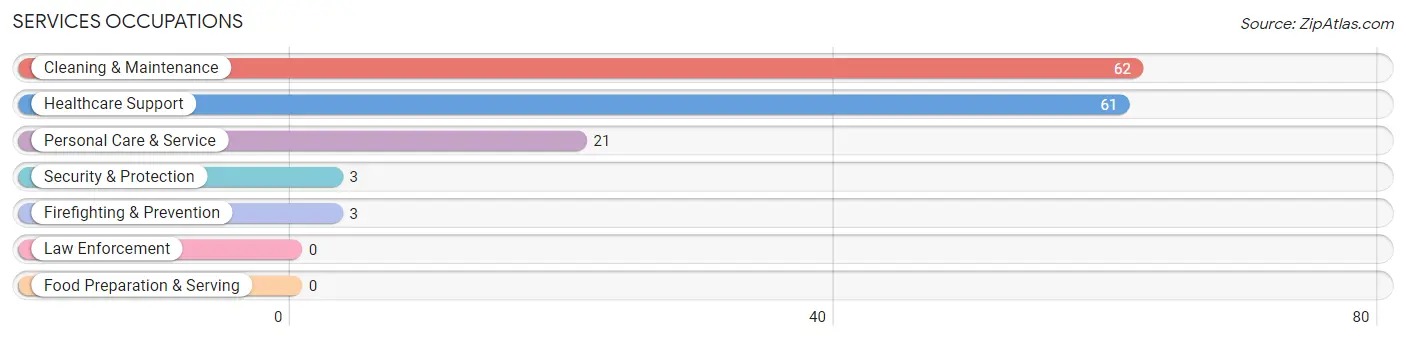
Services Occupations
The most common Services occupations in Skyline Acres are Cleaning & Maintenance (62 | 13.4%), Healthcare Support (61 | 13.2%), Personal Care & Service (21 | 4.5%), Security & Protection (3 | 0.6%), and Firefighting & Prevention (3 | 0.6%).
Services Occupations by Sex
Within the Services occupations in Skyline Acres, the most male-oriented occupations are Security & Protection (100.0%), Firefighting & Prevention (100.0%), and Cleaning & Maintenance (11.3%), while the most female-oriented occupations are Healthcare Support (100.0%), Personal Care & Service (100.0%), and Cleaning & Maintenance (88.7%).
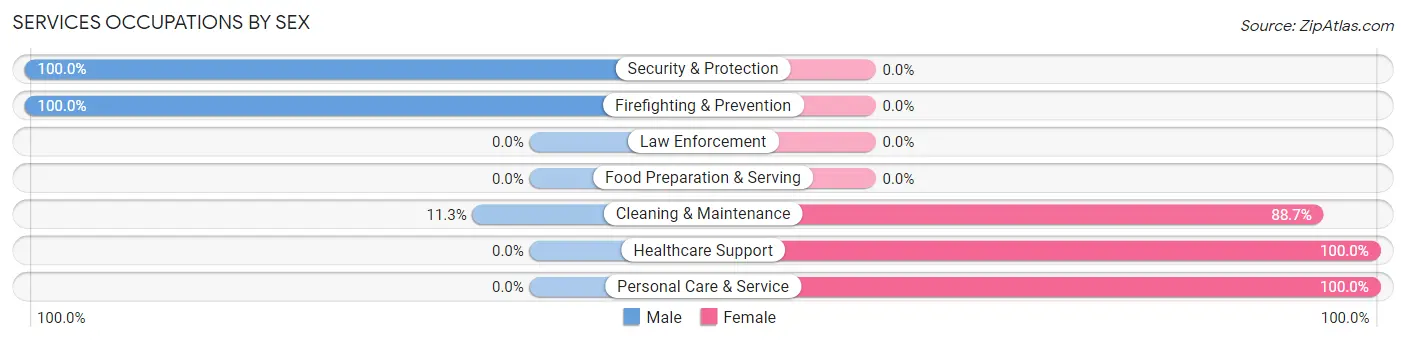
| Occupation | Male | Female |
| Healthcare Support | 0 (0.0%) | 61 (100.0%) |
| Security & Protection | 3 (100.0%) | 0 (0.0%) |
| Firefighting & Prevention | 3 (100.0%) | 0 (0.0%) |
| Law Enforcement | 0 (0.0%) | 0 (0.0%) |
| Food Preparation & Serving | 0 (0.0%) | 0 (0.0%) |
| Cleaning & Maintenance | 7 (11.3%) | 55 (88.7%) |
| Personal Care & Service | 0 (0.0%) | 21 (100.0%) |
| Total (Category) | 10 (6.8%) | 137 (93.2%) |
| Total (Overall) | 169 (36.5%) | 294 (63.5%) |
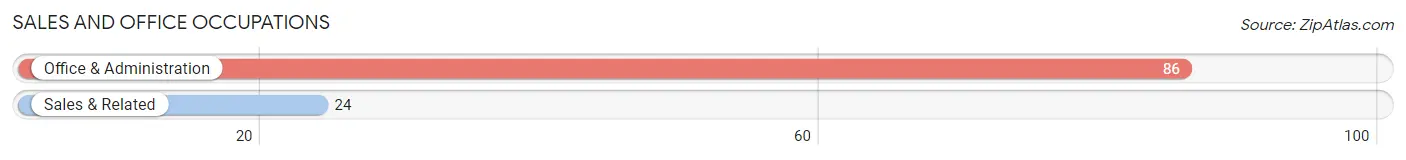
Sales and Office Occupations
The most common Sales and Office occupations in Skyline Acres are Office & Administration (86 | 18.6%), and Sales & Related (24 | 5.2%).
Sales and Office Occupations by Sex
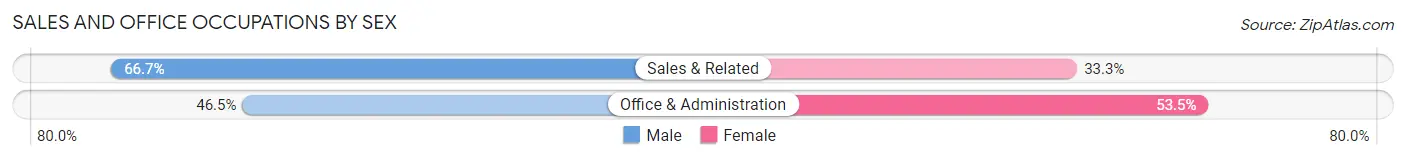
| Occupation | Male | Female |
| Sales & Related | 16 (66.7%) | 8 (33.3%) |
| Office & Administration | 40 (46.5%) | 46 (53.5%) |
| Total (Category) | 56 (50.9%) | 54 (49.1%) |
| Total (Overall) | 169 (36.5%) | 294 (63.5%) |
Natural Resources, Construction and Maintenance Occupations
The most common Natural Resources, Construction and Maintenance occupations in Skyline Acres are Installation, Maintenance & Repair (37 | 8.0%), and Construction & Extraction (16 | 3.5%).
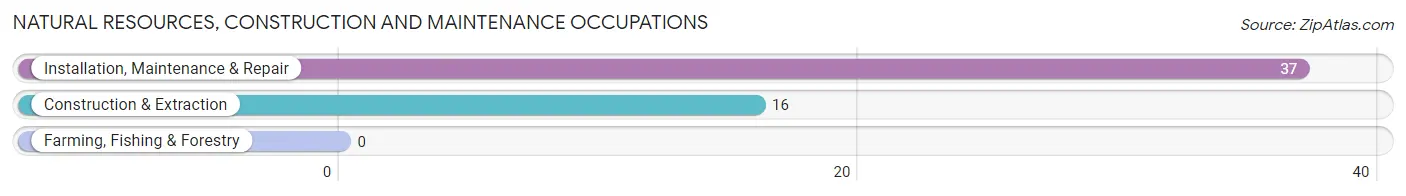
Natural Resources, Construction and Maintenance Occupations by Sex
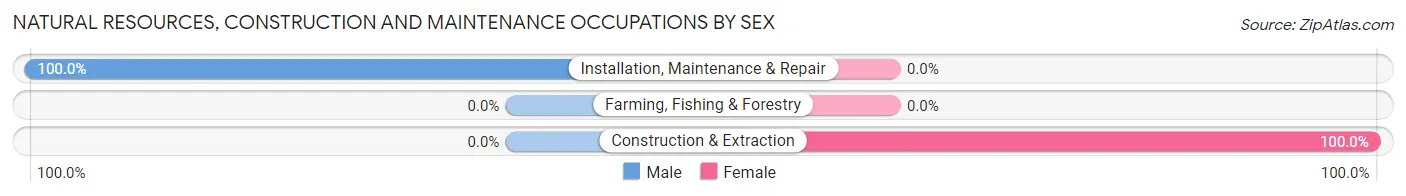
| Occupation | Male | Female |
| Farming, Fishing & Forestry | 0 (0.0%) | 0 (0.0%) |
| Construction & Extraction | 0 (0.0%) | 16 (100.0%) |
| Installation, Maintenance & Repair | 37 (100.0%) | 0 (0.0%) |
| Total (Category) | 37 (69.8%) | 16 (30.2%) |
| Total (Overall) | 169 (36.5%) | 294 (63.5%) |
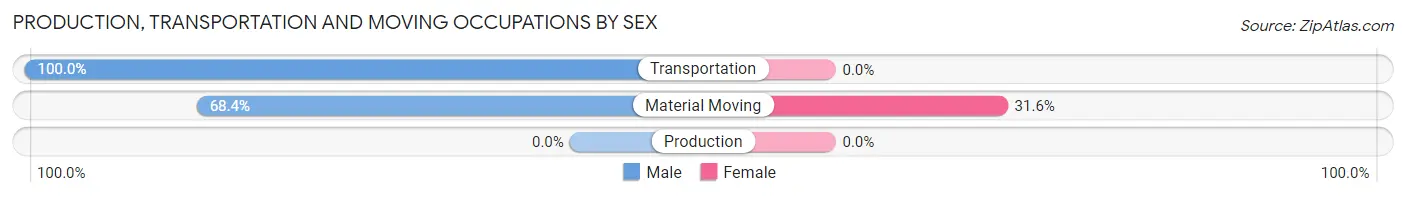
Production, Transportation and Moving Occupations
The most common Production, Transportation and Moving occupations in Skyline Acres are Material Moving (38 | 8.2%), and Transportation (11 | 2.4%).
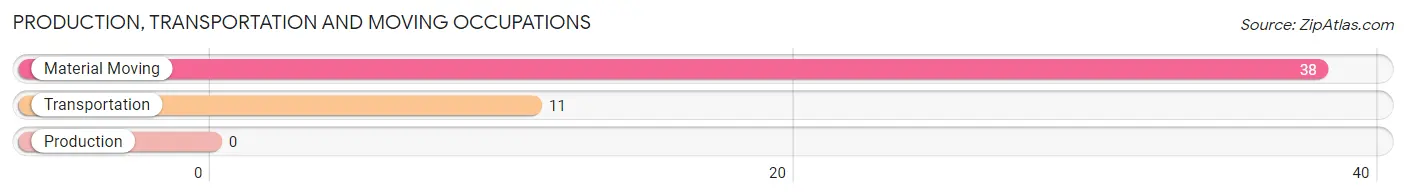
Production, Transportation and Moving Occupations by Sex
| Occupation | Male | Female |
| Production | 0 (0.0%) | 0 (0.0%) |
| Transportation | 11 (100.0%) | 0 (0.0%) |
| Material Moving | 26 (68.4%) | 12 (31.6%) |
| Total (Category) | 37 (75.5%) | 12 (24.5%) |
| Total (Overall) | 169 (36.5%) | 294 (63.5%) |
Employment Industries by Sex in Skyline Acres
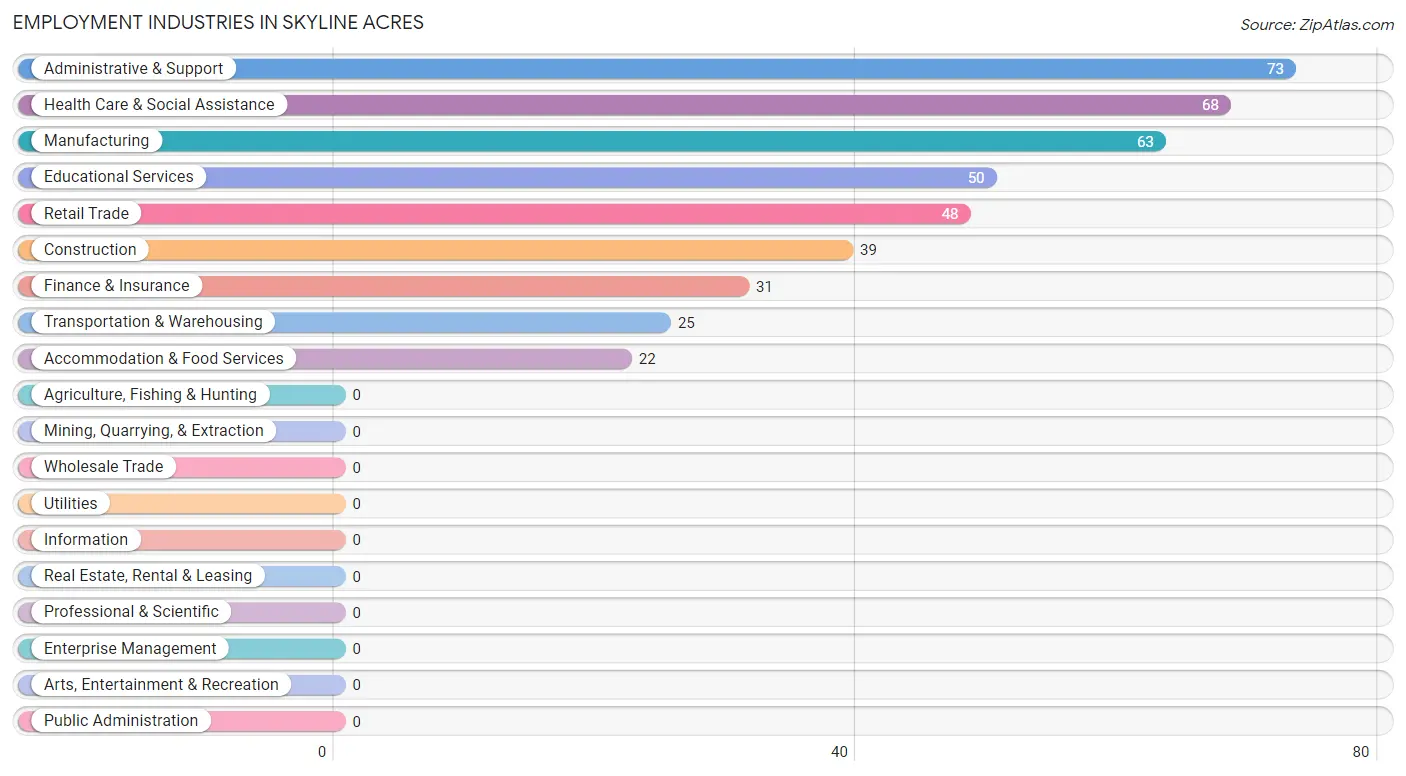
Employment Industries in Skyline Acres
The major employment industries in Skyline Acres include Administrative & Support (73 | 15.8%), Health Care & Social Assistance (68 | 14.7%), Manufacturing (63 | 13.6%), Educational Services (50 | 10.8%), and Retail Trade (48 | 10.4%).
Employment Industries by Sex in Skyline Acres
The Skyline Acres industries that see more men than women are Transportation & Warehousing (100.0%), Finance & Insurance (67.7%), and Manufacturing (60.3%), whereas the industries that tend to have a higher number of women are Construction (100.0%), Accommodation & Food Services (100.0%), and Health Care & Social Assistance (89.7%).
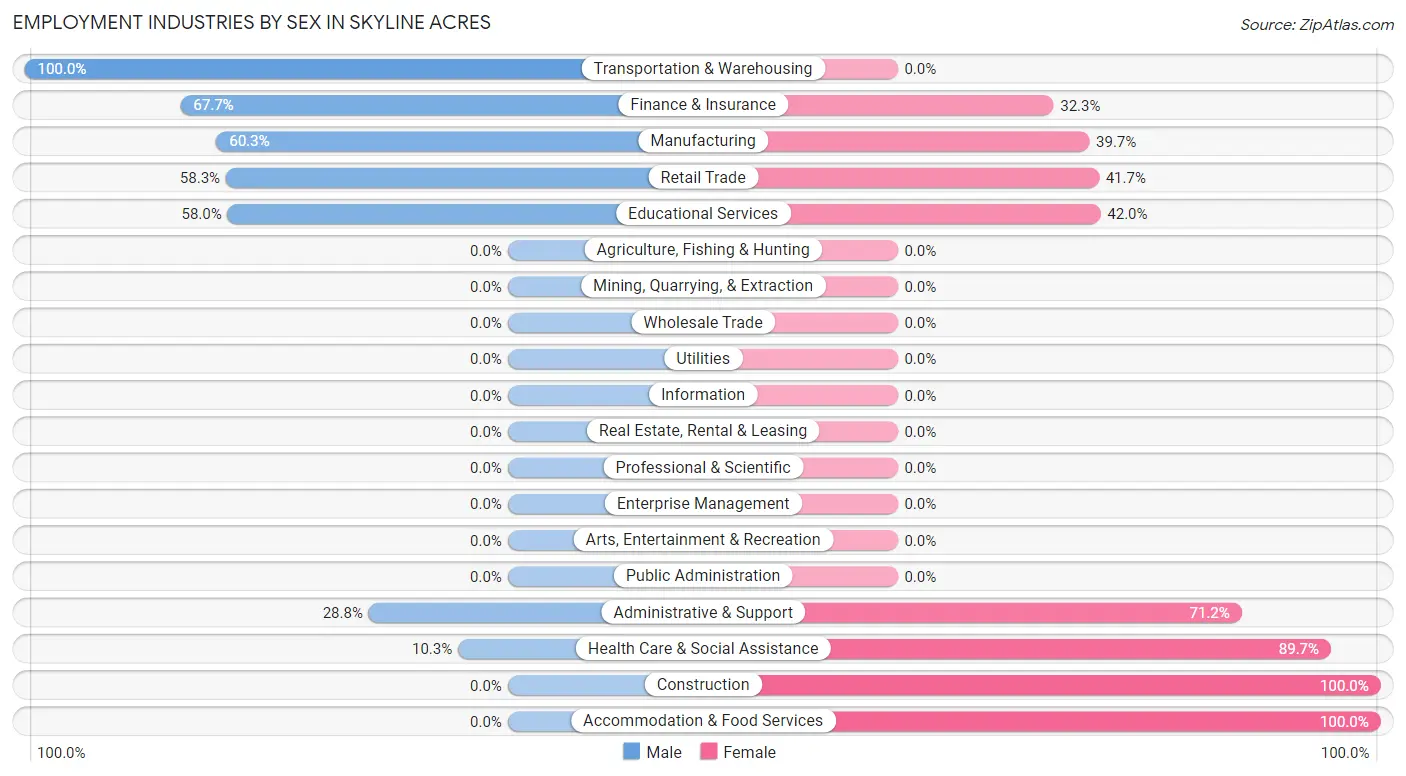
| Industry | Male | Female |
| Agriculture, Fishing & Hunting | 0 (0.0%) | 0 (0.0%) |
| Mining, Quarrying, & Extraction | 0 (0.0%) | 0 (0.0%) |
| Construction | 0 (0.0%) | 39 (100.0%) |
| Manufacturing | 38 (60.3%) | 25 (39.7%) |
| Wholesale Trade | 0 (0.0%) | 0 (0.0%) |
| Retail Trade | 28 (58.3%) | 20 (41.7%) |
| Transportation & Warehousing | 25 (100.0%) | 0 (0.0%) |
| Utilities | 0 (0.0%) | 0 (0.0%) |
| Information | 0 (0.0%) | 0 (0.0%) |
| Finance & Insurance | 21 (67.7%) | 10 (32.3%) |
| Real Estate, Rental & Leasing | 0 (0.0%) | 0 (0.0%) |
| Professional & Scientific | 0 (0.0%) | 0 (0.0%) |
| Enterprise Management | 0 (0.0%) | 0 (0.0%) |
| Administrative & Support | 21 (28.8%) | 52 (71.2%) |
| Educational Services | 29 (58.0%) | 21 (42.0%) |
| Health Care & Social Assistance | 7 (10.3%) | 61 (89.7%) |
| Arts, Entertainment & Recreation | 0 (0.0%) | 0 (0.0%) |
| Accommodation & Food Services | 0 (0.0%) | 22 (100.0%) |
| Public Administration | 0 (0.0%) | 0 (0.0%) |
| Total | 169 (36.5%) | 294 (63.5%) |
Education in Skyline Acres
School Enrollment in Skyline Acres
The most common levels of schooling among the 350 students in Skyline Acres are high school (218 | 62.3%), middle school (44 | 12.6%), and elementary school (42 | 12.0%).
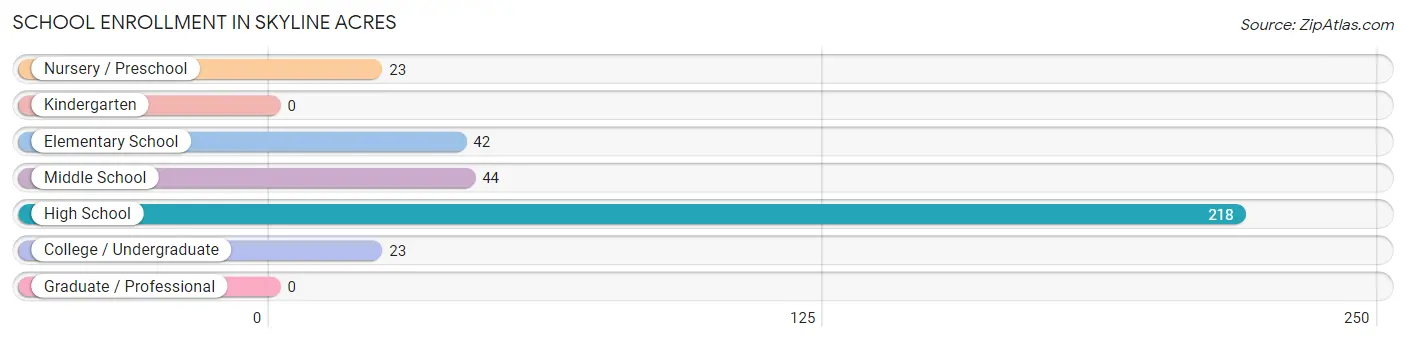
| School Level | # Students | % Students |
| Nursery / Preschool | 23 | 6.6% |
| Kindergarten | 0 | 0.0% |
| Elementary School | 42 | 12.0% |
| Middle School | 44 | 12.6% |
| High School | 218 | 62.3% |
| College / Undergraduate | 23 | 6.6% |
| Graduate / Professional | 0 | 0.0% |
| Total | 350 | 100.0% |
School Enrollment by Age by Funding Source in Skyline Acres
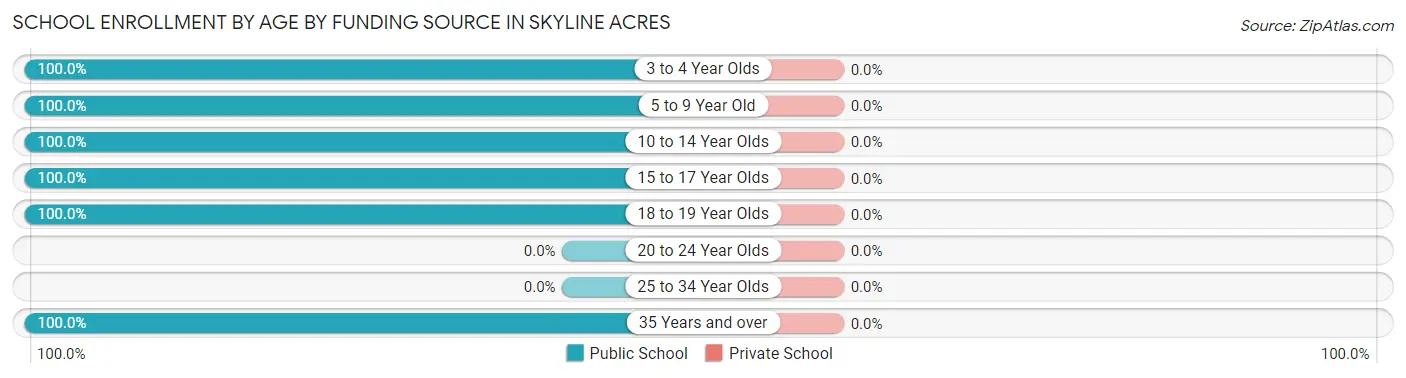
| Age Bracket | Public School | Private School |
| 3 to 4 Year Olds | 23 (100.0%) | 0 (0.0%) |
| 5 to 9 Year Old | 42 (100.0%) | 0 (0.0%) |
| 10 to 14 Year Olds | 148 (100.0%) | 0 (0.0%) |
| 15 to 17 Year Olds | 90 (100.0%) | 0 (0.0%) |
| 18 to 19 Year Olds | 36 (100.0%) | 0 (0.0%) |
| 20 to 24 Year Olds | 0 (0.0%) | 0 (0.0%) |
| 25 to 34 Year Olds | 0 (0.0%) | 0 (0.0%) |
| 35 Years and over | 11 (100.0%) | 0 (0.0%) |
| Total | 350 (100.0%) | 0 (0.0%) |
Educational Attainment by Field of Study in Skyline Acres
Science & technology (52 | 60.5%), bio, nature & agricultural (23 | 26.7%), and education (11 | 12.8%) are the most common fields of study among 86 individuals in Skyline Acres who have obtained a bachelor's degree or higher.
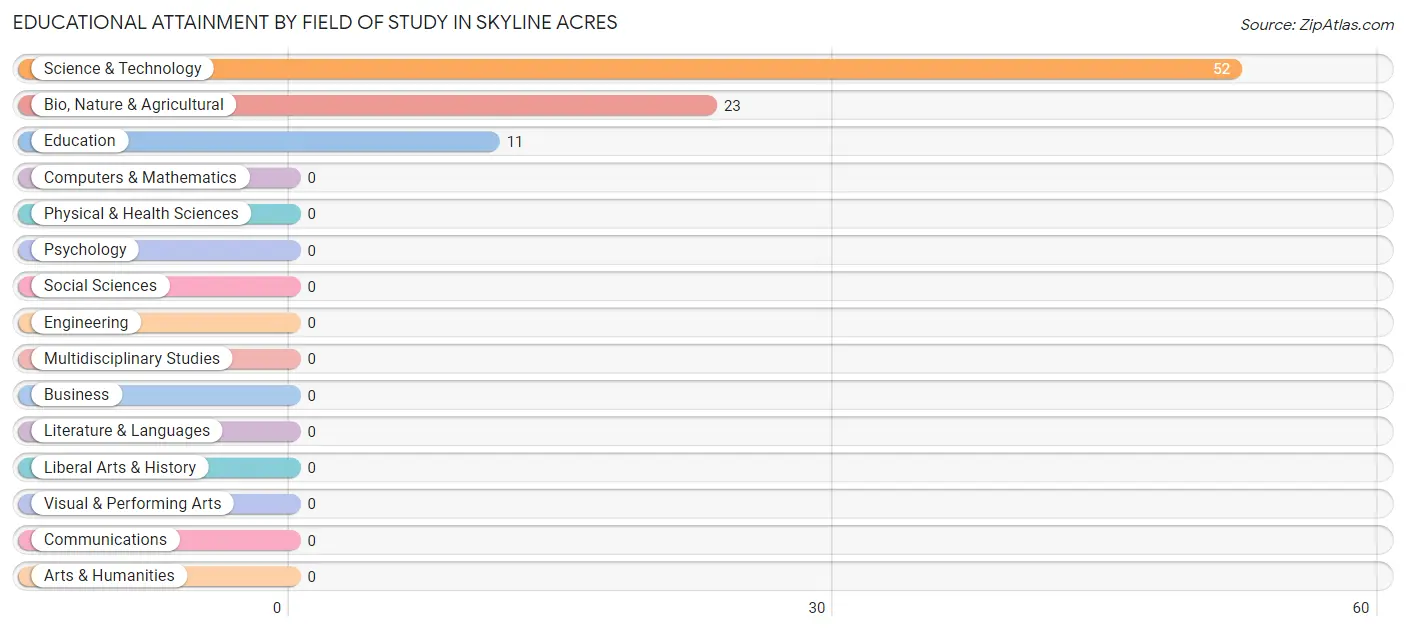
| Field of Study | # Graduates | % Graduates |
| Computers & Mathematics | 0 | 0.0% |
| Bio, Nature & Agricultural | 23 | 26.7% |
| Physical & Health Sciences | 0 | 0.0% |
| Psychology | 0 | 0.0% |
| Social Sciences | 0 | 0.0% |
| Engineering | 0 | 0.0% |
| Multidisciplinary Studies | 0 | 0.0% |
| Science & Technology | 52 | 60.5% |
| Business | 0 | 0.0% |
| Education | 11 | 12.8% |
| Literature & Languages | 0 | 0.0% |
| Liberal Arts & History | 0 | 0.0% |
| Visual & Performing Arts | 0 | 0.0% |
| Communications | 0 | 0.0% |
| Arts & Humanities | 0 | 0.0% |
| Total | 86 | 100.0% |
Transportation & Commute in Skyline Acres
Vehicle Availability by Sex in Skyline Acres
The most prevalent vehicle ownership categories in Skyline Acres are males with 4 vehicles (51, accounting for 30.2%) and females with 4 vehicles (52, making up 17.3%).
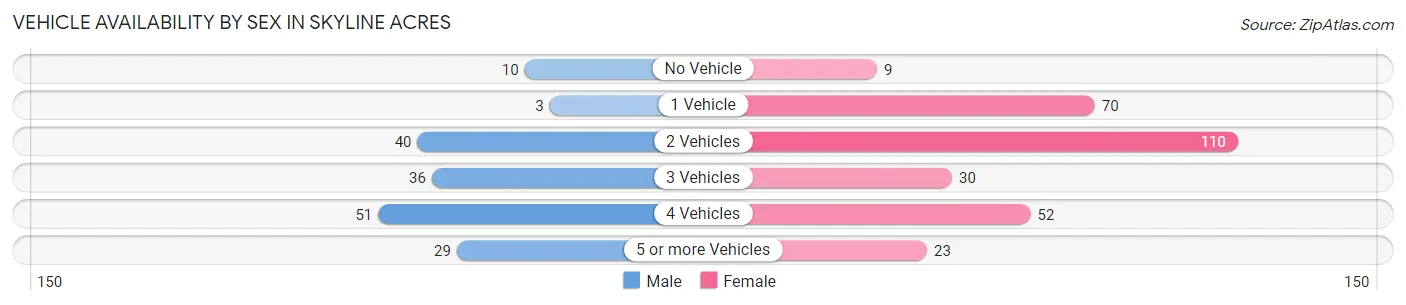
| Vehicles Available | Male | Female |
| No Vehicle | 10 (5.9%) | 9 (3.1%) |
| 1 Vehicle | 3 (1.8%) | 70 (23.8%) |
| 2 Vehicles | 40 (23.7%) | 110 (37.4%) |
| 3 Vehicles | 36 (21.3%) | 30 (10.2%) |
| 4 Vehicles | 51 (30.2%) | 52 (17.7%) |
| 5 or more Vehicles | 29 (17.2%) | 23 (7.8%) |
| Total | 169 (100.0%) | 294 (100.0%) |
Commute Time in Skyline Acres
The most frequently occuring commute durations in Skyline Acres are 25 to 29 minutes (98 commuters, 21.7%), 10 to 14 minutes (79 commuters, 17.5%), and 30 to 34 minutes (77 commuters, 17.0%).
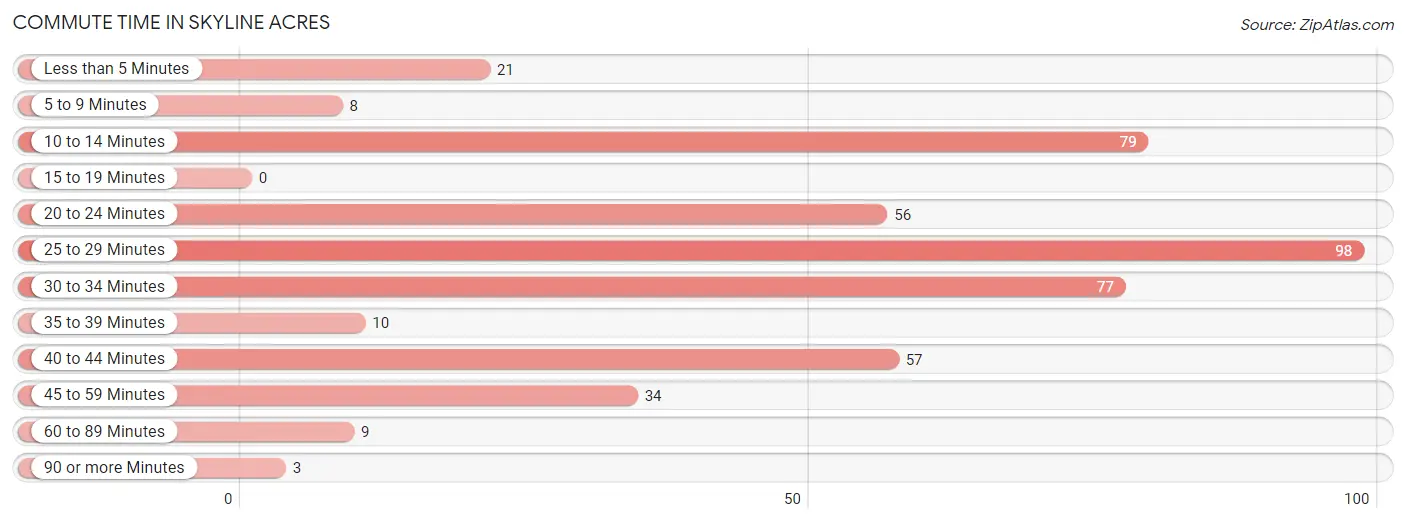
| Commute Time | # Commuters | % Commuters |
| Less than 5 Minutes | 21 | 4.6% |
| 5 to 9 Minutes | 8 | 1.8% |
| 10 to 14 Minutes | 79 | 17.5% |
| 15 to 19 Minutes | 0 | 0.0% |
| 20 to 24 Minutes | 56 | 12.4% |
| 25 to 29 Minutes | 98 | 21.7% |
| 30 to 34 Minutes | 77 | 17.0% |
| 35 to 39 Minutes | 10 | 2.2% |
| 40 to 44 Minutes | 57 | 12.6% |
| 45 to 59 Minutes | 34 | 7.5% |
| 60 to 89 Minutes | 9 | 2.0% |
| 90 or more Minutes | 3 | 0.7% |
Commute Time by Sex in Skyline Acres
The most common commute times in Skyline Acres are 25 to 29 minutes (56 commuters, 33.1%) for males and 10 to 14 minutes (64 commuters, 22.6%) for females.
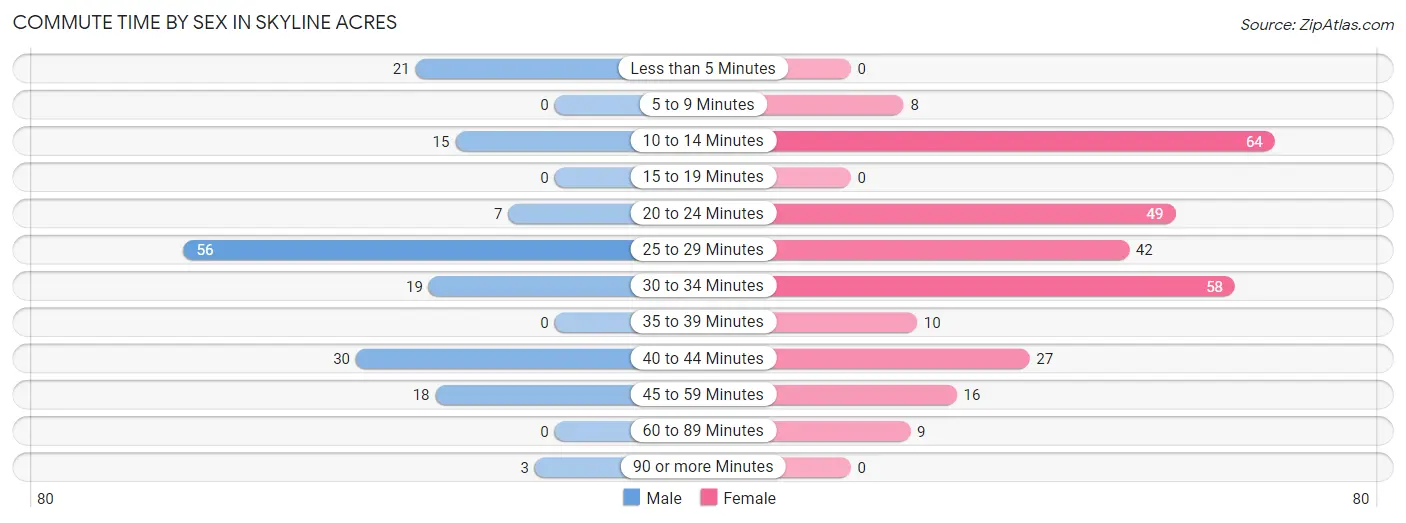
| Commute Time | Male | Female |
| Less than 5 Minutes | 21 (12.4%) | 0 (0.0%) |
| 5 to 9 Minutes | 0 (0.0%) | 8 (2.8%) |
| 10 to 14 Minutes | 15 (8.9%) | 64 (22.6%) |
| 15 to 19 Minutes | 0 (0.0%) | 0 (0.0%) |
| 20 to 24 Minutes | 7 (4.1%) | 49 (17.3%) |
| 25 to 29 Minutes | 56 (33.1%) | 42 (14.8%) |
| 30 to 34 Minutes | 19 (11.2%) | 58 (20.5%) |
| 35 to 39 Minutes | 0 (0.0%) | 10 (3.5%) |
| 40 to 44 Minutes | 30 (17.7%) | 27 (9.5%) |
| 45 to 59 Minutes | 18 (10.6%) | 16 (5.7%) |
| 60 to 89 Minutes | 0 (0.0%) | 9 (3.2%) |
| 90 or more Minutes | 3 (1.8%) | 0 (0.0%) |
Time of Departure to Work by Sex in Skyline Acres
The most frequent times of departure to work in Skyline Acres are 6:30 AM to 6:59 AM (70, 41.4%) for males and 7:30 AM to 7:59 AM (56, 19.8%) for females.
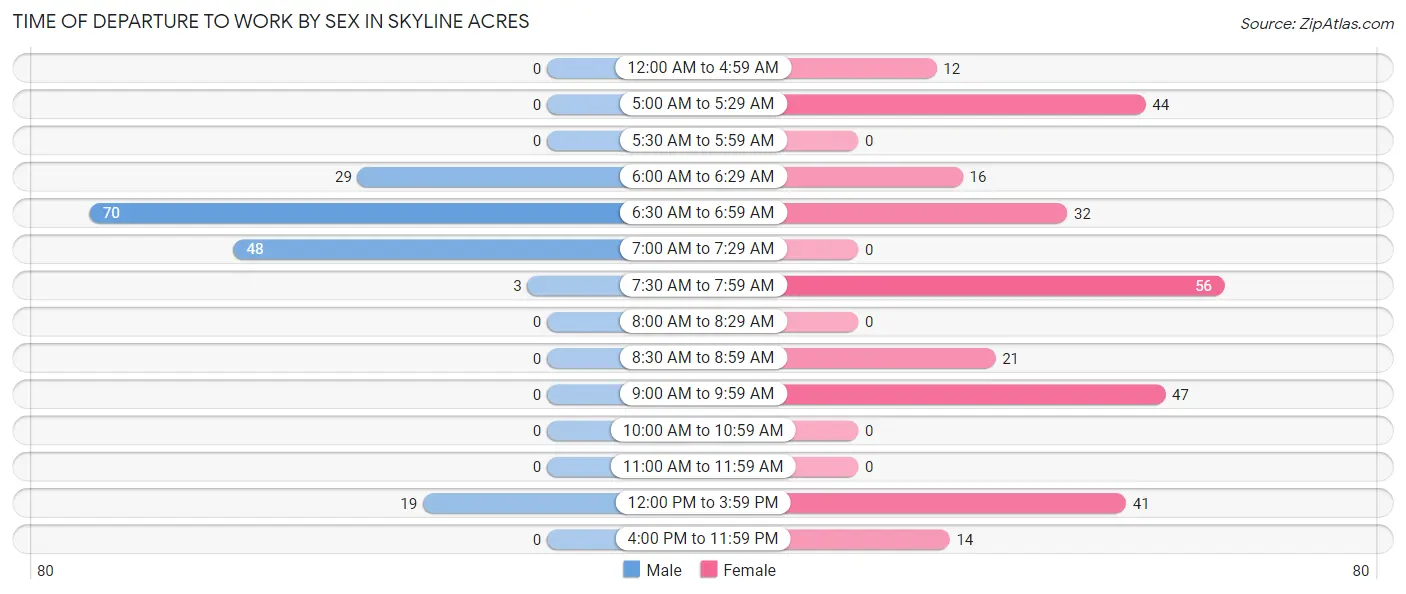
| Time of Departure | Male | Female |
| 12:00 AM to 4:59 AM | 0 (0.0%) | 12 (4.2%) |
| 5:00 AM to 5:29 AM | 0 (0.0%) | 44 (15.5%) |
| 5:30 AM to 5:59 AM | 0 (0.0%) | 0 (0.0%) |
| 6:00 AM to 6:29 AM | 29 (17.2%) | 16 (5.7%) |
| 6:30 AM to 6:59 AM | 70 (41.4%) | 32 (11.3%) |
| 7:00 AM to 7:29 AM | 48 (28.4%) | 0 (0.0%) |
| 7:30 AM to 7:59 AM | 3 (1.8%) | 56 (19.8%) |
| 8:00 AM to 8:29 AM | 0 (0.0%) | 0 (0.0%) |
| 8:30 AM to 8:59 AM | 0 (0.0%) | 21 (7.4%) |
| 9:00 AM to 9:59 AM | 0 (0.0%) | 47 (16.6%) |
| 10:00 AM to 10:59 AM | 0 (0.0%) | 0 (0.0%) |
| 11:00 AM to 11:59 AM | 0 (0.0%) | 0 (0.0%) |
| 12:00 PM to 3:59 PM | 19 (11.2%) | 41 (14.5%) |
| 4:00 PM to 11:59 PM | 0 (0.0%) | 14 (5.0%) |
| Total | 169 (100.0%) | 283 (100.0%) |
Housing Occupancy in Skyline Acres
Occupancy by Ownership in Skyline Acres
Of the total 429 dwellings in Skyline Acres, owner-occupied units account for 291 (67.8%), while renter-occupied units make up 138 (32.2%).
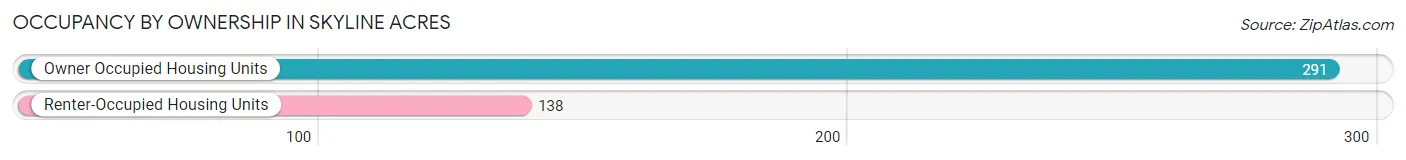
| Occupancy | # Housing Units | % Housing Units |
| Owner Occupied Housing Units | 291 | 67.8% |
| Renter-Occupied Housing Units | 138 | 32.2% |
| Total Occupied Housing Units | 429 | 100.0% |
Occupancy by Household Size in Skyline Acres
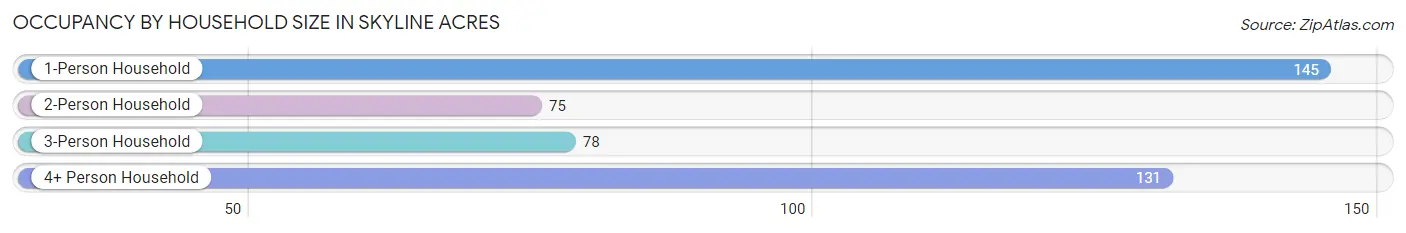
| Household Size | # Housing Units | % Housing Units |
| 1-Person Household | 145 | 33.8% |
| 2-Person Household | 75 | 17.5% |
| 3-Person Household | 78 | 18.2% |
| 4+ Person Household | 131 | 30.5% |
| Total Housing Units | 429 | 100.0% |
Occupancy by Ownership by Household Size in Skyline Acres
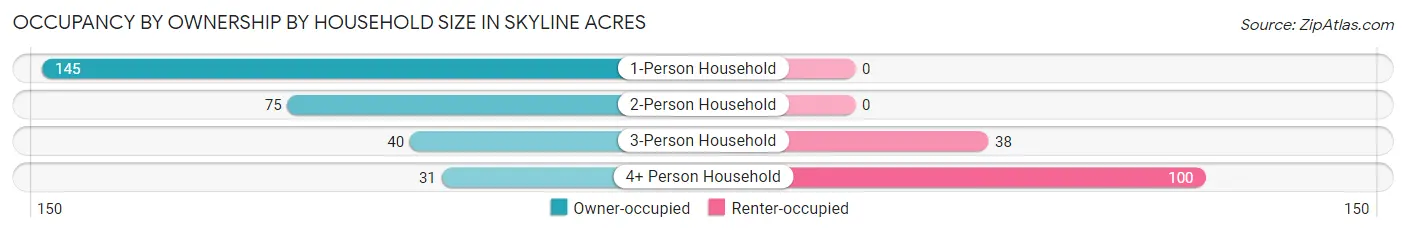
| Household Size | Owner-occupied | Renter-occupied |
| 1-Person Household | 145 (100.0%) | 0 (0.0%) |
| 2-Person Household | 75 (100.0%) | 0 (0.0%) |
| 3-Person Household | 40 (51.3%) | 38 (48.7%) |
| 4+ Person Household | 31 (23.7%) | 100 (76.3%) |
| Total Housing Units | 291 (67.8%) | 138 (32.2%) |
Occupancy by Educational Attainment in Skyline Acres
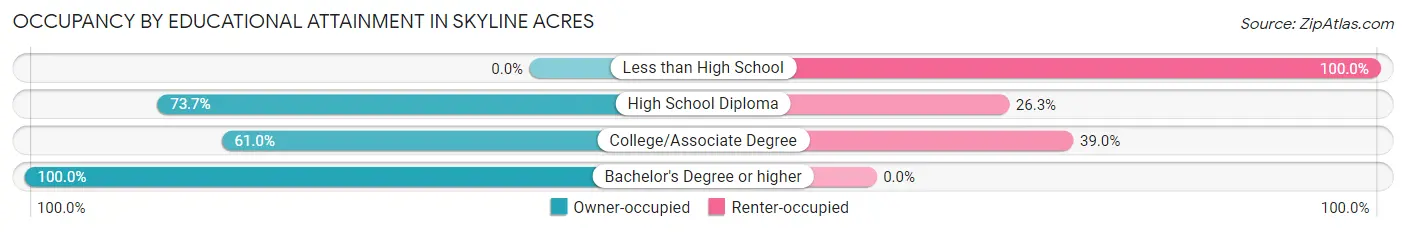
| Household Size | Owner-occupied | Renter-occupied |
| Less than High School | 0 (0.0%) | 9 (100.0%) |
| High School Diploma | 112 (73.7%) | 40 (26.3%) |
| College/Associate Degree | 139 (61.0%) | 89 (39.0%) |
| Bachelor's Degree or higher | 40 (100.0%) | 0 (0.0%) |
Occupancy by Age of Householder in Skyline Acres
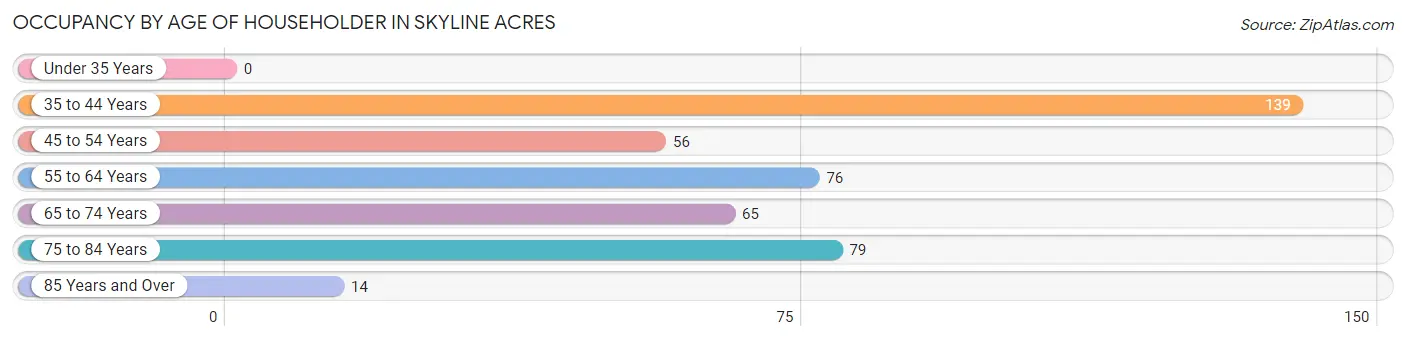
| Age Bracket | # Households | % Households |
| Under 35 Years | 0 | 0.0% |
| 35 to 44 Years | 139 | 32.4% |
| 45 to 54 Years | 56 | 13.1% |
| 55 to 64 Years | 76 | 17.7% |
| 65 to 74 Years | 65 | 15.1% |
| 75 to 84 Years | 79 | 18.4% |
| 85 Years and Over | 14 | 3.3% |
| Total | 429 | 100.0% |
Housing Finances in Skyline Acres
Median Income by Occupancy in Skyline Acres
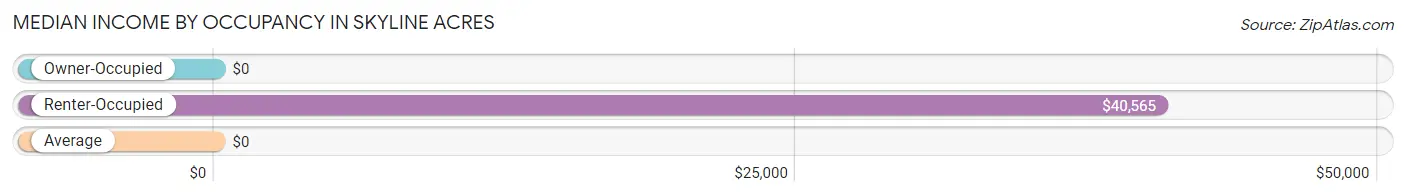
| Occupancy Type | # Households | Median Income |
| Owner-Occupied | 291 (67.8%) | $0 |
| Renter-Occupied | 138 (32.2%) | $40,565 |
| Average | 429 (100.0%) | $0 |
Occupancy by Householder Income Bracket in Skyline Acres
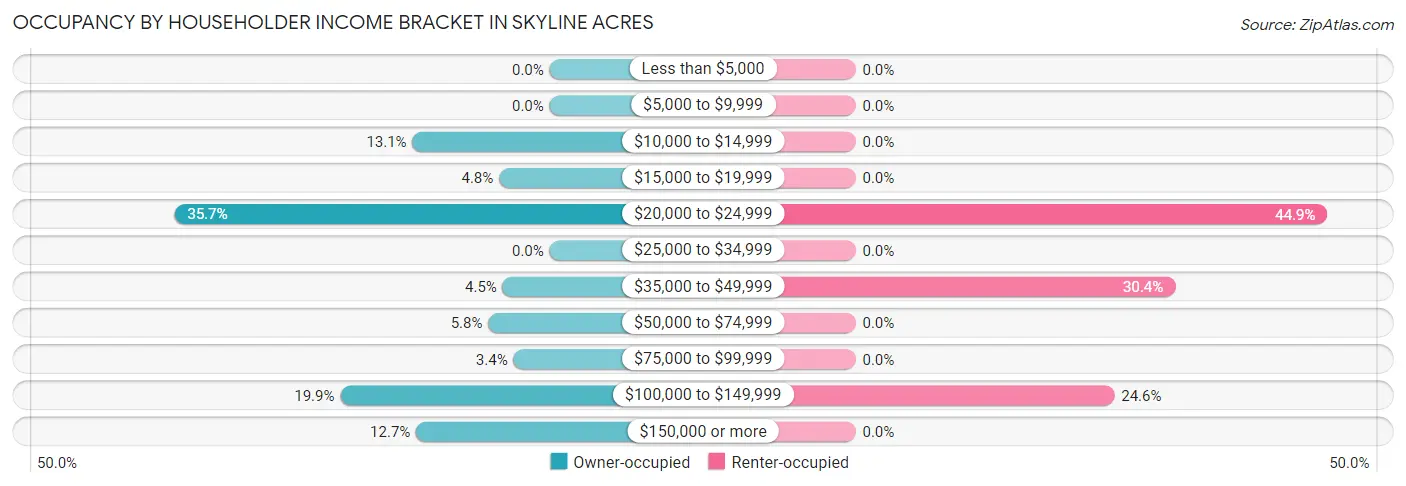
| Income Bracket | Owner-occupied | Renter-occupied |
| Less than $5,000 | 0 (0.0%) | 0 (0.0%) |
| $5,000 to $9,999 | 0 (0.0%) | 0 (0.0%) |
| $10,000 to $14,999 | 38 (13.1%) | 0 (0.0%) |
| $15,000 to $19,999 | 14 (4.8%) | 0 (0.0%) |
| $20,000 to $24,999 | 104 (35.7%) | 62 (44.9%) |
| $25,000 to $34,999 | 0 (0.0%) | 0 (0.0%) |
| $35,000 to $49,999 | 13 (4.5%) | 42 (30.4%) |
| $50,000 to $74,999 | 17 (5.8%) | 0 (0.0%) |
| $75,000 to $99,999 | 10 (3.4%) | 0 (0.0%) |
| $100,000 to $149,999 | 58 (19.9%) | 34 (24.6%) |
| $150,000 or more | 37 (12.7%) | 0 (0.0%) |
| Total | 291 (100.0%) | 138 (100.0%) |
Monthly Housing Cost Tiers in Skyline Acres
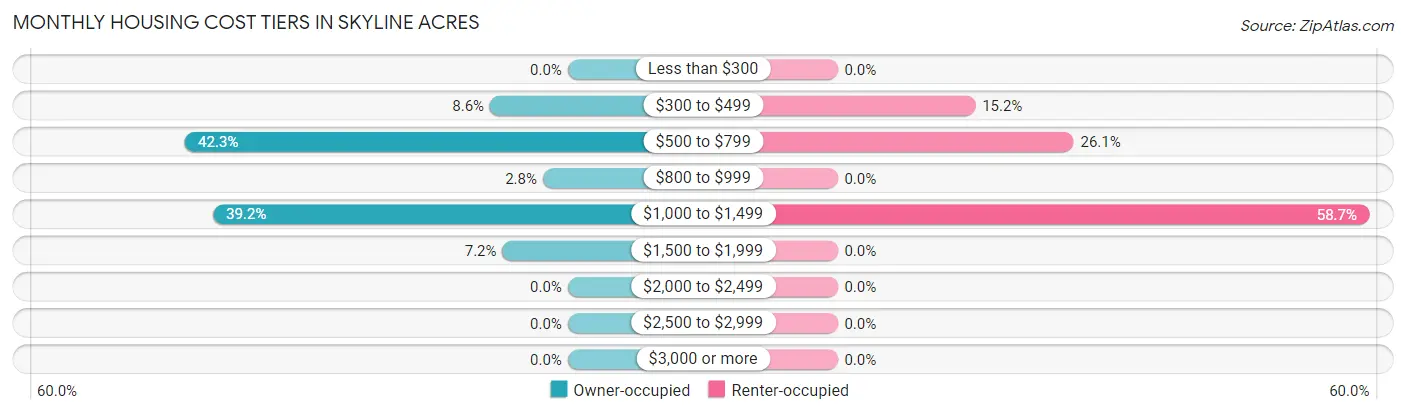
| Monthly Cost | Owner-occupied | Renter-occupied |
| Less than $300 | 0 (0.0%) | 0 (0.0%) |
| $300 to $499 | 25 (8.6%) | 21 (15.2%) |
| $500 to $799 | 123 (42.3%) | 36 (26.1%) |
| $800 to $999 | 8 (2.8%) | 0 (0.0%) |
| $1,000 to $1,499 | 114 (39.2%) | 81 (58.7%) |
| $1,500 to $1,999 | 21 (7.2%) | 0 (0.0%) |
| $2,000 to $2,499 | 0 (0.0%) | 0 (0.0%) |
| $2,500 to $2,999 | 0 (0.0%) | 0 (0.0%) |
| $3,000 or more | 0 (0.0%) | 0 (0.0%) |
| Total | 291 (100.0%) | 138 (100.0%) |
Physical Housing Characteristics in Skyline Acres
Housing Structures in Skyline Acres
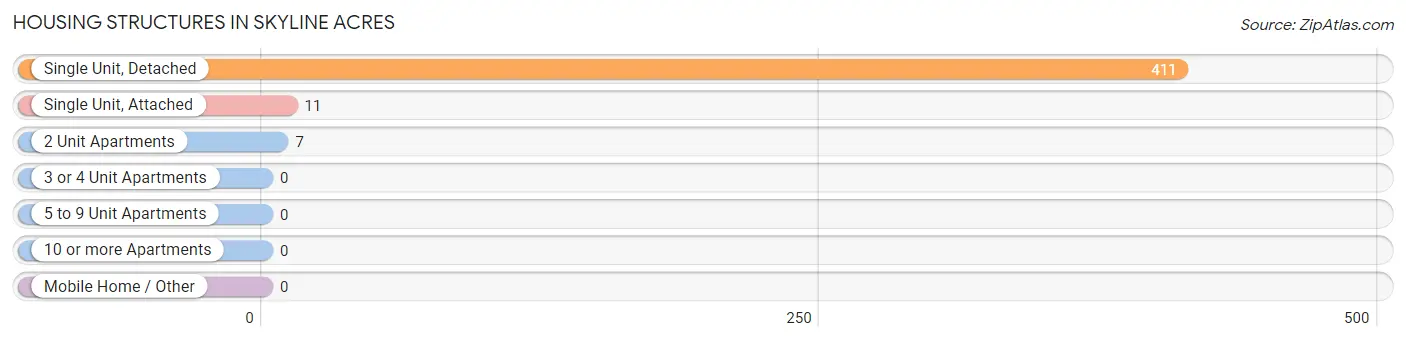
| Structure Type | # Housing Units | % Housing Units |
| Single Unit, Detached | 411 | 95.8% |
| Single Unit, Attached | 11 | 2.6% |
| 2 Unit Apartments | 7 | 1.6% |
| 3 or 4 Unit Apartments | 0 | 0.0% |
| 5 to 9 Unit Apartments | 0 | 0.0% |
| 10 or more Apartments | 0 | 0.0% |
| Mobile Home / Other | 0 | 0.0% |
| Total | 429 | 100.0% |
Housing Structures by Occupancy in Skyline Acres
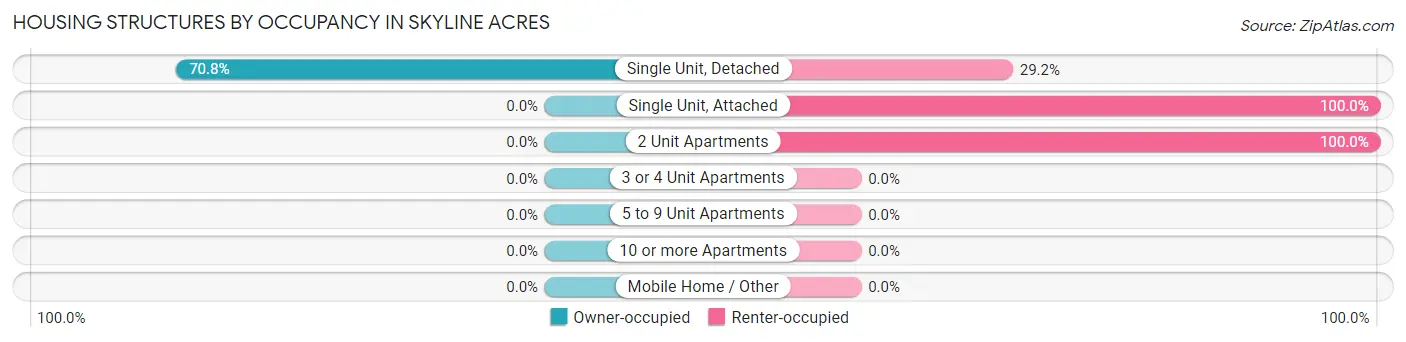
| Structure Type | Owner-occupied | Renter-occupied |
| Single Unit, Detached | 291 (70.8%) | 120 (29.2%) |
| Single Unit, Attached | 0 (0.0%) | 11 (100.0%) |
| 2 Unit Apartments | 0 (0.0%) | 7 (100.0%) |
| 3 or 4 Unit Apartments | 0 (0.0%) | 0 (0.0%) |
| 5 to 9 Unit Apartments | 0 (0.0%) | 0 (0.0%) |
| 10 or more Apartments | 0 (0.0%) | 0 (0.0%) |
| Mobile Home / Other | 0 (0.0%) | 0 (0.0%) |
| Total | 291 (67.8%) | 138 (32.2%) |
Housing Structures by Number of Rooms in Skyline Acres
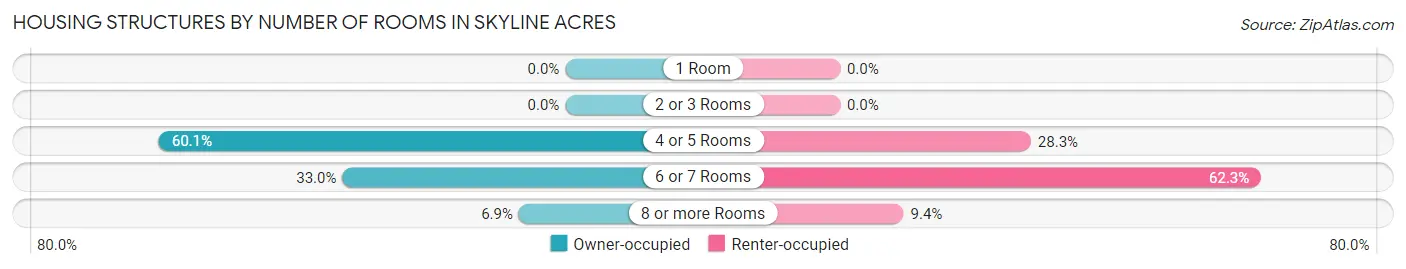
| Number of Rooms | Owner-occupied | Renter-occupied |
| 1 Room | 0 (0.0%) | 0 (0.0%) |
| 2 or 3 Rooms | 0 (0.0%) | 0 (0.0%) |
| 4 or 5 Rooms | 175 (60.1%) | 39 (28.3%) |
| 6 or 7 Rooms | 96 (33.0%) | 86 (62.3%) |
| 8 or more Rooms | 20 (6.9%) | 13 (9.4%) |
| Total | 291 (100.0%) | 138 (100.0%) |
Housing Structure by Heating Type in Skyline Acres
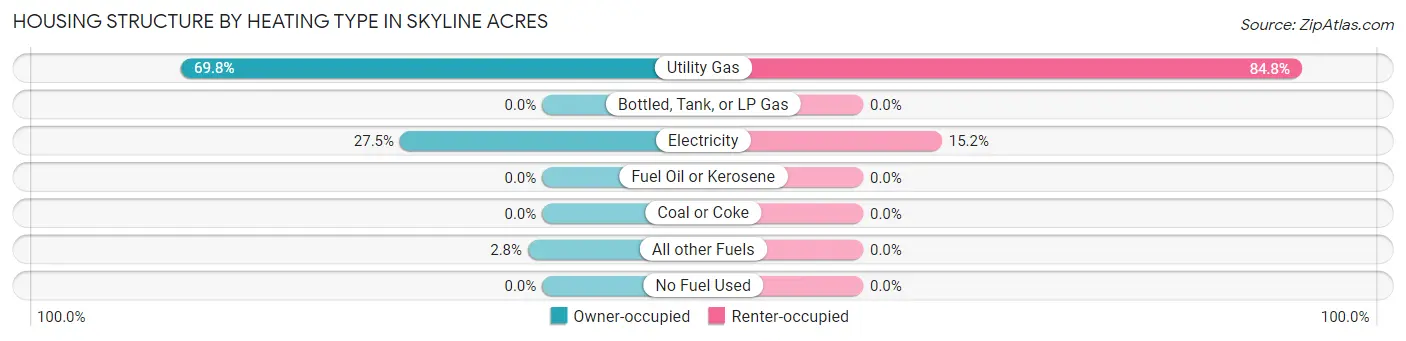
| Heating Type | Owner-occupied | Renter-occupied |
| Utility Gas | 203 (69.8%) | 117 (84.8%) |
| Bottled, Tank, or LP Gas | 0 (0.0%) | 0 (0.0%) |
| Electricity | 80 (27.5%) | 21 (15.2%) |
| Fuel Oil or Kerosene | 0 (0.0%) | 0 (0.0%) |
| Coal or Coke | 0 (0.0%) | 0 (0.0%) |
| All other Fuels | 8 (2.8%) | 0 (0.0%) |
| No Fuel Used | 0 (0.0%) | 0 (0.0%) |
| Total | 291 (100.0%) | 138 (100.0%) |
Household Vehicle Usage in Skyline Acres
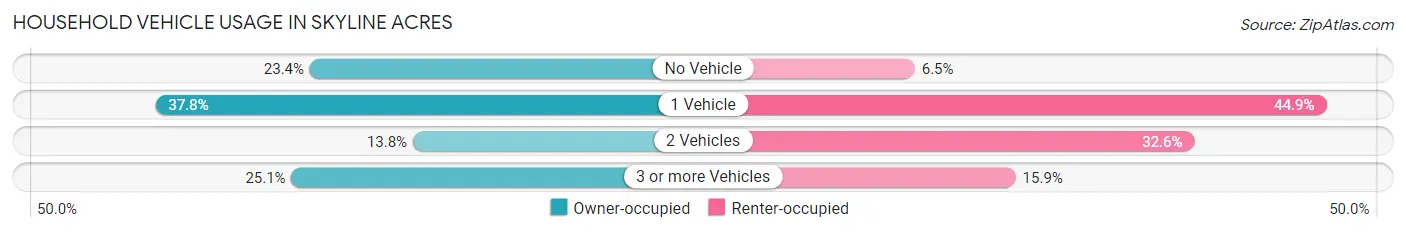
| Vehicles per Household | Owner-occupied | Renter-occupied |
| No Vehicle | 68 (23.4%) | 9 (6.5%) |
| 1 Vehicle | 110 (37.8%) | 62 (44.9%) |
| 2 Vehicles | 40 (13.8%) | 45 (32.6%) |
| 3 or more Vehicles | 73 (25.1%) | 22 (15.9%) |
| Total | 291 (100.0%) | 138 (100.0%) |
Real Estate & Mortgages in Skyline Acres
Real Estate and Mortgage Overview in Skyline Acres
| Characteristic | Without Mortgage | With Mortgage |
| Housing Units | 88 | 203 |
| Median Property Value | $125,000 | $124,500 |
| Median Household Income | - | - |
| Monthly Housing Costs | $535 | $0 |
| Real Estate Taxes | $1,415 | $0 |
Property Value by Mortgage Status in Skyline Acres
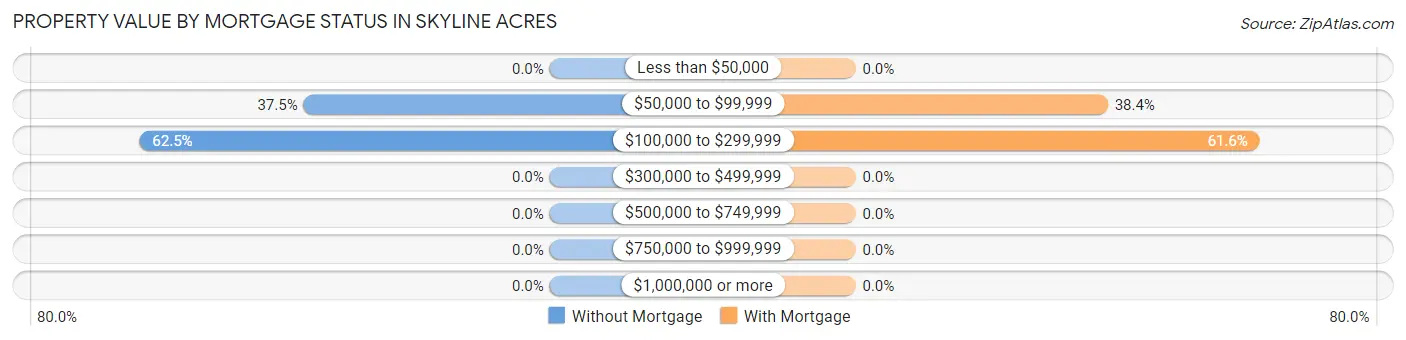
| Property Value | Without Mortgage | With Mortgage |
| Less than $50,000 | 0 (0.0%) | 0 (0.0%) |
| $50,000 to $99,999 | 33 (37.5%) | 78 (38.4%) |
| $100,000 to $299,999 | 55 (62.5%) | 125 (61.6%) |
| $300,000 to $499,999 | 0 (0.0%) | 0 (0.0%) |
| $500,000 to $749,999 | 0 (0.0%) | 0 (0.0%) |
| $750,000 to $999,999 | 0 (0.0%) | 0 (0.0%) |
| $1,000,000 or more | 0 (0.0%) | 0 (0.0%) |
| Total | 88 (100.0%) | 203 (100.0%) |
Household Income by Mortgage Status in Skyline Acres
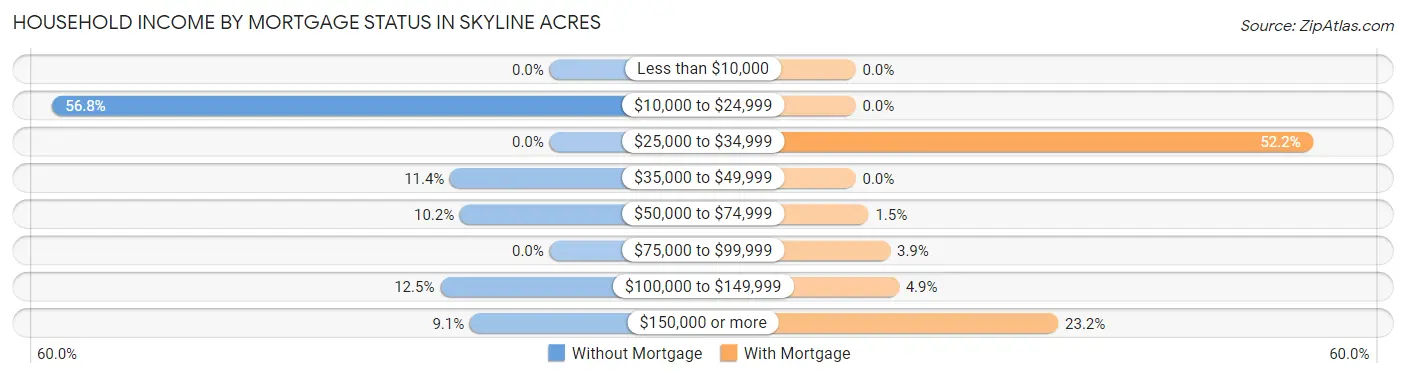
| Household Income | Without Mortgage | With Mortgage |
| Less than $10,000 | 0 (0.0%) | 0 (0.0%) |
| $10,000 to $24,999 | 50 (56.8%) | 0 (0.0%) |
| $25,000 to $34,999 | 0 (0.0%) | 106 (52.2%) |
| $35,000 to $49,999 | 10 (11.4%) | 0 (0.0%) |
| $50,000 to $74,999 | 9 (10.2%) | 3 (1.5%) |
| $75,000 to $99,999 | 0 (0.0%) | 8 (3.9%) |
| $100,000 to $149,999 | 11 (12.5%) | 10 (4.9%) |
| $150,000 or more | 8 (9.1%) | 47 (23.2%) |
| Total | 88 (100.0%) | 203 (100.0%) |
Property Value to Household Income Ratio in Skyline Acres
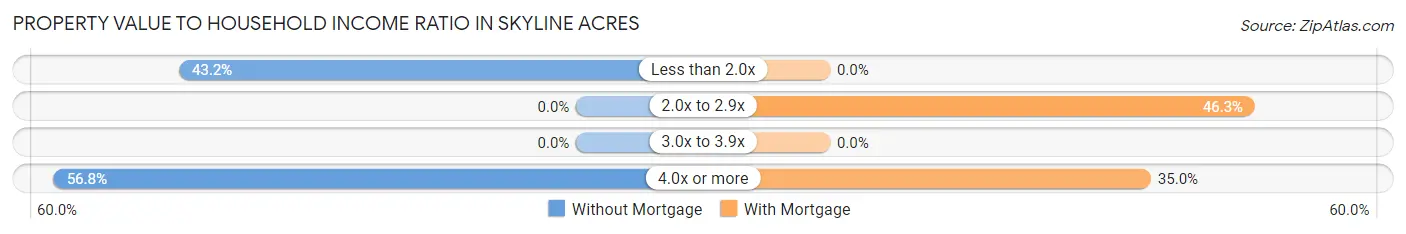
| Value-to-Income Ratio | Without Mortgage | With Mortgage |
| Less than 2.0x | 38 (43.2%) | 0 (0.0%) |
| 2.0x to 2.9x | 0 (0.0%) | 94 (46.3%) |
| 3.0x to 3.9x | 0 (0.0%) | 0 (0.0%) |
| 4.0x or more | 50 (56.8%) | 71 (35.0%) |
| Total | 88 (100.0%) | 203 (100.0%) |
Real Estate Taxes by Mortgage Status in Skyline Acres
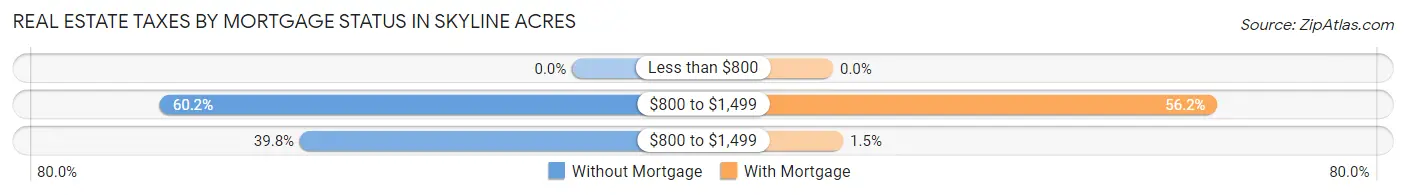
| Property Taxes | Without Mortgage | With Mortgage |
| Less than $800 | 0 (0.0%) | 0 (0.0%) |
| $800 to $1,499 | 53 (60.2%) | 114 (56.2%) |
| $800 to $1,499 | 35 (39.8%) | 3 (1.5%) |
| Total | 88 (100.0%) | 203 (100.0%) |
Health & Disability in Skyline Acres
Health Insurance Coverage by Age in Skyline Acres
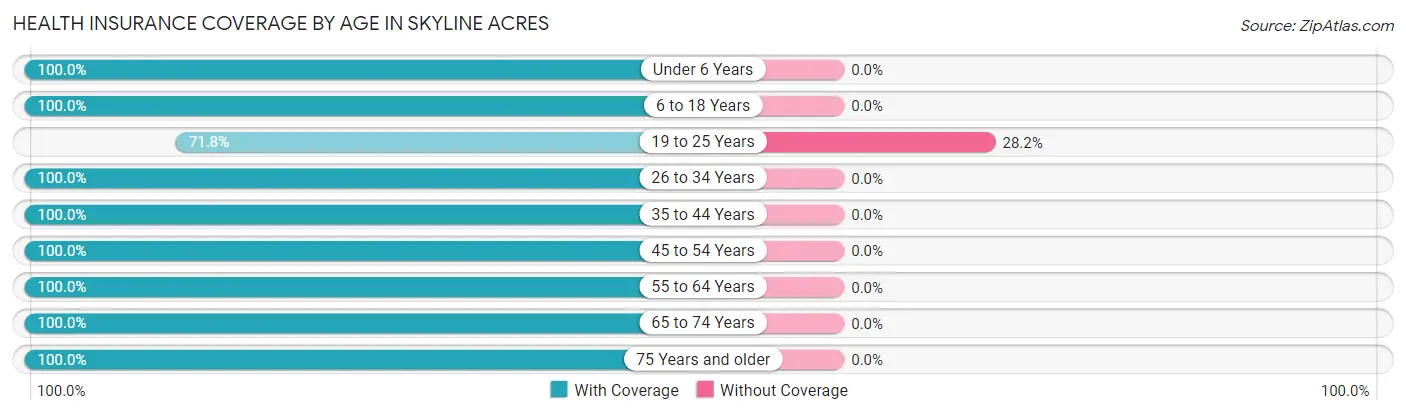
| Age Bracket | With Coverage | Without Coverage |
| Under 6 Years | 47 (100.0%) | 0 (0.0%) |
| 6 to 18 Years | 304 (100.0%) | 0 (0.0%) |
| 19 to 25 Years | 112 (71.8%) | 44 (28.2%) |
| 26 to 34 Years | 18 (100.0%) | 0 (0.0%) |
| 35 to 44 Years | 185 (100.0%) | 0 (0.0%) |
| 45 to 54 Years | 133 (100.0%) | 0 (0.0%) |
| 55 to 64 Years | 128 (100.0%) | 0 (0.0%) |
| 65 to 74 Years | 70 (100.0%) | 0 (0.0%) |
| 75 Years and older | 148 (100.0%) | 0 (0.0%) |
| Total | 1,145 (96.3%) | 44 (3.7%) |
Health Insurance Coverage by Citizenship Status in Skyline Acres
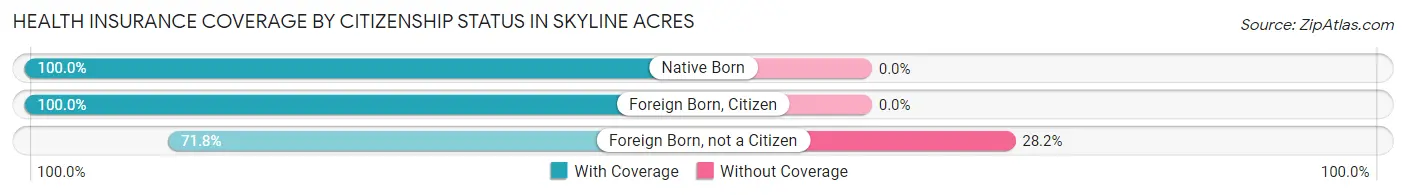
| Citizenship Status | With Coverage | Without Coverage |
| Native Born | 47 (100.0%) | 0 (0.0%) |
| Foreign Born, Citizen | 304 (100.0%) | 0 (0.0%) |
| Foreign Born, not a Citizen | 112 (71.8%) | 44 (28.2%) |
Health Insurance Coverage by Household Income in Skyline Acres
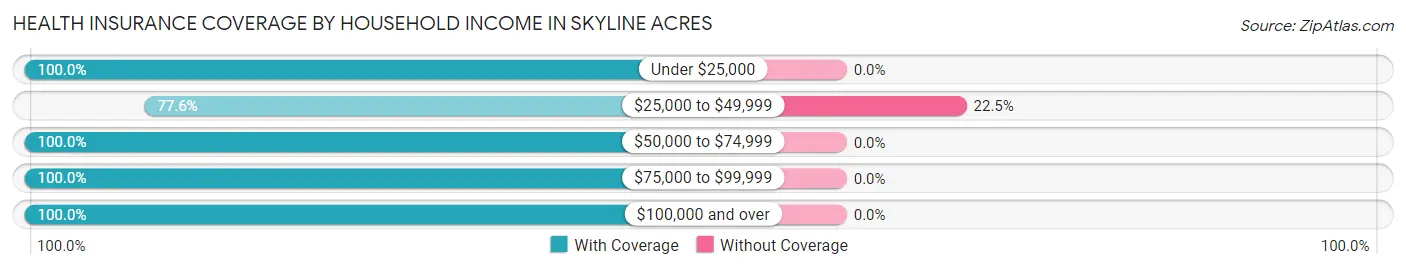
| Household Income | With Coverage | Without Coverage |
| Under $25,000 | 523 (100.0%) | 0 (0.0%) |
| $25,000 to $49,999 | 152 (77.5%) | 44 (22.5%) |
| $50,000 to $74,999 | 17 (100.0%) | 0 (0.0%) |
| $75,000 to $99,999 | 34 (100.0%) | 0 (0.0%) |
| $100,000 and over | 419 (100.0%) | 0 (0.0%) |
Public vs Private Health Insurance Coverage by Age in Skyline Acres
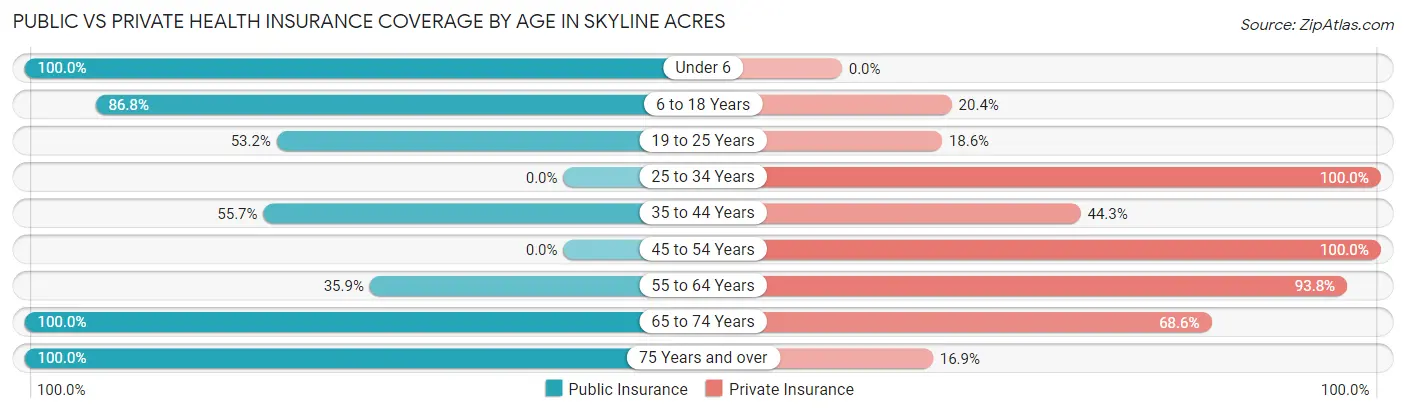
| Age Bracket | Public Insurance | Private Insurance |
| Under 6 | 47 (100.0%) | 0 (0.0%) |
| 6 to 18 Years | 264 (86.8%) | 62 (20.4%) |
| 19 to 25 Years | 83 (53.2%) | 29 (18.6%) |
| 25 to 34 Years | 0 (0.0%) | 18 (100.0%) |
| 35 to 44 Years | 103 (55.7%) | 82 (44.3%) |
| 45 to 54 Years | 0 (0.0%) | 133 (100.0%) |
| 55 to 64 Years | 46 (35.9%) | 120 (93.8%) |
| 65 to 74 Years | 70 (100.0%) | 48 (68.6%) |
| 75 Years and over | 148 (100.0%) | 25 (16.9%) |
| Total | 761 (64.0%) | 517 (43.5%) |
Disability Status by Sex by Age in Skyline Acres
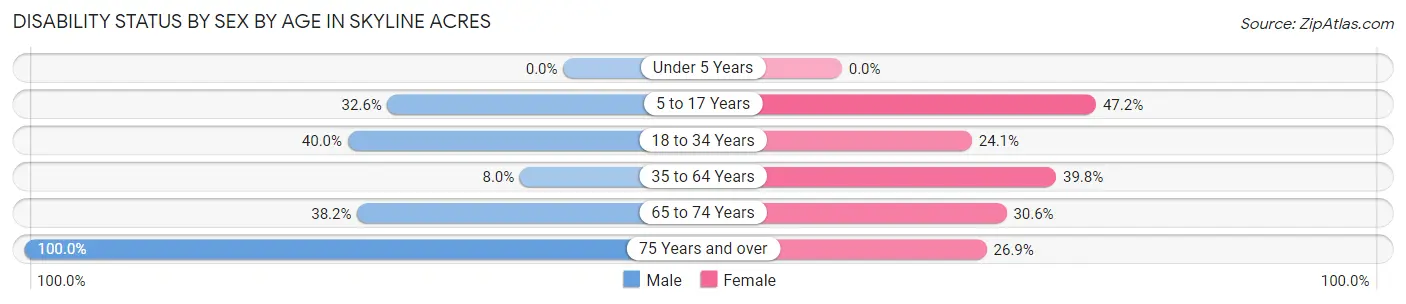
| Age Bracket | Male | Female |
| Under 5 Years | 0 (0.0%) | 0 (0.0%) |
| 5 to 17 Years | 45 (32.6%) | 67 (47.2%) |
| 18 to 34 Years | 56 (40.0%) | 14 (24.1%) |
| 35 to 64 Years | 15 (8.0%) | 103 (39.8%) |
| 65 to 74 Years | 13 (38.2%) | 11 (30.6%) |
| 75 Years and over | 55 (100.0%) | 25 (26.9%) |
Disability Class by Sex by Age in Skyline Acres
Disability Class: Hearing Difficulty
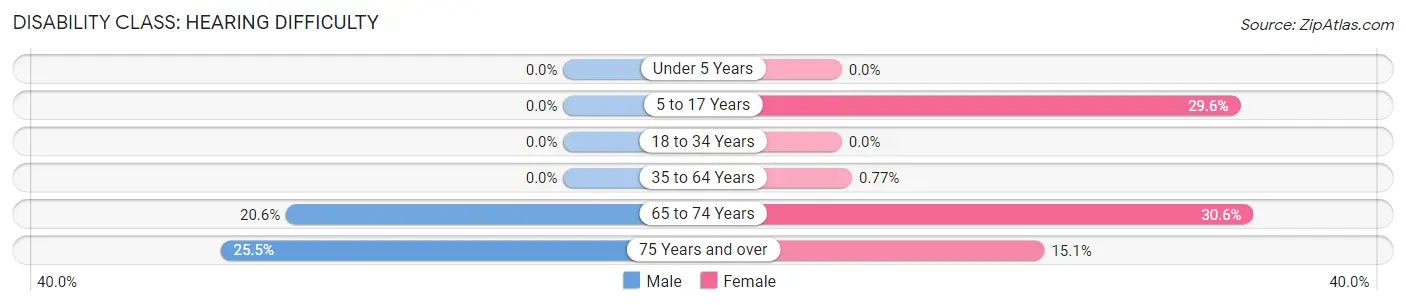
| Age Bracket | Male | Female |
| Under 5 Years | 0 (0.0%) | 0 (0.0%) |
| 5 to 17 Years | 0 (0.0%) | 42 (29.6%) |
| 18 to 34 Years | 0 (0.0%) | 0 (0.0%) |
| 35 to 64 Years | 0 (0.0%) | 2 (0.8%) |
| 65 to 74 Years | 7 (20.6%) | 11 (30.6%) |
| 75 Years and over | 14 (25.5%) | 14 (15.0%) |
Disability Class: Vision Difficulty
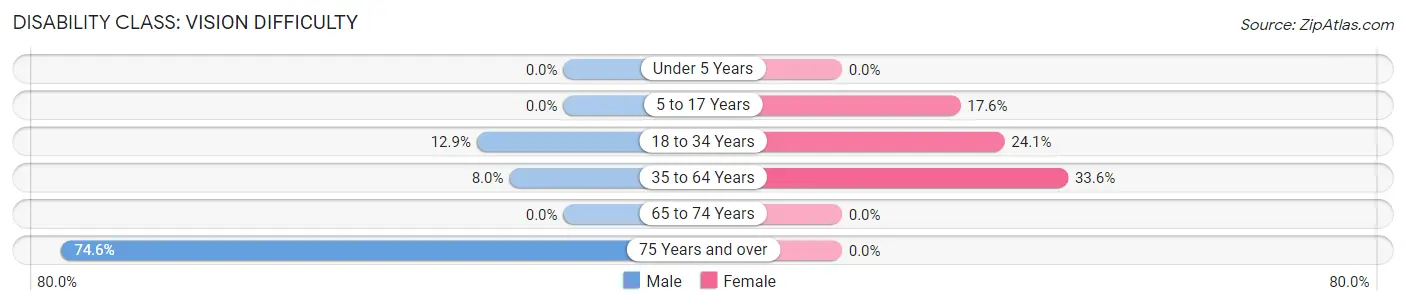
| Age Bracket | Male | Female |
| Under 5 Years | 0 (0.0%) | 0 (0.0%) |
| 5 to 17 Years | 0 (0.0%) | 25 (17.6%) |
| 18 to 34 Years | 18 (12.9%) | 14 (24.1%) |
| 35 to 64 Years | 15 (8.0%) | 87 (33.6%) |
| 65 to 74 Years | 0 (0.0%) | 0 (0.0%) |
| 75 Years and over | 41 (74.6%) | 0 (0.0%) |
Disability Class: Cognitive Difficulty
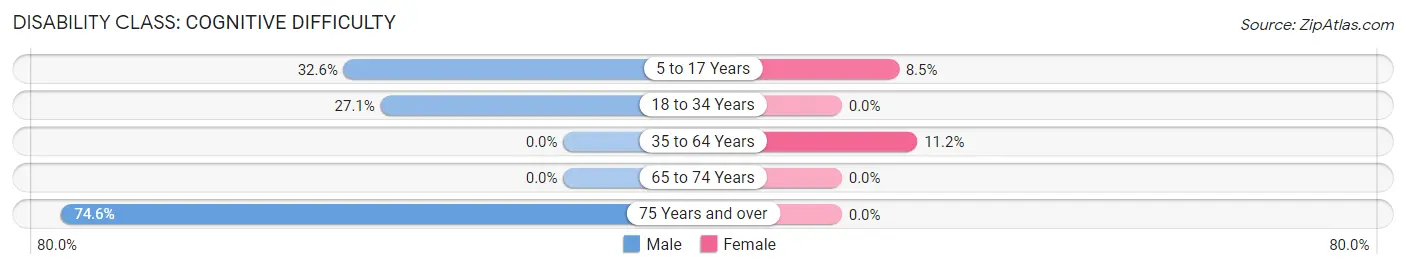
| Age Bracket | Male | Female |
| 5 to 17 Years | 45 (32.6%) | 12 (8.5%) |
| 18 to 34 Years | 38 (27.1%) | 0 (0.0%) |
| 35 to 64 Years | 0 (0.0%) | 29 (11.2%) |
| 65 to 74 Years | 0 (0.0%) | 0 (0.0%) |
| 75 Years and over | 41 (74.6%) | 0 (0.0%) |
Disability Class: Ambulatory Difficulty
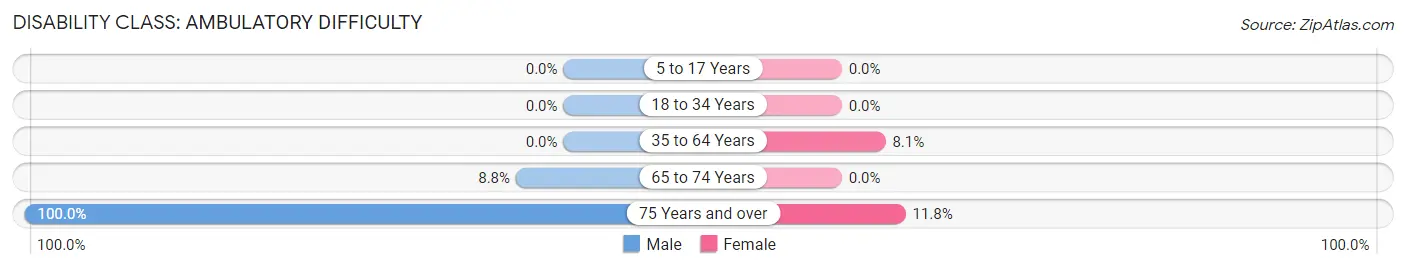
| Age Bracket | Male | Female |
| 5 to 17 Years | 0 (0.0%) | 0 (0.0%) |
| 18 to 34 Years | 0 (0.0%) | 0 (0.0%) |
| 35 to 64 Years | 0 (0.0%) | 21 (8.1%) |
| 65 to 74 Years | 3 (8.8%) | 0 (0.0%) |
| 75 Years and over | 55 (100.0%) | 11 (11.8%) |
Disability Class: Self-Care Difficulty
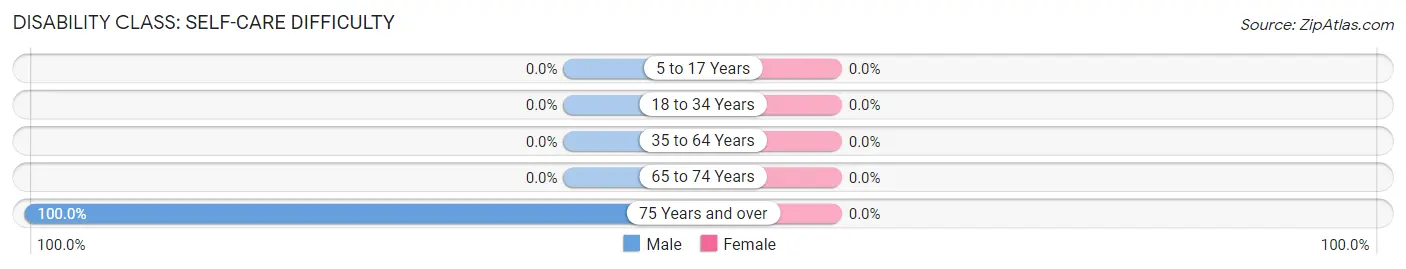
| Age Bracket | Male | Female |
| 5 to 17 Years | 0 (0.0%) | 0 (0.0%) |
| 18 to 34 Years | 0 (0.0%) | 0 (0.0%) |
| 35 to 64 Years | 0 (0.0%) | 0 (0.0%) |
| 65 to 74 Years | 0 (0.0%) | 0 (0.0%) |
| 75 Years and over | 55 (100.0%) | 0 (0.0%) |
Technology Access in Skyline Acres
Computing Device Access in Skyline Acres
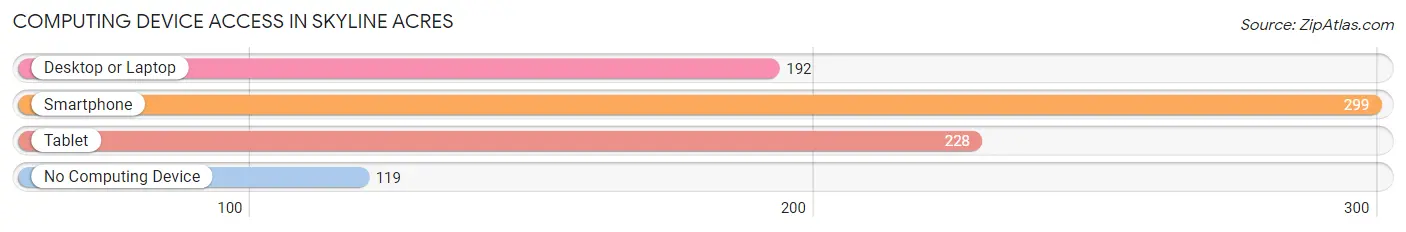
| Device Type | # Households | % Households |
| Desktop or Laptop | 192 | 44.8% |
| Smartphone | 299 | 69.7% |
| Tablet | 228 | 53.1% |
| No Computing Device | 119 | 27.7% |
| Total | 429 | 100.0% |
Internet Access in Skyline Acres
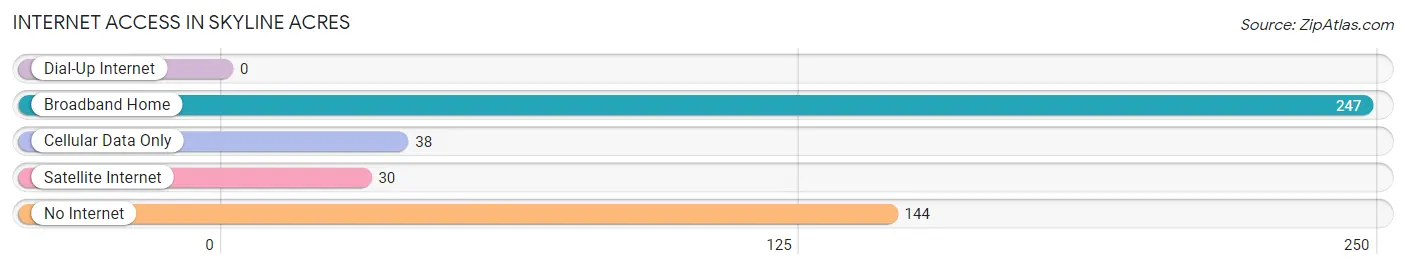
| Internet Type | # Households | % Households |
| Dial-Up Internet | 0 | 0.0% |
| Broadband Home | 247 | 57.6% |
| Cellular Data Only | 38 | 8.9% |
| Satellite Internet | 30 | 7.0% |
| No Internet | 144 | 33.6% |
| Total | 429 | 100.0% |
Skyline Acres Summary
Skyline Acres is a small village located in the state of Ohio, United States. It is situated in the county of Summit and is part of the Akron Metropolitan Statistical Area. The village has a population of approximately 1,000 people and is located in the northeast corner of the county.
History
Skyline Acres was founded in 1820 by a group of settlers from Pennsylvania. The village was originally known as “Skyline” and was named after the nearby hills. The village was incorporated in 1845 and was the first village in Summit County to be incorporated.
The village was originally a farming community and the main crops grown were corn, wheat, and oats. The village also had a few small businesses, such as a general store, a blacksmith, and a sawmill.
In the late 19th century, the village began to grow and the population increased. The village was connected to the outside world by the Akron and Cleveland Railroad in 1881. This allowed for the transportation of goods and people to and from the village.
In the early 20th century, the village began to experience a period of growth and development. The village was connected to the Akron and Cleveland Electric Railway in 1906 and the Akron and Cleveland Interurban Railway in 1910. This allowed for the transportation of goods and people to and from the village.
The village also experienced a period of industrialization in the early 20th century. The village was home to several factories, including a rubber factory, a paper mill, and a steel mill. These factories provided employment for many of the villagers and helped to increase the population of the village.
Geography
Skyline Acres is located in the northeast corner of Summit County, Ohio. The village is situated on the banks of the Cuyahoga River and is surrounded by rolling hills and forests. The village is located approximately 25 miles from the city of Akron and is approximately 40 miles from the city of Cleveland.
The village has a total area of 0.7 square miles and is located at an elevation of 890 feet above sea level. The village is located in a humid continental climate zone and experiences hot summers and cold winters.
Economy
Skyline Acres is a small village and does not have a large economy. The village is primarily a residential community and most of the residents are employed in the nearby cities of Akron and Cleveland. The village does have a few small businesses, such as a general store, a gas station, and a few restaurants.
The village also has a few small manufacturing businesses, such as a rubber factory, a paper mill, and a steel mill. These businesses provide employment for many of the villagers and help to support the local economy.
Demographics
As of the 2010 census, the population of Skyline Acres was 1,000 people. The village has a population density of 1,400 people per square mile. The median age of the village is 43.7 years and the median household income is $45,000.
The village is predominantly white with a small percentage of African Americans and Hispanics. The village also has a small percentage of Asian Americans and Native Americans. The village is predominantly Christian with a small percentage of other religions.
Skyline Acres is a small village with a rich history and a diverse population. The village has a strong sense of community and is a great place to live and work. The village is a great place to raise a family and is a great place to call home.
Common Questions
What is the Total Population of Skyline Acres?
Total Population of Skyline Acres is 1,189.
What is the Total Male Population of Skyline Acres?
Total Male Population of Skyline Acres is 578.
What is the Total Female Population of Skyline Acres?
Total Female Population of Skyline Acres is 611.
What is the Ratio of Males per 100 Females in Skyline Acres?
There are 94.60 Males per 100 Females in Skyline Acres.
What is the Ratio of Females per 100 Males in Skyline Acres?
There are 105.71 Females per 100 Males in Skyline Acres.
What is the Median Population Age in Skyline Acres?
Median Population Age in Skyline Acres is 41.1 Years.
What is the Average Family Size in Skyline Acres
Average Family Size in Skyline Acres is 3.8 People.
What is the Average Household Size in Skyline Acres
Average Household Size in Skyline Acres is 2.8 People.
What is Per Capita Income in Skyline Acres?
Per Capita income in Skyline Acres is $23,834.
What is the Median Family Income in Skyline Acres?
Median Family Income in Skyline Acres is $38,864.
What is Inequality or Gini Index in Skyline Acres?
Inequality or Gini Index in Skyline Acres is 0.44.
How Large is the Labor Force in Skyline Acres?
There are 476 People in the Labor Forcein in Skyline Acres.
What is the Percentage of People in the Labor Force in Skyline Acres?
50.6% of People are in the Labor Force in Skyline Acres.
What is the Unemployment Rate in Skyline Acres?
Unemployment Rate in Skyline Acres is 2.7%.