Twinsburg Heights, OH
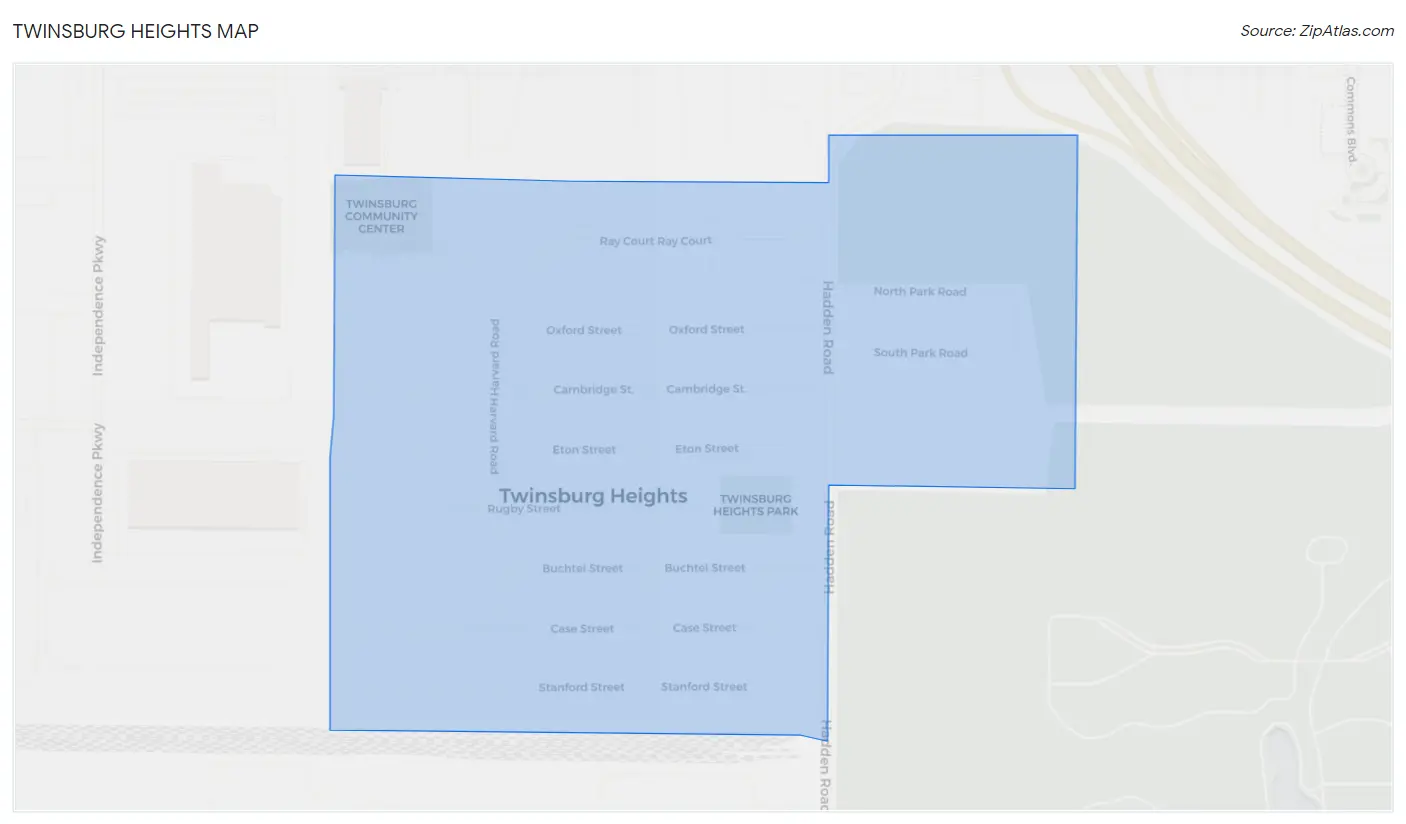
Twinsburg Heights Map
Twinsburg Heights Overview
960
TOTAL POPULATION
433
MALE POPULATION
527
FEMALE POPULATION
82.16
MALES / 100 FEMALES
121.71
FEMALES / 100 MALES
26.1
MEDIAN AGE
3.9
AVG FAMILY SIZE
3.0
AVG HOUSEHOLD SIZE
$23,023
PER CAPITA INCOME
$36,528
AVG HOUSEHOLD INCOME
$11,057
FAMILY INCOME DEFICIT
0.52
INEQUALITY / GINI INDEX
478
LABOR FORCE [ PEOPLE ]
74.0%
PERCENT IN LABOR FORCE
23.2%
UNEMPLOYMENT RATE
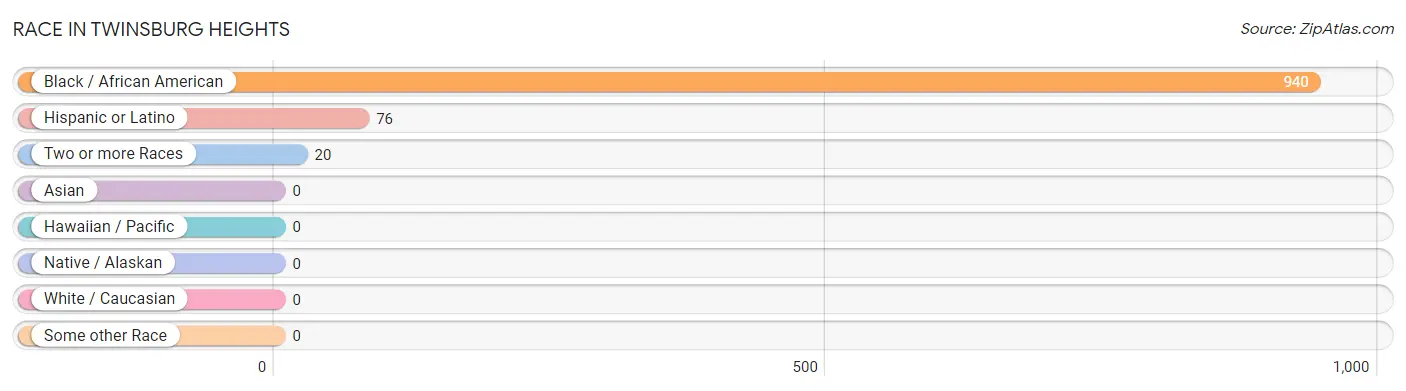
Race in Twinsburg Heights
The most populous races in Twinsburg Heights are Black / African American (940 | 97.9%), Hispanic or Latino (76 | 7.9%), and Two or more Races (20 | 2.1%).
| Race | # Population | % Population |
| Asian | 0 | 0.0% |
| Black / African American | 940 | 97.9% |
| Hawaiian / Pacific | 0 | 0.0% |
| Hispanic or Latino | 76 | 7.9% |
| Native / Alaskan | 0 | 0.0% |
| White / Caucasian | 0 | 0.0% |
| Two or more Races | 20 | 2.1% |
| Some other Race | 0 | 0.0% |
| Total | 960 | 100.0% |
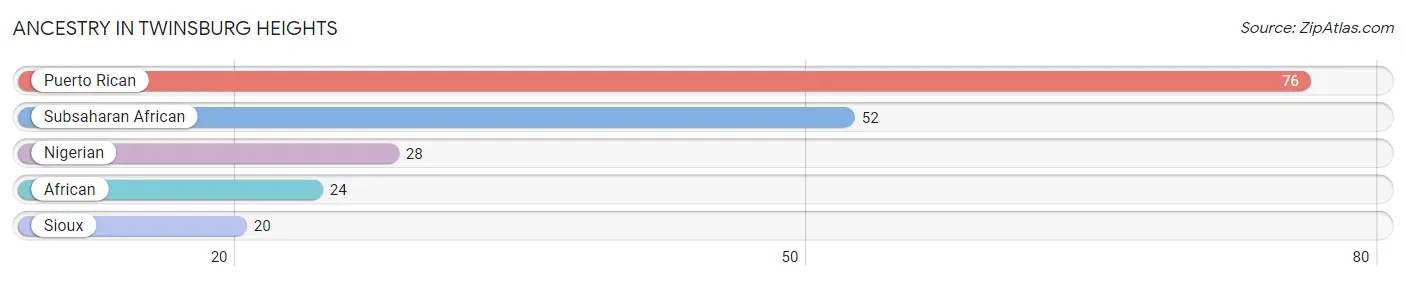
Ancestry in Twinsburg Heights
The most populous ancestries reported in Twinsburg Heights are Puerto Rican (76 | 7.9%), Subsaharan African (52 | 5.4%), Nigerian (28 | 2.9%), African (24 | 2.5%), and Sioux (20 | 2.1%), together accounting for 20.8% of all Twinsburg Heights residents.
| Ancestry | # Population | % Population |
| African | 24 | 2.5% |
| Nigerian | 28 | 2.9% |
| Puerto Rican | 76 | 7.9% |
| Sioux | 20 | 2.1% |
| Subsaharan African | 52 | 5.4% | View All 5 Rows |
Immigrants in Twinsburg Heights

| Immigration Origin | # Population | % Population | View All 0 Rows |
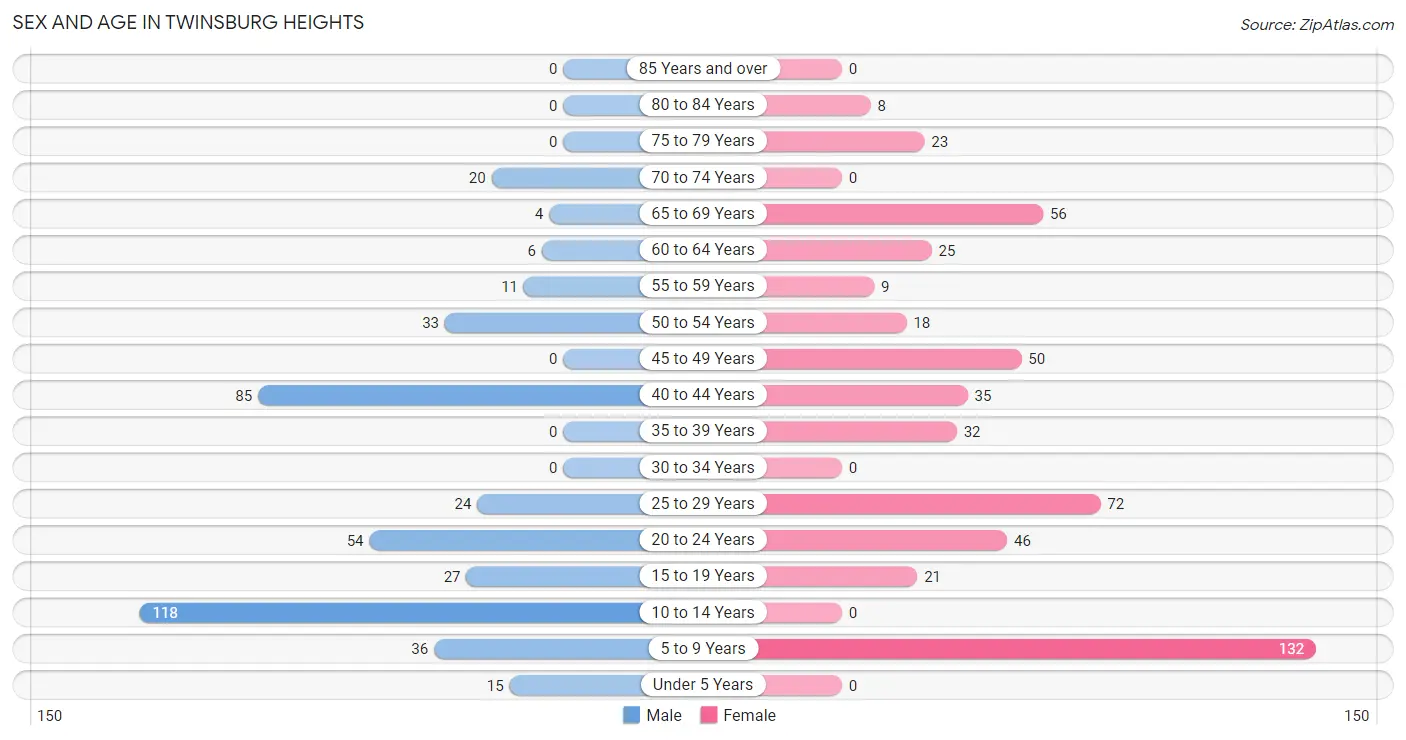
Sex and Age in Twinsburg Heights
Sex and Age in Twinsburg Heights
The most populous age groups in Twinsburg Heights are 10 to 14 Years (118 | 27.3%) for men and 5 to 9 Years (132 | 25.1%) for women.
| Age Bracket | Male | Female |
| Under 5 Years | 15 (3.5%) | 0 (0.0%) |
| 5 to 9 Years | 36 (8.3%) | 132 (25.1%) |
| 10 to 14 Years | 118 (27.3%) | 0 (0.0%) |
| 15 to 19 Years | 27 (6.2%) | 21 (4.0%) |
| 20 to 24 Years | 54 (12.5%) | 46 (8.7%) |
| 25 to 29 Years | 24 (5.5%) | 72 (13.7%) |
| 30 to 34 Years | 0 (0.0%) | 0 (0.0%) |
| 35 to 39 Years | 0 (0.0%) | 32 (6.1%) |
| 40 to 44 Years | 85 (19.6%) | 35 (6.6%) |
| 45 to 49 Years | 0 (0.0%) | 50 (9.5%) |
| 50 to 54 Years | 33 (7.6%) | 18 (3.4%) |
| 55 to 59 Years | 11 (2.5%) | 9 (1.7%) |
| 60 to 64 Years | 6 (1.4%) | 25 (4.7%) |
| 65 to 69 Years | 4 (0.9%) | 56 (10.6%) |
| 70 to 74 Years | 20 (4.6%) | 0 (0.0%) |
| 75 to 79 Years | 0 (0.0%) | 23 (4.4%) |
| 80 to 84 Years | 0 (0.0%) | 8 (1.5%) |
| 85 Years and over | 0 (0.0%) | 0 (0.0%) |
| Total | 433 (100.0%) | 527 (100.0%) |
Families and Households in Twinsburg Heights
Median Family Size in Twinsburg Heights
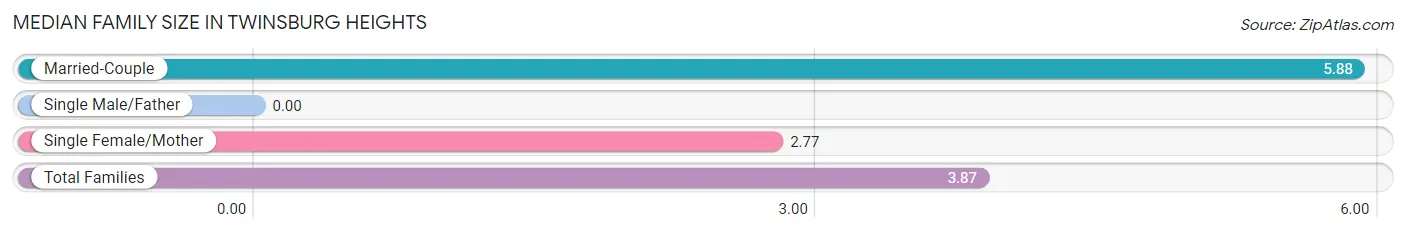
| Family Type | # Families | Family Size |
| Married-Couple | 77 (35.3%) | 5.88 |
| Single Male/Father | 0 (0.0%) | - |
| Single Female/Mother | 141 (64.7%) | 2.77 |
| Total Families | 218 (100.0%) | 3.87 |
Median Household Size in Twinsburg Heights
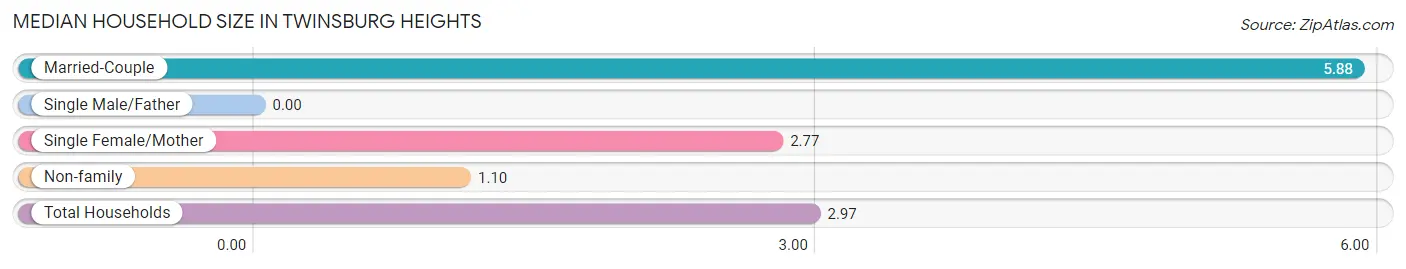
| Household Type | # Households | Household Size |
| Married-Couple | 77 (23.8%) | 5.88 |
| Single Male/Father | 0 (0.0%) | - |
| Single Female/Mother | 141 (43.6%) | 2.77 |
| Non-family | 105 (32.5%) | 1.10 |
| Total Households | 323 (100.0%) | 2.97 |
Household Size by Marriage Status in Twinsburg Heights
Out of a total of 323 households in Twinsburg Heights, 218 (67.5%) are family households, while 105 (32.5%) are nonfamily households. The most numerous type of family households are 2-person households, comprising 91, and the most common type of nonfamily households are 1-person households, comprising 95.
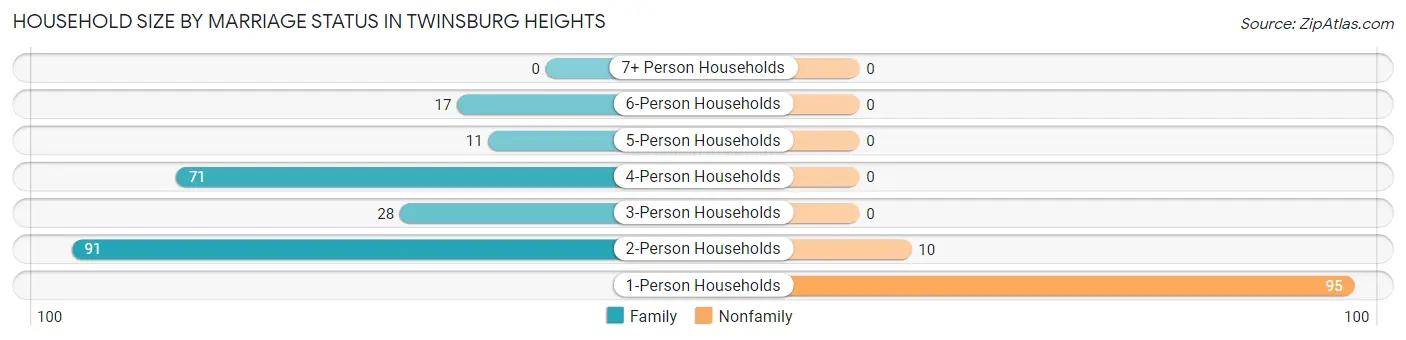
| Household Size | Family Households | Nonfamily Households |
| 1-Person Households | - | 95 (29.4%) |
| 2-Person Households | 91 (28.2%) | 10 (3.1%) |
| 3-Person Households | 28 (8.7%) | 0 (0.0%) |
| 4-Person Households | 71 (22.0%) | 0 (0.0%) |
| 5-Person Households | 11 (3.4%) | 0 (0.0%) |
| 6-Person Households | 17 (5.3%) | 0 (0.0%) |
| 7+ Person Households | 0 (0.0%) | 0 (0.0%) |
| Total | 218 (67.5%) | 105 (32.5%) |
Female Fertility in Twinsburg Heights
Fertility by Age in Twinsburg Heights
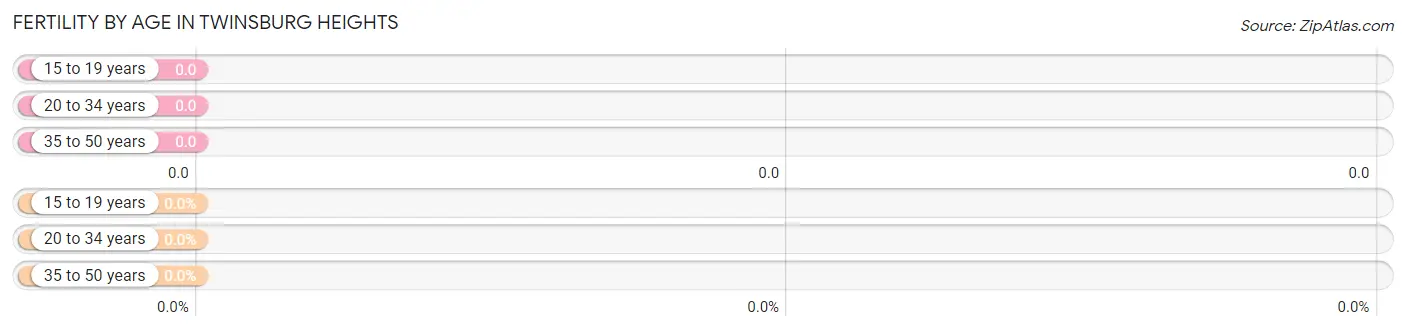
| Age Bracket | Women with Births | Births / 1,000 Women |
| 15 to 19 years | 0 (0.0%) | 0.0 |
| 20 to 34 years | 0 (0.0%) | 0.0 |
| 35 to 50 years | 0 (0.0%) | 0.0 |
| Total | 0 (0.0%) | 0.0 |
Fertility by Age by Marriage Status in Twinsburg Heights
| Age Bracket | Married | Unmarried |
| 15 to 19 years | 0 (0.0%) | 0 (0.0%) |
| 20 to 34 years | 0 (0.0%) | 0 (0.0%) |
| 35 to 50 years | 0 (0.0%) | 0 (0.0%) |
| Total | 0 (0.0%) | 0 (0.0%) |
Fertility by Education in Twinsburg Heights
| Educational Attainment | Women with Births | Births / 1,000 Women |
| Less than High School | 0 (0.0%) | 0.0 |
| High School Diploma | 0 (0.0%) | 0.0 |
| College or Associate's Degree | 0 (0.0%) | 0.0 |
| Bachelor's Degree | 0 (0.0%) | 0.0 |
| Graduate Degree | 0 (0.0%) | 0.0 |
| Total | 0 (0.0%) | 0.0 |
Fertility by Education by Marriage Status in Twinsburg Heights
| Educational Attainment | Married | Unmarried |
| Less than High School | 0 (0.0%) | 0 (0.0%) |
| High School Diploma | 0 (0.0%) | 0 (0.0%) |
| College or Associate's Degree | 0 (0.0%) | 0 (0.0%) |
| Bachelor's Degree | 0 (0.0%) | 0 (0.0%) |
| Graduate Degree | 0 (0.0%) | 0 (0.0%) |
| Total | 0 (0.0%) | 0 (0.0%) |
Income in Twinsburg Heights
Income Overview in Twinsburg Heights
| Characteristic | Number | Measure |
| Per Capita Income | 960 | $23,023 |
| Median Family Income | 218 | $0 |
| Mean Family Income | 218 | $70,544 |
| Median Household Income | 323 | $36,528 |
| Mean Household Income | 323 | $57,763 |
| Income Deficit | 218 | $11,057 |
| Wage / Income Gap (%) | 960 | 0.00% |
| Wage / Income Gap ($) | 960 | 100.00¢ per $1 |
| Gini / Inequality Index | 960 | 0.52 |
Earnings by Sex in Twinsburg Heights
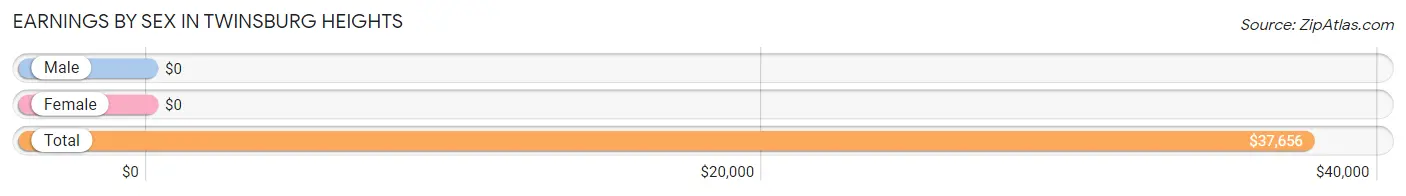
| Sex | Number | Average Earnings |
| Male | 228 (49.3%) | $0 |
| Female | 234 (50.6%) | $0 |
| Total | 462 (100.0%) | $37,656 |
Earnings by Sex by Income Bracket in Twinsburg Heights
The most common earnings brackets in Twinsburg Heights are $75,000 to $99,999 for men (68 | 29.8%) and $2,500 to $4,999 for women (56 | 23.9%).
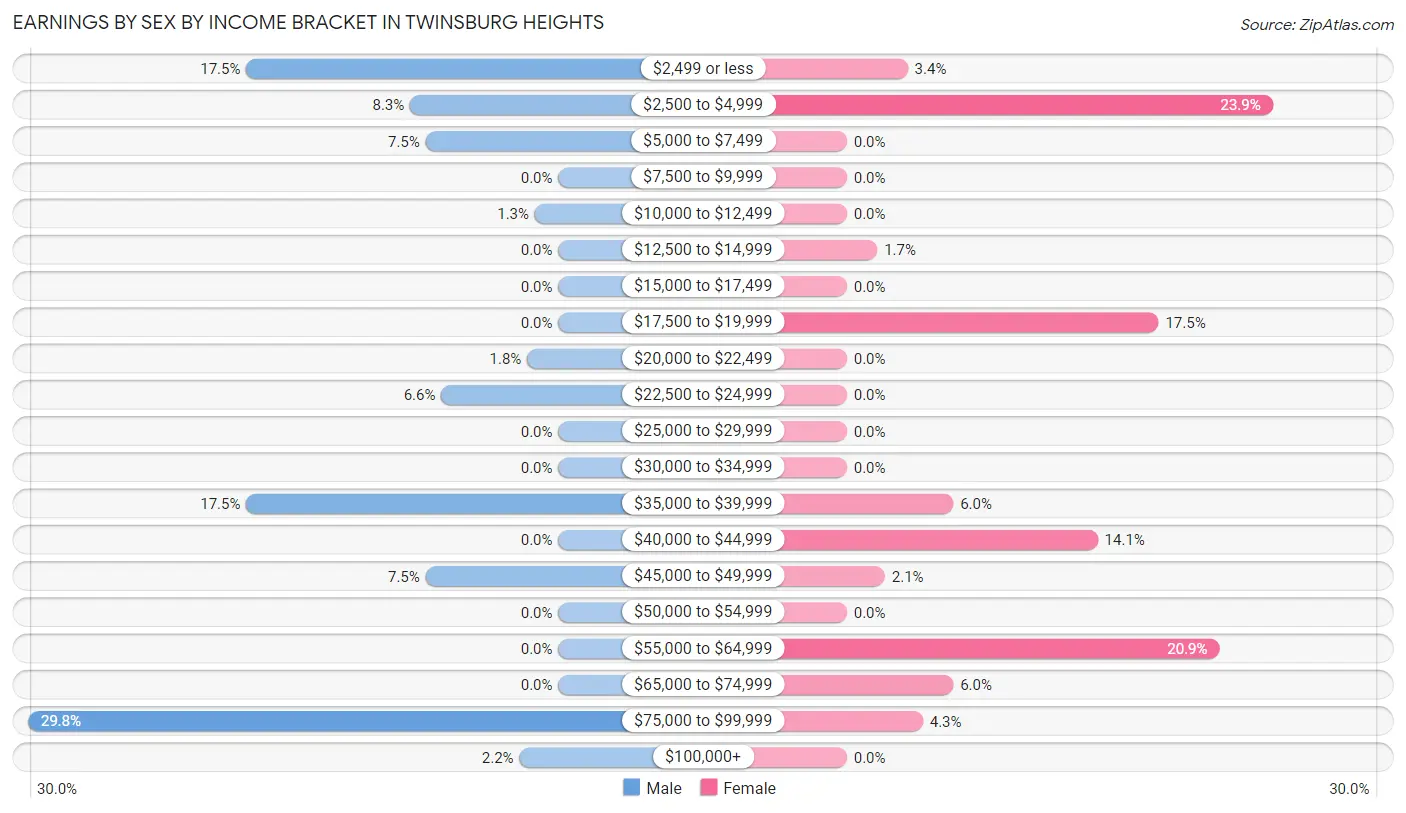
| Income | Male | Female |
| $2,499 or less | 40 (17.5%) | 8 (3.4%) |
| $2,500 to $4,999 | 19 (8.3%) | 56 (23.9%) |
| $5,000 to $7,499 | 17 (7.5%) | 0 (0.0%) |
| $7,500 to $9,999 | 0 (0.0%) | 0 (0.0%) |
| $10,000 to $12,499 | 3 (1.3%) | 0 (0.0%) |
| $12,500 to $14,999 | 0 (0.0%) | 4 (1.7%) |
| $15,000 to $17,499 | 0 (0.0%) | 0 (0.0%) |
| $17,500 to $19,999 | 0 (0.0%) | 41 (17.5%) |
| $20,000 to $22,499 | 4 (1.8%) | 0 (0.0%) |
| $22,500 to $24,999 | 15 (6.6%) | 0 (0.0%) |
| $25,000 to $29,999 | 0 (0.0%) | 0 (0.0%) |
| $30,000 to $34,999 | 0 (0.0%) | 0 (0.0%) |
| $35,000 to $39,999 | 40 (17.5%) | 14 (6.0%) |
| $40,000 to $44,999 | 0 (0.0%) | 33 (14.1%) |
| $45,000 to $49,999 | 17 (7.5%) | 5 (2.1%) |
| $50,000 to $54,999 | 0 (0.0%) | 0 (0.0%) |
| $55,000 to $64,999 | 0 (0.0%) | 49 (20.9%) |
| $65,000 to $74,999 | 0 (0.0%) | 14 (6.0%) |
| $75,000 to $99,999 | 68 (29.8%) | 10 (4.3%) |
| $100,000+ | 5 (2.2%) | 0 (0.0%) |
| Total | 228 (100.0%) | 234 (100.0%) |
Earnings by Sex by Educational Attainment in Twinsburg Heights
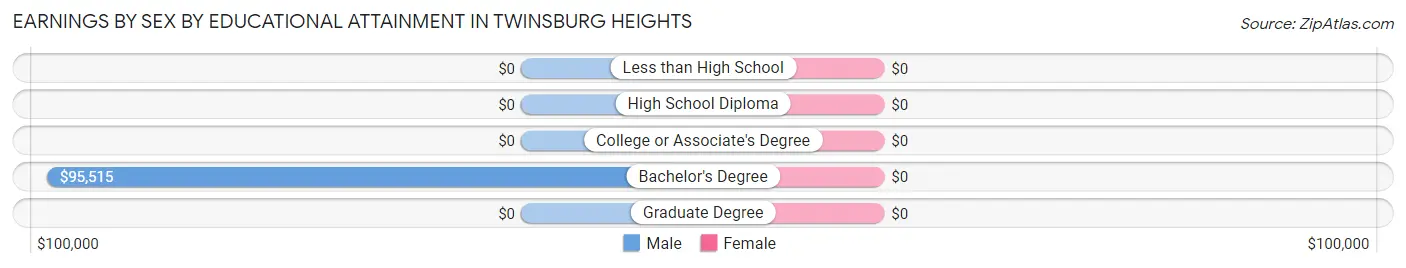
| Educational Attainment | Male Income | Female Income |
| Less than High School | - | - |
| High School Diploma | - | - |
| College or Associate's Degree | - | - |
| Bachelor's Degree | $95,515 | $0 |
| Graduate Degree | - | - |
| Total | - | - |
Family Income in Twinsburg Heights
Family Income Brackets in Twinsburg Heights
According to the Twinsburg Heights family income data, there are 67 families falling into the less than $10,000 income range, which is the most common income bracket and makes up 30.7% of all families.
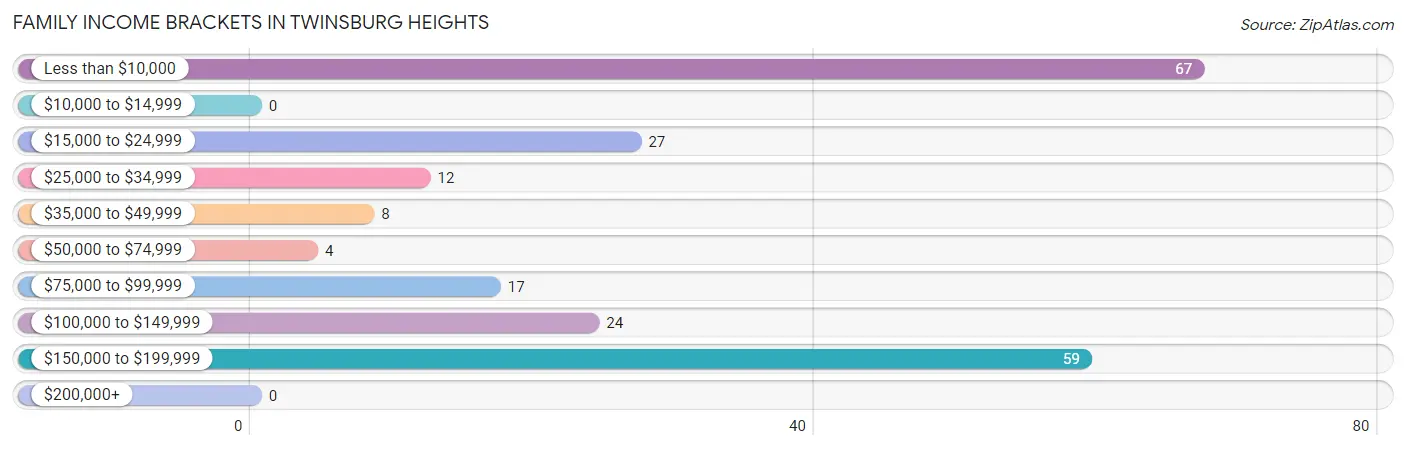
| Income Bracket | # Families | % Families |
| Less than $10,000 | 67 | 30.7% |
| $10,000 to $14,999 | 0 | 0.0% |
| $15,000 to $24,999 | 27 | 12.4% |
| $25,000 to $34,999 | 12 | 5.5% |
| $35,000 to $49,999 | 8 | 3.7% |
| $50,000 to $74,999 | 4 | 1.8% |
| $75,000 to $99,999 | 17 | 7.8% |
| $100,000 to $149,999 | 24 | 11.0% |
| $150,000 to $199,999 | 59 | 27.1% |
| $200,000+ | 0 | 0.0% |
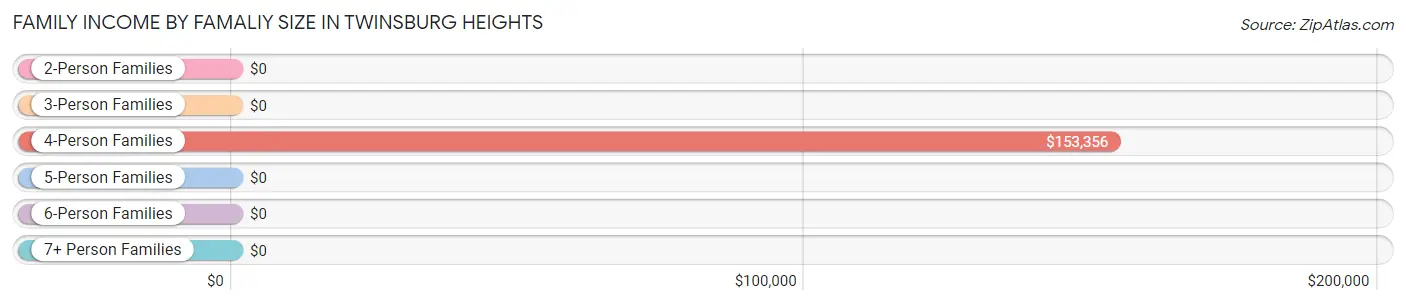
Family Income by Famaliy Size in Twinsburg Heights
4-person families (71 | 32.6%) account for the highest median family income in Twinsburg Heights with $153,356 per family, while 4-person families (71 | 32.6%) have the highest median income of $38,339 per family member.
| Income Bracket | # Families | Median Income |
| 2-Person Families | 91 (41.7%) | $0 |
| 3-Person Families | 28 (12.8%) | $0 |
| 4-Person Families | 71 (32.6%) | $153,356 |
| 5-Person Families | 11 (5.1%) | $0 |
| 6-Person Families | 17 (7.8%) | $0 |
| 7+ Person Families | 0 (0.0%) | $0 |
| Total | 218 (100.0%) | $0 |
Family Income by Number of Earners in Twinsburg Heights
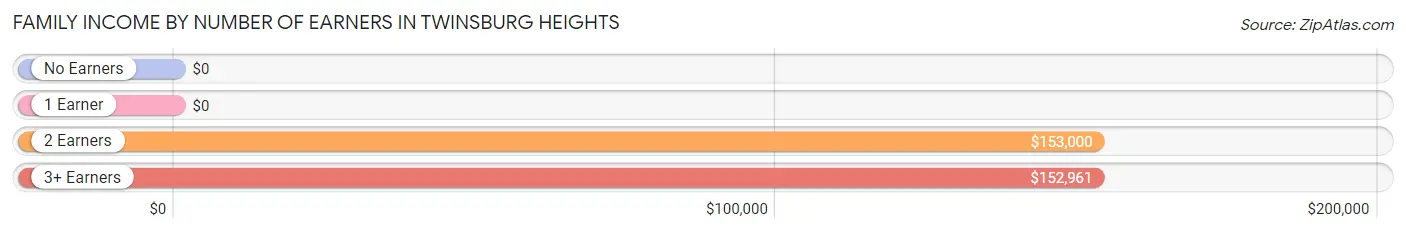
| Number of Earners | # Families | Median Income |
| No Earners | 31 (14.2%) | $0 |
| 1 Earner | 90 (41.3%) | $0 |
| 2 Earners | 56 (25.7%) | $153,000 |
| 3+ Earners | 41 (18.8%) | $152,961 |
| Total | 218 (100.0%) | $0 |
Household Income in Twinsburg Heights
Household Income Brackets in Twinsburg Heights
With 67 households falling in the category, the less than $10,000 income range is the most frequent in Twinsburg Heights, accounting for 20.7% of all households.
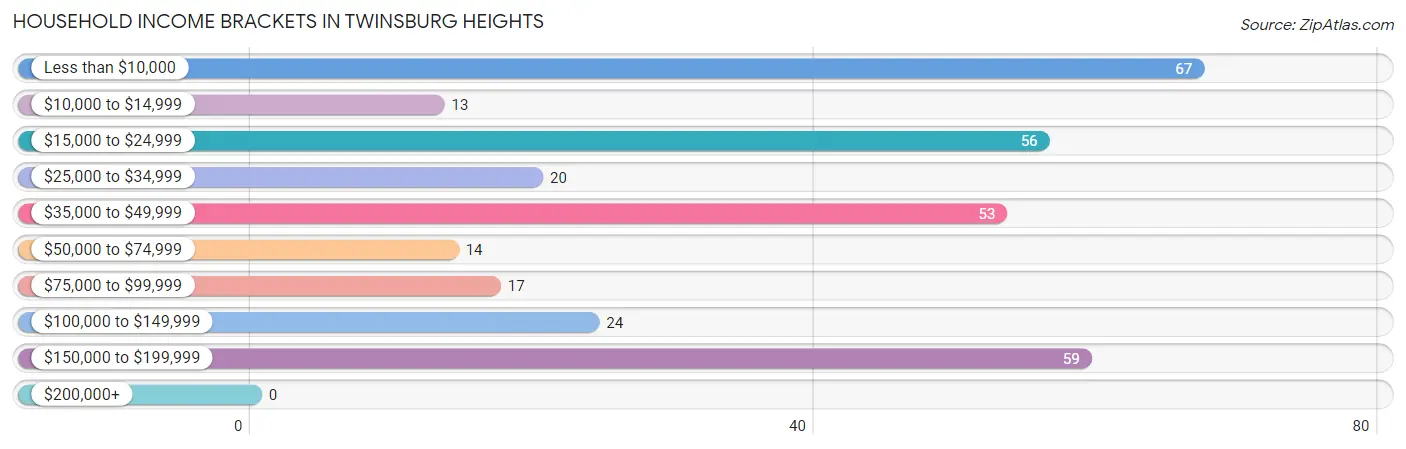
| Income Bracket | # Households | % Households |
| Less than $10,000 | 67 | 20.7% |
| $10,000 to $14,999 | 13 | 4.0% |
| $15,000 to $24,999 | 56 | 17.3% |
| $25,000 to $34,999 | 20 | 6.2% |
| $35,000 to $49,999 | 53 | 16.4% |
| $50,000 to $74,999 | 14 | 4.3% |
| $75,000 to $99,999 | 17 | 5.3% |
| $100,000 to $149,999 | 24 | 7.4% |
| $150,000 to $199,999 | 59 | 18.3% |
| $200,000+ | 0 | 0.0% |
Household Income by Householder Age in Twinsburg Heights
The median household income in Twinsburg Heights is $36,528, with the highest median household income of $44,866 found in the 65+ years age bracket for the primary householder. A total of 95 households (29.4%) fall into this category.
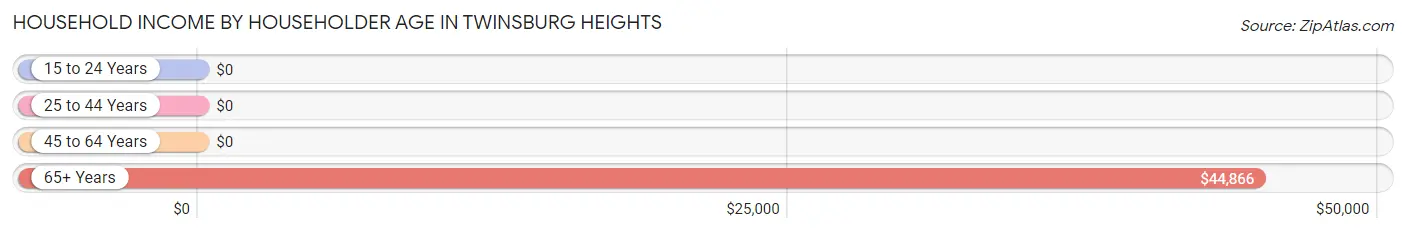
| Income Bracket | # Households | Median Income |
| 15 to 24 Years | 0 (0.0%) | $0 |
| 25 to 44 Years | 150 (46.4%) | $0 |
| 45 to 64 Years | 78 (24.1%) | $0 |
| 65+ Years | 95 (29.4%) | $44,866 |
| Total | 323 (100.0%) | $36,528 |
Poverty in Twinsburg Heights
Income Below Poverty by Sex and Age in Twinsburg Heights
With 12.7% poverty level for males and 33.6% for females among the residents of Twinsburg Heights, 6 to 11 year old males and 25 to 34 year old females are the most vulnerable to poverty, with 36 males (30.8%) and 72 females (100.0%) in their respective age groups living below the poverty level.
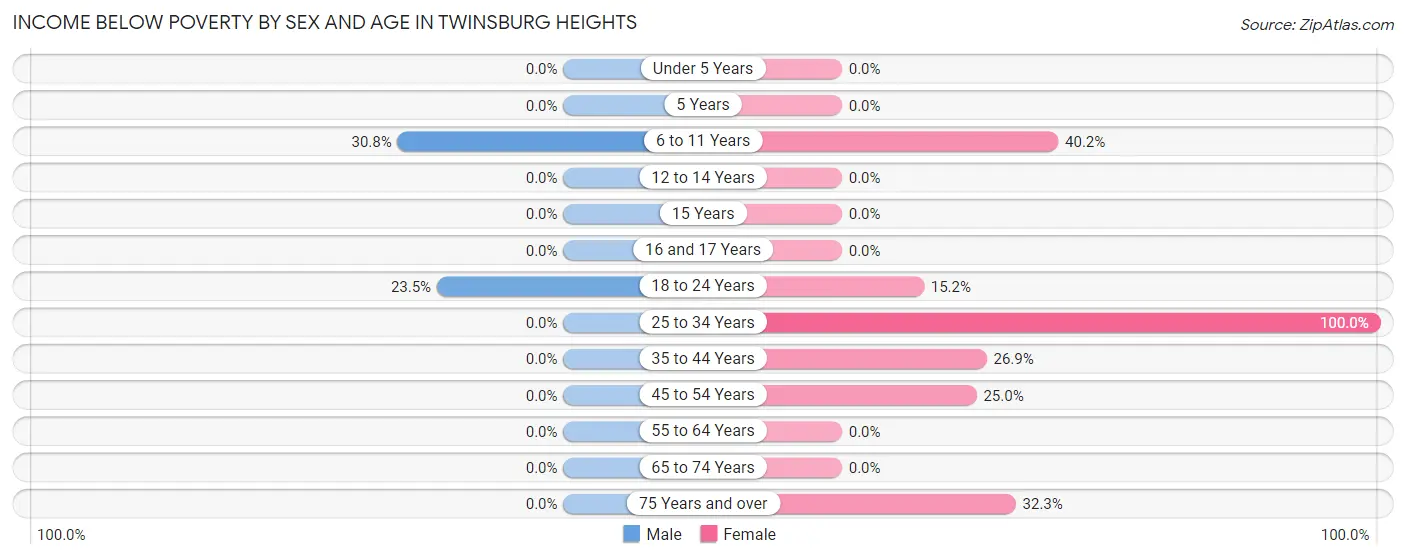
| Age Bracket | Male | Female |
| Under 5 Years | 0 (0.0%) | 0 (0.0%) |
| 5 Years | 0 (0.0%) | 0 (0.0%) |
| 6 to 11 Years | 36 (30.8%) | 53 (40.2%) |
| 12 to 14 Years | 0 (0.0%) | 0 (0.0%) |
| 15 Years | 0 (0.0%) | 0 (0.0%) |
| 16 and 17 Years | 0 (0.0%) | 0 (0.0%) |
| 18 to 24 Years | 19 (23.5%) | 7 (15.2%) |
| 25 to 34 Years | 0 (0.0%) | 72 (100.0%) |
| 35 to 44 Years | 0 (0.0%) | 18 (26.9%) |
| 45 to 54 Years | 0 (0.0%) | 17 (25.0%) |
| 55 to 64 Years | 0 (0.0%) | 0 (0.0%) |
| 65 to 74 Years | 0 (0.0%) | 0 (0.0%) |
| 75 Years and over | 0 (0.0%) | 10 (32.3%) |
| Total | 55 (12.7%) | 177 (33.6%) |
Income Above Poverty by Sex and Age in Twinsburg Heights
According to the poverty statistics in Twinsburg Heights, males aged under 5 years and females aged 15 years are the age groups that are most secure financially, with 100.0% of males and 100.0% of females in these age groups living above the poverty line.
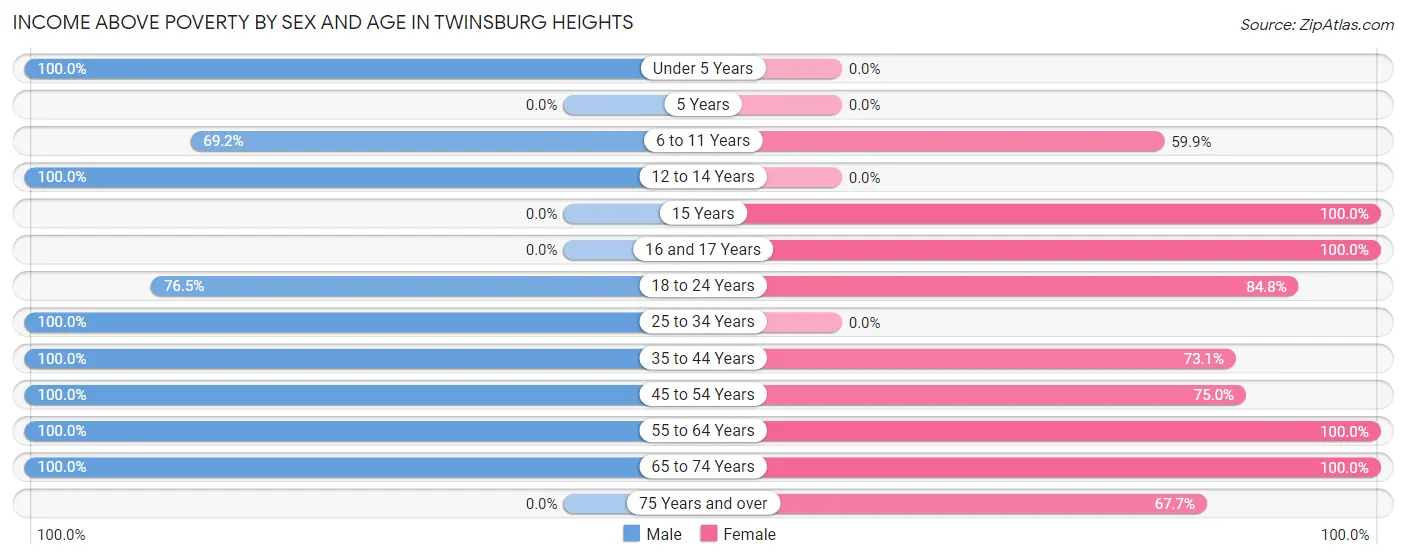
| Age Bracket | Male | Female |
| Under 5 Years | 15 (100.0%) | 0 (0.0%) |
| 5 Years | 0 (0.0%) | 0 (0.0%) |
| 6 to 11 Years | 81 (69.2%) | 79 (59.9%) |
| 12 to 14 Years | 37 (100.0%) | 0 (0.0%) |
| 15 Years | 0 (0.0%) | 13 (100.0%) |
| 16 and 17 Years | 0 (0.0%) | 8 (100.0%) |
| 18 to 24 Years | 62 (76.5%) | 39 (84.8%) |
| 25 to 34 Years | 24 (100.0%) | 0 (0.0%) |
| 35 to 44 Years | 85 (100.0%) | 49 (73.1%) |
| 45 to 54 Years | 33 (100.0%) | 51 (75.0%) |
| 55 to 64 Years | 17 (100.0%) | 34 (100.0%) |
| 65 to 74 Years | 24 (100.0%) | 56 (100.0%) |
| 75 Years and over | 0 (0.0%) | 21 (67.7%) |
| Total | 378 (87.3%) | 350 (66.4%) |
Income Below Poverty Among Married-Couple Families in Twinsburg Heights
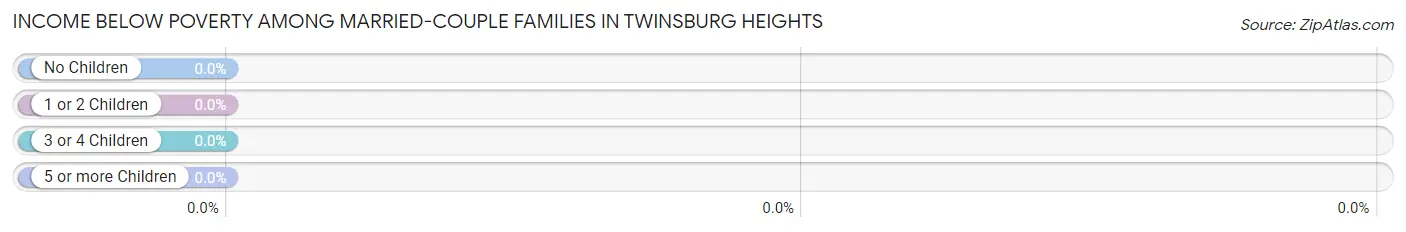
| Children | Above Poverty | Below Poverty |
| No Children | 9 (100.0%) | 0 (0.0%) |
| 1 or 2 Children | 40 (100.0%) | 0 (0.0%) |
| 3 or 4 Children | 28 (100.0%) | 0 (0.0%) |
| 5 or more Children | 0 (0.0%) | 0 (0.0%) |
| Total | 77 (100.0%) | 0 (0.0%) |
Income Below Poverty Among Single-Parent Households in Twinsburg Heights
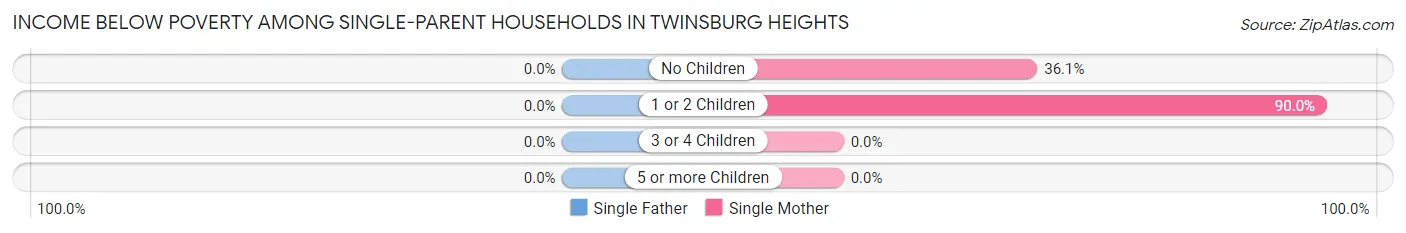
| Children | Single Father | Single Mother |
| No Children | 0 (0.0%) | 22 (36.1%) |
| 1 or 2 Children | 0 (0.0%) | 72 (90.0%) |
| 3 or 4 Children | 0 (0.0%) | 0 (0.0%) |
| 5 or more Children | 0 (0.0%) | 0 (0.0%) |
| Total | 0 (0.0%) | 94 (66.7%) |
Income Below Poverty Among Married-Couple vs Single-Parent Households in Twinsburg Heights
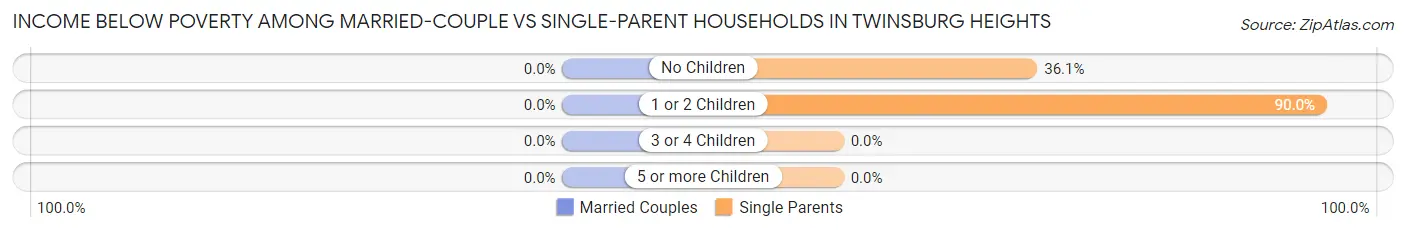
| Children | Married-Couple Families | Single-Parent Households |
| No Children | 0 (0.0%) | 22 (36.1%) |
| 1 or 2 Children | 0 (0.0%) | 72 (90.0%) |
| 3 or 4 Children | 0 (0.0%) | 0 (0.0%) |
| 5 or more Children | 0 (0.0%) | 0 (0.0%) |
| Total | 0 (0.0%) | 94 (66.7%) |
Employment Characteristics in Twinsburg Heights
Employment by Class of Employer in Twinsburg Heights
Among the 367 employed individuals in Twinsburg Heights, private company employees (202 | 55.0%), local government employees (122 | 33.2%), and self-employed (not incorporated) (17 | 4.6%) make up the most common classes of employment.
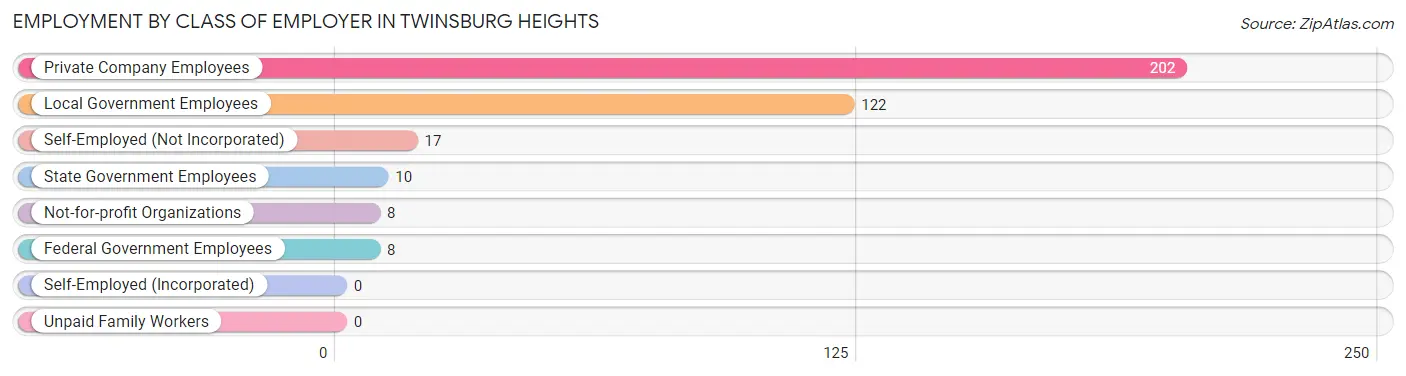
| Employer Class | # Employees | % Employees |
| Private Company Employees | 202 | 55.0% |
| Self-Employed (Incorporated) | 0 | 0.0% |
| Self-Employed (Not Incorporated) | 17 | 4.6% |
| Not-for-profit Organizations | 8 | 2.2% |
| Local Government Employees | 122 | 33.2% |
| State Government Employees | 10 | 2.7% |
| Federal Government Employees | 8 | 2.2% |
| Unpaid Family Workers | 0 | 0.0% |
| Total | 367 | 100.0% |
Employment Status by Age in Twinsburg Heights
According to the labor force statistics for Twinsburg Heights, out of the total population over 16 years of age (646), 74.0% or 478 individuals are in the labor force, with 23.2% or 111 of them unemployed. The age group with the highest labor force participation rate is 55 to 59 years, with 100.0% or 20 individuals in the labor force. Within the labor force, the 25 to 29 years age range has the highest percentage of unemployed individuals, with 67.1% or 49 of them being unemployed.
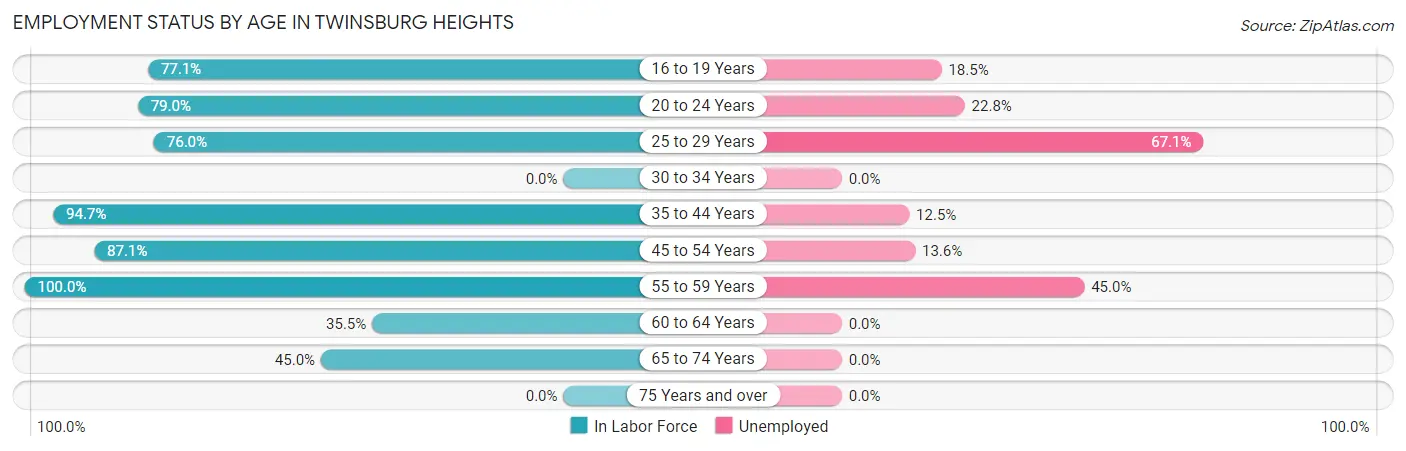
| Age Bracket | In Labor Force | Unemployed |
| 16 to 19 Years | 27 (77.1%) | 5 (18.5%) |
| 20 to 24 Years | 79 (79.0%) | 18 (22.8%) |
| 25 to 29 Years | 73 (76.0%) | 49 (67.1%) |
| 30 to 34 Years | 0 (0.0%) | 0 (0.0%) |
| 35 to 44 Years | 144 (94.7%) | 18 (12.5%) |
| 45 to 54 Years | 88 (87.1%) | 12 (13.6%) |
| 55 to 59 Years | 20 (100.0%) | 9 (45.0%) |
| 60 to 64 Years | 11 (35.5%) | 0 (0.0%) |
| 65 to 74 Years | 36 (45.0%) | 0 (0.0%) |
| 75 Years and over | 0 (0.0%) | 0 (0.0%) |
| Total | 478 (74.0%) | 111 (23.2%) |
Employment Status by Educational Attainment in Twinsburg Heights
According to labor force statistics for Twinsburg Heights, 84.0% of individuals (336) out of the total population between 25 and 64 years of age (400) are in the labor force, with 26.2% or 88 of them being unemployed. The group with the highest labor force participation rate are those with the educational attainment of bachelor's degree or higher, with 100.0% or 157 individuals in the labor force. Within the labor force, individuals with high school diploma education have the highest percentage of unemployment, with 70.1% or 61 of them being unemployed.
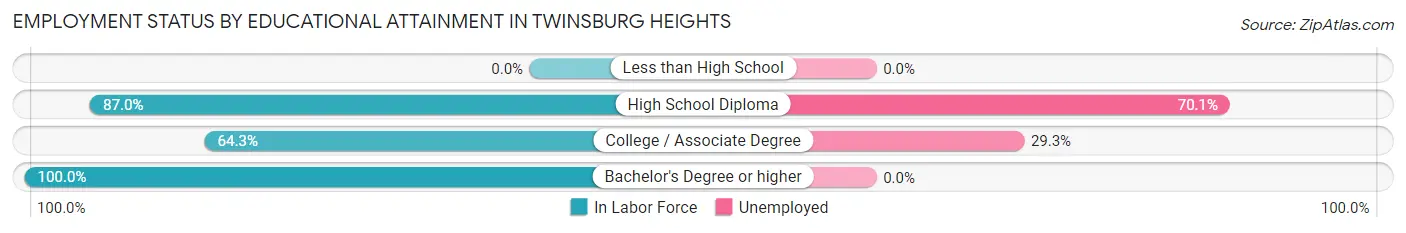
| Educational Attainment | In Labor Force | Unemployed |
| Less than High School | 0 (0.0%) | 0 (0.0%) |
| High School Diploma | 87 (87.0%) | 70 (70.1%) |
| College / Associate Degree | 92 (64.3%) | 42 (29.3%) |
| Bachelor's Degree or higher | 157 (100.0%) | 0 (0.0%) |
| Total | 336 (84.0%) | 105 (26.2%) |
Employment Occupations by Sex in Twinsburg Heights
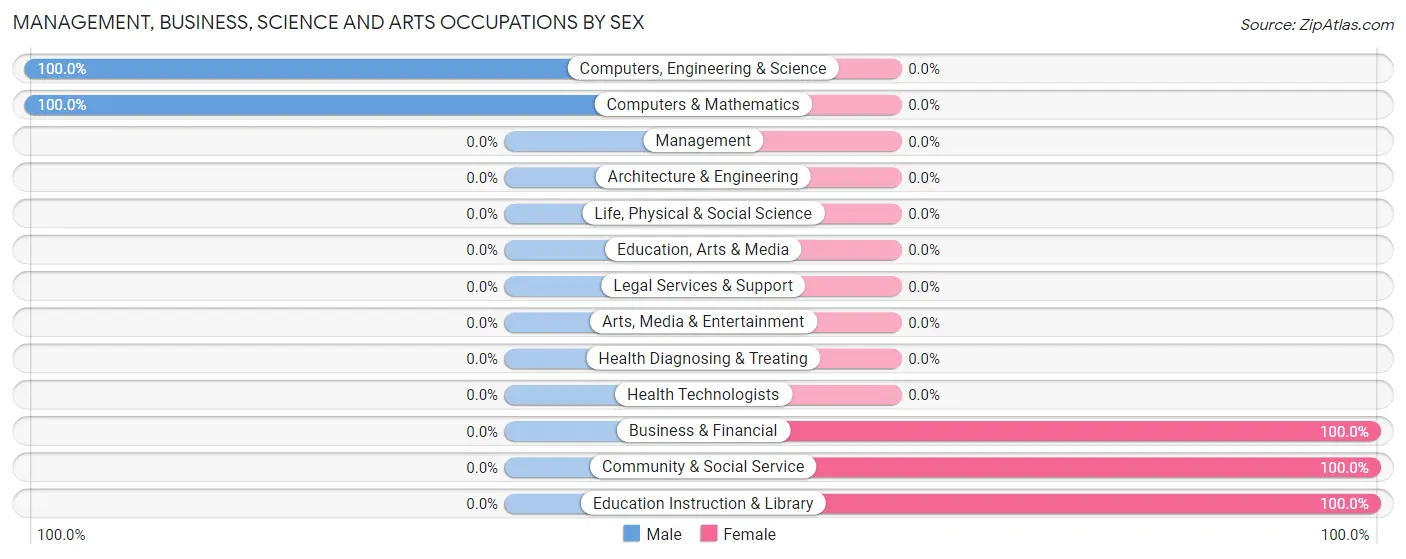
Management, Business, Science and Arts Occupations
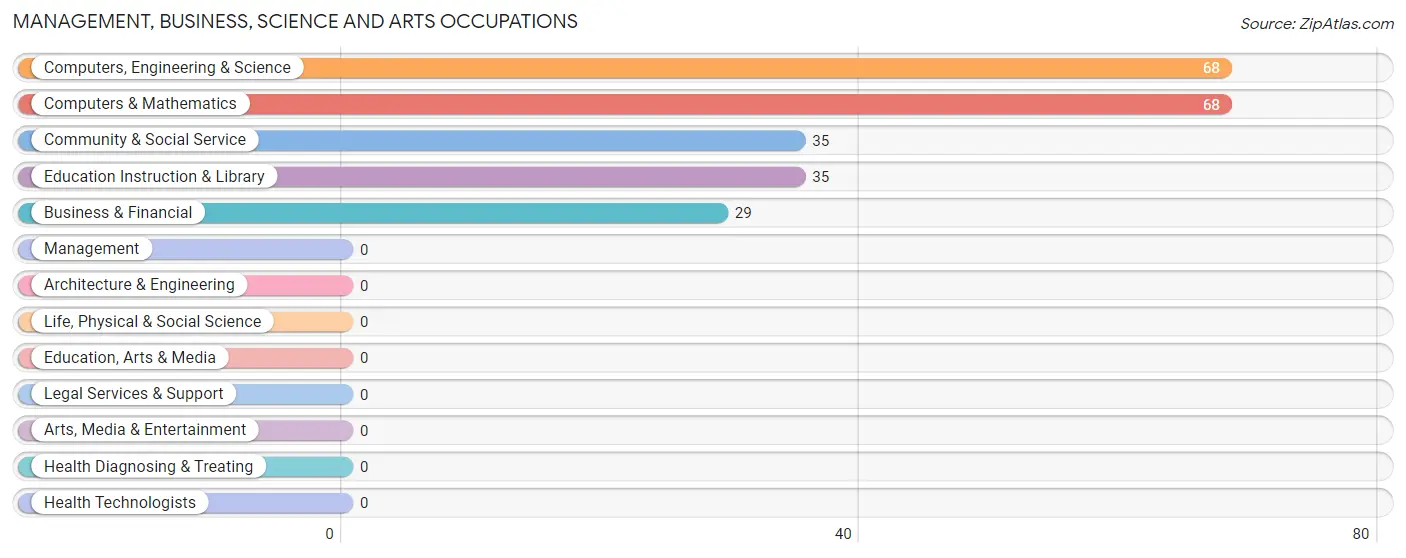
The most common Management, Business, Science and Arts occupations in Twinsburg Heights are Computers, Engineering & Science (68 | 18.5%), Computers & Mathematics (68 | 18.5%), Community & Social Service (35 | 9.5%), Education Instruction & Library (35 | 9.5%), and Business & Financial (29 | 7.9%).
Management, Business, Science and Arts Occupations by Sex
Within the Management, Business, Science and Arts occupations in Twinsburg Heights, the most male-oriented occupations are Computers, Engineering & Science (100.0%), and Computers & Mathematics (100.0%), while the most female-oriented occupations are Business & Financial (100.0%), Community & Social Service (100.0%), and Education Instruction & Library (100.0%).
| Occupation | Male | Female |
| Management | 0 (0.0%) | 0 (0.0%) |
| Business & Financial | 0 (0.0%) | 29 (100.0%) |
| Computers, Engineering & Science | 68 (100.0%) | 0 (0.0%) |
| Computers & Mathematics | 68 (100.0%) | 0 (0.0%) |
| Architecture & Engineering | 0 (0.0%) | 0 (0.0%) |
| Life, Physical & Social Science | 0 (0.0%) | 0 (0.0%) |
| Community & Social Service | 0 (0.0%) | 35 (100.0%) |
| Education, Arts & Media | 0 (0.0%) | 0 (0.0%) |
| Legal Services & Support | 0 (0.0%) | 0 (0.0%) |
| Education Instruction & Library | 0 (0.0%) | 35 (100.0%) |
| Arts, Media & Entertainment | 0 (0.0%) | 0 (0.0%) |
| Health Diagnosing & Treating | 0 (0.0%) | 0 (0.0%) |
| Health Technologists | 0 (0.0%) | 0 (0.0%) |
| Total (Category) | 68 (51.5%) | 64 (48.5%) |
| Total (Overall) | 223 (60.8%) | 144 (39.2%) |
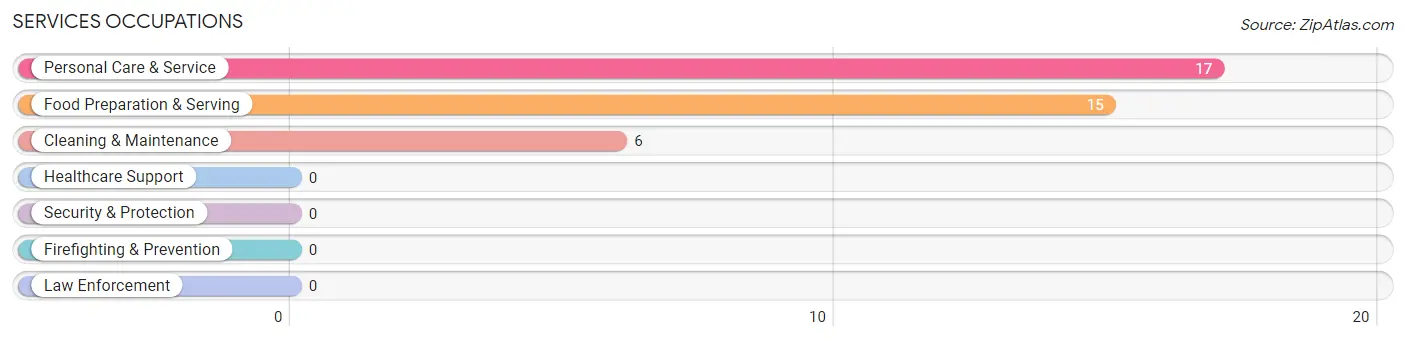
Services Occupations
The most common Services occupations in Twinsburg Heights are Personal Care & Service (17 | 4.6%), Food Preparation & Serving (15 | 4.1%), and Cleaning & Maintenance (6 | 1.6%).
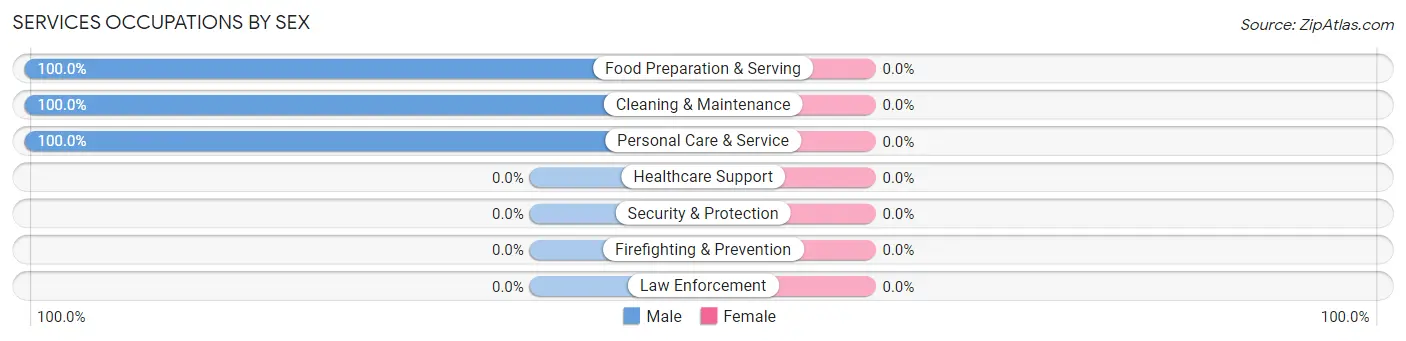
Services Occupations by Sex
| Occupation | Male | Female |
| Healthcare Support | 0 (0.0%) | 0 (0.0%) |
| Security & Protection | 0 (0.0%) | 0 (0.0%) |
| Firefighting & Prevention | 0 (0.0%) | 0 (0.0%) |
| Law Enforcement | 0 (0.0%) | 0 (0.0%) |
| Food Preparation & Serving | 15 (100.0%) | 0 (0.0%) |
| Cleaning & Maintenance | 6 (100.0%) | 0 (0.0%) |
| Personal Care & Service | 17 (100.0%) | 0 (0.0%) |
| Total (Category) | 38 (100.0%) | 0 (0.0%) |
| Total (Overall) | 223 (60.8%) | 144 (39.2%) |
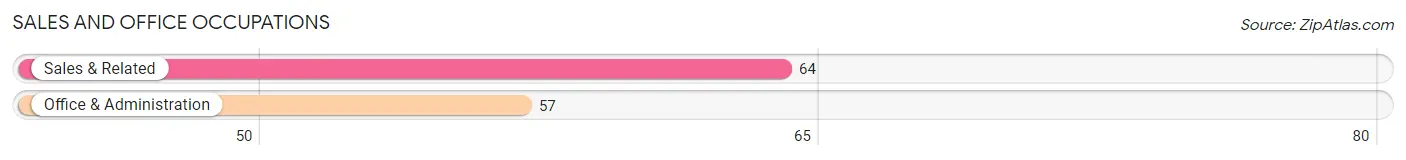
Sales and Office Occupations
The most common Sales and Office occupations in Twinsburg Heights are Sales & Related (64 | 17.4%), and Office & Administration (57 | 15.5%).
Sales and Office Occupations by Sex
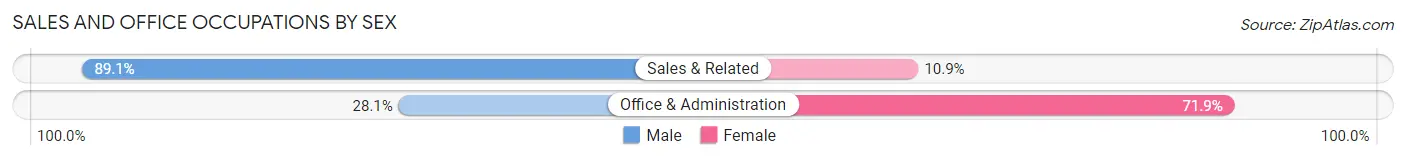
| Occupation | Male | Female |
| Sales & Related | 57 (89.1%) | 7 (10.9%) |
| Office & Administration | 16 (28.1%) | 41 (71.9%) |
| Total (Category) | 73 (60.3%) | 48 (39.7%) |
| Total (Overall) | 223 (60.8%) | 144 (39.2%) |
Natural Resources, Construction and Maintenance Occupations
Natural Resources, Construction and Maintenance Occupations by Sex
| Occupation | Male | Female |
| Farming, Fishing & Forestry | 0 (0.0%) | 0 (0.0%) |
| Construction & Extraction | 0 (0.0%) | 0 (0.0%) |
| Installation, Maintenance & Repair | 0 (0.0%) | 0 (0.0%) |
| Total (Category) | 0 (0.0%) | 0 (0.0%) |
| Total (Overall) | 223 (60.8%) | 144 (39.2%) |
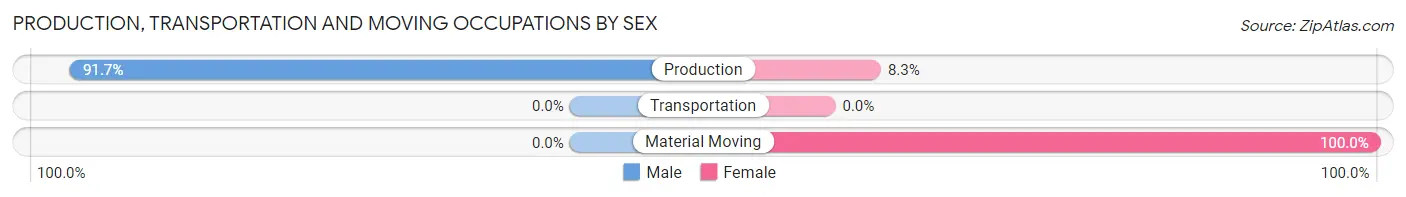
Production, Transportation and Moving Occupations
The most common Production, Transportation and Moving occupations in Twinsburg Heights are Production (48 | 13.1%), and Material Moving (28 | 7.6%).
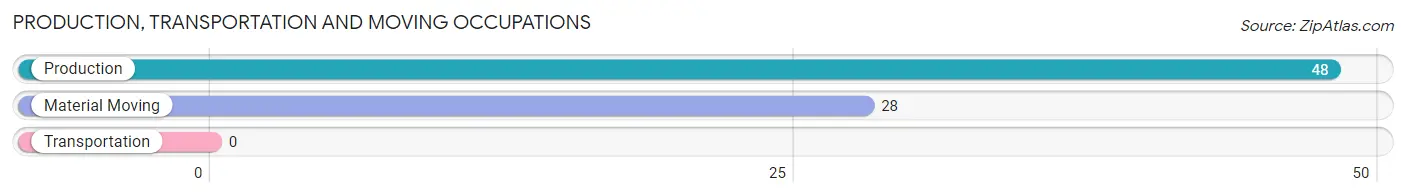
Production, Transportation and Moving Occupations by Sex
| Occupation | Male | Female |
| Production | 44 (91.7%) | 4 (8.3%) |
| Transportation | 0 (0.0%) | 0 (0.0%) |
| Material Moving | 0 (0.0%) | 28 (100.0%) |
| Total (Category) | 44 (57.9%) | 32 (42.1%) |
| Total (Overall) | 223 (60.8%) | 144 (39.2%) |
Employment Industries by Sex in Twinsburg Heights
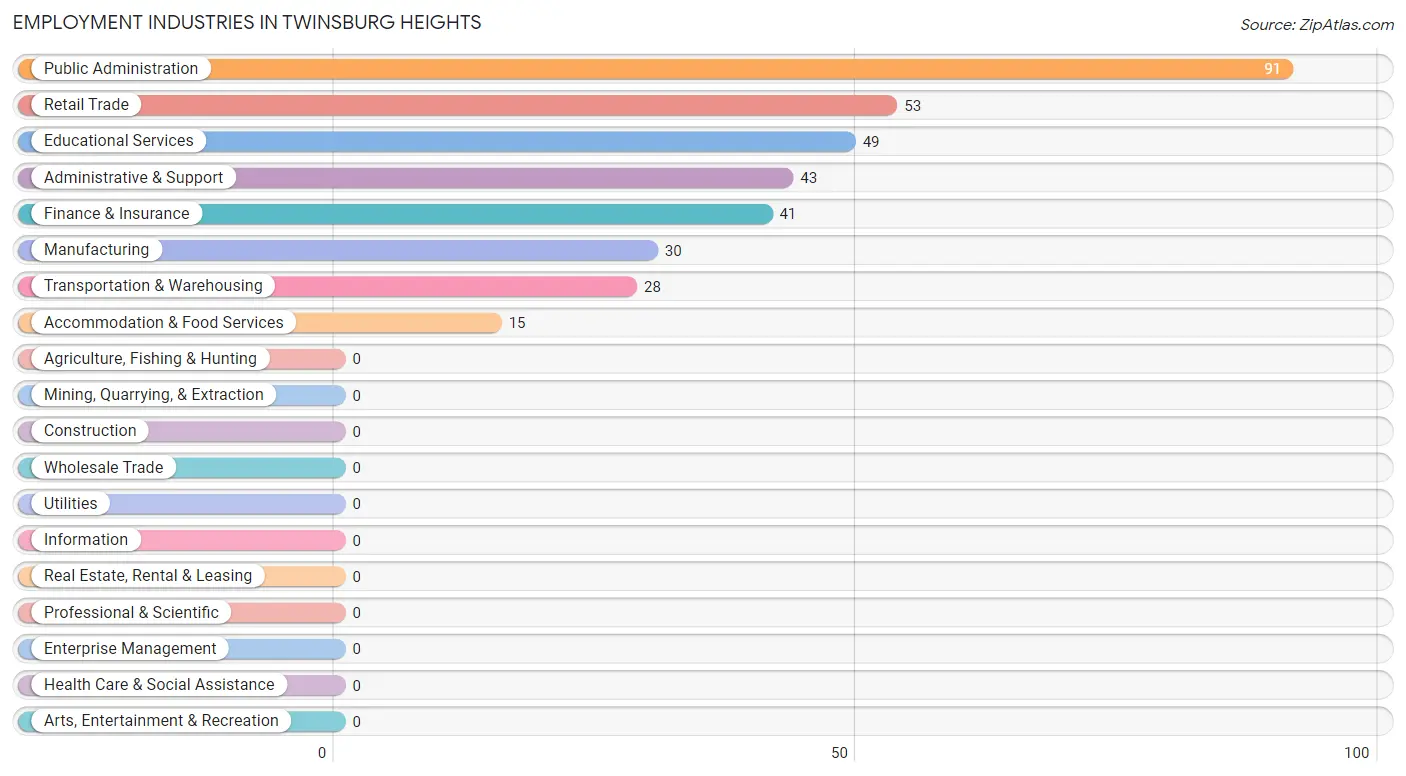
Employment Industries in Twinsburg Heights
The major employment industries in Twinsburg Heights include Public Administration (91 | 24.8%), Retail Trade (53 | 14.4%), Educational Services (49 | 13.4%), Administrative & Support (43 | 11.7%), and Finance & Insurance (41 | 11.2%).
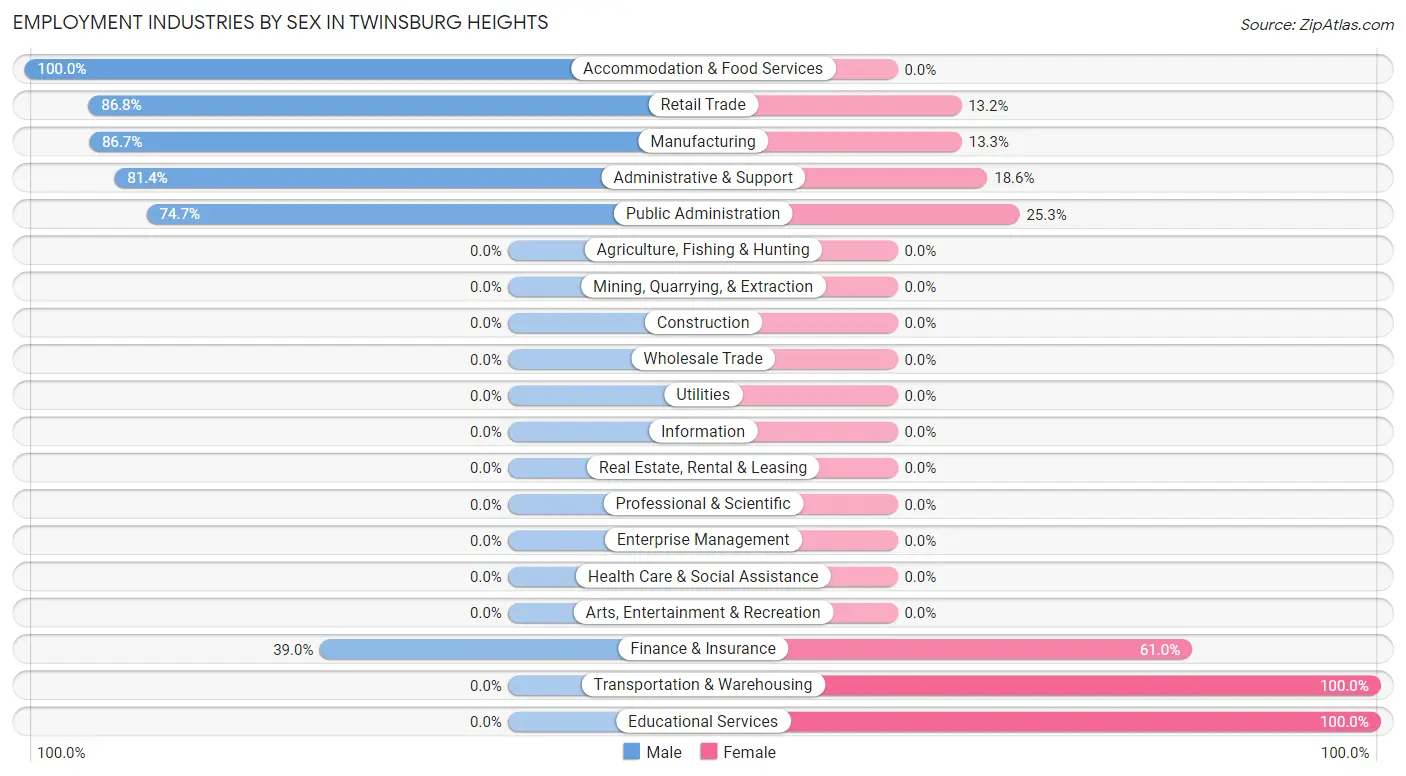
Employment Industries by Sex in Twinsburg Heights
The Twinsburg Heights industries that see more men than women are Accommodation & Food Services (100.0%), Retail Trade (86.8%), and Manufacturing (86.7%), whereas the industries that tend to have a higher number of women are Transportation & Warehousing (100.0%), Educational Services (100.0%), and Finance & Insurance (61.0%).
| Industry | Male | Female |
| Agriculture, Fishing & Hunting | 0 (0.0%) | 0 (0.0%) |
| Mining, Quarrying, & Extraction | 0 (0.0%) | 0 (0.0%) |
| Construction | 0 (0.0%) | 0 (0.0%) |
| Manufacturing | 26 (86.7%) | 4 (13.3%) |
| Wholesale Trade | 0 (0.0%) | 0 (0.0%) |
| Retail Trade | 46 (86.8%) | 7 (13.2%) |
| Transportation & Warehousing | 0 (0.0%) | 28 (100.0%) |
| Utilities | 0 (0.0%) | 0 (0.0%) |
| Information | 0 (0.0%) | 0 (0.0%) |
| Finance & Insurance | 16 (39.0%) | 25 (61.0%) |
| Real Estate, Rental & Leasing | 0 (0.0%) | 0 (0.0%) |
| Professional & Scientific | 0 (0.0%) | 0 (0.0%) |
| Enterprise Management | 0 (0.0%) | 0 (0.0%) |
| Administrative & Support | 35 (81.4%) | 8 (18.6%) |
| Educational Services | 0 (0.0%) | 49 (100.0%) |
| Health Care & Social Assistance | 0 (0.0%) | 0 (0.0%) |
| Arts, Entertainment & Recreation | 0 (0.0%) | 0 (0.0%) |
| Accommodation & Food Services | 15 (100.0%) | 0 (0.0%) |
| Public Administration | 68 (74.7%) | 23 (25.3%) |
| Total | 223 (60.8%) | 144 (39.2%) |
Education in Twinsburg Heights
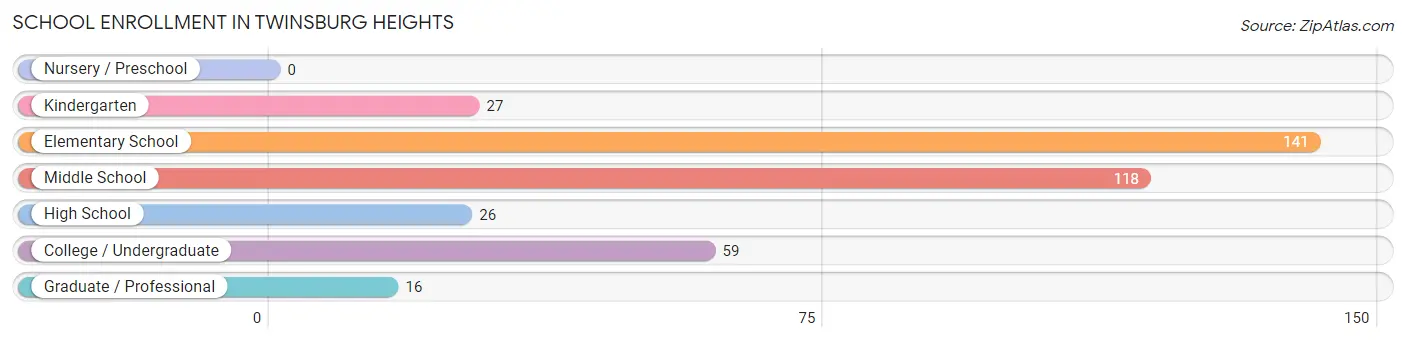
School Enrollment in Twinsburg Heights
The most common levels of schooling among the 387 students in Twinsburg Heights are elementary school (141 | 36.4%), middle school (118 | 30.5%), and college / undergraduate (59 | 15.2%).
| School Level | # Students | % Students |
| Nursery / Preschool | 0 | 0.0% |
| Kindergarten | 27 | 7.0% |
| Elementary School | 141 | 36.4% |
| Middle School | 118 | 30.5% |
| High School | 26 | 6.7% |
| College / Undergraduate | 59 | 15.2% |
| Graduate / Professional | 16 | 4.1% |
| Total | 387 | 100.0% |
School Enrollment by Age by Funding Source in Twinsburg Heights
Out of a total of 387 students who are enrolled in schools in Twinsburg Heights, 103 (26.6%) attend a private institution, while the remaining 284 (73.4%) are enrolled in public schools. The age group of 10 to 14 year olds has the highest likelihood of being enrolled in private schools, with 67 (56.8% in the age bracket) enrolled. Conversely, the age group of 15 to 17 year olds has the lowest likelihood of being enrolled in a private school, with 21 (100.0% in the age bracket) attending a public institution.
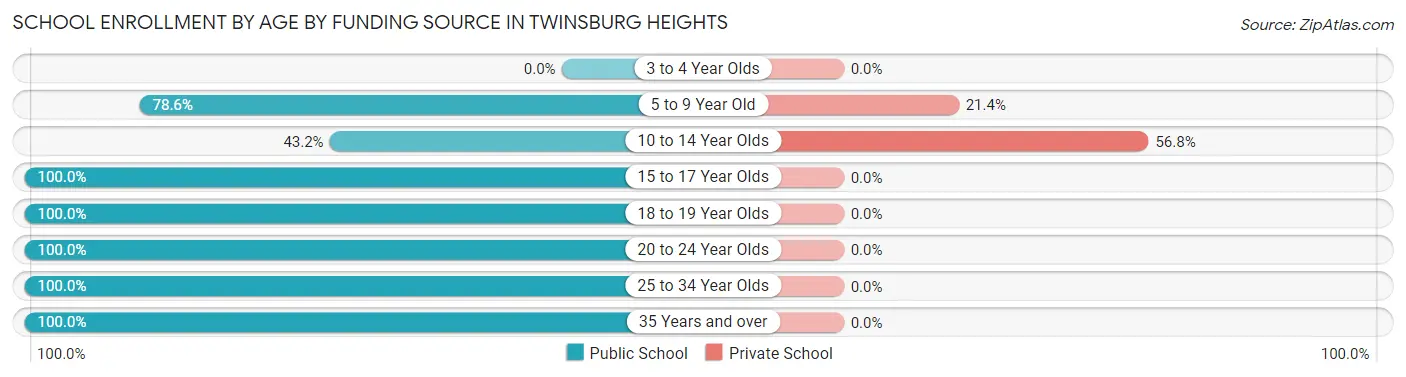
| Age Bracket | Public School | Private School |
| 3 to 4 Year Olds | 0 (0.0%) | 0 (0.0%) |
| 5 to 9 Year Old | 132 (78.6%) | 36 (21.4%) |
| 10 to 14 Year Olds | 51 (43.2%) | 67 (56.8%) |
| 15 to 17 Year Olds | 21 (100.0%) | 0 (0.0%) |
| 18 to 19 Year Olds | 27 (100.0%) | 0 (0.0%) |
| 20 to 24 Year Olds | 21 (100.0%) | 0 (0.0%) |
| 25 to 34 Year Olds | 23 (100.0%) | 0 (0.0%) |
| 35 Years and over | 9 (100.0%) | 0 (0.0%) |
| Total | 284 (73.4%) | 103 (26.6%) |
Educational Attainment by Field of Study in Twinsburg Heights
Business (127 | 80.9%), literature & languages (16 | 10.2%), and social sciences (14 | 8.9%) are the most common fields of study among 157 individuals in Twinsburg Heights who have obtained a bachelor's degree or higher.
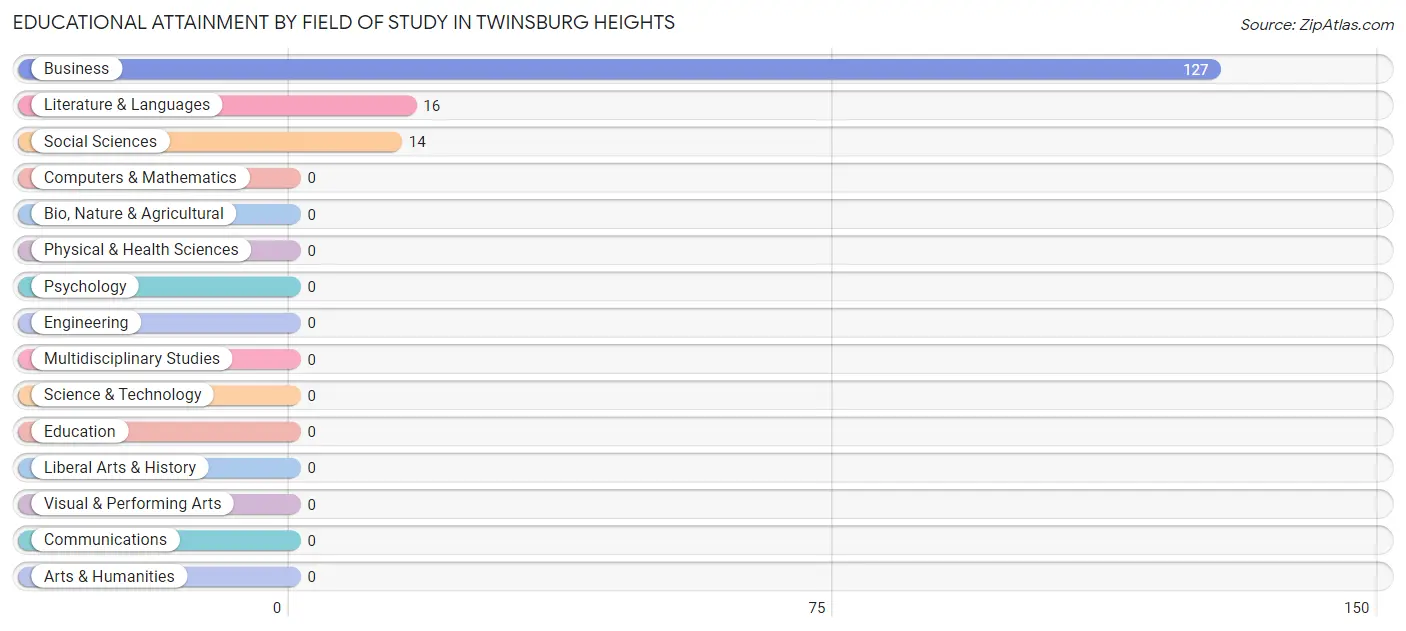
| Field of Study | # Graduates | % Graduates |
| Computers & Mathematics | 0 | 0.0% |
| Bio, Nature & Agricultural | 0 | 0.0% |
| Physical & Health Sciences | 0 | 0.0% |
| Psychology | 0 | 0.0% |
| Social Sciences | 14 | 8.9% |
| Engineering | 0 | 0.0% |
| Multidisciplinary Studies | 0 | 0.0% |
| Science & Technology | 0 | 0.0% |
| Business | 127 | 80.9% |
| Education | 0 | 0.0% |
| Literature & Languages | 16 | 10.2% |
| Liberal Arts & History | 0 | 0.0% |
| Visual & Performing Arts | 0 | 0.0% |
| Communications | 0 | 0.0% |
| Arts & Humanities | 0 | 0.0% |
| Total | 157 | 100.0% |
Transportation & Commute in Twinsburg Heights
Vehicle Availability by Sex in Twinsburg Heights
The most prevalent vehicle ownership categories in Twinsburg Heights are males with 3 vehicles (81, accounting for 36.3%) and females with 3 vehicles (35, making up 56.2%).
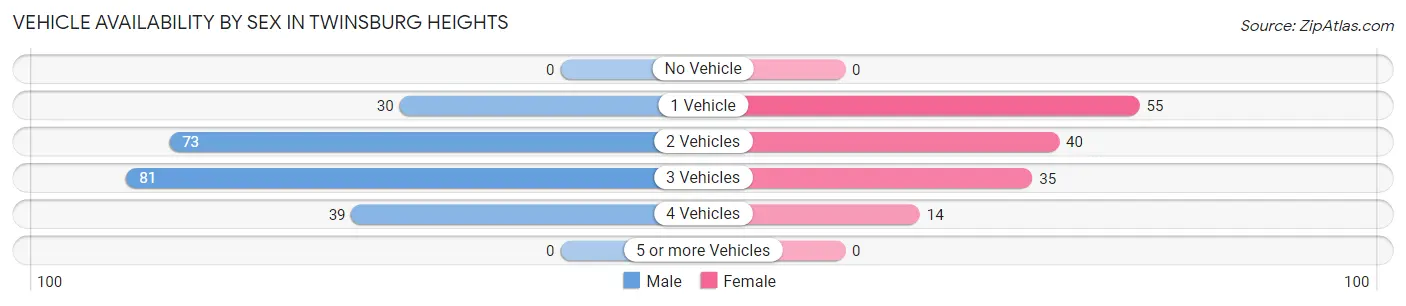
| Vehicles Available | Male | Female |
| No Vehicle | 0 (0.0%) | 0 (0.0%) |
| 1 Vehicle | 30 (13.5%) | 55 (38.2%) |
| 2 Vehicles | 73 (32.7%) | 40 (27.8%) |
| 3 Vehicles | 81 (36.3%) | 35 (24.3%) |
| 4 Vehicles | 39 (17.5%) | 14 (9.7%) |
| 5 or more Vehicles | 0 (0.0%) | 0 (0.0%) |
| Total | 223 (100.0%) | 144 (100.0%) |
Commute Time in Twinsburg Heights
The most frequently occuring commute durations in Twinsburg Heights are 10 to 14 minutes (102 commuters, 27.8%), 5 to 9 minutes (92 commuters, 25.1%), and 15 to 19 minutes (68 commuters, 18.5%).
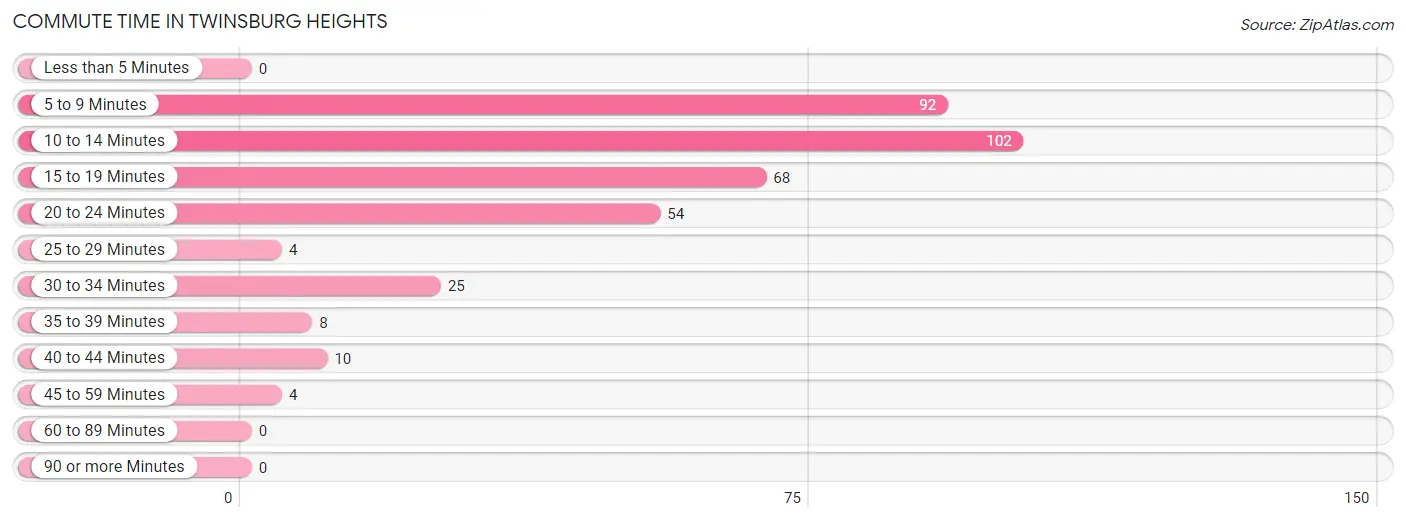
| Commute Time | # Commuters | % Commuters |
| Less than 5 Minutes | 0 | 0.0% |
| 5 to 9 Minutes | 92 | 25.1% |
| 10 to 14 Minutes | 102 | 27.8% |
| 15 to 19 Minutes | 68 | 18.5% |
| 20 to 24 Minutes | 54 | 14.7% |
| 25 to 29 Minutes | 4 | 1.1% |
| 30 to 34 Minutes | 25 | 6.8% |
| 35 to 39 Minutes | 8 | 2.2% |
| 40 to 44 Minutes | 10 | 2.7% |
| 45 to 59 Minutes | 4 | 1.1% |
| 60 to 89 Minutes | 0 | 0.0% |
| 90 or more Minutes | 0 | 0.0% |
Commute Time by Sex in Twinsburg Heights
The most common commute times in Twinsburg Heights are 10 to 14 minutes (95 commuters, 42.6%) for males and 20 to 24 minutes (51 commuters, 35.4%) for females.
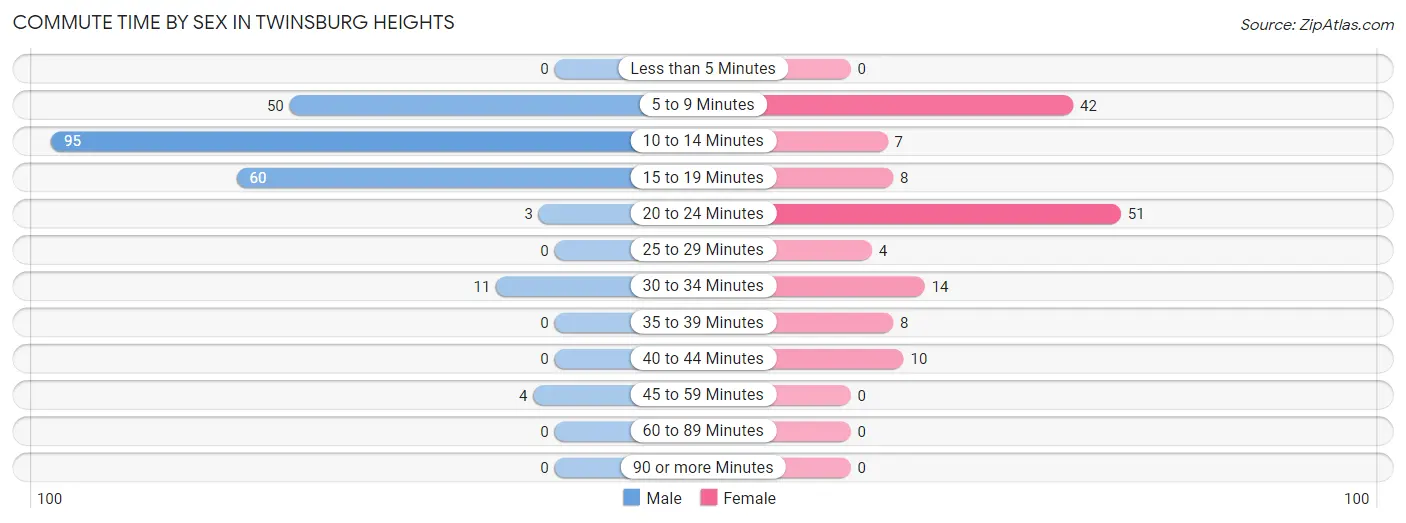
| Commute Time | Male | Female |
| Less than 5 Minutes | 0 (0.0%) | 0 (0.0%) |
| 5 to 9 Minutes | 50 (22.4%) | 42 (29.2%) |
| 10 to 14 Minutes | 95 (42.6%) | 7 (4.9%) |
| 15 to 19 Minutes | 60 (26.9%) | 8 (5.6%) |
| 20 to 24 Minutes | 3 (1.3%) | 51 (35.4%) |
| 25 to 29 Minutes | 0 (0.0%) | 4 (2.8%) |
| 30 to 34 Minutes | 11 (4.9%) | 14 (9.7%) |
| 35 to 39 Minutes | 0 (0.0%) | 8 (5.6%) |
| 40 to 44 Minutes | 0 (0.0%) | 10 (6.9%) |
| 45 to 59 Minutes | 4 (1.8%) | 0 (0.0%) |
| 60 to 89 Minutes | 0 (0.0%) | 0 (0.0%) |
| 90 or more Minutes | 0 (0.0%) | 0 (0.0%) |
Time of Departure to Work by Sex in Twinsburg Heights
The most frequent times of departure to work in Twinsburg Heights are 6:30 AM to 6:59 AM (74, 33.2%) for males and 8:00 AM to 8:29 AM (41, 28.5%) for females.
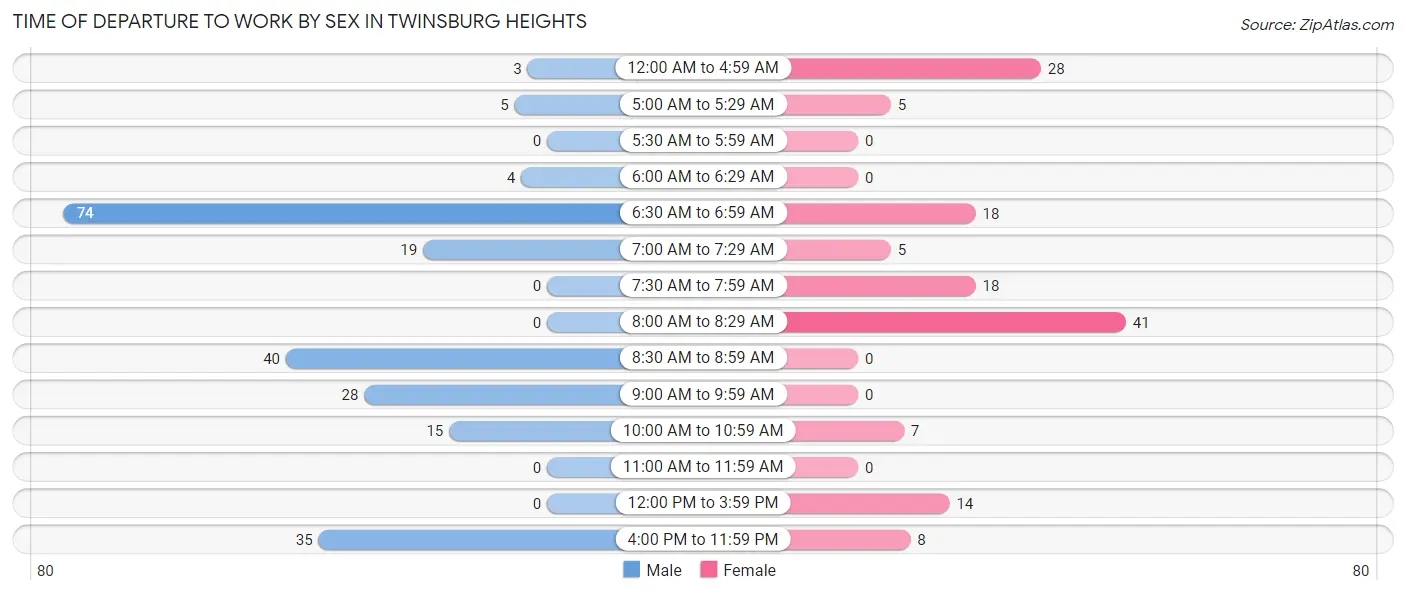
| Time of Departure | Male | Female |
| 12:00 AM to 4:59 AM | 3 (1.3%) | 28 (19.4%) |
| 5:00 AM to 5:29 AM | 5 (2.2%) | 5 (3.5%) |
| 5:30 AM to 5:59 AM | 0 (0.0%) | 0 (0.0%) |
| 6:00 AM to 6:29 AM | 4 (1.8%) | 0 (0.0%) |
| 6:30 AM to 6:59 AM | 74 (33.2%) | 18 (12.5%) |
| 7:00 AM to 7:29 AM | 19 (8.5%) | 5 (3.5%) |
| 7:30 AM to 7:59 AM | 0 (0.0%) | 18 (12.5%) |
| 8:00 AM to 8:29 AM | 0 (0.0%) | 41 (28.5%) |
| 8:30 AM to 8:59 AM | 40 (17.9%) | 0 (0.0%) |
| 9:00 AM to 9:59 AM | 28 (12.6%) | 0 (0.0%) |
| 10:00 AM to 10:59 AM | 15 (6.7%) | 7 (4.9%) |
| 11:00 AM to 11:59 AM | 0 (0.0%) | 0 (0.0%) |
| 12:00 PM to 3:59 PM | 0 (0.0%) | 14 (9.7%) |
| 4:00 PM to 11:59 PM | 35 (15.7%) | 8 (5.6%) |
| Total | 223 (100.0%) | 144 (100.0%) |
Housing Occupancy in Twinsburg Heights
Occupancy by Ownership in Twinsburg Heights
Of the total 323 dwellings in Twinsburg Heights, owner-occupied units account for 174 (53.9%), while renter-occupied units make up 149 (46.1%).
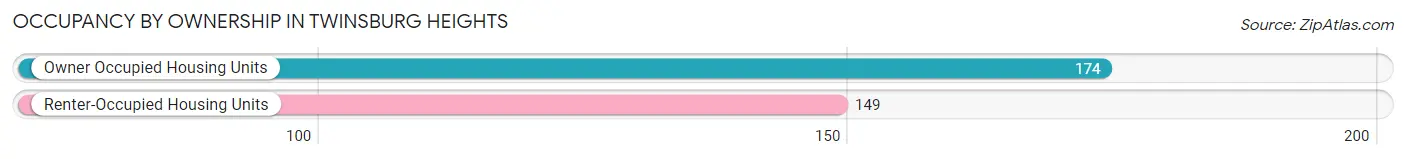
| Occupancy | # Housing Units | % Housing Units |
| Owner Occupied Housing Units | 174 | 53.9% |
| Renter-Occupied Housing Units | 149 | 46.1% |
| Total Occupied Housing Units | 323 | 100.0% |
Occupancy by Household Size in Twinsburg Heights
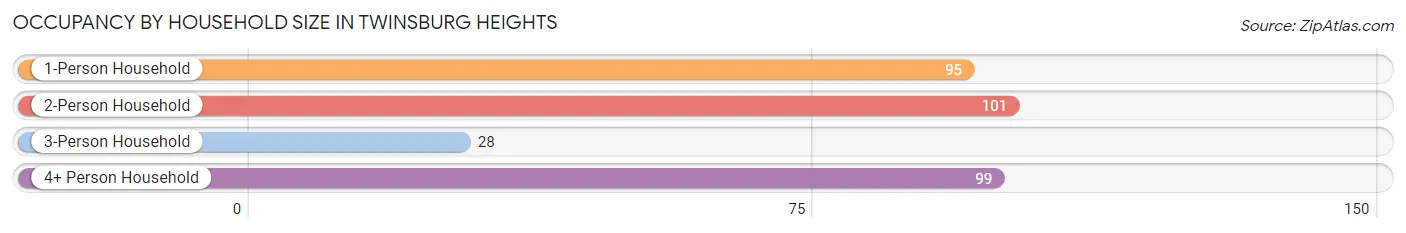
| Household Size | # Housing Units | % Housing Units |
| 1-Person Household | 95 | 29.4% |
| 2-Person Household | 101 | 31.3% |
| 3-Person Household | 28 | 8.7% |
| 4+ Person Household | 99 | 30.6% |
| Total Housing Units | 323 | 100.0% |
Occupancy by Ownership by Household Size in Twinsburg Heights
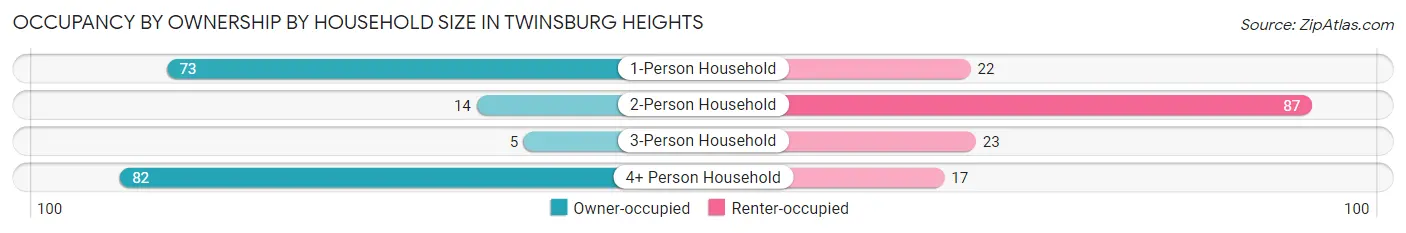
| Household Size | Owner-occupied | Renter-occupied |
| 1-Person Household | 73 (76.8%) | 22 (23.2%) |
| 2-Person Household | 14 (13.9%) | 87 (86.1%) |
| 3-Person Household | 5 (17.9%) | 23 (82.1%) |
| 4+ Person Household | 82 (82.8%) | 17 (17.2%) |
| Total Housing Units | 174 (53.9%) | 149 (46.1%) |
Occupancy by Educational Attainment in Twinsburg Heights
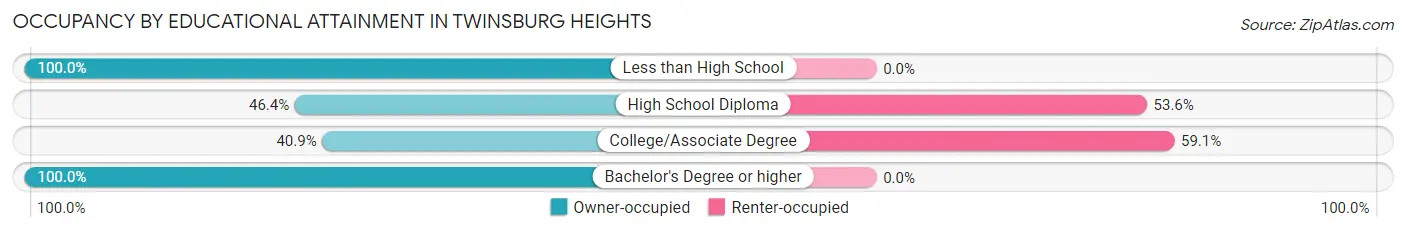
| Household Size | Owner-occupied | Renter-occupied |
| Less than High School | 23 (100.0%) | 0 (0.0%) |
| High School Diploma | 64 (46.4%) | 74 (53.6%) |
| College/Associate Degree | 52 (40.9%) | 75 (59.1%) |
| Bachelor's Degree or higher | 35 (100.0%) | 0 (0.0%) |
Occupancy by Age of Householder in Twinsburg Heights
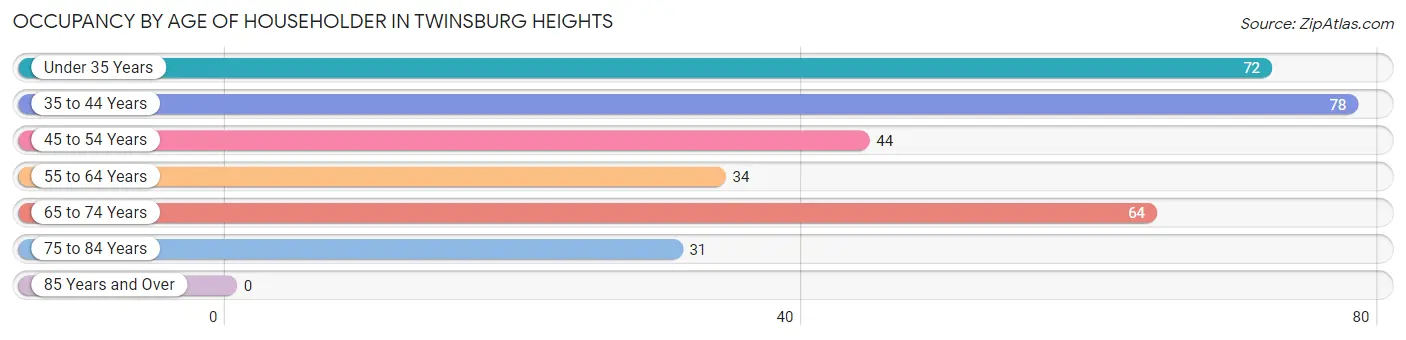
| Age Bracket | # Households | % Households |
| Under 35 Years | 72 | 22.3% |
| 35 to 44 Years | 78 | 24.1% |
| 45 to 54 Years | 44 | 13.6% |
| 55 to 64 Years | 34 | 10.5% |
| 65 to 74 Years | 64 | 19.8% |
| 75 to 84 Years | 31 | 9.6% |
| 85 Years and Over | 0 | 0.0% |
| Total | 323 | 100.0% |
Housing Finances in Twinsburg Heights
Median Income by Occupancy in Twinsburg Heights
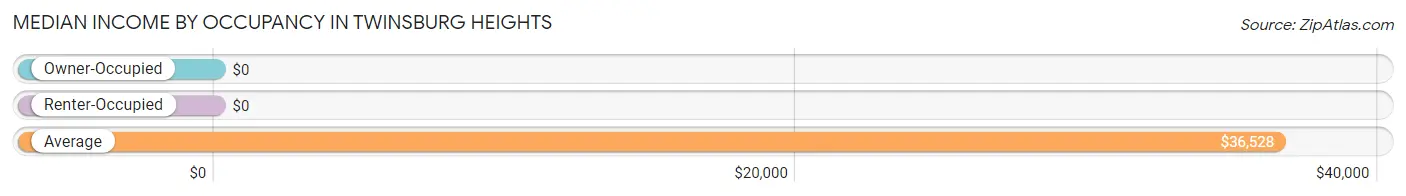
| Occupancy Type | # Households | Median Income |
| Owner-Occupied | 174 (53.9%) | $0 |
| Renter-Occupied | 149 (46.1%) | $0 |
| Average | 323 (100.0%) | $36,528 |
Occupancy by Householder Income Bracket in Twinsburg Heights
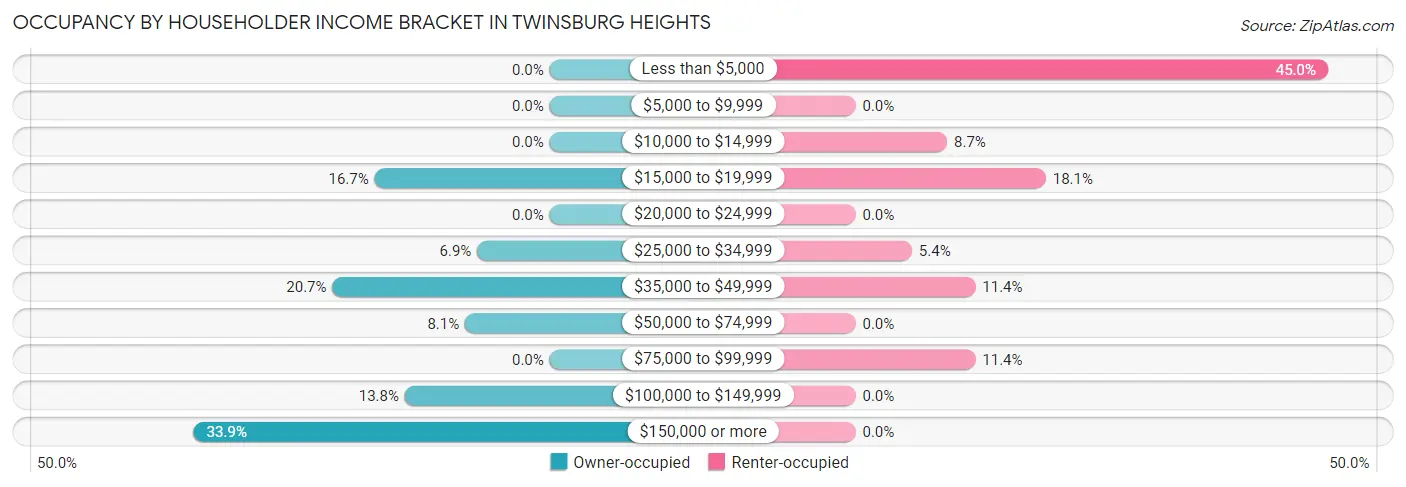
| Income Bracket | Owner-occupied | Renter-occupied |
| Less than $5,000 | 0 (0.0%) | 67 (45.0%) |
| $5,000 to $9,999 | 0 (0.0%) | 0 (0.0%) |
| $10,000 to $14,999 | 0 (0.0%) | 13 (8.7%) |
| $15,000 to $19,999 | 29 (16.7%) | 27 (18.1%) |
| $20,000 to $24,999 | 0 (0.0%) | 0 (0.0%) |
| $25,000 to $34,999 | 12 (6.9%) | 8 (5.4%) |
| $35,000 to $49,999 | 36 (20.7%) | 17 (11.4%) |
| $50,000 to $74,999 | 14 (8.1%) | 0 (0.0%) |
| $75,000 to $99,999 | 0 (0.0%) | 17 (11.4%) |
| $100,000 to $149,999 | 24 (13.8%) | 0 (0.0%) |
| $150,000 or more | 59 (33.9%) | 0 (0.0%) |
| Total | 174 (100.0%) | 149 (100.0%) |
Monthly Housing Cost Tiers in Twinsburg Heights
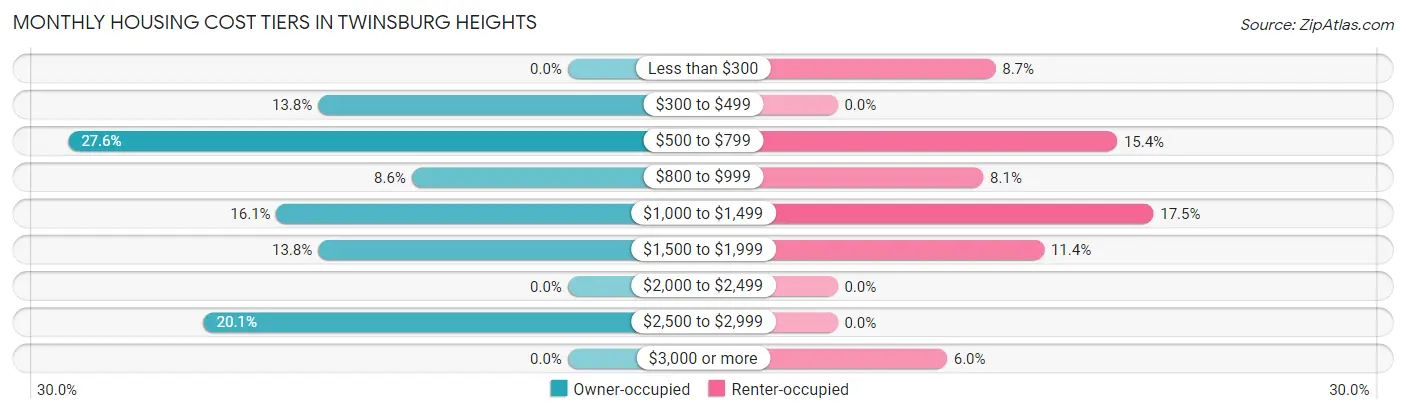
| Monthly Cost | Owner-occupied | Renter-occupied |
| Less than $300 | 0 (0.0%) | 13 (8.7%) |
| $300 to $499 | 24 (13.8%) | 0 (0.0%) |
| $500 to $799 | 48 (27.6%) | 23 (15.4%) |
| $800 to $999 | 15 (8.6%) | 12 (8.1%) |
| $1,000 to $1,499 | 28 (16.1%) | 26 (17.4%) |
| $1,500 to $1,999 | 24 (13.8%) | 17 (11.4%) |
| $2,000 to $2,499 | 0 (0.0%) | 0 (0.0%) |
| $2,500 to $2,999 | 35 (20.1%) | 0 (0.0%) |
| $3,000 or more | 0 (0.0%) | 9 (6.0%) |
| Total | 174 (100.0%) | 149 (100.0%) |
Physical Housing Characteristics in Twinsburg Heights
Housing Structures in Twinsburg Heights
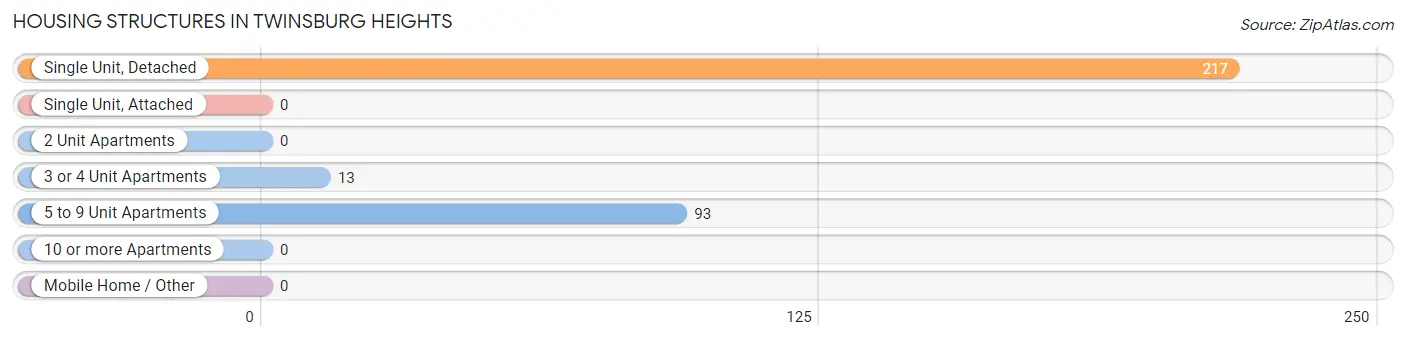
| Structure Type | # Housing Units | % Housing Units |
| Single Unit, Detached | 217 | 67.2% |
| Single Unit, Attached | 0 | 0.0% |
| 2 Unit Apartments | 0 | 0.0% |
| 3 or 4 Unit Apartments | 13 | 4.0% |
| 5 to 9 Unit Apartments | 93 | 28.8% |
| 10 or more Apartments | 0 | 0.0% |
| Mobile Home / Other | 0 | 0.0% |
| Total | 323 | 100.0% |
Housing Structures by Occupancy in Twinsburg Heights
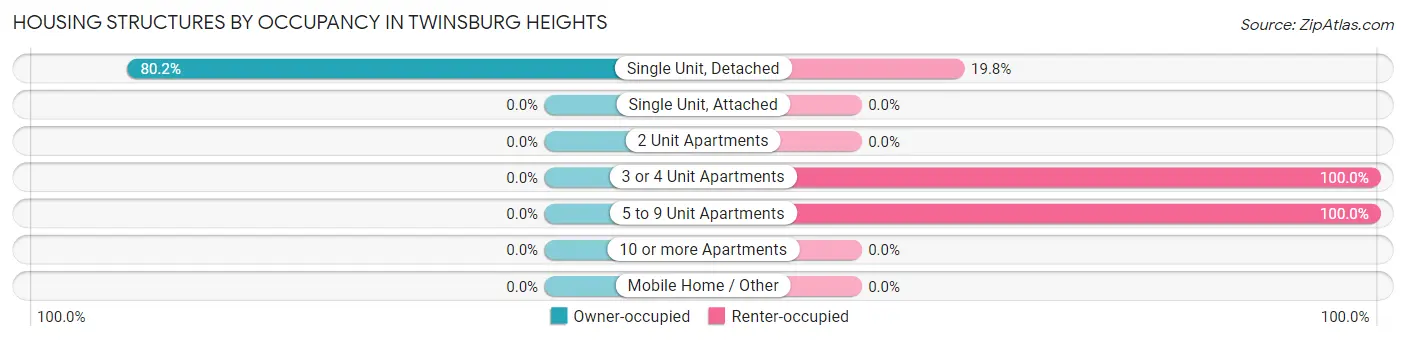
| Structure Type | Owner-occupied | Renter-occupied |
| Single Unit, Detached | 174 (80.2%) | 43 (19.8%) |
| Single Unit, Attached | 0 (0.0%) | 0 (0.0%) |
| 2 Unit Apartments | 0 (0.0%) | 0 (0.0%) |
| 3 or 4 Unit Apartments | 0 (0.0%) | 13 (100.0%) |
| 5 to 9 Unit Apartments | 0 (0.0%) | 93 (100.0%) |
| 10 or more Apartments | 0 (0.0%) | 0 (0.0%) |
| Mobile Home / Other | 0 (0.0%) | 0 (0.0%) |
| Total | 174 (53.9%) | 149 (46.1%) |
Housing Structures by Number of Rooms in Twinsburg Heights
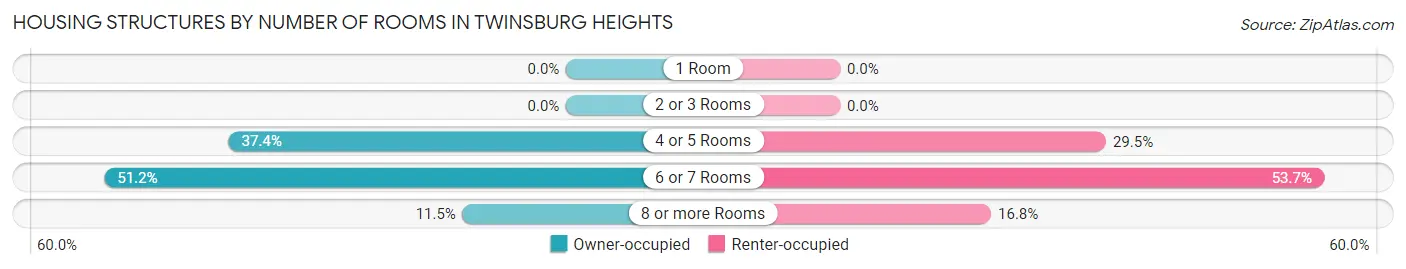
| Number of Rooms | Owner-occupied | Renter-occupied |
| 1 Room | 0 (0.0%) | 0 (0.0%) |
| 2 or 3 Rooms | 0 (0.0%) | 0 (0.0%) |
| 4 or 5 Rooms | 65 (37.4%) | 44 (29.5%) |
| 6 or 7 Rooms | 89 (51.1%) | 80 (53.7%) |
| 8 or more Rooms | 20 (11.5%) | 25 (16.8%) |
| Total | 174 (100.0%) | 149 (100.0%) |
Housing Structure by Heating Type in Twinsburg Heights
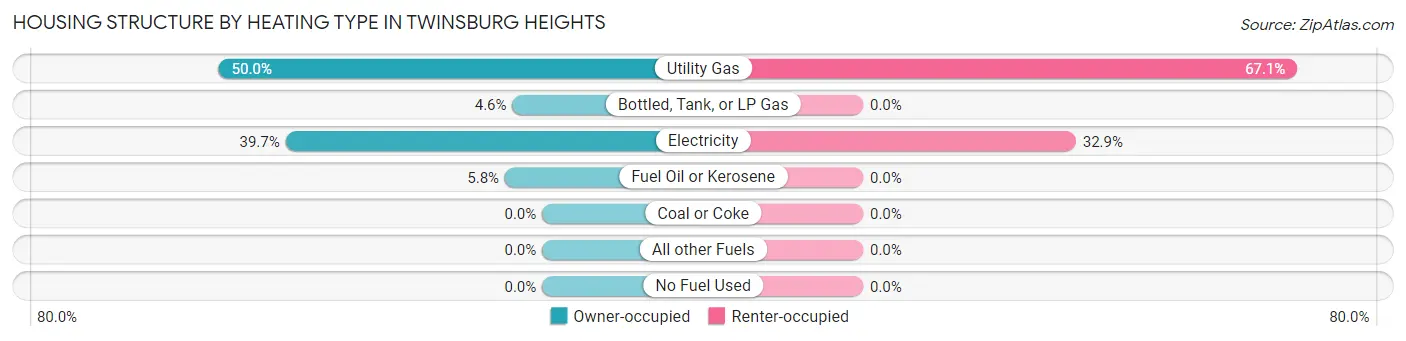
| Heating Type | Owner-occupied | Renter-occupied |
| Utility Gas | 87 (50.0%) | 100 (67.1%) |
| Bottled, Tank, or LP Gas | 8 (4.6%) | 0 (0.0%) |
| Electricity | 69 (39.7%) | 49 (32.9%) |
| Fuel Oil or Kerosene | 10 (5.8%) | 0 (0.0%) |
| Coal or Coke | 0 (0.0%) | 0 (0.0%) |
| All other Fuels | 0 (0.0%) | 0 (0.0%) |
| No Fuel Used | 0 (0.0%) | 0 (0.0%) |
| Total | 174 (100.0%) | 149 (100.0%) |
Household Vehicle Usage in Twinsburg Heights
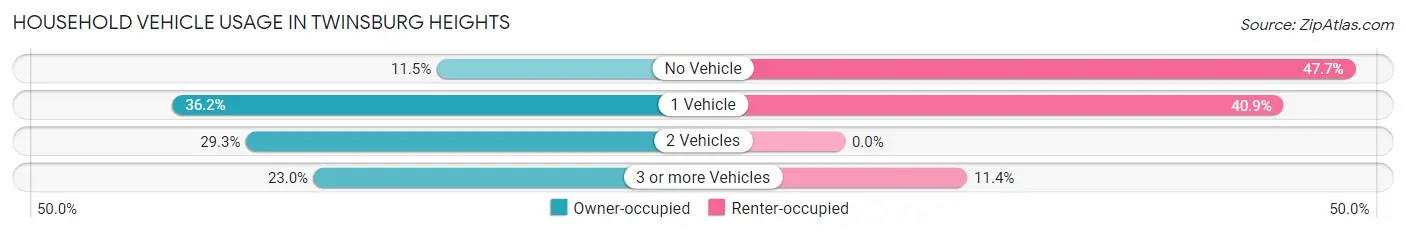
| Vehicles per Household | Owner-occupied | Renter-occupied |
| No Vehicle | 20 (11.5%) | 71 (47.6%) |
| 1 Vehicle | 63 (36.2%) | 61 (40.9%) |
| 2 Vehicles | 51 (29.3%) | 0 (0.0%) |
| 3 or more Vehicles | 40 (23.0%) | 17 (11.4%) |
| Total | 174 (100.0%) | 149 (100.0%) |
Real Estate & Mortgages in Twinsburg Heights
Real Estate and Mortgage Overview in Twinsburg Heights
| Characteristic | Without Mortgage | With Mortgage |
| Housing Units | 36 | 138 |
| Median Property Value | - | - |
| Median Household Income | - | - |
| Monthly Housing Costs | $475 | $0 |
| Real Estate Taxes | $3,300 | $10 |
Property Value by Mortgage Status in Twinsburg Heights
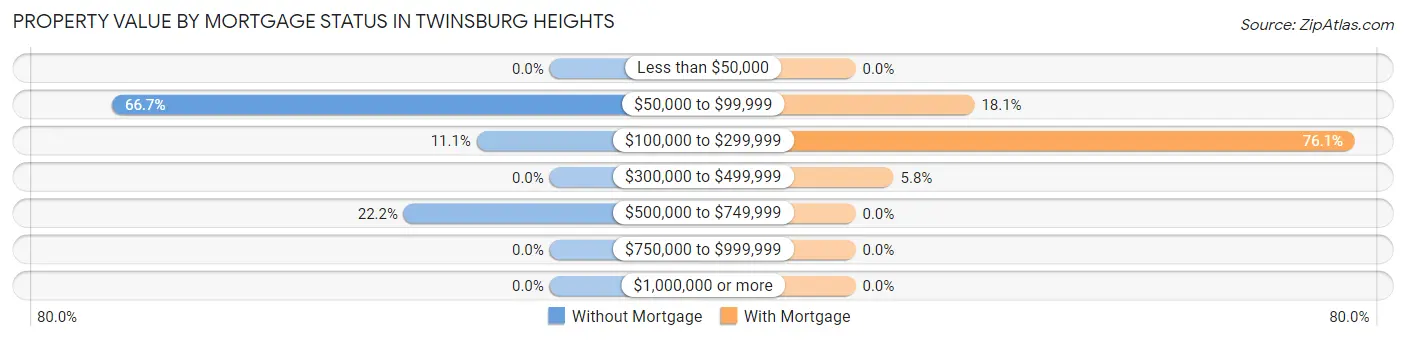
| Property Value | Without Mortgage | With Mortgage |
| Less than $50,000 | 0 (0.0%) | 0 (0.0%) |
| $50,000 to $99,999 | 24 (66.7%) | 25 (18.1%) |
| $100,000 to $299,999 | 4 (11.1%) | 105 (76.1%) |
| $300,000 to $499,999 | 0 (0.0%) | 8 (5.8%) |
| $500,000 to $749,999 | 8 (22.2%) | 0 (0.0%) |
| $750,000 to $999,999 | 0 (0.0%) | 0 (0.0%) |
| $1,000,000 or more | 0 (0.0%) | 0 (0.0%) |
| Total | 36 (100.0%) | 138 (100.0%) |
Household Income by Mortgage Status in Twinsburg Heights
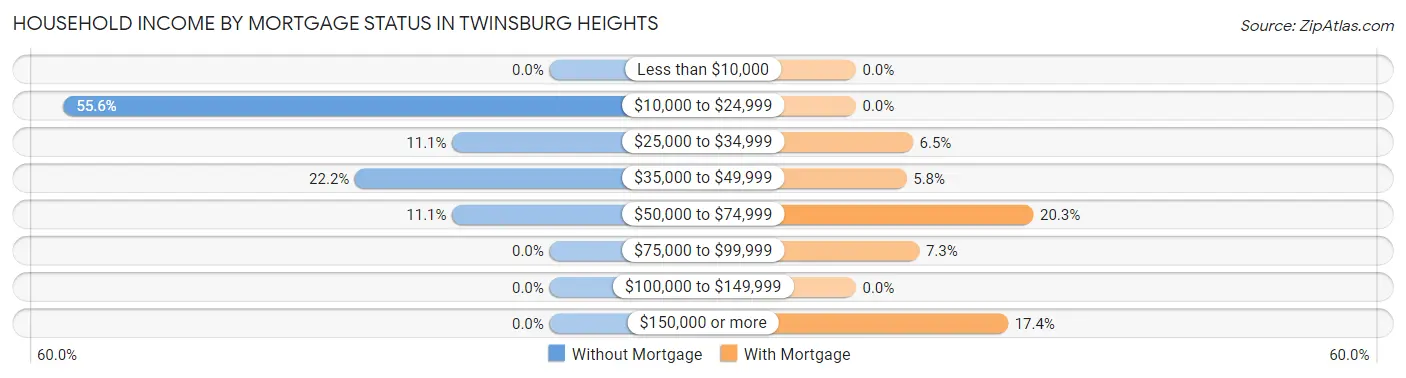
| Household Income | Without Mortgage | With Mortgage |
| Less than $10,000 | 0 (0.0%) | 0 (0.0%) |
| $10,000 to $24,999 | 20 (55.6%) | 0 (0.0%) |
| $25,000 to $34,999 | 4 (11.1%) | 9 (6.5%) |
| $35,000 to $49,999 | 8 (22.2%) | 8 (5.8%) |
| $50,000 to $74,999 | 4 (11.1%) | 28 (20.3%) |
| $75,000 to $99,999 | 0 (0.0%) | 10 (7.2%) |
| $100,000 to $149,999 | 0 (0.0%) | 0 (0.0%) |
| $150,000 or more | 0 (0.0%) | 24 (17.4%) |
| Total | 36 (100.0%) | 138 (100.0%) |
Property Value to Household Income Ratio in Twinsburg Heights
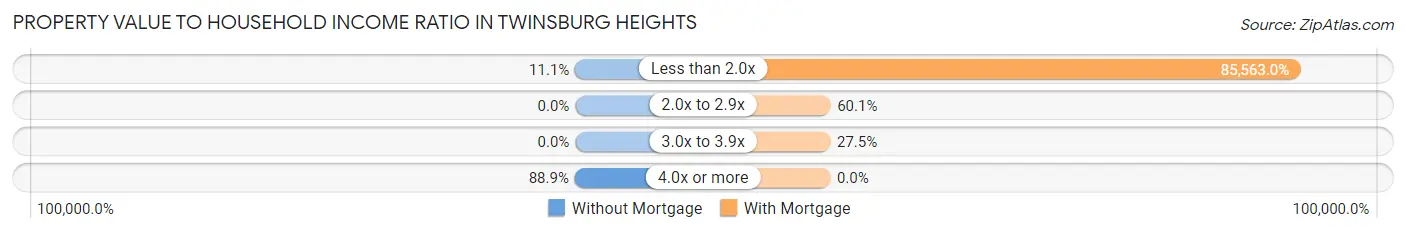
| Value-to-Income Ratio | Without Mortgage | With Mortgage |
| Less than 2.0x | 4 (11.1%) | 118,077 (85,563.0%) |
| 2.0x to 2.9x | 0 (0.0%) | 83 (60.1%) |
| 3.0x to 3.9x | 0 (0.0%) | 38 (27.5%) |
| 4.0x or more | 32 (88.9%) | 0 (0.0%) |
| Total | 36 (100.0%) | 138 (100.0%) |
Real Estate Taxes by Mortgage Status in Twinsburg Heights
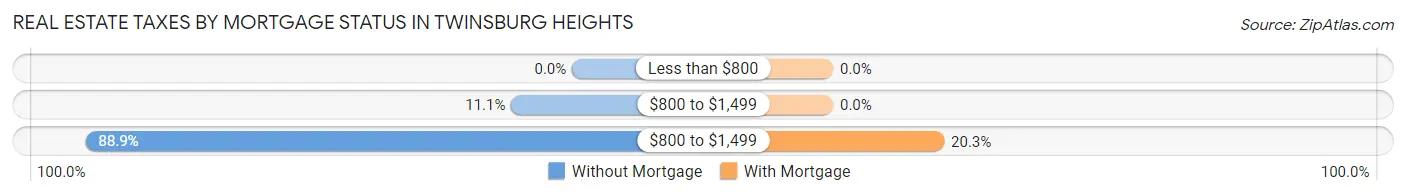
| Property Taxes | Without Mortgage | With Mortgage |
| Less than $800 | 0 (0.0%) | 0 (0.0%) |
| $800 to $1,499 | 4 (11.1%) | 0 (0.0%) |
| $800 to $1,499 | 32 (88.9%) | 28 (20.3%) |
| Total | 36 (100.0%) | 138 (100.0%) |
Health & Disability in Twinsburg Heights
Health Insurance Coverage by Age in Twinsburg Heights
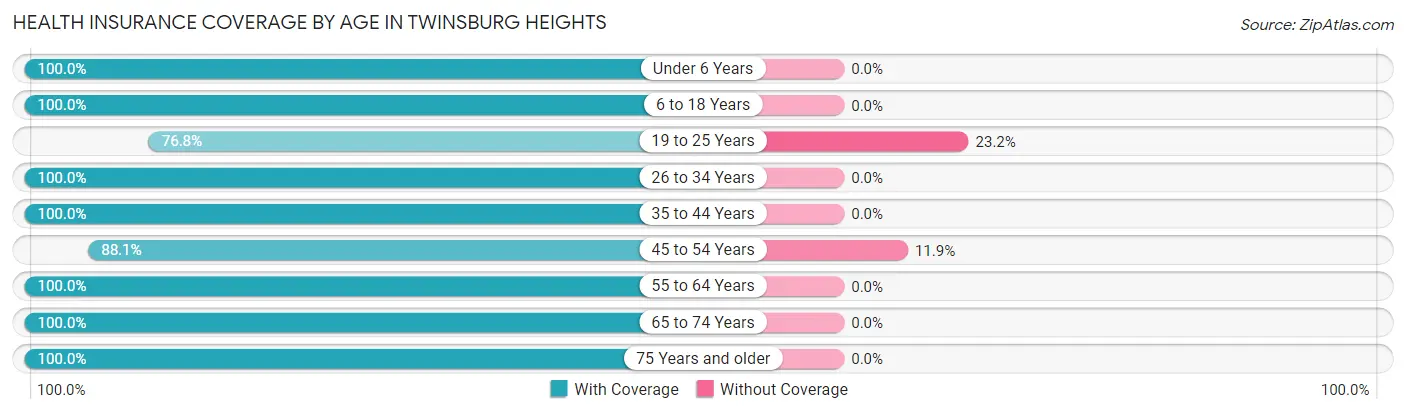
| Age Bracket | With Coverage | Without Coverage |
| Under 6 Years | 15 (100.0%) | 0 (0.0%) |
| 6 to 18 Years | 307 (100.0%) | 0 (0.0%) |
| 19 to 25 Years | 116 (76.8%) | 35 (23.2%) |
| 26 to 34 Years | 72 (100.0%) | 0 (0.0%) |
| 35 to 44 Years | 152 (100.0%) | 0 (0.0%) |
| 45 to 54 Years | 89 (88.1%) | 12 (11.9%) |
| 55 to 64 Years | 51 (100.0%) | 0 (0.0%) |
| 65 to 74 Years | 80 (100.0%) | 0 (0.0%) |
| 75 Years and older | 31 (100.0%) | 0 (0.0%) |
| Total | 913 (95.1%) | 47 (4.9%) |
Health Insurance Coverage by Citizenship Status in Twinsburg Heights
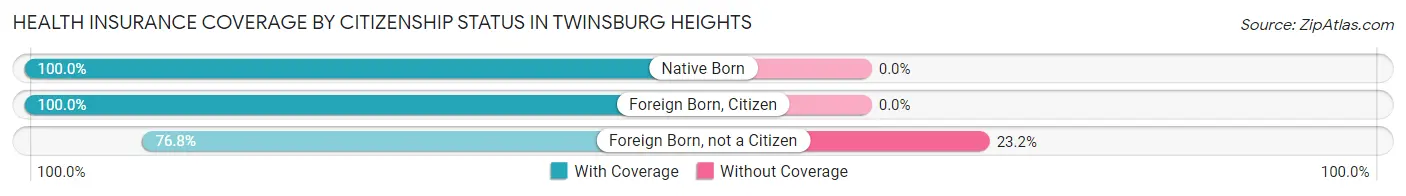
| Citizenship Status | With Coverage | Without Coverage |
| Native Born | 15 (100.0%) | 0 (0.0%) |
| Foreign Born, Citizen | 307 (100.0%) | 0 (0.0%) |
| Foreign Born, not a Citizen | 116 (76.8%) | 35 (23.2%) |
Health Insurance Coverage by Household Income in Twinsburg Heights
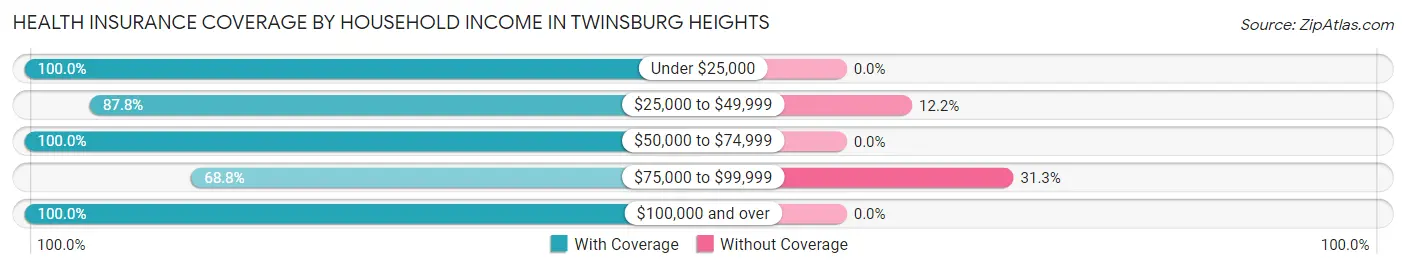
| Household Income | With Coverage | Without Coverage |
| Under $25,000 | 251 (100.0%) | 0 (0.0%) |
| $25,000 to $49,999 | 86 (87.8%) | 12 (12.2%) |
| $50,000 to $74,999 | 37 (100.0%) | 0 (0.0%) |
| $75,000 to $99,999 | 77 (68.8%) | 35 (31.2%) |
| $100,000 and over | 462 (100.0%) | 0 (0.0%) |
Public vs Private Health Insurance Coverage by Age in Twinsburg Heights
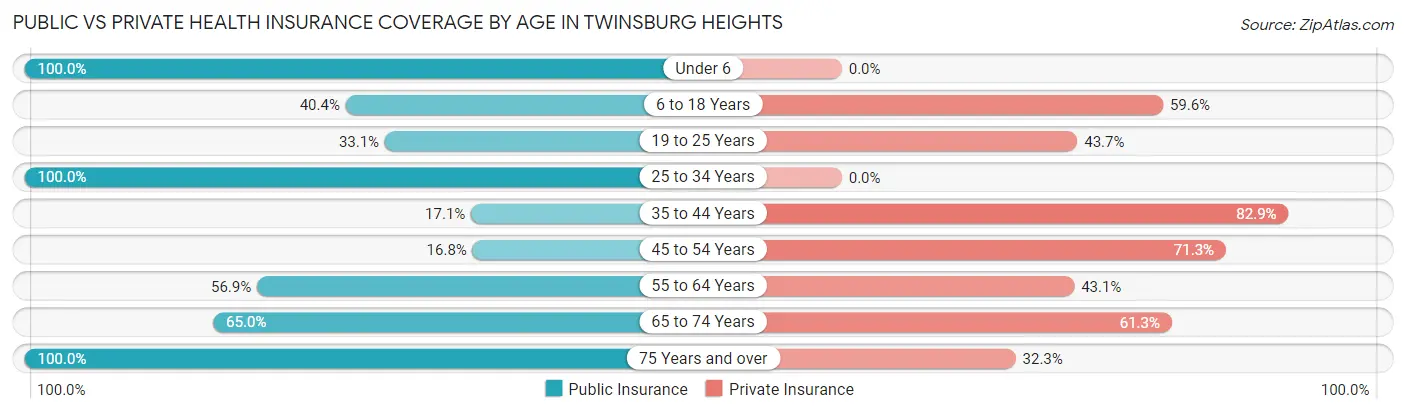
| Age Bracket | Public Insurance | Private Insurance |
| Under 6 | 15 (100.0%) | 0 (0.0%) |
| 6 to 18 Years | 124 (40.4%) | 183 (59.6%) |
| 19 to 25 Years | 50 (33.1%) | 66 (43.7%) |
| 25 to 34 Years | 72 (100.0%) | 0 (0.0%) |
| 35 to 44 Years | 26 (17.1%) | 126 (82.9%) |
| 45 to 54 Years | 17 (16.8%) | 72 (71.3%) |
| 55 to 64 Years | 29 (56.9%) | 22 (43.1%) |
| 65 to 74 Years | 52 (65.0%) | 49 (61.3%) |
| 75 Years and over | 31 (100.0%) | 10 (32.3%) |
| Total | 416 (43.3%) | 528 (55.0%) |
Disability Status by Sex by Age in Twinsburg Heights
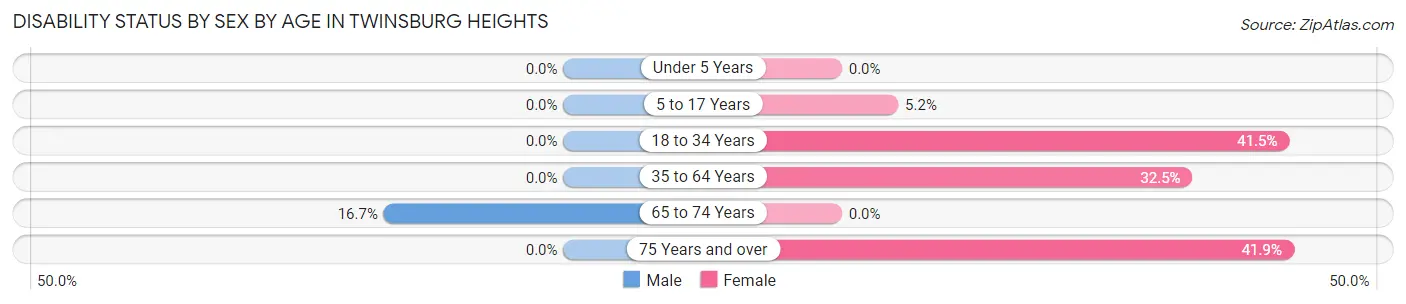
| Age Bracket | Male | Female |
| Under 5 Years | 0 (0.0%) | 0 (0.0%) |
| 5 to 17 Years | 0 (0.0%) | 8 (5.2%) |
| 18 to 34 Years | 0 (0.0%) | 49 (41.5%) |
| 35 to 64 Years | 0 (0.0%) | 55 (32.5%) |
| 65 to 74 Years | 4 (16.7%) | 0 (0.0%) |
| 75 Years and over | 0 (0.0%) | 13 (41.9%) |
Disability Class by Sex by Age in Twinsburg Heights
Disability Class: Hearing Difficulty
| Age Bracket | Male | Female |
| Under 5 Years | 0 (0.0%) | 0 (0.0%) |
| 5 to 17 Years | 0 (0.0%) | 0 (0.0%) |
| 18 to 34 Years | 0 (0.0%) | 0 (0.0%) |
| 35 to 64 Years | 0 (0.0%) | 0 (0.0%) |
| 65 to 74 Years | 0 (0.0%) | 0 (0.0%) |
| 75 Years and over | 0 (0.0%) | 0 (0.0%) |
Disability Class: Vision Difficulty
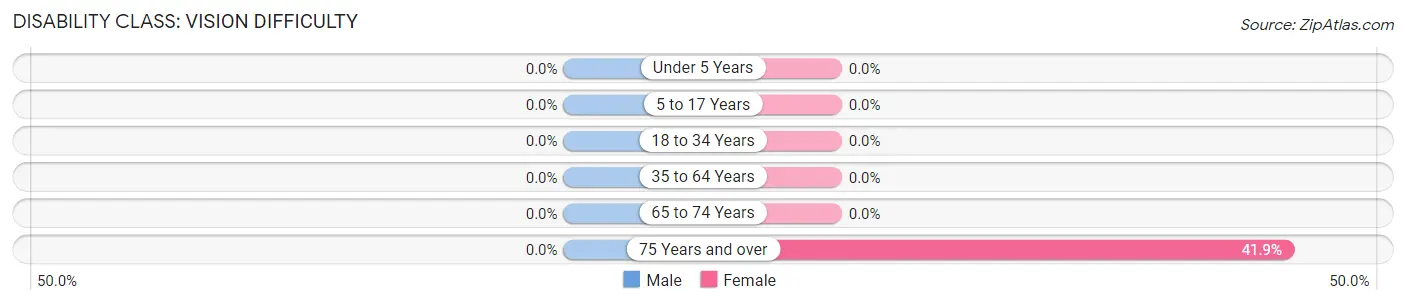
| Age Bracket | Male | Female |
| Under 5 Years | 0 (0.0%) | 0 (0.0%) |
| 5 to 17 Years | 0 (0.0%) | 0 (0.0%) |
| 18 to 34 Years | 0 (0.0%) | 0 (0.0%) |
| 35 to 64 Years | 0 (0.0%) | 0 (0.0%) |
| 65 to 74 Years | 0 (0.0%) | 0 (0.0%) |
| 75 Years and over | 0 (0.0%) | 13 (41.9%) |
Disability Class: Cognitive Difficulty
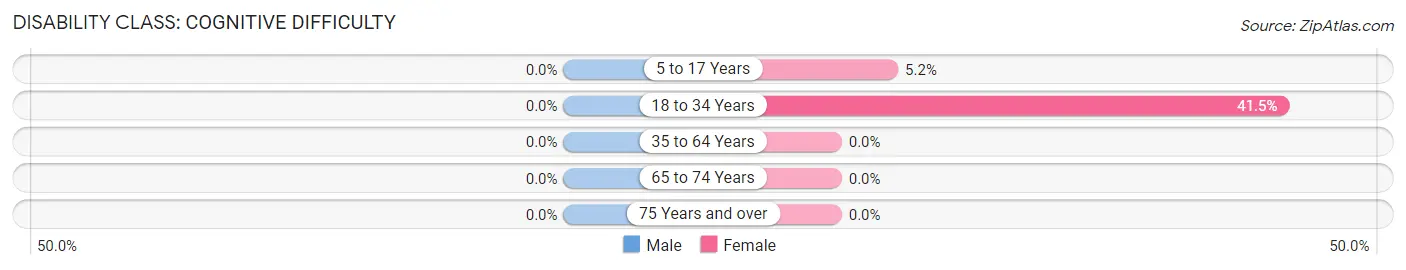
| Age Bracket | Male | Female |
| 5 to 17 Years | 0 (0.0%) | 8 (5.2%) |
| 18 to 34 Years | 0 (0.0%) | 49 (41.5%) |
| 35 to 64 Years | 0 (0.0%) | 0 (0.0%) |
| 65 to 74 Years | 0 (0.0%) | 0 (0.0%) |
| 75 Years and over | 0 (0.0%) | 0 (0.0%) |
Disability Class: Ambulatory Difficulty
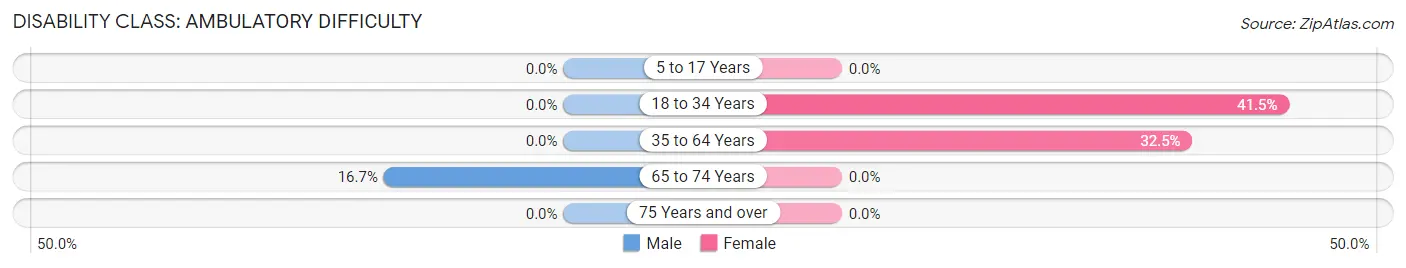
| Age Bracket | Male | Female |
| 5 to 17 Years | 0 (0.0%) | 0 (0.0%) |
| 18 to 34 Years | 0 (0.0%) | 49 (41.5%) |
| 35 to 64 Years | 0 (0.0%) | 55 (32.5%) |
| 65 to 74 Years | 4 (16.7%) | 0 (0.0%) |
| 75 Years and over | 0 (0.0%) | 0 (0.0%) |
Disability Class: Self-Care Difficulty
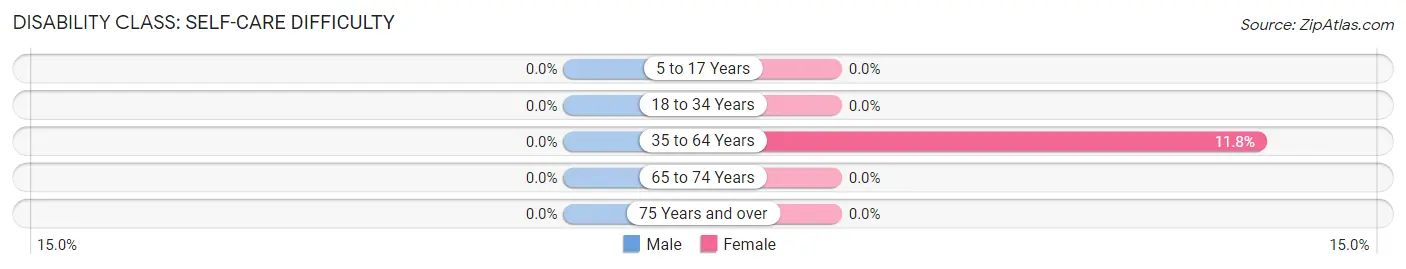
| Age Bracket | Male | Female |
| 5 to 17 Years | 0 (0.0%) | 0 (0.0%) |
| 18 to 34 Years | 0 (0.0%) | 0 (0.0%) |
| 35 to 64 Years | 0 (0.0%) | 20 (11.8%) |
| 65 to 74 Years | 0 (0.0%) | 0 (0.0%) |
| 75 Years and over | 0 (0.0%) | 0 (0.0%) |
Technology Access in Twinsburg Heights
Computing Device Access in Twinsburg Heights
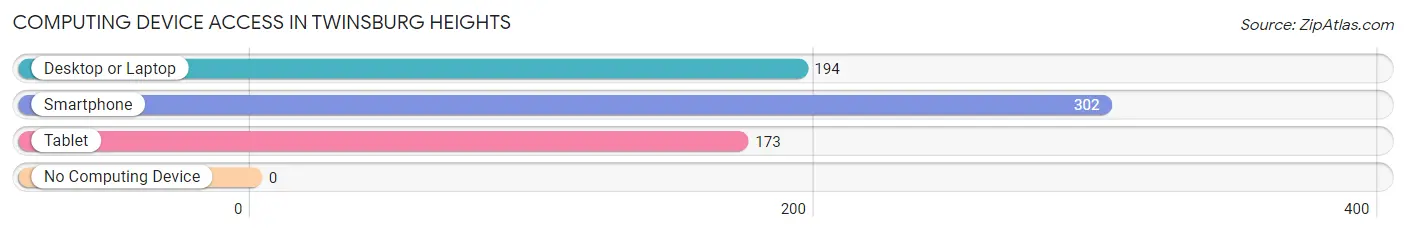
| Device Type | # Households | % Households |
| Desktop or Laptop | 194 | 60.1% |
| Smartphone | 302 | 93.5% |
| Tablet | 173 | 53.6% |
| No Computing Device | 0 | 0.0% |
| Total | 323 | 100.0% |
Internet Access in Twinsburg Heights
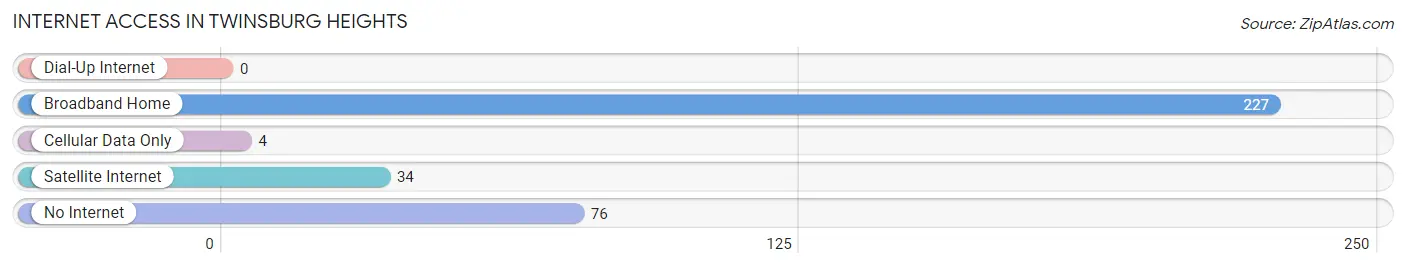
| Internet Type | # Households | % Households |
| Dial-Up Internet | 0 | 0.0% |
| Broadband Home | 227 | 70.3% |
| Cellular Data Only | 4 | 1.2% |
| Satellite Internet | 34 | 10.5% |
| No Internet | 76 | 23.5% |
| Total | 323 | 100.0% |
Twinsburg Heights Summary
Twinsburg Heights is a small village located in Summit County, Ohio. It is situated in the northeast corner of the county, just south of the city of Twinsburg. The village is bordered by the cities of Macedonia and Northfield to the north, and the city of Twinsburg to the south. The village is part of the Twinsburg City School District.
History
Twinsburg Heights was founded in 1818 by two brothers, John and Jacob Stow. The brothers had purchased the land from the Connecticut Land Company and named the area after their hometown of Twinsburg, Connecticut. The village was originally known as Stow’s Corners, but the name was changed to Twinsburg Heights in 1845.
The village was primarily an agricultural community until the late 19th century, when the railroad was built through the area. This allowed for the development of industry and commerce in the area, and the village began to grow. By the early 20th century, the village had become a popular summer resort destination, with many visitors coming to enjoy the area’s natural beauty.
Geography
Twinsburg Heights is located in Summit County, Ohio. It is situated in the northeast corner of the county, just south of the city of Twinsburg. The village is bordered by the cities of Macedonia and Northfield to the north, and the city of Twinsburg to the south. The village is part of the Twinsburg City School District.
The village is located on the western edge of the Cuyahoga Valley National Park. The park is a popular destination for outdoor recreation, and includes a variety of trails, rivers, and lakes. The village is also located near the Cuyahoga River, which is a popular destination for fishing and boating.
Economy
Twinsburg Heights is primarily a residential community, with most of its residents commuting to nearby cities for work. The village does have a few small businesses, including a grocery store, a gas station, and a few restaurants. The village is also home to a few small manufacturing companies.
The village is part of the Twinsburg City School District, which serves the surrounding area. The district is home to several elementary, middle, and high schools, as well as a vocational school.
Demographics
As of the 2010 census, the population of Twinsburg Heights was 2,845. The population is primarily white (94.3%), with a small percentage of African Americans (2.2%) and Hispanics (2.2%). The median household income is $50,945, and the median home value is $179,400.
Twinsburg Heights is a small, close-knit community. The village is home to a variety of churches, and there are several community organizations and events throughout the year. The village is also home to a few parks and recreational areas, including a public pool and a skate park.
Common Questions
What is the Total Population of Twinsburg Heights?
Total Population of Twinsburg Heights is 960.
What is the Total Male Population of Twinsburg Heights?
Total Male Population of Twinsburg Heights is 433.
What is the Total Female Population of Twinsburg Heights?
Total Female Population of Twinsburg Heights is 527.
What is the Ratio of Males per 100 Females in Twinsburg Heights?
There are 82.16 Males per 100 Females in Twinsburg Heights.
What is the Ratio of Females per 100 Males in Twinsburg Heights?
There are 121.71 Females per 100 Males in Twinsburg Heights.
What is the Median Population Age in Twinsburg Heights?
Median Population Age in Twinsburg Heights is 26.1 Years.
What is the Average Family Size in Twinsburg Heights
Average Family Size in Twinsburg Heights is 3.9 People.
What is the Average Household Size in Twinsburg Heights
Average Household Size in Twinsburg Heights is 3.0 People.
What is Per Capita Income in Twinsburg Heights?
Per Capita income in Twinsburg Heights is $23,023.
What is the Median Household income in Twinsburg Heights?
Median Household Income in Twinsburg Heights is $36,528.
What is Family Income Deficit in Twinsburg Heights?
Family Income Deficit in Twinsburg Heights is $11,057.
Families that are below poverty line in Twinsburg Heights earn $11,057 less on average than the poverty threshold level.
What is Inequality or Gini Index in Twinsburg Heights?
Inequality or Gini Index in Twinsburg Heights is 0.52.
How Large is the Labor Force in Twinsburg Heights?
There are 478 People in the Labor Forcein in Twinsburg Heights.
What is the Percentage of People in the Labor Force in Twinsburg Heights?
74.0% of People are in the Labor Force in Twinsburg Heights.
What is the Unemployment Rate in Twinsburg Heights?
Unemployment Rate in Twinsburg Heights is 23.2%.