Sycamore Hills, MO
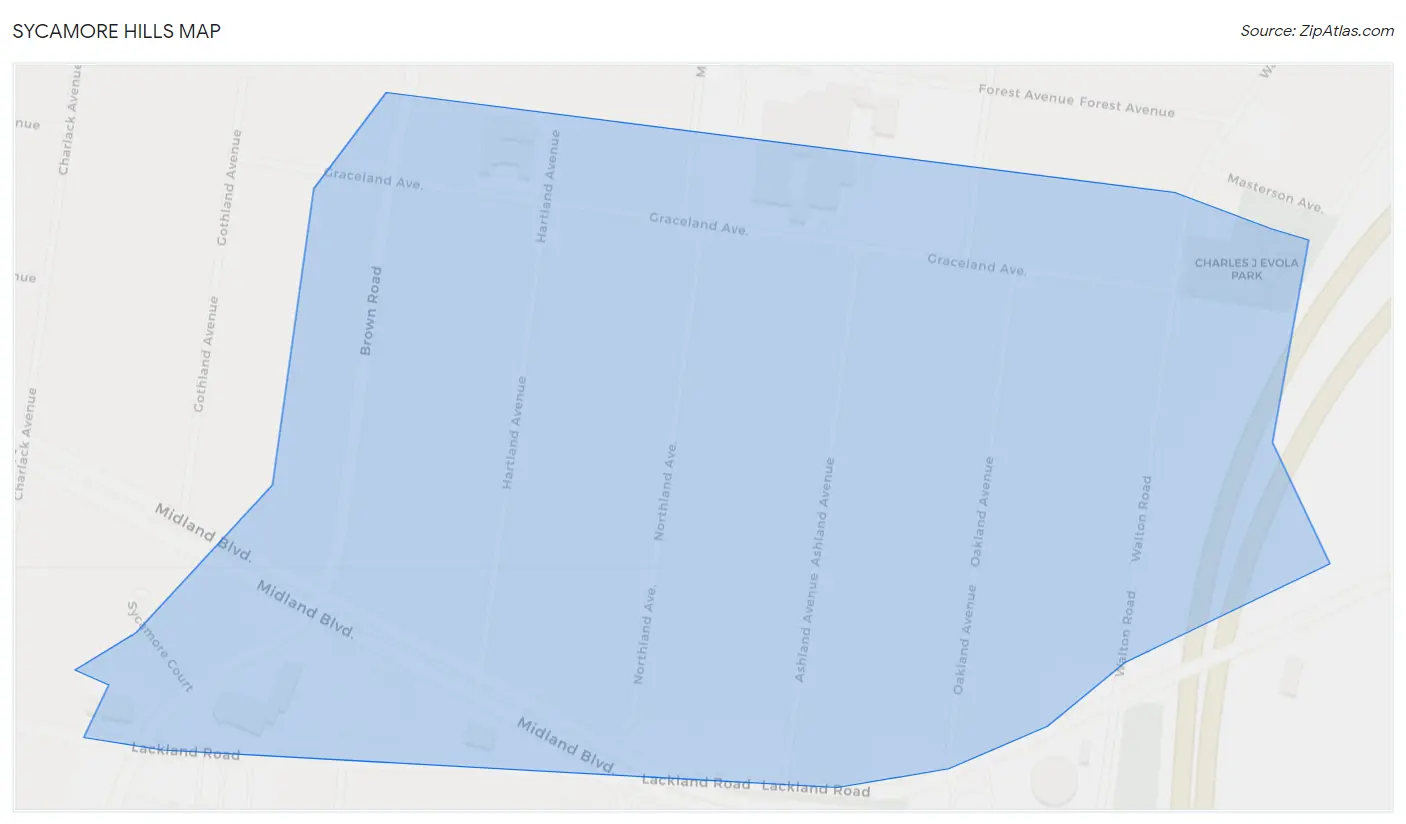
Sycamore Hills Map
Sycamore Hills Overview
621
TOTAL POPULATION
279
MALE POPULATION
342
FEMALE POPULATION
81.58
MALES / 100 FEMALES
122.58
FEMALES / 100 MALES
49.3
MEDIAN AGE
2.7
AVG FAMILY SIZE
1.9
AVG HOUSEHOLD SIZE
$41,494
PER CAPITA INCOME
$90,625
AVG FAMILY INCOME
$85,229
AVG HOUSEHOLD INCOME
0.9%
WAGE / INCOME GAP [ % ]
99.1¢/ $1
WAGE / INCOME GAP [ $ ]
0.31
INEQUALITY / GINI INDEX
421
LABOR FORCE [ PEOPLE ]
75.2%
PERCENT IN LABOR FORCE
0.5%
UNEMPLOYMENT RATE
Sycamore Hills Area Codes
Race in Sycamore Hills
The most populous races in Sycamore Hills are White / Caucasian (418 | 67.3%), Black / African American (146 | 23.5%), and Two or more Races (26 | 4.2%).
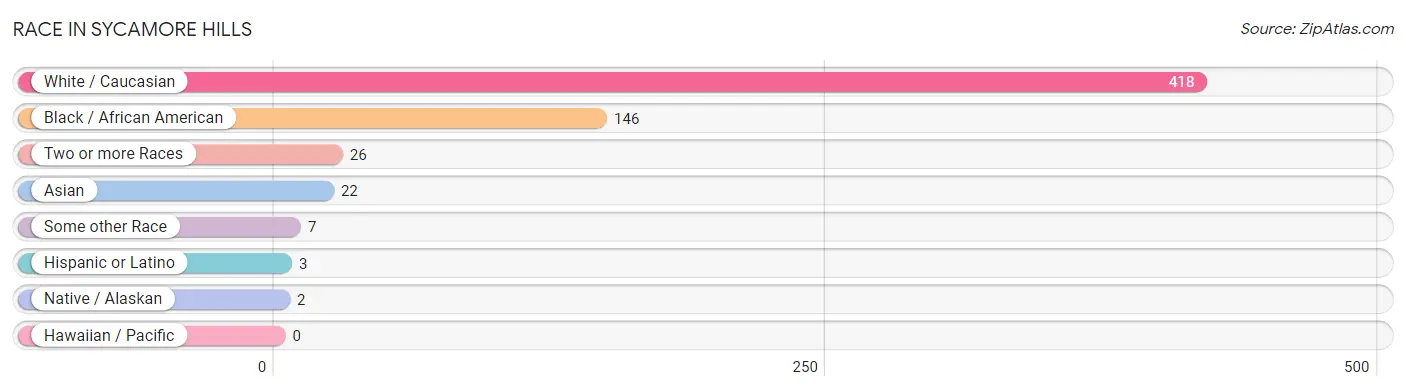
| Race | # Population | % Population |
| Asian | 22 | 3.5% |
| Black / African American | 146 | 23.5% |
| Hawaiian / Pacific | 0 | 0.0% |
| Hispanic or Latino | 3 | 0.5% |
| Native / Alaskan | 2 | 0.3% |
| White / Caucasian | 418 | 67.3% |
| Two or more Races | 26 | 4.2% |
| Some other Race | 7 | 1.1% |
| Total | 621 | 100.0% |
Ancestry in Sycamore Hills
The most populous ancestries reported in Sycamore Hills are German (152 | 24.5%), Irish (92 | 14.8%), English (87 | 14.0%), French (36 | 5.8%), and Italian (34 | 5.5%), together accounting for 64.6% of all Sycamore Hills residents.
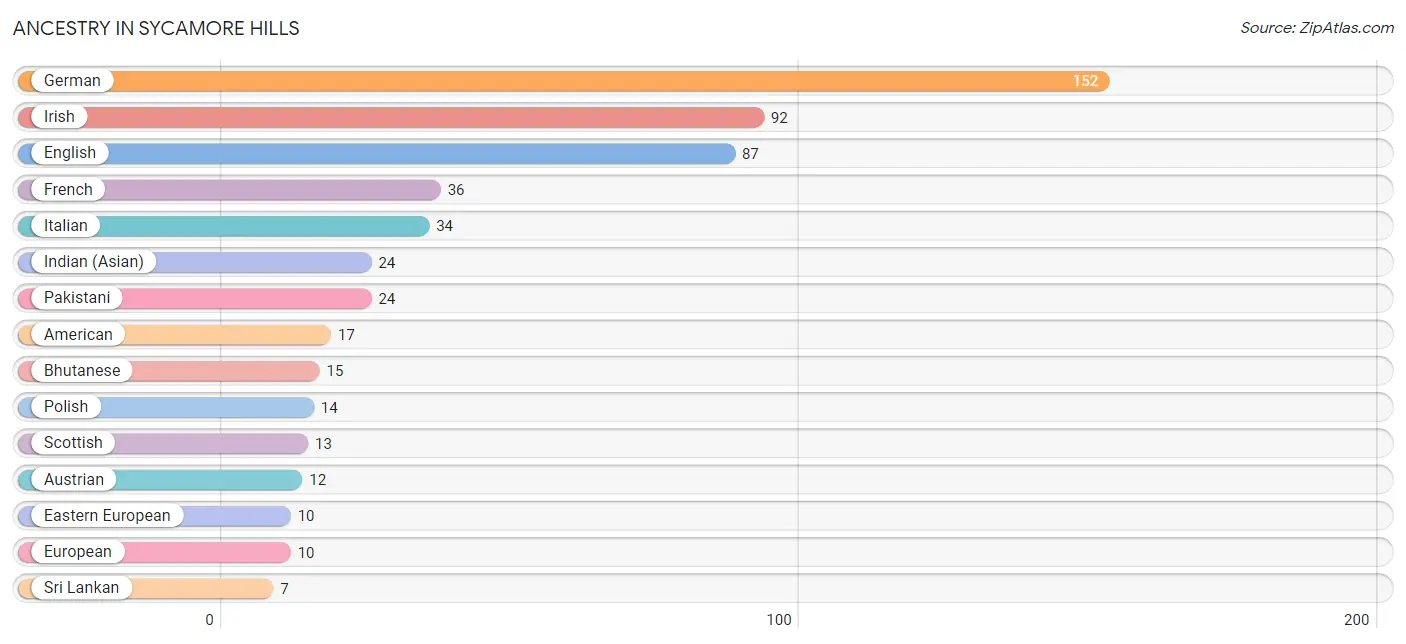
| Ancestry | # Population | % Population |
| American | 17 | 2.7% |
| Austrian | 12 | 1.9% |
| Belgian | 2 | 0.3% |
| Bhutanese | 15 | 2.4% |
| British | 4 | 0.6% |
| Burmese | 3 | 0.5% |
| Central American | 2 | 0.3% |
| Central American Indian | 2 | 0.3% |
| Dutch | 1 | 0.2% |
| Eastern European | 10 | 1.6% |
| English | 87 | 14.0% |
| European | 10 | 1.6% |
| French | 36 | 5.8% |
| German | 152 | 24.5% |
| Greek | 3 | 0.5% |
| Guatemalan | 2 | 0.3% |
| Hungarian | 2 | 0.3% |
| Indian (Asian) | 24 | 3.9% |
| Iranian | 2 | 0.3% |
| Irish | 92 | 14.8% |
| Italian | 34 | 5.5% |
| Kenyan | 1 | 0.2% |
| Korean | 3 | 0.5% |
| Mexican | 1 | 0.2% |
| Norwegian | 2 | 0.3% |
| Pakistani | 24 | 3.9% |
| Polish | 14 | 2.2% |
| Romanian | 2 | 0.3% |
| Russian | 5 | 0.8% |
| Scotch-Irish | 6 | 1.0% |
| Scottish | 13 | 2.1% |
| Slovak | 4 | 0.6% |
| Sri Lankan | 7 | 1.1% |
| Subsaharan African | 1 | 0.2% |
| Swedish | 3 | 0.5% |
| Swiss | 6 | 1.0% |
| Welsh | 4 | 0.6% | View All 37 Rows |
Immigrants in Sycamore Hills
The most numerous immigrant groups reported in Sycamore Hills came from Asia (16 | 2.6%), South Eastern Asia (12 | 1.9%), Thailand (9 | 1.5%), Kazakhstan (4 | 0.6%), and South Central Asia (4 | 0.6%), together accounting for 7.2% of all Sycamore Hills residents.
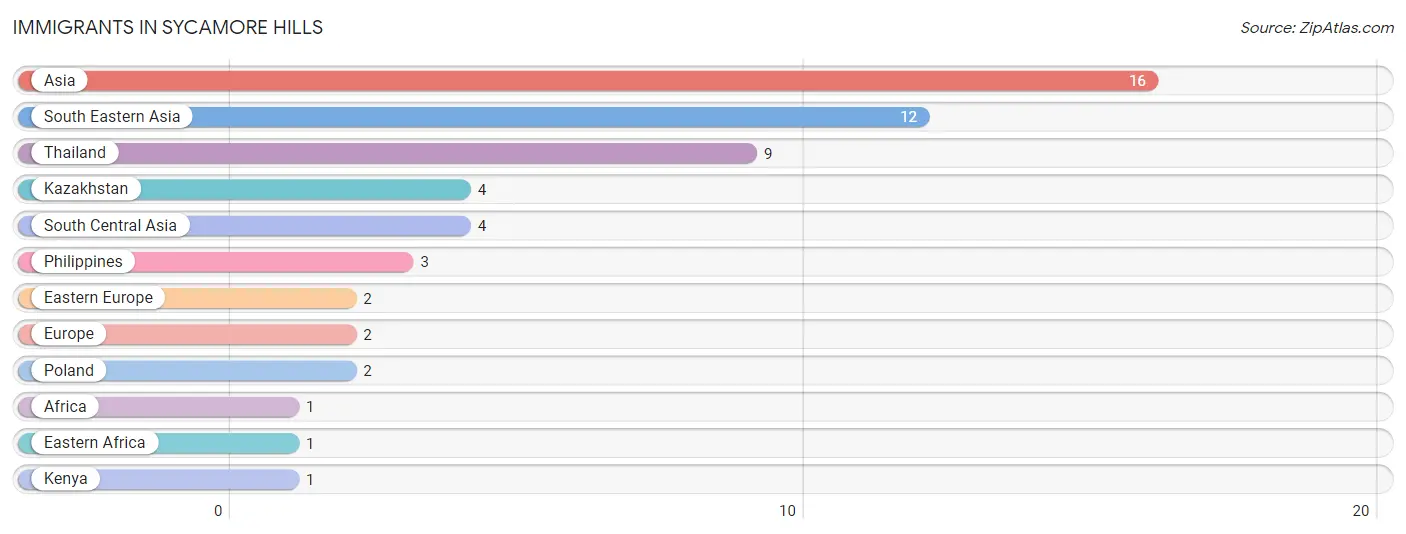
| Immigration Origin | # Population | % Population |
| Africa | 1 | 0.2% |
| Asia | 16 | 2.6% |
| Eastern Africa | 1 | 0.2% |
| Eastern Europe | 2 | 0.3% |
| Europe | 2 | 0.3% |
| Kazakhstan | 4 | 0.6% |
| Kenya | 1 | 0.2% |
| Philippines | 3 | 0.5% |
| Poland | 2 | 0.3% |
| South Central Asia | 4 | 0.6% |
| South Eastern Asia | 12 | 1.9% |
| Thailand | 9 | 1.5% | View All 12 Rows |
Sex and Age in Sycamore Hills
Sex and Age in Sycamore Hills
The most populous age groups in Sycamore Hills are 15 to 19 Years (47 | 16.9%) for men and 45 to 49 Years (93 | 27.2%) for women.
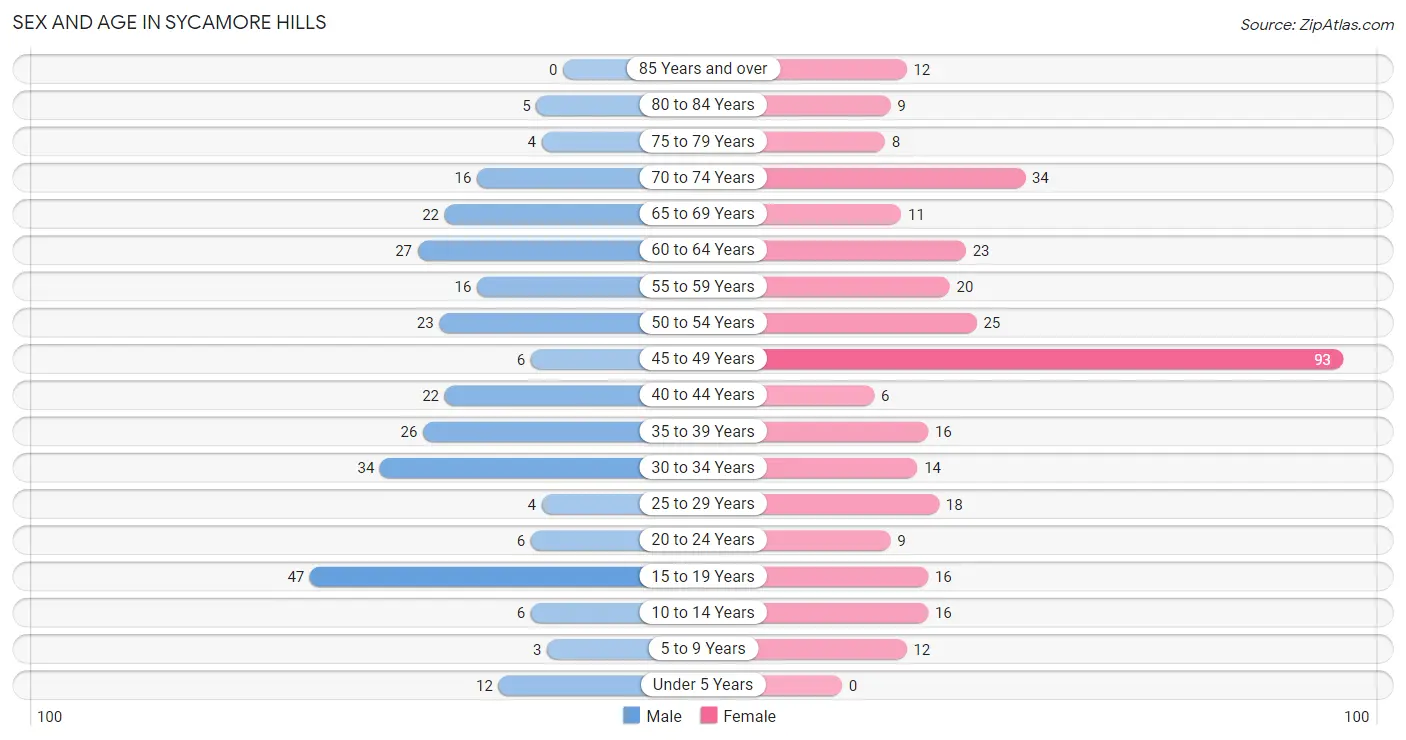
| Age Bracket | Male | Female |
| Under 5 Years | 12 (4.3%) | 0 (0.0%) |
| 5 to 9 Years | 3 (1.1%) | 12 (3.5%) |
| 10 to 14 Years | 6 (2.1%) | 16 (4.7%) |
| 15 to 19 Years | 47 (16.9%) | 16 (4.7%) |
| 20 to 24 Years | 6 (2.1%) | 9 (2.6%) |
| 25 to 29 Years | 4 (1.4%) | 18 (5.3%) |
| 30 to 34 Years | 34 (12.2%) | 14 (4.1%) |
| 35 to 39 Years | 26 (9.3%) | 16 (4.7%) |
| 40 to 44 Years | 22 (7.9%) | 6 (1.8%) |
| 45 to 49 Years | 6 (2.1%) | 93 (27.2%) |
| 50 to 54 Years | 23 (8.2%) | 25 (7.3%) |
| 55 to 59 Years | 16 (5.7%) | 20 (5.9%) |
| 60 to 64 Years | 27 (9.7%) | 23 (6.7%) |
| 65 to 69 Years | 22 (7.9%) | 11 (3.2%) |
| 70 to 74 Years | 16 (5.7%) | 34 (9.9%) |
| 75 to 79 Years | 4 (1.4%) | 8 (2.3%) |
| 80 to 84 Years | 5 (1.8%) | 9 (2.6%) |
| 85 Years and over | 0 (0.0%) | 12 (3.5%) |
| Total | 279 (100.0%) | 342 (100.0%) |
Families and Households in Sycamore Hills
Median Family Size in Sycamore Hills
The median family size in Sycamore Hills is 2.70 persons per family, with single female/mother families (32 | 23.7%) accounting for the largest median family size of 2.88 persons per family. On the other hand, single male/father families (18 | 13.3%) represent the smallest median family size with 2.39 persons per family.
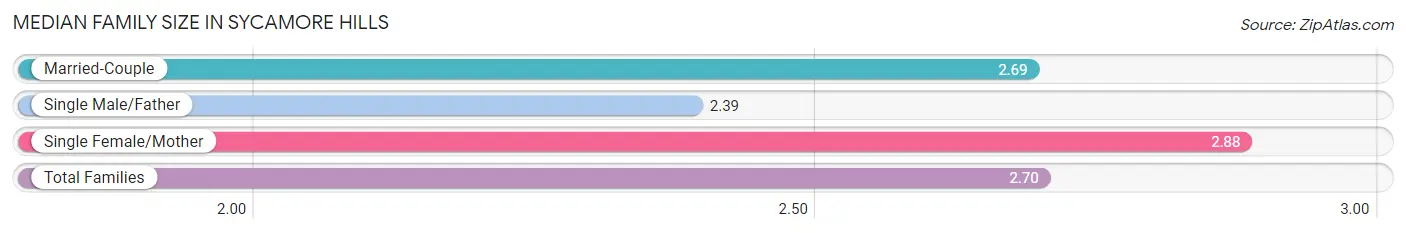
| Family Type | # Families | Family Size |
| Married-Couple | 85 (63.0%) | 2.69 |
| Single Male/Father | 18 (13.3%) | 2.39 |
| Single Female/Mother | 32 (23.7%) | 2.88 |
| Total Families | 135 (100.0%) | 2.70 |
Median Household Size in Sycamore Hills
The median household size in Sycamore Hills is 1.90 persons per household, with single female/mother households (32 | 9.8%) accounting for the largest median household size of 3.16 persons per household. non-family households (192 | 58.7%) represent the smallest median household size with 1.27 persons per household.
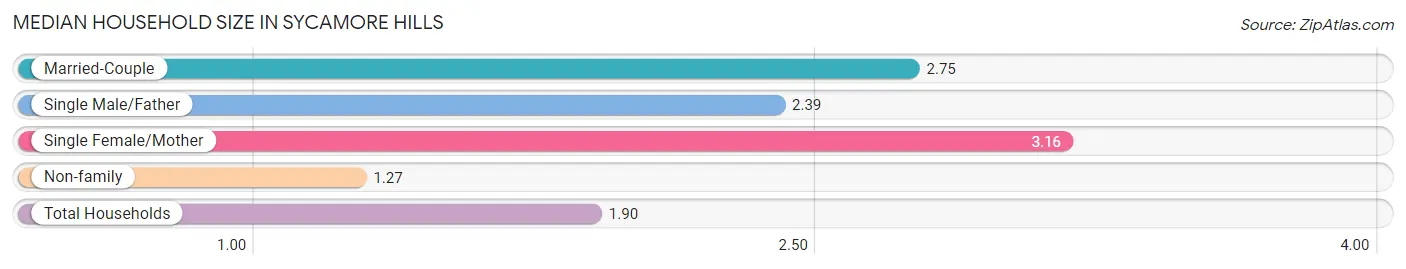
| Household Type | # Households | Household Size |
| Married-Couple | 85 (26.0%) | 2.75 |
| Single Male/Father | 18 (5.5%) | 2.39 |
| Single Female/Mother | 32 (9.8%) | 3.16 |
| Non-family | 192 (58.7%) | 1.27 |
| Total Households | 327 (100.0%) | 1.90 |
Household Size by Marriage Status in Sycamore Hills
Out of a total of 327 households in Sycamore Hills, 135 (41.3%) are family households, while 192 (58.7%) are nonfamily households. The most numerous type of family households are 2-person households, comprising 80, and the most common type of nonfamily households are 1-person households, comprising 147.
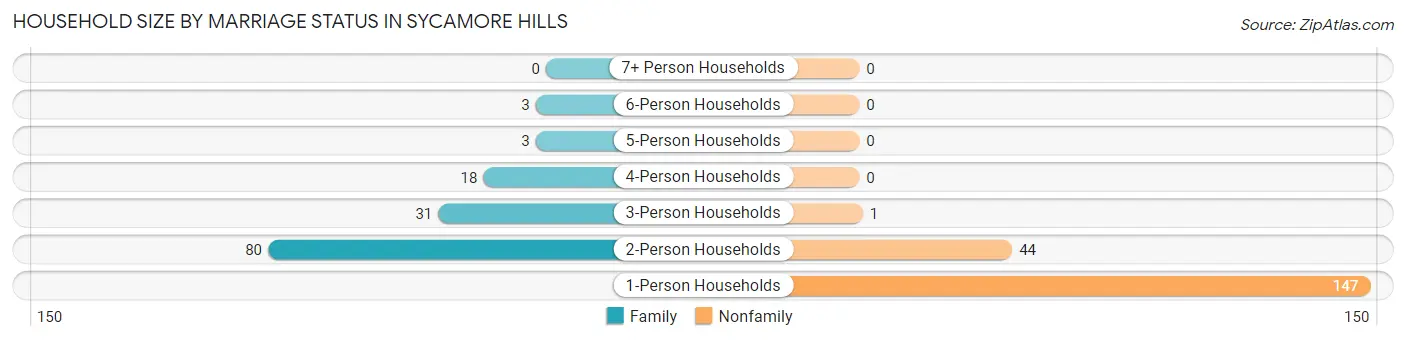
| Household Size | Family Households | Nonfamily Households |
| 1-Person Households | - | 147 (45.0%) |
| 2-Person Households | 80 (24.5%) | 44 (13.5%) |
| 3-Person Households | 31 (9.5%) | 1 (0.3%) |
| 4-Person Households | 18 (5.5%) | 0 (0.0%) |
| 5-Person Households | 3 (0.9%) | 0 (0.0%) |
| 6-Person Households | 3 (0.9%) | 0 (0.0%) |
| 7+ Person Households | 0 (0.0%) | 0 (0.0%) |
| Total | 135 (41.3%) | 192 (58.7%) |
Female Fertility in Sycamore Hills
Fertility by Age in Sycamore Hills
| Age Bracket | Women with Births | Births / 1,000 Women |
| 15 to 19 years | 0 (0.0%) | 0.0 |
| 20 to 34 years | 0 (0.0%) | 0.0 |
| 35 to 50 years | 0 (0.0%) | 0.0 |
| Total | 0 (0.0%) | 0.0 |
Fertility by Age by Marriage Status in Sycamore Hills
| Age Bracket | Married | Unmarried |
| 15 to 19 years | 0 (0.0%) | 0 (0.0%) |
| 20 to 34 years | 0 (0.0%) | 0 (0.0%) |
| 35 to 50 years | 0 (0.0%) | 0 (0.0%) |
| Total | 0 (0.0%) | 0 (0.0%) |
Fertility by Education in Sycamore Hills
| Educational Attainment | Women with Births | Births / 1,000 Women |
| Less than High School | 0 (0.0%) | 0.0 |
| High School Diploma | 0 (0.0%) | 0.0 |
| College or Associate's Degree | 0 (0.0%) | 0.0 |
| Bachelor's Degree | 0 (0.0%) | 0.0 |
| Graduate Degree | 0 (0.0%) | 0.0 |
| Total | 0 (0.0%) | 0.0 |
Fertility by Education by Marriage Status in Sycamore Hills
| Educational Attainment | Married | Unmarried |
| Less than High School | 0 (0.0%) | 0 (0.0%) |
| High School Diploma | 0 (0.0%) | 0 (0.0%) |
| College or Associate's Degree | 0 (0.0%) | 0 (0.0%) |
| Bachelor's Degree | 0 (0.0%) | 0 (0.0%) |
| Graduate Degree | 0 (0.0%) | 0 (0.0%) |
| Total | 0 (0.0%) | 0 (0.0%) |
Income in Sycamore Hills
Income Overview in Sycamore Hills
Per Capita Income in Sycamore Hills is $41,494, while median incomes of families and households are $90,625 and $85,229 respectively.
| Characteristic | Number | Measure |
| Per Capita Income | 621 | $41,494 |
| Median Family Income | 135 | $90,625 |
| Mean Family Income | 135 | $87,955 |
| Median Household Income | 327 | $85,229 |
| Mean Household Income | 327 | $76,978 |
| Income Deficit | 135 | $0 |
| Wage / Income Gap (%) | 621 | 0.94% |
| Wage / Income Gap ($) | 621 | 99.06¢ per $1 |
| Gini / Inequality Index | 621 | 0.31 |
Earnings by Sex in Sycamore Hills
Average Earnings in Sycamore Hills are $50,000, $50,192 for men and $49,722 for women, a difference of 0.9%.
| Sex | Number | Average Earnings |
| Male | 194 (45.8%) | $50,192 |
| Female | 230 (54.2%) | $49,722 |
| Total | 424 (100.0%) | $50,000 |
Earnings by Sex by Income Bracket in Sycamore Hills
The most common earnings brackets in Sycamore Hills are $65,000 to $74,999 for men (38 | 19.6%) and $75,000 to $99,999 for women (69 | 30.0%).
| Income | Male | Female |
| $2,499 or less | 0 (0.0%) | 3 (1.3%) |
| $2,500 to $4,999 | 2 (1.0%) | 2 (0.9%) |
| $5,000 to $7,499 | 0 (0.0%) | 18 (7.8%) |
| $7,500 to $9,999 | 24 (12.4%) | 3 (1.3%) |
| $10,000 to $12,499 | 15 (7.7%) | 4 (1.7%) |
| $12,500 to $14,999 | 0 (0.0%) | 0 (0.0%) |
| $15,000 to $17,499 | 0 (0.0%) | 9 (3.9%) |
| $17,500 to $19,999 | 4 (2.1%) | 4 (1.7%) |
| $20,000 to $22,499 | 0 (0.0%) | 3 (1.3%) |
| $22,500 to $24,999 | 5 (2.6%) | 6 (2.6%) |
| $25,000 to $29,999 | 0 (0.0%) | 9 (3.9%) |
| $30,000 to $34,999 | 0 (0.0%) | 9 (3.9%) |
| $35,000 to $39,999 | 9 (4.6%) | 17 (7.4%) |
| $40,000 to $44,999 | 22 (11.3%) | 6 (2.6%) |
| $45,000 to $49,999 | 15 (7.7%) | 23 (10.0%) |
| $50,000 to $54,999 | 15 (7.7%) | 10 (4.3%) |
| $55,000 to $64,999 | 27 (13.9%) | 13 (5.7%) |
| $65,000 to $74,999 | 38 (19.6%) | 12 (5.2%) |
| $75,000 to $99,999 | 14 (7.2%) | 69 (30.0%) |
| $100,000+ | 4 (2.1%) | 10 (4.3%) |
| Total | 194 (100.0%) | 230 (100.0%) |
Earnings by Sex by Educational Attainment in Sycamore Hills
Average earnings in Sycamore Hills are $55,455 for men and $54,750 for women, a difference of 1.3%. Men with an educational attainment of high school diploma enjoy the highest average annual earnings of $67,875, while those with bachelor's degree education earn the least with $49,167. Women with an educational attainment of graduate degree earn the most with the average annual earnings of $94,375, while those with high school diploma education have the smallest earnings of $36,339.
| Educational Attainment | Male Income | Female Income |
| Less than High School | - | - |
| High School Diploma | $67,875 | $36,339 |
| College or Associate's Degree | $50,385 | $85,081 |
| Bachelor's Degree | $49,167 | $53,125 |
| Graduate Degree | - | - |
| Total | $55,455 | $54,750 |
Family Income in Sycamore Hills
Family Income Brackets in Sycamore Hills
According to the Sycamore Hills family income data, there are 37 families falling into the $100,000 to $149,999 income range, which is the most common income bracket and makes up 27.4% of all families. Conversely, the $10,000 to $14,999 income bracket is the least frequent group with only 2 families (1.5%) belonging to this category.
| Income Bracket | # Families | % Families |
| Less than $10,000 | 3 | 2.2% |
| $10,000 to $14,999 | 2 | 1.5% |
| $15,000 to $24,999 | 3 | 2.2% |
| $25,000 to $34,999 | 2 | 1.5% |
| $35,000 to $49,999 | 27 | 20.0% |
| $50,000 to $74,999 | 22 | 16.3% |
| $75,000 to $99,999 | 25 | 18.5% |
| $100,000 to $149,999 | 37 | 27.4% |
| $150,000 to $199,999 | 12 | 8.9% |
| $200,000+ | 2 | 1.5% |
Family Income by Famaliy Size in Sycamore Hills
4-person families (13 | 9.6%) account for the highest median family income in Sycamore Hills with $131,250 per family, while 2-person families (89 | 65.9%) have the highest median income of $44,688 per family member.
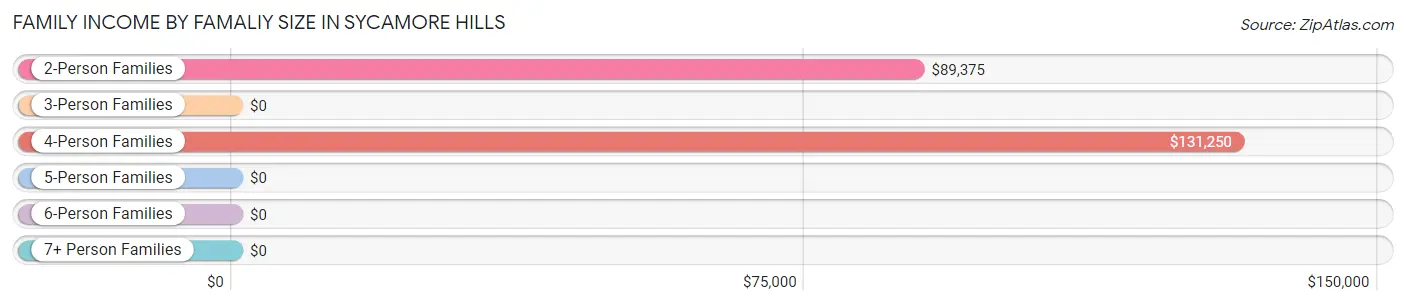
| Income Bracket | # Families | Median Income |
| 2-Person Families | 89 (65.9%) | $89,375 |
| 3-Person Families | 27 (20.0%) | $0 |
| 4-Person Families | 13 (9.6%) | $131,250 |
| 5-Person Families | 3 (2.2%) | $0 |
| 6-Person Families | 3 (2.2%) | $0 |
| 7+ Person Families | 0 (0.0%) | $0 |
| Total | 135 (100.0%) | $90,625 |
Family Income by Number of Earners in Sycamore Hills
The median family income in Sycamore Hills is $90,625, with families comprising 3+ earners (11) having the highest median family income of $154,250, while families with no earners (15) have the lowest median family income of $35,417, accounting for 8.2% and 11.1% of families, respectively.
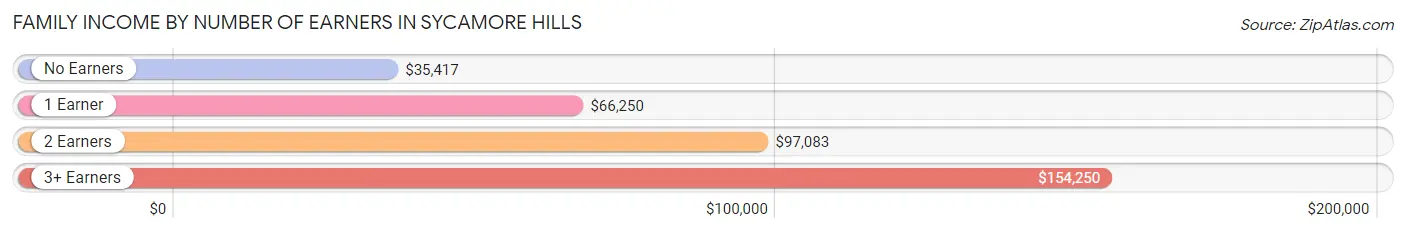
| Number of Earners | # Families | Median Income |
| No Earners | 15 (11.1%) | $35,417 |
| 1 Earner | 44 (32.6%) | $66,250 |
| 2 Earners | 65 (48.1%) | $97,083 |
| 3+ Earners | 11 (8.2%) | $154,250 |
| Total | 135 (100.0%) | $90,625 |
Household Income in Sycamore Hills
Household Income Brackets in Sycamore Hills
With 119 households falling in the category, the $75,000 to $99,999 income range is the most frequent in Sycamore Hills, accounting for 36.4% of all households. In contrast, only 5 households (1.5%) fall into the $200,000+ income bracket, making it the least populous group.
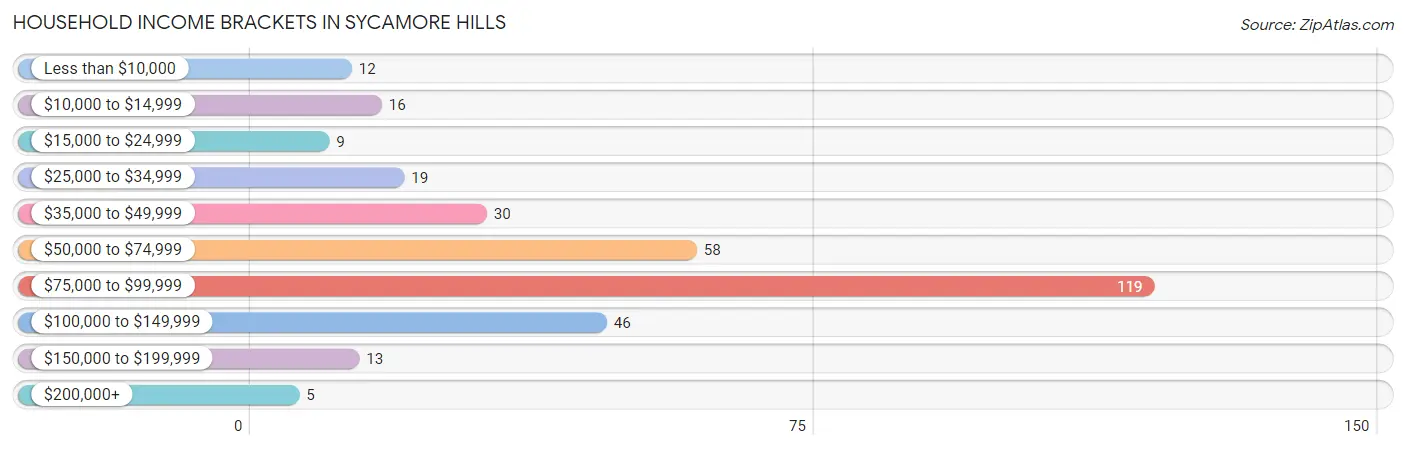
| Income Bracket | # Households | % Households |
| Less than $10,000 | 12 | 3.7% |
| $10,000 to $14,999 | 16 | 4.9% |
| $15,000 to $24,999 | 9 | 2.8% |
| $25,000 to $34,999 | 19 | 5.8% |
| $35,000 to $49,999 | 30 | 9.2% |
| $50,000 to $74,999 | 58 | 17.7% |
| $75,000 to $99,999 | 119 | 36.4% |
| $100,000 to $149,999 | 46 | 14.1% |
| $150,000 to $199,999 | 13 | 4.0% |
| $200,000+ | 5 | 1.5% |
Household Income by Householder Age in Sycamore Hills
The median household income in Sycamore Hills is $85,229, with the highest median household income of $86,500 found in the 45 to 64 years age bracket for the primary householder. A total of 164 households (50.1%) fall into this category. Meanwhile, the 15 to 24 years age bracket for the primary householder has the lowest median household income of $0, with 4 households (1.2%) in this group.
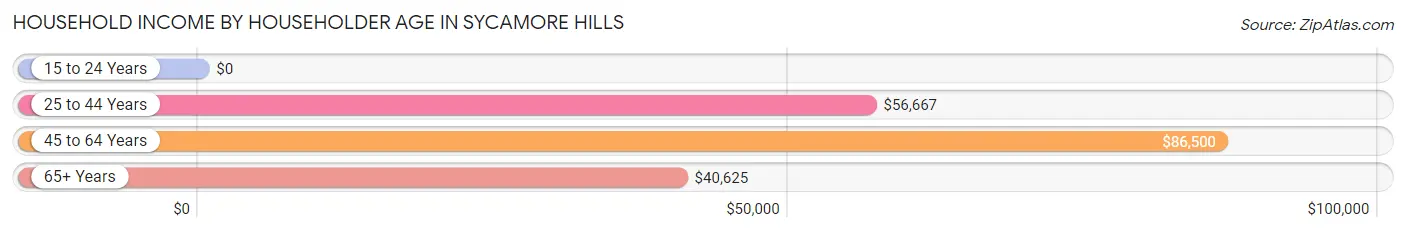
| Income Bracket | # Households | Median Income |
| 15 to 24 Years | 4 (1.2%) | $0 |
| 25 to 44 Years | 66 (20.2%) | $56,667 |
| 45 to 64 Years | 164 (50.1%) | $86,500 |
| 65+ Years | 93 (28.4%) | $40,625 |
| Total | 327 (100.0%) | $85,229 |
Poverty in Sycamore Hills
Income Below Poverty by Sex and Age in Sycamore Hills
With 6.9% poverty level for males and 9.7% for females among the residents of Sycamore Hills, 25 to 34 year old males and 75 year old and over females are the most vulnerable to poverty, with 12 males (31.6%) and 16 females (55.2%) in their respective age groups living below the poverty level.
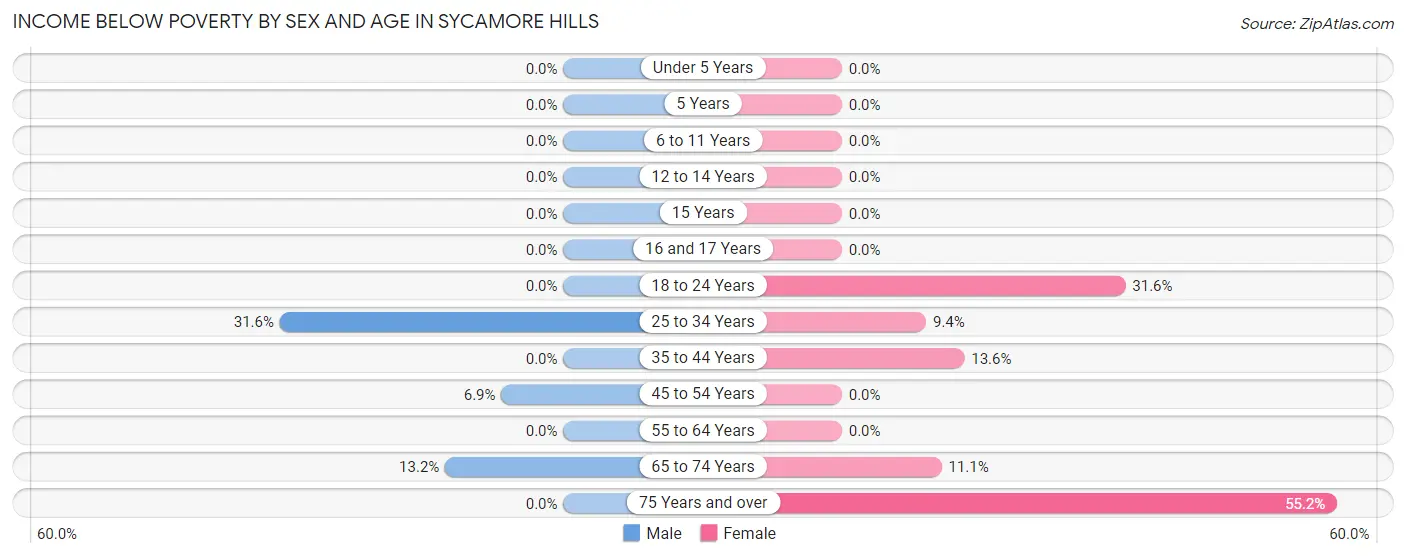
| Age Bracket | Male | Female |
| Under 5 Years | 0 (0.0%) | 0 (0.0%) |
| 5 Years | 0 (0.0%) | 0 (0.0%) |
| 6 to 11 Years | 0 (0.0%) | 0 (0.0%) |
| 12 to 14 Years | 0 (0.0%) | 0 (0.0%) |
| 15 Years | 0 (0.0%) | 0 (0.0%) |
| 16 and 17 Years | 0 (0.0%) | 0 (0.0%) |
| 18 to 24 Years | 0 (0.0%) | 6 (31.6%) |
| 25 to 34 Years | 12 (31.6%) | 3 (9.4%) |
| 35 to 44 Years | 0 (0.0%) | 3 (13.6%) |
| 45 to 54 Years | 2 (6.9%) | 0 (0.0%) |
| 55 to 64 Years | 0 (0.0%) | 0 (0.0%) |
| 65 to 74 Years | 5 (13.2%) | 5 (11.1%) |
| 75 Years and over | 0 (0.0%) | 16 (55.2%) |
| Total | 19 (6.9%) | 33 (9.7%) |
Income Above Poverty by Sex and Age in Sycamore Hills
According to the poverty statistics in Sycamore Hills, males aged under 5 years and females aged 6 to 11 years are the age groups that are most secure financially, with 100.0% of males and 100.0% of females in these age groups living above the poverty line.
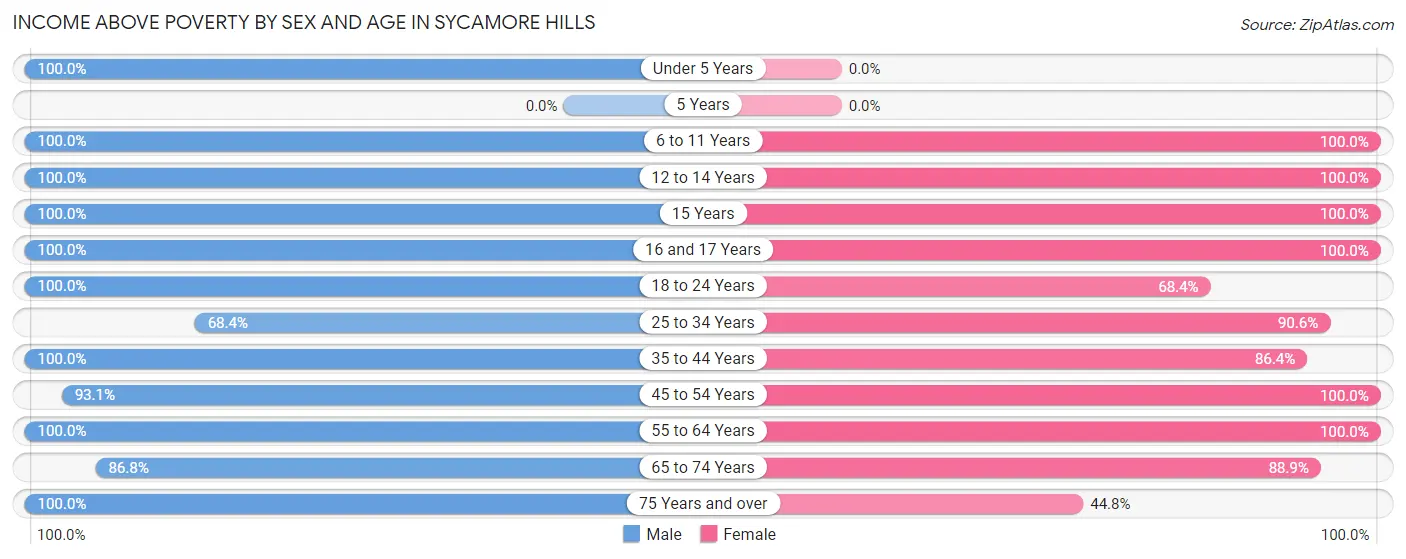
| Age Bracket | Male | Female |
| Under 5 Years | 7 (100.0%) | 0 (0.0%) |
| 5 Years | 0 (0.0%) | 0 (0.0%) |
| 6 to 11 Years | 3 (100.0%) | 20 (100.0%) |
| 12 to 14 Years | 6 (100.0%) | 8 (100.0%) |
| 15 Years | 9 (100.0%) | 3 (100.0%) |
| 16 and 17 Years | 34 (100.0%) | 3 (100.0%) |
| 18 to 24 Years | 10 (100.0%) | 13 (68.4%) |
| 25 to 34 Years | 26 (68.4%) | 29 (90.6%) |
| 35 to 44 Years | 48 (100.0%) | 19 (86.4%) |
| 45 to 54 Years | 27 (93.1%) | 118 (100.0%) |
| 55 to 64 Years | 43 (100.0%) | 43 (100.0%) |
| 65 to 74 Years | 33 (86.8%) | 40 (88.9%) |
| 75 Years and over | 9 (100.0%) | 13 (44.8%) |
| Total | 255 (93.1%) | 309 (90.3%) |
Income Below Poverty Among Married-Couple Families in Sycamore Hills
The poverty statistics for married-couple families in Sycamore Hills show that 2.4% or 2 of the total 85 families live below the poverty line. Families with no children have the highest poverty rate of 2.9%, comprising of 2 families. On the other hand, families with 1 or 2 children have the lowest poverty rate of 0.0%, which includes 0 families.
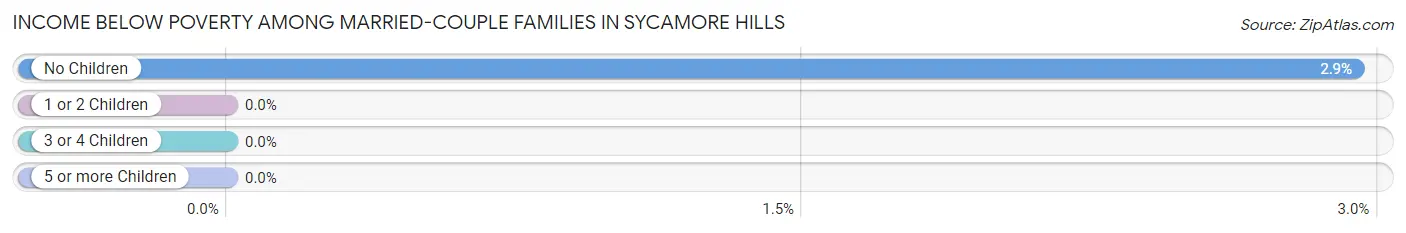
| Children | Above Poverty | Below Poverty |
| No Children | 66 (97.1%) | 2 (2.9%) |
| 1 or 2 Children | 14 (100.0%) | 0 (0.0%) |
| 3 or 4 Children | 3 (100.0%) | 0 (0.0%) |
| 5 or more Children | 0 (0.0%) | 0 (0.0%) |
| Total | 83 (97.7%) | 2 (2.4%) |
Income Below Poverty Among Single-Parent Households in Sycamore Hills
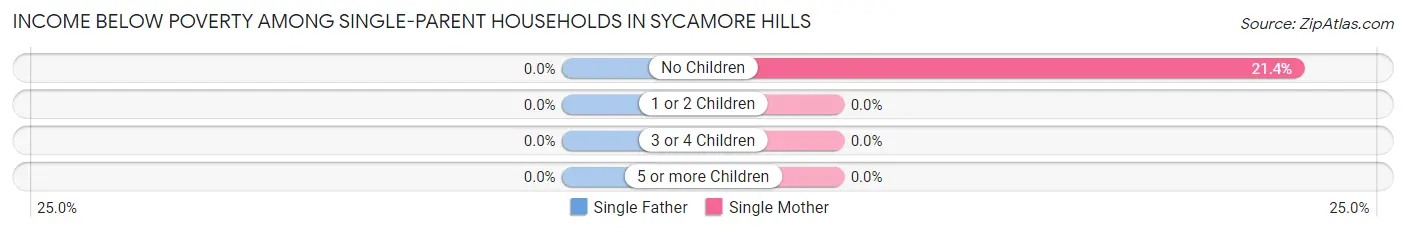
| Children | Single Father | Single Mother |
| No Children | 0 (0.0%) | 3 (21.4%) |
| 1 or 2 Children | 0 (0.0%) | 0 (0.0%) |
| 3 or 4 Children | 0 (0.0%) | 0 (0.0%) |
| 5 or more Children | 0 (0.0%) | 0 (0.0%) |
| Total | 0 (0.0%) | 3 (9.4%) |
Income Below Poverty Among Married-Couple vs Single-Parent Households in Sycamore Hills
The poverty data for Sycamore Hills shows that 2 of the married-couple family households (2.4%) and 3 of the single-parent households (6.0%) are living below the poverty level. Within the married-couple family households, those with no children have the highest poverty rate, with 2 households (2.9%) falling below the poverty line. Among the single-parent households, those with no children have the highest poverty rate, with 3 household (13.0%) living below poverty.
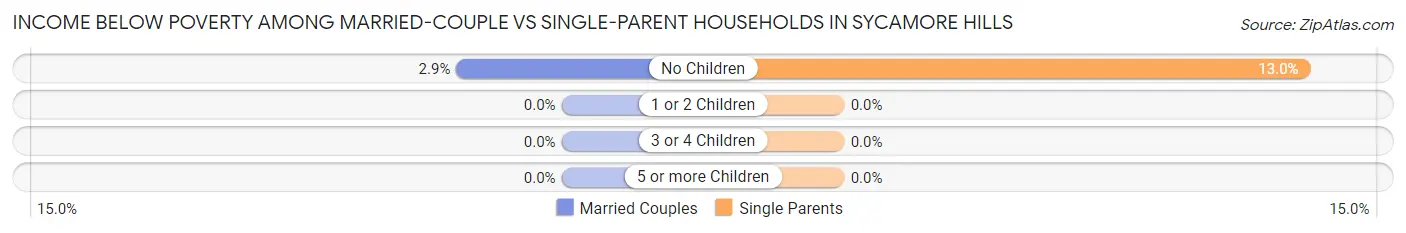
| Children | Married-Couple Families | Single-Parent Households |
| No Children | 2 (2.9%) | 3 (13.0%) |
| 1 or 2 Children | 0 (0.0%) | 0 (0.0%) |
| 3 or 4 Children | 0 (0.0%) | 0 (0.0%) |
| 5 or more Children | 0 (0.0%) | 0 (0.0%) |
| Total | 2 (2.4%) | 3 (6.0%) |
Employment Characteristics in Sycamore Hills
Employment by Class of Employer in Sycamore Hills
Among the 419 employed individuals in Sycamore Hills, private company employees (319 | 76.1%), not-for-profit organizations (40 | 9.6%), and federal government employees (25 | 6.0%) make up the most common classes of employment.
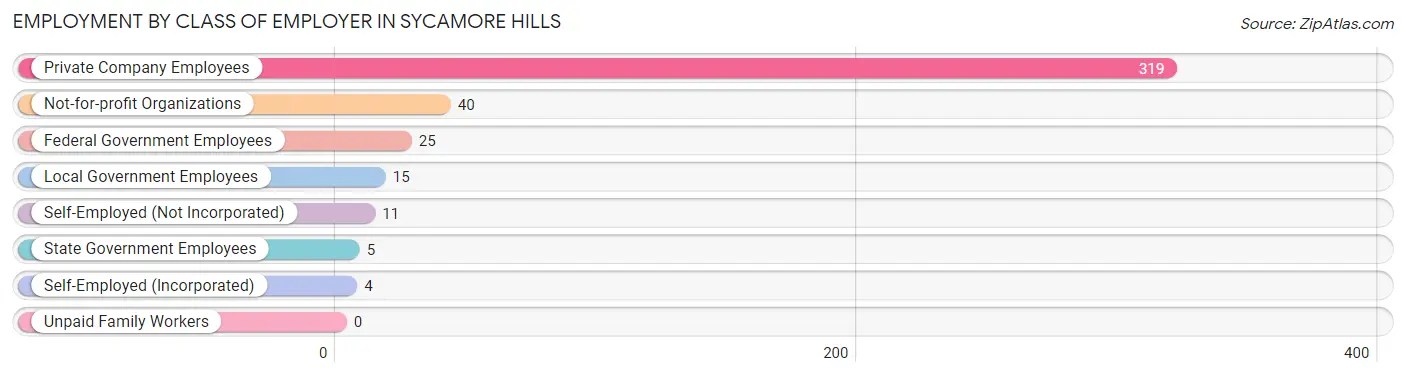
| Employer Class | # Employees | % Employees |
| Private Company Employees | 319 | 76.1% |
| Self-Employed (Incorporated) | 4 | 0.9% |
| Self-Employed (Not Incorporated) | 11 | 2.6% |
| Not-for-profit Organizations | 40 | 9.6% |
| Local Government Employees | 15 | 3.6% |
| State Government Employees | 5 | 1.2% |
| Federal Government Employees | 25 | 6.0% |
| Unpaid Family Workers | 0 | 0.0% |
| Total | 419 | 100.0% |
Employment Status by Age in Sycamore Hills
According to the labor force statistics for Sycamore Hills, out of the total population over 16 years of age (560), 75.2% or 421 individuals are in the labor force, with 0.5% or 2 of them unemployed. The age group with the highest labor force participation rate is 20 to 24 years, with 100.0% or 15 individuals in the labor force. Within the labor force, the 45 to 54 years age range has the highest percentage of unemployed individuals, with 1.4% or 2 of them being unemployed.
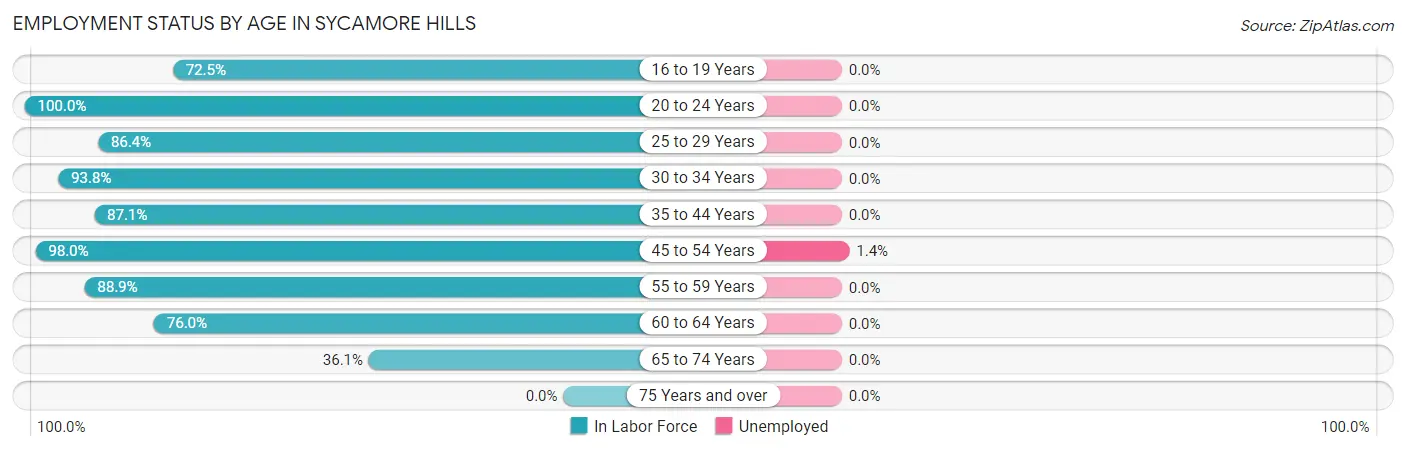
| Age Bracket | In Labor Force | Unemployed |
| 16 to 19 Years | 37 (72.5%) | 0 (0.0%) |
| 20 to 24 Years | 15 (100.0%) | 0 (0.0%) |
| 25 to 29 Years | 19 (86.4%) | 0 (0.0%) |
| 30 to 34 Years | 45 (93.8%) | 0 (0.0%) |
| 35 to 44 Years | 61 (87.1%) | 0 (0.0%) |
| 45 to 54 Years | 144 (98.0%) | 2 (1.4%) |
| 55 to 59 Years | 32 (88.9%) | 0 (0.0%) |
| 60 to 64 Years | 38 (76.0%) | 0 (0.0%) |
| 65 to 74 Years | 30 (36.1%) | 0 (0.0%) |
| 75 Years and over | 0 (0.0%) | 0 (0.0%) |
| Total | 421 (75.2%) | 2 (0.5%) |
Employment Status by Educational Attainment in Sycamore Hills
According to labor force statistics for Sycamore Hills, 90.9% of individuals (339) out of the total population between 25 and 64 years of age (373) are in the labor force, with 0.6% or 2 of them being unemployed. The group with the highest labor force participation rate are those with the educational attainment of bachelor's degree or higher, with 96.0% or 95 individuals in the labor force. Within the labor force, individuals with bachelor's degree or higher education have the highest percentage of unemployment, with 2.1% or 2 of them being unemployed.
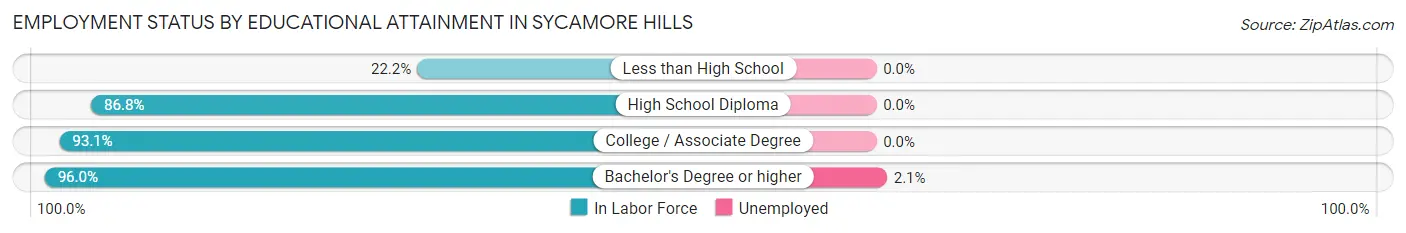
| Educational Attainment | In Labor Force | Unemployed |
| Less than High School | 2 (22.2%) | 0 (0.0%) |
| High School Diploma | 66 (86.8%) | 0 (0.0%) |
| College / Associate Degree | 176 (93.1%) | 0 (0.0%) |
| Bachelor's Degree or higher | 95 (96.0%) | 2 (2.1%) |
| Total | 339 (90.9%) | 2 (0.6%) |
Employment Occupations by Sex in Sycamore Hills
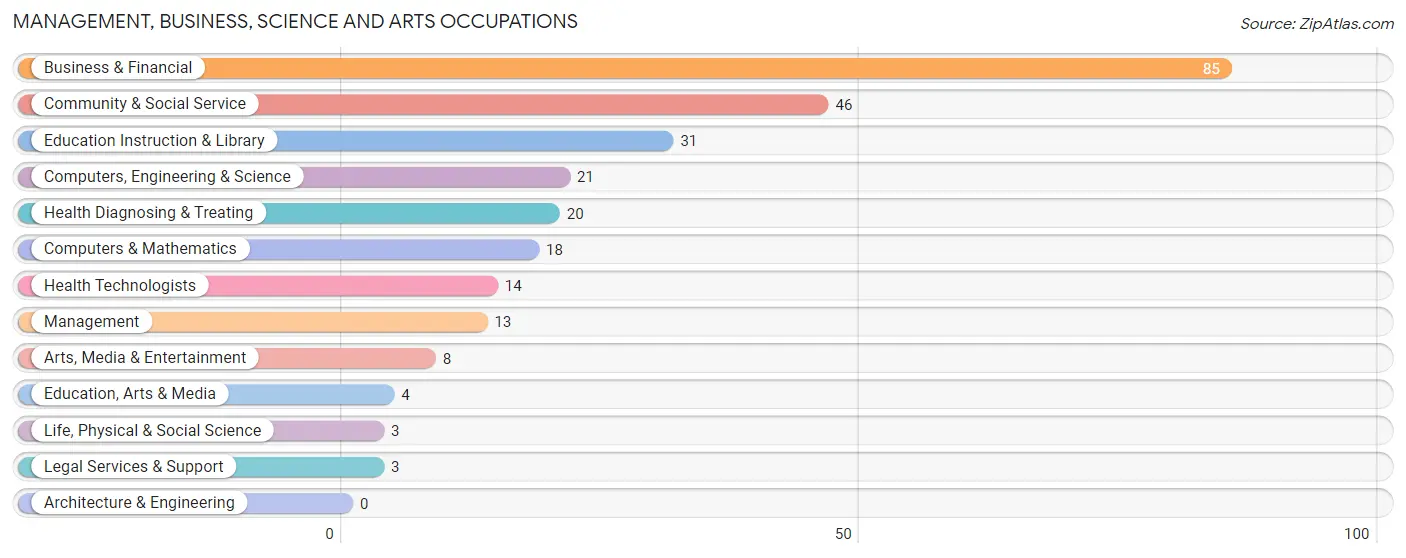
Management, Business, Science and Arts Occupations
The most common Management, Business, Science and Arts occupations in Sycamore Hills are Business & Financial (85 | 20.3%), Community & Social Service (46 | 11.0%), Education Instruction & Library (31 | 7.4%), Computers, Engineering & Science (21 | 5.0%), and Health Diagnosing & Treating (20 | 4.8%).
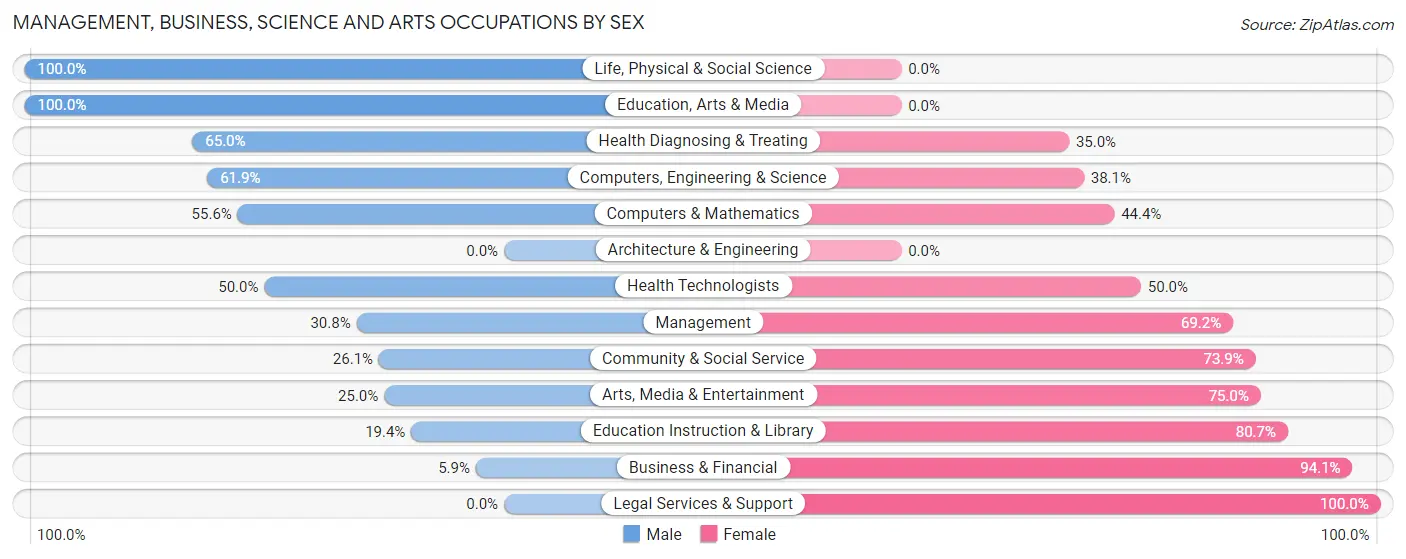
Management, Business, Science and Arts Occupations by Sex
Within the Management, Business, Science and Arts occupations in Sycamore Hills, the most male-oriented occupations are Life, Physical & Social Science (100.0%), Education, Arts & Media (100.0%), and Health Diagnosing & Treating (65.0%), while the most female-oriented occupations are Legal Services & Support (100.0%), Business & Financial (94.1%), and Education Instruction & Library (80.6%).
| Occupation | Male | Female |
| Management | 4 (30.8%) | 9 (69.2%) |
| Business & Financial | 5 (5.9%) | 80 (94.1%) |
| Computers, Engineering & Science | 13 (61.9%) | 8 (38.1%) |
| Computers & Mathematics | 10 (55.6%) | 8 (44.4%) |
| Architecture & Engineering | 0 (0.0%) | 0 (0.0%) |
| Life, Physical & Social Science | 3 (100.0%) | 0 (0.0%) |
| Community & Social Service | 12 (26.1%) | 34 (73.9%) |
| Education, Arts & Media | 4 (100.0%) | 0 (0.0%) |
| Legal Services & Support | 0 (0.0%) | 3 (100.0%) |
| Education Instruction & Library | 6 (19.4%) | 25 (80.6%) |
| Arts, Media & Entertainment | 2 (25.0%) | 6 (75.0%) |
| Health Diagnosing & Treating | 13 (65.0%) | 7 (35.0%) |
| Health Technologists | 7 (50.0%) | 7 (50.0%) |
| Total (Category) | 47 (25.4%) | 138 (74.6%) |
| Total (Overall) | 192 (45.8%) | 227 (54.2%) |
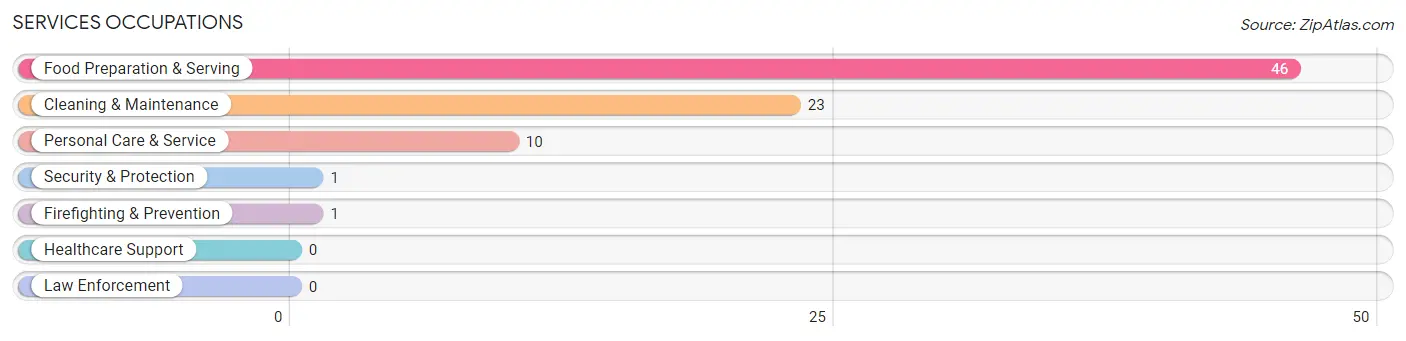
Services Occupations
The most common Services occupations in Sycamore Hills are Food Preparation & Serving (46 | 11.0%), Cleaning & Maintenance (23 | 5.5%), Personal Care & Service (10 | 2.4%), Security & Protection (1 | 0.2%), and Firefighting & Prevention (1 | 0.2%).
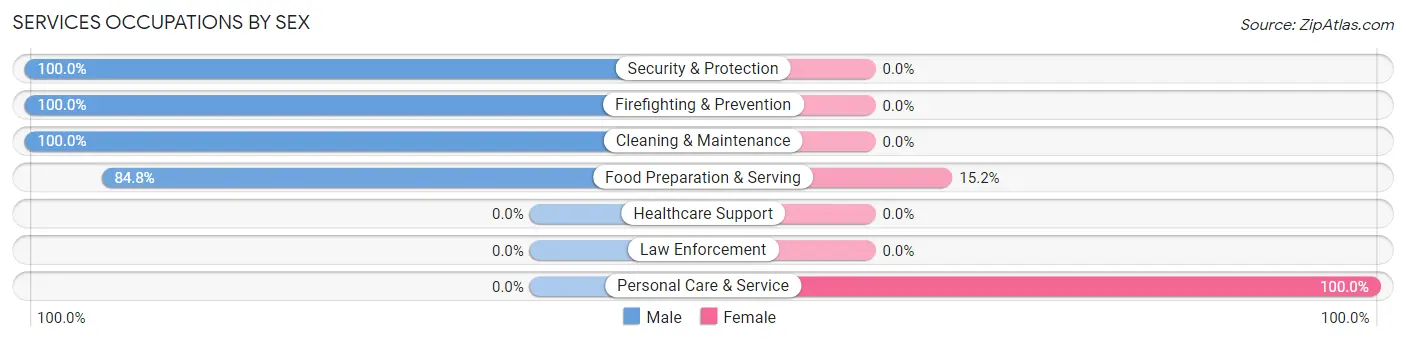
Services Occupations by Sex
Within the Services occupations in Sycamore Hills, the most male-oriented occupations are Security & Protection (100.0%), Firefighting & Prevention (100.0%), and Cleaning & Maintenance (100.0%), while the most female-oriented occupations are Personal Care & Service (100.0%), and Food Preparation & Serving (15.2%).
| Occupation | Male | Female |
| Healthcare Support | 0 (0.0%) | 0 (0.0%) |
| Security & Protection | 1 (100.0%) | 0 (0.0%) |
| Firefighting & Prevention | 1 (100.0%) | 0 (0.0%) |
| Law Enforcement | 0 (0.0%) | 0 (0.0%) |
| Food Preparation & Serving | 39 (84.8%) | 7 (15.2%) |
| Cleaning & Maintenance | 23 (100.0%) | 0 (0.0%) |
| Personal Care & Service | 0 (0.0%) | 10 (100.0%) |
| Total (Category) | 63 (78.7%) | 17 (21.2%) |
| Total (Overall) | 192 (45.8%) | 227 (54.2%) |
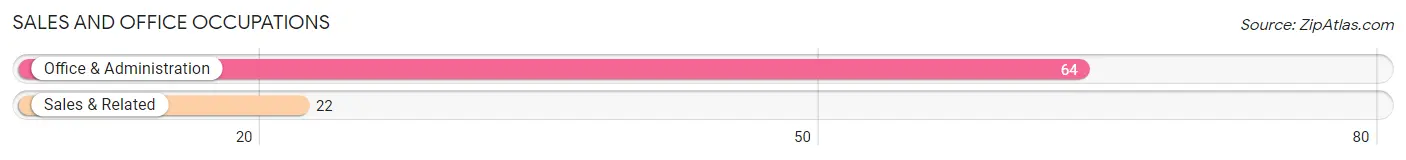
Sales and Office Occupations
The most common Sales and Office occupations in Sycamore Hills are Office & Administration (64 | 15.3%), and Sales & Related (22 | 5.2%).
Sales and Office Occupations by Sex
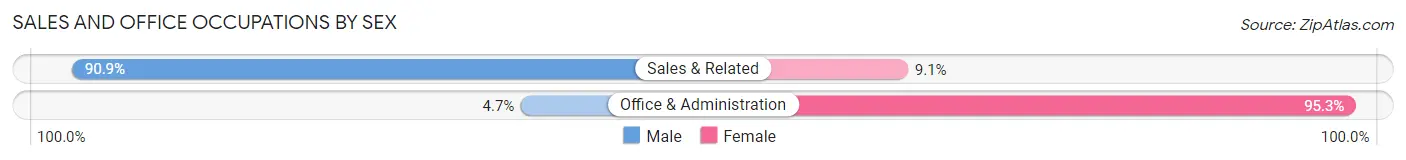
| Occupation | Male | Female |
| Sales & Related | 20 (90.9%) | 2 (9.1%) |
| Office & Administration | 3 (4.7%) | 61 (95.3%) |
| Total (Category) | 23 (26.7%) | 63 (73.3%) |
| Total (Overall) | 192 (45.8%) | 227 (54.2%) |
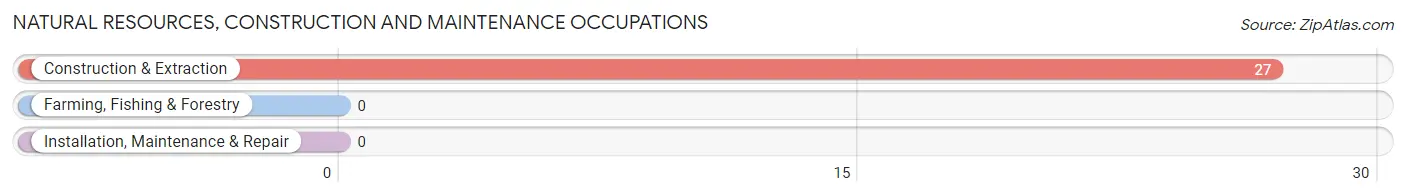
Natural Resources, Construction and Maintenance Occupations
The most common Natural Resources, Construction and Maintenance occupations in Sycamore Hills are , and Construction & Extraction (27 | 6.4%).
Natural Resources, Construction and Maintenance Occupations by Sex
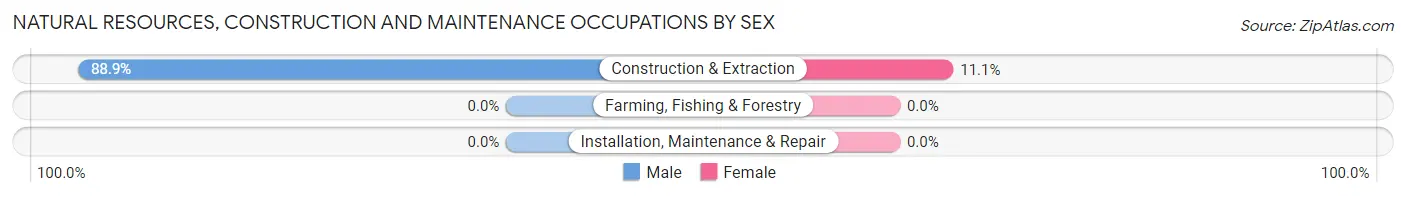
| Occupation | Male | Female |
| Farming, Fishing & Forestry | 0 (0.0%) | 0 (0.0%) |
| Construction & Extraction | 24 (88.9%) | 3 (11.1%) |
| Installation, Maintenance & Repair | 0 (0.0%) | 0 (0.0%) |
| Total (Category) | 24 (88.9%) | 3 (11.1%) |
| Total (Overall) | 192 (45.8%) | 227 (54.2%) |
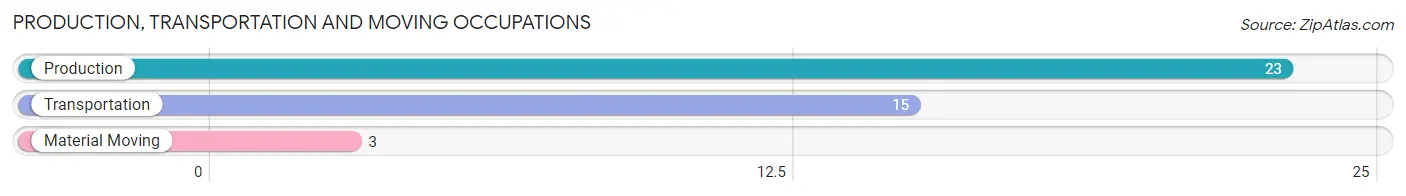
Production, Transportation and Moving Occupations
The most common Production, Transportation and Moving occupations in Sycamore Hills are Production (23 | 5.5%), Transportation (15 | 3.6%), and Material Moving (3 | 0.7%).
Production, Transportation and Moving Occupations by Sex
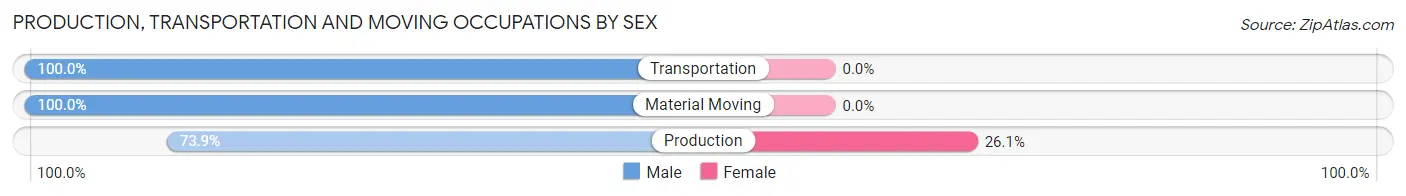
| Occupation | Male | Female |
| Production | 17 (73.9%) | 6 (26.1%) |
| Transportation | 15 (100.0%) | 0 (0.0%) |
| Material Moving | 3 (100.0%) | 0 (0.0%) |
| Total (Category) | 35 (85.4%) | 6 (14.6%) |
| Total (Overall) | 192 (45.8%) | 227 (54.2%) |
Employment Industries by Sex in Sycamore Hills
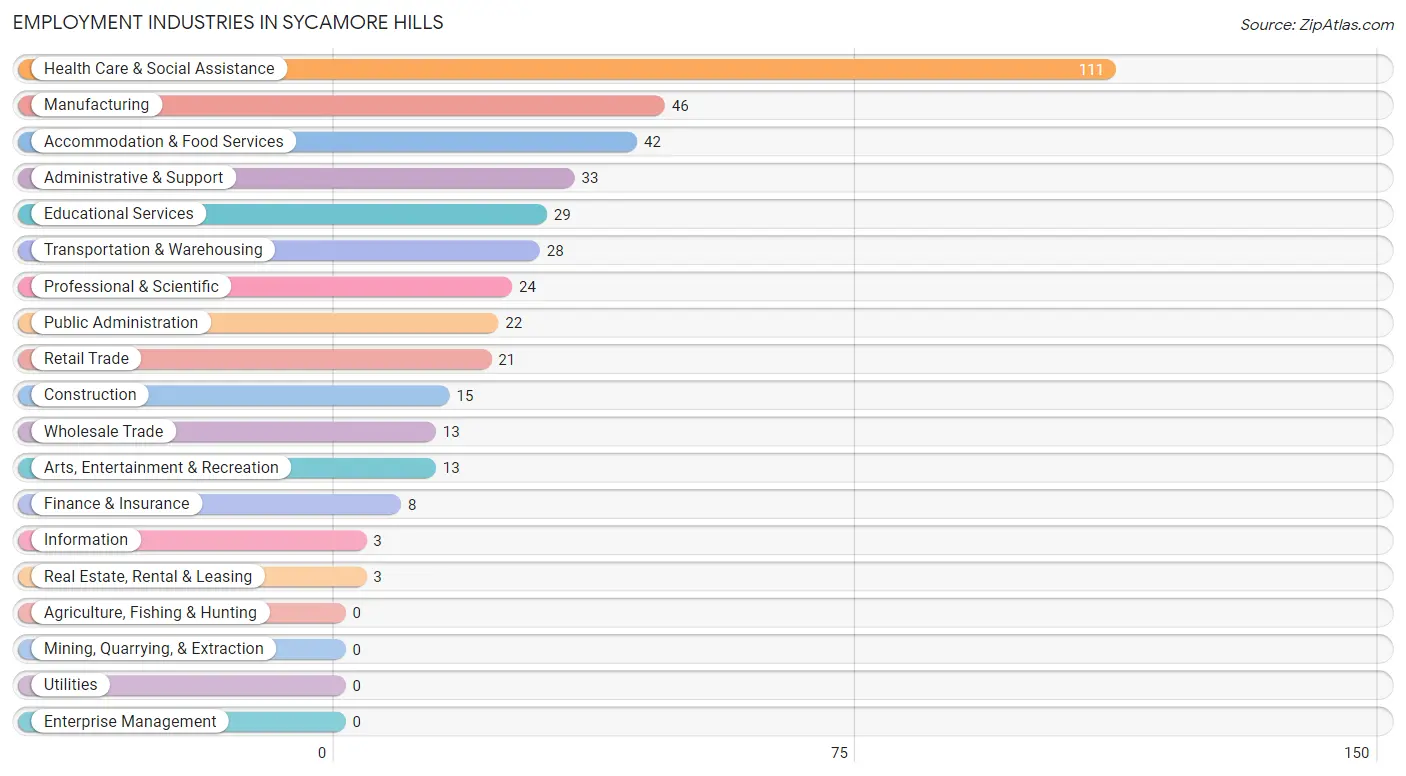
Employment Industries in Sycamore Hills
The major employment industries in Sycamore Hills include Health Care & Social Assistance (111 | 26.5%), Manufacturing (46 | 11.0%), Accommodation & Food Services (42 | 10.0%), Administrative & Support (33 | 7.9%), and Educational Services (29 | 6.9%).
Employment Industries by Sex in Sycamore Hills
The Sycamore Hills industries that see more men than women are Construction (100.0%), Accommodation & Food Services (92.9%), and Wholesale Trade (84.6%), whereas the industries that tend to have a higher number of women are Information (100.0%), Real Estate, Rental & Leasing (100.0%), and Public Administration (90.9%).
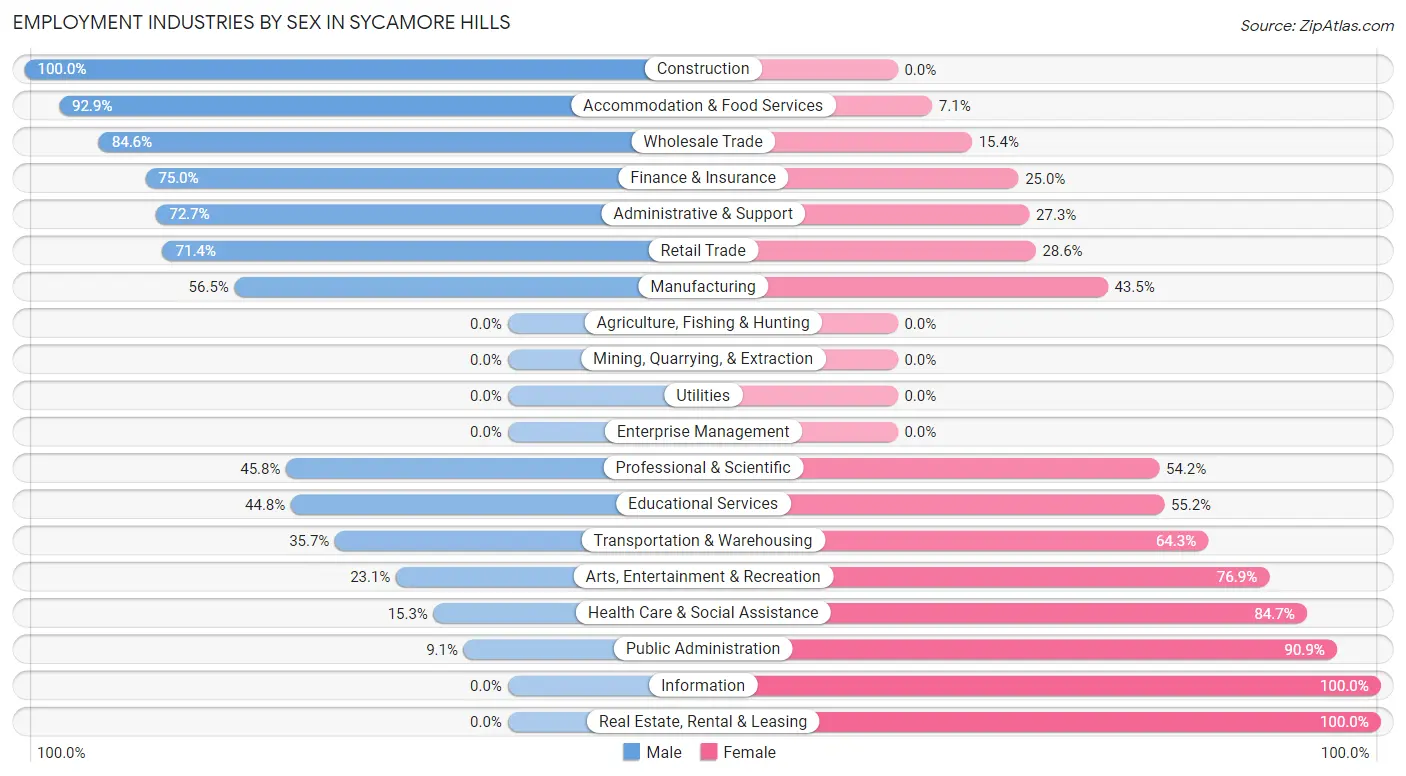
| Industry | Male | Female |
| Agriculture, Fishing & Hunting | 0 (0.0%) | 0 (0.0%) |
| Mining, Quarrying, & Extraction | 0 (0.0%) | 0 (0.0%) |
| Construction | 15 (100.0%) | 0 (0.0%) |
| Manufacturing | 26 (56.5%) | 20 (43.5%) |
| Wholesale Trade | 11 (84.6%) | 2 (15.4%) |
| Retail Trade | 15 (71.4%) | 6 (28.6%) |
| Transportation & Warehousing | 10 (35.7%) | 18 (64.3%) |
| Utilities | 0 (0.0%) | 0 (0.0%) |
| Information | 0 (0.0%) | 3 (100.0%) |
| Finance & Insurance | 6 (75.0%) | 2 (25.0%) |
| Real Estate, Rental & Leasing | 0 (0.0%) | 3 (100.0%) |
| Professional & Scientific | 11 (45.8%) | 13 (54.2%) |
| Enterprise Management | 0 (0.0%) | 0 (0.0%) |
| Administrative & Support | 24 (72.7%) | 9 (27.3%) |
| Educational Services | 13 (44.8%) | 16 (55.2%) |
| Health Care & Social Assistance | 17 (15.3%) | 94 (84.7%) |
| Arts, Entertainment & Recreation | 3 (23.1%) | 10 (76.9%) |
| Accommodation & Food Services | 39 (92.9%) | 3 (7.1%) |
| Public Administration | 2 (9.1%) | 20 (90.9%) |
| Total | 192 (45.8%) | 227 (54.2%) |
Education in Sycamore Hills
School Enrollment in Sycamore Hills
The most common levels of schooling among the 118 students in Sycamore Hills are high school (53 | 44.9%), college / undergraduate (21 | 17.8%), and middle school (20 | 17.0%).
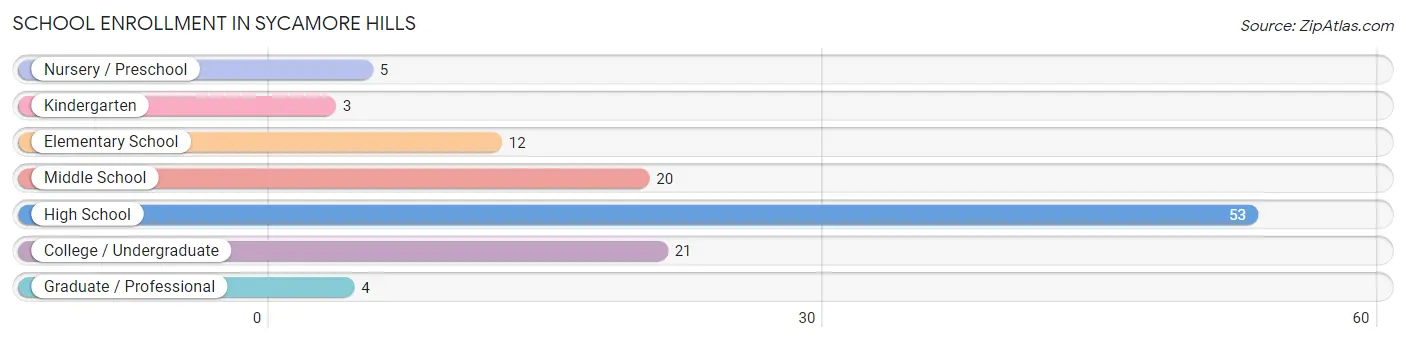
| School Level | # Students | % Students |
| Nursery / Preschool | 5 | 4.2% |
| Kindergarten | 3 | 2.5% |
| Elementary School | 12 | 10.2% |
| Middle School | 20 | 17.0% |
| High School | 53 | 44.9% |
| College / Undergraduate | 21 | 17.8% |
| Graduate / Professional | 4 | 3.4% |
| Total | 118 | 100.0% |
School Enrollment by Age by Funding Source in Sycamore Hills
Out of a total of 118 students who are enrolled in schools in Sycamore Hills, 35 (29.7%) attend a private institution, while the remaining 83 (70.3%) are enrolled in public schools. The age group of 3 to 4 year olds has the highest likelihood of being enrolled in private schools, with 5 (100.0% in the age bracket) enrolled. Conversely, the age group of 5 to 9 year old has the lowest likelihood of being enrolled in a private school, with 15 (100.0% in the age bracket) attending a public institution.
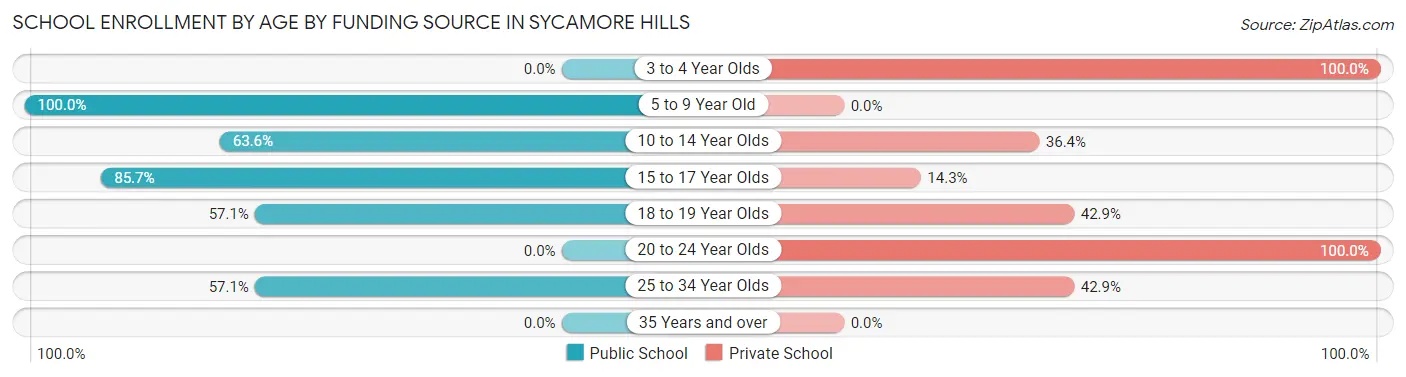
| Age Bracket | Public School | Private School |
| 3 to 4 Year Olds | 0 (0.0%) | 5 (100.0%) |
| 5 to 9 Year Old | 15 (100.0%) | 0 (0.0%) |
| 10 to 14 Year Olds | 14 (63.6%) | 8 (36.4%) |
| 15 to 17 Year Olds | 42 (85.7%) | 7 (14.3%) |
| 18 to 19 Year Olds | 8 (57.1%) | 6 (42.9%) |
| 20 to 24 Year Olds | 0 (0.0%) | 6 (100.0%) |
| 25 to 34 Year Olds | 4 (57.1%) | 3 (42.9%) |
| 35 Years and over | 0 (0.0%) | 0 (0.0%) |
| Total | 83 (70.3%) | 35 (29.7%) |
Educational Attainment by Field of Study in Sycamore Hills
Business (29 | 22.5%), education (16 | 12.4%), science & technology (15 | 11.6%), visual & performing arts (14 | 10.8%), and communications (12 | 9.3%) are the most common fields of study among 129 individuals in Sycamore Hills who have obtained a bachelor's degree or higher.
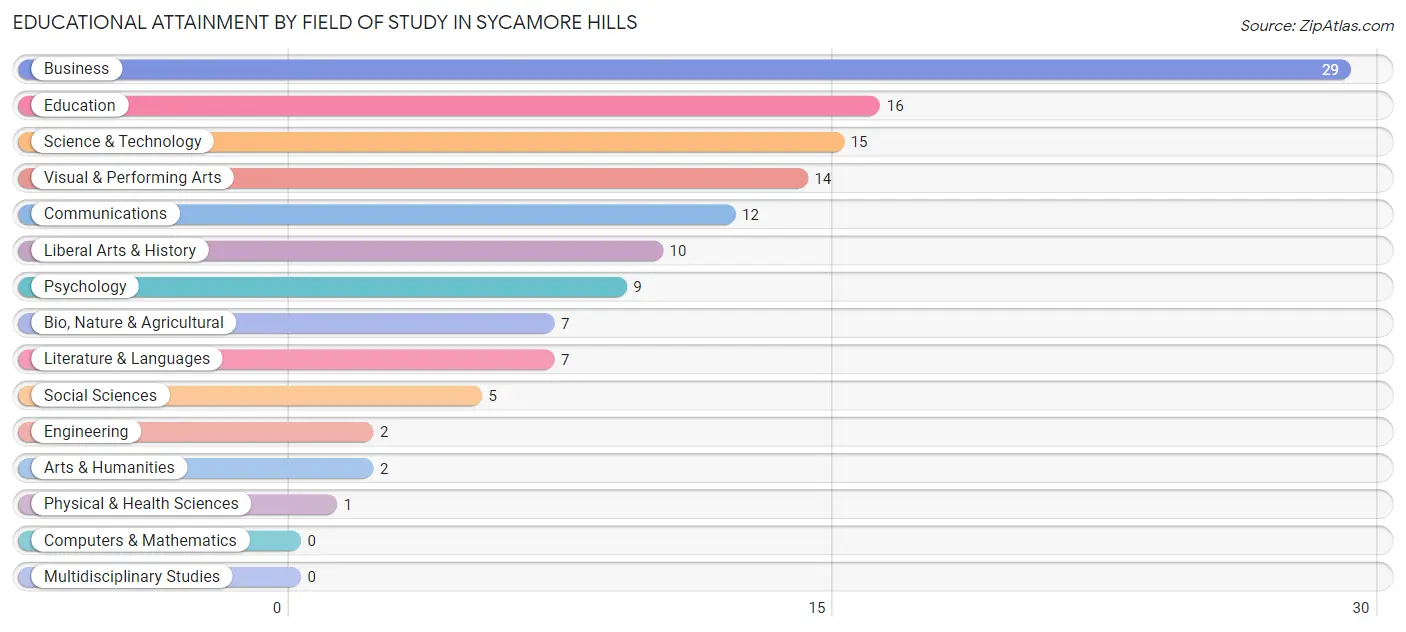
| Field of Study | # Graduates | % Graduates |
| Computers & Mathematics | 0 | 0.0% |
| Bio, Nature & Agricultural | 7 | 5.4% |
| Physical & Health Sciences | 1 | 0.8% |
| Psychology | 9 | 7.0% |
| Social Sciences | 5 | 3.9% |
| Engineering | 2 | 1.5% |
| Multidisciplinary Studies | 0 | 0.0% |
| Science & Technology | 15 | 11.6% |
| Business | 29 | 22.5% |
| Education | 16 | 12.4% |
| Literature & Languages | 7 | 5.4% |
| Liberal Arts & History | 10 | 7.7% |
| Visual & Performing Arts | 14 | 10.8% |
| Communications | 12 | 9.3% |
| Arts & Humanities | 2 | 1.5% |
| Total | 129 | 100.0% |
Transportation & Commute in Sycamore Hills
Vehicle Availability by Sex in Sycamore Hills
The most prevalent vehicle ownership categories in Sycamore Hills are males with 2 vehicles (119, accounting for 62.0%) and females with 2 vehicles (83, making up 52.4%).
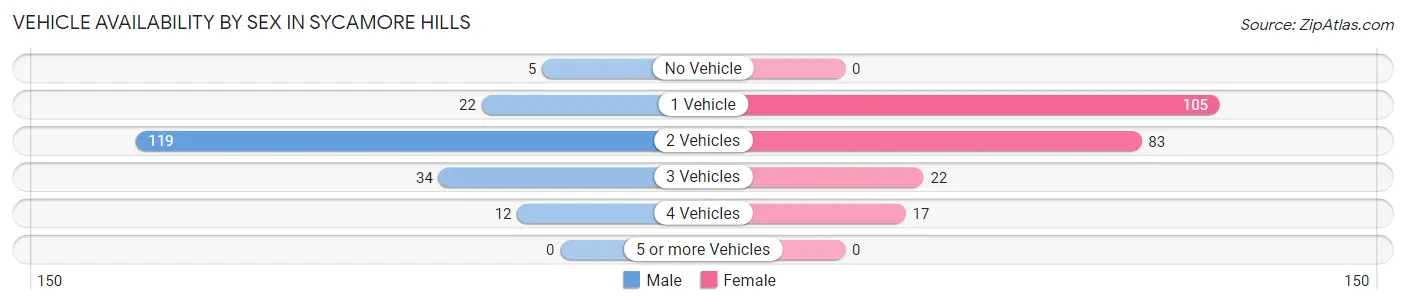
| Vehicles Available | Male | Female |
| No Vehicle | 5 (2.6%) | 0 (0.0%) |
| 1 Vehicle | 22 (11.5%) | 105 (46.3%) |
| 2 Vehicles | 119 (62.0%) | 83 (36.6%) |
| 3 Vehicles | 34 (17.7%) | 22 (9.7%) |
| 4 Vehicles | 12 (6.2%) | 17 (7.5%) |
| 5 or more Vehicles | 0 (0.0%) | 0 (0.0%) |
| Total | 192 (100.0%) | 227 (100.0%) |
Commute Time in Sycamore Hills
The most frequently occuring commute durations in Sycamore Hills are 20 to 24 minutes (76 commuters, 22.9%), 15 to 19 minutes (61 commuters, 18.4%), and 35 to 39 minutes (40 commuters, 12.0%).
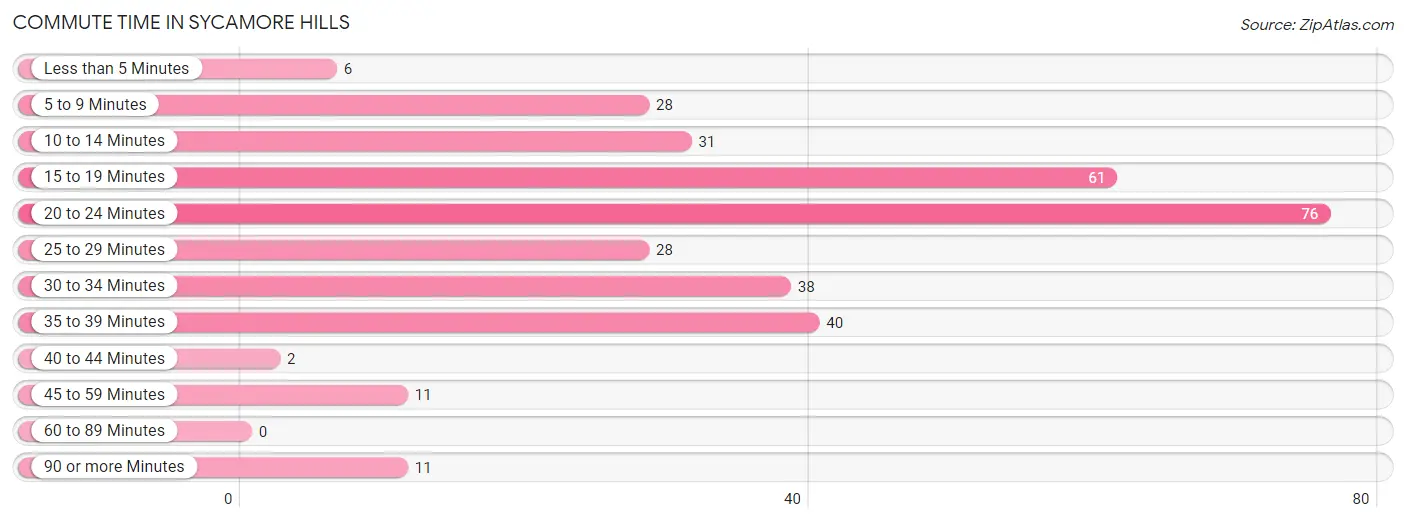
| Commute Time | # Commuters | % Commuters |
| Less than 5 Minutes | 6 | 1.8% |
| 5 to 9 Minutes | 28 | 8.4% |
| 10 to 14 Minutes | 31 | 9.3% |
| 15 to 19 Minutes | 61 | 18.4% |
| 20 to 24 Minutes | 76 | 22.9% |
| 25 to 29 Minutes | 28 | 8.4% |
| 30 to 34 Minutes | 38 | 11.5% |
| 35 to 39 Minutes | 40 | 12.0% |
| 40 to 44 Minutes | 2 | 0.6% |
| 45 to 59 Minutes | 11 | 3.3% |
| 60 to 89 Minutes | 0 | 0.0% |
| 90 or more Minutes | 11 | 3.3% |
Commute Time by Sex in Sycamore Hills
The most common commute times in Sycamore Hills are 15 to 19 minutes (43 commuters, 23.8%) for males and 20 to 24 minutes (42 commuters, 27.8%) for females.
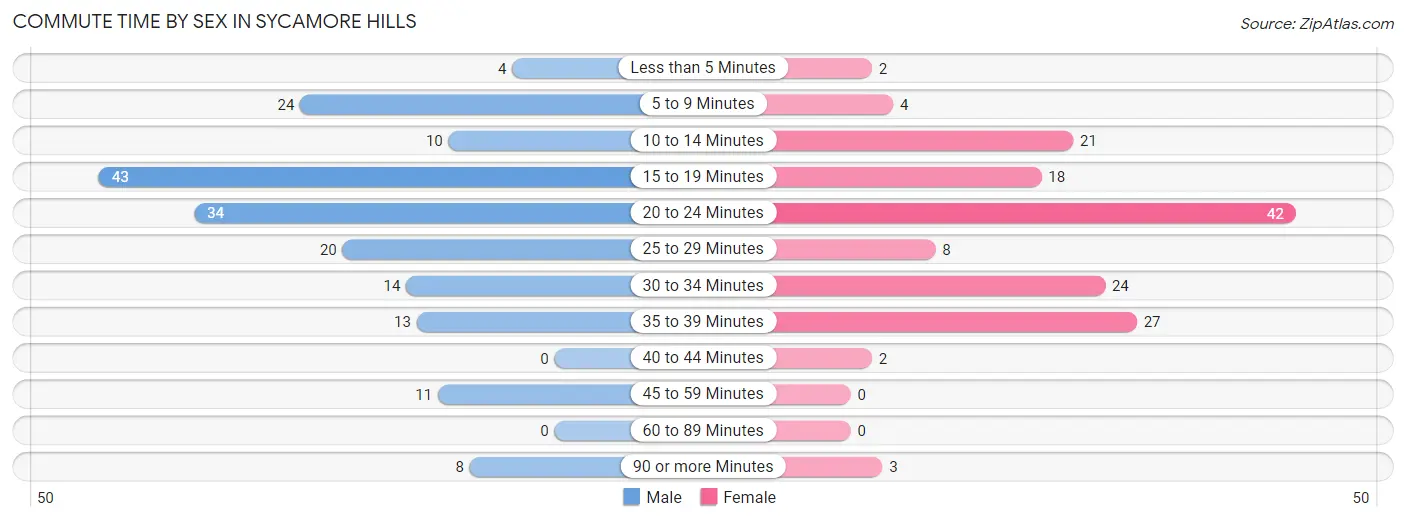
| Commute Time | Male | Female |
| Less than 5 Minutes | 4 (2.2%) | 2 (1.3%) |
| 5 to 9 Minutes | 24 (13.3%) | 4 (2.6%) |
| 10 to 14 Minutes | 10 (5.5%) | 21 (13.9%) |
| 15 to 19 Minutes | 43 (23.8%) | 18 (11.9%) |
| 20 to 24 Minutes | 34 (18.8%) | 42 (27.8%) |
| 25 to 29 Minutes | 20 (11.1%) | 8 (5.3%) |
| 30 to 34 Minutes | 14 (7.7%) | 24 (15.9%) |
| 35 to 39 Minutes | 13 (7.2%) | 27 (17.9%) |
| 40 to 44 Minutes | 0 (0.0%) | 2 (1.3%) |
| 45 to 59 Minutes | 11 (6.1%) | 0 (0.0%) |
| 60 to 89 Minutes | 0 (0.0%) | 0 (0.0%) |
| 90 or more Minutes | 8 (4.4%) | 3 (2.0%) |
Time of Departure to Work by Sex in Sycamore Hills
The most frequent times of departure to work in Sycamore Hills are 4:00 PM to 11:59 PM (47, 26.0%) for males and 8:00 AM to 8:29 AM (36, 23.8%) for females.
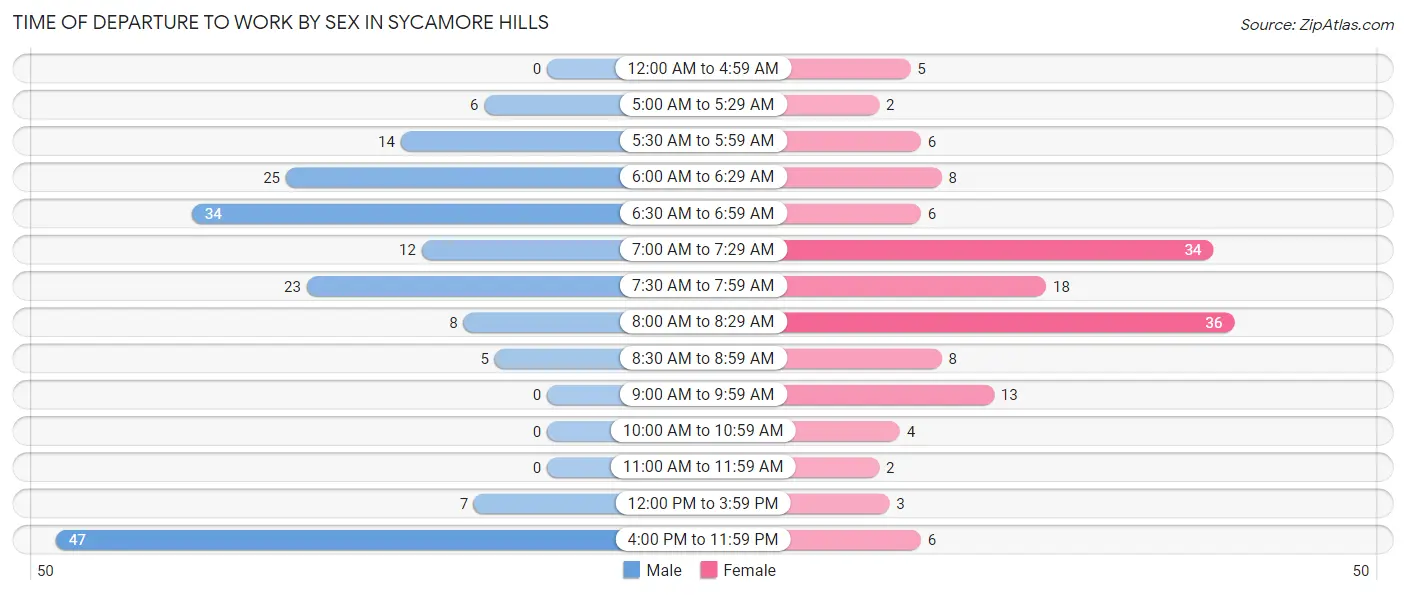
| Time of Departure | Male | Female |
| 12:00 AM to 4:59 AM | 0 (0.0%) | 5 (3.3%) |
| 5:00 AM to 5:29 AM | 6 (3.3%) | 2 (1.3%) |
| 5:30 AM to 5:59 AM | 14 (7.7%) | 6 (4.0%) |
| 6:00 AM to 6:29 AM | 25 (13.8%) | 8 (5.3%) |
| 6:30 AM to 6:59 AM | 34 (18.8%) | 6 (4.0%) |
| 7:00 AM to 7:29 AM | 12 (6.6%) | 34 (22.5%) |
| 7:30 AM to 7:59 AM | 23 (12.7%) | 18 (11.9%) |
| 8:00 AM to 8:29 AM | 8 (4.4%) | 36 (23.8%) |
| 8:30 AM to 8:59 AM | 5 (2.8%) | 8 (5.3%) |
| 9:00 AM to 9:59 AM | 0 (0.0%) | 13 (8.6%) |
| 10:00 AM to 10:59 AM | 0 (0.0%) | 4 (2.6%) |
| 11:00 AM to 11:59 AM | 0 (0.0%) | 2 (1.3%) |
| 12:00 PM to 3:59 PM | 7 (3.9%) | 3 (2.0%) |
| 4:00 PM to 11:59 PM | 47 (26.0%) | 6 (4.0%) |
| Total | 181 (100.0%) | 151 (100.0%) |
Housing Occupancy in Sycamore Hills
Occupancy by Ownership in Sycamore Hills
Of the total 327 dwellings in Sycamore Hills, owner-occupied units account for 230 (70.3%), while renter-occupied units make up 97 (29.7%).
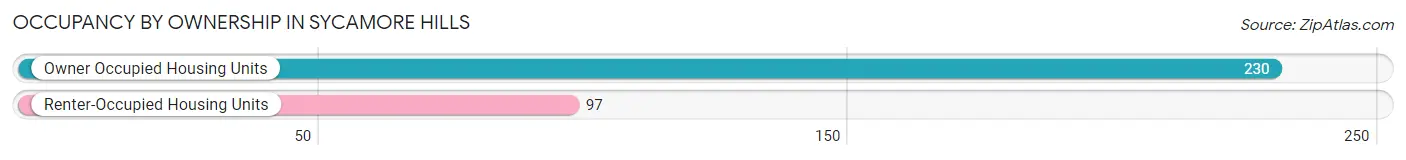
| Occupancy | # Housing Units | % Housing Units |
| Owner Occupied Housing Units | 230 | 70.3% |
| Renter-Occupied Housing Units | 97 | 29.7% |
| Total Occupied Housing Units | 327 | 100.0% |
Occupancy by Household Size in Sycamore Hills
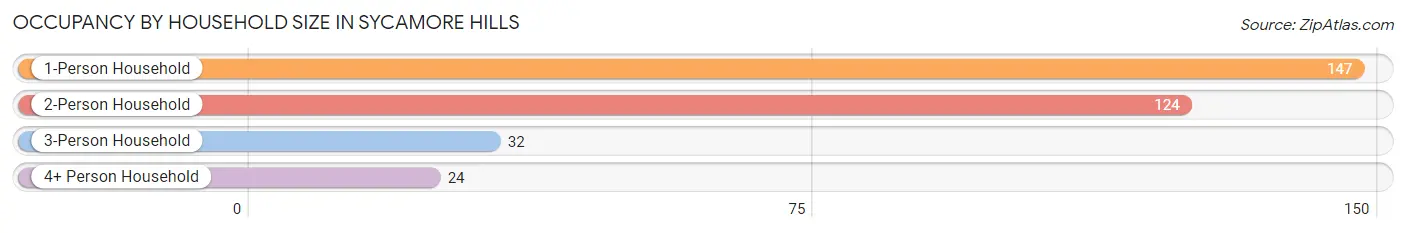
| Household Size | # Housing Units | % Housing Units |
| 1-Person Household | 147 | 45.0% |
| 2-Person Household | 124 | 37.9% |
| 3-Person Household | 32 | 9.8% |
| 4+ Person Household | 24 | 7.3% |
| Total Housing Units | 327 | 100.0% |
Occupancy by Ownership by Household Size in Sycamore Hills
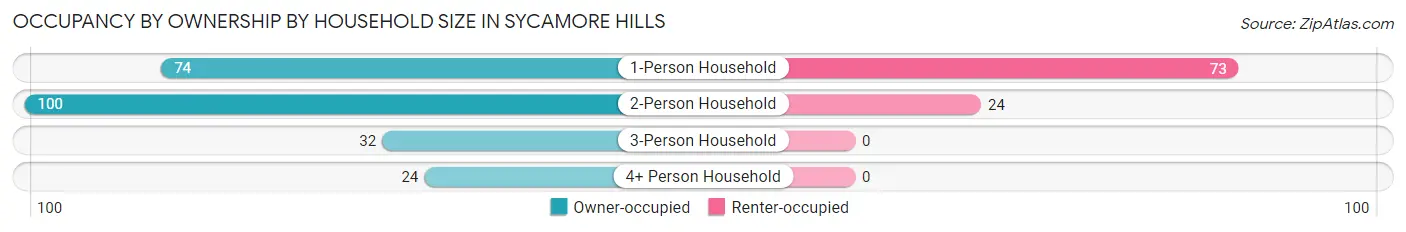
| Household Size | Owner-occupied | Renter-occupied |
| 1-Person Household | 74 (50.3%) | 73 (49.7%) |
| 2-Person Household | 100 (80.6%) | 24 (19.4%) |
| 3-Person Household | 32 (100.0%) | 0 (0.0%) |
| 4+ Person Household | 24 (100.0%) | 0 (0.0%) |
| Total Housing Units | 230 (70.3%) | 97 (29.7%) |
Occupancy by Educational Attainment in Sycamore Hills
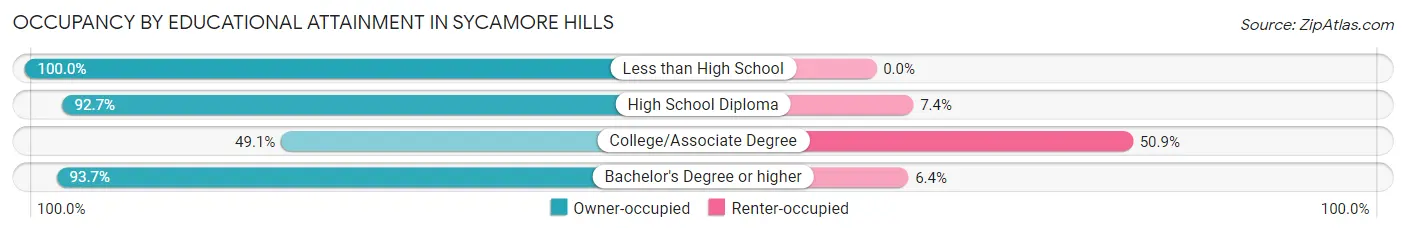
| Household Size | Owner-occupied | Renter-occupied |
| Less than High School | 23 (100.0%) | 0 (0.0%) |
| High School Diploma | 63 (92.6%) | 5 (7.3%) |
| College/Associate Degree | 85 (49.1%) | 88 (50.9%) |
| Bachelor's Degree or higher | 59 (93.6%) | 4 (6.4%) |
Occupancy by Age of Householder in Sycamore Hills
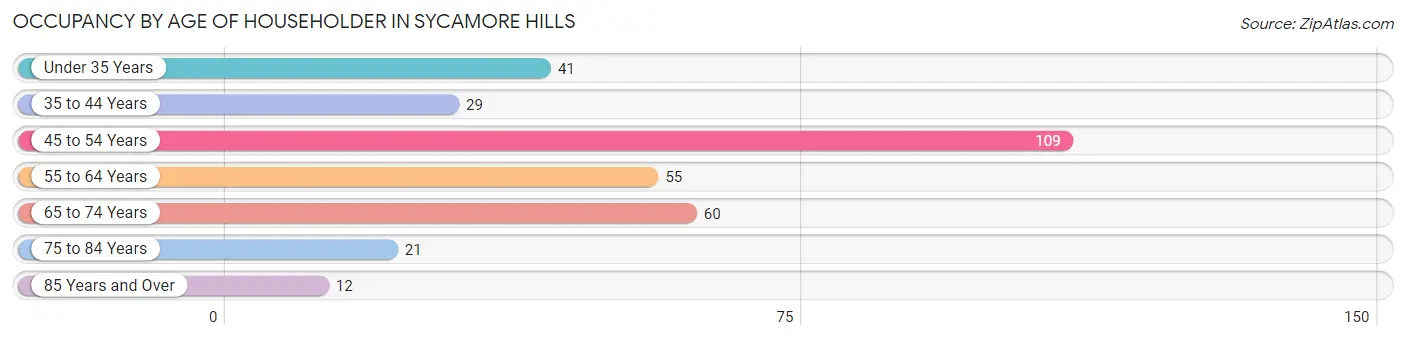
| Age Bracket | # Households | % Households |
| Under 35 Years | 41 | 12.5% |
| 35 to 44 Years | 29 | 8.9% |
| 45 to 54 Years | 109 | 33.3% |
| 55 to 64 Years | 55 | 16.8% |
| 65 to 74 Years | 60 | 18.3% |
| 75 to 84 Years | 21 | 6.4% |
| 85 Years and Over | 12 | 3.7% |
| Total | 327 | 100.0% |
Housing Finances in Sycamore Hills
Median Income by Occupancy in Sycamore Hills
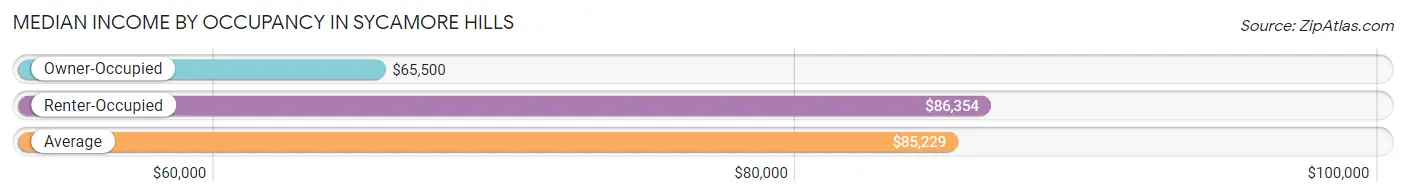
| Occupancy Type | # Households | Median Income |
| Owner-Occupied | 230 (70.3%) | $65,500 |
| Renter-Occupied | 97 (29.7%) | $86,354 |
| Average | 327 (100.0%) | $85,229 |
Occupancy by Householder Income Bracket in Sycamore Hills
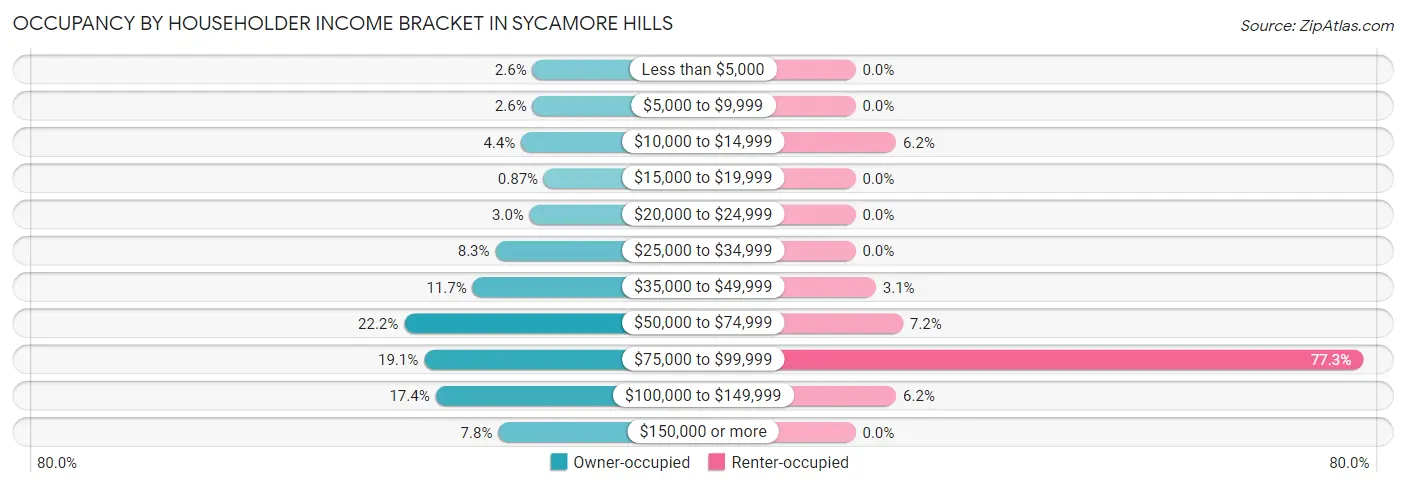
| Income Bracket | Owner-occupied | Renter-occupied |
| Less than $5,000 | 6 (2.6%) | 0 (0.0%) |
| $5,000 to $9,999 | 6 (2.6%) | 0 (0.0%) |
| $10,000 to $14,999 | 10 (4.3%) | 6 (6.2%) |
| $15,000 to $19,999 | 2 (0.9%) | 0 (0.0%) |
| $20,000 to $24,999 | 7 (3.0%) | 0 (0.0%) |
| $25,000 to $34,999 | 19 (8.3%) | 0 (0.0%) |
| $35,000 to $49,999 | 27 (11.7%) | 3 (3.1%) |
| $50,000 to $74,999 | 51 (22.2%) | 7 (7.2%) |
| $75,000 to $99,999 | 44 (19.1%) | 75 (77.3%) |
| $100,000 to $149,999 | 40 (17.4%) | 6 (6.2%) |
| $150,000 or more | 18 (7.8%) | 0 (0.0%) |
| Total | 230 (100.0%) | 97 (100.0%) |
Monthly Housing Cost Tiers in Sycamore Hills
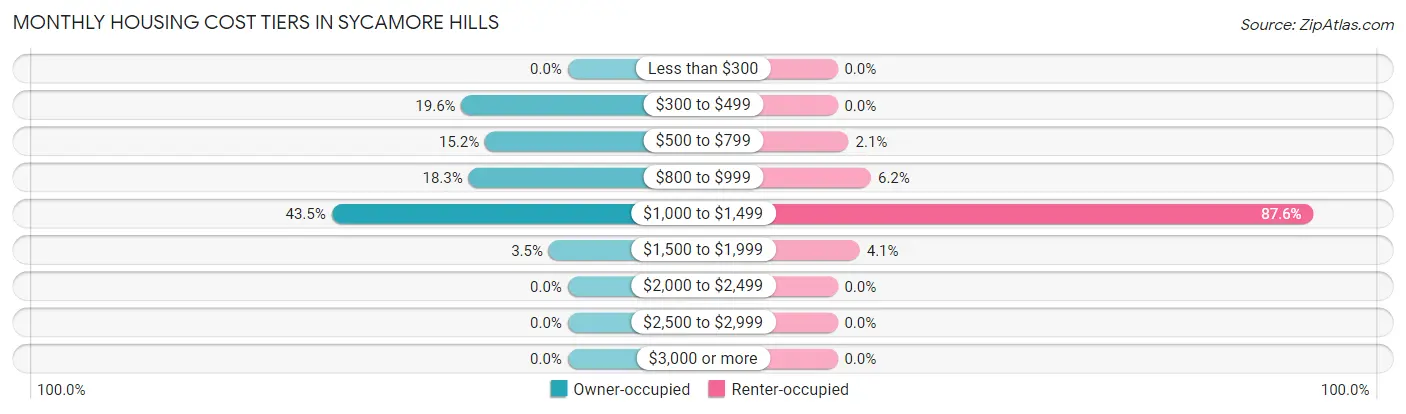
| Monthly Cost | Owner-occupied | Renter-occupied |
| Less than $300 | 0 (0.0%) | 0 (0.0%) |
| $300 to $499 | 45 (19.6%) | 0 (0.0%) |
| $500 to $799 | 35 (15.2%) | 2 (2.1%) |
| $800 to $999 | 42 (18.3%) | 6 (6.2%) |
| $1,000 to $1,499 | 100 (43.5%) | 85 (87.6%) |
| $1,500 to $1,999 | 8 (3.5%) | 4 (4.1%) |
| $2,000 to $2,499 | 0 (0.0%) | 0 (0.0%) |
| $2,500 to $2,999 | 0 (0.0%) | 0 (0.0%) |
| $3,000 or more | 0 (0.0%) | 0 (0.0%) |
| Total | 230 (100.0%) | 97 (100.0%) |
Physical Housing Characteristics in Sycamore Hills
Housing Structures in Sycamore Hills
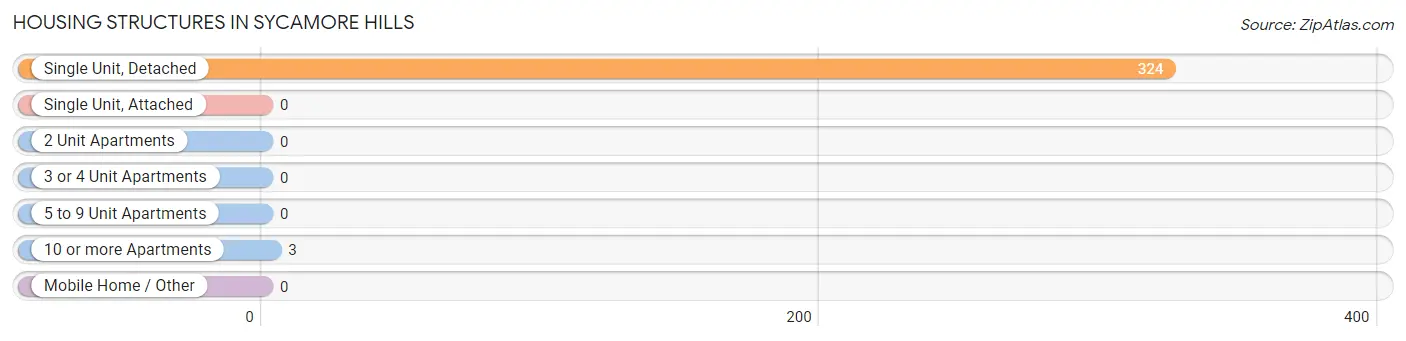
| Structure Type | # Housing Units | % Housing Units |
| Single Unit, Detached | 324 | 99.1% |
| Single Unit, Attached | 0 | 0.0% |
| 2 Unit Apartments | 0 | 0.0% |
| 3 or 4 Unit Apartments | 0 | 0.0% |
| 5 to 9 Unit Apartments | 0 | 0.0% |
| 10 or more Apartments | 3 | 0.9% |
| Mobile Home / Other | 0 | 0.0% |
| Total | 327 | 100.0% |
Housing Structures by Occupancy in Sycamore Hills
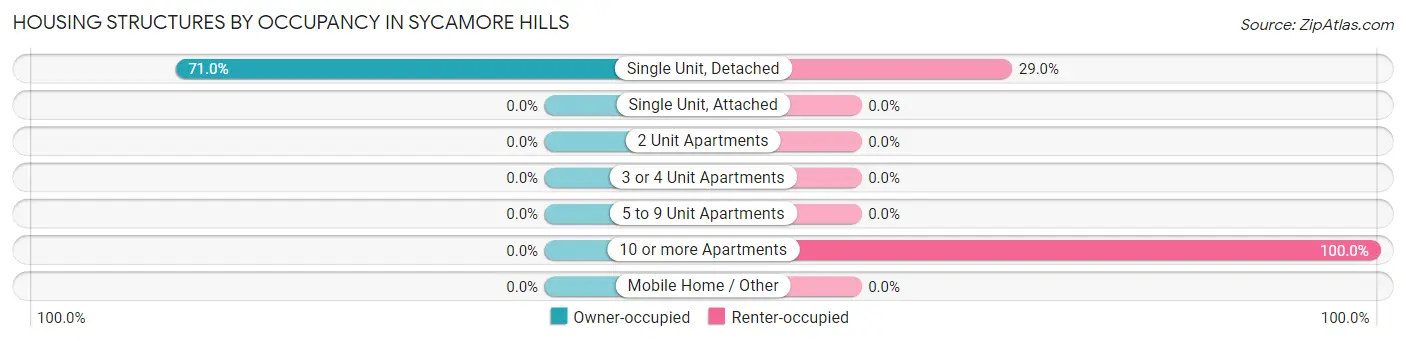
| Structure Type | Owner-occupied | Renter-occupied |
| Single Unit, Detached | 230 (71.0%) | 94 (29.0%) |
| Single Unit, Attached | 0 (0.0%) | 0 (0.0%) |
| 2 Unit Apartments | 0 (0.0%) | 0 (0.0%) |
| 3 or 4 Unit Apartments | 0 (0.0%) | 0 (0.0%) |
| 5 to 9 Unit Apartments | 0 (0.0%) | 0 (0.0%) |
| 10 or more Apartments | 0 (0.0%) | 3 (100.0%) |
| Mobile Home / Other | 0 (0.0%) | 0 (0.0%) |
| Total | 230 (70.3%) | 97 (29.7%) |
Housing Structures by Number of Rooms in Sycamore Hills
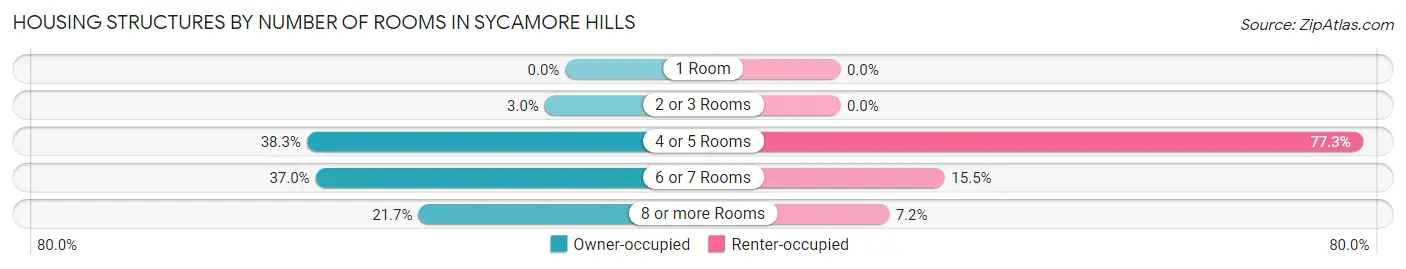
| Number of Rooms | Owner-occupied | Renter-occupied |
| 1 Room | 0 (0.0%) | 0 (0.0%) |
| 2 or 3 Rooms | 7 (3.0%) | 0 (0.0%) |
| 4 or 5 Rooms | 88 (38.3%) | 75 (77.3%) |
| 6 or 7 Rooms | 85 (37.0%) | 15 (15.5%) |
| 8 or more Rooms | 50 (21.7%) | 7 (7.2%) |
| Total | 230 (100.0%) | 97 (100.0%) |
Housing Structure by Heating Type in Sycamore Hills
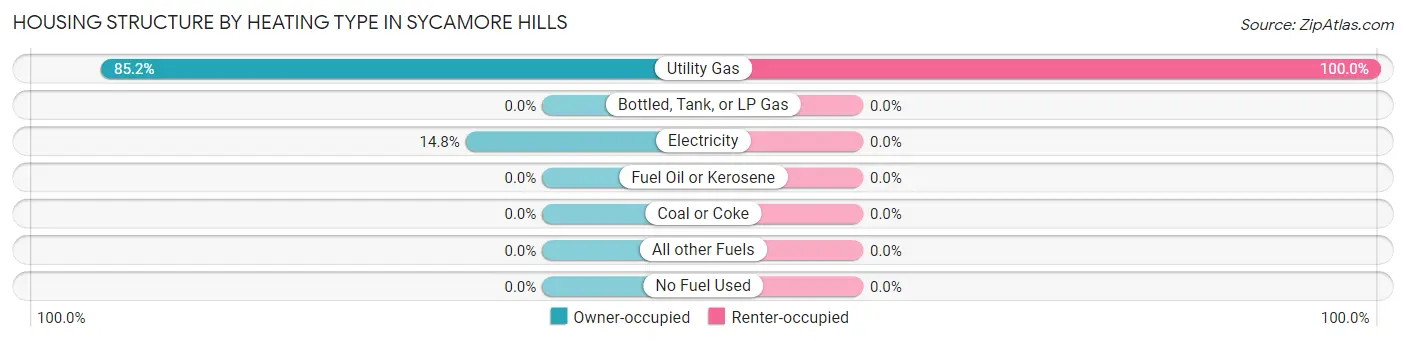
| Heating Type | Owner-occupied | Renter-occupied |
| Utility Gas | 196 (85.2%) | 97 (100.0%) |
| Bottled, Tank, or LP Gas | 0 (0.0%) | 0 (0.0%) |
| Electricity | 34 (14.8%) | 0 (0.0%) |
| Fuel Oil or Kerosene | 0 (0.0%) | 0 (0.0%) |
| Coal or Coke | 0 (0.0%) | 0 (0.0%) |
| All other Fuels | 0 (0.0%) | 0 (0.0%) |
| No Fuel Used | 0 (0.0%) | 0 (0.0%) |
| Total | 230 (100.0%) | 97 (100.0%) |
Household Vehicle Usage in Sycamore Hills
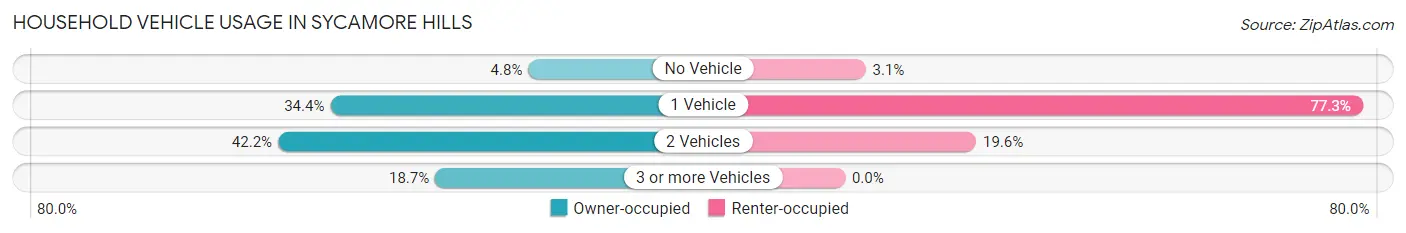
| Vehicles per Household | Owner-occupied | Renter-occupied |
| No Vehicle | 11 (4.8%) | 3 (3.1%) |
| 1 Vehicle | 79 (34.4%) | 75 (77.3%) |
| 2 Vehicles | 97 (42.2%) | 19 (19.6%) |
| 3 or more Vehicles | 43 (18.7%) | 0 (0.0%) |
| Total | 230 (100.0%) | 97 (100.0%) |
Real Estate & Mortgages in Sycamore Hills
Real Estate and Mortgage Overview in Sycamore Hills
| Characteristic | Without Mortgage | With Mortgage |
| Housing Units | 58 | 172 |
| Median Property Value | $88,600 | $127,900 |
| Median Household Income | $37,500 | $18 |
| Monthly Housing Costs | $448 | $0 |
| Real Estate Taxes | $1,848 | $0 |
Property Value by Mortgage Status in Sycamore Hills
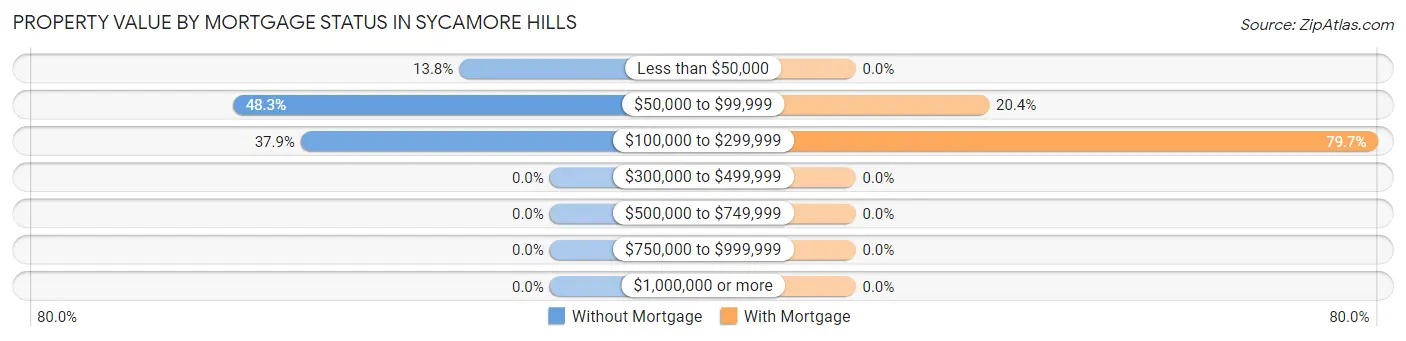
| Property Value | Without Mortgage | With Mortgage |
| Less than $50,000 | 8 (13.8%) | 0 (0.0%) |
| $50,000 to $99,999 | 28 (48.3%) | 35 (20.3%) |
| $100,000 to $299,999 | 22 (37.9%) | 137 (79.6%) |
| $300,000 to $499,999 | 0 (0.0%) | 0 (0.0%) |
| $500,000 to $749,999 | 0 (0.0%) | 0 (0.0%) |
| $750,000 to $999,999 | 0 (0.0%) | 0 (0.0%) |
| $1,000,000 or more | 0 (0.0%) | 0 (0.0%) |
| Total | 58 (100.0%) | 172 (100.0%) |
Household Income by Mortgage Status in Sycamore Hills
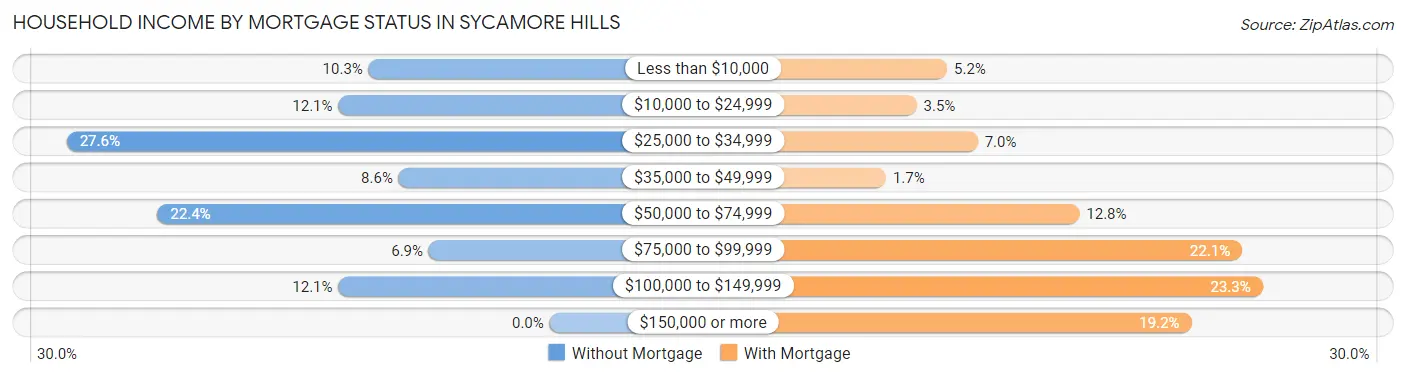
| Household Income | Without Mortgage | With Mortgage |
| Less than $10,000 | 6 (10.3%) | 9 (5.2%) |
| $10,000 to $24,999 | 7 (12.1%) | 6 (3.5%) |
| $25,000 to $34,999 | 16 (27.6%) | 12 (7.0%) |
| $35,000 to $49,999 | 5 (8.6%) | 3 (1.7%) |
| $50,000 to $74,999 | 13 (22.4%) | 22 (12.8%) |
| $75,000 to $99,999 | 4 (6.9%) | 38 (22.1%) |
| $100,000 to $149,999 | 7 (12.1%) | 40 (23.3%) |
| $150,000 or more | 0 (0.0%) | 33 (19.2%) |
| Total | 58 (100.0%) | 172 (100.0%) |
Property Value to Household Income Ratio in Sycamore Hills
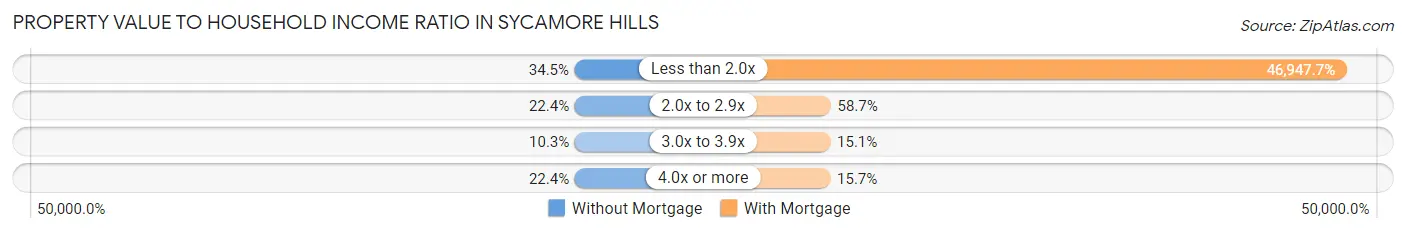
| Value-to-Income Ratio | Without Mortgage | With Mortgage |
| Less than 2.0x | 20 (34.5%) | 80,750 (46,947.7%) |
| 2.0x to 2.9x | 13 (22.4%) | 101 (58.7%) |
| 3.0x to 3.9x | 6 (10.3%) | 26 (15.1%) |
| 4.0x or more | 13 (22.4%) | 27 (15.7%) |
| Total | 58 (100.0%) | 172 (100.0%) |
Real Estate Taxes by Mortgage Status in Sycamore Hills
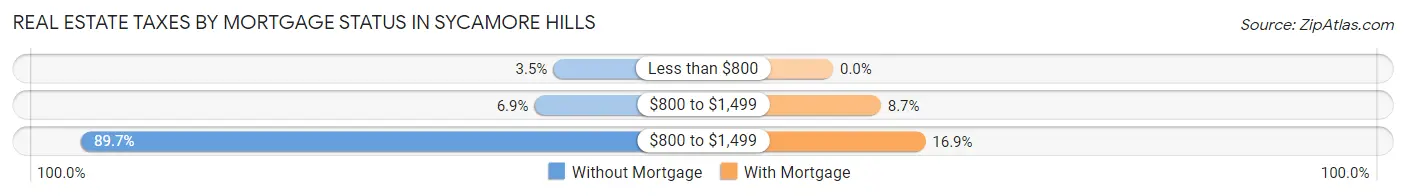
| Property Taxes | Without Mortgage | With Mortgage |
| Less than $800 | 2 (3.5%) | 0 (0.0%) |
| $800 to $1,499 | 4 (6.9%) | 15 (8.7%) |
| $800 to $1,499 | 52 (89.7%) | 29 (16.9%) |
| Total | 58 (100.0%) | 172 (100.0%) |
Health & Disability in Sycamore Hills
Health Insurance Coverage by Age in Sycamore Hills
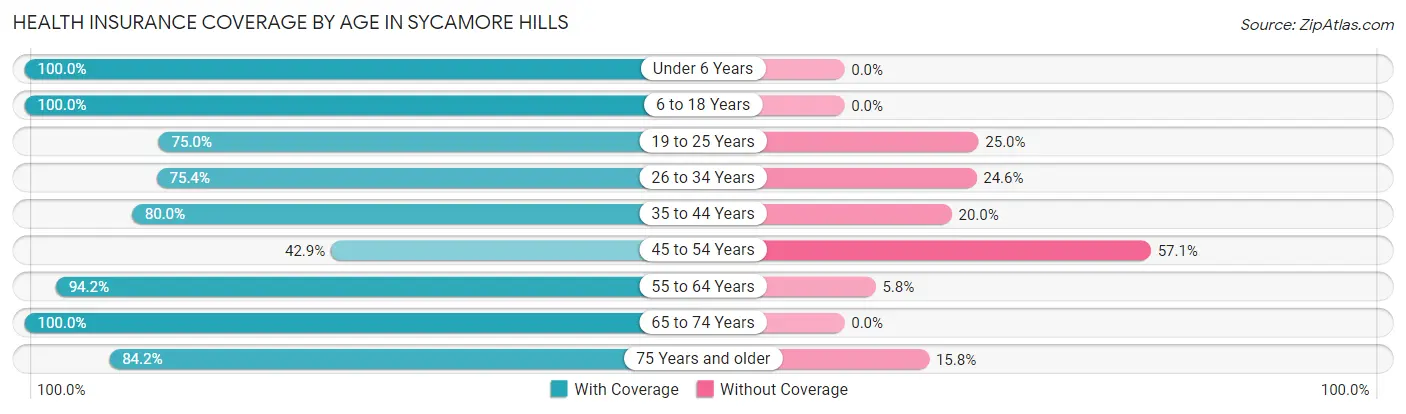
| Age Bracket | With Coverage | Without Coverage |
| Under 6 Years | 12 (100.0%) | 0 (0.0%) |
| 6 to 18 Years | 88 (100.0%) | 0 (0.0%) |
| 19 to 25 Years | 24 (75.0%) | 8 (25.0%) |
| 26 to 34 Years | 49 (75.4%) | 16 (24.6%) |
| 35 to 44 Years | 56 (80.0%) | 14 (20.0%) |
| 45 to 54 Years | 63 (42.9%) | 84 (57.1%) |
| 55 to 64 Years | 81 (94.2%) | 5 (5.8%) |
| 65 to 74 Years | 83 (100.0%) | 0 (0.0%) |
| 75 Years and older | 32 (84.2%) | 6 (15.8%) |
| Total | 488 (78.6%) | 133 (21.4%) |
Health Insurance Coverage by Citizenship Status in Sycamore Hills
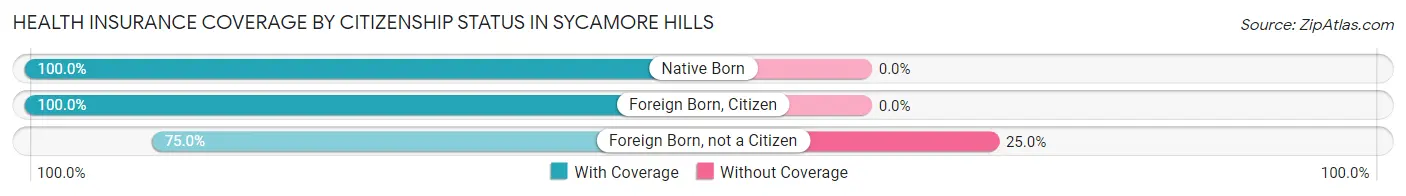
| Citizenship Status | With Coverage | Without Coverage |
| Native Born | 12 (100.0%) | 0 (0.0%) |
| Foreign Born, Citizen | 88 (100.0%) | 0 (0.0%) |
| Foreign Born, not a Citizen | 24 (75.0%) | 8 (25.0%) |
Health Insurance Coverage by Household Income in Sycamore Hills
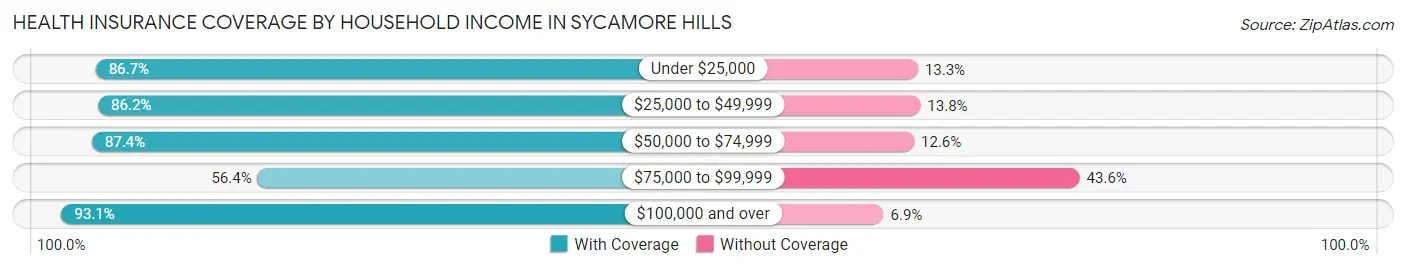
| Household Income | With Coverage | Without Coverage |
| Under $25,000 | 39 (86.7%) | 6 (13.3%) |
| $25,000 to $49,999 | 75 (86.2%) | 12 (13.8%) |
| $50,000 to $74,999 | 97 (87.4%) | 14 (12.6%) |
| $75,000 to $99,999 | 115 (56.4%) | 89 (43.6%) |
| $100,000 and over | 162 (93.1%) | 12 (6.9%) |
Public vs Private Health Insurance Coverage by Age in Sycamore Hills
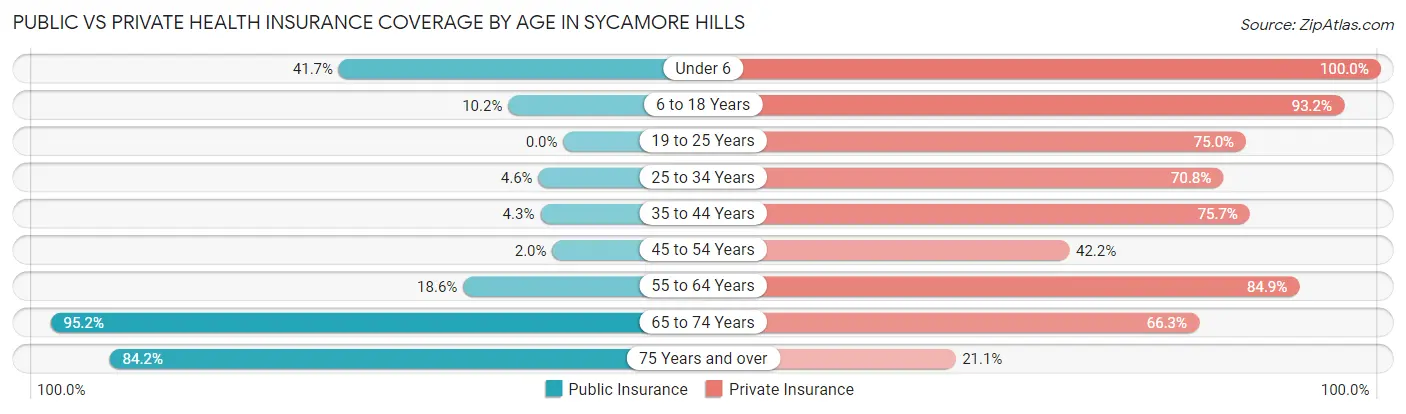
| Age Bracket | Public Insurance | Private Insurance |
| Under 6 | 5 (41.7%) | 12 (100.0%) |
| 6 to 18 Years | 9 (10.2%) | 82 (93.2%) |
| 19 to 25 Years | 0 (0.0%) | 24 (75.0%) |
| 25 to 34 Years | 3 (4.6%) | 46 (70.8%) |
| 35 to 44 Years | 3 (4.3%) | 53 (75.7%) |
| 45 to 54 Years | 3 (2.0%) | 62 (42.2%) |
| 55 to 64 Years | 16 (18.6%) | 73 (84.9%) |
| 65 to 74 Years | 79 (95.2%) | 55 (66.3%) |
| 75 Years and over | 32 (84.2%) | 8 (21.0%) |
| Total | 150 (24.1%) | 415 (66.8%) |
Disability Status by Sex by Age in Sycamore Hills
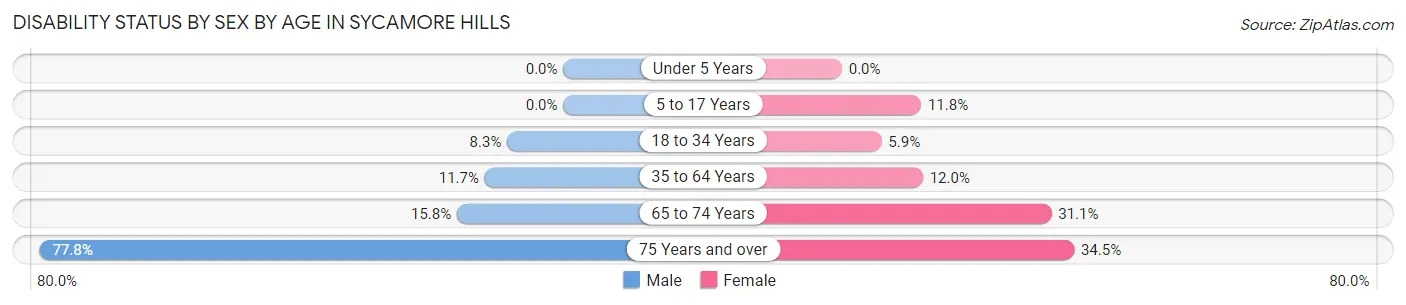
| Age Bracket | Male | Female |
| Under 5 Years | 0 (0.0%) | 0 (0.0%) |
| 5 to 17 Years | 0 (0.0%) | 4 (11.8%) |
| 18 to 34 Years | 4 (8.3%) | 3 (5.9%) |
| 35 to 64 Years | 14 (11.7%) | 22 (12.0%) |
| 65 to 74 Years | 6 (15.8%) | 14 (31.1%) |
| 75 Years and over | 7 (77.8%) | 10 (34.5%) |
Disability Class by Sex by Age in Sycamore Hills
Disability Class: Hearing Difficulty
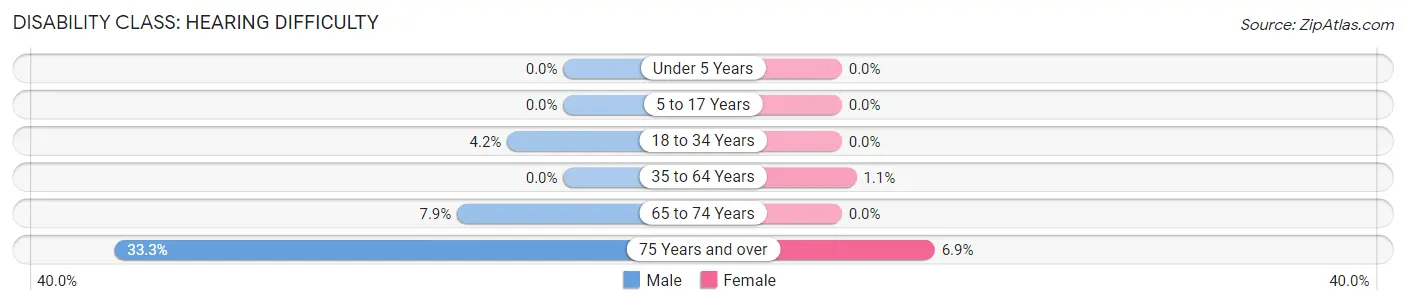
| Age Bracket | Male | Female |
| Under 5 Years | 0 (0.0%) | 0 (0.0%) |
| 5 to 17 Years | 0 (0.0%) | 0 (0.0%) |
| 18 to 34 Years | 2 (4.2%) | 0 (0.0%) |
| 35 to 64 Years | 0 (0.0%) | 2 (1.1%) |
| 65 to 74 Years | 3 (7.9%) | 0 (0.0%) |
| 75 Years and over | 3 (33.3%) | 2 (6.9%) |
Disability Class: Vision Difficulty
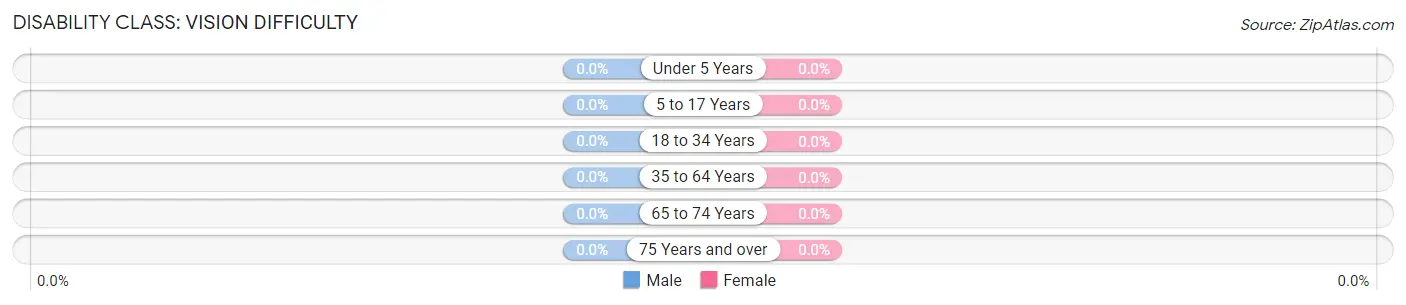
| Age Bracket | Male | Female |
| Under 5 Years | 0 (0.0%) | 0 (0.0%) |
| 5 to 17 Years | 0 (0.0%) | 0 (0.0%) |
| 18 to 34 Years | 0 (0.0%) | 0 (0.0%) |
| 35 to 64 Years | 0 (0.0%) | 0 (0.0%) |
| 65 to 74 Years | 0 (0.0%) | 0 (0.0%) |
| 75 Years and over | 0 (0.0%) | 0 (0.0%) |
Disability Class: Cognitive Difficulty
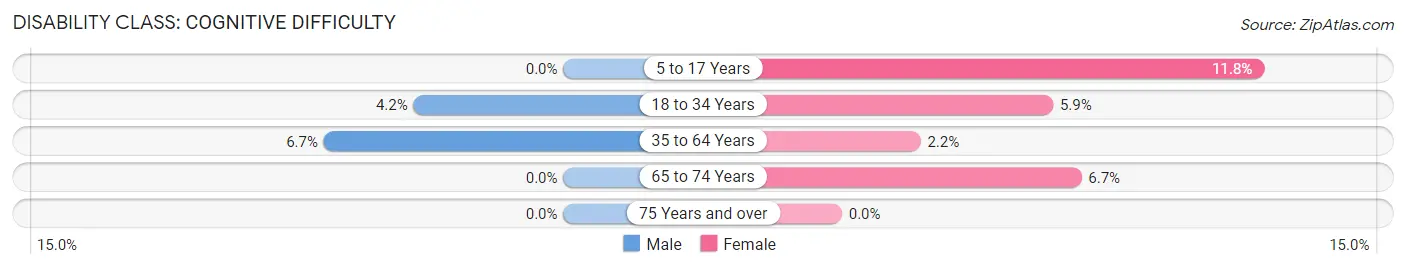
| Age Bracket | Male | Female |
| 5 to 17 Years | 0 (0.0%) | 4 (11.8%) |
| 18 to 34 Years | 2 (4.2%) | 3 (5.9%) |
| 35 to 64 Years | 8 (6.7%) | 4 (2.2%) |
| 65 to 74 Years | 0 (0.0%) | 3 (6.7%) |
| 75 Years and over | 0 (0.0%) | 0 (0.0%) |
Disability Class: Ambulatory Difficulty
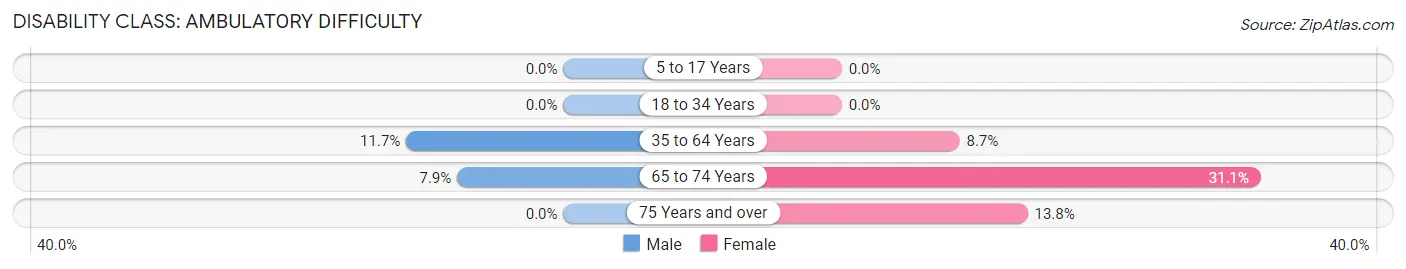
| Age Bracket | Male | Female |
| 5 to 17 Years | 0 (0.0%) | 0 (0.0%) |
| 18 to 34 Years | 0 (0.0%) | 0 (0.0%) |
| 35 to 64 Years | 14 (11.7%) | 16 (8.7%) |
| 65 to 74 Years | 3 (7.9%) | 14 (31.1%) |
| 75 Years and over | 0 (0.0%) | 4 (13.8%) |
Disability Class: Self-Care Difficulty
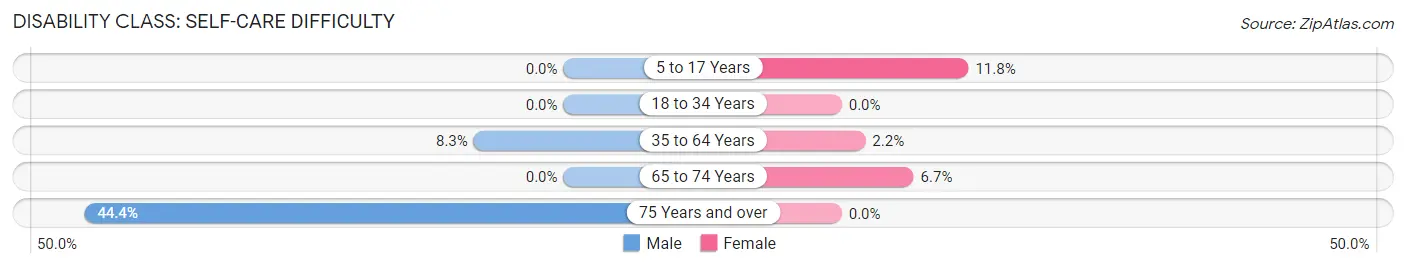
| Age Bracket | Male | Female |
| 5 to 17 Years | 0 (0.0%) | 4 (11.8%) |
| 18 to 34 Years | 0 (0.0%) | 0 (0.0%) |
| 35 to 64 Years | 10 (8.3%) | 4 (2.2%) |
| 65 to 74 Years | 0 (0.0%) | 3 (6.7%) |
| 75 Years and over | 4 (44.4%) | 0 (0.0%) |
Technology Access in Sycamore Hills
Computing Device Access in Sycamore Hills
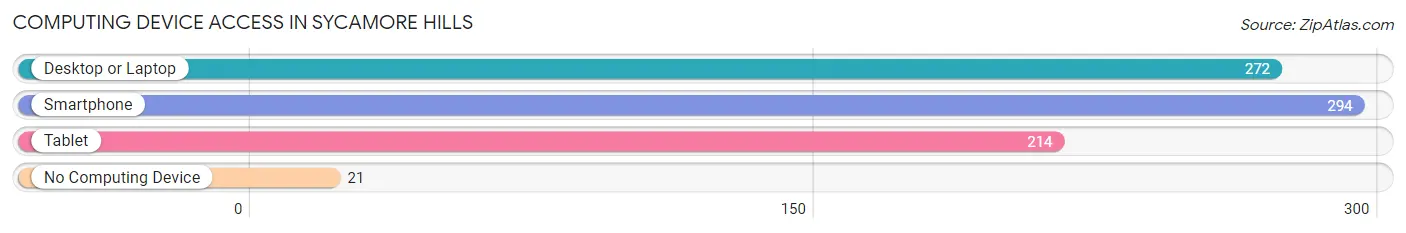
| Device Type | # Households | % Households |
| Desktop or Laptop | 272 | 83.2% |
| Smartphone | 294 | 89.9% |
| Tablet | 214 | 65.4% |
| No Computing Device | 21 | 6.4% |
| Total | 327 | 100.0% |
Internet Access in Sycamore Hills
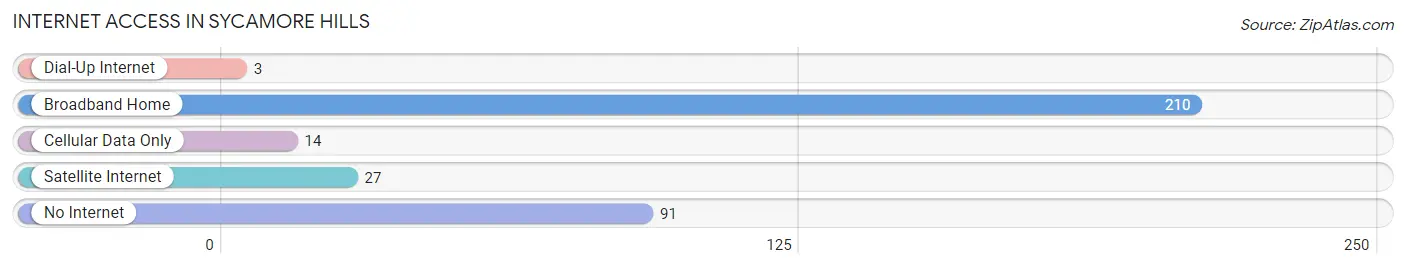
| Internet Type | # Households | % Households |
| Dial-Up Internet | 3 | 0.9% |
| Broadband Home | 210 | 64.2% |
| Cellular Data Only | 14 | 4.3% |
| Satellite Internet | 27 | 8.3% |
| No Internet | 91 | 27.8% |
| Total | 327 | 100.0% |
Sycamore Hills Summary
Sycamore Hills, Missouri is a small city located in St. Louis County, Missouri. It is a suburb of St. Louis and is located approximately 15 miles northwest of the city. The city was incorporated in 1988 and has a population of approximately 4,000 people.
History
The area that is now Sycamore Hills was originally inhabited by Native Americans, including the Osage and the Missouri tribes. The first European settlers arrived in the area in the early 1800s. The area was originally known as “Sycamore Hill” and was part of the Spanish Land Grant of 1803. The area was later annexed by St. Louis County in 1876.
In the late 1800s, the area was primarily used for farming and was home to several small farms. In the early 1900s, the area began to develop as a residential community. The first homes were built in the area in the 1920s and 1930s. The area was officially incorporated as the City of Sycamore Hills in 1988.
Geography
Sycamore Hills is located in St. Louis County, Missouri. It is situated approximately 15 miles northwest of St. Louis. The city is bordered by the cities of St. Ann to the north, Bridgeton to the east, and Maryland Heights to the south. The city is located in the Missouri River Valley and is surrounded by rolling hills and wooded areas.
The city has a total area of 2.2 square miles, all of which is land. The city has a humid continental climate, with hot, humid summers and cold, snowy winters. The average annual temperature is around 54°F.
Economy
Sycamore Hills has a diverse economy, with a mix of retail, manufacturing, and service industries. The city is home to several large employers, including the St. Louis County Government, the St. Louis County Police Department, and the St. Louis County Fire Department. The city is also home to several small businesses, including restaurants, retail stores, and professional services.
The city has a low unemployment rate and a high median household income. The median household income in Sycamore Hills is $63,000, which is higher than the national average.
Demographics
As of the 2010 census, the population of Sycamore Hills was 4,000. The racial makeup of the city was 87.3% White, 5.2% African American, 0.3% Native American, 2.2% Asian, and 4.2% from other races. The median age of the population was 38.7 years.
The median household income in Sycamore Hills was $63,000, which is higher than the national average. The per capita income in the city was $25,000. The poverty rate in the city was 8.3%, which is lower than the national average.
Sycamore Hills is a diverse city, with a mix of cultures and backgrounds. The city is home to a variety of religious denominations, including Christianity, Judaism, and Islam. The city is also home to a variety of ethnicities, including African American, Hispanic, and Asian.
Common Questions
What is the Total Population of Sycamore Hills?
Total Population of Sycamore Hills is 621.
What is the Total Male Population of Sycamore Hills?
Total Male Population of Sycamore Hills is 279.
What is the Total Female Population of Sycamore Hills?
Total Female Population of Sycamore Hills is 342.
What is the Ratio of Males per 100 Females in Sycamore Hills?
There are 81.58 Males per 100 Females in Sycamore Hills.
What is the Ratio of Females per 100 Males in Sycamore Hills?
There are 122.58 Females per 100 Males in Sycamore Hills.
What is the Median Population Age in Sycamore Hills?
Median Population Age in Sycamore Hills is 49.3 Years.
What is the Average Family Size in Sycamore Hills
Average Family Size in Sycamore Hills is 2.7 People.
What is the Average Household Size in Sycamore Hills
Average Household Size in Sycamore Hills is 1.9 People.
What is Per Capita Income in Sycamore Hills?
Per Capita income in Sycamore Hills is $41,494.
What is the Median Family Income in Sycamore Hills?
Median Family Income in Sycamore Hills is $90,625.
What is the Median Household income in Sycamore Hills?
Median Household Income in Sycamore Hills is $85,229.
What is Income or Wage Gap in Sycamore Hills?
Income or Wage Gap in Sycamore Hills is 0.9%.
Women in Sycamore Hills earn 99.1 cents for every dollar earned by a man.
What is Inequality or Gini Index in Sycamore Hills?
Inequality or Gini Index in Sycamore Hills is 0.31.
How Large is the Labor Force in Sycamore Hills?
There are 421 People in the Labor Forcein in Sycamore Hills.
What is the Percentage of People in the Labor Force in Sycamore Hills?
75.2% of People are in the Labor Force in Sycamore Hills.
What is the Unemployment Rate in Sycamore Hills?
Unemployment Rate in Sycamore Hills is 0.5%.