Lake Tapawingo, MO
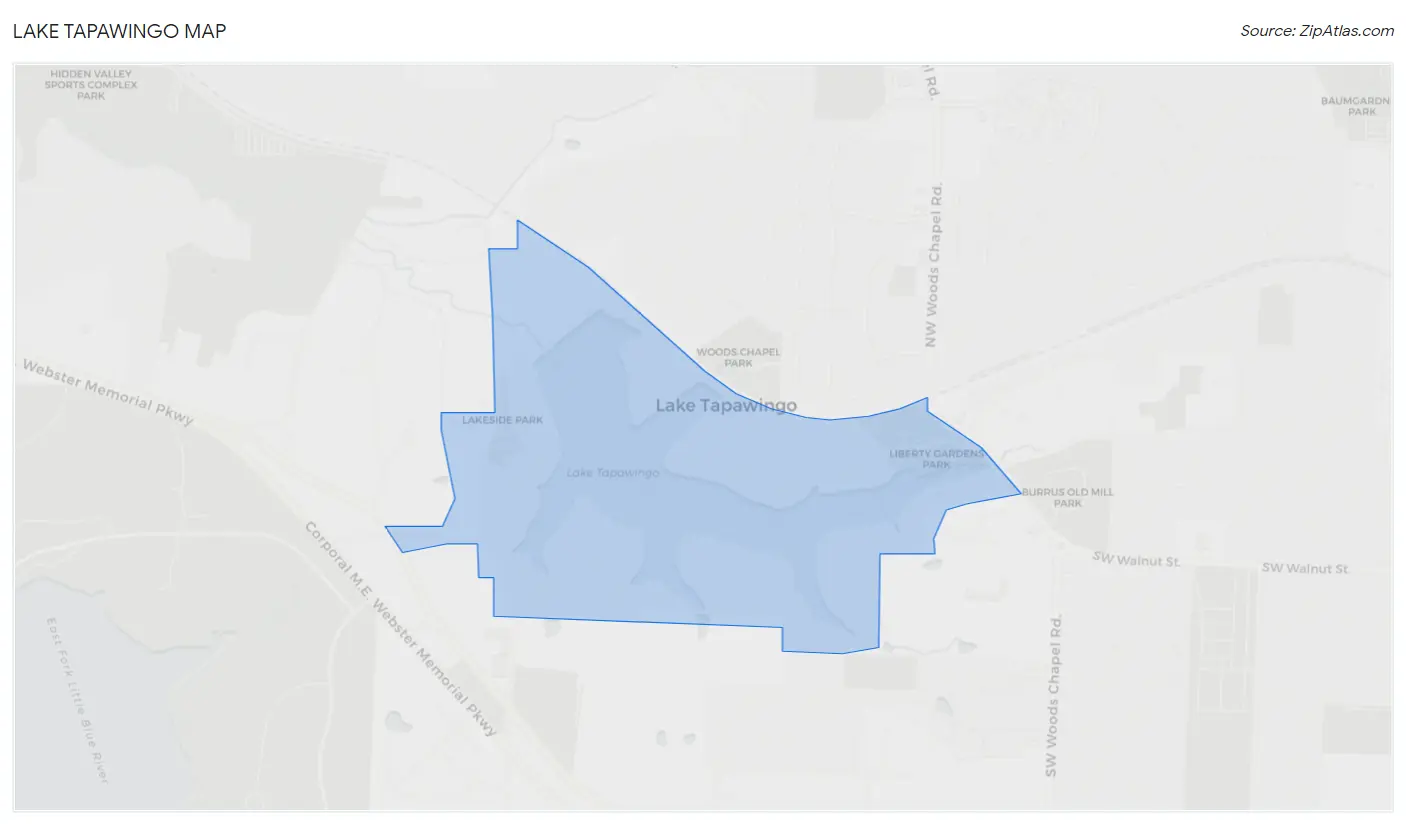
Lake Tapawingo Map
Lake Tapawingo Overview
871
TOTAL POPULATION
447
MALE POPULATION
424
FEMALE POPULATION
105.42
MALES / 100 FEMALES
94.85
FEMALES / 100 MALES
54.5
MEDIAN AGE
2.8
AVG FAMILY SIZE
2.3
AVG HOUSEHOLD SIZE
$57,278
PER CAPITA INCOME
$148,125
AVG FAMILY INCOME
$110,625
AVG HOUSEHOLD INCOME
51.9%
WAGE / INCOME GAP [ % ]
48.1¢/ $1
WAGE / INCOME GAP [ $ ]
0.40
INEQUALITY / GINI INDEX
469
LABOR FORCE [ PEOPLE ]
61.6%
PERCENT IN LABOR FORCE
5.8%
UNEMPLOYMENT RATE
Lake Tapawingo Area Codes
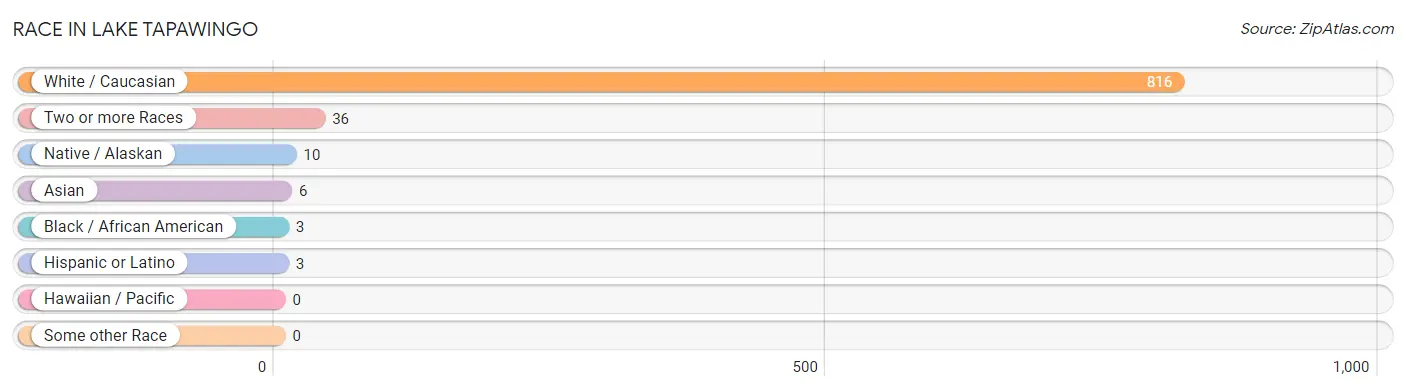
Race in Lake Tapawingo
The most populous races in Lake Tapawingo are White / Caucasian (816 | 93.7%), Two or more Races (36 | 4.1%), and Native / Alaskan (10 | 1.1%).
| Race | # Population | % Population |
| Asian | 6 | 0.7% |
| Black / African American | 3 | 0.3% |
| Hawaiian / Pacific | 0 | 0.0% |
| Hispanic or Latino | 3 | 0.3% |
| Native / Alaskan | 10 | 1.1% |
| White / Caucasian | 816 | 93.7% |
| Two or more Races | 36 | 4.1% |
| Some other Race | 0 | 0.0% |
| Total | 871 | 100.0% |
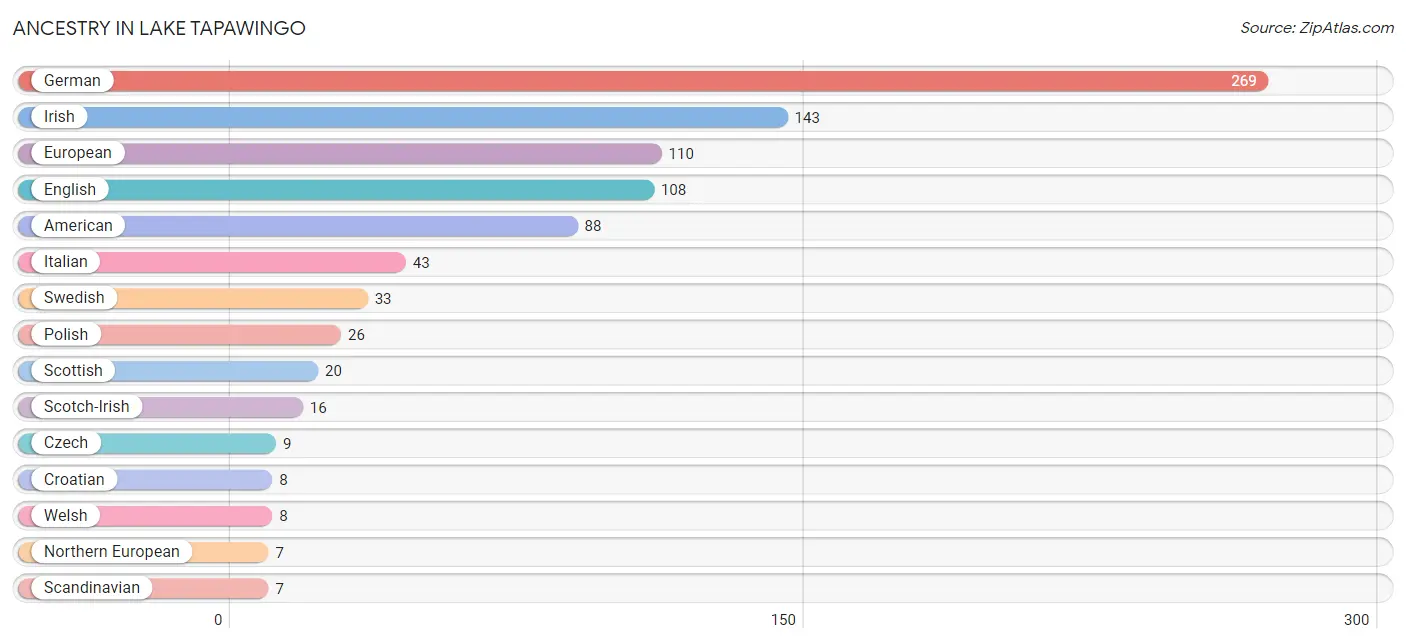
Ancestry in Lake Tapawingo
The most populous ancestries reported in Lake Tapawingo are German (269 | 30.9%), Irish (143 | 16.4%), European (110 | 12.6%), English (108 | 12.4%), and American (88 | 10.1%), together accounting for 82.4% of all Lake Tapawingo residents.
| Ancestry | # Population | % Population |
| American | 88 | 10.1% |
| Austrian | 1 | 0.1% |
| Blackfeet | 6 | 0.7% |
| British | 6 | 0.7% |
| Burmese | 3 | 0.3% |
| Canadian | 4 | 0.5% |
| Croatian | 8 | 0.9% |
| Czech | 9 | 1.0% |
| Danish | 3 | 0.3% |
| Dutch | 6 | 0.7% |
| Eastern European | 3 | 0.3% |
| English | 108 | 12.4% |
| European | 110 | 12.6% |
| French | 3 | 0.3% |
| German | 269 | 30.9% |
| Greek | 2 | 0.2% |
| Irish | 143 | 16.4% |
| Italian | 43 | 4.9% |
| Korean | 6 | 0.7% |
| Mexican | 3 | 0.3% |
| Northern European | 7 | 0.8% |
| Norwegian | 2 | 0.2% |
| Pennsylvania German | 1 | 0.1% |
| Polish | 26 | 3.0% |
| Portuguese | 3 | 0.3% |
| Russian | 4 | 0.5% |
| Scandinavian | 7 | 0.8% |
| Scotch-Irish | 16 | 1.8% |
| Scottish | 20 | 2.3% |
| Swedish | 33 | 3.8% |
| Swiss | 4 | 0.5% |
| Thai | 2 | 0.2% |
| Welsh | 8 | 0.9% | View All 33 Rows |
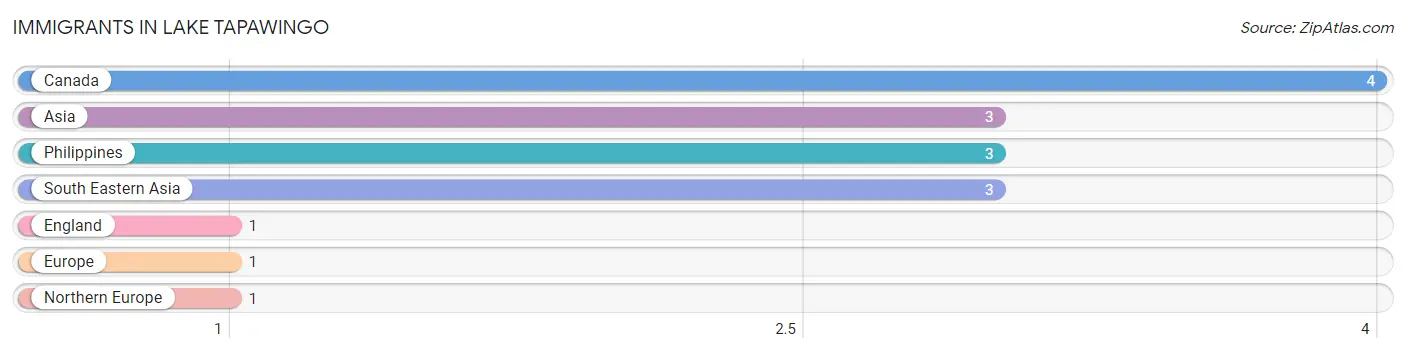
Immigrants in Lake Tapawingo
The most numerous immigrant groups reported in Lake Tapawingo came from Canada (4 | 0.5%), Asia (3 | 0.3%), Philippines (3 | 0.3%), South Eastern Asia (3 | 0.3%), and England (1 | 0.1%), together accounting for 1.6% of all Lake Tapawingo residents.
| Immigration Origin | # Population | % Population |
| Asia | 3 | 0.3% |
| Canada | 4 | 0.5% |
| England | 1 | 0.1% |
| Europe | 1 | 0.1% |
| Northern Europe | 1 | 0.1% |
| Philippines | 3 | 0.3% |
| South Eastern Asia | 3 | 0.3% | View All 7 Rows |
Sex and Age in Lake Tapawingo
Sex and Age in Lake Tapawingo
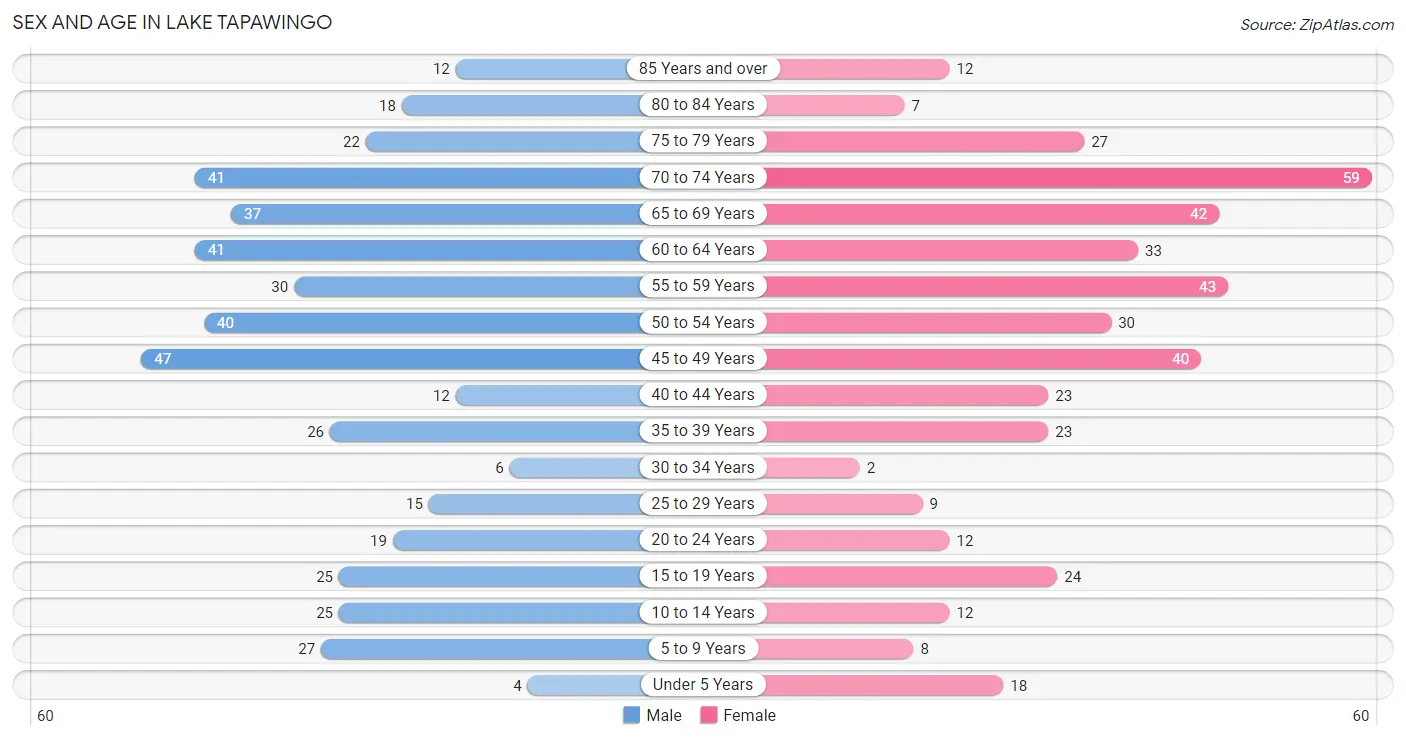
The most populous age groups in Lake Tapawingo are 45 to 49 Years (47 | 10.5%) for men and 70 to 74 Years (59 | 13.9%) for women.
| Age Bracket | Male | Female |
| Under 5 Years | 4 (0.9%) | 18 (4.3%) |
| 5 to 9 Years | 27 (6.0%) | 8 (1.9%) |
| 10 to 14 Years | 25 (5.6%) | 12 (2.8%) |
| 15 to 19 Years | 25 (5.6%) | 24 (5.7%) |
| 20 to 24 Years | 19 (4.3%) | 12 (2.8%) |
| 25 to 29 Years | 15 (3.4%) | 9 (2.1%) |
| 30 to 34 Years | 6 (1.3%) | 2 (0.5%) |
| 35 to 39 Years | 26 (5.8%) | 23 (5.4%) |
| 40 to 44 Years | 12 (2.7%) | 23 (5.4%) |
| 45 to 49 Years | 47 (10.5%) | 40 (9.4%) |
| 50 to 54 Years | 40 (8.9%) | 30 (7.1%) |
| 55 to 59 Years | 30 (6.7%) | 43 (10.1%) |
| 60 to 64 Years | 41 (9.2%) | 33 (7.8%) |
| 65 to 69 Years | 37 (8.3%) | 42 (9.9%) |
| 70 to 74 Years | 41 (9.2%) | 59 (13.9%) |
| 75 to 79 Years | 22 (4.9%) | 27 (6.4%) |
| 80 to 84 Years | 18 (4.0%) | 7 (1.7%) |
| 85 Years and over | 12 (2.7%) | 12 (2.8%) |
| Total | 447 (100.0%) | 424 (100.0%) |
Families and Households in Lake Tapawingo
Median Family Size in Lake Tapawingo
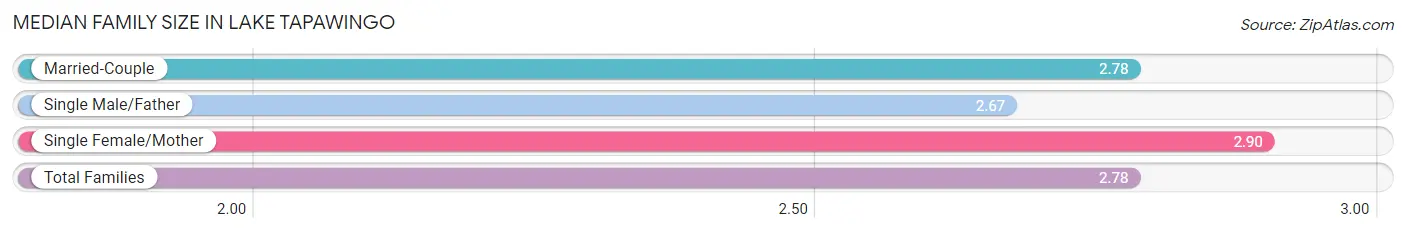
The median family size in Lake Tapawingo is 2.78 persons per family, with single female/mother families (10 | 4.3%) accounting for the largest median family size of 2.9 persons per family. On the other hand, single male/father families (15 | 6.4%) represent the smallest median family size with 2.67 persons per family.
| Family Type | # Families | Family Size |
| Married-Couple | 209 (89.3%) | 2.78 |
| Single Male/Father | 15 (6.4%) | 2.67 |
| Single Female/Mother | 10 (4.3%) | 2.90 |
| Total Families | 234 (100.0%) | 2.78 |
Median Household Size in Lake Tapawingo
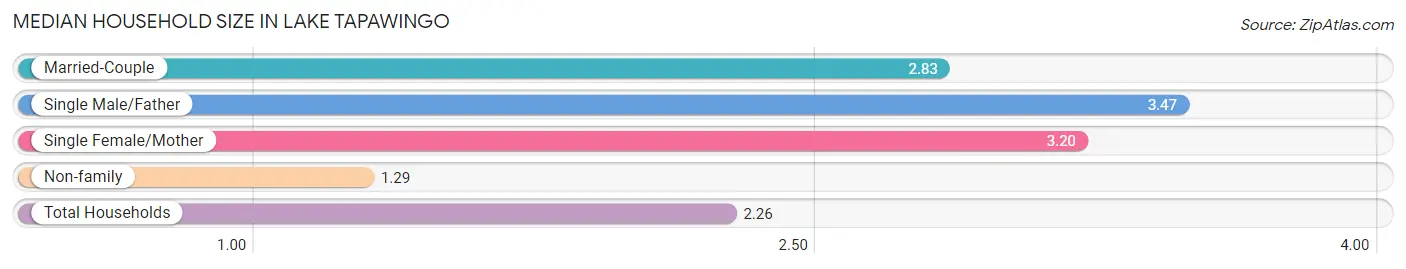
The median household size in Lake Tapawingo is 2.26 persons per household, with single male/father households (15 | 3.9%) accounting for the largest median household size of 3.47 persons per household. non-family households (151 | 39.2%) represent the smallest median household size with 1.29 persons per household.
| Household Type | # Households | Household Size |
| Married-Couple | 209 (54.3%) | 2.83 |
| Single Male/Father | 15 (3.9%) | 3.47 |
| Single Female/Mother | 10 (2.6%) | 3.20 |
| Non-family | 151 (39.2%) | 1.29 |
| Total Households | 385 (100.0%) | 2.26 |
Household Size by Marriage Status in Lake Tapawingo
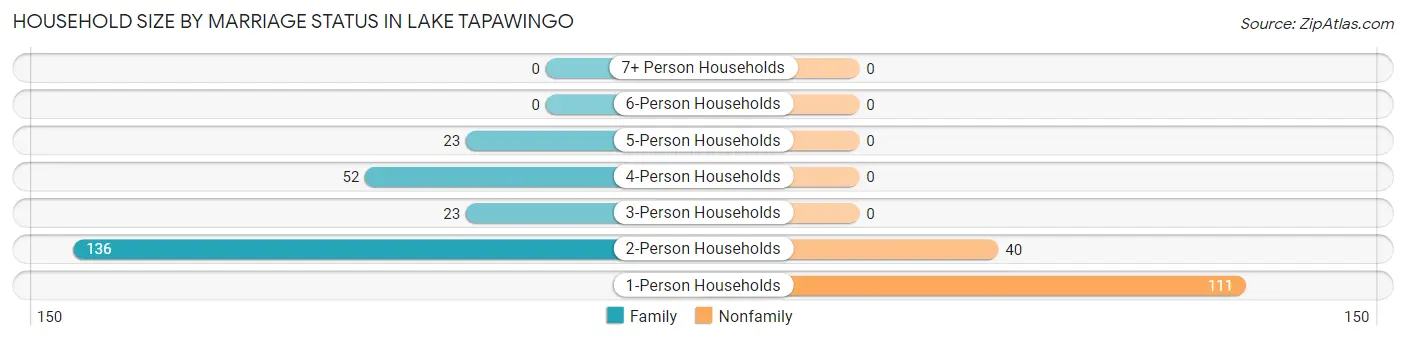
Out of a total of 385 households in Lake Tapawingo, 234 (60.8%) are family households, while 151 (39.2%) are nonfamily households. The most numerous type of family households are 2-person households, comprising 136, and the most common type of nonfamily households are 1-person households, comprising 111.
| Household Size | Family Households | Nonfamily Households |
| 1-Person Households | - | 111 (28.8%) |
| 2-Person Households | 136 (35.3%) | 40 (10.4%) |
| 3-Person Households | 23 (6.0%) | 0 (0.0%) |
| 4-Person Households | 52 (13.5%) | 0 (0.0%) |
| 5-Person Households | 23 (6.0%) | 0 (0.0%) |
| 6-Person Households | 0 (0.0%) | 0 (0.0%) |
| 7+ Person Households | 0 (0.0%) | 0 (0.0%) |
| Total | 234 (60.8%) | 151 (39.2%) |
Female Fertility in Lake Tapawingo
Fertility by Age in Lake Tapawingo
Average fertility rate in Lake Tapawingo is 15.0 births per 1,000 women. Women in the age bracket of 20 to 34 years have the highest fertility rate with 87.0 births per 1,000 women. Women in the age bracket of 20 to 34 years acount for 100.0% of all women with births.
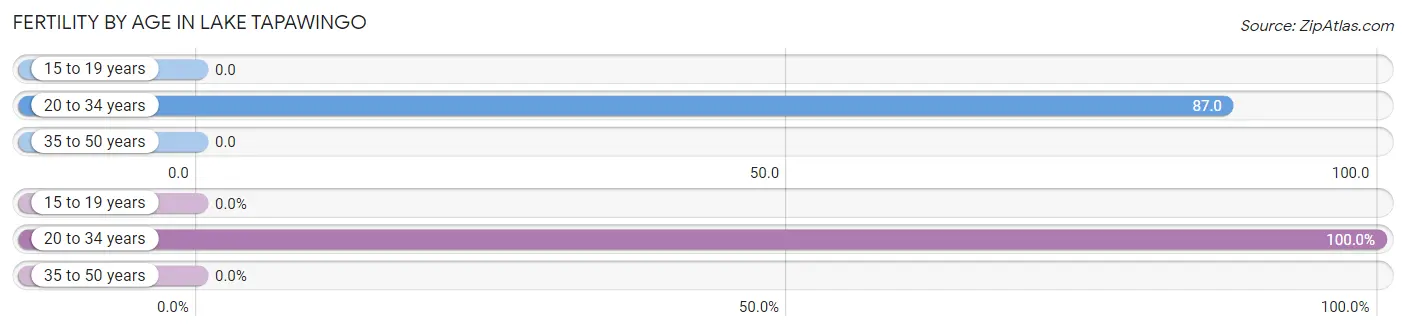
| Age Bracket | Women with Births | Births / 1,000 Women |
| 15 to 19 years | 0 (0.0%) | 0.0 |
| 20 to 34 years | 2 (100.0%) | 87.0 |
| 35 to 50 years | 0 (0.0%) | 0.0 |
| Total | 2 (100.0%) | 15.0 |
Fertility by Age by Marriage Status in Lake Tapawingo
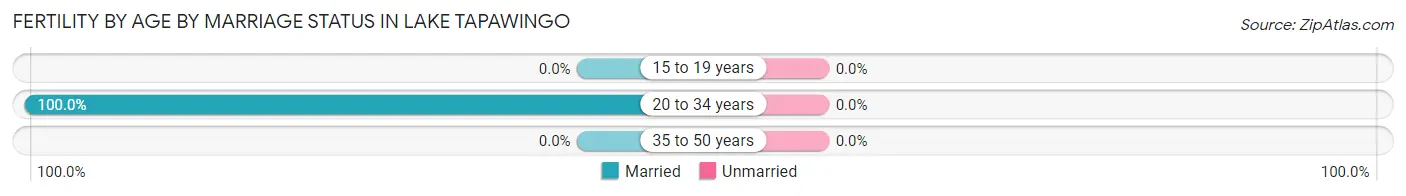
| Age Bracket | Married | Unmarried |
| 15 to 19 years | 0 (0.0%) | 0 (0.0%) |
| 20 to 34 years | 2 (100.0%) | 0 (0.0%) |
| 35 to 50 years | 0 (0.0%) | 0 (0.0%) |
| Total | 2 (100.0%) | 0 (0.0%) |
Fertility by Education in Lake Tapawingo
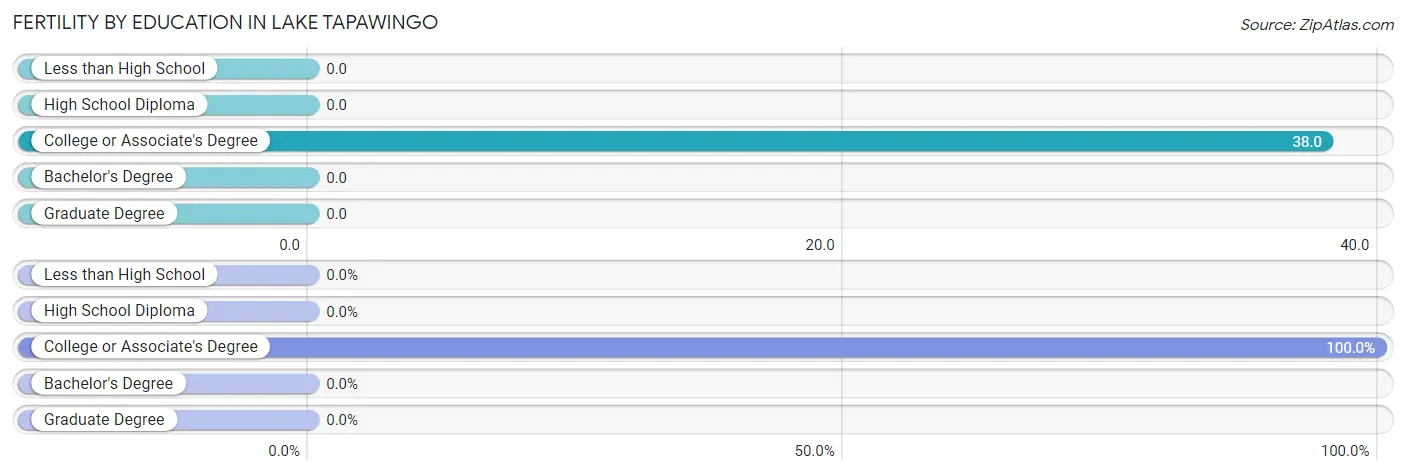
| Educational Attainment | Women with Births | Births / 1,000 Women |
| Less than High School | 0 (0.0%) | 0.0 |
| High School Diploma | 0 (0.0%) | 0.0 |
| College or Associate's Degree | 2 (100.0%) | 38.0 |
| Bachelor's Degree | 0 (0.0%) | 0.0 |
| Graduate Degree | 0 (0.0%) | 0.0 |
| Total | 2 (100.0%) | 15.0 |
Fertility by Education by Marriage Status in Lake Tapawingo
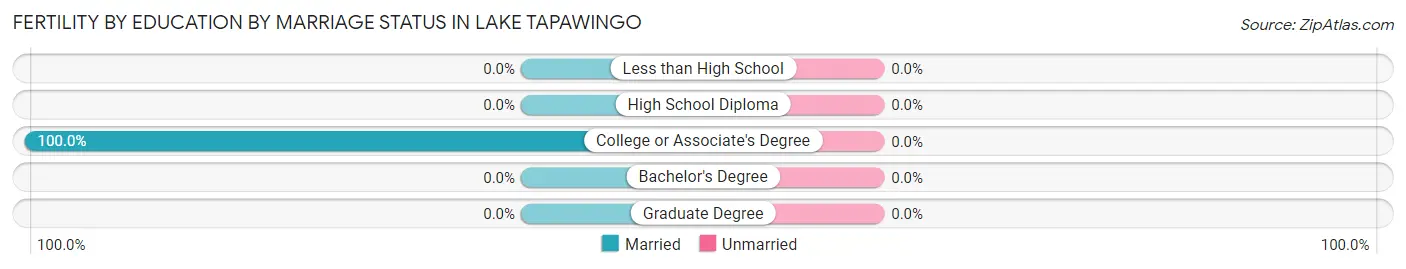
| Educational Attainment | Married | Unmarried |
| Less than High School | 0 (0.0%) | 0 (0.0%) |
| High School Diploma | 0 (0.0%) | 0 (0.0%) |
| College or Associate's Degree | 2 (100.0%) | 0 (0.0%) |
| Bachelor's Degree | 0 (0.0%) | 0 (0.0%) |
| Graduate Degree | 0 (0.0%) | 0 (0.0%) |
| Total | 2 (100.0%) | 0 (0.0%) |
Income in Lake Tapawingo
Income Overview in Lake Tapawingo
Per Capita Income in Lake Tapawingo is $57,278, while median incomes of families and households are $148,125 and $110,625 respectively.
| Characteristic | Number | Measure |
| Per Capita Income | 871 | $57,278 |
| Median Family Income | 234 | $148,125 |
| Mean Family Income | 234 | $164,223 |
| Median Household Income | 385 | $110,625 |
| Mean Household Income | 385 | $127,963 |
| Income Deficit | 234 | $0 |
| Wage / Income Gap (%) | 871 | 51.85% |
| Wage / Income Gap ($) | 871 | 48.15¢ per $1 |
| Gini / Inequality Index | 871 | 0.40 |
Earnings by Sex in Lake Tapawingo
Average Earnings in Lake Tapawingo are $55,446, $78,750 for men and $37,917 for women, a difference of 51.8%.
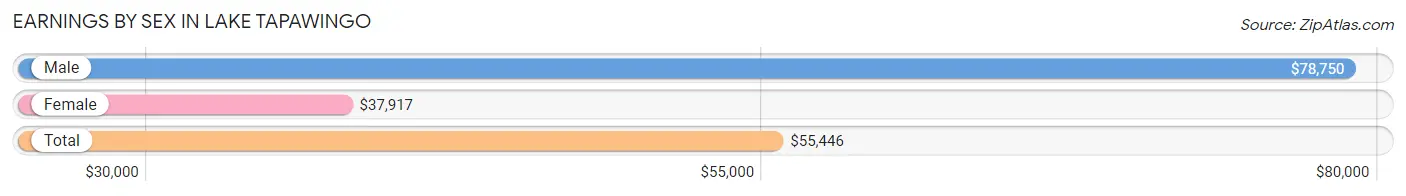
| Sex | Number | Average Earnings |
| Male | 272 (55.2%) | $78,750 |
| Female | 221 (44.8%) | $37,917 |
| Total | 493 (100.0%) | $55,446 |
Earnings by Sex by Income Bracket in Lake Tapawingo
The most common earnings brackets in Lake Tapawingo are $100,000+ for men (103 | 37.9%) and $75,000 to $99,999 for women (42 | 19.0%).
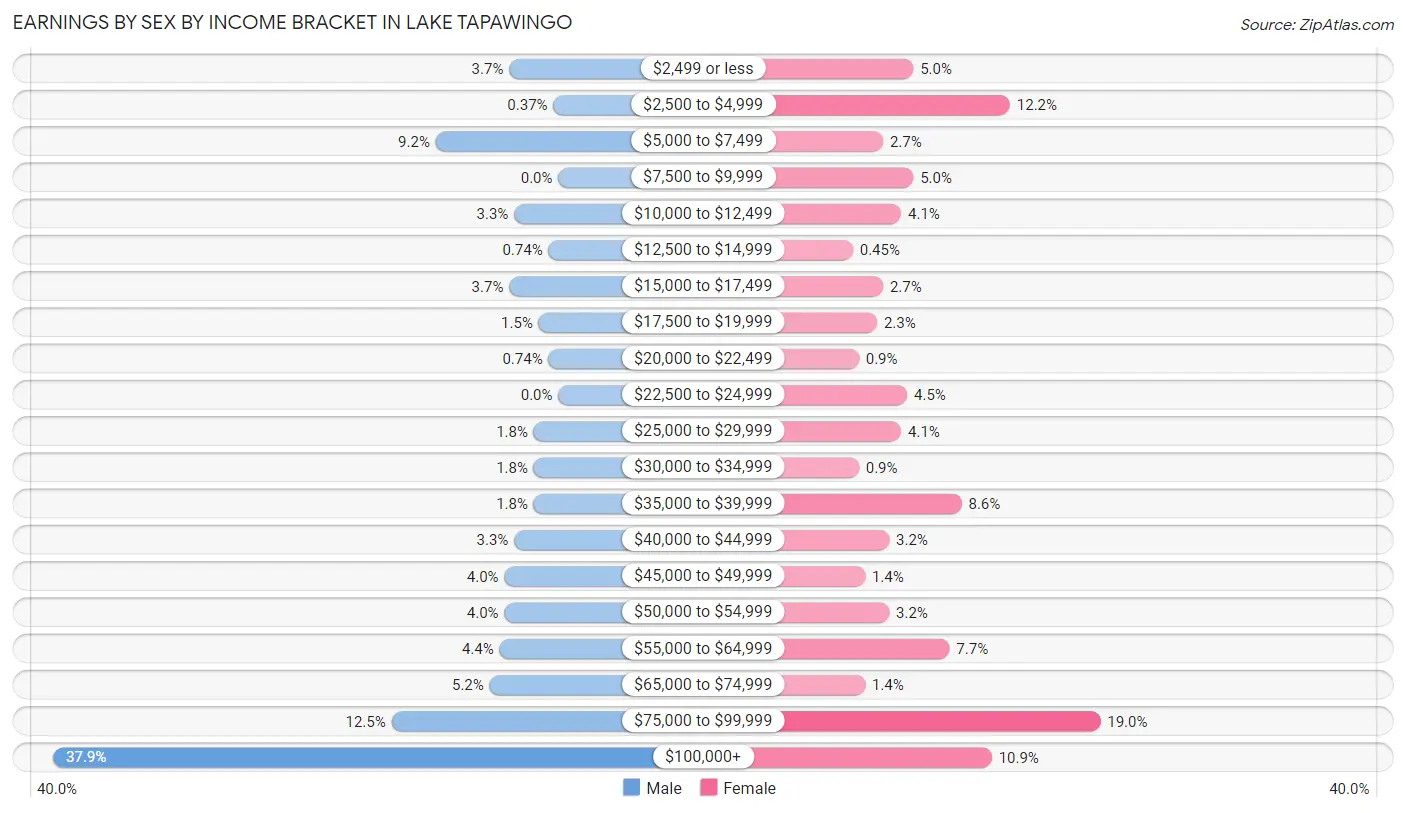
| Income | Male | Female |
| $2,499 or less | 10 (3.7%) | 11 (5.0%) |
| $2,500 to $4,999 | 1 (0.4%) | 27 (12.2%) |
| $5,000 to $7,499 | 25 (9.2%) | 6 (2.7%) |
| $7,500 to $9,999 | 0 (0.0%) | 11 (5.0%) |
| $10,000 to $12,499 | 9 (3.3%) | 9 (4.1%) |
| $12,500 to $14,999 | 2 (0.7%) | 1 (0.4%) |
| $15,000 to $17,499 | 10 (3.7%) | 6 (2.7%) |
| $17,500 to $19,999 | 4 (1.5%) | 5 (2.3%) |
| $20,000 to $22,499 | 2 (0.7%) | 2 (0.9%) |
| $22,500 to $24,999 | 0 (0.0%) | 10 (4.5%) |
| $25,000 to $29,999 | 5 (1.8%) | 9 (4.1%) |
| $30,000 to $34,999 | 5 (1.8%) | 2 (0.9%) |
| $35,000 to $39,999 | 5 (1.8%) | 19 (8.6%) |
| $40,000 to $44,999 | 9 (3.3%) | 7 (3.2%) |
| $45,000 to $49,999 | 11 (4.0%) | 3 (1.4%) |
| $50,000 to $54,999 | 11 (4.0%) | 7 (3.2%) |
| $55,000 to $64,999 | 12 (4.4%) | 17 (7.7%) |
| $65,000 to $74,999 | 14 (5.1%) | 3 (1.4%) |
| $75,000 to $99,999 | 34 (12.5%) | 42 (19.0%) |
| $100,000+ | 103 (37.9%) | 24 (10.9%) |
| Total | 272 (100.0%) | 221 (100.0%) |
Earnings by Sex by Educational Attainment in Lake Tapawingo
Average earnings in Lake Tapawingo are $90,268 for men and $41,667 for women, a difference of 53.8%. Men with an educational attainment of graduate degree enjoy the highest average annual earnings of $116,406, while those with bachelor's degree education earn the least with $56,389. Women with an educational attainment of graduate degree earn the most with the average annual earnings of $81,250, while those with bachelor's degree education have the smallest earnings of $35,313.
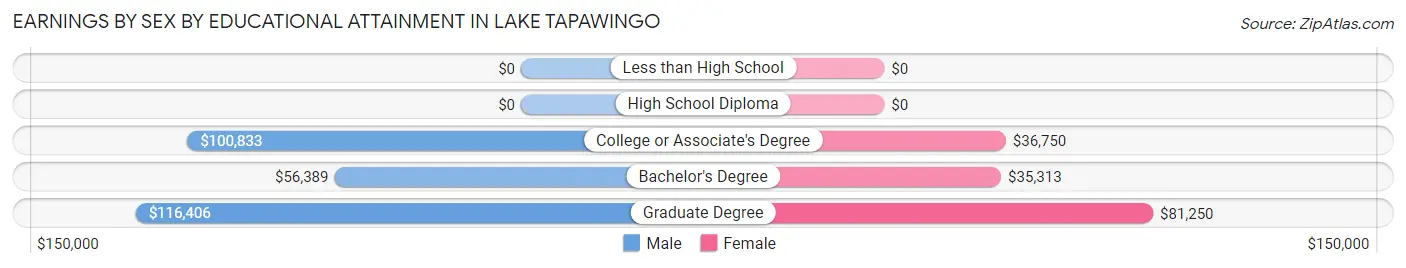
| Educational Attainment | Male Income | Female Income |
| Less than High School | - | - |
| High School Diploma | - | - |
| College or Associate's Degree | $100,833 | $36,750 |
| Bachelor's Degree | $56,389 | $35,313 |
| Graduate Degree | $116,406 | $81,250 |
| Total | $90,268 | $41,667 |
Family Income in Lake Tapawingo
Family Income Brackets in Lake Tapawingo
According to the Lake Tapawingo family income data, there are 65 families falling into the $100,000 to $149,999 income range, which is the most common income bracket and makes up 27.8% of all families.
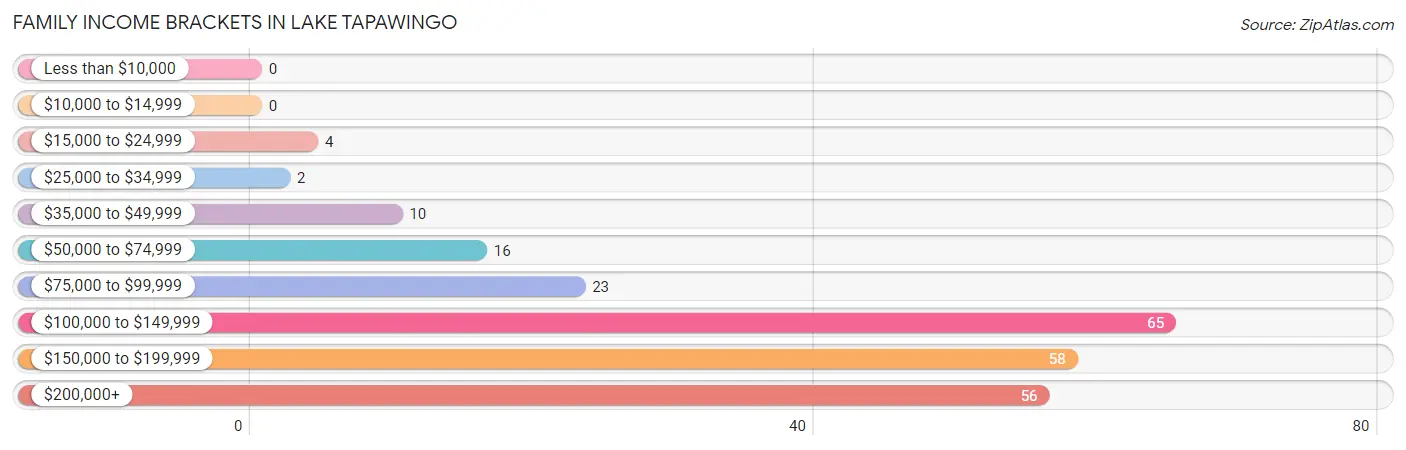
| Income Bracket | # Families | % Families |
| Less than $10,000 | 0 | 0.0% |
| $10,000 to $14,999 | 0 | 0.0% |
| $15,000 to $24,999 | 4 | 1.7% |
| $25,000 to $34,999 | 2 | 0.9% |
| $35,000 to $49,999 | 10 | 4.3% |
| $50,000 to $74,999 | 16 | 6.8% |
| $75,000 to $99,999 | 23 | 9.8% |
| $100,000 to $149,999 | 65 | 27.8% |
| $150,000 to $199,999 | 58 | 24.8% |
| $200,000+ | 56 | 23.9% |
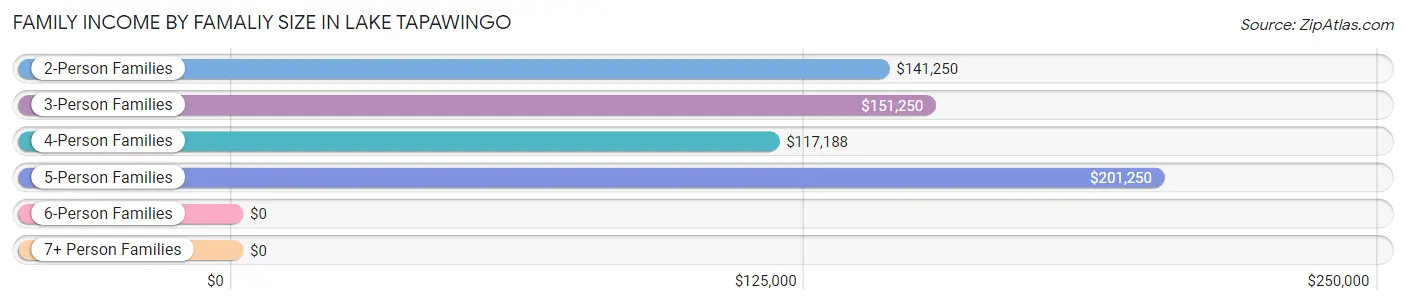
Family Income by Famaliy Size in Lake Tapawingo
5-person families (17 | 7.3%) account for the highest median family income in Lake Tapawingo with $201,250 per family, while 2-person families (149 | 63.7%) have the highest median income of $70,625 per family member.
| Income Bracket | # Families | Median Income |
| 2-Person Families | 149 (63.7%) | $141,250 |
| 3-Person Families | 20 (8.6%) | $151,250 |
| 4-Person Families | 48 (20.5%) | $117,188 |
| 5-Person Families | 17 (7.3%) | $201,250 |
| 6-Person Families | 0 (0.0%) | $0 |
| 7+ Person Families | 0 (0.0%) | $0 |
| Total | 234 (100.0%) | $148,125 |
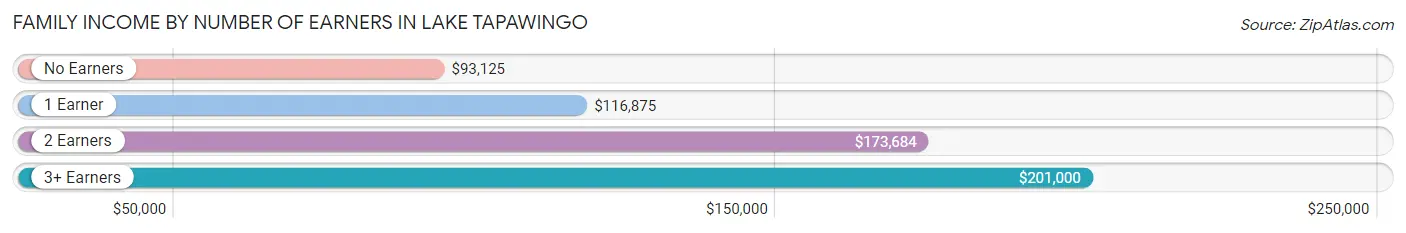
Family Income by Number of Earners in Lake Tapawingo
The median family income in Lake Tapawingo is $148,125, with families comprising 3+ earners (32) having the highest median family income of $201,000, while families with no earners (33) have the lowest median family income of $93,125, accounting for 13.7% and 14.1% of families, respectively.
| Number of Earners | # Families | Median Income |
| No Earners | 33 (14.1%) | $93,125 |
| 1 Earner | 65 (27.8%) | $116,875 |
| 2 Earners | 104 (44.4%) | $173,684 |
| 3+ Earners | 32 (13.7%) | $201,000 |
| Total | 234 (100.0%) | $148,125 |
Household Income in Lake Tapawingo
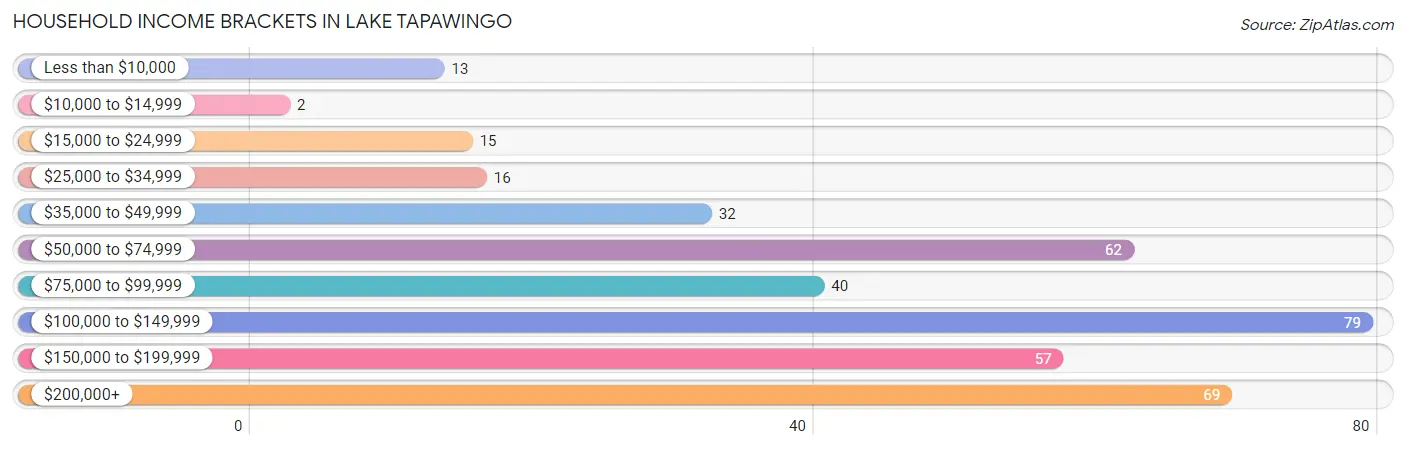
Household Income Brackets in Lake Tapawingo
With 79 households falling in the category, the $100,000 to $149,999 income range is the most frequent in Lake Tapawingo, accounting for 20.5% of all households. In contrast, only 2 households (0.5%) fall into the $10,000 to $14,999 income bracket, making it the least populous group.
| Income Bracket | # Households | % Households |
| Less than $10,000 | 13 | 3.4% |
| $10,000 to $14,999 | 2 | 0.5% |
| $15,000 to $24,999 | 15 | 3.9% |
| $25,000 to $34,999 | 16 | 4.2% |
| $35,000 to $49,999 | 32 | 8.3% |
| $50,000 to $74,999 | 62 | 16.1% |
| $75,000 to $99,999 | 40 | 10.4% |
| $100,000 to $149,999 | 79 | 20.5% |
| $150,000 to $199,999 | 57 | 14.8% |
| $200,000+ | 69 | 17.9% |
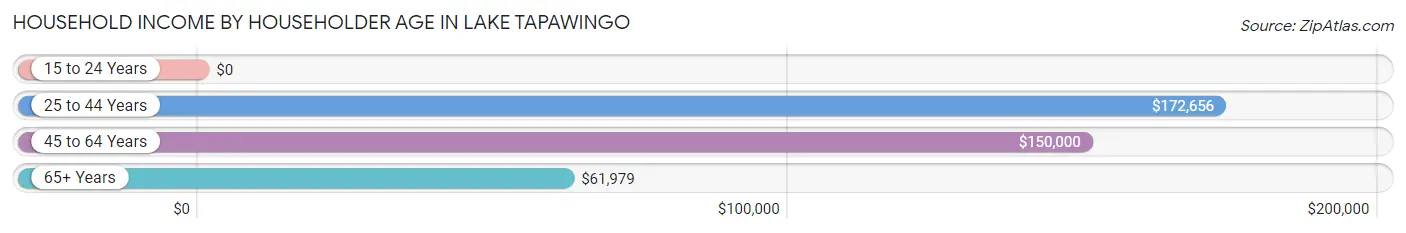
Household Income by Householder Age in Lake Tapawingo
The median household income in Lake Tapawingo is $110,625, with the highest median household income of $172,656 found in the 25 to 44 years age bracket for the primary householder. A total of 43 households (11.2%) fall into this category.
| Income Bracket | # Households | Median Income |
| 15 to 24 Years | 0 (0.0%) | $0 |
| 25 to 44 Years | 43 (11.2%) | $172,656 |
| 45 to 64 Years | 170 (44.2%) | $150,000 |
| 65+ Years | 172 (44.7%) | $61,979 |
| Total | 385 (100.0%) | $110,625 |
Poverty in Lake Tapawingo
Income Below Poverty by Sex and Age in Lake Tapawingo
With 1.8% poverty level for males and 5.2% for females among the residents of Lake Tapawingo, 55 to 64 year old males and 15 year old females are the most vulnerable to poverty, with 6 males (8.5%) and 3 females (21.4%) in their respective age groups living below the poverty level.
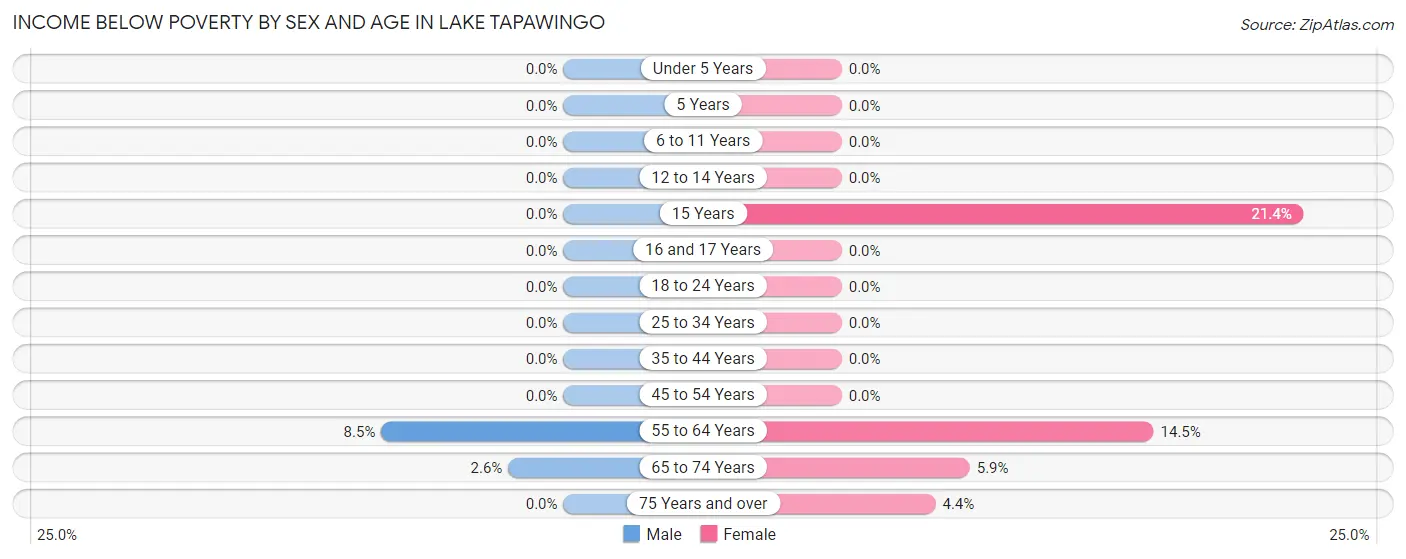
| Age Bracket | Male | Female |
| Under 5 Years | 0 (0.0%) | 0 (0.0%) |
| 5 Years | 0 (0.0%) | 0 (0.0%) |
| 6 to 11 Years | 0 (0.0%) | 0 (0.0%) |
| 12 to 14 Years | 0 (0.0%) | 0 (0.0%) |
| 15 Years | 0 (0.0%) | 3 (21.4%) |
| 16 and 17 Years | 0 (0.0%) | 0 (0.0%) |
| 18 to 24 Years | 0 (0.0%) | 0 (0.0%) |
| 25 to 34 Years | 0 (0.0%) | 0 (0.0%) |
| 35 to 44 Years | 0 (0.0%) | 0 (0.0%) |
| 45 to 54 Years | 0 (0.0%) | 0 (0.0%) |
| 55 to 64 Years | 6 (8.5%) | 11 (14.5%) |
| 65 to 74 Years | 2 (2.6%) | 6 (5.9%) |
| 75 Years and over | 0 (0.0%) | 2 (4.3%) |
| Total | 8 (1.8%) | 22 (5.2%) |
Income Above Poverty by Sex and Age in Lake Tapawingo
According to the poverty statistics in Lake Tapawingo, males aged under 5 years and females aged under 5 years are the age groups that are most secure financially, with 100.0% of males and 100.0% of females in these age groups living above the poverty line.
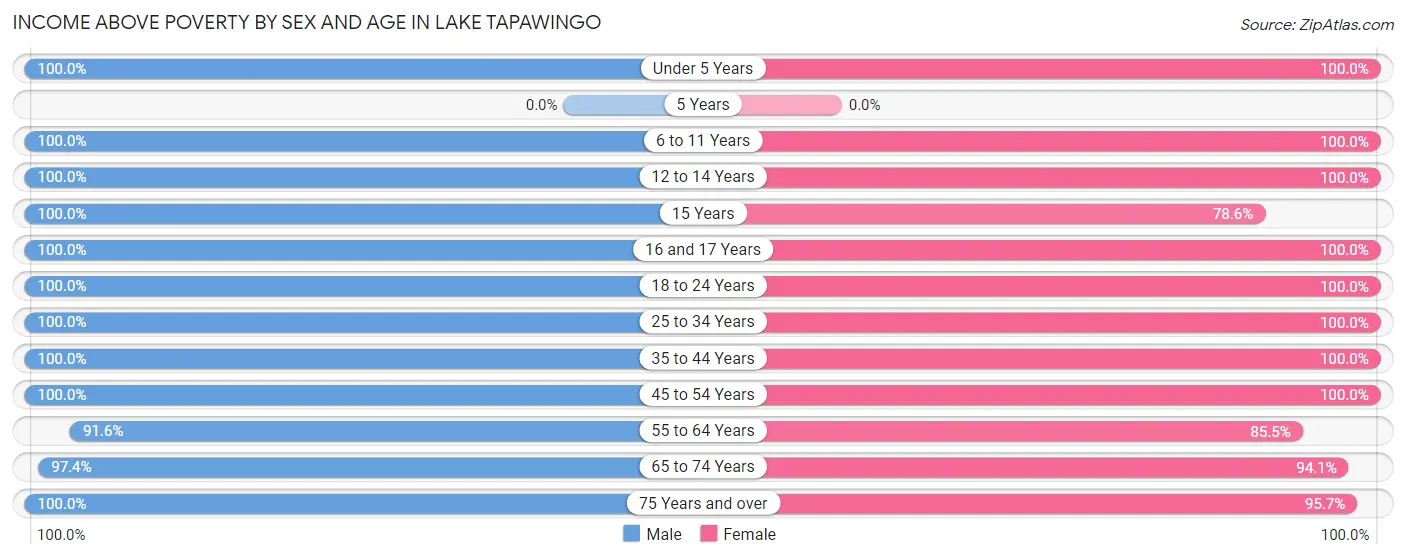
| Age Bracket | Male | Female |
| Under 5 Years | 4 (100.0%) | 18 (100.0%) |
| 5 Years | 0 (0.0%) | 0 (0.0%) |
| 6 to 11 Years | 21 (100.0%) | 8 (100.0%) |
| 12 to 14 Years | 23 (100.0%) | 8 (100.0%) |
| 15 Years | 2 (100.0%) | 11 (78.6%) |
| 16 and 17 Years | 23 (100.0%) | 7 (100.0%) |
| 18 to 24 Years | 19 (100.0%) | 15 (100.0%) |
| 25 to 34 Years | 21 (100.0%) | 11 (100.0%) |
| 35 to 44 Years | 38 (100.0%) | 46 (100.0%) |
| 45 to 54 Years | 87 (100.0%) | 70 (100.0%) |
| 55 to 64 Years | 65 (91.5%) | 65 (85.5%) |
| 65 to 74 Years | 76 (97.4%) | 95 (94.1%) |
| 75 Years and over | 52 (100.0%) | 44 (95.7%) |
| Total | 431 (98.2%) | 398 (94.8%) |
Income Below Poverty Among Married-Couple Families in Lake Tapawingo
| Children | Above Poverty | Below Poverty |
| No Children | 148 (100.0%) | 0 (0.0%) |
| 1 or 2 Children | 58 (100.0%) | 0 (0.0%) |
| 3 or 4 Children | 3 (100.0%) | 0 (0.0%) |
| 5 or more Children | 0 (0.0%) | 0 (0.0%) |
| Total | 209 (100.0%) | 0 (0.0%) |
Income Below Poverty Among Single-Parent Households in Lake Tapawingo
| Children | Single Father | Single Mother |
| No Children | 0 (0.0%) | 0 (0.0%) |
| 1 or 2 Children | 0 (0.0%) | 0 (0.0%) |
| 3 or 4 Children | 0 (0.0%) | 0 (0.0%) |
| 5 or more Children | 0 (0.0%) | 0 (0.0%) |
| Total | 0 (0.0%) | 0 (0.0%) |
Income Below Poverty Among Married-Couple vs Single-Parent Households in Lake Tapawingo
| Children | Married-Couple Families | Single-Parent Households |
| No Children | 0 (0.0%) | 0 (0.0%) |
| 1 or 2 Children | 0 (0.0%) | 0 (0.0%) |
| 3 or 4 Children | 0 (0.0%) | 0 (0.0%) |
| 5 or more Children | 0 (0.0%) | 0 (0.0%) |
| Total | 0 (0.0%) | 0 (0.0%) |
Employment Characteristics in Lake Tapawingo
Employment by Class of Employer in Lake Tapawingo
Among the 442 employed individuals in Lake Tapawingo, private company employees (291 | 65.8%), not-for-profit organizations (42 | 9.5%), and local government employees (39 | 8.8%) make up the most common classes of employment.
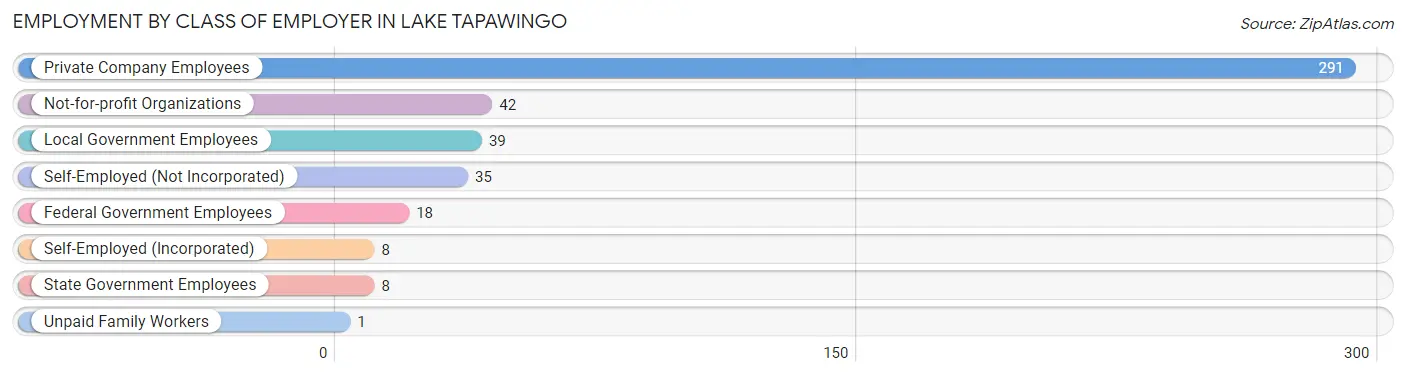
| Employer Class | # Employees | % Employees |
| Private Company Employees | 291 | 65.8% |
| Self-Employed (Incorporated) | 8 | 1.8% |
| Self-Employed (Not Incorporated) | 35 | 7.9% |
| Not-for-profit Organizations | 42 | 9.5% |
| Local Government Employees | 39 | 8.8% |
| State Government Employees | 8 | 1.8% |
| Federal Government Employees | 18 | 4.1% |
| Unpaid Family Workers | 1 | 0.2% |
| Total | 442 | 100.0% |
Employment Status by Age in Lake Tapawingo
According to the labor force statistics for Lake Tapawingo, out of the total population over 16 years of age (761), 61.6% or 469 individuals are in the labor force, with 5.8% or 27 of them unemployed. The age group with the highest labor force participation rate is 20 to 24 years, with 100.0% or 31 individuals in the labor force. Within the labor force, the 65 to 74 years age range has the highest percentage of unemployed individuals, with 39.3% or 24 of them being unemployed.
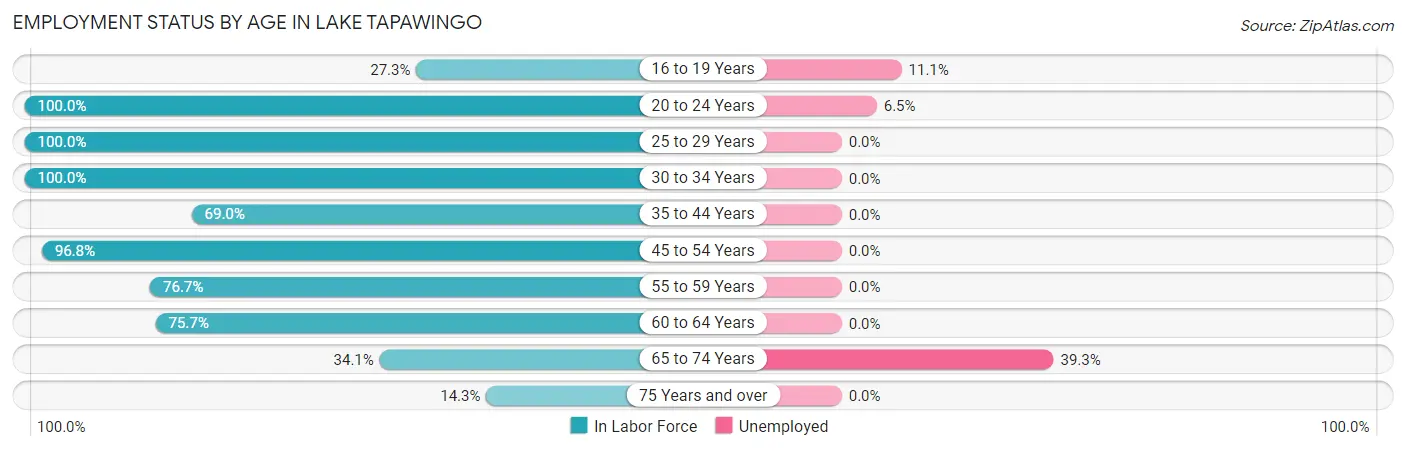
| Age Bracket | In Labor Force | Unemployed |
| 16 to 19 Years | 9 (27.3%) | 1 (11.1%) |
| 20 to 24 Years | 31 (100.0%) | 2 (6.5%) |
| 25 to 29 Years | 24 (100.0%) | 0 (0.0%) |
| 30 to 34 Years | 8 (100.0%) | 0 (0.0%) |
| 35 to 44 Years | 58 (69.0%) | 0 (0.0%) |
| 45 to 54 Years | 152 (96.8%) | 0 (0.0%) |
| 55 to 59 Years | 56 (76.7%) | 0 (0.0%) |
| 60 to 64 Years | 56 (75.7%) | 0 (0.0%) |
| 65 to 74 Years | 61 (34.1%) | 24 (39.3%) |
| 75 Years and over | 14 (14.3%) | 0 (0.0%) |
| Total | 469 (61.6%) | 27 (5.8%) |
Employment Status by Educational Attainment in Lake Tapawingo
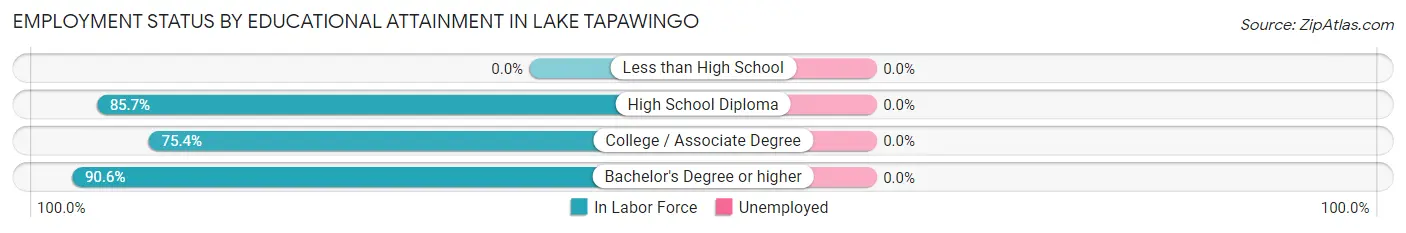
| Educational Attainment | In Labor Force | Unemployed |
| Less than High School | 0 (0.0%) | 0 (0.0%) |
| High School Diploma | 66 (85.7%) | 0 (0.0%) |
| College / Associate Degree | 104 (75.4%) | 0 (0.0%) |
| Bachelor's Degree or higher | 184 (90.6%) | 0 (0.0%) |
| Total | 354 (84.3%) | 0 (0.0%) |
Employment Occupations by Sex in Lake Tapawingo
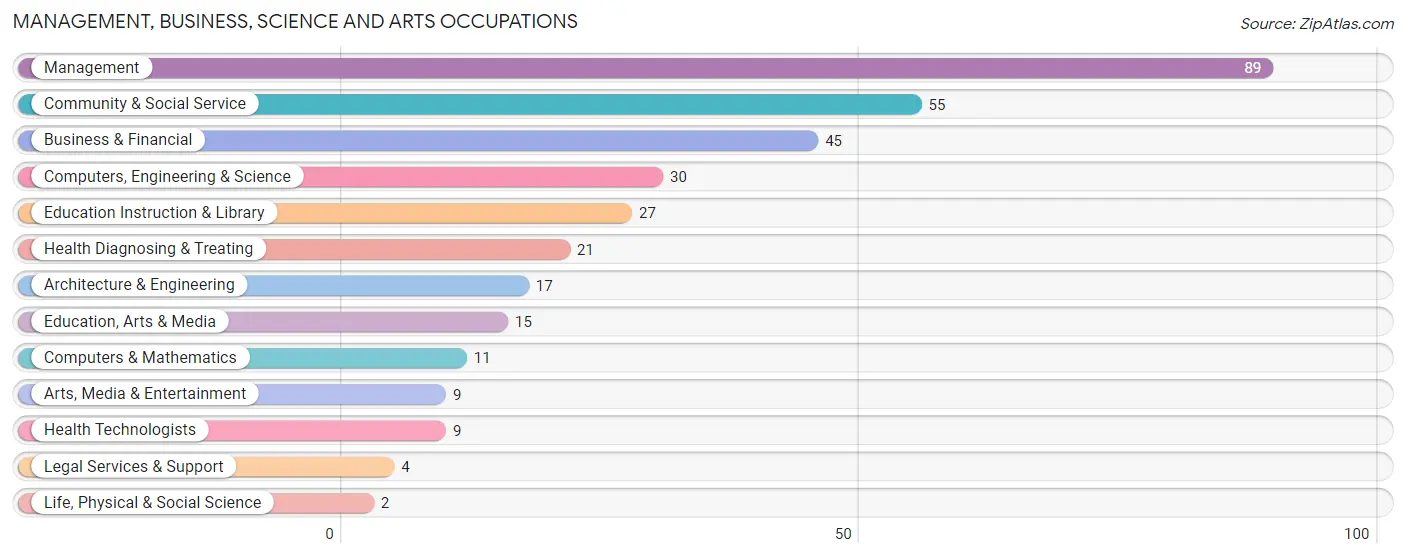
Management, Business, Science and Arts Occupations
The most common Management, Business, Science and Arts occupations in Lake Tapawingo are Management (89 | 20.1%), Community & Social Service (55 | 12.4%), Business & Financial (45 | 10.2%), Computers, Engineering & Science (30 | 6.8%), and Education Instruction & Library (27 | 6.1%).
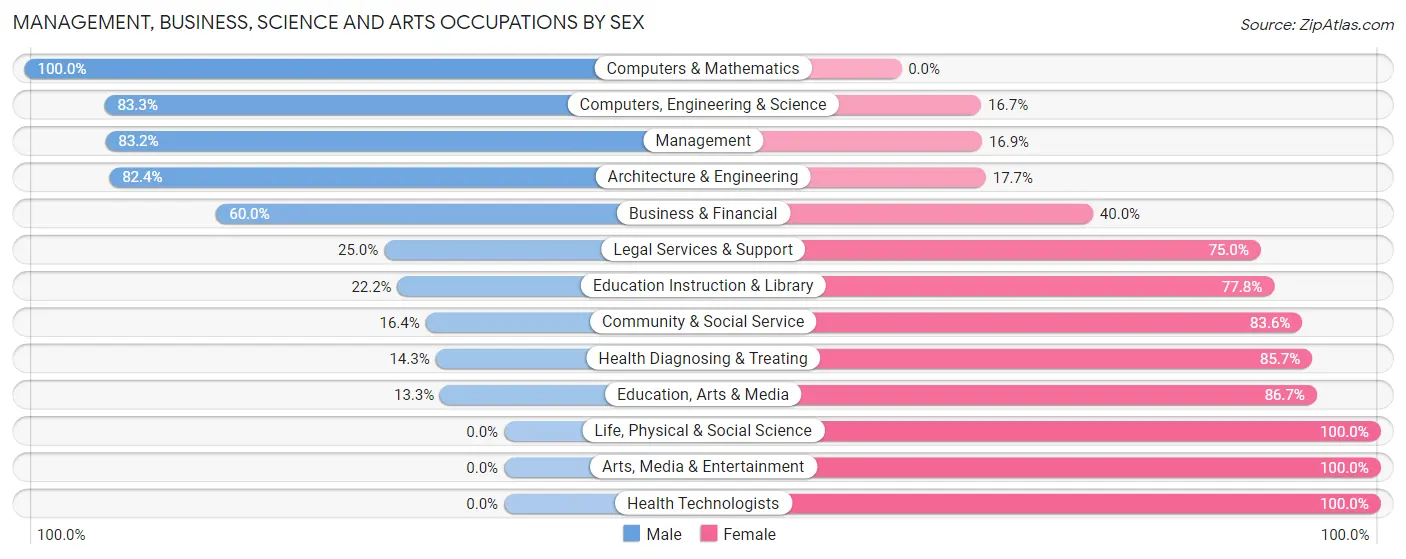
Management, Business, Science and Arts Occupations by Sex
Within the Management, Business, Science and Arts occupations in Lake Tapawingo, the most male-oriented occupations are Computers & Mathematics (100.0%), Computers, Engineering & Science (83.3%), and Management (83.2%), while the most female-oriented occupations are Life, Physical & Social Science (100.0%), Arts, Media & Entertainment (100.0%), and Health Technologists (100.0%).
| Occupation | Male | Female |
| Management | 74 (83.2%) | 15 (16.9%) |
| Business & Financial | 27 (60.0%) | 18 (40.0%) |
| Computers, Engineering & Science | 25 (83.3%) | 5 (16.7%) |
| Computers & Mathematics | 11 (100.0%) | 0 (0.0%) |
| Architecture & Engineering | 14 (82.4%) | 3 (17.6%) |
| Life, Physical & Social Science | 0 (0.0%) | 2 (100.0%) |
| Community & Social Service | 9 (16.4%) | 46 (83.6%) |
| Education, Arts & Media | 2 (13.3%) | 13 (86.7%) |
| Legal Services & Support | 1 (25.0%) | 3 (75.0%) |
| Education Instruction & Library | 6 (22.2%) | 21 (77.8%) |
| Arts, Media & Entertainment | 0 (0.0%) | 9 (100.0%) |
| Health Diagnosing & Treating | 3 (14.3%) | 18 (85.7%) |
| Health Technologists | 0 (0.0%) | 9 (100.0%) |
| Total (Category) | 138 (57.5%) | 102 (42.5%) |
| Total (Overall) | 241 (54.5%) | 201 (45.5%) |
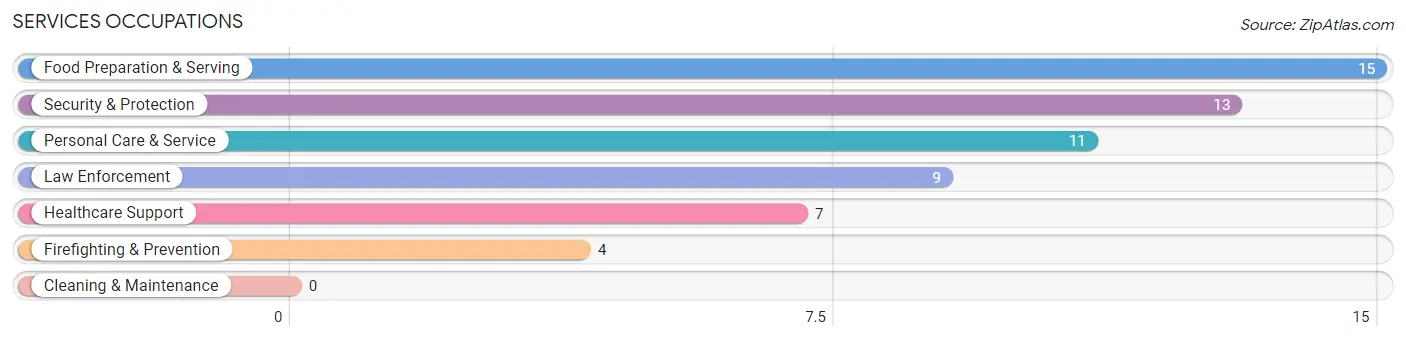
Services Occupations
The most common Services occupations in Lake Tapawingo are Food Preparation & Serving (15 | 3.4%), Security & Protection (13 | 2.9%), Personal Care & Service (11 | 2.5%), Law Enforcement (9 | 2.0%), and Healthcare Support (7 | 1.6%).
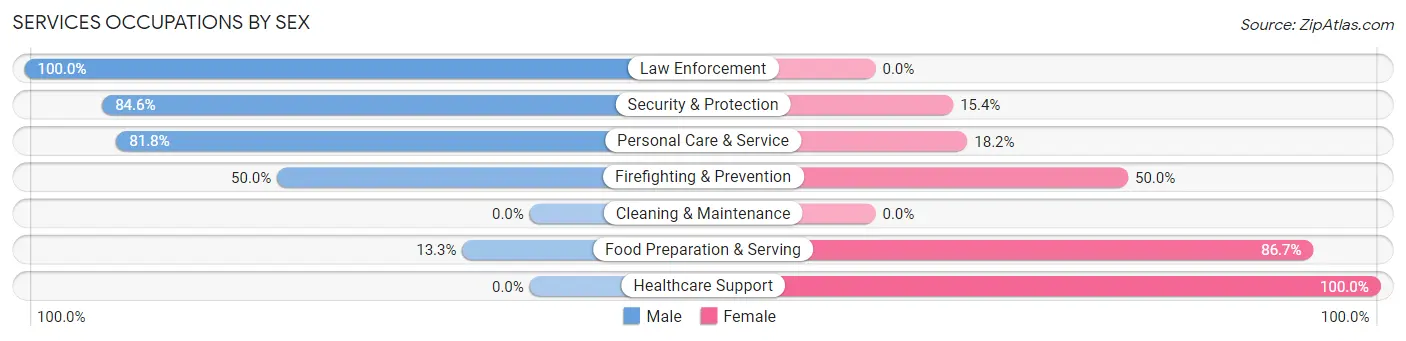
Services Occupations by Sex
Within the Services occupations in Lake Tapawingo, the most male-oriented occupations are Law Enforcement (100.0%), Security & Protection (84.6%), and Personal Care & Service (81.8%), while the most female-oriented occupations are Healthcare Support (100.0%), Food Preparation & Serving (86.7%), and Firefighting & Prevention (50.0%).
| Occupation | Male | Female |
| Healthcare Support | 0 (0.0%) | 7 (100.0%) |
| Security & Protection | 11 (84.6%) | 2 (15.4%) |
| Firefighting & Prevention | 2 (50.0%) | 2 (50.0%) |
| Law Enforcement | 9 (100.0%) | 0 (0.0%) |
| Food Preparation & Serving | 2 (13.3%) | 13 (86.7%) |
| Cleaning & Maintenance | 0 (0.0%) | 0 (0.0%) |
| Personal Care & Service | 9 (81.8%) | 2 (18.2%) |
| Total (Category) | 22 (47.8%) | 24 (52.2%) |
| Total (Overall) | 241 (54.5%) | 201 (45.5%) |
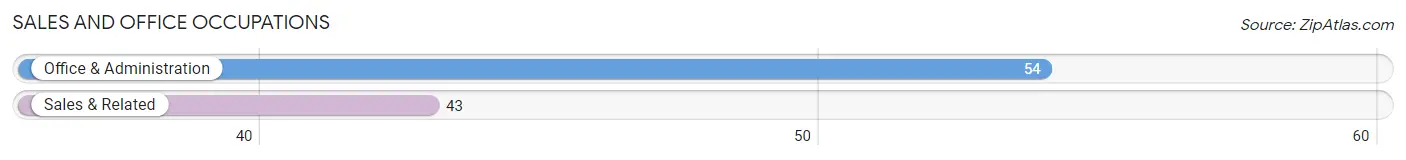
Sales and Office Occupations
The most common Sales and Office occupations in Lake Tapawingo are Office & Administration (54 | 12.2%), and Sales & Related (43 | 9.7%).
Sales and Office Occupations by Sex
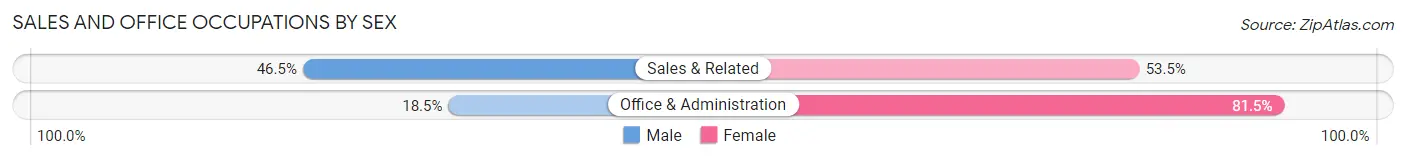
| Occupation | Male | Female |
| Sales & Related | 20 (46.5%) | 23 (53.5%) |
| Office & Administration | 10 (18.5%) | 44 (81.5%) |
| Total (Category) | 30 (30.9%) | 67 (69.1%) |
| Total (Overall) | 241 (54.5%) | 201 (45.5%) |
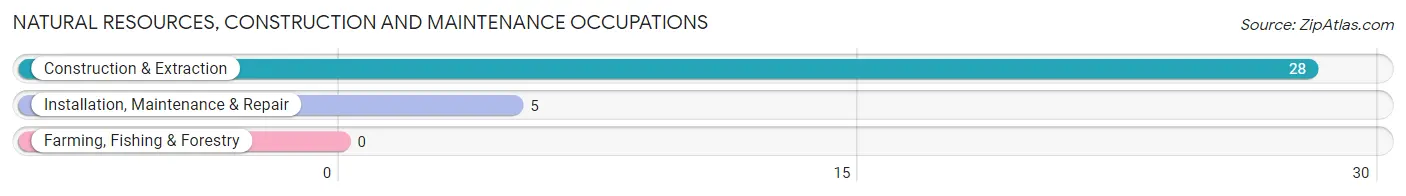
Natural Resources, Construction and Maintenance Occupations
The most common Natural Resources, Construction and Maintenance occupations in Lake Tapawingo are Construction & Extraction (28 | 6.3%), and Installation, Maintenance & Repair (5 | 1.1%).
Natural Resources, Construction and Maintenance Occupations by Sex
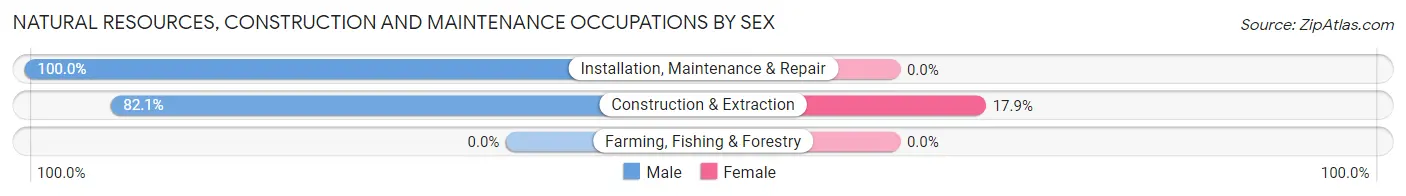
| Occupation | Male | Female |
| Farming, Fishing & Forestry | 0 (0.0%) | 0 (0.0%) |
| Construction & Extraction | 23 (82.1%) | 5 (17.9%) |
| Installation, Maintenance & Repair | 5 (100.0%) | 0 (0.0%) |
| Total (Category) | 28 (84.9%) | 5 (15.1%) |
| Total (Overall) | 241 (54.5%) | 201 (45.5%) |
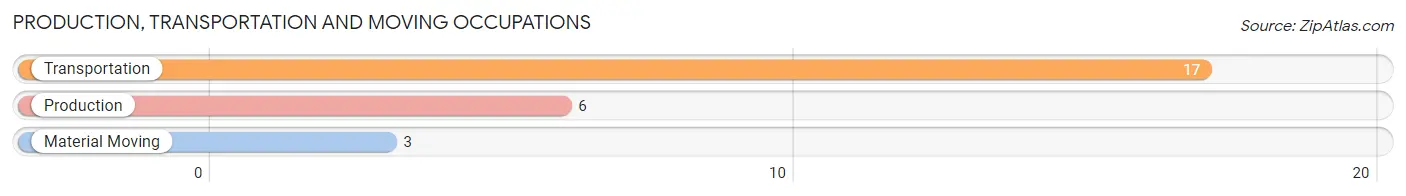
Production, Transportation and Moving Occupations
The most common Production, Transportation and Moving occupations in Lake Tapawingo are Transportation (17 | 3.8%), Production (6 | 1.4%), and Material Moving (3 | 0.7%).
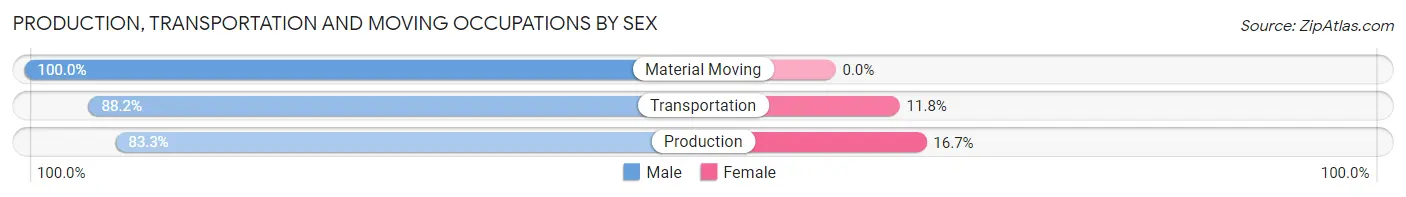
Production, Transportation and Moving Occupations by Sex
| Occupation | Male | Female |
| Production | 5 (83.3%) | 1 (16.7%) |
| Transportation | 15 (88.2%) | 2 (11.8%) |
| Material Moving | 3 (100.0%) | 0 (0.0%) |
| Total (Category) | 23 (88.5%) | 3 (11.5%) |
| Total (Overall) | 241 (54.5%) | 201 (45.5%) |
Employment Industries by Sex in Lake Tapawingo
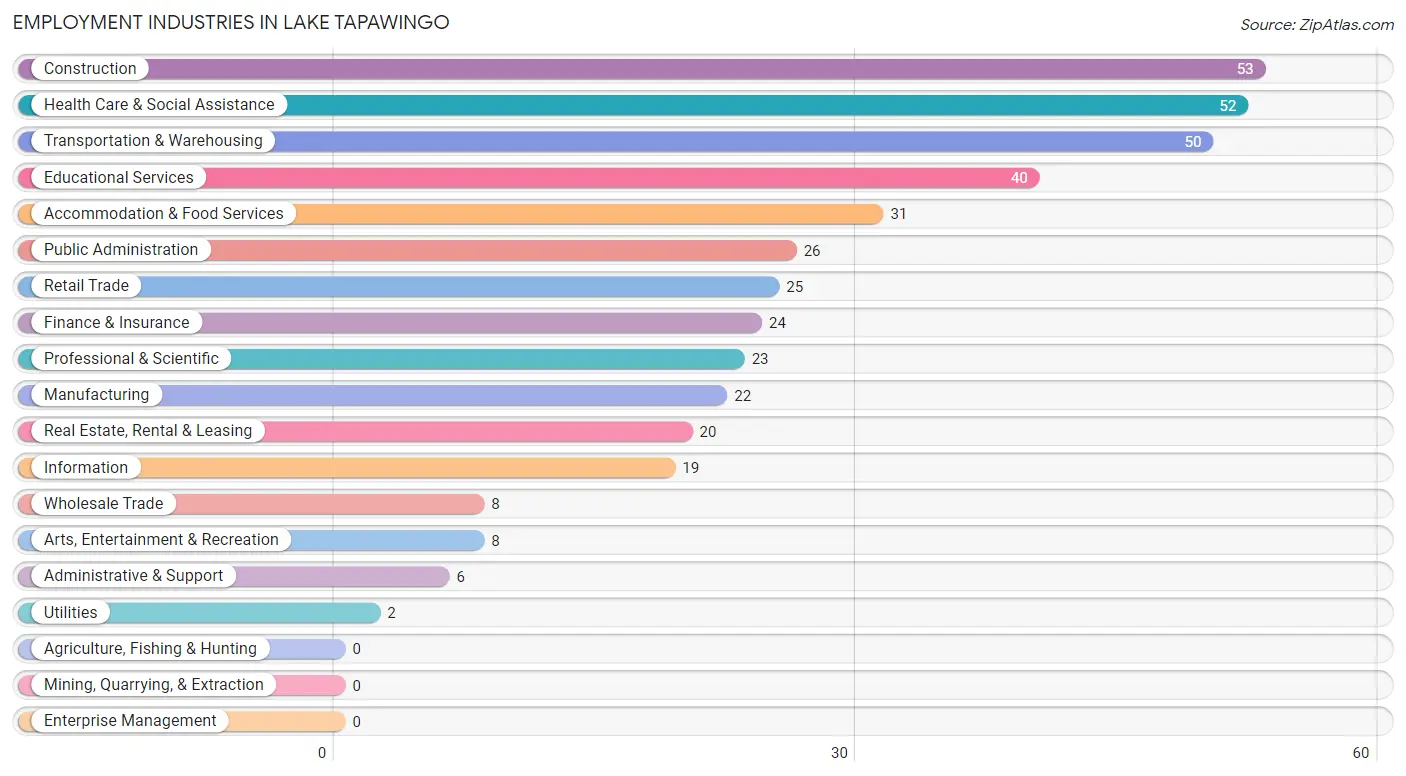
Employment Industries in Lake Tapawingo
The major employment industries in Lake Tapawingo include Construction (53 | 12.0%), Health Care & Social Assistance (52 | 11.8%), Transportation & Warehousing (50 | 11.3%), Educational Services (40 | 9.0%), and Accommodation & Food Services (31 | 7.0%).
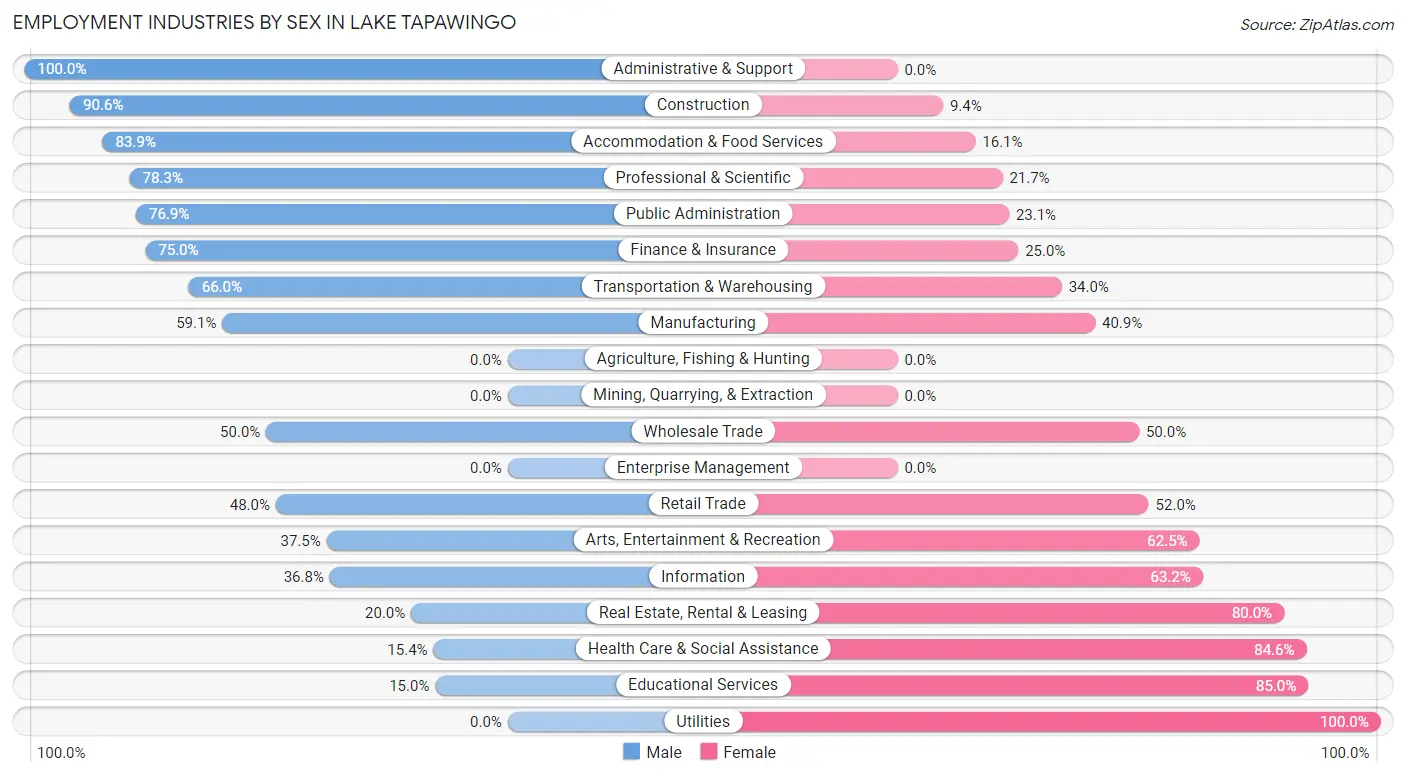
Employment Industries by Sex in Lake Tapawingo
The Lake Tapawingo industries that see more men than women are Administrative & Support (100.0%), Construction (90.6%), and Accommodation & Food Services (83.9%), whereas the industries that tend to have a higher number of women are Utilities (100.0%), Educational Services (85.0%), and Health Care & Social Assistance (84.6%).
| Industry | Male | Female |
| Agriculture, Fishing & Hunting | 0 (0.0%) | 0 (0.0%) |
| Mining, Quarrying, & Extraction | 0 (0.0%) | 0 (0.0%) |
| Construction | 48 (90.6%) | 5 (9.4%) |
| Manufacturing | 13 (59.1%) | 9 (40.9%) |
| Wholesale Trade | 4 (50.0%) | 4 (50.0%) |
| Retail Trade | 12 (48.0%) | 13 (52.0%) |
| Transportation & Warehousing | 33 (66.0%) | 17 (34.0%) |
| Utilities | 0 (0.0%) | 2 (100.0%) |
| Information | 7 (36.8%) | 12 (63.2%) |
| Finance & Insurance | 18 (75.0%) | 6 (25.0%) |
| Real Estate, Rental & Leasing | 4 (20.0%) | 16 (80.0%) |
| Professional & Scientific | 18 (78.3%) | 5 (21.7%) |
| Enterprise Management | 0 (0.0%) | 0 (0.0%) |
| Administrative & Support | 6 (100.0%) | 0 (0.0%) |
| Educational Services | 6 (15.0%) | 34 (85.0%) |
| Health Care & Social Assistance | 8 (15.4%) | 44 (84.6%) |
| Arts, Entertainment & Recreation | 3 (37.5%) | 5 (62.5%) |
| Accommodation & Food Services | 26 (83.9%) | 5 (16.1%) |
| Public Administration | 20 (76.9%) | 6 (23.1%) |
| Total | 241 (54.5%) | 201 (45.5%) |
Education in Lake Tapawingo
School Enrollment in Lake Tapawingo
The most common levels of schooling among the 147 students in Lake Tapawingo are high school (50 | 34.0%), middle school (34 | 23.1%), and elementary school (33 | 22.5%).
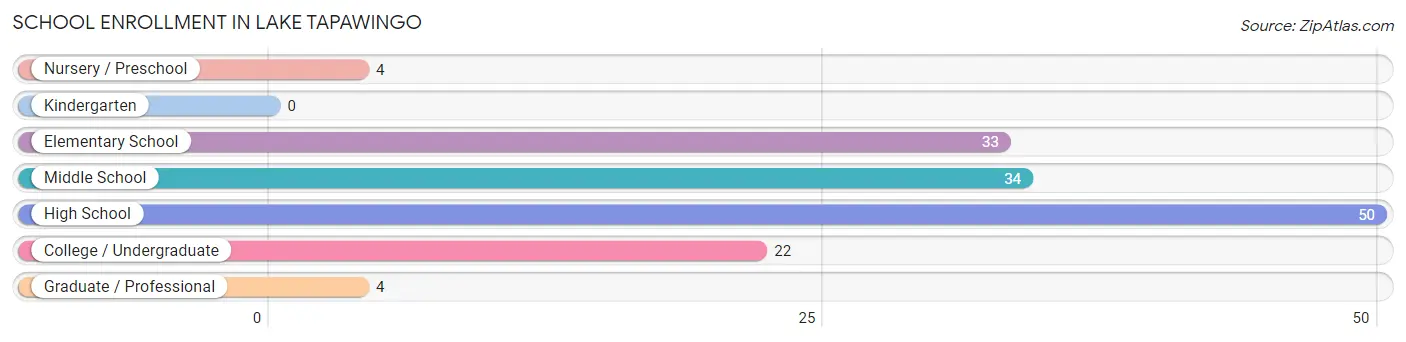
| School Level | # Students | % Students |
| Nursery / Preschool | 4 | 2.7% |
| Kindergarten | 0 | 0.0% |
| Elementary School | 33 | 22.5% |
| Middle School | 34 | 23.1% |
| High School | 50 | 34.0% |
| College / Undergraduate | 22 | 15.0% |
| Graduate / Professional | 4 | 2.7% |
| Total | 147 | 100.0% |
School Enrollment by Age by Funding Source in Lake Tapawingo
Out of a total of 147 students who are enrolled in schools in Lake Tapawingo, 27 (18.4%) attend a private institution, while the remaining 120 (81.6%) are enrolled in public schools. The age group of 35 years and over has the highest likelihood of being enrolled in private schools, with 10 (100.0% in the age bracket) enrolled. Conversely, the age group of 10 to 14 year olds has the lowest likelihood of being enrolled in a private school, with 37 (100.0% in the age bracket) attending a public institution.
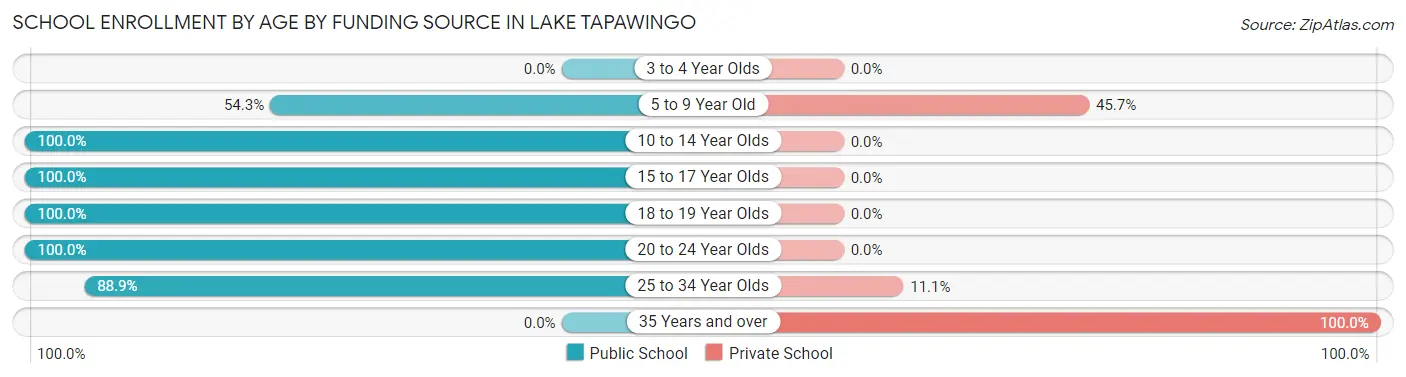
| Age Bracket | Public School | Private School |
| 3 to 4 Year Olds | 0 (0.0%) | 0 (0.0%) |
| 5 to 9 Year Old | 19 (54.3%) | 16 (45.7%) |
| 10 to 14 Year Olds | 37 (100.0%) | 0 (0.0%) |
| 15 to 17 Year Olds | 46 (100.0%) | 0 (0.0%) |
| 18 to 19 Year Olds | 3 (100.0%) | 0 (0.0%) |
| 20 to 24 Year Olds | 7 (100.0%) | 0 (0.0%) |
| 25 to 34 Year Olds | 8 (88.9%) | 1 (11.1%) |
| 35 Years and over | 0 (0.0%) | 10 (100.0%) |
| Total | 120 (81.6%) | 27 (18.4%) |
Educational Attainment by Field of Study in Lake Tapawingo
Business (99 | 30.4%), education (71 | 21.8%), arts & humanities (33 | 10.1%), science & technology (23 | 7.1%), and visual & performing arts (19 | 5.8%) are the most common fields of study among 326 individuals in Lake Tapawingo who have obtained a bachelor's degree or higher.
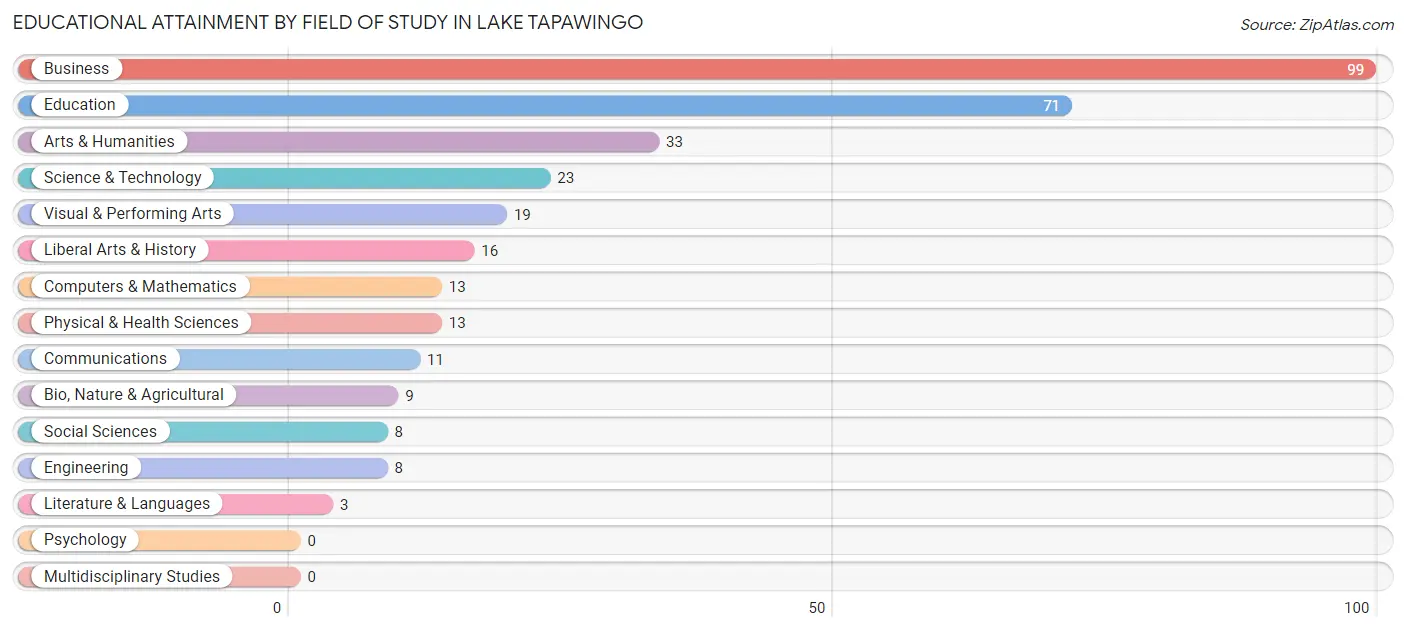
| Field of Study | # Graduates | % Graduates |
| Computers & Mathematics | 13 | 4.0% |
| Bio, Nature & Agricultural | 9 | 2.8% |
| Physical & Health Sciences | 13 | 4.0% |
| Psychology | 0 | 0.0% |
| Social Sciences | 8 | 2.5% |
| Engineering | 8 | 2.5% |
| Multidisciplinary Studies | 0 | 0.0% |
| Science & Technology | 23 | 7.1% |
| Business | 99 | 30.4% |
| Education | 71 | 21.8% |
| Literature & Languages | 3 | 0.9% |
| Liberal Arts & History | 16 | 4.9% |
| Visual & Performing Arts | 19 | 5.8% |
| Communications | 11 | 3.4% |
| Arts & Humanities | 33 | 10.1% |
| Total | 326 | 100.0% |
Transportation & Commute in Lake Tapawingo
Vehicle Availability by Sex in Lake Tapawingo
The most prevalent vehicle ownership categories in Lake Tapawingo are males with 2 vehicles (110, accounting for 45.6%) and females with 2 vehicles (93, making up 54.7%).
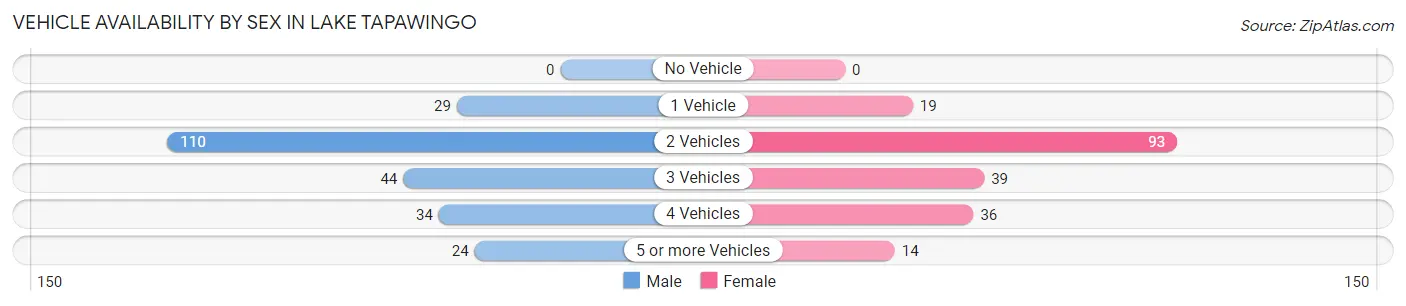
| Vehicles Available | Male | Female |
| No Vehicle | 0 (0.0%) | 0 (0.0%) |
| 1 Vehicle | 29 (12.0%) | 19 (9.5%) |
| 2 Vehicles | 110 (45.6%) | 93 (46.3%) |
| 3 Vehicles | 44 (18.3%) | 39 (19.4%) |
| 4 Vehicles | 34 (14.1%) | 36 (17.9%) |
| 5 or more Vehicles | 24 (10.0%) | 14 (7.0%) |
| Total | 241 (100.0%) | 201 (100.0%) |
Commute Time in Lake Tapawingo
The most frequently occuring commute durations in Lake Tapawingo are 30 to 34 minutes (73 commuters, 19.1%), 10 to 14 minutes (65 commuters, 17.0%), and 20 to 24 minutes (51 commuters, 13.3%).
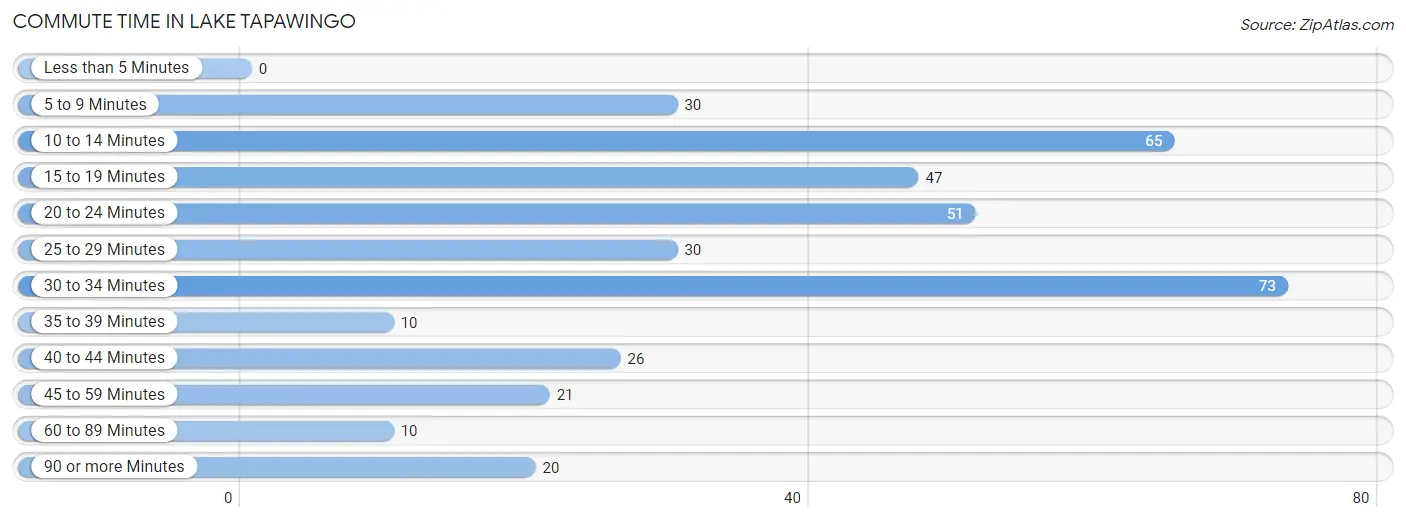
| Commute Time | # Commuters | % Commuters |
| Less than 5 Minutes | 0 | 0.0% |
| 5 to 9 Minutes | 30 | 7.8% |
| 10 to 14 Minutes | 65 | 17.0% |
| 15 to 19 Minutes | 47 | 12.3% |
| 20 to 24 Minutes | 51 | 13.3% |
| 25 to 29 Minutes | 30 | 7.8% |
| 30 to 34 Minutes | 73 | 19.1% |
| 35 to 39 Minutes | 10 | 2.6% |
| 40 to 44 Minutes | 26 | 6.8% |
| 45 to 59 Minutes | 21 | 5.5% |
| 60 to 89 Minutes | 10 | 2.6% |
| 90 or more Minutes | 20 | 5.2% |
Commute Time by Sex in Lake Tapawingo
The most common commute times in Lake Tapawingo are 30 to 34 minutes (50 commuters, 23.2%) for males and 10 to 14 minutes (40 commuters, 23.9%) for females.
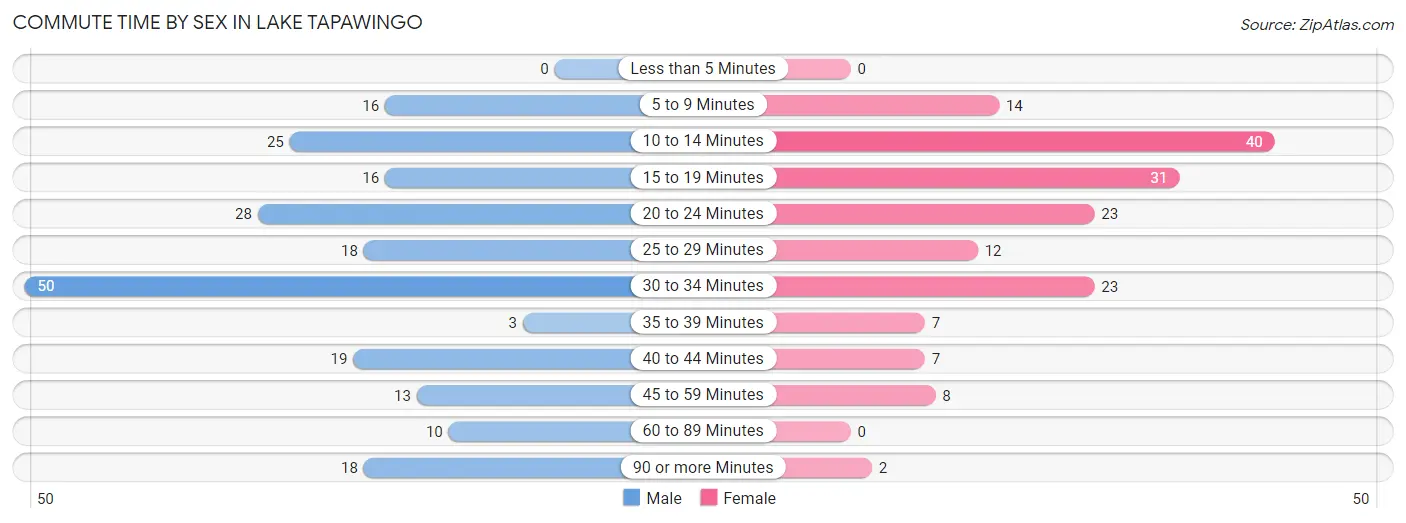
| Commute Time | Male | Female |
| Less than 5 Minutes | 0 (0.0%) | 0 (0.0%) |
| 5 to 9 Minutes | 16 (7.4%) | 14 (8.4%) |
| 10 to 14 Minutes | 25 (11.6%) | 40 (23.9%) |
| 15 to 19 Minutes | 16 (7.4%) | 31 (18.6%) |
| 20 to 24 Minutes | 28 (13.0%) | 23 (13.8%) |
| 25 to 29 Minutes | 18 (8.3%) | 12 (7.2%) |
| 30 to 34 Minutes | 50 (23.2%) | 23 (13.8%) |
| 35 to 39 Minutes | 3 (1.4%) | 7 (4.2%) |
| 40 to 44 Minutes | 19 (8.8%) | 7 (4.2%) |
| 45 to 59 Minutes | 13 (6.0%) | 8 (4.8%) |
| 60 to 89 Minutes | 10 (4.6%) | 0 (0.0%) |
| 90 or more Minutes | 18 (8.3%) | 2 (1.2%) |
Time of Departure to Work by Sex in Lake Tapawingo
The most frequent times of departure to work in Lake Tapawingo are 7:00 AM to 7:29 AM (61, 28.2%) for males and 6:30 AM to 6:59 AM (42, 25.2%) for females.
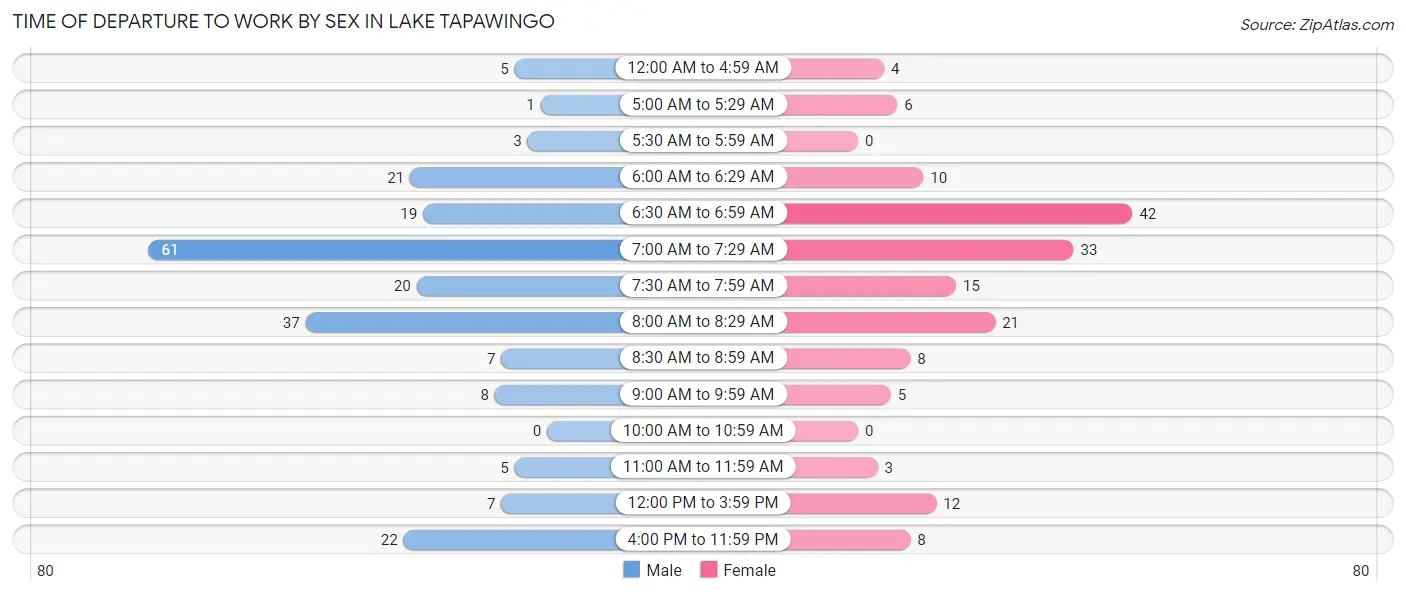
| Time of Departure | Male | Female |
| 12:00 AM to 4:59 AM | 5 (2.3%) | 4 (2.4%) |
| 5:00 AM to 5:29 AM | 1 (0.5%) | 6 (3.6%) |
| 5:30 AM to 5:59 AM | 3 (1.4%) | 0 (0.0%) |
| 6:00 AM to 6:29 AM | 21 (9.7%) | 10 (6.0%) |
| 6:30 AM to 6:59 AM | 19 (8.8%) | 42 (25.2%) |
| 7:00 AM to 7:29 AM | 61 (28.2%) | 33 (19.8%) |
| 7:30 AM to 7:59 AM | 20 (9.3%) | 15 (9.0%) |
| 8:00 AM to 8:29 AM | 37 (17.1%) | 21 (12.6%) |
| 8:30 AM to 8:59 AM | 7 (3.2%) | 8 (4.8%) |
| 9:00 AM to 9:59 AM | 8 (3.7%) | 5 (3.0%) |
| 10:00 AM to 10:59 AM | 0 (0.0%) | 0 (0.0%) |
| 11:00 AM to 11:59 AM | 5 (2.3%) | 3 (1.8%) |
| 12:00 PM to 3:59 PM | 7 (3.2%) | 12 (7.2%) |
| 4:00 PM to 11:59 PM | 22 (10.2%) | 8 (4.8%) |
| Total | 216 (100.0%) | 167 (100.0%) |
Housing Occupancy in Lake Tapawingo
Occupancy by Ownership in Lake Tapawingo
Of the total 385 dwellings in Lake Tapawingo, owner-occupied units account for 364 (94.6%), while renter-occupied units make up 21 (5.4%).
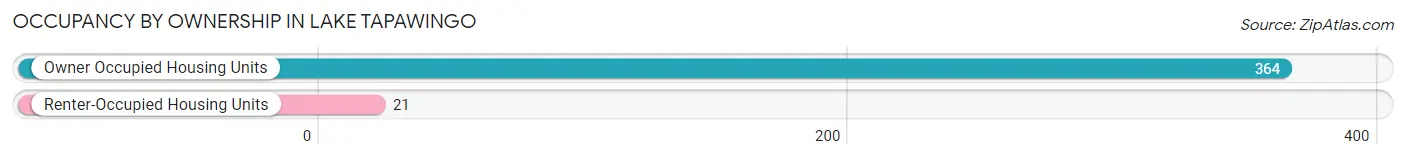
| Occupancy | # Housing Units | % Housing Units |
| Owner Occupied Housing Units | 364 | 94.6% |
| Renter-Occupied Housing Units | 21 | 5.4% |
| Total Occupied Housing Units | 385 | 100.0% |
Occupancy by Household Size in Lake Tapawingo
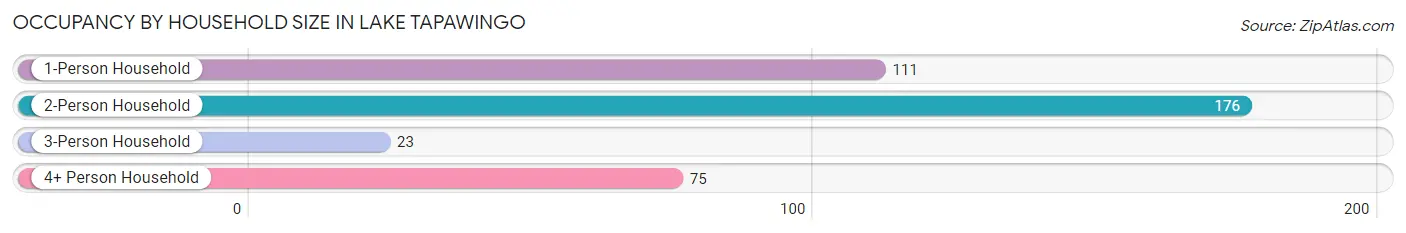
| Household Size | # Housing Units | % Housing Units |
| 1-Person Household | 111 | 28.8% |
| 2-Person Household | 176 | 45.7% |
| 3-Person Household | 23 | 6.0% |
| 4+ Person Household | 75 | 19.5% |
| Total Housing Units | 385 | 100.0% |
Occupancy by Ownership by Household Size in Lake Tapawingo
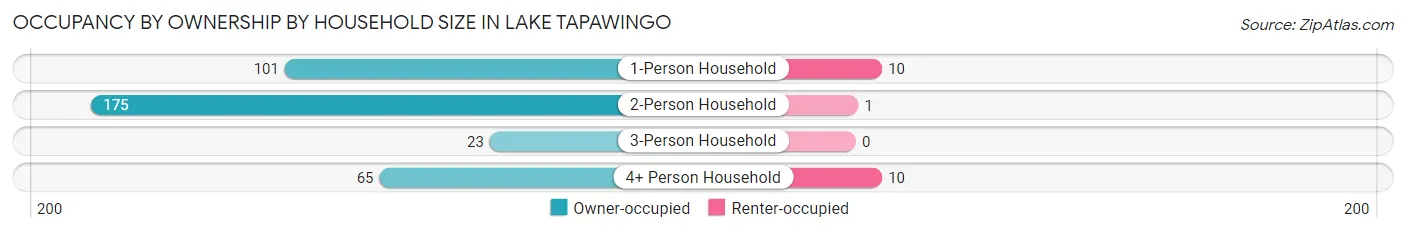
| Household Size | Owner-occupied | Renter-occupied |
| 1-Person Household | 101 (91.0%) | 10 (9.0%) |
| 2-Person Household | 175 (99.4%) | 1 (0.6%) |
| 3-Person Household | 23 (100.0%) | 0 (0.0%) |
| 4+ Person Household | 65 (86.7%) | 10 (13.3%) |
| Total Housing Units | 364 (94.6%) | 21 (5.4%) |
Occupancy by Educational Attainment in Lake Tapawingo
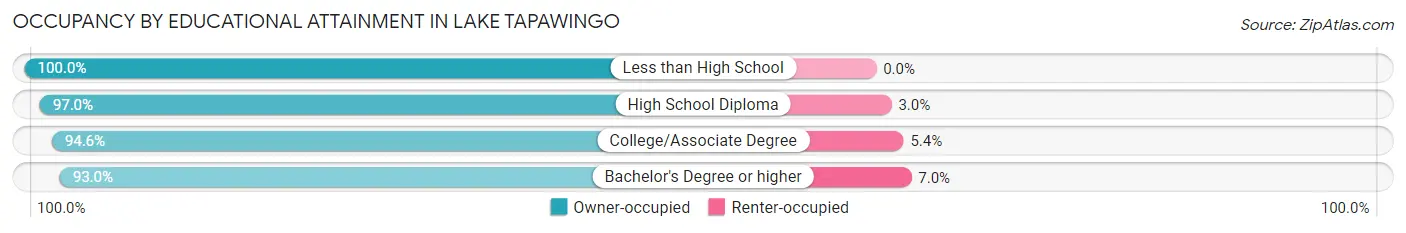
| Household Size | Owner-occupied | Renter-occupied |
| Less than High School | 3 (100.0%) | 0 (0.0%) |
| High School Diploma | 96 (97.0%) | 3 (3.0%) |
| College/Associate Degree | 105 (94.6%) | 6 (5.4%) |
| Bachelor's Degree or higher | 160 (93.0%) | 12 (7.0%) |
Occupancy by Age of Householder in Lake Tapawingo
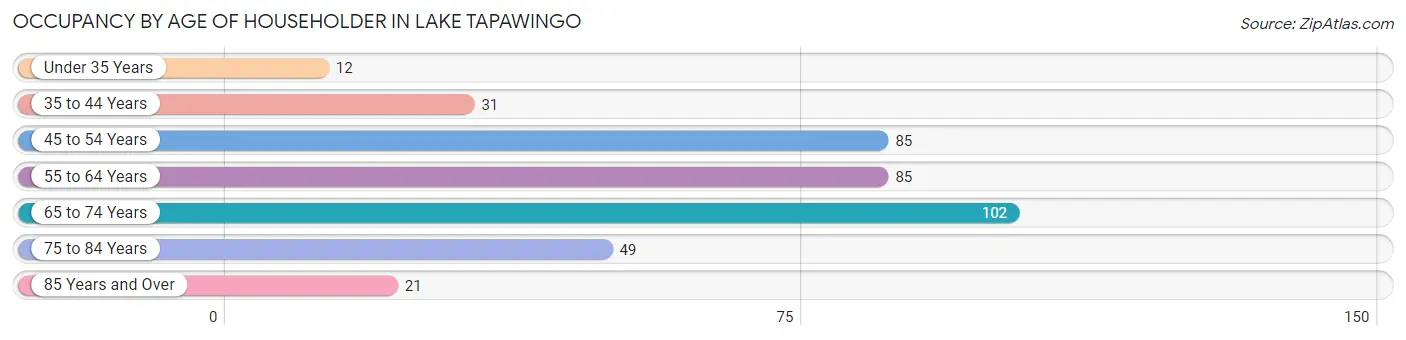
| Age Bracket | # Households | % Households |
| Under 35 Years | 12 | 3.1% |
| 35 to 44 Years | 31 | 8.1% |
| 45 to 54 Years | 85 | 22.1% |
| 55 to 64 Years | 85 | 22.1% |
| 65 to 74 Years | 102 | 26.5% |
| 75 to 84 Years | 49 | 12.7% |
| 85 Years and Over | 21 | 5.4% |
| Total | 385 | 100.0% |
Housing Finances in Lake Tapawingo
Median Income by Occupancy in Lake Tapawingo
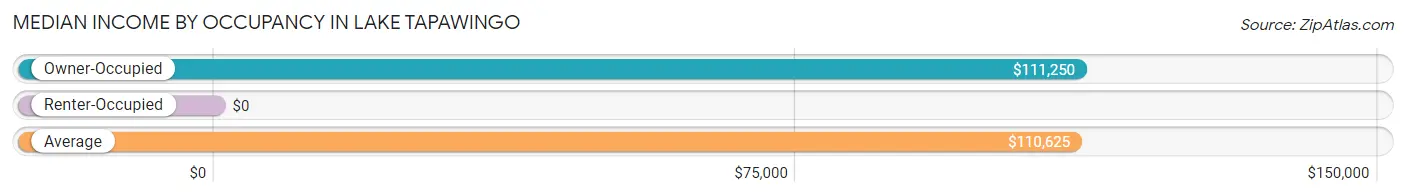
| Occupancy Type | # Households | Median Income |
| Owner-Occupied | 364 (94.6%) | $111,250 |
| Renter-Occupied | 21 (5.4%) | $0 |
| Average | 385 (100.0%) | $110,625 |
Occupancy by Householder Income Bracket in Lake Tapawingo
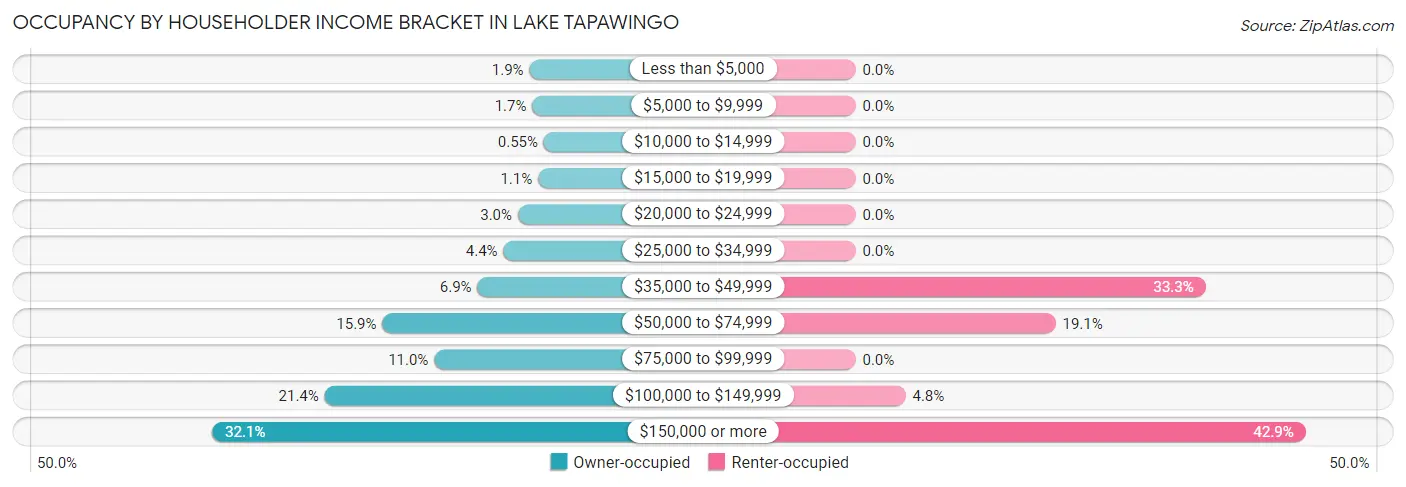
| Income Bracket | Owner-occupied | Renter-occupied |
| Less than $5,000 | 7 (1.9%) | 0 (0.0%) |
| $5,000 to $9,999 | 6 (1.7%) | 0 (0.0%) |
| $10,000 to $14,999 | 2 (0.5%) | 0 (0.0%) |
| $15,000 to $19,999 | 4 (1.1%) | 0 (0.0%) |
| $20,000 to $24,999 | 11 (3.0%) | 0 (0.0%) |
| $25,000 to $34,999 | 16 (4.4%) | 0 (0.0%) |
| $35,000 to $49,999 | 25 (6.9%) | 7 (33.3%) |
| $50,000 to $74,999 | 58 (15.9%) | 4 (19.1%) |
| $75,000 to $99,999 | 40 (11.0%) | 0 (0.0%) |
| $100,000 to $149,999 | 78 (21.4%) | 1 (4.8%) |
| $150,000 or more | 117 (32.1%) | 9 (42.9%) |
| Total | 364 (100.0%) | 21 (100.0%) |
Monthly Housing Cost Tiers in Lake Tapawingo
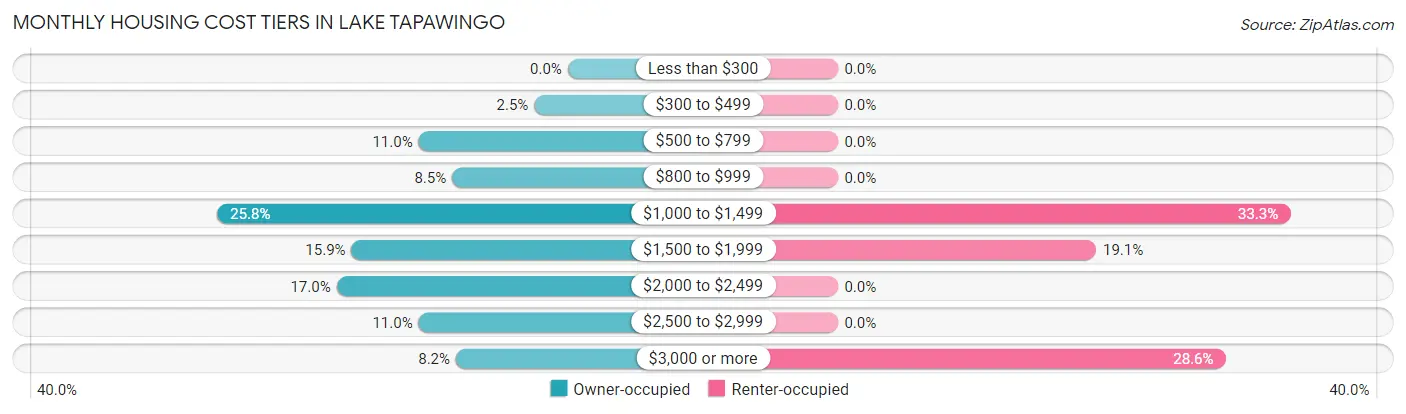
| Monthly Cost | Owner-occupied | Renter-occupied |
| Less than $300 | 0 (0.0%) | 0 (0.0%) |
| $300 to $499 | 9 (2.5%) | 0 (0.0%) |
| $500 to $799 | 40 (11.0%) | 0 (0.0%) |
| $800 to $999 | 31 (8.5%) | 0 (0.0%) |
| $1,000 to $1,499 | 94 (25.8%) | 7 (33.3%) |
| $1,500 to $1,999 | 58 (15.9%) | 4 (19.1%) |
| $2,000 to $2,499 | 62 (17.0%) | 0 (0.0%) |
| $2,500 to $2,999 | 40 (11.0%) | 0 (0.0%) |
| $3,000 or more | 30 (8.2%) | 6 (28.6%) |
| Total | 364 (100.0%) | 21 (100.0%) |
Physical Housing Characteristics in Lake Tapawingo
Housing Structures in Lake Tapawingo
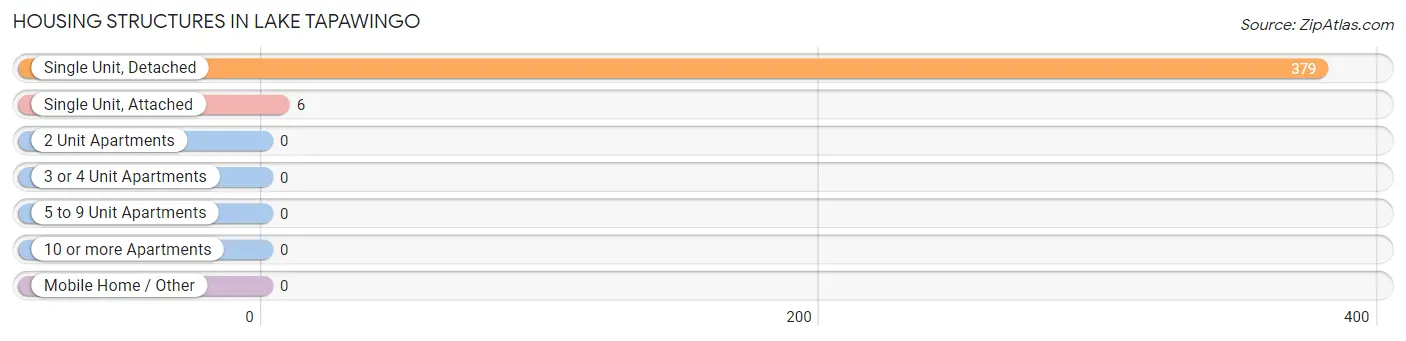
| Structure Type | # Housing Units | % Housing Units |
| Single Unit, Detached | 379 | 98.4% |
| Single Unit, Attached | 6 | 1.6% |
| 2 Unit Apartments | 0 | 0.0% |
| 3 or 4 Unit Apartments | 0 | 0.0% |
| 5 to 9 Unit Apartments | 0 | 0.0% |
| 10 or more Apartments | 0 | 0.0% |
| Mobile Home / Other | 0 | 0.0% |
| Total | 385 | 100.0% |
Housing Structures by Occupancy in Lake Tapawingo
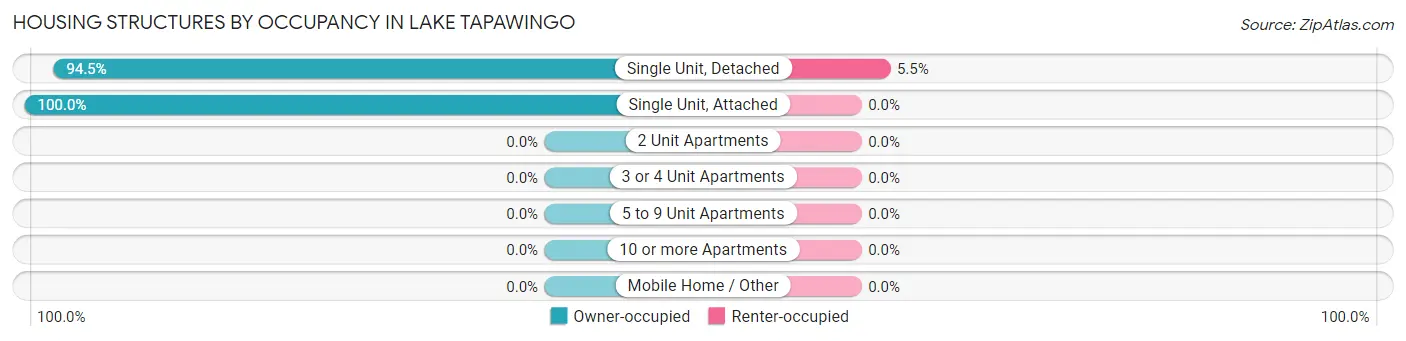
| Structure Type | Owner-occupied | Renter-occupied |
| Single Unit, Detached | 358 (94.5%) | 21 (5.5%) |
| Single Unit, Attached | 6 (100.0%) | 0 (0.0%) |
| 2 Unit Apartments | 0 (0.0%) | 0 (0.0%) |
| 3 or 4 Unit Apartments | 0 (0.0%) | 0 (0.0%) |
| 5 to 9 Unit Apartments | 0 (0.0%) | 0 (0.0%) |
| 10 or more Apartments | 0 (0.0%) | 0 (0.0%) |
| Mobile Home / Other | 0 (0.0%) | 0 (0.0%) |
| Total | 364 (94.6%) | 21 (5.4%) |
Housing Structures by Number of Rooms in Lake Tapawingo
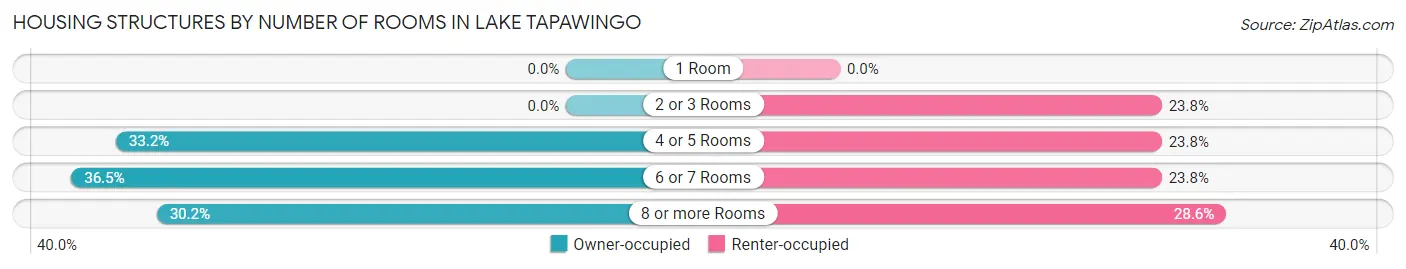
| Number of Rooms | Owner-occupied | Renter-occupied |
| 1 Room | 0 (0.0%) | 0 (0.0%) |
| 2 or 3 Rooms | 0 (0.0%) | 5 (23.8%) |
| 4 or 5 Rooms | 121 (33.2%) | 5 (23.8%) |
| 6 or 7 Rooms | 133 (36.5%) | 5 (23.8%) |
| 8 or more Rooms | 110 (30.2%) | 6 (28.6%) |
| Total | 364 (100.0%) | 21 (100.0%) |
Housing Structure by Heating Type in Lake Tapawingo
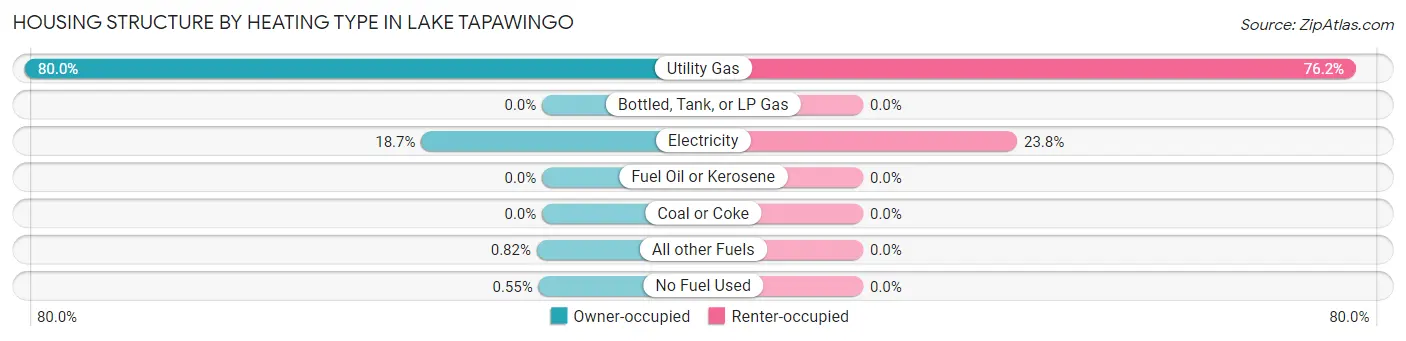
| Heating Type | Owner-occupied | Renter-occupied |
| Utility Gas | 291 (79.9%) | 16 (76.2%) |
| Bottled, Tank, or LP Gas | 0 (0.0%) | 0 (0.0%) |
| Electricity | 68 (18.7%) | 5 (23.8%) |
| Fuel Oil or Kerosene | 0 (0.0%) | 0 (0.0%) |
| Coal or Coke | 0 (0.0%) | 0 (0.0%) |
| All other Fuels | 3 (0.8%) | 0 (0.0%) |
| No Fuel Used | 2 (0.5%) | 0 (0.0%) |
| Total | 364 (100.0%) | 21 (100.0%) |
Household Vehicle Usage in Lake Tapawingo
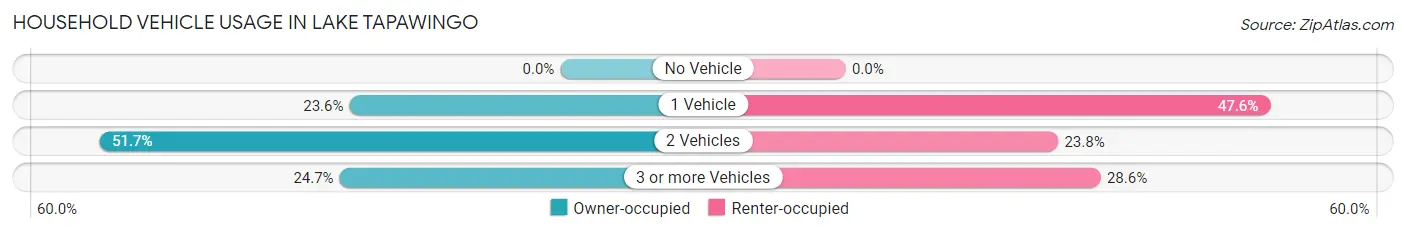
| Vehicles per Household | Owner-occupied | Renter-occupied |
| No Vehicle | 0 (0.0%) | 0 (0.0%) |
| 1 Vehicle | 86 (23.6%) | 10 (47.6%) |
| 2 Vehicles | 188 (51.6%) | 5 (23.8%) |
| 3 or more Vehicles | 90 (24.7%) | 6 (28.6%) |
| Total | 364 (100.0%) | 21 (100.0%) |
Real Estate & Mortgages in Lake Tapawingo
Real Estate and Mortgage Overview in Lake Tapawingo
| Characteristic | Without Mortgage | With Mortgage |
| Housing Units | 131 | 233 |
| Median Property Value | $355,000 | $341,200 |
| Median Household Income | $115,139 | $90 |
| Monthly Housing Costs | $946 | $30 |
| Real Estate Taxes | $5,224 | $0 |
Property Value by Mortgage Status in Lake Tapawingo
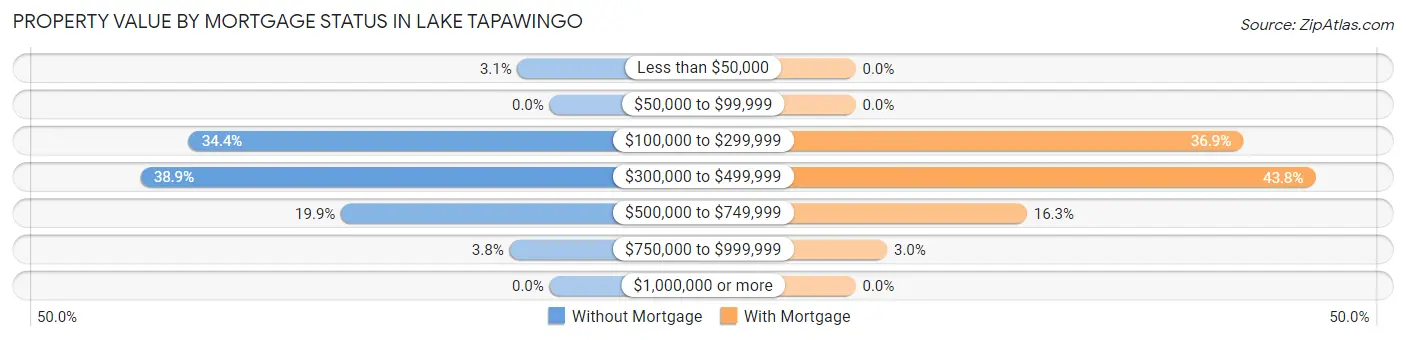
| Property Value | Without Mortgage | With Mortgage |
| Less than $50,000 | 4 (3.0%) | 0 (0.0%) |
| $50,000 to $99,999 | 0 (0.0%) | 0 (0.0%) |
| $100,000 to $299,999 | 45 (34.4%) | 86 (36.9%) |
| $300,000 to $499,999 | 51 (38.9%) | 102 (43.8%) |
| $500,000 to $749,999 | 26 (19.9%) | 38 (16.3%) |
| $750,000 to $999,999 | 5 (3.8%) | 7 (3.0%) |
| $1,000,000 or more | 0 (0.0%) | 0 (0.0%) |
| Total | 131 (100.0%) | 233 (100.0%) |
Household Income by Mortgage Status in Lake Tapawingo
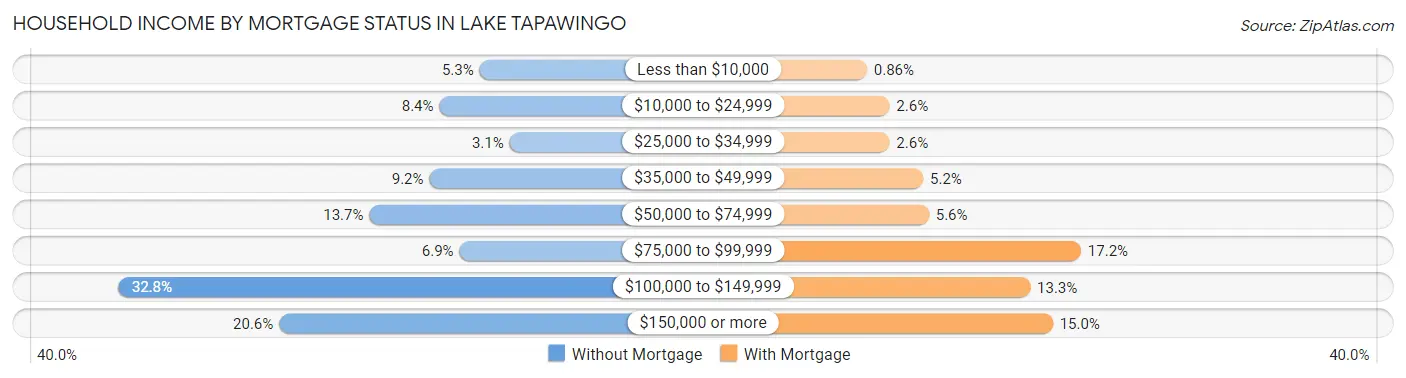
| Household Income | Without Mortgage | With Mortgage |
| Less than $10,000 | 7 (5.3%) | 2 (0.9%) |
| $10,000 to $24,999 | 11 (8.4%) | 6 (2.6%) |
| $25,000 to $34,999 | 4 (3.0%) | 6 (2.6%) |
| $35,000 to $49,999 | 12 (9.2%) | 12 (5.1%) |
| $50,000 to $74,999 | 18 (13.7%) | 13 (5.6%) |
| $75,000 to $99,999 | 9 (6.9%) | 40 (17.2%) |
| $100,000 to $149,999 | 43 (32.8%) | 31 (13.3%) |
| $150,000 or more | 27 (20.6%) | 35 (15.0%) |
| Total | 131 (100.0%) | 233 (100.0%) |
Property Value to Household Income Ratio in Lake Tapawingo
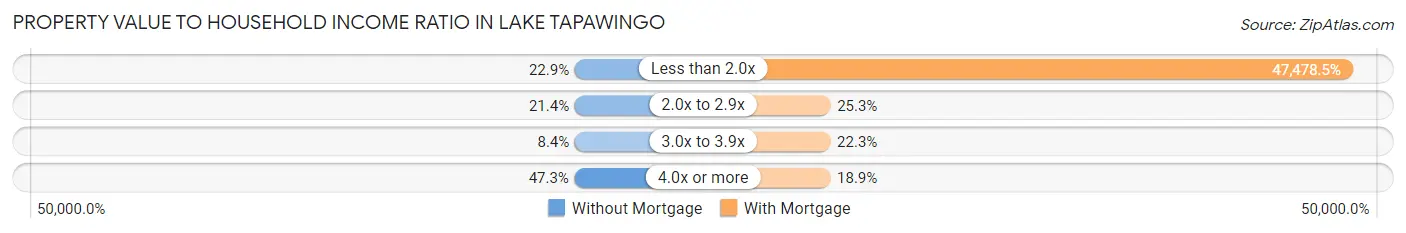
| Value-to-Income Ratio | Without Mortgage | With Mortgage |
| Less than 2.0x | 30 (22.9%) | 110,625 (47,478.5%) |
| 2.0x to 2.9x | 28 (21.4%) | 59 (25.3%) |
| 3.0x to 3.9x | 11 (8.4%) | 52 (22.3%) |
| 4.0x or more | 62 (47.3%) | 44 (18.9%) |
| Total | 131 (100.0%) | 233 (100.0%) |
Real Estate Taxes by Mortgage Status in Lake Tapawingo
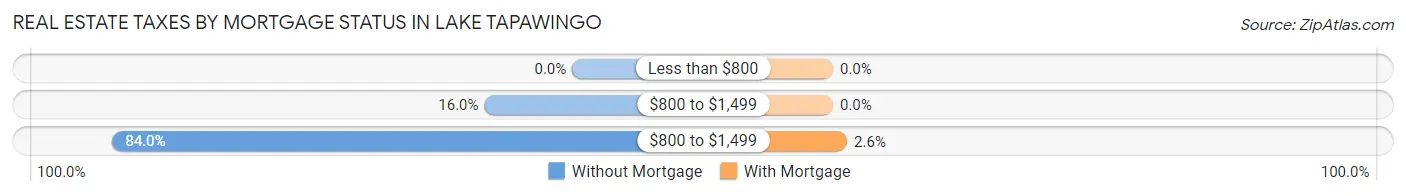
| Property Taxes | Without Mortgage | With Mortgage |
| Less than $800 | 0 (0.0%) | 0 (0.0%) |
| $800 to $1,499 | 21 (16.0%) | 0 (0.0%) |
| $800 to $1,499 | 110 (84.0%) | 6 (2.6%) |
| Total | 131 (100.0%) | 233 (100.0%) |
Health & Disability in Lake Tapawingo
Health Insurance Coverage by Age in Lake Tapawingo
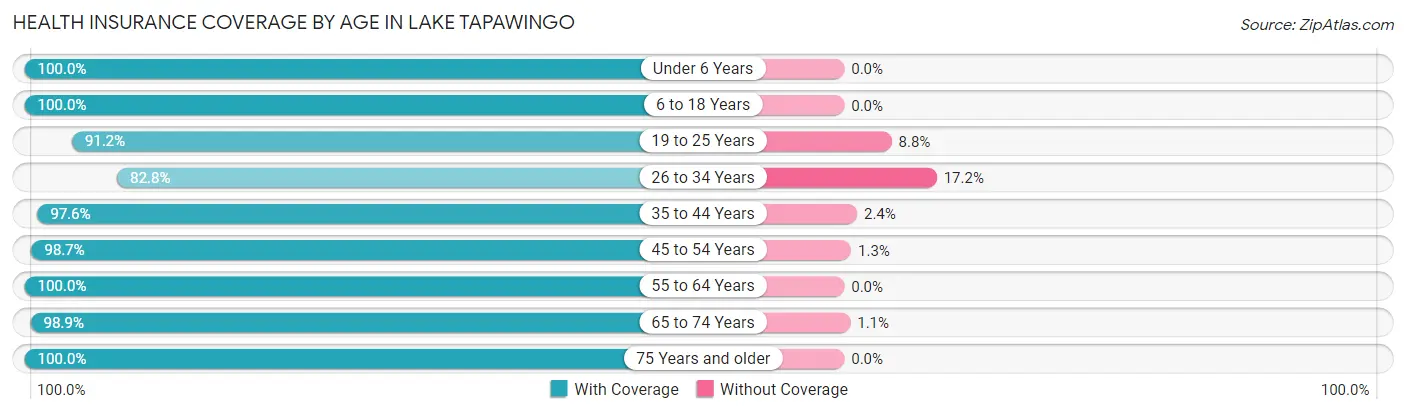
| Age Bracket | With Coverage | Without Coverage |
| Under 6 Years | 26 (100.0%) | 0 (0.0%) |
| 6 to 18 Years | 117 (100.0%) | 0 (0.0%) |
| 19 to 25 Years | 31 (91.2%) | 3 (8.8%) |
| 26 to 34 Years | 24 (82.8%) | 5 (17.2%) |
| 35 to 44 Years | 82 (97.6%) | 2 (2.4%) |
| 45 to 54 Years | 155 (98.7%) | 2 (1.3%) |
| 55 to 64 Years | 147 (100.0%) | 0 (0.0%) |
| 65 to 74 Years | 177 (98.9%) | 2 (1.1%) |
| 75 Years and older | 98 (100.0%) | 0 (0.0%) |
| Total | 857 (98.4%) | 14 (1.6%) |
Health Insurance Coverage by Citizenship Status in Lake Tapawingo
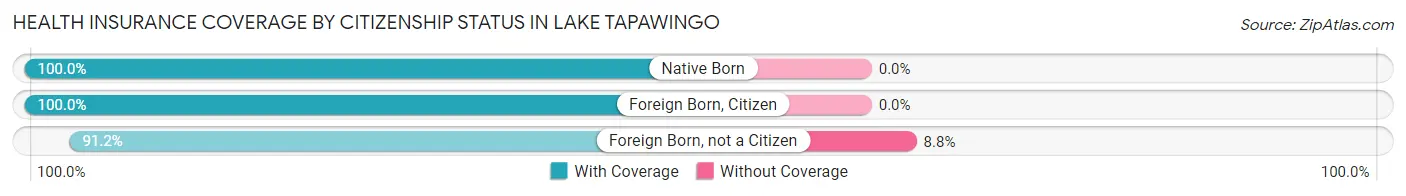
| Citizenship Status | With Coverage | Without Coverage |
| Native Born | 26 (100.0%) | 0 (0.0%) |
| Foreign Born, Citizen | 117 (100.0%) | 0 (0.0%) |
| Foreign Born, not a Citizen | 31 (91.2%) | 3 (8.8%) |
Health Insurance Coverage by Household Income in Lake Tapawingo
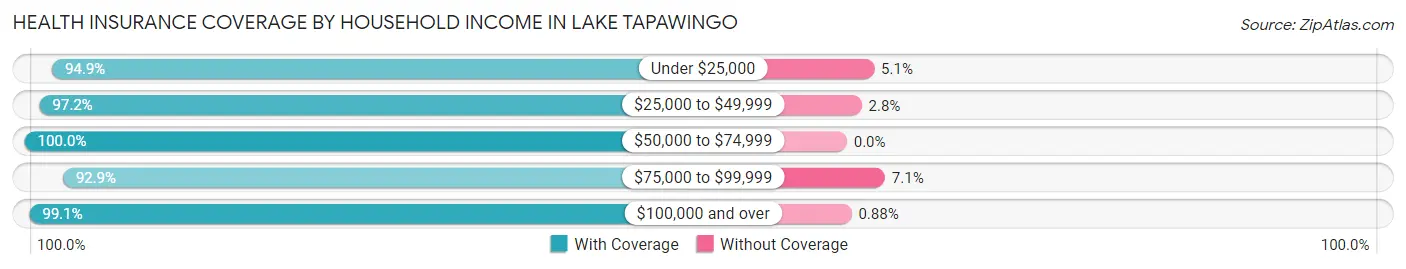
| Household Income | With Coverage | Without Coverage |
| Under $25,000 | 37 (94.9%) | 2 (5.1%) |
| $25,000 to $49,999 | 70 (97.2%) | 2 (2.8%) |
| $50,000 to $74,999 | 119 (100.0%) | 0 (0.0%) |
| $75,000 to $99,999 | 65 (92.9%) | 5 (7.1%) |
| $100,000 and over | 566 (99.1%) | 5 (0.9%) |
Public vs Private Health Insurance Coverage by Age in Lake Tapawingo
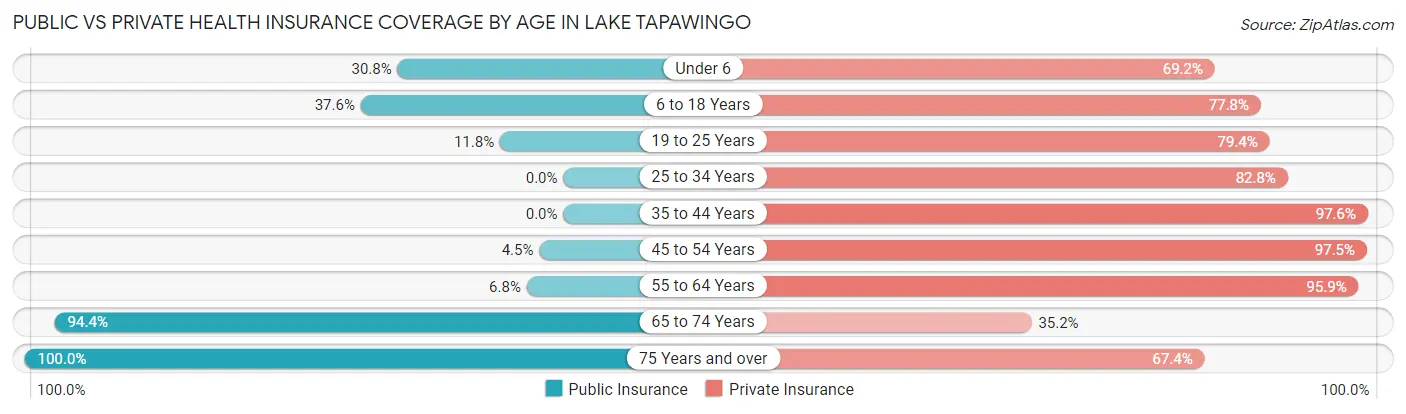
| Age Bracket | Public Insurance | Private Insurance |
| Under 6 | 8 (30.8%) | 18 (69.2%) |
| 6 to 18 Years | 44 (37.6%) | 91 (77.8%) |
| 19 to 25 Years | 4 (11.8%) | 27 (79.4%) |
| 25 to 34 Years | 0 (0.0%) | 24 (82.8%) |
| 35 to 44 Years | 0 (0.0%) | 82 (97.6%) |
| 45 to 54 Years | 7 (4.5%) | 153 (97.5%) |
| 55 to 64 Years | 10 (6.8%) | 141 (95.9%) |
| 65 to 74 Years | 169 (94.4%) | 63 (35.2%) |
| 75 Years and over | 98 (100.0%) | 66 (67.3%) |
| Total | 340 (39.0%) | 665 (76.3%) |
Disability Status by Sex by Age in Lake Tapawingo
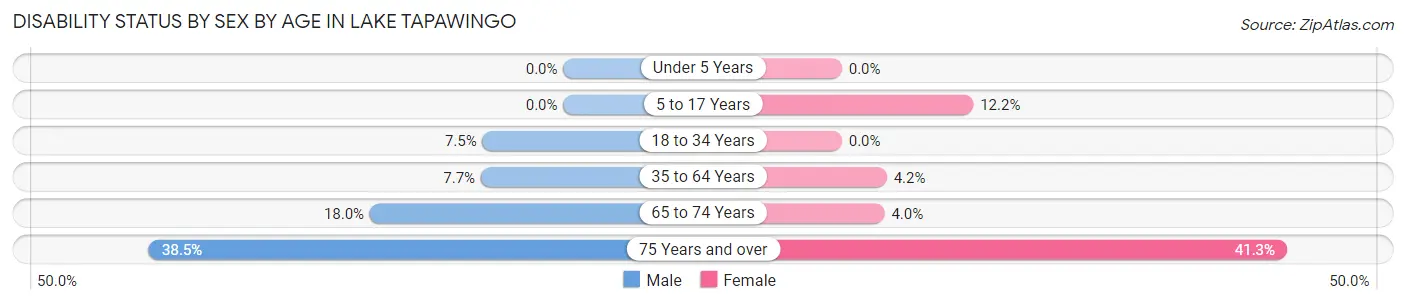
| Age Bracket | Male | Female |
| Under 5 Years | 0 (0.0%) | 0 (0.0%) |
| 5 to 17 Years | 0 (0.0%) | 5 (12.2%) |
| 18 to 34 Years | 3 (7.5%) | 0 (0.0%) |
| 35 to 64 Years | 15 (7.6%) | 8 (4.2%) |
| 65 to 74 Years | 14 (17.9%) | 4 (4.0%) |
| 75 Years and over | 20 (38.5%) | 19 (41.3%) |
Disability Class by Sex by Age in Lake Tapawingo
Disability Class: Hearing Difficulty
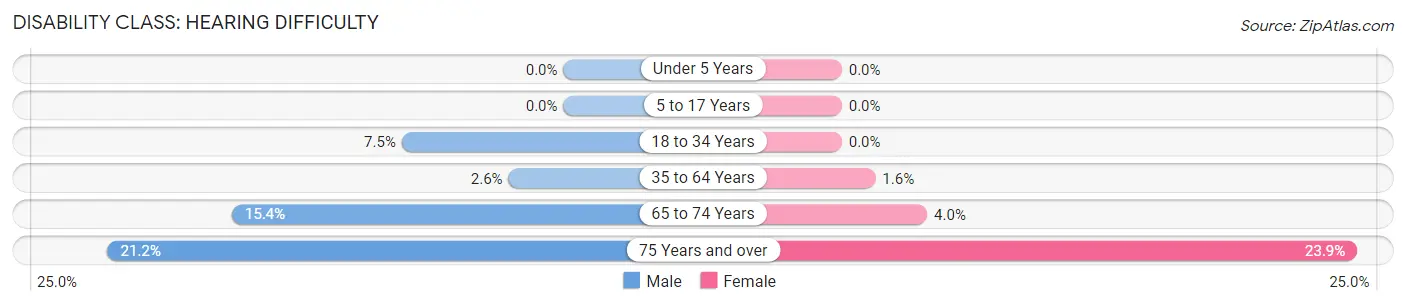
| Age Bracket | Male | Female |
| Under 5 Years | 0 (0.0%) | 0 (0.0%) |
| 5 to 17 Years | 0 (0.0%) | 0 (0.0%) |
| 18 to 34 Years | 3 (7.5%) | 0 (0.0%) |
| 35 to 64 Years | 5 (2.5%) | 3 (1.6%) |
| 65 to 74 Years | 12 (15.4%) | 4 (4.0%) |
| 75 Years and over | 11 (21.1%) | 11 (23.9%) |
Disability Class: Vision Difficulty
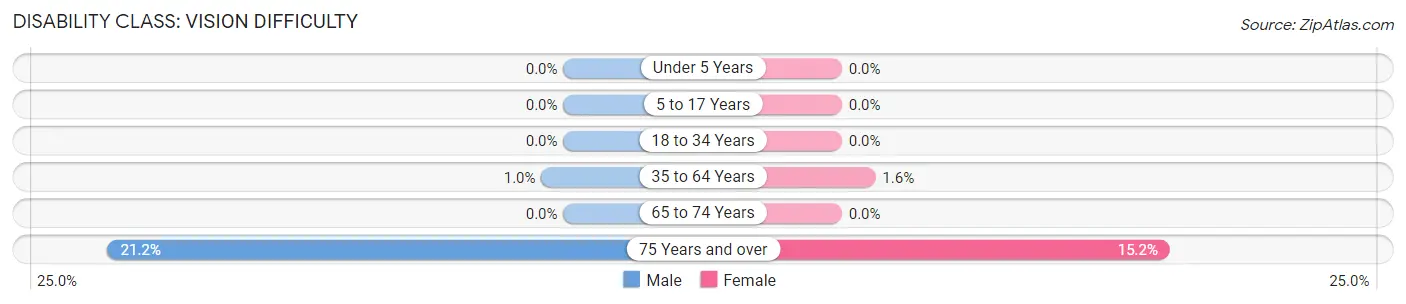
| Age Bracket | Male | Female |
| Under 5 Years | 0 (0.0%) | 0 (0.0%) |
| 5 to 17 Years | 0 (0.0%) | 0 (0.0%) |
| 18 to 34 Years | 0 (0.0%) | 0 (0.0%) |
| 35 to 64 Years | 2 (1.0%) | 3 (1.6%) |
| 65 to 74 Years | 0 (0.0%) | 0 (0.0%) |
| 75 Years and over | 11 (21.1%) | 7 (15.2%) |
Disability Class: Cognitive Difficulty
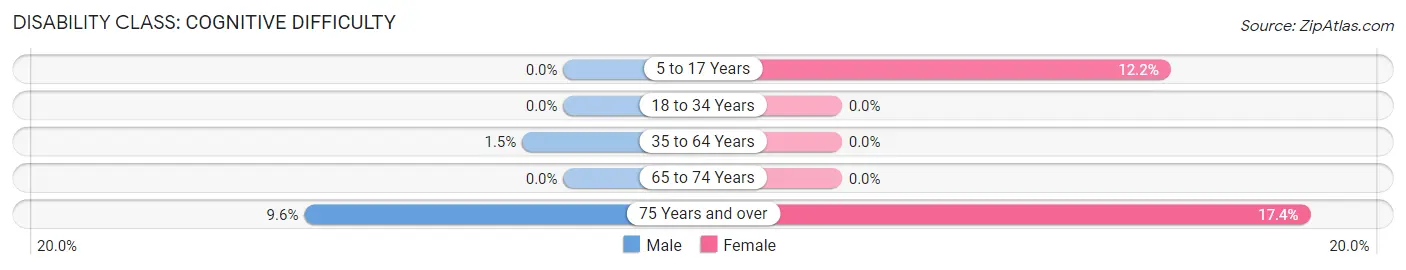
| Age Bracket | Male | Female |
| 5 to 17 Years | 0 (0.0%) | 5 (12.2%) |
| 18 to 34 Years | 0 (0.0%) | 0 (0.0%) |
| 35 to 64 Years | 3 (1.5%) | 0 (0.0%) |
| 65 to 74 Years | 0 (0.0%) | 0 (0.0%) |
| 75 Years and over | 5 (9.6%) | 8 (17.4%) |
Disability Class: Ambulatory Difficulty
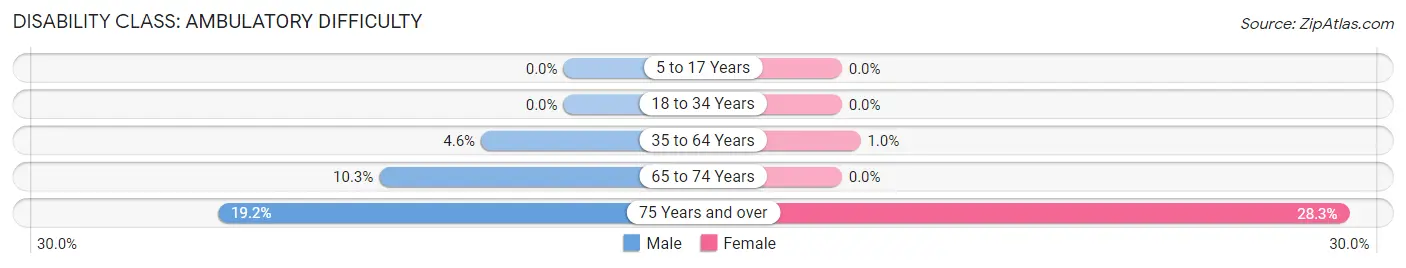
| Age Bracket | Male | Female |
| 5 to 17 Years | 0 (0.0%) | 0 (0.0%) |
| 18 to 34 Years | 0 (0.0%) | 0 (0.0%) |
| 35 to 64 Years | 9 (4.6%) | 2 (1.0%) |
| 65 to 74 Years | 8 (10.3%) | 0 (0.0%) |
| 75 Years and over | 10 (19.2%) | 13 (28.3%) |
Disability Class: Self-Care Difficulty
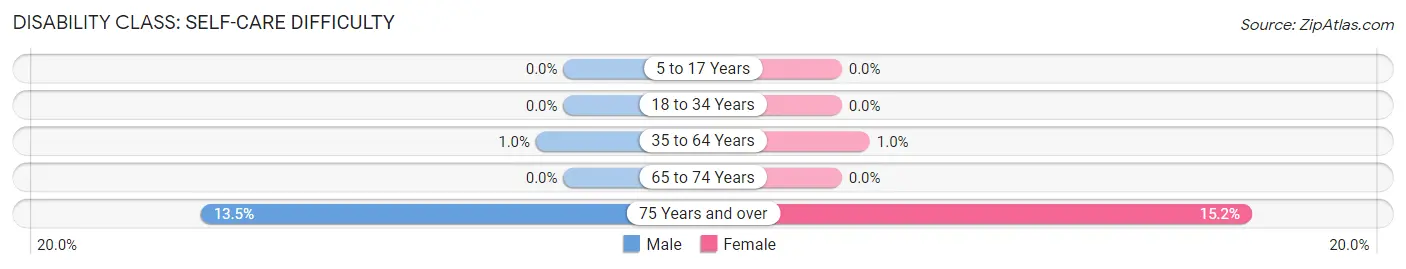
| Age Bracket | Male | Female |
| 5 to 17 Years | 0 (0.0%) | 0 (0.0%) |
| 18 to 34 Years | 0 (0.0%) | 0 (0.0%) |
| 35 to 64 Years | 2 (1.0%) | 2 (1.0%) |
| 65 to 74 Years | 0 (0.0%) | 0 (0.0%) |
| 75 Years and over | 7 (13.5%) | 7 (15.2%) |
Technology Access in Lake Tapawingo
Computing Device Access in Lake Tapawingo
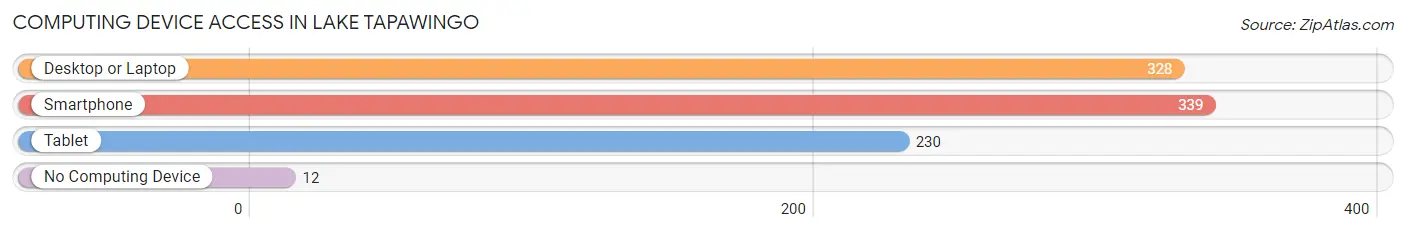
| Device Type | # Households | % Households |
| Desktop or Laptop | 328 | 85.2% |
| Smartphone | 339 | 88.0% |
| Tablet | 230 | 59.7% |
| No Computing Device | 12 | 3.1% |
| Total | 385 | 100.0% |
Internet Access in Lake Tapawingo
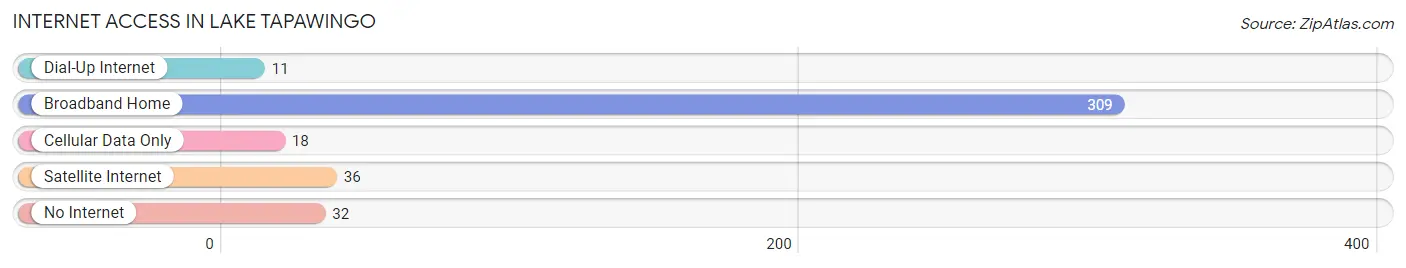
| Internet Type | # Households | % Households |
| Dial-Up Internet | 11 | 2.9% |
| Broadband Home | 309 | 80.3% |
| Cellular Data Only | 18 | 4.7% |
| Satellite Internet | 36 | 9.3% |
| No Internet | 32 | 8.3% |
| Total | 385 | 100.0% |
Lake Tapawingo Summary
History
The history of Lake Tapawingo, Missouri dates back to the early 1800s when the area was first settled by Native Americans. The area was originally part of the Osage Nation, and the first settlers were French fur traders. The area was later settled by German immigrants in the mid-1800s, and the town of Lake Tapawingo was officially established in 1876.
The town was named after the nearby lake, which was named after a Native American chief. The lake was a popular spot for fishing and swimming, and the town quickly grew in popularity as a summer resort destination. The town was also known for its mineral springs, which were believed to have healing properties.
In the early 1900s, the town began to experience a decline in popularity as a resort destination. This was due to the increasing popularity of nearby cities such as Kansas City and St. Louis. However, the town still remained a popular spot for fishing and swimming.
In the 1950s, the town experienced a resurgence in popularity as a summer resort destination. This was due to the construction of a new dam on the lake, which created a larger and deeper lake. This allowed for more recreational activities such as boating and water skiing.
The town has continued to grow and develop over the years, and today it is a popular destination for both locals and tourists alike.
Geography
Lake Tapawingo is located in Jackson County, Missouri, approximately 25 miles east of Kansas City. The town is situated on the banks of the Lake Tapawingo reservoir, which was created in the 1950s by the construction of a dam. The lake is approximately 1,000 acres in size and is a popular spot for fishing, swimming, and other recreational activities.
The town is surrounded by rolling hills and wooded areas, and is home to a variety of wildlife. The area is also known for its mineral springs, which are believed to have healing properties.
Economy
The economy of Lake Tapawingo is largely based on tourism. The town is a popular destination for both locals and tourists alike, and the lake is a popular spot for fishing, swimming, and other recreational activities. The town also has a number of restaurants, bars, and shops that cater to tourists.
The town is also home to a number of small businesses, including a marina, a golf course, and a number of bed and breakfasts.
Demographics
As of the 2010 census, the population of Lake Tapawingo was 1,845. The town is predominantly white, with approximately 95% of the population being white. The median household income is $50,000, and the median age is 44.
Conclusion
Lake Tapawingo, Missouri is a small town with a rich history and a vibrant economy. The town is a popular destination for both locals and tourists alike, and the lake is a popular spot for fishing, swimming, and other recreational activities. The town is also home to a number of small businesses, including a marina, a golf course, and a number of bed and breakfasts. The population of the town is predominantly white, with a median household income of $50,000 and a median age of 44.
Common Questions
What is the Total Population of Lake Tapawingo?
Total Population of Lake Tapawingo is 871.
What is the Total Male Population of Lake Tapawingo?
Total Male Population of Lake Tapawingo is 447.
What is the Total Female Population of Lake Tapawingo?
Total Female Population of Lake Tapawingo is 424.
What is the Ratio of Males per 100 Females in Lake Tapawingo?
There are 105.42 Males per 100 Females in Lake Tapawingo.
What is the Ratio of Females per 100 Males in Lake Tapawingo?
There are 94.85 Females per 100 Males in Lake Tapawingo.
What is the Median Population Age in Lake Tapawingo?
Median Population Age in Lake Tapawingo is 54.5 Years.
What is the Average Family Size in Lake Tapawingo
Average Family Size in Lake Tapawingo is 2.8 People.
What is the Average Household Size in Lake Tapawingo
Average Household Size in Lake Tapawingo is 2.3 People.
What is Per Capita Income in Lake Tapawingo?
Per Capita income in Lake Tapawingo is $57,278.
What is the Median Family Income in Lake Tapawingo?
Median Family Income in Lake Tapawingo is $148,125.
What is the Median Household income in Lake Tapawingo?
Median Household Income in Lake Tapawingo is $110,625.
What is Income or Wage Gap in Lake Tapawingo?
Income or Wage Gap in Lake Tapawingo is 51.9%.
Women in Lake Tapawingo earn 48.1 cents for every dollar earned by a man.
What is Inequality or Gini Index in Lake Tapawingo?
Inequality or Gini Index in Lake Tapawingo is 0.40.
How Large is the Labor Force in Lake Tapawingo?
There are 469 People in the Labor Forcein in Lake Tapawingo.
What is the Percentage of People in the Labor Force in Lake Tapawingo?
61.6% of People are in the Labor Force in Lake Tapawingo.
What is the Unemployment Rate in Lake Tapawingo?
Unemployment Rate in Lake Tapawingo is 5.8%.