Monroe City, MO
Monroe City Map
Monroe City Overview
3,176
TOTAL POPULATION
1,591
MALE POPULATION
1,585
FEMALE POPULATION
100.38
MALES / 100 FEMALES
99.62
FEMALES / 100 MALES
40.1
MEDIAN AGE
3.3
AVG FAMILY SIZE
2.7
AVG HOUSEHOLD SIZE
$25,959
PER CAPITA INCOME
$71,346
AVG FAMILY INCOME
$50,885
AVG HOUSEHOLD INCOME
12.7%
WAGE / INCOME GAP [ % ]
87.3¢/ $1
WAGE / INCOME GAP [ $ ]
0.43
INEQUALITY / GINI INDEX
1,448
LABOR FORCE [ PEOPLE ]
59.2%
PERCENT IN LABOR FORCE
0.5%
UNEMPLOYMENT RATE
Monroe City Zip Codes
Monroe City Area Codes
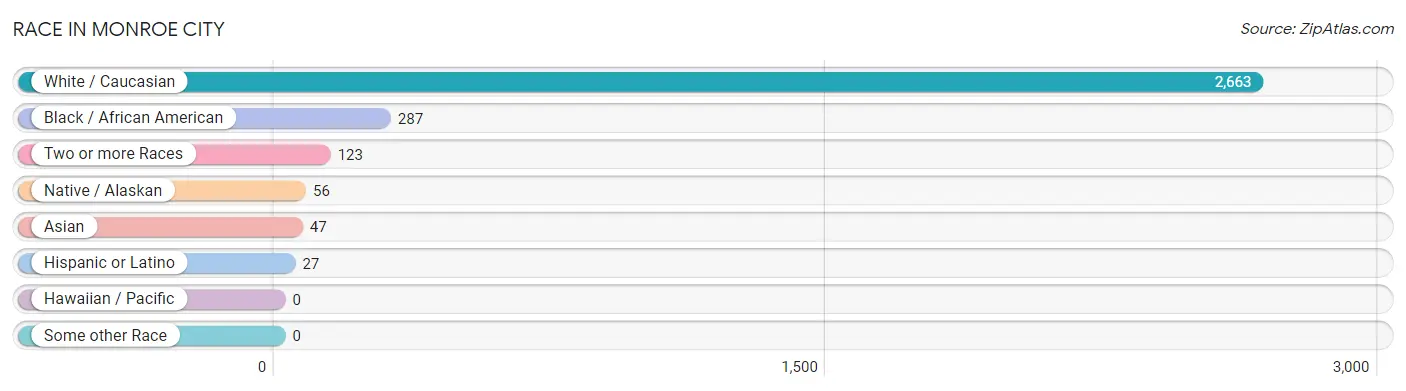
Race in Monroe City
The most populous races in Monroe City are White / Caucasian (2,663 | 83.9%), Black / African American (287 | 9.0%), and Two or more Races (123 | 3.9%).
| Race | # Population | % Population |
| Asian | 47 | 1.5% |
| Black / African American | 287 | 9.0% |
| Hawaiian / Pacific | 0 | 0.0% |
| Hispanic or Latino | 27 | 0.9% |
| Native / Alaskan | 56 | 1.8% |
| White / Caucasian | 2,663 | 83.9% |
| Two or more Races | 123 | 3.9% |
| Some other Race | 0 | 0.0% |
| Total | 3,176 | 100.0% |
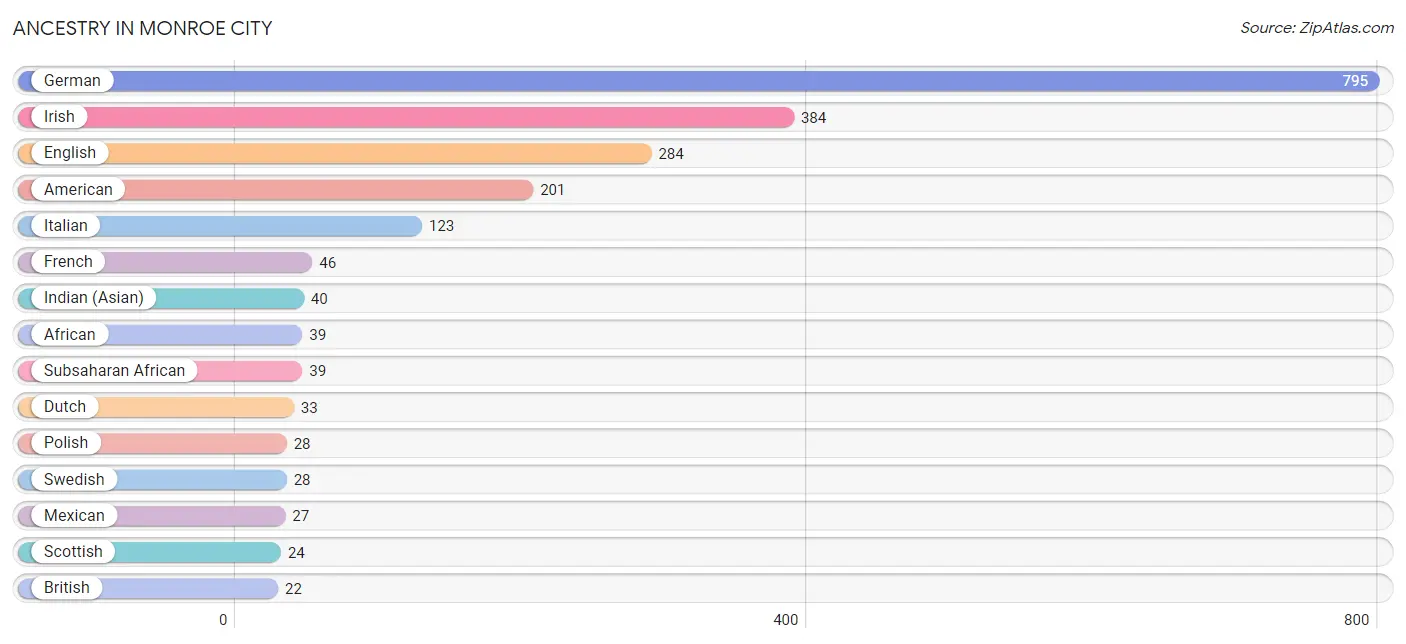
Ancestry in Monroe City
The most populous ancestries reported in Monroe City are German (795 | 25.0%), Irish (384 | 12.1%), English (284 | 8.9%), American (201 | 6.3%), and Italian (123 | 3.9%), together accounting for 56.3% of all Monroe City residents.
| Ancestry | # Population | % Population |
| African | 39 | 1.2% |
| American | 201 | 6.3% |
| Austrian | 3 | 0.1% |
| Blackfeet | 2 | 0.1% |
| British | 22 | 0.7% |
| Cherokee | 6 | 0.2% |
| Czech | 7 | 0.2% |
| Dutch | 33 | 1.0% |
| English | 284 | 8.9% |
| French | 46 | 1.5% |
| French Canadian | 22 | 0.7% |
| German | 795 | 25.0% |
| Indian (Asian) | 40 | 1.3% |
| Irish | 384 | 12.1% |
| Italian | 123 | 3.9% |
| Korean | 10 | 0.3% |
| Mexican | 27 | 0.9% |
| Polish | 28 | 0.9% |
| Potawatomi | 5 | 0.2% |
| Scotch-Irish | 16 | 0.5% |
| Scottish | 24 | 0.8% |
| Subsaharan African | 39 | 1.2% |
| Swedish | 28 | 0.9% |
| Thai | 1 | 0.0% |
| Ukrainian | 7 | 0.2% |
| Yugoslavian | 7 | 0.2% | View All 26 Rows |
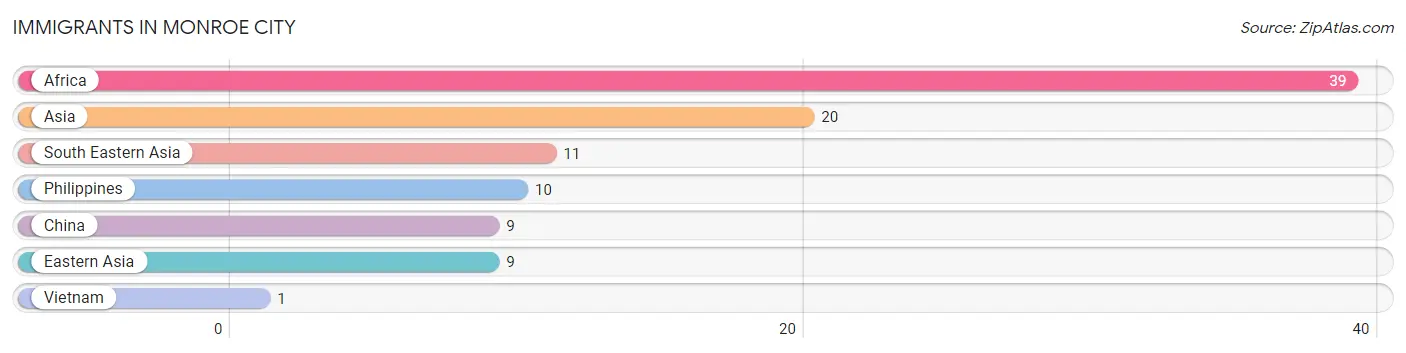
Immigrants in Monroe City
The most numerous immigrant groups reported in Monroe City came from Africa (39 | 1.2%), Asia (20 | 0.6%), South Eastern Asia (11 | 0.4%), Philippines (10 | 0.3%), and China (9 | 0.3%), together accounting for 2.8% of all Monroe City residents.
| Immigration Origin | # Population | % Population |
| Africa | 39 | 1.2% |
| Asia | 20 | 0.6% |
| China | 9 | 0.3% |
| Eastern Asia | 9 | 0.3% |
| Philippines | 10 | 0.3% |
| South Eastern Asia | 11 | 0.4% |
| Vietnam | 1 | 0.0% | View All 7 Rows |
Sex and Age in Monroe City
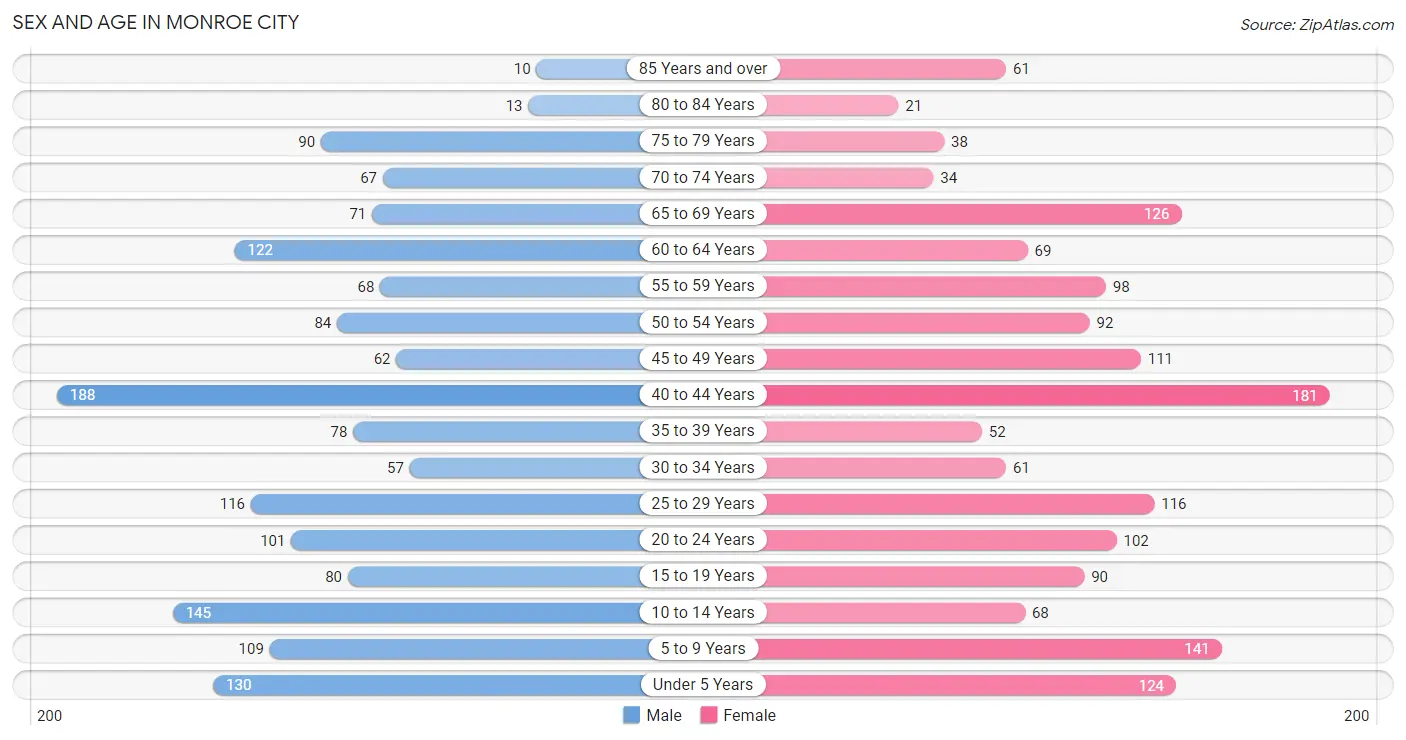
Sex and Age in Monroe City
The most populous age groups in Monroe City are 40 to 44 Years (188 | 11.8%) for men and 40 to 44 Years (181 | 11.4%) for women.
| Age Bracket | Male | Female |
| Under 5 Years | 130 (8.2%) | 124 (7.8%) |
| 5 to 9 Years | 109 (6.9%) | 141 (8.9%) |
| 10 to 14 Years | 145 (9.1%) | 68 (4.3%) |
| 15 to 19 Years | 80 (5.0%) | 90 (5.7%) |
| 20 to 24 Years | 101 (6.4%) | 102 (6.4%) |
| 25 to 29 Years | 116 (7.3%) | 116 (7.3%) |
| 30 to 34 Years | 57 (3.6%) | 61 (3.8%) |
| 35 to 39 Years | 78 (4.9%) | 52 (3.3%) |
| 40 to 44 Years | 188 (11.8%) | 181 (11.4%) |
| 45 to 49 Years | 62 (3.9%) | 111 (7.0%) |
| 50 to 54 Years | 84 (5.3%) | 92 (5.8%) |
| 55 to 59 Years | 68 (4.3%) | 98 (6.2%) |
| 60 to 64 Years | 122 (7.7%) | 69 (4.3%) |
| 65 to 69 Years | 71 (4.5%) | 126 (8.0%) |
| 70 to 74 Years | 67 (4.2%) | 34 (2.1%) |
| 75 to 79 Years | 90 (5.7%) | 38 (2.4%) |
| 80 to 84 Years | 13 (0.8%) | 21 (1.3%) |
| 85 Years and over | 10 (0.6%) | 61 (3.8%) |
| Total | 1,591 (100.0%) | 1,585 (100.0%) |
Families and Households in Monroe City
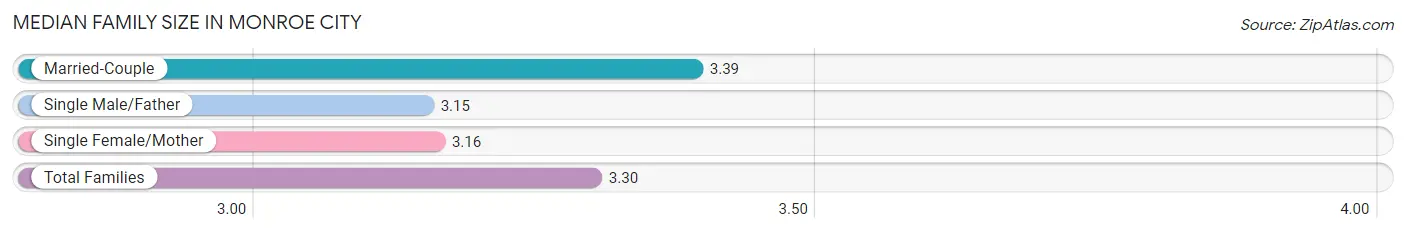
Median Family Size in Monroe City
The median family size in Monroe City is 3.30 persons per family, with married-couple families (487 | 63.4%) accounting for the largest median family size of 3.39 persons per family. On the other hand, single male/father families (79 | 10.3%) represent the smallest median family size with 3.15 persons per family.
| Family Type | # Families | Family Size |
| Married-Couple | 487 (63.4%) | 3.39 |
| Single Male/Father | 79 (10.3%) | 3.15 |
| Single Female/Mother | 202 (26.3%) | 3.16 |
| Total Families | 768 (100.0%) | 3.30 |
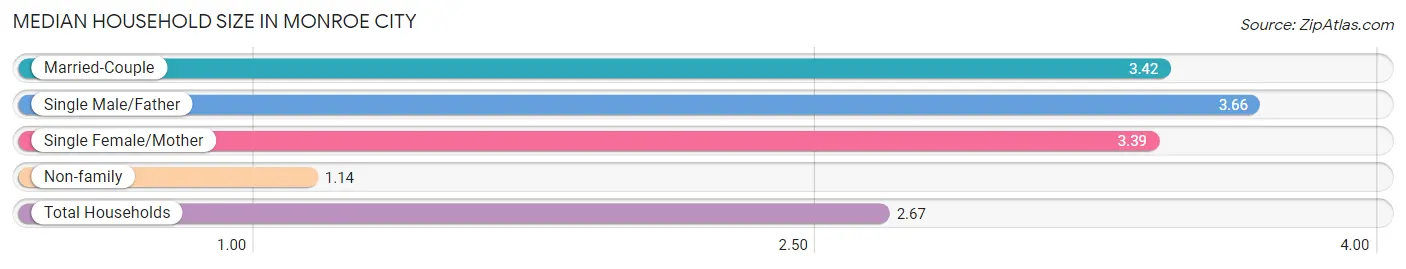
Median Household Size in Monroe City
The median household size in Monroe City is 2.67 persons per household, with single male/father households (79 | 6.8%) accounting for the largest median household size of 3.66 persons per household. non-family households (388 | 33.6%) represent the smallest median household size with 1.14 persons per household.
| Household Type | # Households | Household Size |
| Married-Couple | 487 (42.1%) | 3.42 |
| Single Male/Father | 79 (6.8%) | 3.66 |
| Single Female/Mother | 202 (17.5%) | 3.39 |
| Non-family | 388 (33.6%) | 1.14 |
| Total Households | 1,156 (100.0%) | 2.67 |
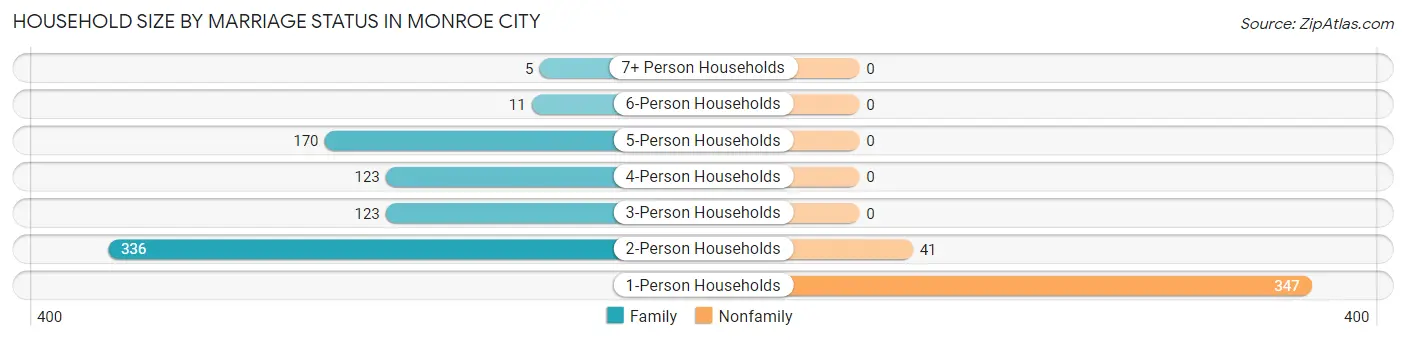
Household Size by Marriage Status in Monroe City
Out of a total of 1,156 households in Monroe City, 768 (66.4%) are family households, while 388 (33.6%) are nonfamily households. The most numerous type of family households are 2-person households, comprising 336, and the most common type of nonfamily households are 1-person households, comprising 347.
| Household Size | Family Households | Nonfamily Households |
| 1-Person Households | - | 347 (30.0%) |
| 2-Person Households | 336 (29.1%) | 41 (3.5%) |
| 3-Person Households | 123 (10.6%) | 0 (0.0%) |
| 4-Person Households | 123 (10.6%) | 0 (0.0%) |
| 5-Person Households | 170 (14.7%) | 0 (0.0%) |
| 6-Person Households | 11 (0.9%) | 0 (0.0%) |
| 7+ Person Households | 5 (0.4%) | 0 (0.0%) |
| Total | 768 (66.4%) | 388 (33.6%) |
Female Fertility in Monroe City
Fertility by Age in Monroe City
Average fertility rate in Monroe City is 25.0 births per 1,000 women. Women in the age bracket of 20 to 34 years have the highest fertility rate with 65.0 births per 1,000 women. Women in the age bracket of 20 to 34 years acount for 100.0% of all women with births.
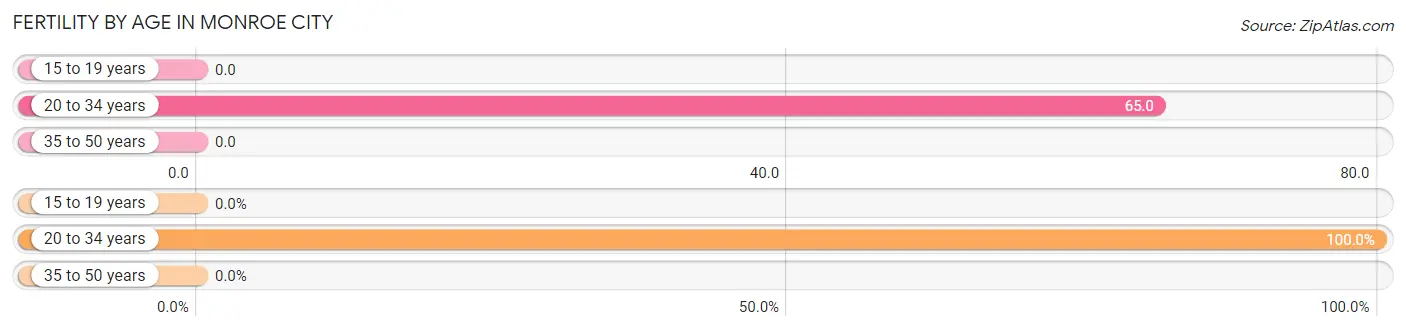
| Age Bracket | Women with Births | Births / 1,000 Women |
| 15 to 19 years | 0 (0.0%) | 0.0 |
| 20 to 34 years | 18 (100.0%) | 65.0 |
| 35 to 50 years | 0 (0.0%) | 0.0 |
| Total | 18 (100.0%) | 25.0 |
Fertility by Age by Marriage Status in Monroe City
38.9% of women with births (18) in Monroe City are married. The highest percentage of unmarried women with births falls into 20 to 34 years age bracket with 61.1% of them unmarried at the time of birth, while the lowest percentage of unmarried women with births belong to 20 to 34 years age bracket with 61.1% of them unmarried.
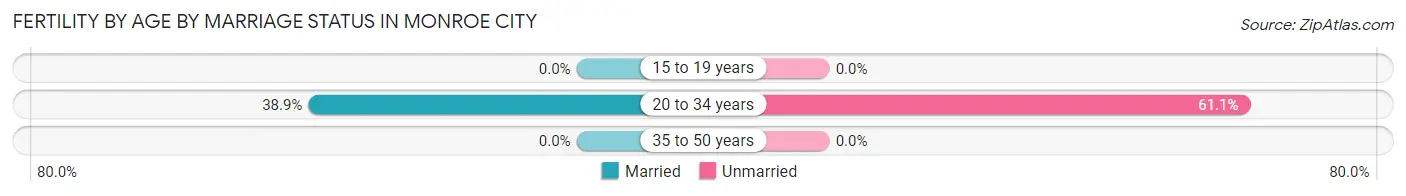
| Age Bracket | Married | Unmarried |
| 15 to 19 years | 0 (0.0%) | 0 (0.0%) |
| 20 to 34 years | 7 (38.9%) | 11 (61.1%) |
| 35 to 50 years | 0 (0.0%) | 0 (0.0%) |
| Total | 7 (38.9%) | 11 (61.1%) |
Fertility by Education in Monroe City
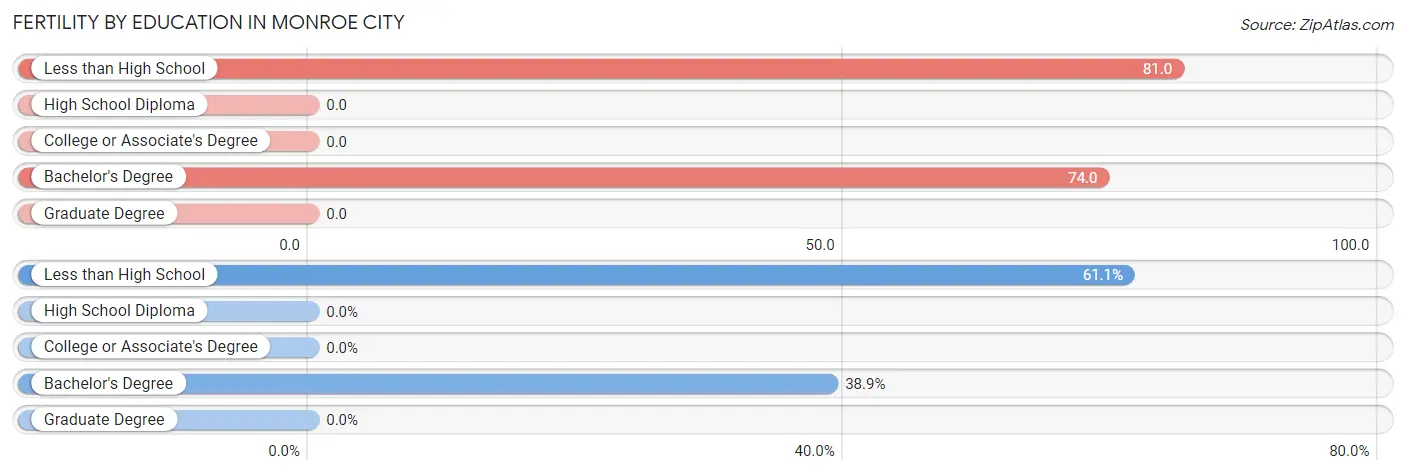
| Educational Attainment | Women with Births | Births / 1,000 Women |
| Less than High School | 11 (61.1%) | 81.0 |
| High School Diploma | 0 (0.0%) | 0.0 |
| College or Associate's Degree | 0 (0.0%) | 0.0 |
| Bachelor's Degree | 7 (38.9%) | 74.0 |
| Graduate Degree | 0 (0.0%) | 0.0 |
| Total | 18 (100.0%) | 25.0 |
Fertility by Education by Marriage Status in Monroe City
61.1% of women with births in Monroe City are unmarried. Women with the educational attainment of bachelor's degree are most likely to be married with 100.0% of them married at childbirth, while women with the educational attainment of less than high school are least likely to be married with 100.0% of them unmarried at childbirth.
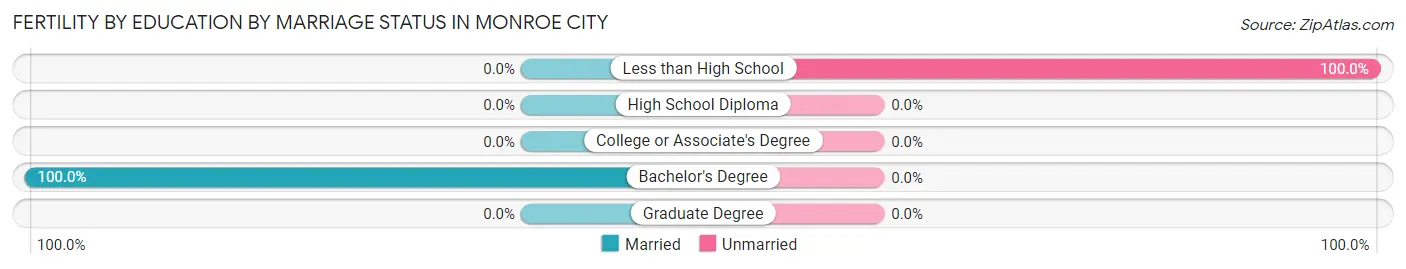
| Educational Attainment | Married | Unmarried |
| Less than High School | 0 (0.0%) | 11 (100.0%) |
| High School Diploma | 0 (0.0%) | 0 (0.0%) |
| College or Associate's Degree | 0 (0.0%) | 0 (0.0%) |
| Bachelor's Degree | 7 (100.0%) | 0 (0.0%) |
| Graduate Degree | 0 (0.0%) | 0 (0.0%) |
| Total | 7 (38.9%) | 11 (61.1%) |
Income in Monroe City
Income Overview in Monroe City
Per Capita Income in Monroe City is $25,959, while median incomes of families and households are $71,346 and $50,885 respectively.
| Characteristic | Number | Measure |
| Per Capita Income | 3,176 | $25,959 |
| Median Family Income | 768 | $71,346 |
| Mean Family Income | 768 | $84,193 |
| Median Household Income | 1,156 | $50,885 |
| Mean Household Income | 1,156 | $68,602 |
| Income Deficit | 768 | $0 |
| Wage / Income Gap (%) | 3,176 | 12.73% |
| Wage / Income Gap ($) | 3,176 | 87.27¢ per $1 |
| Gini / Inequality Index | 3,176 | 0.43 |
Earnings by Sex in Monroe City
Average Earnings in Monroe City are $32,112, $34,810 for men and $30,380 for women, a difference of 12.7%.
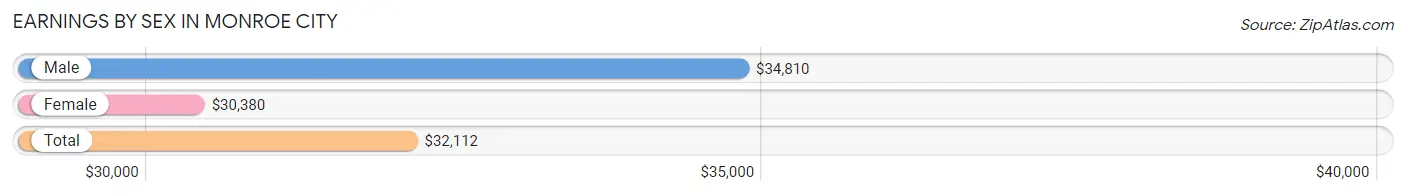
| Sex | Number | Average Earnings |
| Male | 855 (53.6%) | $34,810 |
| Female | 740 (46.4%) | $30,380 |
| Total | 1,595 (100.0%) | $32,112 |
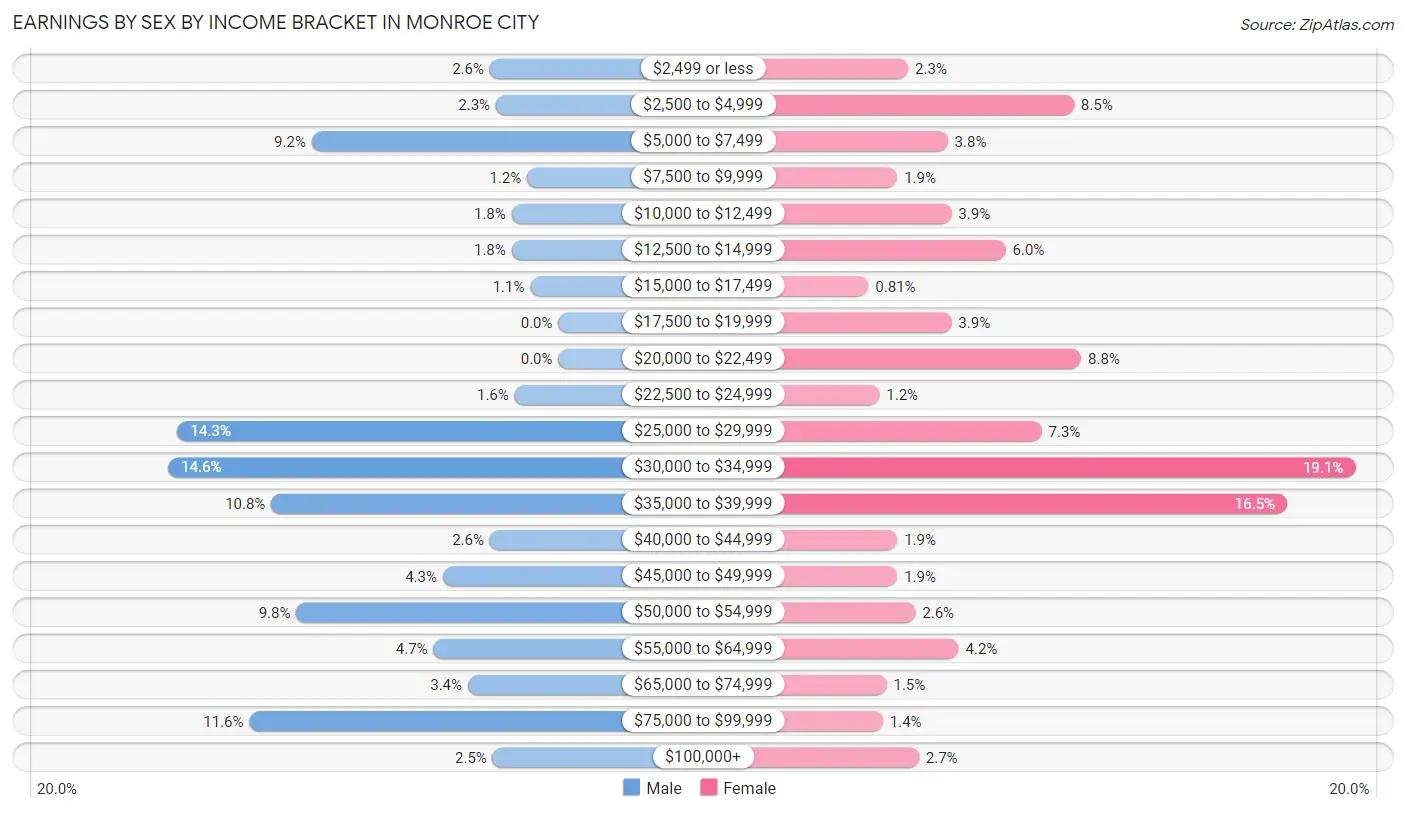
Earnings by Sex by Income Bracket in Monroe City
The most common earnings brackets in Monroe City are $30,000 to $34,999 for men (125 | 14.6%) and $30,000 to $34,999 for women (141 | 19.1%).
| Income | Male | Female |
| $2,499 or less | 22 (2.6%) | 17 (2.3%) |
| $2,500 to $4,999 | 20 (2.3%) | 63 (8.5%) |
| $5,000 to $7,499 | 79 (9.2%) | 28 (3.8%) |
| $7,500 to $9,999 | 10 (1.2%) | 14 (1.9%) |
| $10,000 to $12,499 | 15 (1.8%) | 29 (3.9%) |
| $12,500 to $14,999 | 15 (1.8%) | 44 (5.9%) |
| $15,000 to $17,499 | 9 (1.1%) | 6 (0.8%) |
| $17,500 to $19,999 | 0 (0.0%) | 29 (3.9%) |
| $20,000 to $22,499 | 0 (0.0%) | 65 (8.8%) |
| $22,500 to $24,999 | 14 (1.6%) | 9 (1.2%) |
| $25,000 to $29,999 | 122 (14.3%) | 54 (7.3%) |
| $30,000 to $34,999 | 125 (14.6%) | 141 (19.1%) |
| $35,000 to $39,999 | 92 (10.8%) | 122 (16.5%) |
| $40,000 to $44,999 | 22 (2.6%) | 14 (1.9%) |
| $45,000 to $49,999 | 37 (4.3%) | 14 (1.9%) |
| $50,000 to $54,999 | 84 (9.8%) | 19 (2.6%) |
| $55,000 to $64,999 | 40 (4.7%) | 31 (4.2%) |
| $65,000 to $74,999 | 29 (3.4%) | 11 (1.5%) |
| $75,000 to $99,999 | 99 (11.6%) | 10 (1.3%) |
| $100,000+ | 21 (2.5%) | 20 (2.7%) |
| Total | 855 (100.0%) | 740 (100.0%) |
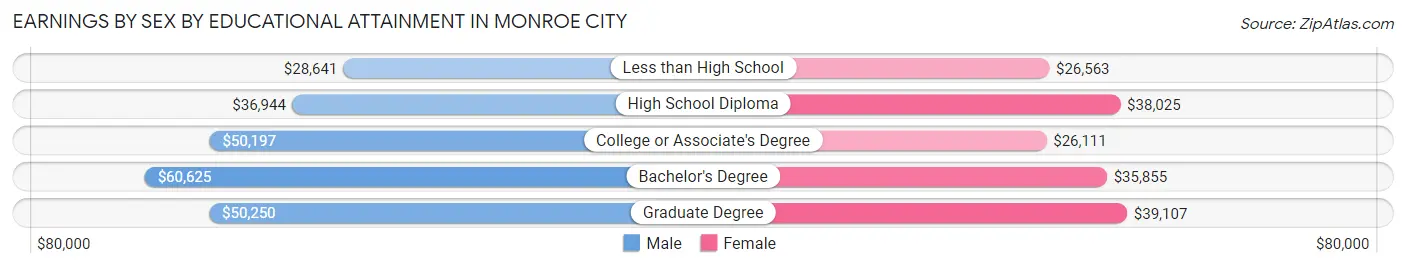
Earnings by Sex by Educational Attainment in Monroe City
Average earnings in Monroe City are $37,288 for men and $31,845 for women, a difference of 14.6%. Men with an educational attainment of bachelor's degree enjoy the highest average annual earnings of $60,625, while those with less than high school education earn the least with $28,641. Women with an educational attainment of graduate degree earn the most with the average annual earnings of $39,107, while those with college or associate's degree education have the smallest earnings of $26,111.
| Educational Attainment | Male Income | Female Income |
| Less than High School | $28,641 | $26,563 |
| High School Diploma | $36,944 | $38,025 |
| College or Associate's Degree | $50,197 | $26,111 |
| Bachelor's Degree | $60,625 | $35,855 |
| Graduate Degree | $50,250 | $39,107 |
| Total | $37,288 | $31,845 |
Family Income in Monroe City
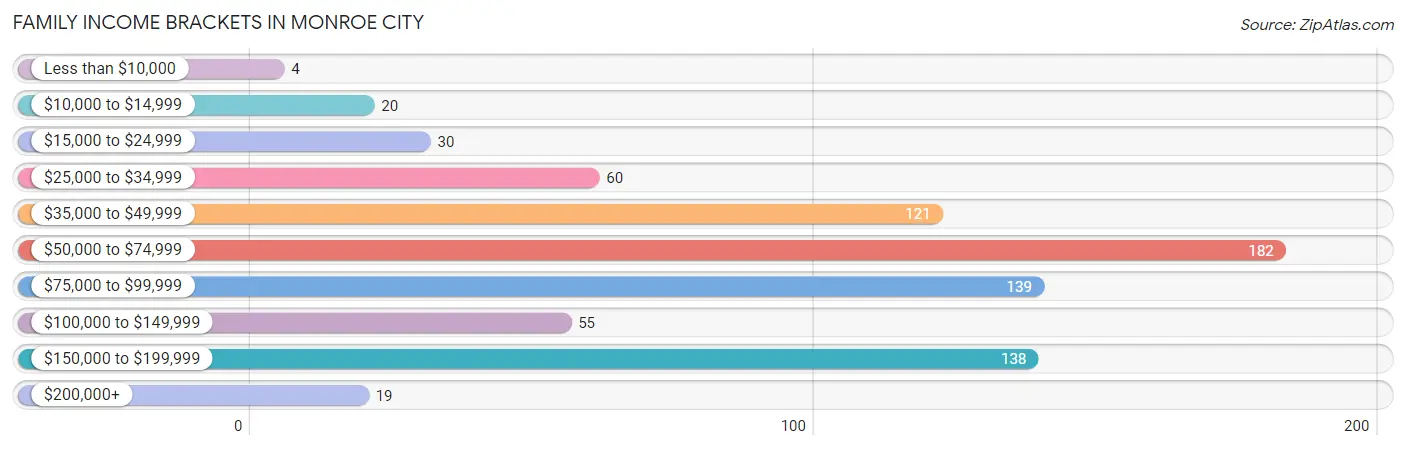
Family Income Brackets in Monroe City
According to the Monroe City family income data, there are 182 families falling into the $50,000 to $74,999 income range, which is the most common income bracket and makes up 23.7% of all families. Conversely, the less than $10,000 income bracket is the least frequent group with only 4 families (0.5%) belonging to this category.
| Income Bracket | # Families | % Families |
| Less than $10,000 | 4 | 0.5% |
| $10,000 to $14,999 | 20 | 2.6% |
| $15,000 to $24,999 | 30 | 3.9% |
| $25,000 to $34,999 | 60 | 7.8% |
| $35,000 to $49,999 | 121 | 15.8% |
| $50,000 to $74,999 | 182 | 23.7% |
| $75,000 to $99,999 | 139 | 18.1% |
| $100,000 to $149,999 | 55 | 7.2% |
| $150,000 to $199,999 | 138 | 18.0% |
| $200,000+ | 19 | 2.5% |
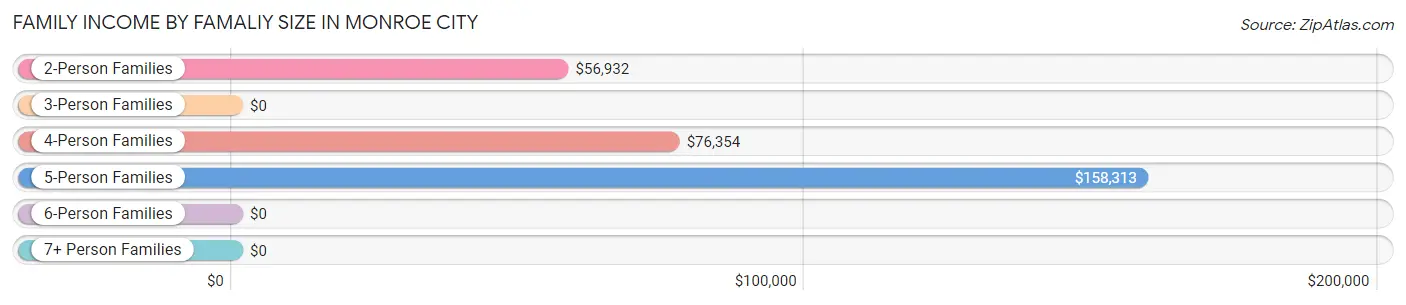
Family Income by Famaliy Size in Monroe City
5-person families (164 | 21.3%) account for the highest median family income in Monroe City with $158,313 per family, while 5-person families (164 | 21.3%) have the highest median income of $31,663 per family member.
| Income Bracket | # Families | Median Income |
| 2-Person Families | 382 (49.7%) | $56,932 |
| 3-Person Families | 113 (14.7%) | $0 |
| 4-Person Families | 93 (12.1%) | $76,354 |
| 5-Person Families | 164 (21.3%) | $158,313 |
| 6-Person Families | 11 (1.4%) | $0 |
| 7+ Person Families | 5 (0.6%) | $0 |
| Total | 768 (100.0%) | $71,346 |
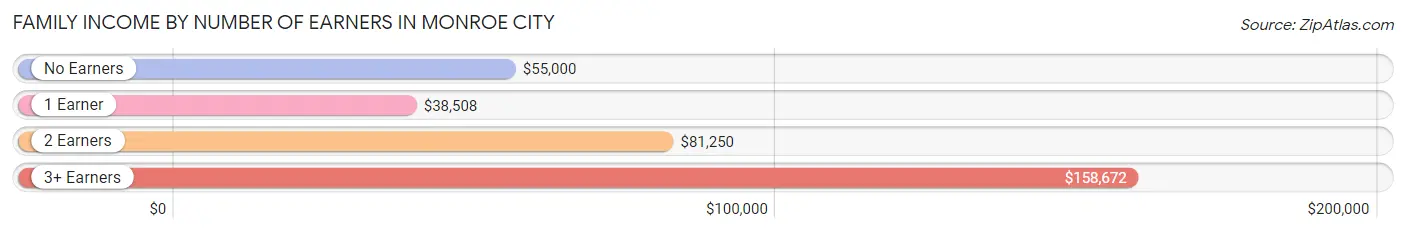
Family Income by Number of Earners in Monroe City
The median family income in Monroe City is $71,346, with families comprising 3+ earners (147) having the highest median family income of $158,672, while families with 1 earner (267) have the lowest median family income of $38,508, accounting for 19.1% and 34.8% of families, respectively.
| Number of Earners | # Families | Median Income |
| No Earners | 82 (10.7%) | $55,000 |
| 1 Earner | 267 (34.8%) | $38,508 |
| 2 Earners | 272 (35.4%) | $81,250 |
| 3+ Earners | 147 (19.1%) | $158,672 |
| Total | 768 (100.0%) | $71,346 |
Household Income in Monroe City
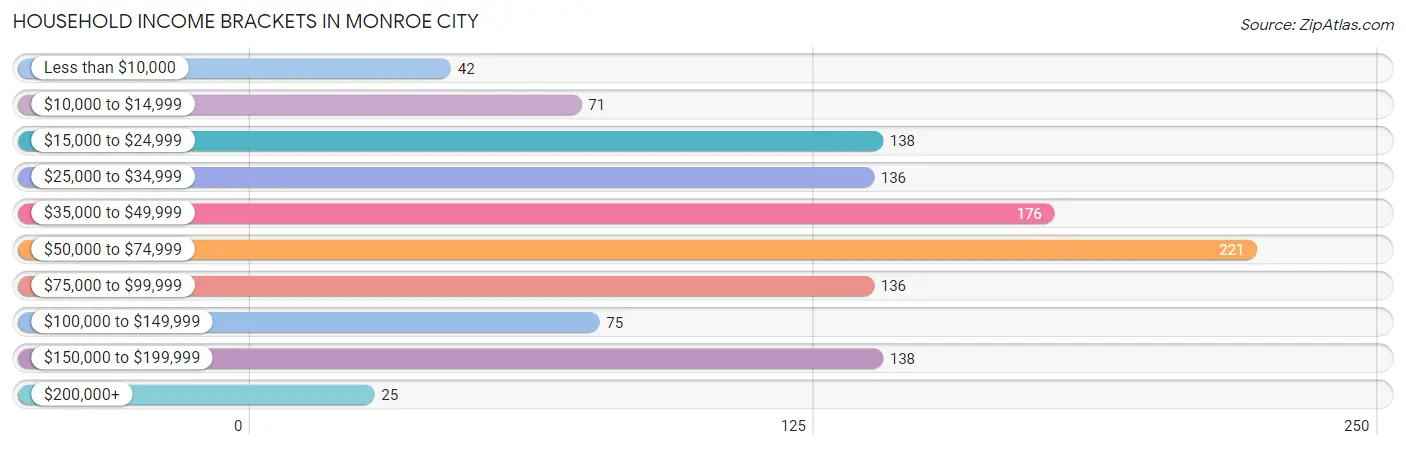
Household Income Brackets in Monroe City
With 221 households falling in the category, the $50,000 to $74,999 income range is the most frequent in Monroe City, accounting for 19.1% of all households. In contrast, only 25 households (2.2%) fall into the $200,000+ income bracket, making it the least populous group.
| Income Bracket | # Households | % Households |
| Less than $10,000 | 42 | 3.6% |
| $10,000 to $14,999 | 71 | 6.1% |
| $15,000 to $24,999 | 138 | 11.9% |
| $25,000 to $34,999 | 136 | 11.8% |
| $35,000 to $49,999 | 176 | 15.2% |
| $50,000 to $74,999 | 221 | 19.1% |
| $75,000 to $99,999 | 136 | 11.8% |
| $100,000 to $149,999 | 75 | 6.5% |
| $150,000 to $199,999 | 138 | 11.9% |
| $200,000+ | 25 | 2.2% |
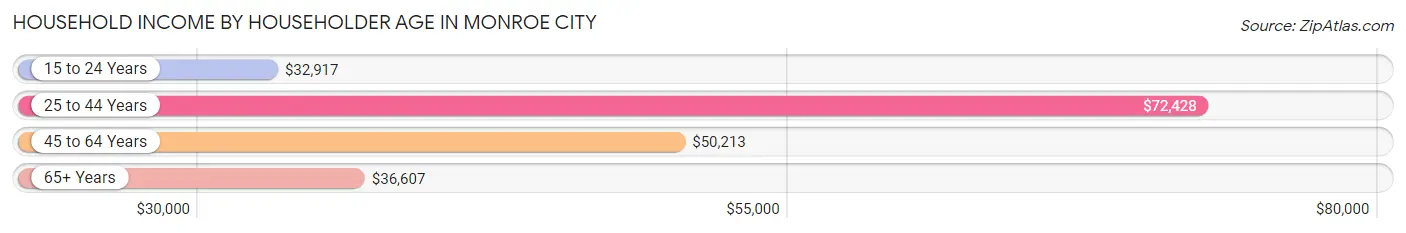
Household Income by Householder Age in Monroe City
The median household income in Monroe City is $50,885, with the highest median household income of $72,428 found in the 25 to 44 years age bracket for the primary householder. A total of 395 households (34.2%) fall into this category. Meanwhile, the 15 to 24 years age bracket for the primary householder has the lowest median household income of $32,917, with 47 households (4.1%) in this group.
| Income Bracket | # Households | Median Income |
| 15 to 24 Years | 47 (4.1%) | $32,917 |
| 25 to 44 Years | 395 (34.2%) | $72,428 |
| 45 to 64 Years | 383 (33.1%) | $50,213 |
| 65+ Years | 331 (28.6%) | $36,607 |
| Total | 1,156 (100.0%) | $50,885 |
Poverty in Monroe City
Income Below Poverty by Sex and Age in Monroe City
With 14.9% poverty level for males and 13.6% for females among the residents of Monroe City, 5 year old males and 45 to 54 year old females are the most vulnerable to poverty, with 4 males (36.4%) and 64 females (31.5%) in their respective age groups living below the poverty level.
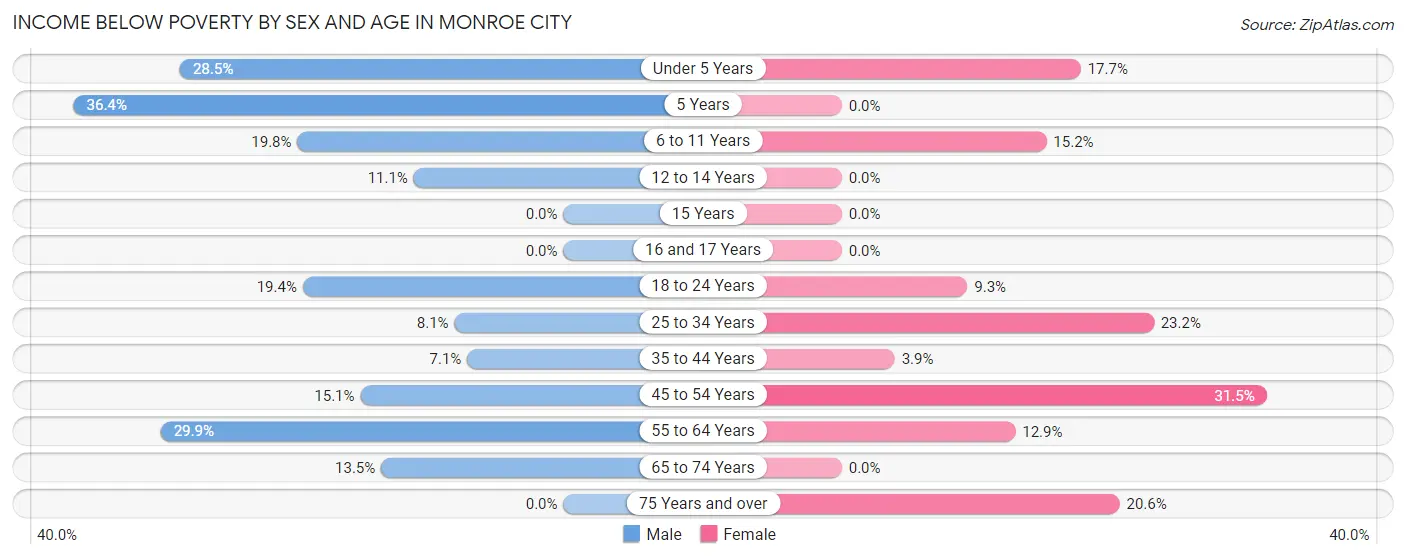
| Age Bracket | Male | Female |
| Under 5 Years | 37 (28.5%) | 22 (17.7%) |
| 5 Years | 4 (36.4%) | 0 (0.0%) |
| 6 to 11 Years | 32 (19.8%) | 24 (15.2%) |
| 12 to 14 Years | 9 (11.1%) | 0 (0.0%) |
| 15 Years | 0 (0.0%) | 0 (0.0%) |
| 16 and 17 Years | 0 (0.0%) | 0 (0.0%) |
| 18 to 24 Years | 24 (19.4%) | 11 (9.3%) |
| 25 to 34 Years | 14 (8.1%) | 41 (23.2%) |
| 35 to 44 Years | 19 (7.1%) | 9 (3.9%) |
| 45 to 54 Years | 22 (15.1%) | 64 (31.5%) |
| 55 to 64 Years | 55 (29.9%) | 21 (12.9%) |
| 65 to 74 Years | 18 (13.5%) | 0 (0.0%) |
| 75 Years and over | 0 (0.0%) | 20 (20.6%) |
| Total | 234 (14.9%) | 212 (13.6%) |
Income Above Poverty by Sex and Age in Monroe City
According to the poverty statistics in Monroe City, males aged 15 years and females aged 5 years are the age groups that are most secure financially, with 100.0% of males and 100.0% of females in these age groups living above the poverty line.
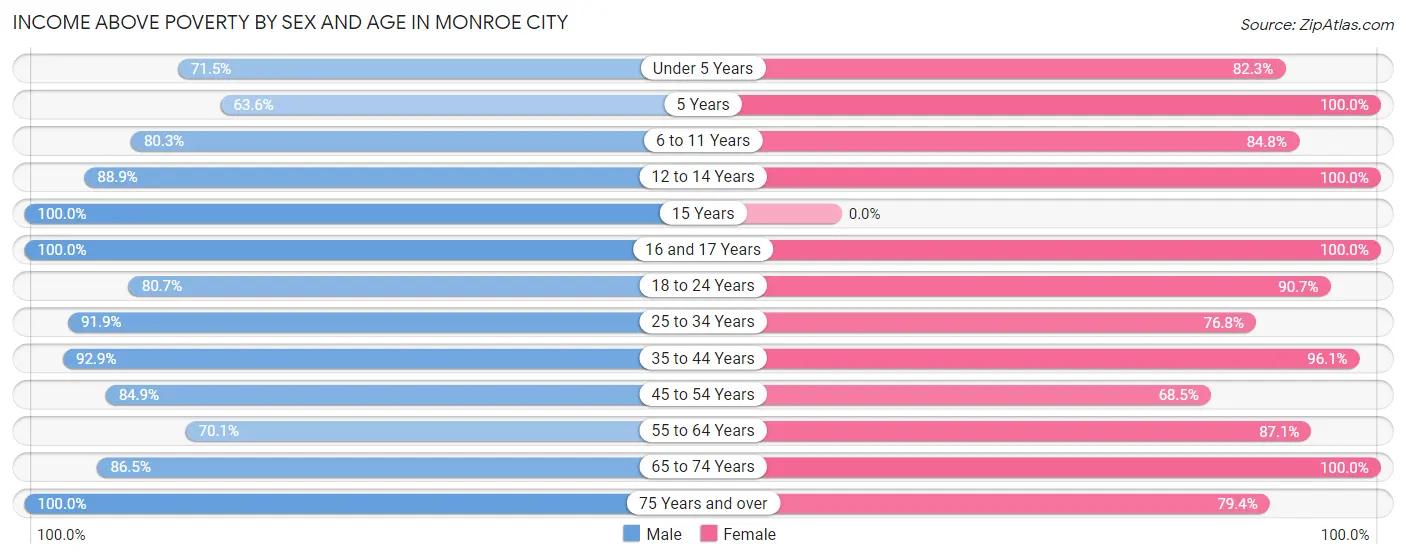
| Age Bracket | Male | Female |
| Under 5 Years | 93 (71.5%) | 102 (82.3%) |
| 5 Years | 7 (63.6%) | 30 (100.0%) |
| 6 to 11 Years | 130 (80.2%) | 134 (84.8%) |
| 12 to 14 Years | 72 (88.9%) | 21 (100.0%) |
| 15 Years | 13 (100.0%) | 0 (0.0%) |
| 16 and 17 Years | 42 (100.0%) | 74 (100.0%) |
| 18 to 24 Years | 100 (80.6%) | 107 (90.7%) |
| 25 to 34 Years | 159 (91.9%) | 136 (76.8%) |
| 35 to 44 Years | 247 (92.9%) | 220 (96.1%) |
| 45 to 54 Years | 124 (84.9%) | 139 (68.5%) |
| 55 to 64 Years | 129 (70.1%) | 142 (87.1%) |
| 65 to 74 Years | 115 (86.5%) | 160 (100.0%) |
| 75 Years and over | 101 (100.0%) | 77 (79.4%) |
| Total | 1,332 (85.1%) | 1,342 (86.4%) |
Income Below Poverty Among Married-Couple Families in Monroe City
The poverty statistics for married-couple families in Monroe City show that 0.8% or 4 of the total 487 families live below the poverty line. Families with 3 or 4 children have the highest poverty rate of 5.9%, comprising of 4 families. On the other hand, families with no children have the lowest poverty rate of 0.0%, which includes 0 families.
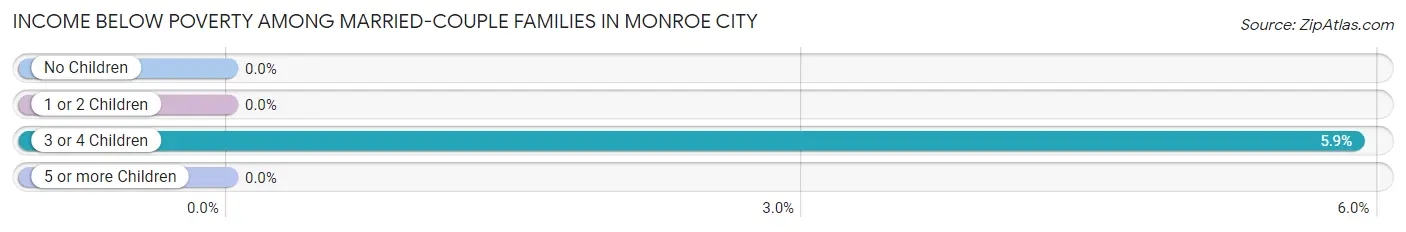
| Children | Above Poverty | Below Poverty |
| No Children | 252 (100.0%) | 0 (0.0%) |
| 1 or 2 Children | 167 (100.0%) | 0 (0.0%) |
| 3 or 4 Children | 64 (94.1%) | 4 (5.9%) |
| 5 or more Children | 0 (0.0%) | 0 (0.0%) |
| Total | 483 (99.2%) | 4 (0.8%) |
Income Below Poverty Among Single-Parent Households in Monroe City
According to the poverty data in Monroe City, 3.8% or 3 single-father households and 23.3% or 47 single-mother households are living below the poverty line. Among single-father households, those with 1 or 2 children have the highest poverty rate, with 3 households (5.4%) experiencing poverty. Likewise, among single-mother households, those with 3 or 4 children have the highest poverty rate, with 17 households (100.0%) falling below the poverty line.
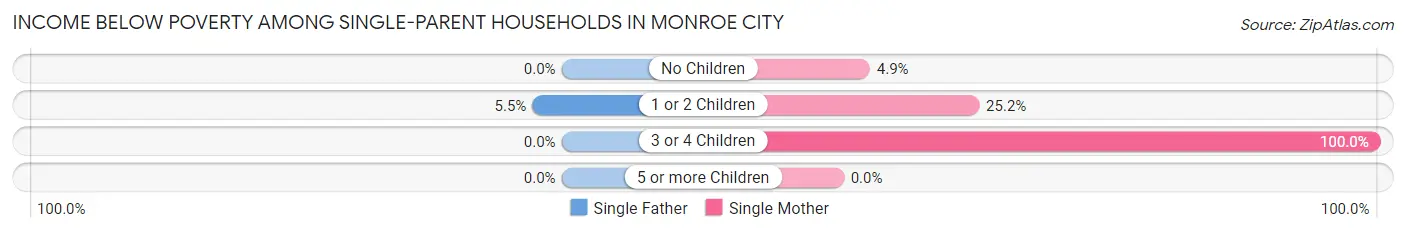
| Children | Single Father | Single Mother |
| No Children | 0 (0.0%) | 4 (4.9%) |
| 1 or 2 Children | 3 (5.4%) | 26 (25.2%) |
| 3 or 4 Children | 0 (0.0%) | 17 (100.0%) |
| 5 or more Children | 0 (0.0%) | 0 (0.0%) |
| Total | 3 (3.8%) | 47 (23.3%) |
Income Below Poverty Among Married-Couple vs Single-Parent Households in Monroe City
The poverty data for Monroe City shows that 4 of the married-couple family households (0.8%) and 50 of the single-parent households (17.8%) are living below the poverty level. Within the married-couple family households, those with 3 or 4 children have the highest poverty rate, with 4 households (5.9%) falling below the poverty line. Among the single-parent households, those with 3 or 4 children have the highest poverty rate, with 17 household (73.9%) living below poverty.
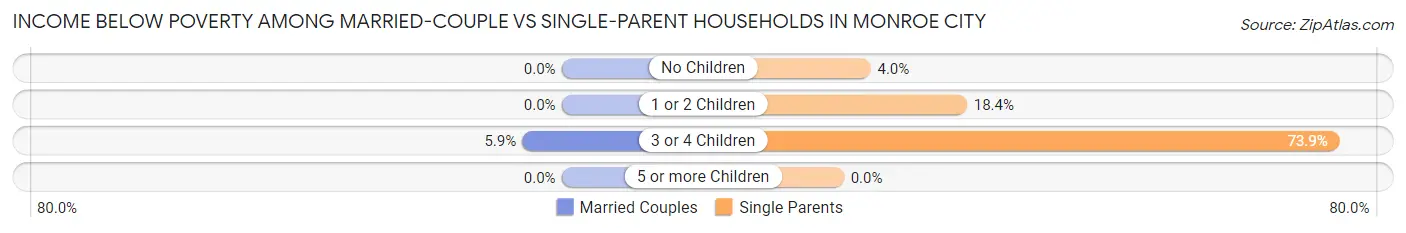
| Children | Married-Couple Families | Single-Parent Households |
| No Children | 0 (0.0%) | 4 (4.0%) |
| 1 or 2 Children | 0 (0.0%) | 29 (18.3%) |
| 3 or 4 Children | 4 (5.9%) | 17 (73.9%) |
| 5 or more Children | 0 (0.0%) | 0 (0.0%) |
| Total | 4 (0.8%) | 50 (17.8%) |
Employment Characteristics in Monroe City
Employment by Class of Employer in Monroe City
Among the 1,441 employed individuals in Monroe City, private company employees (933 | 64.7%), not-for-profit organizations (210 | 14.6%), and local government employees (174 | 12.1%) make up the most common classes of employment.
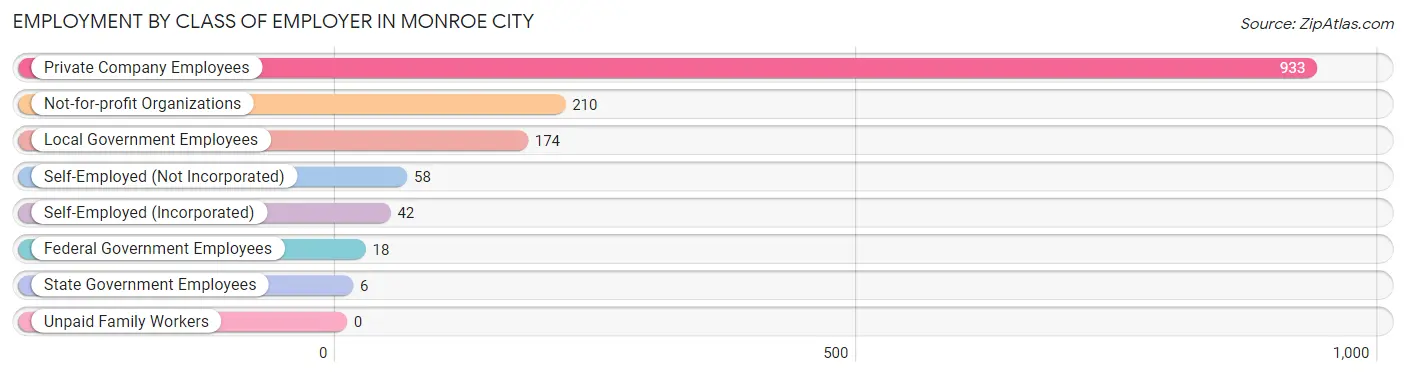
| Employer Class | # Employees | % Employees |
| Private Company Employees | 933 | 64.7% |
| Self-Employed (Incorporated) | 42 | 2.9% |
| Self-Employed (Not Incorporated) | 58 | 4.0% |
| Not-for-profit Organizations | 210 | 14.6% |
| Local Government Employees | 174 | 12.1% |
| State Government Employees | 6 | 0.4% |
| Federal Government Employees | 18 | 1.3% |
| Unpaid Family Workers | 0 | 0.0% |
| Total | 1,441 | 100.0% |
Employment Status by Age in Monroe City
According to the labor force statistics for Monroe City, out of the total population over 16 years of age (2,446), 59.2% or 1,448 individuals are in the labor force, with 0.5% or 7 of them unemployed. The age group with the highest labor force participation rate is 30 to 34 years, with 92.4% or 109 individuals in the labor force. Within the labor force, the 25 to 29 years age range has the highest percentage of unemployed individuals, with 3.6% or 7 of them being unemployed.
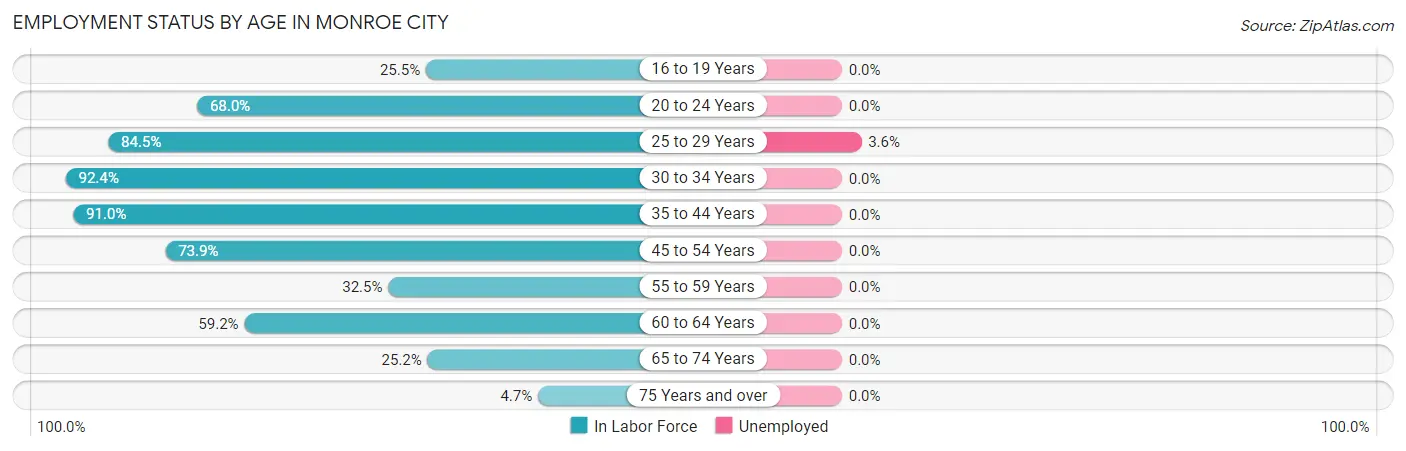
| Age Bracket | In Labor Force | Unemployed |
| 16 to 19 Years | 40 (25.5%) | 0 (0.0%) |
| 20 to 24 Years | 138 (68.0%) | 0 (0.0%) |
| 25 to 29 Years | 196 (84.5%) | 7 (3.6%) |
| 30 to 34 Years | 109 (92.4%) | 0 (0.0%) |
| 35 to 44 Years | 454 (91.0%) | 0 (0.0%) |
| 45 to 54 Years | 258 (73.9%) | 0 (0.0%) |
| 55 to 59 Years | 54 (32.5%) | 0 (0.0%) |
| 60 to 64 Years | 113 (59.2%) | 0 (0.0%) |
| 65 to 74 Years | 75 (25.2%) | 0 (0.0%) |
| 75 Years and over | 11 (4.7%) | 0 (0.0%) |
| Total | 1,448 (59.2%) | 7 (0.5%) |
Employment Status by Educational Attainment in Monroe City
According to labor force statistics for Monroe City, 76.1% of individuals (1,183) out of the total population between 25 and 64 years of age (1,555) are in the labor force, with 0.6% or 7 of them being unemployed. The group with the highest labor force participation rate are those with the educational attainment of bachelor's degree or higher, with 91.3% or 220 individuals in the labor force. Within the labor force, individuals with high school diploma education have the highest percentage of unemployment, with 1.4% or 7 of them being unemployed.
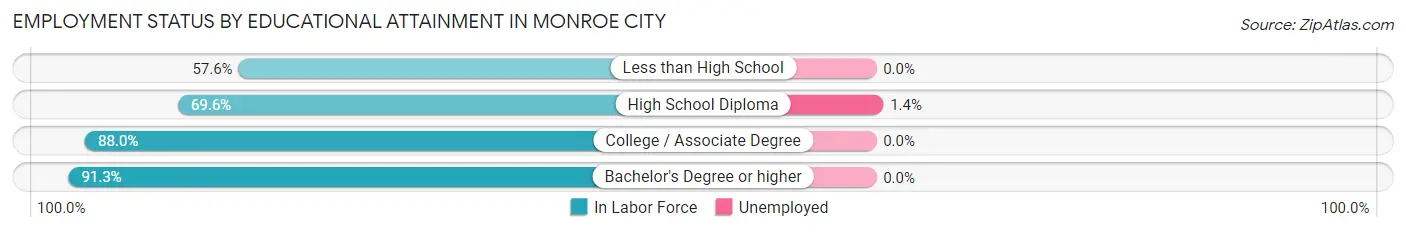
| Educational Attainment | In Labor Force | Unemployed |
| Less than High School | 121 (57.6%) | 0 (0.0%) |
| High School Diploma | 485 (69.6%) | 10 (1.4%) |
| College / Associate Degree | 358 (88.0%) | 0 (0.0%) |
| Bachelor's Degree or higher | 220 (91.3%) | 0 (0.0%) |
| Total | 1,183 (76.1%) | 9 (0.6%) |
Employment Occupations by Sex in Monroe City
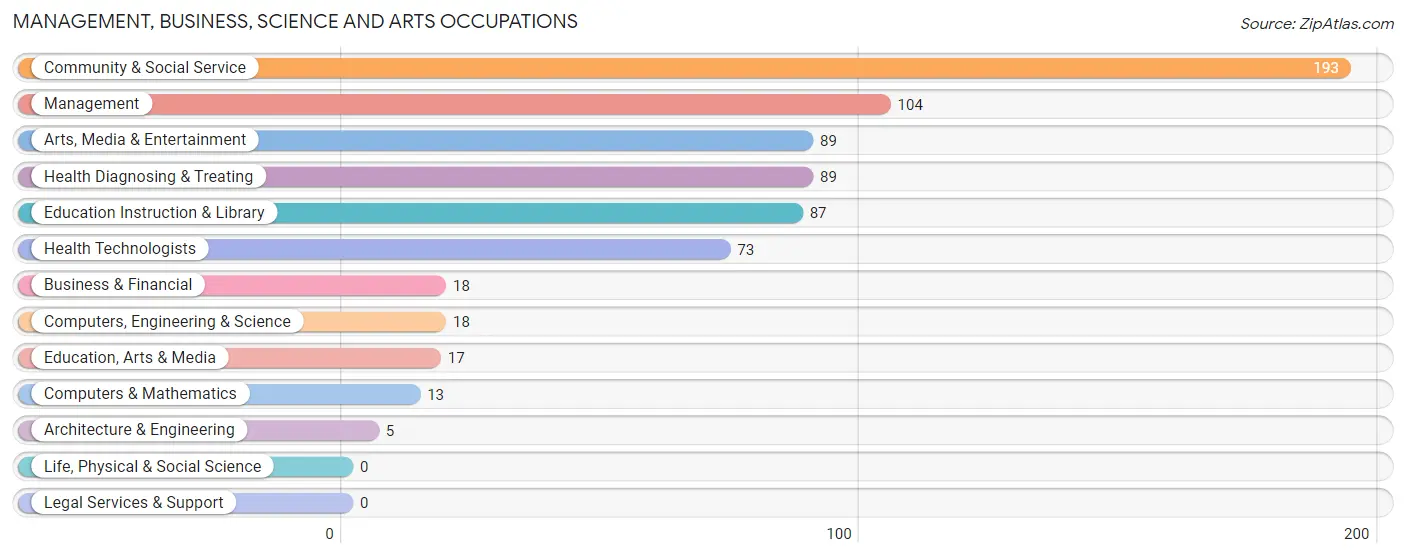
Management, Business, Science and Arts Occupations
The most common Management, Business, Science and Arts occupations in Monroe City are Community & Social Service (193 | 13.4%), Management (104 | 7.2%), Arts, Media & Entertainment (89 | 6.2%), Health Diagnosing & Treating (89 | 6.2%), and Education Instruction & Library (87 | 6.1%).
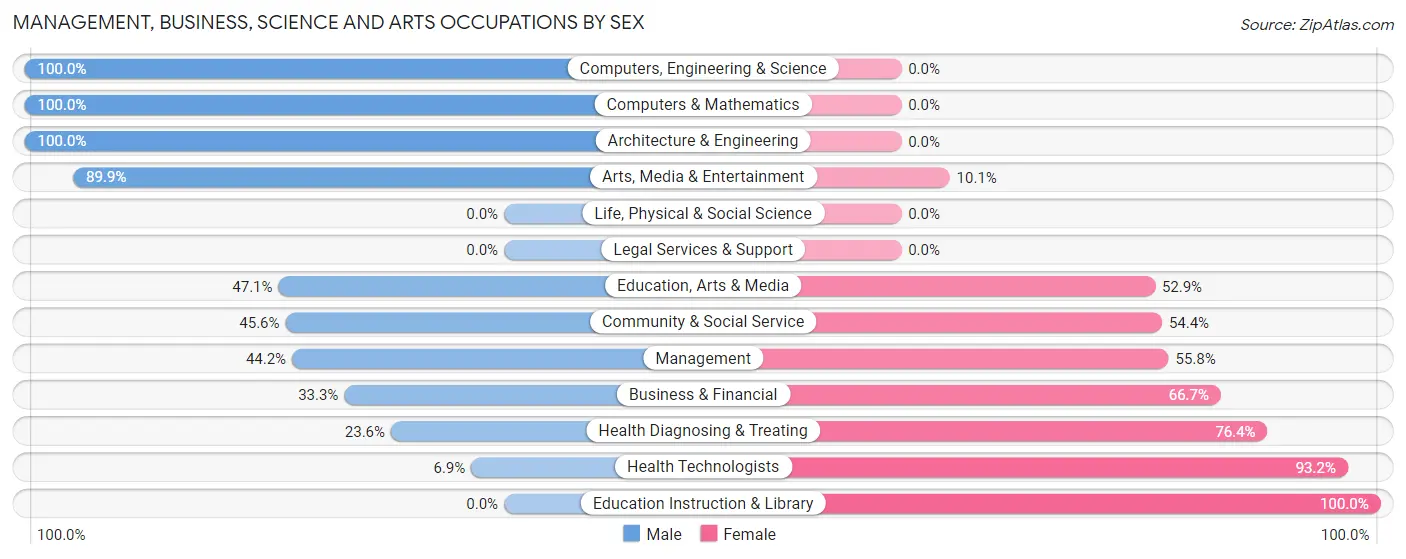
Management, Business, Science and Arts Occupations by Sex
Within the Management, Business, Science and Arts occupations in Monroe City, the most male-oriented occupations are Computers, Engineering & Science (100.0%), Computers & Mathematics (100.0%), and Architecture & Engineering (100.0%), while the most female-oriented occupations are Education Instruction & Library (100.0%), Health Technologists (93.1%), and Health Diagnosing & Treating (76.4%).
| Occupation | Male | Female |
| Management | 46 (44.2%) | 58 (55.8%) |
| Business & Financial | 6 (33.3%) | 12 (66.7%) |
| Computers, Engineering & Science | 18 (100.0%) | 0 (0.0%) |
| Computers & Mathematics | 13 (100.0%) | 0 (0.0%) |
| Architecture & Engineering | 5 (100.0%) | 0 (0.0%) |
| Life, Physical & Social Science | 0 (0.0%) | 0 (0.0%) |
| Community & Social Service | 88 (45.6%) | 105 (54.4%) |
| Education, Arts & Media | 8 (47.1%) | 9 (52.9%) |
| Legal Services & Support | 0 (0.0%) | 0 (0.0%) |
| Education Instruction & Library | 0 (0.0%) | 87 (100.0%) |
| Arts, Media & Entertainment | 80 (89.9%) | 9 (10.1%) |
| Health Diagnosing & Treating | 21 (23.6%) | 68 (76.4%) |
| Health Technologists | 5 (6.9%) | 68 (93.1%) |
| Total (Category) | 179 (42.4%) | 243 (57.6%) |
| Total (Overall) | 746 (51.9%) | 690 (48.0%) |
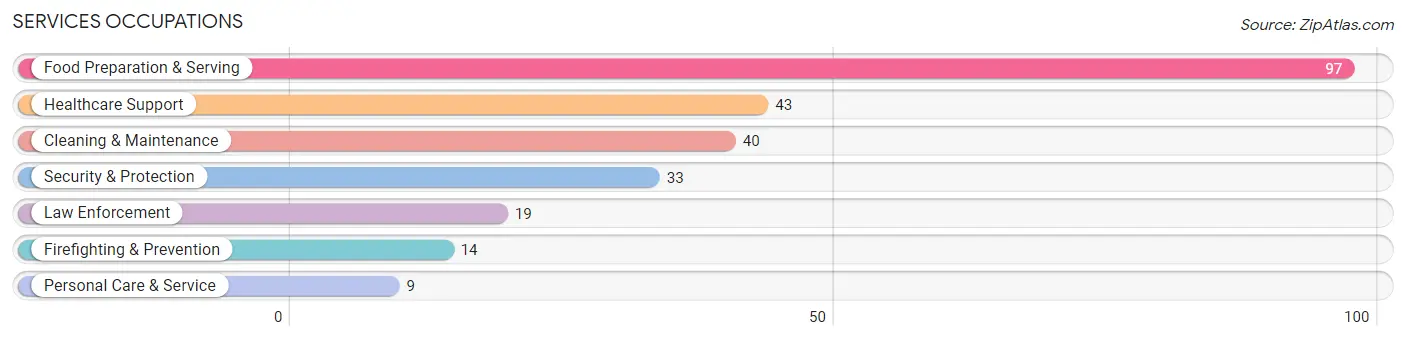
Services Occupations
The most common Services occupations in Monroe City are Food Preparation & Serving (97 | 6.8%), Healthcare Support (43 | 3.0%), Cleaning & Maintenance (40 | 2.8%), Security & Protection (33 | 2.3%), and Law Enforcement (19 | 1.3%).
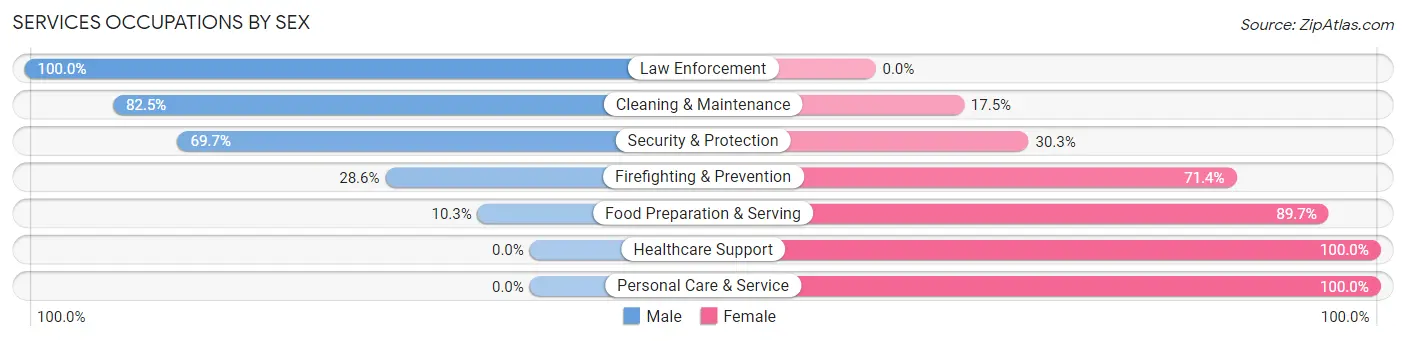
Services Occupations by Sex
Within the Services occupations in Monroe City, the most male-oriented occupations are Law Enforcement (100.0%), Cleaning & Maintenance (82.5%), and Security & Protection (69.7%), while the most female-oriented occupations are Healthcare Support (100.0%), Personal Care & Service (100.0%), and Food Preparation & Serving (89.7%).
| Occupation | Male | Female |
| Healthcare Support | 0 (0.0%) | 43 (100.0%) |
| Security & Protection | 23 (69.7%) | 10 (30.3%) |
| Firefighting & Prevention | 4 (28.6%) | 10 (71.4%) |
| Law Enforcement | 19 (100.0%) | 0 (0.0%) |
| Food Preparation & Serving | 10 (10.3%) | 87 (89.7%) |
| Cleaning & Maintenance | 33 (82.5%) | 7 (17.5%) |
| Personal Care & Service | 0 (0.0%) | 9 (100.0%) |
| Total (Category) | 66 (29.7%) | 156 (70.3%) |
| Total (Overall) | 746 (51.9%) | 690 (48.0%) |
Sales and Office Occupations
The most common Sales and Office occupations in Monroe City are Sales & Related (189 | 13.2%), and Office & Administration (115 | 8.0%).
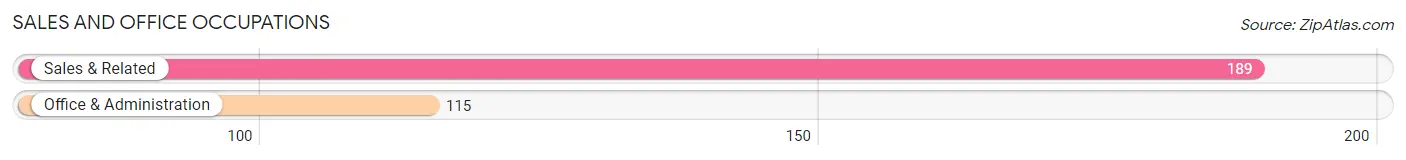
Sales and Office Occupations by Sex
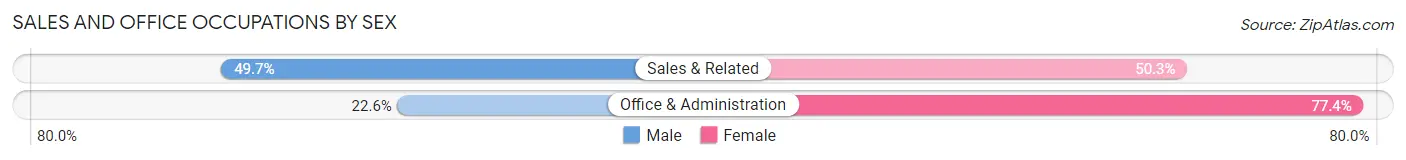
| Occupation | Male | Female |
| Sales & Related | 94 (49.7%) | 95 (50.3%) |
| Office & Administration | 26 (22.6%) | 89 (77.4%) |
| Total (Category) | 120 (39.5%) | 184 (60.5%) |
| Total (Overall) | 746 (51.9%) | 690 (48.0%) |
Natural Resources, Construction and Maintenance Occupations
The most common Natural Resources, Construction and Maintenance occupations in Monroe City are Installation, Maintenance & Repair (64 | 4.5%), and Construction & Extraction (14 | 1.0%).
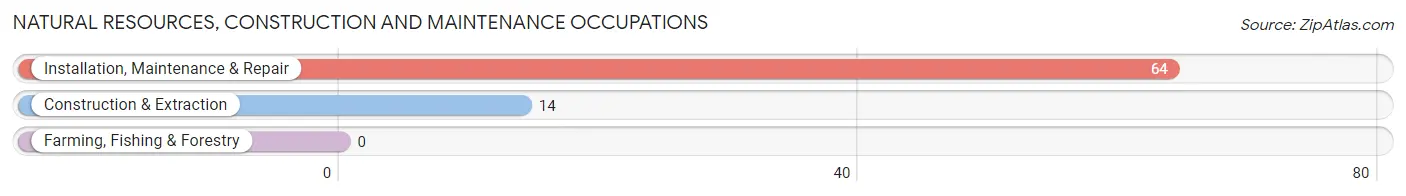
Natural Resources, Construction and Maintenance Occupations by Sex
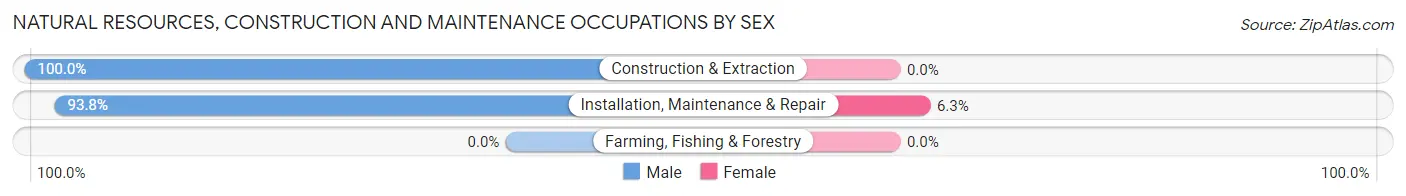
| Occupation | Male | Female |
| Farming, Fishing & Forestry | 0 (0.0%) | 0 (0.0%) |
| Construction & Extraction | 14 (100.0%) | 0 (0.0%) |
| Installation, Maintenance & Repair | 60 (93.8%) | 4 (6.2%) |
| Total (Category) | 74 (94.9%) | 4 (5.1%) |
| Total (Overall) | 746 (51.9%) | 690 (48.0%) |
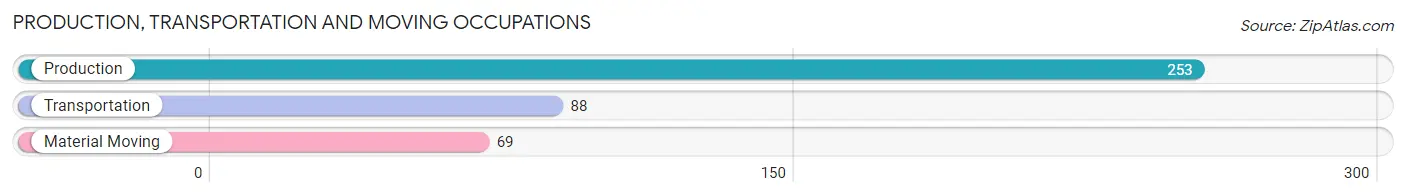
Production, Transportation and Moving Occupations
The most common Production, Transportation and Moving occupations in Monroe City are Production (253 | 17.6%), Transportation (88 | 6.1%), and Material Moving (69 | 4.8%).
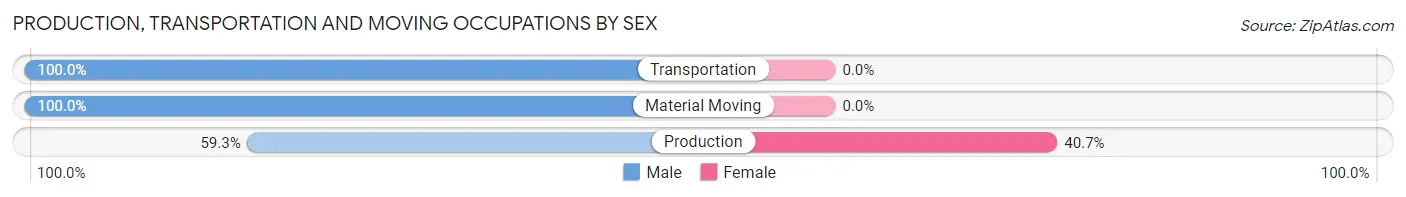
Production, Transportation and Moving Occupations by Sex
| Occupation | Male | Female |
| Production | 150 (59.3%) | 103 (40.7%) |
| Transportation | 88 (100.0%) | 0 (0.0%) |
| Material Moving | 69 (100.0%) | 0 (0.0%) |
| Total (Category) | 307 (74.9%) | 103 (25.1%) |
| Total (Overall) | 746 (51.9%) | 690 (48.0%) |
Employment Industries by Sex in Monroe City
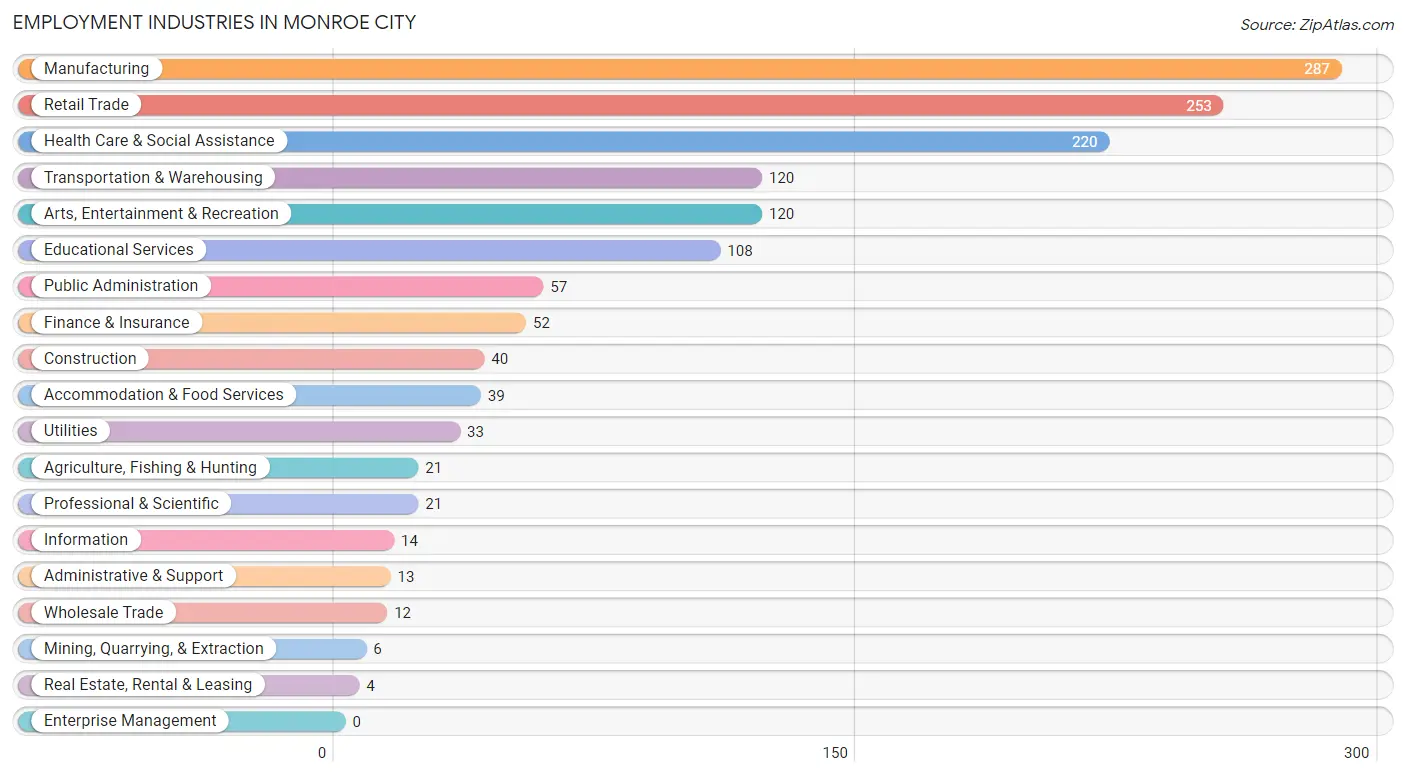
Employment Industries in Monroe City
The major employment industries in Monroe City include Manufacturing (287 | 20.0%), Retail Trade (253 | 17.6%), Health Care & Social Assistance (220 | 15.3%), Transportation & Warehousing (120 | 8.4%), and Arts, Entertainment & Recreation (120 | 8.4%).
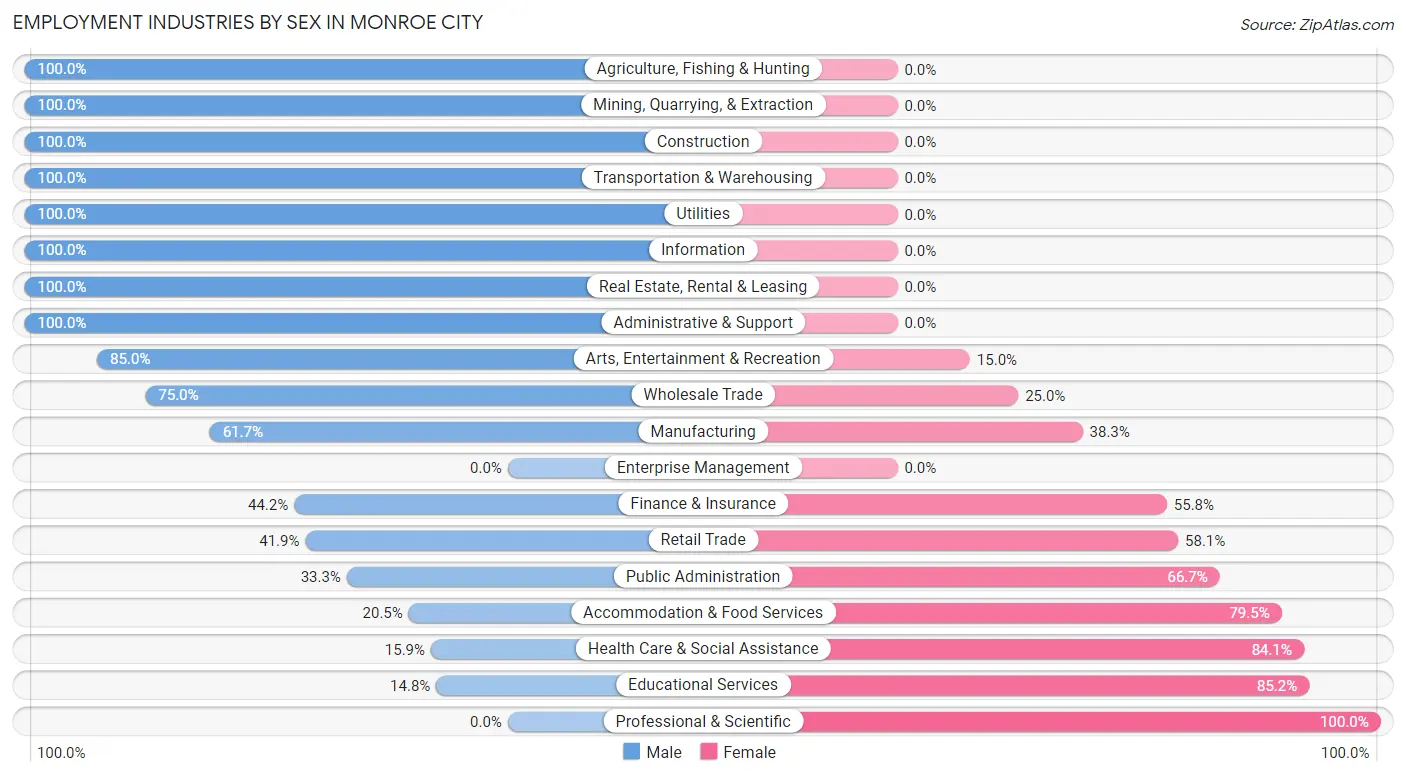
Employment Industries by Sex in Monroe City
The Monroe City industries that see more men than women are Agriculture, Fishing & Hunting (100.0%), Mining, Quarrying, & Extraction (100.0%), and Construction (100.0%), whereas the industries that tend to have a higher number of women are Professional & Scientific (100.0%), Educational Services (85.2%), and Health Care & Social Assistance (84.1%).
| Industry | Male | Female |
| Agriculture, Fishing & Hunting | 21 (100.0%) | 0 (0.0%) |
| Mining, Quarrying, & Extraction | 6 (100.0%) | 0 (0.0%) |
| Construction | 40 (100.0%) | 0 (0.0%) |
| Manufacturing | 177 (61.7%) | 110 (38.3%) |
| Wholesale Trade | 9 (75.0%) | 3 (25.0%) |
| Retail Trade | 106 (41.9%) | 147 (58.1%) |
| Transportation & Warehousing | 120 (100.0%) | 0 (0.0%) |
| Utilities | 33 (100.0%) | 0 (0.0%) |
| Information | 14 (100.0%) | 0 (0.0%) |
| Finance & Insurance | 23 (44.2%) | 29 (55.8%) |
| Real Estate, Rental & Leasing | 4 (100.0%) | 0 (0.0%) |
| Professional & Scientific | 0 (0.0%) | 21 (100.0%) |
| Enterprise Management | 0 (0.0%) | 0 (0.0%) |
| Administrative & Support | 13 (100.0%) | 0 (0.0%) |
| Educational Services | 16 (14.8%) | 92 (85.2%) |
| Health Care & Social Assistance | 35 (15.9%) | 185 (84.1%) |
| Arts, Entertainment & Recreation | 102 (85.0%) | 18 (15.0%) |
| Accommodation & Food Services | 8 (20.5%) | 31 (79.5%) |
| Public Administration | 19 (33.3%) | 38 (66.7%) |
| Total | 746 (51.9%) | 690 (48.0%) |
Education in Monroe City
School Enrollment in Monroe City
The most common levels of schooling among the 628 students in Monroe City are high school (172 | 27.4%), elementary school (167 | 26.6%), and middle school (150 | 23.9%).
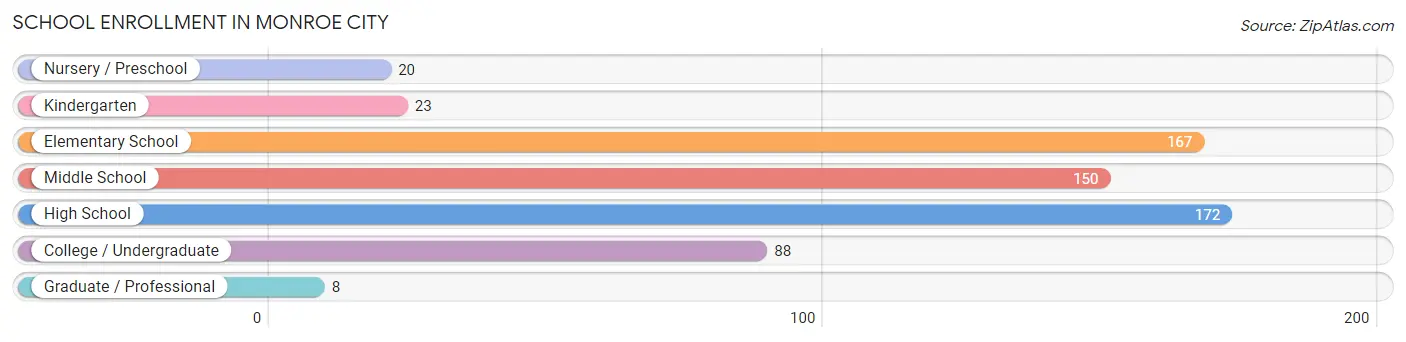
| School Level | # Students | % Students |
| Nursery / Preschool | 20 | 3.2% |
| Kindergarten | 23 | 3.7% |
| Elementary School | 167 | 26.6% |
| Middle School | 150 | 23.9% |
| High School | 172 | 27.4% |
| College / Undergraduate | 88 | 14.0% |
| Graduate / Professional | 8 | 1.3% |
| Total | 628 | 100.0% |
School Enrollment by Age by Funding Source in Monroe City
Out of a total of 628 students who are enrolled in schools in Monroe City, 155 (24.7%) attend a private institution, while the remaining 473 (75.3%) are enrolled in public schools. The age group of 35 years and over has the highest likelihood of being enrolled in private schools, with 16 (100.0% in the age bracket) enrolled. Conversely, the age group of 10 to 14 year olds has the lowest likelihood of being enrolled in a private school, with 180 (84.5% in the age bracket) attending a public institution.
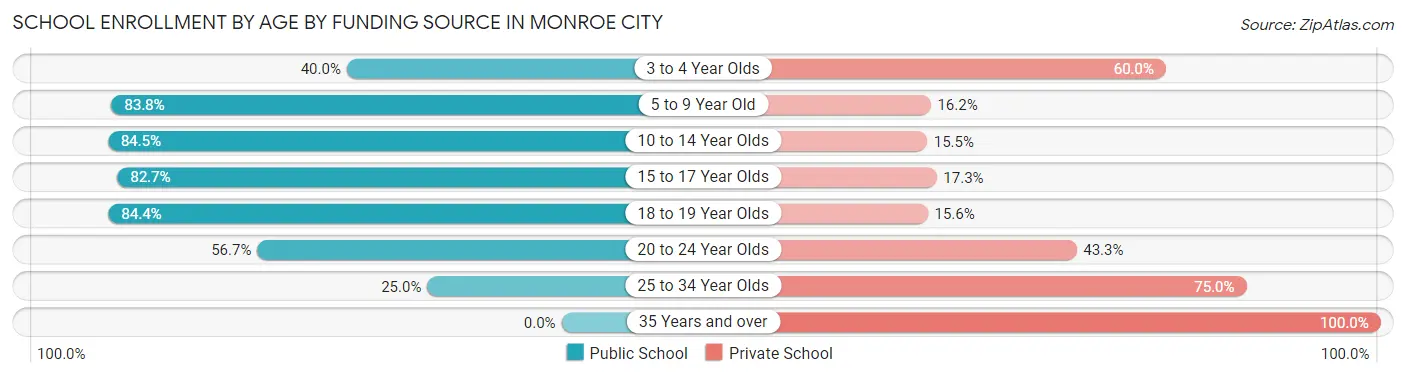
| Age Bracket | Public School | Private School |
| 3 to 4 Year Olds | 8 (40.0%) | 12 (60.0%) |
| 5 to 9 Year Old | 140 (83.8%) | 27 (16.2%) |
| 10 to 14 Year Olds | 180 (84.5%) | 33 (15.5%) |
| 15 to 17 Year Olds | 91 (82.7%) | 19 (17.3%) |
| 18 to 19 Year Olds | 27 (84.4%) | 5 (15.6%) |
| 20 to 24 Year Olds | 17 (56.7%) | 13 (43.3%) |
| 25 to 34 Year Olds | 10 (25.0%) | 30 (75.0%) |
| 35 Years and over | 0 (0.0%) | 16 (100.0%) |
| Total | 473 (75.3%) | 155 (24.7%) |
Educational Attainment by Field of Study in Monroe City
Education (90 | 25.7%), business (60 | 17.1%), bio, nature & agricultural (46 | 13.1%), arts & humanities (44 | 12.6%), and psychology (38 | 10.9%) are the most common fields of study among 350 individuals in Monroe City who have obtained a bachelor's degree or higher.
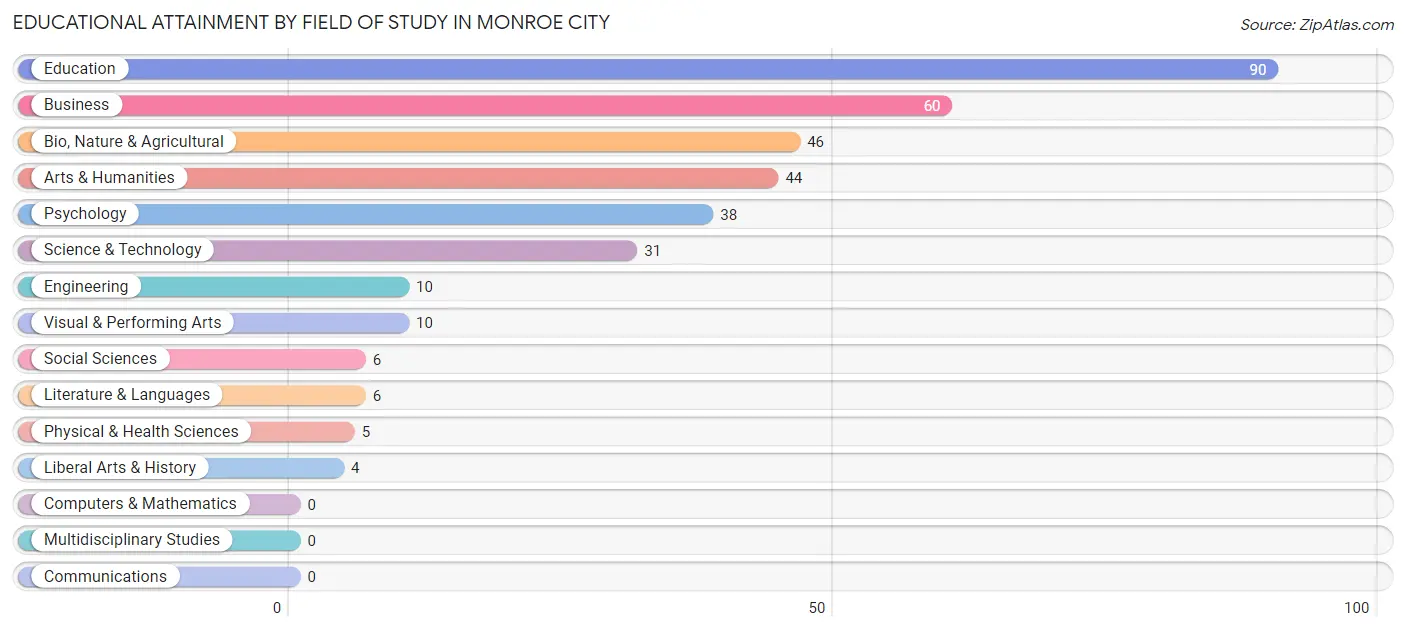
| Field of Study | # Graduates | % Graduates |
| Computers & Mathematics | 0 | 0.0% |
| Bio, Nature & Agricultural | 46 | 13.1% |
| Physical & Health Sciences | 5 | 1.4% |
| Psychology | 38 | 10.9% |
| Social Sciences | 6 | 1.7% |
| Engineering | 10 | 2.9% |
| Multidisciplinary Studies | 0 | 0.0% |
| Science & Technology | 31 | 8.9% |
| Business | 60 | 17.1% |
| Education | 90 | 25.7% |
| Literature & Languages | 6 | 1.7% |
| Liberal Arts & History | 4 | 1.1% |
| Visual & Performing Arts | 10 | 2.9% |
| Communications | 0 | 0.0% |
| Arts & Humanities | 44 | 12.6% |
| Total | 350 | 100.0% |
Transportation & Commute in Monroe City
Vehicle Availability by Sex in Monroe City
The most prevalent vehicle ownership categories in Monroe City are males with 2 vehicles (313, accounting for 41.7%) and females with 2 vehicles (303, making up 45.5%).
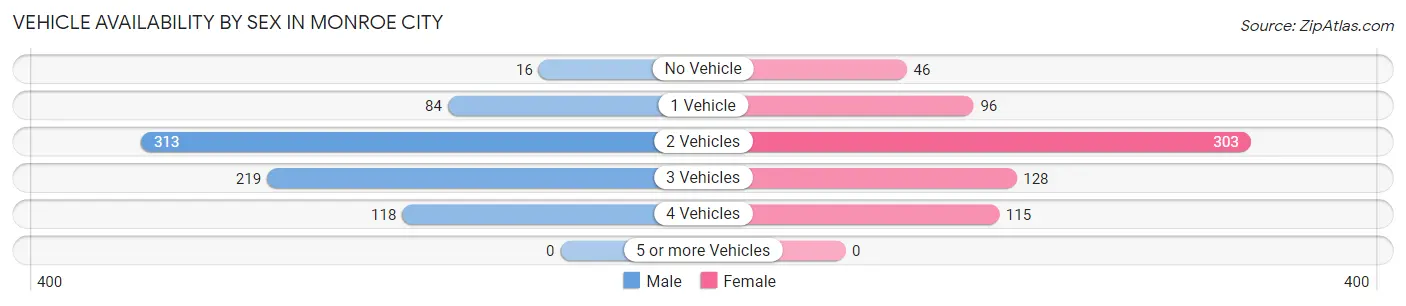
| Vehicles Available | Male | Female |
| No Vehicle | 16 (2.1%) | 46 (6.7%) |
| 1 Vehicle | 84 (11.2%) | 96 (14.0%) |
| 2 Vehicles | 313 (41.7%) | 303 (44.0%) |
| 3 Vehicles | 219 (29.2%) | 128 (18.6%) |
| 4 Vehicles | 118 (15.7%) | 115 (16.7%) |
| 5 or more Vehicles | 0 (0.0%) | 0 (0.0%) |
| Total | 750 (100.0%) | 688 (100.0%) |
Commute Time in Monroe City
The most frequently occuring commute durations in Monroe City are 20 to 24 minutes (376 commuters, 26.7%), 5 to 9 minutes (258 commuters, 18.3%), and 30 to 34 minutes (237 commuters, 16.8%).
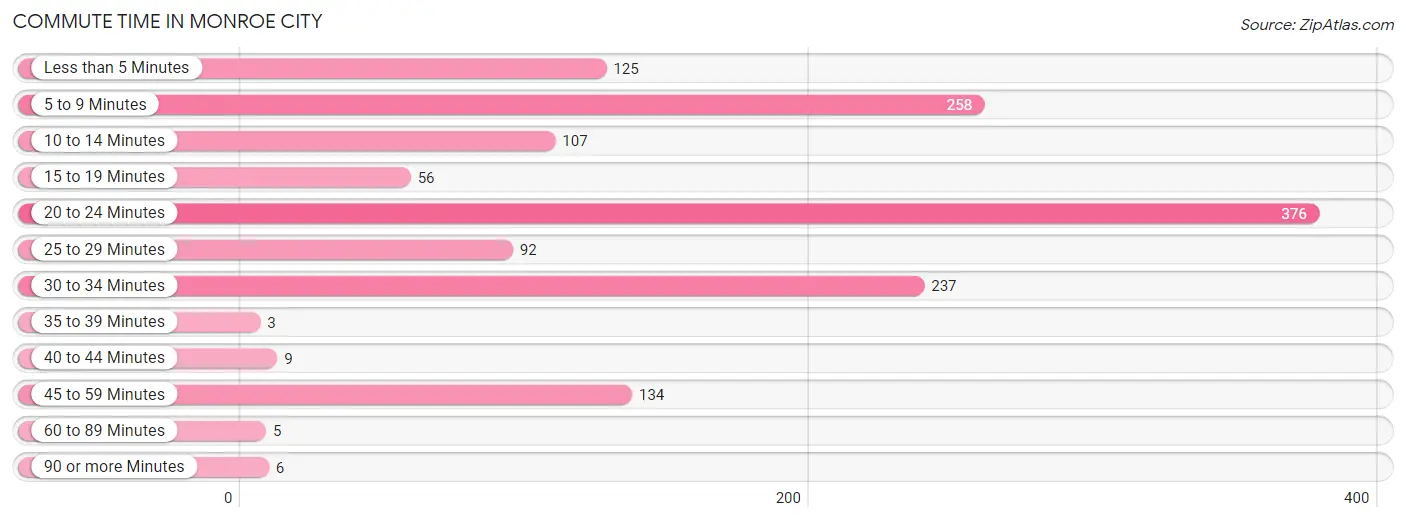
| Commute Time | # Commuters | % Commuters |
| Less than 5 Minutes | 125 | 8.9% |
| 5 to 9 Minutes | 258 | 18.3% |
| 10 to 14 Minutes | 107 | 7.6% |
| 15 to 19 Minutes | 56 | 4.0% |
| 20 to 24 Minutes | 376 | 26.7% |
| 25 to 29 Minutes | 92 | 6.5% |
| 30 to 34 Minutes | 237 | 16.8% |
| 35 to 39 Minutes | 3 | 0.2% |
| 40 to 44 Minutes | 9 | 0.6% |
| 45 to 59 Minutes | 134 | 9.5% |
| 60 to 89 Minutes | 5 | 0.4% |
| 90 or more Minutes | 6 | 0.4% |
Commute Time by Sex in Monroe City
The most common commute times in Monroe City are 30 to 34 minutes (172 commuters, 22.9%) for males and 20 to 24 minutes (220 commuters, 33.5%) for females.
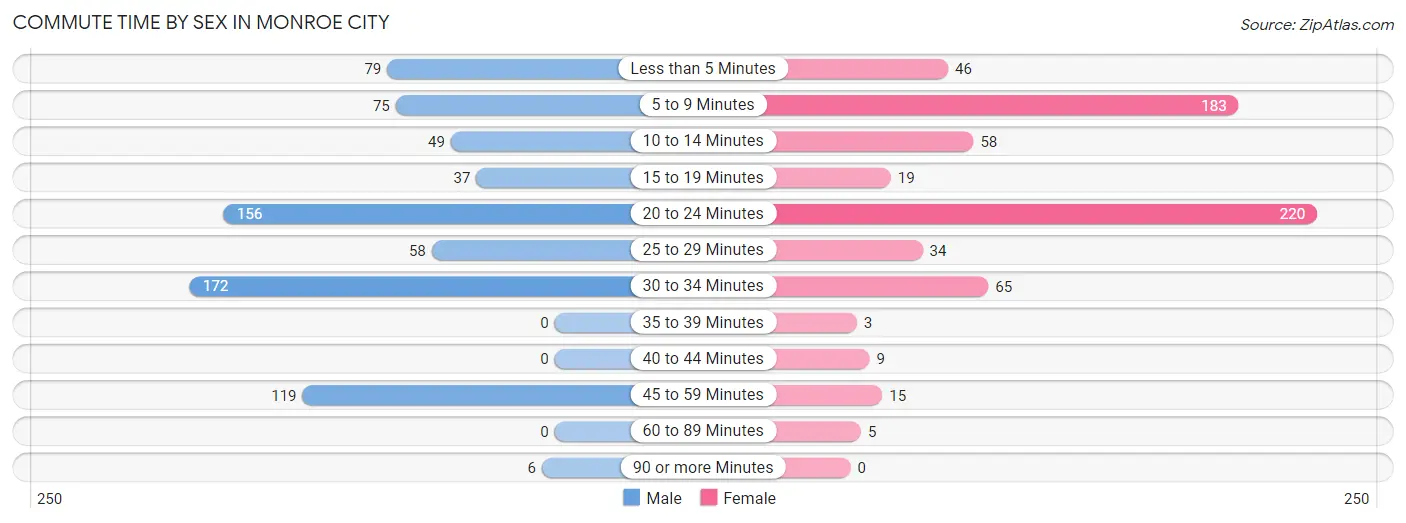
| Commute Time | Male | Female |
| Less than 5 Minutes | 79 (10.5%) | 46 (7.0%) |
| 5 to 9 Minutes | 75 (10.0%) | 183 (27.9%) |
| 10 to 14 Minutes | 49 (6.5%) | 58 (8.8%) |
| 15 to 19 Minutes | 37 (4.9%) | 19 (2.9%) |
| 20 to 24 Minutes | 156 (20.8%) | 220 (33.5%) |
| 25 to 29 Minutes | 58 (7.7%) | 34 (5.2%) |
| 30 to 34 Minutes | 172 (22.9%) | 65 (9.9%) |
| 35 to 39 Minutes | 0 (0.0%) | 3 (0.5%) |
| 40 to 44 Minutes | 0 (0.0%) | 9 (1.4%) |
| 45 to 59 Minutes | 119 (15.9%) | 15 (2.3%) |
| 60 to 89 Minutes | 0 (0.0%) | 5 (0.8%) |
| 90 or more Minutes | 6 (0.8%) | 0 (0.0%) |
Time of Departure to Work by Sex in Monroe City
The most frequent times of departure to work in Monroe City are 7:30 AM to 7:59 AM (181, 24.1%) for males and 7:30 AM to 7:59 AM (254, 38.7%) for females.
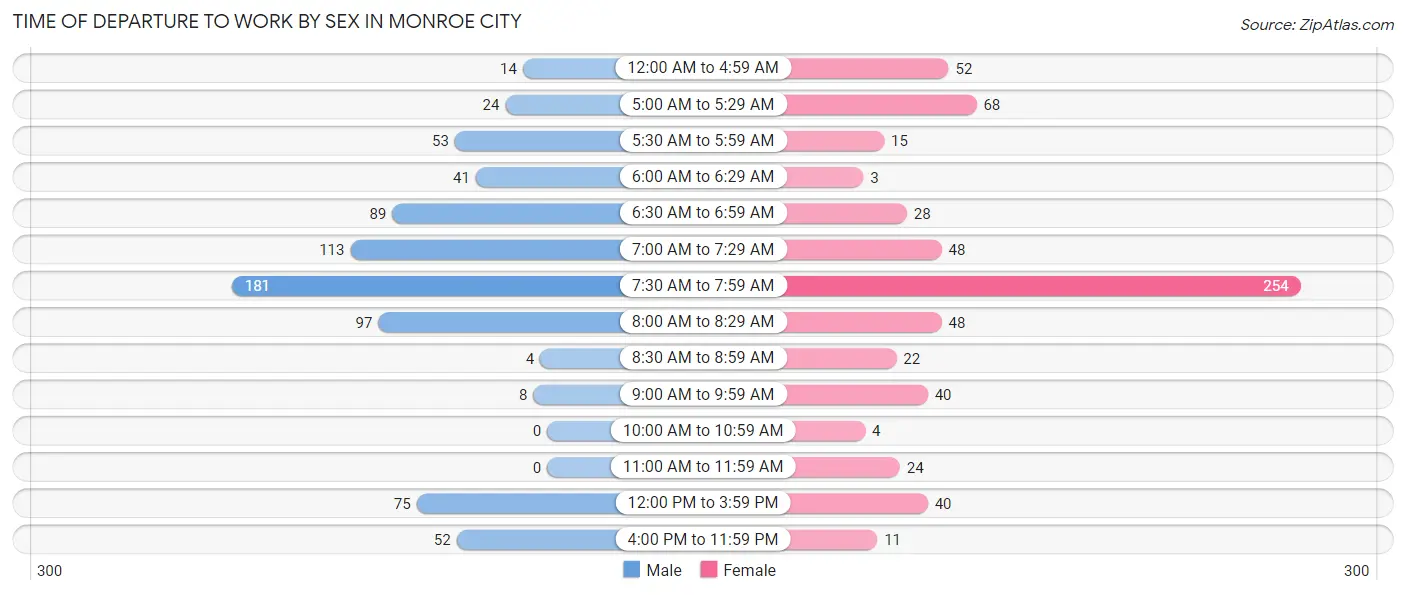
| Time of Departure | Male | Female |
| 12:00 AM to 4:59 AM | 14 (1.9%) | 52 (7.9%) |
| 5:00 AM to 5:29 AM | 24 (3.2%) | 68 (10.3%) |
| 5:30 AM to 5:59 AM | 53 (7.1%) | 15 (2.3%) |
| 6:00 AM to 6:29 AM | 41 (5.5%) | 3 (0.5%) |
| 6:30 AM to 6:59 AM | 89 (11.8%) | 28 (4.3%) |
| 7:00 AM to 7:29 AM | 113 (15.0%) | 48 (7.3%) |
| 7:30 AM to 7:59 AM | 181 (24.1%) | 254 (38.7%) |
| 8:00 AM to 8:29 AM | 97 (12.9%) | 48 (7.3%) |
| 8:30 AM to 8:59 AM | 4 (0.5%) | 22 (3.4%) |
| 9:00 AM to 9:59 AM | 8 (1.1%) | 40 (6.1%) |
| 10:00 AM to 10:59 AM | 0 (0.0%) | 4 (0.6%) |
| 11:00 AM to 11:59 AM | 0 (0.0%) | 24 (3.6%) |
| 12:00 PM to 3:59 PM | 75 (10.0%) | 40 (6.1%) |
| 4:00 PM to 11:59 PM | 52 (6.9%) | 11 (1.7%) |
| Total | 751 (100.0%) | 657 (100.0%) |
Housing Occupancy in Monroe City
Occupancy by Ownership in Monroe City
Of the total 1,156 dwellings in Monroe City, owner-occupied units account for 603 (52.2%), while renter-occupied units make up 553 (47.8%).
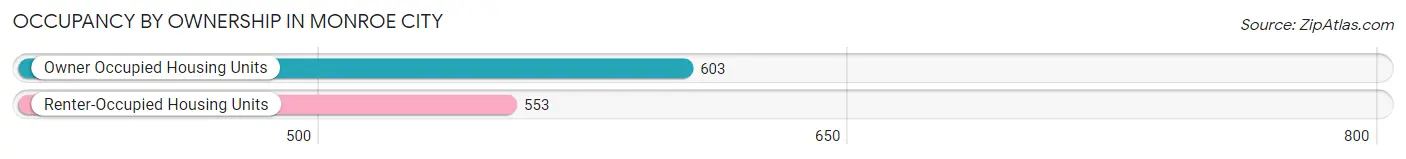
| Occupancy | # Housing Units | % Housing Units |
| Owner Occupied Housing Units | 603 | 52.2% |
| Renter-Occupied Housing Units | 553 | 47.8% |
| Total Occupied Housing Units | 1,156 | 100.0% |
Occupancy by Household Size in Monroe City
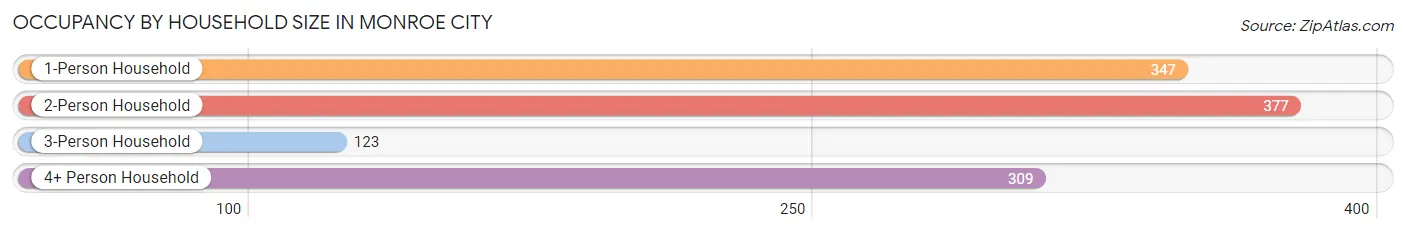
| Household Size | # Housing Units | % Housing Units |
| 1-Person Household | 347 | 30.0% |
| 2-Person Household | 377 | 32.6% |
| 3-Person Household | 123 | 10.6% |
| 4+ Person Household | 309 | 26.7% |
| Total Housing Units | 1,156 | 100.0% |
Occupancy by Ownership by Household Size in Monroe City
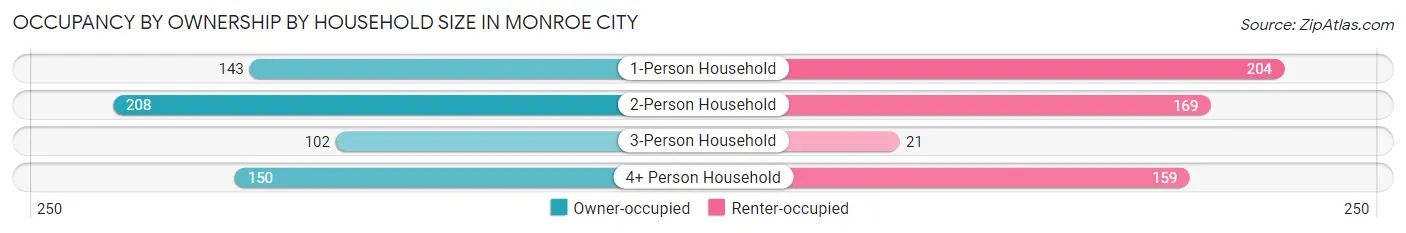
| Household Size | Owner-occupied | Renter-occupied |
| 1-Person Household | 143 (41.2%) | 204 (58.8%) |
| 2-Person Household | 208 (55.2%) | 169 (44.8%) |
| 3-Person Household | 102 (82.9%) | 21 (17.1%) |
| 4+ Person Household | 150 (48.5%) | 159 (51.5%) |
| Total Housing Units | 603 (52.2%) | 553 (47.8%) |
Occupancy by Educational Attainment in Monroe City
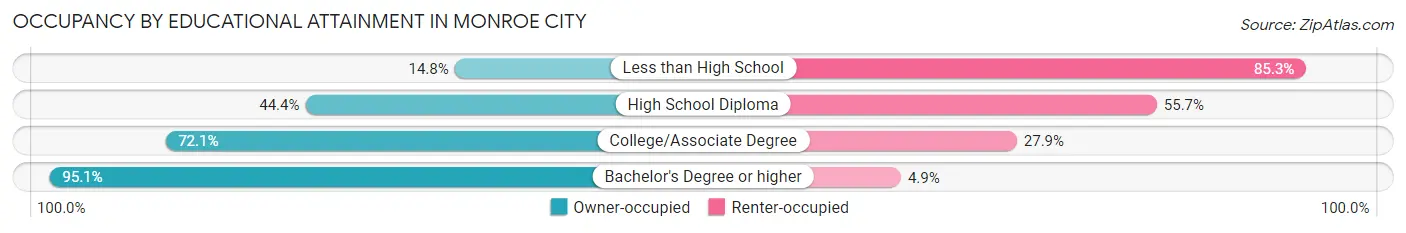
| Household Size | Owner-occupied | Renter-occupied |
| Less than High School | 36 (14.7%) | 208 (85.3%) |
| High School Diploma | 212 (44.4%) | 266 (55.6%) |
| College/Associate Degree | 181 (72.1%) | 70 (27.9%) |
| Bachelor's Degree or higher | 174 (95.1%) | 9 (4.9%) |
Occupancy by Age of Householder in Monroe City
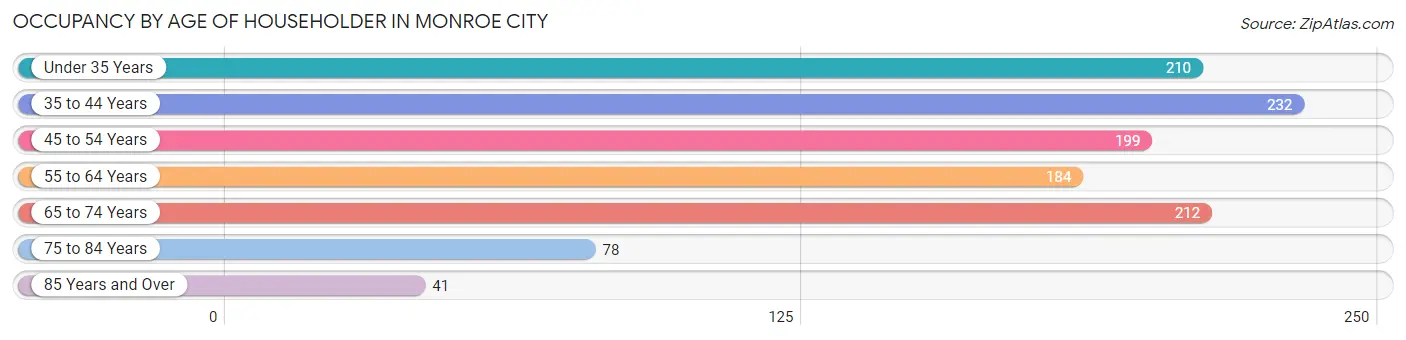
| Age Bracket | # Households | % Households |
| Under 35 Years | 210 | 18.2% |
| 35 to 44 Years | 232 | 20.1% |
| 45 to 54 Years | 199 | 17.2% |
| 55 to 64 Years | 184 | 15.9% |
| 65 to 74 Years | 212 | 18.3% |
| 75 to 84 Years | 78 | 6.8% |
| 85 Years and Over | 41 | 3.5% |
| Total | 1,156 | 100.0% |
Housing Finances in Monroe City
Median Income by Occupancy in Monroe City
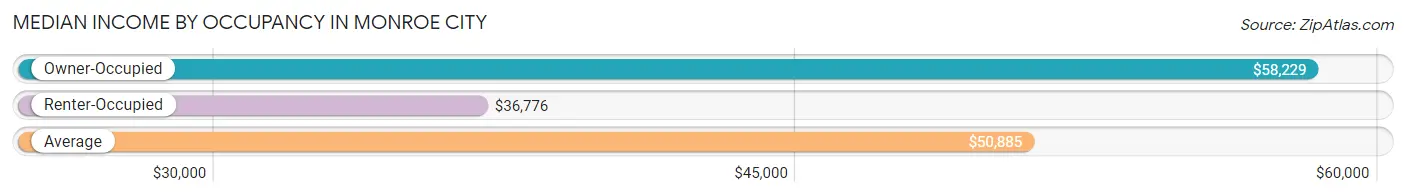
| Occupancy Type | # Households | Median Income |
| Owner-Occupied | 603 (52.2%) | $58,229 |
| Renter-Occupied | 553 (47.8%) | $36,776 |
| Average | 1,156 (100.0%) | $50,885 |
Occupancy by Householder Income Bracket in Monroe City
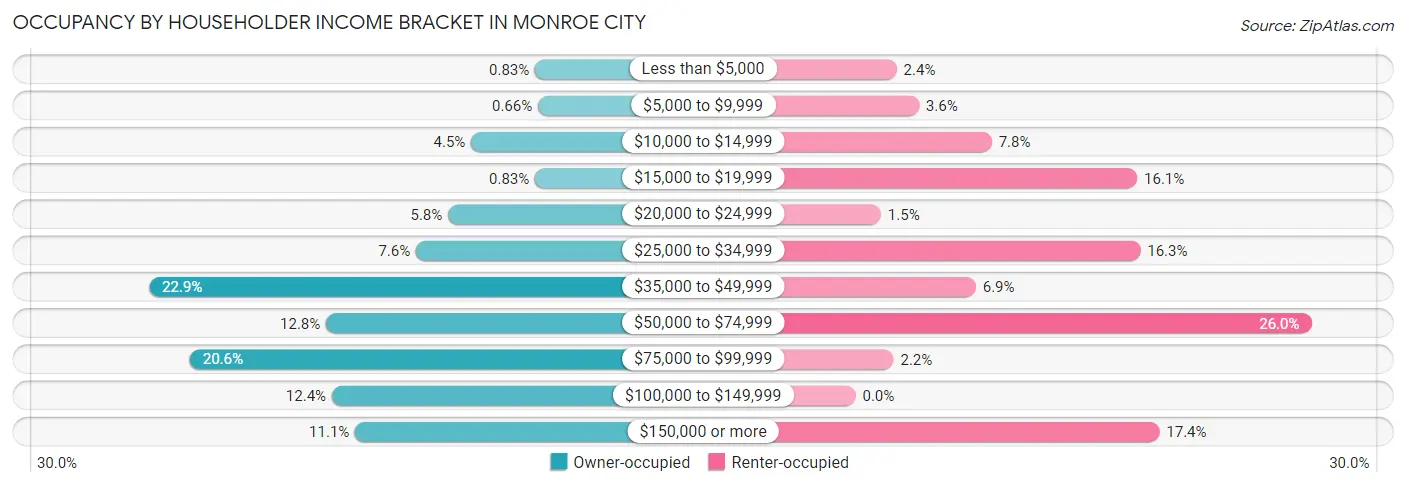
| Income Bracket | Owner-occupied | Renter-occupied |
| Less than $5,000 | 5 (0.8%) | 13 (2.4%) |
| $5,000 to $9,999 | 4 (0.7%) | 20 (3.6%) |
| $10,000 to $14,999 | 27 (4.5%) | 43 (7.8%) |
| $15,000 to $19,999 | 5 (0.8%) | 89 (16.1%) |
| $20,000 to $24,999 | 35 (5.8%) | 8 (1.5%) |
| $25,000 to $34,999 | 46 (7.6%) | 90 (16.3%) |
| $35,000 to $49,999 | 138 (22.9%) | 38 (6.9%) |
| $50,000 to $74,999 | 77 (12.8%) | 144 (26.0%) |
| $75,000 to $99,999 | 124 (20.6%) | 12 (2.2%) |
| $100,000 to $149,999 | 75 (12.4%) | 0 (0.0%) |
| $150,000 or more | 67 (11.1%) | 96 (17.4%) |
| Total | 603 (100.0%) | 553 (100.0%) |
Monthly Housing Cost Tiers in Monroe City
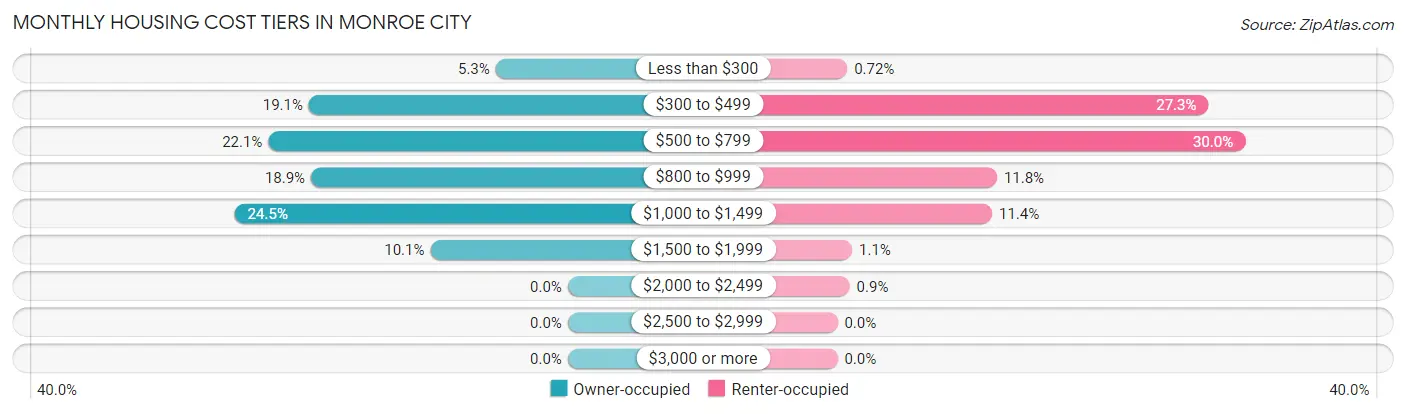
| Monthly Cost | Owner-occupied | Renter-occupied |
| Less than $300 | 32 (5.3%) | 4 (0.7%) |
| $300 to $499 | 115 (19.1%) | 151 (27.3%) |
| $500 to $799 | 133 (22.1%) | 166 (30.0%) |
| $800 to $999 | 114 (18.9%) | 65 (11.7%) |
| $1,000 to $1,499 | 148 (24.5%) | 63 (11.4%) |
| $1,500 to $1,999 | 61 (10.1%) | 6 (1.1%) |
| $2,000 to $2,499 | 0 (0.0%) | 5 (0.9%) |
| $2,500 to $2,999 | 0 (0.0%) | 0 (0.0%) |
| $3,000 or more | 0 (0.0%) | 0 (0.0%) |
| Total | 603 (100.0%) | 553 (100.0%) |
Physical Housing Characteristics in Monroe City
Housing Structures in Monroe City
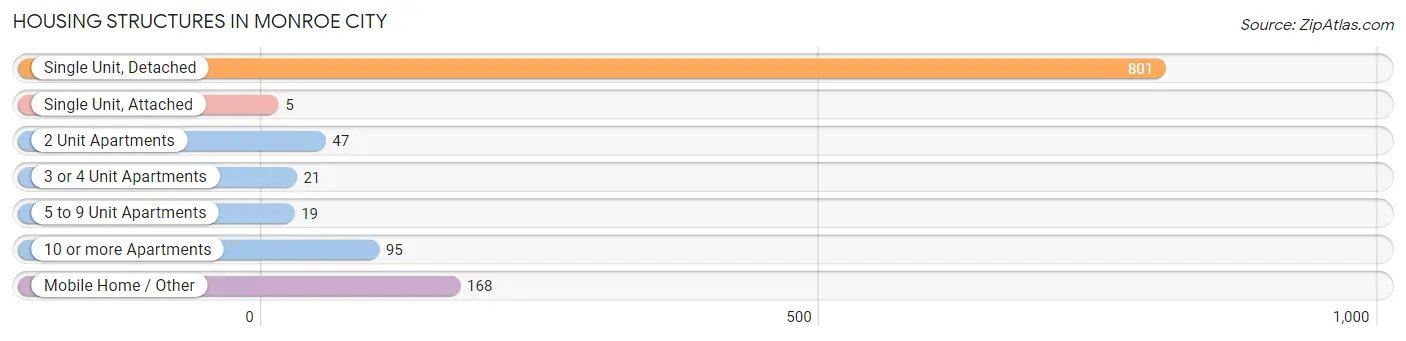
| Structure Type | # Housing Units | % Housing Units |
| Single Unit, Detached | 801 | 69.3% |
| Single Unit, Attached | 5 | 0.4% |
| 2 Unit Apartments | 47 | 4.1% |
| 3 or 4 Unit Apartments | 21 | 1.8% |
| 5 to 9 Unit Apartments | 19 | 1.6% |
| 10 or more Apartments | 95 | 8.2% |
| Mobile Home / Other | 168 | 14.5% |
| Total | 1,156 | 100.0% |
Housing Structures by Occupancy in Monroe City
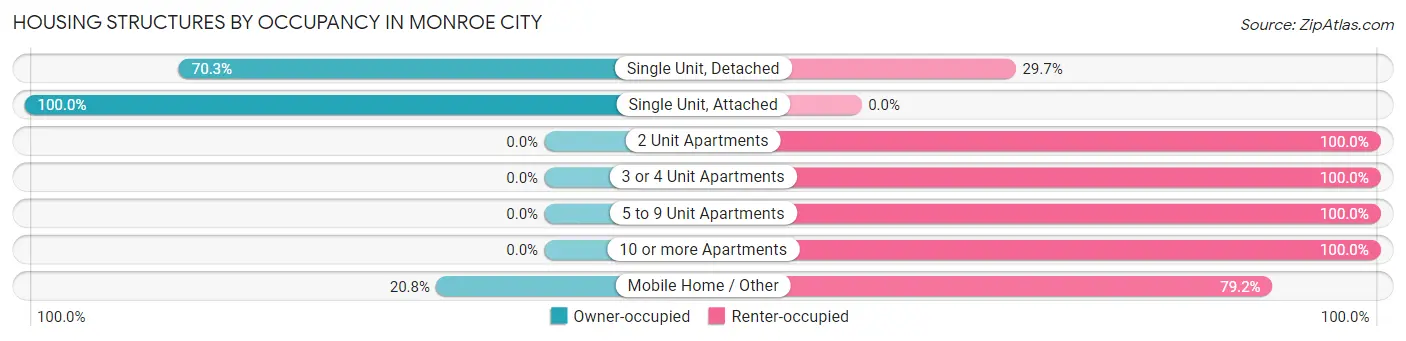
| Structure Type | Owner-occupied | Renter-occupied |
| Single Unit, Detached | 563 (70.3%) | 238 (29.7%) |
| Single Unit, Attached | 5 (100.0%) | 0 (0.0%) |
| 2 Unit Apartments | 0 (0.0%) | 47 (100.0%) |
| 3 or 4 Unit Apartments | 0 (0.0%) | 21 (100.0%) |
| 5 to 9 Unit Apartments | 0 (0.0%) | 19 (100.0%) |
| 10 or more Apartments | 0 (0.0%) | 95 (100.0%) |
| Mobile Home / Other | 35 (20.8%) | 133 (79.2%) |
| Total | 603 (52.2%) | 553 (47.8%) |
Housing Structures by Number of Rooms in Monroe City
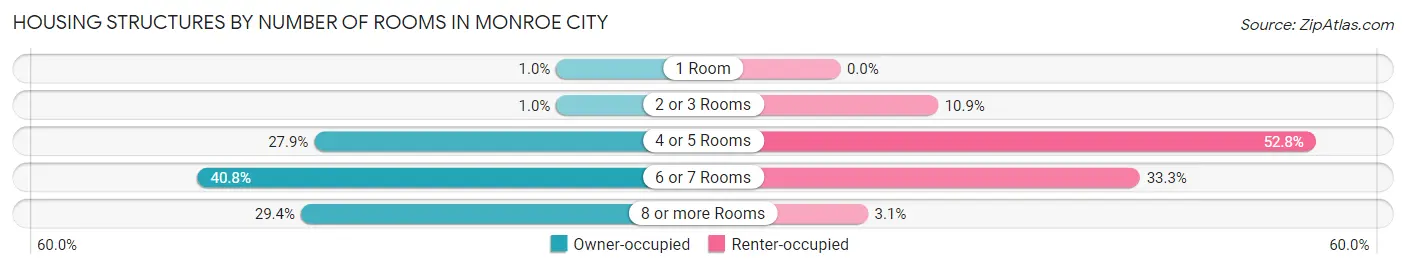
| Number of Rooms | Owner-occupied | Renter-occupied |
| 1 Room | 6 (1.0%) | 0 (0.0%) |
| 2 or 3 Rooms | 6 (1.0%) | 60 (10.8%) |
| 4 or 5 Rooms | 168 (27.9%) | 292 (52.8%) |
| 6 or 7 Rooms | 246 (40.8%) | 184 (33.3%) |
| 8 or more Rooms | 177 (29.3%) | 17 (3.1%) |
| Total | 603 (100.0%) | 553 (100.0%) |
Housing Structure by Heating Type in Monroe City
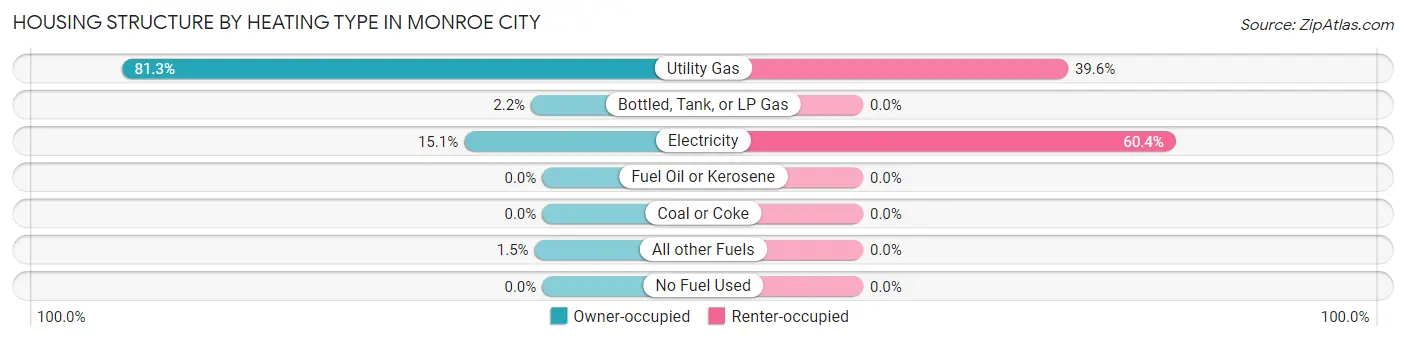
| Heating Type | Owner-occupied | Renter-occupied |
| Utility Gas | 490 (81.3%) | 219 (39.6%) |
| Bottled, Tank, or LP Gas | 13 (2.2%) | 0 (0.0%) |
| Electricity | 91 (15.1%) | 334 (60.4%) |
| Fuel Oil or Kerosene | 0 (0.0%) | 0 (0.0%) |
| Coal or Coke | 0 (0.0%) | 0 (0.0%) |
| All other Fuels | 9 (1.5%) | 0 (0.0%) |
| No Fuel Used | 0 (0.0%) | 0 (0.0%) |
| Total | 603 (100.0%) | 553 (100.0%) |
Household Vehicle Usage in Monroe City
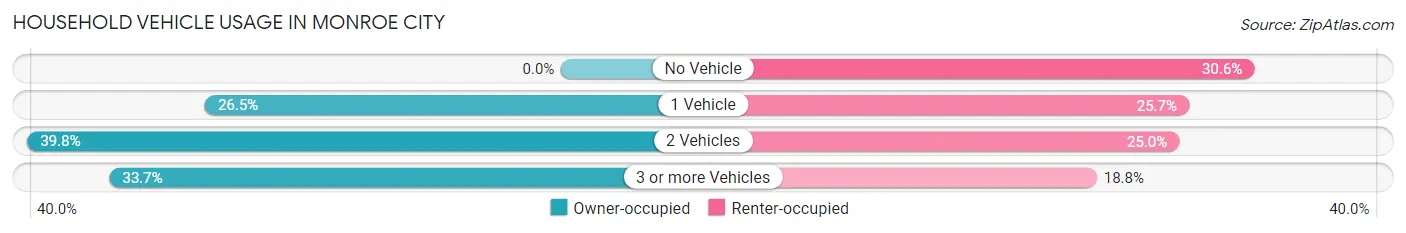
| Vehicles per Household | Owner-occupied | Renter-occupied |
| No Vehicle | 0 (0.0%) | 169 (30.6%) |
| 1 Vehicle | 160 (26.5%) | 142 (25.7%) |
| 2 Vehicles | 240 (39.8%) | 138 (24.9%) |
| 3 or more Vehicles | 203 (33.7%) | 104 (18.8%) |
| Total | 603 (100.0%) | 553 (100.0%) |
Real Estate & Mortgages in Monroe City
Real Estate and Mortgage Overview in Monroe City
| Characteristic | Without Mortgage | With Mortgage |
| Housing Units | 234 | 369 |
| Median Property Value | $106,500 | $150,900 |
| Median Household Income | $60,500 | $38 |
| Monthly Housing Costs | $462 | $0 |
| Real Estate Taxes | $1,013 | $0 |
Property Value by Mortgage Status in Monroe City
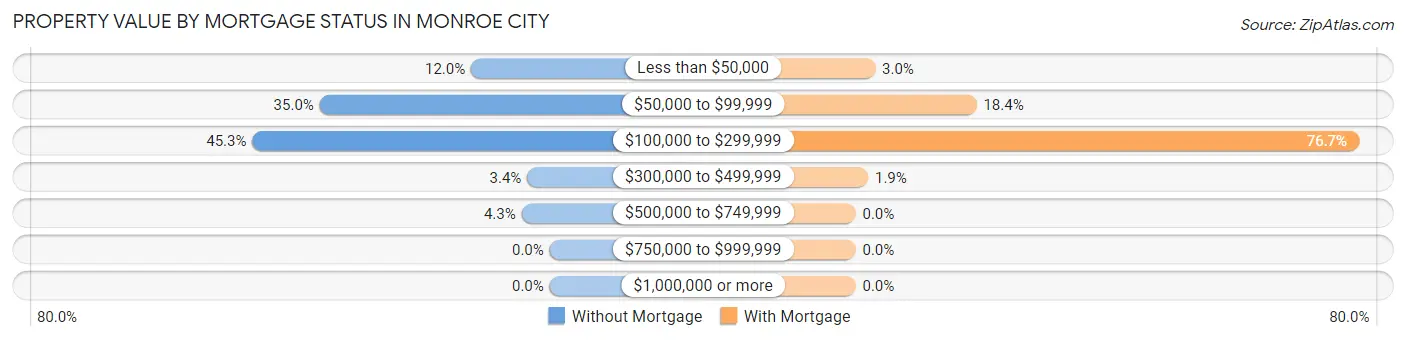
| Property Value | Without Mortgage | With Mortgage |
| Less than $50,000 | 28 (12.0%) | 11 (3.0%) |
| $50,000 to $99,999 | 82 (35.0%) | 68 (18.4%) |
| $100,000 to $299,999 | 106 (45.3%) | 283 (76.7%) |
| $300,000 to $499,999 | 8 (3.4%) | 7 (1.9%) |
| $500,000 to $749,999 | 10 (4.3%) | 0 (0.0%) |
| $750,000 to $999,999 | 0 (0.0%) | 0 (0.0%) |
| $1,000,000 or more | 0 (0.0%) | 0 (0.0%) |
| Total | 234 (100.0%) | 369 (100.0%) |
Household Income by Mortgage Status in Monroe City
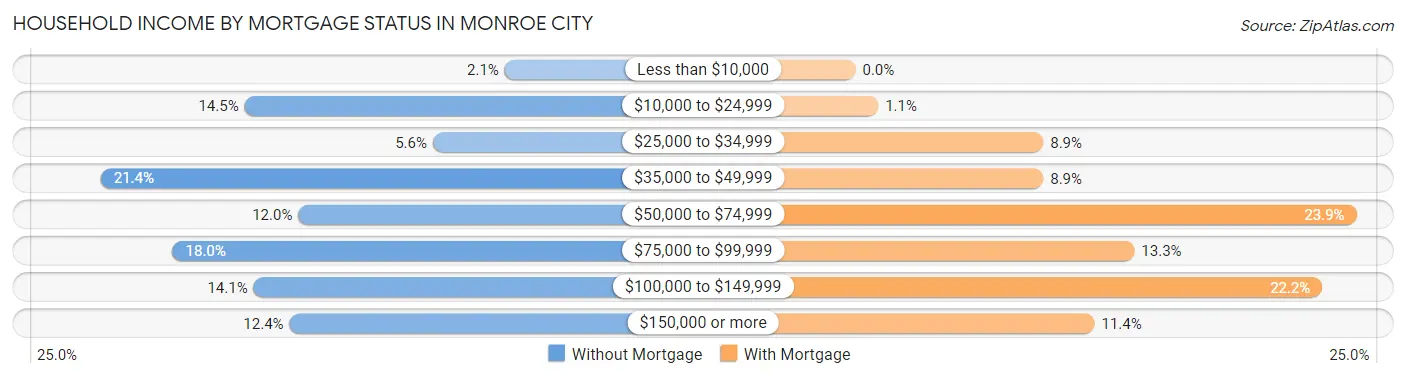
| Household Income | Without Mortgage | With Mortgage |
| Less than $10,000 | 5 (2.1%) | 0 (0.0%) |
| $10,000 to $24,999 | 34 (14.5%) | 4 (1.1%) |
| $25,000 to $34,999 | 13 (5.6%) | 33 (8.9%) |
| $35,000 to $49,999 | 50 (21.4%) | 33 (8.9%) |
| $50,000 to $74,999 | 28 (12.0%) | 88 (23.8%) |
| $75,000 to $99,999 | 42 (17.9%) | 49 (13.3%) |
| $100,000 to $149,999 | 33 (14.1%) | 82 (22.2%) |
| $150,000 or more | 29 (12.4%) | 42 (11.4%) |
| Total | 234 (100.0%) | 369 (100.0%) |
Property Value to Household Income Ratio in Monroe City
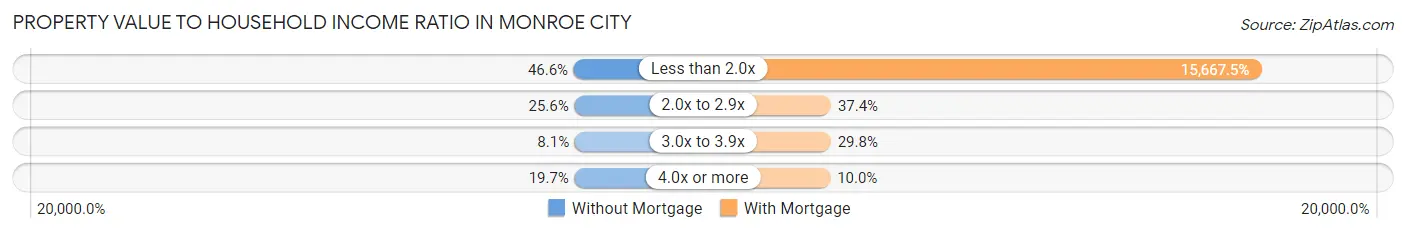
| Value-to-Income Ratio | Without Mortgage | With Mortgage |
| Less than 2.0x | 109 (46.6%) | 57,813 (15,667.5%) |
| 2.0x to 2.9x | 60 (25.6%) | 138 (37.4%) |
| 3.0x to 3.9x | 19 (8.1%) | 110 (29.8%) |
| 4.0x or more | 46 (19.7%) | 37 (10.0%) |
| Total | 234 (100.0%) | 369 (100.0%) |
Real Estate Taxes by Mortgage Status in Monroe City
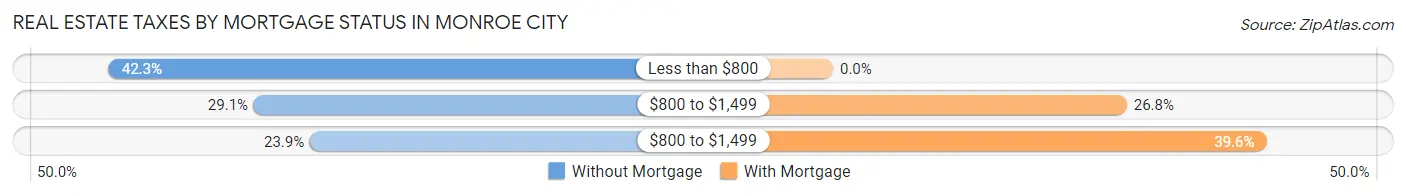
| Property Taxes | Without Mortgage | With Mortgage |
| Less than $800 | 99 (42.3%) | 0 (0.0%) |
| $800 to $1,499 | 68 (29.1%) | 99 (26.8%) |
| $800 to $1,499 | 56 (23.9%) | 146 (39.6%) |
| Total | 234 (100.0%) | 369 (100.0%) |
Health & Disability in Monroe City
Health Insurance Coverage by Age in Monroe City
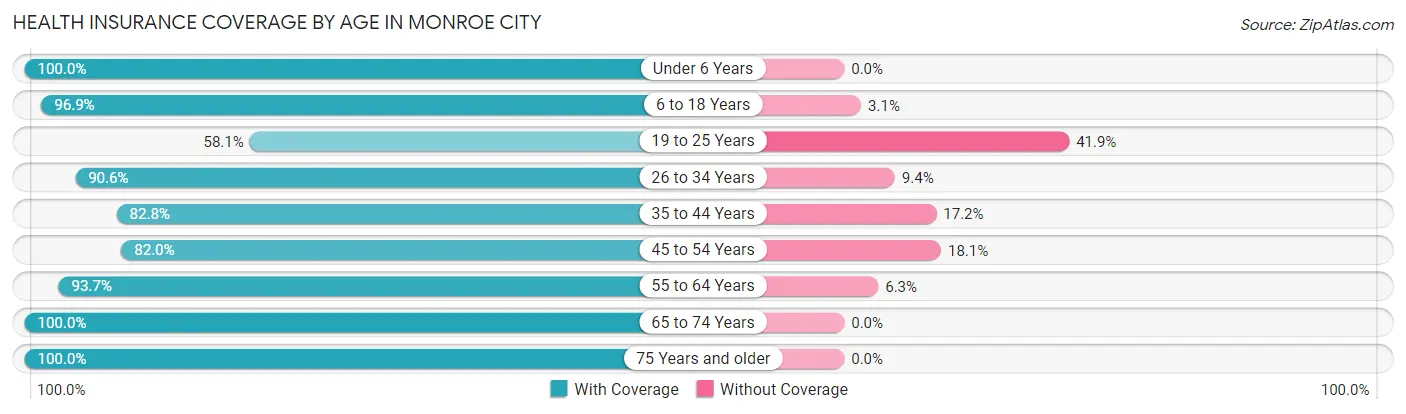
| Age Bracket | With Coverage | Without Coverage |
| Under 6 Years | 295 (100.0%) | 0 (0.0%) |
| 6 to 18 Years | 555 (96.9%) | 18 (3.1%) |
| 19 to 25 Years | 162 (58.1%) | 117 (41.9%) |
| 26 to 34 Years | 259 (90.6%) | 27 (9.4%) |
| 35 to 44 Years | 410 (82.8%) | 85 (17.2%) |
| 45 to 54 Years | 286 (82.0%) | 63 (18.0%) |
| 55 to 64 Years | 325 (93.7%) | 22 (6.3%) |
| 65 to 74 Years | 293 (100.0%) | 0 (0.0%) |
| 75 Years and older | 198 (100.0%) | 0 (0.0%) |
| Total | 2,783 (89.3%) | 332 (10.7%) |
Health Insurance Coverage by Citizenship Status in Monroe City
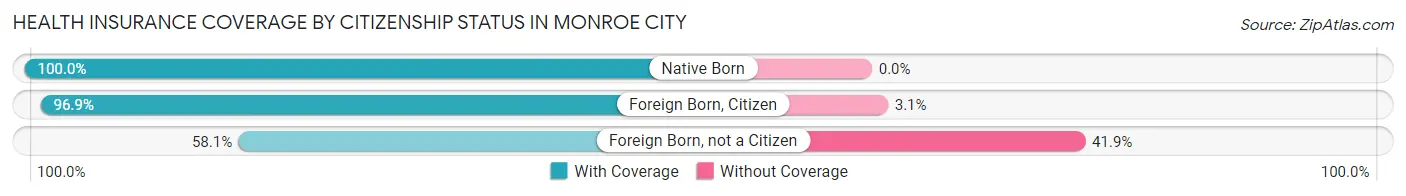
| Citizenship Status | With Coverage | Without Coverage |
| Native Born | 295 (100.0%) | 0 (0.0%) |
| Foreign Born, Citizen | 555 (96.9%) | 18 (3.1%) |
| Foreign Born, not a Citizen | 162 (58.1%) | 117 (41.9%) |
Health Insurance Coverage by Household Income in Monroe City
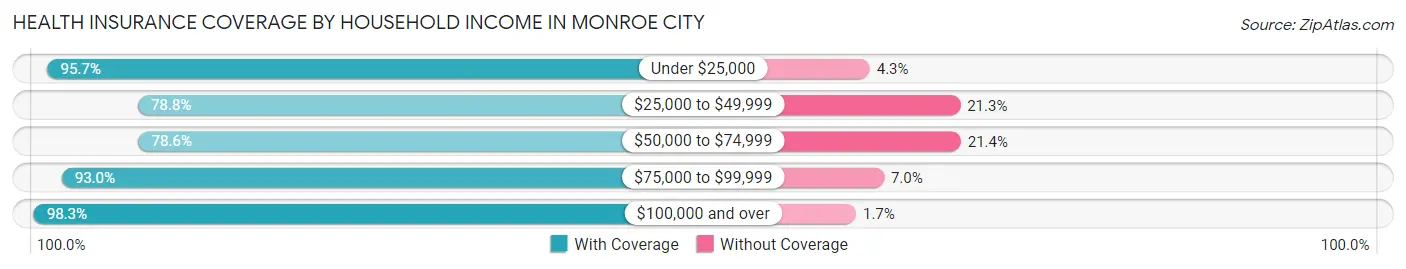
| Household Income | With Coverage | Without Coverage |
| Under $25,000 | 422 (95.7%) | 19 (4.3%) |
| $25,000 to $49,999 | 556 (78.7%) | 150 (21.2%) |
| $50,000 to $74,999 | 405 (78.6%) | 110 (21.4%) |
| $75,000 to $99,999 | 507 (93.0%) | 38 (7.0%) |
| $100,000 and over | 854 (98.3%) | 15 (1.7%) |
Public vs Private Health Insurance Coverage by Age in Monroe City
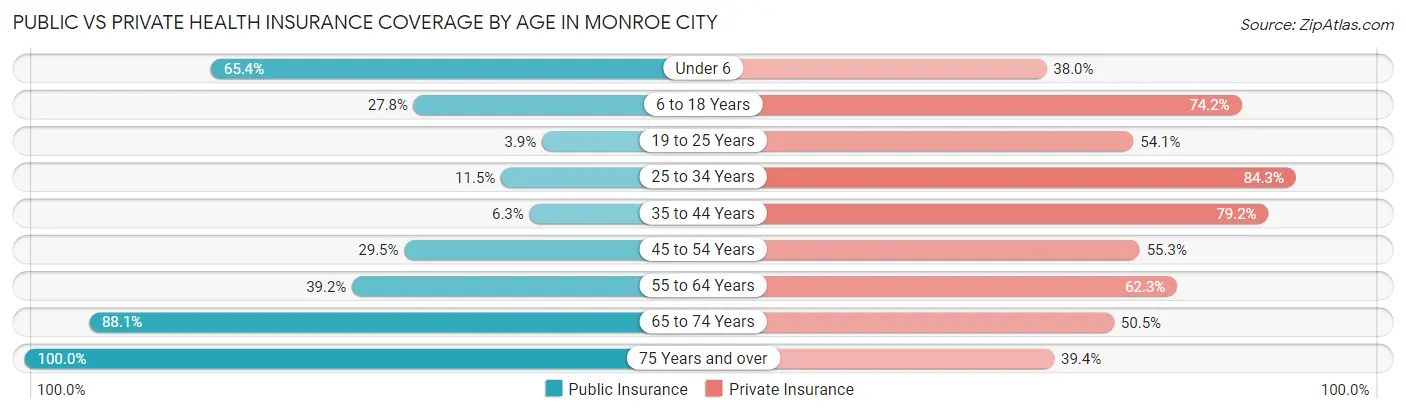
| Age Bracket | Public Insurance | Private Insurance |
| Under 6 | 193 (65.4%) | 112 (38.0%) |
| 6 to 18 Years | 159 (27.8%) | 425 (74.2%) |
| 19 to 25 Years | 11 (3.9%) | 151 (54.1%) |
| 25 to 34 Years | 33 (11.5%) | 241 (84.3%) |
| 35 to 44 Years | 31 (6.3%) | 392 (79.2%) |
| 45 to 54 Years | 103 (29.5%) | 193 (55.3%) |
| 55 to 64 Years | 136 (39.2%) | 216 (62.3%) |
| 65 to 74 Years | 258 (88.0%) | 148 (50.5%) |
| 75 Years and over | 198 (100.0%) | 78 (39.4%) |
| Total | 1,122 (36.0%) | 1,956 (62.8%) |
Disability Status by Sex by Age in Monroe City
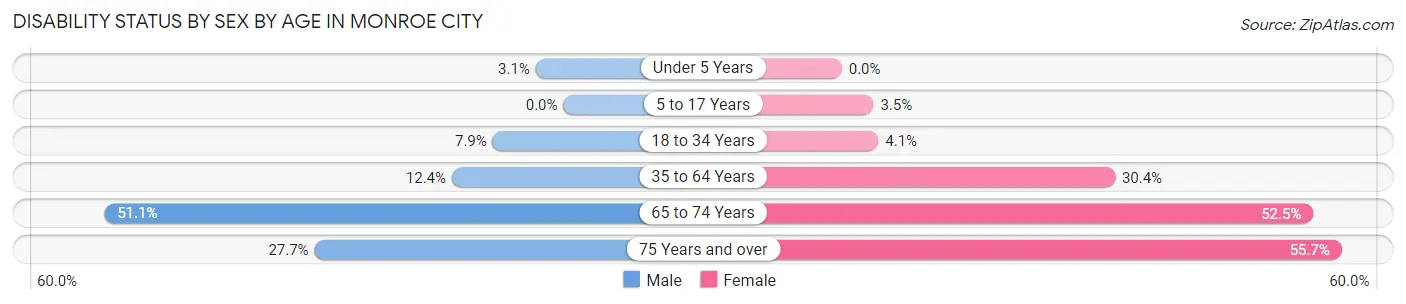
| Age Bracket | Male | Female |
| Under 5 Years | 4 (3.1%) | 0 (0.0%) |
| 5 to 17 Years | 0 (0.0%) | 10 (3.5%) |
| 18 to 34 Years | 23 (7.9%) | 12 (4.1%) |
| 35 to 64 Years | 74 (12.4%) | 181 (30.4%) |
| 65 to 74 Years | 68 (51.1%) | 84 (52.5%) |
| 75 Years and over | 28 (27.7%) | 54 (55.7%) |
Disability Class by Sex by Age in Monroe City
Disability Class: Hearing Difficulty
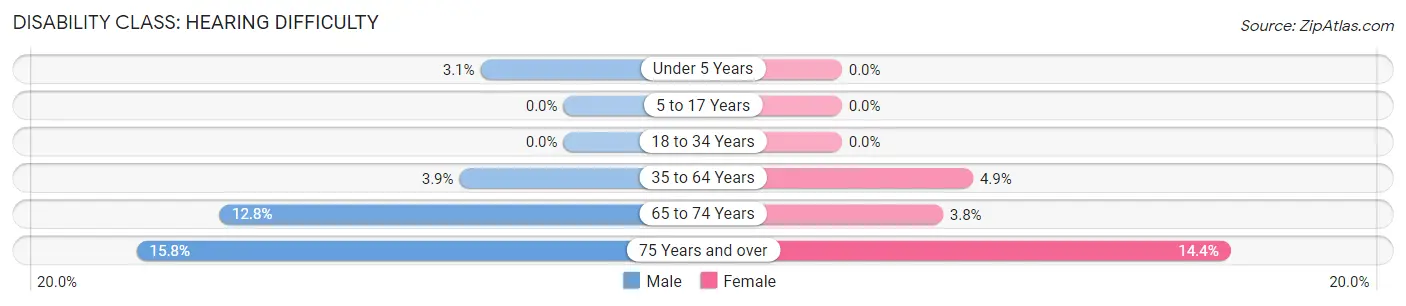
| Age Bracket | Male | Female |
| Under 5 Years | 4 (3.1%) | 0 (0.0%) |
| 5 to 17 Years | 0 (0.0%) | 0 (0.0%) |
| 18 to 34 Years | 0 (0.0%) | 0 (0.0%) |
| 35 to 64 Years | 23 (3.9%) | 29 (4.9%) |
| 65 to 74 Years | 17 (12.8%) | 6 (3.7%) |
| 75 Years and over | 16 (15.8%) | 14 (14.4%) |
Disability Class: Vision Difficulty
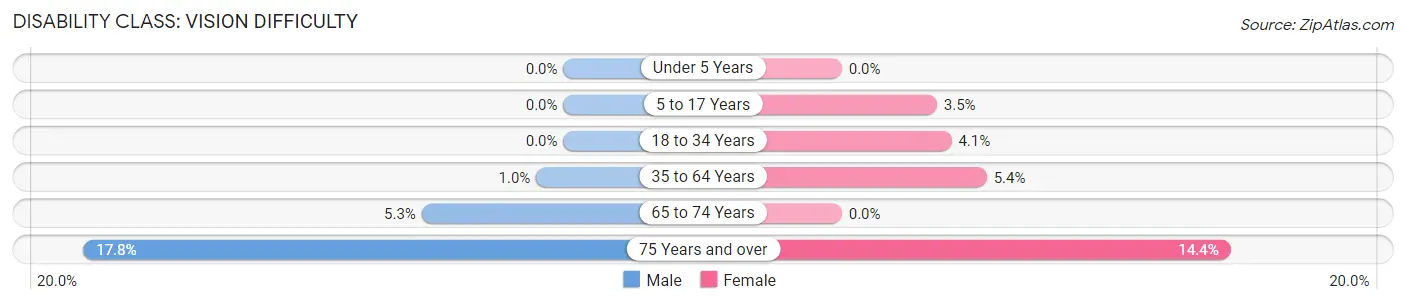
| Age Bracket | Male | Female |
| Under 5 Years | 0 (0.0%) | 0 (0.0%) |
| 5 to 17 Years | 0 (0.0%) | 10 (3.5%) |
| 18 to 34 Years | 0 (0.0%) | 12 (4.1%) |
| 35 to 64 Years | 6 (1.0%) | 32 (5.4%) |
| 65 to 74 Years | 7 (5.3%) | 0 (0.0%) |
| 75 Years and over | 18 (17.8%) | 14 (14.4%) |
Disability Class: Cognitive Difficulty
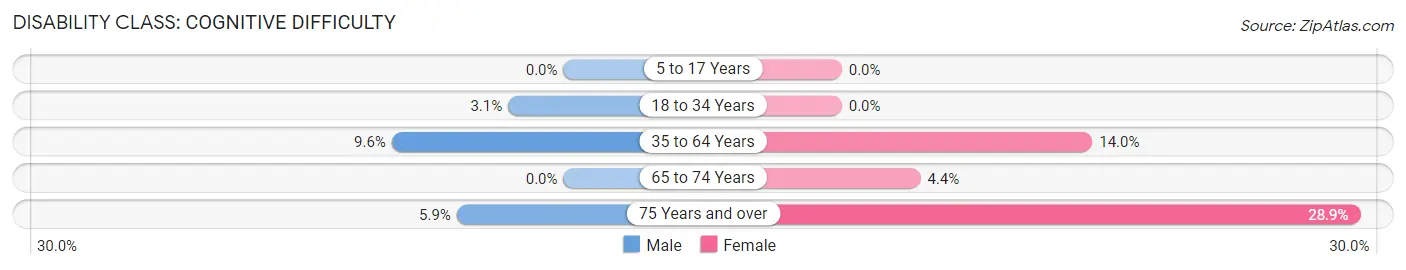
| Age Bracket | Male | Female |
| 5 to 17 Years | 0 (0.0%) | 0 (0.0%) |
| 18 to 34 Years | 9 (3.1%) | 0 (0.0%) |
| 35 to 64 Years | 57 (9.6%) | 83 (14.0%) |
| 65 to 74 Years | 0 (0.0%) | 7 (4.4%) |
| 75 Years and over | 6 (5.9%) | 28 (28.9%) |
Disability Class: Ambulatory Difficulty
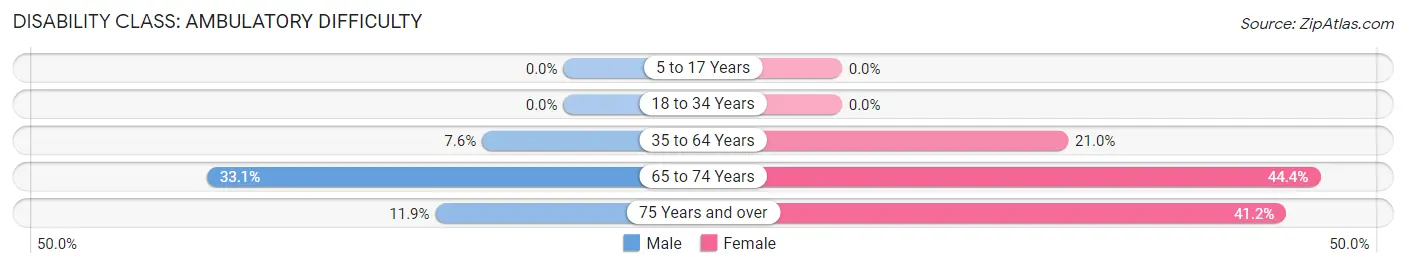
| Age Bracket | Male | Female |
| 5 to 17 Years | 0 (0.0%) | 0 (0.0%) |
| 18 to 34 Years | 0 (0.0%) | 0 (0.0%) |
| 35 to 64 Years | 45 (7.5%) | 125 (21.0%) |
| 65 to 74 Years | 44 (33.1%) | 71 (44.4%) |
| 75 Years and over | 12 (11.9%) | 40 (41.2%) |
Disability Class: Self-Care Difficulty
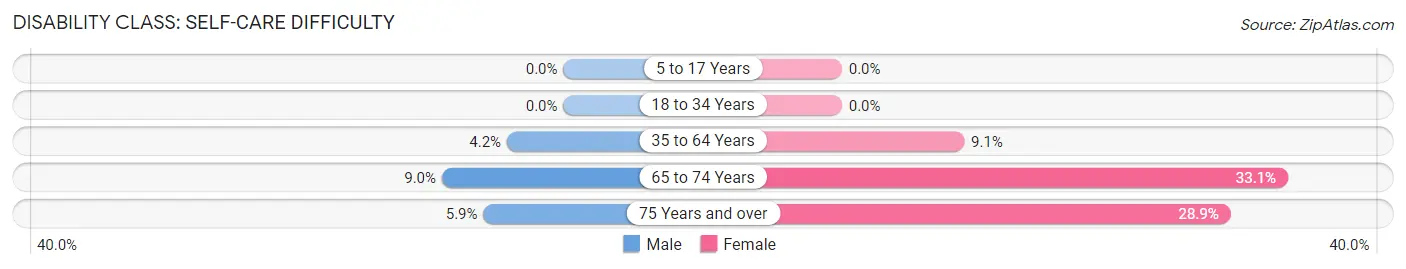
| Age Bracket | Male | Female |
| 5 to 17 Years | 0 (0.0%) | 0 (0.0%) |
| 18 to 34 Years | 0 (0.0%) | 0 (0.0%) |
| 35 to 64 Years | 25 (4.2%) | 54 (9.1%) |
| 65 to 74 Years | 12 (9.0%) | 53 (33.1%) |
| 75 Years and over | 6 (5.9%) | 28 (28.9%) |
Technology Access in Monroe City
Computing Device Access in Monroe City
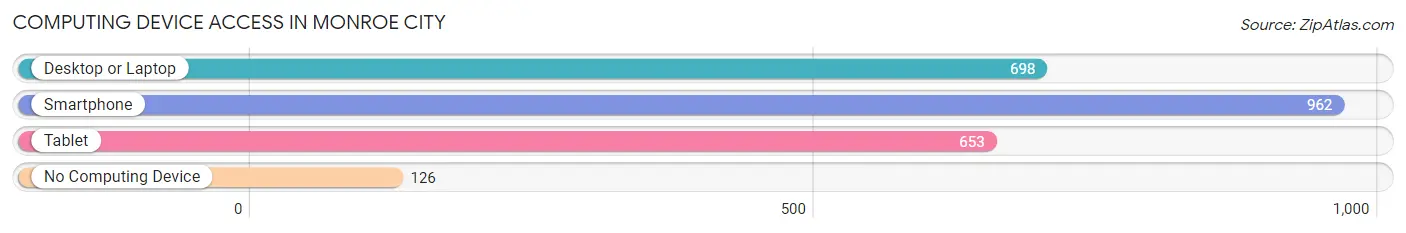
| Device Type | # Households | % Households |
| Desktop or Laptop | 698 | 60.4% |
| Smartphone | 962 | 83.2% |
| Tablet | 653 | 56.5% |
| No Computing Device | 126 | 10.9% |
| Total | 1,156 | 100.0% |
Internet Access in Monroe City
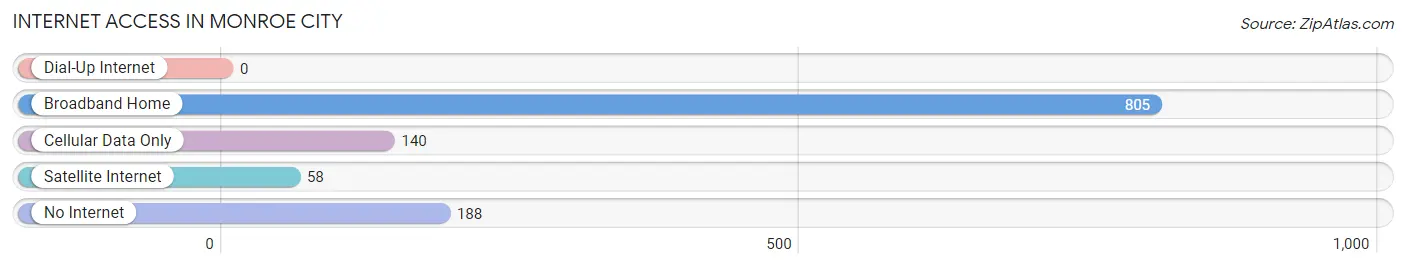
| Internet Type | # Households | % Households |
| Dial-Up Internet | 0 | 0.0% |
| Broadband Home | 805 | 69.6% |
| Cellular Data Only | 140 | 12.1% |
| Satellite Internet | 58 | 5.0% |
| No Internet | 188 | 16.3% |
| Total | 1,156 | 100.0% |
Monroe City Summary
Monroe City is a small city located in the northeast corner of Missouri, in Marion County. It is situated on the banks of the Mississippi River, and is the county seat of Marion County. The city has a population of 2,845, according to the 2010 census.
History
Monroe City was founded in 1820 by William Monroe, a Revolutionary War veteran. The city was named after him, and was incorporated in 1837. The city was a major stop on the Hannibal and St. Joseph Railroad, which connected Hannibal, Missouri to St. Joseph, Missouri. The railroad was a major factor in the growth of the city, and it was a major hub for the transportation of goods and people.
In the late 19th century, Monroe City was a major center for the production of tobacco. The city was home to several tobacco warehouses, and the city was known for its high quality tobacco. The city was also home to several factories, including a flour mill, a furniture factory, and a shoe factory.
Geography
Monroe City is located in the northeast corner of Missouri, in Marion County. It is situated on the banks of the Mississippi River, and is the county seat of Marion County. The city has a total area of 2.2 square miles, all of which is land. The city is located in the Central Lowland region of the United States, and is part of the Mississippi River Valley.
The climate in Monroe City is humid continental, with hot, humid summers and cold, dry winters. The average temperature in the summer is around 80 degrees Fahrenheit, and the average temperature in the winter is around 30 degrees Fahrenheit.
Economy
The economy of Monroe City is largely based on agriculture and manufacturing. The city is home to several large farms, and the surrounding area is known for its production of corn, soybeans, and wheat. The city is also home to several manufacturing companies, including a furniture factory, a shoe factory, and a flour mill.
The city is also home to several small businesses, including restaurants, retail stores, and service providers. The city is also home to several banks, and the city is served by the Marion County Bank.
Demographics
According to the 2010 census, Monroe City has a population of 2,845. The population is made up of 97.3% White, 0.7% African American, 0.3% Native American, 0.2% Asian, 0.1% Pacific Islander, 0.3% from other races, and 1.1% from two or more races. The median household income in Monroe City is $37,917, and the median family income is $45,938. The per capita income in Monroe City is $19,845.
Monroe City is served by the Monroe City R-1 School District, which consists of one elementary school, one middle school, and one high school. The city is also home to several churches, including the First Baptist Church, the First United Methodist Church, and the Church of the Nazarene.
Common Questions
What is the Total Population of Monroe City?
Total Population of Monroe City is 3,176.
What is the Total Male Population of Monroe City?
Total Male Population of Monroe City is 1,591.
What is the Total Female Population of Monroe City?
Total Female Population of Monroe City is 1,585.
What is the Ratio of Males per 100 Females in Monroe City?
There are 100.38 Males per 100 Females in Monroe City.
What is the Ratio of Females per 100 Males in Monroe City?
There are 99.62 Females per 100 Males in Monroe City.
What is the Median Population Age in Monroe City?
Median Population Age in Monroe City is 40.1 Years.
What is the Average Family Size in Monroe City
Average Family Size in Monroe City is 3.3 People.
What is the Average Household Size in Monroe City
Average Household Size in Monroe City is 2.7 People.
What is Per Capita Income in Monroe City?
Per Capita income in Monroe City is $25,959.
What is the Median Family Income in Monroe City?
Median Family Income in Monroe City is $71,346.
What is the Median Household income in Monroe City?
Median Household Income in Monroe City is $50,885.
What is Income or Wage Gap in Monroe City?
Income or Wage Gap in Monroe City is 12.7%.
Women in Monroe City earn 87.3 cents for every dollar earned by a man.
What is Inequality or Gini Index in Monroe City?
Inequality or Gini Index in Monroe City is 0.43.
How Large is the Labor Force in Monroe City?
There are 1,448 People in the Labor Forcein in Monroe City.
What is the Percentage of People in the Labor Force in Monroe City?
59.2% of People are in the Labor Force in Monroe City.
What is the Unemployment Rate in Monroe City?
Unemployment Rate in Monroe City is 0.5%.