Byrnes Mill, MO
Byrnes Mill Map
Byrnes Mill Overview
3,155
TOTAL POPULATION
1,761
MALE POPULATION
1,394
FEMALE POPULATION
126.33
MALES / 100 FEMALES
79.16
FEMALES / 100 MALES
39.8
MEDIAN AGE
3.1
AVG FAMILY SIZE
2.6
AVG HOUSEHOLD SIZE
$33,353
PER CAPITA INCOME
$99,667
AVG FAMILY INCOME
$65,156
AVG HOUSEHOLD INCOME
30.9%
WAGE / INCOME GAP [ % ]
69.1¢/ $1
WAGE / INCOME GAP [ $ ]
0.40
INEQUALITY / GINI INDEX
1,288
LABOR FORCE [ PEOPLE ]
54.7%
PERCENT IN LABOR FORCE
1.7%
UNEMPLOYMENT RATE
Byrnes Mill Area Codes
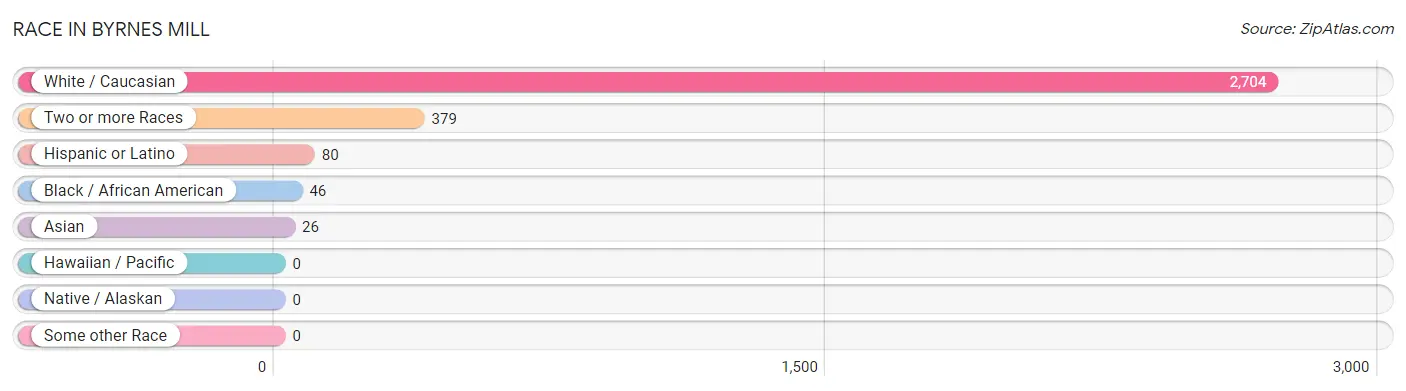
Race in Byrnes Mill
The most populous races in Byrnes Mill are White / Caucasian (2,704 | 85.7%), Two or more Races (379 | 12.0%), and Hispanic or Latino (80 | 2.5%).
| Race | # Population | % Population |
| Asian | 26 | 0.8% |
| Black / African American | 46 | 1.5% |
| Hawaiian / Pacific | 0 | 0.0% |
| Hispanic or Latino | 80 | 2.5% |
| Native / Alaskan | 0 | 0.0% |
| White / Caucasian | 2,704 | 85.7% |
| Two or more Races | 379 | 12.0% |
| Some other Race | 0 | 0.0% |
| Total | 3,155 | 100.0% |
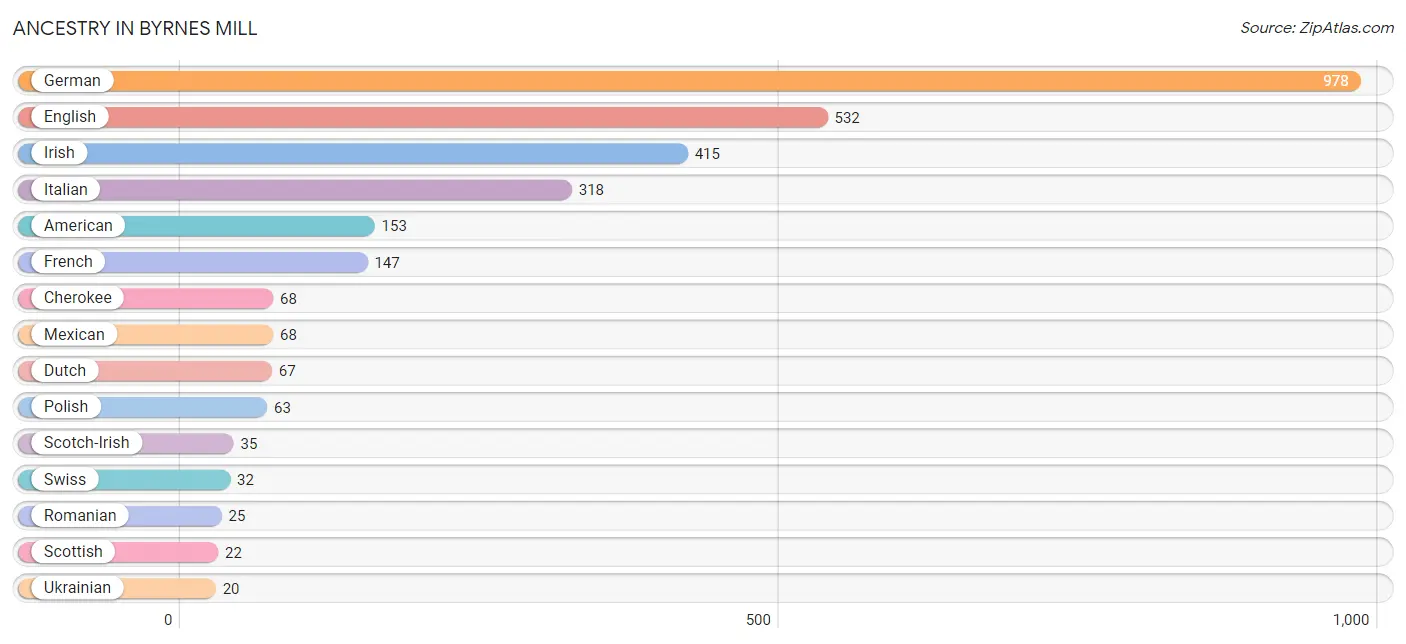
Ancestry in Byrnes Mill
The most populous ancestries reported in Byrnes Mill are German (978 | 31.0%), English (532 | 16.9%), Irish (415 | 13.2%), Italian (318 | 10.1%), and American (153 | 4.9%), together accounting for 75.9% of all Byrnes Mill residents.
| Ancestry | # Population | % Population |
| African | 6 | 0.2% |
| American | 153 | 4.9% |
| Burmese | 7 | 0.2% |
| Celtic | 5 | 0.2% |
| Cherokee | 68 | 2.2% |
| Chickasaw | 3 | 0.1% |
| Croatian | 17 | 0.5% |
| Cuban | 12 | 0.4% |
| Czech | 6 | 0.2% |
| Czechoslovakian | 7 | 0.2% |
| Danish | 7 | 0.2% |
| Dutch | 67 | 2.1% |
| Eastern European | 15 | 0.5% |
| English | 532 | 16.9% |
| European | 12 | 0.4% |
| French | 147 | 4.7% |
| French American Indian | 9 | 0.3% |
| German | 978 | 31.0% |
| Irish | 415 | 13.2% |
| Italian | 318 | 10.1% |
| Korean | 19 | 0.6% |
| Mexican | 68 | 2.2% |
| Norwegian | 3 | 0.1% |
| Polish | 63 | 2.0% |
| Portuguese | 9 | 0.3% |
| Romanian | 25 | 0.8% |
| Russian | 15 | 0.5% |
| Scandinavian | 8 | 0.3% |
| Scotch-Irish | 35 | 1.1% |
| Scottish | 22 | 0.7% |
| Subsaharan African | 6 | 0.2% |
| Swiss | 32 | 1.0% |
| Ukrainian | 20 | 0.6% | View All 33 Rows |
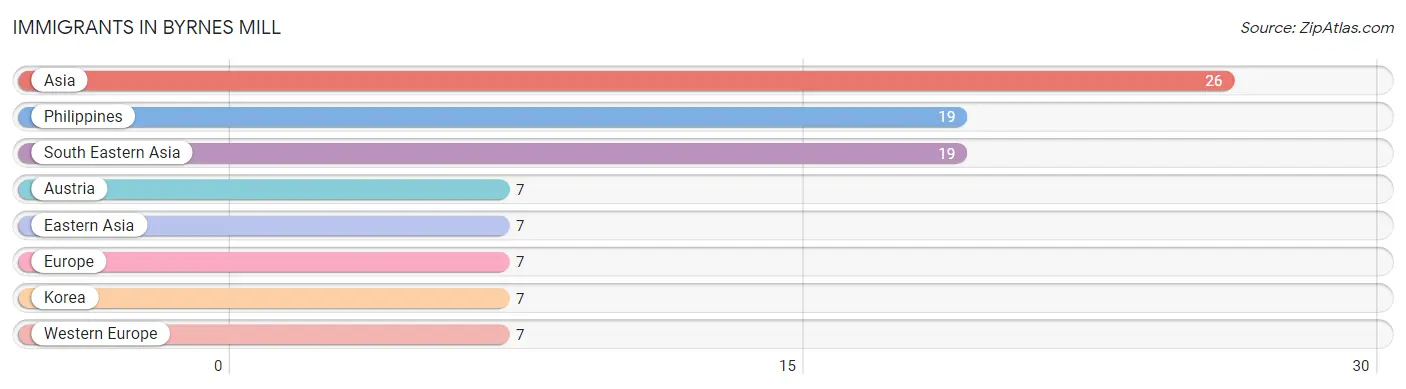
Immigrants in Byrnes Mill
The most numerous immigrant groups reported in Byrnes Mill came from Asia (26 | 0.8%), Philippines (19 | 0.6%), South Eastern Asia (19 | 0.6%), Austria (7 | 0.2%), and Eastern Asia (7 | 0.2%), together accounting for 2.5% of all Byrnes Mill residents.
| Immigration Origin | # Population | % Population |
| Asia | 26 | 0.8% |
| Austria | 7 | 0.2% |
| Eastern Asia | 7 | 0.2% |
| Europe | 7 | 0.2% |
| Korea | 7 | 0.2% |
| Philippines | 19 | 0.6% |
| South Eastern Asia | 19 | 0.6% |
| Western Europe | 7 | 0.2% | View All 8 Rows |
Sex and Age in Byrnes Mill
Sex and Age in Byrnes Mill
The most populous age groups in Byrnes Mill are 10 to 14 Years (238 | 13.5%) for men and 35 to 39 Years (173 | 12.4%) for women.
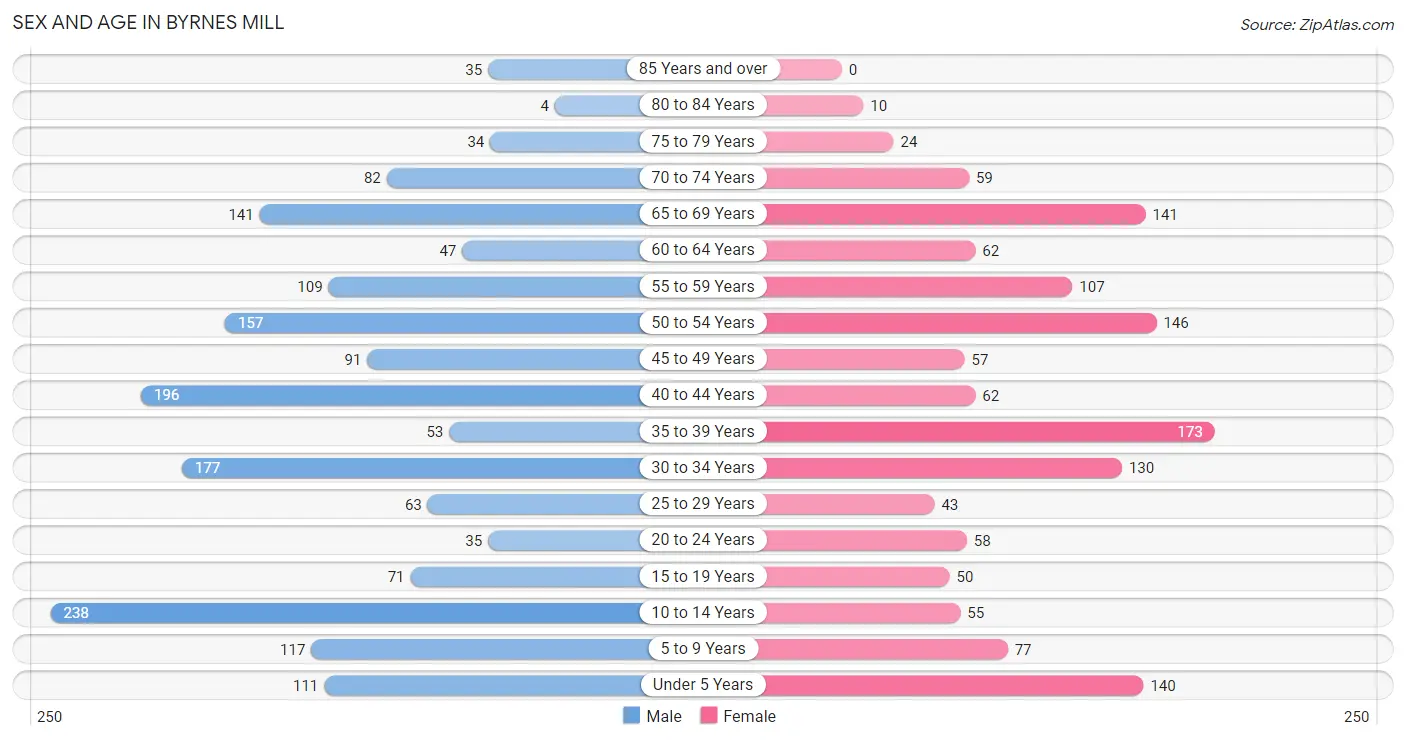
| Age Bracket | Male | Female |
| Under 5 Years | 111 (6.3%) | 140 (10.0%) |
| 5 to 9 Years | 117 (6.6%) | 77 (5.5%) |
| 10 to 14 Years | 238 (13.5%) | 55 (4.0%) |
| 15 to 19 Years | 71 (4.0%) | 50 (3.6%) |
| 20 to 24 Years | 35 (2.0%) | 58 (4.2%) |
| 25 to 29 Years | 63 (3.6%) | 43 (3.1%) |
| 30 to 34 Years | 177 (10.1%) | 130 (9.3%) |
| 35 to 39 Years | 53 (3.0%) | 173 (12.4%) |
| 40 to 44 Years | 196 (11.1%) | 62 (4.4%) |
| 45 to 49 Years | 91 (5.2%) | 57 (4.1%) |
| 50 to 54 Years | 157 (8.9%) | 146 (10.5%) |
| 55 to 59 Years | 109 (6.2%) | 107 (7.7%) |
| 60 to 64 Years | 47 (2.7%) | 62 (4.4%) |
| 65 to 69 Years | 141 (8.0%) | 141 (10.1%) |
| 70 to 74 Years | 82 (4.7%) | 59 (4.2%) |
| 75 to 79 Years | 34 (1.9%) | 24 (1.7%) |
| 80 to 84 Years | 4 (0.2%) | 10 (0.7%) |
| 85 Years and over | 35 (2.0%) | 0 (0.0%) |
| Total | 1,761 (100.0%) | 1,394 (100.0%) |
Families and Households in Byrnes Mill
Median Family Size in Byrnes Mill
The median family size in Byrnes Mill is 3.06 persons per family, with single female/mother families (111 | 13.3%) accounting for the largest median family size of 3.51 persons per family. On the other hand, single male/father families (35 | 4.2%) represent the smallest median family size with 2.17 persons per family.
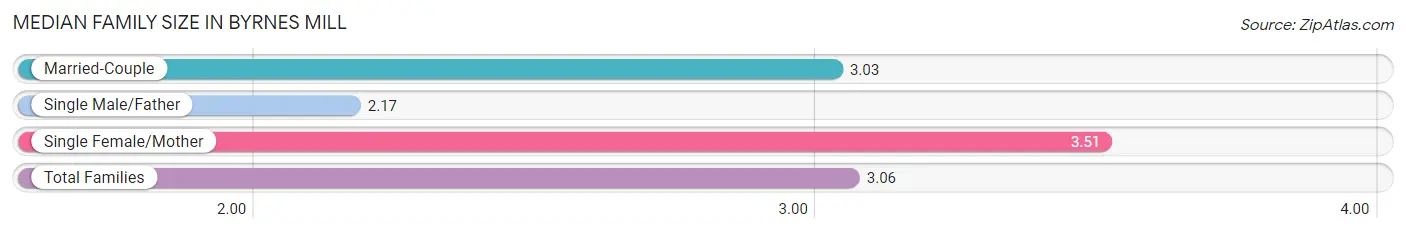
| Family Type | # Families | Family Size |
| Married-Couple | 690 (82.5%) | 3.03 |
| Single Male/Father | 35 (4.2%) | 2.17 |
| Single Female/Mother | 111 (13.3%) | 3.51 |
| Total Families | 836 (100.0%) | 3.06 |
Median Household Size in Byrnes Mill
The median household size in Byrnes Mill is 2.60 persons per household, with single female/mother households (111 | 9.1%) accounting for the largest median household size of 4.21 persons per household. non-family households (377 | 31.1%) represent the smallest median household size with 1.32 persons per household.
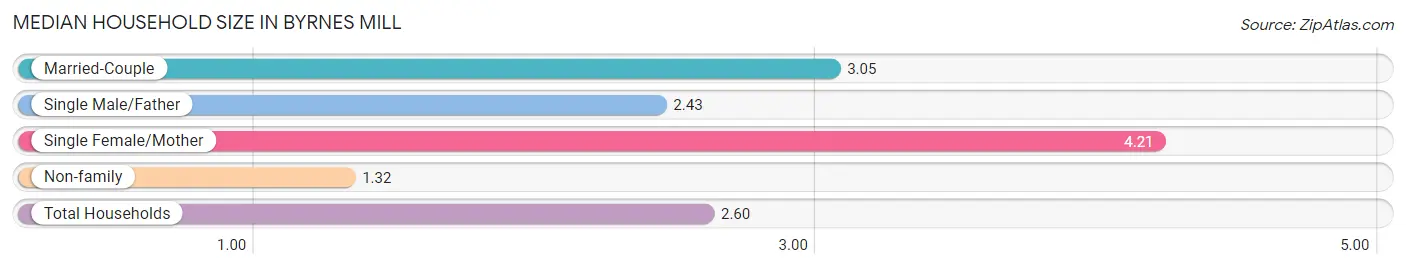
| Household Type | # Households | Household Size |
| Married-Couple | 690 (56.9%) | 3.05 |
| Single Male/Father | 35 (2.9%) | 2.43 |
| Single Female/Mother | 111 (9.1%) | 4.21 |
| Non-family | 377 (31.1%) | 1.32 |
| Total Households | 1,213 (100.0%) | 2.60 |
Household Size by Marriage Status in Byrnes Mill
Out of a total of 1,213 households in Byrnes Mill, 836 (68.9%) are family households, while 377 (31.1%) are nonfamily households. The most numerous type of family households are 2-person households, comprising 370, and the most common type of nonfamily households are 1-person households, comprising 264.
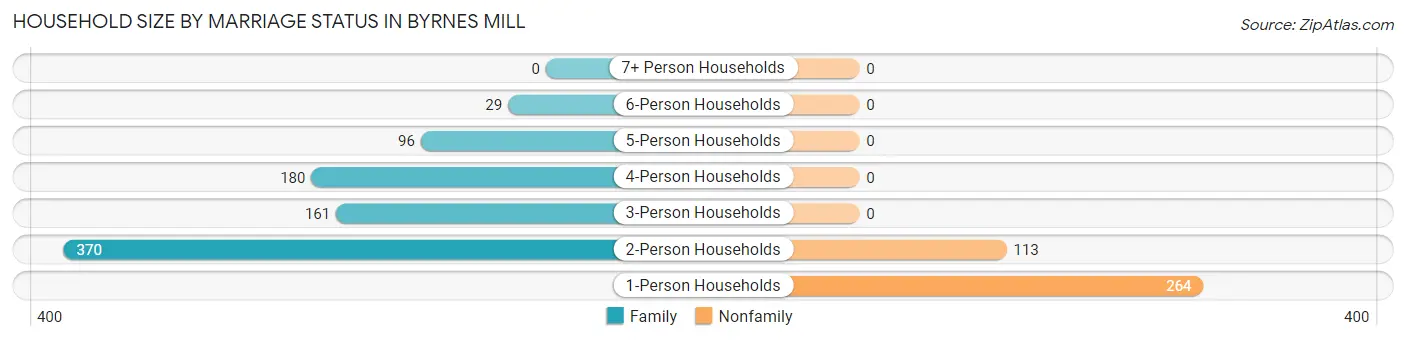
| Household Size | Family Households | Nonfamily Households |
| 1-Person Households | - | 264 (21.8%) |
| 2-Person Households | 370 (30.5%) | 113 (9.3%) |
| 3-Person Households | 161 (13.3%) | 0 (0.0%) |
| 4-Person Households | 180 (14.8%) | 0 (0.0%) |
| 5-Person Households | 96 (7.9%) | 0 (0.0%) |
| 6-Person Households | 29 (2.4%) | 0 (0.0%) |
| 7+ Person Households | 0 (0.0%) | 0 (0.0%) |
| Total | 836 (68.9%) | 377 (31.1%) |
Female Fertility in Byrnes Mill
Fertility by Age in Byrnes Mill
Average fertility rate in Byrnes Mill is 77.0 births per 1,000 women. Women in the age bracket of 20 to 34 years have the highest fertility rate with 152.0 births per 1,000 women. Women in the age bracket of 20 to 34 years acount for 77.8% of all women with births.
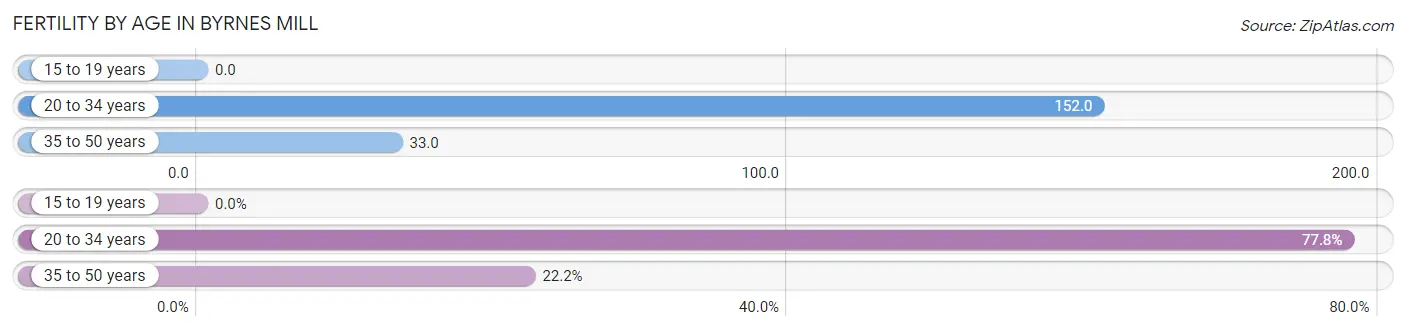
| Age Bracket | Women with Births | Births / 1,000 Women |
| 15 to 19 years | 0 (0.0%) | 0.0 |
| 20 to 34 years | 35 (77.8%) | 152.0 |
| 35 to 50 years | 10 (22.2%) | 33.0 |
| Total | 45 (100.0%) | 77.0 |
Fertility by Age by Marriage Status in Byrnes Mill
80.0% of women with births (45) in Byrnes Mill are married. The highest percentage of unmarried women with births falls into 20 to 34 years age bracket with 25.7% of them unmarried at the time of birth, while the lowest percentage of unmarried women with births belong to 35 to 50 years age bracket with 0.0% of them unmarried.
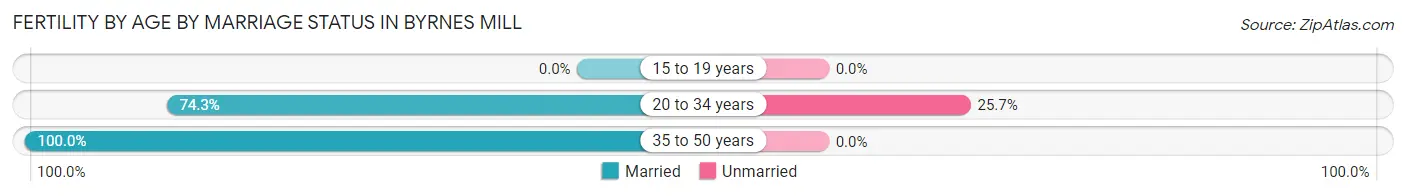
| Age Bracket | Married | Unmarried |
| 15 to 19 years | 0 (0.0%) | 0 (0.0%) |
| 20 to 34 years | 26 (74.3%) | 9 (25.7%) |
| 35 to 50 years | 10 (100.0%) | 0 (0.0%) |
| Total | 36 (80.0%) | 9 (20.0%) |
Fertility by Education in Byrnes Mill
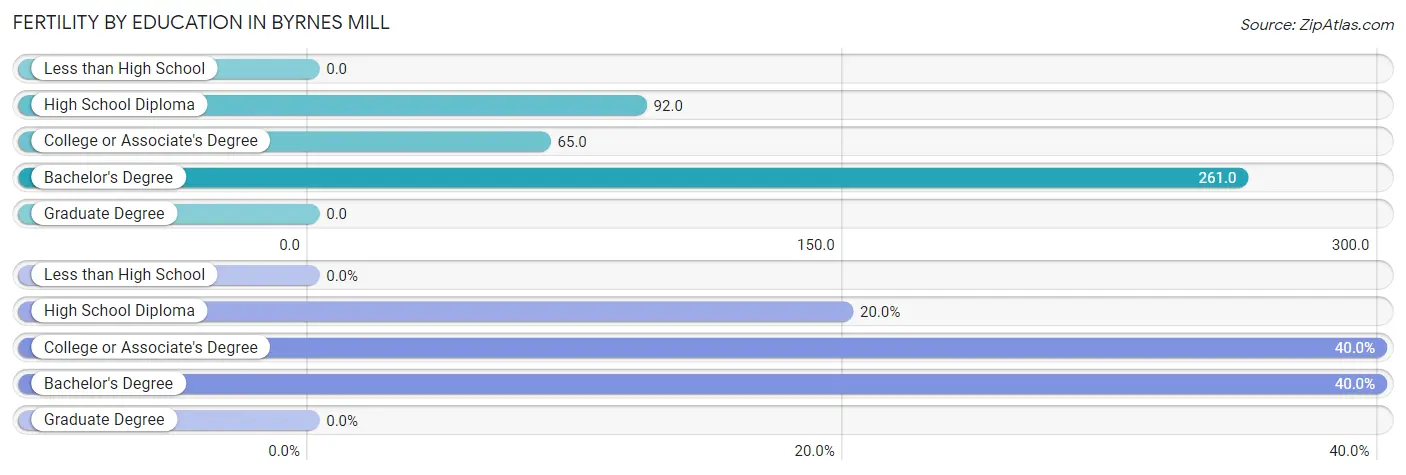
| Educational Attainment | Women with Births | Births / 1,000 Women |
| Less than High School | 0 (0.0%) | 0.0 |
| High School Diploma | 9 (20.0%) | 92.0 |
| College or Associate's Degree | 18 (40.0%) | 65.0 |
| Bachelor's Degree | 18 (40.0%) | 261.0 |
| Graduate Degree | 0 (0.0%) | 0.0 |
| Total | 45 (100.0%) | 77.0 |
Fertility by Education by Marriage Status in Byrnes Mill
20.0% of women with births in Byrnes Mill are unmarried. Women with the educational attainment of college or associate's degree are most likely to be married with 100.0% of them married at childbirth, while women with the educational attainment of high school diploma are least likely to be married with 100.0% of them unmarried at childbirth.
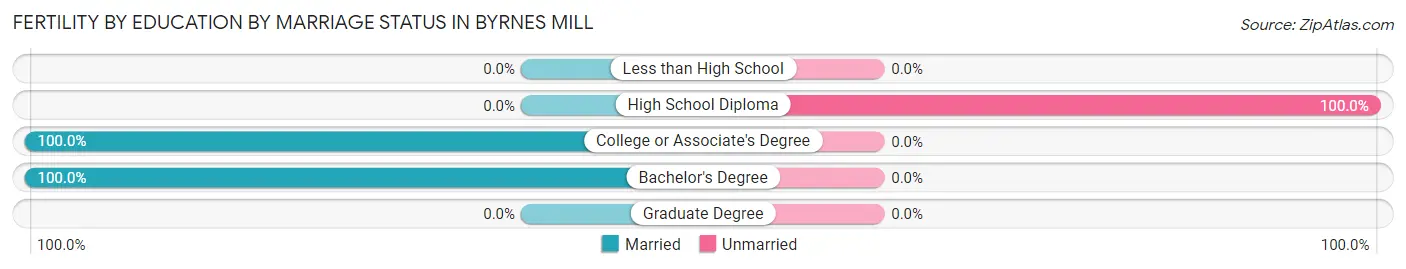
| Educational Attainment | Married | Unmarried |
| Less than High School | 0 (0.0%) | 0 (0.0%) |
| High School Diploma | 0 (0.0%) | 9 (100.0%) |
| College or Associate's Degree | 18 (100.0%) | 0 (0.0%) |
| Bachelor's Degree | 18 (100.0%) | 0 (0.0%) |
| Graduate Degree | 0 (0.0%) | 0 (0.0%) |
| Total | 36 (80.0%) | 9 (20.0%) |
Income in Byrnes Mill
Income Overview in Byrnes Mill
Per Capita Income in Byrnes Mill is $33,353, while median incomes of families and households are $99,667 and $65,156 respectively.
| Characteristic | Number | Measure |
| Per Capita Income | 3,155 | $33,353 |
| Median Family Income | 836 | $99,667 |
| Mean Family Income | 836 | $100,213 |
| Median Household Income | 1,213 | $65,156 |
| Mean Household Income | 1,213 | $85,460 |
| Income Deficit | 836 | $0 |
| Wage / Income Gap (%) | 3,155 | 30.94% |
| Wage / Income Gap ($) | 3,155 | 69.06¢ per $1 |
| Gini / Inequality Index | 3,155 | 0.40 |
Earnings by Sex in Byrnes Mill
Average Earnings in Byrnes Mill are $50,643, $55,639 for men and $38,424 for women, a difference of 30.9%.
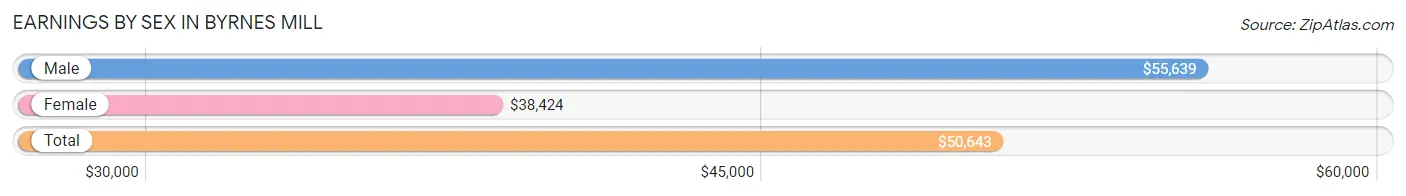
| Sex | Number | Average Earnings |
| Male | 909 (60.6%) | $55,639 |
| Female | 591 (39.4%) | $38,424 |
| Total | 1,500 (100.0%) | $50,643 |
Earnings by Sex by Income Bracket in Byrnes Mill
The most common earnings brackets in Byrnes Mill are $100,000+ for men (190 | 20.9%) and $55,000 to $64,999 for women (97 | 16.4%).
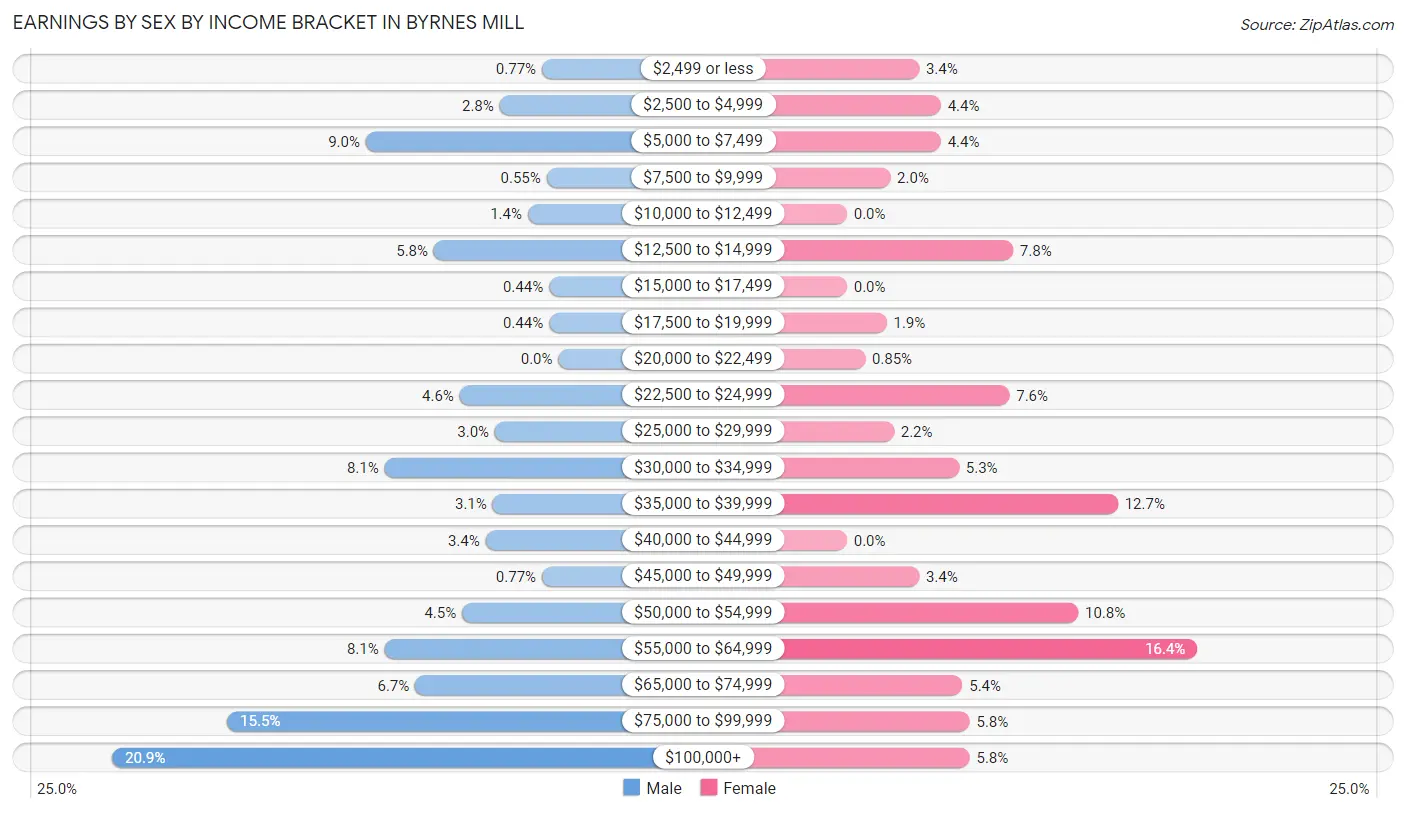
| Income | Male | Female |
| $2,499 or less | 7 (0.8%) | 20 (3.4%) |
| $2,500 to $4,999 | 25 (2.8%) | 26 (4.4%) |
| $5,000 to $7,499 | 82 (9.0%) | 26 (4.4%) |
| $7,500 to $9,999 | 5 (0.5%) | 12 (2.0%) |
| $10,000 to $12,499 | 13 (1.4%) | 0 (0.0%) |
| $12,500 to $14,999 | 53 (5.8%) | 46 (7.8%) |
| $15,000 to $17,499 | 4 (0.4%) | 0 (0.0%) |
| $17,500 to $19,999 | 4 (0.4%) | 11 (1.9%) |
| $20,000 to $22,499 | 0 (0.0%) | 5 (0.9%) |
| $22,500 to $24,999 | 42 (4.6%) | 45 (7.6%) |
| $25,000 to $29,999 | 27 (3.0%) | 13 (2.2%) |
| $30,000 to $34,999 | 74 (8.1%) | 31 (5.2%) |
| $35,000 to $39,999 | 28 (3.1%) | 75 (12.7%) |
| $40,000 to $44,999 | 31 (3.4%) | 0 (0.0%) |
| $45,000 to $49,999 | 7 (0.8%) | 20 (3.4%) |
| $50,000 to $54,999 | 41 (4.5%) | 64 (10.8%) |
| $55,000 to $64,999 | 74 (8.1%) | 97 (16.4%) |
| $65,000 to $74,999 | 61 (6.7%) | 32 (5.4%) |
| $75,000 to $99,999 | 141 (15.5%) | 34 (5.8%) |
| $100,000+ | 190 (20.9%) | 34 (5.8%) |
| Total | 909 (100.0%) | 591 (100.0%) |
Earnings by Sex by Educational Attainment in Byrnes Mill
Average earnings in Byrnes Mill are $56,889 for men and $50,129 for women, a difference of 11.9%. Men with an educational attainment of bachelor's degree enjoy the highest average annual earnings of $125,403, while those with college or associate's degree education earn the least with $73,542. Women with an educational attainment of graduate degree earn the most with the average annual earnings of $80,357, while those with college or associate's degree education have the smallest earnings of $37,470.
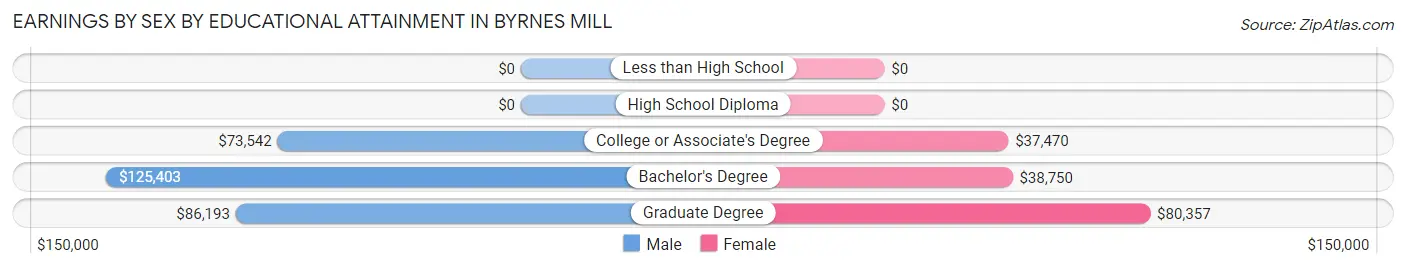
| Educational Attainment | Male Income | Female Income |
| Less than High School | - | - |
| High School Diploma | - | - |
| College or Associate's Degree | $73,542 | $37,470 |
| Bachelor's Degree | $125,403 | $38,750 |
| Graduate Degree | $86,193 | $80,357 |
| Total | $56,889 | $50,129 |
Family Income in Byrnes Mill
Family Income Brackets in Byrnes Mill
According to the Byrnes Mill family income data, there are 245 families falling into the $100,000 to $149,999 income range, which is the most common income bracket and makes up 29.3% of all families. Conversely, the less than $10,000 income bracket is the least frequent group with only 18 families (2.1%) belonging to this category.
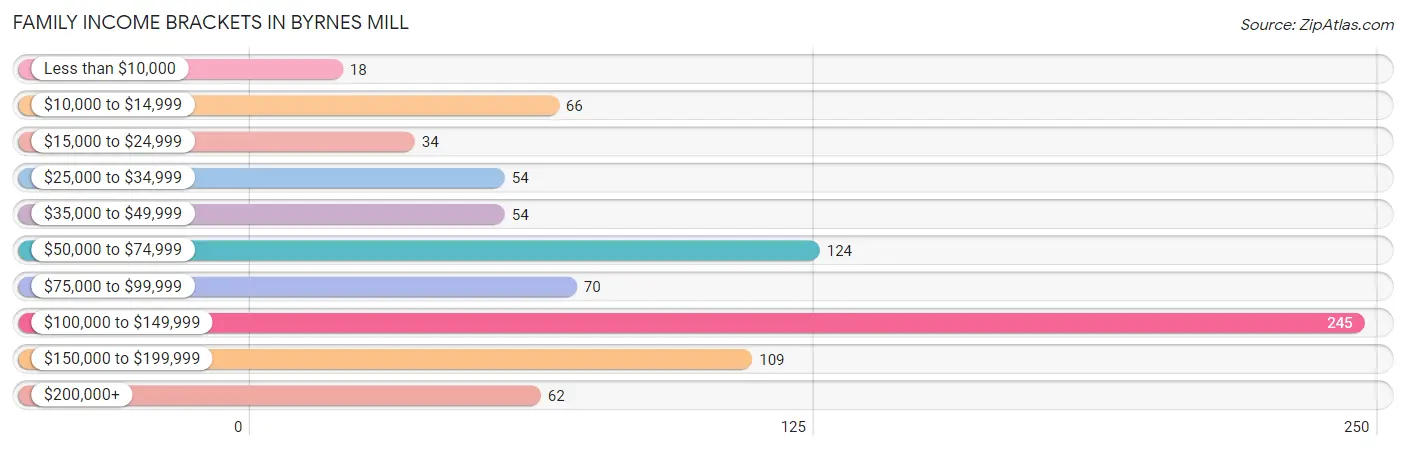
| Income Bracket | # Families | % Families |
| Less than $10,000 | 18 | 2.2% |
| $10,000 to $14,999 | 66 | 7.9% |
| $15,000 to $24,999 | 34 | 4.1% |
| $25,000 to $34,999 | 54 | 6.5% |
| $35,000 to $49,999 | 54 | 6.5% |
| $50,000 to $74,999 | 124 | 14.8% |
| $75,000 to $99,999 | 70 | 8.4% |
| $100,000 to $149,999 | 245 | 29.3% |
| $150,000 to $199,999 | 109 | 13.0% |
| $200,000+ | 62 | 7.4% |
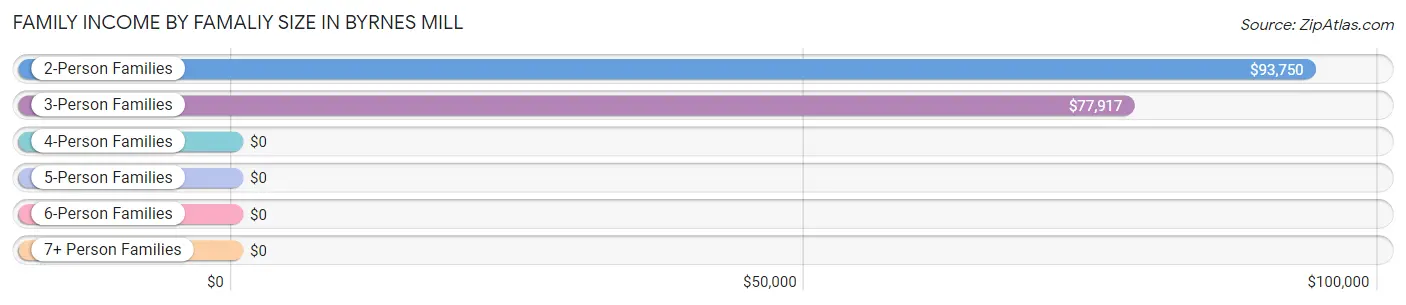
Family Income by Famaliy Size in Byrnes Mill
2-person families (398 | 47.6%) account for the highest median family income in Byrnes Mill with $93,750 per family, while 2-person families (398 | 47.6%) have the highest median income of $46,875 per family member.
| Income Bracket | # Families | Median Income |
| 2-Person Families | 398 (47.6%) | $93,750 |
| 3-Person Families | 186 (22.3%) | $77,917 |
| 4-Person Families | 127 (15.2%) | $0 |
| 5-Person Families | 114 (13.6%) | $0 |
| 6-Person Families | 11 (1.3%) | $0 |
| 7+ Person Families | 0 (0.0%) | $0 |
| Total | 836 (100.0%) | $99,667 |
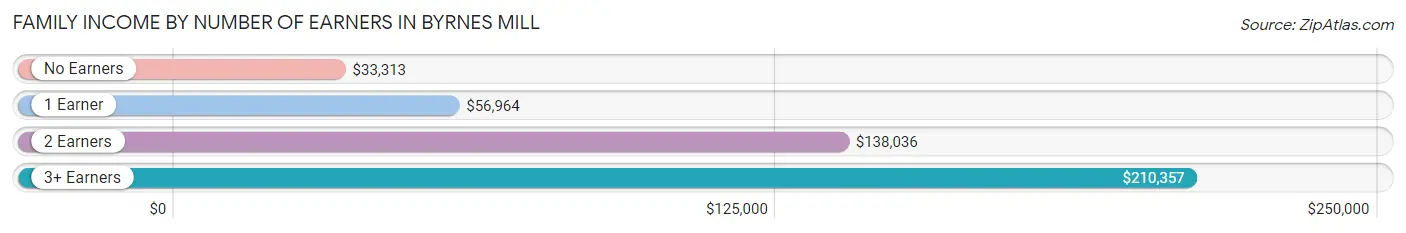
Family Income by Number of Earners in Byrnes Mill
The median family income in Byrnes Mill is $99,667, with families comprising 3+ earners (38) having the highest median family income of $210,357, while families with no earners (208) have the lowest median family income of $33,313, accounting for 4.5% and 24.9% of families, respectively.
| Number of Earners | # Families | Median Income |
| No Earners | 208 (24.9%) | $33,313 |
| 1 Earner | 251 (30.0%) | $56,964 |
| 2 Earners | 339 (40.6%) | $138,036 |
| 3+ Earners | 38 (4.5%) | $210,357 |
| Total | 836 (100.0%) | $99,667 |
Household Income in Byrnes Mill
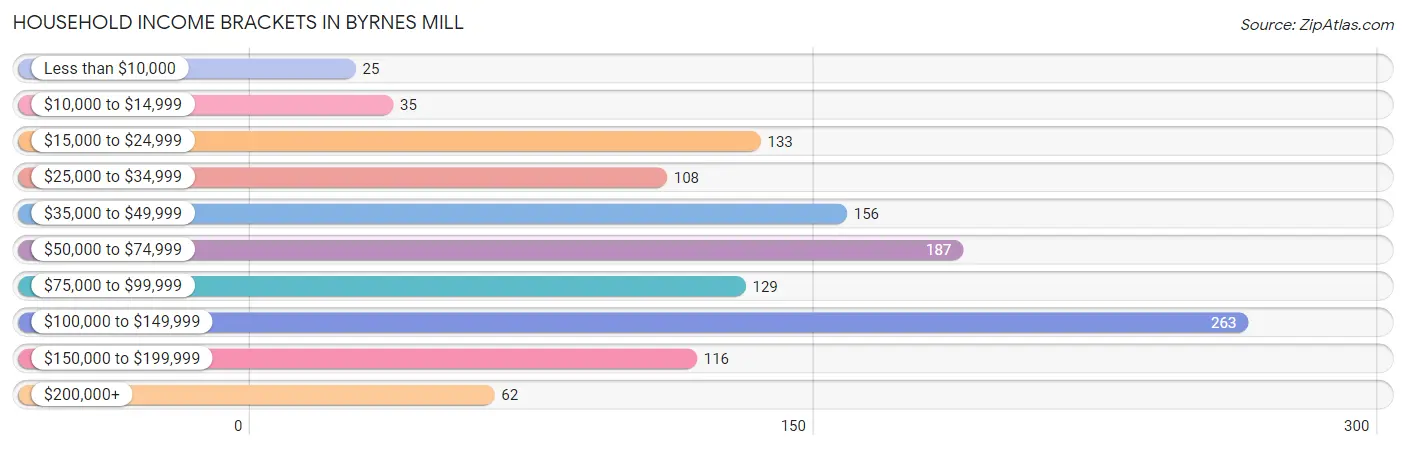
Household Income Brackets in Byrnes Mill
With 263 households falling in the category, the $100,000 to $149,999 income range is the most frequent in Byrnes Mill, accounting for 21.7% of all households. In contrast, only 25 households (2.1%) fall into the less than $10,000 income bracket, making it the least populous group.
| Income Bracket | # Households | % Households |
| Less than $10,000 | 25 | 2.1% |
| $10,000 to $14,999 | 35 | 2.9% |
| $15,000 to $24,999 | 133 | 11.0% |
| $25,000 to $34,999 | 108 | 8.9% |
| $35,000 to $49,999 | 156 | 12.9% |
| $50,000 to $74,999 | 187 | 15.4% |
| $75,000 to $99,999 | 129 | 10.6% |
| $100,000 to $149,999 | 263 | 21.7% |
| $150,000 to $199,999 | 116 | 9.6% |
| $200,000+ | 62 | 5.1% |
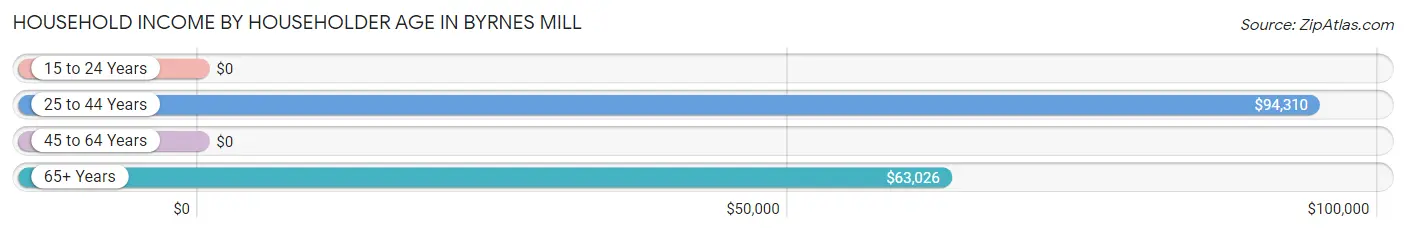
Household Income by Householder Age in Byrnes Mill
The median household income in Byrnes Mill is $65,156, with the highest median household income of $94,310 found in the 25 to 44 years age bracket for the primary householder. A total of 488 households (40.2%) fall into this category. Meanwhile, the 15 to 24 years age bracket for the primary householder has the lowest median household income of $0, with 48 households (4.0%) in this group.
| Income Bracket | # Households | Median Income |
| 15 to 24 Years | 48 (4.0%) | $0 |
| 25 to 44 Years | 488 (40.2%) | $94,310 |
| 45 to 64 Years | 385 (31.7%) | $0 |
| 65+ Years | 292 (24.1%) | $63,026 |
| Total | 1,213 (100.0%) | $65,156 |
Poverty in Byrnes Mill
Income Below Poverty by Sex and Age in Byrnes Mill
With 18.5% poverty level for males and 19.2% for females among the residents of Byrnes Mill, 12 to 14 year old males and 18 to 24 year old females are the most vulnerable to poverty, with 72 males (50.3%) and 35 females (48.6%) in their respective age groups living below the poverty level.
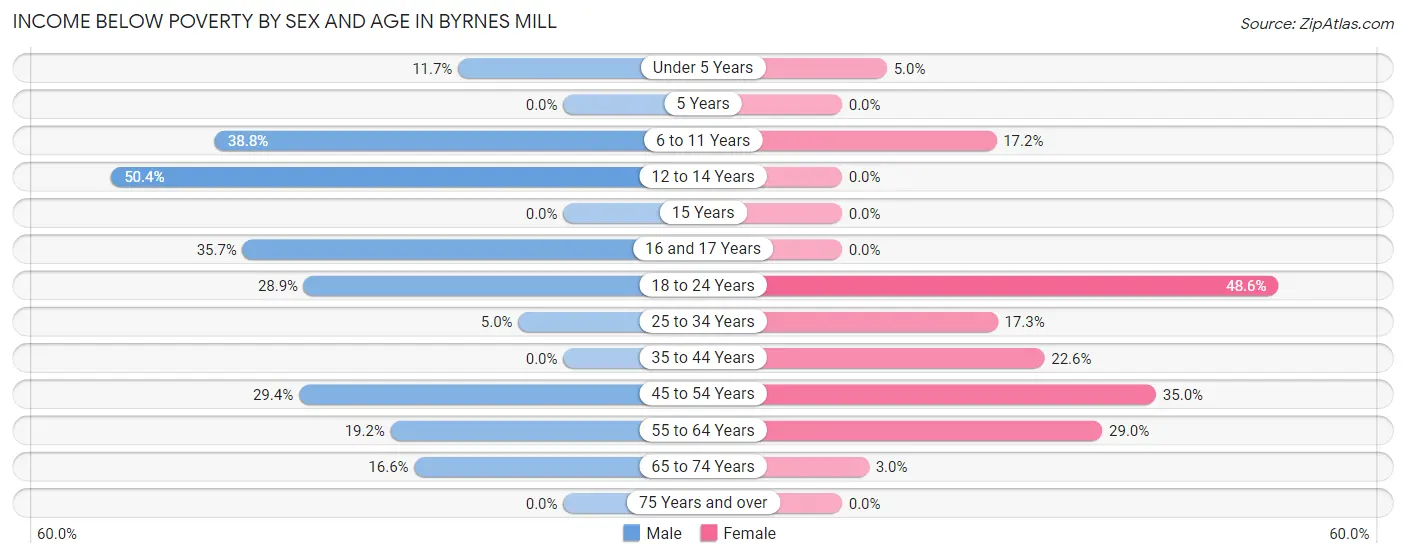
| Age Bracket | Male | Female |
| Under 5 Years | 13 (11.7%) | 7 (5.0%) |
| 5 Years | 0 (0.0%) | 0 (0.0%) |
| 6 to 11 Years | 71 (38.8%) | 16 (17.2%) |
| 12 to 14 Years | 72 (50.3%) | 0 (0.0%) |
| 15 Years | 0 (0.0%) | 0 (0.0%) |
| 16 and 17 Years | 5 (35.7%) | 0 (0.0%) |
| 18 to 24 Years | 13 (28.9%) | 35 (48.6%) |
| 25 to 34 Years | 12 (5.0%) | 30 (17.3%) |
| 35 to 44 Years | 0 (0.0%) | 53 (22.6%) |
| 45 to 54 Years | 73 (29.4%) | 71 (35.0%) |
| 55 to 64 Years | 30 (19.2%) | 49 (29.0%) |
| 65 to 74 Years | 37 (16.6%) | 6 (3.0%) |
| 75 Years and over | 0 (0.0%) | 0 (0.0%) |
| Total | 326 (18.5%) | 267 (19.2%) |
Income Above Poverty by Sex and Age in Byrnes Mill
According to the poverty statistics in Byrnes Mill, males aged 5 years and females aged 5 years are the age groups that are most secure financially, with 100.0% of males and 100.0% of females in these age groups living above the poverty line.
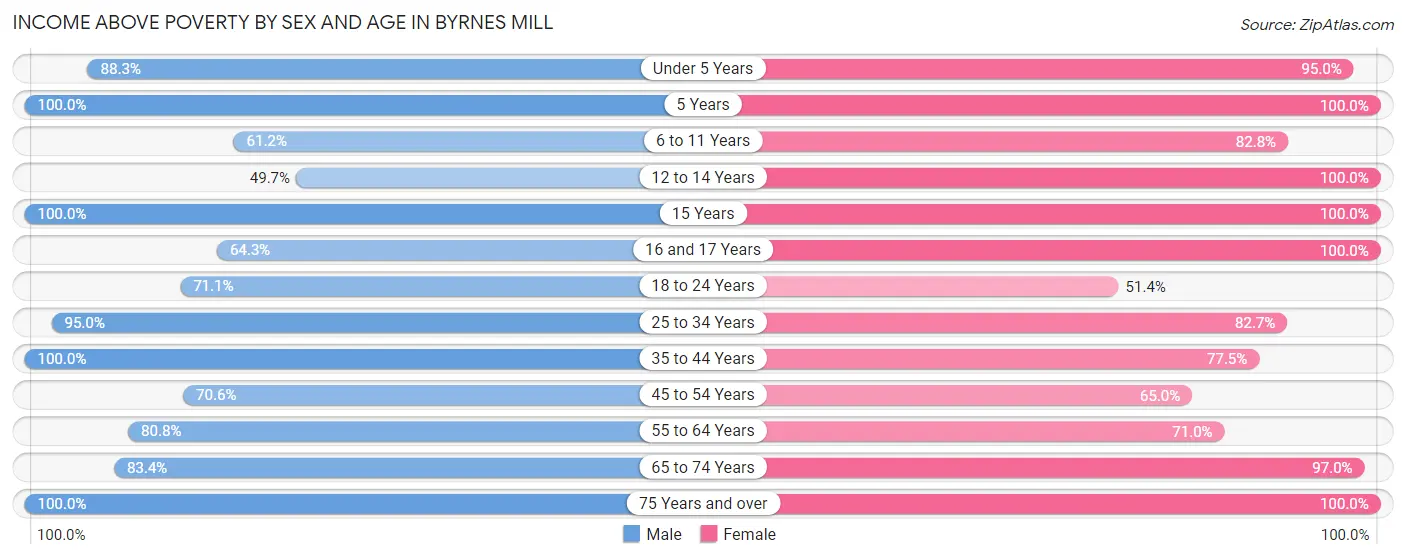
| Age Bracket | Male | Female |
| Under 5 Years | 98 (88.3%) | 133 (95.0%) |
| 5 Years | 29 (100.0%) | 8 (100.0%) |
| 6 to 11 Years | 112 (61.2%) | 77 (82.8%) |
| 12 to 14 Years | 71 (49.6%) | 31 (100.0%) |
| 15 Years | 47 (100.0%) | 16 (100.0%) |
| 16 and 17 Years | 9 (64.3%) | 20 (100.0%) |
| 18 to 24 Years | 32 (71.1%) | 37 (51.4%) |
| 25 to 34 Years | 228 (95.0%) | 143 (82.7%) |
| 35 to 44 Years | 249 (100.0%) | 182 (77.4%) |
| 45 to 54 Years | 175 (70.6%) | 132 (65.0%) |
| 55 to 64 Years | 126 (80.8%) | 120 (71.0%) |
| 65 to 74 Years | 186 (83.4%) | 194 (97.0%) |
| 75 Years and over | 73 (100.0%) | 34 (100.0%) |
| Total | 1,435 (81.5%) | 1,127 (80.8%) |
Income Below Poverty Among Married-Couple Families in Byrnes Mill
The poverty statistics for married-couple families in Byrnes Mill show that 4.5% or 31 of the total 690 families live below the poverty line. Families with no children have the highest poverty rate of 7.5%, comprising of 31 families. On the other hand, families with 1 or 2 children have the lowest poverty rate of 0.0%, which includes 0 families.
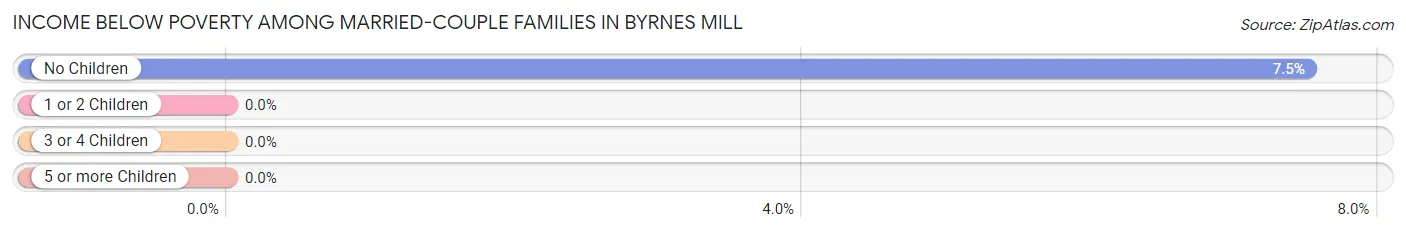
| Children | Above Poverty | Below Poverty |
| No Children | 382 (92.5%) | 31 (7.5%) |
| 1 or 2 Children | 183 (100.0%) | 0 (0.0%) |
| 3 or 4 Children | 94 (100.0%) | 0 (0.0%) |
| 5 or more Children | 0 (0.0%) | 0 (0.0%) |
| Total | 659 (95.5%) | 31 (4.5%) |
Income Below Poverty Among Single-Parent Households in Byrnes Mill
According to the poverty data in Byrnes Mill, 48.6% or 17 single-father households and 64.0% or 71 single-mother households are living below the poverty line. Among single-father households, those with 1 or 2 children have the highest poverty rate, with 17 households (54.8%) experiencing poverty. Likewise, among single-mother households, those with 1 or 2 children have the highest poverty rate, with 53 households (72.6%) falling below the poverty line.
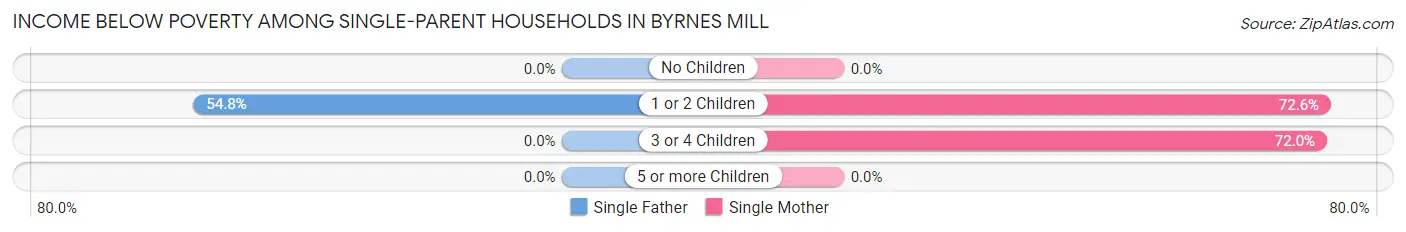
| Children | Single Father | Single Mother |
| No Children | 0 (0.0%) | 0 (0.0%) |
| 1 or 2 Children | 17 (54.8%) | 53 (72.6%) |
| 3 or 4 Children | 0 (0.0%) | 18 (72.0%) |
| 5 or more Children | 0 (0.0%) | 0 (0.0%) |
| Total | 17 (48.6%) | 71 (64.0%) |
Income Below Poverty Among Married-Couple vs Single-Parent Households in Byrnes Mill
The poverty data for Byrnes Mill shows that 31 of the married-couple family households (4.5%) and 88 of the single-parent households (60.3%) are living below the poverty level. Within the married-couple family households, those with no children have the highest poverty rate, with 31 households (7.5%) falling below the poverty line. Among the single-parent households, those with 3 or 4 children have the highest poverty rate, with 18 household (72.0%) living below poverty.
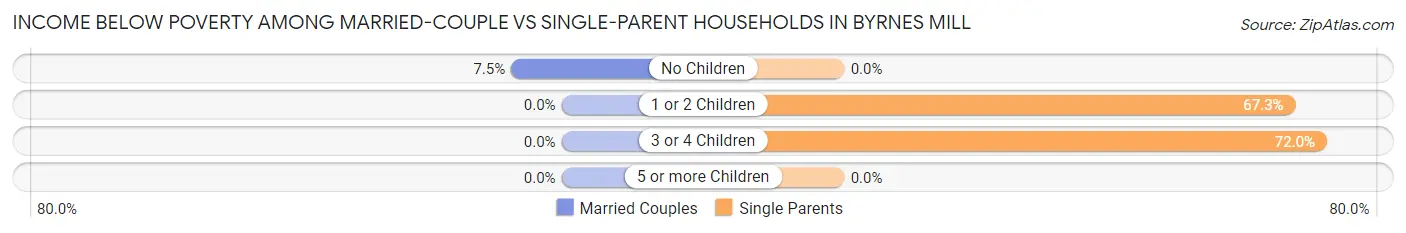
| Children | Married-Couple Families | Single-Parent Households |
| No Children | 31 (7.5%) | 0 (0.0%) |
| 1 or 2 Children | 0 (0.0%) | 70 (67.3%) |
| 3 or 4 Children | 0 (0.0%) | 18 (72.0%) |
| 5 or more Children | 0 (0.0%) | 0 (0.0%) |
| Total | 31 (4.5%) | 88 (60.3%) |
Employment Characteristics in Byrnes Mill
Employment by Class of Employer in Byrnes Mill
Among the 1,266 employed individuals in Byrnes Mill, private company employees (922 | 72.8%), local government employees (129 | 10.2%), and self-employed (not incorporated) (75 | 5.9%) make up the most common classes of employment.
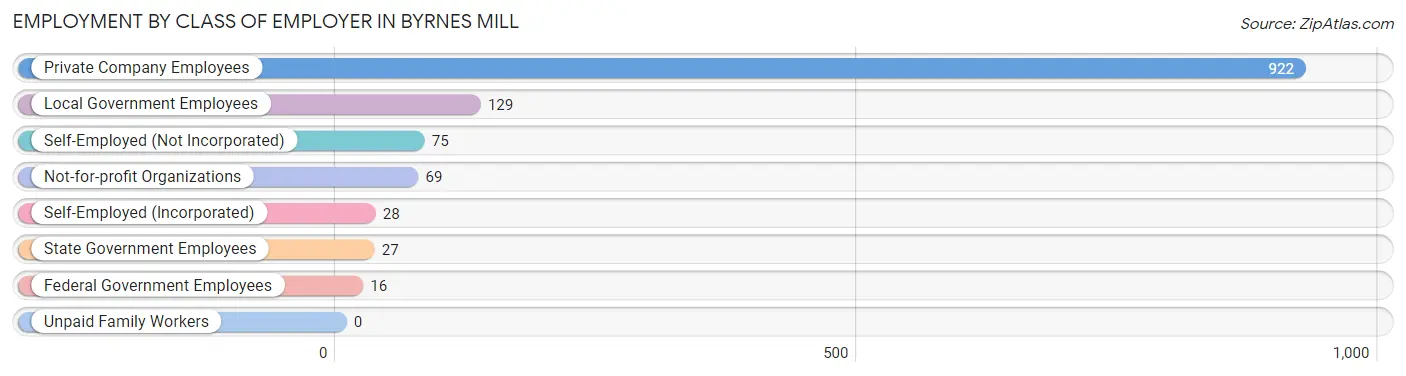
| Employer Class | # Employees | % Employees |
| Private Company Employees | 922 | 72.8% |
| Self-Employed (Incorporated) | 28 | 2.2% |
| Self-Employed (Not Incorporated) | 75 | 5.9% |
| Not-for-profit Organizations | 69 | 5.4% |
| Local Government Employees | 129 | 10.2% |
| State Government Employees | 27 | 2.1% |
| Federal Government Employees | 16 | 1.3% |
| Unpaid Family Workers | 0 | 0.0% |
| Total | 1,266 | 100.0% |
Employment Status by Age in Byrnes Mill
According to the labor force statistics for Byrnes Mill, out of the total population over 16 years of age (2,354), 54.7% or 1,288 individuals are in the labor force, with 1.7% or 22 of them unemployed. The age group with the highest labor force participation rate is 20 to 24 years, with 90.3% or 84 individuals in the labor force. Within the labor force, the 60 to 64 years age range has the highest percentage of unemployed individuals, with 20.8% or 5 of them being unemployed.
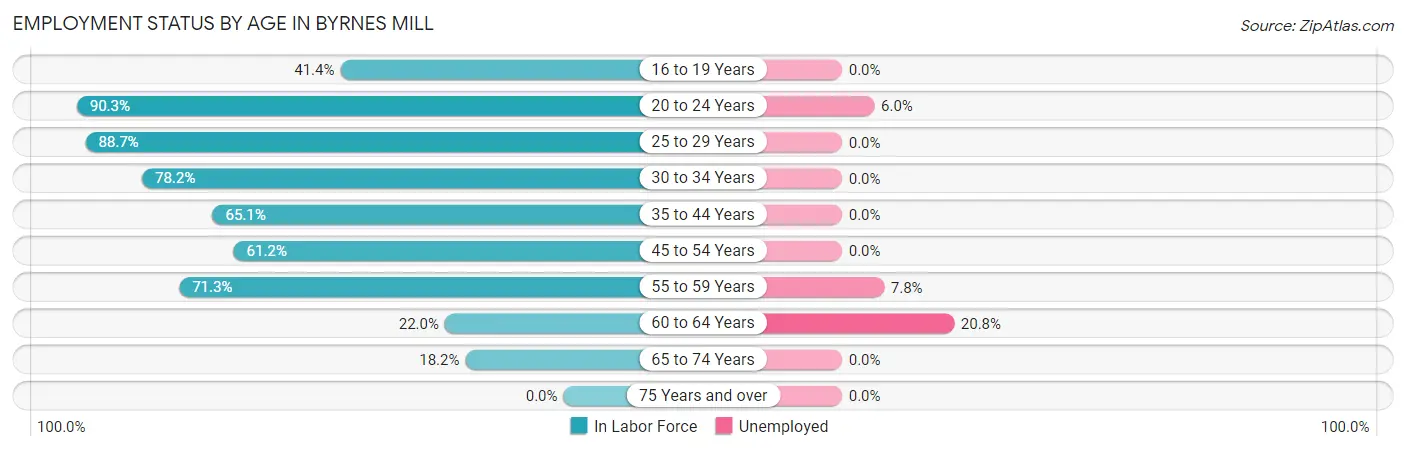
| Age Bracket | In Labor Force | Unemployed |
| 16 to 19 Years | 24 (41.4%) | 0 (0.0%) |
| 20 to 24 Years | 84 (90.3%) | 5 (6.0%) |
| 25 to 29 Years | 94 (88.7%) | 0 (0.0%) |
| 30 to 34 Years | 240 (78.2%) | 0 (0.0%) |
| 35 to 44 Years | 315 (65.1%) | 0 (0.0%) |
| 45 to 54 Years | 276 (61.2%) | 0 (0.0%) |
| 55 to 59 Years | 154 (71.3%) | 12 (7.8%) |
| 60 to 64 Years | 24 (22.0%) | 5 (20.8%) |
| 65 to 74 Years | 77 (18.2%) | 0 (0.0%) |
| 75 Years and over | 0 (0.0%) | 0 (0.0%) |
| Total | 1,288 (54.7%) | 22 (1.7%) |
Employment Status by Educational Attainment in Byrnes Mill
According to labor force statistics for Byrnes Mill, 65.9% of individuals (1,103) out of the total population between 25 and 64 years of age (1,673) are in the labor force, with 1.5% or 17 of them being unemployed. The group with the highest labor force participation rate are those with the educational attainment of bachelor's degree or higher, with 89.4% or 386 individuals in the labor force. Within the labor force, individuals with bachelor's degree or higher education have the highest percentage of unemployment, with 4.4% or 17 of them being unemployed.
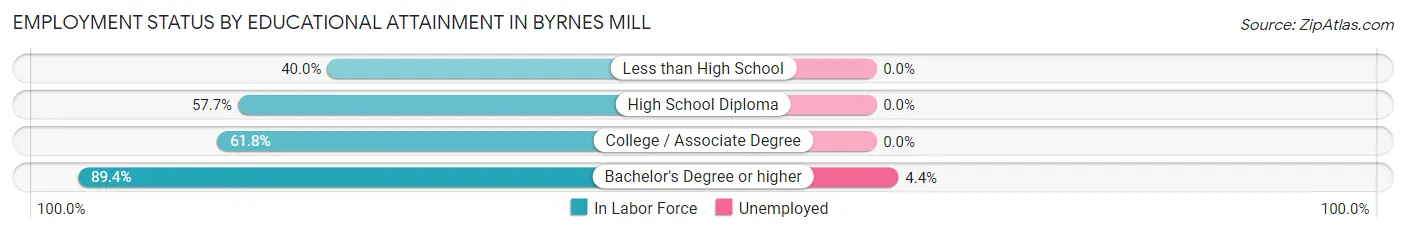
| Educational Attainment | In Labor Force | Unemployed |
| Less than High School | 66 (40.0%) | 0 (0.0%) |
| High School Diploma | 198 (57.7%) | 0 (0.0%) |
| College / Associate Degree | 453 (61.8%) | 0 (0.0%) |
| Bachelor's Degree or higher | 386 (89.4%) | 19 (4.4%) |
| Total | 1,103 (65.9%) | 25 (1.5%) |
Employment Occupations by Sex in Byrnes Mill
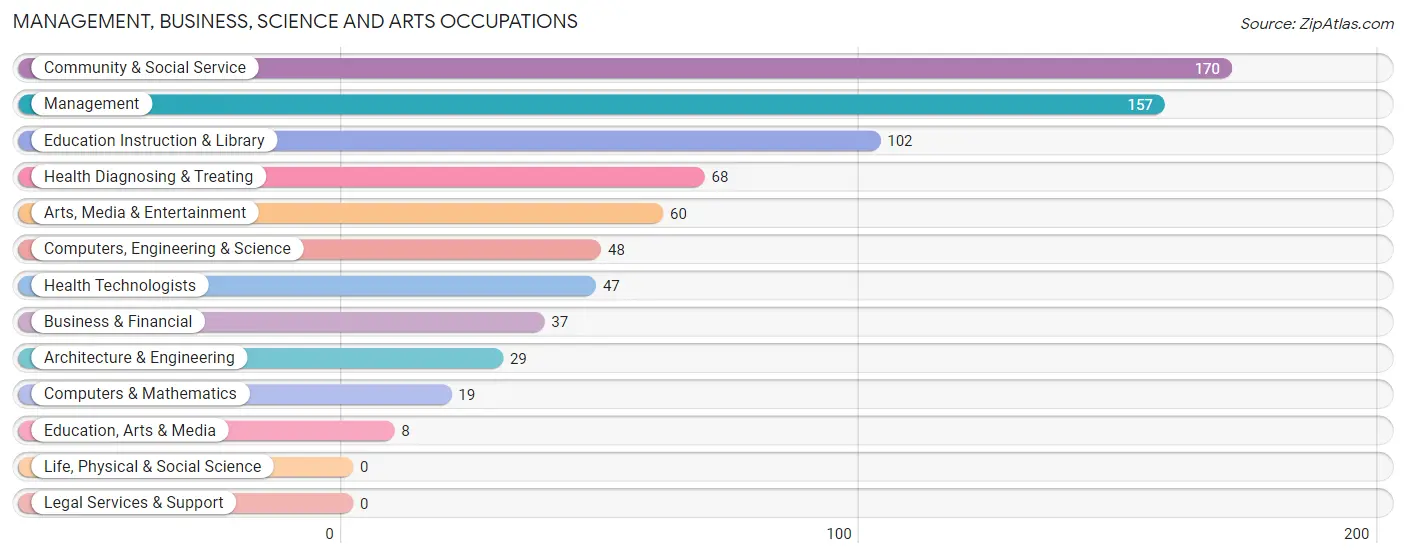
Management, Business, Science and Arts Occupations
The most common Management, Business, Science and Arts occupations in Byrnes Mill are Community & Social Service (170 | 13.4%), Management (157 | 12.4%), Education Instruction & Library (102 | 8.1%), Health Diagnosing & Treating (68 | 5.4%), and Arts, Media & Entertainment (60 | 4.7%).
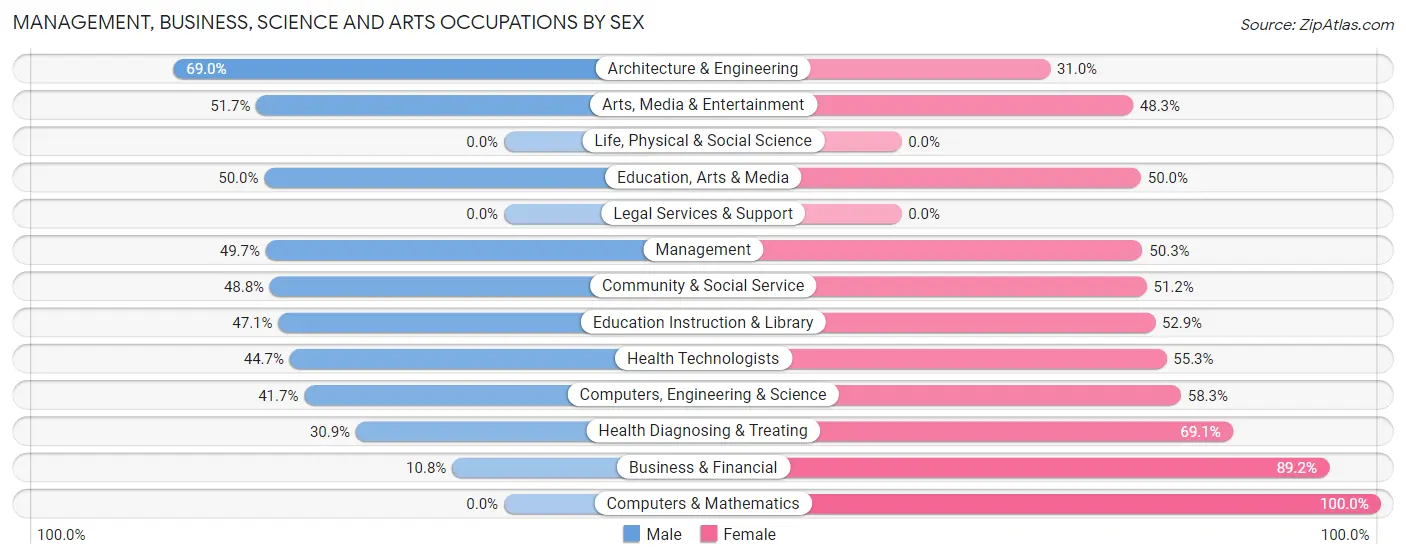
Management, Business, Science and Arts Occupations by Sex
Within the Management, Business, Science and Arts occupations in Byrnes Mill, the most male-oriented occupations are Architecture & Engineering (69.0%), Arts, Media & Entertainment (51.7%), and Education, Arts & Media (50.0%), while the most female-oriented occupations are Computers & Mathematics (100.0%), Business & Financial (89.2%), and Health Diagnosing & Treating (69.1%).
| Occupation | Male | Female |
| Management | 78 (49.7%) | 79 (50.3%) |
| Business & Financial | 4 (10.8%) | 33 (89.2%) |
| Computers, Engineering & Science | 20 (41.7%) | 28 (58.3%) |
| Computers & Mathematics | 0 (0.0%) | 19 (100.0%) |
| Architecture & Engineering | 20 (69.0%) | 9 (31.0%) |
| Life, Physical & Social Science | 0 (0.0%) | 0 (0.0%) |
| Community & Social Service | 83 (48.8%) | 87 (51.2%) |
| Education, Arts & Media | 4 (50.0%) | 4 (50.0%) |
| Legal Services & Support | 0 (0.0%) | 0 (0.0%) |
| Education Instruction & Library | 48 (47.1%) | 54 (52.9%) |
| Arts, Media & Entertainment | 31 (51.7%) | 29 (48.3%) |
| Health Diagnosing & Treating | 21 (30.9%) | 47 (69.1%) |
| Health Technologists | 21 (44.7%) | 26 (55.3%) |
| Total (Category) | 206 (42.9%) | 274 (57.1%) |
| Total (Overall) | 756 (59.7%) | 510 (40.3%) |
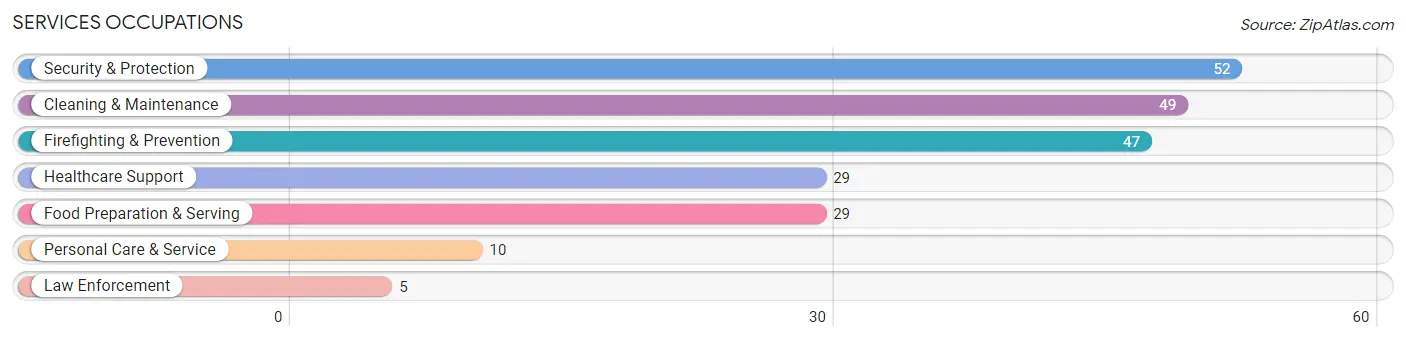
Services Occupations
The most common Services occupations in Byrnes Mill are Security & Protection (52 | 4.1%), Cleaning & Maintenance (49 | 3.9%), Firefighting & Prevention (47 | 3.7%), Healthcare Support (29 | 2.3%), and Food Preparation & Serving (29 | 2.3%).
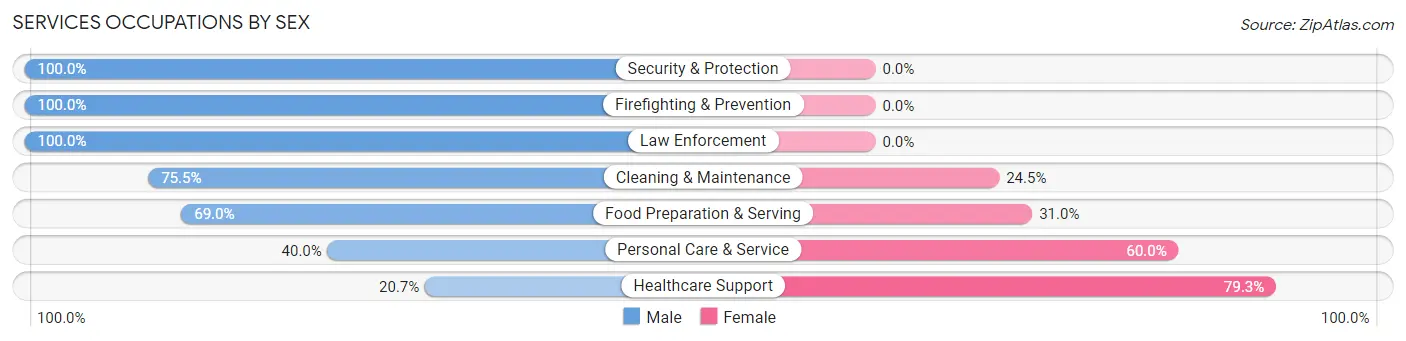
Services Occupations by Sex
Within the Services occupations in Byrnes Mill, the most male-oriented occupations are Security & Protection (100.0%), Firefighting & Prevention (100.0%), and Law Enforcement (100.0%), while the most female-oriented occupations are Healthcare Support (79.3%), Personal Care & Service (60.0%), and Food Preparation & Serving (31.0%).
| Occupation | Male | Female |
| Healthcare Support | 6 (20.7%) | 23 (79.3%) |
| Security & Protection | 52 (100.0%) | 0 (0.0%) |
| Firefighting & Prevention | 47 (100.0%) | 0 (0.0%) |
| Law Enforcement | 5 (100.0%) | 0 (0.0%) |
| Food Preparation & Serving | 20 (69.0%) | 9 (31.0%) |
| Cleaning & Maintenance | 37 (75.5%) | 12 (24.5%) |
| Personal Care & Service | 4 (40.0%) | 6 (60.0%) |
| Total (Category) | 119 (70.4%) | 50 (29.6%) |
| Total (Overall) | 756 (59.7%) | 510 (40.3%) |
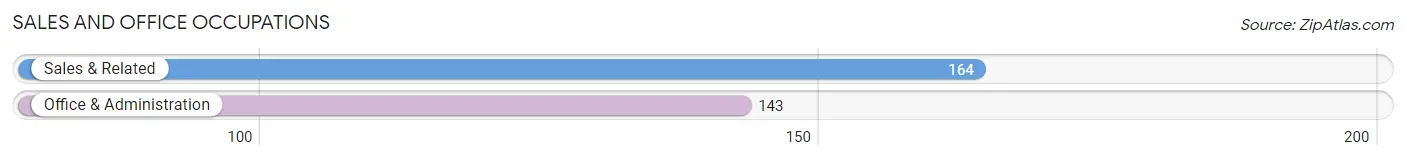
Sales and Office Occupations
The most common Sales and Office occupations in Byrnes Mill are Sales & Related (164 | 13.0%), and Office & Administration (143 | 11.3%).
Sales and Office Occupations by Sex
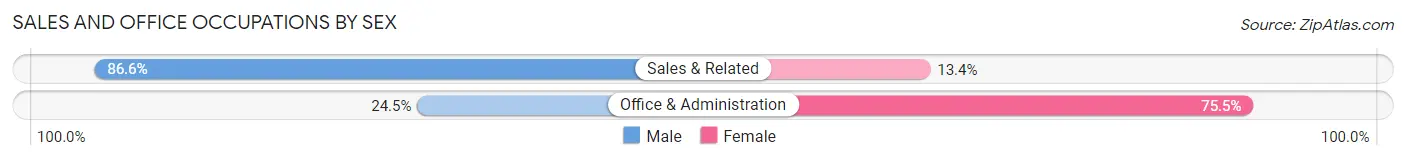
| Occupation | Male | Female |
| Sales & Related | 142 (86.6%) | 22 (13.4%) |
| Office & Administration | 35 (24.5%) | 108 (75.5%) |
| Total (Category) | 177 (57.7%) | 130 (42.3%) |
| Total (Overall) | 756 (59.7%) | 510 (40.3%) |
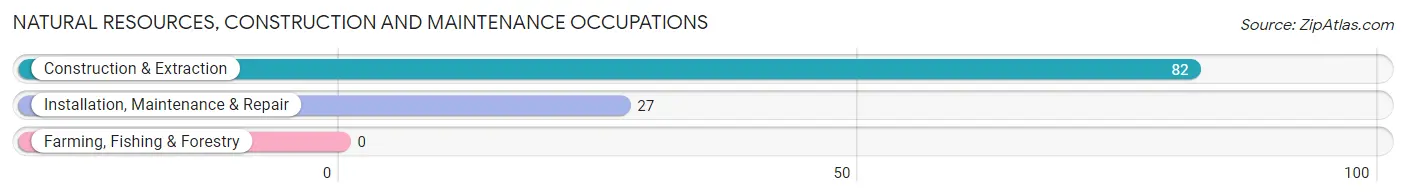
Natural Resources, Construction and Maintenance Occupations
The most common Natural Resources, Construction and Maintenance occupations in Byrnes Mill are Construction & Extraction (82 | 6.5%), and Installation, Maintenance & Repair (27 | 2.1%).
Natural Resources, Construction and Maintenance Occupations by Sex
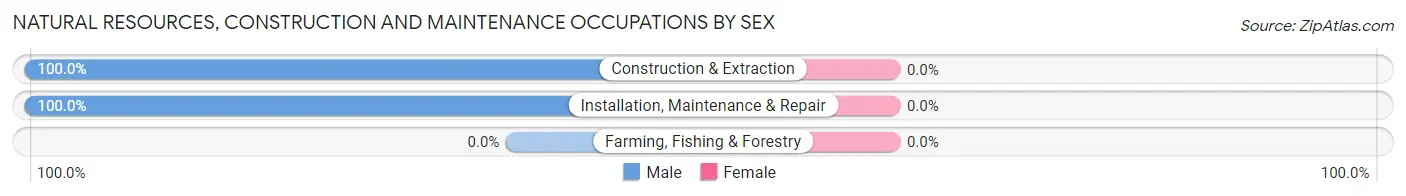
| Occupation | Male | Female |
| Farming, Fishing & Forestry | 0 (0.0%) | 0 (0.0%) |
| Construction & Extraction | 82 (100.0%) | 0 (0.0%) |
| Installation, Maintenance & Repair | 27 (100.0%) | 0 (0.0%) |
| Total (Category) | 109 (100.0%) | 0 (0.0%) |
| Total (Overall) | 756 (59.7%) | 510 (40.3%) |
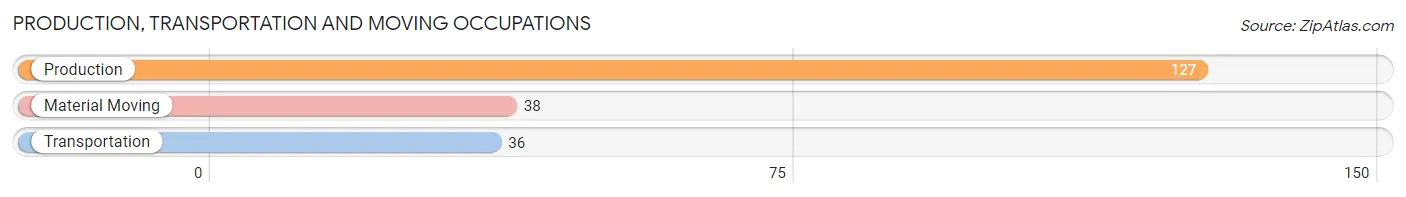
Production, Transportation and Moving Occupations
The most common Production, Transportation and Moving occupations in Byrnes Mill are Production (127 | 10.0%), Material Moving (38 | 3.0%), and Transportation (36 | 2.8%).
Production, Transportation and Moving Occupations by Sex
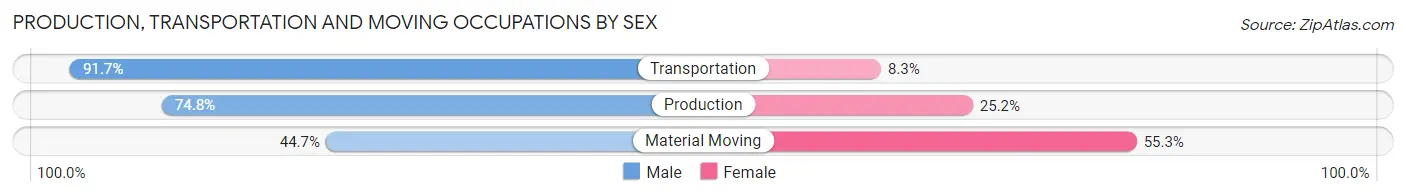
| Occupation | Male | Female |
| Production | 95 (74.8%) | 32 (25.2%) |
| Transportation | 33 (91.7%) | 3 (8.3%) |
| Material Moving | 17 (44.7%) | 21 (55.3%) |
| Total (Category) | 145 (72.1%) | 56 (27.9%) |
| Total (Overall) | 756 (59.7%) | 510 (40.3%) |
Employment Industries by Sex in Byrnes Mill
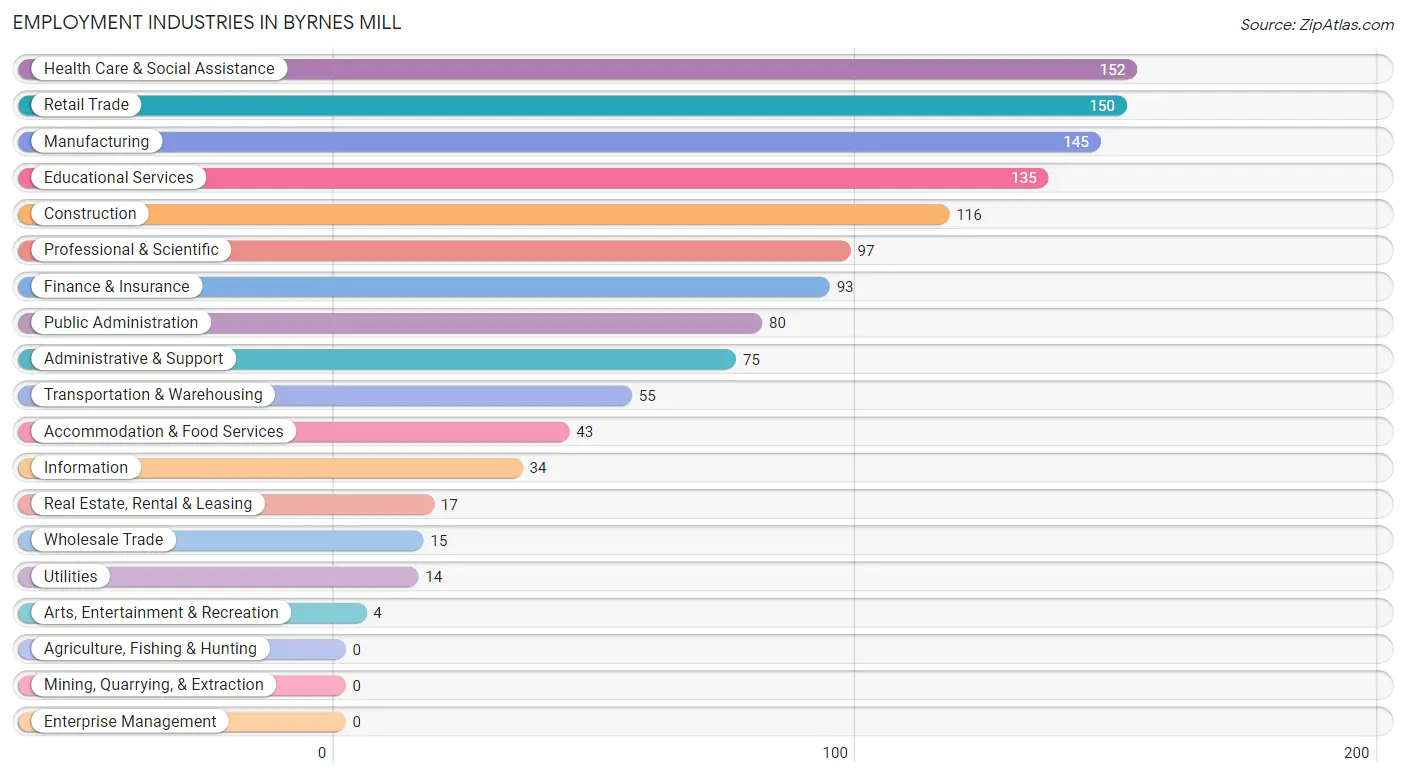
Employment Industries in Byrnes Mill
The major employment industries in Byrnes Mill include Health Care & Social Assistance (152 | 12.0%), Retail Trade (150 | 11.8%), Manufacturing (145 | 11.5%), Educational Services (135 | 10.7%), and Construction (116 | 9.2%).
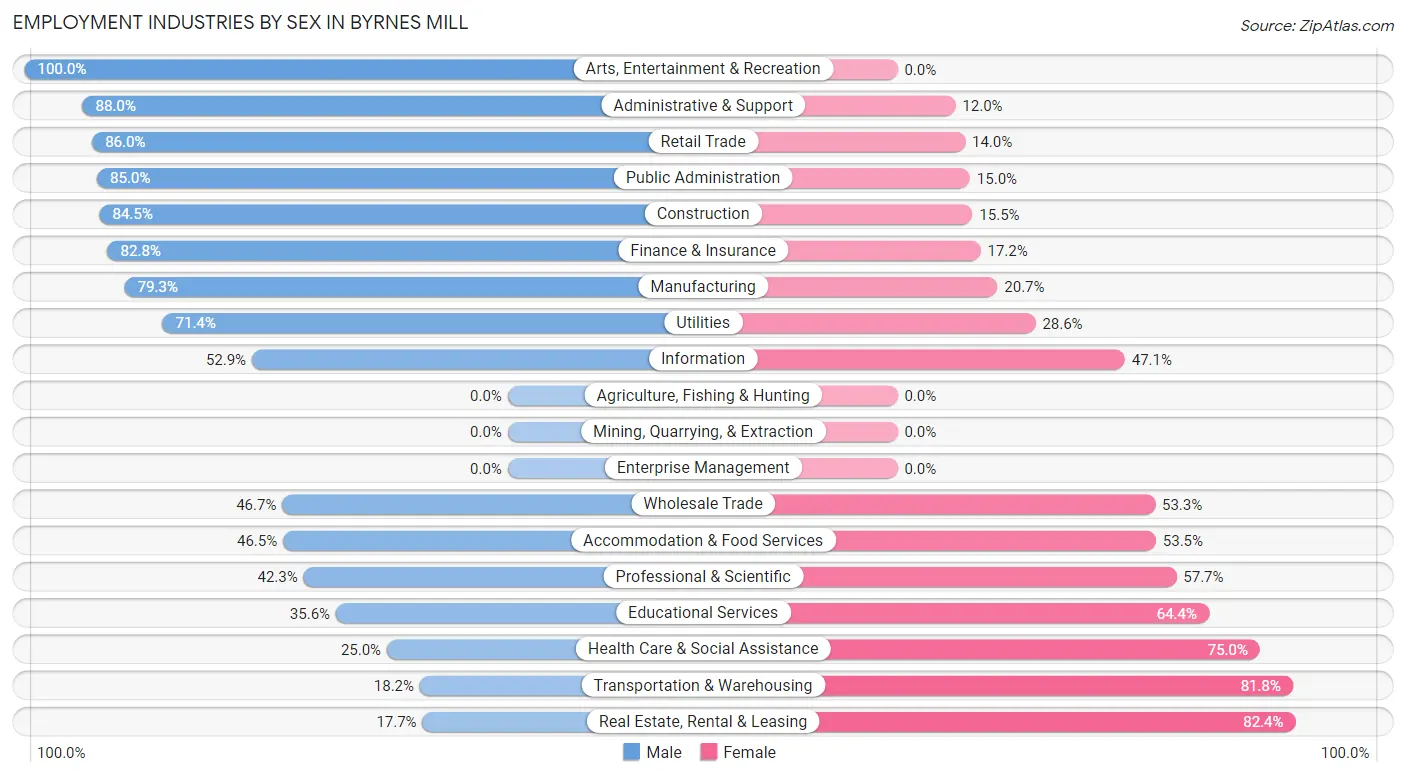
Employment Industries by Sex in Byrnes Mill
The Byrnes Mill industries that see more men than women are Arts, Entertainment & Recreation (100.0%), Administrative & Support (88.0%), and Retail Trade (86.0%), whereas the industries that tend to have a higher number of women are Real Estate, Rental & Leasing (82.4%), Transportation & Warehousing (81.8%), and Health Care & Social Assistance (75.0%).
| Industry | Male | Female |
| Agriculture, Fishing & Hunting | 0 (0.0%) | 0 (0.0%) |
| Mining, Quarrying, & Extraction | 0 (0.0%) | 0 (0.0%) |
| Construction | 98 (84.5%) | 18 (15.5%) |
| Manufacturing | 115 (79.3%) | 30 (20.7%) |
| Wholesale Trade | 7 (46.7%) | 8 (53.3%) |
| Retail Trade | 129 (86.0%) | 21 (14.0%) |
| Transportation & Warehousing | 10 (18.2%) | 45 (81.8%) |
| Utilities | 10 (71.4%) | 4 (28.6%) |
| Information | 18 (52.9%) | 16 (47.1%) |
| Finance & Insurance | 77 (82.8%) | 16 (17.2%) |
| Real Estate, Rental & Leasing | 3 (17.6%) | 14 (82.4%) |
| Professional & Scientific | 41 (42.3%) | 56 (57.7%) |
| Enterprise Management | 0 (0.0%) | 0 (0.0%) |
| Administrative & Support | 66 (88.0%) | 9 (12.0%) |
| Educational Services | 48 (35.6%) | 87 (64.4%) |
| Health Care & Social Assistance | 38 (25.0%) | 114 (75.0%) |
| Arts, Entertainment & Recreation | 4 (100.0%) | 0 (0.0%) |
| Accommodation & Food Services | 20 (46.5%) | 23 (53.5%) |
| Public Administration | 68 (85.0%) | 12 (15.0%) |
| Total | 756 (59.7%) | 510 (40.3%) |
Education in Byrnes Mill
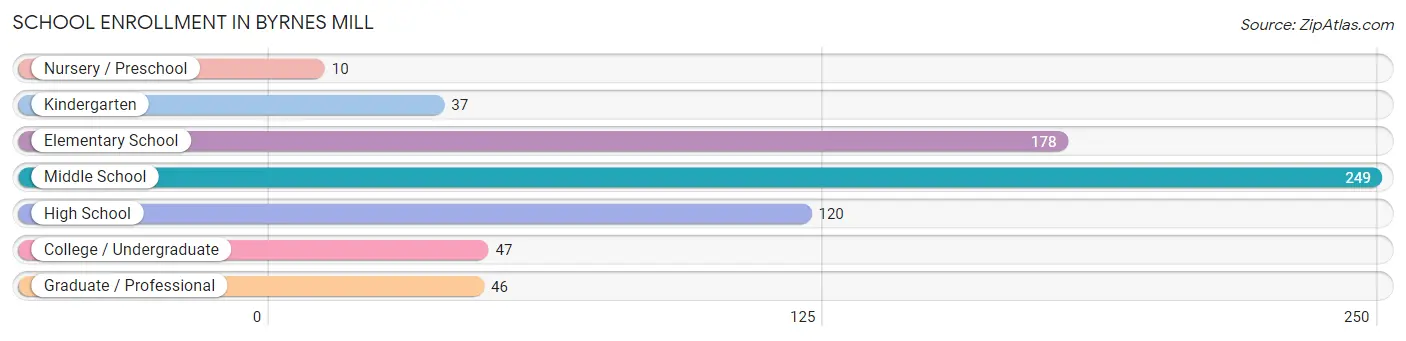
School Enrollment in Byrnes Mill
The most common levels of schooling among the 687 students in Byrnes Mill are middle school (249 | 36.2%), elementary school (178 | 25.9%), and high school (120 | 17.5%).
| School Level | # Students | % Students |
| Nursery / Preschool | 10 | 1.5% |
| Kindergarten | 37 | 5.4% |
| Elementary School | 178 | 25.9% |
| Middle School | 249 | 36.2% |
| High School | 120 | 17.5% |
| College / Undergraduate | 47 | 6.8% |
| Graduate / Professional | 46 | 6.7% |
| Total | 687 | 100.0% |
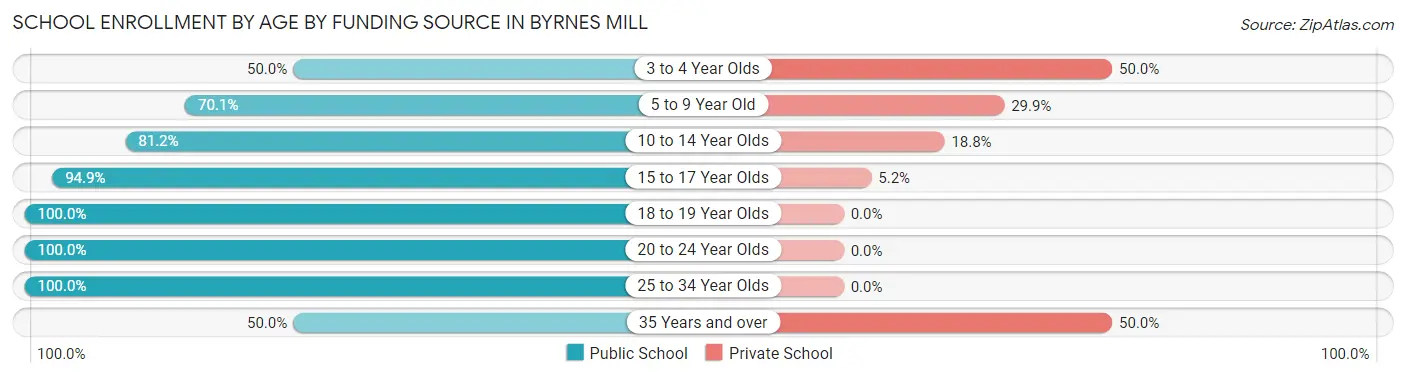
School Enrollment by Age by Funding Source in Byrnes Mill
Out of a total of 687 students who are enrolled in schools in Byrnes Mill, 134 (19.5%) attend a private institution, while the remaining 553 (80.5%) are enrolled in public schools. The age group of 3 to 4 year olds has the highest likelihood of being enrolled in private schools, with 5 (50.0% in the age bracket) enrolled. Conversely, the age group of 18 to 19 year olds has the lowest likelihood of being enrolled in a private school, with 8 (100.0% in the age bracket) attending a public institution.
| Age Bracket | Public School | Private School |
| 3 to 4 Year Olds | 5 (50.0%) | 5 (50.0%) |
| 5 to 9 Year Old | 136 (70.1%) | 58 (29.9%) |
| 10 to 14 Year Olds | 238 (81.2%) | 55 (18.8%) |
| 15 to 17 Year Olds | 92 (94.9%) | 5 (5.1%) |
| 18 to 19 Year Olds | 8 (100.0%) | 0 (0.0%) |
| 20 to 24 Year Olds | 23 (100.0%) | 0 (0.0%) |
| 25 to 34 Year Olds | 40 (100.0%) | 0 (0.0%) |
| 35 Years and over | 11 (50.0%) | 11 (50.0%) |
| Total | 553 (80.5%) | 134 (19.5%) |
Educational Attainment by Field of Study in Byrnes Mill
Business (150 | 25.2%), education (116 | 19.5%), science & technology (91 | 15.3%), arts & humanities (56 | 9.4%), and bio, nature & agricultural (34 | 5.7%) are the most common fields of study among 595 individuals in Byrnes Mill who have obtained a bachelor's degree or higher.

| Field of Study | # Graduates | % Graduates |
| Computers & Mathematics | 29 | 4.9% |
| Bio, Nature & Agricultural | 34 | 5.7% |
| Physical & Health Sciences | 8 | 1.3% |
| Psychology | 34 | 5.7% |
| Social Sciences | 11 | 1.8% |
| Engineering | 10 | 1.7% |
| Multidisciplinary Studies | 4 | 0.7% |
| Science & Technology | 91 | 15.3% |
| Business | 150 | 25.2% |
| Education | 116 | 19.5% |
| Literature & Languages | 4 | 0.7% |
| Liberal Arts & History | 11 | 1.8% |
| Visual & Performing Arts | 31 | 5.2% |
| Communications | 6 | 1.0% |
| Arts & Humanities | 56 | 9.4% |
| Total | 595 | 100.0% |
Transportation & Commute in Byrnes Mill
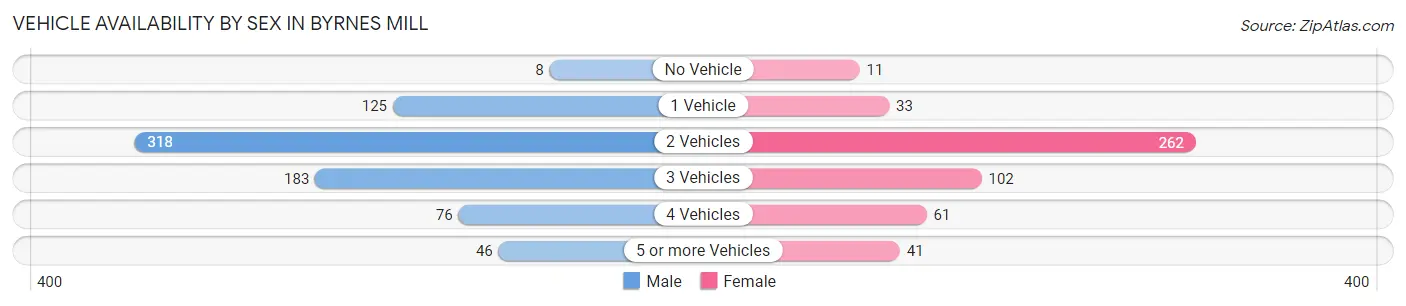
Vehicle Availability by Sex in Byrnes Mill
The most prevalent vehicle ownership categories in Byrnes Mill are males with 2 vehicles (318, accounting for 42.1%) and females with 2 vehicles (262, making up 62.4%).
| Vehicles Available | Male | Female |
| No Vehicle | 8 (1.1%) | 11 (2.2%) |
| 1 Vehicle | 125 (16.5%) | 33 (6.5%) |
| 2 Vehicles | 318 (42.1%) | 262 (51.4%) |
| 3 Vehicles | 183 (24.2%) | 102 (20.0%) |
| 4 Vehicles | 76 (10.1%) | 61 (12.0%) |
| 5 or more Vehicles | 46 (6.1%) | 41 (8.0%) |
| Total | 756 (100.0%) | 510 (100.0%) |
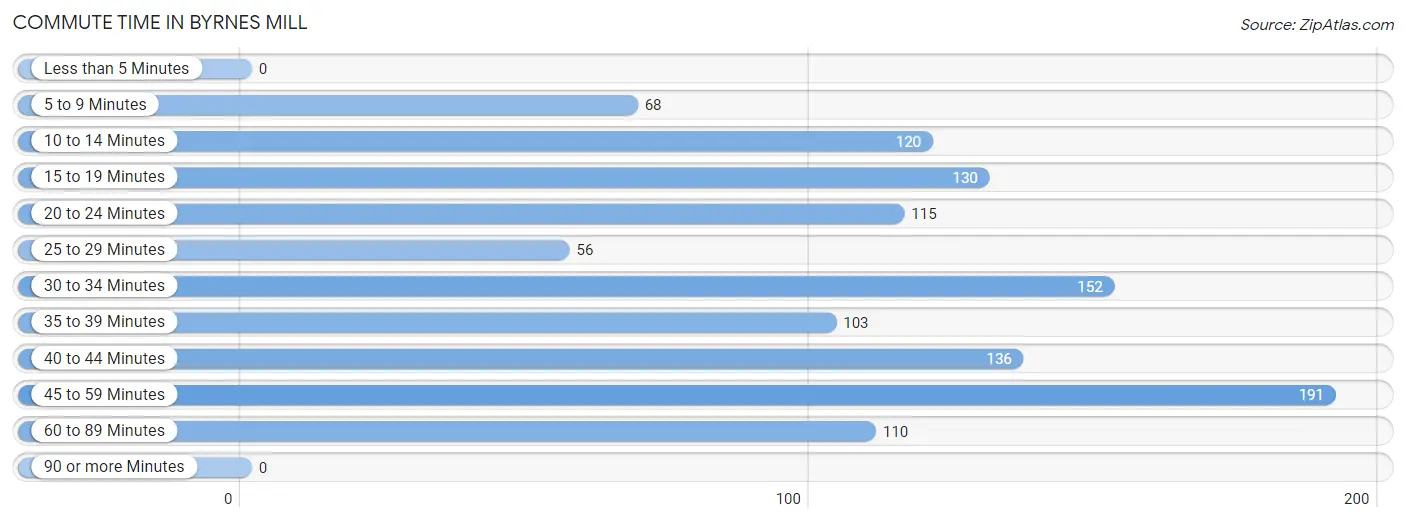
Commute Time in Byrnes Mill
The most frequently occuring commute durations in Byrnes Mill are 45 to 59 minutes (191 commuters, 16.2%), 30 to 34 minutes (152 commuters, 12.9%), and 40 to 44 minutes (136 commuters, 11.5%).
| Commute Time | # Commuters | % Commuters |
| Less than 5 Minutes | 0 | 0.0% |
| 5 to 9 Minutes | 68 | 5.8% |
| 10 to 14 Minutes | 120 | 10.2% |
| 15 to 19 Minutes | 130 | 11.0% |
| 20 to 24 Minutes | 115 | 9.7% |
| 25 to 29 Minutes | 56 | 4.7% |
| 30 to 34 Minutes | 152 | 12.9% |
| 35 to 39 Minutes | 103 | 8.7% |
| 40 to 44 Minutes | 136 | 11.5% |
| 45 to 59 Minutes | 191 | 16.2% |
| 60 to 89 Minutes | 110 | 9.3% |
| 90 or more Minutes | 0 | 0.0% |
Commute Time by Sex in Byrnes Mill
The most common commute times in Byrnes Mill are 45 to 59 minutes (152 commuters, 21.3%) for males and 30 to 34 minutes (80 commuters, 17.1%) for females.
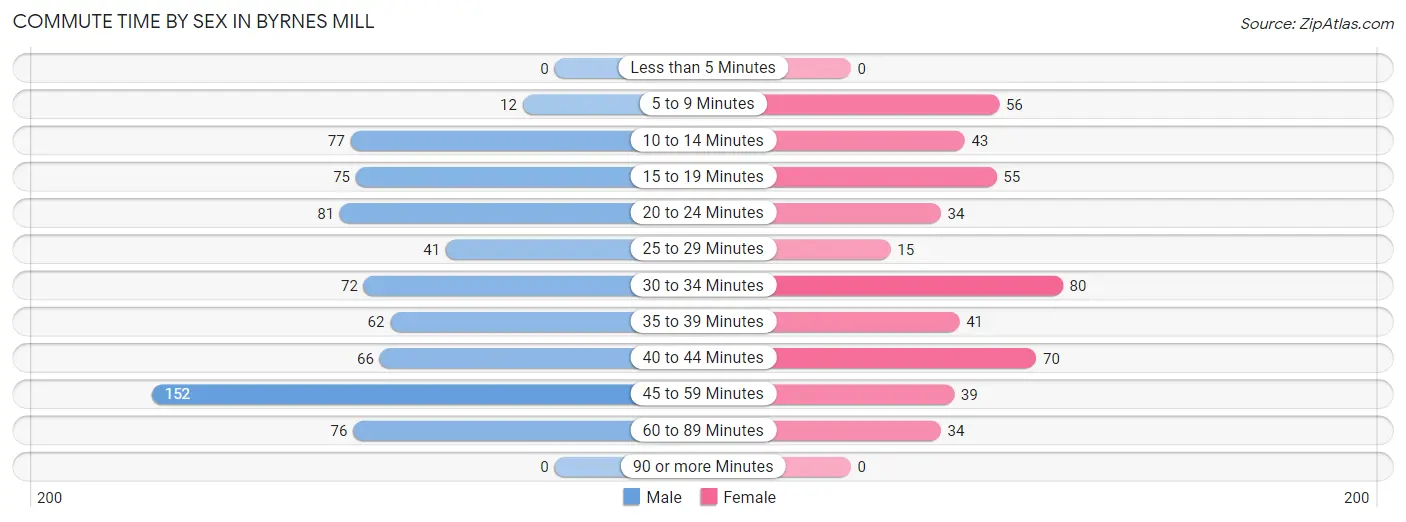
| Commute Time | Male | Female |
| Less than 5 Minutes | 0 (0.0%) | 0 (0.0%) |
| 5 to 9 Minutes | 12 (1.7%) | 56 (12.0%) |
| 10 to 14 Minutes | 77 (10.8%) | 43 (9.2%) |
| 15 to 19 Minutes | 75 (10.5%) | 55 (11.8%) |
| 20 to 24 Minutes | 81 (11.3%) | 34 (7.3%) |
| 25 to 29 Minutes | 41 (5.7%) | 15 (3.2%) |
| 30 to 34 Minutes | 72 (10.1%) | 80 (17.1%) |
| 35 to 39 Minutes | 62 (8.7%) | 41 (8.8%) |
| 40 to 44 Minutes | 66 (9.2%) | 70 (15.0%) |
| 45 to 59 Minutes | 152 (21.3%) | 39 (8.4%) |
| 60 to 89 Minutes | 76 (10.6%) | 34 (7.3%) |
| 90 or more Minutes | 0 (0.0%) | 0 (0.0%) |
Time of Departure to Work by Sex in Byrnes Mill
The most frequent times of departure to work in Byrnes Mill are 6:30 AM to 6:59 AM (182, 25.5%) for males and 7:30 AM to 7:59 AM (122, 26.1%) for females.
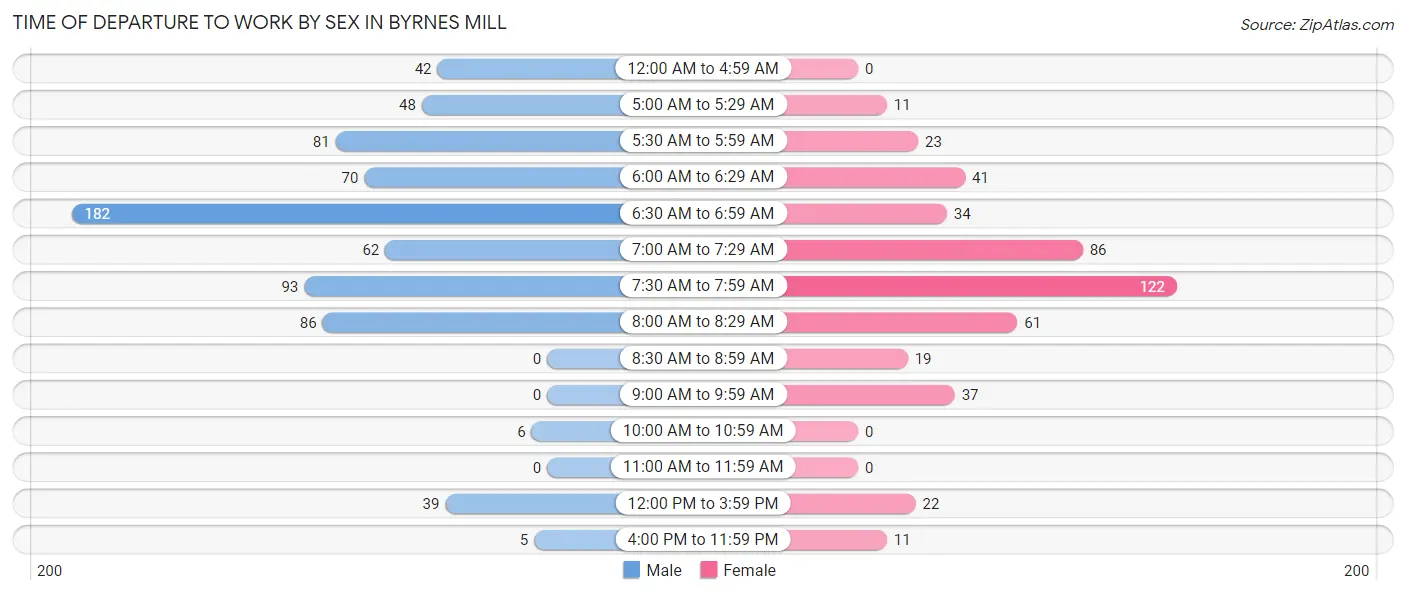
| Time of Departure | Male | Female |
| 12:00 AM to 4:59 AM | 42 (5.9%) | 0 (0.0%) |
| 5:00 AM to 5:29 AM | 48 (6.7%) | 11 (2.4%) |
| 5:30 AM to 5:59 AM | 81 (11.3%) | 23 (4.9%) |
| 6:00 AM to 6:29 AM | 70 (9.8%) | 41 (8.8%) |
| 6:30 AM to 6:59 AM | 182 (25.5%) | 34 (7.3%) |
| 7:00 AM to 7:29 AM | 62 (8.7%) | 86 (18.4%) |
| 7:30 AM to 7:59 AM | 93 (13.0%) | 122 (26.1%) |
| 8:00 AM to 8:29 AM | 86 (12.0%) | 61 (13.1%) |
| 8:30 AM to 8:59 AM | 0 (0.0%) | 19 (4.1%) |
| 9:00 AM to 9:59 AM | 0 (0.0%) | 37 (7.9%) |
| 10:00 AM to 10:59 AM | 6 (0.8%) | 0 (0.0%) |
| 11:00 AM to 11:59 AM | 0 (0.0%) | 0 (0.0%) |
| 12:00 PM to 3:59 PM | 39 (5.5%) | 22 (4.7%) |
| 4:00 PM to 11:59 PM | 5 (0.7%) | 11 (2.4%) |
| Total | 714 (100.0%) | 467 (100.0%) |
Housing Occupancy in Byrnes Mill
Occupancy by Ownership in Byrnes Mill
Of the total 1,213 dwellings in Byrnes Mill, owner-occupied units account for 987 (81.4%), while renter-occupied units make up 226 (18.6%).
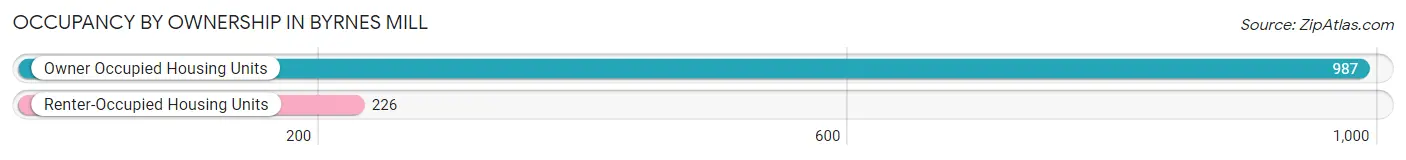
| Occupancy | # Housing Units | % Housing Units |
| Owner Occupied Housing Units | 987 | 81.4% |
| Renter-Occupied Housing Units | 226 | 18.6% |
| Total Occupied Housing Units | 1,213 | 100.0% |
Occupancy by Household Size in Byrnes Mill
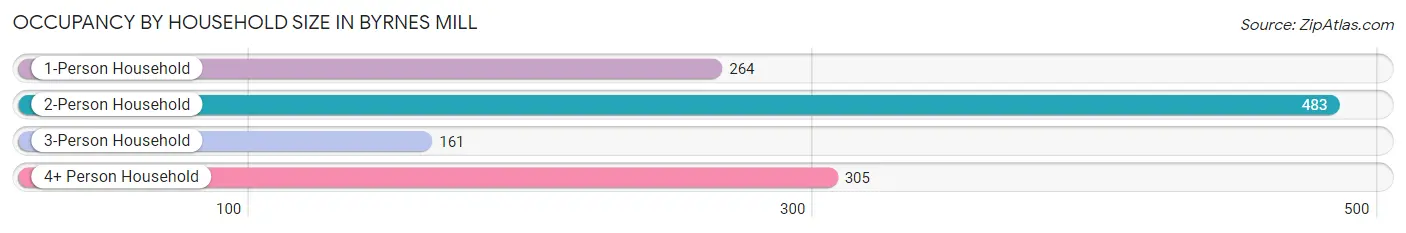
| Household Size | # Housing Units | % Housing Units |
| 1-Person Household | 264 | 21.8% |
| 2-Person Household | 483 | 39.8% |
| 3-Person Household | 161 | 13.3% |
| 4+ Person Household | 305 | 25.1% |
| Total Housing Units | 1,213 | 100.0% |
Occupancy by Ownership by Household Size in Byrnes Mill
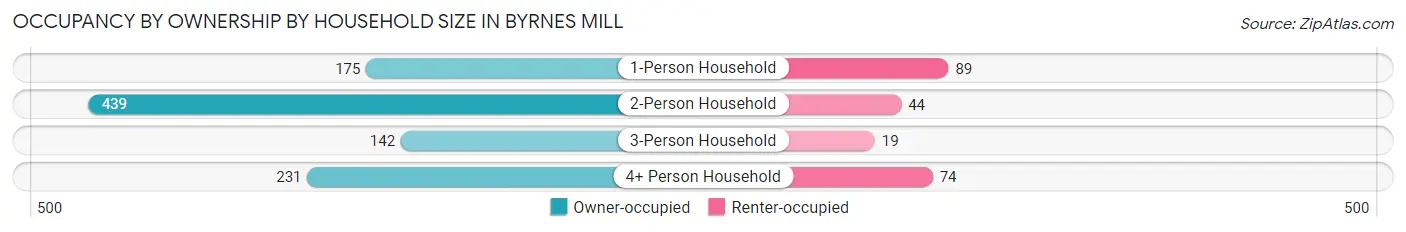
| Household Size | Owner-occupied | Renter-occupied |
| 1-Person Household | 175 (66.3%) | 89 (33.7%) |
| 2-Person Household | 439 (90.9%) | 44 (9.1%) |
| 3-Person Household | 142 (88.2%) | 19 (11.8%) |
| 4+ Person Household | 231 (75.7%) | 74 (24.3%) |
| Total Housing Units | 987 (81.4%) | 226 (18.6%) |
Occupancy by Educational Attainment in Byrnes Mill
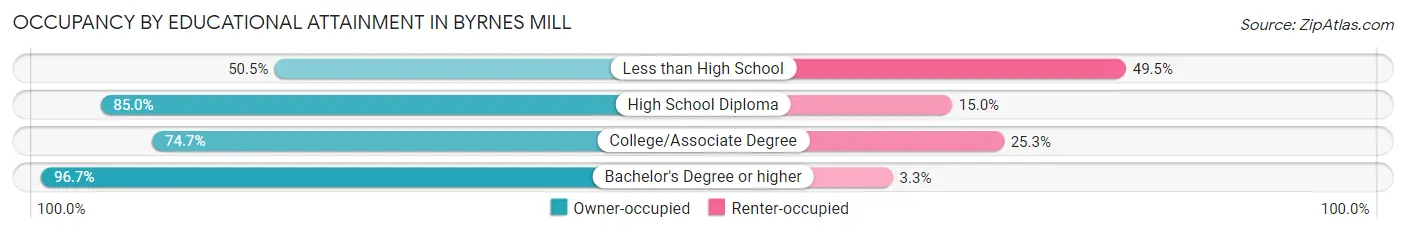
| Household Size | Owner-occupied | Renter-occupied |
| Less than High School | 50 (50.5%) | 49 (49.5%) |
| High School Diploma | 198 (85.0%) | 35 (15.0%) |
| College/Associate Degree | 384 (74.7%) | 130 (25.3%) |
| Bachelor's Degree or higher | 355 (96.7%) | 12 (3.3%) |
Occupancy by Age of Householder in Byrnes Mill
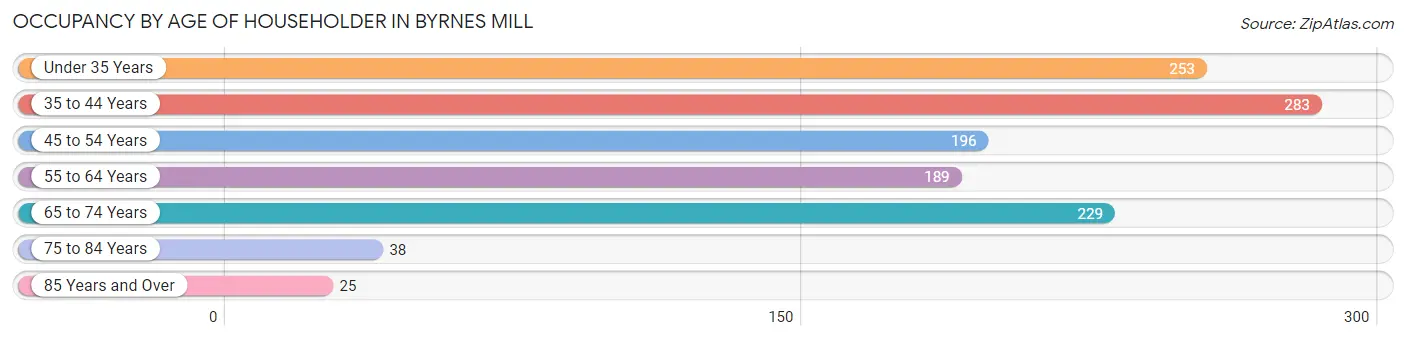
| Age Bracket | # Households | % Households |
| Under 35 Years | 253 | 20.9% |
| 35 to 44 Years | 283 | 23.3% |
| 45 to 54 Years | 196 | 16.2% |
| 55 to 64 Years | 189 | 15.6% |
| 65 to 74 Years | 229 | 18.9% |
| 75 to 84 Years | 38 | 3.1% |
| 85 Years and Over | 25 | 2.1% |
| Total | 1,213 | 100.0% |
Housing Finances in Byrnes Mill
Median Income by Occupancy in Byrnes Mill
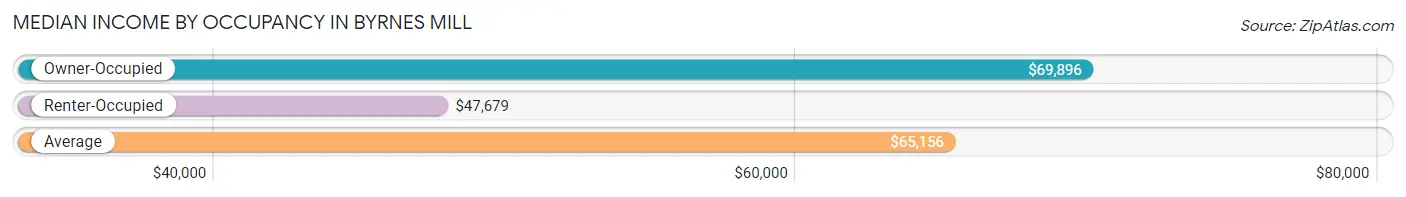
| Occupancy Type | # Households | Median Income |
| Owner-Occupied | 987 (81.4%) | $69,896 |
| Renter-Occupied | 226 (18.6%) | $47,679 |
| Average | 1,213 (100.0%) | $65,156 |
Occupancy by Householder Income Bracket in Byrnes Mill
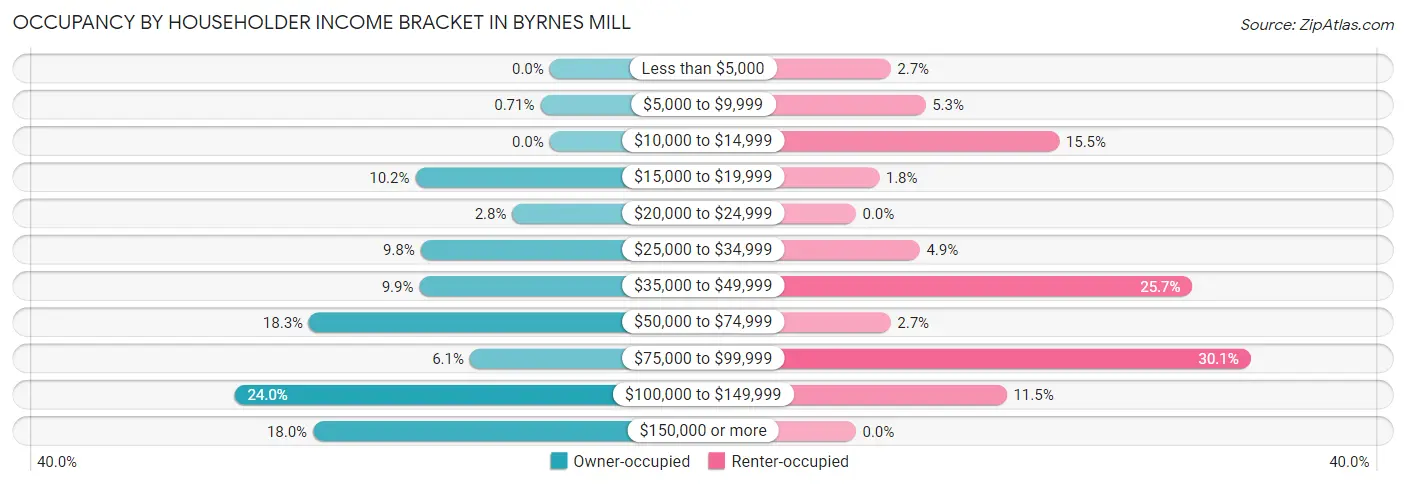
| Income Bracket | Owner-occupied | Renter-occupied |
| Less than $5,000 | 0 (0.0%) | 6 (2.6%) |
| $5,000 to $9,999 | 7 (0.7%) | 12 (5.3%) |
| $10,000 to $14,999 | 0 (0.0%) | 35 (15.5%) |
| $15,000 to $19,999 | 101 (10.2%) | 4 (1.8%) |
| $20,000 to $24,999 | 28 (2.8%) | 0 (0.0%) |
| $25,000 to $34,999 | 97 (9.8%) | 11 (4.9%) |
| $35,000 to $49,999 | 98 (9.9%) | 58 (25.7%) |
| $50,000 to $74,999 | 181 (18.3%) | 6 (2.6%) |
| $75,000 to $99,999 | 60 (6.1%) | 68 (30.1%) |
| $100,000 to $149,999 | 237 (24.0%) | 26 (11.5%) |
| $150,000 or more | 178 (18.0%) | 0 (0.0%) |
| Total | 987 (100.0%) | 226 (100.0%) |
Monthly Housing Cost Tiers in Byrnes Mill
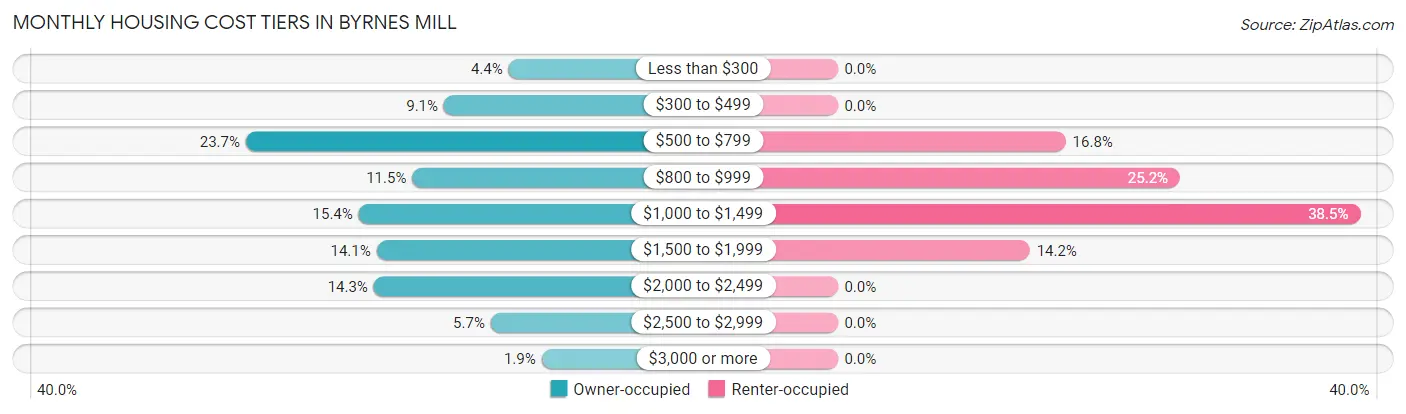
| Monthly Cost | Owner-occupied | Renter-occupied |
| Less than $300 | 43 (4.4%) | 0 (0.0%) |
| $300 to $499 | 90 (9.1%) | 0 (0.0%) |
| $500 to $799 | 234 (23.7%) | 38 (16.8%) |
| $800 to $999 | 113 (11.5%) | 57 (25.2%) |
| $1,000 to $1,499 | 152 (15.4%) | 87 (38.5%) |
| $1,500 to $1,999 | 139 (14.1%) | 32 (14.2%) |
| $2,000 to $2,499 | 141 (14.3%) | 0 (0.0%) |
| $2,500 to $2,999 | 56 (5.7%) | 0 (0.0%) |
| $3,000 or more | 19 (1.9%) | 0 (0.0%) |
| Total | 987 (100.0%) | 226 (100.0%) |
Physical Housing Characteristics in Byrnes Mill
Housing Structures in Byrnes Mill
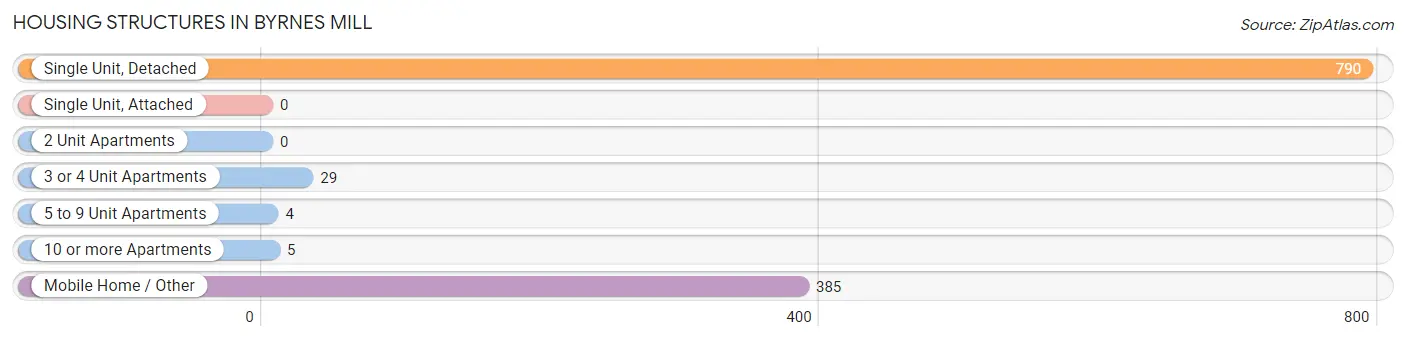
| Structure Type | # Housing Units | % Housing Units |
| Single Unit, Detached | 790 | 65.1% |
| Single Unit, Attached | 0 | 0.0% |
| 2 Unit Apartments | 0 | 0.0% |
| 3 or 4 Unit Apartments | 29 | 2.4% |
| 5 to 9 Unit Apartments | 4 | 0.3% |
| 10 or more Apartments | 5 | 0.4% |
| Mobile Home / Other | 385 | 31.7% |
| Total | 1,213 | 100.0% |
Housing Structures by Occupancy in Byrnes Mill
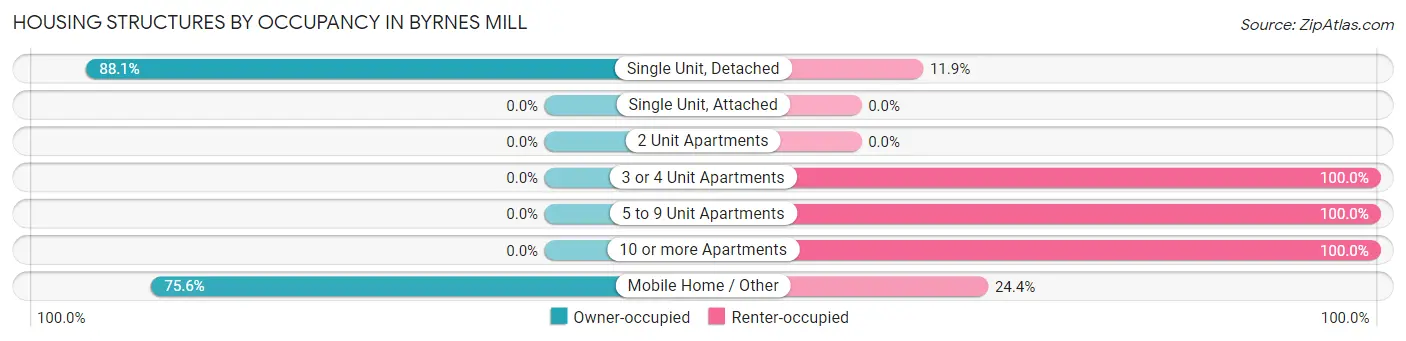
| Structure Type | Owner-occupied | Renter-occupied |
| Single Unit, Detached | 696 (88.1%) | 94 (11.9%) |
| Single Unit, Attached | 0 (0.0%) | 0 (0.0%) |
| 2 Unit Apartments | 0 (0.0%) | 0 (0.0%) |
| 3 or 4 Unit Apartments | 0 (0.0%) | 29 (100.0%) |
| 5 to 9 Unit Apartments | 0 (0.0%) | 4 (100.0%) |
| 10 or more Apartments | 0 (0.0%) | 5 (100.0%) |
| Mobile Home / Other | 291 (75.6%) | 94 (24.4%) |
| Total | 987 (81.4%) | 226 (18.6%) |
Housing Structures by Number of Rooms in Byrnes Mill
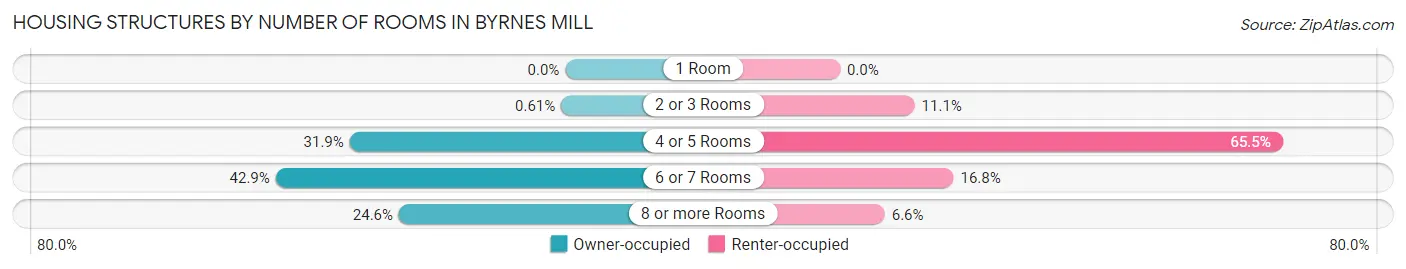
| Number of Rooms | Owner-occupied | Renter-occupied |
| 1 Room | 0 (0.0%) | 0 (0.0%) |
| 2 or 3 Rooms | 6 (0.6%) | 25 (11.1%) |
| 4 or 5 Rooms | 315 (31.9%) | 148 (65.5%) |
| 6 or 7 Rooms | 423 (42.9%) | 38 (16.8%) |
| 8 or more Rooms | 243 (24.6%) | 15 (6.6%) |
| Total | 987 (100.0%) | 226 (100.0%) |
Housing Structure by Heating Type in Byrnes Mill
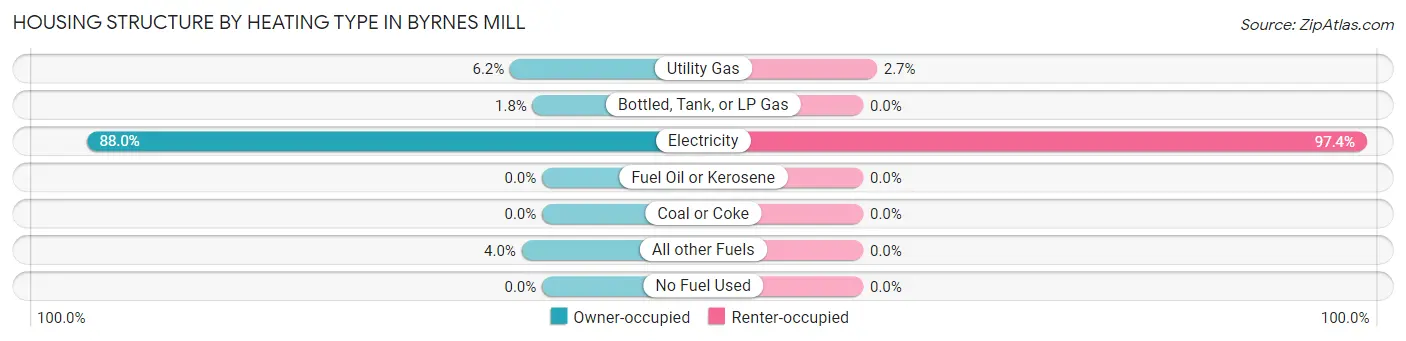
| Heating Type | Owner-occupied | Renter-occupied |
| Utility Gas | 61 (6.2%) | 6 (2.6%) |
| Bottled, Tank, or LP Gas | 18 (1.8%) | 0 (0.0%) |
| Electricity | 869 (88.0%) | 220 (97.4%) |
| Fuel Oil or Kerosene | 0 (0.0%) | 0 (0.0%) |
| Coal or Coke | 0 (0.0%) | 0 (0.0%) |
| All other Fuels | 39 (4.0%) | 0 (0.0%) |
| No Fuel Used | 0 (0.0%) | 0 (0.0%) |
| Total | 987 (100.0%) | 226 (100.0%) |
Household Vehicle Usage in Byrnes Mill
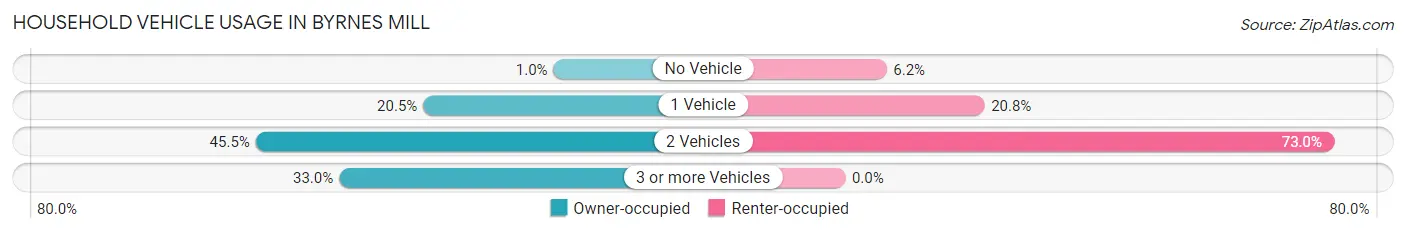
| Vehicles per Household | Owner-occupied | Renter-occupied |
| No Vehicle | 10 (1.0%) | 14 (6.2%) |
| 1 Vehicle | 202 (20.5%) | 47 (20.8%) |
| 2 Vehicles | 449 (45.5%) | 165 (73.0%) |
| 3 or more Vehicles | 326 (33.0%) | 0 (0.0%) |
| Total | 987 (100.0%) | 226 (100.0%) |
Real Estate & Mortgages in Byrnes Mill
Real Estate and Mortgage Overview in Byrnes Mill
| Characteristic | Without Mortgage | With Mortgage |
| Housing Units | 310 | 677 |
| Median Property Value | - | - |
| Median Household Income | $53,750 | $165 |
| Monthly Housing Costs | $552 | $19 |
| Real Estate Taxes | $1,797 | $69 |
Property Value by Mortgage Status in Byrnes Mill
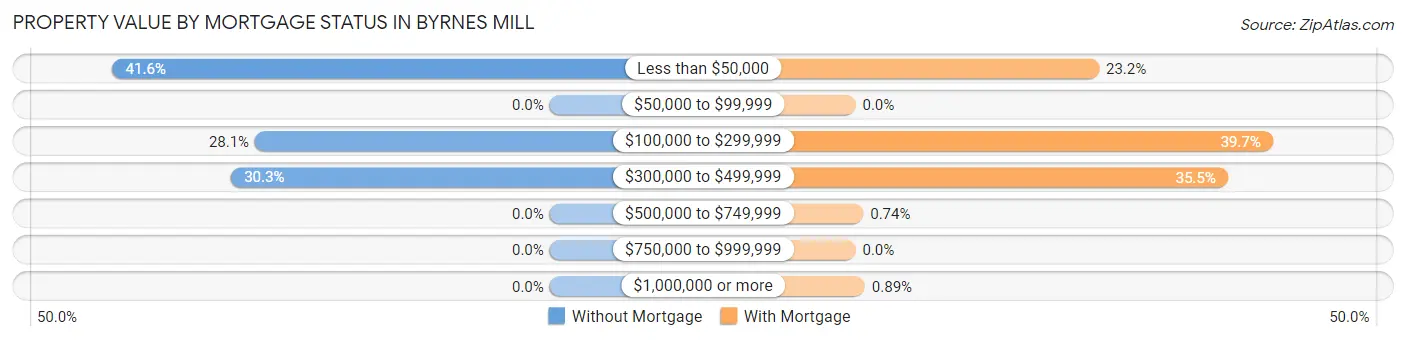
| Property Value | Without Mortgage | With Mortgage |
| Less than $50,000 | 129 (41.6%) | 157 (23.2%) |
| $50,000 to $99,999 | 0 (0.0%) | 0 (0.0%) |
| $100,000 to $299,999 | 87 (28.1%) | 269 (39.7%) |
| $300,000 to $499,999 | 94 (30.3%) | 240 (35.4%) |
| $500,000 to $749,999 | 0 (0.0%) | 5 (0.7%) |
| $750,000 to $999,999 | 0 (0.0%) | 0 (0.0%) |
| $1,000,000 or more | 0 (0.0%) | 6 (0.9%) |
| Total | 310 (100.0%) | 677 (100.0%) |
Household Income by Mortgage Status in Byrnes Mill
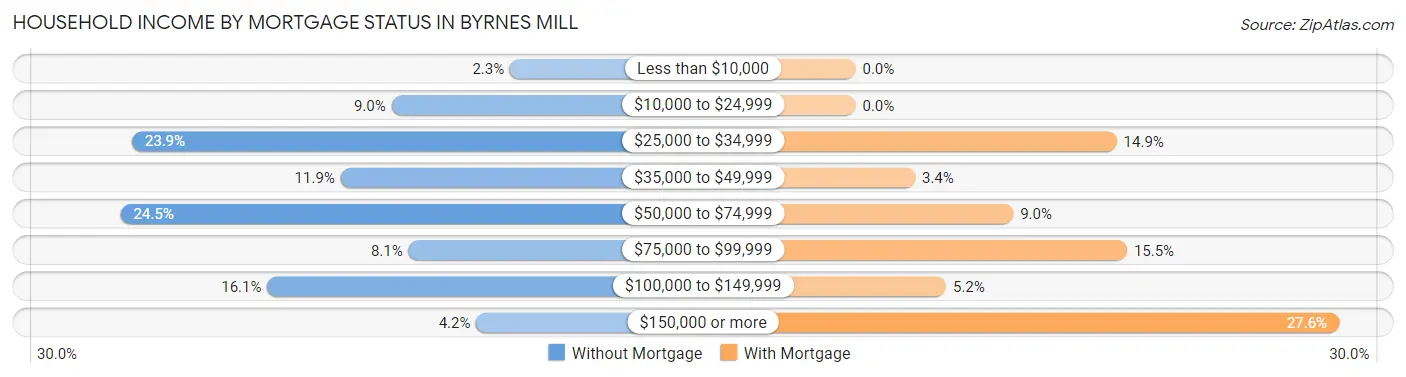
| Household Income | Without Mortgage | With Mortgage |
| Less than $10,000 | 7 (2.3%) | 0 (0.0%) |
| $10,000 to $24,999 | 28 (9.0%) | 0 (0.0%) |
| $25,000 to $34,999 | 74 (23.9%) | 101 (14.9%) |
| $35,000 to $49,999 | 37 (11.9%) | 23 (3.4%) |
| $50,000 to $74,999 | 76 (24.5%) | 61 (9.0%) |
| $75,000 to $99,999 | 25 (8.1%) | 105 (15.5%) |
| $100,000 to $149,999 | 50 (16.1%) | 35 (5.2%) |
| $150,000 or more | 13 (4.2%) | 187 (27.6%) |
| Total | 310 (100.0%) | 677 (100.0%) |
Property Value to Household Income Ratio in Byrnes Mill
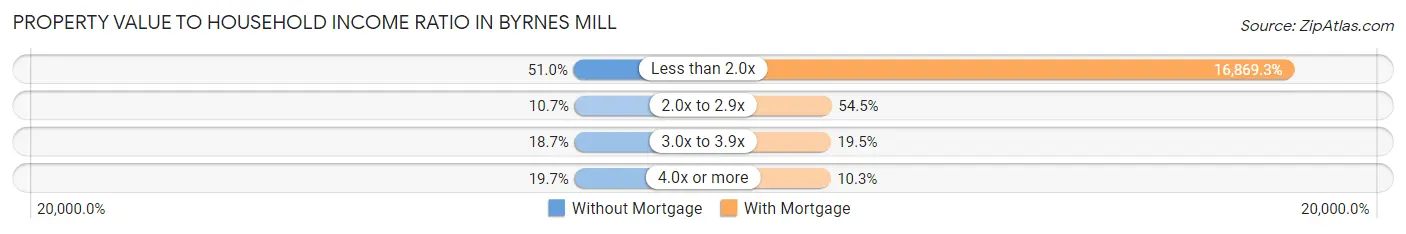
| Value-to-Income Ratio | Without Mortgage | With Mortgage |
| Less than 2.0x | 158 (51.0%) | 114,205 (16,869.3%) |
| 2.0x to 2.9x | 33 (10.6%) | 369 (54.5%) |
| 3.0x to 3.9x | 58 (18.7%) | 132 (19.5%) |
| 4.0x or more | 61 (19.7%) | 70 (10.3%) |
| Total | 310 (100.0%) | 677 (100.0%) |
Real Estate Taxes by Mortgage Status in Byrnes Mill
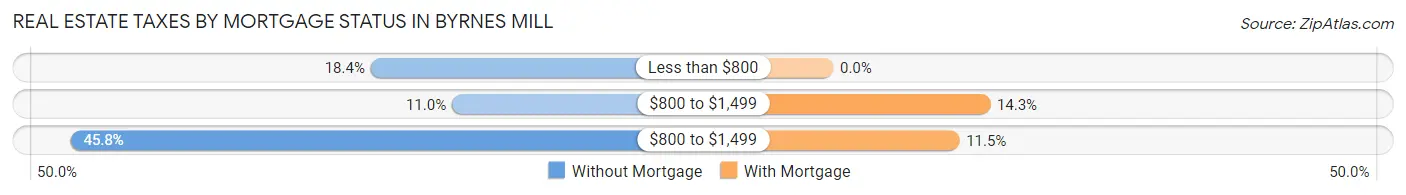
| Property Taxes | Without Mortgage | With Mortgage |
| Less than $800 | 57 (18.4%) | 0 (0.0%) |
| $800 to $1,499 | 34 (11.0%) | 97 (14.3%) |
| $800 to $1,499 | 142 (45.8%) | 78 (11.5%) |
| Total | 310 (100.0%) | 677 (100.0%) |
Health & Disability in Byrnes Mill
Health Insurance Coverage by Age in Byrnes Mill
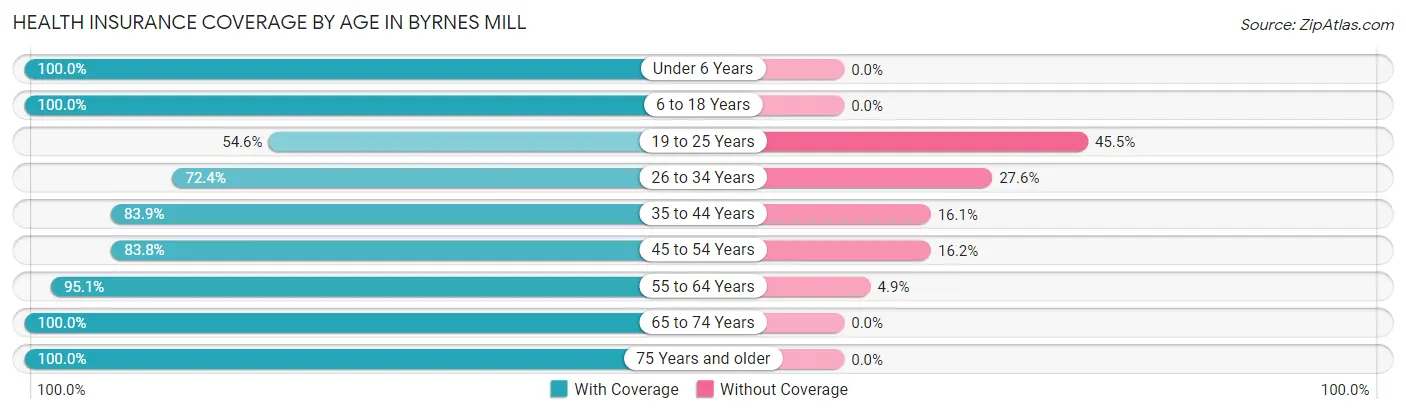
| Age Bracket | With Coverage | Without Coverage |
| Under 6 Years | 288 (100.0%) | 0 (0.0%) |
| 6 to 18 Years | 550 (100.0%) | 0 (0.0%) |
| 19 to 25 Years | 66 (54.5%) | 55 (45.5%) |
| 26 to 34 Years | 294 (72.4%) | 112 (27.6%) |
| 35 to 44 Years | 406 (83.9%) | 78 (16.1%) |
| 45 to 54 Years | 378 (83.8%) | 73 (16.2%) |
| 55 to 64 Years | 309 (95.1%) | 16 (4.9%) |
| 65 to 74 Years | 423 (100.0%) | 0 (0.0%) |
| 75 Years and older | 107 (100.0%) | 0 (0.0%) |
| Total | 2,821 (89.4%) | 334 (10.6%) |
Health Insurance Coverage by Citizenship Status in Byrnes Mill
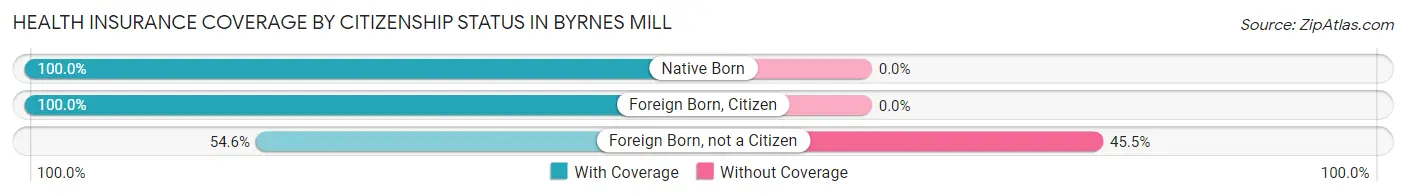
| Citizenship Status | With Coverage | Without Coverage |
| Native Born | 288 (100.0%) | 0 (0.0%) |
| Foreign Born, Citizen | 550 (100.0%) | 0 (0.0%) |
| Foreign Born, not a Citizen | 66 (54.5%) | 55 (45.5%) |
Health Insurance Coverage by Household Income in Byrnes Mill
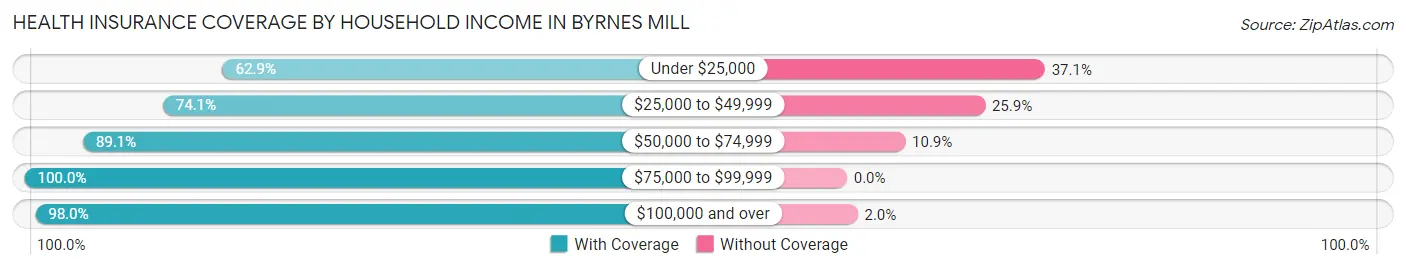
| Household Income | With Coverage | Without Coverage |
| Under $25,000 | 190 (62.9%) | 112 (37.1%) |
| $25,000 to $49,999 | 395 (74.1%) | 138 (25.9%) |
| $50,000 to $74,999 | 465 (89.1%) | 57 (10.9%) |
| $75,000 to $99,999 | 452 (100.0%) | 0 (0.0%) |
| $100,000 and over | 1,319 (98.0%) | 27 (2.0%) |
Public vs Private Health Insurance Coverage by Age in Byrnes Mill
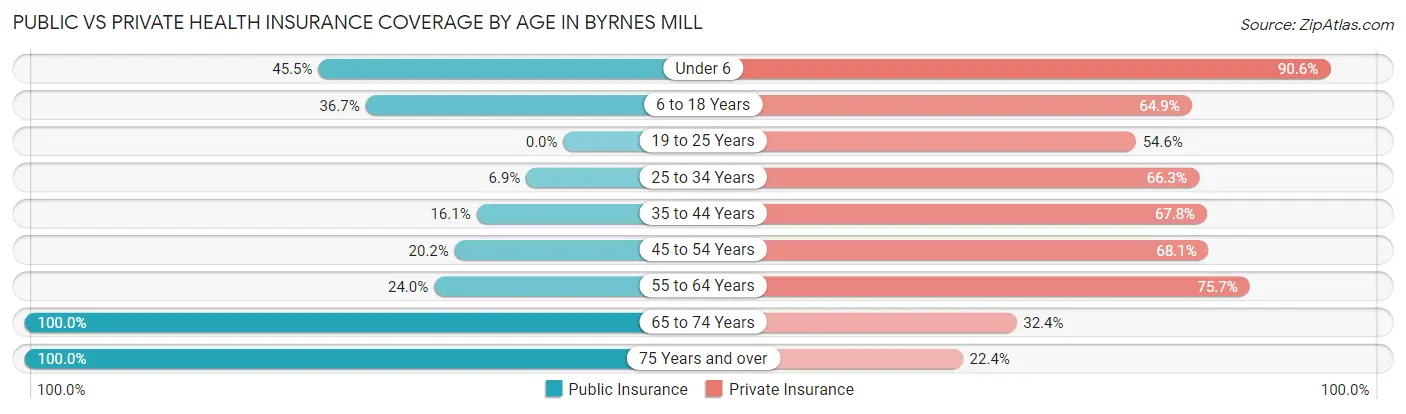
| Age Bracket | Public Insurance | Private Insurance |
| Under 6 | 131 (45.5%) | 261 (90.6%) |
| 6 to 18 Years | 202 (36.7%) | 357 (64.9%) |
| 19 to 25 Years | 0 (0.0%) | 66 (54.5%) |
| 25 to 34 Years | 28 (6.9%) | 269 (66.3%) |
| 35 to 44 Years | 78 (16.1%) | 328 (67.8%) |
| 45 to 54 Years | 91 (20.2%) | 307 (68.1%) |
| 55 to 64 Years | 78 (24.0%) | 246 (75.7%) |
| 65 to 74 Years | 423 (100.0%) | 137 (32.4%) |
| 75 Years and over | 107 (100.0%) | 24 (22.4%) |
| Total | 1,138 (36.1%) | 1,995 (63.2%) |
Disability Status by Sex by Age in Byrnes Mill
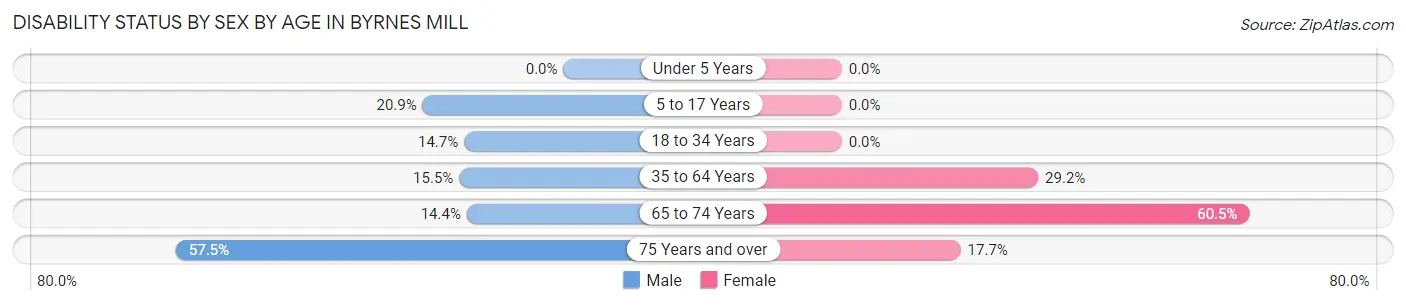
| Age Bracket | Male | Female |
| Under 5 Years | 0 (0.0%) | 0 (0.0%) |
| 5 to 17 Years | 87 (20.9%) | 0 (0.0%) |
| 18 to 34 Years | 42 (14.7%) | 0 (0.0%) |
| 35 to 64 Years | 101 (15.5%) | 177 (29.2%) |
| 65 to 74 Years | 32 (14.3%) | 121 (60.5%) |
| 75 Years and over | 42 (57.5%) | 6 (17.6%) |
Disability Class by Sex by Age in Byrnes Mill
Disability Class: Hearing Difficulty
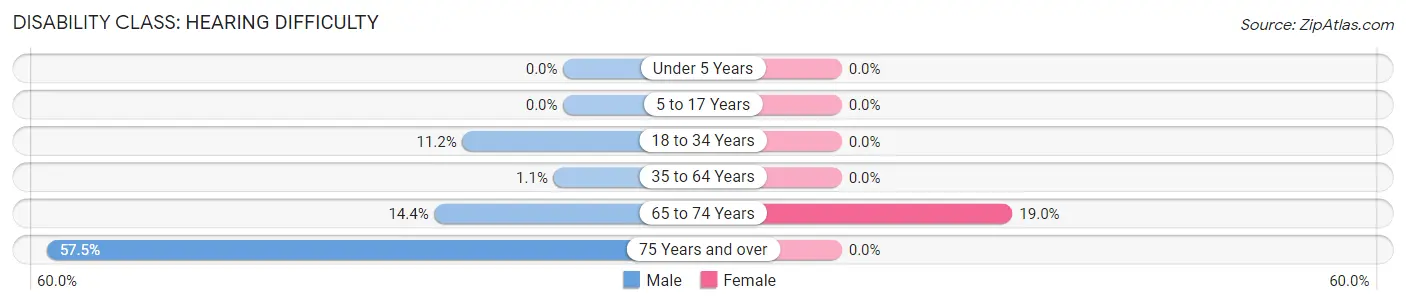
| Age Bracket | Male | Female |
| Under 5 Years | 0 (0.0%) | 0 (0.0%) |
| 5 to 17 Years | 0 (0.0%) | 0 (0.0%) |
| 18 to 34 Years | 32 (11.2%) | 0 (0.0%) |
| 35 to 64 Years | 7 (1.1%) | 0 (0.0%) |
| 65 to 74 Years | 32 (14.3%) | 38 (19.0%) |
| 75 Years and over | 42 (57.5%) | 0 (0.0%) |
Disability Class: Vision Difficulty
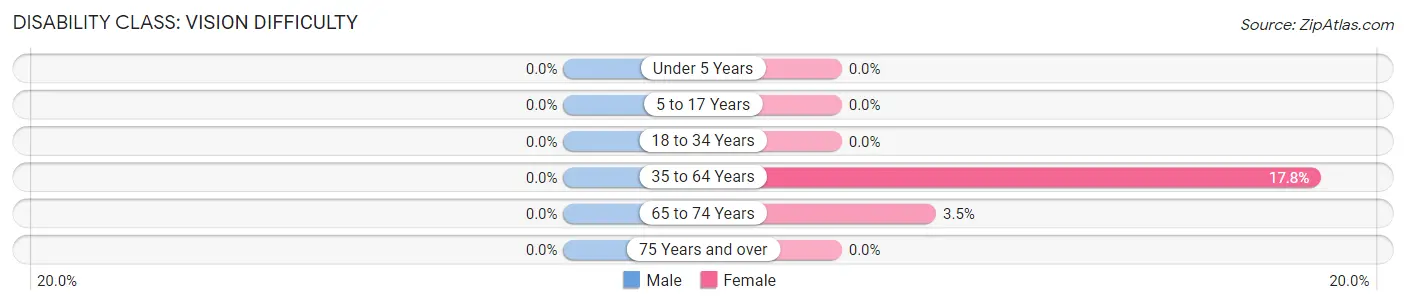
| Age Bracket | Male | Female |
| Under 5 Years | 0 (0.0%) | 0 (0.0%) |
| 5 to 17 Years | 0 (0.0%) | 0 (0.0%) |
| 18 to 34 Years | 0 (0.0%) | 0 (0.0%) |
| 35 to 64 Years | 0 (0.0%) | 108 (17.8%) |
| 65 to 74 Years | 0 (0.0%) | 7 (3.5%) |
| 75 Years and over | 0 (0.0%) | 0 (0.0%) |
Disability Class: Cognitive Difficulty
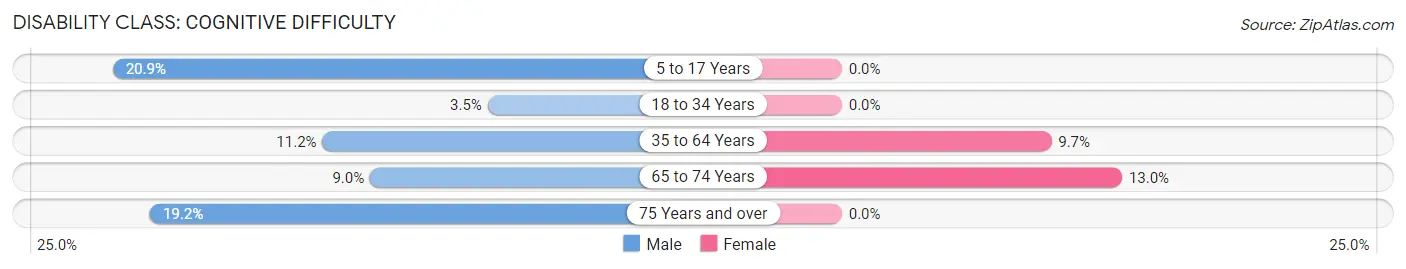
| Age Bracket | Male | Female |
| 5 to 17 Years | 87 (20.9%) | 0 (0.0%) |
| 18 to 34 Years | 10 (3.5%) | 0 (0.0%) |
| 35 to 64 Years | 73 (11.2%) | 59 (9.7%) |
| 65 to 74 Years | 20 (9.0%) | 26 (13.0%) |
| 75 Years and over | 14 (19.2%) | 0 (0.0%) |
Disability Class: Ambulatory Difficulty
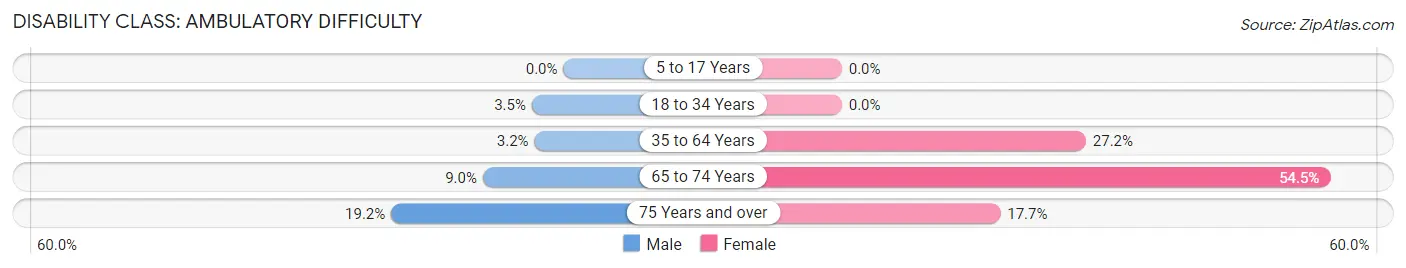
| Age Bracket | Male | Female |
| 5 to 17 Years | 0 (0.0%) | 0 (0.0%) |
| 18 to 34 Years | 10 (3.5%) | 0 (0.0%) |
| 35 to 64 Years | 21 (3.2%) | 165 (27.2%) |
| 65 to 74 Years | 20 (9.0%) | 109 (54.5%) |
| 75 Years and over | 14 (19.2%) | 6 (17.6%) |
Disability Class: Self-Care Difficulty
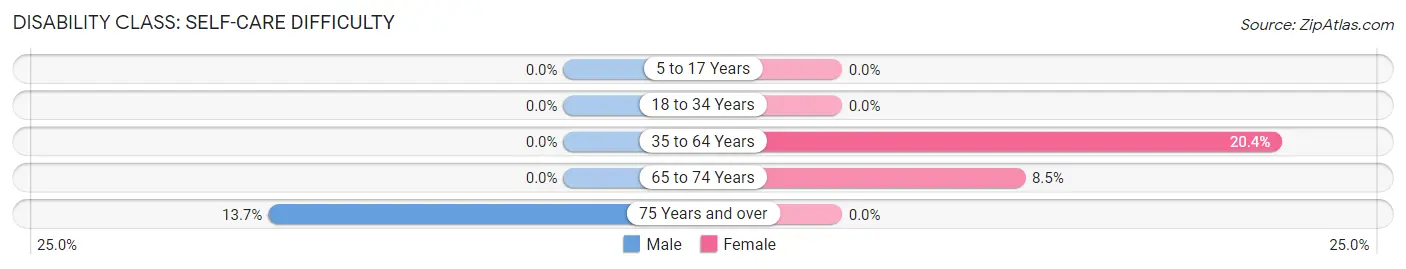
| Age Bracket | Male | Female |
| 5 to 17 Years | 0 (0.0%) | 0 (0.0%) |
| 18 to 34 Years | 0 (0.0%) | 0 (0.0%) |
| 35 to 64 Years | 0 (0.0%) | 124 (20.4%) |
| 65 to 74 Years | 0 (0.0%) | 17 (8.5%) |
| 75 Years and over | 10 (13.7%) | 0 (0.0%) |
Technology Access in Byrnes Mill
Computing Device Access in Byrnes Mill
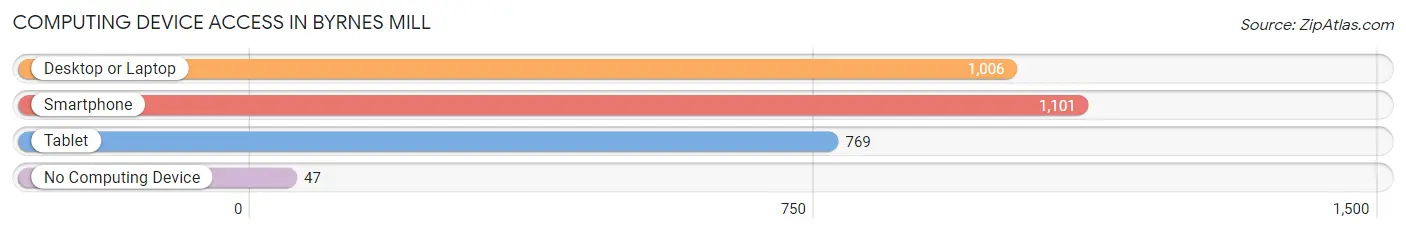
| Device Type | # Households | % Households |
| Desktop or Laptop | 1,006 | 82.9% |
| Smartphone | 1,101 | 90.8% |
| Tablet | 769 | 63.4% |
| No Computing Device | 47 | 3.9% |
| Total | 1,213 | 100.0% |
Internet Access in Byrnes Mill
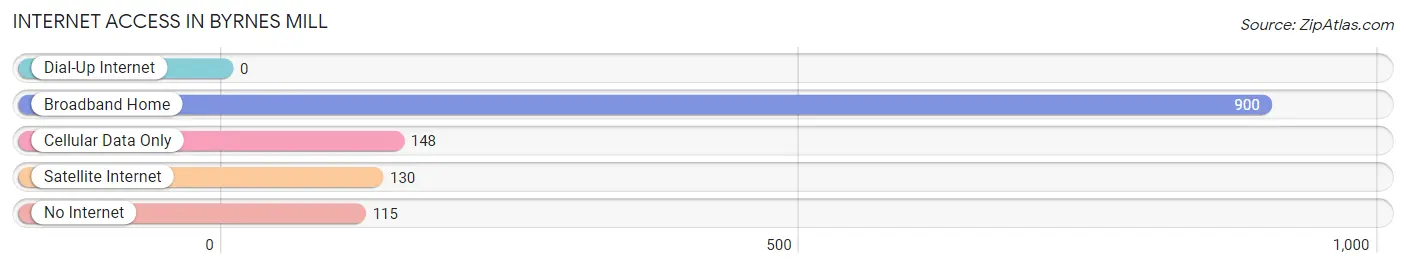
| Internet Type | # Households | % Households |
| Dial-Up Internet | 0 | 0.0% |
| Broadband Home | 900 | 74.2% |
| Cellular Data Only | 148 | 12.2% |
| Satellite Internet | 130 | 10.7% |
| No Internet | 115 | 9.5% |
| Total | 1,213 | 100.0% |
Byrnes Mill Summary
Byrnes Mill is a small city located in Jefferson County, Missouri. It is situated on the banks of the Big River, approximately 25 miles south of St. Louis. The city has a population of 1,845 people, according to the 2010 census.
History
The area that is now Byrnes Mill was first settled in the early 1800s by a group of German immigrants. The town was originally known as “Byrne’s Mill” after the family that owned the mill. The mill was used to grind grain and was a major source of income for the town.
In 1876, the town was officially incorporated as Byrnes Mill. The town grew steadily over the next few decades, and by the early 1900s, it had become a thriving community. The town was home to several businesses, including a general store, a blacksmith shop, a hotel, and a post office.
Geography
Byrnes Mill is located in the Ozark Mountains region of Missouri. The city is situated on the banks of the Big River, which flows through the city. The city is surrounded by rolling hills and forests, and is located approximately 25 miles south of St. Louis.
The climate in Byrnes Mill is humid subtropical, with hot, humid summers and mild winters. The average annual temperature is around 60 degrees Fahrenheit. The average annual precipitation is around 40 inches.
Economy
The economy of Byrnes Mill is largely based on agriculture and tourism. The city is home to several farms, which produce a variety of crops, including corn, soybeans, and wheat. The city is also home to several wineries, which produce a variety of wines.
Tourism is also an important part of the economy. The city is home to several attractions, including the Byrnes Mill Historical Museum, the Byrnes Mill Nature Center, and the Byrnes Mill Winery.
Demographics
According to the 2010 census, the population of Byrnes Mill was 1,845 people. The racial makeup of the city was 97.3% White, 0.7% African American, 0.3% Native American, 0.2% Asian, and 1.5% from other races. The median household income was $50,938, and the median family income was $60,938.
Conclusion
Byrnes Mill is a small city located in Jefferson County, Missouri. It is situated on the banks of the Big River, approximately 25 miles south of St. Louis. The city has a population of 1,845 people, according to the 2010 census. The economy of Byrnes Mill is largely based on agriculture and tourism. The racial makeup of the city was 97.3% White, 0.7% African American, 0.3% Native American, 0.2% Asian, and 1.5% from other races. The median household income was $50,938, and the median family income was $60,938. Byrnes Mill is a thriving community with a rich history and a bright future.
Common Questions
What is the Total Population of Byrnes Mill?
Total Population of Byrnes Mill is 3,155.
What is the Total Male Population of Byrnes Mill?
Total Male Population of Byrnes Mill is 1,761.
What is the Total Female Population of Byrnes Mill?
Total Female Population of Byrnes Mill is 1,394.
What is the Ratio of Males per 100 Females in Byrnes Mill?
There are 126.33 Males per 100 Females in Byrnes Mill.
What is the Ratio of Females per 100 Males in Byrnes Mill?
There are 79.16 Females per 100 Males in Byrnes Mill.
What is the Median Population Age in Byrnes Mill?
Median Population Age in Byrnes Mill is 39.8 Years.
What is the Average Family Size in Byrnes Mill
Average Family Size in Byrnes Mill is 3.1 People.
What is the Average Household Size in Byrnes Mill
Average Household Size in Byrnes Mill is 2.6 People.
What is Per Capita Income in Byrnes Mill?
Per Capita income in Byrnes Mill is $33,353.
What is the Median Family Income in Byrnes Mill?
Median Family Income in Byrnes Mill is $99,667.
What is the Median Household income in Byrnes Mill?
Median Household Income in Byrnes Mill is $65,156.
What is Income or Wage Gap in Byrnes Mill?
Income or Wage Gap in Byrnes Mill is 30.9%.
Women in Byrnes Mill earn 69.1 cents for every dollar earned by a man.
What is Inequality or Gini Index in Byrnes Mill?
Inequality or Gini Index in Byrnes Mill is 0.40.
How Large is the Labor Force in Byrnes Mill?
There are 1,288 People in the Labor Forcein in Byrnes Mill.
What is the Percentage of People in the Labor Force in Byrnes Mill?
54.7% of People are in the Labor Force in Byrnes Mill.
What is the Unemployment Rate in Byrnes Mill?
Unemployment Rate in Byrnes Mill is 1.7%.