Windsor Place, MO
Windsor Place Map
Windsor Place Overview
448
TOTAL POPULATION
188
MALE POPULATION
260
FEMALE POPULATION
72.31
MALES / 100 FEMALES
138.30
FEMALES / 100 MALES
32.7
MEDIAN AGE
3.4
AVG FAMILY SIZE
2.9
AVG HOUSEHOLD SIZE
$31,260
PER CAPITA INCOME
$110,114
AVG FAMILY INCOME
$91,667
AVG HOUSEHOLD INCOME
25.3%
WAGE / INCOME GAP [ % ]
74.7¢/ $1
WAGE / INCOME GAP [ $ ]
0.31
INEQUALITY / GINI INDEX
255
LABOR FORCE [ PEOPLE ]
75.2%
PERCENT IN LABOR FORCE
1.2%
UNEMPLOYMENT RATE
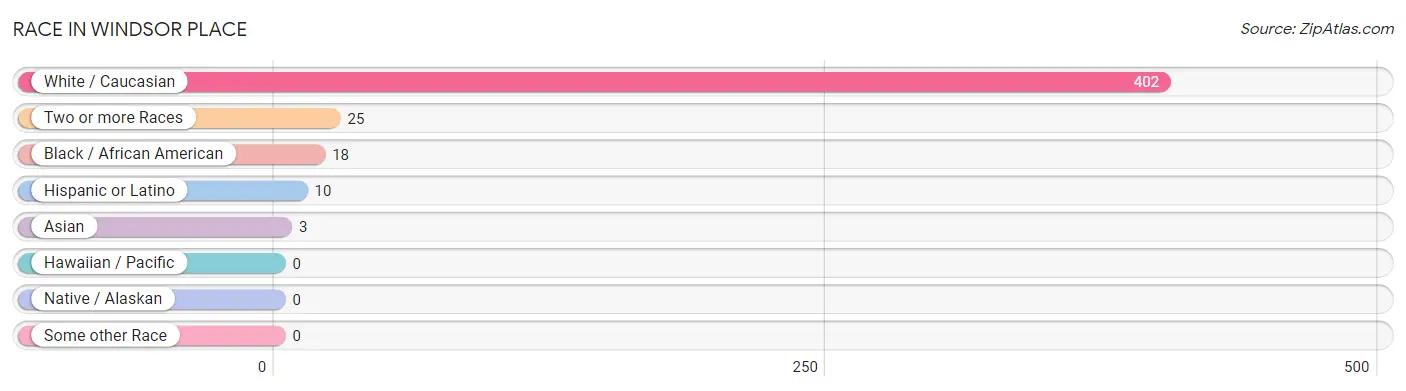
Race in Windsor Place
The most populous races in Windsor Place are White / Caucasian (402 | 89.7%), Two or more Races (25 | 5.6%), and Black / African American (18 | 4.0%).
| Race | # Population | % Population |
| Asian | 3 | 0.7% |
| Black / African American | 18 | 4.0% |
| Hawaiian / Pacific | 0 | 0.0% |
| Hispanic or Latino | 10 | 2.2% |
| Native / Alaskan | 0 | 0.0% |
| White / Caucasian | 402 | 89.7% |
| Two or more Races | 25 | 5.6% |
| Some other Race | 0 | 0.0% |
| Total | 448 | 100.0% |
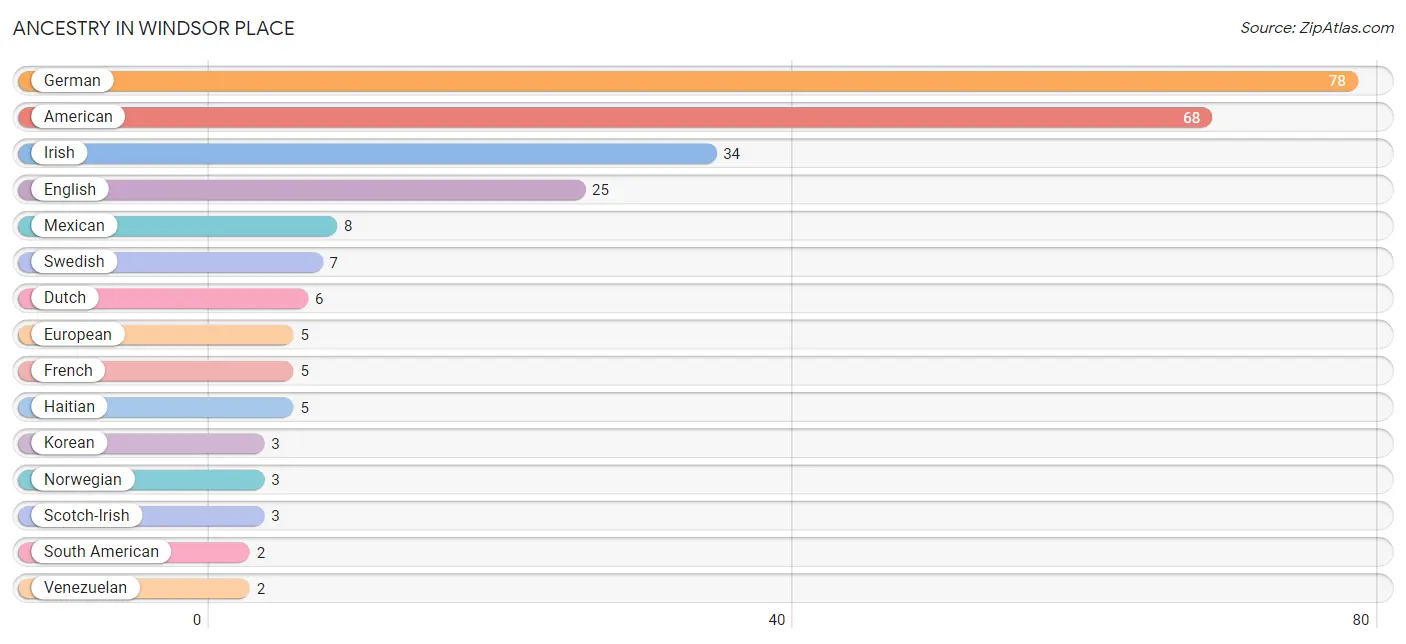
Ancestry in Windsor Place
The most populous ancestries reported in Windsor Place are German (78 | 17.4%), American (68 | 15.2%), Irish (34 | 7.6%), English (25 | 5.6%), and Mexican (8 | 1.8%), together accounting for 47.5% of all Windsor Place residents.
| Ancestry | # Population | % Population |
| American | 68 | 15.2% |
| Dutch | 6 | 1.3% |
| English | 25 | 5.6% |
| European | 5 | 1.1% |
| French | 5 | 1.1% |
| German | 78 | 17.4% |
| Haitian | 5 | 1.1% |
| Irish | 34 | 7.6% |
| Korean | 3 | 0.7% |
| Mexican | 8 | 1.8% |
| Norwegian | 3 | 0.7% |
| Russian | 1 | 0.2% |
| Scotch-Irish | 3 | 0.7% |
| Scottish | 1 | 0.2% |
| South American | 2 | 0.4% |
| Swedish | 7 | 1.6% |
| Venezuelan | 2 | 0.4% |
| Welsh | 2 | 0.4% | View All 18 Rows |
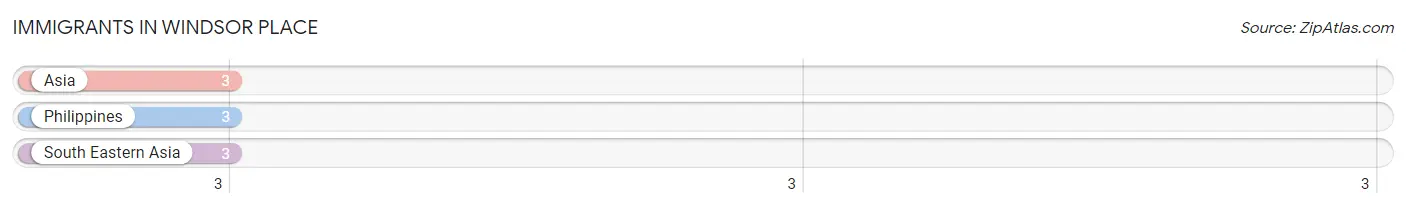
Immigrants in Windsor Place
The most numerous immigrant groups reported in Windsor Place came from Asia (3 | 0.7%), Philippines (3 | 0.7%), and South Eastern Asia (3 | 0.7%), together accounting for 2.0% of all Windsor Place residents.
| Immigration Origin | # Population | % Population |
| Asia | 3 | 0.7% |
| Philippines | 3 | 0.7% |
| South Eastern Asia | 3 | 0.7% | View All 3 Rows |
Sex and Age in Windsor Place
Sex and Age in Windsor Place
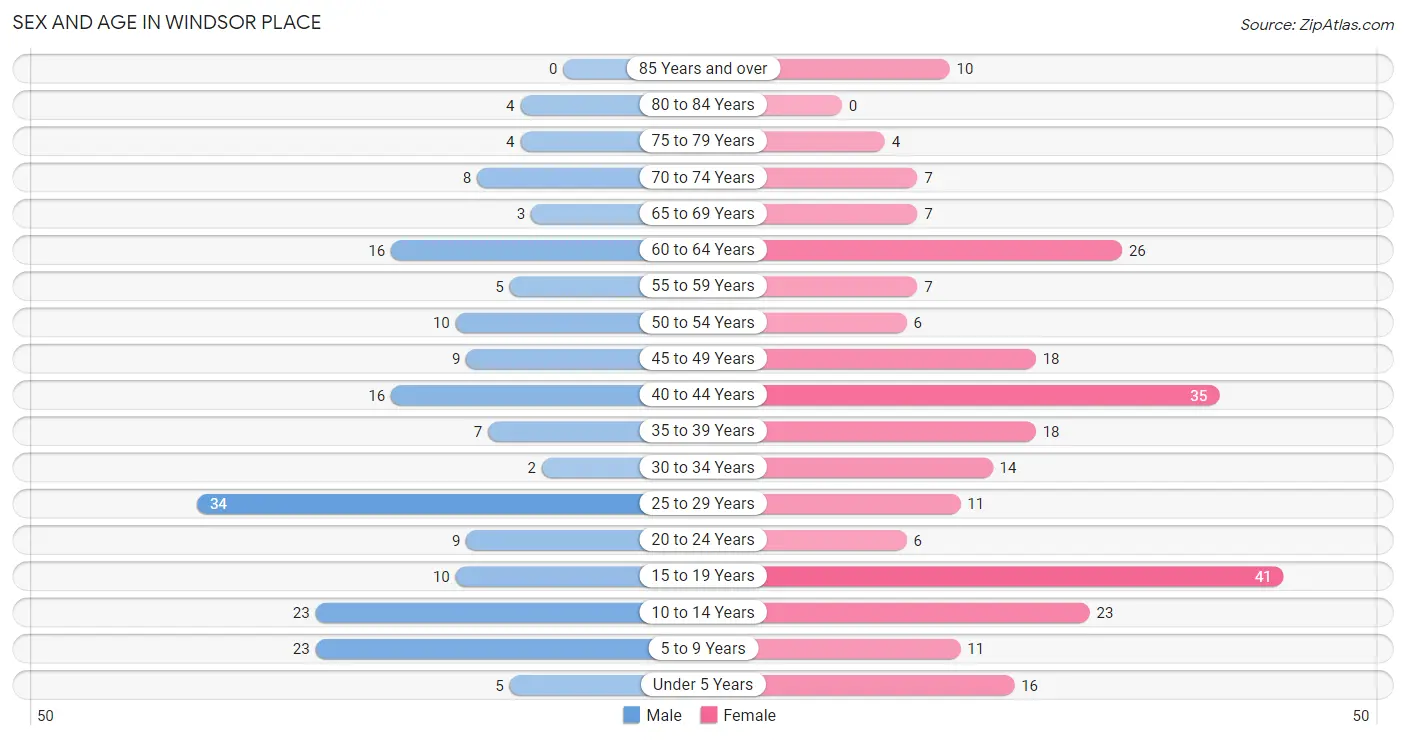
The most populous age groups in Windsor Place are 25 to 29 Years (34 | 18.1%) for men and 15 to 19 Years (41 | 15.8%) for women.
| Age Bracket | Male | Female |
| Under 5 Years | 5 (2.7%) | 16 (6.1%) |
| 5 to 9 Years | 23 (12.2%) | 11 (4.2%) |
| 10 to 14 Years | 23 (12.2%) | 23 (8.8%) |
| 15 to 19 Years | 10 (5.3%) | 41 (15.8%) |
| 20 to 24 Years | 9 (4.8%) | 6 (2.3%) |
| 25 to 29 Years | 34 (18.1%) | 11 (4.2%) |
| 30 to 34 Years | 2 (1.1%) | 14 (5.4%) |
| 35 to 39 Years | 7 (3.7%) | 18 (6.9%) |
| 40 to 44 Years | 16 (8.5%) | 35 (13.5%) |
| 45 to 49 Years | 9 (4.8%) | 18 (6.9%) |
| 50 to 54 Years | 10 (5.3%) | 6 (2.3%) |
| 55 to 59 Years | 5 (2.7%) | 7 (2.7%) |
| 60 to 64 Years | 16 (8.5%) | 26 (10.0%) |
| 65 to 69 Years | 3 (1.6%) | 7 (2.7%) |
| 70 to 74 Years | 8 (4.3%) | 7 (2.7%) |
| 75 to 79 Years | 4 (2.1%) | 4 (1.5%) |
| 80 to 84 Years | 4 (2.1%) | 0 (0.0%) |
| 85 Years and over | 0 (0.0%) | 10 (3.8%) |
| Total | 188 (100.0%) | 260 (100.0%) |
Families and Households in Windsor Place
Median Family Size in Windsor Place
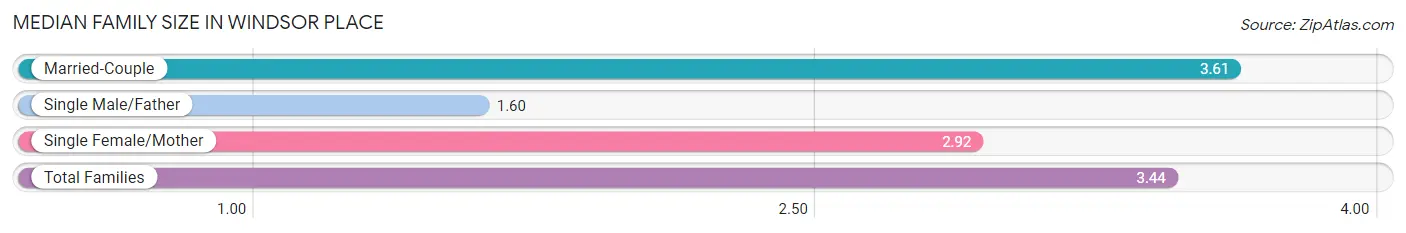
The median family size in Windsor Place is 3.44 persons per family, with married-couple families (94 | 83.9%) accounting for the largest median family size of 3.61 persons per family. On the other hand, single male/father families (5 | 4.5%) represent the smallest median family size with 1.60 persons per family.
| Family Type | # Families | Family Size |
| Married-Couple | 94 (83.9%) | 3.61 |
| Single Male/Father | 5 (4.5%) | 1.60 |
| Single Female/Mother | 13 (11.6%) | 2.92 |
| Total Families | 112 (100.0%) | 3.44 |
Median Household Size in Windsor Place
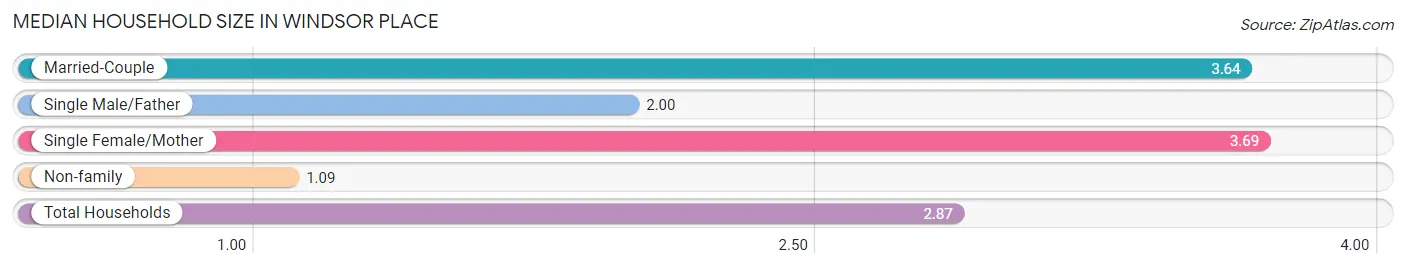
The median household size in Windsor Place is 2.87 persons per household, with single female/mother households (13 | 8.3%) accounting for the largest median household size of 3.69 persons per household. non-family households (44 | 28.2%) represent the smallest median household size with 1.09 persons per household.
| Household Type | # Households | Household Size |
| Married-Couple | 94 (60.3%) | 3.64 |
| Single Male/Father | 5 (3.2%) | 2.00 |
| Single Female/Mother | 13 (8.3%) | 3.69 |
| Non-family | 44 (28.2%) | 1.09 |
| Total Households | 156 (100.0%) | 2.87 |
Household Size by Marriage Status in Windsor Place
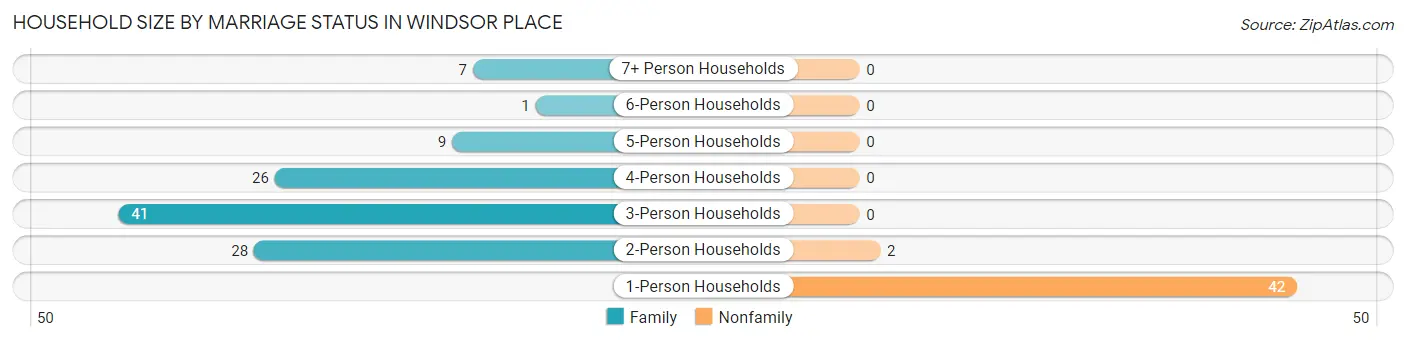
Out of a total of 156 households in Windsor Place, 112 (71.8%) are family households, while 44 (28.2%) are nonfamily households. The most numerous type of family households are 3-person households, comprising 41, and the most common type of nonfamily households are 1-person households, comprising 42.
| Household Size | Family Households | Nonfamily Households |
| 1-Person Households | - | 42 (26.9%) |
| 2-Person Households | 28 (17.9%) | 2 (1.3%) |
| 3-Person Households | 41 (26.3%) | 0 (0.0%) |
| 4-Person Households | 26 (16.7%) | 0 (0.0%) |
| 5-Person Households | 9 (5.8%) | 0 (0.0%) |
| 6-Person Households | 1 (0.6%) | 0 (0.0%) |
| 7+ Person Households | 7 (4.5%) | 0 (0.0%) |
| Total | 112 (71.8%) | 44 (28.2%) |
Female Fertility in Windsor Place
Fertility by Age in Windsor Place
Average fertility rate in Windsor Place is 28.0 births per 1,000 women. Women in the age bracket of 20 to 34 years have the highest fertility rate with 129.0 births per 1,000 women. Women in the age bracket of 20 to 34 years acount for 100.0% of all women with births.
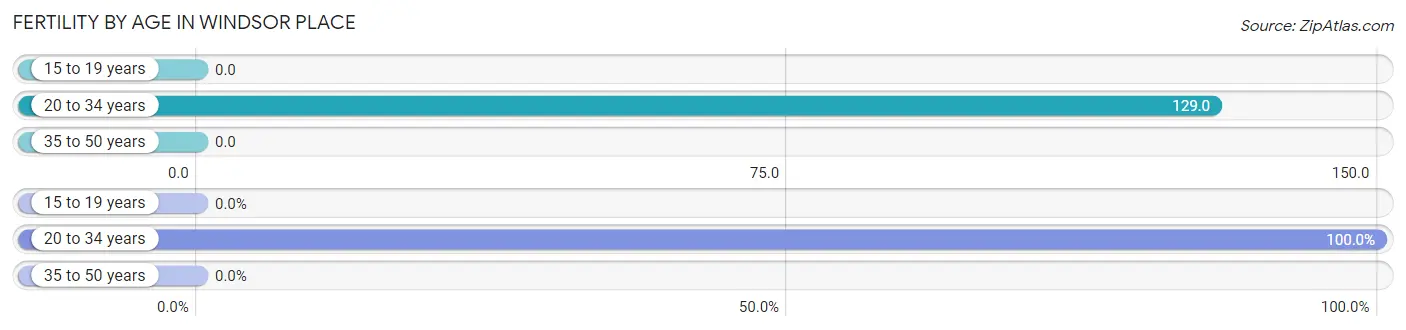
| Age Bracket | Women with Births | Births / 1,000 Women |
| 15 to 19 years | 0 (0.0%) | 0.0 |
| 20 to 34 years | 4 (100.0%) | 129.0 |
| 35 to 50 years | 0 (0.0%) | 0.0 |
| Total | 4 (100.0%) | 28.0 |
Fertility by Age by Marriage Status in Windsor Place
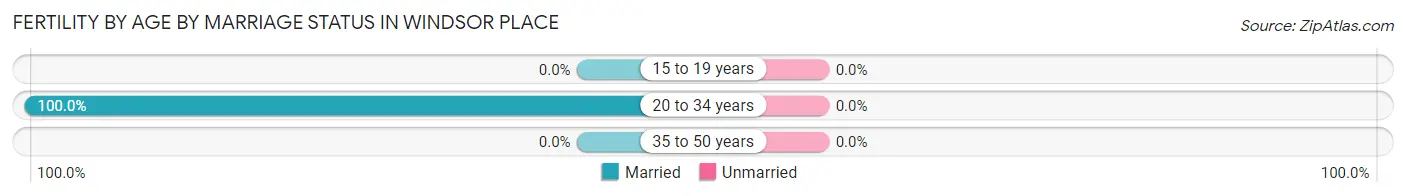
| Age Bracket | Married | Unmarried |
| 15 to 19 years | 0 (0.0%) | 0 (0.0%) |
| 20 to 34 years | 4 (100.0%) | 0 (0.0%) |
| 35 to 50 years | 0 (0.0%) | 0 (0.0%) |
| Total | 4 (100.0%) | 0 (0.0%) |
Fertility by Education in Windsor Place
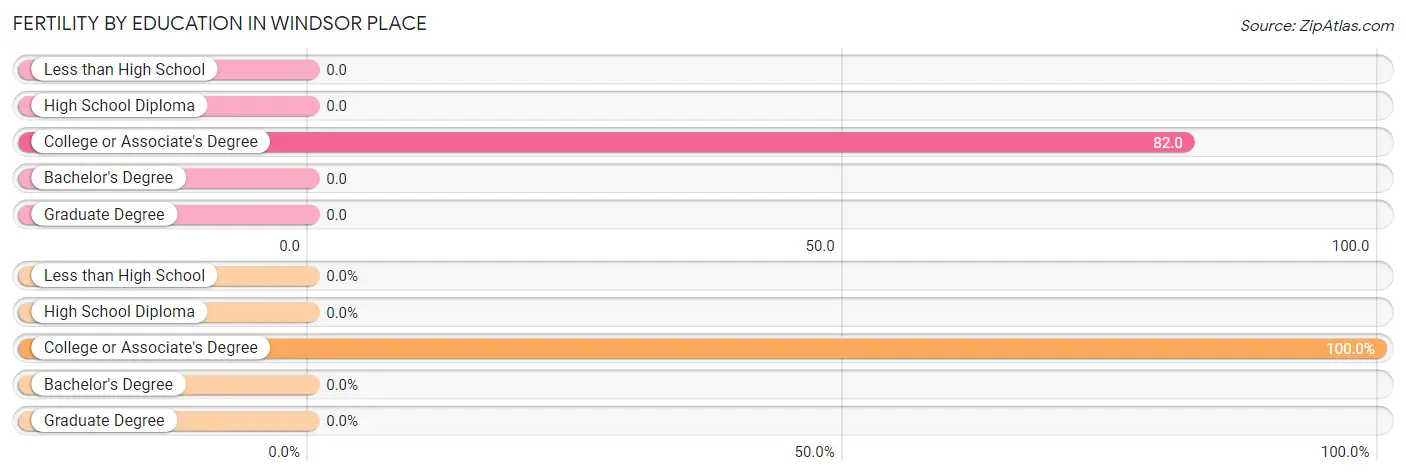
| Educational Attainment | Women with Births | Births / 1,000 Women |
| Less than High School | 0 (0.0%) | 0.0 |
| High School Diploma | 0 (0.0%) | 0.0 |
| College or Associate's Degree | 4 (100.0%) | 82.0 |
| Bachelor's Degree | 0 (0.0%) | 0.0 |
| Graduate Degree | 0 (0.0%) | 0.0 |
| Total | 4 (100.0%) | 28.0 |
Fertility by Education by Marriage Status in Windsor Place
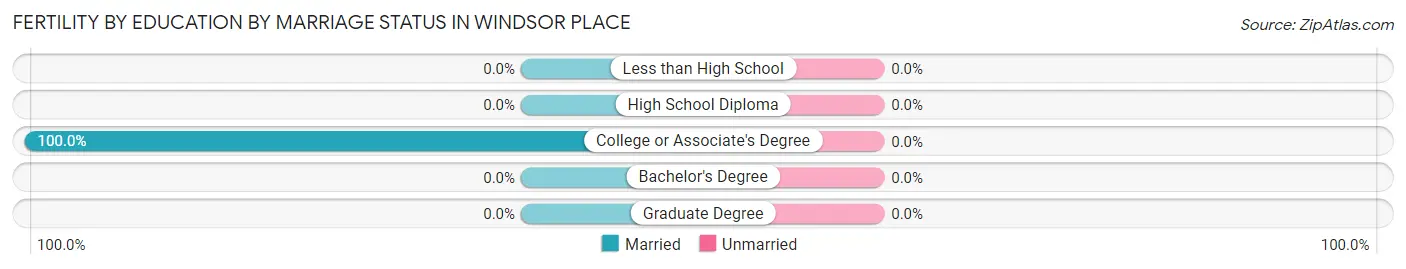
| Educational Attainment | Married | Unmarried |
| Less than High School | 0 (0.0%) | 0 (0.0%) |
| High School Diploma | 0 (0.0%) | 0 (0.0%) |
| College or Associate's Degree | 4 (100.0%) | 0 (0.0%) |
| Bachelor's Degree | 0 (0.0%) | 0 (0.0%) |
| Graduate Degree | 0 (0.0%) | 0 (0.0%) |
| Total | 4 (100.0%) | 0 (0.0%) |
Income in Windsor Place
Income Overview in Windsor Place
Per Capita Income in Windsor Place is $31,260, while median incomes of families and households are $110,114 and $91,667 respectively.
| Characteristic | Number | Measure |
| Per Capita Income | 448 | $31,260 |
| Median Family Income | 112 | $110,114 |
| Mean Family Income | 112 | $103,297 |
| Median Household Income | 156 | $91,667 |
| Mean Household Income | 156 | $89,062 |
| Income Deficit | 112 | $0 |
| Wage / Income Gap (%) | 448 | 25.35% |
| Wage / Income Gap ($) | 448 | 74.65¢ per $1 |
| Gini / Inequality Index | 448 | 0.31 |
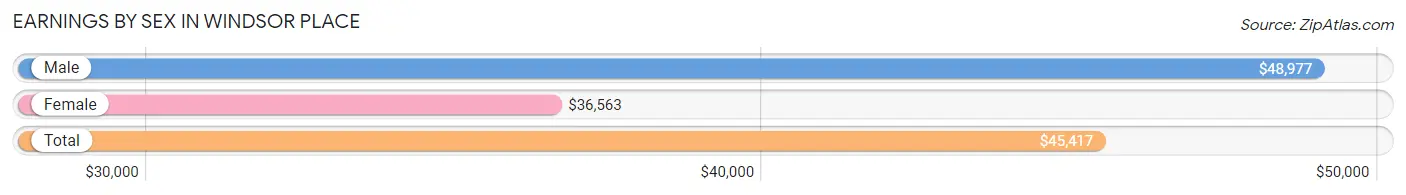
Earnings by Sex in Windsor Place
Average Earnings in Windsor Place are $45,417, $48,977 for men and $36,563 for women, a difference of 25.4%.
| Sex | Number | Average Earnings |
| Male | 117 (44.8%) | $48,977 |
| Female | 144 (55.2%) | $36,563 |
| Total | 261 (100.0%) | $45,417 |
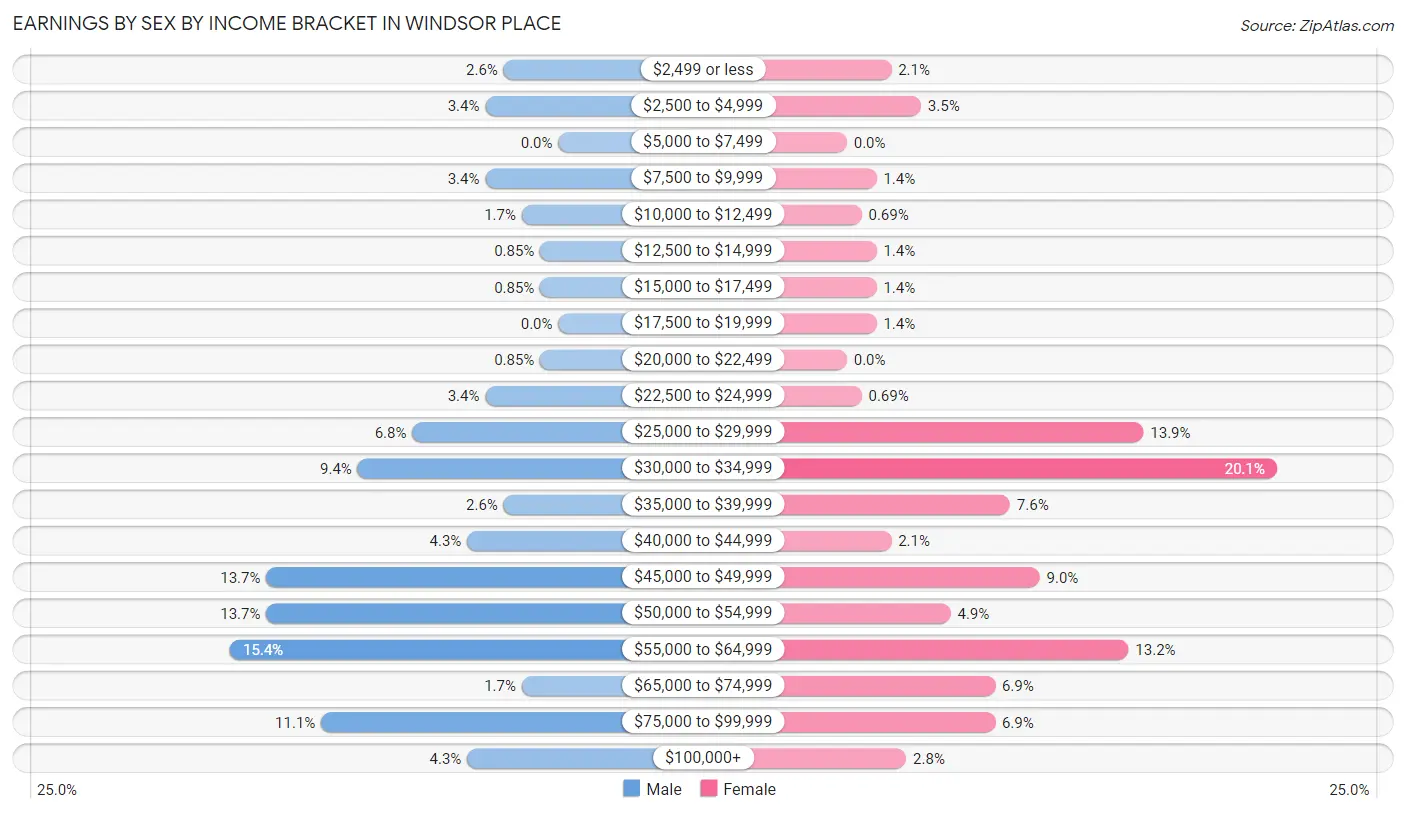
Earnings by Sex by Income Bracket in Windsor Place
The most common earnings brackets in Windsor Place are $55,000 to $64,999 for men (18 | 15.4%) and $30,000 to $34,999 for women (29 | 20.1%).
| Income | Male | Female |
| $2,499 or less | 3 (2.6%) | 3 (2.1%) |
| $2,500 to $4,999 | 4 (3.4%) | 5 (3.5%) |
| $5,000 to $7,499 | 0 (0.0%) | 0 (0.0%) |
| $7,500 to $9,999 | 4 (3.4%) | 2 (1.4%) |
| $10,000 to $12,499 | 2 (1.7%) | 1 (0.7%) |
| $12,500 to $14,999 | 1 (0.9%) | 2 (1.4%) |
| $15,000 to $17,499 | 1 (0.9%) | 2 (1.4%) |
| $17,500 to $19,999 | 0 (0.0%) | 2 (1.4%) |
| $20,000 to $22,499 | 1 (0.9%) | 0 (0.0%) |
| $22,500 to $24,999 | 4 (3.4%) | 1 (0.7%) |
| $25,000 to $29,999 | 8 (6.8%) | 20 (13.9%) |
| $30,000 to $34,999 | 11 (9.4%) | 29 (20.1%) |
| $35,000 to $39,999 | 3 (2.6%) | 11 (7.6%) |
| $40,000 to $44,999 | 5 (4.3%) | 3 (2.1%) |
| $45,000 to $49,999 | 16 (13.7%) | 13 (9.0%) |
| $50,000 to $54,999 | 16 (13.7%) | 7 (4.9%) |
| $55,000 to $64,999 | 18 (15.4%) | 19 (13.2%) |
| $65,000 to $74,999 | 2 (1.7%) | 10 (6.9%) |
| $75,000 to $99,999 | 13 (11.1%) | 10 (6.9%) |
| $100,000+ | 5 (4.3%) | 4 (2.8%) |
| Total | 117 (100.0%) | 144 (100.0%) |
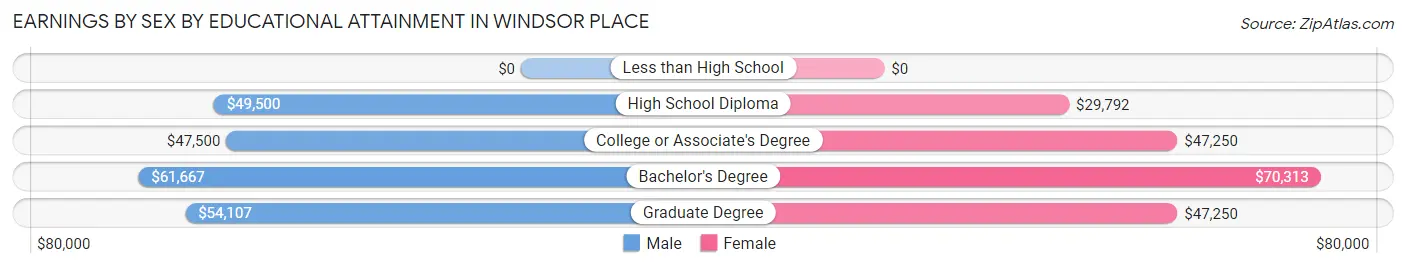
Earnings by Sex by Educational Attainment in Windsor Place
Average earnings in Windsor Place are $52,917 for men and $40,625 for women, a difference of 23.2%. Men with an educational attainment of bachelor's degree enjoy the highest average annual earnings of $61,667, while those with college or associate's degree education earn the least with $47,500. Women with an educational attainment of bachelor's degree earn the most with the average annual earnings of $70,313, while those with high school diploma education have the smallest earnings of $29,792.
| Educational Attainment | Male Income | Female Income |
| Less than High School | - | - |
| High School Diploma | $49,500 | $29,792 |
| College or Associate's Degree | $47,500 | $47,250 |
| Bachelor's Degree | $61,667 | $70,313 |
| Graduate Degree | $54,107 | $47,250 |
| Total | $52,917 | $40,625 |
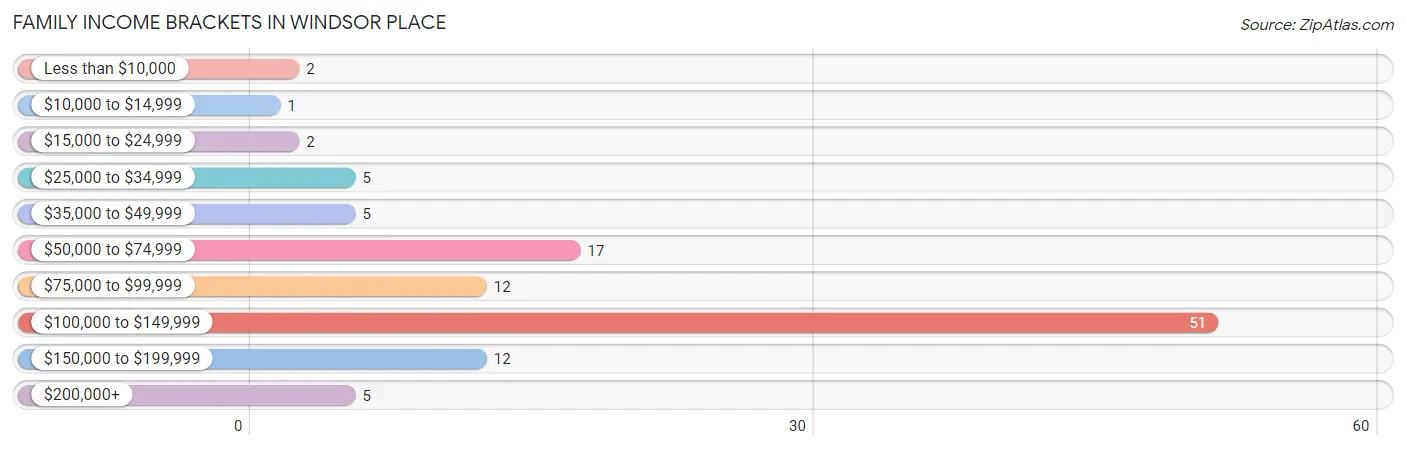
Family Income in Windsor Place
Family Income Brackets in Windsor Place
According to the Windsor Place family income data, there are 51 families falling into the $100,000 to $149,999 income range, which is the most common income bracket and makes up 45.5% of all families. Conversely, the $10,000 to $14,999 income bracket is the least frequent group with only 1 families (0.9%) belonging to this category.
| Income Bracket | # Families | % Families |
| Less than $10,000 | 2 | 1.8% |
| $10,000 to $14,999 | 1 | 0.9% |
| $15,000 to $24,999 | 2 | 1.8% |
| $25,000 to $34,999 | 5 | 4.5% |
| $35,000 to $49,999 | 5 | 4.5% |
| $50,000 to $74,999 | 17 | 15.2% |
| $75,000 to $99,999 | 12 | 10.7% |
| $100,000 to $149,999 | 51 | 45.5% |
| $150,000 to $199,999 | 12 | 10.7% |
| $200,000+ | 5 | 4.5% |
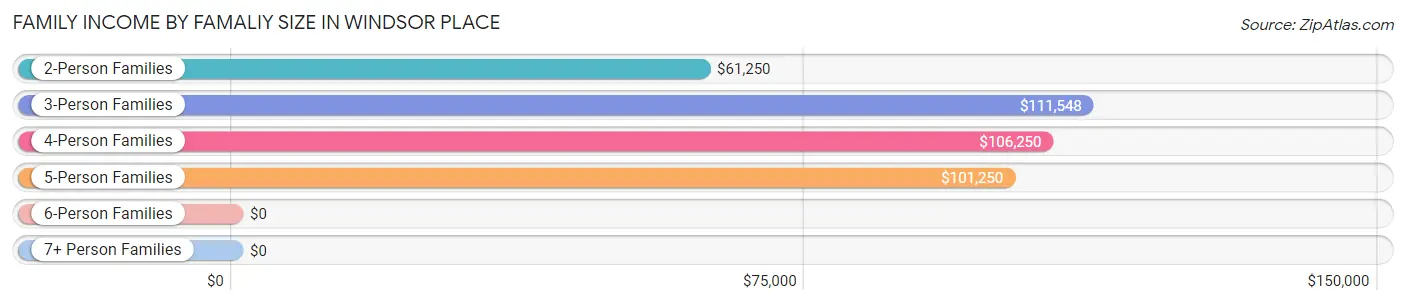
Family Income by Famaliy Size in Windsor Place
3-person families (34 | 30.4%) account for the highest median family income in Windsor Place with $111,548 per family, while 3-person families (34 | 30.4%) have the highest median income of $37,183 per family member.
| Income Bracket | # Families | Median Income |
| 2-Person Families | 37 (33.0%) | $61,250 |
| 3-Person Families | 34 (30.4%) | $111,548 |
| 4-Person Families | 26 (23.2%) | $106,250 |
| 5-Person Families | 7 (6.2%) | $101,250 |
| 6-Person Families | 1 (0.9%) | $0 |
| 7+ Person Families | 7 (6.2%) | $0 |
| Total | 112 (100.0%) | $110,114 |
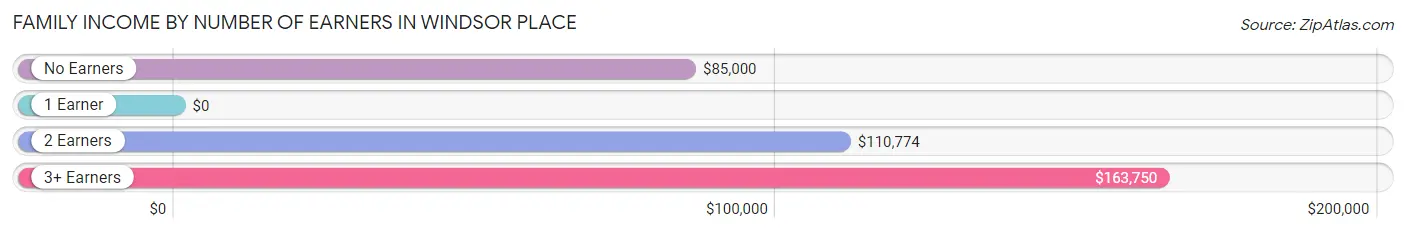
Family Income by Number of Earners in Windsor Place
| Number of Earners | # Families | Median Income |
| No Earners | 6 (5.4%) | $85,000 |
| 1 Earner | 21 (18.8%) | $0 |
| 2 Earners | 69 (61.6%) | $110,774 |
| 3+ Earners | 16 (14.3%) | $163,750 |
| Total | 112 (100.0%) | $110,114 |
Household Income in Windsor Place
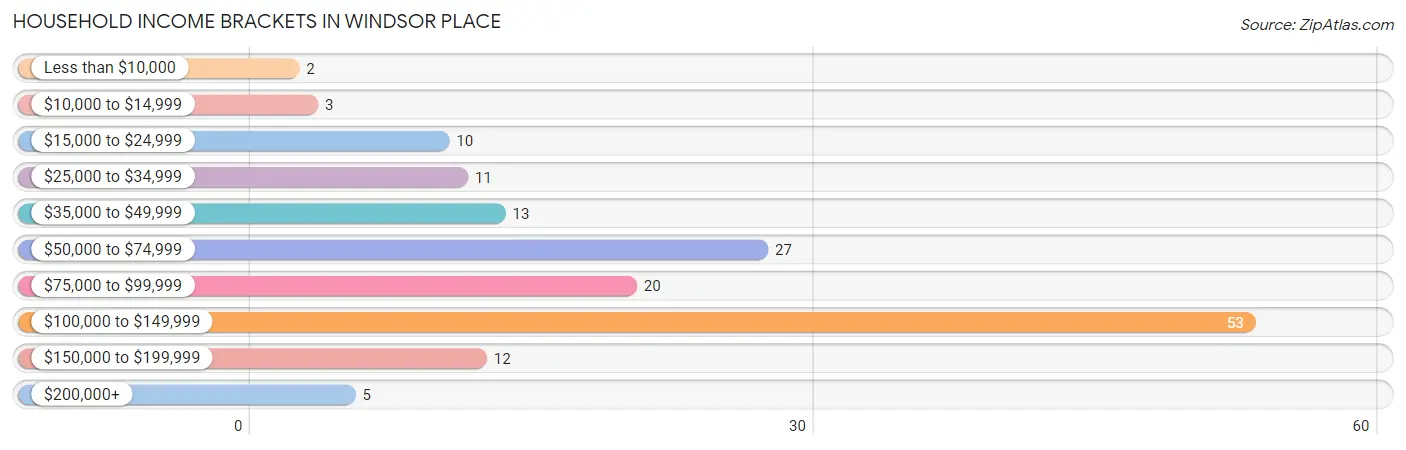
Household Income Brackets in Windsor Place
With 53 households falling in the category, the $100,000 to $149,999 income range is the most frequent in Windsor Place, accounting for 34.0% of all households. In contrast, only 2 households (1.3%) fall into the less than $10,000 income bracket, making it the least populous group.
| Income Bracket | # Households | % Households |
| Less than $10,000 | 2 | 1.3% |
| $10,000 to $14,999 | 3 | 1.9% |
| $15,000 to $24,999 | 10 | 6.4% |
| $25,000 to $34,999 | 11 | 7.1% |
| $35,000 to $49,999 | 13 | 8.3% |
| $50,000 to $74,999 | 27 | 17.3% |
| $75,000 to $99,999 | 20 | 12.8% |
| $100,000 to $149,999 | 53 | 34.0% |
| $150,000 to $199,999 | 12 | 7.7% |
| $200,000+ | 5 | 3.2% |
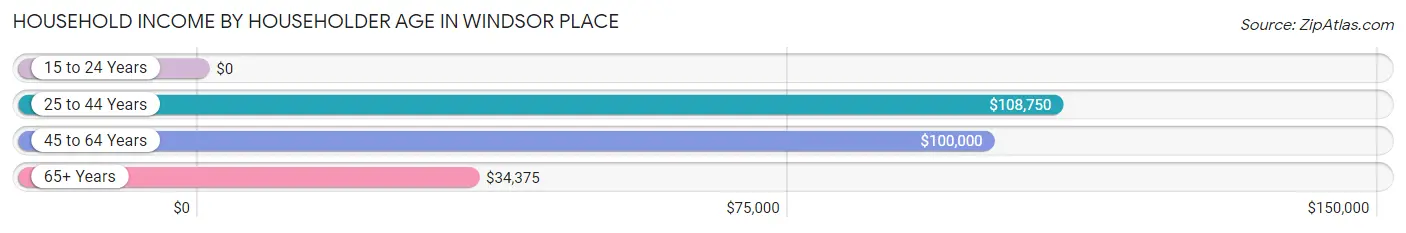
Household Income by Householder Age in Windsor Place
The median household income in Windsor Place is $91,667, with the highest median household income of $108,750 found in the 25 to 44 years age bracket for the primary householder. A total of 69 households (44.2%) fall into this category. Meanwhile, the 15 to 24 years age bracket for the primary householder has the lowest median household income of $0, with 2 households (1.3%) in this group.
| Income Bracket | # Households | Median Income |
| 15 to 24 Years | 2 (1.3%) | $0 |
| 25 to 44 Years | 69 (44.2%) | $108,750 |
| 45 to 64 Years | 48 (30.8%) | $100,000 |
| 65+ Years | 37 (23.7%) | $34,375 |
| Total | 156 (100.0%) | $91,667 |
Poverty in Windsor Place
Income Below Poverty by Sex and Age in Windsor Place
With 3.7% poverty level for males and 5.8% for females among the residents of Windsor Place, 18 to 24 year old males and 5 year old females are the most vulnerable to poverty, with 3 males (18.8%) and 2 females (100.0%) in their respective age groups living below the poverty level.
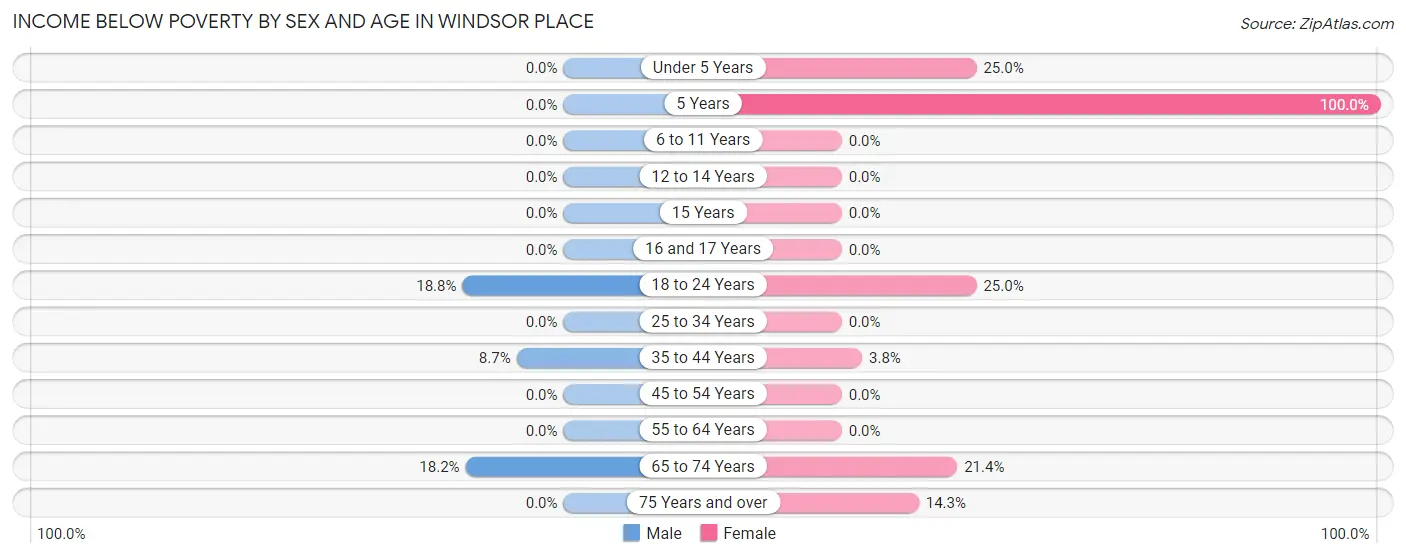
| Age Bracket | Male | Female |
| Under 5 Years | 0 (0.0%) | 4 (25.0%) |
| 5 Years | 0 (0.0%) | 2 (100.0%) |
| 6 to 11 Years | 0 (0.0%) | 0 (0.0%) |
| 12 to 14 Years | 0 (0.0%) | 0 (0.0%) |
| 15 Years | 0 (0.0%) | 0 (0.0%) |
| 16 and 17 Years | 0 (0.0%) | 0 (0.0%) |
| 18 to 24 Years | 3 (18.8%) | 2 (25.0%) |
| 25 to 34 Years | 0 (0.0%) | 0 (0.0%) |
| 35 to 44 Years | 2 (8.7%) | 2 (3.8%) |
| 45 to 54 Years | 0 (0.0%) | 0 (0.0%) |
| 55 to 64 Years | 0 (0.0%) | 0 (0.0%) |
| 65 to 74 Years | 2 (18.2%) | 3 (21.4%) |
| 75 Years and over | 0 (0.0%) | 2 (14.3%) |
| Total | 7 (3.7%) | 15 (5.8%) |
Income Above Poverty by Sex and Age in Windsor Place
According to the poverty statistics in Windsor Place, males aged under 5 years and females aged 6 to 11 years are the age groups that are most secure financially, with 100.0% of males and 100.0% of females in these age groups living above the poverty line.
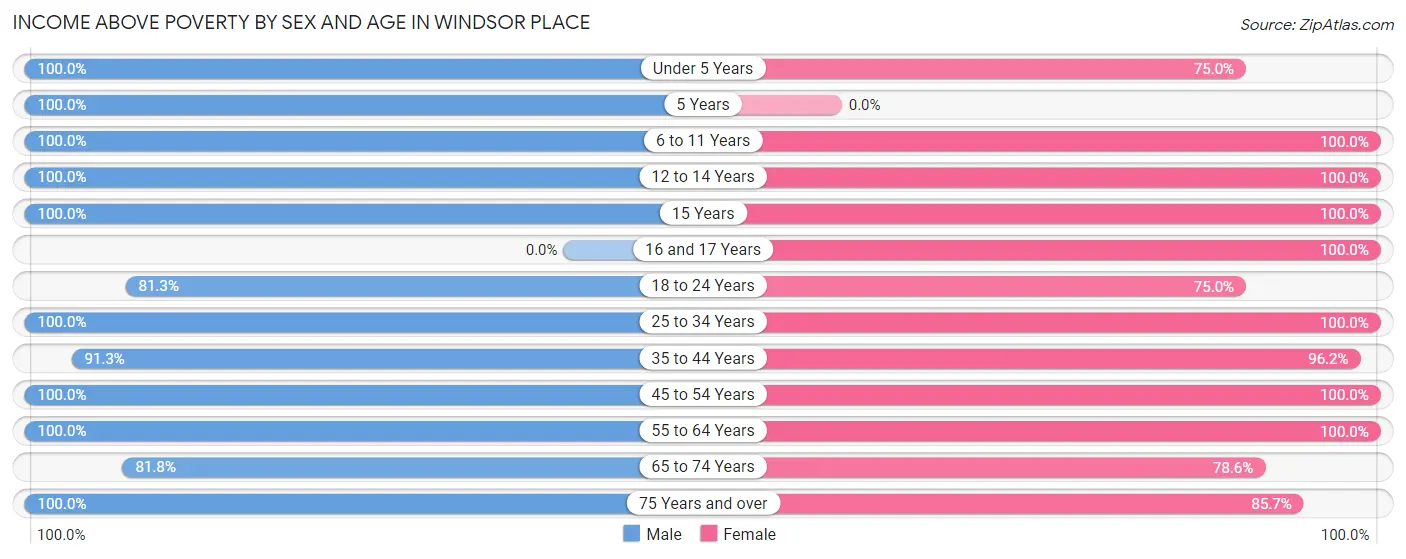
| Age Bracket | Male | Female |
| Under 5 Years | 5 (100.0%) | 12 (75.0%) |
| 5 Years | 4 (100.0%) | 0 (0.0%) |
| 6 to 11 Years | 29 (100.0%) | 15 (100.0%) |
| 12 to 14 Years | 13 (100.0%) | 17 (100.0%) |
| 15 Years | 3 (100.0%) | 5 (100.0%) |
| 16 and 17 Years | 0 (0.0%) | 34 (100.0%) |
| 18 to 24 Years | 13 (81.2%) | 6 (75.0%) |
| 25 to 34 Years | 36 (100.0%) | 25 (100.0%) |
| 35 to 44 Years | 21 (91.3%) | 51 (96.2%) |
| 45 to 54 Years | 19 (100.0%) | 24 (100.0%) |
| 55 to 64 Years | 21 (100.0%) | 33 (100.0%) |
| 65 to 74 Years | 9 (81.8%) | 11 (78.6%) |
| 75 Years and over | 8 (100.0%) | 12 (85.7%) |
| Total | 181 (96.3%) | 245 (94.2%) |
Income Below Poverty Among Married-Couple Families in Windsor Place
The poverty statistics for married-couple families in Windsor Place show that 3.2% or 3 of the total 94 families live below the poverty line. Families with no children have the highest poverty rate of 3.7%, comprising of 1 families. On the other hand, families with 3 or 4 children have the lowest poverty rate of 0.0%, which includes 0 families.
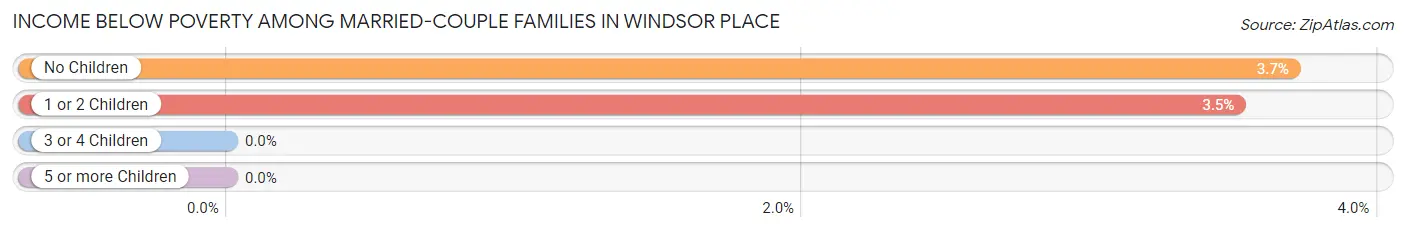
| Children | Above Poverty | Below Poverty |
| No Children | 26 (96.3%) | 1 (3.7%) |
| 1 or 2 Children | 55 (96.5%) | 2 (3.5%) |
| 3 or 4 Children | 6 (100.0%) | 0 (0.0%) |
| 5 or more Children | 4 (100.0%) | 0 (0.0%) |
| Total | 91 (96.8%) | 3 (3.2%) |
Income Below Poverty Among Single-Parent Households in Windsor Place
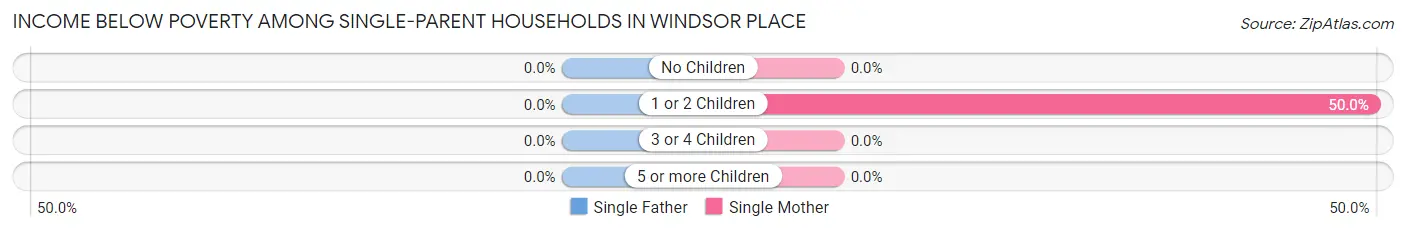
| Children | Single Father | Single Mother |
| No Children | 0 (0.0%) | 0 (0.0%) |
| 1 or 2 Children | 0 (0.0%) | 2 (50.0%) |
| 3 or 4 Children | 0 (0.0%) | 0 (0.0%) |
| 5 or more Children | 0 (0.0%) | 0 (0.0%) |
| Total | 0 (0.0%) | 2 (15.4%) |
Income Below Poverty Among Married-Couple vs Single-Parent Households in Windsor Place
The poverty data for Windsor Place shows that 3 of the married-couple family households (3.2%) and 2 of the single-parent households (11.1%) are living below the poverty level. Within the married-couple family households, those with no children have the highest poverty rate, with 1 households (3.7%) falling below the poverty line. Among the single-parent households, those with 1 or 2 children have the highest poverty rate, with 2 household (50.0%) living below poverty.
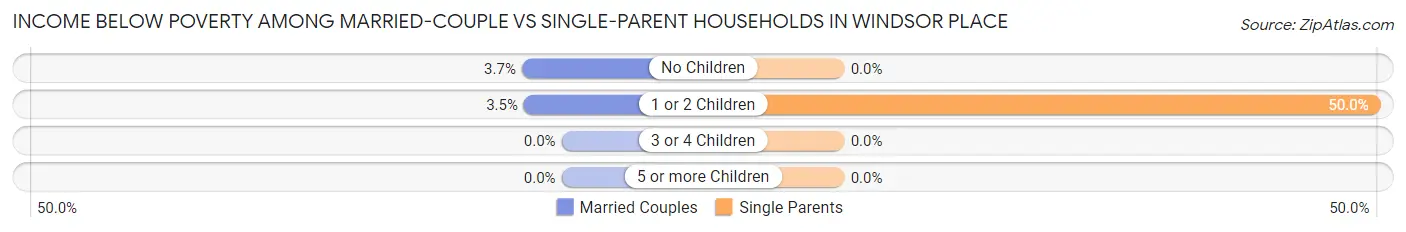
| Children | Married-Couple Families | Single-Parent Households |
| No Children | 1 (3.7%) | 0 (0.0%) |
| 1 or 2 Children | 2 (3.5%) | 2 (50.0%) |
| 3 or 4 Children | 0 (0.0%) | 0 (0.0%) |
| 5 or more Children | 0 (0.0%) | 0 (0.0%) |
| Total | 3 (3.2%) | 2 (11.1%) |
Employment Characteristics in Windsor Place
Employment by Class of Employer in Windsor Place
Among the 248 employed individuals in Windsor Place, private company employees (178 | 71.8%), local government employees (24 | 9.7%), and not-for-profit organizations (16 | 6.5%) make up the most common classes of employment.
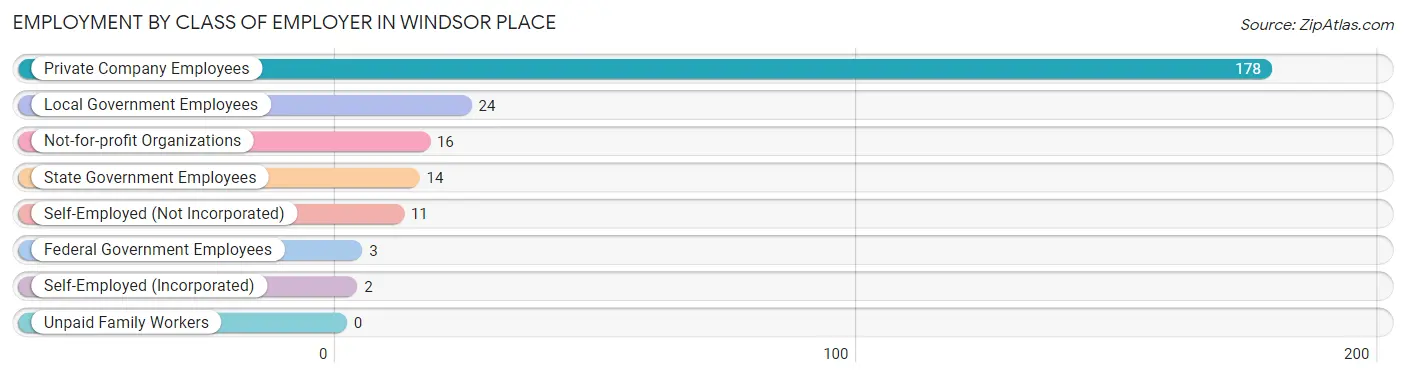
| Employer Class | # Employees | % Employees |
| Private Company Employees | 178 | 71.8% |
| Self-Employed (Incorporated) | 2 | 0.8% |
| Self-Employed (Not Incorporated) | 11 | 4.4% |
| Not-for-profit Organizations | 16 | 6.5% |
| Local Government Employees | 24 | 9.7% |
| State Government Employees | 14 | 5.7% |
| Federal Government Employees | 3 | 1.2% |
| Unpaid Family Workers | 0 | 0.0% |
| Total | 248 | 100.0% |
Employment Status by Age in Windsor Place
According to the labor force statistics for Windsor Place, out of the total population over 16 years of age (339), 75.2% or 255 individuals are in the labor force, with 1.2% or 3 of them unemployed. The age group with the highest labor force participation rate is 25 to 29 years, with 100.0% or 45 individuals in the labor force. Within the labor force, the 65 to 74 years age range has the highest percentage of unemployed individuals, with 12.5% or 1 of them being unemployed.
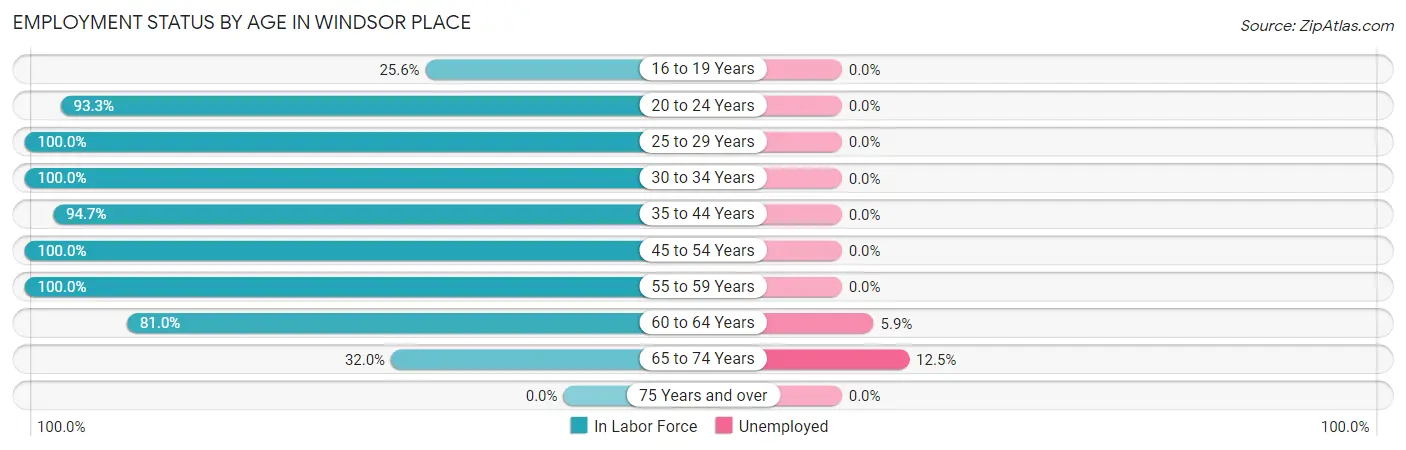
| Age Bracket | In Labor Force | Unemployed |
| 16 to 19 Years | 11 (25.6%) | 0 (0.0%) |
| 20 to 24 Years | 14 (93.3%) | 0 (0.0%) |
| 25 to 29 Years | 45 (100.0%) | 0 (0.0%) |
| 30 to 34 Years | 16 (100.0%) | 0 (0.0%) |
| 35 to 44 Years | 72 (94.7%) | 0 (0.0%) |
| 45 to 54 Years | 43 (100.0%) | 0 (0.0%) |
| 55 to 59 Years | 12 (100.0%) | 0 (0.0%) |
| 60 to 64 Years | 34 (81.0%) | 2 (5.9%) |
| 65 to 74 Years | 8 (32.0%) | 1 (12.5%) |
| 75 Years and over | 0 (0.0%) | 0 (0.0%) |
| Total | 255 (75.2%) | 3 (1.2%) |
Employment Status by Educational Attainment in Windsor Place
According to labor force statistics for Windsor Place, 94.9% of individuals (222) out of the total population between 25 and 64 years of age (234) are in the labor force, with 0.9% or 2 of them being unemployed. The group with the highest labor force participation rate are those with the educational attainment of college / associate degree, with 98.9% or 86 individuals in the labor force. Within the labor force, individuals with high school diploma education have the highest percentage of unemployment, with 2.8% or 2 of them being unemployed.
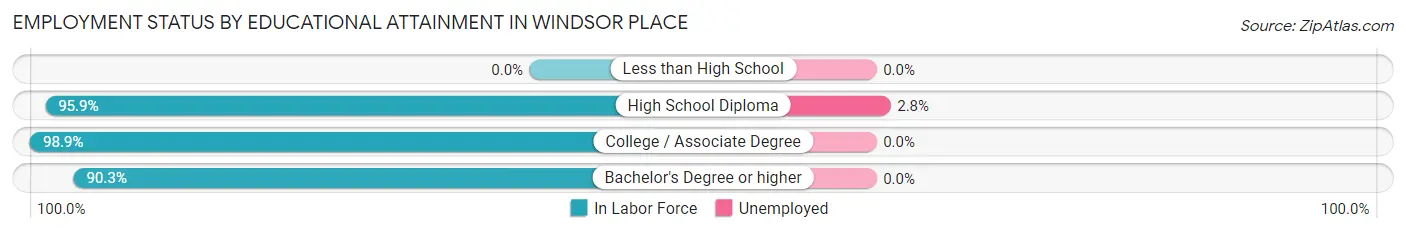
| Educational Attainment | In Labor Force | Unemployed |
| Less than High School | 0 (0.0%) | 0 (0.0%) |
| High School Diploma | 71 (95.9%) | 2 (2.8%) |
| College / Associate Degree | 86 (98.9%) | 0 (0.0%) |
| Bachelor's Degree or higher | 65 (90.3%) | 0 (0.0%) |
| Total | 222 (94.9%) | 2 (0.9%) |
Employment Occupations by Sex in Windsor Place
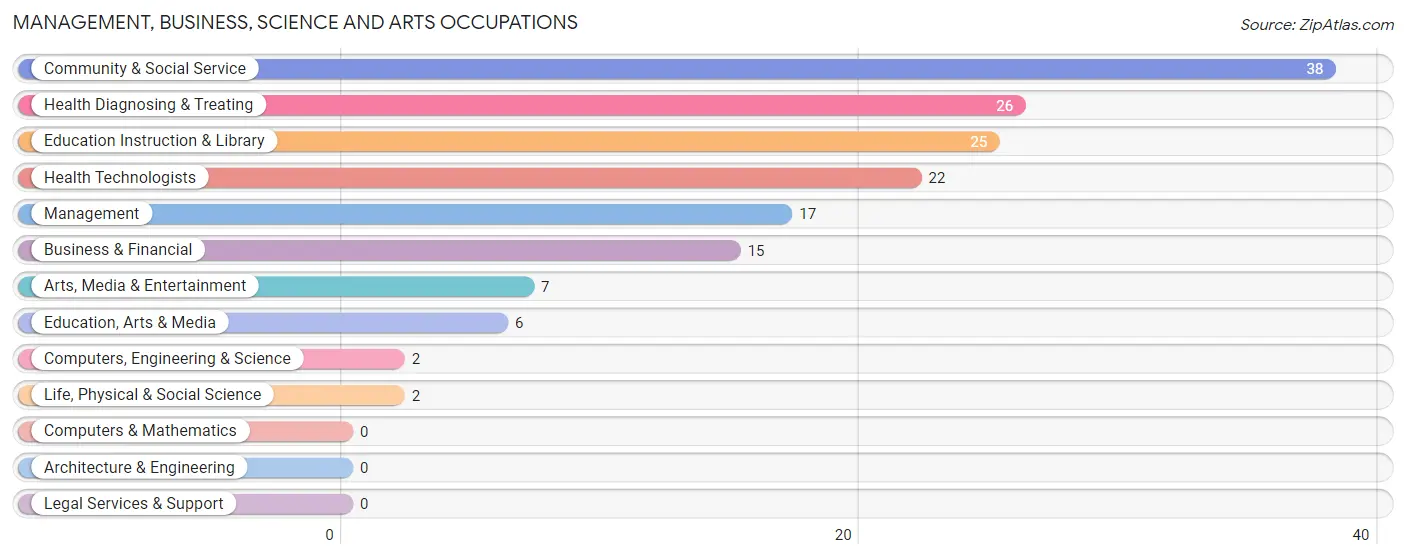
Management, Business, Science and Arts Occupations
The most common Management, Business, Science and Arts occupations in Windsor Place are Community & Social Service (38 | 15.1%), Health Diagnosing & Treating (26 | 10.3%), Education Instruction & Library (25 | 9.9%), Health Technologists (22 | 8.7%), and Management (17 | 6.8%).
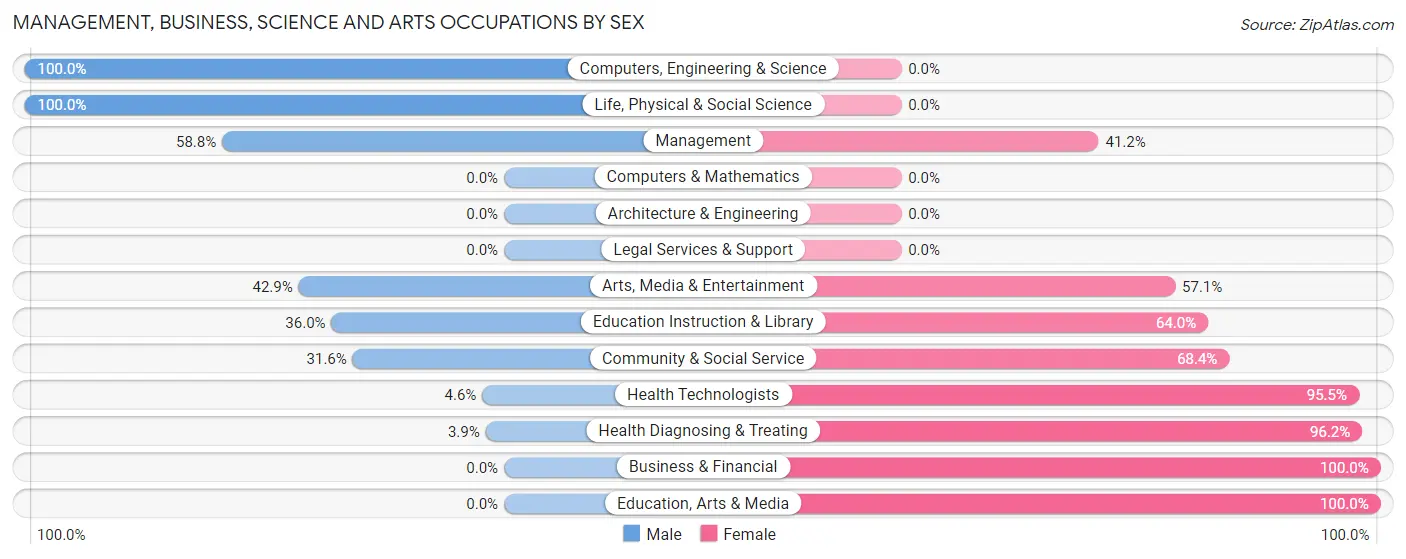
Management, Business, Science and Arts Occupations by Sex
Within the Management, Business, Science and Arts occupations in Windsor Place, the most male-oriented occupations are Computers, Engineering & Science (100.0%), Life, Physical & Social Science (100.0%), and Management (58.8%), while the most female-oriented occupations are Business & Financial (100.0%), Education, Arts & Media (100.0%), and Health Diagnosing & Treating (96.2%).
| Occupation | Male | Female |
| Management | 10 (58.8%) | 7 (41.2%) |
| Business & Financial | 0 (0.0%) | 15 (100.0%) |
| Computers, Engineering & Science | 2 (100.0%) | 0 (0.0%) |
| Computers & Mathematics | 0 (0.0%) | 0 (0.0%) |
| Architecture & Engineering | 0 (0.0%) | 0 (0.0%) |
| Life, Physical & Social Science | 2 (100.0%) | 0 (0.0%) |
| Community & Social Service | 12 (31.6%) | 26 (68.4%) |
| Education, Arts & Media | 0 (0.0%) | 6 (100.0%) |
| Legal Services & Support | 0 (0.0%) | 0 (0.0%) |
| Education Instruction & Library | 9 (36.0%) | 16 (64.0%) |
| Arts, Media & Entertainment | 3 (42.9%) | 4 (57.1%) |
| Health Diagnosing & Treating | 1 (3.8%) | 25 (96.2%) |
| Health Technologists | 1 (4.5%) | 21 (95.5%) |
| Total (Category) | 25 (25.5%) | 73 (74.5%) |
| Total (Overall) | 110 (43.6%) | 142 (56.4%) |
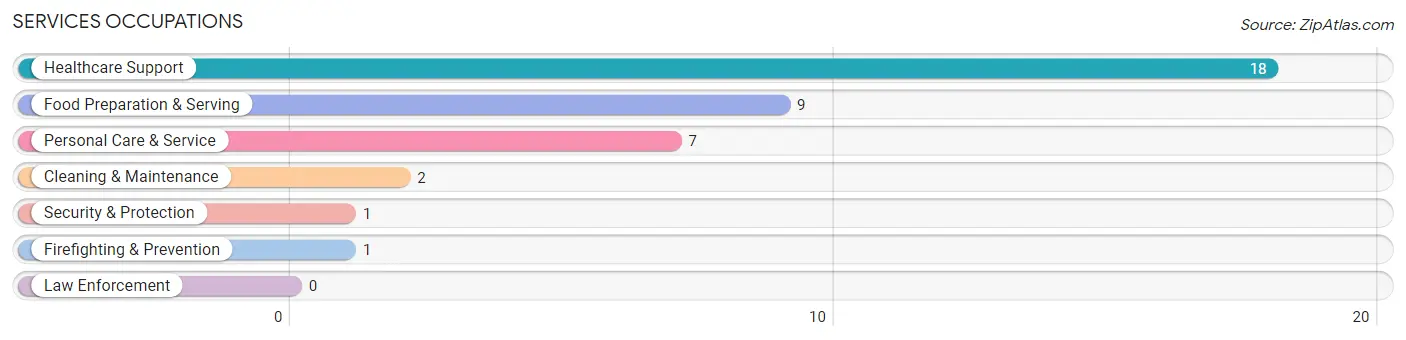
Services Occupations
The most common Services occupations in Windsor Place are Healthcare Support (18 | 7.1%), Food Preparation & Serving (9 | 3.6%), Personal Care & Service (7 | 2.8%), Cleaning & Maintenance (2 | 0.8%), and Security & Protection (1 | 0.4%).
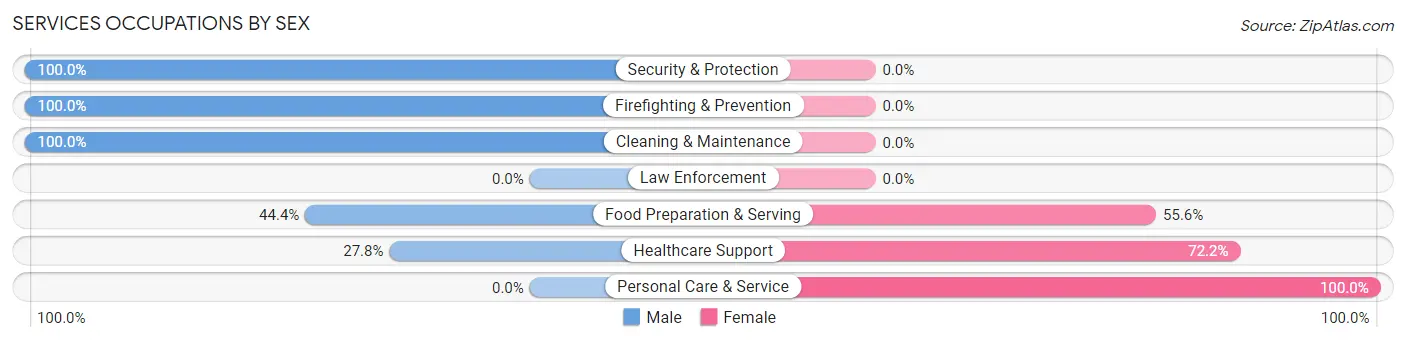
Services Occupations by Sex
Within the Services occupations in Windsor Place, the most male-oriented occupations are Security & Protection (100.0%), Firefighting & Prevention (100.0%), and Cleaning & Maintenance (100.0%), while the most female-oriented occupations are Personal Care & Service (100.0%), Healthcare Support (72.2%), and Food Preparation & Serving (55.6%).
| Occupation | Male | Female |
| Healthcare Support | 5 (27.8%) | 13 (72.2%) |
| Security & Protection | 1 (100.0%) | 0 (0.0%) |
| Firefighting & Prevention | 1 (100.0%) | 0 (0.0%) |
| Law Enforcement | 0 (0.0%) | 0 (0.0%) |
| Food Preparation & Serving | 4 (44.4%) | 5 (55.6%) |
| Cleaning & Maintenance | 2 (100.0%) | 0 (0.0%) |
| Personal Care & Service | 0 (0.0%) | 7 (100.0%) |
| Total (Category) | 12 (32.4%) | 25 (67.6%) |
| Total (Overall) | 110 (43.6%) | 142 (56.4%) |
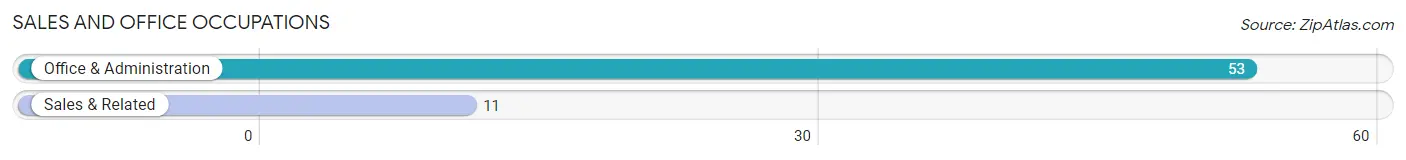
Sales and Office Occupations
The most common Sales and Office occupations in Windsor Place are Office & Administration (53 | 21.0%), and Sales & Related (11 | 4.4%).
Sales and Office Occupations by Sex
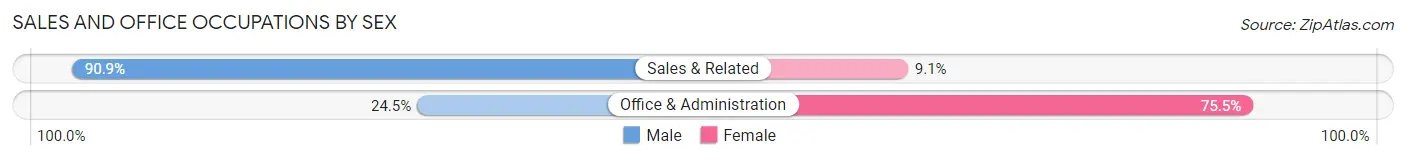
| Occupation | Male | Female |
| Sales & Related | 10 (90.9%) | 1 (9.1%) |
| Office & Administration | 13 (24.5%) | 40 (75.5%) |
| Total (Category) | 23 (35.9%) | 41 (64.1%) |
| Total (Overall) | 110 (43.6%) | 142 (56.4%) |
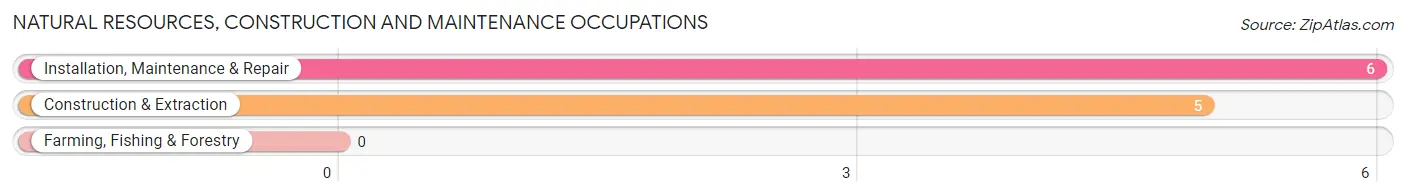
Natural Resources, Construction and Maintenance Occupations
The most common Natural Resources, Construction and Maintenance occupations in Windsor Place are Installation, Maintenance & Repair (6 | 2.4%), and Construction & Extraction (5 | 2.0%).
Natural Resources, Construction and Maintenance Occupations by Sex
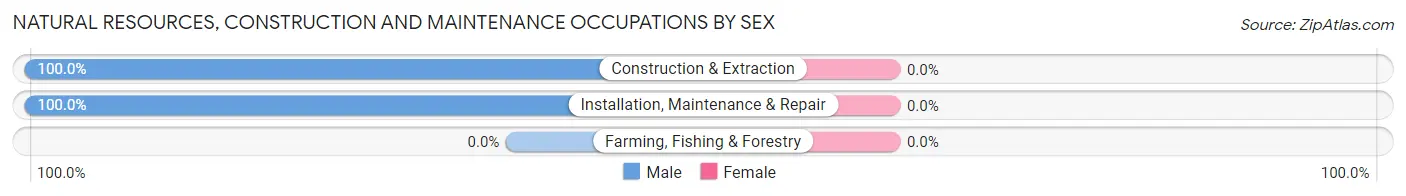
| Occupation | Male | Female |
| Farming, Fishing & Forestry | 0 (0.0%) | 0 (0.0%) |
| Construction & Extraction | 5 (100.0%) | 0 (0.0%) |
| Installation, Maintenance & Repair | 6 (100.0%) | 0 (0.0%) |
| Total (Category) | 11 (100.0%) | 0 (0.0%) |
| Total (Overall) | 110 (43.6%) | 142 (56.4%) |
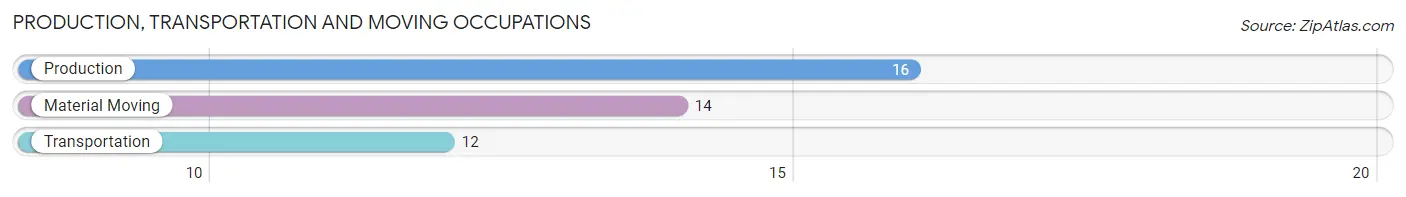
Production, Transportation and Moving Occupations
The most common Production, Transportation and Moving occupations in Windsor Place are Production (16 | 6.4%), Material Moving (14 | 5.6%), and Transportation (12 | 4.8%).
Production, Transportation and Moving Occupations by Sex
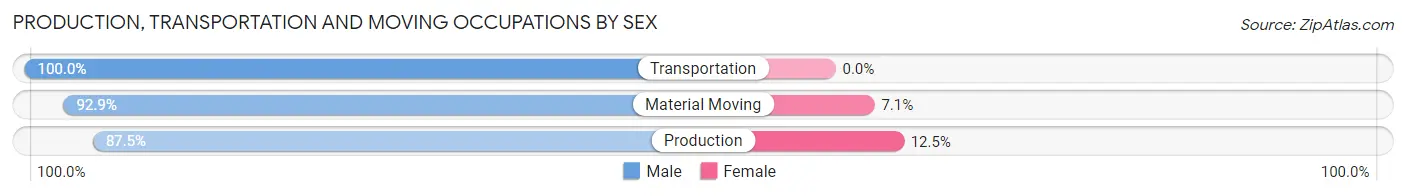
| Occupation | Male | Female |
| Production | 14 (87.5%) | 2 (12.5%) |
| Transportation | 12 (100.0%) | 0 (0.0%) |
| Material Moving | 13 (92.9%) | 1 (7.1%) |
| Total (Category) | 39 (92.9%) | 3 (7.1%) |
| Total (Overall) | 110 (43.6%) | 142 (56.4%) |
Employment Industries by Sex in Windsor Place
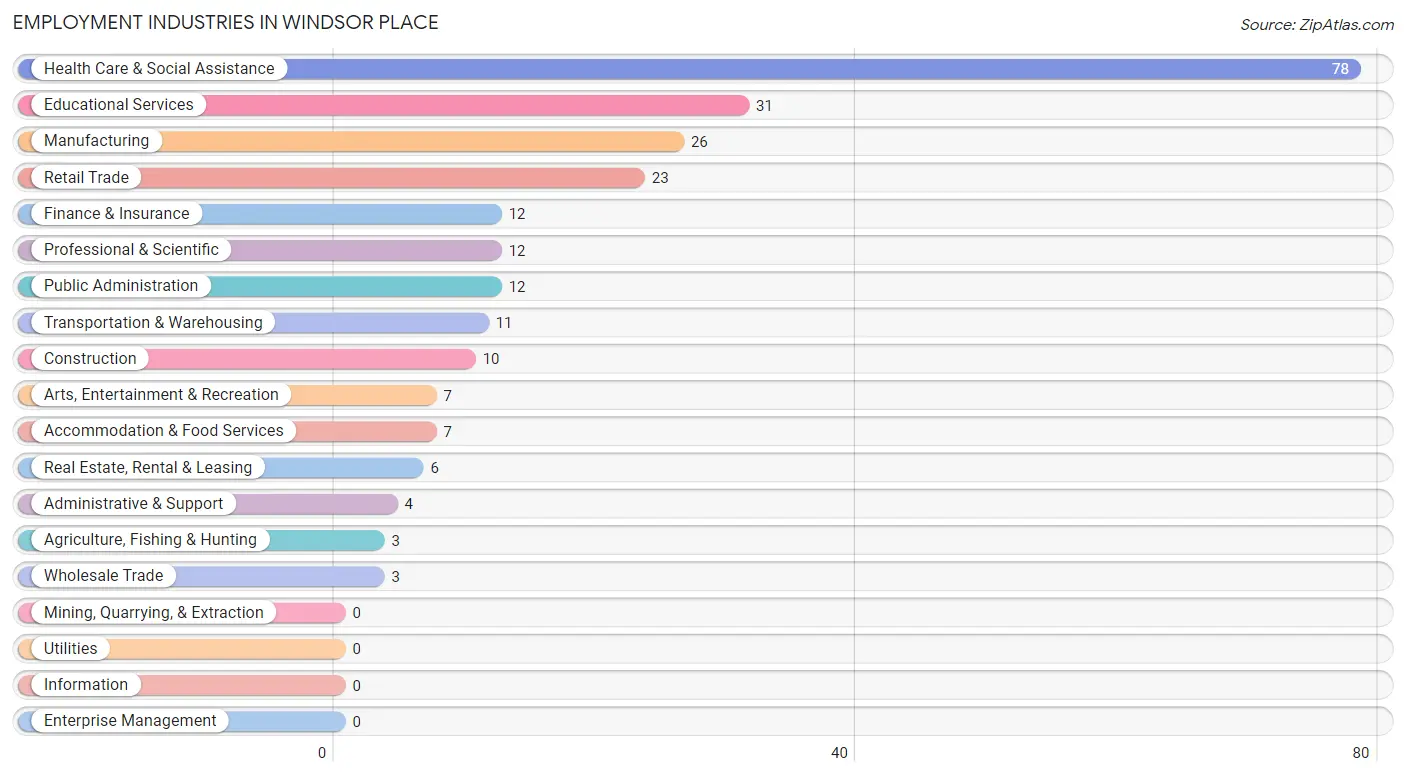
Employment Industries in Windsor Place
The major employment industries in Windsor Place include Health Care & Social Assistance (78 | 30.9%), Educational Services (31 | 12.3%), Manufacturing (26 | 10.3%), Retail Trade (23 | 9.1%), and Finance & Insurance (12 | 4.8%).
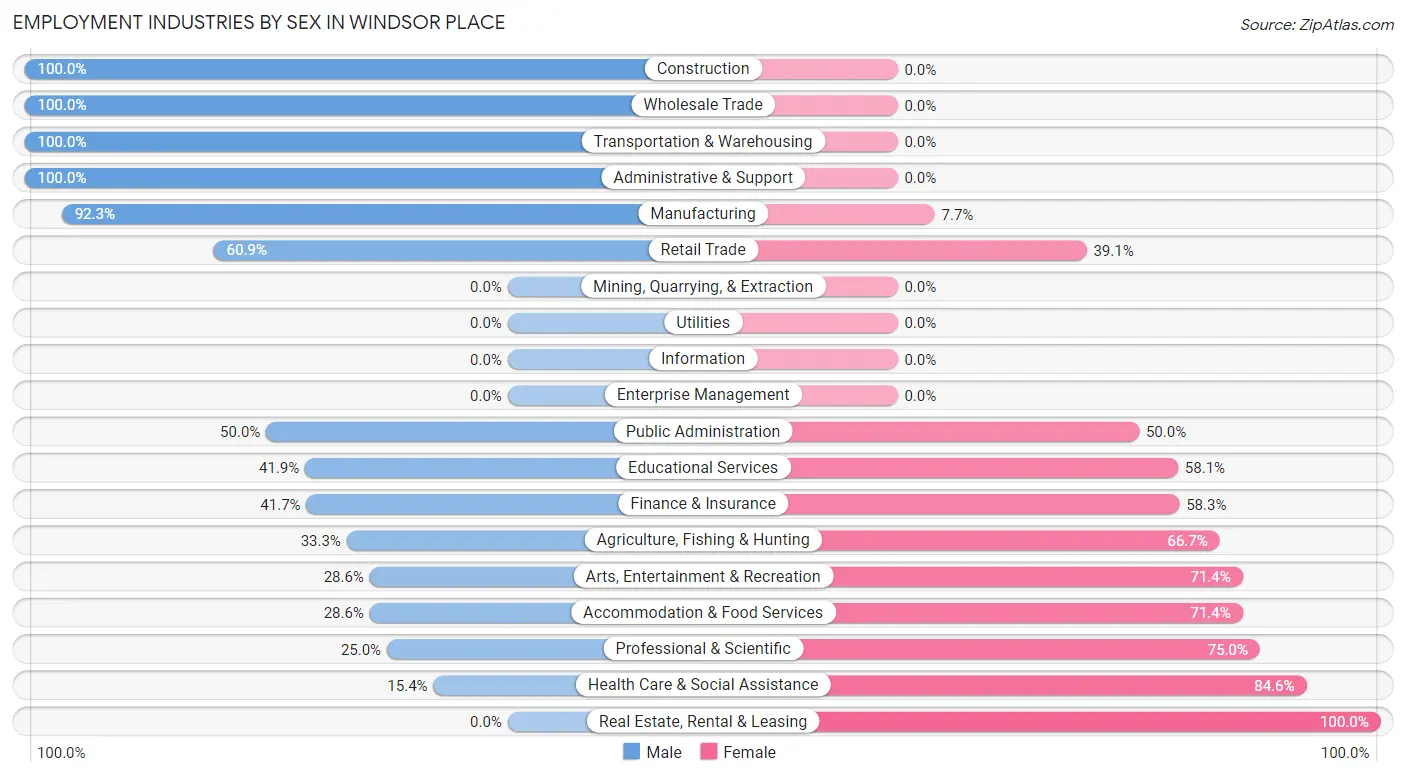
Employment Industries by Sex in Windsor Place
The Windsor Place industries that see more men than women are Construction (100.0%), Wholesale Trade (100.0%), and Transportation & Warehousing (100.0%), whereas the industries that tend to have a higher number of women are Real Estate, Rental & Leasing (100.0%), Health Care & Social Assistance (84.6%), and Professional & Scientific (75.0%).
| Industry | Male | Female |
| Agriculture, Fishing & Hunting | 1 (33.3%) | 2 (66.7%) |
| Mining, Quarrying, & Extraction | 0 (0.0%) | 0 (0.0%) |
| Construction | 10 (100.0%) | 0 (0.0%) |
| Manufacturing | 24 (92.3%) | 2 (7.7%) |
| Wholesale Trade | 3 (100.0%) | 0 (0.0%) |
| Retail Trade | 14 (60.9%) | 9 (39.1%) |
| Transportation & Warehousing | 11 (100.0%) | 0 (0.0%) |
| Utilities | 0 (0.0%) | 0 (0.0%) |
| Information | 0 (0.0%) | 0 (0.0%) |
| Finance & Insurance | 5 (41.7%) | 7 (58.3%) |
| Real Estate, Rental & Leasing | 0 (0.0%) | 6 (100.0%) |
| Professional & Scientific | 3 (25.0%) | 9 (75.0%) |
| Enterprise Management | 0 (0.0%) | 0 (0.0%) |
| Administrative & Support | 4 (100.0%) | 0 (0.0%) |
| Educational Services | 13 (41.9%) | 18 (58.1%) |
| Health Care & Social Assistance | 12 (15.4%) | 66 (84.6%) |
| Arts, Entertainment & Recreation | 2 (28.6%) | 5 (71.4%) |
| Accommodation & Food Services | 2 (28.6%) | 5 (71.4%) |
| Public Administration | 6 (50.0%) | 6 (50.0%) |
| Total | 110 (43.6%) | 142 (56.4%) |
Education in Windsor Place
School Enrollment in Windsor Place
The most common levels of schooling among the 115 students in Windsor Place are middle school (37 | 32.2%), high school (27 | 23.5%), and elementary school (26 | 22.6%).
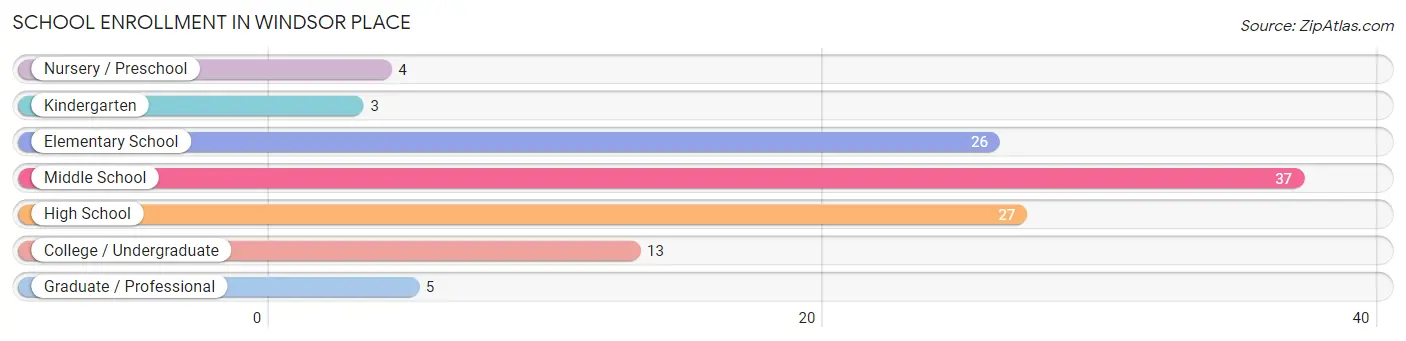
| School Level | # Students | % Students |
| Nursery / Preschool | 4 | 3.5% |
| Kindergarten | 3 | 2.6% |
| Elementary School | 26 | 22.6% |
| Middle School | 37 | 32.2% |
| High School | 27 | 23.5% |
| College / Undergraduate | 13 | 11.3% |
| Graduate / Professional | 5 | 4.3% |
| Total | 115 | 100.0% |
School Enrollment by Age by Funding Source in Windsor Place
Out of a total of 115 students who are enrolled in schools in Windsor Place, 10 (8.7%) attend a private institution, while the remaining 105 (91.3%) are enrolled in public schools. The age group of 25 to 34 year olds has the highest likelihood of being enrolled in private schools, with 4 (66.7% in the age bracket) enrolled. Conversely, the age group of 15 to 17 year olds has the lowest likelihood of being enrolled in a private school, with 19 (100.0% in the age bracket) attending a public institution.
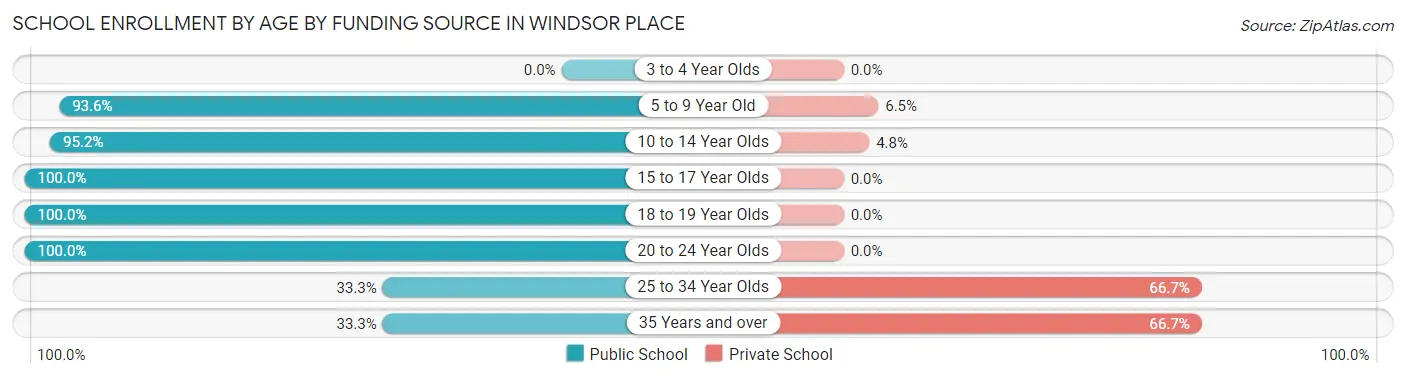
| Age Bracket | Public School | Private School |
| 3 to 4 Year Olds | 0 (0.0%) | 0 (0.0%) |
| 5 to 9 Year Old | 29 (93.5%) | 2 (6.5%) |
| 10 to 14 Year Olds | 40 (95.2%) | 2 (4.8%) |
| 15 to 17 Year Olds | 19 (100.0%) | 0 (0.0%) |
| 18 to 19 Year Olds | 9 (100.0%) | 0 (0.0%) |
| 20 to 24 Year Olds | 5 (100.0%) | 0 (0.0%) |
| 25 to 34 Year Olds | 2 (33.3%) | 4 (66.7%) |
| 35 Years and over | 1 (33.3%) | 2 (66.7%) |
| Total | 105 (91.3%) | 10 (8.7%) |
Educational Attainment by Field of Study in Windsor Place
Education (26 | 29.9%), business (21 | 24.1%), science & technology (10 | 11.5%), bio, nature & agricultural (9 | 10.3%), and literature & languages (6 | 6.9%) are the most common fields of study among 87 individuals in Windsor Place who have obtained a bachelor's degree or higher.
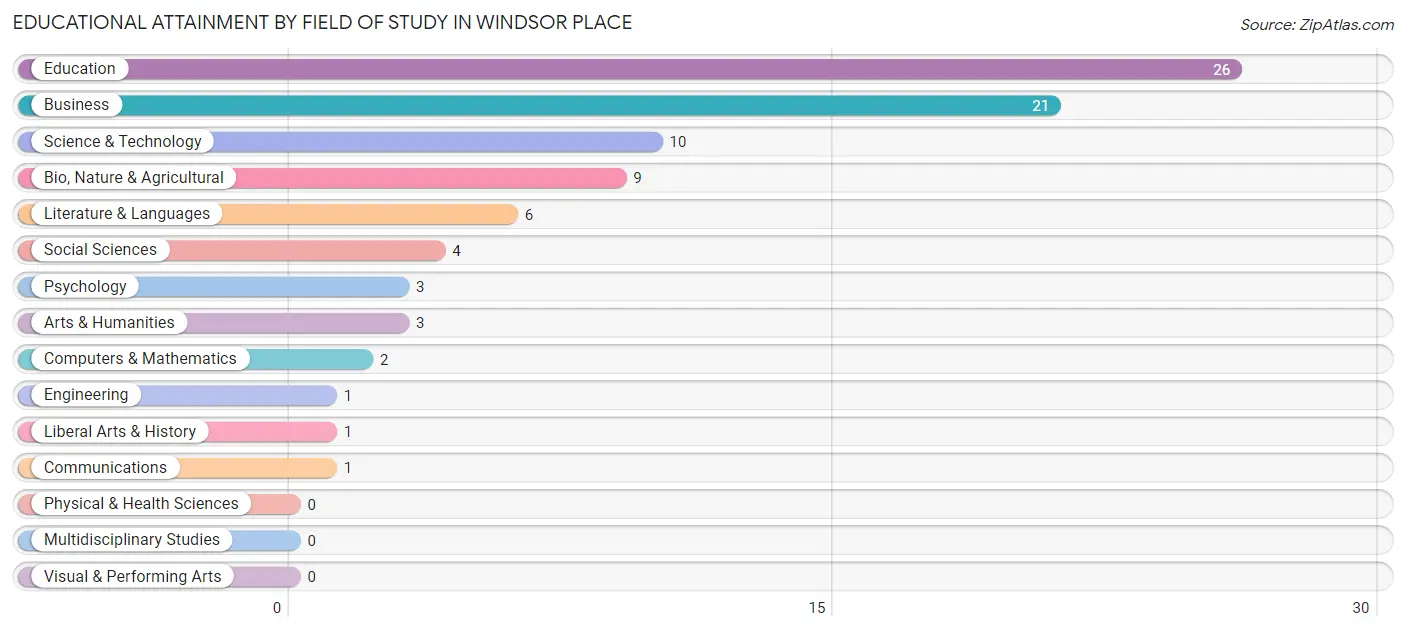
| Field of Study | # Graduates | % Graduates |
| Computers & Mathematics | 2 | 2.3% |
| Bio, Nature & Agricultural | 9 | 10.3% |
| Physical & Health Sciences | 0 | 0.0% |
| Psychology | 3 | 3.5% |
| Social Sciences | 4 | 4.6% |
| Engineering | 1 | 1.1% |
| Multidisciplinary Studies | 0 | 0.0% |
| Science & Technology | 10 | 11.5% |
| Business | 21 | 24.1% |
| Education | 26 | 29.9% |
| Literature & Languages | 6 | 6.9% |
| Liberal Arts & History | 1 | 1.1% |
| Visual & Performing Arts | 0 | 0.0% |
| Communications | 1 | 1.1% |
| Arts & Humanities | 3 | 3.5% |
| Total | 87 | 100.0% |
Transportation & Commute in Windsor Place
Vehicle Availability by Sex in Windsor Place
The most prevalent vehicle ownership categories in Windsor Place are males with 2 vehicles (49, accounting for 45.4%) and females with 2 vehicles (54, making up 35.0%).
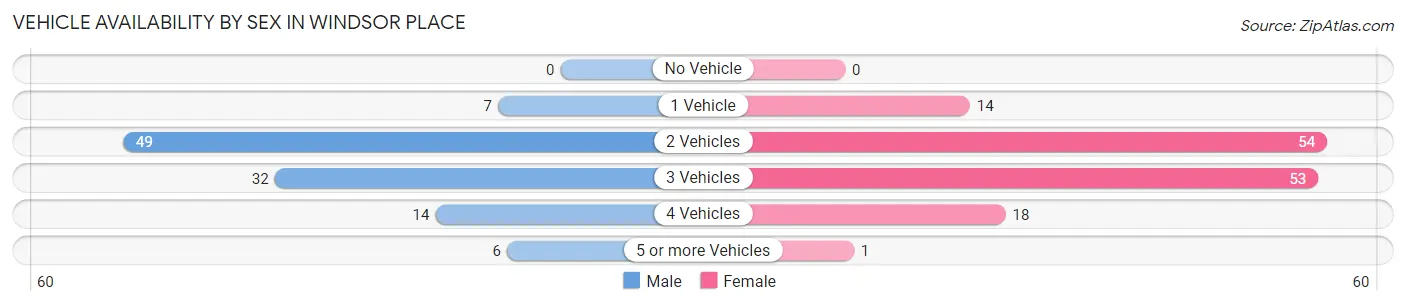
| Vehicles Available | Male | Female |
| No Vehicle | 0 (0.0%) | 0 (0.0%) |
| 1 Vehicle | 7 (6.5%) | 14 (10.0%) |
| 2 Vehicles | 49 (45.4%) | 54 (38.6%) |
| 3 Vehicles | 32 (29.6%) | 53 (37.9%) |
| 4 Vehicles | 14 (13.0%) | 18 (12.9%) |
| 5 or more Vehicles | 6 (5.6%) | 1 (0.7%) |
| Total | 108 (100.0%) | 140 (100.0%) |
Commute Time in Windsor Place
The most frequently occuring commute durations in Windsor Place are 30 to 34 minutes (67 commuters, 28.5%), 10 to 14 minutes (40 commuters, 17.0%), and 5 to 9 minutes (38 commuters, 16.2%).
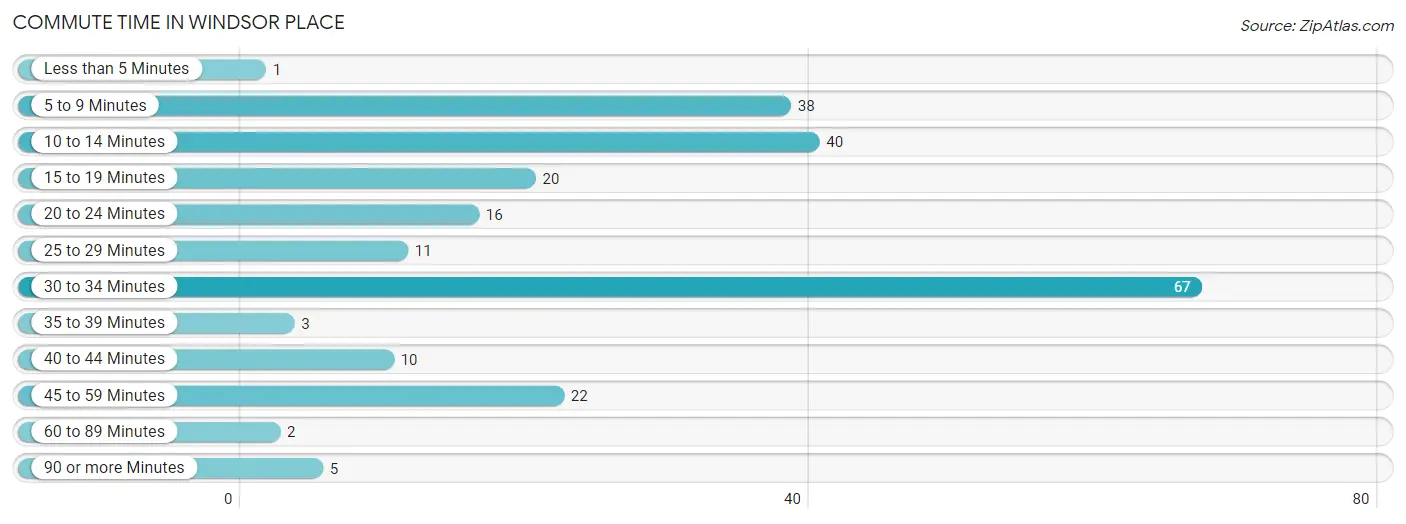
| Commute Time | # Commuters | % Commuters |
| Less than 5 Minutes | 1 | 0.4% |
| 5 to 9 Minutes | 38 | 16.2% |
| 10 to 14 Minutes | 40 | 17.0% |
| 15 to 19 Minutes | 20 | 8.5% |
| 20 to 24 Minutes | 16 | 6.8% |
| 25 to 29 Minutes | 11 | 4.7% |
| 30 to 34 Minutes | 67 | 28.5% |
| 35 to 39 Minutes | 3 | 1.3% |
| 40 to 44 Minutes | 10 | 4.3% |
| 45 to 59 Minutes | 22 | 9.4% |
| 60 to 89 Minutes | 2 | 0.9% |
| 90 or more Minutes | 5 | 2.1% |
Commute Time by Sex in Windsor Place
The most common commute times in Windsor Place are 30 to 34 minutes (19 commuters, 18.4%) for males and 30 to 34 minutes (48 commuters, 36.4%) for females.
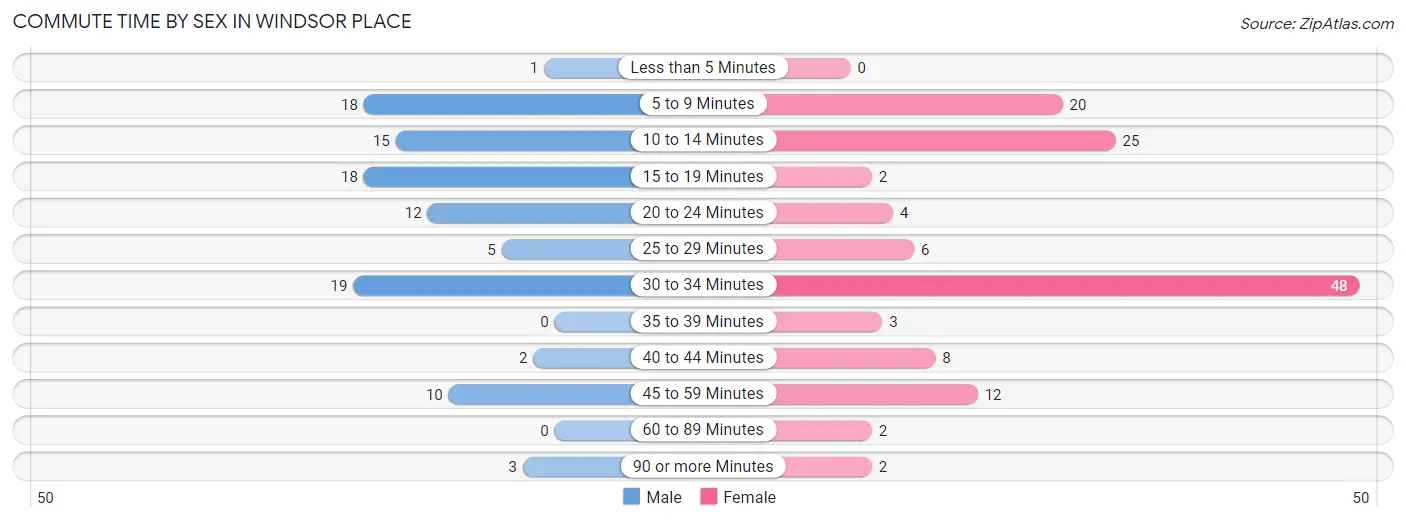
| Commute Time | Male | Female |
| Less than 5 Minutes | 1 (1.0%) | 0 (0.0%) |
| 5 to 9 Minutes | 18 (17.5%) | 20 (15.1%) |
| 10 to 14 Minutes | 15 (14.6%) | 25 (18.9%) |
| 15 to 19 Minutes | 18 (17.5%) | 2 (1.5%) |
| 20 to 24 Minutes | 12 (11.7%) | 4 (3.0%) |
| 25 to 29 Minutes | 5 (4.9%) | 6 (4.5%) |
| 30 to 34 Minutes | 19 (18.4%) | 48 (36.4%) |
| 35 to 39 Minutes | 0 (0.0%) | 3 (2.3%) |
| 40 to 44 Minutes | 2 (1.9%) | 8 (6.1%) |
| 45 to 59 Minutes | 10 (9.7%) | 12 (9.1%) |
| 60 to 89 Minutes | 0 (0.0%) | 2 (1.5%) |
| 90 or more Minutes | 3 (2.9%) | 2 (1.5%) |
Time of Departure to Work by Sex in Windsor Place
The most frequent times of departure to work in Windsor Place are 7:00 AM to 7:29 AM (21, 20.4%) for males and 6:30 AM to 6:59 AM (39, 29.5%) for females.
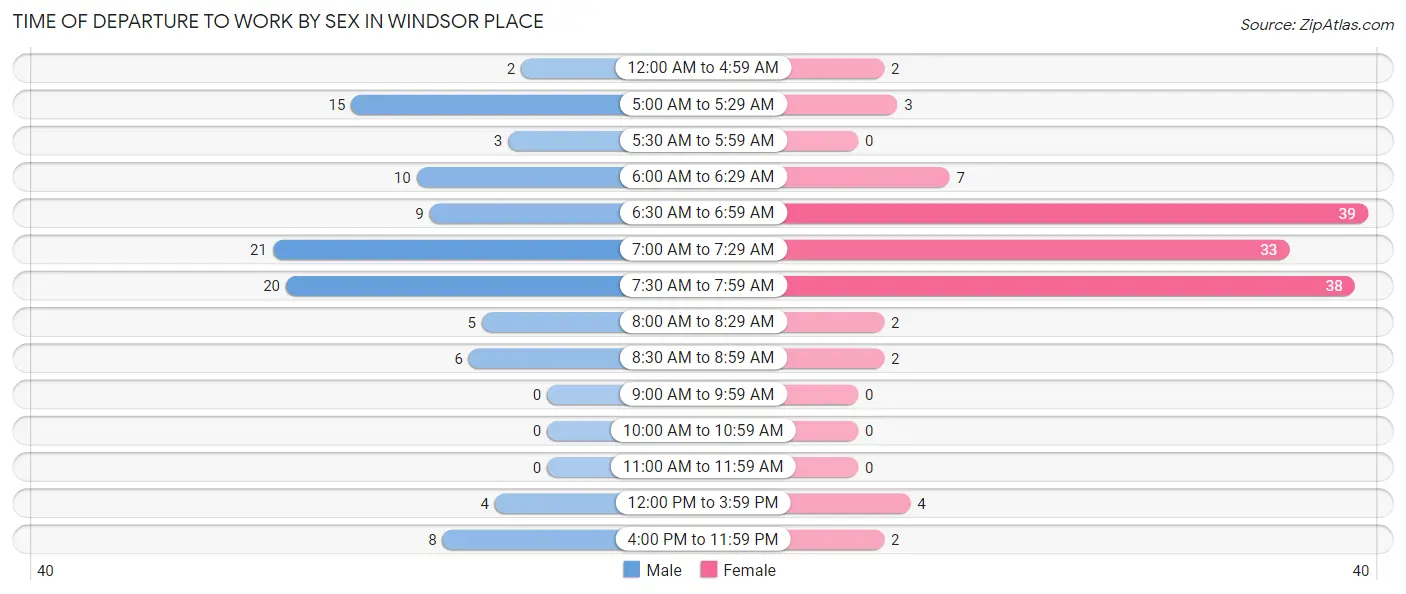
| Time of Departure | Male | Female |
| 12:00 AM to 4:59 AM | 2 (1.9%) | 2 (1.5%) |
| 5:00 AM to 5:29 AM | 15 (14.6%) | 3 (2.3%) |
| 5:30 AM to 5:59 AM | 3 (2.9%) | 0 (0.0%) |
| 6:00 AM to 6:29 AM | 10 (9.7%) | 7 (5.3%) |
| 6:30 AM to 6:59 AM | 9 (8.7%) | 39 (29.5%) |
| 7:00 AM to 7:29 AM | 21 (20.4%) | 33 (25.0%) |
| 7:30 AM to 7:59 AM | 20 (19.4%) | 38 (28.8%) |
| 8:00 AM to 8:29 AM | 5 (4.9%) | 2 (1.5%) |
| 8:30 AM to 8:59 AM | 6 (5.8%) | 2 (1.5%) |
| 9:00 AM to 9:59 AM | 0 (0.0%) | 0 (0.0%) |
| 10:00 AM to 10:59 AM | 0 (0.0%) | 0 (0.0%) |
| 11:00 AM to 11:59 AM | 0 (0.0%) | 0 (0.0%) |
| 12:00 PM to 3:59 PM | 4 (3.9%) | 4 (3.0%) |
| 4:00 PM to 11:59 PM | 8 (7.8%) | 2 (1.5%) |
| Total | 103 (100.0%) | 132 (100.0%) |
Housing Occupancy in Windsor Place
Occupancy by Ownership in Windsor Place
Of the total 156 dwellings in Windsor Place, owner-occupied units account for 110 (70.5%), while renter-occupied units make up 46 (29.5%).
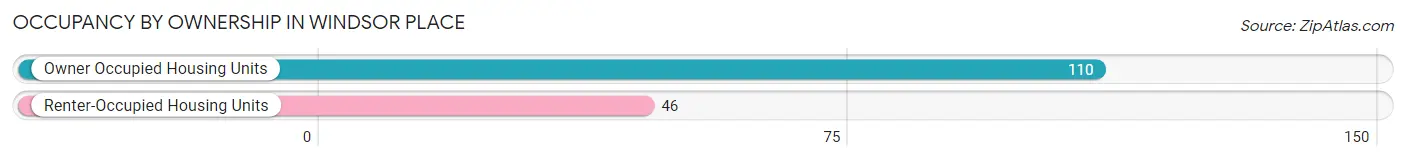
| Occupancy | # Housing Units | % Housing Units |
| Owner Occupied Housing Units | 110 | 70.5% |
| Renter-Occupied Housing Units | 46 | 29.5% |
| Total Occupied Housing Units | 156 | 100.0% |
Occupancy by Household Size in Windsor Place
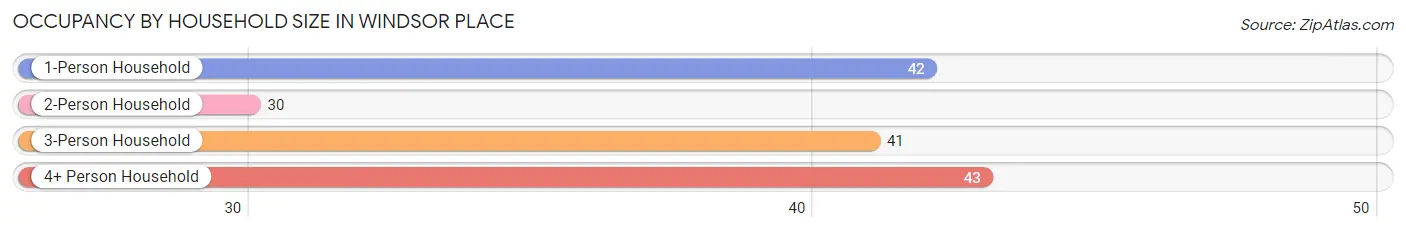
| Household Size | # Housing Units | % Housing Units |
| 1-Person Household | 42 | 26.9% |
| 2-Person Household | 30 | 19.2% |
| 3-Person Household | 41 | 26.3% |
| 4+ Person Household | 43 | 27.6% |
| Total Housing Units | 156 | 100.0% |
Occupancy by Ownership by Household Size in Windsor Place
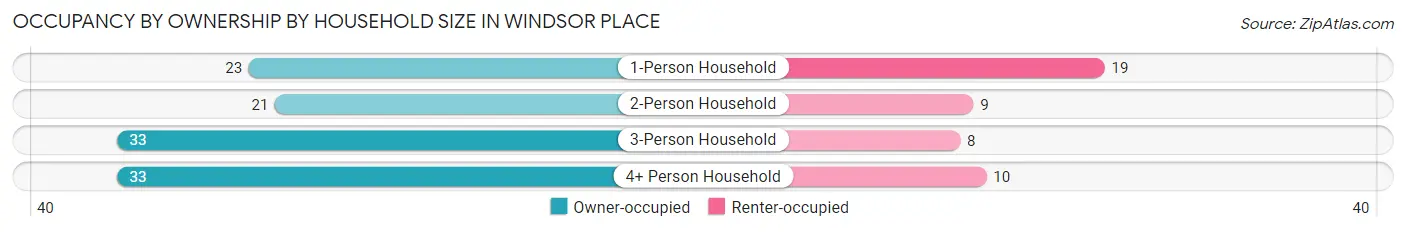
| Household Size | Owner-occupied | Renter-occupied |
| 1-Person Household | 23 (54.8%) | 19 (45.2%) |
| 2-Person Household | 21 (70.0%) | 9 (30.0%) |
| 3-Person Household | 33 (80.5%) | 8 (19.5%) |
| 4+ Person Household | 33 (76.7%) | 10 (23.3%) |
| Total Housing Units | 110 (70.5%) | 46 (29.5%) |
Occupancy by Educational Attainment in Windsor Place
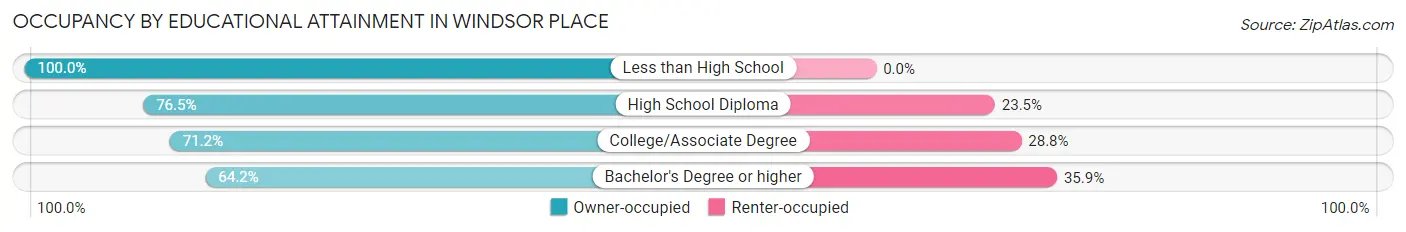
| Household Size | Owner-occupied | Renter-occupied |
| Less than High School | 3 (100.0%) | 0 (0.0%) |
| High School Diploma | 26 (76.5%) | 8 (23.5%) |
| College/Associate Degree | 47 (71.2%) | 19 (28.8%) |
| Bachelor's Degree or higher | 34 (64.1%) | 19 (35.8%) |
Occupancy by Age of Householder in Windsor Place
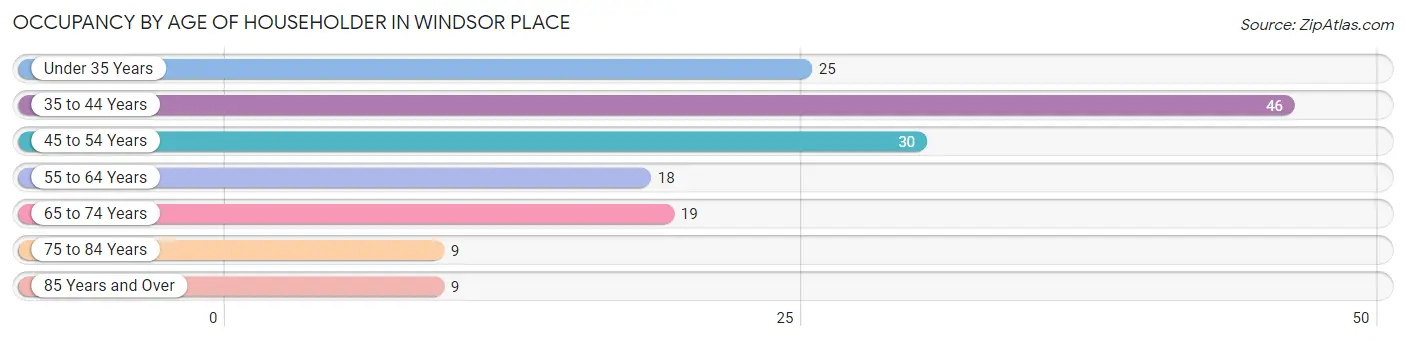
| Age Bracket | # Households | % Households |
| Under 35 Years | 25 | 16.0% |
| 35 to 44 Years | 46 | 29.5% |
| 45 to 54 Years | 30 | 19.2% |
| 55 to 64 Years | 18 | 11.5% |
| 65 to 74 Years | 19 | 12.2% |
| 75 to 84 Years | 9 | 5.8% |
| 85 Years and Over | 9 | 5.8% |
| Total | 156 | 100.0% |
Housing Finances in Windsor Place
Median Income by Occupancy in Windsor Place
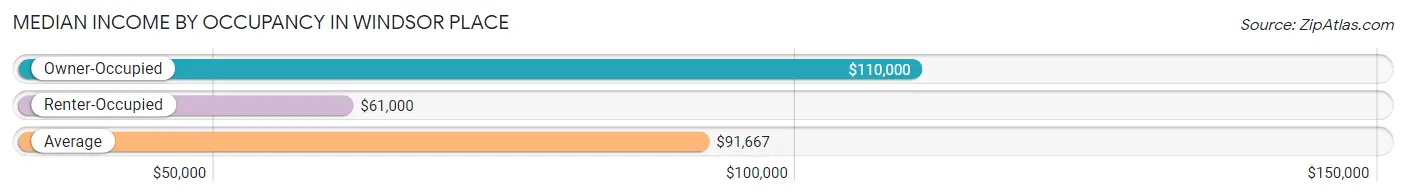
| Occupancy Type | # Households | Median Income |
| Owner-Occupied | 110 (70.5%) | $110,000 |
| Renter-Occupied | 46 (29.5%) | $61,000 |
| Average | 156 (100.0%) | $91,667 |
Occupancy by Householder Income Bracket in Windsor Place
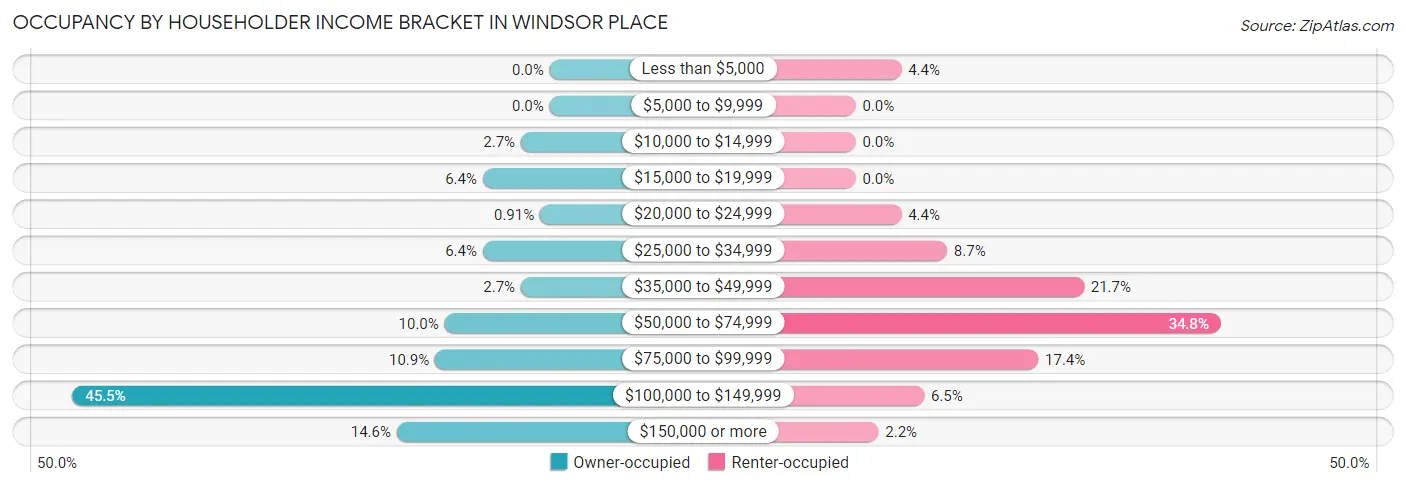
| Income Bracket | Owner-occupied | Renter-occupied |
| Less than $5,000 | 0 (0.0%) | 2 (4.3%) |
| $5,000 to $9,999 | 0 (0.0%) | 0 (0.0%) |
| $10,000 to $14,999 | 3 (2.7%) | 0 (0.0%) |
| $15,000 to $19,999 | 7 (6.4%) | 0 (0.0%) |
| $20,000 to $24,999 | 1 (0.9%) | 2 (4.3%) |
| $25,000 to $34,999 | 7 (6.4%) | 4 (8.7%) |
| $35,000 to $49,999 | 3 (2.7%) | 10 (21.7%) |
| $50,000 to $74,999 | 11 (10.0%) | 16 (34.8%) |
| $75,000 to $99,999 | 12 (10.9%) | 8 (17.4%) |
| $100,000 to $149,999 | 50 (45.5%) | 3 (6.5%) |
| $150,000 or more | 16 (14.5%) | 1 (2.2%) |
| Total | 110 (100.0%) | 46 (100.0%) |
Monthly Housing Cost Tiers in Windsor Place
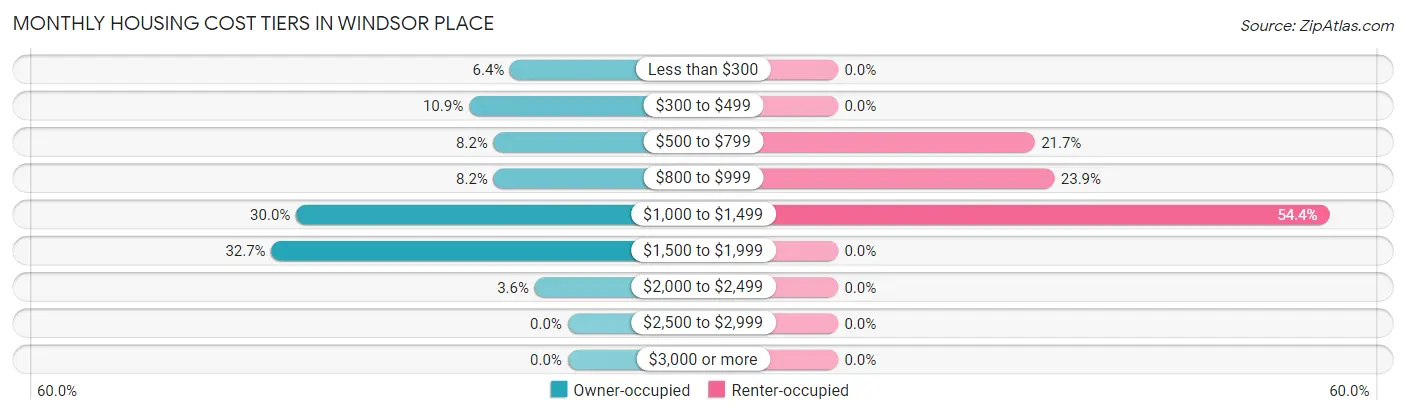
| Monthly Cost | Owner-occupied | Renter-occupied |
| Less than $300 | 7 (6.4%) | 0 (0.0%) |
| $300 to $499 | 12 (10.9%) | 0 (0.0%) |
| $500 to $799 | 9 (8.2%) | 10 (21.7%) |
| $800 to $999 | 9 (8.2%) | 11 (23.9%) |
| $1,000 to $1,499 | 33 (30.0%) | 25 (54.3%) |
| $1,500 to $1,999 | 36 (32.7%) | 0 (0.0%) |
| $2,000 to $2,499 | 4 (3.6%) | 0 (0.0%) |
| $2,500 to $2,999 | 0 (0.0%) | 0 (0.0%) |
| $3,000 or more | 0 (0.0%) | 0 (0.0%) |
| Total | 110 (100.0%) | 46 (100.0%) |
Physical Housing Characteristics in Windsor Place
Housing Structures in Windsor Place
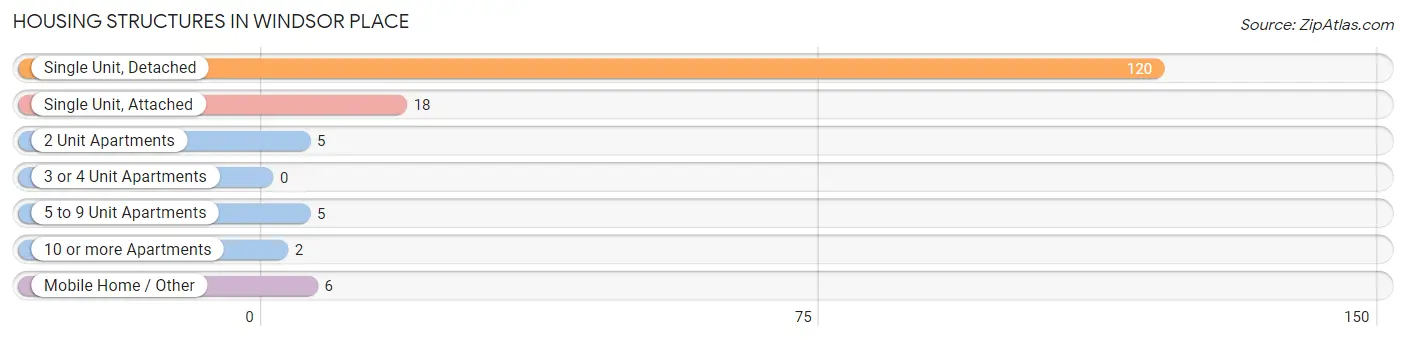
| Structure Type | # Housing Units | % Housing Units |
| Single Unit, Detached | 120 | 76.9% |
| Single Unit, Attached | 18 | 11.5% |
| 2 Unit Apartments | 5 | 3.2% |
| 3 or 4 Unit Apartments | 0 | 0.0% |
| 5 to 9 Unit Apartments | 5 | 3.2% |
| 10 or more Apartments | 2 | 1.3% |
| Mobile Home / Other | 6 | 3.8% |
| Total | 156 | 100.0% |
Housing Structures by Occupancy in Windsor Place
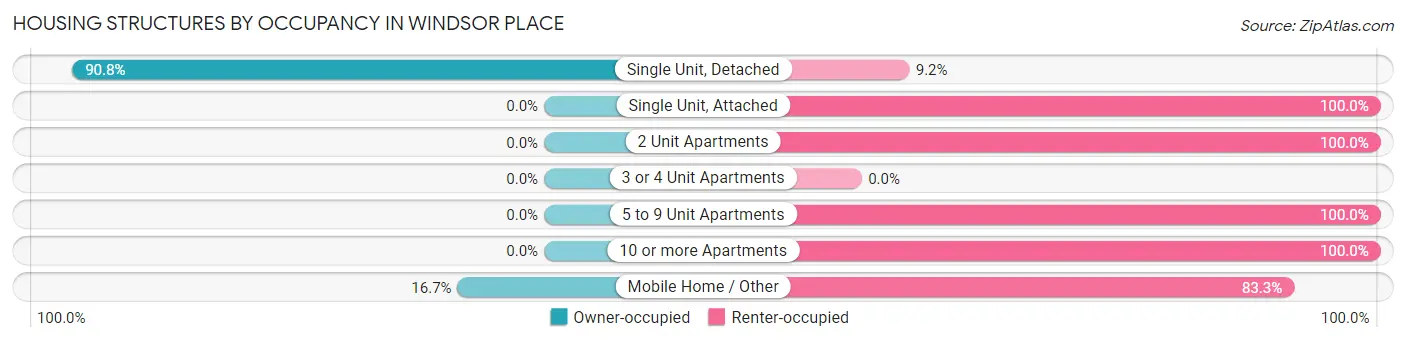
| Structure Type | Owner-occupied | Renter-occupied |
| Single Unit, Detached | 109 (90.8%) | 11 (9.2%) |
| Single Unit, Attached | 0 (0.0%) | 18 (100.0%) |
| 2 Unit Apartments | 0 (0.0%) | 5 (100.0%) |
| 3 or 4 Unit Apartments | 0 (0.0%) | 0 (0.0%) |
| 5 to 9 Unit Apartments | 0 (0.0%) | 5 (100.0%) |
| 10 or more Apartments | 0 (0.0%) | 2 (100.0%) |
| Mobile Home / Other | 1 (16.7%) | 5 (83.3%) |
| Total | 110 (70.5%) | 46 (29.5%) |
Housing Structures by Number of Rooms in Windsor Place
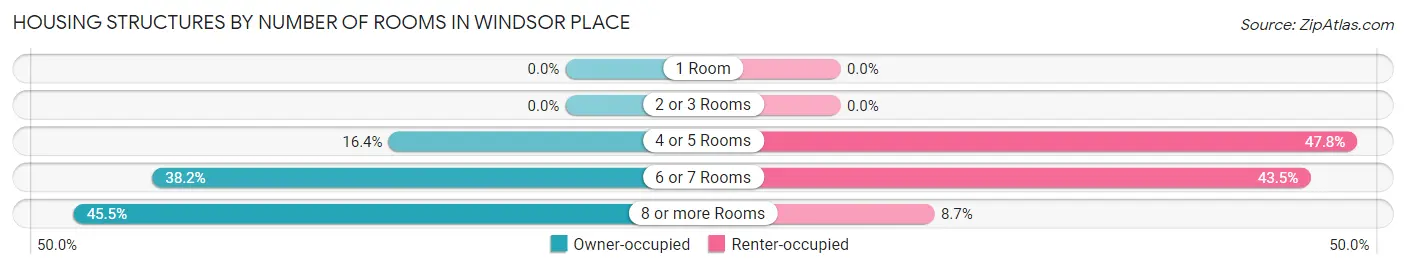
| Number of Rooms | Owner-occupied | Renter-occupied |
| 1 Room | 0 (0.0%) | 0 (0.0%) |
| 2 or 3 Rooms | 0 (0.0%) | 0 (0.0%) |
| 4 or 5 Rooms | 18 (16.4%) | 22 (47.8%) |
| 6 or 7 Rooms | 42 (38.2%) | 20 (43.5%) |
| 8 or more Rooms | 50 (45.5%) | 4 (8.7%) |
| Total | 110 (100.0%) | 46 (100.0%) |
Housing Structure by Heating Type in Windsor Place
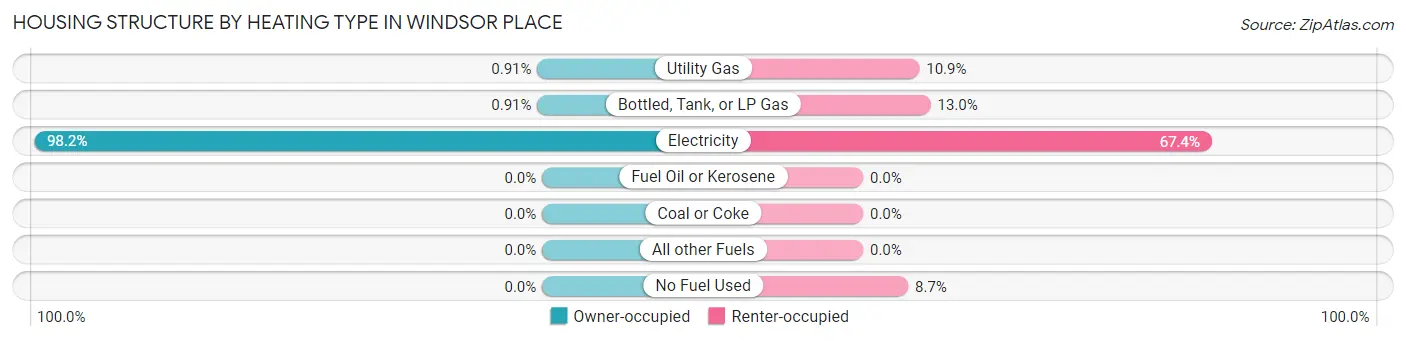
| Heating Type | Owner-occupied | Renter-occupied |
| Utility Gas | 1 (0.9%) | 5 (10.9%) |
| Bottled, Tank, or LP Gas | 1 (0.9%) | 6 (13.0%) |
| Electricity | 108 (98.2%) | 31 (67.4%) |
| Fuel Oil or Kerosene | 0 (0.0%) | 0 (0.0%) |
| Coal or Coke | 0 (0.0%) | 0 (0.0%) |
| All other Fuels | 0 (0.0%) | 0 (0.0%) |
| No Fuel Used | 0 (0.0%) | 4 (8.7%) |
| Total | 110 (100.0%) | 46 (100.0%) |
Household Vehicle Usage in Windsor Place
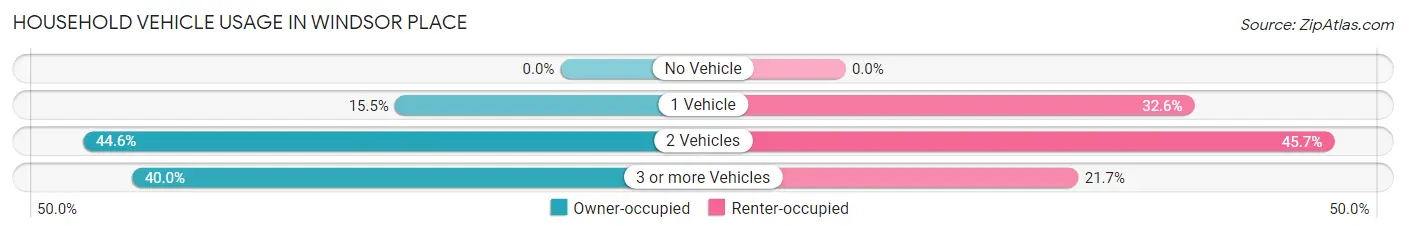
| Vehicles per Household | Owner-occupied | Renter-occupied |
| No Vehicle | 0 (0.0%) | 0 (0.0%) |
| 1 Vehicle | 17 (15.4%) | 15 (32.6%) |
| 2 Vehicles | 49 (44.6%) | 21 (45.7%) |
| 3 or more Vehicles | 44 (40.0%) | 10 (21.7%) |
| Total | 110 (100.0%) | 46 (100.0%) |
Real Estate & Mortgages in Windsor Place
Real Estate and Mortgage Overview in Windsor Place
| Characteristic | Without Mortgage | With Mortgage |
| Housing Units | 29 | 81 |
| Median Property Value | $193,800 | $231,700 |
| Median Household Income | $44,583 | $10 |
| Monthly Housing Costs | $444 | $0 |
| Real Estate Taxes | $1,821 | $0 |
Property Value by Mortgage Status in Windsor Place
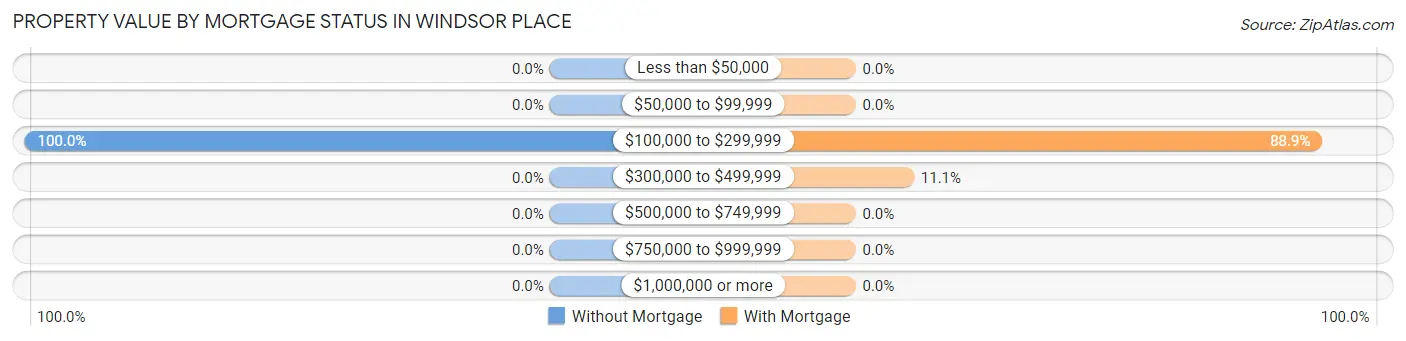
| Property Value | Without Mortgage | With Mortgage |
| Less than $50,000 | 0 (0.0%) | 0 (0.0%) |
| $50,000 to $99,999 | 0 (0.0%) | 0 (0.0%) |
| $100,000 to $299,999 | 29 (100.0%) | 72 (88.9%) |
| $300,000 to $499,999 | 0 (0.0%) | 9 (11.1%) |
| $500,000 to $749,999 | 0 (0.0%) | 0 (0.0%) |
| $750,000 to $999,999 | 0 (0.0%) | 0 (0.0%) |
| $1,000,000 or more | 0 (0.0%) | 0 (0.0%) |
| Total | 29 (100.0%) | 81 (100.0%) |
Household Income by Mortgage Status in Windsor Place
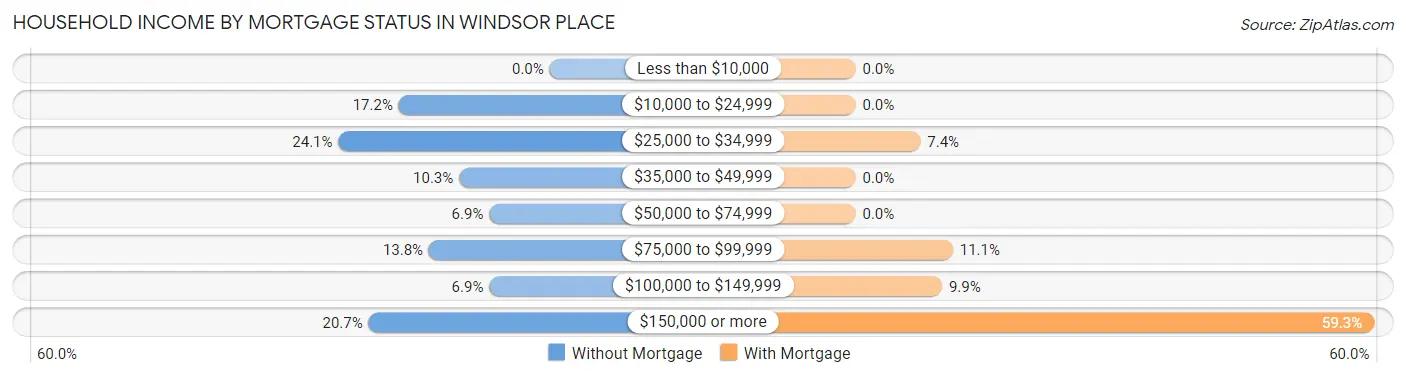
| Household Income | Without Mortgage | With Mortgage |
| Less than $10,000 | 0 (0.0%) | 0 (0.0%) |
| $10,000 to $24,999 | 5 (17.2%) | 0 (0.0%) |
| $25,000 to $34,999 | 7 (24.1%) | 6 (7.4%) |
| $35,000 to $49,999 | 3 (10.3%) | 0 (0.0%) |
| $50,000 to $74,999 | 2 (6.9%) | 0 (0.0%) |
| $75,000 to $99,999 | 4 (13.8%) | 9 (11.1%) |
| $100,000 to $149,999 | 2 (6.9%) | 8 (9.9%) |
| $150,000 or more | 6 (20.7%) | 48 (59.3%) |
| Total | 29 (100.0%) | 81 (100.0%) |
Property Value to Household Income Ratio in Windsor Place
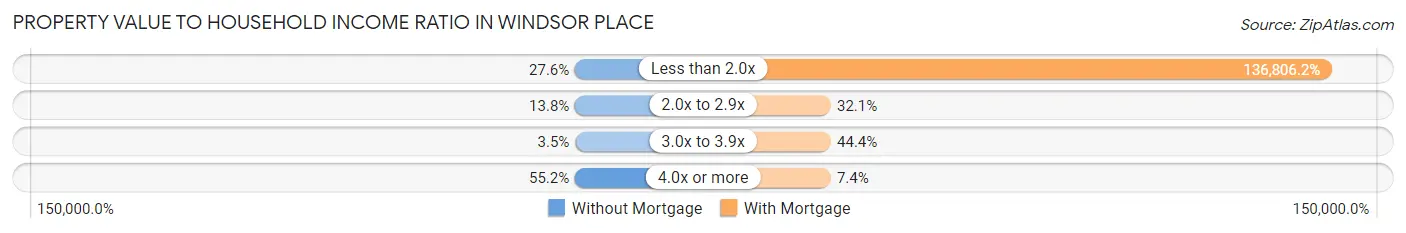
| Value-to-Income Ratio | Without Mortgage | With Mortgage |
| Less than 2.0x | 8 (27.6%) | 110,813 (136,806.2%) |
| 2.0x to 2.9x | 4 (13.8%) | 26 (32.1%) |
| 3.0x to 3.9x | 1 (3.5%) | 36 (44.4%) |
| 4.0x or more | 16 (55.2%) | 6 (7.4%) |
| Total | 29 (100.0%) | 81 (100.0%) |
Real Estate Taxes by Mortgage Status in Windsor Place
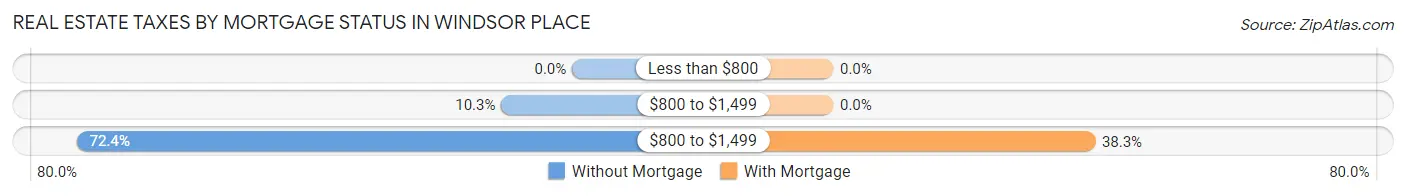
| Property Taxes | Without Mortgage | With Mortgage |
| Less than $800 | 0 (0.0%) | 0 (0.0%) |
| $800 to $1,499 | 3 (10.3%) | 0 (0.0%) |
| $800 to $1,499 | 21 (72.4%) | 31 (38.3%) |
| Total | 29 (100.0%) | 81 (100.0%) |
Health & Disability in Windsor Place
Health Insurance Coverage by Age in Windsor Place
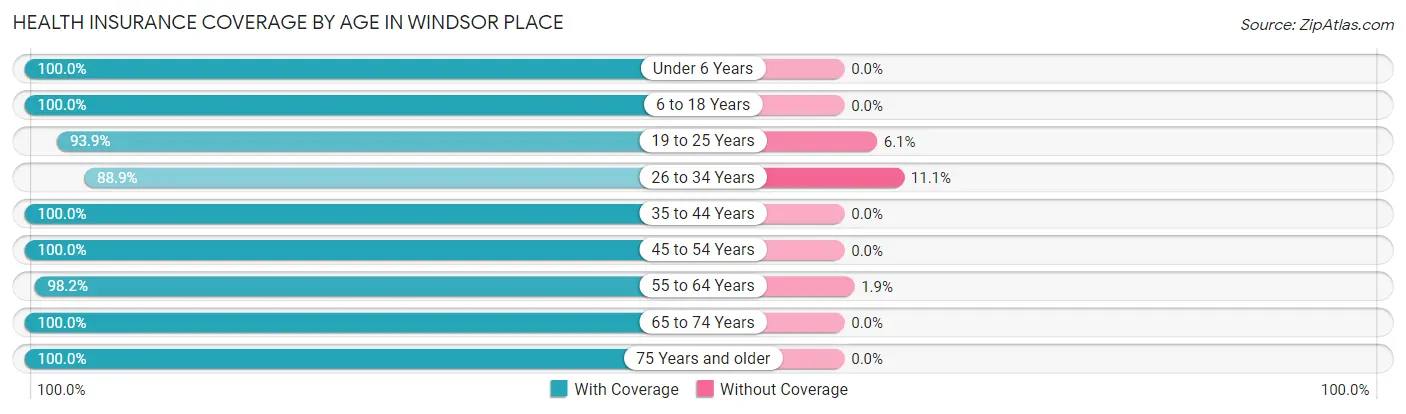
| Age Bracket | With Coverage | Without Coverage |
| Under 6 Years | 27 (100.0%) | 0 (0.0%) |
| 6 to 18 Years | 123 (100.0%) | 0 (0.0%) |
| 19 to 25 Years | 31 (93.9%) | 2 (6.1%) |
| 26 to 34 Years | 40 (88.9%) | 5 (11.1%) |
| 35 to 44 Years | 76 (100.0%) | 0 (0.0%) |
| 45 to 54 Years | 43 (100.0%) | 0 (0.0%) |
| 55 to 64 Years | 53 (98.2%) | 1 (1.8%) |
| 65 to 74 Years | 25 (100.0%) | 0 (0.0%) |
| 75 Years and older | 22 (100.0%) | 0 (0.0%) |
| Total | 440 (98.2%) | 8 (1.8%) |
Health Insurance Coverage by Citizenship Status in Windsor Place
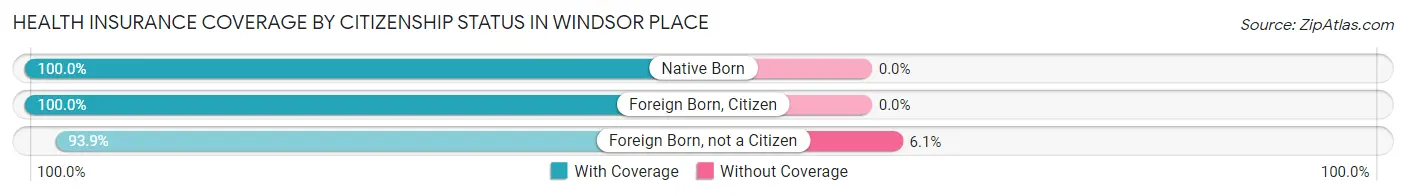
| Citizenship Status | With Coverage | Without Coverage |
| Native Born | 27 (100.0%) | 0 (0.0%) |
| Foreign Born, Citizen | 123 (100.0%) | 0 (0.0%) |
| Foreign Born, not a Citizen | 31 (93.9%) | 2 (6.1%) |
Health Insurance Coverage by Household Income in Windsor Place
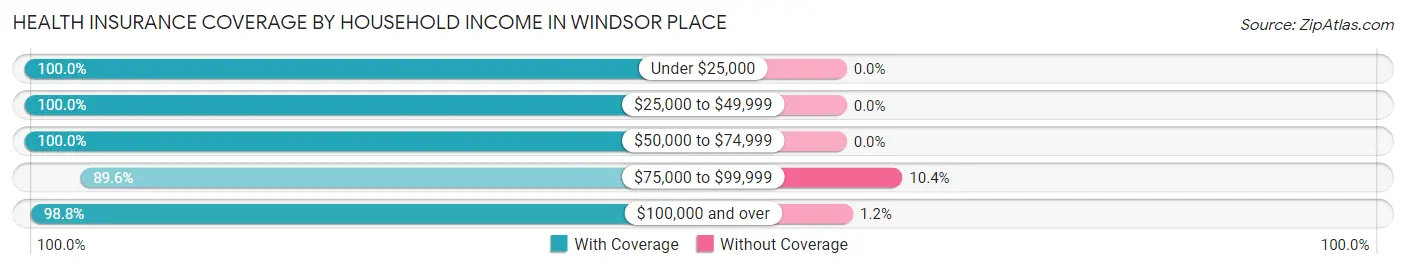
| Household Income | With Coverage | Without Coverage |
| Under $25,000 | 21 (100.0%) | 0 (0.0%) |
| $25,000 to $49,999 | 44 (100.0%) | 0 (0.0%) |
| $50,000 to $74,999 | 82 (100.0%) | 0 (0.0%) |
| $75,000 to $99,999 | 43 (89.6%) | 5 (10.4%) |
| $100,000 and over | 250 (98.8%) | 3 (1.2%) |
Public vs Private Health Insurance Coverage by Age in Windsor Place
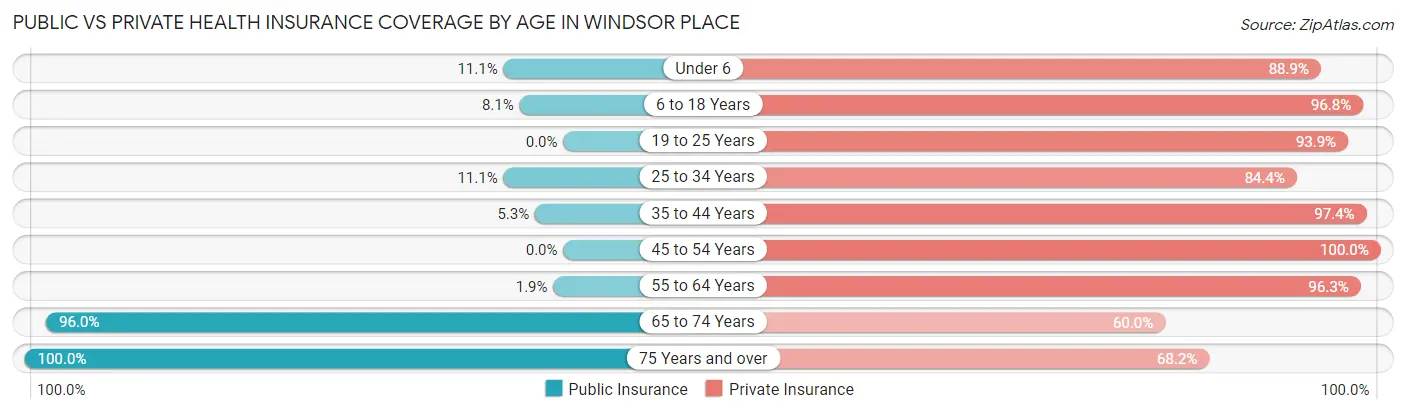
| Age Bracket | Public Insurance | Private Insurance |
| Under 6 | 3 (11.1%) | 24 (88.9%) |
| 6 to 18 Years | 10 (8.1%) | 119 (96.8%) |
| 19 to 25 Years | 0 (0.0%) | 31 (93.9%) |
| 25 to 34 Years | 5 (11.1%) | 38 (84.4%) |
| 35 to 44 Years | 4 (5.3%) | 74 (97.4%) |
| 45 to 54 Years | 0 (0.0%) | 43 (100.0%) |
| 55 to 64 Years | 1 (1.8%) | 52 (96.3%) |
| 65 to 74 Years | 24 (96.0%) | 15 (60.0%) |
| 75 Years and over | 22 (100.0%) | 15 (68.2%) |
| Total | 69 (15.4%) | 411 (91.7%) |
Disability Status by Sex by Age in Windsor Place
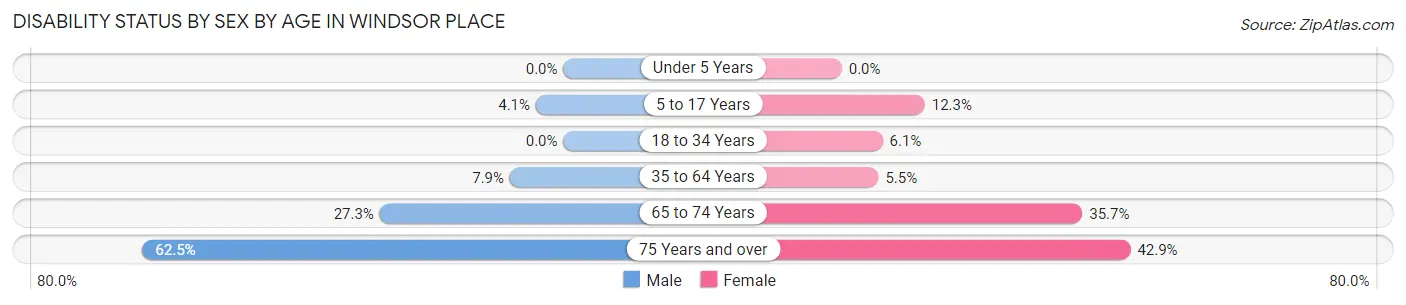
| Age Bracket | Male | Female |
| Under 5 Years | 0 (0.0%) | 0 (0.0%) |
| 5 to 17 Years | 2 (4.1%) | 9 (12.3%) |
| 18 to 34 Years | 0 (0.0%) | 2 (6.1%) |
| 35 to 64 Years | 5 (7.9%) | 6 (5.4%) |
| 65 to 74 Years | 3 (27.3%) | 5 (35.7%) |
| 75 Years and over | 5 (62.5%) | 6 (42.9%) |
Disability Class by Sex by Age in Windsor Place
Disability Class: Hearing Difficulty
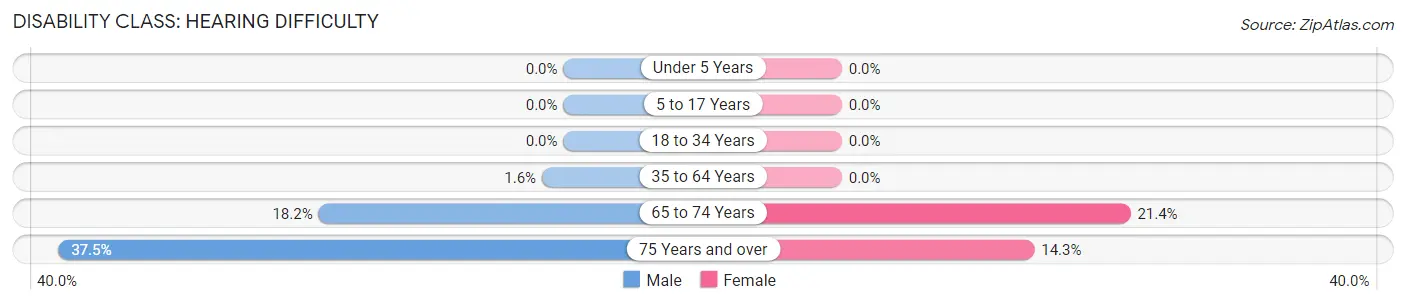
| Age Bracket | Male | Female |
| Under 5 Years | 0 (0.0%) | 0 (0.0%) |
| 5 to 17 Years | 0 (0.0%) | 0 (0.0%) |
| 18 to 34 Years | 0 (0.0%) | 0 (0.0%) |
| 35 to 64 Years | 1 (1.6%) | 0 (0.0%) |
| 65 to 74 Years | 2 (18.2%) | 3 (21.4%) |
| 75 Years and over | 3 (37.5%) | 2 (14.3%) |
Disability Class: Vision Difficulty
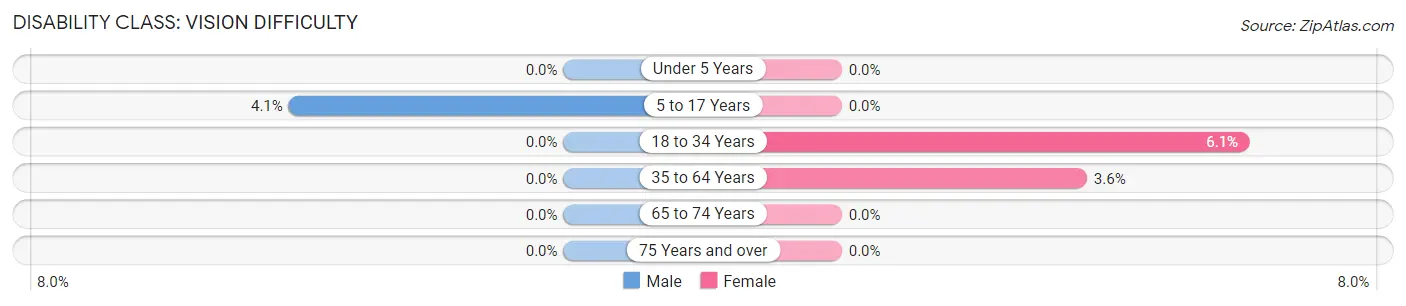
| Age Bracket | Male | Female |
| Under 5 Years | 0 (0.0%) | 0 (0.0%) |
| 5 to 17 Years | 2 (4.1%) | 0 (0.0%) |
| 18 to 34 Years | 0 (0.0%) | 2 (6.1%) |
| 35 to 64 Years | 0 (0.0%) | 4 (3.6%) |
| 65 to 74 Years | 0 (0.0%) | 0 (0.0%) |
| 75 Years and over | 0 (0.0%) | 0 (0.0%) |
Disability Class: Cognitive Difficulty
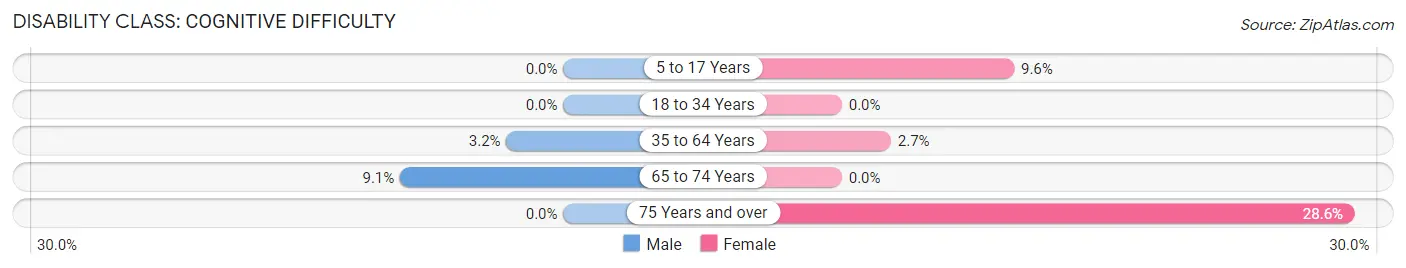
| Age Bracket | Male | Female |
| 5 to 17 Years | 0 (0.0%) | 7 (9.6%) |
| 18 to 34 Years | 0 (0.0%) | 0 (0.0%) |
| 35 to 64 Years | 2 (3.2%) | 3 (2.7%) |
| 65 to 74 Years | 1 (9.1%) | 0 (0.0%) |
| 75 Years and over | 0 (0.0%) | 4 (28.6%) |
Disability Class: Ambulatory Difficulty
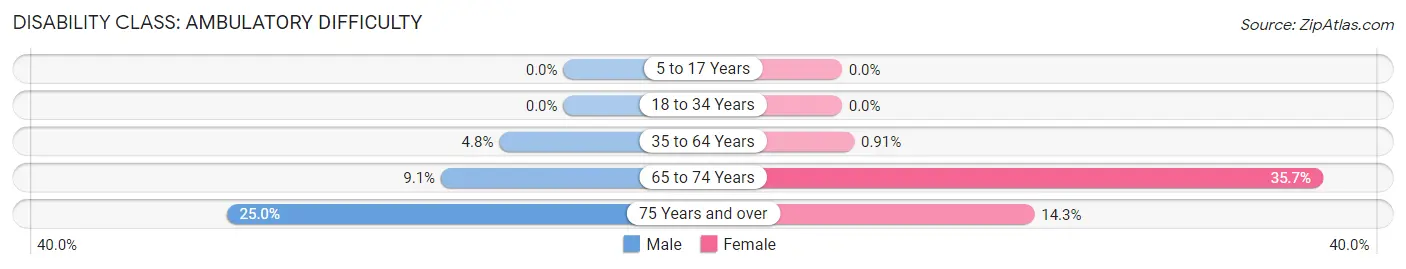
| Age Bracket | Male | Female |
| 5 to 17 Years | 0 (0.0%) | 0 (0.0%) |
| 18 to 34 Years | 0 (0.0%) | 0 (0.0%) |
| 35 to 64 Years | 3 (4.8%) | 1 (0.9%) |
| 65 to 74 Years | 1 (9.1%) | 5 (35.7%) |
| 75 Years and over | 2 (25.0%) | 2 (14.3%) |
Disability Class: Self-Care Difficulty
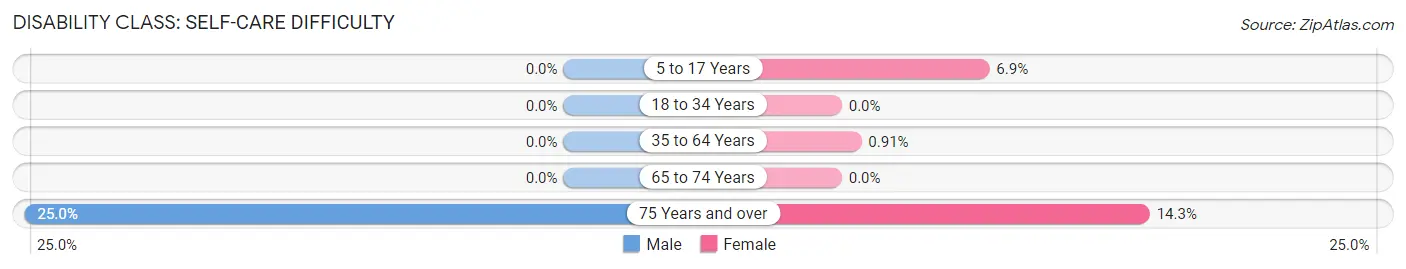
| Age Bracket | Male | Female |
| 5 to 17 Years | 0 (0.0%) | 5 (6.9%) |
| 18 to 34 Years | 0 (0.0%) | 0 (0.0%) |
| 35 to 64 Years | 0 (0.0%) | 1 (0.9%) |
| 65 to 74 Years | 0 (0.0%) | 0 (0.0%) |
| 75 Years and over | 2 (25.0%) | 2 (14.3%) |
Technology Access in Windsor Place
Computing Device Access in Windsor Place
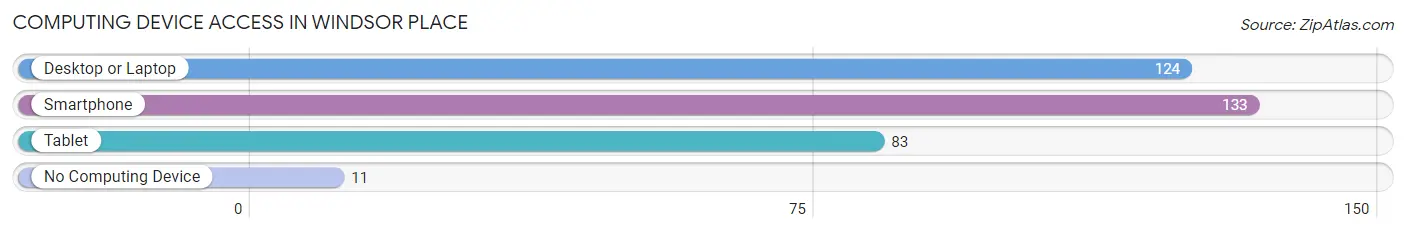
| Device Type | # Households | % Households |
| Desktop or Laptop | 124 | 79.5% |
| Smartphone | 133 | 85.3% |
| Tablet | 83 | 53.2% |
| No Computing Device | 11 | 7.0% |
| Total | 156 | 100.0% |
Internet Access in Windsor Place
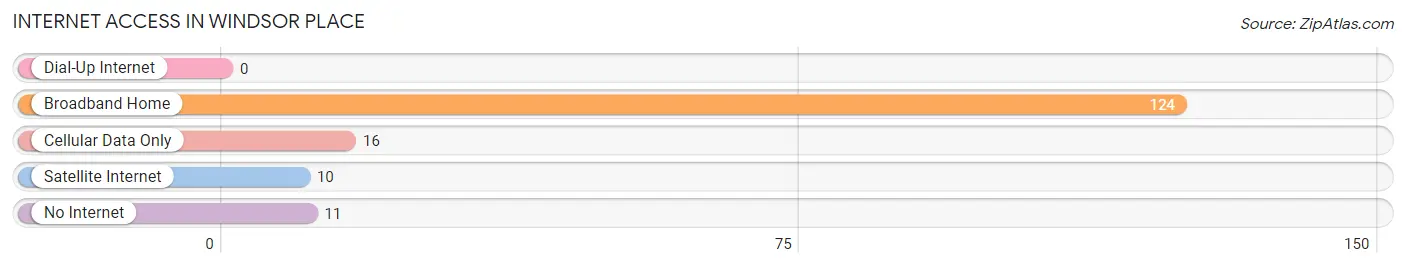
| Internet Type | # Households | % Households |
| Dial-Up Internet | 0 | 0.0% |
| Broadband Home | 124 | 79.5% |
| Cellular Data Only | 16 | 10.3% |
| Satellite Internet | 10 | 6.4% |
| No Internet | 11 | 7.0% |
| Total | 156 | 100.0% |
Windsor Place Summary
Windsor Place is a small town located in the state of Missouri, United States. It is situated in the northwest corner of the state, near the border with Iowa. The town has a population of approximately 1,000 people and is part of the St. Louis metropolitan area.
History
Windsor Place was founded in 1837 by a group of settlers from Kentucky. The town was named after the Duke of Windsor, who was the reigning monarch of England at the time. The town was originally a farming community, but it soon developed into a small industrial center. The first industry in the town was a sawmill, which was built in 1845. The sawmill was followed by a gristmill, a blacksmith shop, and a general store.
In the late 19th century, Windsor Place became a popular tourist destination. The town was known for its scenic beauty and its proximity to the Mississippi River. The town also had a number of hotels and resorts, which attracted visitors from all over the country.
Geography
Windsor Place is located in the northwest corner of Missouri, near the border with Iowa. The town is situated on the banks of the Mississippi River, and is surrounded by rolling hills and farmland. The town is located approximately 30 miles north of St. Louis.
The climate in Windsor Place is humid continental, with hot summers and cold winters. The average annual temperature is around 50 degrees Fahrenheit. The town receives an average of 40 inches of precipitation per year.
Economy
The economy of Windsor Place is largely based on agriculture and tourism. The town is home to several farms, which produce a variety of crops, including corn, soybeans, and wheat. The town also has a number of small businesses, including restaurants, shops, and hotels.
Tourism is an important part of the local economy. The town is home to several historic sites, including the Windsor Place Historic District, which is listed on the National Register of Historic Places. The town also has a number of parks and recreational areas, which attract visitors from all over the country.
Demographics
As of the 2010 census, the population of Windsor Place was 1,000 people. The town has a median household income of $45,000, and the median age is 38 years old. The town is predominantly white, with a small African American population. The town also has a small Hispanic population.
Windsor Place is a small town with a rich history and a vibrant economy. The town is home to a diverse population, and it is a popular tourist destination. The town is a great place to live, work, and visit.
Common Questions
What is the Total Population of Windsor Place?
Total Population of Windsor Place is 448.
What is the Total Male Population of Windsor Place?
Total Male Population of Windsor Place is 188.
What is the Total Female Population of Windsor Place?
Total Female Population of Windsor Place is 260.
What is the Ratio of Males per 100 Females in Windsor Place?
There are 72.31 Males per 100 Females in Windsor Place.
What is the Ratio of Females per 100 Males in Windsor Place?
There are 138.30 Females per 100 Males in Windsor Place.
What is the Median Population Age in Windsor Place?
Median Population Age in Windsor Place is 32.7 Years.
What is the Average Family Size in Windsor Place
Average Family Size in Windsor Place is 3.4 People.
What is the Average Household Size in Windsor Place
Average Household Size in Windsor Place is 2.9 People.
What is Per Capita Income in Windsor Place?
Per Capita income in Windsor Place is $31,260.
What is the Median Family Income in Windsor Place?
Median Family Income in Windsor Place is $110,114.
What is the Median Household income in Windsor Place?
Median Household Income in Windsor Place is $91,667.
What is Income or Wage Gap in Windsor Place?
Income or Wage Gap in Windsor Place is 25.3%.
Women in Windsor Place earn 74.7 cents for every dollar earned by a man.
What is Inequality or Gini Index in Windsor Place?
Inequality or Gini Index in Windsor Place is 0.31.
How Large is the Labor Force in Windsor Place?
There are 255 People in the Labor Forcein in Windsor Place.
What is the Percentage of People in the Labor Force in Windsor Place?
75.2% of People are in the Labor Force in Windsor Place.
What is the Unemployment Rate in Windsor Place?
Unemployment Rate in Windsor Place is 1.2%.