Miramiguoa Park, MO
Miramiguoa Park Map
Miramiguoa Park Overview
189
TOTAL POPULATION
103
MALE POPULATION
86
FEMALE POPULATION
119.77
MALES / 100 FEMALES
83.50
FEMALES / 100 MALES
43.9
MEDIAN AGE
3.3
AVG FAMILY SIZE
2.7
AVG HOUSEHOLD SIZE
$25,695
PER CAPITA INCOME
$80,592
AVG FAMILY INCOME
$80,066
AVG HOUSEHOLD INCOME
0.25
INEQUALITY / GINI INDEX
106
LABOR FORCE [ PEOPLE ]
65.4%
PERCENT IN LABOR FORCE
1.9%
UNEMPLOYMENT RATE
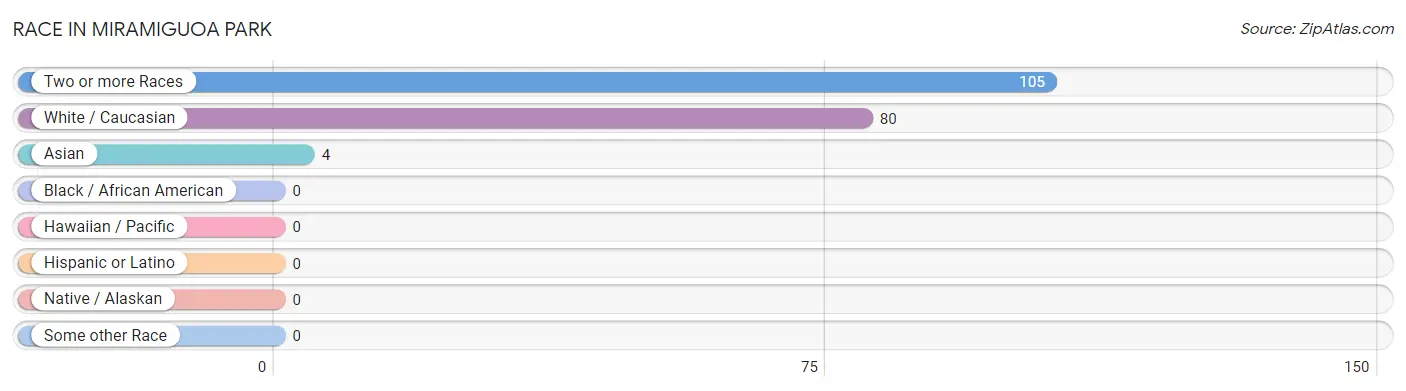
Race in Miramiguoa Park
The most populous races in Miramiguoa Park are Two or more Races (105 | 55.6%), White / Caucasian (80 | 42.3%), and Asian (4 | 2.1%).
| Race | # Population | % Population |
| Asian | 4 | 2.1% |
| Black / African American | 0 | 0.0% |
| Hawaiian / Pacific | 0 | 0.0% |
| Hispanic or Latino | 0 | 0.0% |
| Native / Alaskan | 0 | 0.0% |
| White / Caucasian | 80 | 42.3% |
| Two or more Races | 105 | 55.6% |
| Some other Race | 0 | 0.0% |
| Total | 189 | 100.0% |
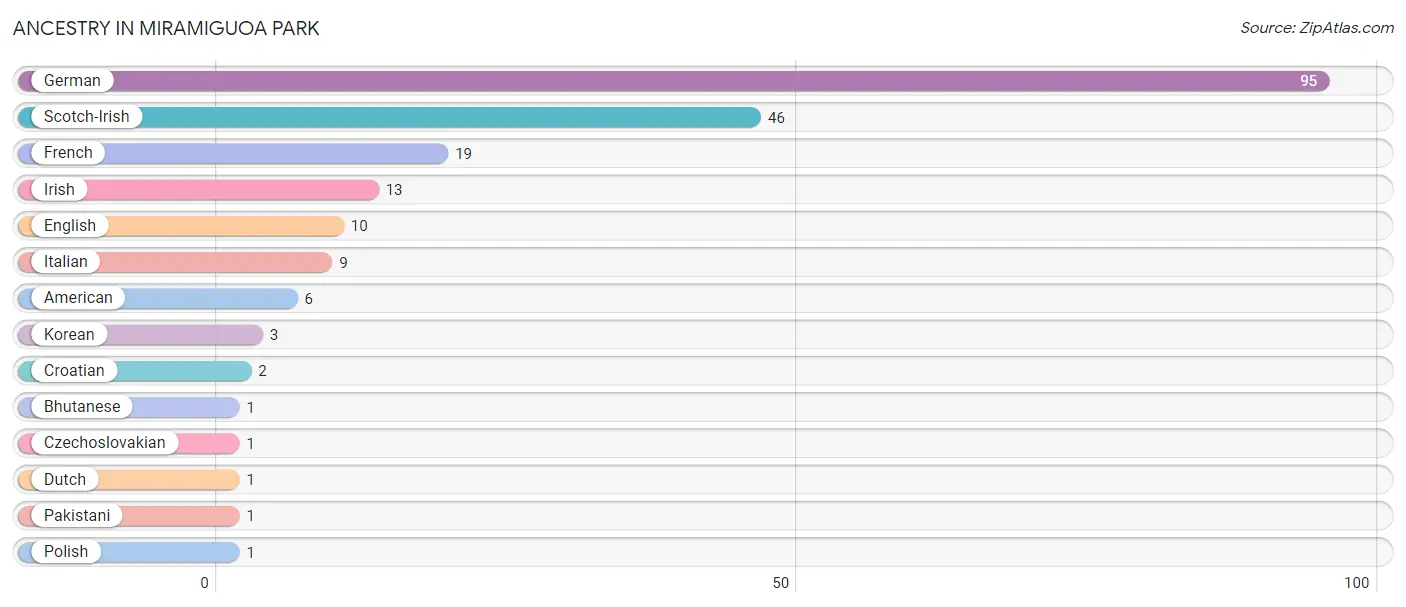
Ancestry in Miramiguoa Park
The most populous ancestries reported in Miramiguoa Park are German (95 | 50.3%), Scotch-Irish (46 | 24.3%), French (19 | 10.1%), Irish (13 | 6.9%), and English (10 | 5.3%), together accounting for 96.8% of all Miramiguoa Park residents.
| Ancestry | # Population | % Population |
| American | 6 | 3.2% |
| Bhutanese | 1 | 0.5% |
| Croatian | 2 | 1.1% |
| Czechoslovakian | 1 | 0.5% |
| Dutch | 1 | 0.5% |
| English | 10 | 5.3% |
| French | 19 | 10.1% |
| German | 95 | 50.3% |
| Irish | 13 | 6.9% |
| Italian | 9 | 4.8% |
| Korean | 3 | 1.6% |
| Pakistani | 1 | 0.5% |
| Polish | 1 | 0.5% |
| Scotch-Irish | 46 | 24.3% | View All 14 Rows |
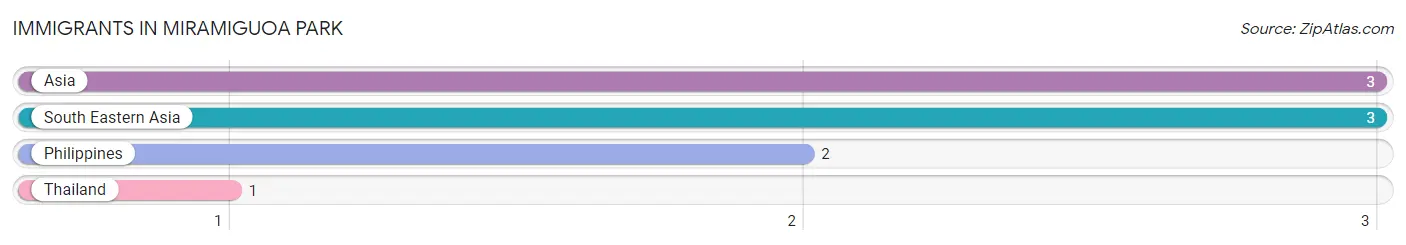
Immigrants in Miramiguoa Park
The most numerous immigrant groups reported in Miramiguoa Park came from Asia (3 | 1.6%), South Eastern Asia (3 | 1.6%), Philippines (2 | 1.1%), and Thailand (1 | 0.5%), together accounting for 4.8% of all Miramiguoa Park residents.
| Immigration Origin | # Population | % Population |
| Asia | 3 | 1.6% |
| Philippines | 2 | 1.1% |
| South Eastern Asia | 3 | 1.6% |
| Thailand | 1 | 0.5% | View All 4 Rows |
Sex and Age in Miramiguoa Park
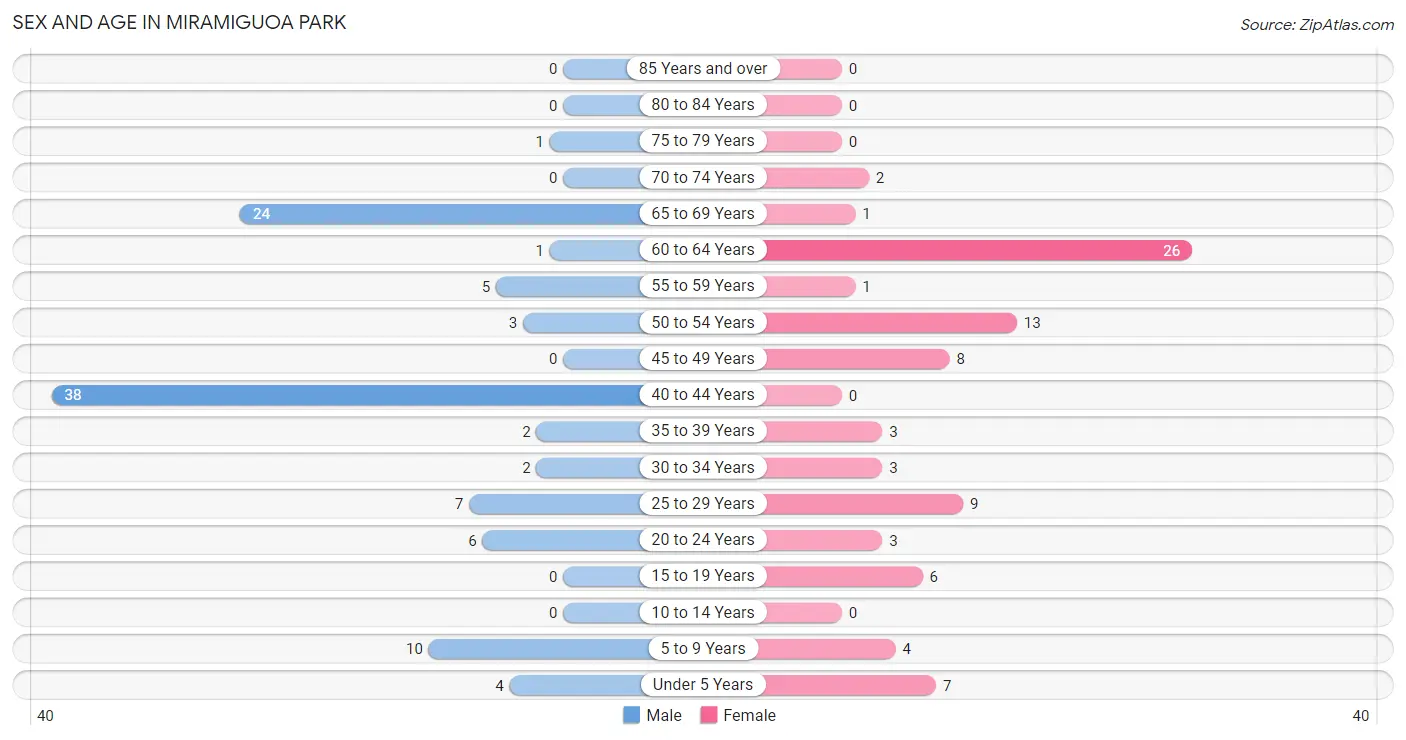
Sex and Age in Miramiguoa Park
The most populous age groups in Miramiguoa Park are 40 to 44 Years (38 | 36.9%) for men and 60 to 64 Years (26 | 30.2%) for women.
| Age Bracket | Male | Female |
| Under 5 Years | 4 (3.9%) | 7 (8.1%) |
| 5 to 9 Years | 10 (9.7%) | 4 (4.6%) |
| 10 to 14 Years | 0 (0.0%) | 0 (0.0%) |
| 15 to 19 Years | 0 (0.0%) | 6 (7.0%) |
| 20 to 24 Years | 6 (5.8%) | 3 (3.5%) |
| 25 to 29 Years | 7 (6.8%) | 9 (10.5%) |
| 30 to 34 Years | 2 (1.9%) | 3 (3.5%) |
| 35 to 39 Years | 2 (1.9%) | 3 (3.5%) |
| 40 to 44 Years | 38 (36.9%) | 0 (0.0%) |
| 45 to 49 Years | 0 (0.0%) | 8 (9.3%) |
| 50 to 54 Years | 3 (2.9%) | 13 (15.1%) |
| 55 to 59 Years | 5 (4.9%) | 1 (1.2%) |
| 60 to 64 Years | 1 (1.0%) | 26 (30.2%) |
| 65 to 69 Years | 24 (23.3%) | 1 (1.2%) |
| 70 to 74 Years | 0 (0.0%) | 2 (2.3%) |
| 75 to 79 Years | 1 (1.0%) | 0 (0.0%) |
| 80 to 84 Years | 0 (0.0%) | 0 (0.0%) |
| 85 Years and over | 0 (0.0%) | 0 (0.0%) |
| Total | 103 (100.0%) | 86 (100.0%) |
Families and Households in Miramiguoa Park
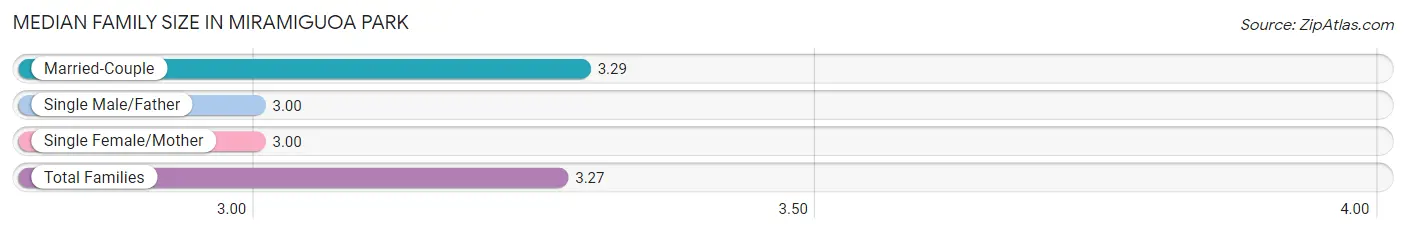
Median Family Size in Miramiguoa Park
The median family size in Miramiguoa Park is 3.27 persons per family, with married-couple families (49 | 96.1%) accounting for the largest median family size of 3.29 persons per family. On the other hand, single male/father families (1 | 2.0%) represent the smallest median family size with 3.00 persons per family.
| Family Type | # Families | Family Size |
| Married-Couple | 49 (96.1%) | 3.29 |
| Single Male/Father | 1 (2.0%) | 3.00 |
| Single Female/Mother | 1 (2.0%) | 3.00 |
| Total Families | 51 (100.0%) | 3.27 |
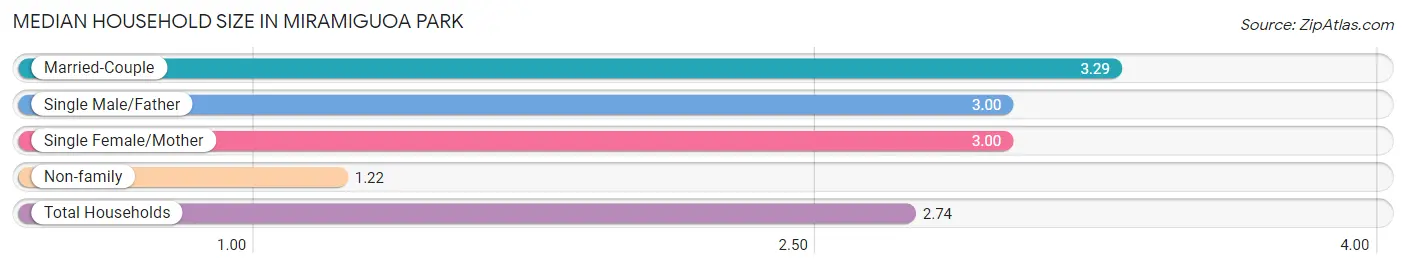
Median Household Size in Miramiguoa Park
The median household size in Miramiguoa Park is 2.74 persons per household, with married-couple households (49 | 71.0%) accounting for the largest median household size of 3.29 persons per household. non-family households (18 | 26.1%) represent the smallest median household size with 1.22 persons per household.
| Household Type | # Households | Household Size |
| Married-Couple | 49 (71.0%) | 3.29 |
| Single Male/Father | 1 (1.5%) | 3.00 |
| Single Female/Mother | 1 (1.5%) | 3.00 |
| Non-family | 18 (26.1%) | 1.22 |
| Total Households | 69 (100.0%) | 2.74 |
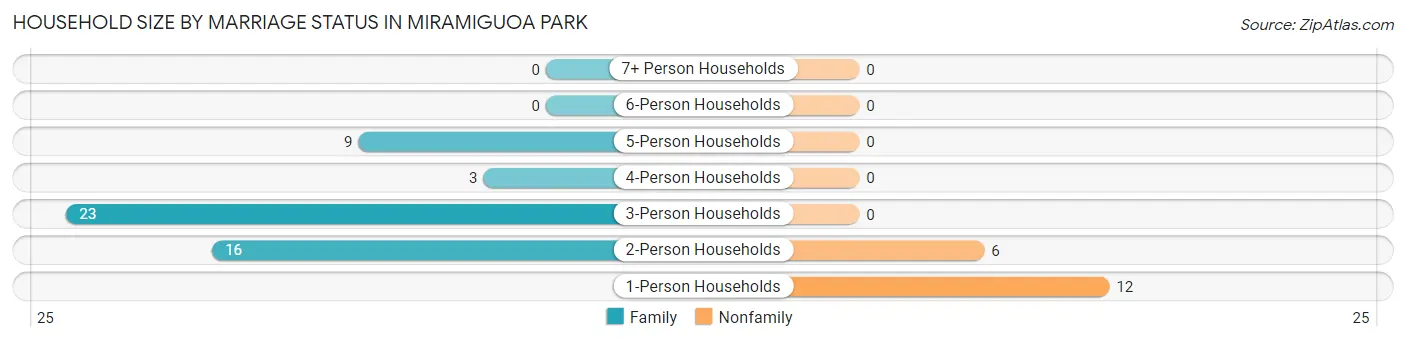
Household Size by Marriage Status in Miramiguoa Park
Out of a total of 69 households in Miramiguoa Park, 51 (73.9%) are family households, while 18 (26.1%) are nonfamily households. The most numerous type of family households are 3-person households, comprising 23, and the most common type of nonfamily households are 1-person households, comprising 12.
| Household Size | Family Households | Nonfamily Households |
| 1-Person Households | - | 12 (17.4%) |
| 2-Person Households | 16 (23.2%) | 6 (8.7%) |
| 3-Person Households | 23 (33.3%) | 0 (0.0%) |
| 4-Person Households | 3 (4.3%) | 0 (0.0%) |
| 5-Person Households | 9 (13.0%) | 0 (0.0%) |
| 6-Person Households | 0 (0.0%) | 0 (0.0%) |
| 7+ Person Households | 0 (0.0%) | 0 (0.0%) |
| Total | 51 (73.9%) | 18 (26.1%) |
Female Fertility in Miramiguoa Park
Fertility by Age in Miramiguoa Park
Average fertility rate in Miramiguoa Park is 175.0 births per 1,000 women. Women in the age bracket of 20 to 34 years have the highest fertility rate with 467.0 births per 1,000 women. Women in the age bracket of 20 to 34 years acount for 100.0% of all women with births.
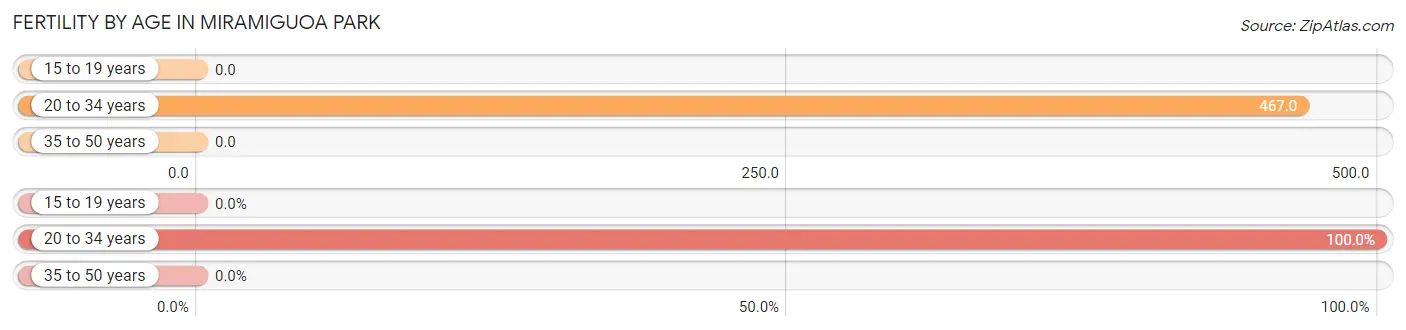
| Age Bracket | Women with Births | Births / 1,000 Women |
| 15 to 19 years | 0 (0.0%) | 0.0 |
| 20 to 34 years | 7 (100.0%) | 467.0 |
| 35 to 50 years | 0 (0.0%) | 0.0 |
| Total | 7 (100.0%) | 175.0 |
Fertility by Age by Marriage Status in Miramiguoa Park
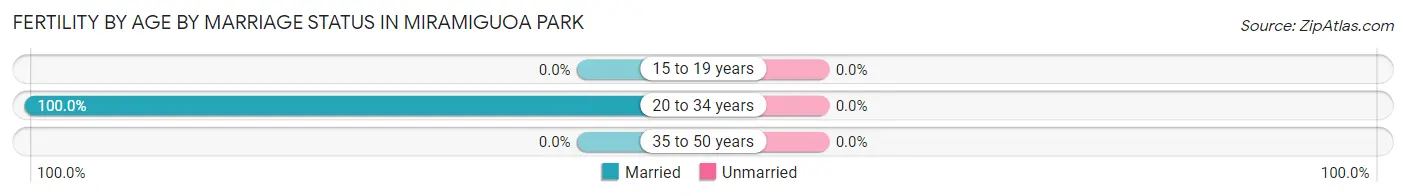
| Age Bracket | Married | Unmarried |
| 15 to 19 years | 0 (0.0%) | 0 (0.0%) |
| 20 to 34 years | 7 (100.0%) | 0 (0.0%) |
| 35 to 50 years | 0 (0.0%) | 0 (0.0%) |
| Total | 7 (100.0%) | 0 (0.0%) |
Fertility by Education in Miramiguoa Park
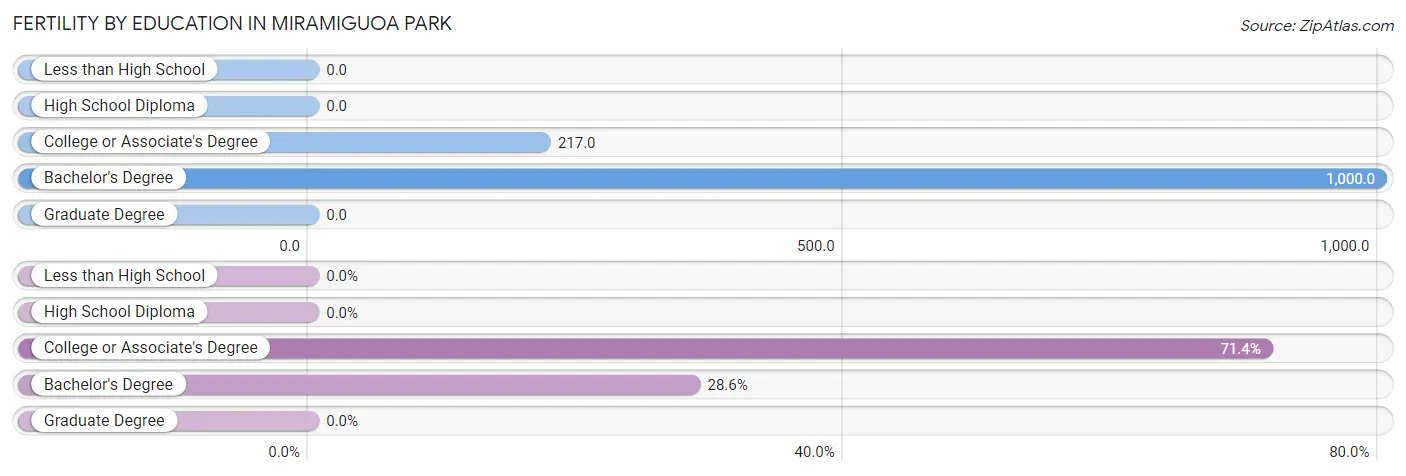
| Educational Attainment | Women with Births | Births / 1,000 Women |
| Less than High School | 0 (0.0%) | 0.0 |
| High School Diploma | 0 (0.0%) | 0.0 |
| College or Associate's Degree | 5 (71.4%) | 217.0 |
| Bachelor's Degree | 2 (28.6%) | 1,000.0 |
| Graduate Degree | 0 (0.0%) | 0.0 |
| Total | 7 (100.0%) | 175.0 |
Fertility by Education by Marriage Status in Miramiguoa Park
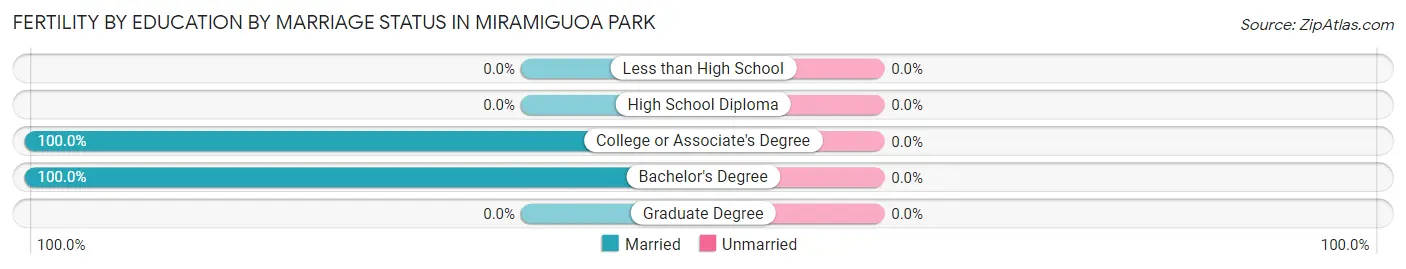
| Educational Attainment | Married | Unmarried |
| Less than High School | 0 (0.0%) | 0 (0.0%) |
| High School Diploma | 0 (0.0%) | 0 (0.0%) |
| College or Associate's Degree | 5 (100.0%) | 0 (0.0%) |
| Bachelor's Degree | 2 (100.0%) | 0 (0.0%) |
| Graduate Degree | 0 (0.0%) | 0 (0.0%) |
| Total | 7 (100.0%) | 0 (0.0%) |
Income in Miramiguoa Park
Income Overview in Miramiguoa Park
Per Capita Income in Miramiguoa Park is $25,695, while median incomes of families and households are $80,592 and $80,066 respectively.
| Characteristic | Number | Measure |
| Per Capita Income | 189 | $25,695 |
| Median Family Income | 51 | $80,592 |
| Mean Family Income | 51 | $74,018 |
| Median Household Income | 69 | $80,066 |
| Mean Household Income | 69 | $69,357 |
| Income Deficit | 51 | $0 |
| Wage / Income Gap (%) | 189 | 0.00% |
| Wage / Income Gap ($) | 189 | 100.00¢ per $1 |
| Gini / Inequality Index | 189 | 0.25 |
Earnings by Sex in Miramiguoa Park
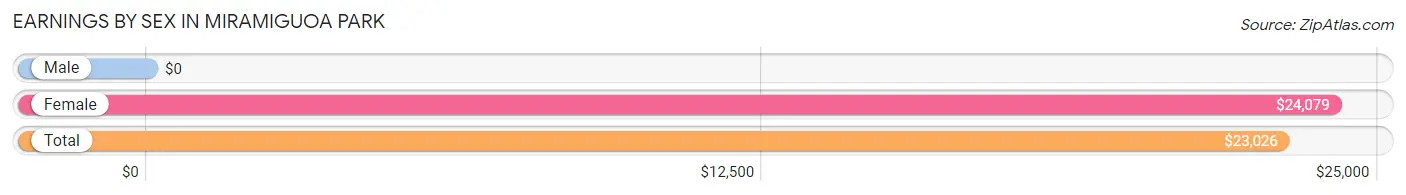
| Sex | Number | Average Earnings |
| Male | 76 (62.3%) | $0 |
| Female | 46 (37.7%) | $24,079 |
| Total | 122 (100.0%) | $23,026 |
Earnings by Sex by Income Bracket in Miramiguoa Park
The most common earnings brackets in Miramiguoa Park are $17,500 to $19,999 for men (29 | 38.2%) and $22,500 to $24,999 for women (19 | 41.3%).
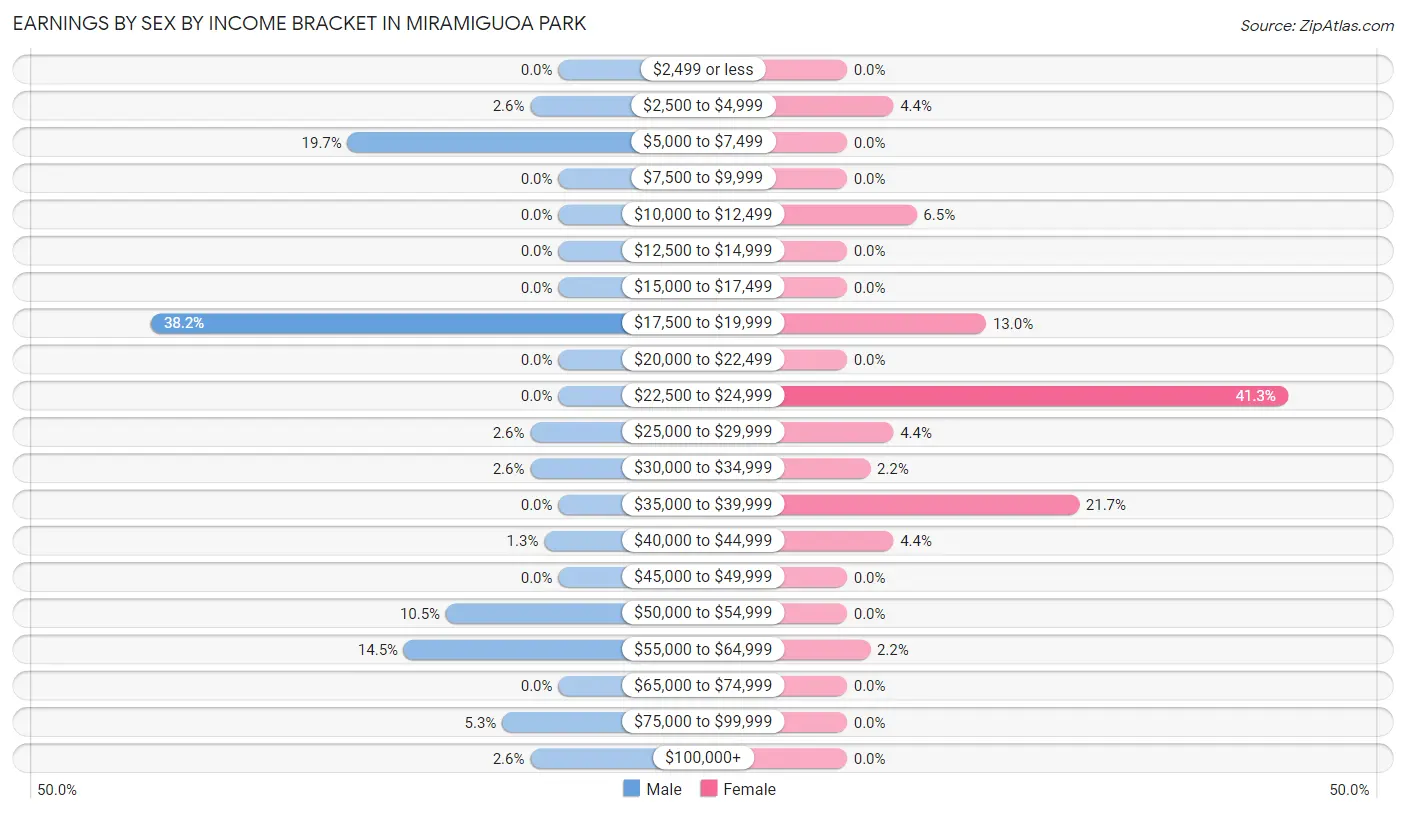
| Income | Male | Female |
| $2,499 or less | 0 (0.0%) | 0 (0.0%) |
| $2,500 to $4,999 | 2 (2.6%) | 2 (4.3%) |
| $5,000 to $7,499 | 15 (19.7%) | 0 (0.0%) |
| $7,500 to $9,999 | 0 (0.0%) | 0 (0.0%) |
| $10,000 to $12,499 | 0 (0.0%) | 3 (6.5%) |
| $12,500 to $14,999 | 0 (0.0%) | 0 (0.0%) |
| $15,000 to $17,499 | 0 (0.0%) | 0 (0.0%) |
| $17,500 to $19,999 | 29 (38.2%) | 6 (13.0%) |
| $20,000 to $22,499 | 0 (0.0%) | 0 (0.0%) |
| $22,500 to $24,999 | 0 (0.0%) | 19 (41.3%) |
| $25,000 to $29,999 | 2 (2.6%) | 2 (4.3%) |
| $30,000 to $34,999 | 2 (2.6%) | 1 (2.2%) |
| $35,000 to $39,999 | 0 (0.0%) | 10 (21.7%) |
| $40,000 to $44,999 | 1 (1.3%) | 2 (4.3%) |
| $45,000 to $49,999 | 0 (0.0%) | 0 (0.0%) |
| $50,000 to $54,999 | 8 (10.5%) | 0 (0.0%) |
| $55,000 to $64,999 | 11 (14.5%) | 1 (2.2%) |
| $65,000 to $74,999 | 0 (0.0%) | 0 (0.0%) |
| $75,000 to $99,999 | 4 (5.3%) | 0 (0.0%) |
| $100,000+ | 2 (2.6%) | 0 (0.0%) |
| Total | 76 (100.0%) | 46 (100.0%) |
Earnings by Sex by Educational Attainment in Miramiguoa Park
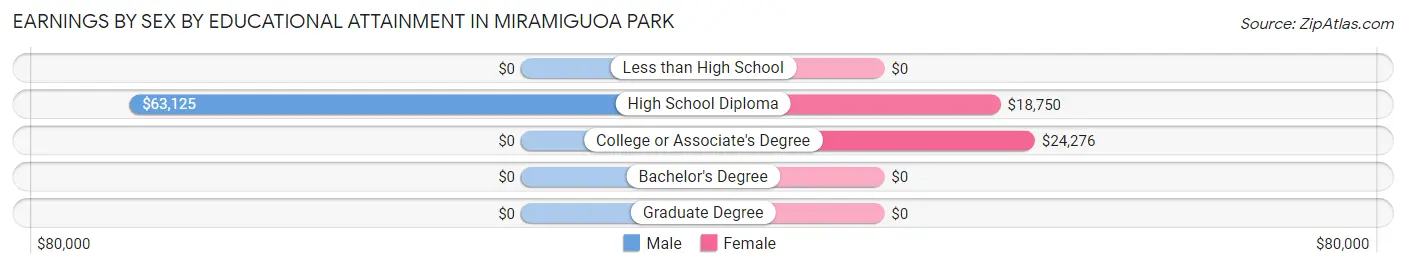
| Educational Attainment | Male Income | Female Income |
| Less than High School | - | - |
| High School Diploma | $63,125 | $18,750 |
| College or Associate's Degree | - | - |
| Bachelor's Degree | - | - |
| Graduate Degree | - | - |
| Total | - | - |
Family Income in Miramiguoa Park
Family Income Brackets in Miramiguoa Park
According to the Miramiguoa Park family income data, there are 26 families falling into the $75,000 to $99,999 income range, which is the most common income bracket and makes up 51.0% of all families.
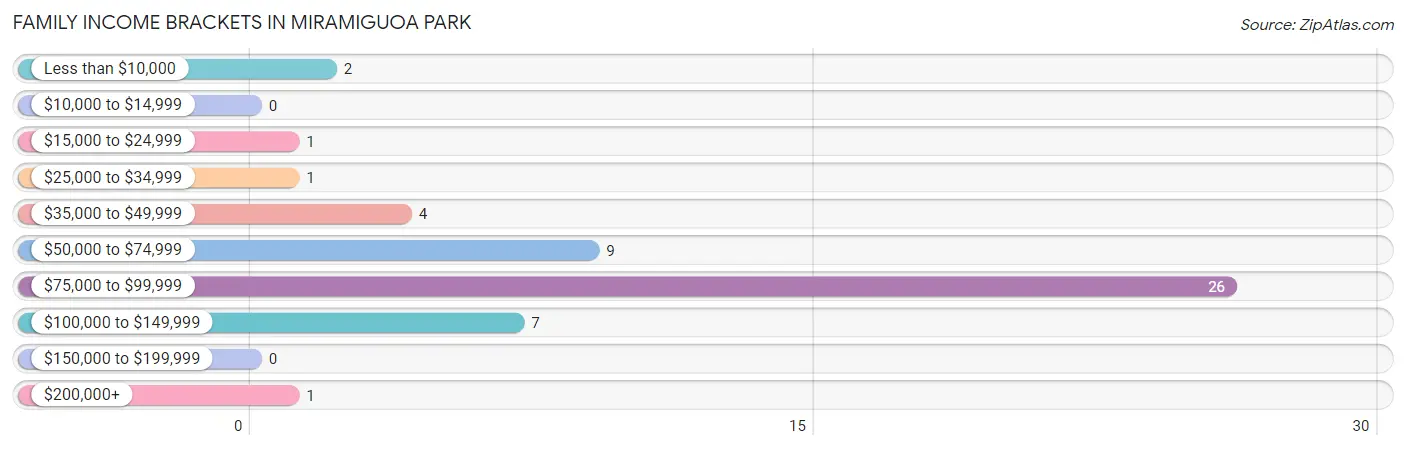
| Income Bracket | # Families | % Families |
| Less than $10,000 | 2 | 3.9% |
| $10,000 to $14,999 | 0 | 0.0% |
| $15,000 to $24,999 | 1 | 2.0% |
| $25,000 to $34,999 | 1 | 2.0% |
| $35,000 to $49,999 | 4 | 7.8% |
| $50,000 to $74,999 | 9 | 17.6% |
| $75,000 to $99,999 | 26 | 51.0% |
| $100,000 to $149,999 | 7 | 13.7% |
| $150,000 to $199,999 | 0 | 0.0% |
| $200,000+ | 1 | 2.0% |
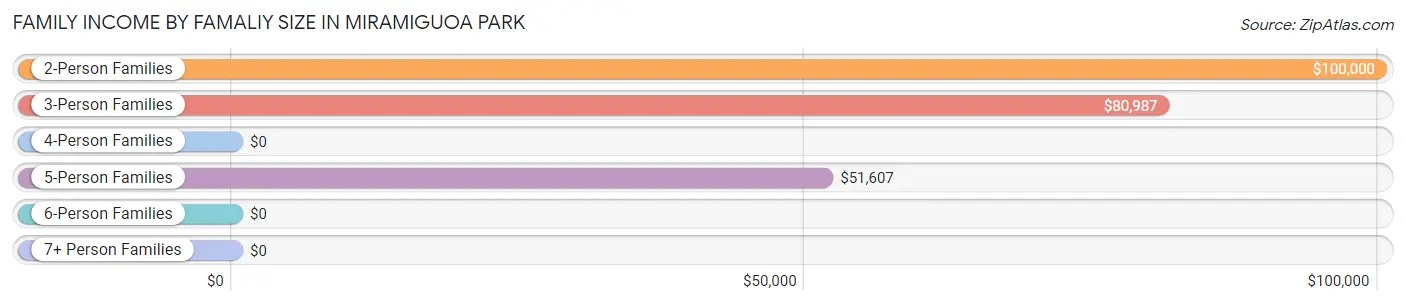
Family Income by Famaliy Size in Miramiguoa Park
2-person families (16 | 31.4%) account for the highest median family income in Miramiguoa Park with $100,000 per family, while 2-person families (16 | 31.4%) have the highest median income of $50,000 per family member.
| Income Bracket | # Families | Median Income |
| 2-Person Families | 16 (31.4%) | $100,000 |
| 3-Person Families | 23 (45.1%) | $80,987 |
| 4-Person Families | 3 (5.9%) | $0 |
| 5-Person Families | 9 (17.6%) | $51,607 |
| 6-Person Families | 0 (0.0%) | $0 |
| 7+ Person Families | 0 (0.0%) | $0 |
| Total | 51 (100.0%) | $80,592 |
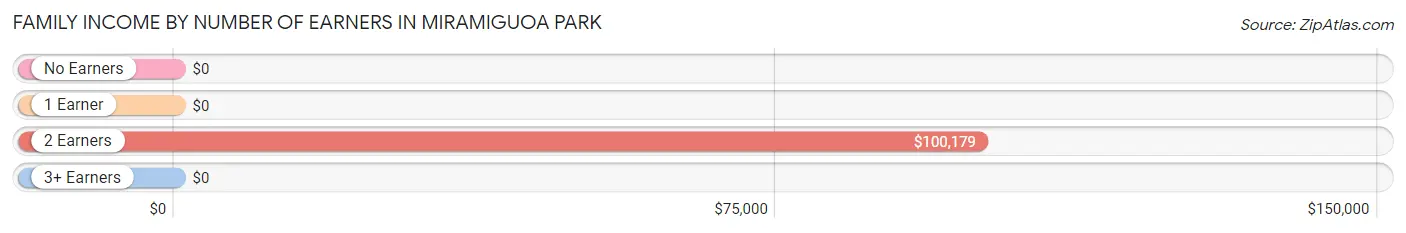
Family Income by Number of Earners in Miramiguoa Park
| Number of Earners | # Families | Median Income |
| No Earners | 6 (11.8%) | $0 |
| 1 Earner | 11 (21.6%) | $0 |
| 2 Earners | 15 (29.4%) | $100,179 |
| 3+ Earners | 19 (37.2%) | $0 |
| Total | 51 (100.0%) | $80,592 |
Household Income in Miramiguoa Park
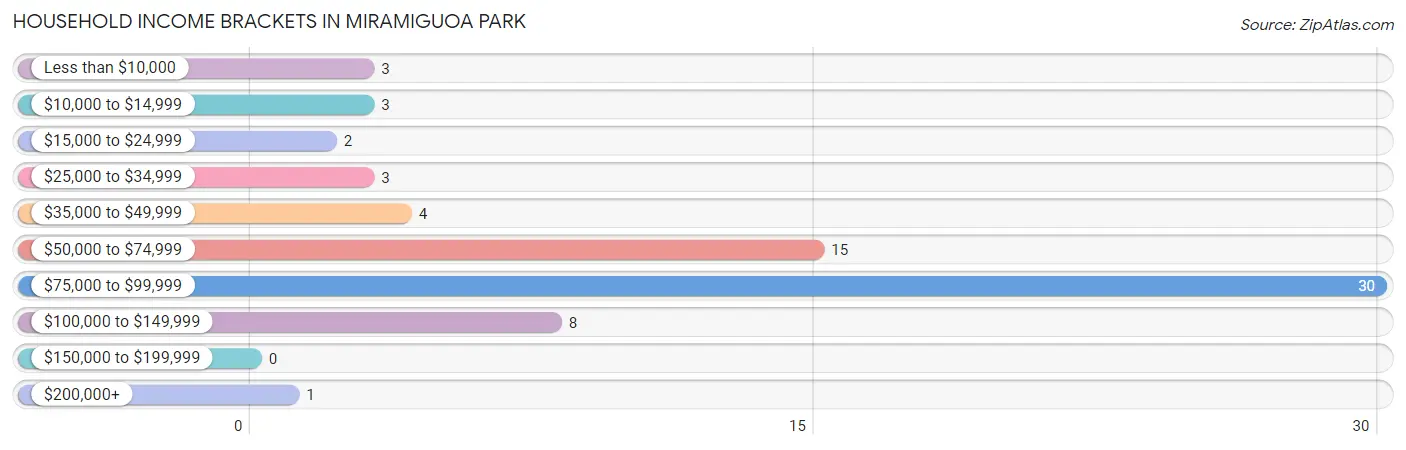
Household Income Brackets in Miramiguoa Park
With 30 households falling in the category, the $75,000 to $99,999 income range is the most frequent in Miramiguoa Park, accounting for 43.5% of all households.
| Income Bracket | # Households | % Households |
| Less than $10,000 | 3 | 4.3% |
| $10,000 to $14,999 | 3 | 4.3% |
| $15,000 to $24,999 | 2 | 2.9% |
| $25,000 to $34,999 | 3 | 4.3% |
| $35,000 to $49,999 | 4 | 5.8% |
| $50,000 to $74,999 | 15 | 21.7% |
| $75,000 to $99,999 | 30 | 43.5% |
| $100,000 to $149,999 | 8 | 11.6% |
| $150,000 to $199,999 | 0 | 0.0% |
| $200,000+ | 1 | 1.4% |
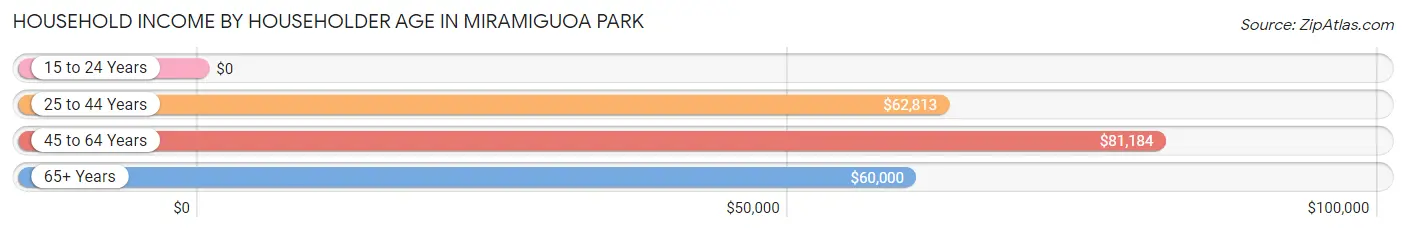
Household Income by Householder Age in Miramiguoa Park
The median household income in Miramiguoa Park is $80,066, with the highest median household income of $81,184 found in the 45 to 64 years age bracket for the primary householder. A total of 34 households (49.3%) fall into this category.
| Income Bracket | # Households | Median Income |
| 15 to 24 Years | 0 (0.0%) | $0 |
| 25 to 44 Years | 25 (36.2%) | $62,813 |
| 45 to 64 Years | 34 (49.3%) | $81,184 |
| 65+ Years | 10 (14.5%) | $60,000 |
| Total | 69 (100.0%) | $80,066 |
Poverty in Miramiguoa Park
Income Below Poverty by Sex and Age in Miramiguoa Park
With 3.9% poverty level for males and 8.1% for females among the residents of Miramiguoa Park, 65 to 74 year old males and 65 to 74 year old females are the most vulnerable to poverty, with 4 males (16.7%) and 1 females (33.3%) in their respective age groups living below the poverty level.
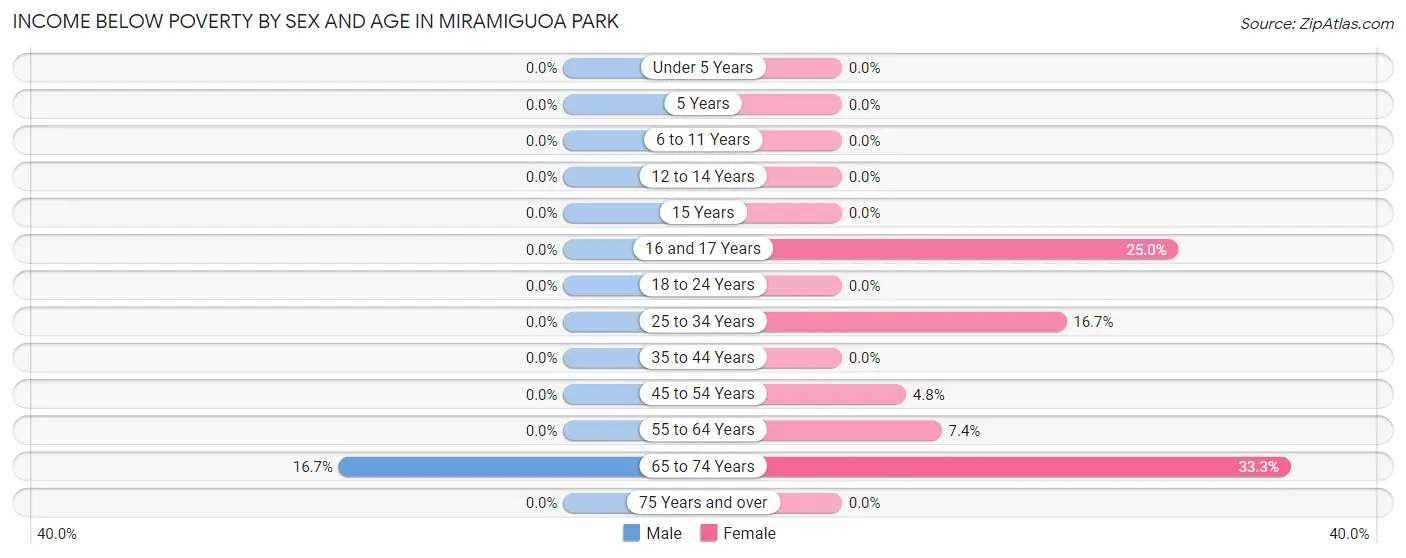
| Age Bracket | Male | Female |
| Under 5 Years | 0 (0.0%) | 0 (0.0%) |
| 5 Years | 0 (0.0%) | 0 (0.0%) |
| 6 to 11 Years | 0 (0.0%) | 0 (0.0%) |
| 12 to 14 Years | 0 (0.0%) | 0 (0.0%) |
| 15 Years | 0 (0.0%) | 0 (0.0%) |
| 16 and 17 Years | 0 (0.0%) | 1 (25.0%) |
| 18 to 24 Years | 0 (0.0%) | 0 (0.0%) |
| 25 to 34 Years | 0 (0.0%) | 2 (16.7%) |
| 35 to 44 Years | 0 (0.0%) | 0 (0.0%) |
| 45 to 54 Years | 0 (0.0%) | 1 (4.8%) |
| 55 to 64 Years | 0 (0.0%) | 2 (7.4%) |
| 65 to 74 Years | 4 (16.7%) | 1 (33.3%) |
| 75 Years and over | 0 (0.0%) | 0 (0.0%) |
| Total | 4 (3.9%) | 7 (8.1%) |
Income Above Poverty by Sex and Age in Miramiguoa Park
According to the poverty statistics in Miramiguoa Park, males aged under 5 years and females aged under 5 years are the age groups that are most secure financially, with 100.0% of males and 100.0% of females in these age groups living above the poverty line.
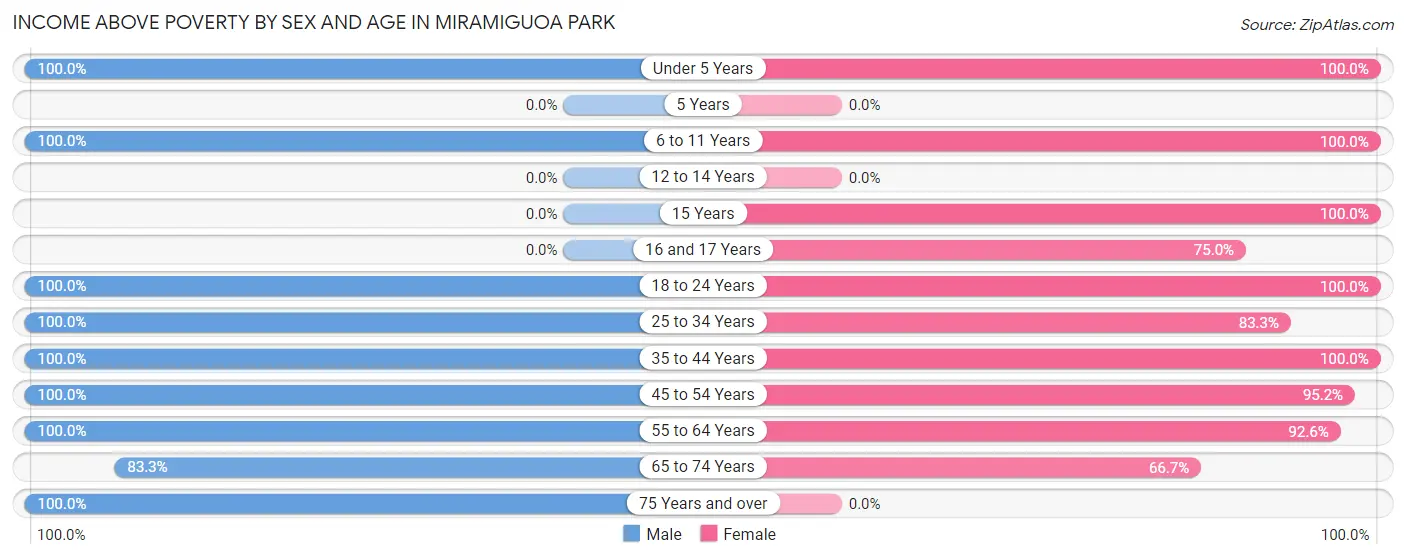
| Age Bracket | Male | Female |
| Under 5 Years | 4 (100.0%) | 7 (100.0%) |
| 5 Years | 0 (0.0%) | 0 (0.0%) |
| 6 to 11 Years | 10 (100.0%) | 4 (100.0%) |
| 12 to 14 Years | 0 (0.0%) | 0 (0.0%) |
| 15 Years | 0 (0.0%) | 2 (100.0%) |
| 16 and 17 Years | 0 (0.0%) | 3 (75.0%) |
| 18 to 24 Years | 6 (100.0%) | 3 (100.0%) |
| 25 to 34 Years | 9 (100.0%) | 10 (83.3%) |
| 35 to 44 Years | 40 (100.0%) | 3 (100.0%) |
| 45 to 54 Years | 3 (100.0%) | 20 (95.2%) |
| 55 to 64 Years | 6 (100.0%) | 25 (92.6%) |
| 65 to 74 Years | 20 (83.3%) | 2 (66.7%) |
| 75 Years and over | 1 (100.0%) | 0 (0.0%) |
| Total | 99 (96.1%) | 79 (91.9%) |
Income Below Poverty Among Married-Couple Families in Miramiguoa Park
The poverty statistics for married-couple families in Miramiguoa Park show that 4.1% or 2 of the total 49 families live below the poverty line. Families with no children have the highest poverty rate of 5.6%, comprising of 2 families. On the other hand, families with 1 or 2 children have the lowest poverty rate of 0.0%, which includes 0 families.
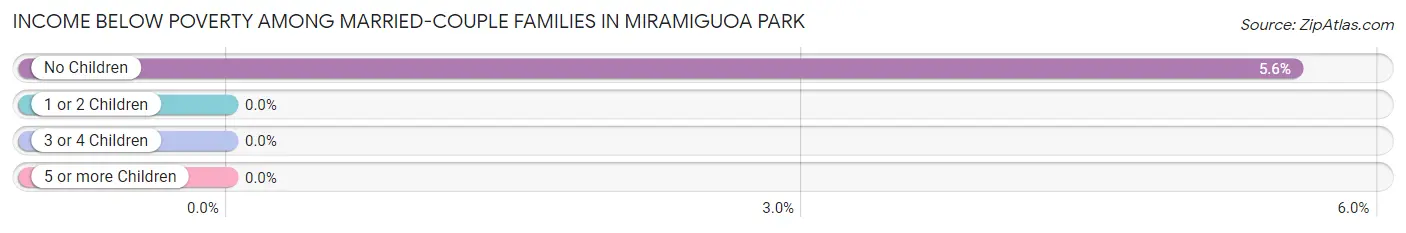
| Children | Above Poverty | Below Poverty |
| No Children | 34 (94.4%) | 2 (5.6%) |
| 1 or 2 Children | 6 (100.0%) | 0 (0.0%) |
| 3 or 4 Children | 7 (100.0%) | 0 (0.0%) |
| 5 or more Children | 0 (0.0%) | 0 (0.0%) |
| Total | 47 (95.9%) | 2 (4.1%) |
Income Below Poverty Among Single-Parent Households in Miramiguoa Park
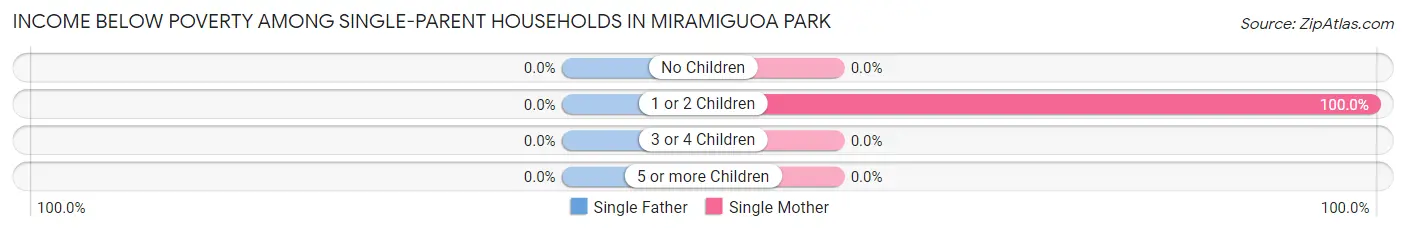
| Children | Single Father | Single Mother |
| No Children | 0 (0.0%) | 0 (0.0%) |
| 1 or 2 Children | 0 (0.0%) | 1 (100.0%) |
| 3 or 4 Children | 0 (0.0%) | 0 (0.0%) |
| 5 or more Children | 0 (0.0%) | 0 (0.0%) |
| Total | 0 (0.0%) | 1 (100.0%) |
Income Below Poverty Among Married-Couple vs Single-Parent Households in Miramiguoa Park
The poverty data for Miramiguoa Park shows that 2 of the married-couple family households (4.1%) and 1 of the single-parent households (50.0%) are living below the poverty level. Within the married-couple family households, those with no children have the highest poverty rate, with 2 households (5.6%) falling below the poverty line. Among the single-parent households, those with 1 or 2 children have the highest poverty rate, with 1 household (50.0%) living below poverty.
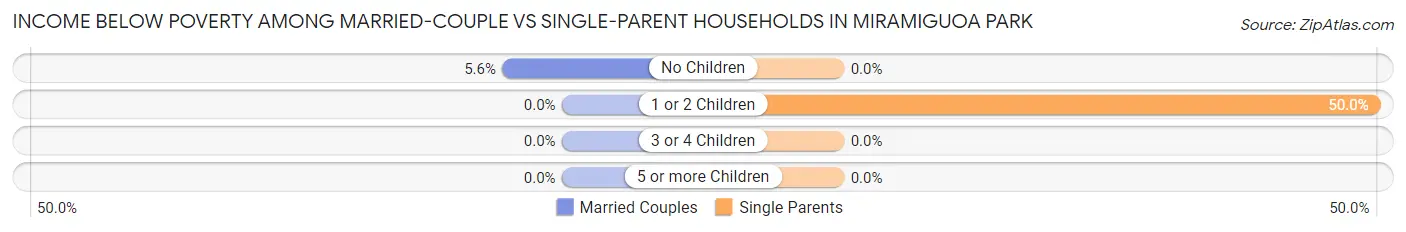
| Children | Married-Couple Families | Single-Parent Households |
| No Children | 2 (5.6%) | 0 (0.0%) |
| 1 or 2 Children | 0 (0.0%) | 1 (50.0%) |
| 3 or 4 Children | 0 (0.0%) | 0 (0.0%) |
| 5 or more Children | 0 (0.0%) | 0 (0.0%) |
| Total | 2 (4.1%) | 1 (50.0%) |
Employment Characteristics in Miramiguoa Park
Employment by Class of Employer in Miramiguoa Park
Among the 104 employed individuals in Miramiguoa Park, private company employees (76 | 73.1%), not-for-profit organizations (19 | 18.3%), and self-employed (not incorporated) (3 | 2.9%) make up the most common classes of employment.
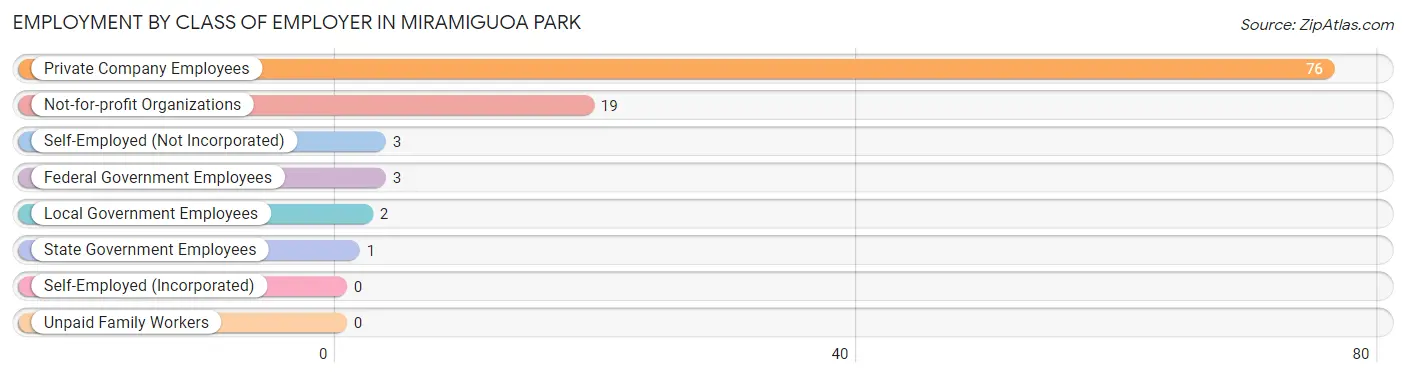
| Employer Class | # Employees | % Employees |
| Private Company Employees | 76 | 73.1% |
| Self-Employed (Incorporated) | 0 | 0.0% |
| Self-Employed (Not Incorporated) | 3 | 2.9% |
| Not-for-profit Organizations | 19 | 18.3% |
| Local Government Employees | 2 | 1.9% |
| State Government Employees | 1 | 1.0% |
| Federal Government Employees | 3 | 2.9% |
| Unpaid Family Workers | 0 | 0.0% |
| Total | 104 | 100.0% |
Employment Status by Age in Miramiguoa Park
According to the labor force statistics for Miramiguoa Park, out of the total population over 16 years of age (162), 65.4% or 106 individuals are in the labor force, with 1.9% or 2 of them unemployed. The age group with the highest labor force participation rate is 20 to 24 years, with 100.0% or 9 individuals in the labor force. Within the labor force, the 60 to 64 years age range has the highest percentage of unemployed individuals, with 9.1% or 2 of them being unemployed.
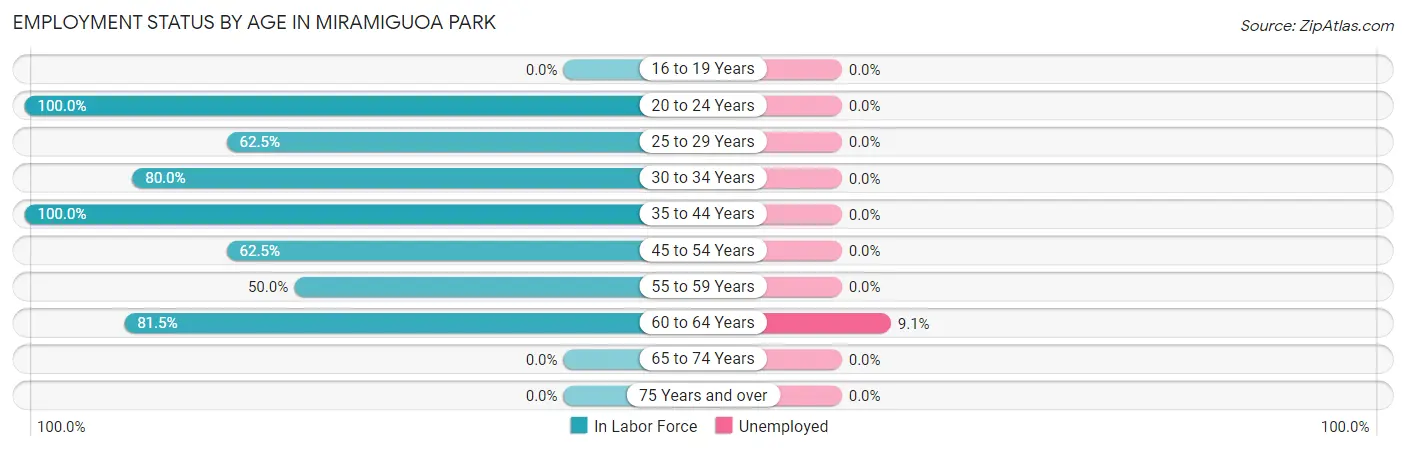
| Age Bracket | In Labor Force | Unemployed |
| 16 to 19 Years | 0 (0.0%) | 0 (0.0%) |
| 20 to 24 Years | 9 (100.0%) | 0 (0.0%) |
| 25 to 29 Years | 10 (62.5%) | 0 (0.0%) |
| 30 to 34 Years | 4 (80.0%) | 0 (0.0%) |
| 35 to 44 Years | 43 (100.0%) | 0 (0.0%) |
| 45 to 54 Years | 15 (62.5%) | 0 (0.0%) |
| 55 to 59 Years | 3 (50.0%) | 0 (0.0%) |
| 60 to 64 Years | 22 (81.5%) | 2 (9.1%) |
| 65 to 74 Years | 0 (0.0%) | 0 (0.0%) |
| 75 Years and over | 0 (0.0%) | 0 (0.0%) |
| Total | 106 (65.4%) | 2 (1.9%) |
Employment Status by Educational Attainment in Miramiguoa Park
According to labor force statistics for Miramiguoa Park, 80.2% of individuals (97) out of the total population between 25 and 64 years of age (121) are in the labor force, with 2.1% or 2 of them being unemployed. The group with the highest labor force participation rate are those with the educational attainment of bachelor's degree or higher, with 100.0% or 34 individuals in the labor force. Within the labor force, individuals with high school diploma education have the highest percentage of unemployment, with 13.3% or 2 of them being unemployed.
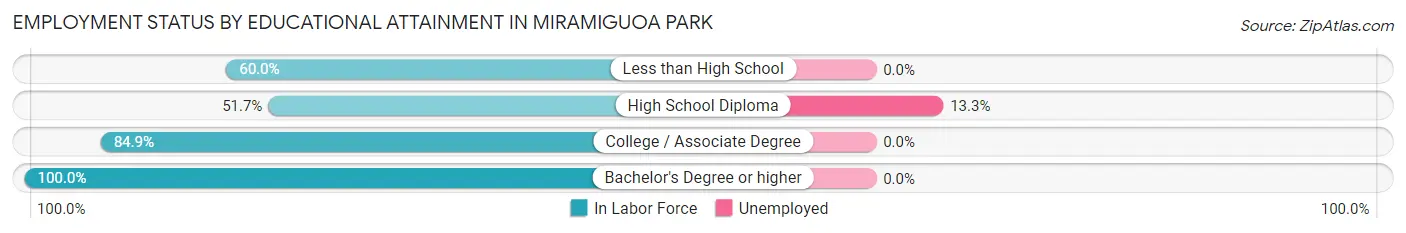
| Educational Attainment | In Labor Force | Unemployed |
| Less than High School | 3 (60.0%) | 0 (0.0%) |
| High School Diploma | 15 (51.7%) | 4 (13.3%) |
| College / Associate Degree | 45 (84.9%) | 0 (0.0%) |
| Bachelor's Degree or higher | 34 (100.0%) | 0 (0.0%) |
| Total | 97 (80.2%) | 3 (2.1%) |
Employment Occupations by Sex in Miramiguoa Park
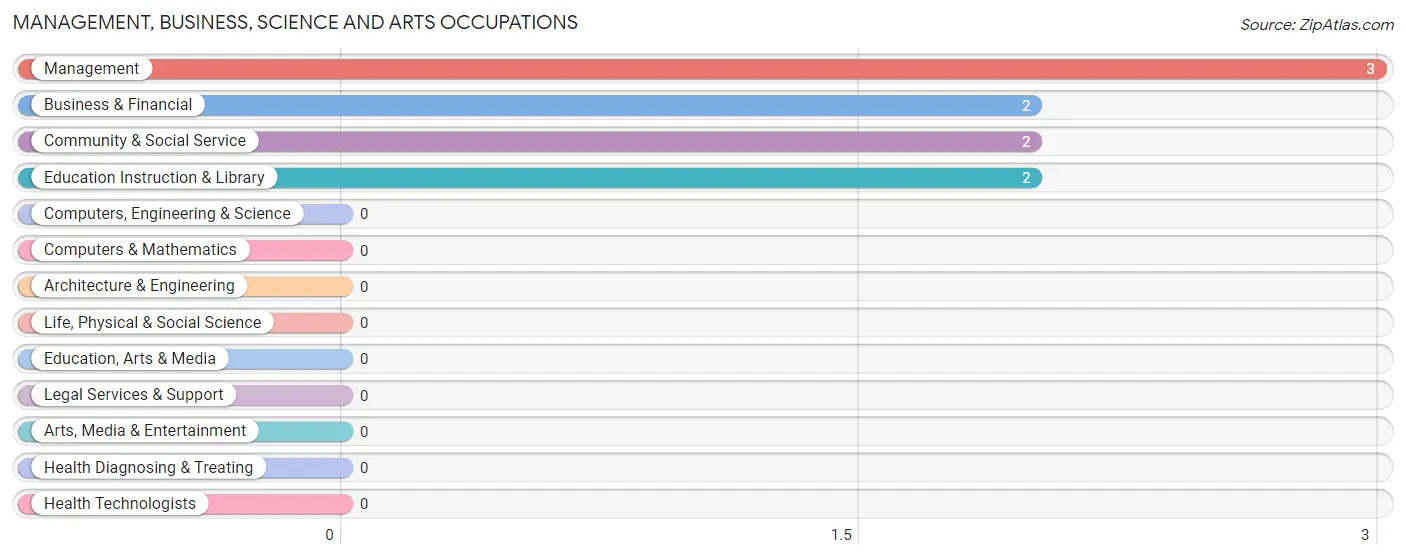
Management, Business, Science and Arts Occupations
The most common Management, Business, Science and Arts occupations in Miramiguoa Park are Management (3 | 2.9%), Business & Financial (2 | 1.9%), Community & Social Service (2 | 1.9%), and Education Instruction & Library (2 | 1.9%).
Management, Business, Science and Arts Occupations by Sex
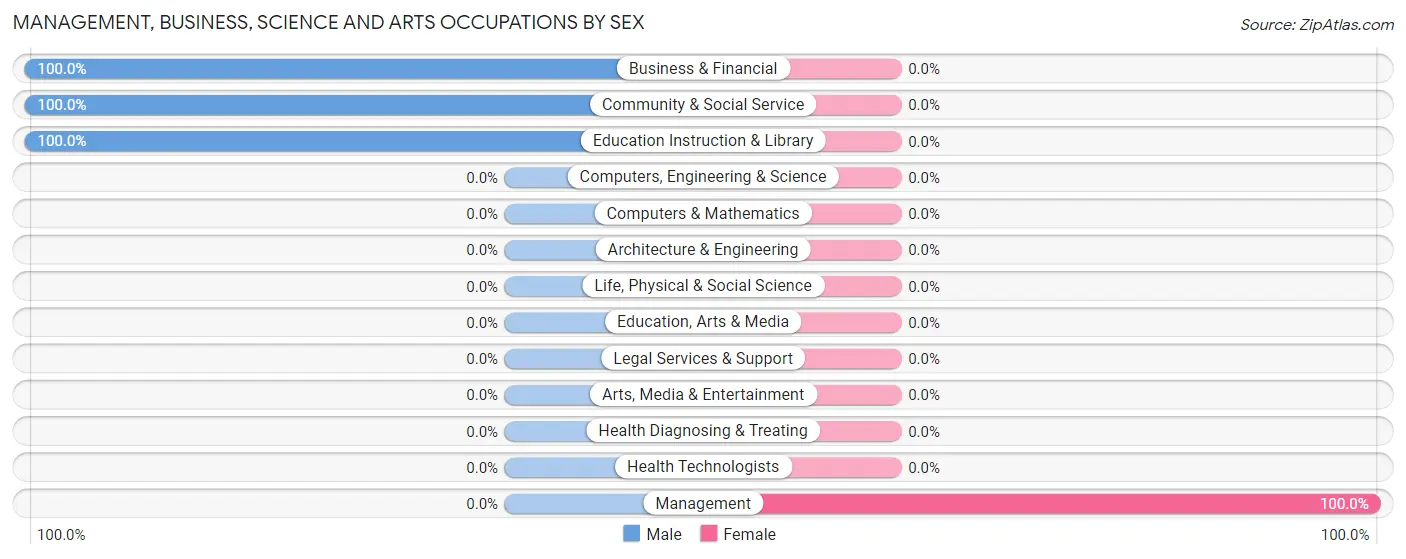
| Occupation | Male | Female |
| Management | 0 (0.0%) | 3 (100.0%) |
| Business & Financial | 2 (100.0%) | 0 (0.0%) |
| Computers, Engineering & Science | 0 (0.0%) | 0 (0.0%) |
| Computers & Mathematics | 0 (0.0%) | 0 (0.0%) |
| Architecture & Engineering | 0 (0.0%) | 0 (0.0%) |
| Life, Physical & Social Science | 0 (0.0%) | 0 (0.0%) |
| Community & Social Service | 2 (100.0%) | 0 (0.0%) |
| Education, Arts & Media | 0 (0.0%) | 0 (0.0%) |
| Legal Services & Support | 0 (0.0%) | 0 (0.0%) |
| Education Instruction & Library | 2 (100.0%) | 0 (0.0%) |
| Arts, Media & Entertainment | 0 (0.0%) | 0 (0.0%) |
| Health Diagnosing & Treating | 0 (0.0%) | 0 (0.0%) |
| Health Technologists | 0 (0.0%) | 0 (0.0%) |
| Total (Category) | 4 (57.1%) | 3 (42.9%) |
| Total (Overall) | 61 (58.7%) | 43 (41.3%) |
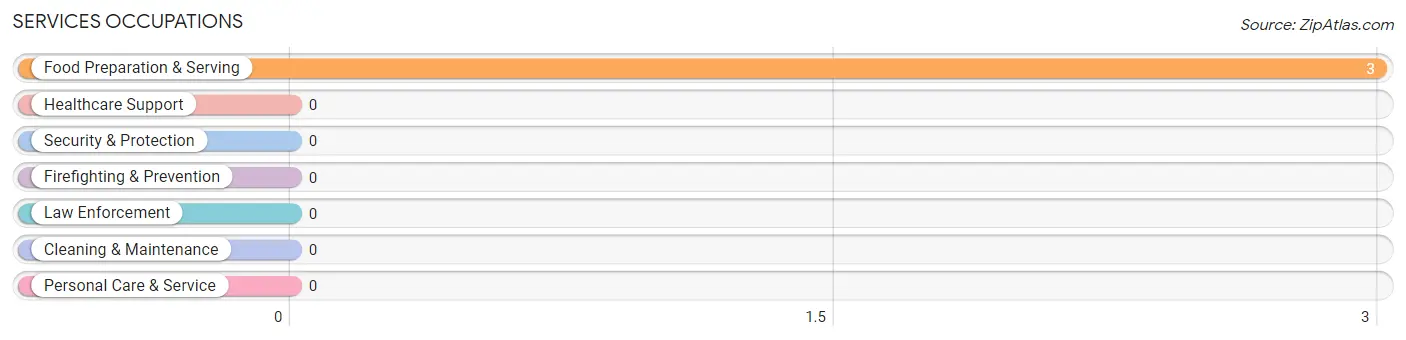
Services Occupations
The most common Services occupations in Miramiguoa Park are , and Food Preparation & Serving (3 | 2.9%).
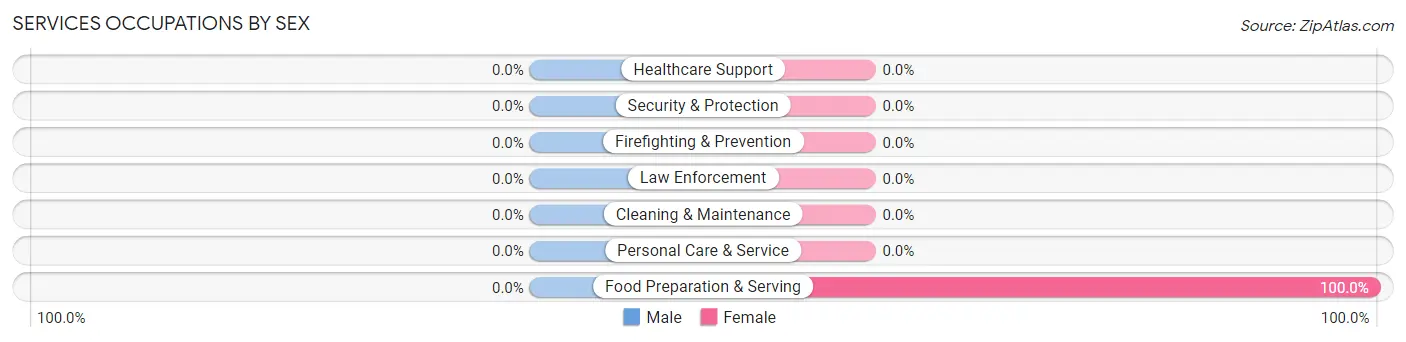
Services Occupations by Sex
| Occupation | Male | Female |
| Healthcare Support | 0 (0.0%) | 0 (0.0%) |
| Security & Protection | 0 (0.0%) | 0 (0.0%) |
| Firefighting & Prevention | 0 (0.0%) | 0 (0.0%) |
| Law Enforcement | 0 (0.0%) | 0 (0.0%) |
| Food Preparation & Serving | 0 (0.0%) | 3 (100.0%) |
| Cleaning & Maintenance | 0 (0.0%) | 0 (0.0%) |
| Personal Care & Service | 0 (0.0%) | 0 (0.0%) |
| Total (Category) | 0 (0.0%) | 3 (100.0%) |
| Total (Overall) | 61 (58.7%) | 43 (41.3%) |
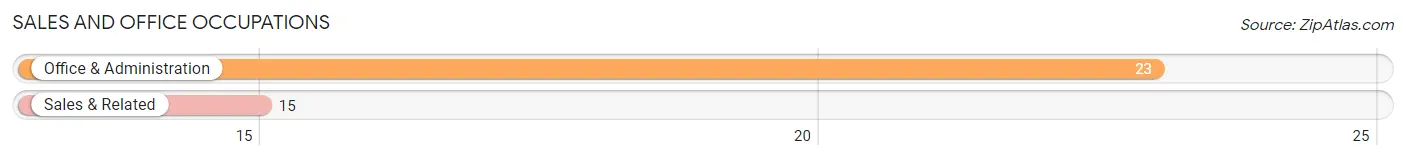
Sales and Office Occupations
The most common Sales and Office occupations in Miramiguoa Park are Office & Administration (23 | 22.1%), and Sales & Related (15 | 14.4%).
Sales and Office Occupations by Sex
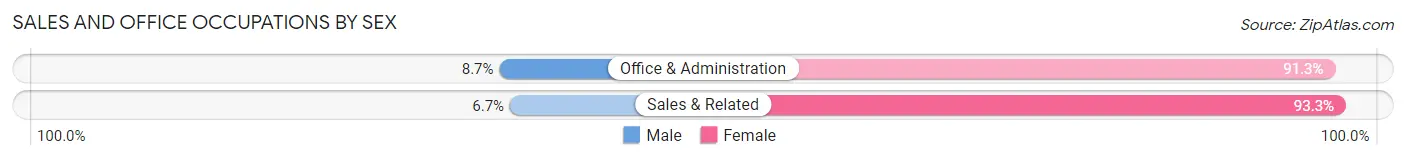
| Occupation | Male | Female |
| Sales & Related | 1 (6.7%) | 14 (93.3%) |
| Office & Administration | 2 (8.7%) | 21 (91.3%) |
| Total (Category) | 3 (7.9%) | 35 (92.1%) |
| Total (Overall) | 61 (58.7%) | 43 (41.3%) |
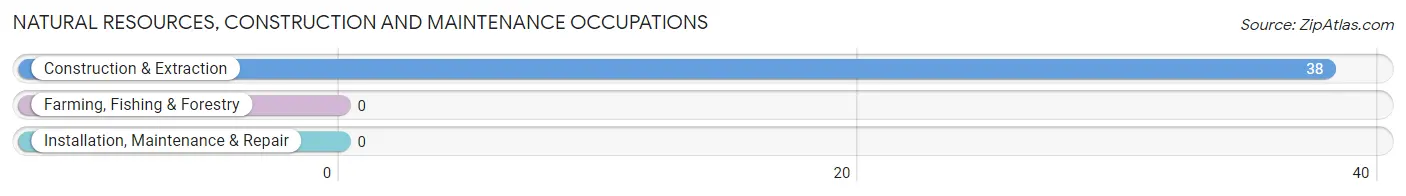
Natural Resources, Construction and Maintenance Occupations
The most common Natural Resources, Construction and Maintenance occupations in Miramiguoa Park are , and Construction & Extraction (38 | 36.5%).
Natural Resources, Construction and Maintenance Occupations by Sex
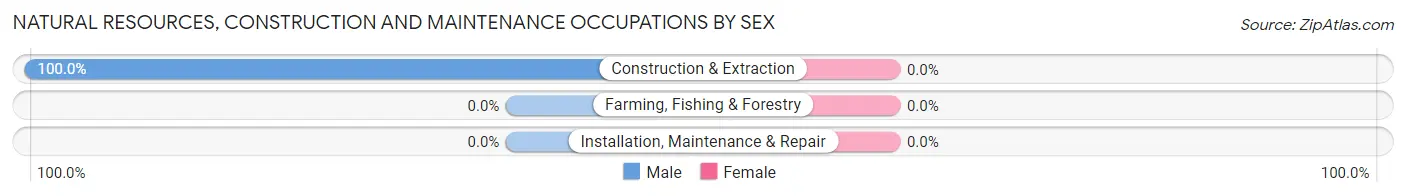
| Occupation | Male | Female |
| Farming, Fishing & Forestry | 0 (0.0%) | 0 (0.0%) |
| Construction & Extraction | 38 (100.0%) | 0 (0.0%) |
| Installation, Maintenance & Repair | 0 (0.0%) | 0 (0.0%) |
| Total (Category) | 38 (100.0%) | 0 (0.0%) |
| Total (Overall) | 61 (58.7%) | 43 (41.3%) |
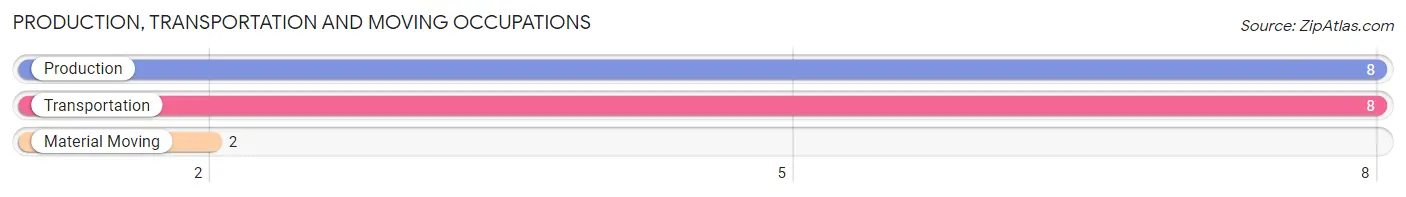
Production, Transportation and Moving Occupations
The most common Production, Transportation and Moving occupations in Miramiguoa Park are Production (8 | 7.7%), Transportation (8 | 7.7%), and Material Moving (2 | 1.9%).
Production, Transportation and Moving Occupations by Sex
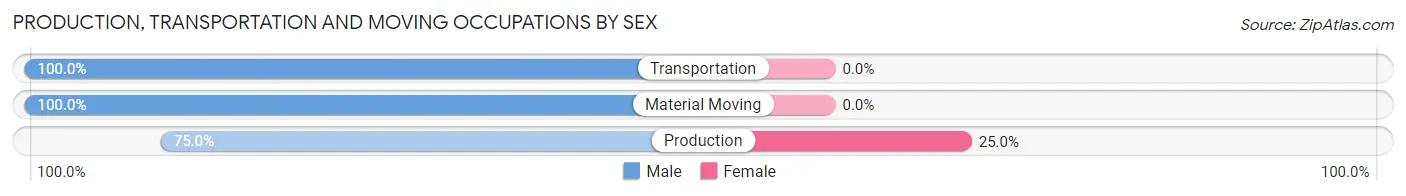
| Occupation | Male | Female |
| Production | 6 (75.0%) | 2 (25.0%) |
| Transportation | 8 (100.0%) | 0 (0.0%) |
| Material Moving | 2 (100.0%) | 0 (0.0%) |
| Total (Category) | 16 (88.9%) | 2 (11.1%) |
| Total (Overall) | 61 (58.7%) | 43 (41.3%) |
Employment Industries by Sex in Miramiguoa Park
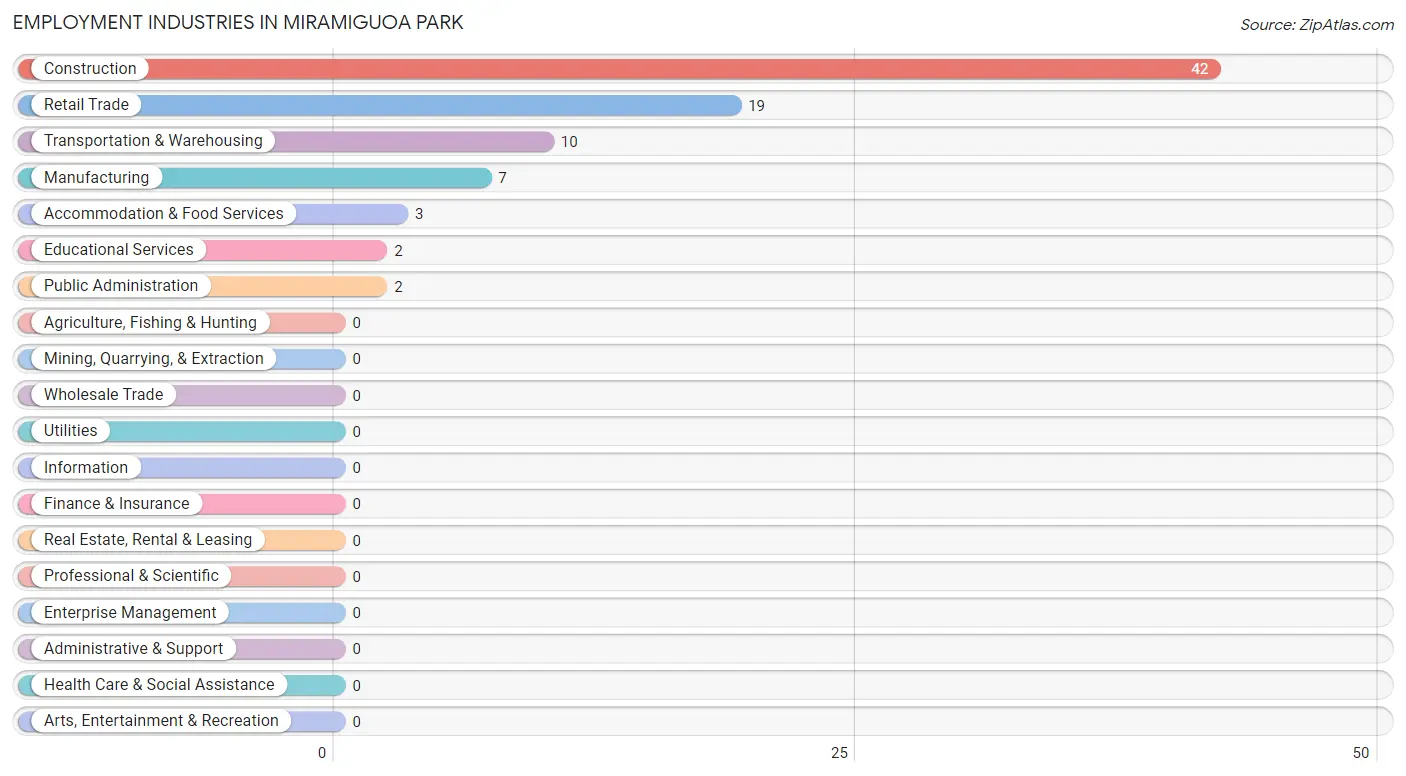
Employment Industries in Miramiguoa Park
The major employment industries in Miramiguoa Park include Construction (42 | 40.4%), Retail Trade (19 | 18.3%), Transportation & Warehousing (10 | 9.6%), Manufacturing (7 | 6.7%), and Accommodation & Food Services (3 | 2.9%).
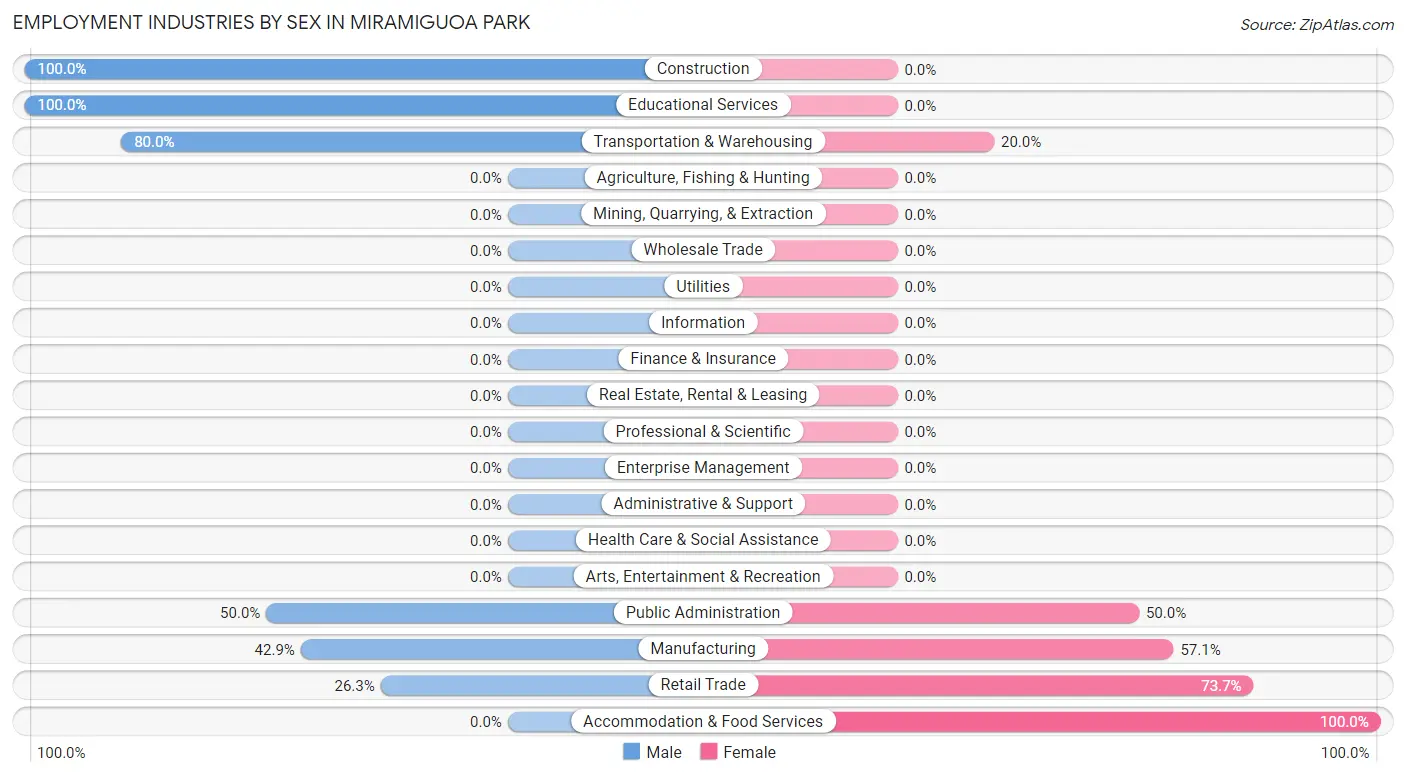
Employment Industries by Sex in Miramiguoa Park
The Miramiguoa Park industries that see more men than women are Construction (100.0%), Educational Services (100.0%), and Transportation & Warehousing (80.0%), whereas the industries that tend to have a higher number of women are Accommodation & Food Services (100.0%), Retail Trade (73.7%), and Manufacturing (57.1%).
| Industry | Male | Female |
| Agriculture, Fishing & Hunting | 0 (0.0%) | 0 (0.0%) |
| Mining, Quarrying, & Extraction | 0 (0.0%) | 0 (0.0%) |
| Construction | 42 (100.0%) | 0 (0.0%) |
| Manufacturing | 3 (42.9%) | 4 (57.1%) |
| Wholesale Trade | 0 (0.0%) | 0 (0.0%) |
| Retail Trade | 5 (26.3%) | 14 (73.7%) |
| Transportation & Warehousing | 8 (80.0%) | 2 (20.0%) |
| Utilities | 0 (0.0%) | 0 (0.0%) |
| Information | 0 (0.0%) | 0 (0.0%) |
| Finance & Insurance | 0 (0.0%) | 0 (0.0%) |
| Real Estate, Rental & Leasing | 0 (0.0%) | 0 (0.0%) |
| Professional & Scientific | 0 (0.0%) | 0 (0.0%) |
| Enterprise Management | 0 (0.0%) | 0 (0.0%) |
| Administrative & Support | 0 (0.0%) | 0 (0.0%) |
| Educational Services | 2 (100.0%) | 0 (0.0%) |
| Health Care & Social Assistance | 0 (0.0%) | 0 (0.0%) |
| Arts, Entertainment & Recreation | 0 (0.0%) | 0 (0.0%) |
| Accommodation & Food Services | 0 (0.0%) | 3 (100.0%) |
| Public Administration | 1 (50.0%) | 1 (50.0%) |
| Total | 61 (58.7%) | 43 (41.3%) |
Education in Miramiguoa Park
School Enrollment in Miramiguoa Park
The most common levels of schooling among the 19 students in Miramiguoa Park are elementary school (10 | 52.6%), high school (5 | 26.3%), and kindergarten (4 | 21.0%).
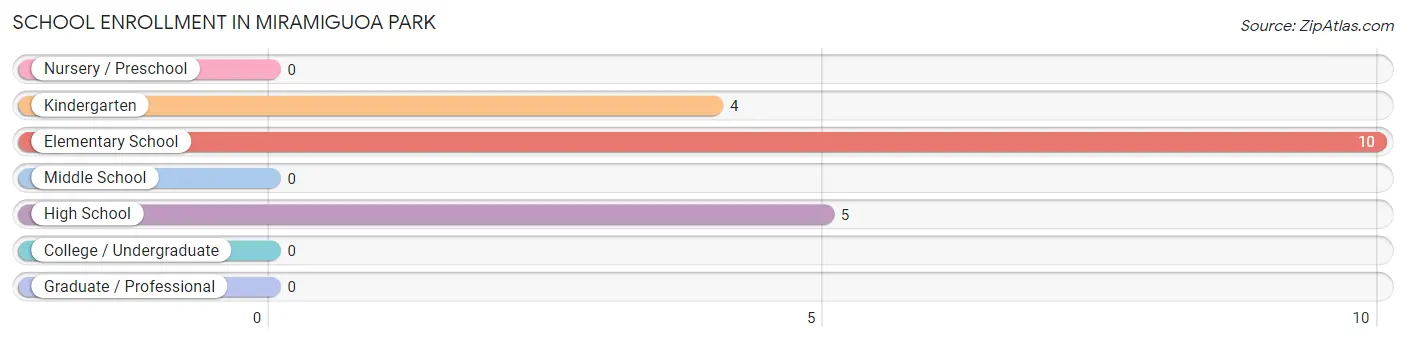
| School Level | # Students | % Students |
| Nursery / Preschool | 0 | 0.0% |
| Kindergarten | 4 | 21.0% |
| Elementary School | 10 | 52.6% |
| Middle School | 0 | 0.0% |
| High School | 5 | 26.3% |
| College / Undergraduate | 0 | 0.0% |
| Graduate / Professional | 0 | 0.0% |
| Total | 19 | 100.0% |
School Enrollment by Age by Funding Source in Miramiguoa Park
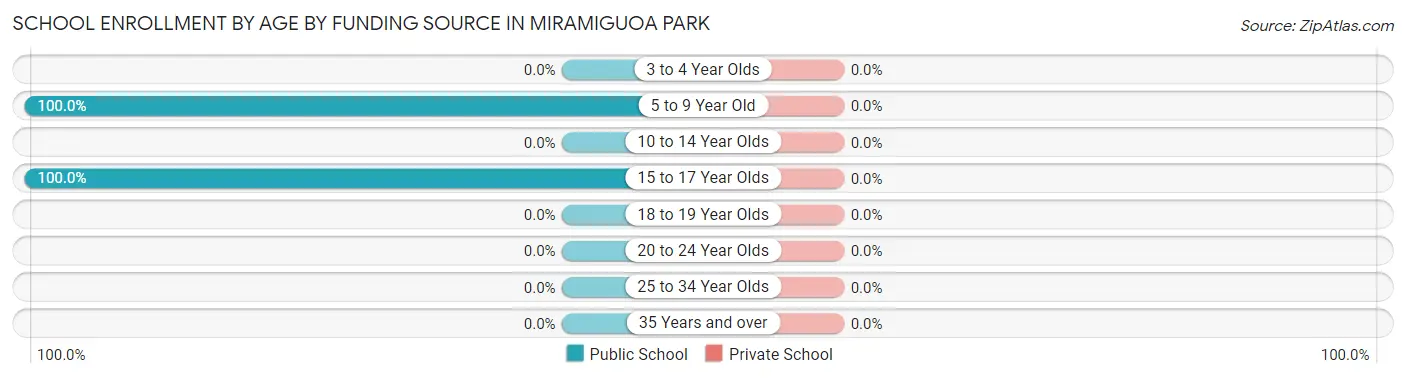
| Age Bracket | Public School | Private School |
| 3 to 4 Year Olds | 0 (0.0%) | 0 (0.0%) |
| 5 to 9 Year Old | 14 (100.0%) | 0 (0.0%) |
| 10 to 14 Year Olds | 0 (0.0%) | 0 (0.0%) |
| 15 to 17 Year Olds | 5 (100.0%) | 0 (0.0%) |
| 18 to 19 Year Olds | 0 (0.0%) | 0 (0.0%) |
| 20 to 24 Year Olds | 0 (0.0%) | 0 (0.0%) |
| 25 to 34 Year Olds | 0 (0.0%) | 0 (0.0%) |
| 35 Years and over | 0 (0.0%) | 0 (0.0%) |
| Total | 19 (100.0%) | 0 (0.0%) |
Educational Attainment by Field of Study in Miramiguoa Park
Business (33 | 91.7%), science & technology (1 | 2.8%), literature & languages (1 | 2.8%), and visual & performing arts (1 | 2.8%) are the most common fields of study among 36 individuals in Miramiguoa Park who have obtained a bachelor's degree or higher.
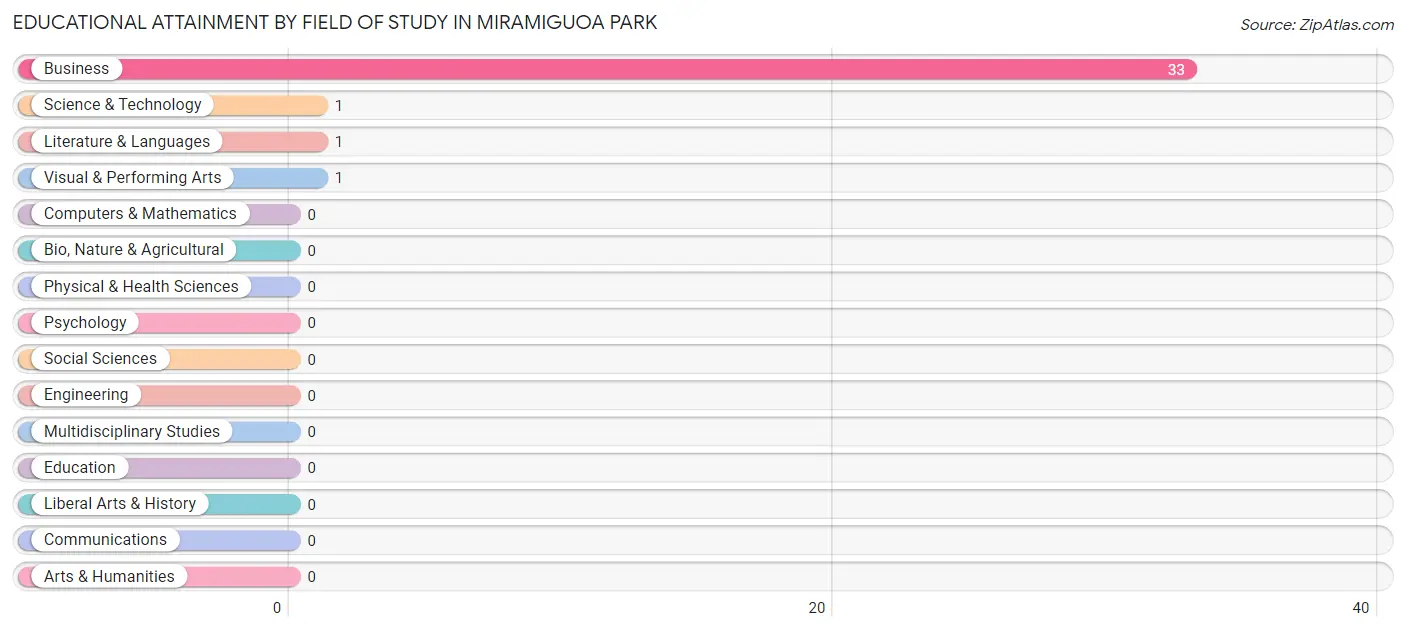
| Field of Study | # Graduates | % Graduates |
| Computers & Mathematics | 0 | 0.0% |
| Bio, Nature & Agricultural | 0 | 0.0% |
| Physical & Health Sciences | 0 | 0.0% |
| Psychology | 0 | 0.0% |
| Social Sciences | 0 | 0.0% |
| Engineering | 0 | 0.0% |
| Multidisciplinary Studies | 0 | 0.0% |
| Science & Technology | 1 | 2.8% |
| Business | 33 | 91.7% |
| Education | 0 | 0.0% |
| Literature & Languages | 1 | 2.8% |
| Liberal Arts & History | 0 | 0.0% |
| Visual & Performing Arts | 1 | 2.8% |
| Communications | 0 | 0.0% |
| Arts & Humanities | 0 | 0.0% |
| Total | 36 | 100.0% |
Transportation & Commute in Miramiguoa Park
Vehicle Availability by Sex in Miramiguoa Park
The most prevalent vehicle ownership categories in Miramiguoa Park are males with 3 vehicles (38, accounting for 62.3%) and females with 3 vehicles (33, making up 88.4%).
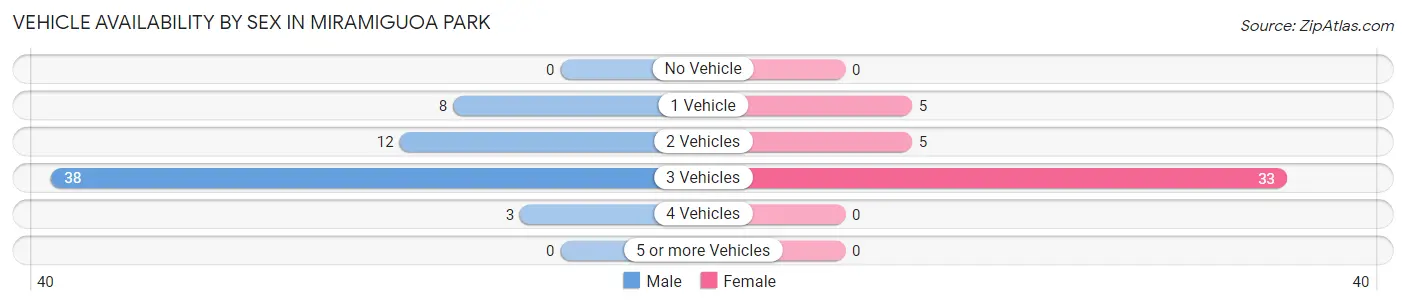
| Vehicles Available | Male | Female |
| No Vehicle | 0 (0.0%) | 0 (0.0%) |
| 1 Vehicle | 8 (13.1%) | 5 (11.6%) |
| 2 Vehicles | 12 (19.7%) | 5 (11.6%) |
| 3 Vehicles | 38 (62.3%) | 33 (76.7%) |
| 4 Vehicles | 3 (4.9%) | 0 (0.0%) |
| 5 or more Vehicles | 0 (0.0%) | 0 (0.0%) |
| Total | 61 (100.0%) | 43 (100.0%) |
Commute Time in Miramiguoa Park
The most frequently occuring commute durations in Miramiguoa Park are 40 to 44 minutes (48 commuters, 48.0%), 30 to 34 minutes (16 commuters, 16.0%), and 25 to 29 minutes (10 commuters, 10.0%).
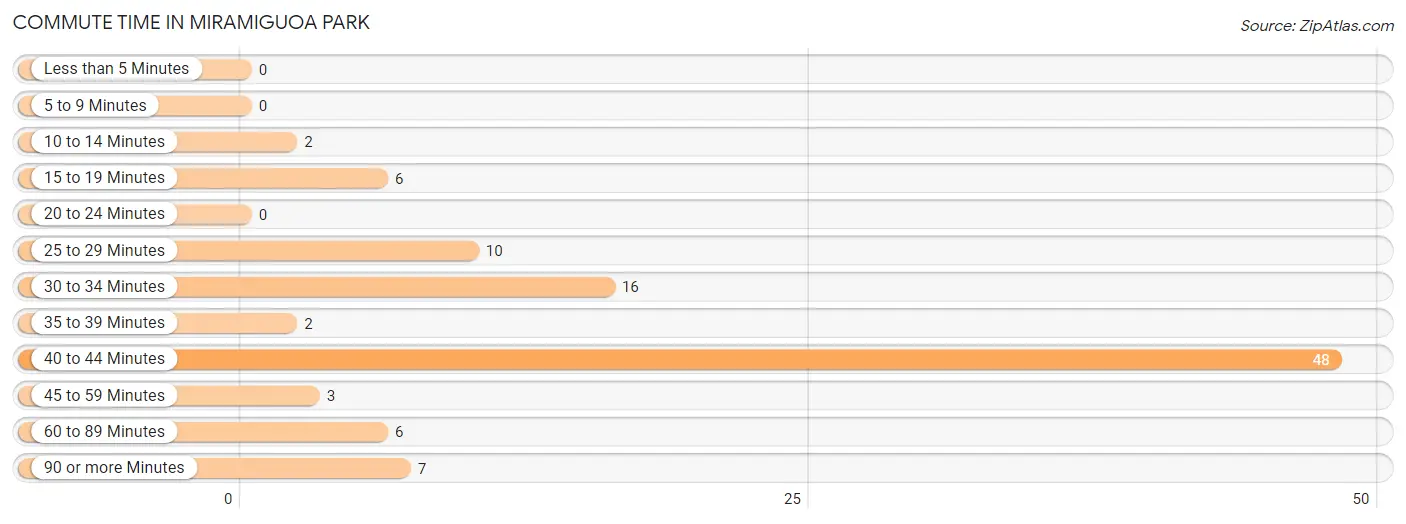
| Commute Time | # Commuters | % Commuters |
| Less than 5 Minutes | 0 | 0.0% |
| 5 to 9 Minutes | 0 | 0.0% |
| 10 to 14 Minutes | 2 | 2.0% |
| 15 to 19 Minutes | 6 | 6.0% |
| 20 to 24 Minutes | 0 | 0.0% |
| 25 to 29 Minutes | 10 | 10.0% |
| 30 to 34 Minutes | 16 | 16.0% |
| 35 to 39 Minutes | 2 | 2.0% |
| 40 to 44 Minutes | 48 | 48.0% |
| 45 to 59 Minutes | 3 | 3.0% |
| 60 to 89 Minutes | 6 | 6.0% |
| 90 or more Minutes | 7 | 7.0% |
Commute Time by Sex in Miramiguoa Park
The most common commute times in Miramiguoa Park are 40 to 44 minutes (29 commuters, 50.9%) for males and 40 to 44 minutes (19 commuters, 44.2%) for females.
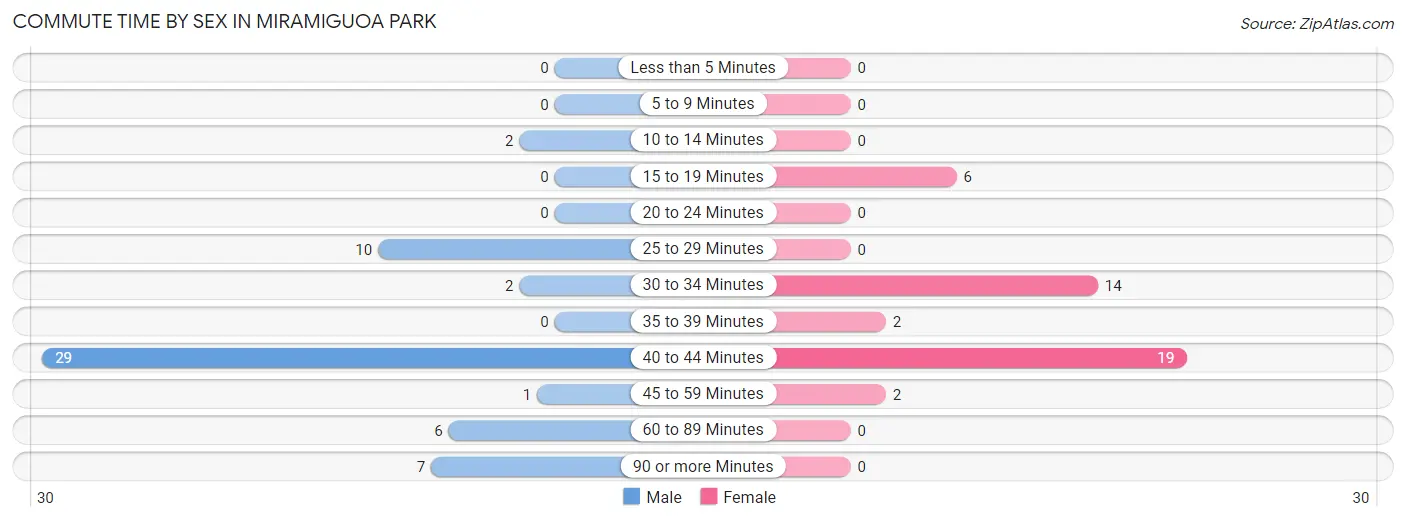
| Commute Time | Male | Female |
| Less than 5 Minutes | 0 (0.0%) | 0 (0.0%) |
| 5 to 9 Minutes | 0 (0.0%) | 0 (0.0%) |
| 10 to 14 Minutes | 2 (3.5%) | 0 (0.0%) |
| 15 to 19 Minutes | 0 (0.0%) | 6 (14.0%) |
| 20 to 24 Minutes | 0 (0.0%) | 0 (0.0%) |
| 25 to 29 Minutes | 10 (17.5%) | 0 (0.0%) |
| 30 to 34 Minutes | 2 (3.5%) | 14 (32.6%) |
| 35 to 39 Minutes | 0 (0.0%) | 2 (4.6%) |
| 40 to 44 Minutes | 29 (50.9%) | 19 (44.2%) |
| 45 to 59 Minutes | 1 (1.8%) | 2 (4.6%) |
| 60 to 89 Minutes | 6 (10.5%) | 0 (0.0%) |
| 90 or more Minutes | 7 (12.3%) | 0 (0.0%) |
Time of Departure to Work by Sex in Miramiguoa Park
The most frequent times of departure to work in Miramiguoa Park are 7:00 AM to 7:29 AM (29, 50.9%) for males and 6:30 AM to 6:59 AM (21, 48.8%) for females.
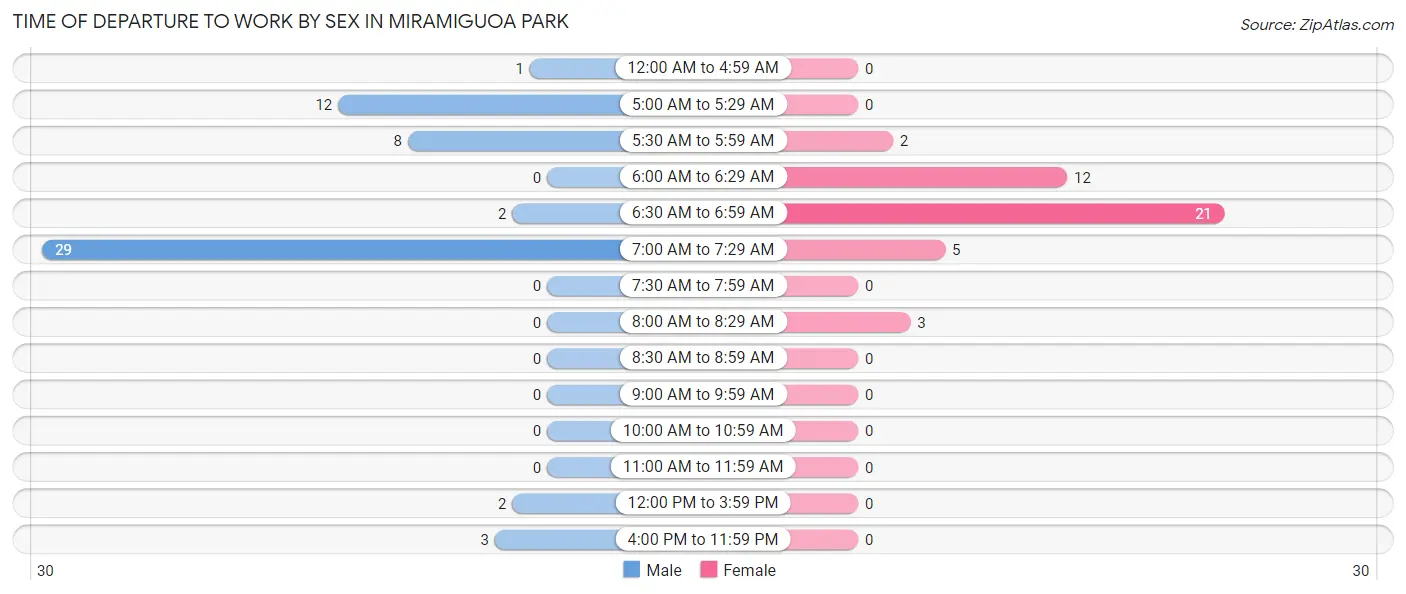
| Time of Departure | Male | Female |
| 12:00 AM to 4:59 AM | 1 (1.8%) | 0 (0.0%) |
| 5:00 AM to 5:29 AM | 12 (21.0%) | 0 (0.0%) |
| 5:30 AM to 5:59 AM | 8 (14.0%) | 2 (4.6%) |
| 6:00 AM to 6:29 AM | 0 (0.0%) | 12 (27.9%) |
| 6:30 AM to 6:59 AM | 2 (3.5%) | 21 (48.8%) |
| 7:00 AM to 7:29 AM | 29 (50.9%) | 5 (11.6%) |
| 7:30 AM to 7:59 AM | 0 (0.0%) | 0 (0.0%) |
| 8:00 AM to 8:29 AM | 0 (0.0%) | 3 (7.0%) |
| 8:30 AM to 8:59 AM | 0 (0.0%) | 0 (0.0%) |
| 9:00 AM to 9:59 AM | 0 (0.0%) | 0 (0.0%) |
| 10:00 AM to 10:59 AM | 0 (0.0%) | 0 (0.0%) |
| 11:00 AM to 11:59 AM | 0 (0.0%) | 0 (0.0%) |
| 12:00 PM to 3:59 PM | 2 (3.5%) | 0 (0.0%) |
| 4:00 PM to 11:59 PM | 3 (5.3%) | 0 (0.0%) |
| Total | 57 (100.0%) | 43 (100.0%) |
Housing Occupancy in Miramiguoa Park
Occupancy by Ownership in Miramiguoa Park
Of the total 69 dwellings in Miramiguoa Park, owner-occupied units account for 62 (89.9%), while renter-occupied units make up 7 (10.1%).

| Occupancy | # Housing Units | % Housing Units |
| Owner Occupied Housing Units | 62 | 89.9% |
| Renter-Occupied Housing Units | 7 | 10.1% |
| Total Occupied Housing Units | 69 | 100.0% |
Occupancy by Household Size in Miramiguoa Park
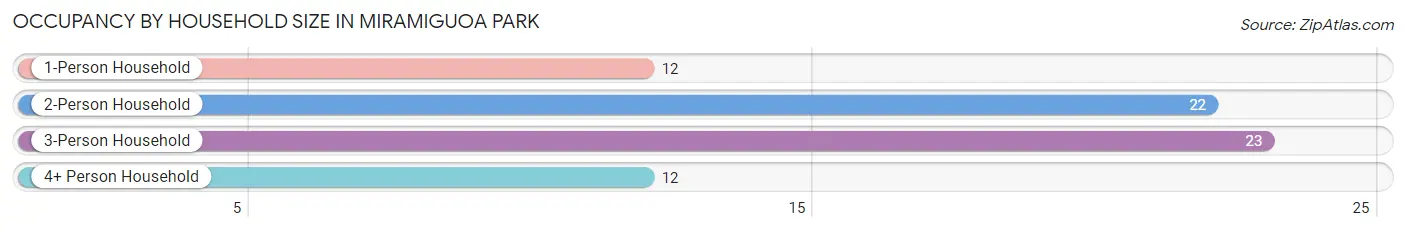
| Household Size | # Housing Units | % Housing Units |
| 1-Person Household | 12 | 17.4% |
| 2-Person Household | 22 | 31.9% |
| 3-Person Household | 23 | 33.3% |
| 4+ Person Household | 12 | 17.4% |
| Total Housing Units | 69 | 100.0% |
Occupancy by Ownership by Household Size in Miramiguoa Park
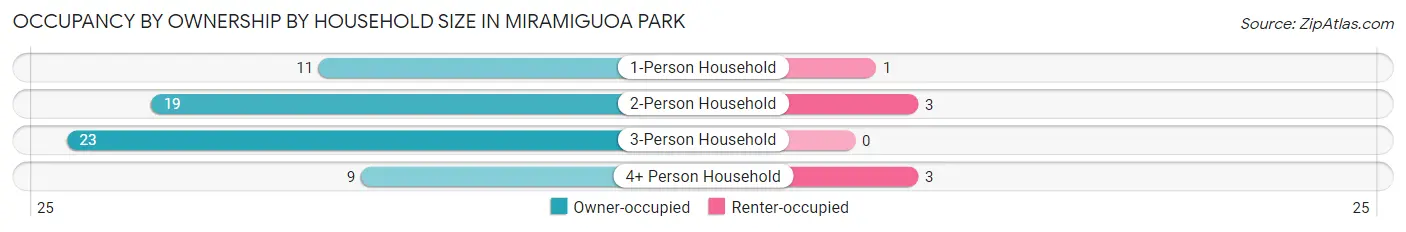
| Household Size | Owner-occupied | Renter-occupied |
| 1-Person Household | 11 (91.7%) | 1 (8.3%) |
| 2-Person Household | 19 (86.4%) | 3 (13.6%) |
| 3-Person Household | 23 (100.0%) | 0 (0.0%) |
| 4+ Person Household | 9 (75.0%) | 3 (25.0%) |
| Total Housing Units | 62 (89.9%) | 7 (10.1%) |
Occupancy by Educational Attainment in Miramiguoa Park
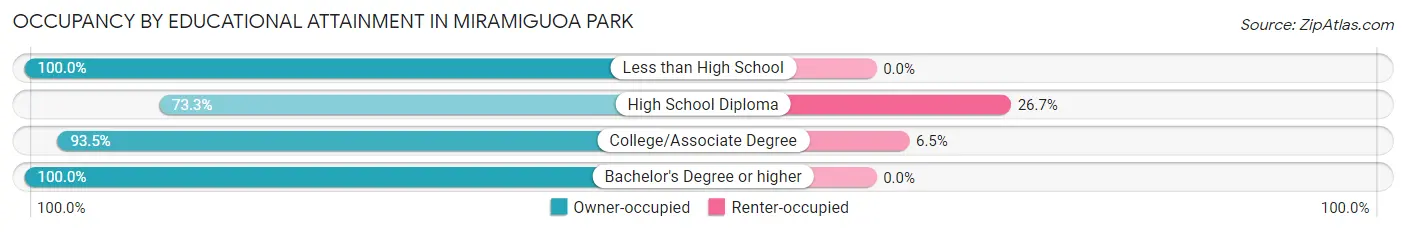
| Household Size | Owner-occupied | Renter-occupied |
| Less than High School | 3 (100.0%) | 0 (0.0%) |
| High School Diploma | 11 (73.3%) | 4 (26.7%) |
| College/Associate Degree | 43 (93.5%) | 3 (6.5%) |
| Bachelor's Degree or higher | 5 (100.0%) | 0 (0.0%) |
Occupancy by Age of Householder in Miramiguoa Park
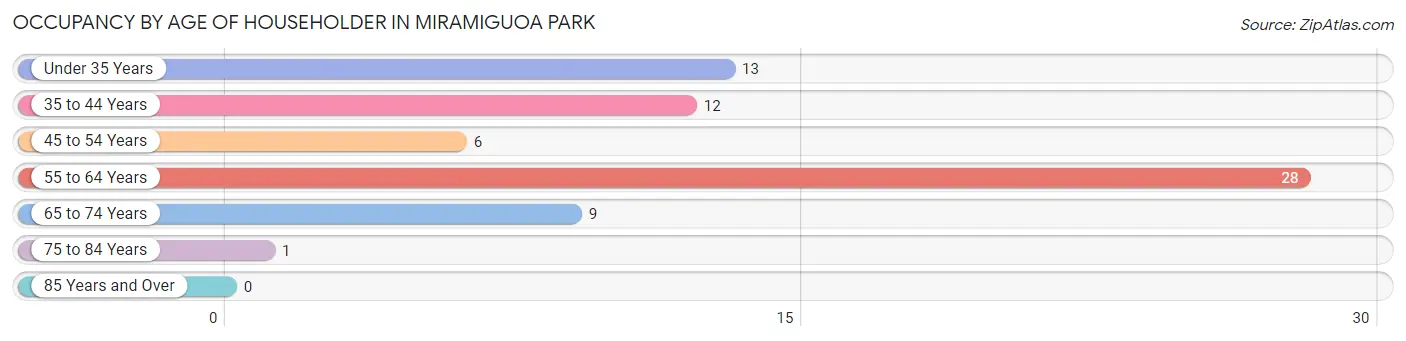
| Age Bracket | # Households | % Households |
| Under 35 Years | 13 | 18.8% |
| 35 to 44 Years | 12 | 17.4% |
| 45 to 54 Years | 6 | 8.7% |
| 55 to 64 Years | 28 | 40.6% |
| 65 to 74 Years | 9 | 13.0% |
| 75 to 84 Years | 1 | 1.5% |
| 85 Years and Over | 0 | 0.0% |
| Total | 69 | 100.0% |
Housing Finances in Miramiguoa Park
Median Income by Occupancy in Miramiguoa Park
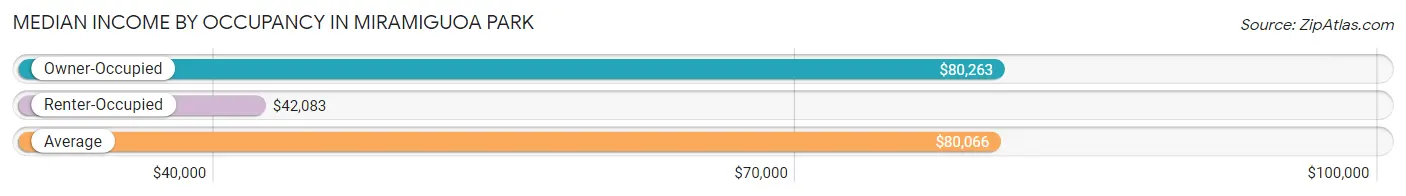
| Occupancy Type | # Households | Median Income |
| Owner-Occupied | 62 (89.9%) | $80,263 |
| Renter-Occupied | 7 (10.1%) | $42,083 |
| Average | 69 (100.0%) | $80,066 |
Occupancy by Householder Income Bracket in Miramiguoa Park
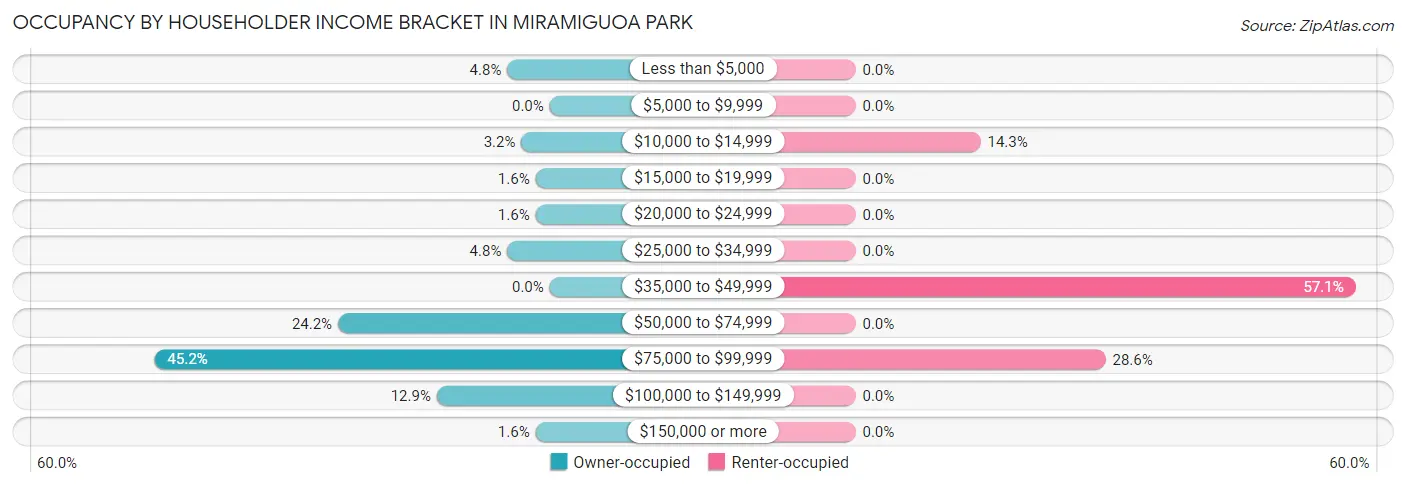
| Income Bracket | Owner-occupied | Renter-occupied |
| Less than $5,000 | 3 (4.8%) | 0 (0.0%) |
| $5,000 to $9,999 | 0 (0.0%) | 0 (0.0%) |
| $10,000 to $14,999 | 2 (3.2%) | 1 (14.3%) |
| $15,000 to $19,999 | 1 (1.6%) | 0 (0.0%) |
| $20,000 to $24,999 | 1 (1.6%) | 0 (0.0%) |
| $25,000 to $34,999 | 3 (4.8%) | 0 (0.0%) |
| $35,000 to $49,999 | 0 (0.0%) | 4 (57.1%) |
| $50,000 to $74,999 | 15 (24.2%) | 0 (0.0%) |
| $75,000 to $99,999 | 28 (45.2%) | 2 (28.6%) |
| $100,000 to $149,999 | 8 (12.9%) | 0 (0.0%) |
| $150,000 or more | 1 (1.6%) | 0 (0.0%) |
| Total | 62 (100.0%) | 7 (100.0%) |
Monthly Housing Cost Tiers in Miramiguoa Park
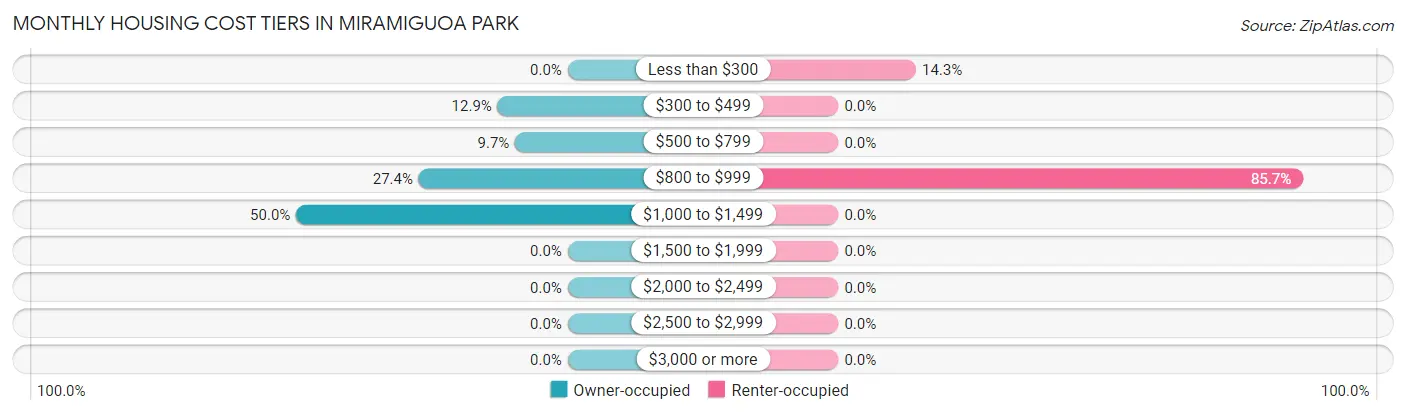
| Monthly Cost | Owner-occupied | Renter-occupied |
| Less than $300 | 0 (0.0%) | 1 (14.3%) |
| $300 to $499 | 8 (12.9%) | 0 (0.0%) |
| $500 to $799 | 6 (9.7%) | 0 (0.0%) |
| $800 to $999 | 17 (27.4%) | 6 (85.7%) |
| $1,000 to $1,499 | 31 (50.0%) | 0 (0.0%) |
| $1,500 to $1,999 | 0 (0.0%) | 0 (0.0%) |
| $2,000 to $2,499 | 0 (0.0%) | 0 (0.0%) |
| $2,500 to $2,999 | 0 (0.0%) | 0 (0.0%) |
| $3,000 or more | 0 (0.0%) | 0 (0.0%) |
| Total | 62 (100.0%) | 7 (100.0%) |
Physical Housing Characteristics in Miramiguoa Park
Housing Structures in Miramiguoa Park
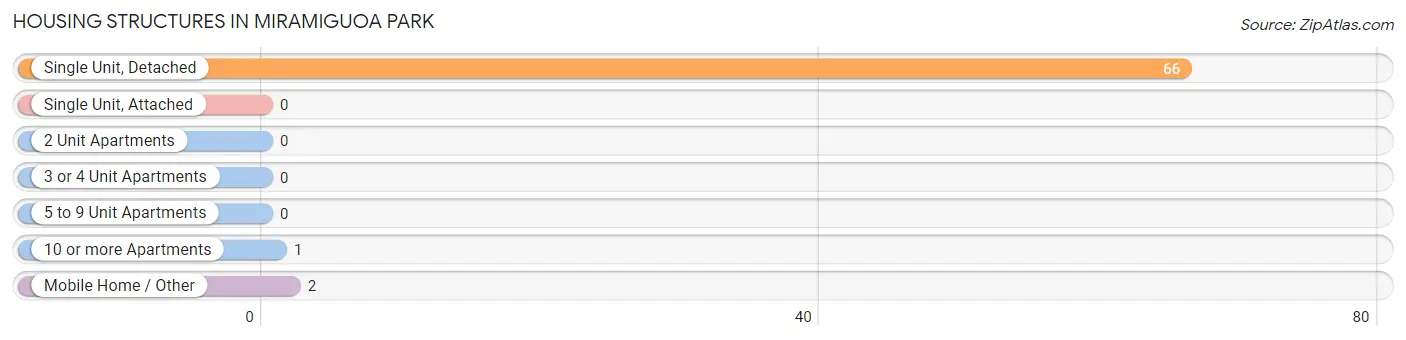
| Structure Type | # Housing Units | % Housing Units |
| Single Unit, Detached | 66 | 95.7% |
| Single Unit, Attached | 0 | 0.0% |
| 2 Unit Apartments | 0 | 0.0% |
| 3 or 4 Unit Apartments | 0 | 0.0% |
| 5 to 9 Unit Apartments | 0 | 0.0% |
| 10 or more Apartments | 1 | 1.5% |
| Mobile Home / Other | 2 | 2.9% |
| Total | 69 | 100.0% |
Housing Structures by Occupancy in Miramiguoa Park
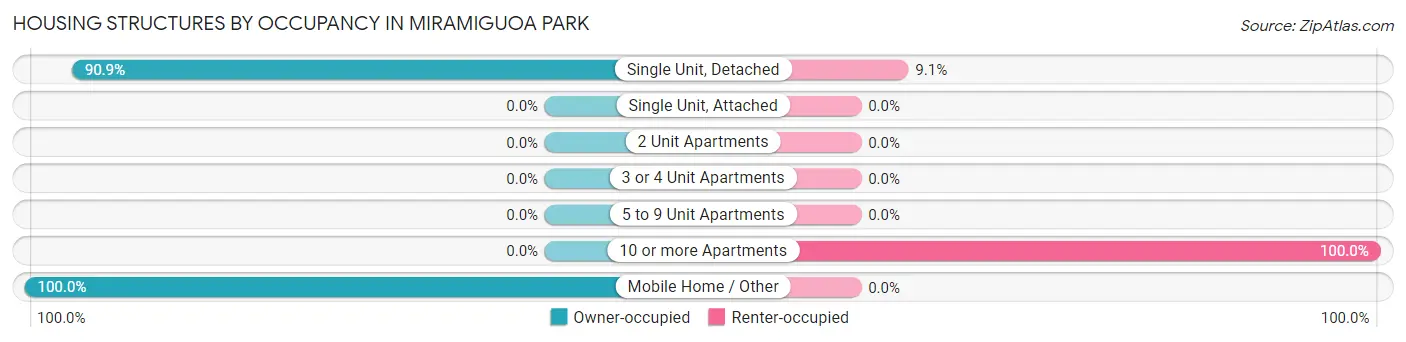
| Structure Type | Owner-occupied | Renter-occupied |
| Single Unit, Detached | 60 (90.9%) | 6 (9.1%) |
| Single Unit, Attached | 0 (0.0%) | 0 (0.0%) |
| 2 Unit Apartments | 0 (0.0%) | 0 (0.0%) |
| 3 or 4 Unit Apartments | 0 (0.0%) | 0 (0.0%) |
| 5 to 9 Unit Apartments | 0 (0.0%) | 0 (0.0%) |
| 10 or more Apartments | 0 (0.0%) | 1 (100.0%) |
| Mobile Home / Other | 2 (100.0%) | 0 (0.0%) |
| Total | 62 (89.9%) | 7 (10.1%) |
Housing Structures by Number of Rooms in Miramiguoa Park
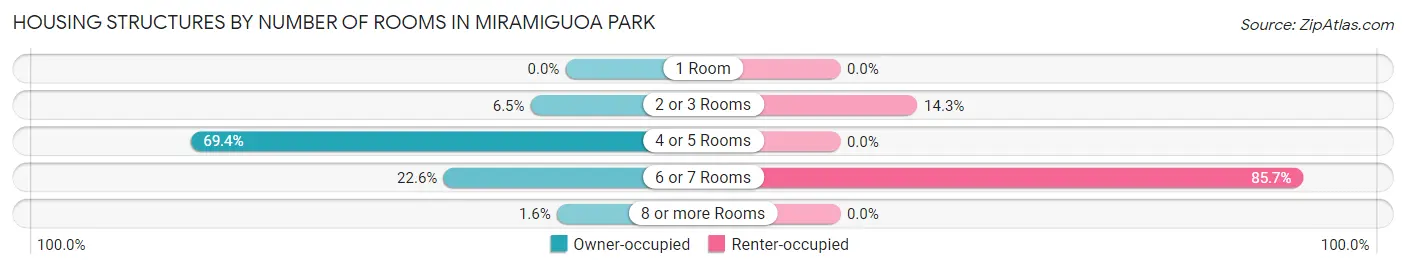
| Number of Rooms | Owner-occupied | Renter-occupied |
| 1 Room | 0 (0.0%) | 0 (0.0%) |
| 2 or 3 Rooms | 4 (6.5%) | 1 (14.3%) |
| 4 or 5 Rooms | 43 (69.4%) | 0 (0.0%) |
| 6 or 7 Rooms | 14 (22.6%) | 6 (85.7%) |
| 8 or more Rooms | 1 (1.6%) | 0 (0.0%) |
| Total | 62 (100.0%) | 7 (100.0%) |
Housing Structure by Heating Type in Miramiguoa Park
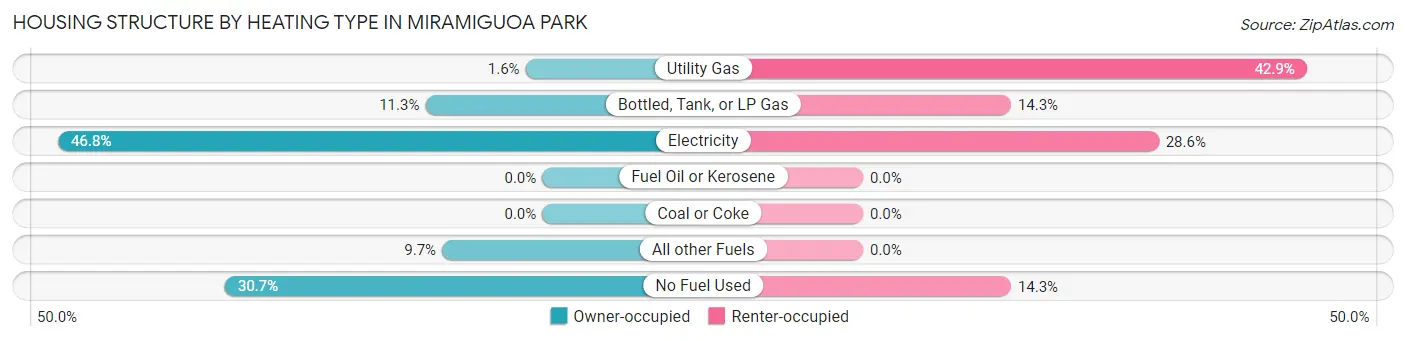
| Heating Type | Owner-occupied | Renter-occupied |
| Utility Gas | 1 (1.6%) | 3 (42.9%) |
| Bottled, Tank, or LP Gas | 7 (11.3%) | 1 (14.3%) |
| Electricity | 29 (46.8%) | 2 (28.6%) |
| Fuel Oil or Kerosene | 0 (0.0%) | 0 (0.0%) |
| Coal or Coke | 0 (0.0%) | 0 (0.0%) |
| All other Fuels | 6 (9.7%) | 0 (0.0%) |
| No Fuel Used | 19 (30.6%) | 1 (14.3%) |
| Total | 62 (100.0%) | 7 (100.0%) |
Household Vehicle Usage in Miramiguoa Park
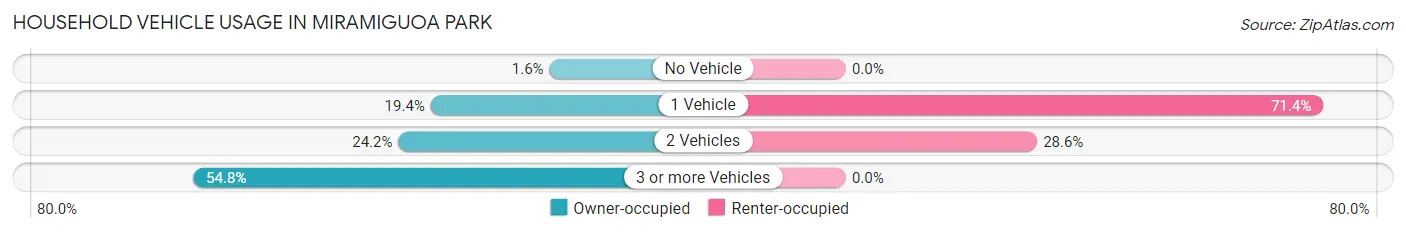
| Vehicles per Household | Owner-occupied | Renter-occupied |
| No Vehicle | 1 (1.6%) | 0 (0.0%) |
| 1 Vehicle | 12 (19.4%) | 5 (71.4%) |
| 2 Vehicles | 15 (24.2%) | 2 (28.6%) |
| 3 or more Vehicles | 34 (54.8%) | 0 (0.0%) |
| Total | 62 (100.0%) | 7 (100.0%) |
Real Estate & Mortgages in Miramiguoa Park
Real Estate and Mortgage Overview in Miramiguoa Park
| Characteristic | Without Mortgage | With Mortgage |
| Housing Units | 10 | 52 |
| Median Property Value | $85,000 | $133,700 |
| Median Household Income | - | - |
| Monthly Housing Costs | $383 | $0 |
| Real Estate Taxes | $800 | $0 |
Property Value by Mortgage Status in Miramiguoa Park
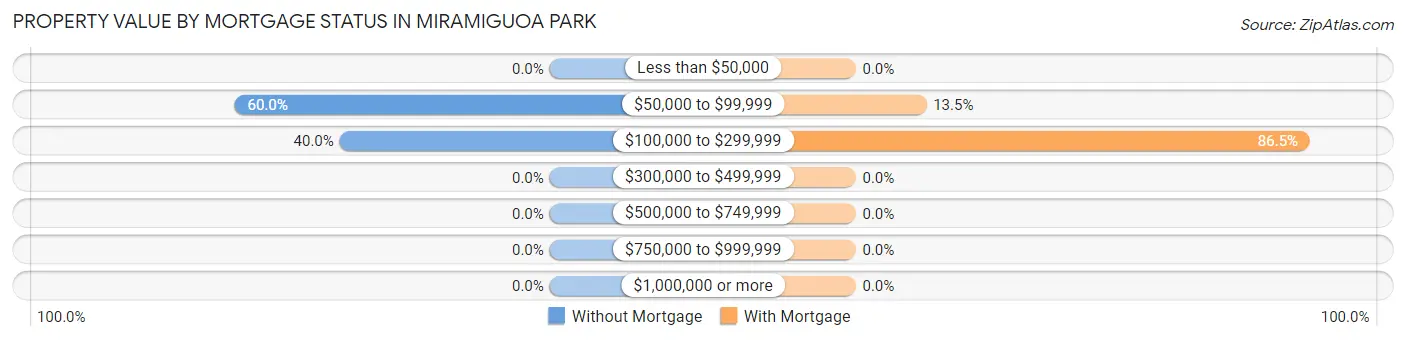
| Property Value | Without Mortgage | With Mortgage |
| Less than $50,000 | 0 (0.0%) | 0 (0.0%) |
| $50,000 to $99,999 | 6 (60.0%) | 7 (13.5%) |
| $100,000 to $299,999 | 4 (40.0%) | 45 (86.5%) |
| $300,000 to $499,999 | 0 (0.0%) | 0 (0.0%) |
| $500,000 to $749,999 | 0 (0.0%) | 0 (0.0%) |
| $750,000 to $999,999 | 0 (0.0%) | 0 (0.0%) |
| $1,000,000 or more | 0 (0.0%) | 0 (0.0%) |
| Total | 10 (100.0%) | 52 (100.0%) |
Household Income by Mortgage Status in Miramiguoa Park
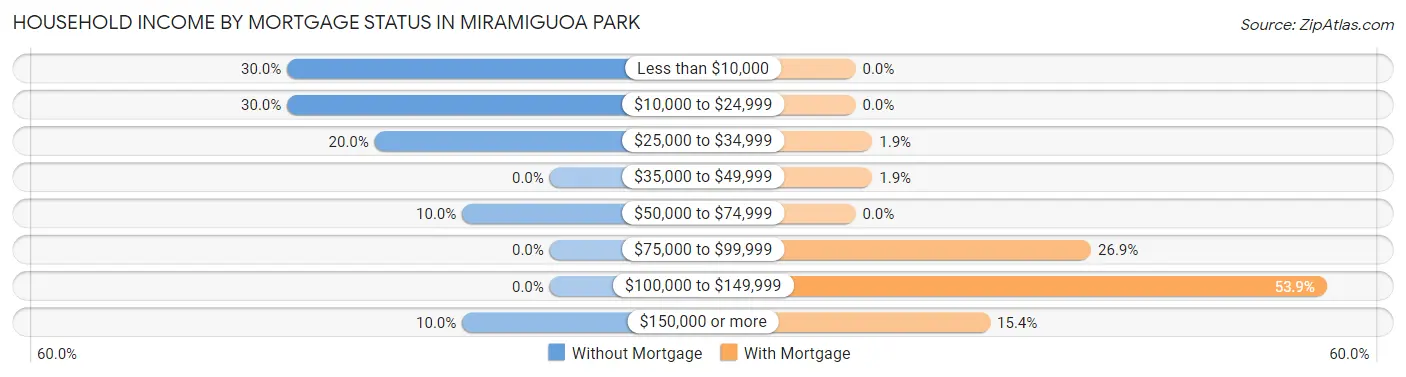
| Household Income | Without Mortgage | With Mortgage |
| Less than $10,000 | 3 (30.0%) | 0 (0.0%) |
| $10,000 to $24,999 | 3 (30.0%) | 0 (0.0%) |
| $25,000 to $34,999 | 2 (20.0%) | 1 (1.9%) |
| $35,000 to $49,999 | 0 (0.0%) | 1 (1.9%) |
| $50,000 to $74,999 | 1 (10.0%) | 0 (0.0%) |
| $75,000 to $99,999 | 0 (0.0%) | 14 (26.9%) |
| $100,000 to $149,999 | 0 (0.0%) | 28 (53.8%) |
| $150,000 or more | 1 (10.0%) | 8 (15.4%) |
| Total | 10 (100.0%) | 52 (100.0%) |
Property Value to Household Income Ratio in Miramiguoa Park
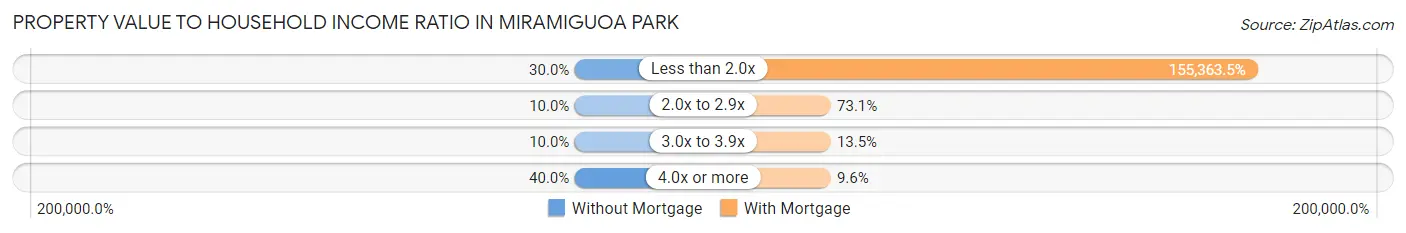
| Value-to-Income Ratio | Without Mortgage | With Mortgage |
| Less than 2.0x | 3 (30.0%) | 80,789 (155,363.5%) |
| 2.0x to 2.9x | 1 (10.0%) | 38 (73.1%) |
| 3.0x to 3.9x | 1 (10.0%) | 7 (13.5%) |
| 4.0x or more | 4 (40.0%) | 5 (9.6%) |
| Total | 10 (100.0%) | 52 (100.0%) |
Real Estate Taxes by Mortgage Status in Miramiguoa Park
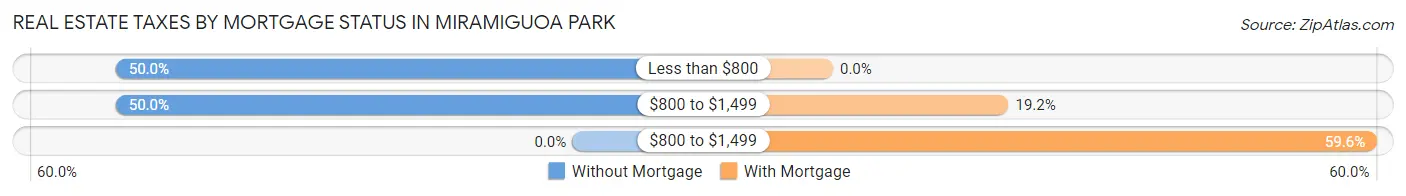
| Property Taxes | Without Mortgage | With Mortgage |
| Less than $800 | 5 (50.0%) | 0 (0.0%) |
| $800 to $1,499 | 5 (50.0%) | 10 (19.2%) |
| $800 to $1,499 | 0 (0.0%) | 31 (59.6%) |
| Total | 10 (100.0%) | 52 (100.0%) |
Health & Disability in Miramiguoa Park
Health Insurance Coverage by Age in Miramiguoa Park
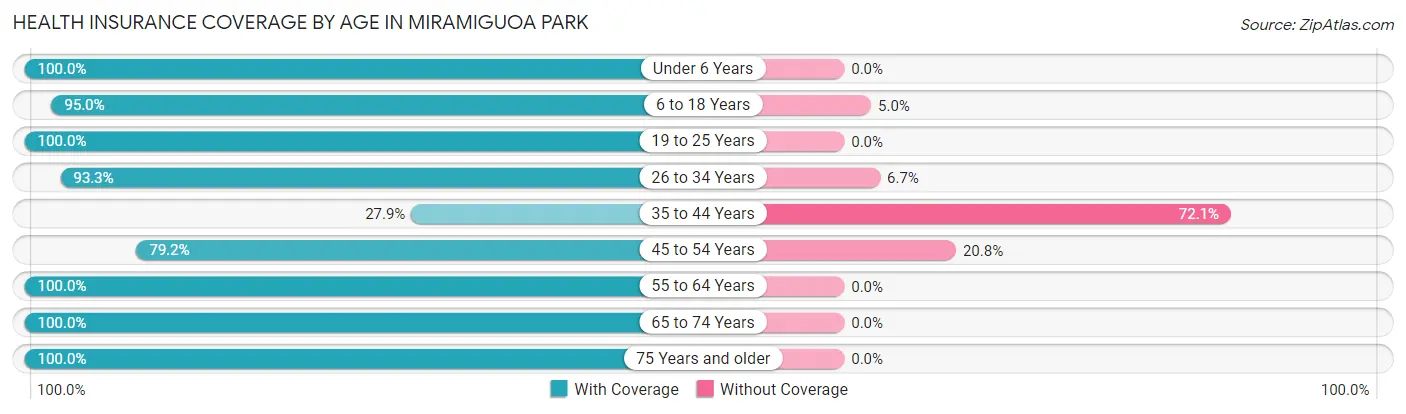
| Age Bracket | With Coverage | Without Coverage |
| Under 6 Years | 11 (100.0%) | 0 (0.0%) |
| 6 to 18 Years | 19 (95.0%) | 1 (5.0%) |
| 19 to 25 Years | 15 (100.0%) | 0 (0.0%) |
| 26 to 34 Years | 14 (93.3%) | 1 (6.7%) |
| 35 to 44 Years | 12 (27.9%) | 31 (72.1%) |
| 45 to 54 Years | 19 (79.2%) | 5 (20.8%) |
| 55 to 64 Years | 33 (100.0%) | 0 (0.0%) |
| 65 to 74 Years | 27 (100.0%) | 0 (0.0%) |
| 75 Years and older | 1 (100.0%) | 0 (0.0%) |
| Total | 151 (79.9%) | 38 (20.1%) |
Health Insurance Coverage by Citizenship Status in Miramiguoa Park
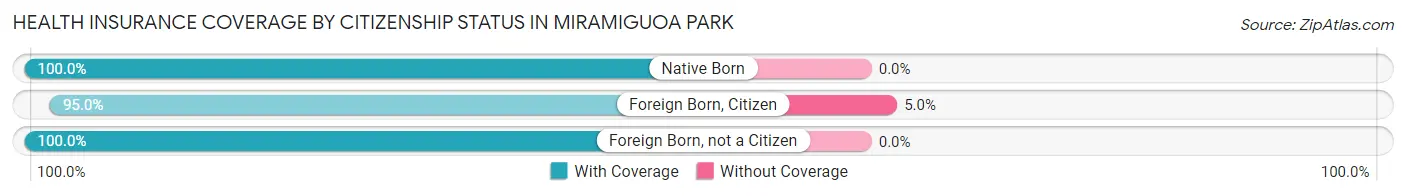
| Citizenship Status | With Coverage | Without Coverage |
| Native Born | 11 (100.0%) | 0 (0.0%) |
| Foreign Born, Citizen | 19 (95.0%) | 1 (5.0%) |
| Foreign Born, not a Citizen | 15 (100.0%) | 0 (0.0%) |
Health Insurance Coverage by Household Income in Miramiguoa Park
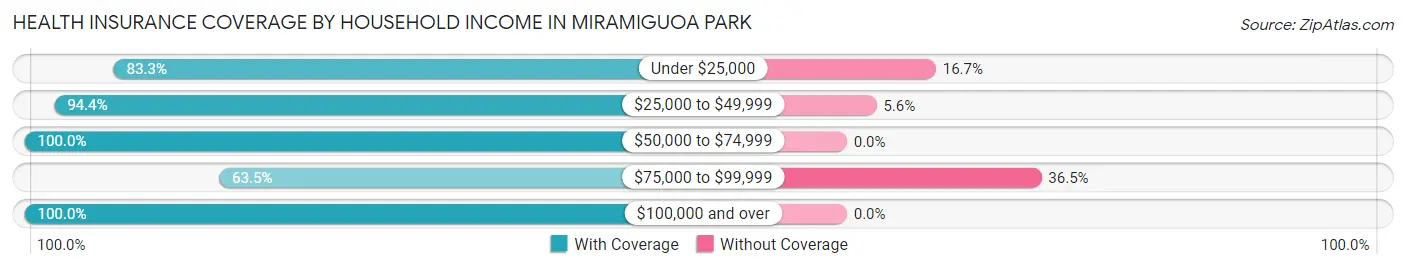
| Household Income | With Coverage | Without Coverage |
| Under $25,000 | 10 (83.3%) | 2 (16.7%) |
| $25,000 to $49,999 | 17 (94.4%) | 1 (5.6%) |
| $50,000 to $74,999 | 45 (100.0%) | 0 (0.0%) |
| $75,000 to $99,999 | 61 (63.5%) | 35 (36.5%) |
| $100,000 and over | 18 (100.0%) | 0 (0.0%) |
Public vs Private Health Insurance Coverage by Age in Miramiguoa Park
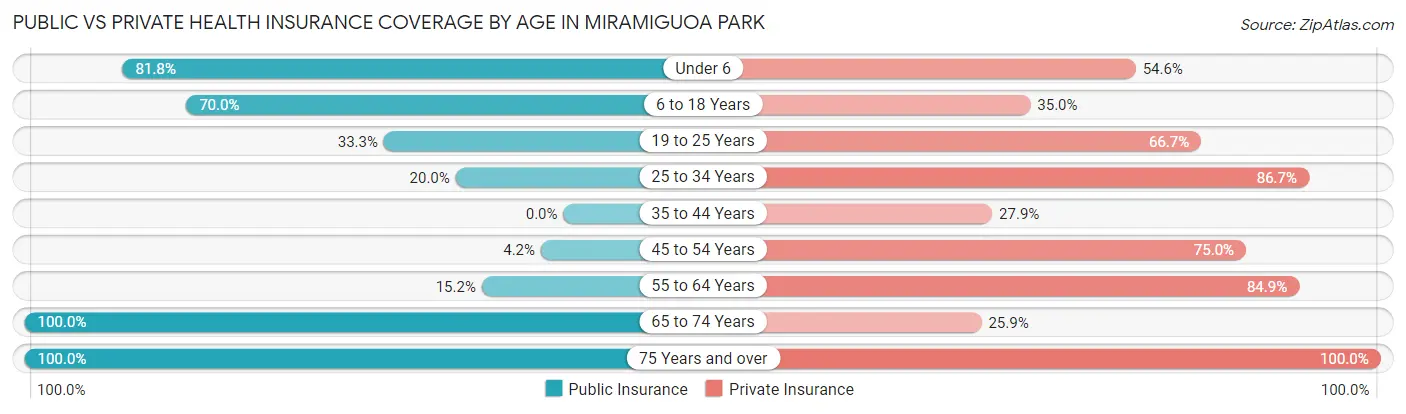
| Age Bracket | Public Insurance | Private Insurance |
| Under 6 | 9 (81.8%) | 6 (54.5%) |
| 6 to 18 Years | 14 (70.0%) | 7 (35.0%) |
| 19 to 25 Years | 5 (33.3%) | 10 (66.7%) |
| 25 to 34 Years | 3 (20.0%) | 13 (86.7%) |
| 35 to 44 Years | 0 (0.0%) | 12 (27.9%) |
| 45 to 54 Years | 1 (4.2%) | 18 (75.0%) |
| 55 to 64 Years | 5 (15.1%) | 28 (84.9%) |
| 65 to 74 Years | 27 (100.0%) | 7 (25.9%) |
| 75 Years and over | 1 (100.0%) | 1 (100.0%) |
| Total | 65 (34.4%) | 102 (54.0%) |
Disability Status by Sex by Age in Miramiguoa Park
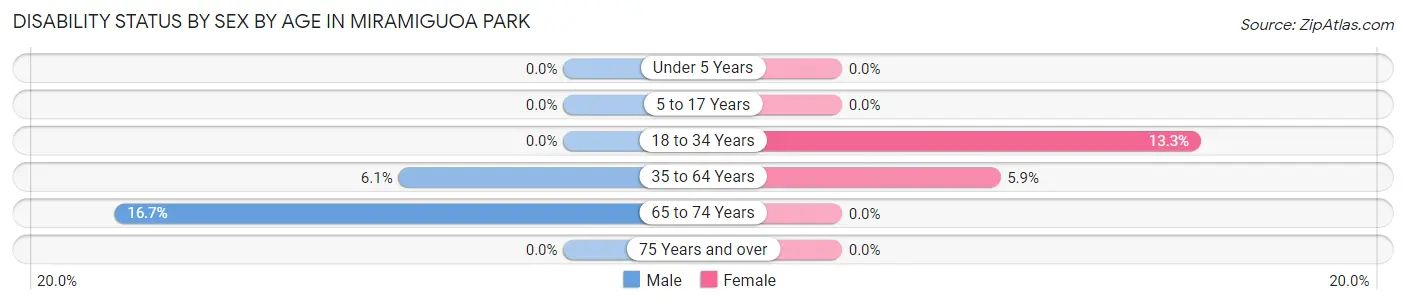
| Age Bracket | Male | Female |
| Under 5 Years | 0 (0.0%) | 0 (0.0%) |
| 5 to 17 Years | 0 (0.0%) | 0 (0.0%) |
| 18 to 34 Years | 0 (0.0%) | 2 (13.3%) |
| 35 to 64 Years | 3 (6.1%) | 3 (5.9%) |
| 65 to 74 Years | 4 (16.7%) | 0 (0.0%) |
| 75 Years and over | 0 (0.0%) | 0 (0.0%) |
Disability Class by Sex by Age in Miramiguoa Park
Disability Class: Hearing Difficulty
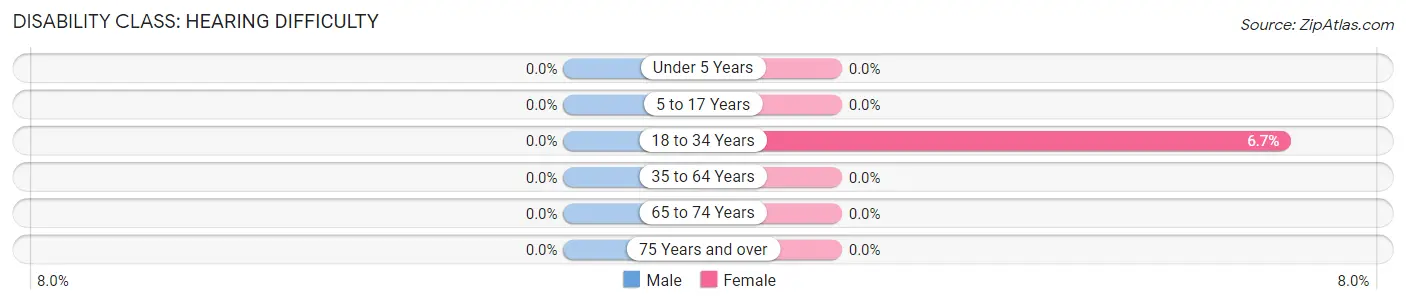
| Age Bracket | Male | Female |
| Under 5 Years | 0 (0.0%) | 0 (0.0%) |
| 5 to 17 Years | 0 (0.0%) | 0 (0.0%) |
| 18 to 34 Years | 0 (0.0%) | 1 (6.7%) |
| 35 to 64 Years | 0 (0.0%) | 0 (0.0%) |
| 65 to 74 Years | 0 (0.0%) | 0 (0.0%) |
| 75 Years and over | 0 (0.0%) | 0 (0.0%) |
Disability Class: Vision Difficulty
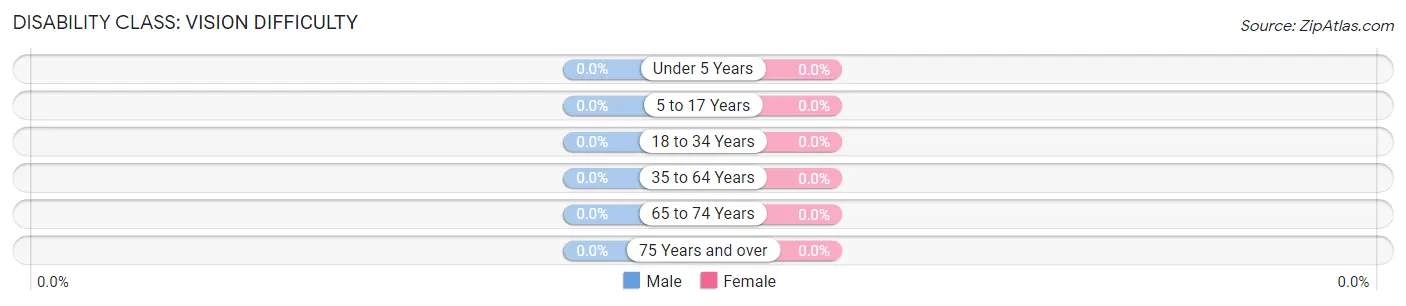
| Age Bracket | Male | Female |
| Under 5 Years | 0 (0.0%) | 0 (0.0%) |
| 5 to 17 Years | 0 (0.0%) | 0 (0.0%) |
| 18 to 34 Years | 0 (0.0%) | 0 (0.0%) |
| 35 to 64 Years | 0 (0.0%) | 0 (0.0%) |
| 65 to 74 Years | 0 (0.0%) | 0 (0.0%) |
| 75 Years and over | 0 (0.0%) | 0 (0.0%) |
Disability Class: Cognitive Difficulty
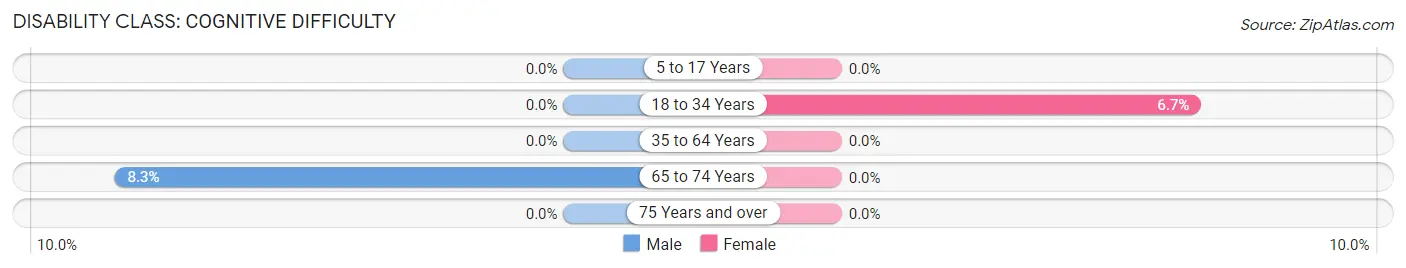
| Age Bracket | Male | Female |
| 5 to 17 Years | 0 (0.0%) | 0 (0.0%) |
| 18 to 34 Years | 0 (0.0%) | 1 (6.7%) |
| 35 to 64 Years | 0 (0.0%) | 0 (0.0%) |
| 65 to 74 Years | 2 (8.3%) | 0 (0.0%) |
| 75 Years and over | 0 (0.0%) | 0 (0.0%) |
Disability Class: Ambulatory Difficulty

| Age Bracket | Male | Female |
| 5 to 17 Years | 0 (0.0%) | 0 (0.0%) |
| 18 to 34 Years | 0 (0.0%) | 0 (0.0%) |
| 35 to 64 Years | 3 (6.1%) | 3 (5.9%) |
| 65 to 74 Years | 2 (8.3%) | 0 (0.0%) |
| 75 Years and over | 0 (0.0%) | 0 (0.0%) |
Disability Class: Self-Care Difficulty
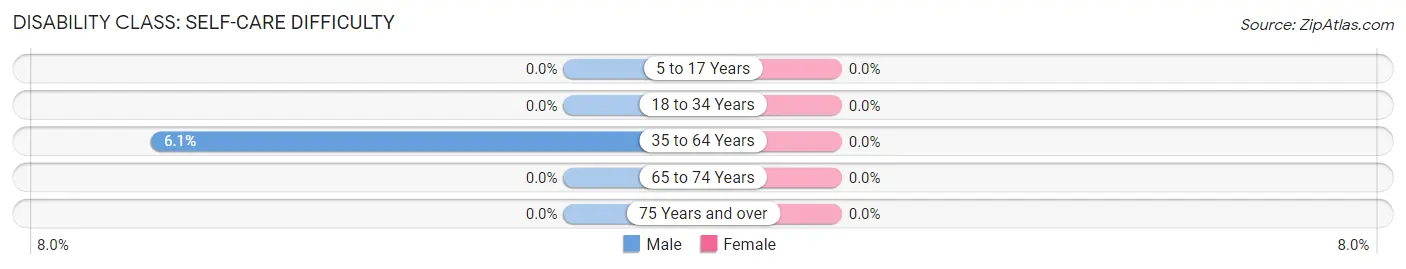
| Age Bracket | Male | Female |
| 5 to 17 Years | 0 (0.0%) | 0 (0.0%) |
| 18 to 34 Years | 0 (0.0%) | 0 (0.0%) |
| 35 to 64 Years | 3 (6.1%) | 0 (0.0%) |
| 65 to 74 Years | 0 (0.0%) | 0 (0.0%) |
| 75 Years and over | 0 (0.0%) | 0 (0.0%) |
Technology Access in Miramiguoa Park
Computing Device Access in Miramiguoa Park
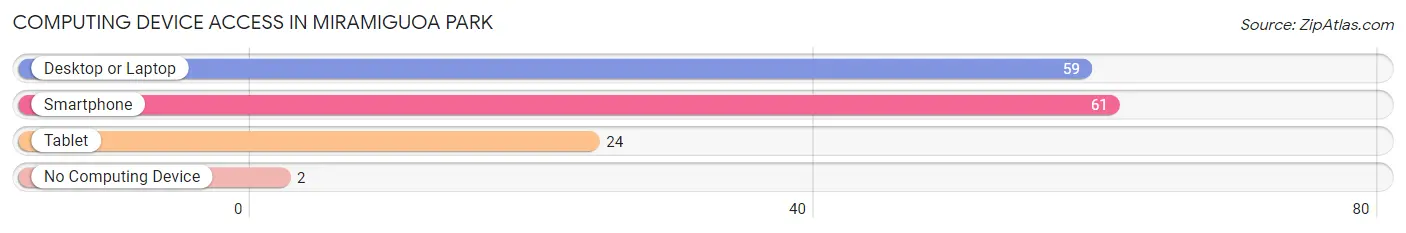
| Device Type | # Households | % Households |
| Desktop or Laptop | 59 | 85.5% |
| Smartphone | 61 | 88.4% |
| Tablet | 24 | 34.8% |
| No Computing Device | 2 | 2.9% |
| Total | 69 | 100.0% |
Internet Access in Miramiguoa Park
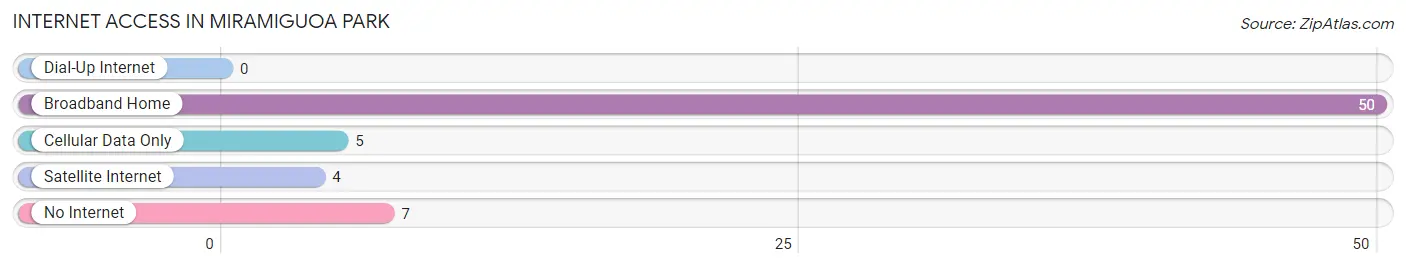
| Internet Type | # Households | % Households |
| Dial-Up Internet | 0 | 0.0% |
| Broadband Home | 50 | 72.5% |
| Cellular Data Only | 5 | 7.2% |
| Satellite Internet | 4 | 5.8% |
| No Internet | 7 | 10.1% |
| Total | 69 | 100.0% |
Miramiguoa Park Summary
Miramiguoa Park is a small city located in St. Louis County, Missouri. It is situated on the banks of the Meramec River, approximately 20 miles southwest of downtown St. Louis. The city was incorporated in 1949 and has a population of approximately 4,000 people.
History
The area that is now Miramiguoa Park was originally inhabited by Native American tribes, including the Osage, Missouri, and Illinois. The first European settlers arrived in the area in the early 1800s. The area was originally known as “Mudtown” due to the muddy conditions of the Meramec River. In 1849, the area was renamed “Miramiguoa” after a local Native American chief.
In the late 1800s, the area began to develop as a small farming community. The first post office was established in 1891 and the first school was built in 1895. In the early 1900s, the area began to experience rapid growth due to the development of the St. Louis and San Francisco Railroad. The railroad provided easy access to St. Louis and other nearby cities, which helped to attract new businesses and residents to the area.
In 1949, the area was officially incorporated as the City of Miramiguoa Park. The city quickly grew in size and population, and by the 1960s, it had become a popular destination for tourists and vacationers. The city has continued to grow and develop over the years, and today it is a vibrant and thriving community.
Geography
Miramiguoa Park is located in St. Louis County, Missouri. It is situated on the banks of the Meramec River, approximately 20 miles southwest of downtown St. Louis. The city covers an area of approximately 4.5 square miles and has a population of approximately 4,000 people.
The city is located in a hilly region of the Ozark Plateau. The terrain is mostly flat, with some rolling hills and valleys. The climate is humid and subtropical, with hot summers and mild winters.
Economy
The economy of Miramiguoa Park is largely based on tourism and retail. The city is home to several popular tourist attractions, including the Meramec Caverns, the Meramec River, and the St. Louis Zoo. The city also has a vibrant retail sector, with several shopping centers and malls.
The city is also home to several manufacturing and industrial businesses. The largest employers in the city include the St. Louis County Government, the St. Louis Zoo, and the Meramec Caverns.
Demographics
As of the 2010 census, the population of Miramiguoa Park was 4,000 people. The racial makeup of the city was 94.3% White, 2.2% African American, 0.7% Native American, 0.7% Asian, 0.3% from other races, and 1.9% from two or more races. Hispanic or Latino of any race were 1.3% of the population.
The median household income in Miramiguoa Park was $45,000, and the median family income was $50,000. The per capita income was $20,000. About 8.3% of families and 10.3% of the population were below the poverty line, including 14.3% of those under age 18 and 6.3% of those age 65 or over.
Common Questions
What is the Total Population of Miramiguoa Park?
Total Population of Miramiguoa Park is 189.
What is the Total Male Population of Miramiguoa Park?
Total Male Population of Miramiguoa Park is 103.
What is the Total Female Population of Miramiguoa Park?
Total Female Population of Miramiguoa Park is 86.
What is the Ratio of Males per 100 Females in Miramiguoa Park?
There are 119.77 Males per 100 Females in Miramiguoa Park.
What is the Ratio of Females per 100 Males in Miramiguoa Park?
There are 83.50 Females per 100 Males in Miramiguoa Park.
What is the Median Population Age in Miramiguoa Park?
Median Population Age in Miramiguoa Park is 43.9 Years.
What is the Average Family Size in Miramiguoa Park
Average Family Size in Miramiguoa Park is 3.3 People.
What is the Average Household Size in Miramiguoa Park
Average Household Size in Miramiguoa Park is 2.7 People.
What is Per Capita Income in Miramiguoa Park?
Per Capita income in Miramiguoa Park is $25,695.
What is the Median Family Income in Miramiguoa Park?
Median Family Income in Miramiguoa Park is $80,592.
What is the Median Household income in Miramiguoa Park?
Median Household Income in Miramiguoa Park is $80,066.
What is Inequality or Gini Index in Miramiguoa Park?
Inequality or Gini Index in Miramiguoa Park is 0.25.
How Large is the Labor Force in Miramiguoa Park?
There are 106 People in the Labor Forcein in Miramiguoa Park.
What is the Percentage of People in the Labor Force in Miramiguoa Park?
65.4% of People are in the Labor Force in Miramiguoa Park.
What is the Unemployment Rate in Miramiguoa Park?
Unemployment Rate in Miramiguoa Park is 1.9%.