Spanish Lake, MO
Spanish Lake Map
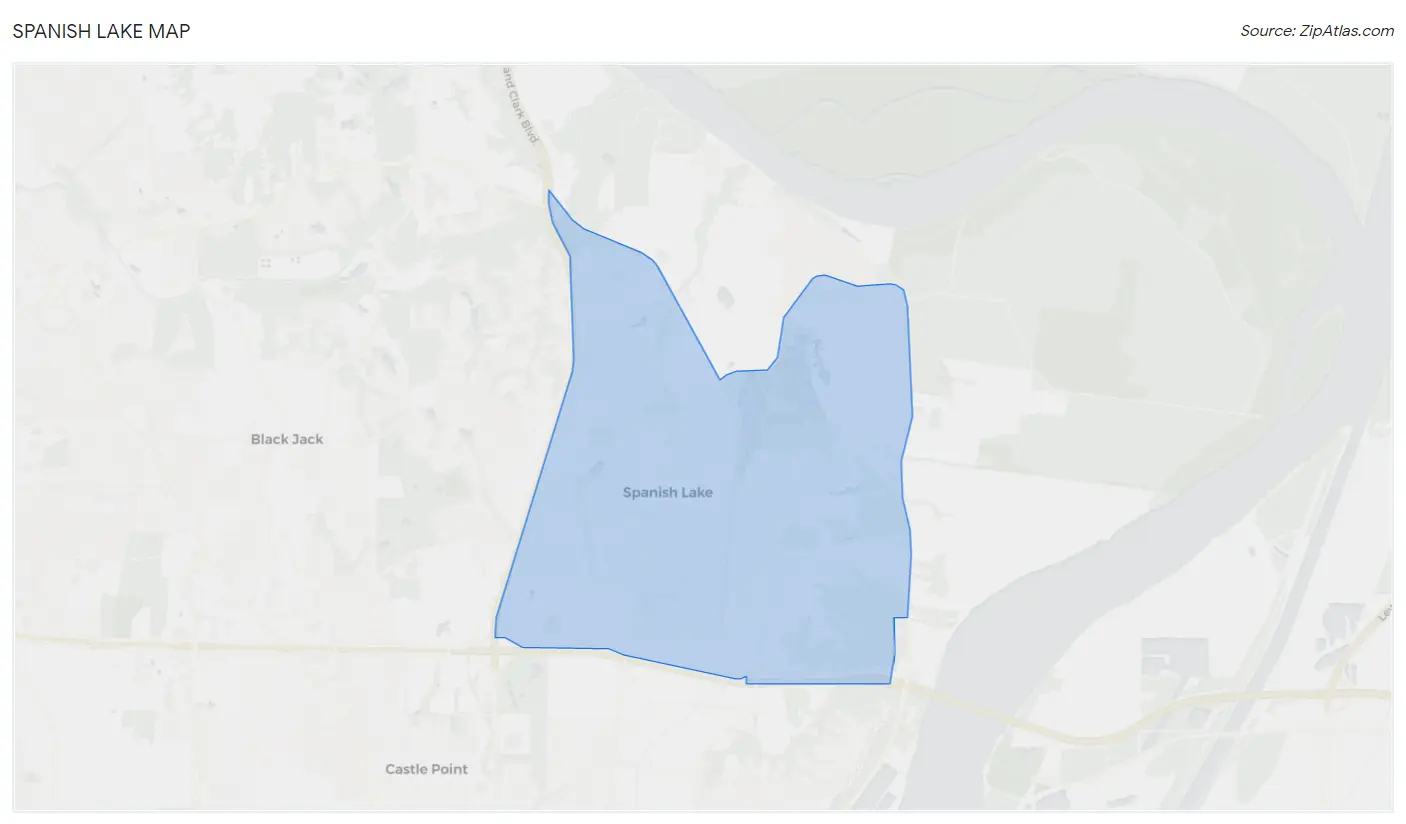
Spanish Lake Overview
18,051
TOTAL POPULATION
8,244
MALE POPULATION
9,807
FEMALE POPULATION
84.06
MALES / 100 FEMALES
118.96
FEMALES / 100 MALES
32.1
MEDIAN AGE
3.2
AVG FAMILY SIZE
2.5
AVG HOUSEHOLD SIZE
$25,662
PER CAPITA INCOME
$61,484
AVG FAMILY INCOME
$49,639
AVG HOUSEHOLD INCOME
14.6%
WAGE / INCOME GAP [ % ]
85.4¢/ $1
WAGE / INCOME GAP [ $ ]
0.44
INEQUALITY / GINI INDEX
9,377
LABOR FORCE [ PEOPLE ]
67.6%
PERCENT IN LABOR FORCE
8.3%
UNEMPLOYMENT RATE
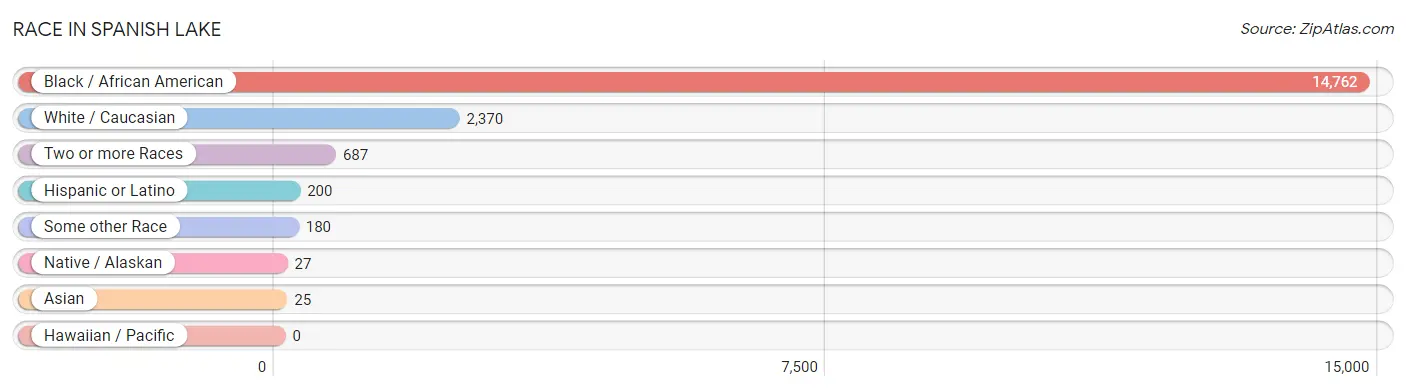
Race in Spanish Lake
The most populous races in Spanish Lake are Black / African American (14,762 | 81.8%), White / Caucasian (2,370 | 13.1%), and Two or more Races (687 | 3.8%).
| Race | # Population | % Population |
| Asian | 25 | 0.1% |
| Black / African American | 14,762 | 81.8% |
| Hawaiian / Pacific | 0 | 0.0% |
| Hispanic or Latino | 200 | 1.1% |
| Native / Alaskan | 27 | 0.2% |
| White / Caucasian | 2,370 | 13.1% |
| Two or more Races | 687 | 3.8% |
| Some other Race | 180 | 1.0% |
| Total | 18,051 | 100.0% |
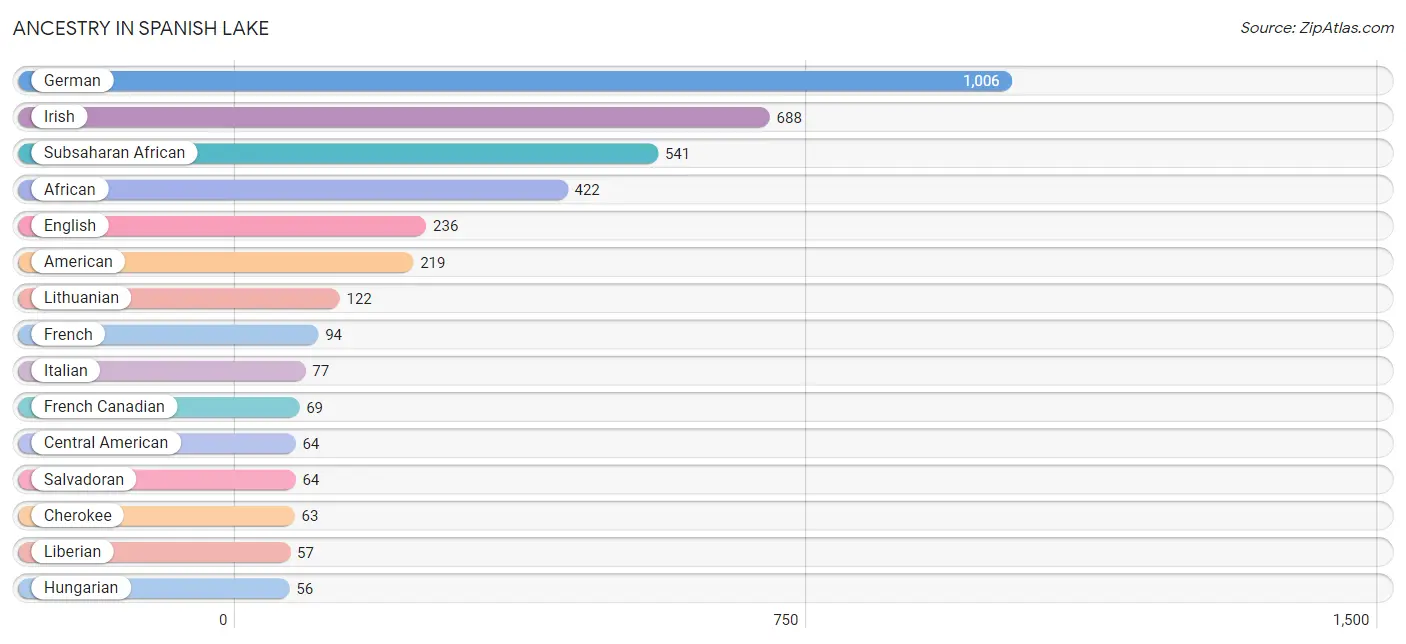
Ancestry in Spanish Lake
The most populous ancestries reported in Spanish Lake are German (1,006 | 5.6%), Irish (688 | 3.8%), Subsaharan African (541 | 3.0%), African (422 | 2.3%), and English (236 | 1.3%), together accounting for 16.0% of all Spanish Lake residents.
| Ancestry | # Population | % Population |
| African | 422 | 2.3% |
| American | 219 | 1.2% |
| Arab | 36 | 0.2% |
| Bhutanese | 15 | 0.1% |
| British | 21 | 0.1% |
| Canadian | 4 | 0.0% |
| Central American | 64 | 0.4% |
| Central American Indian | 21 | 0.1% |
| Cherokee | 63 | 0.4% |
| Chippewa | 2 | 0.0% |
| Choctaw | 3 | 0.0% |
| Cuban | 49 | 0.3% |
| Dutch | 43 | 0.2% |
| Eastern European | 24 | 0.1% |
| English | 236 | 1.3% |
| European | 28 | 0.2% |
| French | 94 | 0.5% |
| French Canadian | 69 | 0.4% |
| German | 1,006 | 5.6% |
| Ghanaian | 8 | 0.0% |
| Haitian | 17 | 0.1% |
| Hungarian | 56 | 0.3% |
| Indian (Asian) | 9 | 0.1% |
| Irish | 688 | 3.8% |
| Italian | 77 | 0.4% |
| Jamaican | 9 | 0.1% |
| Liberian | 57 | 0.3% |
| Lithuanian | 122 | 0.7% |
| Mexican | 9 | 0.1% |
| Moroccan | 36 | 0.2% |
| Nigerian | 25 | 0.1% |
| Norwegian | 22 | 0.1% |
| Okinawan | 9 | 0.1% |
| Pennsylvania German | 35 | 0.2% |
| Polish | 39 | 0.2% |
| Puerto Rican | 21 | 0.1% |
| Romanian | 20 | 0.1% |
| Russian | 39 | 0.2% |
| Salvadoran | 64 | 0.4% |
| Scotch-Irish | 30 | 0.2% |
| Scottish | 39 | 0.2% |
| Senegalese | 4 | 0.0% |
| Slovak | 4 | 0.0% |
| Sri Lankan | 1 | 0.0% |
| Subsaharan African | 541 | 3.0% |
| Swiss | 1 | 0.0% |
| Welsh | 29 | 0.2% | View All 47 Rows |
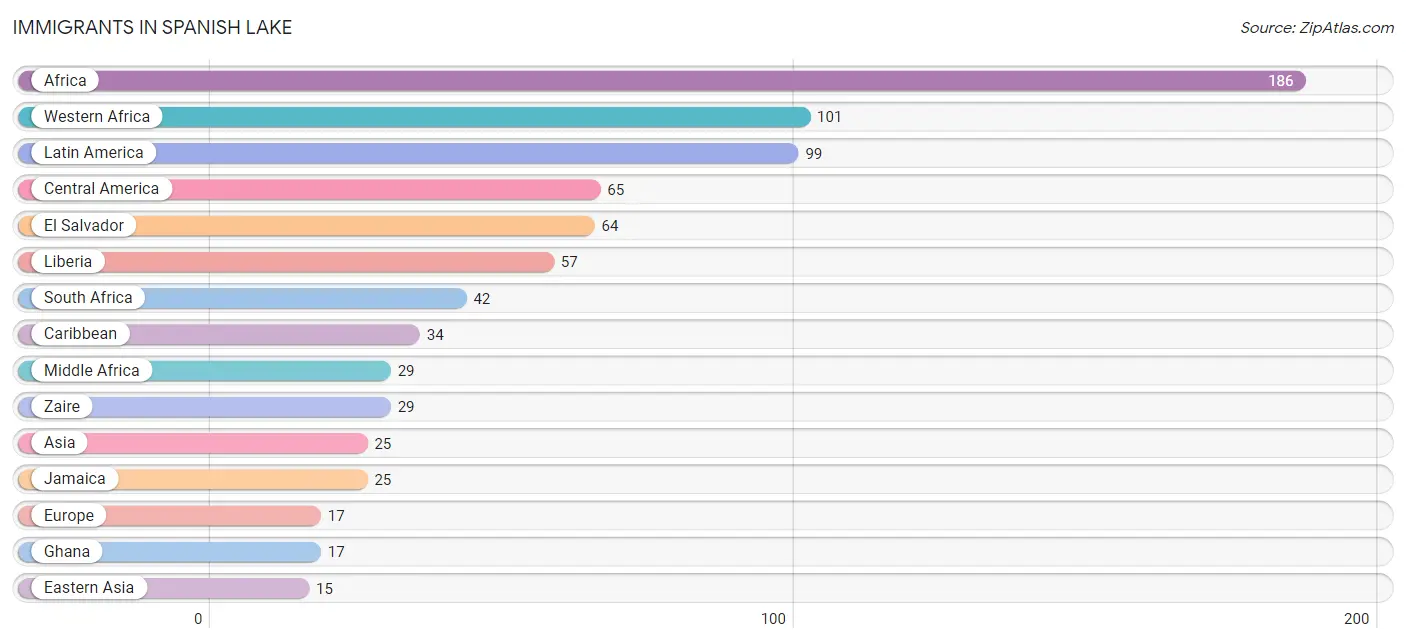
Immigrants in Spanish Lake
The most numerous immigrant groups reported in Spanish Lake came from Africa (186 | 1.0%), Western Africa (101 | 0.6%), Latin America (99 | 0.5%), Central America (65 | 0.4%), and El Salvador (64 | 0.4%), together accounting for 2.9% of all Spanish Lake residents.
| Immigration Origin | # Population | % Population |
| Africa | 186 | 1.0% |
| Asia | 25 | 0.1% |
| Caribbean | 34 | 0.2% |
| Central America | 65 | 0.4% |
| Cuba | 9 | 0.1% |
| Eastern Africa | 14 | 0.1% |
| Eastern Asia | 15 | 0.1% |
| El Salvador | 64 | 0.4% |
| Europe | 17 | 0.1% |
| Germany | 11 | 0.1% |
| Ghana | 17 | 0.1% |
| Jamaica | 25 | 0.1% |
| Japan | 15 | 0.1% |
| Latin America | 99 | 0.5% |
| Liberia | 57 | 0.3% |
| Mexico | 1 | 0.0% |
| Middle Africa | 29 | 0.2% |
| Nigeria | 11 | 0.1% |
| Northern Europe | 6 | 0.0% |
| Singapore | 9 | 0.1% |
| South Africa | 42 | 0.2% |
| South Eastern Asia | 10 | 0.1% |
| Vietnam | 1 | 0.0% |
| Western Africa | 101 | 0.6% |
| Western Europe | 11 | 0.1% |
| Zaire | 29 | 0.2% | View All 26 Rows |
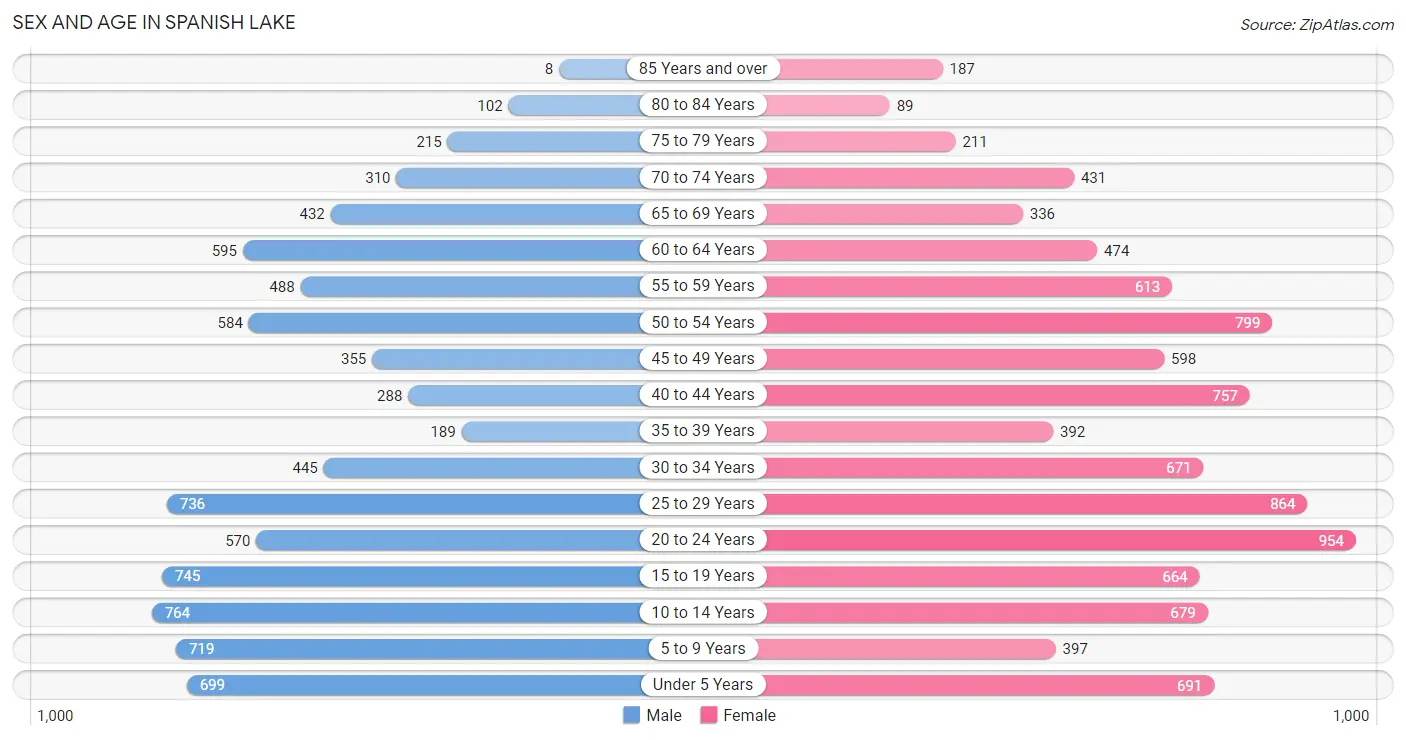
Sex and Age in Spanish Lake
Sex and Age in Spanish Lake
The most populous age groups in Spanish Lake are 10 to 14 Years (764 | 9.3%) for men and 20 to 24 Years (954 | 9.7%) for women.
| Age Bracket | Male | Female |
| Under 5 Years | 699 (8.5%) | 691 (7.0%) |
| 5 to 9 Years | 719 (8.7%) | 397 (4.1%) |
| 10 to 14 Years | 764 (9.3%) | 679 (6.9%) |
| 15 to 19 Years | 745 (9.0%) | 664 (6.8%) |
| 20 to 24 Years | 570 (6.9%) | 954 (9.7%) |
| 25 to 29 Years | 736 (8.9%) | 864 (8.8%) |
| 30 to 34 Years | 445 (5.4%) | 671 (6.8%) |
| 35 to 39 Years | 189 (2.3%) | 392 (4.0%) |
| 40 to 44 Years | 288 (3.5%) | 757 (7.7%) |
| 45 to 49 Years | 355 (4.3%) | 598 (6.1%) |
| 50 to 54 Years | 584 (7.1%) | 799 (8.2%) |
| 55 to 59 Years | 488 (5.9%) | 613 (6.2%) |
| 60 to 64 Years | 595 (7.2%) | 474 (4.8%) |
| 65 to 69 Years | 432 (5.2%) | 336 (3.4%) |
| 70 to 74 Years | 310 (3.8%) | 431 (4.4%) |
| 75 to 79 Years | 215 (2.6%) | 211 (2.1%) |
| 80 to 84 Years | 102 (1.2%) | 89 (0.9%) |
| 85 Years and over | 8 (0.1%) | 187 (1.9%) |
| Total | 8,244 (100.0%) | 9,807 (100.0%) |
Families and Households in Spanish Lake
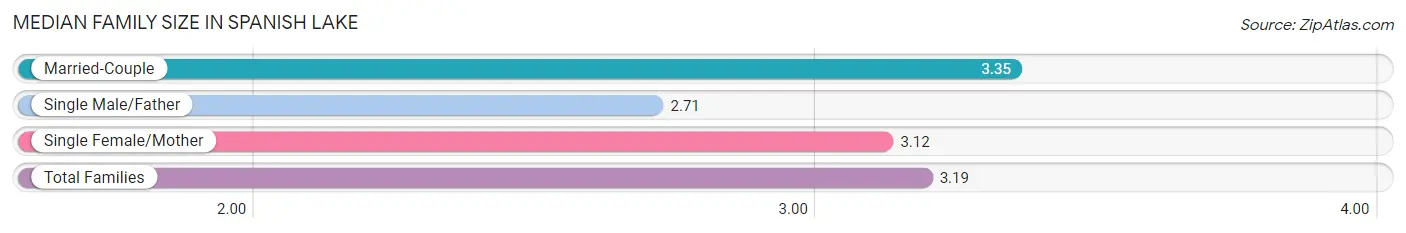
Median Family Size in Spanish Lake
The median family size in Spanish Lake is 3.19 persons per family, with married-couple families (2,023 | 46.2%) accounting for the largest median family size of 3.35 persons per family. On the other hand, single male/father families (414 | 9.5%) represent the smallest median family size with 2.71 persons per family.
| Family Type | # Families | Family Size |
| Married-Couple | 2,023 (46.2%) | 3.35 |
| Single Male/Father | 414 (9.5%) | 2.71 |
| Single Female/Mother | 1,938 (44.3%) | 3.12 |
| Total Families | 4,375 (100.0%) | 3.19 |
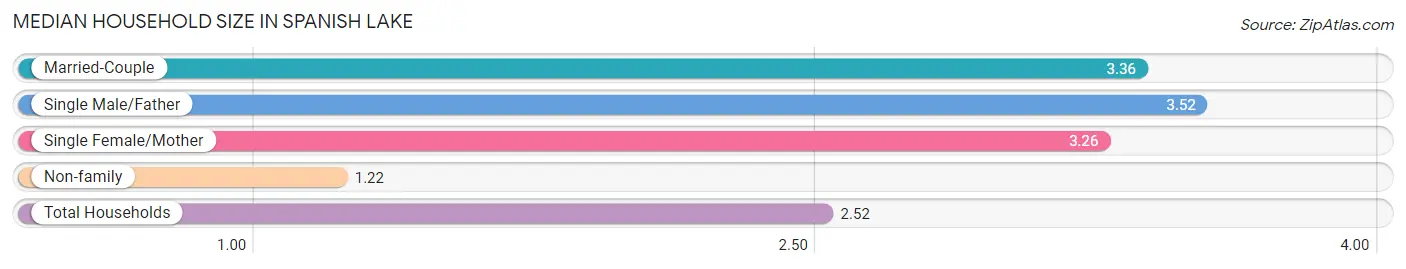
Median Household Size in Spanish Lake
The median household size in Spanish Lake is 2.52 persons per household, with single male/father households (414 | 5.8%) accounting for the largest median household size of 3.52 persons per household. non-family households (2,711 | 38.3%) represent the smallest median household size with 1.22 persons per household.
| Household Type | # Households | Household Size |
| Married-Couple | 2,023 (28.5%) | 3.36 |
| Single Male/Father | 414 (5.8%) | 3.52 |
| Single Female/Mother | 1,938 (27.4%) | 3.26 |
| Non-family | 2,711 (38.3%) | 1.22 |
| Total Households | 7,086 (100.0%) | 2.52 |
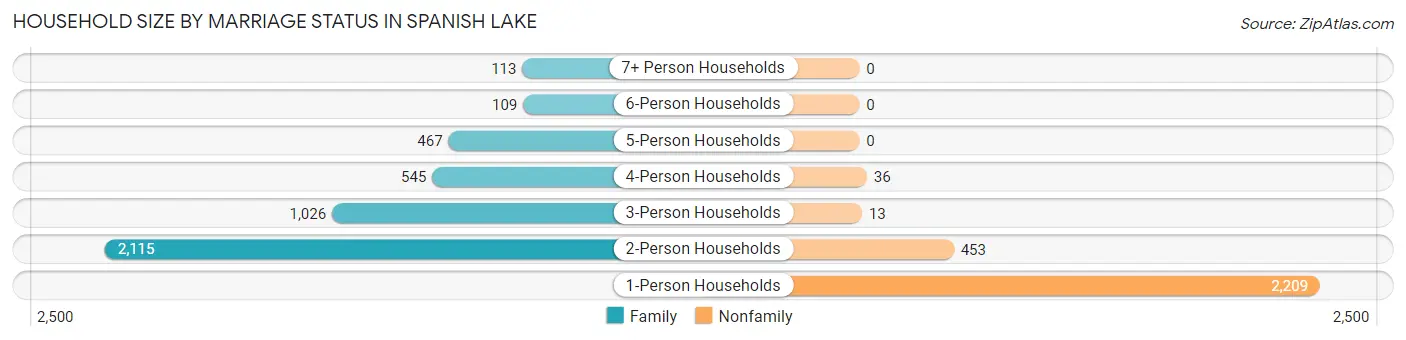
Household Size by Marriage Status in Spanish Lake
Out of a total of 7,086 households in Spanish Lake, 4,375 (61.7%) are family households, while 2,711 (38.3%) are nonfamily households. The most numerous type of family households are 2-person households, comprising 2,115, and the most common type of nonfamily households are 1-person households, comprising 2,209.
| Household Size | Family Households | Nonfamily Households |
| 1-Person Households | - | 2,209 (31.2%) |
| 2-Person Households | 2,115 (29.8%) | 453 (6.4%) |
| 3-Person Households | 1,026 (14.5%) | 13 (0.2%) |
| 4-Person Households | 545 (7.7%) | 36 (0.5%) |
| 5-Person Households | 467 (6.6%) | 0 (0.0%) |
| 6-Person Households | 109 (1.5%) | 0 (0.0%) |
| 7+ Person Households | 113 (1.6%) | 0 (0.0%) |
| Total | 4,375 (61.7%) | 2,711 (38.3%) |
Female Fertility in Spanish Lake
Fertility by Age in Spanish Lake
Average fertility rate in Spanish Lake is 63.0 births per 1,000 women. Women in the age bracket of 15 to 19 years have the highest fertility rate with 119.0 births per 1,000 women. Women in the age bracket of 20 to 34 years acount for 54.9% of all women with births.
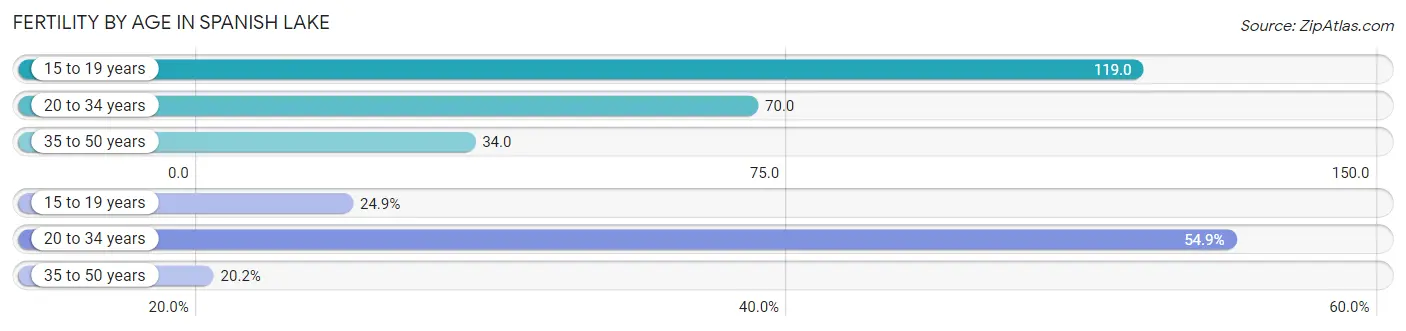
| Age Bracket | Women with Births | Births / 1,000 Women |
| 15 to 19 years | 79 (24.9%) | 119.0 |
| 20 to 34 years | 174 (54.9%) | 70.0 |
| 35 to 50 years | 64 (20.2%) | 34.0 |
| Total | 317 (100.0%) | 63.0 |
Fertility by Age by Marriage Status in Spanish Lake
23.3% of women with births (317) in Spanish Lake are married. The highest percentage of unmarried women with births falls into 15 to 19 years age bracket with 100.0% of them unmarried at the time of birth, while the lowest percentage of unmarried women with births belong to 35 to 50 years age bracket with 59.4% of them unmarried.
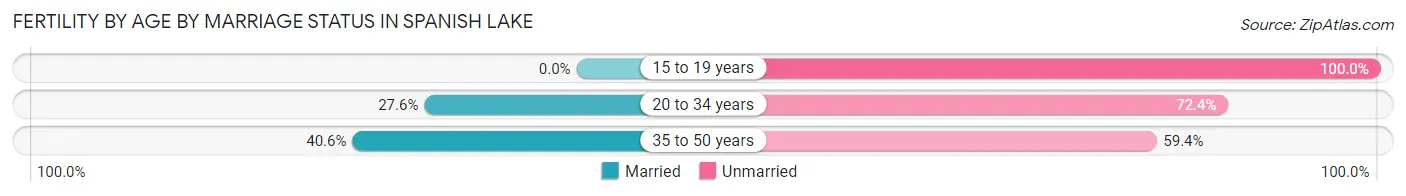
| Age Bracket | Married | Unmarried |
| 15 to 19 years | 0 (0.0%) | 79 (100.0%) |
| 20 to 34 years | 48 (27.6%) | 126 (72.4%) |
| 35 to 50 years | 26 (40.6%) | 38 (59.4%) |
| Total | 74 (23.3%) | 243 (76.7%) |
Fertility by Education in Spanish Lake
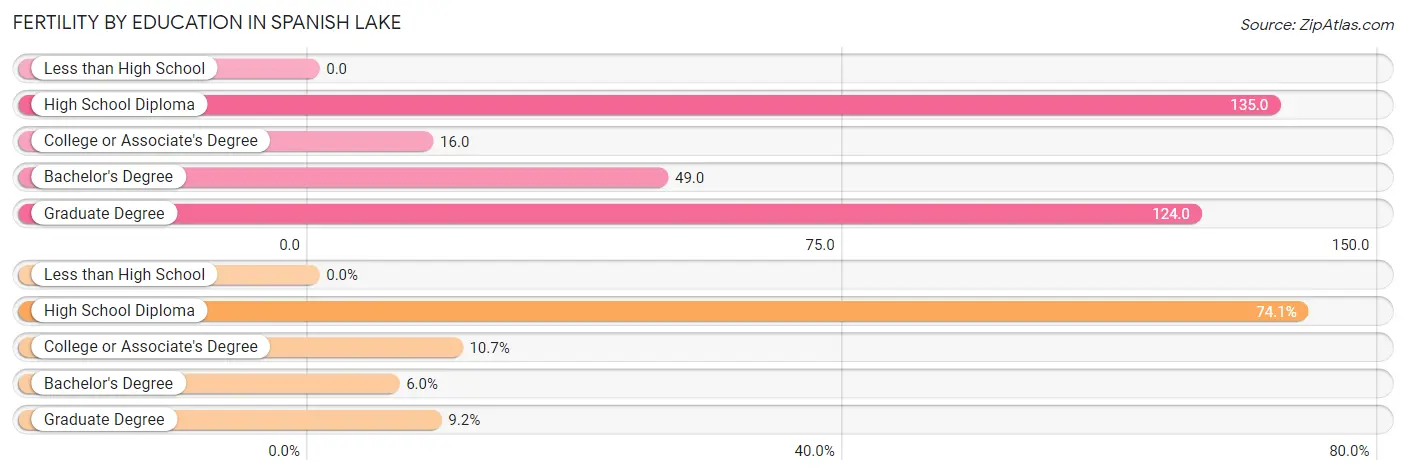
| Educational Attainment | Women with Births | Births / 1,000 Women |
| Less than High School | 0 (0.0%) | 0.0 |
| High School Diploma | 235 (74.1%) | 135.0 |
| College or Associate's Degree | 34 (10.7%) | 16.0 |
| Bachelor's Degree | 19 (6.0%) | 49.0 |
| Graduate Degree | 29 (9.1%) | 124.0 |
| Total | 317 (100.0%) | 63.0 |
Fertility by Education by Marriage Status in Spanish Lake
76.7% of women with births in Spanish Lake are unmarried. Women with the educational attainment of bachelor's degree are most likely to be married with 100.0% of them married at childbirth, while women with the educational attainment of high school diploma are least likely to be married with 96.2% of them unmarried at childbirth.
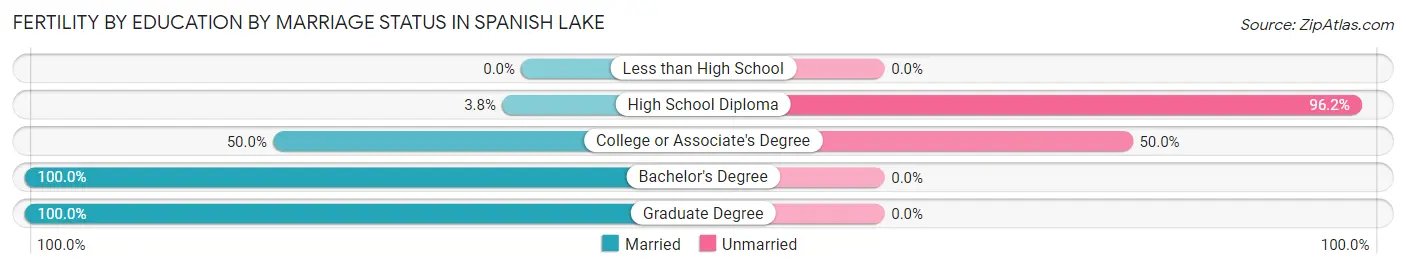
| Educational Attainment | Married | Unmarried |
| Less than High School | 0 (0.0%) | 0 (0.0%) |
| High School Diploma | 9 (3.8%) | 226 (96.2%) |
| College or Associate's Degree | 17 (50.0%) | 17 (50.0%) |
| Bachelor's Degree | 19 (100.0%) | 0 (0.0%) |
| Graduate Degree | 29 (100.0%) | 0 (0.0%) |
| Total | 74 (23.3%) | 243 (76.7%) |
Income in Spanish Lake
Income Overview in Spanish Lake
Per Capita Income in Spanish Lake is $25,662, while median incomes of families and households are $61,484 and $49,639 respectively.
| Characteristic | Number | Measure |
| Per Capita Income | 18,051 | $25,662 |
| Median Family Income | 4,375 | $61,484 |
| Mean Family Income | 4,375 | $74,128 |
| Median Household Income | 7,086 | $49,639 |
| Mean Household Income | 7,086 | $62,948 |
| Income Deficit | 4,375 | $0 |
| Wage / Income Gap (%) | 18,051 | 14.62% |
| Wage / Income Gap ($) | 18,051 | 85.38¢ per $1 |
| Gini / Inequality Index | 18,051 | 0.44 |
Earnings by Sex in Spanish Lake
Average Earnings in Spanish Lake are $28,817, $31,974 for men and $27,299 for women, a difference of 14.6%.
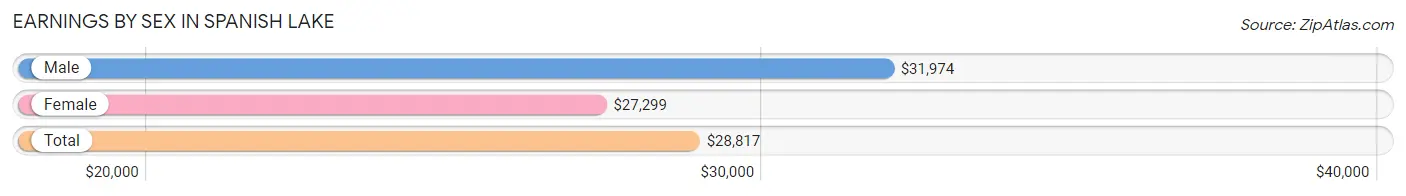
| Sex | Number | Average Earnings |
| Male | 3,799 (40.1%) | $31,974 |
| Female | 5,667 (59.9%) | $27,299 |
| Total | 9,466 (100.0%) | $28,817 |
Earnings by Sex by Income Bracket in Spanish Lake
The most common earnings brackets in Spanish Lake are $17,500 to $19,999 for men (347 | 9.1%) and $25,000 to $29,999 for women (560 | 9.9%).
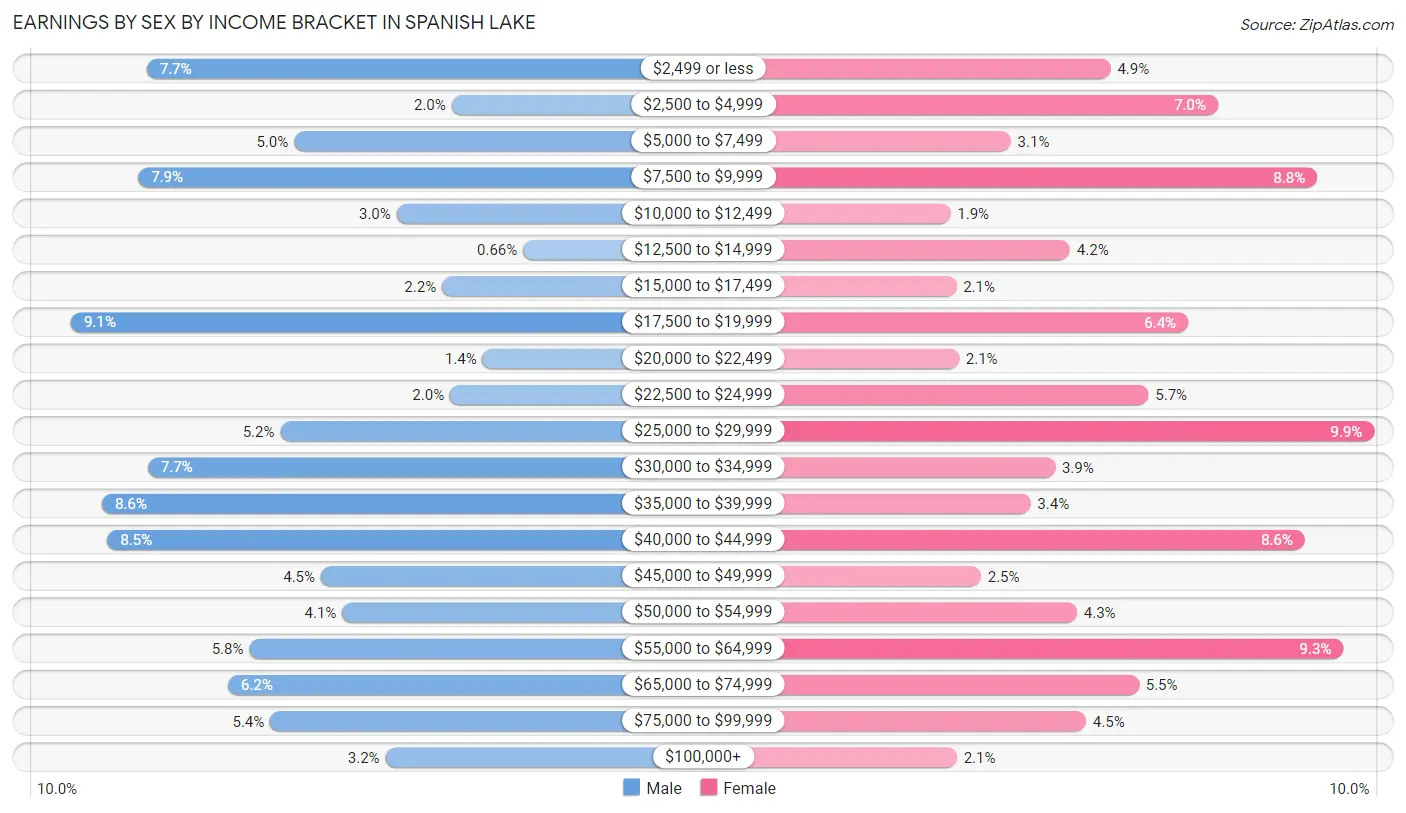
| Income | Male | Female |
| $2,499 or less | 293 (7.7%) | 280 (4.9%) |
| $2,500 to $4,999 | 76 (2.0%) | 394 (7.0%) |
| $5,000 to $7,499 | 188 (5.0%) | 174 (3.1%) |
| $7,500 to $9,999 | 299 (7.9%) | 499 (8.8%) |
| $10,000 to $12,499 | 115 (3.0%) | 110 (1.9%) |
| $12,500 to $14,999 | 25 (0.7%) | 237 (4.2%) |
| $15,000 to $17,499 | 83 (2.2%) | 116 (2.1%) |
| $17,500 to $19,999 | 347 (9.1%) | 362 (6.4%) |
| $20,000 to $22,499 | 54 (1.4%) | 119 (2.1%) |
| $22,500 to $24,999 | 77 (2.0%) | 320 (5.7%) |
| $25,000 to $29,999 | 198 (5.2%) | 560 (9.9%) |
| $30,000 to $34,999 | 292 (7.7%) | 221 (3.9%) |
| $35,000 to $39,999 | 325 (8.6%) | 195 (3.4%) |
| $40,000 to $44,999 | 321 (8.5%) | 486 (8.6%) |
| $45,000 to $49,999 | 169 (4.4%) | 142 (2.5%) |
| $50,000 to $54,999 | 154 (4.1%) | 244 (4.3%) |
| $55,000 to $64,999 | 220 (5.8%) | 527 (9.3%) |
| $65,000 to $74,999 | 235 (6.2%) | 310 (5.5%) |
| $75,000 to $99,999 | 205 (5.4%) | 254 (4.5%) |
| $100,000+ | 123 (3.2%) | 117 (2.1%) |
| Total | 3,799 (100.0%) | 5,667 (100.0%) |
Earnings by Sex by Educational Attainment in Spanish Lake
Average earnings in Spanish Lake are $36,965 for men and $34,320 for women, a difference of 7.2%. Men with an educational attainment of graduate degree enjoy the highest average annual earnings of $70,135, while those with bachelor's degree education earn the least with $32,366. Women with an educational attainment of bachelor's degree earn the most with the average annual earnings of $64,776, while those with high school diploma education have the smallest earnings of $24,407.
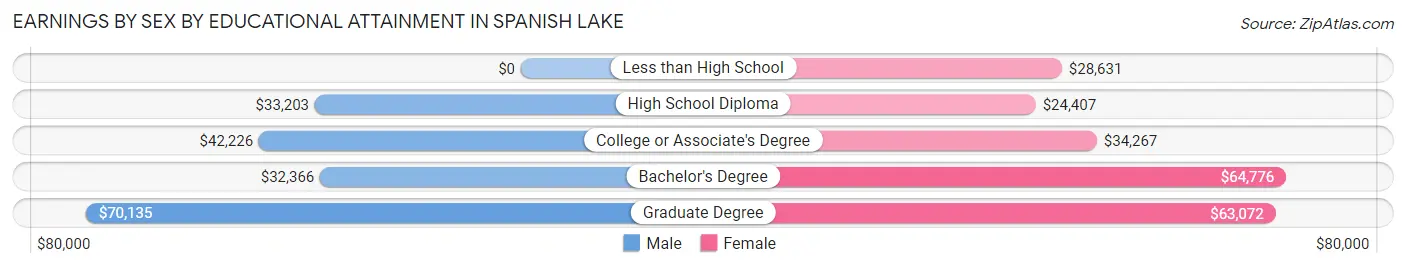
| Educational Attainment | Male Income | Female Income |
| Less than High School | - | - |
| High School Diploma | $33,203 | $24,407 |
| College or Associate's Degree | $42,226 | $34,267 |
| Bachelor's Degree | $32,366 | $64,776 |
| Graduate Degree | $70,135 | $63,072 |
| Total | $36,965 | $34,320 |
Family Income in Spanish Lake
Family Income Brackets in Spanish Lake
According to the Spanish Lake family income data, there are 980 families falling into the $50,000 to $74,999 income range, which is the most common income bracket and makes up 22.4% of all families. Conversely, the $10,000 to $14,999 income bracket is the least frequent group with only 39 families (0.9%) belonging to this category.
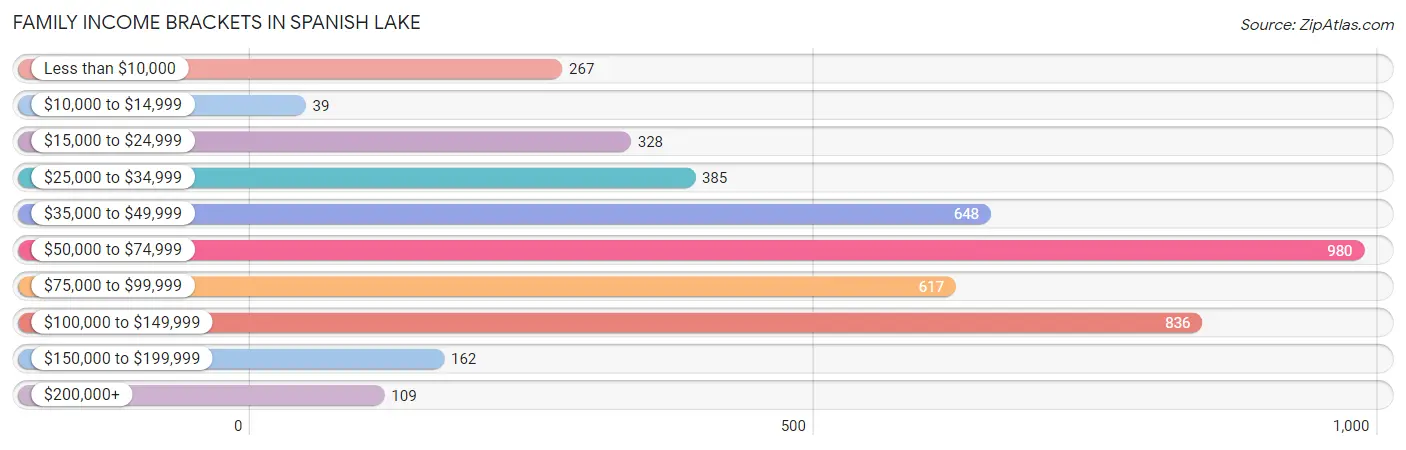
| Income Bracket | # Families | % Families |
| Less than $10,000 | 267 | 6.1% |
| $10,000 to $14,999 | 39 | 0.9% |
| $15,000 to $24,999 | 328 | 7.5% |
| $25,000 to $34,999 | 385 | 8.8% |
| $35,000 to $49,999 | 648 | 14.8% |
| $50,000 to $74,999 | 980 | 22.4% |
| $75,000 to $99,999 | 617 | 14.1% |
| $100,000 to $149,999 | 836 | 19.1% |
| $150,000 to $199,999 | 162 | 3.7% |
| $200,000+ | 109 | 2.5% |
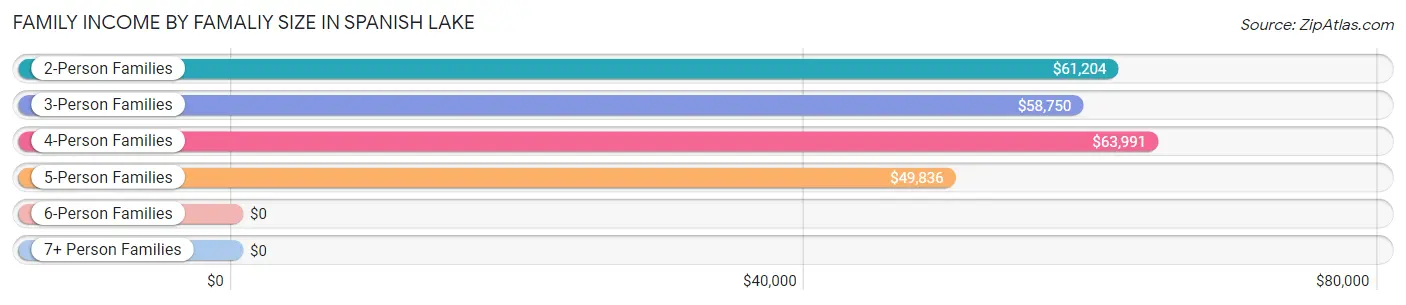
Family Income by Famaliy Size in Spanish Lake
4-person families (538 | 12.3%) account for the highest median family income in Spanish Lake with $63,991 per family, while 2-person families (2,322 | 53.1%) have the highest median income of $30,602 per family member.
| Income Bracket | # Families | Median Income |
| 2-Person Families | 2,322 (53.1%) | $61,204 |
| 3-Person Families | 953 (21.8%) | $58,750 |
| 4-Person Families | 538 (12.3%) | $63,991 |
| 5-Person Families | 389 (8.9%) | $49,836 |
| 6-Person Families | 130 (3.0%) | $0 |
| 7+ Person Families | 43 (1.0%) | $0 |
| Total | 4,375 (100.0%) | $61,484 |
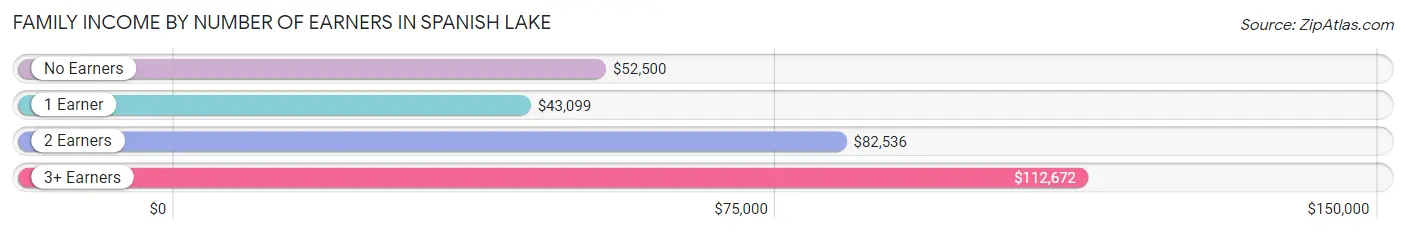
Family Income by Number of Earners in Spanish Lake
The median family income in Spanish Lake is $61,484, with families comprising 3+ earners (470) having the highest median family income of $112,672, while families with 1 earner (1,986) have the lowest median family income of $43,099, accounting for 10.7% and 45.4% of families, respectively.
| Number of Earners | # Families | Median Income |
| No Earners | 400 (9.1%) | $52,500 |
| 1 Earner | 1,986 (45.4%) | $43,099 |
| 2 Earners | 1,519 (34.7%) | $82,536 |
| 3+ Earners | 470 (10.7%) | $112,672 |
| Total | 4,375 (100.0%) | $61,484 |
Household Income in Spanish Lake
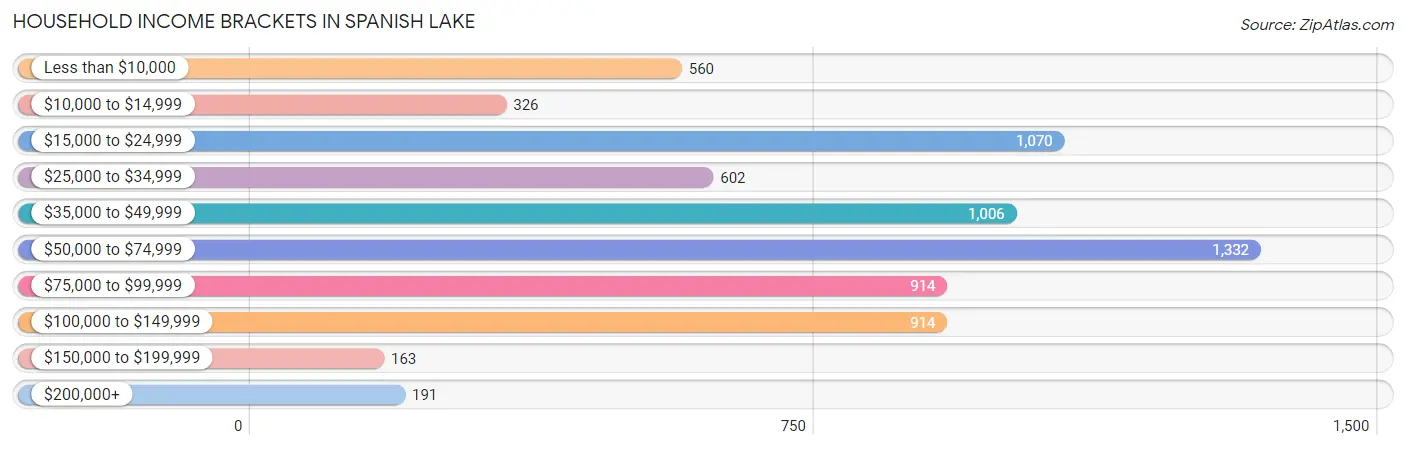
Household Income Brackets in Spanish Lake
With 1,332 households falling in the category, the $50,000 to $74,999 income range is the most frequent in Spanish Lake, accounting for 18.8% of all households. In contrast, only 163 households (2.3%) fall into the $150,000 to $199,999 income bracket, making it the least populous group.
| Income Bracket | # Households | % Households |
| Less than $10,000 | 560 | 7.9% |
| $10,000 to $14,999 | 326 | 4.6% |
| $15,000 to $24,999 | 1,070 | 15.1% |
| $25,000 to $34,999 | 602 | 8.5% |
| $35,000 to $49,999 | 1,006 | 14.2% |
| $50,000 to $74,999 | 1,332 | 18.8% |
| $75,000 to $99,999 | 914 | 12.9% |
| $100,000 to $149,999 | 914 | 12.9% |
| $150,000 to $199,999 | 163 | 2.3% |
| $200,000+ | 191 | 2.7% |
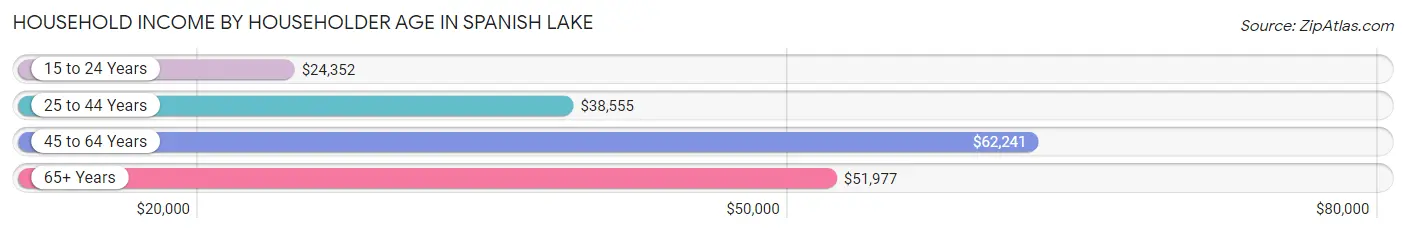
Household Income by Householder Age in Spanish Lake
The median household income in Spanish Lake is $49,639, with the highest median household income of $62,241 found in the 45 to 64 years age bracket for the primary householder. A total of 2,742 households (38.7%) fall into this category. Meanwhile, the 15 to 24 years age bracket for the primary householder has the lowest median household income of $24,352, with 426 households (6.0%) in this group.
| Income Bracket | # Households | Median Income |
| 15 to 24 Years | 426 (6.0%) | $24,352 |
| 25 to 44 Years | 2,335 (33.0%) | $38,555 |
| 45 to 64 Years | 2,742 (38.7%) | $62,241 |
| 65+ Years | 1,583 (22.3%) | $51,977 |
| Total | 7,086 (100.0%) | $49,639 |
Poverty in Spanish Lake
Income Below Poverty by Sex and Age in Spanish Lake
With 20.4% poverty level for males and 17.5% for females among the residents of Spanish Lake, 16 and 17 year old males and under 5 year old females are the most vulnerable to poverty, with 129 males (53.7%) and 256 females (37.0%) in their respective age groups living below the poverty level.
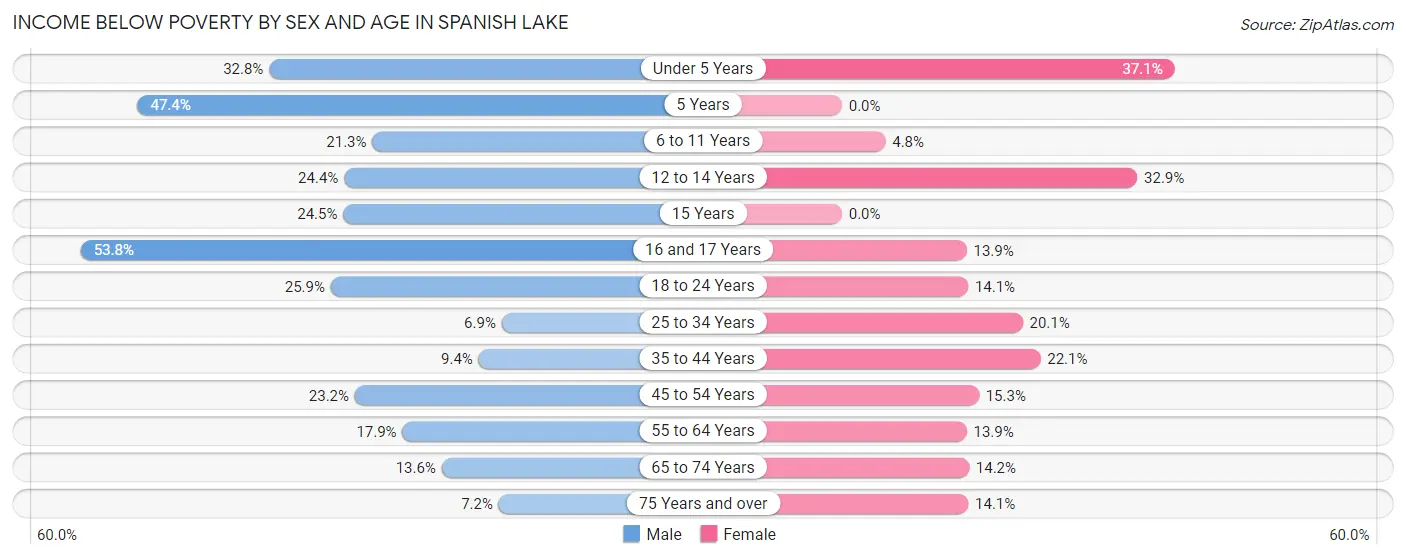
| Age Bracket | Male | Female |
| Under 5 Years | 229 (32.8%) | 256 (37.0%) |
| 5 Years | 92 (47.4%) | 0 (0.0%) |
| 6 to 11 Years | 161 (21.3%) | 33 (4.8%) |
| 12 to 14 Years | 114 (24.4%) | 98 (32.9%) |
| 15 Years | 25 (24.5%) | 0 (0.0%) |
| 16 and 17 Years | 129 (53.7%) | 25 (13.9%) |
| 18 to 24 Years | 251 (25.9%) | 182 (14.1%) |
| 25 to 34 Years | 81 (6.9%) | 309 (20.1%) |
| 35 to 44 Years | 45 (9.4%) | 254 (22.1%) |
| 45 to 54 Years | 218 (23.2%) | 213 (15.2%) |
| 55 to 64 Years | 191 (17.9%) | 151 (13.9%) |
| 65 to 74 Years | 100 (13.6%) | 108 (14.1%) |
| 75 Years and over | 22 (7.2%) | 56 (14.1%) |
| Total | 1,658 (20.4%) | 1,685 (17.5%) |
Income Above Poverty by Sex and Age in Spanish Lake
According to the poverty statistics in Spanish Lake, males aged 25 to 34 years and females aged 5 years are the age groups that are most secure financially, with 93.1% of males and 100.0% of females in these age groups living above the poverty line.
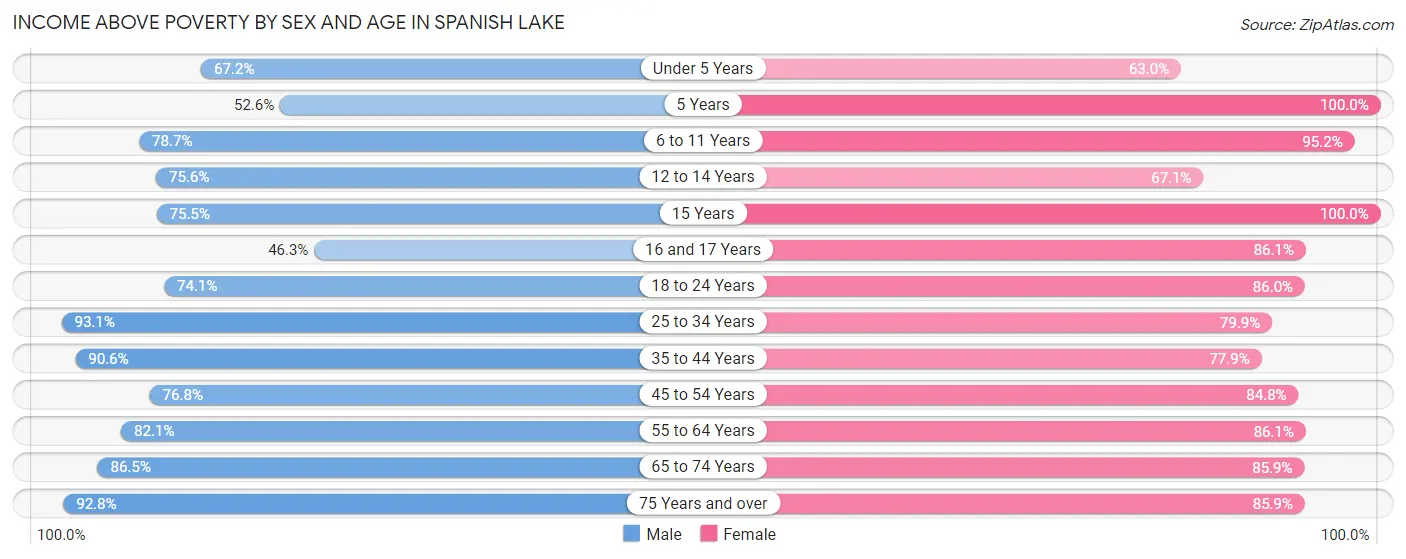
| Age Bracket | Male | Female |
| Under 5 Years | 470 (67.2%) | 435 (62.9%) |
| 5 Years | 102 (52.6%) | 20 (100.0%) |
| 6 to 11 Years | 596 (78.7%) | 649 (95.2%) |
| 12 to 14 Years | 353 (75.6%) | 200 (67.1%) |
| 15 Years | 77 (75.5%) | 129 (100.0%) |
| 16 and 17 Years | 111 (46.3%) | 155 (86.1%) |
| 18 to 24 Years | 718 (74.1%) | 1,113 (86.0%) |
| 25 to 34 Years | 1,099 (93.1%) | 1,226 (79.9%) |
| 35 to 44 Years | 432 (90.6%) | 895 (77.9%) |
| 45 to 54 Years | 721 (76.8%) | 1,184 (84.8%) |
| 55 to 64 Years | 875 (82.1%) | 936 (86.1%) |
| 65 to 74 Years | 638 (86.5%) | 655 (85.9%) |
| 75 Years and over | 284 (92.8%) | 342 (85.9%) |
| Total | 6,476 (79.6%) | 7,939 (82.5%) |
Income Below Poverty Among Married-Couple Families in Spanish Lake
The poverty statistics for married-couple families in Spanish Lake show that 8.9% or 180 of the total 2,023 families live below the poverty line. Families with 3 or 4 children have the highest poverty rate of 25.3%, comprising of 75 families. On the other hand, families with no children have the lowest poverty rate of 5.0%, which includes 67 families.
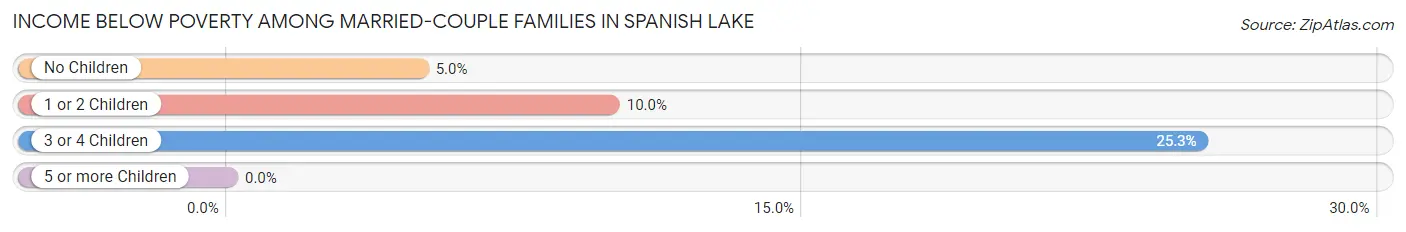
| Children | Above Poverty | Below Poverty |
| No Children | 1,279 (95.0%) | 67 (5.0%) |
| 1 or 2 Children | 343 (90.0%) | 38 (10.0%) |
| 3 or 4 Children | 221 (74.7%) | 75 (25.3%) |
| 5 or more Children | 0 (0.0%) | 0 (0.0%) |
| Total | 1,843 (91.1%) | 180 (8.9%) |
Income Below Poverty Among Single-Parent Households in Spanish Lake
According to the poverty data in Spanish Lake, 20.8% or 86 single-father households and 19.3% or 373 single-mother households are living below the poverty line. Among single-father households, those with 1 or 2 children have the highest poverty rate, with 86 households (28.2%) experiencing poverty. Likewise, among single-mother households, those with 1 or 2 children have the highest poverty rate, with 278 households (29.4%) falling below the poverty line.
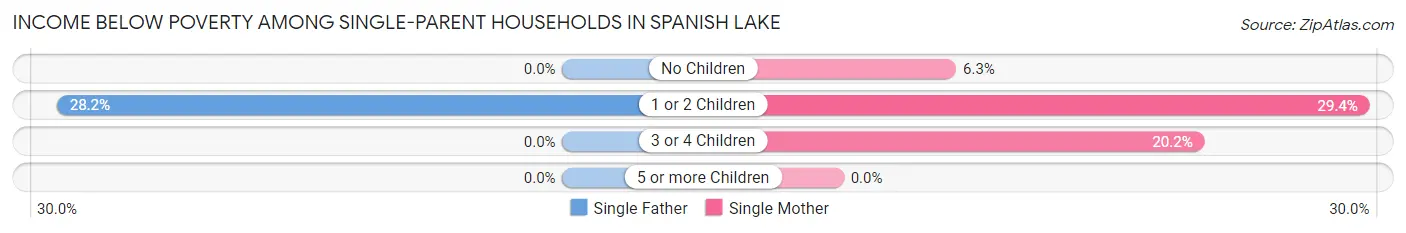
| Children | Single Father | Single Mother |
| No Children | 0 (0.0%) | 44 (6.3%) |
| 1 or 2 Children | 86 (28.2%) | 278 (29.4%) |
| 3 or 4 Children | 0 (0.0%) | 51 (20.2%) |
| 5 or more Children | 0 (0.0%) | 0 (0.0%) |
| Total | 86 (20.8%) | 373 (19.3%) |
Income Below Poverty Among Married-Couple vs Single-Parent Households in Spanish Lake
The poverty data for Spanish Lake shows that 180 of the married-couple family households (8.9%) and 459 of the single-parent households (19.5%) are living below the poverty level. Within the married-couple family households, those with 3 or 4 children have the highest poverty rate, with 75 households (25.3%) falling below the poverty line. Among the single-parent households, those with 1 or 2 children have the highest poverty rate, with 364 household (29.1%) living below poverty.
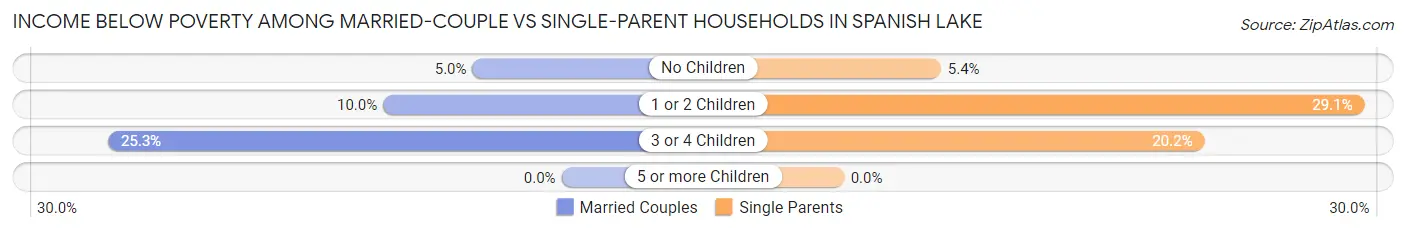
| Children | Married-Couple Families | Single-Parent Households |
| No Children | 67 (5.0%) | 44 (5.4%) |
| 1 or 2 Children | 38 (10.0%) | 364 (29.1%) |
| 3 or 4 Children | 75 (25.3%) | 51 (20.2%) |
| 5 or more Children | 0 (0.0%) | 0 (0.0%) |
| Total | 180 (8.9%) | 459 (19.5%) |
Employment Characteristics in Spanish Lake
Employment by Class of Employer in Spanish Lake
Among the 8,331 employed individuals in Spanish Lake, private company employees (5,631 | 67.6%), not-for-profit organizations (1,251 | 15.0%), and local government employees (533 | 6.4%) make up the most common classes of employment.
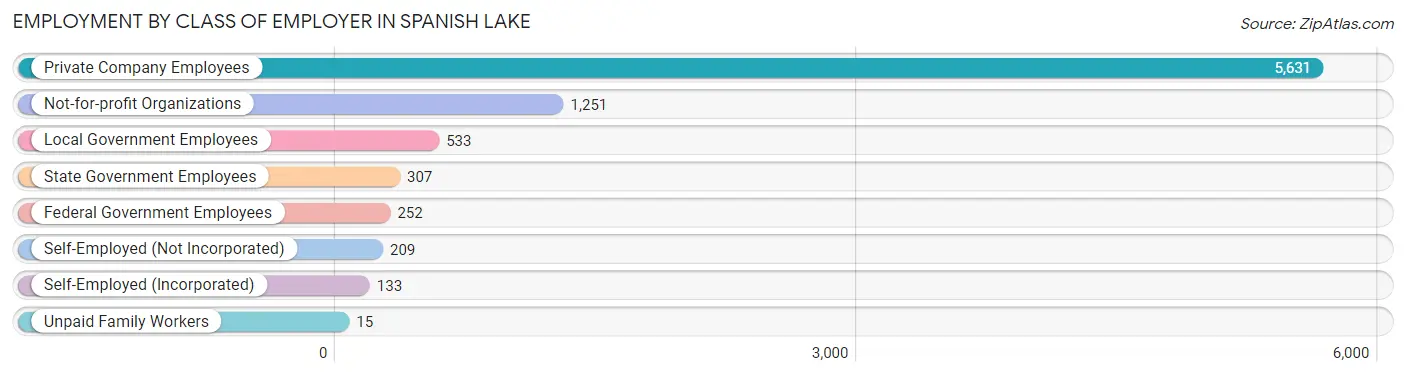
| Employer Class | # Employees | % Employees |
| Private Company Employees | 5,631 | 67.6% |
| Self-Employed (Incorporated) | 133 | 1.6% |
| Self-Employed (Not Incorporated) | 209 | 2.5% |
| Not-for-profit Organizations | 1,251 | 15.0% |
| Local Government Employees | 533 | 6.4% |
| State Government Employees | 307 | 3.7% |
| Federal Government Employees | 252 | 3.0% |
| Unpaid Family Workers | 15 | 0.2% |
| Total | 8,331 | 100.0% |
Employment Status by Age in Spanish Lake
According to the labor force statistics for Spanish Lake, out of the total population over 16 years of age (13,871), 67.6% or 9,377 individuals are in the labor force, with 8.3% or 778 of them unemployed. The age group with the highest labor force participation rate is 25 to 29 years, with 96.9% or 1,550 individuals in the labor force. Within the labor force, the 16 to 19 years age range has the highest percentage of unemployed individuals, with 44.3% or 250 of them being unemployed.
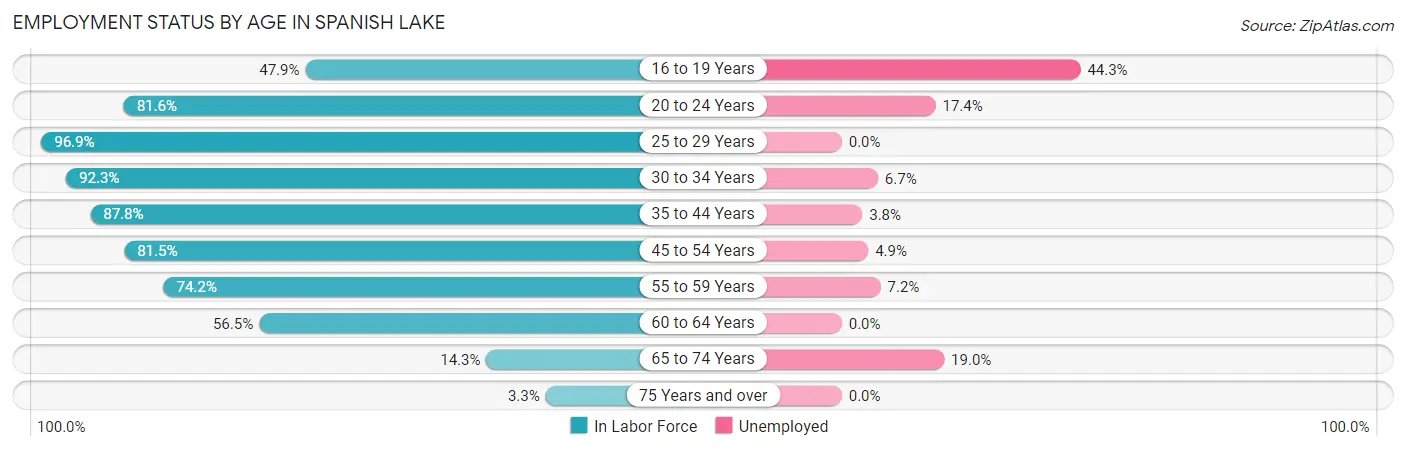
| Age Bracket | In Labor Force | Unemployed |
| 16 to 19 Years | 564 (47.9%) | 250 (44.3%) |
| 20 to 24 Years | 1,244 (81.6%) | 216 (17.4%) |
| 25 to 29 Years | 1,550 (96.9%) | 0 (0.0%) |
| 30 to 34 Years | 1,030 (92.3%) | 69 (6.7%) |
| 35 to 44 Years | 1,428 (87.8%) | 54 (3.8%) |
| 45 to 54 Years | 1,904 (81.5%) | 93 (4.9%) |
| 55 to 59 Years | 817 (74.2%) | 59 (7.2%) |
| 60 to 64 Years | 604 (56.5%) | 0 (0.0%) |
| 65 to 74 Years | 216 (14.3%) | 41 (19.0%) |
| 75 Years and over | 27 (3.3%) | 0 (0.0%) |
| Total | 9,377 (67.6%) | 778 (8.3%) |
Employment Status by Educational Attainment in Spanish Lake
According to labor force statistics for Spanish Lake, 82.9% of individuals (7,335) out of the total population between 25 and 64 years of age (8,848) are in the labor force, with 3.8% or 279 of them being unemployed. The group with the highest labor force participation rate are those with the educational attainment of college / associate degree, with 89.5% or 3,311 individuals in the labor force. Within the labor force, individuals with high school diploma education have the highest percentage of unemployment, with 5.0% or 118 of them being unemployed.
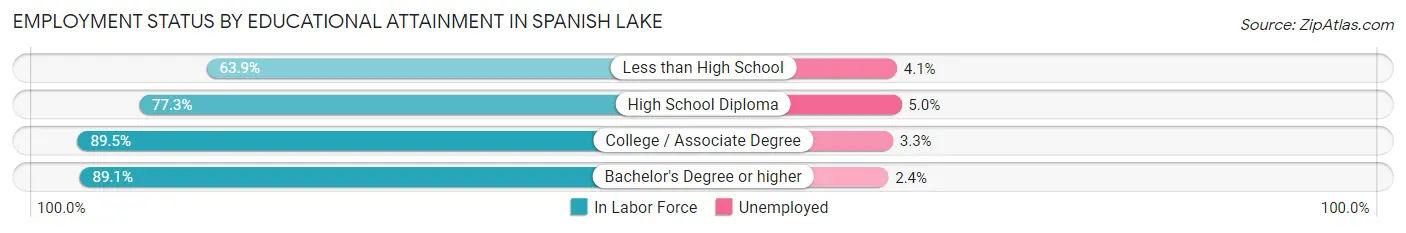
| Educational Attainment | In Labor Force | Unemployed |
| Less than High School | 514 (63.9%) | 33 (4.1%) |
| High School Diploma | 2,361 (77.3%) | 153 (5.0%) |
| College / Associate Degree | 3,311 (89.5%) | 122 (3.3%) |
| Bachelor's Degree or higher | 1,149 (89.1%) | 31 (2.4%) |
| Total | 7,335 (82.9%) | 336 (3.8%) |
Employment Occupations by Sex in Spanish Lake
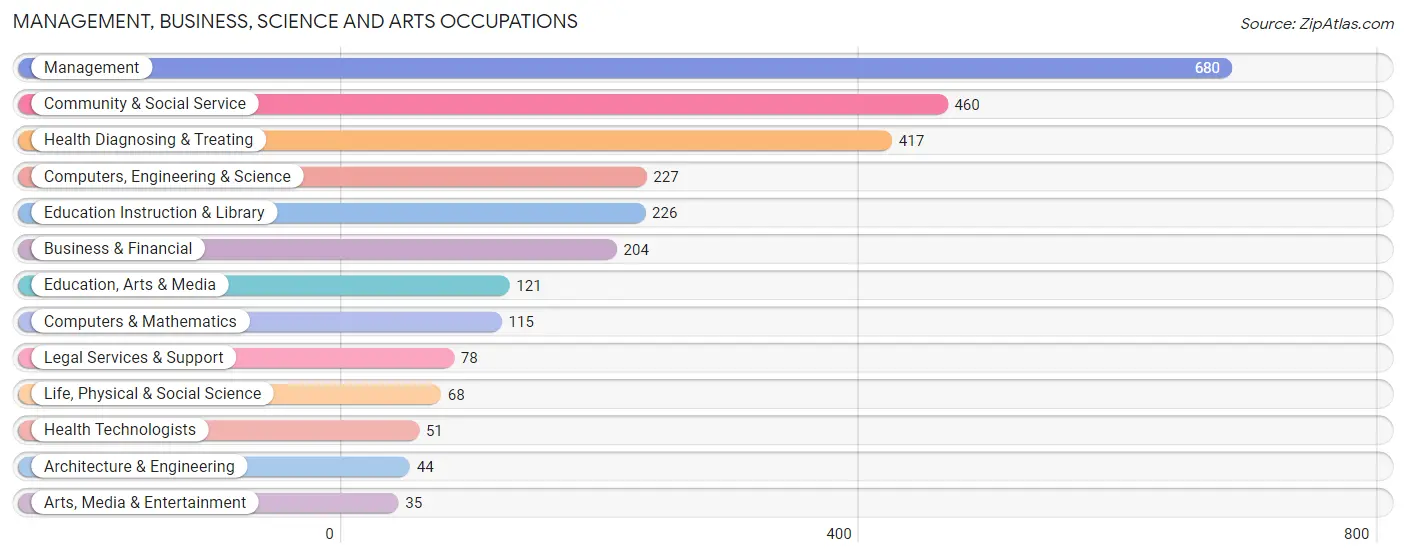
Management, Business, Science and Arts Occupations
The most common Management, Business, Science and Arts occupations in Spanish Lake are Management (680 | 7.9%), Community & Social Service (460 | 5.3%), Health Diagnosing & Treating (417 | 4.9%), Computers, Engineering & Science (227 | 2.6%), and Education Instruction & Library (226 | 2.6%).
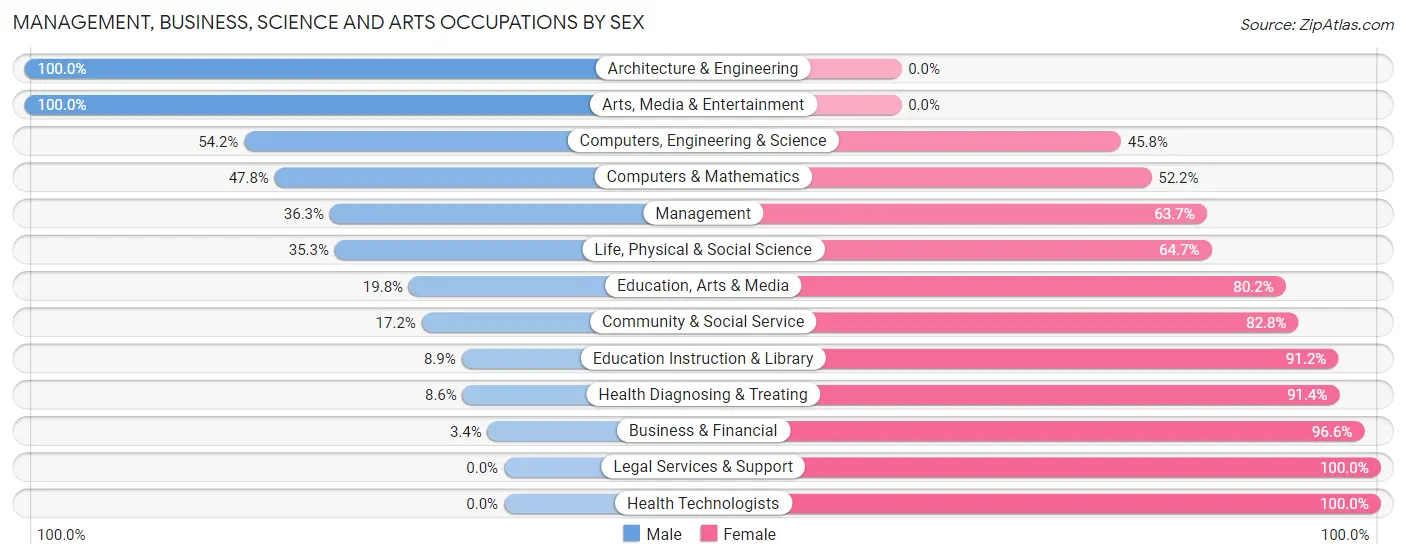
Management, Business, Science and Arts Occupations by Sex
Within the Management, Business, Science and Arts occupations in Spanish Lake, the most male-oriented occupations are Architecture & Engineering (100.0%), Arts, Media & Entertainment (100.0%), and Computers, Engineering & Science (54.2%), while the most female-oriented occupations are Legal Services & Support (100.0%), Health Technologists (100.0%), and Business & Financial (96.6%).
| Occupation | Male | Female |
| Management | 247 (36.3%) | 433 (63.7%) |
| Business & Financial | 7 (3.4%) | 197 (96.6%) |
| Computers, Engineering & Science | 123 (54.2%) | 104 (45.8%) |
| Computers & Mathematics | 55 (47.8%) | 60 (52.2%) |
| Architecture & Engineering | 44 (100.0%) | 0 (0.0%) |
| Life, Physical & Social Science | 24 (35.3%) | 44 (64.7%) |
| Community & Social Service | 79 (17.2%) | 381 (82.8%) |
| Education, Arts & Media | 24 (19.8%) | 97 (80.2%) |
| Legal Services & Support | 0 (0.0%) | 78 (100.0%) |
| Education Instruction & Library | 20 (8.8%) | 206 (91.1%) |
| Arts, Media & Entertainment | 35 (100.0%) | 0 (0.0%) |
| Health Diagnosing & Treating | 36 (8.6%) | 381 (91.4%) |
| Health Technologists | 0 (0.0%) | 51 (100.0%) |
| Total (Category) | 492 (24.7%) | 1,496 (75.2%) |
| Total (Overall) | 3,459 (40.2%) | 5,142 (59.8%) |
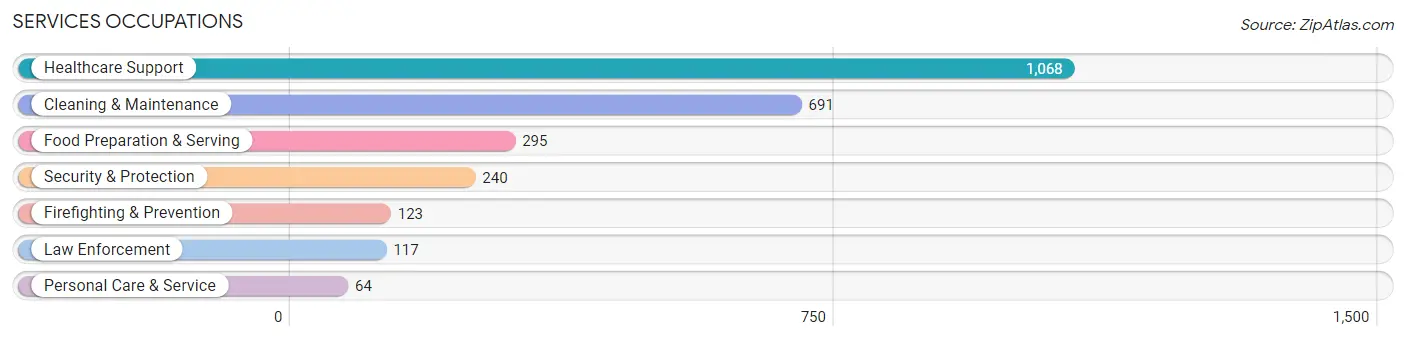
Services Occupations
The most common Services occupations in Spanish Lake are Healthcare Support (1,068 | 12.4%), Cleaning & Maintenance (691 | 8.0%), Food Preparation & Serving (295 | 3.4%), Security & Protection (240 | 2.8%), and Firefighting & Prevention (123 | 1.4%).
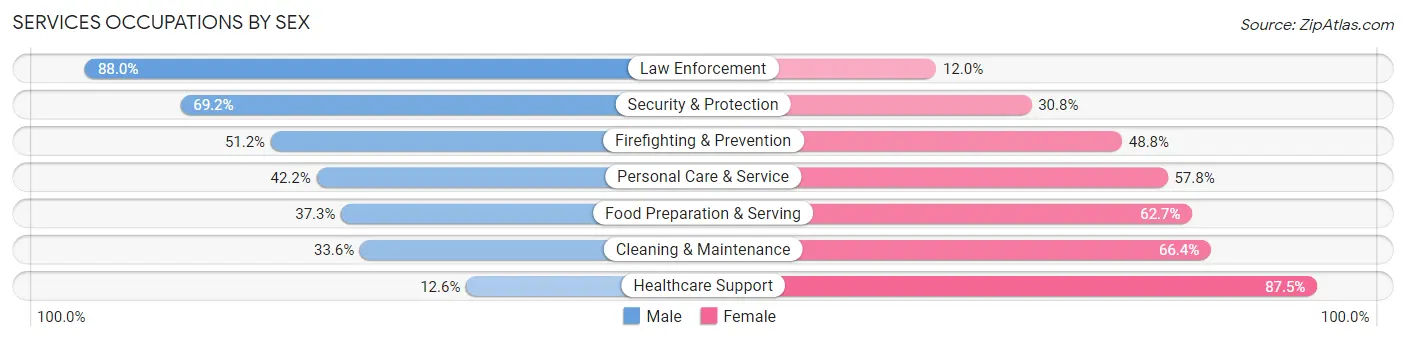
Services Occupations by Sex
Within the Services occupations in Spanish Lake, the most male-oriented occupations are Law Enforcement (88.0%), Security & Protection (69.2%), and Firefighting & Prevention (51.2%), while the most female-oriented occupations are Healthcare Support (87.5%), Cleaning & Maintenance (66.4%), and Food Preparation & Serving (62.7%).
| Occupation | Male | Female |
| Healthcare Support | 134 (12.6%) | 934 (87.5%) |
| Security & Protection | 166 (69.2%) | 74 (30.8%) |
| Firefighting & Prevention | 63 (51.2%) | 60 (48.8%) |
| Law Enforcement | 103 (88.0%) | 14 (12.0%) |
| Food Preparation & Serving | 110 (37.3%) | 185 (62.7%) |
| Cleaning & Maintenance | 232 (33.6%) | 459 (66.4%) |
| Personal Care & Service | 27 (42.2%) | 37 (57.8%) |
| Total (Category) | 669 (28.4%) | 1,689 (71.6%) |
| Total (Overall) | 3,459 (40.2%) | 5,142 (59.8%) |
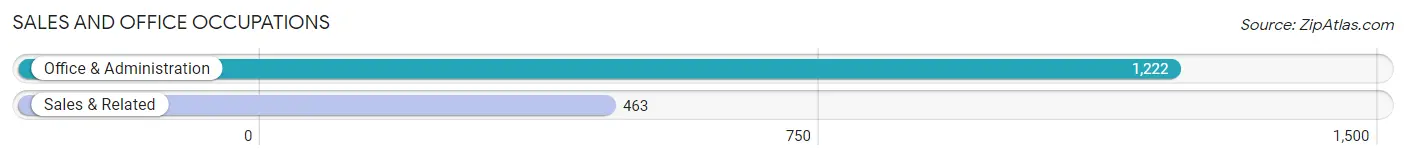
Sales and Office Occupations
The most common Sales and Office occupations in Spanish Lake are Office & Administration (1,222 | 14.2%), and Sales & Related (463 | 5.4%).
Sales and Office Occupations by Sex
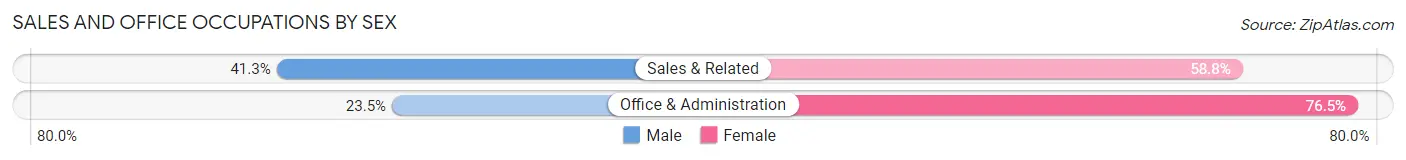
| Occupation | Male | Female |
| Sales & Related | 191 (41.2%) | 272 (58.8%) |
| Office & Administration | 287 (23.5%) | 935 (76.5%) |
| Total (Category) | 478 (28.4%) | 1,207 (71.6%) |
| Total (Overall) | 3,459 (40.2%) | 5,142 (59.8%) |
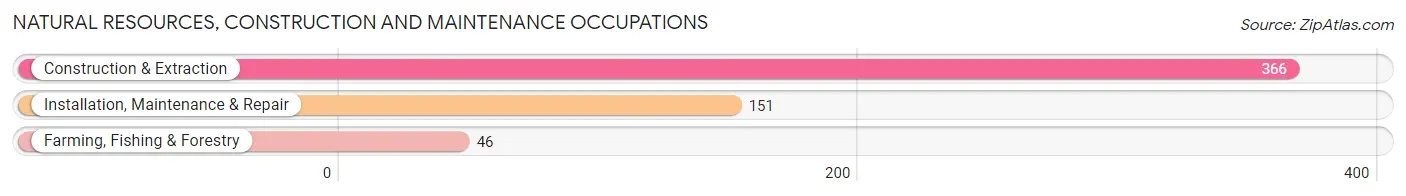
Natural Resources, Construction and Maintenance Occupations
The most common Natural Resources, Construction and Maintenance occupations in Spanish Lake are Construction & Extraction (366 | 4.3%), Installation, Maintenance & Repair (151 | 1.8%), and Farming, Fishing & Forestry (46 | 0.5%).
Natural Resources, Construction and Maintenance Occupations by Sex
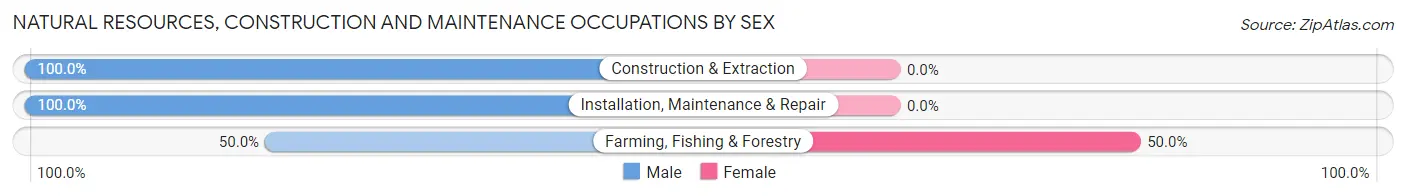
| Occupation | Male | Female |
| Farming, Fishing & Forestry | 23 (50.0%) | 23 (50.0%) |
| Construction & Extraction | 366 (100.0%) | 0 (0.0%) |
| Installation, Maintenance & Repair | 151 (100.0%) | 0 (0.0%) |
| Total (Category) | 540 (95.9%) | 23 (4.1%) |
| Total (Overall) | 3,459 (40.2%) | 5,142 (59.8%) |
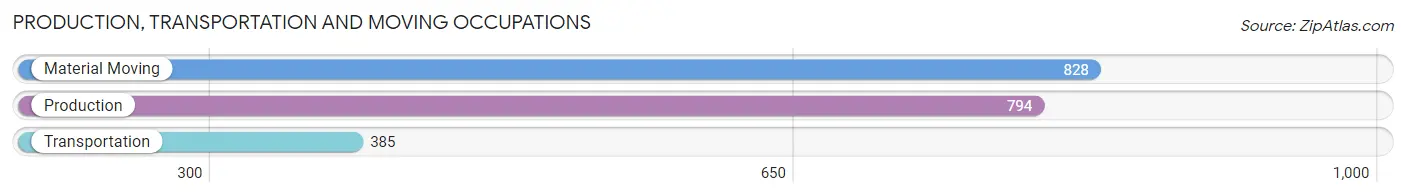
Production, Transportation and Moving Occupations
The most common Production, Transportation and Moving occupations in Spanish Lake are Material Moving (828 | 9.6%), Production (794 | 9.2%), and Transportation (385 | 4.5%).
Production, Transportation and Moving Occupations by Sex
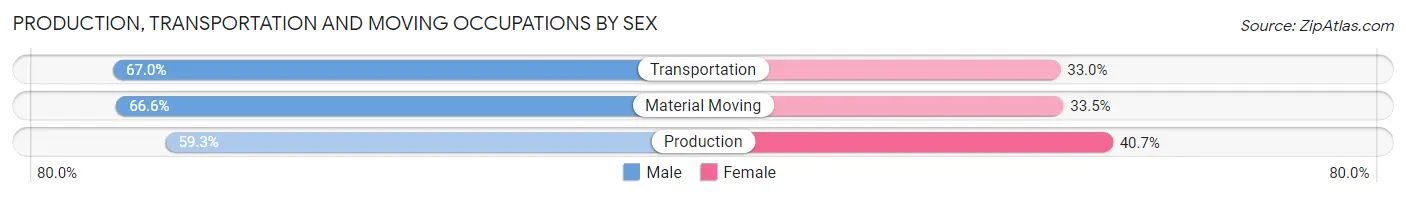
| Occupation | Male | Female |
| Production | 471 (59.3%) | 323 (40.7%) |
| Transportation | 258 (67.0%) | 127 (33.0%) |
| Material Moving | 551 (66.5%) | 277 (33.5%) |
| Total (Category) | 1,280 (63.8%) | 727 (36.2%) |
| Total (Overall) | 3,459 (40.2%) | 5,142 (59.8%) |
Employment Industries by Sex in Spanish Lake
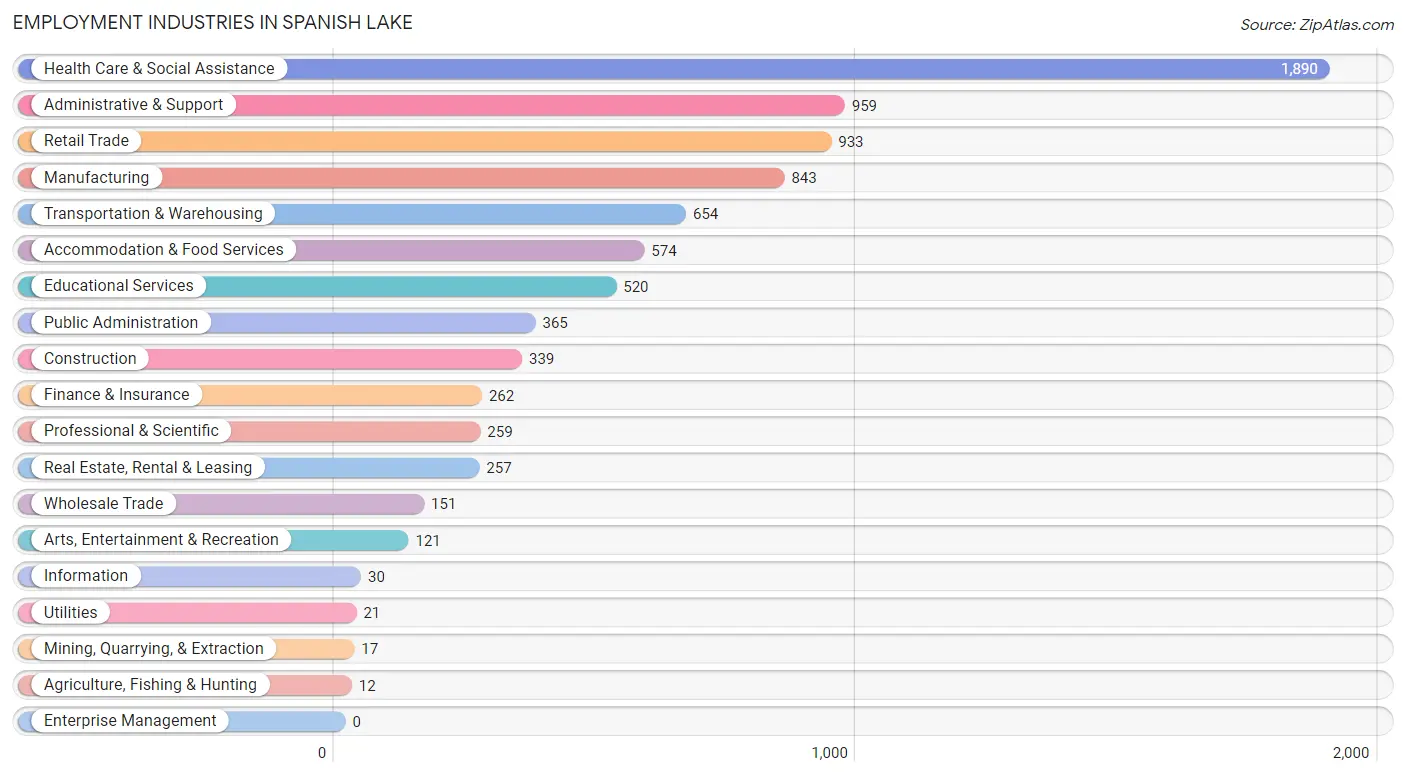
Employment Industries in Spanish Lake
The major employment industries in Spanish Lake include Health Care & Social Assistance (1,890 | 22.0%), Administrative & Support (959 | 11.2%), Retail Trade (933 | 10.8%), Manufacturing (843 | 9.8%), and Transportation & Warehousing (654 | 7.6%).
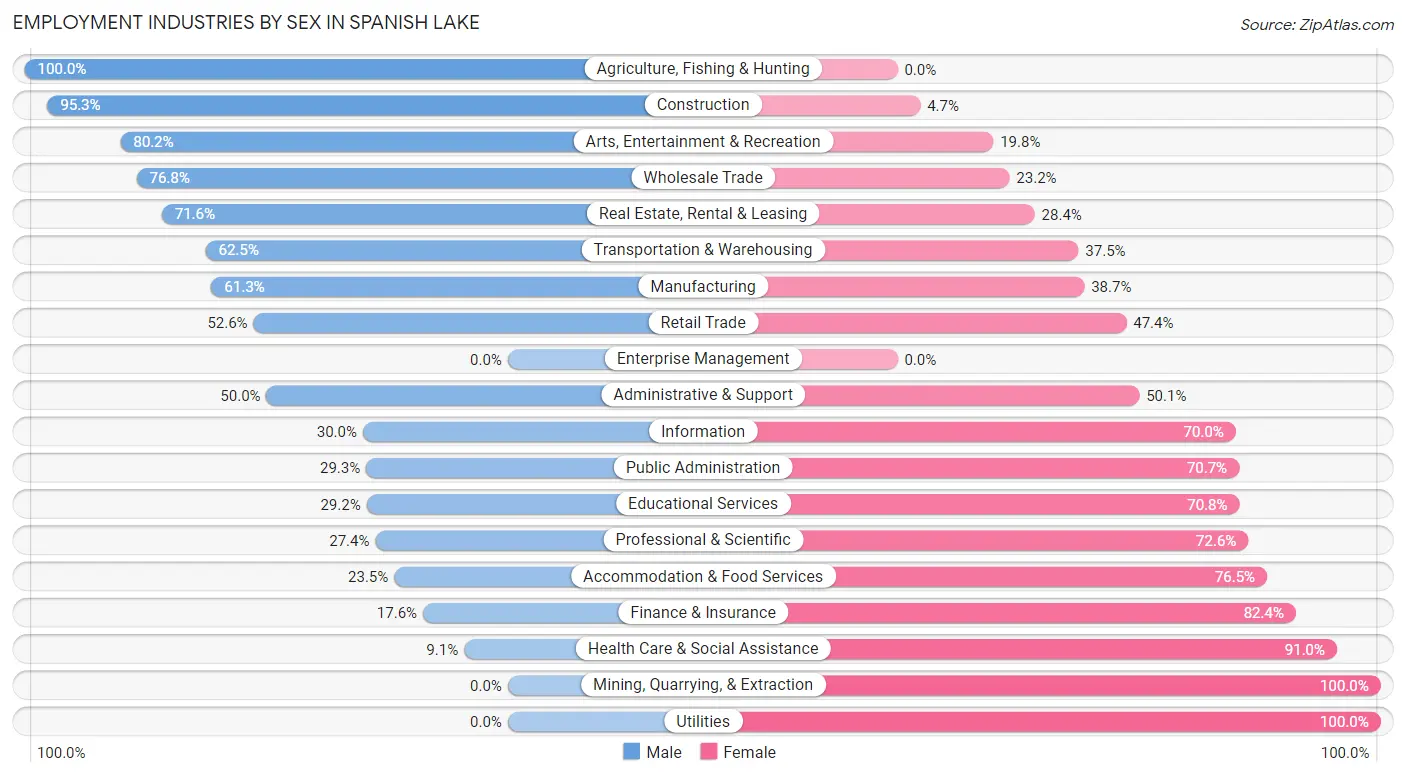
Employment Industries by Sex in Spanish Lake
The Spanish Lake industries that see more men than women are Agriculture, Fishing & Hunting (100.0%), Construction (95.3%), and Arts, Entertainment & Recreation (80.2%), whereas the industries that tend to have a higher number of women are Mining, Quarrying, & Extraction (100.0%), Utilities (100.0%), and Health Care & Social Assistance (90.9%).
| Industry | Male | Female |
| Agriculture, Fishing & Hunting | 12 (100.0%) | 0 (0.0%) |
| Mining, Quarrying, & Extraction | 0 (0.0%) | 17 (100.0%) |
| Construction | 323 (95.3%) | 16 (4.7%) |
| Manufacturing | 517 (61.3%) | 326 (38.7%) |
| Wholesale Trade | 116 (76.8%) | 35 (23.2%) |
| Retail Trade | 491 (52.6%) | 442 (47.4%) |
| Transportation & Warehousing | 409 (62.5%) | 245 (37.5%) |
| Utilities | 0 (0.0%) | 21 (100.0%) |
| Information | 9 (30.0%) | 21 (70.0%) |
| Finance & Insurance | 46 (17.6%) | 216 (82.4%) |
| Real Estate, Rental & Leasing | 184 (71.6%) | 73 (28.4%) |
| Professional & Scientific | 71 (27.4%) | 188 (72.6%) |
| Enterprise Management | 0 (0.0%) | 0 (0.0%) |
| Administrative & Support | 479 (49.9%) | 480 (50.0%) |
| Educational Services | 152 (29.2%) | 368 (70.8%) |
| Health Care & Social Assistance | 171 (9.0%) | 1,719 (90.9%) |
| Arts, Entertainment & Recreation | 97 (80.2%) | 24 (19.8%) |
| Accommodation & Food Services | 135 (23.5%) | 439 (76.5%) |
| Public Administration | 107 (29.3%) | 258 (70.7%) |
| Total | 3,459 (40.2%) | 5,142 (59.8%) |
Education in Spanish Lake
School Enrollment in Spanish Lake
The most common levels of schooling among the 4,852 students in Spanish Lake are college / undergraduate (1,132 | 23.3%), middle school (1,085 | 22.4%), and elementary school (985 | 20.3%).
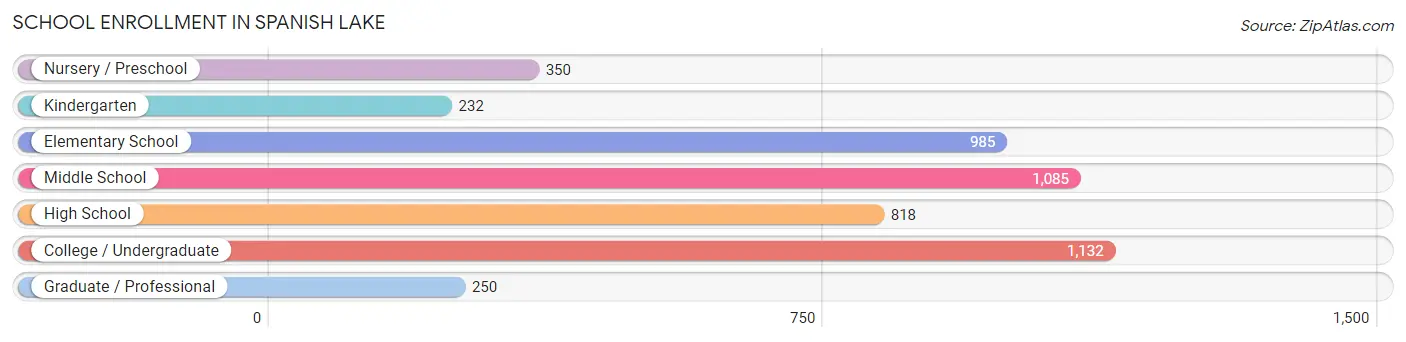
| School Level | # Students | % Students |
| Nursery / Preschool | 350 | 7.2% |
| Kindergarten | 232 | 4.8% |
| Elementary School | 985 | 20.3% |
| Middle School | 1,085 | 22.4% |
| High School | 818 | 16.9% |
| College / Undergraduate | 1,132 | 23.3% |
| Graduate / Professional | 250 | 5.1% |
| Total | 4,852 | 100.0% |
School Enrollment by Age by Funding Source in Spanish Lake
Out of a total of 4,852 students who are enrolled in schools in Spanish Lake, 738 (15.2%) attend a private institution, while the remaining 4,114 (84.8%) are enrolled in public schools. The age group of 35 years and over has the highest likelihood of being enrolled in private schools, with 185 (45.6% in the age bracket) enrolled. Conversely, the age group of 25 to 34 year olds has the lowest likelihood of being enrolled in a private school, with 127 (99.2% in the age bracket) attending a public institution.
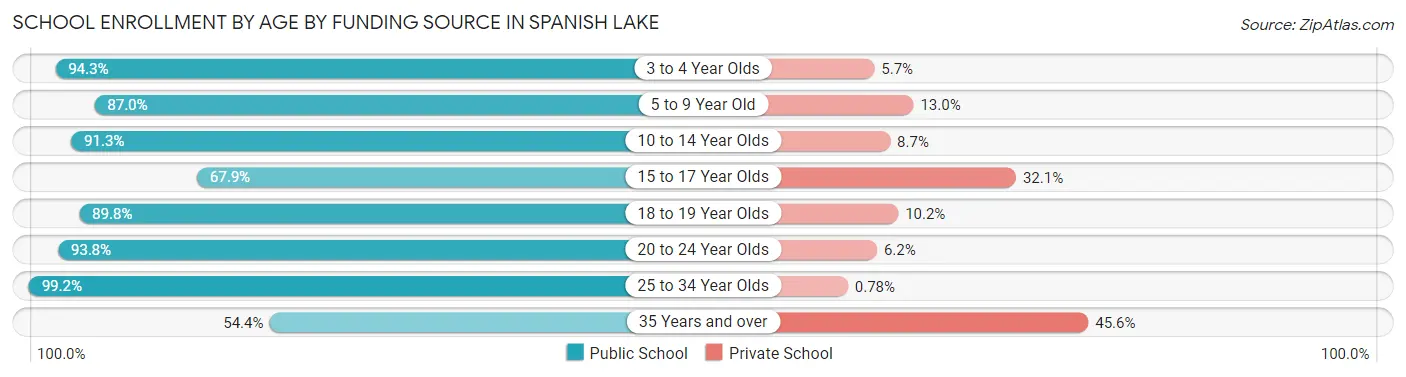
| Age Bracket | Public School | Private School |
| 3 to 4 Year Olds | 231 (94.3%) | 14 (5.7%) |
| 5 to 9 Year Old | 937 (87.0%) | 140 (13.0%) |
| 10 to 14 Year Olds | 1,245 (91.3%) | 118 (8.7%) |
| 15 to 17 Year Olds | 442 (67.9%) | 209 (32.1%) |
| 18 to 19 Year Olds | 230 (89.8%) | 26 (10.2%) |
| 20 to 24 Year Olds | 681 (93.8%) | 45 (6.2%) |
| 25 to 34 Year Olds | 127 (99.2%) | 1 (0.8%) |
| 35 Years and over | 221 (54.4%) | 185 (45.6%) |
| Total | 4,114 (84.8%) | 738 (15.2%) |
Educational Attainment by Field of Study in Spanish Lake
Business (566 | 32.2%), education (275 | 15.6%), liberal arts & history (176 | 10.0%), computers & mathematics (142 | 8.1%), and science & technology (131 | 7.4%) are the most common fields of study among 1,760 individuals in Spanish Lake who have obtained a bachelor's degree or higher.
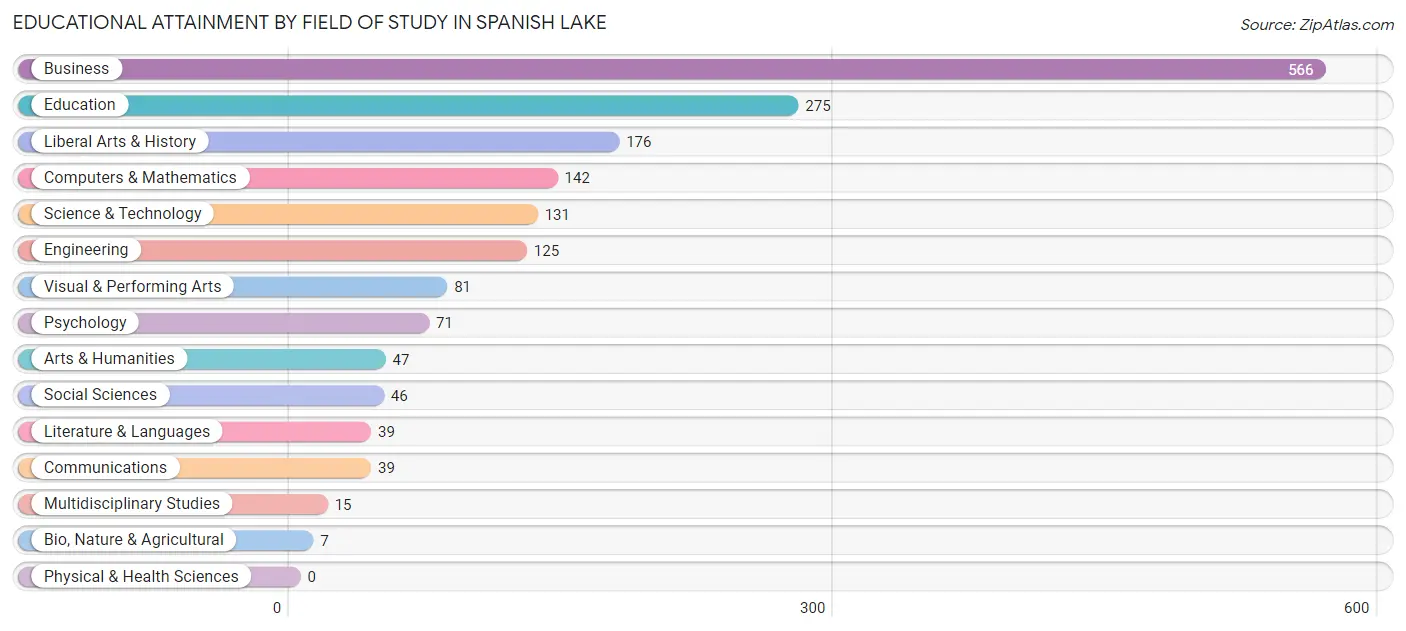
| Field of Study | # Graduates | % Graduates |
| Computers & Mathematics | 142 | 8.1% |
| Bio, Nature & Agricultural | 7 | 0.4% |
| Physical & Health Sciences | 0 | 0.0% |
| Psychology | 71 | 4.0% |
| Social Sciences | 46 | 2.6% |
| Engineering | 125 | 7.1% |
| Multidisciplinary Studies | 15 | 0.9% |
| Science & Technology | 131 | 7.4% |
| Business | 566 | 32.2% |
| Education | 275 | 15.6% |
| Literature & Languages | 39 | 2.2% |
| Liberal Arts & History | 176 | 10.0% |
| Visual & Performing Arts | 81 | 4.6% |
| Communications | 39 | 2.2% |
| Arts & Humanities | 47 | 2.7% |
| Total | 1,760 | 100.0% |
Transportation & Commute in Spanish Lake
Vehicle Availability by Sex in Spanish Lake
The most prevalent vehicle ownership categories in Spanish Lake are males with 2 vehicles (1,572, accounting for 47.6%) and females with 2 vehicles (2,143, making up 31.3%).
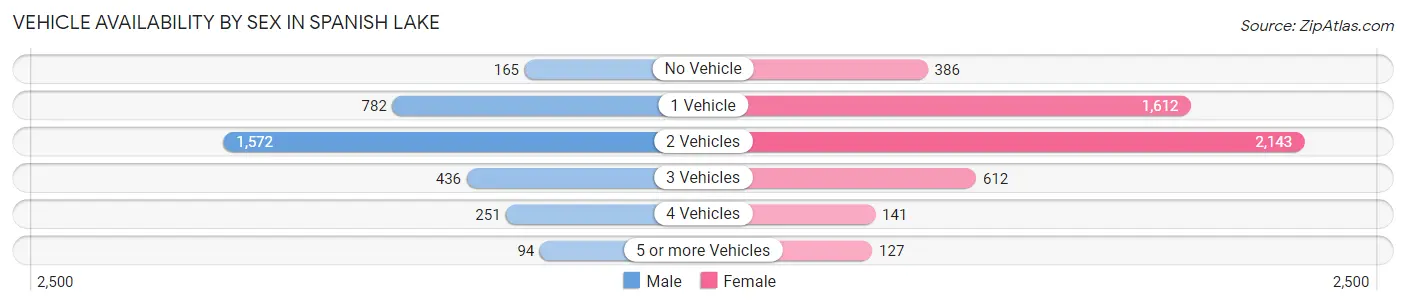
| Vehicles Available | Male | Female |
| No Vehicle | 165 (5.0%) | 386 (7.7%) |
| 1 Vehicle | 782 (23.7%) | 1,612 (32.1%) |
| 2 Vehicles | 1,572 (47.6%) | 2,143 (42.7%) |
| 3 Vehicles | 436 (13.2%) | 612 (12.2%) |
| 4 Vehicles | 251 (7.6%) | 141 (2.8%) |
| 5 or more Vehicles | 94 (2.9%) | 127 (2.5%) |
| Total | 3,300 (100.0%) | 5,021 (100.0%) |
Commute Time in Spanish Lake
The most frequently occuring commute durations in Spanish Lake are 20 to 24 minutes (2,335 commuters, 30.3%), 30 to 34 minutes (1,291 commuters, 16.8%), and 15 to 19 minutes (1,070 commuters, 13.9%).
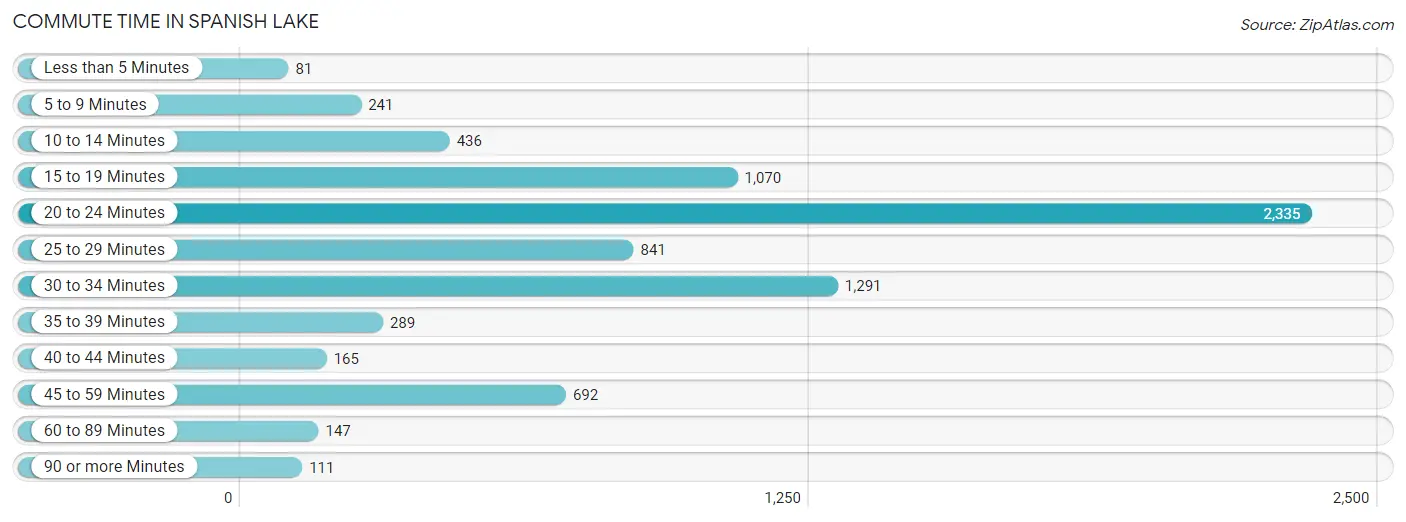
| Commute Time | # Commuters | % Commuters |
| Less than 5 Minutes | 81 | 1.1% |
| 5 to 9 Minutes | 241 | 3.1% |
| 10 to 14 Minutes | 436 | 5.7% |
| 15 to 19 Minutes | 1,070 | 13.9% |
| 20 to 24 Minutes | 2,335 | 30.3% |
| 25 to 29 Minutes | 841 | 10.9% |
| 30 to 34 Minutes | 1,291 | 16.8% |
| 35 to 39 Minutes | 289 | 3.7% |
| 40 to 44 Minutes | 165 | 2.1% |
| 45 to 59 Minutes | 692 | 9.0% |
| 60 to 89 Minutes | 147 | 1.9% |
| 90 or more Minutes | 111 | 1.4% |
Commute Time by Sex in Spanish Lake
The most common commute times in Spanish Lake are 20 to 24 minutes (1,085 commuters, 34.4%) for males and 20 to 24 minutes (1,250 commuters, 27.5%) for females.
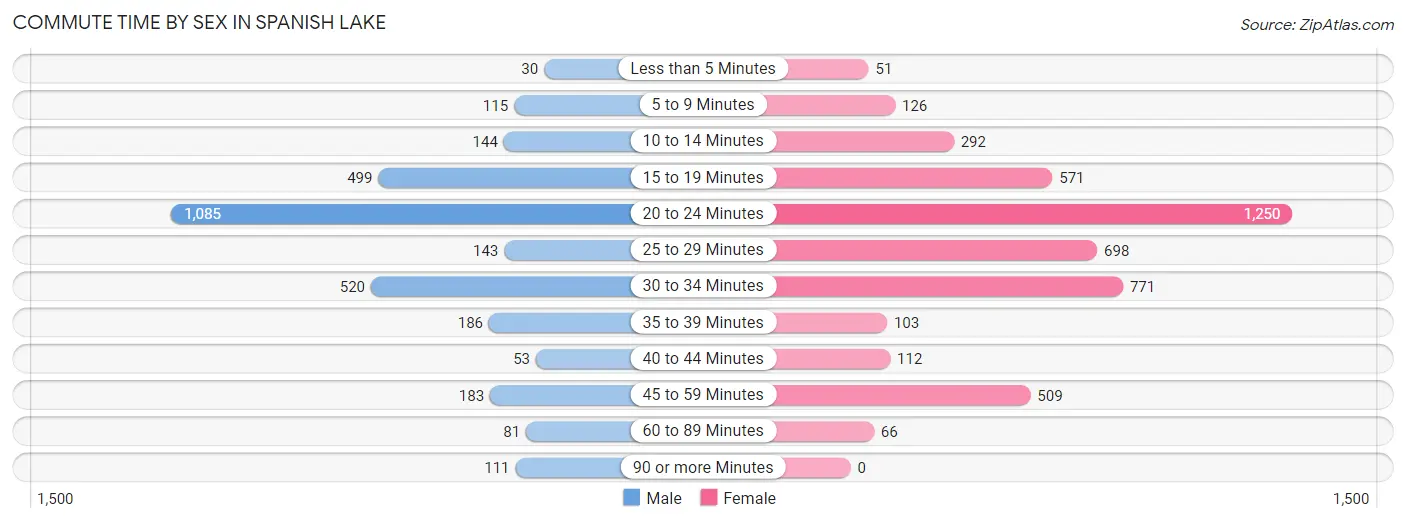
| Commute Time | Male | Female |
| Less than 5 Minutes | 30 (0.9%) | 51 (1.1%) |
| 5 to 9 Minutes | 115 (3.6%) | 126 (2.8%) |
| 10 to 14 Minutes | 144 (4.6%) | 292 (6.4%) |
| 15 to 19 Minutes | 499 (15.8%) | 571 (12.6%) |
| 20 to 24 Minutes | 1,085 (34.4%) | 1,250 (27.5%) |
| 25 to 29 Minutes | 143 (4.5%) | 698 (15.3%) |
| 30 to 34 Minutes | 520 (16.5%) | 771 (17.0%) |
| 35 to 39 Minutes | 186 (5.9%) | 103 (2.3%) |
| 40 to 44 Minutes | 53 (1.7%) | 112 (2.5%) |
| 45 to 59 Minutes | 183 (5.8%) | 509 (11.2%) |
| 60 to 89 Minutes | 81 (2.6%) | 66 (1.5%) |
| 90 or more Minutes | 111 (3.5%) | 0 (0.0%) |
Time of Departure to Work by Sex in Spanish Lake
The most frequent times of departure to work in Spanish Lake are 6:00 AM to 6:29 AM (608, 19.3%) for males and 8:00 AM to 8:29 AM (662, 14.5%) for females.
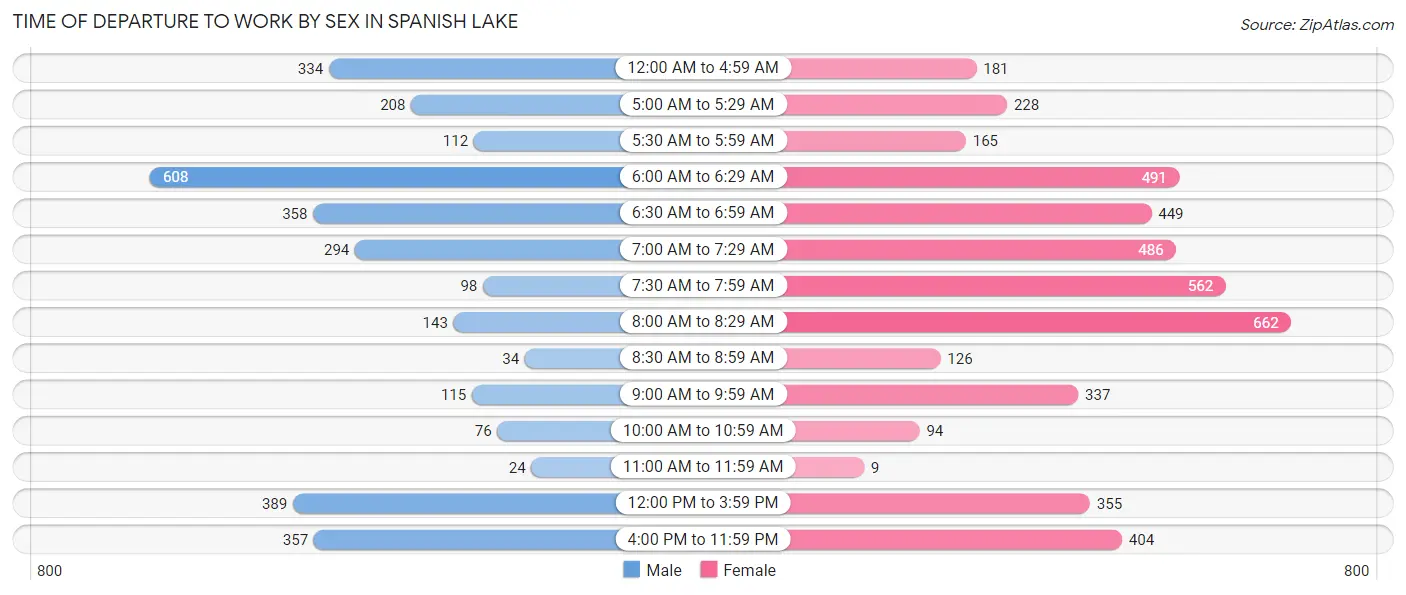
| Time of Departure | Male | Female |
| 12:00 AM to 4:59 AM | 334 (10.6%) | 181 (4.0%) |
| 5:00 AM to 5:29 AM | 208 (6.6%) | 228 (5.0%) |
| 5:30 AM to 5:59 AM | 112 (3.6%) | 165 (3.6%) |
| 6:00 AM to 6:29 AM | 608 (19.3%) | 491 (10.8%) |
| 6:30 AM to 6:59 AM | 358 (11.4%) | 449 (9.9%) |
| 7:00 AM to 7:29 AM | 294 (9.3%) | 486 (10.7%) |
| 7:30 AM to 7:59 AM | 98 (3.1%) | 562 (12.3%) |
| 8:00 AM to 8:29 AM | 143 (4.5%) | 662 (14.5%) |
| 8:30 AM to 8:59 AM | 34 (1.1%) | 126 (2.8%) |
| 9:00 AM to 9:59 AM | 115 (3.6%) | 337 (7.4%) |
| 10:00 AM to 10:59 AM | 76 (2.4%) | 94 (2.1%) |
| 11:00 AM to 11:59 AM | 24 (0.8%) | 9 (0.2%) |
| 12:00 PM to 3:59 PM | 389 (12.3%) | 355 (7.8%) |
| 4:00 PM to 11:59 PM | 357 (11.3%) | 404 (8.9%) |
| Total | 3,150 (100.0%) | 4,549 (100.0%) |
Housing Occupancy in Spanish Lake
Occupancy by Ownership in Spanish Lake
Of the total 7,086 dwellings in Spanish Lake, owner-occupied units account for 3,340 (47.1%), while renter-occupied units make up 3,746 (52.9%).
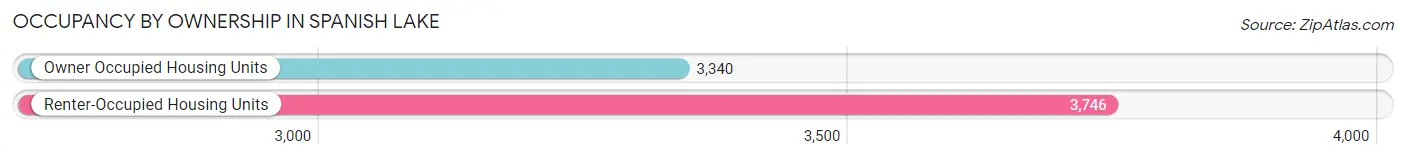
| Occupancy | # Housing Units | % Housing Units |
| Owner Occupied Housing Units | 3,340 | 47.1% |
| Renter-Occupied Housing Units | 3,746 | 52.9% |
| Total Occupied Housing Units | 7,086 | 100.0% |
Occupancy by Household Size in Spanish Lake
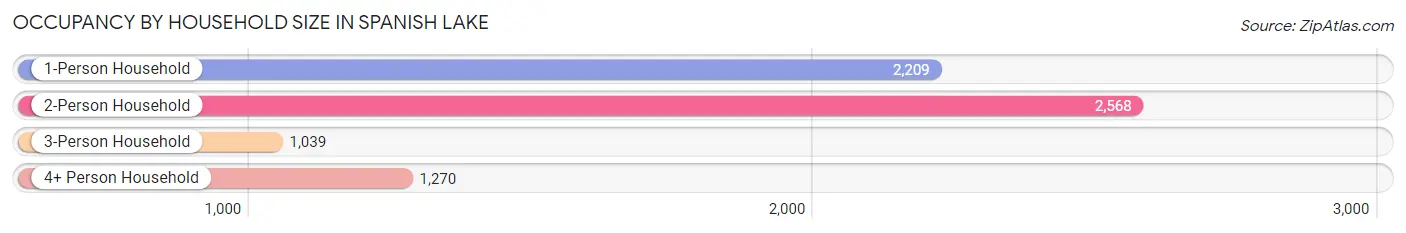
| Household Size | # Housing Units | % Housing Units |
| 1-Person Household | 2,209 | 31.2% |
| 2-Person Household | 2,568 | 36.2% |
| 3-Person Household | 1,039 | 14.7% |
| 4+ Person Household | 1,270 | 17.9% |
| Total Housing Units | 7,086 | 100.0% |
Occupancy by Ownership by Household Size in Spanish Lake
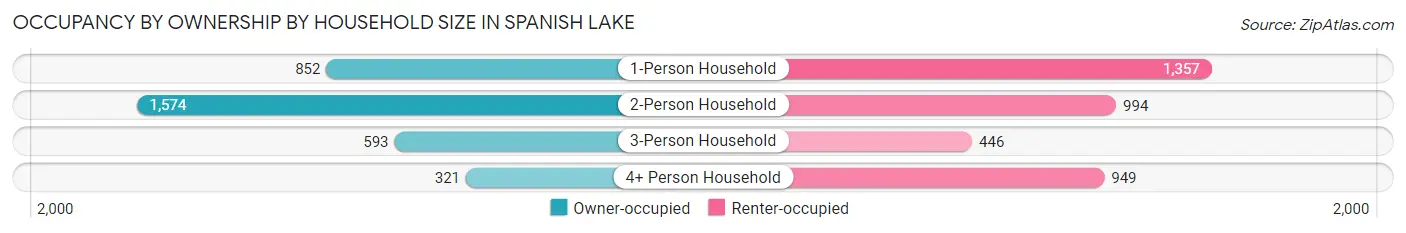
| Household Size | Owner-occupied | Renter-occupied |
| 1-Person Household | 852 (38.6%) | 1,357 (61.4%) |
| 2-Person Household | 1,574 (61.3%) | 994 (38.7%) |
| 3-Person Household | 593 (57.1%) | 446 (42.9%) |
| 4+ Person Household | 321 (25.3%) | 949 (74.7%) |
| Total Housing Units | 3,340 (47.1%) | 3,746 (52.9%) |
Occupancy by Educational Attainment in Spanish Lake
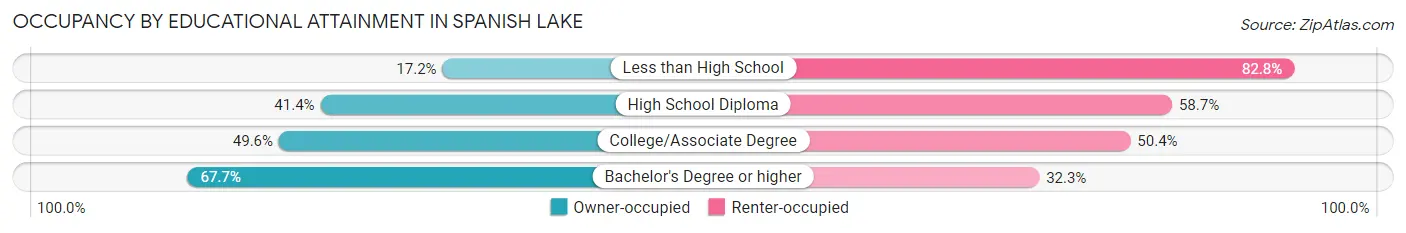
| Household Size | Owner-occupied | Renter-occupied |
| Less than High School | 104 (17.2%) | 502 (82.8%) |
| High School Diploma | 875 (41.3%) | 1,241 (58.7%) |
| College/Associate Degree | 1,624 (49.6%) | 1,651 (50.4%) |
| Bachelor's Degree or higher | 737 (67.7%) | 352 (32.3%) |
Occupancy by Age of Householder in Spanish Lake
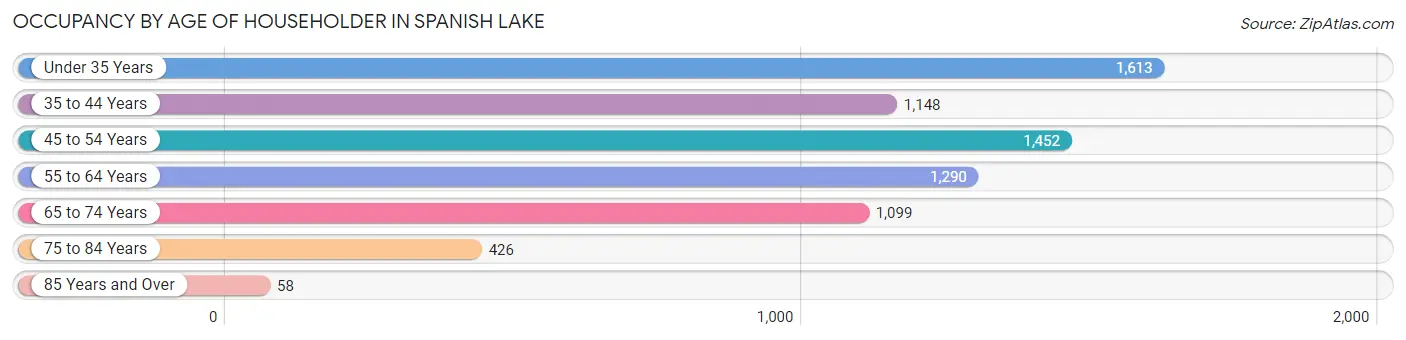
| Age Bracket | # Households | % Households |
| Under 35 Years | 1,613 | 22.8% |
| 35 to 44 Years | 1,148 | 16.2% |
| 45 to 54 Years | 1,452 | 20.5% |
| 55 to 64 Years | 1,290 | 18.2% |
| 65 to 74 Years | 1,099 | 15.5% |
| 75 to 84 Years | 426 | 6.0% |
| 85 Years and Over | 58 | 0.8% |
| Total | 7,086 | 100.0% |
Housing Finances in Spanish Lake
Median Income by Occupancy in Spanish Lake
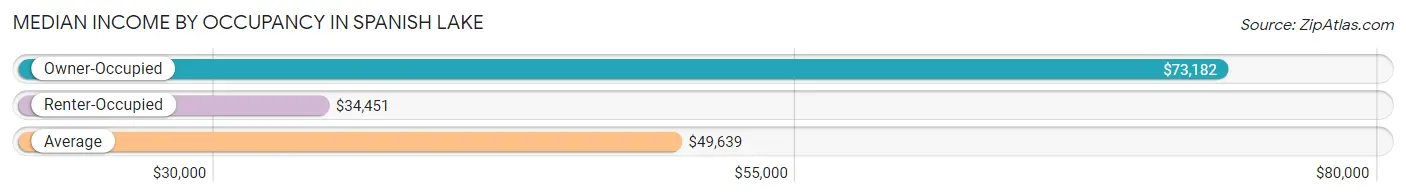
| Occupancy Type | # Households | Median Income |
| Owner-Occupied | 3,340 (47.1%) | $73,182 |
| Renter-Occupied | 3,746 (52.9%) | $34,451 |
| Average | 7,086 (100.0%) | $49,639 |
Occupancy by Householder Income Bracket in Spanish Lake
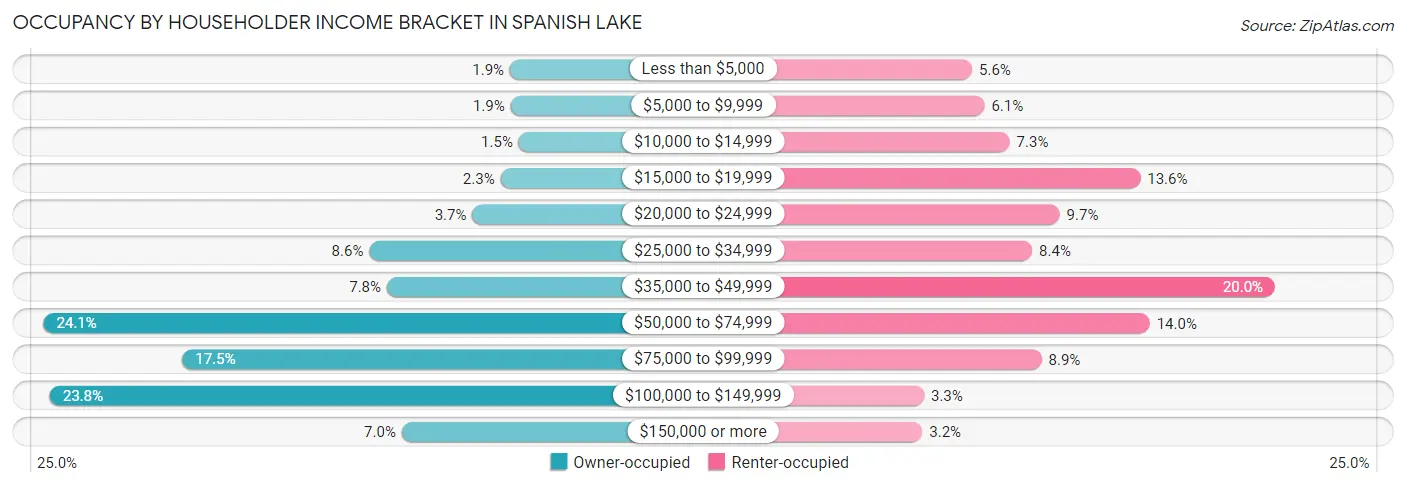
| Income Bracket | Owner-occupied | Renter-occupied |
| Less than $5,000 | 63 (1.9%) | 208 (5.6%) |
| $5,000 to $9,999 | 62 (1.9%) | 230 (6.1%) |
| $10,000 to $14,999 | 49 (1.5%) | 275 (7.3%) |
| $15,000 to $19,999 | 78 (2.3%) | 508 (13.6%) |
| $20,000 to $24,999 | 123 (3.7%) | 364 (9.7%) |
| $25,000 to $34,999 | 287 (8.6%) | 315 (8.4%) |
| $35,000 to $49,999 | 259 (7.7%) | 748 (20.0%) |
| $50,000 to $74,999 | 805 (24.1%) | 525 (14.0%) |
| $75,000 to $99,999 | 584 (17.5%) | 332 (8.9%) |
| $100,000 to $149,999 | 795 (23.8%) | 122 (3.3%) |
| $150,000 or more | 235 (7.0%) | 119 (3.2%) |
| Total | 3,340 (100.0%) | 3,746 (100.0%) |
Monthly Housing Cost Tiers in Spanish Lake
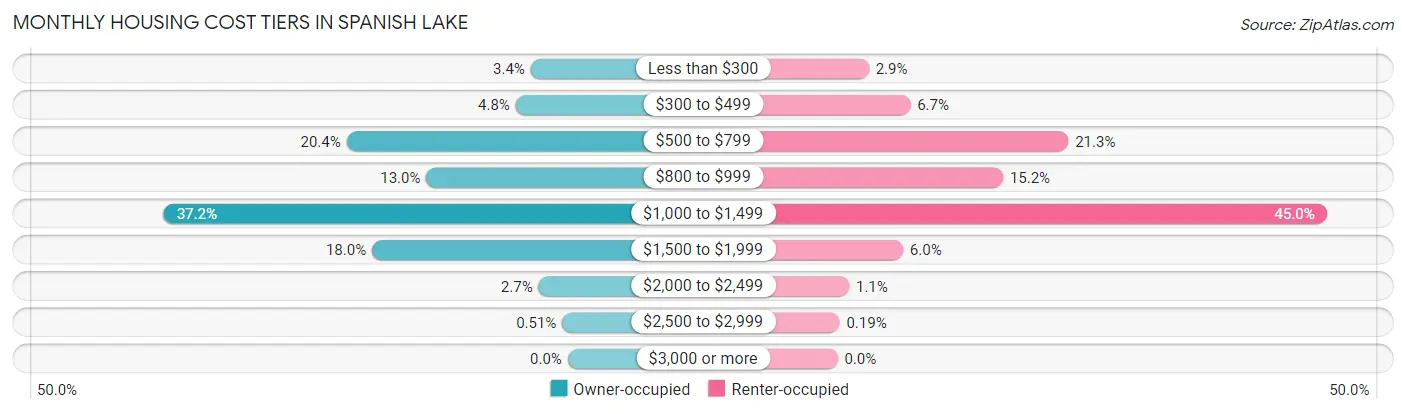
| Monthly Cost | Owner-occupied | Renter-occupied |
| Less than $300 | 114 (3.4%) | 108 (2.9%) |
| $300 to $499 | 160 (4.8%) | 251 (6.7%) |
| $500 to $799 | 680 (20.4%) | 796 (21.2%) |
| $800 to $999 | 435 (13.0%) | 571 (15.2%) |
| $1,000 to $1,499 | 1,242 (37.2%) | 1,687 (45.0%) |
| $1,500 to $1,999 | 602 (18.0%) | 226 (6.0%) |
| $2,000 to $2,499 | 90 (2.7%) | 40 (1.1%) |
| $2,500 to $2,999 | 17 (0.5%) | 7 (0.2%) |
| $3,000 or more | 0 (0.0%) | 0 (0.0%) |
| Total | 3,340 (100.0%) | 3,746 (100.0%) |
Physical Housing Characteristics in Spanish Lake
Housing Structures in Spanish Lake
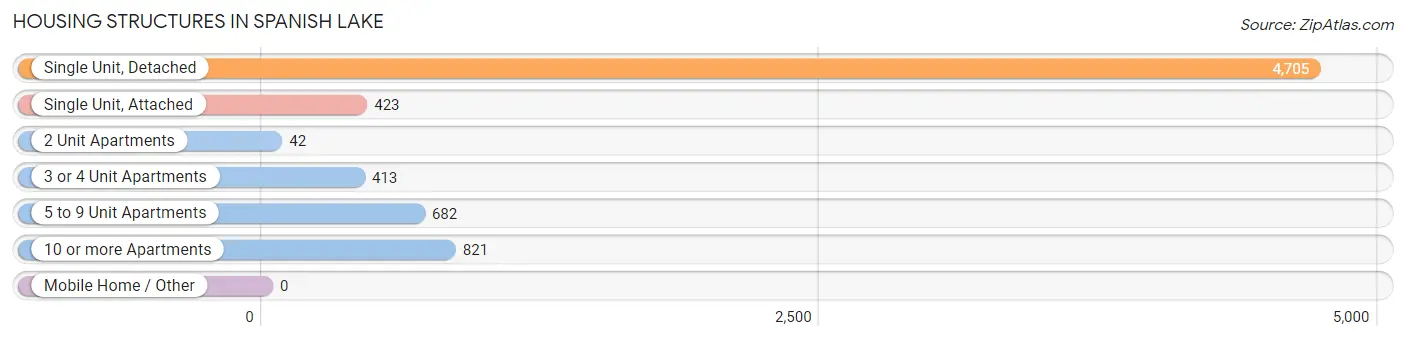
| Structure Type | # Housing Units | % Housing Units |
| Single Unit, Detached | 4,705 | 66.4% |
| Single Unit, Attached | 423 | 6.0% |
| 2 Unit Apartments | 42 | 0.6% |
| 3 or 4 Unit Apartments | 413 | 5.8% |
| 5 to 9 Unit Apartments | 682 | 9.6% |
| 10 or more Apartments | 821 | 11.6% |
| Mobile Home / Other | 0 | 0.0% |
| Total | 7,086 | 100.0% |
Housing Structures by Occupancy in Spanish Lake
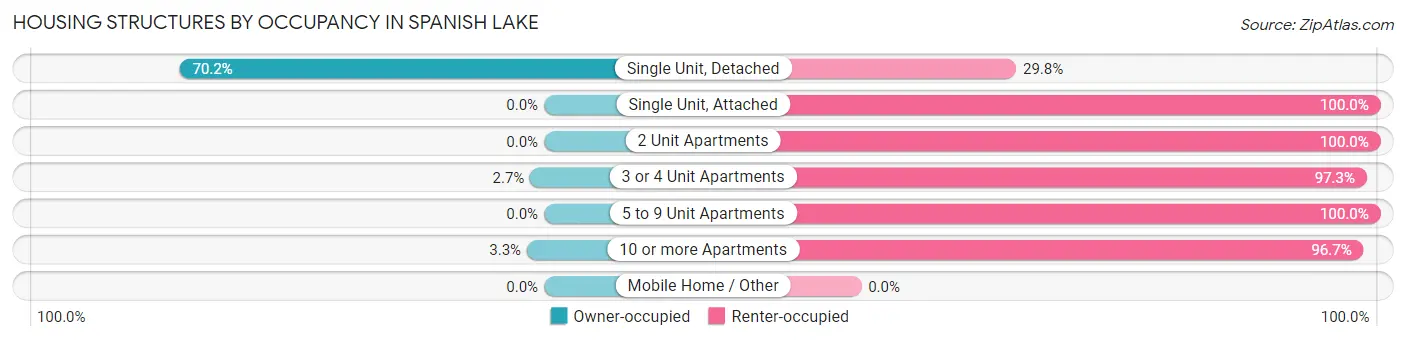
| Structure Type | Owner-occupied | Renter-occupied |
| Single Unit, Detached | 3,302 (70.2%) | 1,403 (29.8%) |
| Single Unit, Attached | 0 (0.0%) | 423 (100.0%) |
| 2 Unit Apartments | 0 (0.0%) | 42 (100.0%) |
| 3 or 4 Unit Apartments | 11 (2.7%) | 402 (97.3%) |
| 5 to 9 Unit Apartments | 0 (0.0%) | 682 (100.0%) |
| 10 or more Apartments | 27 (3.3%) | 794 (96.7%) |
| Mobile Home / Other | 0 (0.0%) | 0 (0.0%) |
| Total | 3,340 (47.1%) | 3,746 (52.9%) |
Housing Structures by Number of Rooms in Spanish Lake
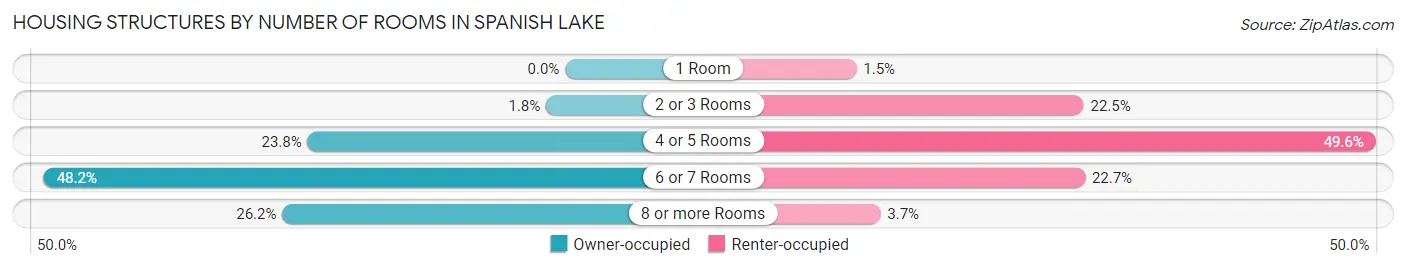
| Number of Rooms | Owner-occupied | Renter-occupied |
| 1 Room | 0 (0.0%) | 57 (1.5%) |
| 2 or 3 Rooms | 59 (1.8%) | 844 (22.5%) |
| 4 or 5 Rooms | 796 (23.8%) | 1,856 (49.5%) |
| 6 or 7 Rooms | 1,611 (48.2%) | 849 (22.7%) |
| 8 or more Rooms | 874 (26.2%) | 140 (3.7%) |
| Total | 3,340 (100.0%) | 3,746 (100.0%) |
Housing Structure by Heating Type in Spanish Lake
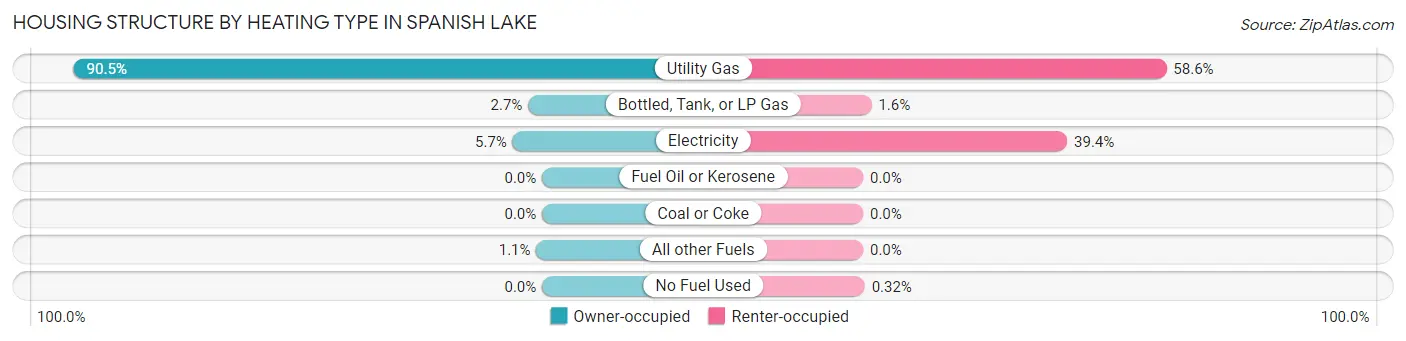
| Heating Type | Owner-occupied | Renter-occupied |
| Utility Gas | 3,023 (90.5%) | 2,196 (58.6%) |
| Bottled, Tank, or LP Gas | 90 (2.7%) | 61 (1.6%) |
| Electricity | 190 (5.7%) | 1,477 (39.4%) |
| Fuel Oil or Kerosene | 0 (0.0%) | 0 (0.0%) |
| Coal or Coke | 0 (0.0%) | 0 (0.0%) |
| All other Fuels | 37 (1.1%) | 0 (0.0%) |
| No Fuel Used | 0 (0.0%) | 12 (0.3%) |
| Total | 3,340 (100.0%) | 3,746 (100.0%) |
Household Vehicle Usage in Spanish Lake
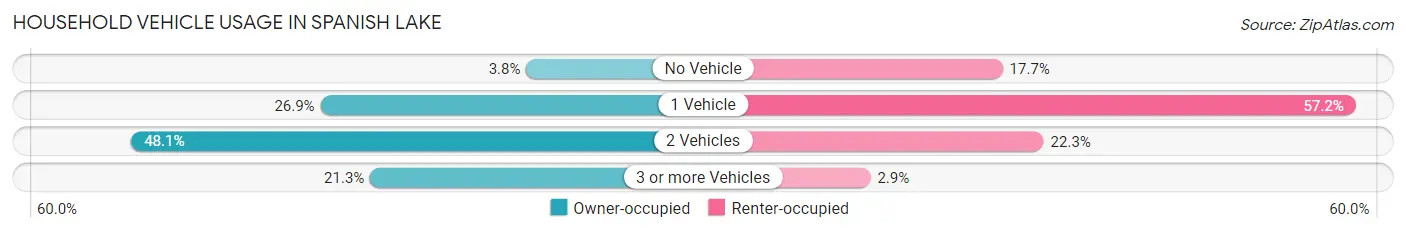
| Vehicles per Household | Owner-occupied | Renter-occupied |
| No Vehicle | 127 (3.8%) | 662 (17.7%) |
| 1 Vehicle | 897 (26.9%) | 2,143 (57.2%) |
| 2 Vehicles | 1,605 (48.0%) | 834 (22.3%) |
| 3 or more Vehicles | 711 (21.3%) | 107 (2.9%) |
| Total | 3,340 (100.0%) | 3,746 (100.0%) |
Real Estate & Mortgages in Spanish Lake
Real Estate and Mortgage Overview in Spanish Lake
| Characteristic | Without Mortgage | With Mortgage |
| Housing Units | 966 | 2,374 |
| Median Property Value | $95,000 | $118,800 |
| Median Household Income | $61,209 | $190 |
| Monthly Housing Costs | $617 | $0 |
| Real Estate Taxes | $1,899 | $41 |
Property Value by Mortgage Status in Spanish Lake
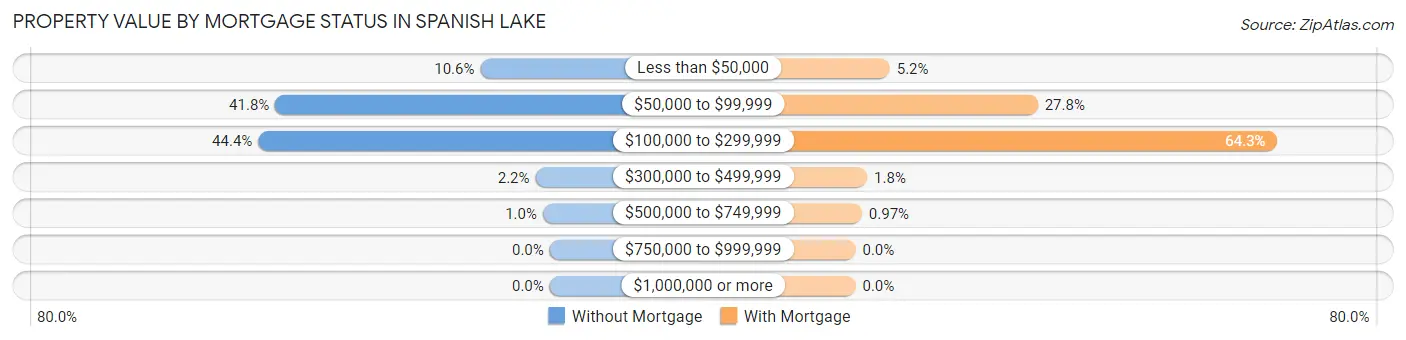
| Property Value | Without Mortgage | With Mortgage |
| Less than $50,000 | 102 (10.6%) | 124 (5.2%) |
| $50,000 to $99,999 | 404 (41.8%) | 659 (27.8%) |
| $100,000 to $299,999 | 429 (44.4%) | 1,526 (64.3%) |
| $300,000 to $499,999 | 21 (2.2%) | 42 (1.8%) |
| $500,000 to $749,999 | 10 (1.0%) | 23 (1.0%) |
| $750,000 to $999,999 | 0 (0.0%) | 0 (0.0%) |
| $1,000,000 or more | 0 (0.0%) | 0 (0.0%) |
| Total | 966 (100.0%) | 2,374 (100.0%) |
Household Income by Mortgage Status in Spanish Lake
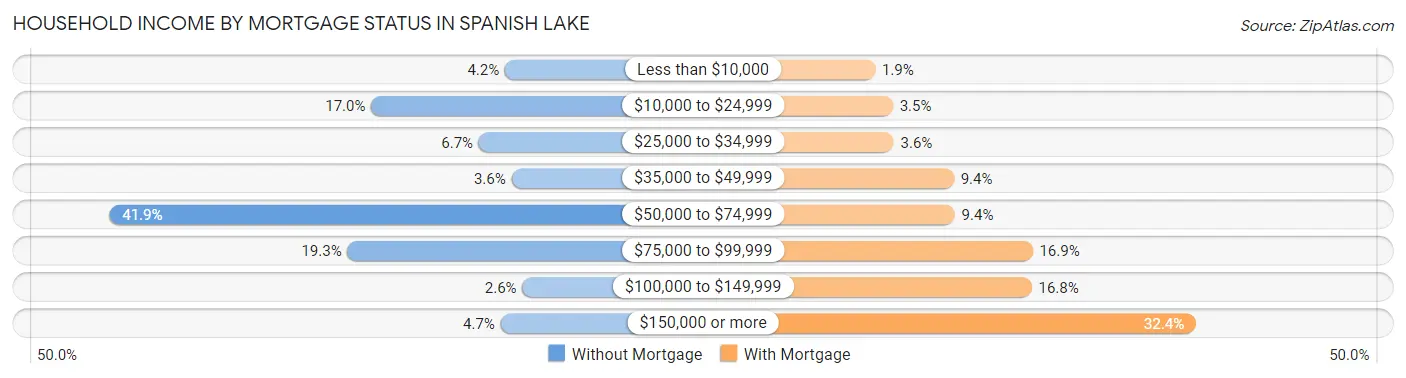
| Household Income | Without Mortgage | With Mortgage |
| Less than $10,000 | 41 (4.2%) | 44 (1.8%) |
| $10,000 to $24,999 | 164 (17.0%) | 84 (3.5%) |
| $25,000 to $34,999 | 65 (6.7%) | 86 (3.6%) |
| $35,000 to $49,999 | 35 (3.6%) | 222 (9.3%) |
| $50,000 to $74,999 | 405 (41.9%) | 224 (9.4%) |
| $75,000 to $99,999 | 186 (19.3%) | 400 (16.9%) |
| $100,000 to $149,999 | 25 (2.6%) | 398 (16.8%) |
| $150,000 or more | 45 (4.7%) | 770 (32.4%) |
| Total | 966 (100.0%) | 2,374 (100.0%) |
Property Value to Household Income Ratio in Spanish Lake
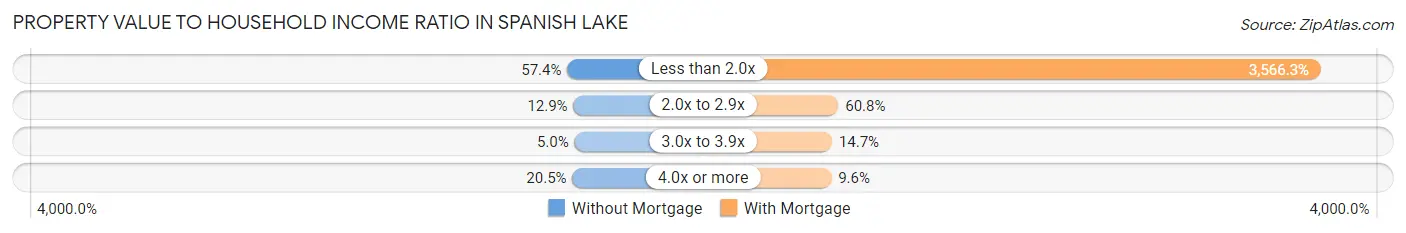
| Value-to-Income Ratio | Without Mortgage | With Mortgage |
| Less than 2.0x | 554 (57.4%) | 84,665 (3,566.3%) |
| 2.0x to 2.9x | 125 (12.9%) | 1,444 (60.8%) |
| 3.0x to 3.9x | 48 (5.0%) | 348 (14.7%) |
| 4.0x or more | 198 (20.5%) | 228 (9.6%) |
| Total | 966 (100.0%) | 2,374 (100.0%) |
Real Estate Taxes by Mortgage Status in Spanish Lake
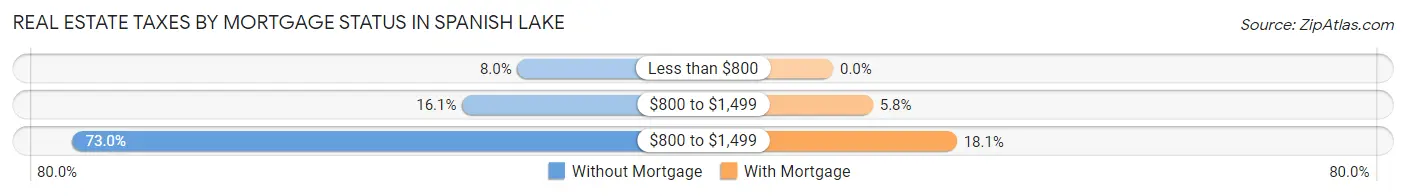
| Property Taxes | Without Mortgage | With Mortgage |
| Less than $800 | 77 (8.0%) | 0 (0.0%) |
| $800 to $1,499 | 155 (16.1%) | 138 (5.8%) |
| $800 to $1,499 | 705 (73.0%) | 429 (18.1%) |
| Total | 966 (100.0%) | 2,374 (100.0%) |
Health & Disability in Spanish Lake
Health Insurance Coverage by Age in Spanish Lake
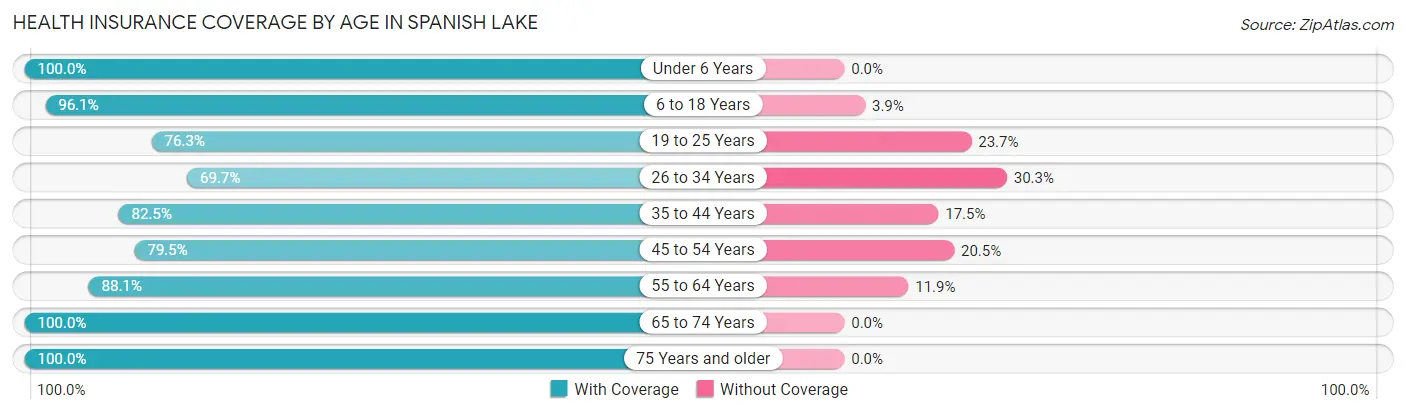
| Age Bracket | With Coverage | Without Coverage |
| Under 6 Years | 1,604 (100.0%) | 0 (0.0%) |
| 6 to 18 Years | 3,201 (96.1%) | 129 (3.9%) |
| 19 to 25 Years | 1,647 (76.3%) | 511 (23.7%) |
| 26 to 34 Years | 1,746 (69.7%) | 759 (30.3%) |
| 35 to 44 Years | 1,341 (82.5%) | 285 (17.5%) |
| 45 to 54 Years | 1,858 (79.5%) | 478 (20.5%) |
| 55 to 64 Years | 1,896 (88.1%) | 257 (11.9%) |
| 65 to 74 Years | 1,501 (100.0%) | 0 (0.0%) |
| 75 Years and older | 704 (100.0%) | 0 (0.0%) |
| Total | 15,498 (86.5%) | 2,419 (13.5%) |
Health Insurance Coverage by Citizenship Status in Spanish Lake
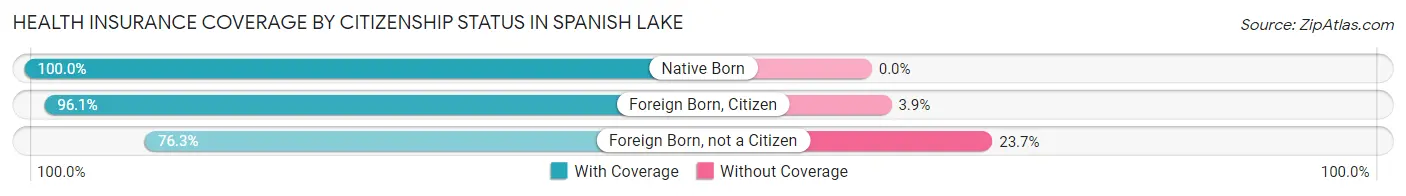
| Citizenship Status | With Coverage | Without Coverage |
| Native Born | 1,604 (100.0%) | 0 (0.0%) |
| Foreign Born, Citizen | 3,201 (96.1%) | 129 (3.9%) |
| Foreign Born, not a Citizen | 1,647 (76.3%) | 511 (23.7%) |
Health Insurance Coverage by Household Income in Spanish Lake
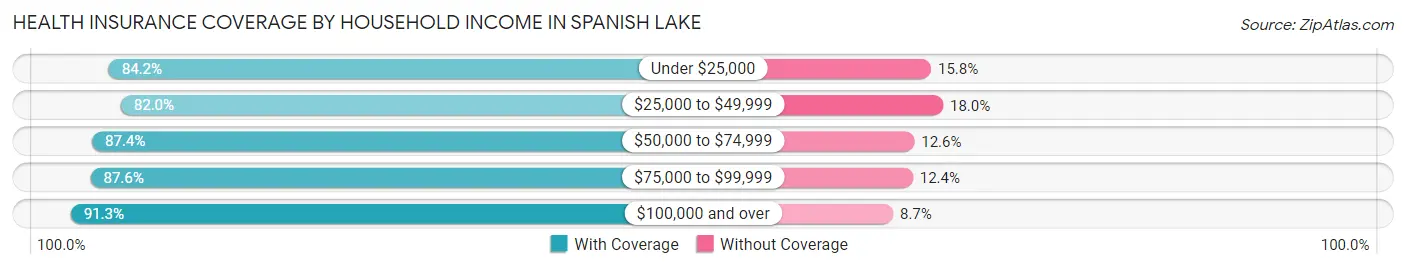
| Household Income | With Coverage | Without Coverage |
| Under $25,000 | 2,855 (84.2%) | 535 (15.8%) |
| $25,000 to $49,999 | 3,480 (82.0%) | 766 (18.0%) |
| $50,000 to $74,999 | 2,785 (87.4%) | 403 (12.6%) |
| $75,000 to $99,999 | 2,417 (87.6%) | 341 (12.4%) |
| $100,000 and over | 3,934 (91.3%) | 373 (8.7%) |
Public vs Private Health Insurance Coverage by Age in Spanish Lake
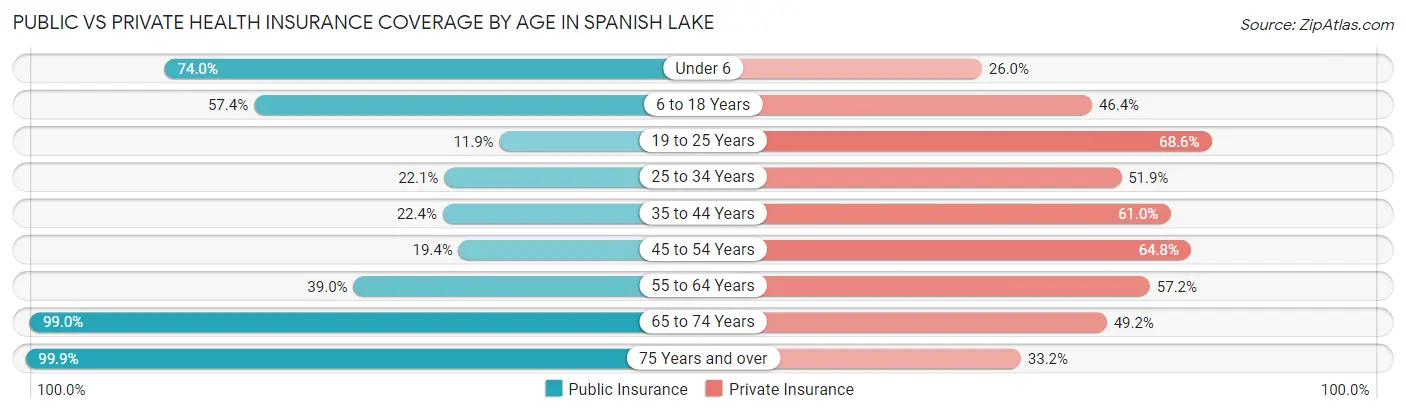
| Age Bracket | Public Insurance | Private Insurance |
| Under 6 | 1,187 (74.0%) | 417 (26.0%) |
| 6 to 18 Years | 1,912 (57.4%) | 1,546 (46.4%) |
| 19 to 25 Years | 256 (11.9%) | 1,480 (68.6%) |
| 25 to 34 Years | 554 (22.1%) | 1,299 (51.9%) |
| 35 to 44 Years | 364 (22.4%) | 991 (61.0%) |
| 45 to 54 Years | 454 (19.4%) | 1,513 (64.8%) |
| 55 to 64 Years | 839 (39.0%) | 1,231 (57.2%) |
| 65 to 74 Years | 1,486 (99.0%) | 738 (49.2%) |
| 75 Years and over | 703 (99.9%) | 234 (33.2%) |
| Total | 7,755 (43.3%) | 9,449 (52.7%) |
Disability Status by Sex by Age in Spanish Lake
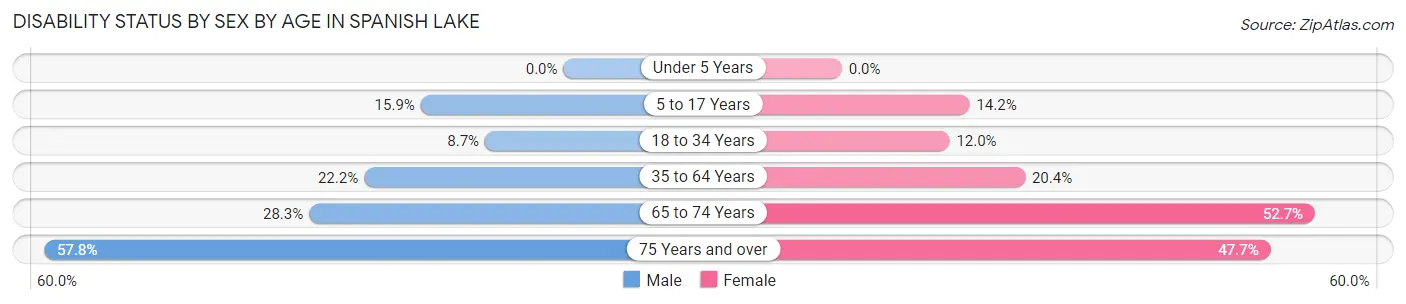
| Age Bracket | Male | Female |
| Under 5 Years | 0 (0.0%) | 0 (0.0%) |
| 5 to 17 Years | 290 (15.9%) | 197 (14.2%) |
| 18 to 34 Years | 188 (8.7%) | 341 (12.0%) |
| 35 to 64 Years | 551 (22.2%) | 741 (20.4%) |
| 65 to 74 Years | 209 (28.3%) | 402 (52.7%) |
| 75 Years and over | 177 (57.8%) | 190 (47.7%) |
Disability Class by Sex by Age in Spanish Lake
Disability Class: Hearing Difficulty
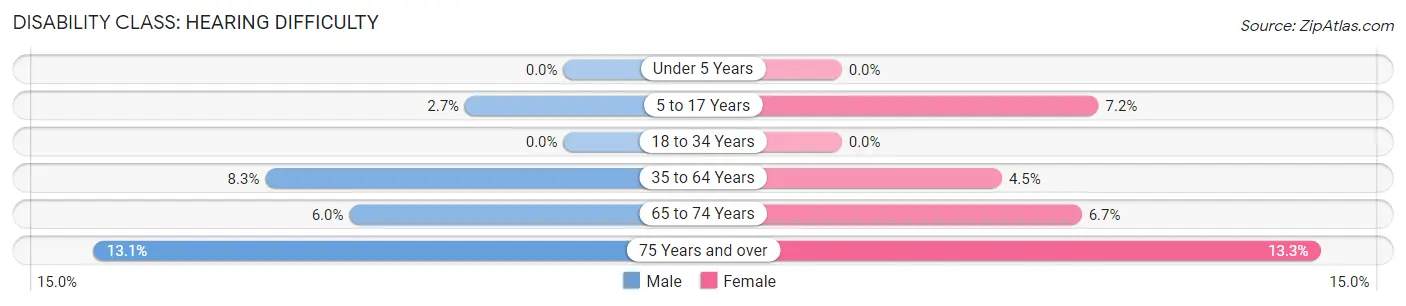
| Age Bracket | Male | Female |
| Under 5 Years | 0 (0.0%) | 0 (0.0%) |
| 5 to 17 Years | 50 (2.7%) | 99 (7.1%) |
| 18 to 34 Years | 0 (0.0%) | 0 (0.0%) |
| 35 to 64 Years | 206 (8.3%) | 162 (4.5%) |
| 65 to 74 Years | 44 (6.0%) | 51 (6.7%) |
| 75 Years and over | 40 (13.1%) | 53 (13.3%) |
Disability Class: Vision Difficulty
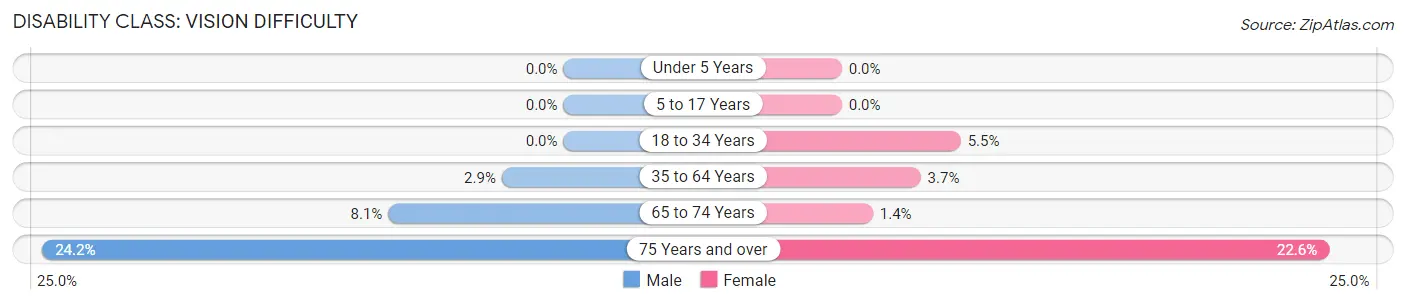
| Age Bracket | Male | Female |
| Under 5 Years | 0 (0.0%) | 0 (0.0%) |
| 5 to 17 Years | 0 (0.0%) | 0 (0.0%) |
| 18 to 34 Years | 0 (0.0%) | 157 (5.5%) |
| 35 to 64 Years | 71 (2.9%) | 133 (3.7%) |
| 65 to 74 Years | 60 (8.1%) | 11 (1.4%) |
| 75 Years and over | 74 (24.2%) | 90 (22.6%) |
Disability Class: Cognitive Difficulty
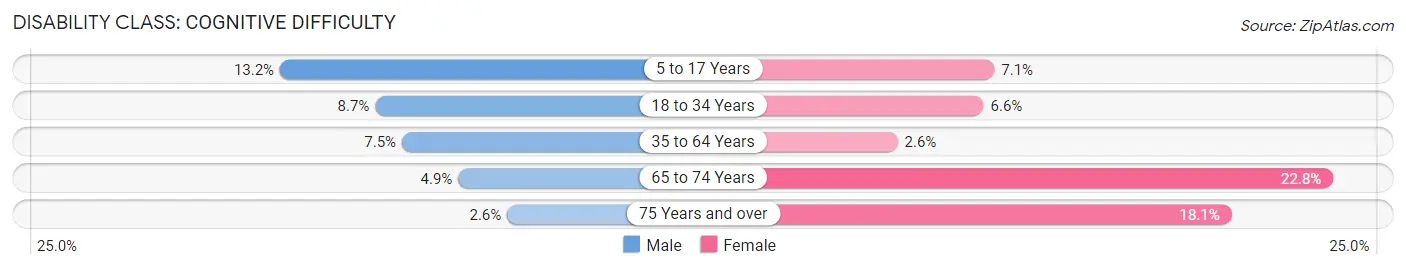
| Age Bracket | Male | Female |
| 5 to 17 Years | 240 (13.2%) | 98 (7.1%) |
| 18 to 34 Years | 188 (8.7%) | 187 (6.6%) |
| 35 to 64 Years | 186 (7.5%) | 94 (2.6%) |
| 65 to 74 Years | 36 (4.9%) | 174 (22.8%) |
| 75 Years and over | 8 (2.6%) | 72 (18.1%) |
Disability Class: Ambulatory Difficulty
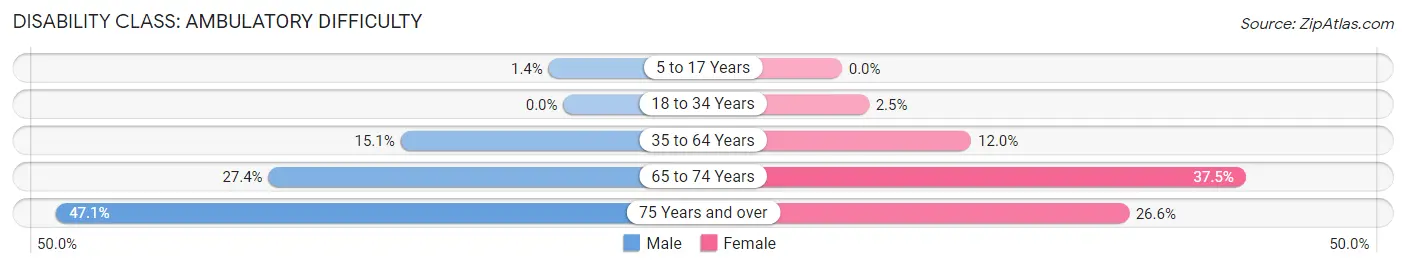
| Age Bracket | Male | Female |
| 5 to 17 Years | 25 (1.4%) | 0 (0.0%) |
| 18 to 34 Years | 0 (0.0%) | 71 (2.5%) |
| 35 to 64 Years | 375 (15.1%) | 436 (12.0%) |
| 65 to 74 Years | 202 (27.4%) | 286 (37.5%) |
| 75 Years and over | 144 (47.1%) | 106 (26.6%) |
Disability Class: Self-Care Difficulty
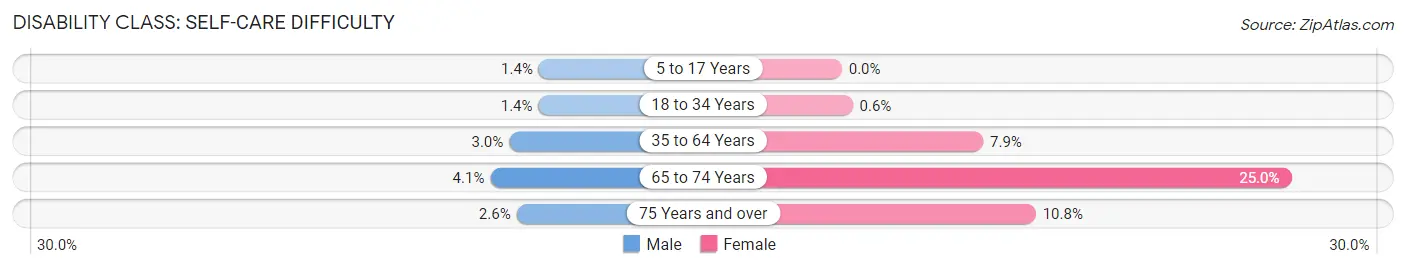
| Age Bracket | Male | Female |
| 5 to 17 Years | 25 (1.4%) | 0 (0.0%) |
| 18 to 34 Years | 30 (1.4%) | 17 (0.6%) |
| 35 to 64 Years | 75 (3.0%) | 286 (7.9%) |
| 65 to 74 Years | 30 (4.1%) | 191 (25.0%) |
| 75 Years and over | 8 (2.6%) | 43 (10.8%) |
Technology Access in Spanish Lake
Computing Device Access in Spanish Lake
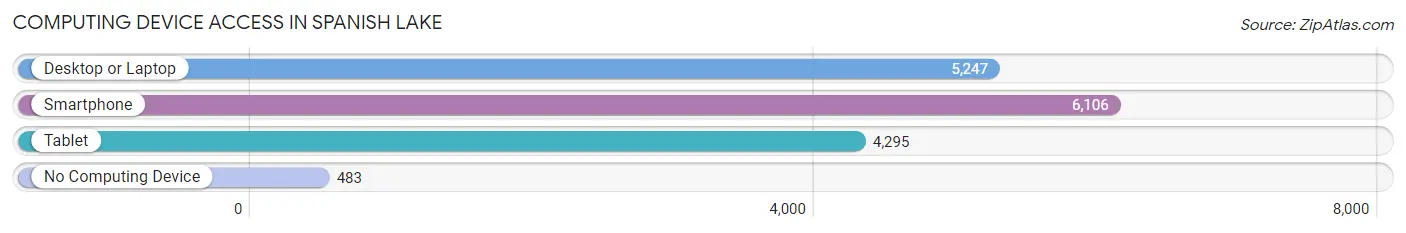
| Device Type | # Households | % Households |
| Desktop or Laptop | 5,247 | 74.1% |
| Smartphone | 6,106 | 86.2% |
| Tablet | 4,295 | 60.6% |
| No Computing Device | 483 | 6.8% |
| Total | 7,086 | 100.0% |
Internet Access in Spanish Lake
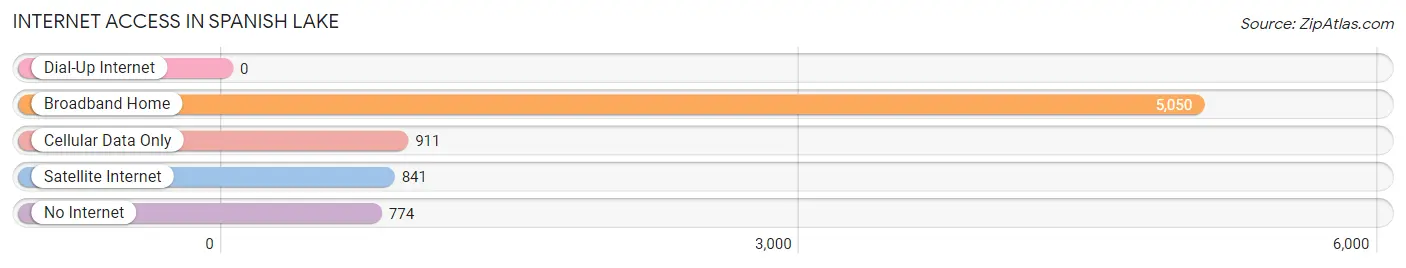
| Internet Type | # Households | % Households |
| Dial-Up Internet | 0 | 0.0% |
| Broadband Home | 5,050 | 71.3% |
| Cellular Data Only | 911 | 12.9% |
| Satellite Internet | 841 | 11.9% |
| No Internet | 774 | 10.9% |
| Total | 7,086 | 100.0% |
Spanish Lake Summary
History
The area now known as Spanish Lake, Missouri was first inhabited by Native Americans, including the Osage, who lived in the area for centuries before the arrival of Europeans. The first Europeans to settle in the area were French fur traders, who established trading posts in the area in the late 1700s. The area was part of the Louisiana Purchase in 1803, and was later organized as part of St. Louis County in 1812.
The area was originally known as “Spanish Pond”, and was named after a large pond in the area that was believed to have been created by Spanish explorers. The pond was later filled in and the area was renamed “Spanish Lake”. The area was largely rural until the 1950s, when suburban development began to spread from St. Louis. The area was incorporated as a village in 1959, and was later annexed by the City of St. Louis in 1975.
Geography
Spanish Lake is located in St. Louis County, Missouri, approximately 15 miles northwest of downtown St. Louis. The area is bordered by the Missouri River to the east, and is situated on the western edge of the Missouri Ozarks. The area is largely flat, with an elevation of approximately 500 feet above sea level.
The area is home to several parks and recreational areas, including Spanish Lake Park, which features a lake, walking trails, and a playground. The area is also home to several golf courses, including the Spanish Lake Golf Course, which is one of the oldest courses in the St. Louis area.
Economy
Spanish Lake is primarily a residential area, with most of the area’s residents employed in the service sector. The area is home to several large employers, including the St. Louis County government, the St. Louis County Police Department, and the St. Louis County Fire Department. The area is also home to several retail establishments, including a Walmart Supercenter, a Target, and several restaurants.
Demographics
As of the 2010 census, the population of Spanish Lake was 11,717. The racial makeup of the area was 79.3% White, 14.2% African American, 0.4% Native American, 1.2% Asian, and 4.9% from other races. The median household income was $50,945, and the median home value was $128,400. The area is served by the St. Louis County Public Schools system.
Common Questions
What is the Total Population of Spanish Lake?
Total Population of Spanish Lake is 18,051.
What is the Total Male Population of Spanish Lake?
Total Male Population of Spanish Lake is 8,244.
What is the Total Female Population of Spanish Lake?
Total Female Population of Spanish Lake is 9,807.
What is the Ratio of Males per 100 Females in Spanish Lake?
There are 84.06 Males per 100 Females in Spanish Lake.
What is the Ratio of Females per 100 Males in Spanish Lake?
There are 118.96 Females per 100 Males in Spanish Lake.
What is the Median Population Age in Spanish Lake?
Median Population Age in Spanish Lake is 32.1 Years.
What is the Average Family Size in Spanish Lake
Average Family Size in Spanish Lake is 3.2 People.
What is the Average Household Size in Spanish Lake
Average Household Size in Spanish Lake is 2.5 People.
What is Per Capita Income in Spanish Lake?
Per Capita income in Spanish Lake is $25,662.
What is the Median Family Income in Spanish Lake?
Median Family Income in Spanish Lake is $61,484.
What is the Median Household income in Spanish Lake?
Median Household Income in Spanish Lake is $49,639.
What is Income or Wage Gap in Spanish Lake?
Income or Wage Gap in Spanish Lake is 14.6%.
Women in Spanish Lake earn 85.4 cents for every dollar earned by a man.
What is Inequality or Gini Index in Spanish Lake?
Inequality or Gini Index in Spanish Lake is 0.44.
How Large is the Labor Force in Spanish Lake?
There are 9,377 People in the Labor Forcein in Spanish Lake.
What is the Percentage of People in the Labor Force in Spanish Lake?
67.6% of People are in the Labor Force in Spanish Lake.
What is the Unemployment Rate in Spanish Lake?
Unemployment Rate in Spanish Lake is 8.3%.