LaBarque Creek, MO
LaBarque Creek Map
LaBarque Creek Overview
1,201
TOTAL POPULATION
476
MALE POPULATION
725
FEMALE POPULATION
65.66
MALES / 100 FEMALES
152.31
FEMALES / 100 MALES
53.0
MEDIAN AGE
2.9
AVG FAMILY SIZE
2.6
AVG HOUSEHOLD SIZE
$64,578
PER CAPITA INCOME
$174,583
AVG FAMILY INCOME
$161,250
AVG HOUSEHOLD INCOME
73.8%
WAGE / INCOME GAP [ % ]
26.2¢/ $1
WAGE / INCOME GAP [ $ ]
0.40
INEQUALITY / GINI INDEX
747
LABOR FORCE [ PEOPLE ]
68.5%
PERCENT IN LABOR FORCE
2.5%
UNEMPLOYMENT RATE
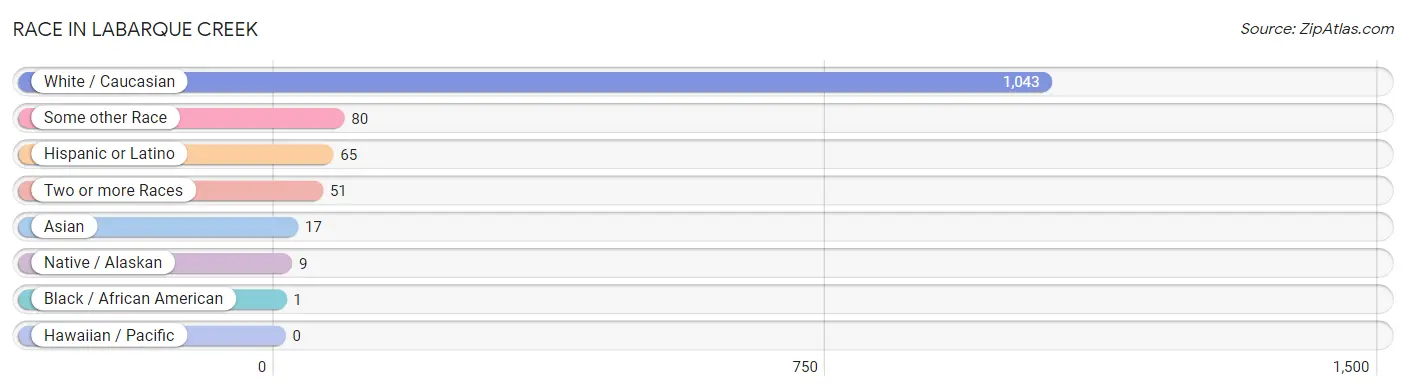
Race in LaBarque Creek
The most populous races in LaBarque Creek are White / Caucasian (1,043 | 86.8%), Some other Race (80 | 6.7%), and Hispanic or Latino (65 | 5.4%).
| Race | # Population | % Population |
| Asian | 17 | 1.4% |
| Black / African American | 1 | 0.1% |
| Hawaiian / Pacific | 0 | 0.0% |
| Hispanic or Latino | 65 | 5.4% |
| Native / Alaskan | 9 | 0.7% |
| White / Caucasian | 1,043 | 86.8% |
| Two or more Races | 51 | 4.3% |
| Some other Race | 80 | 6.7% |
| Total | 1,201 | 100.0% |
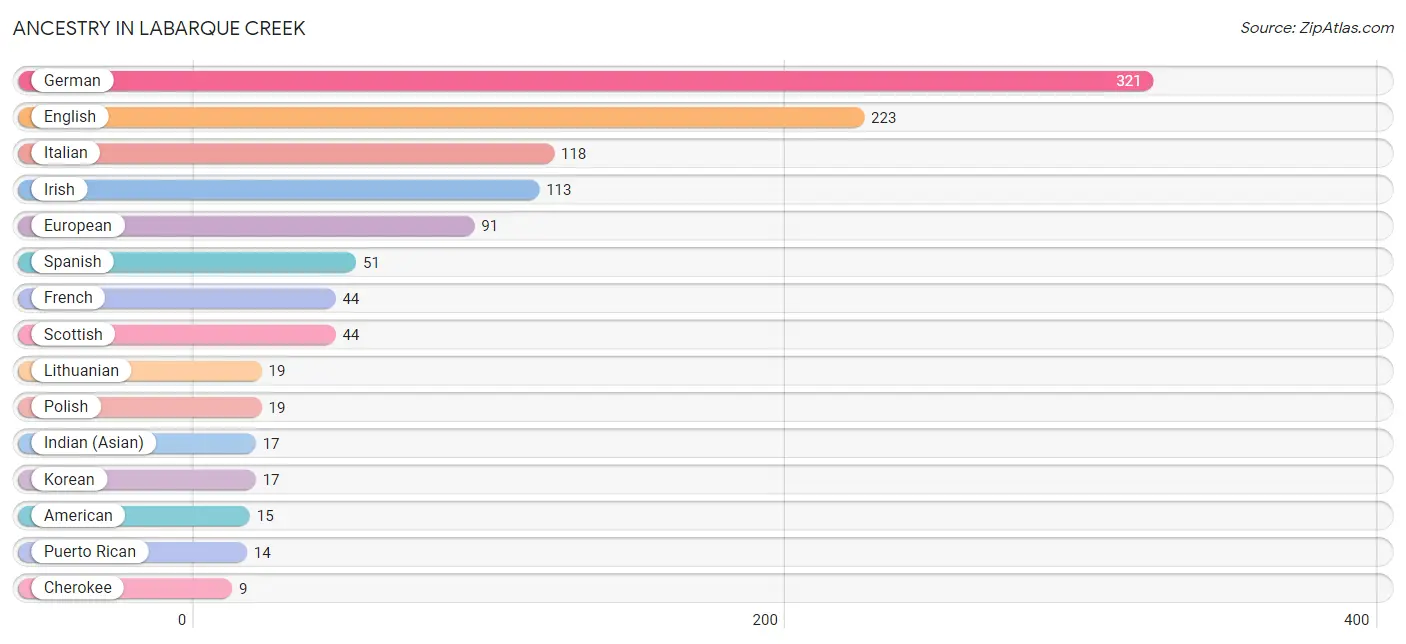
Ancestry in LaBarque Creek
The most populous ancestries reported in LaBarque Creek are German (321 | 26.7%), English (223 | 18.6%), Italian (118 | 9.8%), Irish (113 | 9.4%), and European (91 | 7.6%), together accounting for 72.1% of all LaBarque Creek residents.
| Ancestry | # Population | % Population |
| American | 15 | 1.3% |
| Austrian | 5 | 0.4% |
| Cherokee | 9 | 0.7% |
| Czech | 5 | 0.4% |
| English | 223 | 18.6% |
| European | 91 | 7.6% |
| French | 44 | 3.7% |
| German | 321 | 26.7% |
| Indian (Asian) | 17 | 1.4% |
| Irish | 113 | 9.4% |
| Italian | 118 | 9.8% |
| Korean | 17 | 1.4% |
| Lithuanian | 19 | 1.6% |
| Polish | 19 | 1.6% |
| Puerto Rican | 14 | 1.2% |
| Scottish | 44 | 3.7% |
| Spanish | 51 | 4.3% |
| Swedish | 9 | 0.7% | View All 18 Rows |
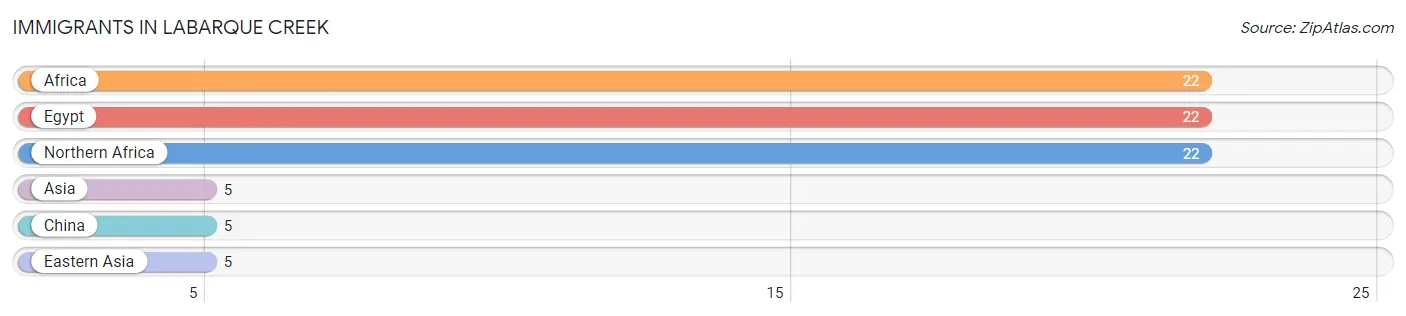
Immigrants in LaBarque Creek
The most numerous immigrant groups reported in LaBarque Creek came from Africa (22 | 1.8%), Egypt (22 | 1.8%), Northern Africa (22 | 1.8%), Asia (5 | 0.4%), and China (5 | 0.4%), together accounting for 6.3% of all LaBarque Creek residents.
| Immigration Origin | # Population | % Population |
| Africa | 22 | 1.8% |
| Asia | 5 | 0.4% |
| China | 5 | 0.4% |
| Eastern Asia | 5 | 0.4% |
| Egypt | 22 | 1.8% |
| Northern Africa | 22 | 1.8% | View All 6 Rows |
Sex and Age in LaBarque Creek
Sex and Age in LaBarque Creek
The most populous age groups in LaBarque Creek are 50 to 54 Years (95 | 20.0%) for men and 50 to 54 Years (214 | 29.5%) for women.
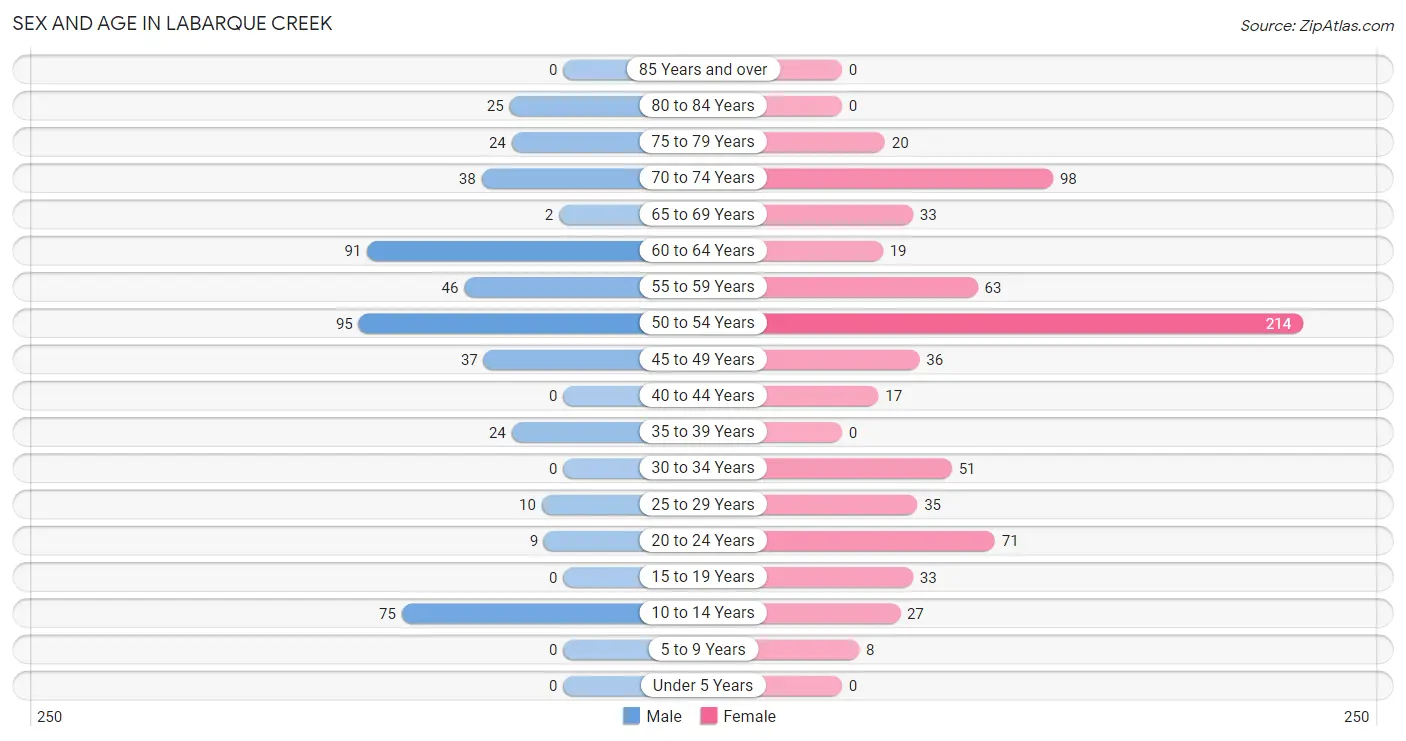
| Age Bracket | Male | Female |
| Under 5 Years | 0 (0.0%) | 0 (0.0%) |
| 5 to 9 Years | 0 (0.0%) | 8 (1.1%) |
| 10 to 14 Years | 75 (15.8%) | 27 (3.7%) |
| 15 to 19 Years | 0 (0.0%) | 33 (4.5%) |
| 20 to 24 Years | 9 (1.9%) | 71 (9.8%) |
| 25 to 29 Years | 10 (2.1%) | 35 (4.8%) |
| 30 to 34 Years | 0 (0.0%) | 51 (7.0%) |
| 35 to 39 Years | 24 (5.0%) | 0 (0.0%) |
| 40 to 44 Years | 0 (0.0%) | 17 (2.3%) |
| 45 to 49 Years | 37 (7.8%) | 36 (5.0%) |
| 50 to 54 Years | 95 (20.0%) | 214 (29.5%) |
| 55 to 59 Years | 46 (9.7%) | 63 (8.7%) |
| 60 to 64 Years | 91 (19.1%) | 19 (2.6%) |
| 65 to 69 Years | 2 (0.4%) | 33 (4.5%) |
| 70 to 74 Years | 38 (8.0%) | 98 (13.5%) |
| 75 to 79 Years | 24 (5.0%) | 20 (2.8%) |
| 80 to 84 Years | 25 (5.2%) | 0 (0.0%) |
| 85 Years and over | 0 (0.0%) | 0 (0.0%) |
| Total | 476 (100.0%) | 725 (100.0%) |
Families and Households in LaBarque Creek
Median Family Size in LaBarque Creek
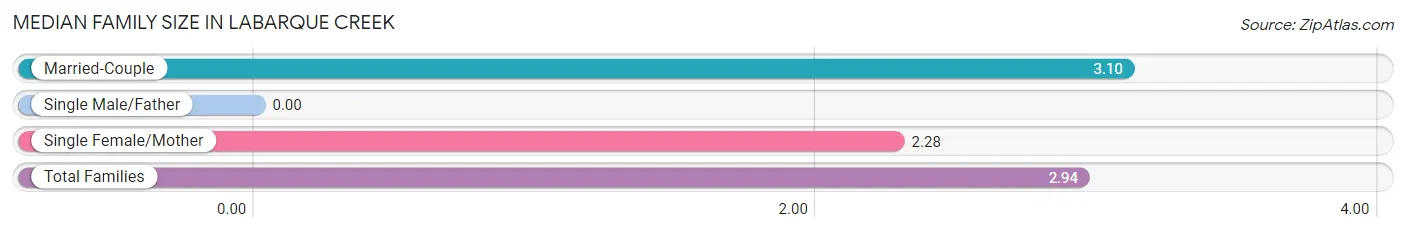
| Family Type | # Families | Family Size |
| Married-Couple | 279 (80.6%) | 3.10 |
| Single Male/Father | 0 (0.0%) | - |
| Single Female/Mother | 67 (19.4%) | 2.28 |
| Total Families | 346 (100.0%) | 2.94 |
Median Household Size in LaBarque Creek
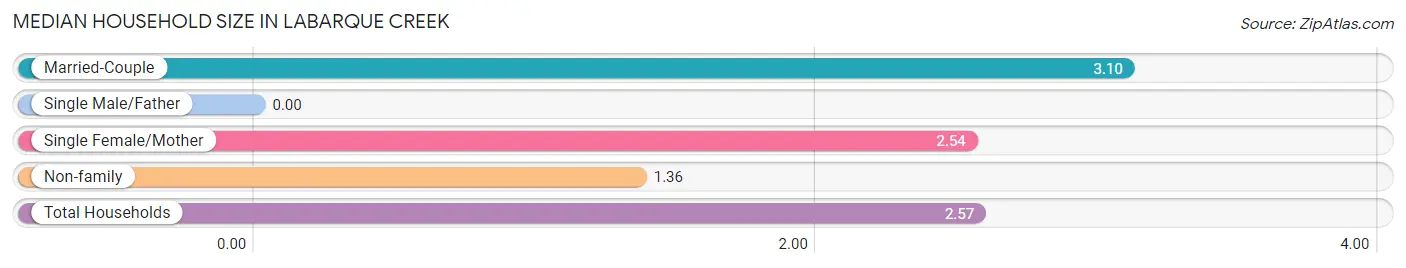
| Household Type | # Households | Household Size |
| Married-Couple | 279 (59.7%) | 3.10 |
| Single Male/Father | 0 (0.0%) | - |
| Single Female/Mother | 67 (14.3%) | 2.54 |
| Non-family | 121 (25.9%) | 1.36 |
| Total Households | 467 (100.0%) | 2.57 |
Household Size by Marriage Status in LaBarque Creek
Out of a total of 467 households in LaBarque Creek, 346 (74.1%) are family households, while 121 (25.9%) are nonfamily households. The most numerous type of family households are 2-person households, comprising 244, and the most common type of nonfamily households are 1-person households, comprising 83.
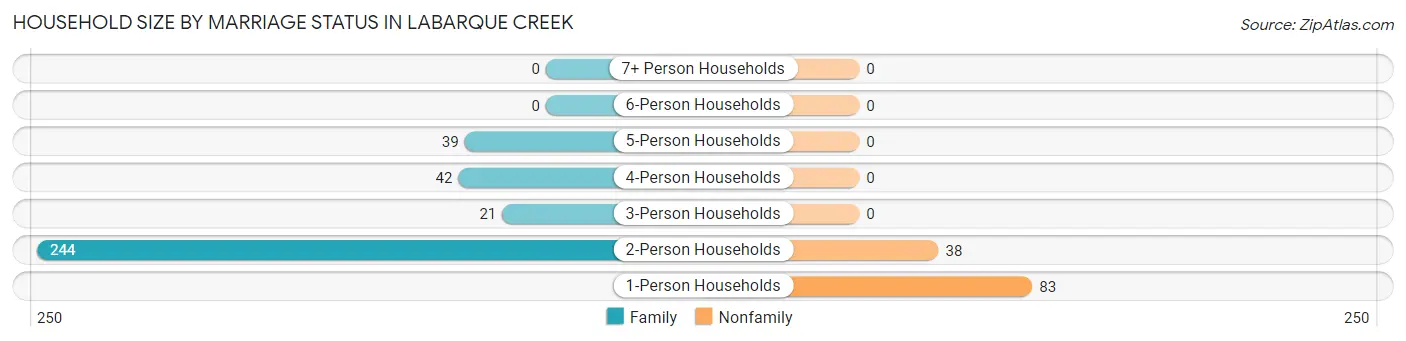
| Household Size | Family Households | Nonfamily Households |
| 1-Person Households | - | 83 (17.8%) |
| 2-Person Households | 244 (52.2%) | 38 (8.1%) |
| 3-Person Households | 21 (4.5%) | 0 (0.0%) |
| 4-Person Households | 42 (9.0%) | 0 (0.0%) |
| 5-Person Households | 39 (8.4%) | 0 (0.0%) |
| 6-Person Households | 0 (0.0%) | 0 (0.0%) |
| 7+ Person Households | 0 (0.0%) | 0 (0.0%) |
| Total | 346 (74.1%) | 121 (25.9%) |
Female Fertility in LaBarque Creek
Fertility by Age in LaBarque Creek
| Age Bracket | Women with Births | Births / 1,000 Women |
| 15 to 19 years | 0 (0.0%) | 0.0 |
| 20 to 34 years | 0 (0.0%) | 0.0 |
| 35 to 50 years | 0 (0.0%) | 0.0 |
| Total | 0 (0.0%) | 0.0 |
Fertility by Age by Marriage Status in LaBarque Creek
| Age Bracket | Married | Unmarried |
| 15 to 19 years | 0 (0.0%) | 0 (0.0%) |
| 20 to 34 years | 0 (0.0%) | 0 (0.0%) |
| 35 to 50 years | 0 (0.0%) | 0 (0.0%) |
| Total | 0 (0.0%) | 0 (0.0%) |
Fertility by Education in LaBarque Creek
| Educational Attainment | Women with Births | Births / 1,000 Women |
| Less than High School | 0 (0.0%) | 0.0 |
| High School Diploma | 0 (0.0%) | 0.0 |
| College or Associate's Degree | 0 (0.0%) | 0.0 |
| Bachelor's Degree | 0 (0.0%) | 0.0 |
| Graduate Degree | 0 (0.0%) | 0.0 |
| Total | 0 (0.0%) | 0.0 |
Fertility by Education by Marriage Status in LaBarque Creek
| Educational Attainment | Married | Unmarried |
| Less than High School | 0 (0.0%) | 0 (0.0%) |
| High School Diploma | 0 (0.0%) | 0 (0.0%) |
| College or Associate's Degree | 0 (0.0%) | 0 (0.0%) |
| Bachelor's Degree | 0 (0.0%) | 0 (0.0%) |
| Graduate Degree | 0 (0.0%) | 0 (0.0%) |
| Total | 0 (0.0%) | 0 (0.0%) |
Income in LaBarque Creek
Income Overview in LaBarque Creek
Per Capita Income in LaBarque Creek is $64,578, while median incomes of families and households are $174,583 and $161,250 respectively.
| Characteristic | Number | Measure |
| Per Capita Income | 1,201 | $64,578 |
| Median Family Income | 346 | $174,583 |
| Mean Family Income | 346 | $185,870 |
| Median Household Income | 467 | $161,250 |
| Mean Household Income | 467 | $161,916 |
| Income Deficit | 346 | $0 |
| Wage / Income Gap (%) | 1,201 | 73.82% |
| Wage / Income Gap ($) | 1,201 | 26.18¢ per $1 |
| Gini / Inequality Index | 1,201 | 0.40 |
Earnings by Sex in LaBarque Creek
Average Earnings in LaBarque Creek are $57,750, $113,375 for men and $29,681 for women, a difference of 73.8%.
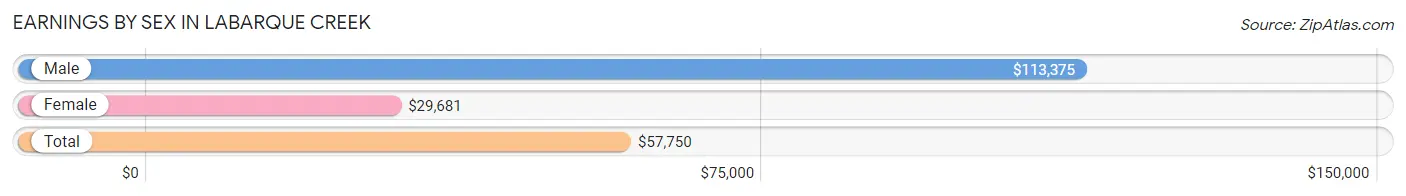
| Sex | Number | Average Earnings |
| Male | 299 (37.4%) | $113,375 |
| Female | 501 (62.6%) | $29,681 |
| Total | 800 (100.0%) | $57,750 |
Earnings by Sex by Income Bracket in LaBarque Creek
The most common earnings brackets in LaBarque Creek are $100,000+ for men (191 | 63.9%) and $100,000+ for women (104 | 20.8%).
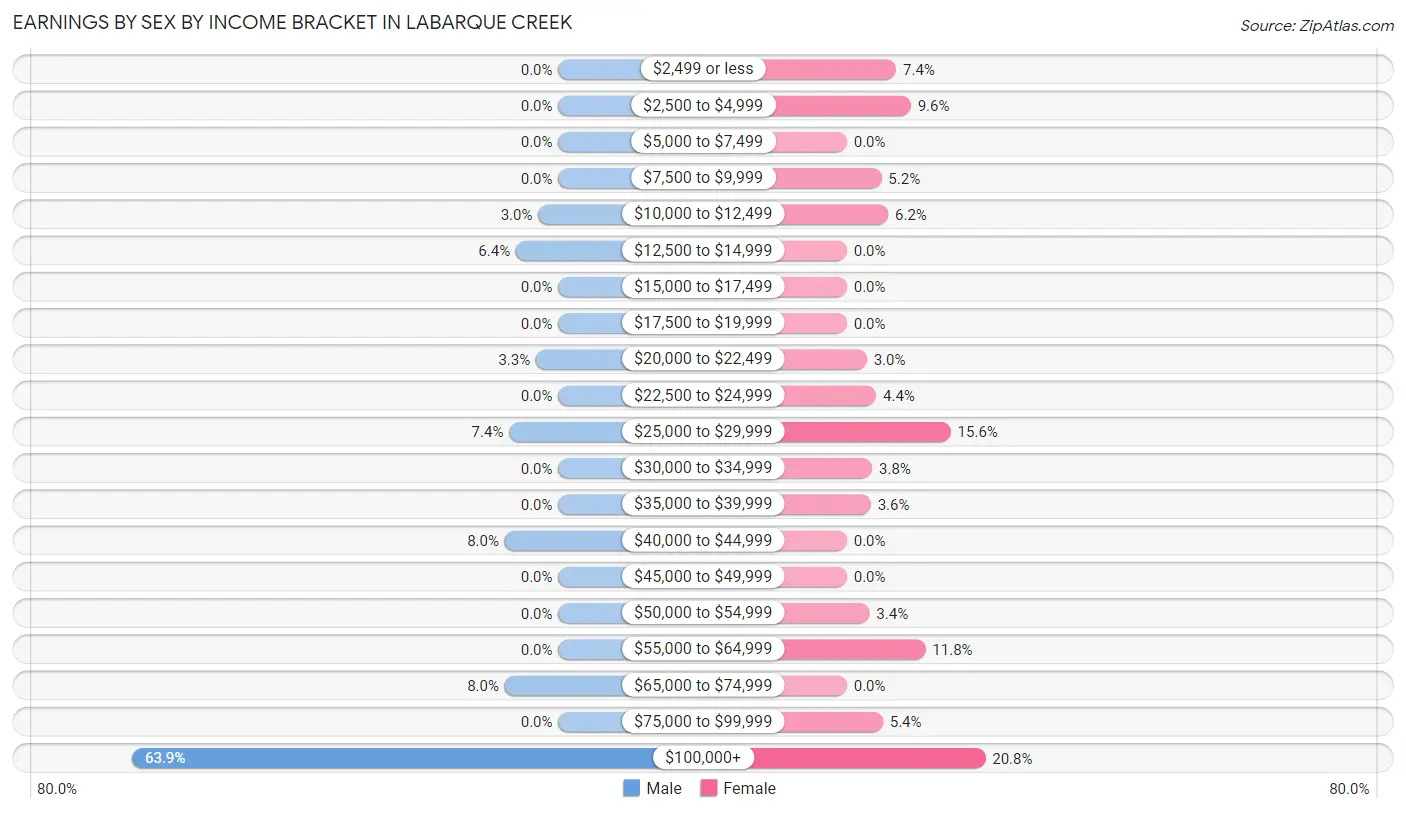
| Income | Male | Female |
| $2,499 or less | 0 (0.0%) | 37 (7.4%) |
| $2,500 to $4,999 | 0 (0.0%) | 48 (9.6%) |
| $5,000 to $7,499 | 0 (0.0%) | 0 (0.0%) |
| $7,500 to $9,999 | 0 (0.0%) | 26 (5.2%) |
| $10,000 to $12,499 | 9 (3.0%) | 31 (6.2%) |
| $12,500 to $14,999 | 19 (6.4%) | 0 (0.0%) |
| $15,000 to $17,499 | 0 (0.0%) | 0 (0.0%) |
| $17,500 to $19,999 | 0 (0.0%) | 0 (0.0%) |
| $20,000 to $22,499 | 10 (3.3%) | 15 (3.0%) |
| $22,500 to $24,999 | 0 (0.0%) | 22 (4.4%) |
| $25,000 to $29,999 | 22 (7.4%) | 78 (15.6%) |
| $30,000 to $34,999 | 0 (0.0%) | 19 (3.8%) |
| $35,000 to $39,999 | 0 (0.0%) | 18 (3.6%) |
| $40,000 to $44,999 | 24 (8.0%) | 0 (0.0%) |
| $45,000 to $49,999 | 0 (0.0%) | 0 (0.0%) |
| $50,000 to $54,999 | 0 (0.0%) | 17 (3.4%) |
| $55,000 to $64,999 | 0 (0.0%) | 59 (11.8%) |
| $65,000 to $74,999 | 24 (8.0%) | 0 (0.0%) |
| $75,000 to $99,999 | 0 (0.0%) | 27 (5.4%) |
| $100,000+ | 191 (63.9%) | 104 (20.8%) |
| Total | 299 (100.0%) | 501 (100.0%) |
Earnings by Sex by Educational Attainment in LaBarque Creek
Average earnings in LaBarque Creek are $113,750 for men and $51,250 for women, a difference of 54.9%. Men with an educational attainment of bachelor's degree enjoy the highest average annual earnings of $144,643, while those with high school diploma education earn the least with $112,938. Women with an educational attainment of bachelor's degree earn the most with the average annual earnings of $58,725, while those with bachelor's degree education have the smallest earnings of $58,725.
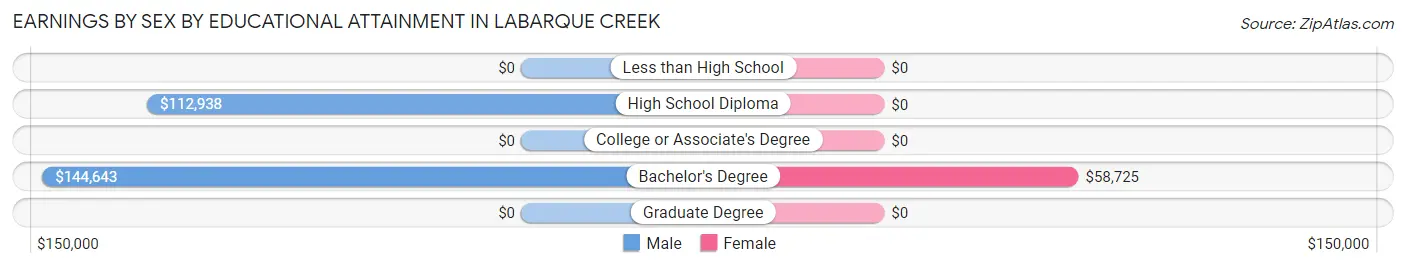
| Educational Attainment | Male Income | Female Income |
| Less than High School | - | - |
| High School Diploma | $112,938 | $0 |
| College or Associate's Degree | - | - |
| Bachelor's Degree | $144,643 | $58,725 |
| Graduate Degree | - | - |
| Total | $113,750 | $51,250 |
Family Income in LaBarque Creek
Family Income Brackets in LaBarque Creek
According to the LaBarque Creek family income data, there are 127 families falling into the $200,000+ income range, which is the most common income bracket and makes up 36.7% of all families.
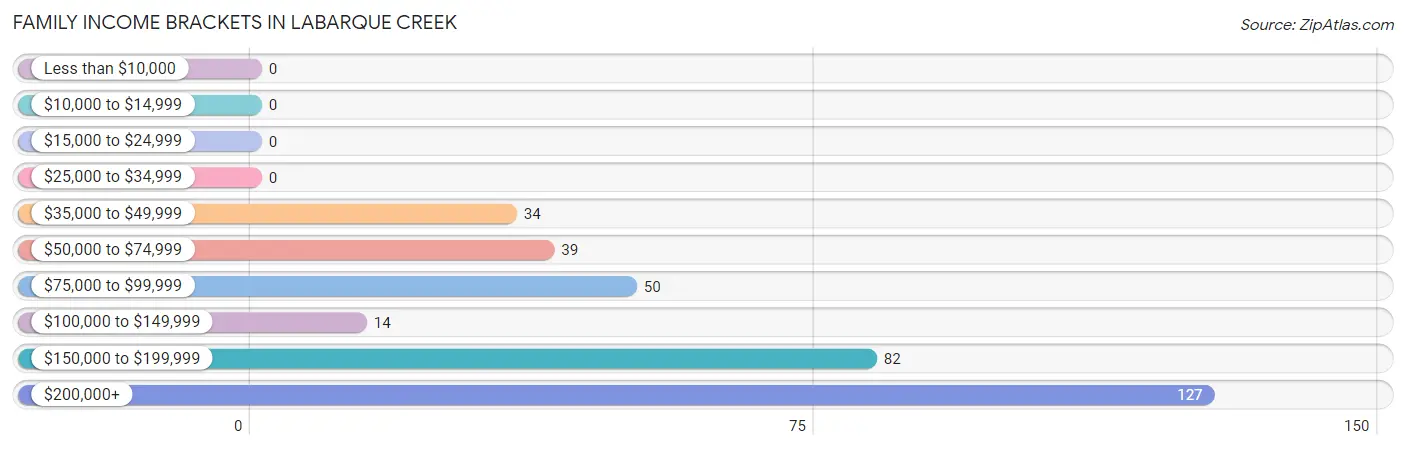
| Income Bracket | # Families | % Families |
| Less than $10,000 | 0 | 0.0% |
| $10,000 to $14,999 | 0 | 0.0% |
| $15,000 to $24,999 | 0 | 0.0% |
| $25,000 to $34,999 | 0 | 0.0% |
| $35,000 to $49,999 | 34 | 9.8% |
| $50,000 to $74,999 | 39 | 11.3% |
| $75,000 to $99,999 | 50 | 14.5% |
| $100,000 to $149,999 | 14 | 4.0% |
| $150,000 to $199,999 | 82 | 23.7% |
| $200,000+ | 127 | 36.7% |
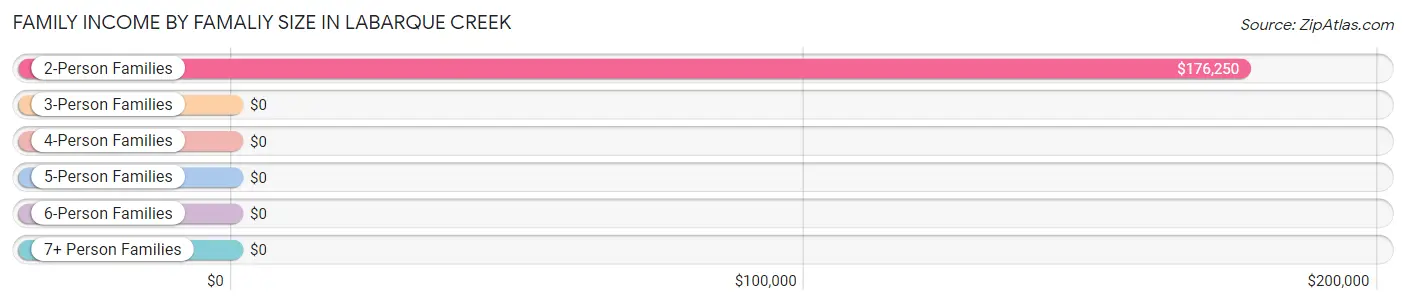
Family Income by Famaliy Size in LaBarque Creek
2-person families (244 | 70.5%) account for the highest median family income in LaBarque Creek with $176,250 per family, while 2-person families (244 | 70.5%) have the highest median income of $88,125 per family member.
| Income Bracket | # Families | Median Income |
| 2-Person Families | 244 (70.5%) | $176,250 |
| 3-Person Families | 38 (11.0%) | $0 |
| 4-Person Families | 25 (7.2%) | $0 |
| 5-Person Families | 39 (11.3%) | $0 |
| 6-Person Families | 0 (0.0%) | $0 |
| 7+ Person Families | 0 (0.0%) | $0 |
| Total | 346 (100.0%) | $174,583 |
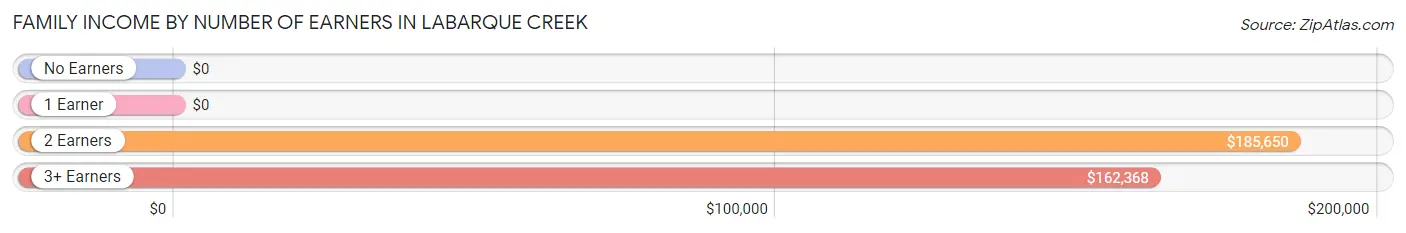
Family Income by Number of Earners in LaBarque Creek
| Number of Earners | # Families | Median Income |
| No Earners | 14 (4.1%) | $0 |
| 1 Earner | 77 (22.3%) | $0 |
| 2 Earners | 219 (63.3%) | $185,650 |
| 3+ Earners | 36 (10.4%) | $162,368 |
| Total | 346 (100.0%) | $174,583 |
Household Income in LaBarque Creek
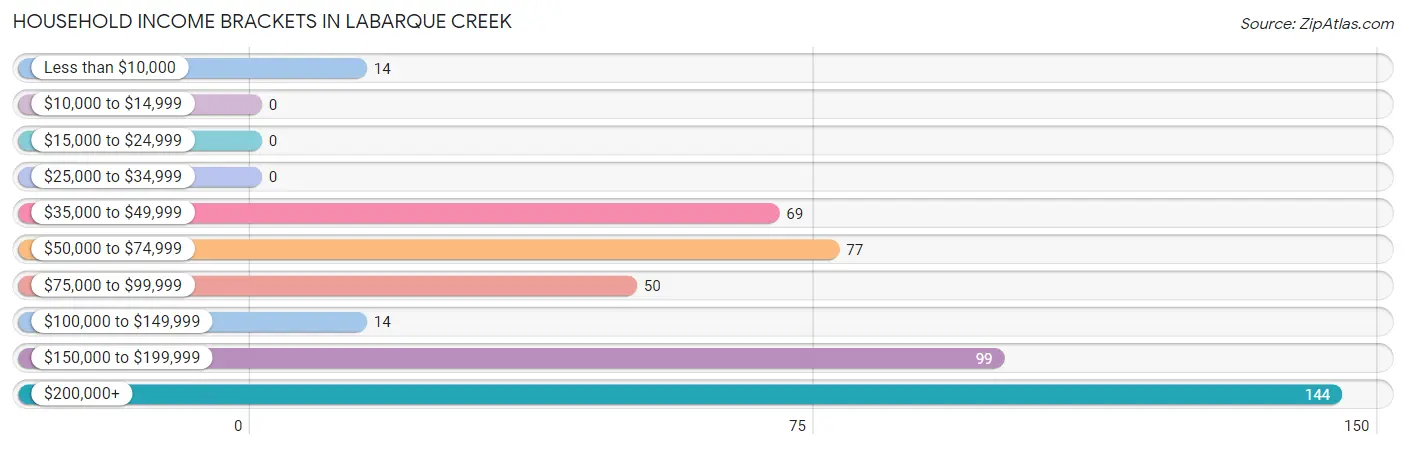
Household Income Brackets in LaBarque Creek
With 144 households falling in the category, the $200,000+ income range is the most frequent in LaBarque Creek, accounting for 30.8% of all households.
| Income Bracket | # Households | % Households |
| Less than $10,000 | 14 | 3.0% |
| $10,000 to $14,999 | 0 | 0.0% |
| $15,000 to $24,999 | 0 | 0.0% |
| $25,000 to $34,999 | 0 | 0.0% |
| $35,000 to $49,999 | 69 | 14.8% |
| $50,000 to $74,999 | 77 | 16.5% |
| $75,000 to $99,999 | 50 | 10.7% |
| $100,000 to $149,999 | 14 | 3.0% |
| $150,000 to $199,999 | 99 | 21.2% |
| $200,000+ | 144 | 30.8% |
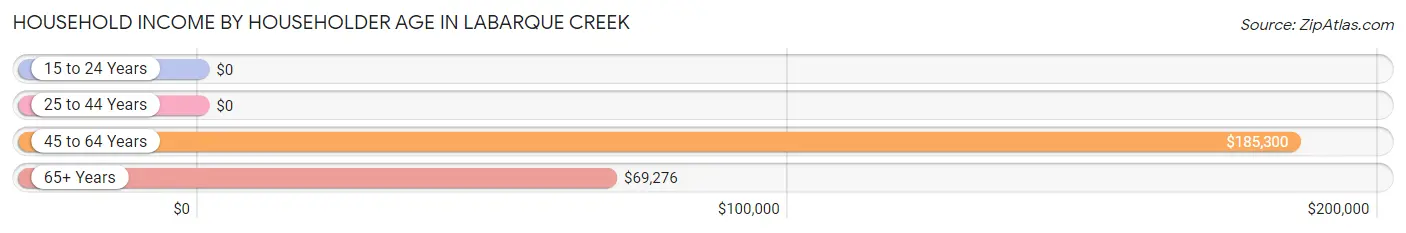
Household Income by Householder Age in LaBarque Creek
The median household income in LaBarque Creek is $161,250, with the highest median household income of $185,300 found in the 45 to 64 years age bracket for the primary householder. A total of 308 households (65.9%) fall into this category.
| Income Bracket | # Households | Median Income |
| 15 to 24 Years | 0 (0.0%) | $0 |
| 25 to 44 Years | 52 (11.1%) | $0 |
| 45 to 64 Years | 308 (65.9%) | $185,300 |
| 65+ Years | 107 (22.9%) | $69,276 |
| Total | 467 (100.0%) | $161,250 |
Poverty in LaBarque Creek
Income Below Poverty by Sex and Age in LaBarque Creek
With 4.2% poverty level for males and 4.8% for females among the residents of LaBarque Creek, 55 to 64 year old males and 25 to 34 year old females are the most vulnerable to poverty, with 20 males (14.6%) and 35 females (40.7%) in their respective age groups living below the poverty level.
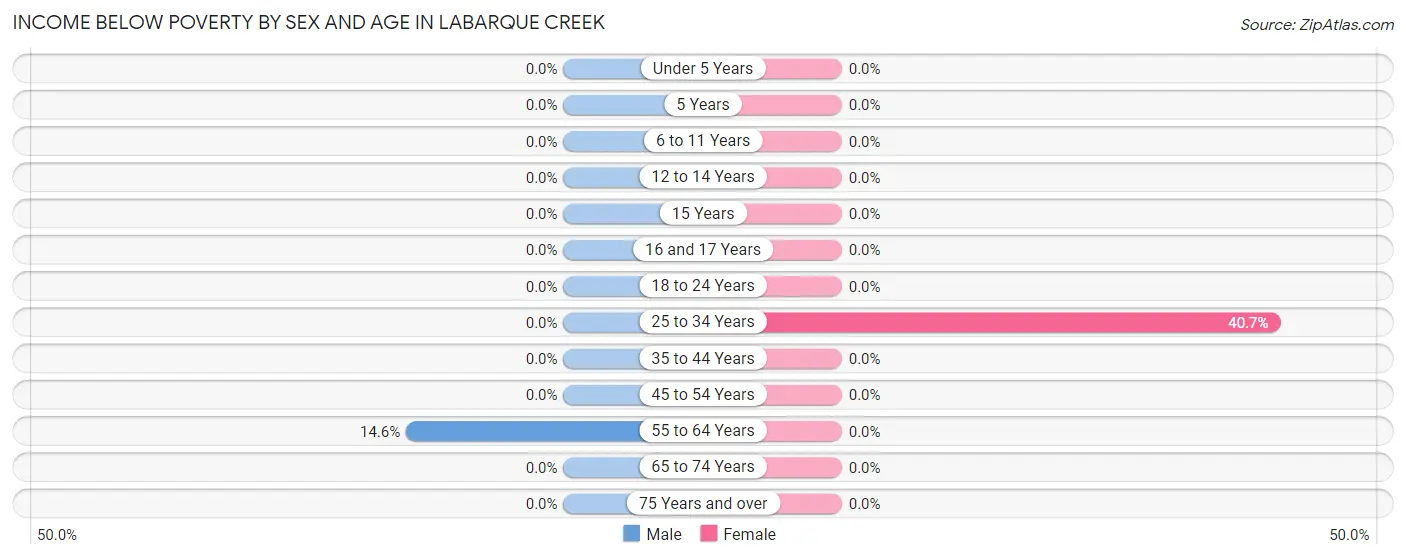
| Age Bracket | Male | Female |
| Under 5 Years | 0 (0.0%) | 0 (0.0%) |
| 5 Years | 0 (0.0%) | 0 (0.0%) |
| 6 to 11 Years | 0 (0.0%) | 0 (0.0%) |
| 12 to 14 Years | 0 (0.0%) | 0 (0.0%) |
| 15 Years | 0 (0.0%) | 0 (0.0%) |
| 16 and 17 Years | 0 (0.0%) | 0 (0.0%) |
| 18 to 24 Years | 0 (0.0%) | 0 (0.0%) |
| 25 to 34 Years | 0 (0.0%) | 35 (40.7%) |
| 35 to 44 Years | 0 (0.0%) | 0 (0.0%) |
| 45 to 54 Years | 0 (0.0%) | 0 (0.0%) |
| 55 to 64 Years | 20 (14.6%) | 0 (0.0%) |
| 65 to 74 Years | 0 (0.0%) | 0 (0.0%) |
| 75 Years and over | 0 (0.0%) | 0 (0.0%) |
| Total | 20 (4.2%) | 35 (4.8%) |
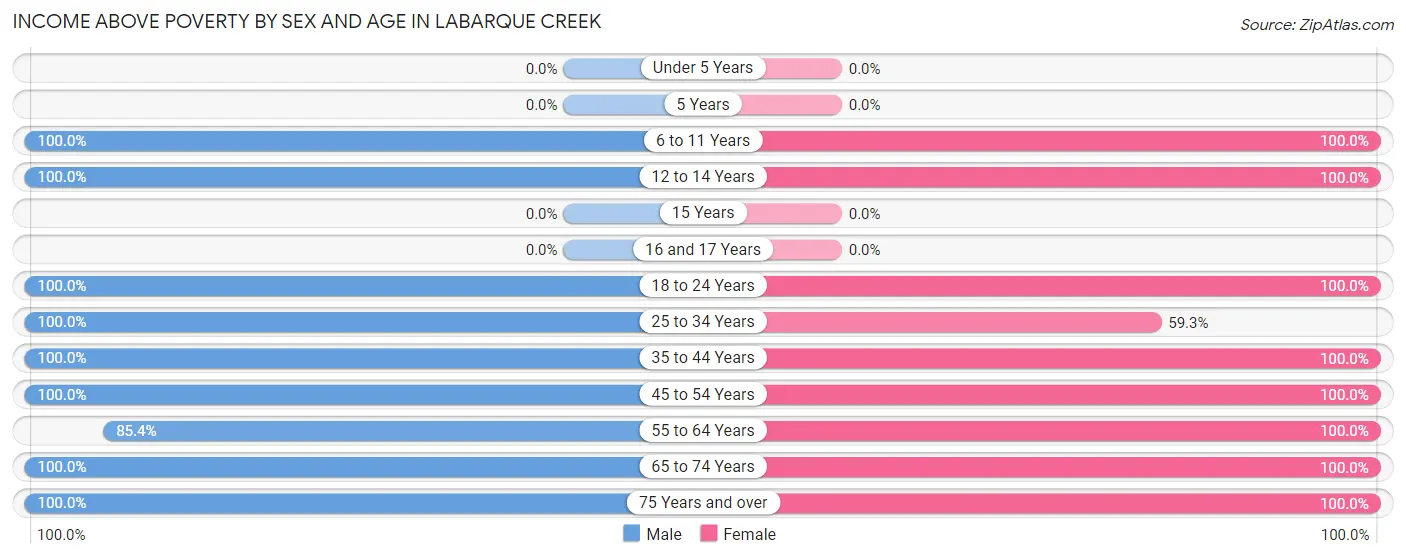
Income Above Poverty by Sex and Age in LaBarque Creek
According to the poverty statistics in LaBarque Creek, males aged 6 to 11 years and females aged 6 to 11 years are the age groups that are most secure financially, with 100.0% of males and 100.0% of females in these age groups living above the poverty line.
| Age Bracket | Male | Female |
| Under 5 Years | 0 (0.0%) | 0 (0.0%) |
| 5 Years | 0 (0.0%) | 0 (0.0%) |
| 6 to 11 Years | 38 (100.0%) | 28 (100.0%) |
| 12 to 14 Years | 37 (100.0%) | 7 (100.0%) |
| 15 Years | 0 (0.0%) | 0 (0.0%) |
| 16 and 17 Years | 0 (0.0%) | 0 (0.0%) |
| 18 to 24 Years | 9 (100.0%) | 104 (100.0%) |
| 25 to 34 Years | 10 (100.0%) | 51 (59.3%) |
| 35 to 44 Years | 24 (100.0%) | 17 (100.0%) |
| 45 to 54 Years | 132 (100.0%) | 250 (100.0%) |
| 55 to 64 Years | 117 (85.4%) | 82 (100.0%) |
| 65 to 74 Years | 40 (100.0%) | 131 (100.0%) |
| 75 Years and over | 49 (100.0%) | 20 (100.0%) |
| Total | 456 (95.8%) | 690 (95.2%) |
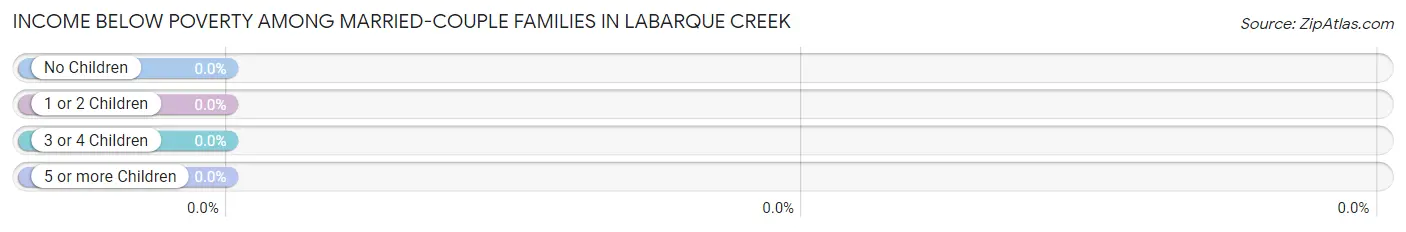
Income Below Poverty Among Married-Couple Families in LaBarque Creek
| Children | Above Poverty | Below Poverty |
| No Children | 244 (100.0%) | 0 (0.0%) |
| 1 or 2 Children | 35 (100.0%) | 0 (0.0%) |
| 3 or 4 Children | 0 (0.0%) | 0 (0.0%) |
| 5 or more Children | 0 (0.0%) | 0 (0.0%) |
| Total | 279 (100.0%) | 0 (0.0%) |
Income Below Poverty Among Single-Parent Households in LaBarque Creek
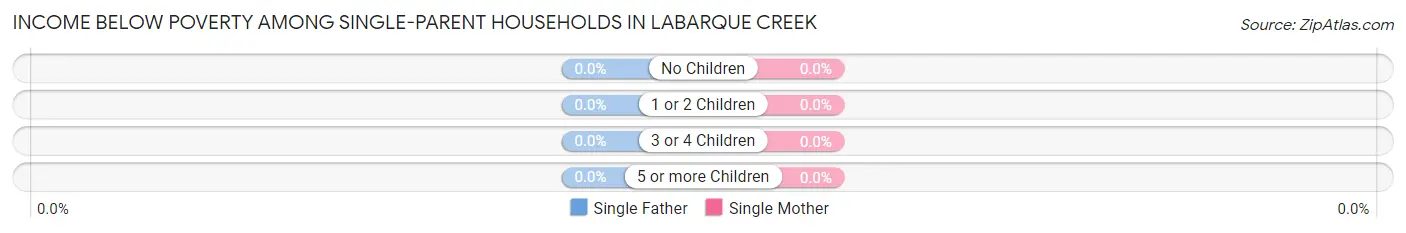
| Children | Single Father | Single Mother |
| No Children | 0 (0.0%) | 0 (0.0%) |
| 1 or 2 Children | 0 (0.0%) | 0 (0.0%) |
| 3 or 4 Children | 0 (0.0%) | 0 (0.0%) |
| 5 or more Children | 0 (0.0%) | 0 (0.0%) |
| Total | 0 (0.0%) | 0 (0.0%) |
Income Below Poverty Among Married-Couple vs Single-Parent Households in LaBarque Creek
| Children | Married-Couple Families | Single-Parent Households |
| No Children | 0 (0.0%) | 0 (0.0%) |
| 1 or 2 Children | 0 (0.0%) | 0 (0.0%) |
| 3 or 4 Children | 0 (0.0%) | 0 (0.0%) |
| 5 or more Children | 0 (0.0%) | 0 (0.0%) |
| Total | 0 (0.0%) | 0 (0.0%) |
Employment Characteristics in LaBarque Creek
Employment by Class of Employer in LaBarque Creek
Among the 706 employed individuals in LaBarque Creek, private company employees (486 | 68.8%), not-for-profit organizations (109 | 15.4%), and self-employed (not incorporated) (53 | 7.5%) make up the most common classes of employment.
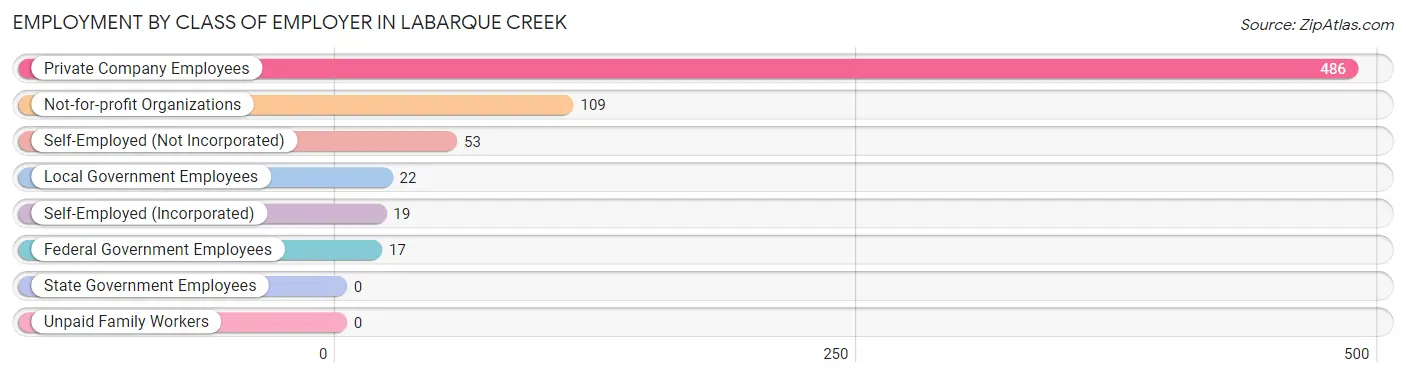
| Employer Class | # Employees | % Employees |
| Private Company Employees | 486 | 68.8% |
| Self-Employed (Incorporated) | 19 | 2.7% |
| Self-Employed (Not Incorporated) | 53 | 7.5% |
| Not-for-profit Organizations | 109 | 15.4% |
| Local Government Employees | 22 | 3.1% |
| State Government Employees | 0 | 0.0% |
| Federal Government Employees | 17 | 2.4% |
| Unpaid Family Workers | 0 | 0.0% |
| Total | 706 | 100.0% |
Employment Status by Age in LaBarque Creek
According to the labor force statistics for LaBarque Creek, out of the total population over 16 years of age (1,091), 68.5% or 747 individuals are in the labor force, with 2.5% or 19 of them unemployed. The age group with the highest labor force participation rate is 30 to 34 years, with 100.0% or 51 individuals in the labor force. Within the labor force, the 60 to 64 years age range has the highest percentage of unemployed individuals, with 26.4% or 19 of them being unemployed.
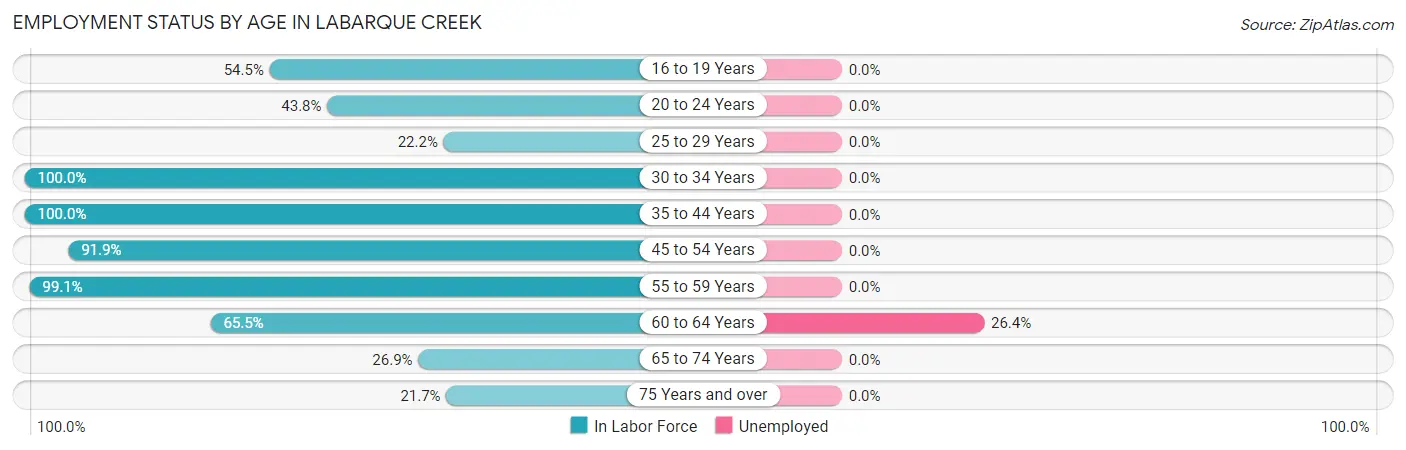
| Age Bracket | In Labor Force | Unemployed |
| 16 to 19 Years | 18 (54.5%) | 0 (0.0%) |
| 20 to 24 Years | 35 (43.8%) | 0 (0.0%) |
| 25 to 29 Years | 10 (22.2%) | 0 (0.0%) |
| 30 to 34 Years | 51 (100.0%) | 0 (0.0%) |
| 35 to 44 Years | 41 (100.0%) | 0 (0.0%) |
| 45 to 54 Years | 351 (91.9%) | 0 (0.0%) |
| 55 to 59 Years | 108 (99.1%) | 0 (0.0%) |
| 60 to 64 Years | 72 (65.5%) | 19 (26.4%) |
| 65 to 74 Years | 46 (26.9%) | 0 (0.0%) |
| 75 Years and over | 15 (21.7%) | 0 (0.0%) |
| Total | 747 (68.5%) | 19 (2.5%) |
Employment Status by Educational Attainment in LaBarque Creek
According to labor force statistics for LaBarque Creek, 85.8% of individuals (633) out of the total population between 25 and 64 years of age (738) are in the labor force, with 3.0% or 19 of them being unemployed. The group with the highest labor force participation rate are those with the educational attainment of college / associate degree, with 88.4% or 167 individuals in the labor force. Within the labor force, individuals with high school diploma education have the highest percentage of unemployment, with 16.5% or 19 of them being unemployed.
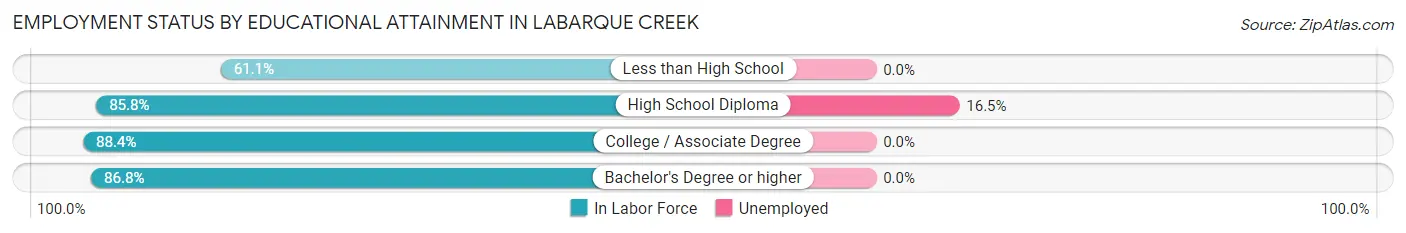
| Educational Attainment | In Labor Force | Unemployed |
| Less than High School | 22 (61.1%) | 0 (0.0%) |
| High School Diploma | 115 (85.8%) | 22 (16.5%) |
| College / Associate Degree | 167 (88.4%) | 0 (0.0%) |
| Bachelor's Degree or higher | 329 (86.8%) | 0 (0.0%) |
| Total | 633 (85.8%) | 22 (3.0%) |
Employment Occupations by Sex in LaBarque Creek
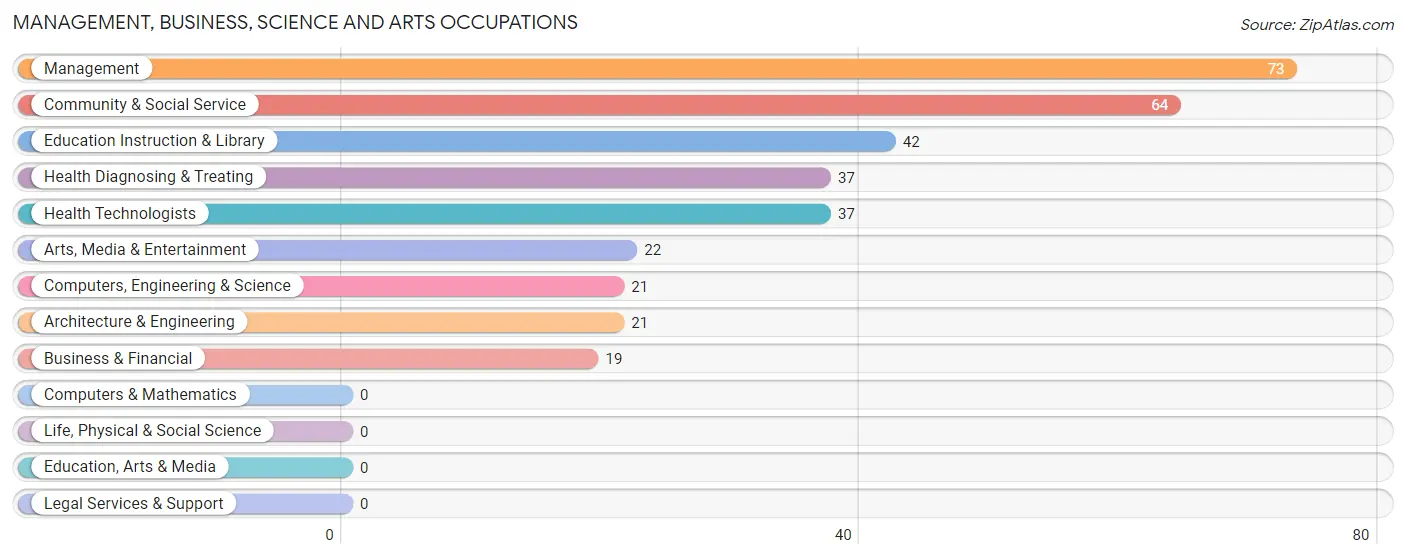
Management, Business, Science and Arts Occupations
The most common Management, Business, Science and Arts occupations in LaBarque Creek are Management (73 | 10.0%), Community & Social Service (64 | 8.8%), Education Instruction & Library (42 | 5.8%), Health Diagnosing & Treating (37 | 5.1%), and Health Technologists (37 | 5.1%).
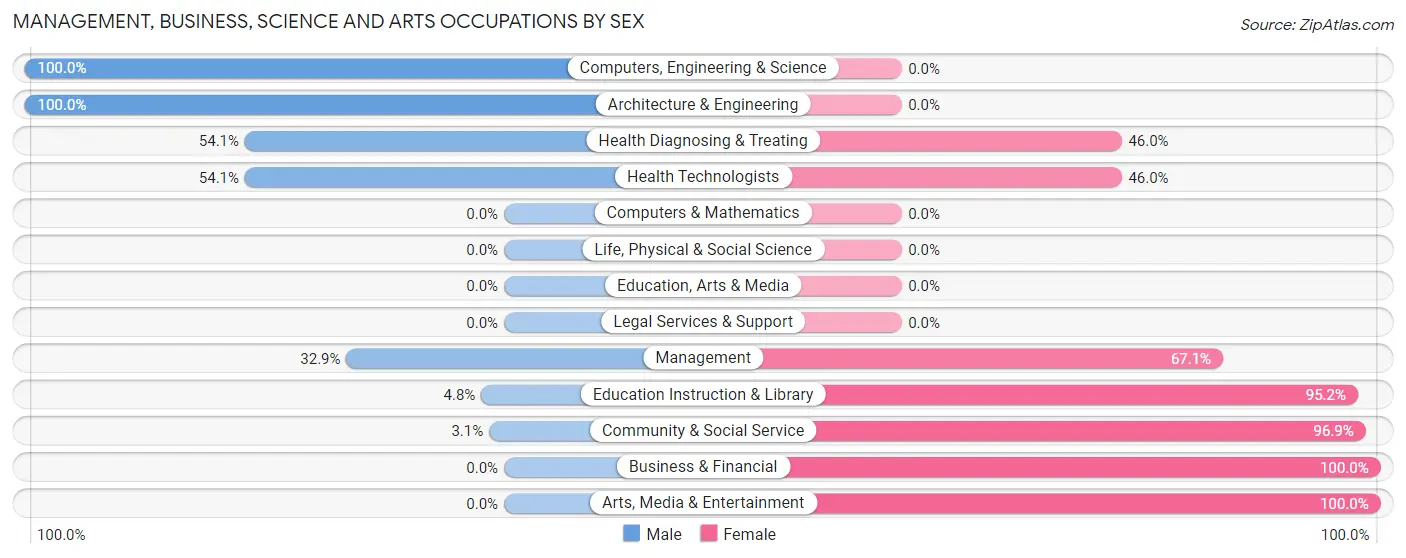
Management, Business, Science and Arts Occupations by Sex
Within the Management, Business, Science and Arts occupations in LaBarque Creek, the most male-oriented occupations are Computers, Engineering & Science (100.0%), Architecture & Engineering (100.0%), and Health Diagnosing & Treating (54.0%), while the most female-oriented occupations are Business & Financial (100.0%), Arts, Media & Entertainment (100.0%), and Community & Social Service (96.9%).
| Occupation | Male | Female |
| Management | 24 (32.9%) | 49 (67.1%) |
| Business & Financial | 0 (0.0%) | 19 (100.0%) |
| Computers, Engineering & Science | 21 (100.0%) | 0 (0.0%) |
| Computers & Mathematics | 0 (0.0%) | 0 (0.0%) |
| Architecture & Engineering | 21 (100.0%) | 0 (0.0%) |
| Life, Physical & Social Science | 0 (0.0%) | 0 (0.0%) |
| Community & Social Service | 2 (3.1%) | 62 (96.9%) |
| Education, Arts & Media | 0 (0.0%) | 0 (0.0%) |
| Legal Services & Support | 0 (0.0%) | 0 (0.0%) |
| Education Instruction & Library | 2 (4.8%) | 40 (95.2%) |
| Arts, Media & Entertainment | 0 (0.0%) | 22 (100.0%) |
| Health Diagnosing & Treating | 20 (54.0%) | 17 (46.0%) |
| Health Technologists | 20 (54.0%) | 17 (46.0%) |
| Total (Category) | 67 (31.3%) | 147 (68.7%) |
| Total (Overall) | 287 (39.4%) | 441 (60.6%) |
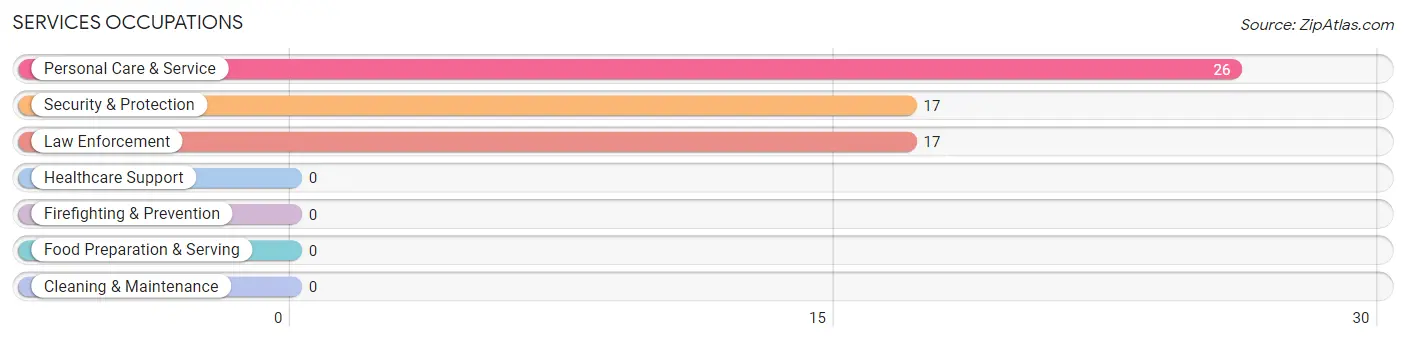
Services Occupations
The most common Services occupations in LaBarque Creek are Personal Care & Service (26 | 3.6%), Security & Protection (17 | 2.3%), and Law Enforcement (17 | 2.3%).
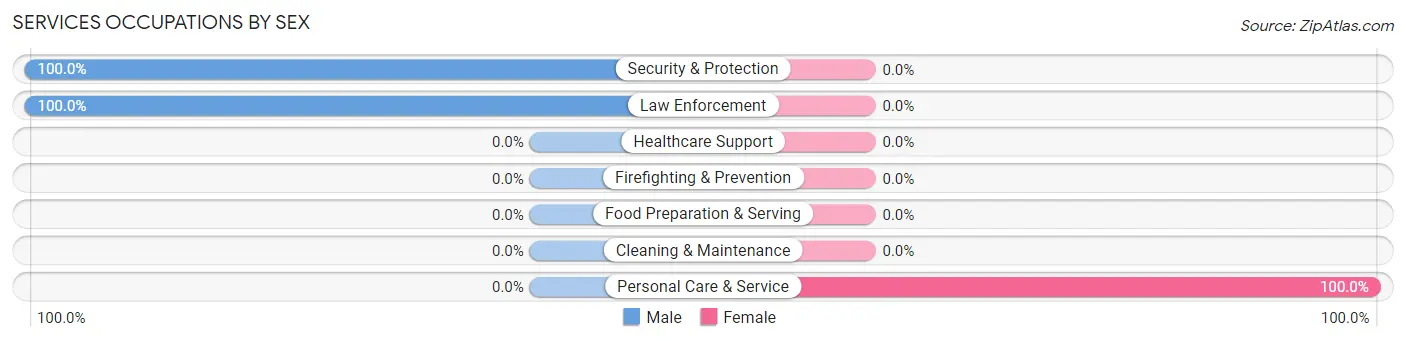
Services Occupations by Sex
| Occupation | Male | Female |
| Healthcare Support | 0 (0.0%) | 0 (0.0%) |
| Security & Protection | 17 (100.0%) | 0 (0.0%) |
| Firefighting & Prevention | 0 (0.0%) | 0 (0.0%) |
| Law Enforcement | 17 (100.0%) | 0 (0.0%) |
| Food Preparation & Serving | 0 (0.0%) | 0 (0.0%) |
| Cleaning & Maintenance | 0 (0.0%) | 0 (0.0%) |
| Personal Care & Service | 0 (0.0%) | 26 (100.0%) |
| Total (Category) | 17 (39.5%) | 26 (60.5%) |
| Total (Overall) | 287 (39.4%) | 441 (60.6%) |
Sales and Office Occupations
The most common Sales and Office occupations in LaBarque Creek are Office & Administration (136 | 18.7%), and Sales & Related (105 | 14.4%).
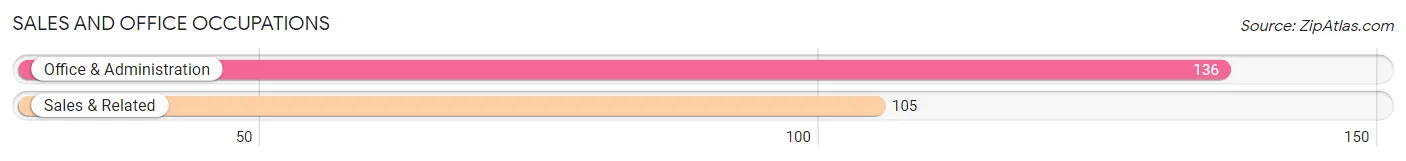
Sales and Office Occupations by Sex

| Occupation | Male | Female |
| Sales & Related | 32 (30.5%) | 73 (69.5%) |
| Office & Administration | 0 (0.0%) | 136 (100.0%) |
| Total (Category) | 32 (13.3%) | 209 (86.7%) |
| Total (Overall) | 287 (39.4%) | 441 (60.6%) |
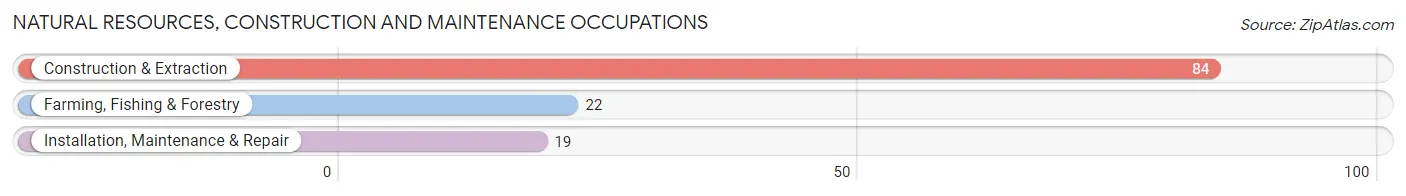
Natural Resources, Construction and Maintenance Occupations
The most common Natural Resources, Construction and Maintenance occupations in LaBarque Creek are Construction & Extraction (84 | 11.5%), Farming, Fishing & Forestry (22 | 3.0%), and Installation, Maintenance & Repair (19 | 2.6%).
Natural Resources, Construction and Maintenance Occupations by Sex
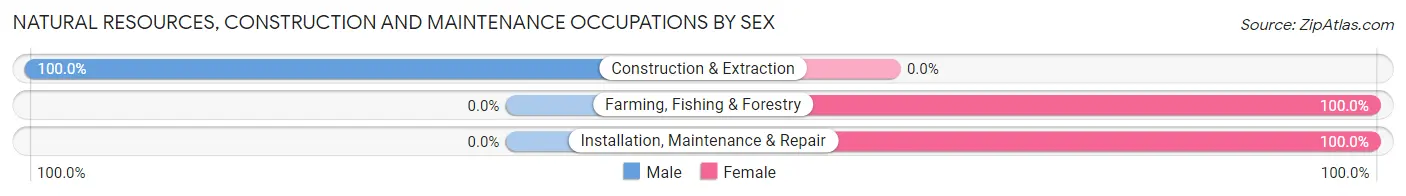
| Occupation | Male | Female |
| Farming, Fishing & Forestry | 0 (0.0%) | 22 (100.0%) |
| Construction & Extraction | 84 (100.0%) | 0 (0.0%) |
| Installation, Maintenance & Repair | 0 (0.0%) | 19 (100.0%) |
| Total (Category) | 84 (67.2%) | 41 (32.8%) |
| Total (Overall) | 287 (39.4%) | 441 (60.6%) |
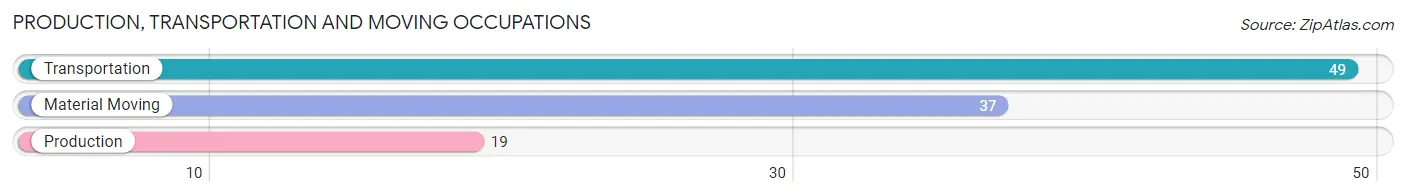
Production, Transportation and Moving Occupations
The most common Production, Transportation and Moving occupations in LaBarque Creek are Transportation (49 | 6.7%), Material Moving (37 | 5.1%), and Production (19 | 2.6%).
Production, Transportation and Moving Occupations by Sex
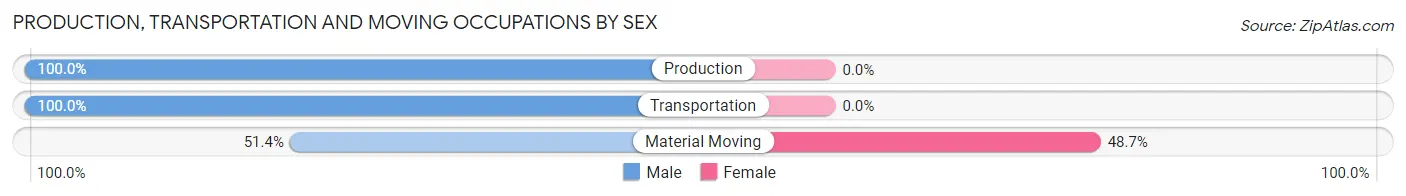
| Occupation | Male | Female |
| Production | 19 (100.0%) | 0 (0.0%) |
| Transportation | 49 (100.0%) | 0 (0.0%) |
| Material Moving | 19 (51.3%) | 18 (48.6%) |
| Total (Category) | 87 (82.9%) | 18 (17.1%) |
| Total (Overall) | 287 (39.4%) | 441 (60.6%) |
Employment Industries by Sex in LaBarque Creek
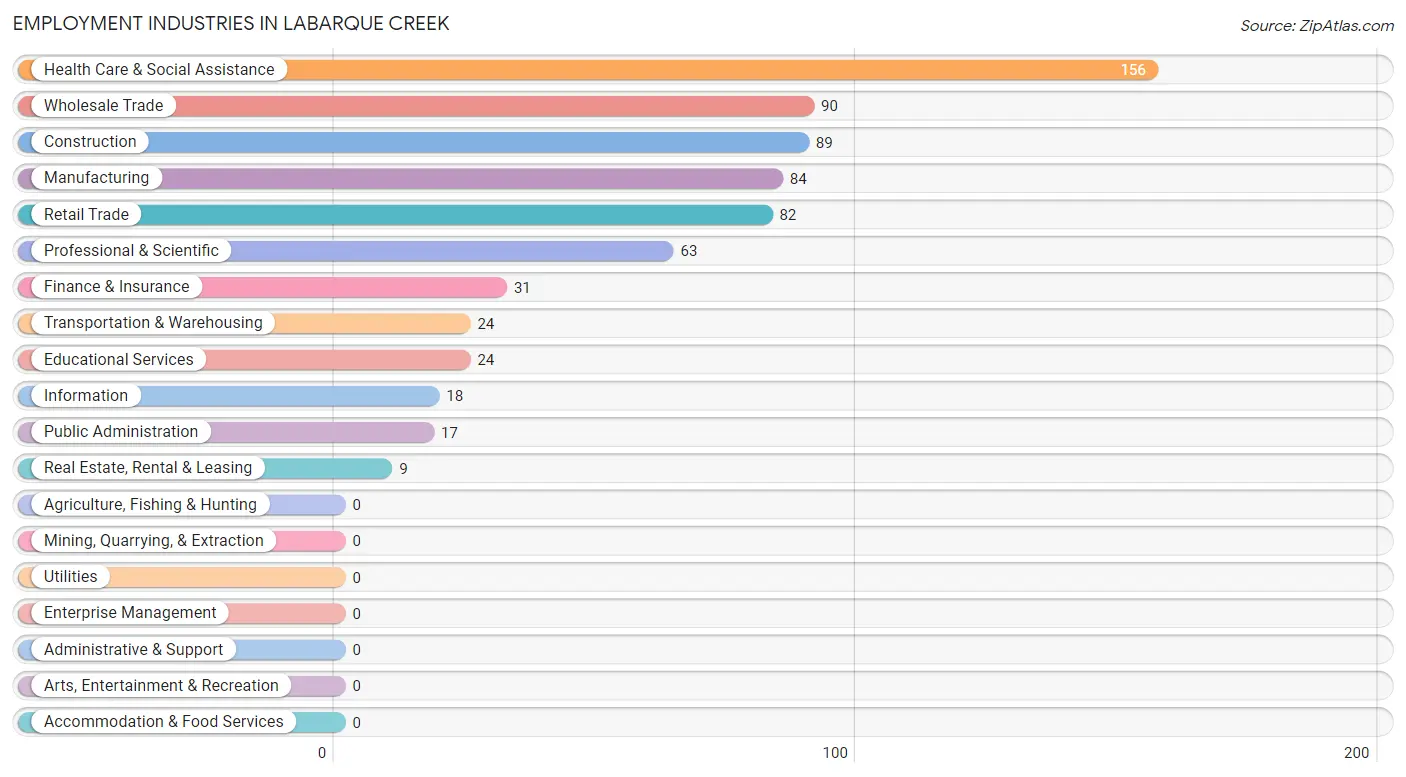
Employment Industries in LaBarque Creek
The major employment industries in LaBarque Creek include Health Care & Social Assistance (156 | 21.4%), Wholesale Trade (90 | 12.4%), Construction (89 | 12.2%), Manufacturing (84 | 11.5%), and Retail Trade (82 | 11.3%).
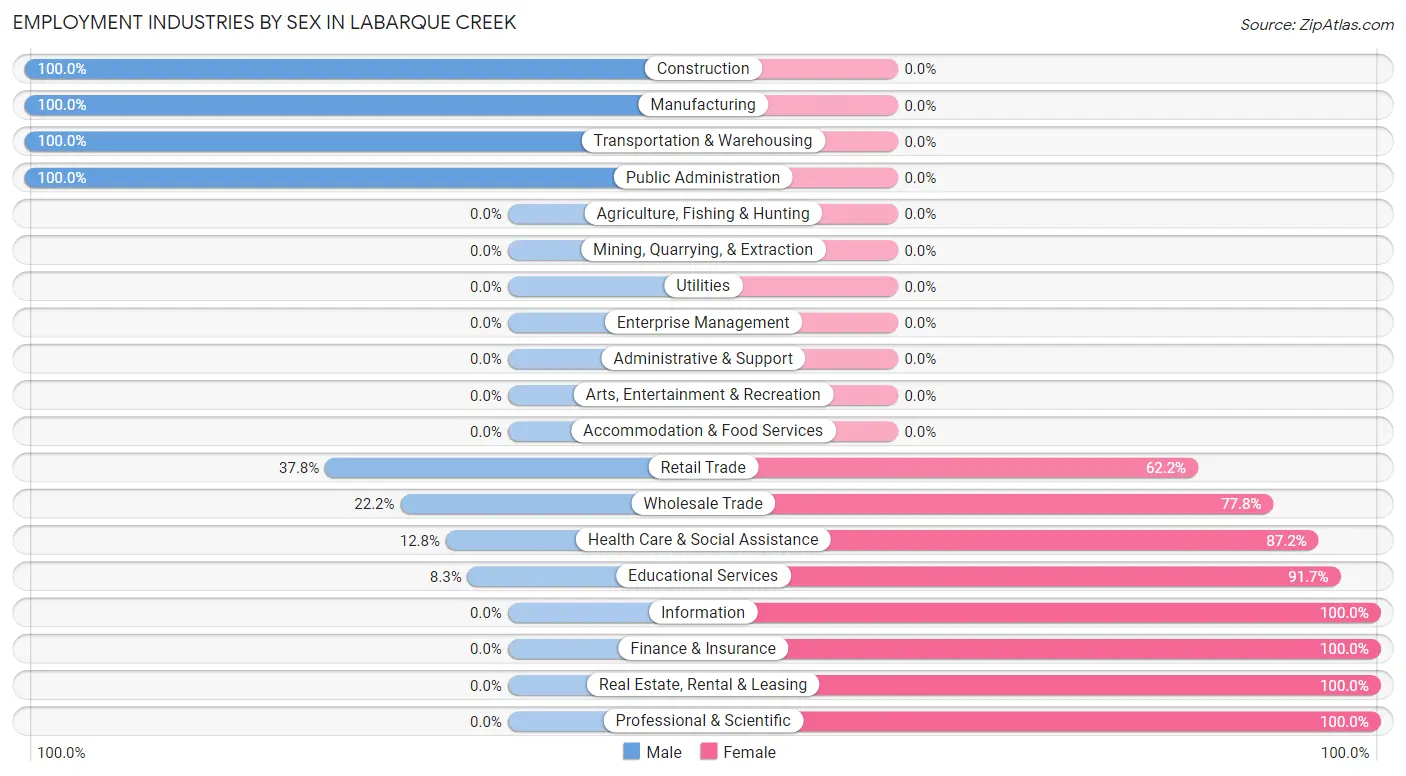
Employment Industries by Sex in LaBarque Creek
The LaBarque Creek industries that see more men than women are Construction (100.0%), Manufacturing (100.0%), and Transportation & Warehousing (100.0%), whereas the industries that tend to have a higher number of women are Information (100.0%), Finance & Insurance (100.0%), and Real Estate, Rental & Leasing (100.0%).
| Industry | Male | Female |
| Agriculture, Fishing & Hunting | 0 (0.0%) | 0 (0.0%) |
| Mining, Quarrying, & Extraction | 0 (0.0%) | 0 (0.0%) |
| Construction | 89 (100.0%) | 0 (0.0%) |
| Manufacturing | 84 (100.0%) | 0 (0.0%) |
| Wholesale Trade | 20 (22.2%) | 70 (77.8%) |
| Retail Trade | 31 (37.8%) | 51 (62.2%) |
| Transportation & Warehousing | 24 (100.0%) | 0 (0.0%) |
| Utilities | 0 (0.0%) | 0 (0.0%) |
| Information | 0 (0.0%) | 18 (100.0%) |
| Finance & Insurance | 0 (0.0%) | 31 (100.0%) |
| Real Estate, Rental & Leasing | 0 (0.0%) | 9 (100.0%) |
| Professional & Scientific | 0 (0.0%) | 63 (100.0%) |
| Enterprise Management | 0 (0.0%) | 0 (0.0%) |
| Administrative & Support | 0 (0.0%) | 0 (0.0%) |
| Educational Services | 2 (8.3%) | 22 (91.7%) |
| Health Care & Social Assistance | 20 (12.8%) | 136 (87.2%) |
| Arts, Entertainment & Recreation | 0 (0.0%) | 0 (0.0%) |
| Accommodation & Food Services | 0 (0.0%) | 0 (0.0%) |
| Public Administration | 17 (100.0%) | 0 (0.0%) |
| Total | 287 (39.4%) | 441 (60.6%) |
Education in LaBarque Creek
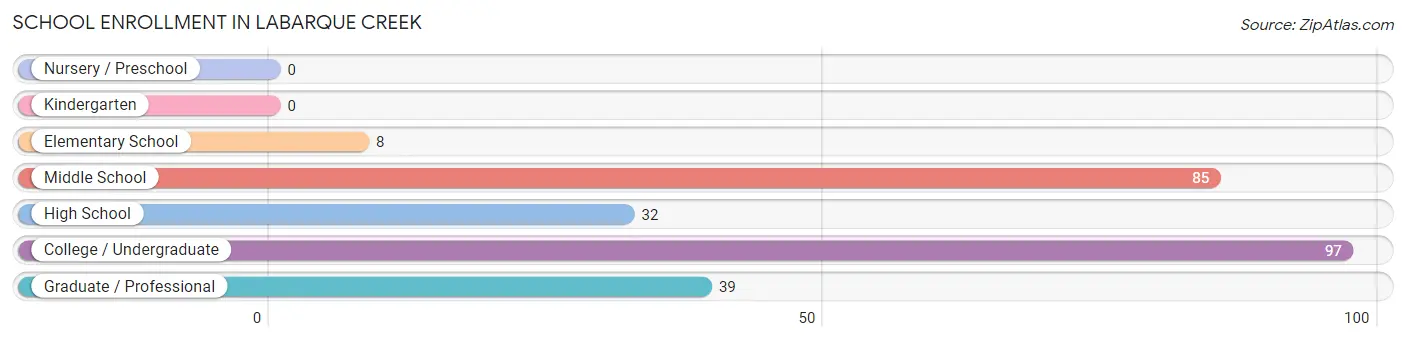
School Enrollment in LaBarque Creek
The most common levels of schooling among the 261 students in LaBarque Creek are college / undergraduate (97 | 37.2%), middle school (85 | 32.6%), and graduate / professional (39 | 14.9%).
| School Level | # Students | % Students |
| Nursery / Preschool | 0 | 0.0% |
| Kindergarten | 0 | 0.0% |
| Elementary School | 8 | 3.1% |
| Middle School | 85 | 32.6% |
| High School | 32 | 12.3% |
| College / Undergraduate | 97 | 37.2% |
| Graduate / Professional | 39 | 14.9% |
| Total | 261 | 100.0% |
School Enrollment by Age by Funding Source in LaBarque Creek
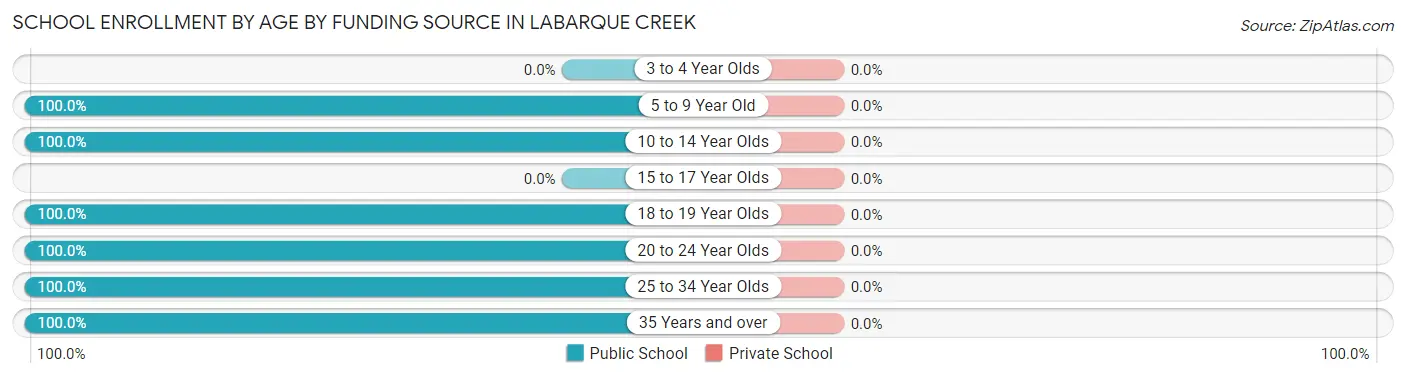
| Age Bracket | Public School | Private School |
| 3 to 4 Year Olds | 0 (0.0%) | 0 (0.0%) |
| 5 to 9 Year Old | 8 (100.0%) | 0 (0.0%) |
| 10 to 14 Year Olds | 102 (100.0%) | 0 (0.0%) |
| 15 to 17 Year Olds | 0 (0.0%) | 0 (0.0%) |
| 18 to 19 Year Olds | 33 (100.0%) | 0 (0.0%) |
| 20 to 24 Year Olds | 80 (100.0%) | 0 (0.0%) |
| 25 to 34 Year Olds | 21 (100.0%) | 0 (0.0%) |
| 35 Years and over | 17 (100.0%) | 0 (0.0%) |
| Total | 261 (100.0%) | 0 (0.0%) |
Educational Attainment by Field of Study in LaBarque Creek
Business (85 | 18.6%), education (66 | 14.5%), engineering (55 | 12.1%), literature & languages (50 | 11.0%), and psychology (40 | 8.8%) are the most common fields of study among 456 individuals in LaBarque Creek who have obtained a bachelor's degree or higher.
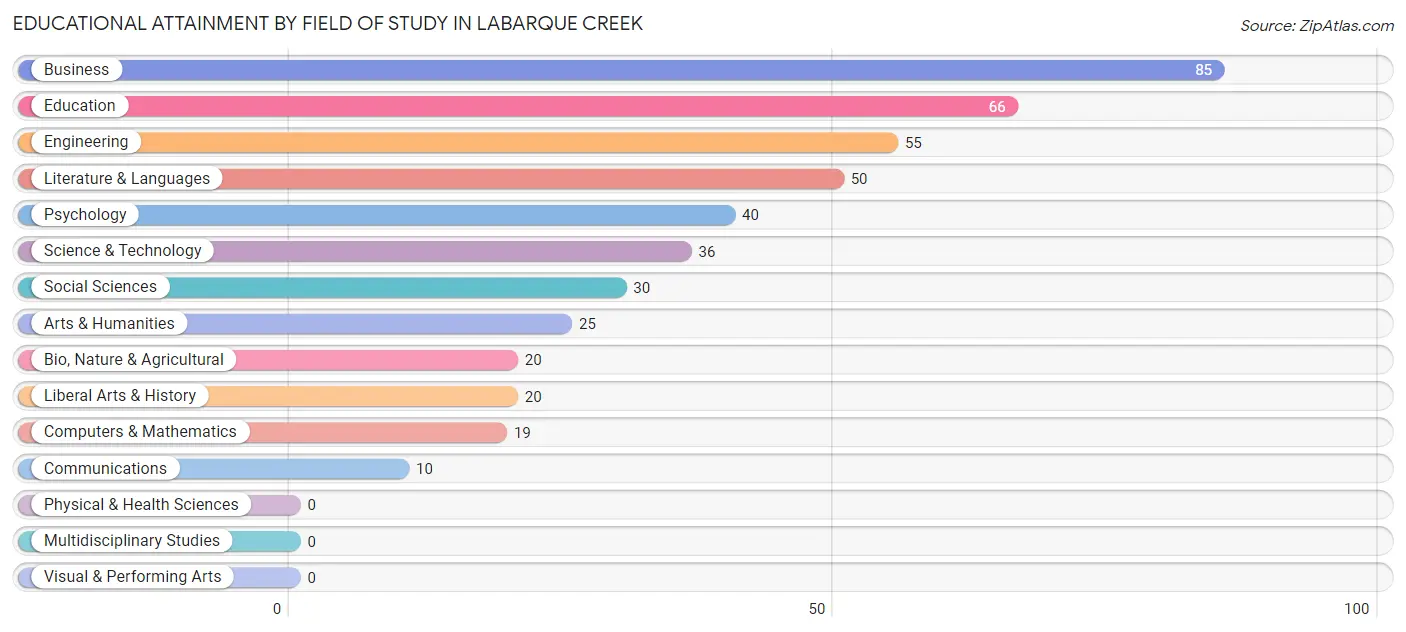
| Field of Study | # Graduates | % Graduates |
| Computers & Mathematics | 19 | 4.2% |
| Bio, Nature & Agricultural | 20 | 4.4% |
| Physical & Health Sciences | 0 | 0.0% |
| Psychology | 40 | 8.8% |
| Social Sciences | 30 | 6.6% |
| Engineering | 55 | 12.1% |
| Multidisciplinary Studies | 0 | 0.0% |
| Science & Technology | 36 | 7.9% |
| Business | 85 | 18.6% |
| Education | 66 | 14.5% |
| Literature & Languages | 50 | 11.0% |
| Liberal Arts & History | 20 | 4.4% |
| Visual & Performing Arts | 0 | 0.0% |
| Communications | 10 | 2.2% |
| Arts & Humanities | 25 | 5.5% |
| Total | 456 | 100.0% |
Transportation & Commute in LaBarque Creek
Vehicle Availability by Sex in LaBarque Creek
The most prevalent vehicle ownership categories in LaBarque Creek are males with 2 vehicles (100, accounting for 38.0%) and females with 2 vehicles (212, making up 22.7%).
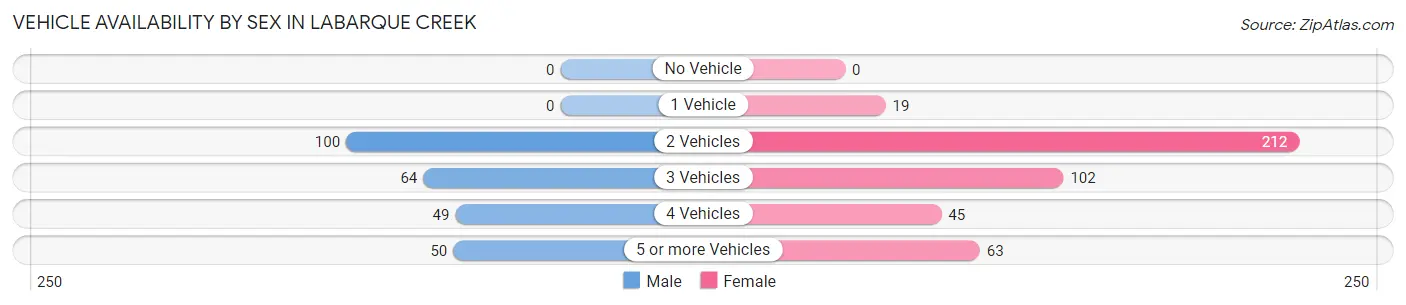
| Vehicles Available | Male | Female |
| No Vehicle | 0 (0.0%) | 0 (0.0%) |
| 1 Vehicle | 0 (0.0%) | 19 (4.3%) |
| 2 Vehicles | 100 (38.0%) | 212 (48.1%) |
| 3 Vehicles | 64 (24.3%) | 102 (23.1%) |
| 4 Vehicles | 49 (18.6%) | 45 (10.2%) |
| 5 or more Vehicles | 50 (19.0%) | 63 (14.3%) |
| Total | 263 (100.0%) | 441 (100.0%) |
Commute Time in LaBarque Creek
The most frequently occuring commute durations in LaBarque Creek are 45 to 59 minutes (231 commuters, 41.4%), 30 to 34 minutes (126 commuters, 22.6%), and less than 5 minutes (50 commuters, 9.0%).
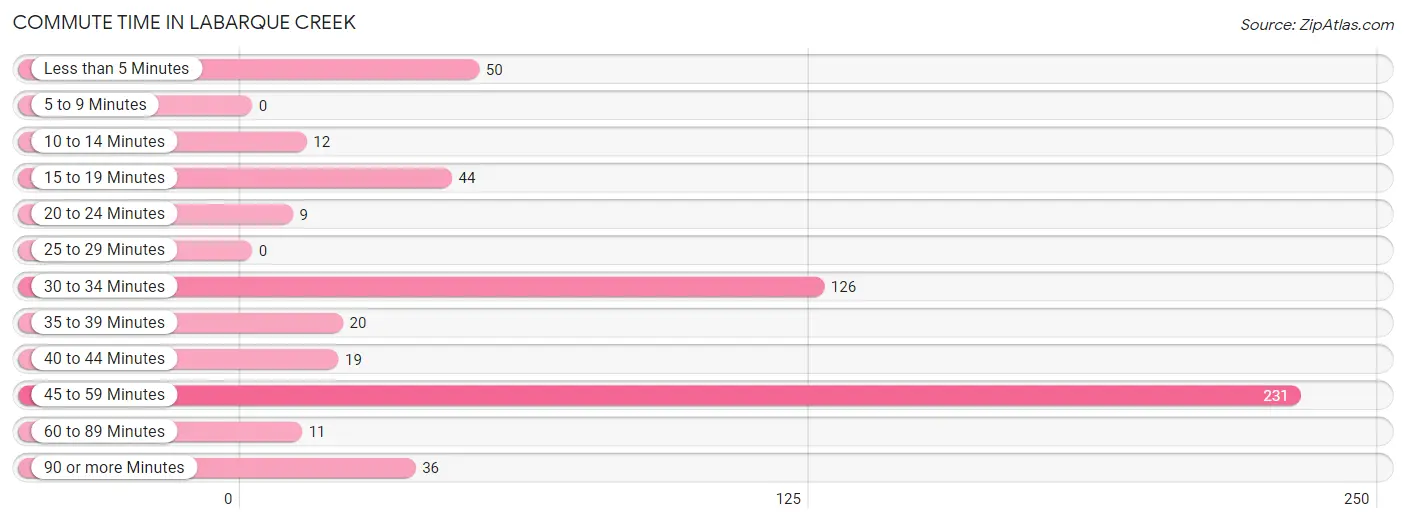
| Commute Time | # Commuters | % Commuters |
| Less than 5 Minutes | 50 | 9.0% |
| 5 to 9 Minutes | 0 | 0.0% |
| 10 to 14 Minutes | 12 | 2.1% |
| 15 to 19 Minutes | 44 | 7.9% |
| 20 to 24 Minutes | 9 | 1.6% |
| 25 to 29 Minutes | 0 | 0.0% |
| 30 to 34 Minutes | 126 | 22.6% |
| 35 to 39 Minutes | 20 | 3.6% |
| 40 to 44 Minutes | 19 | 3.4% |
| 45 to 59 Minutes | 231 | 41.4% |
| 60 to 89 Minutes | 11 | 2.0% |
| 90 or more Minutes | 36 | 6.5% |
Commute Time by Sex in LaBarque Creek
The most common commute times in LaBarque Creek are 45 to 59 minutes (133 commuters, 50.2%) for males and 45 to 59 minutes (98 commuters, 33.5%) for females.
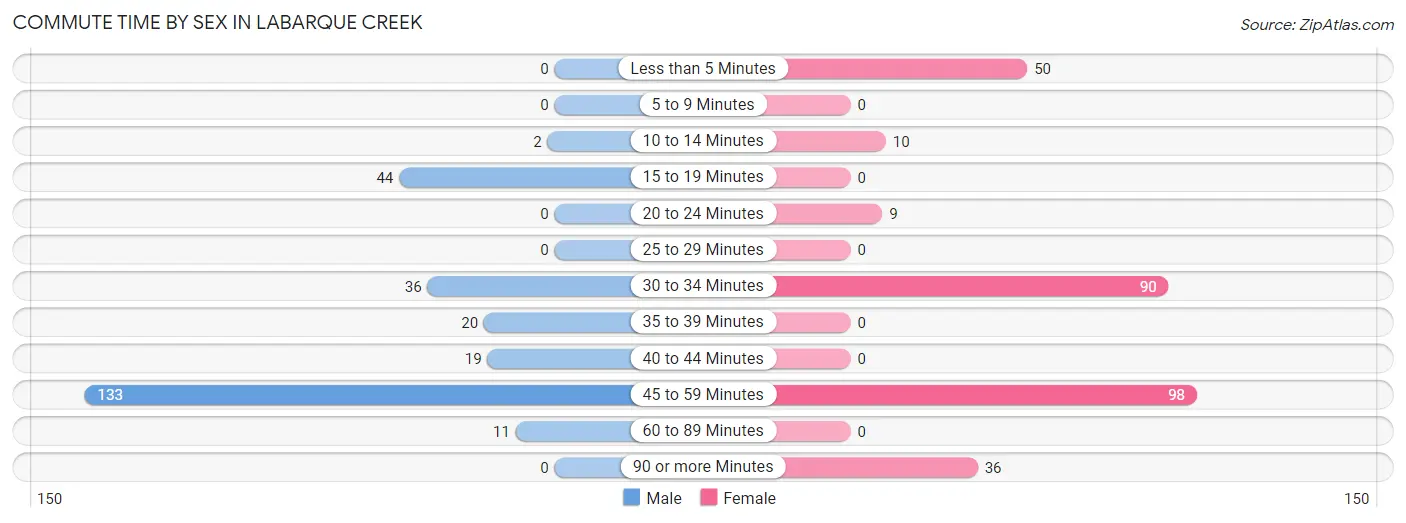
| Commute Time | Male | Female |
| Less than 5 Minutes | 0 (0.0%) | 50 (17.1%) |
| 5 to 9 Minutes | 0 (0.0%) | 0 (0.0%) |
| 10 to 14 Minutes | 2 (0.7%) | 10 (3.4%) |
| 15 to 19 Minutes | 44 (16.6%) | 0 (0.0%) |
| 20 to 24 Minutes | 0 (0.0%) | 9 (3.1%) |
| 25 to 29 Minutes | 0 (0.0%) | 0 (0.0%) |
| 30 to 34 Minutes | 36 (13.6%) | 90 (30.7%) |
| 35 to 39 Minutes | 20 (7.5%) | 0 (0.0%) |
| 40 to 44 Minutes | 19 (7.2%) | 0 (0.0%) |
| 45 to 59 Minutes | 133 (50.2%) | 98 (33.5%) |
| 60 to 89 Minutes | 11 (4.2%) | 0 (0.0%) |
| 90 or more Minutes | 0 (0.0%) | 36 (12.3%) |
Time of Departure to Work by Sex in LaBarque Creek
The most frequent times of departure to work in LaBarque Creek are 7:00 AM to 7:29 AM (59, 22.3%) for males and 7:00 AM to 7:29 AM (90, 30.7%) for females.
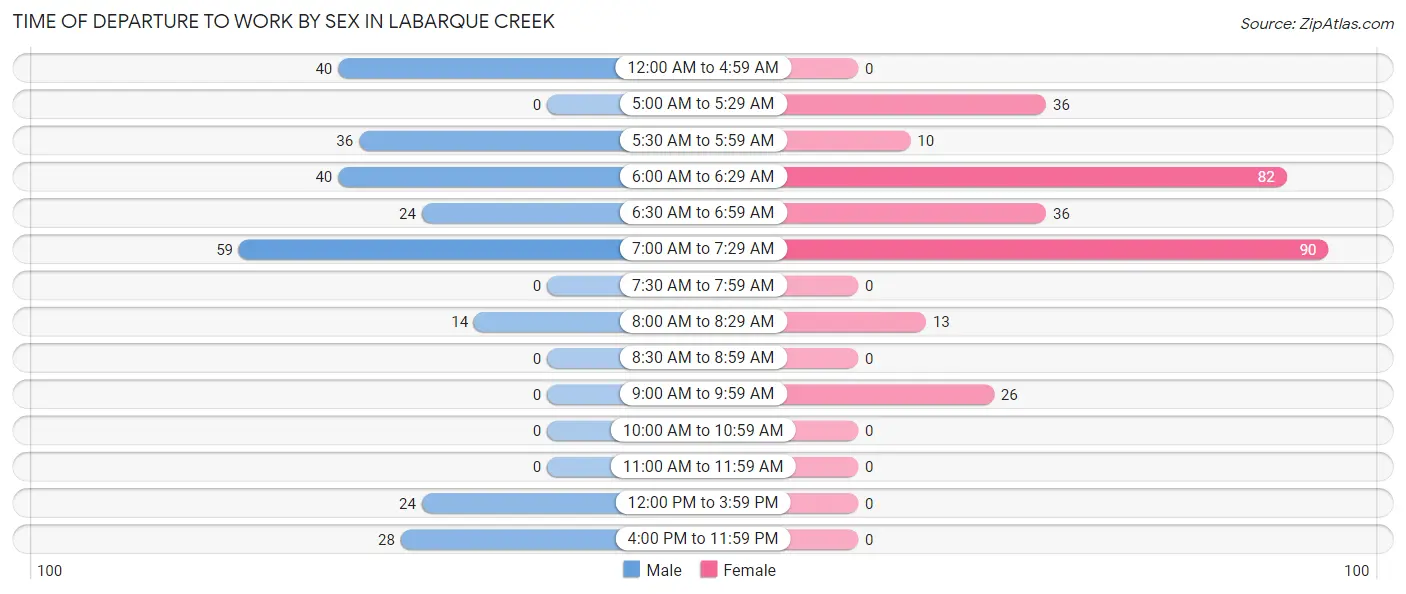
| Time of Departure | Male | Female |
| 12:00 AM to 4:59 AM | 40 (15.1%) | 0 (0.0%) |
| 5:00 AM to 5:29 AM | 0 (0.0%) | 36 (12.3%) |
| 5:30 AM to 5:59 AM | 36 (13.6%) | 10 (3.4%) |
| 6:00 AM to 6:29 AM | 40 (15.1%) | 82 (28.0%) |
| 6:30 AM to 6:59 AM | 24 (9.1%) | 36 (12.3%) |
| 7:00 AM to 7:29 AM | 59 (22.3%) | 90 (30.7%) |
| 7:30 AM to 7:59 AM | 0 (0.0%) | 0 (0.0%) |
| 8:00 AM to 8:29 AM | 14 (5.3%) | 13 (4.4%) |
| 8:30 AM to 8:59 AM | 0 (0.0%) | 0 (0.0%) |
| 9:00 AM to 9:59 AM | 0 (0.0%) | 26 (8.9%) |
| 10:00 AM to 10:59 AM | 0 (0.0%) | 0 (0.0%) |
| 11:00 AM to 11:59 AM | 0 (0.0%) | 0 (0.0%) |
| 12:00 PM to 3:59 PM | 24 (9.1%) | 0 (0.0%) |
| 4:00 PM to 11:59 PM | 28 (10.6%) | 0 (0.0%) |
| Total | 265 (100.0%) | 293 (100.0%) |
Housing Occupancy in LaBarque Creek
Occupancy by Ownership in LaBarque Creek
Of the total 467 dwellings in LaBarque Creek, owner-occupied units account for 453 (97.0%), while renter-occupied units make up 14 (3.0%).
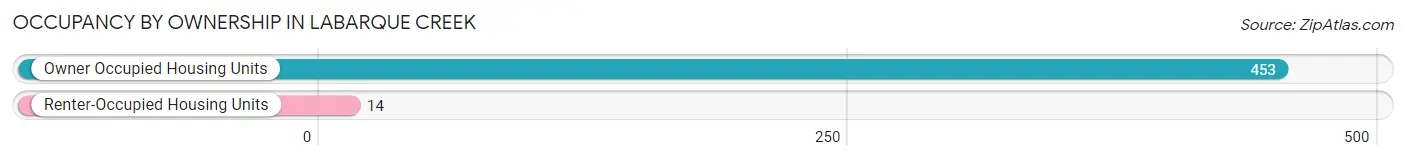
| Occupancy | # Housing Units | % Housing Units |
| Owner Occupied Housing Units | 453 | 97.0% |
| Renter-Occupied Housing Units | 14 | 3.0% |
| Total Occupied Housing Units | 467 | 100.0% |
Occupancy by Household Size in LaBarque Creek
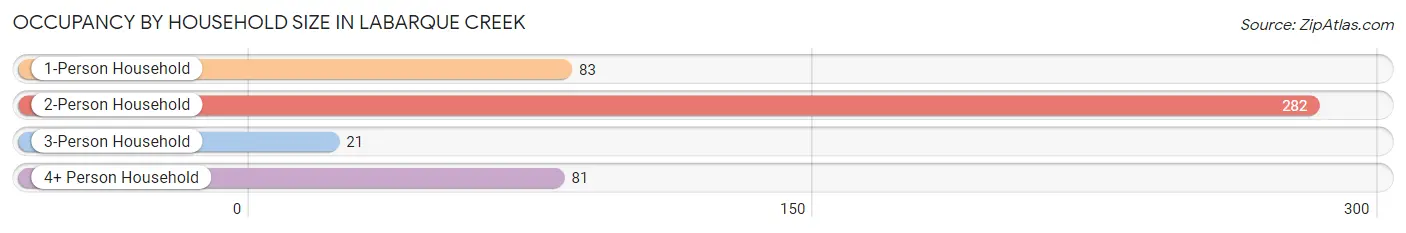
| Household Size | # Housing Units | % Housing Units |
| 1-Person Household | 83 | 17.8% |
| 2-Person Household | 282 | 60.4% |
| 3-Person Household | 21 | 4.5% |
| 4+ Person Household | 81 | 17.3% |
| Total Housing Units | 467 | 100.0% |
Occupancy by Ownership by Household Size in LaBarque Creek
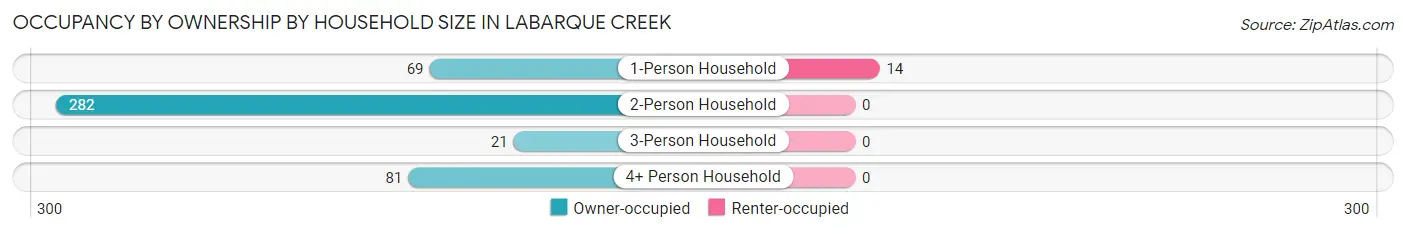
| Household Size | Owner-occupied | Renter-occupied |
| 1-Person Household | 69 (83.1%) | 14 (16.9%) |
| 2-Person Household | 282 (100.0%) | 0 (0.0%) |
| 3-Person Household | 21 (100.0%) | 0 (0.0%) |
| 4+ Person Household | 81 (100.0%) | 0 (0.0%) |
| Total Housing Units | 453 (97.0%) | 14 (3.0%) |
Occupancy by Educational Attainment in LaBarque Creek
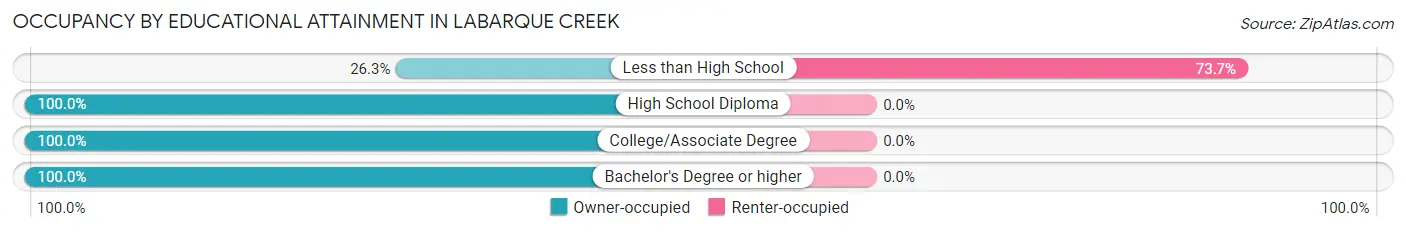
| Household Size | Owner-occupied | Renter-occupied |
| Less than High School | 5 (26.3%) | 14 (73.7%) |
| High School Diploma | 62 (100.0%) | 0 (0.0%) |
| College/Associate Degree | 134 (100.0%) | 0 (0.0%) |
| Bachelor's Degree or higher | 252 (100.0%) | 0 (0.0%) |
Occupancy by Age of Householder in LaBarque Creek
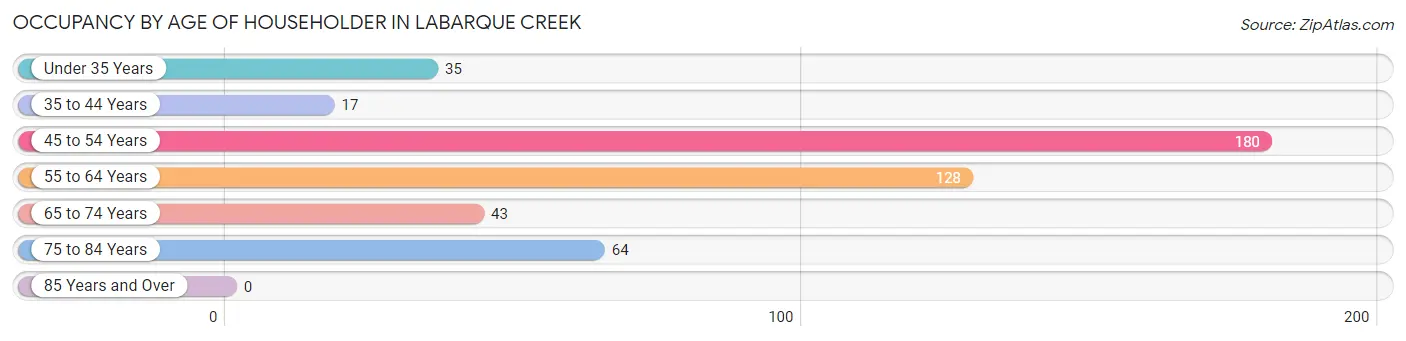
| Age Bracket | # Households | % Households |
| Under 35 Years | 35 | 7.5% |
| 35 to 44 Years | 17 | 3.6% |
| 45 to 54 Years | 180 | 38.5% |
| 55 to 64 Years | 128 | 27.4% |
| 65 to 74 Years | 43 | 9.2% |
| 75 to 84 Years | 64 | 13.7% |
| 85 Years and Over | 0 | 0.0% |
| Total | 467 | 100.0% |
Housing Finances in LaBarque Creek
Median Income by Occupancy in LaBarque Creek
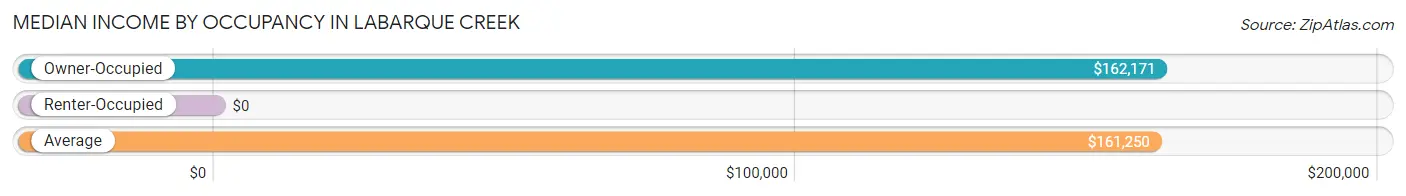
| Occupancy Type | # Households | Median Income |
| Owner-Occupied | 453 (97.0%) | $162,171 |
| Renter-Occupied | 14 (3.0%) | $0 |
| Average | 467 (100.0%) | $161,250 |
Occupancy by Householder Income Bracket in LaBarque Creek
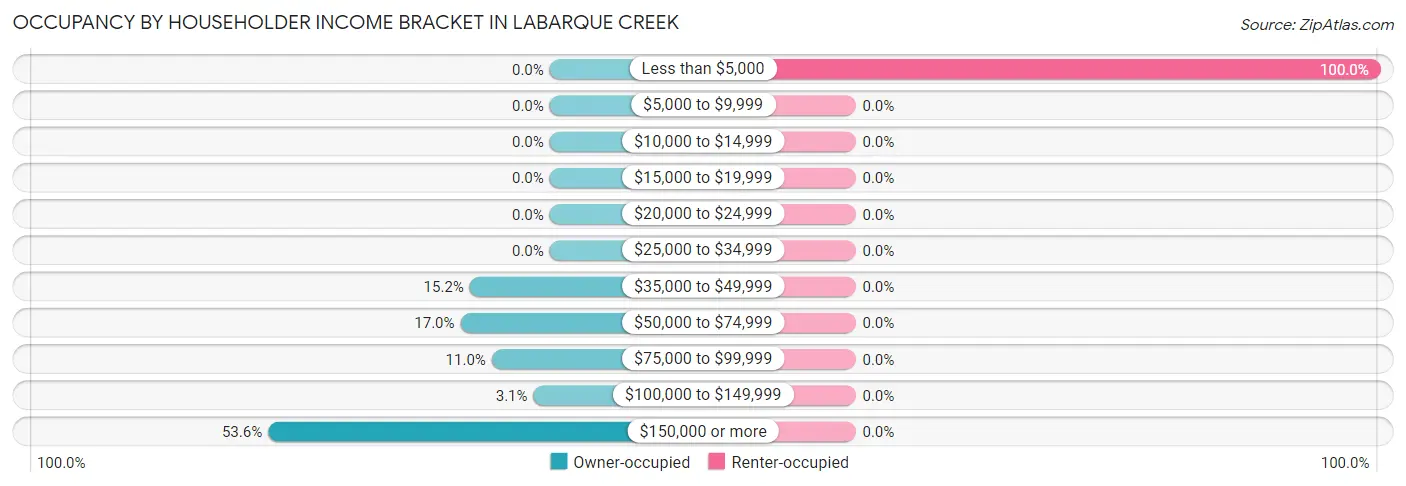
| Income Bracket | Owner-occupied | Renter-occupied |
| Less than $5,000 | 0 (0.0%) | 14 (100.0%) |
| $5,000 to $9,999 | 0 (0.0%) | 0 (0.0%) |
| $10,000 to $14,999 | 0 (0.0%) | 0 (0.0%) |
| $15,000 to $19,999 | 0 (0.0%) | 0 (0.0%) |
| $20,000 to $24,999 | 0 (0.0%) | 0 (0.0%) |
| $25,000 to $34,999 | 0 (0.0%) | 0 (0.0%) |
| $35,000 to $49,999 | 69 (15.2%) | 0 (0.0%) |
| $50,000 to $74,999 | 77 (17.0%) | 0 (0.0%) |
| $75,000 to $99,999 | 50 (11.0%) | 0 (0.0%) |
| $100,000 to $149,999 | 14 (3.1%) | 0 (0.0%) |
| $150,000 or more | 243 (53.6%) | 0 (0.0%) |
| Total | 453 (100.0%) | 14 (100.0%) |
Monthly Housing Cost Tiers in LaBarque Creek
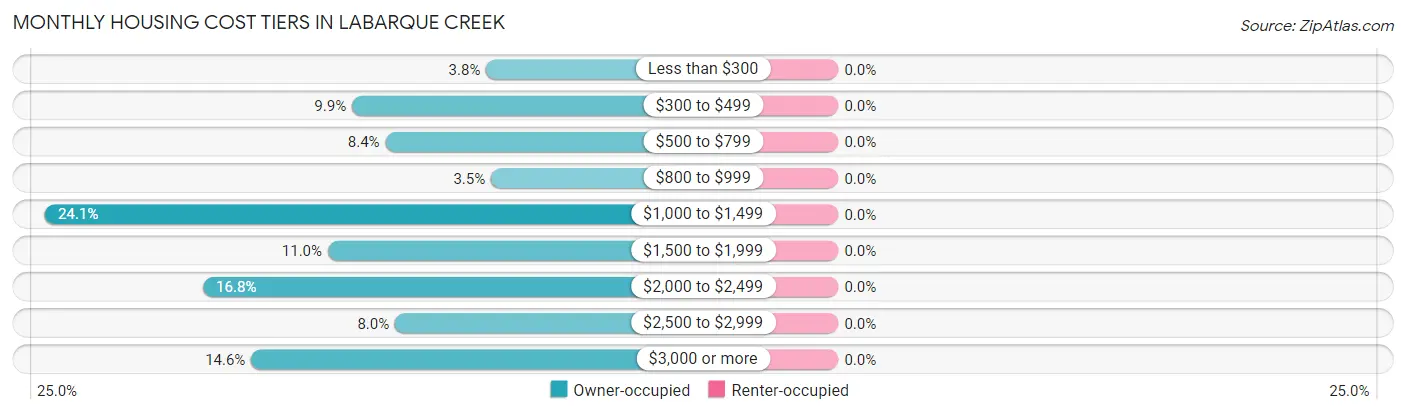
| Monthly Cost | Owner-occupied | Renter-occupied |
| Less than $300 | 17 (3.7%) | 0 (0.0%) |
| $300 to $499 | 45 (9.9%) | 0 (0.0%) |
| $500 to $799 | 38 (8.4%) | 0 (0.0%) |
| $800 to $999 | 16 (3.5%) | 0 (0.0%) |
| $1,000 to $1,499 | 109 (24.1%) | 0 (0.0%) |
| $1,500 to $1,999 | 50 (11.0%) | 0 (0.0%) |
| $2,000 to $2,499 | 76 (16.8%) | 0 (0.0%) |
| $2,500 to $2,999 | 36 (8.0%) | 0 (0.0%) |
| $3,000 or more | 66 (14.6%) | 0 (0.0%) |
| Total | 453 (100.0%) | 14 (100.0%) |
Physical Housing Characteristics in LaBarque Creek
Housing Structures in LaBarque Creek
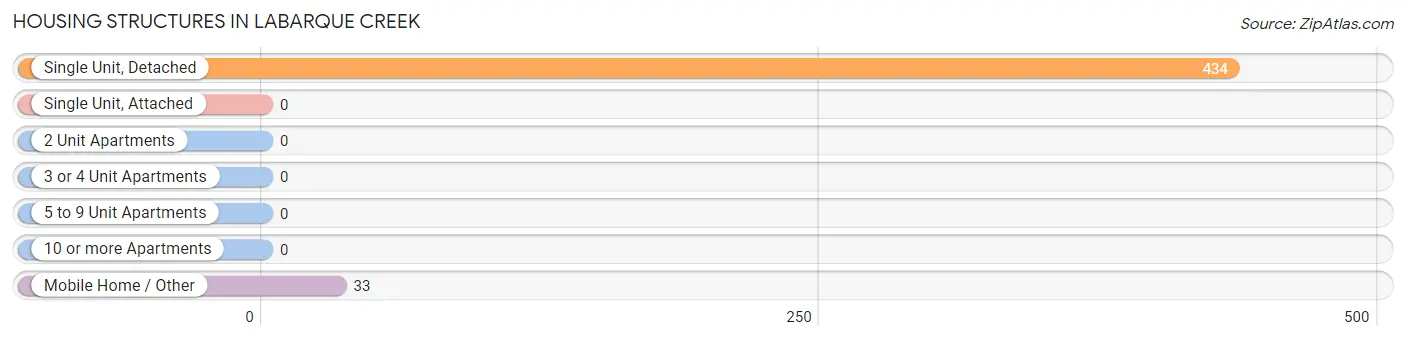
| Structure Type | # Housing Units | % Housing Units |
| Single Unit, Detached | 434 | 92.9% |
| Single Unit, Attached | 0 | 0.0% |
| 2 Unit Apartments | 0 | 0.0% |
| 3 or 4 Unit Apartments | 0 | 0.0% |
| 5 to 9 Unit Apartments | 0 | 0.0% |
| 10 or more Apartments | 0 | 0.0% |
| Mobile Home / Other | 33 | 7.1% |
| Total | 467 | 100.0% |
Housing Structures by Occupancy in LaBarque Creek
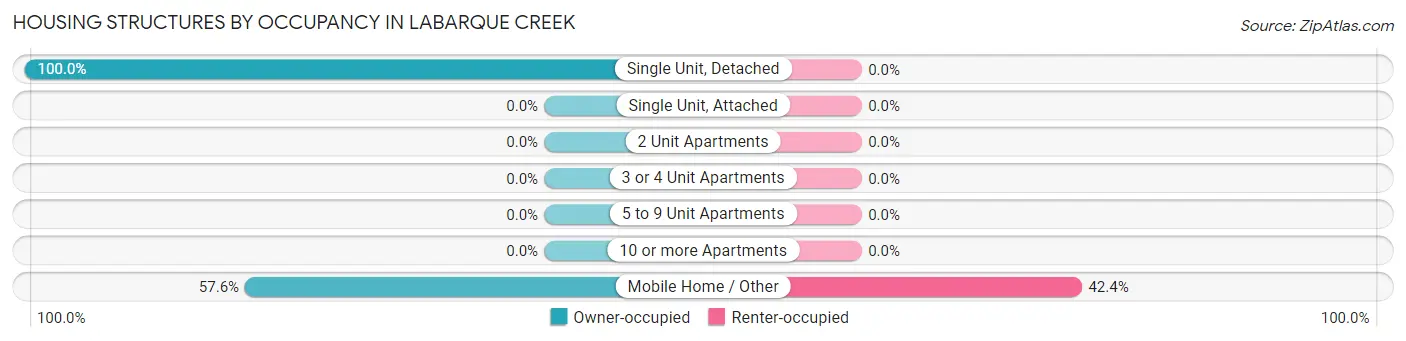
| Structure Type | Owner-occupied | Renter-occupied |
| Single Unit, Detached | 434 (100.0%) | 0 (0.0%) |
| Single Unit, Attached | 0 (0.0%) | 0 (0.0%) |
| 2 Unit Apartments | 0 (0.0%) | 0 (0.0%) |
| 3 or 4 Unit Apartments | 0 (0.0%) | 0 (0.0%) |
| 5 to 9 Unit Apartments | 0 (0.0%) | 0 (0.0%) |
| 10 or more Apartments | 0 (0.0%) | 0 (0.0%) |
| Mobile Home / Other | 19 (57.6%) | 14 (42.4%) |
| Total | 453 (97.0%) | 14 (3.0%) |
Housing Structures by Number of Rooms in LaBarque Creek
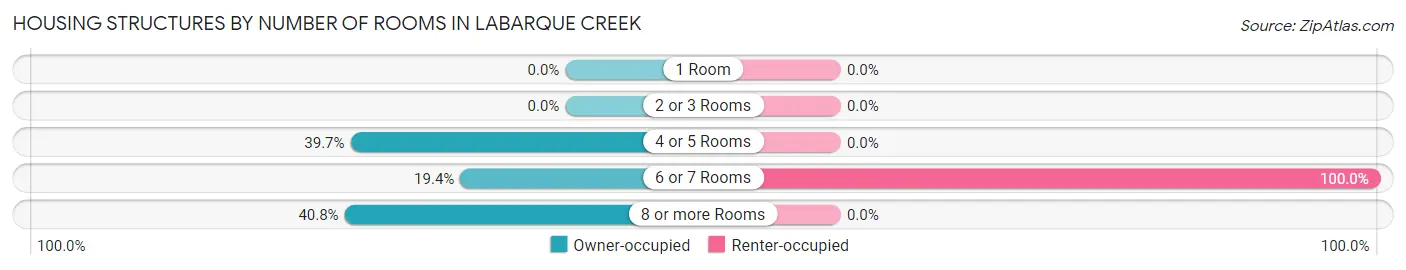
| Number of Rooms | Owner-occupied | Renter-occupied |
| 1 Room | 0 (0.0%) | 0 (0.0%) |
| 2 or 3 Rooms | 0 (0.0%) | 0 (0.0%) |
| 4 or 5 Rooms | 180 (39.7%) | 0 (0.0%) |
| 6 or 7 Rooms | 88 (19.4%) | 14 (100.0%) |
| 8 or more Rooms | 185 (40.8%) | 0 (0.0%) |
| Total | 453 (100.0%) | 14 (100.0%) |
Housing Structure by Heating Type in LaBarque Creek
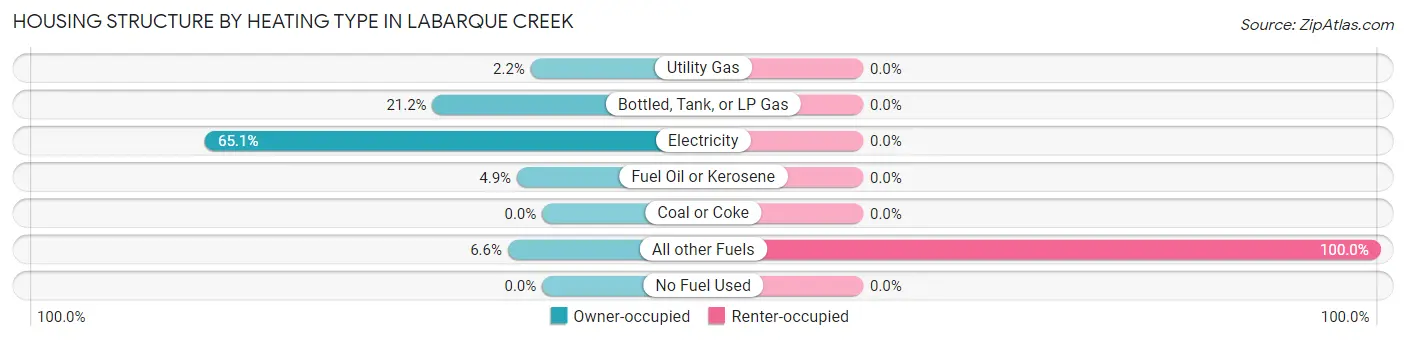
| Heating Type | Owner-occupied | Renter-occupied |
| Utility Gas | 10 (2.2%) | 0 (0.0%) |
| Bottled, Tank, or LP Gas | 96 (21.2%) | 0 (0.0%) |
| Electricity | 295 (65.1%) | 0 (0.0%) |
| Fuel Oil or Kerosene | 22 (4.9%) | 0 (0.0%) |
| Coal or Coke | 0 (0.0%) | 0 (0.0%) |
| All other Fuels | 30 (6.6%) | 14 (100.0%) |
| No Fuel Used | 0 (0.0%) | 0 (0.0%) |
| Total | 453 (100.0%) | 14 (100.0%) |
Household Vehicle Usage in LaBarque Creek
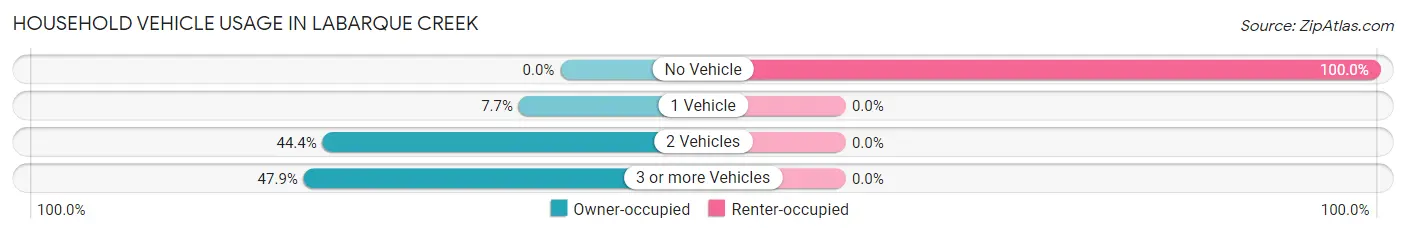
| Vehicles per Household | Owner-occupied | Renter-occupied |
| No Vehicle | 0 (0.0%) | 14 (100.0%) |
| 1 Vehicle | 35 (7.7%) | 0 (0.0%) |
| 2 Vehicles | 201 (44.4%) | 0 (0.0%) |
| 3 or more Vehicles | 217 (47.9%) | 0 (0.0%) |
| Total | 453 (100.0%) | 14 (100.0%) |
Real Estate & Mortgages in LaBarque Creek
Real Estate and Mortgage Overview in LaBarque Creek
| Characteristic | Without Mortgage | With Mortgage |
| Housing Units | 135 | 318 |
| Median Property Value | $541,700 | $342,400 |
| Median Household Income | $73,417 | $199 |
| Monthly Housing Costs | $520 | $66 |
| Real Estate Taxes | $2,900 | $0 |
Property Value by Mortgage Status in LaBarque Creek
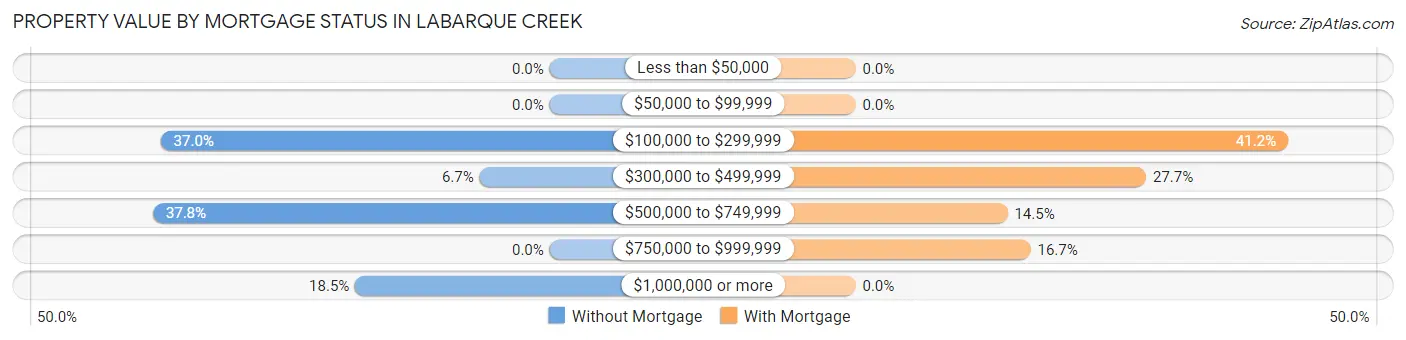
| Property Value | Without Mortgage | With Mortgage |
| Less than $50,000 | 0 (0.0%) | 0 (0.0%) |
| $50,000 to $99,999 | 0 (0.0%) | 0 (0.0%) |
| $100,000 to $299,999 | 50 (37.0%) | 131 (41.2%) |
| $300,000 to $499,999 | 9 (6.7%) | 88 (27.7%) |
| $500,000 to $749,999 | 51 (37.8%) | 46 (14.5%) |
| $750,000 to $999,999 | 0 (0.0%) | 53 (16.7%) |
| $1,000,000 or more | 25 (18.5%) | 0 (0.0%) |
| Total | 135 (100.0%) | 318 (100.0%) |
Household Income by Mortgage Status in LaBarque Creek
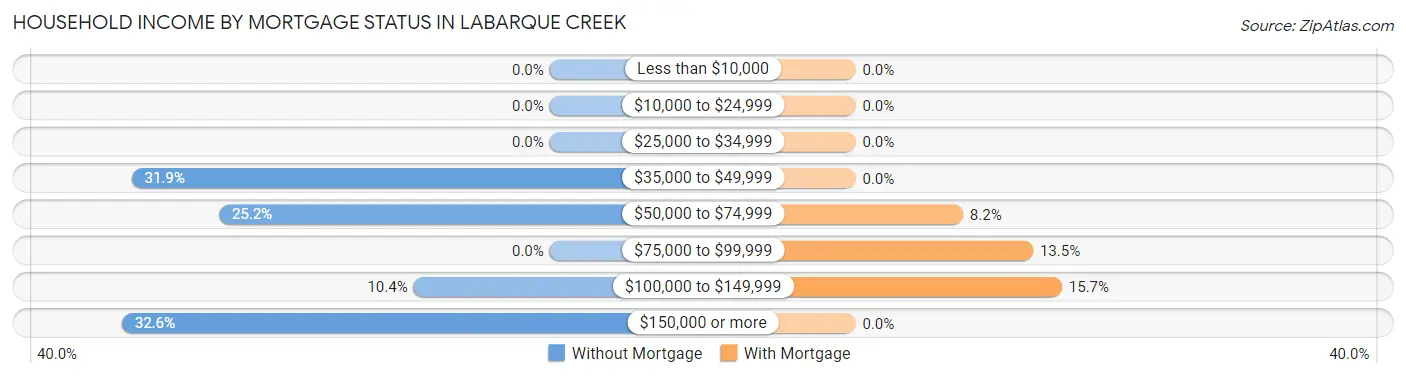
| Household Income | Without Mortgage | With Mortgage |
| Less than $10,000 | 0 (0.0%) | 0 (0.0%) |
| $10,000 to $24,999 | 0 (0.0%) | 0 (0.0%) |
| $25,000 to $34,999 | 0 (0.0%) | 0 (0.0%) |
| $35,000 to $49,999 | 43 (31.9%) | 0 (0.0%) |
| $50,000 to $74,999 | 34 (25.2%) | 26 (8.2%) |
| $75,000 to $99,999 | 0 (0.0%) | 43 (13.5%) |
| $100,000 to $149,999 | 14 (10.4%) | 50 (15.7%) |
| $150,000 or more | 44 (32.6%) | 0 (0.0%) |
| Total | 135 (100.0%) | 318 (100.0%) |
Property Value to Household Income Ratio in LaBarque Creek
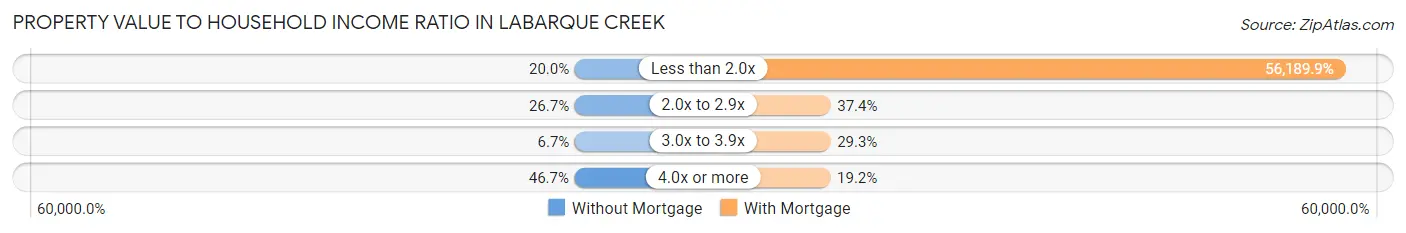
| Value-to-Income Ratio | Without Mortgage | With Mortgage |
| Less than 2.0x | 27 (20.0%) | 178,684 (56,189.9%) |
| 2.0x to 2.9x | 36 (26.7%) | 119 (37.4%) |
| 3.0x to 3.9x | 9 (6.7%) | 93 (29.2%) |
| 4.0x or more | 63 (46.7%) | 61 (19.2%) |
| Total | 135 (100.0%) | 318 (100.0%) |
Real Estate Taxes by Mortgage Status in LaBarque Creek
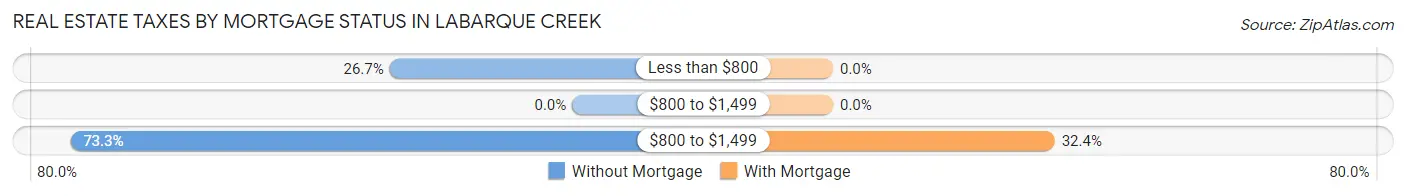
| Property Taxes | Without Mortgage | With Mortgage |
| Less than $800 | 36 (26.7%) | 0 (0.0%) |
| $800 to $1,499 | 0 (0.0%) | 0 (0.0%) |
| $800 to $1,499 | 99 (73.3%) | 103 (32.4%) |
| Total | 135 (100.0%) | 318 (100.0%) |
Health & Disability in LaBarque Creek
Health Insurance Coverage by Age in LaBarque Creek
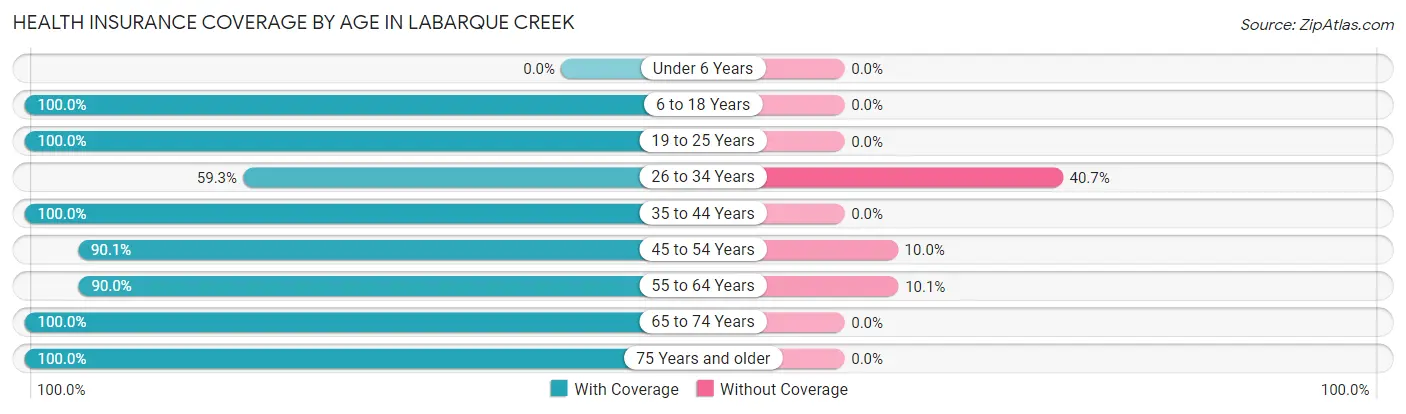
| Age Bracket | With Coverage | Without Coverage |
| Under 6 Years | 0 (0.0%) | 0 (0.0%) |
| 6 to 18 Years | 125 (100.0%) | 0 (0.0%) |
| 19 to 25 Years | 108 (100.0%) | 0 (0.0%) |
| 26 to 34 Years | 51 (59.3%) | 35 (40.7%) |
| 35 to 44 Years | 41 (100.0%) | 0 (0.0%) |
| 45 to 54 Years | 344 (90.0%) | 38 (10.0%) |
| 55 to 64 Years | 197 (89.9%) | 22 (10.1%) |
| 65 to 74 Years | 171 (100.0%) | 0 (0.0%) |
| 75 Years and older | 69 (100.0%) | 0 (0.0%) |
| Total | 1,106 (92.1%) | 95 (7.9%) |
Health Insurance Coverage by Citizenship Status in LaBarque Creek

| Citizenship Status | With Coverage | Without Coverage |
| Native Born | 0 (0.0%) | 0 (0.0%) |
| Foreign Born, Citizen | 125 (100.0%) | 0 (0.0%) |
| Foreign Born, not a Citizen | 108 (100.0%) | 0 (0.0%) |
Health Insurance Coverage by Household Income in LaBarque Creek
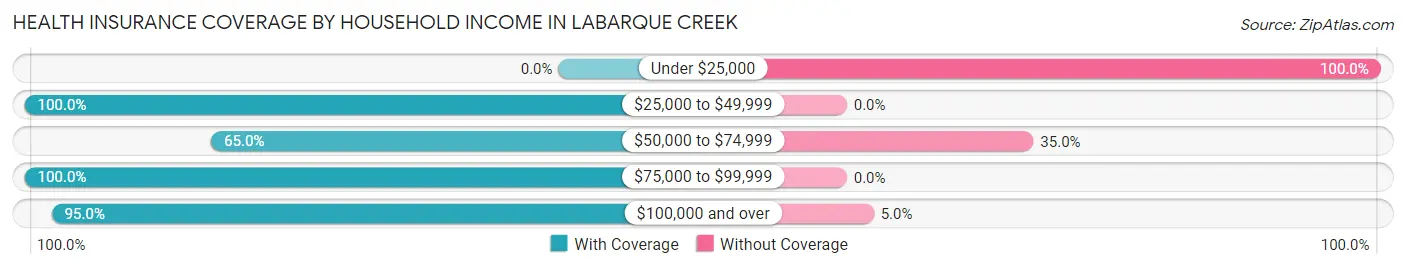
| Household Income | With Coverage | Without Coverage |
| Under $25,000 | 0 (0.0%) | 14 (100.0%) |
| $25,000 to $49,999 | 206 (100.0%) | 0 (0.0%) |
| $50,000 to $74,999 | 80 (65.0%) | 43 (35.0%) |
| $75,000 to $99,999 | 101 (100.0%) | 0 (0.0%) |
| $100,000 and over | 716 (95.0%) | 38 (5.0%) |
Public vs Private Health Insurance Coverage by Age in LaBarque Creek
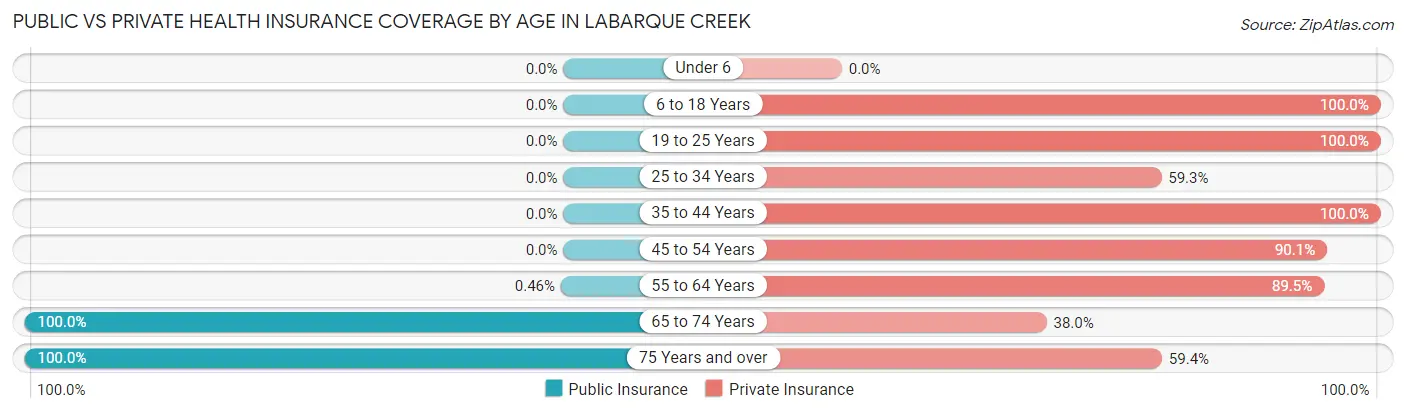
| Age Bracket | Public Insurance | Private Insurance |
| Under 6 | 0 (0.0%) | 0 (0.0%) |
| 6 to 18 Years | 0 (0.0%) | 125 (100.0%) |
| 19 to 25 Years | 0 (0.0%) | 108 (100.0%) |
| 25 to 34 Years | 0 (0.0%) | 51 (59.3%) |
| 35 to 44 Years | 0 (0.0%) | 41 (100.0%) |
| 45 to 54 Years | 0 (0.0%) | 344 (90.0%) |
| 55 to 64 Years | 1 (0.5%) | 196 (89.5%) |
| 65 to 74 Years | 171 (100.0%) | 65 (38.0%) |
| 75 Years and over | 69 (100.0%) | 41 (59.4%) |
| Total | 241 (20.1%) | 971 (80.8%) |
Disability Status by Sex by Age in LaBarque Creek
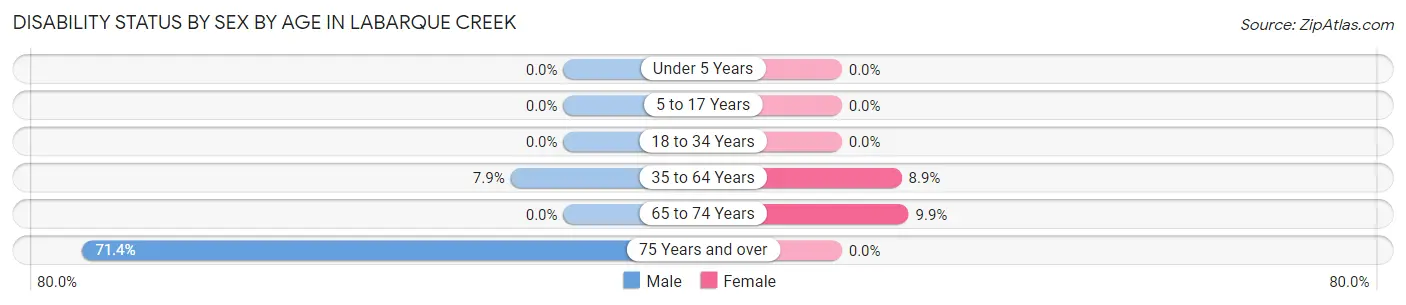
| Age Bracket | Male | Female |
| Under 5 Years | 0 (0.0%) | 0 (0.0%) |
| 5 to 17 Years | 0 (0.0%) | 0 (0.0%) |
| 18 to 34 Years | 0 (0.0%) | 0 (0.0%) |
| 35 to 64 Years | 23 (7.9%) | 31 (8.9%) |
| 65 to 74 Years | 0 (0.0%) | 13 (9.9%) |
| 75 Years and over | 35 (71.4%) | 0 (0.0%) |
Disability Class by Sex by Age in LaBarque Creek
Disability Class: Hearing Difficulty
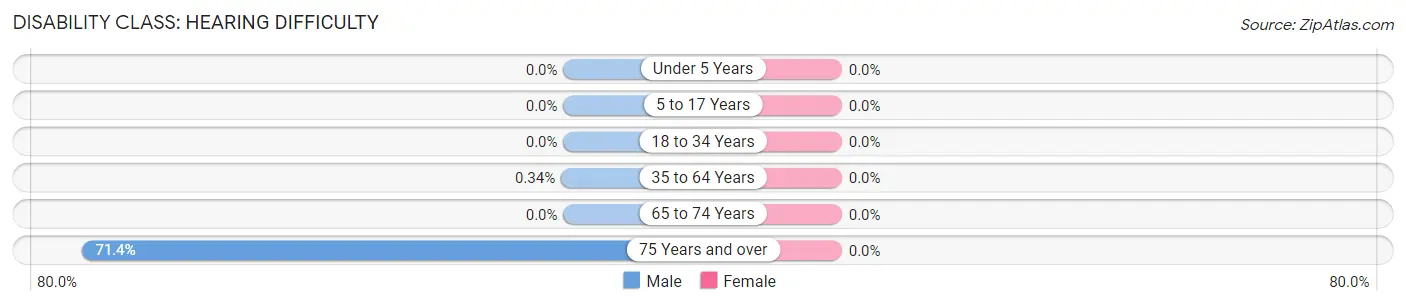
| Age Bracket | Male | Female |
| Under 5 Years | 0 (0.0%) | 0 (0.0%) |
| 5 to 17 Years | 0 (0.0%) | 0 (0.0%) |
| 18 to 34 Years | 0 (0.0%) | 0 (0.0%) |
| 35 to 64 Years | 1 (0.3%) | 0 (0.0%) |
| 65 to 74 Years | 0 (0.0%) | 0 (0.0%) |
| 75 Years and over | 35 (71.4%) | 0 (0.0%) |
Disability Class: Vision Difficulty
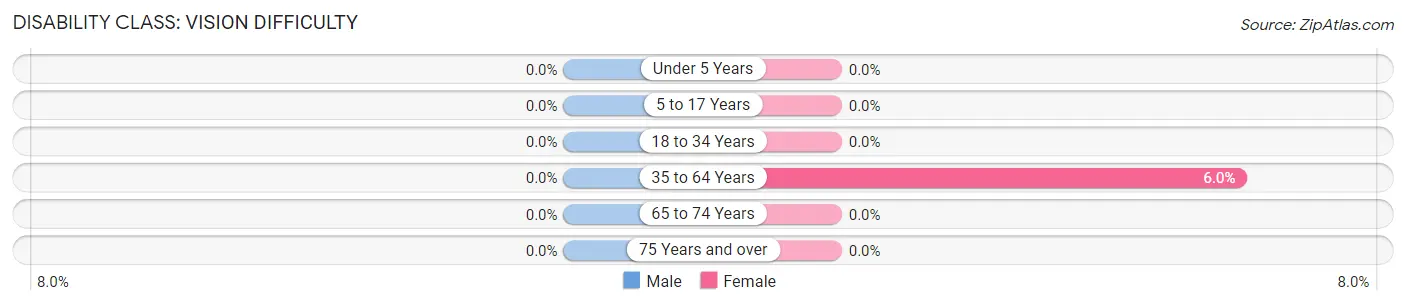
| Age Bracket | Male | Female |
| Under 5 Years | 0 (0.0%) | 0 (0.0%) |
| 5 to 17 Years | 0 (0.0%) | 0 (0.0%) |
| 18 to 34 Years | 0 (0.0%) | 0 (0.0%) |
| 35 to 64 Years | 0 (0.0%) | 21 (6.0%) |
| 65 to 74 Years | 0 (0.0%) | 0 (0.0%) |
| 75 Years and over | 0 (0.0%) | 0 (0.0%) |
Disability Class: Cognitive Difficulty
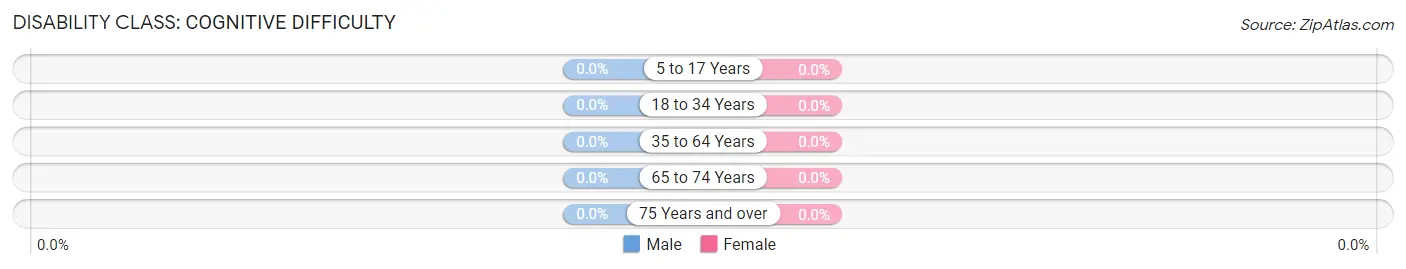
| Age Bracket | Male | Female |
| 5 to 17 Years | 0 (0.0%) | 0 (0.0%) |
| 18 to 34 Years | 0 (0.0%) | 0 (0.0%) |
| 35 to 64 Years | 0 (0.0%) | 0 (0.0%) |
| 65 to 74 Years | 0 (0.0%) | 0 (0.0%) |
| 75 Years and over | 0 (0.0%) | 0 (0.0%) |
Disability Class: Ambulatory Difficulty
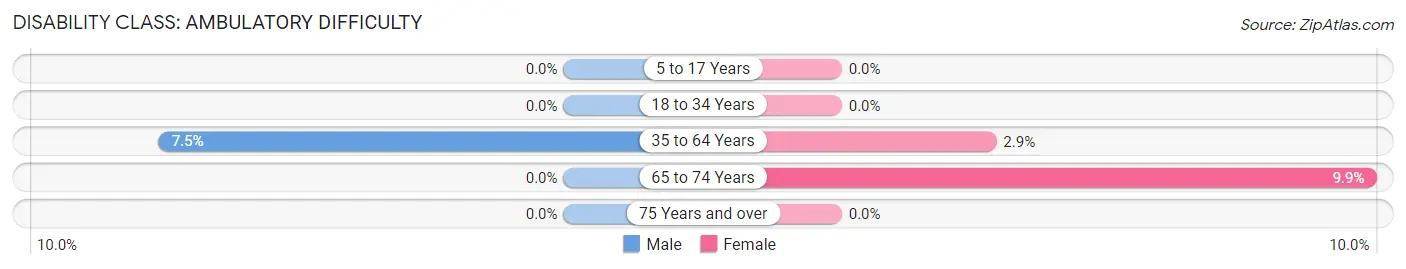
| Age Bracket | Male | Female |
| 5 to 17 Years | 0 (0.0%) | 0 (0.0%) |
| 18 to 34 Years | 0 (0.0%) | 0 (0.0%) |
| 35 to 64 Years | 22 (7.5%) | 10 (2.9%) |
| 65 to 74 Years | 0 (0.0%) | 13 (9.9%) |
| 75 Years and over | 0 (0.0%) | 0 (0.0%) |
Disability Class: Self-Care Difficulty
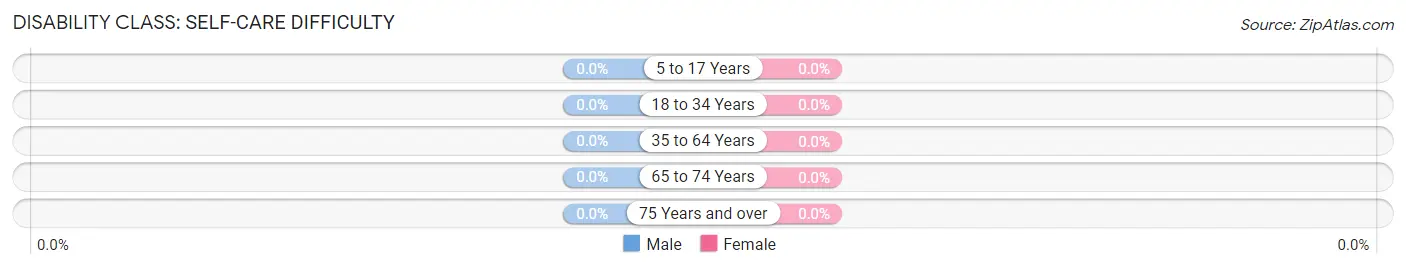
| Age Bracket | Male | Female |
| 5 to 17 Years | 0 (0.0%) | 0 (0.0%) |
| 18 to 34 Years | 0 (0.0%) | 0 (0.0%) |
| 35 to 64 Years | 0 (0.0%) | 0 (0.0%) |
| 65 to 74 Years | 0 (0.0%) | 0 (0.0%) |
| 75 Years and over | 0 (0.0%) | 0 (0.0%) |
Technology Access in LaBarque Creek
Computing Device Access in LaBarque Creek
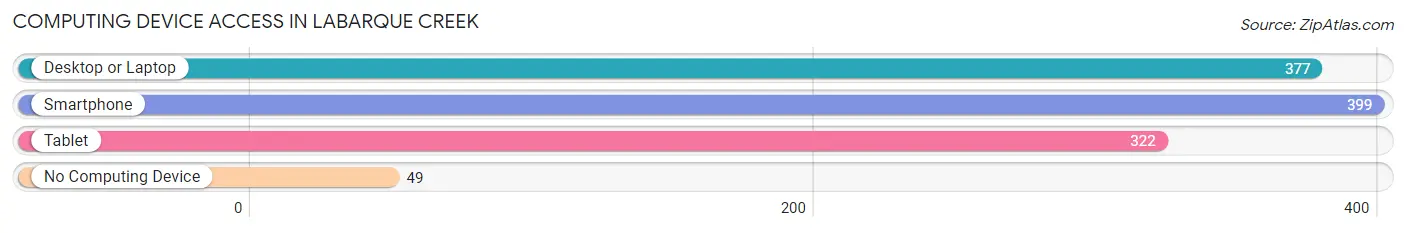
| Device Type | # Households | % Households |
| Desktop or Laptop | 377 | 80.7% |
| Smartphone | 399 | 85.4% |
| Tablet | 322 | 69.0% |
| No Computing Device | 49 | 10.5% |
| Total | 467 | 100.0% |
Internet Access in LaBarque Creek
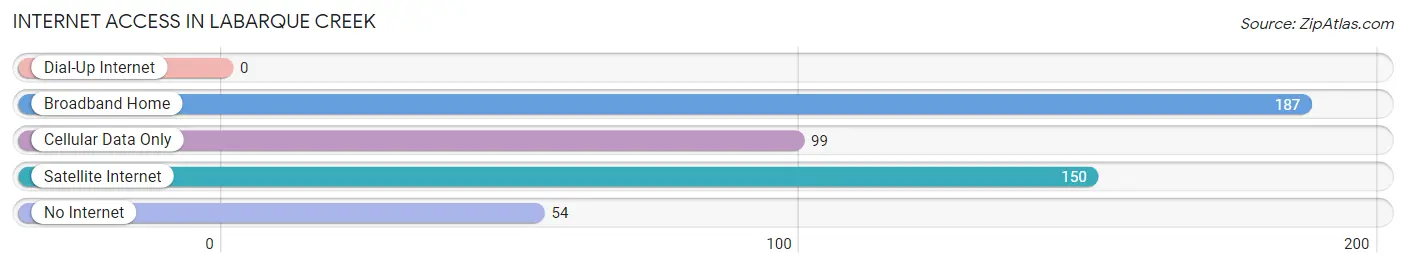
| Internet Type | # Households | % Households |
| Dial-Up Internet | 0 | 0.0% |
| Broadband Home | 187 | 40.0% |
| Cellular Data Only | 99 | 21.2% |
| Satellite Internet | 150 | 32.1% |
| No Internet | 54 | 11.6% |
| Total | 467 | 100.0% |
LaBarque Creek Summary
Labarque Creek is a small creek located in St. Charles County, Missouri. It is a tributary of the Missouri River and is approximately 8 miles long. The creek is named after the Labarque family, who were early settlers in the area.
Geography
Labarque Creek is located in St. Charles County, Missouri, and is a tributary of the Missouri River. The creek is 8 miles long and is located in the northern part of the county. The creek is fed by several small streams and springs, and is surrounded by rolling hills and wooded areas. The creek is a popular spot for fishing, canoeing, and kayaking.
History
Labarque Creek was named after the Labarque family, who were early settlers in the area. The Labarque family was originally from France and settled in the area in the early 1800s. The creek was used as a source of water for the family’s farm and for other local farms. In the late 1800s, the creek was used to power a grist mill and a sawmill.
In the early 1900s, the creek was used to power a hydroelectric plant. The plant was built by the St. Charles Electric Company and provided electricity to the surrounding area. The plant was in operation until the 1950s, when it was replaced by a larger power plant.
Economy
Labarque Creek is located in a rural area and is not a major economic center. The creek is surrounded by farms and small towns, and the local economy is largely based on agriculture. The creek is also a popular spot for fishing, canoeing, and kayaking, and there are several businesses in the area that cater to these activities.
Demographics
Labarque Creek is located in St. Charles County, Missouri, which has a population of approximately 360,000 people. The population of the area surrounding the creek is largely white, with a small percentage of African Americans and Hispanics. The median household income in the area is approximately $60,000, and the median home value is approximately $200,000.
Conclusion
Labarque Creek is a small creek located in St. Charles County, Missouri. It is a tributary of the Missouri River and is approximately 8 miles long. The creek is named after the Labarque family, who were early settlers in the area. The creek is surrounded by rolling hills and wooded areas, and is a popular spot for fishing, canoeing, and kayaking. The local economy is largely based on agriculture, and the population of the area is largely white.
Common Questions
What is the Total Population of LaBarque Creek?
Total Population of LaBarque Creek is 1,201.
What is the Total Male Population of LaBarque Creek?
Total Male Population of LaBarque Creek is 476.
What is the Total Female Population of LaBarque Creek?
Total Female Population of LaBarque Creek is 725.
What is the Ratio of Males per 100 Females in LaBarque Creek?
There are 65.66 Males per 100 Females in LaBarque Creek.
What is the Ratio of Females per 100 Males in LaBarque Creek?
There are 152.31 Females per 100 Males in LaBarque Creek.
What is the Median Population Age in LaBarque Creek?
Median Population Age in LaBarque Creek is 53.0 Years.
What is the Average Family Size in LaBarque Creek
Average Family Size in LaBarque Creek is 2.9 People.
What is the Average Household Size in LaBarque Creek
Average Household Size in LaBarque Creek is 2.6 People.
What is Per Capita Income in LaBarque Creek?
Per Capita income in LaBarque Creek is $64,578.
What is the Median Family Income in LaBarque Creek?
Median Family Income in LaBarque Creek is $174,583.
What is the Median Household income in LaBarque Creek?
Median Household Income in LaBarque Creek is $161,250.
What is Income or Wage Gap in LaBarque Creek?
Income or Wage Gap in LaBarque Creek is 73.8%.
Women in LaBarque Creek earn 26.2 cents for every dollar earned by a man.
What is Inequality or Gini Index in LaBarque Creek?
Inequality or Gini Index in LaBarque Creek is 0.40.
How Large is the Labor Force in LaBarque Creek?
There are 747 People in the Labor Forcein in LaBarque Creek.
What is the Percentage of People in the Labor Force in LaBarque Creek?
68.5% of People are in the Labor Force in LaBarque Creek.
What is the Unemployment Rate in LaBarque Creek?
Unemployment Rate in LaBarque Creek is 2.5%.