Hanley Hills, MO
Hanley Hills Map
Hanley Hills Overview
1,612
TOTAL POPULATION
784
MALE POPULATION
828
FEMALE POPULATION
94.69
MALES / 100 FEMALES
105.61
FEMALES / 100 MALES
37.6
MEDIAN AGE
3.1
AVG FAMILY SIZE
2.3
AVG HOUSEHOLD SIZE
$26,807
PER CAPITA INCOME
$56,563
AVG FAMILY INCOME
$47,083
AVG HOUSEHOLD INCOME
3.1%
WAGE / INCOME GAP [ % ]
96.9¢/ $1
WAGE / INCOME GAP [ $ ]
0.40
INEQUALITY / GINI INDEX
1,005
LABOR FORCE [ PEOPLE ]
67.6%
PERCENT IN LABOR FORCE
6.3%
UNEMPLOYMENT RATE
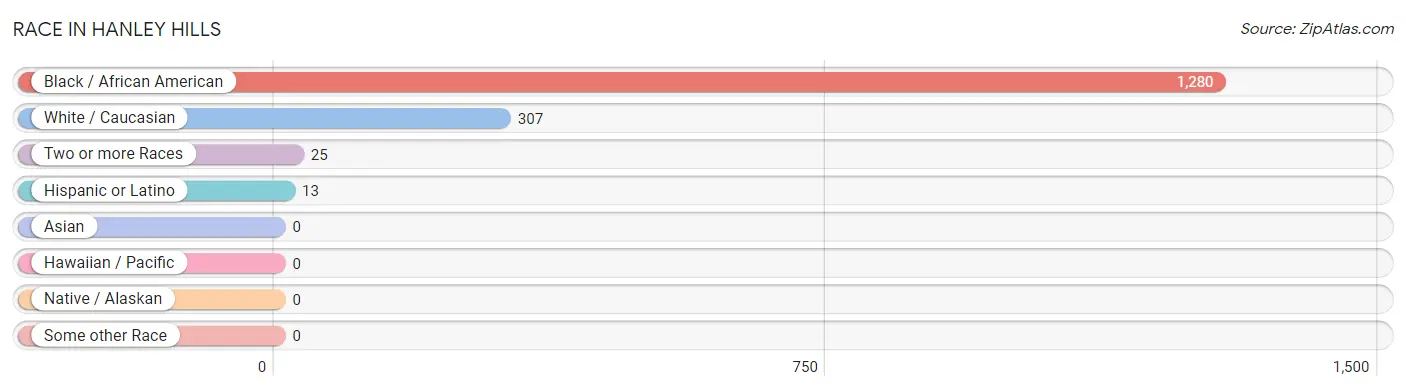
Race in Hanley Hills
The most populous races in Hanley Hills are Black / African American (1,280 | 79.4%), White / Caucasian (307 | 19.0%), and Two or more Races (25 | 1.5%).
| Race | # Population | % Population |
| Asian | 0 | 0.0% |
| Black / African American | 1,280 | 79.4% |
| Hawaiian / Pacific | 0 | 0.0% |
| Hispanic or Latino | 13 | 0.8% |
| Native / Alaskan | 0 | 0.0% |
| White / Caucasian | 307 | 19.0% |
| Two or more Races | 25 | 1.5% |
| Some other Race | 0 | 0.0% |
| Total | 1,612 | 100.0% |
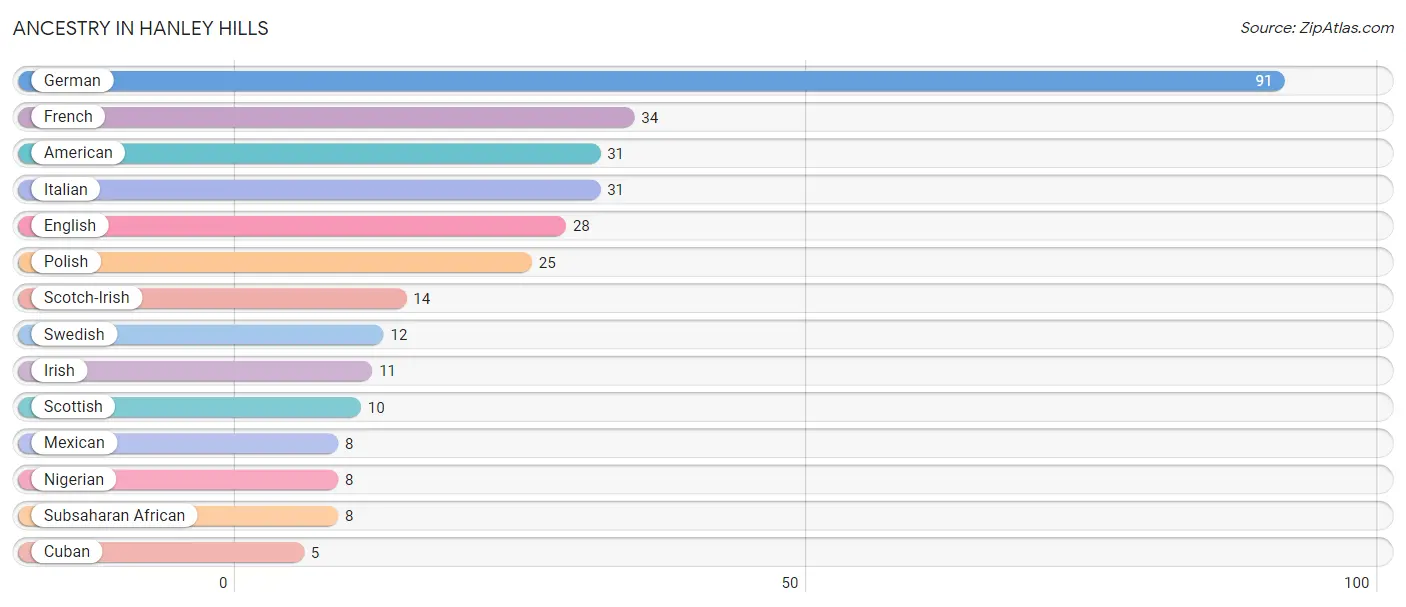
Ancestry in Hanley Hills
The most populous ancestries reported in Hanley Hills are German (91 | 5.7%), French (34 | 2.1%), American (31 | 1.9%), Italian (31 | 1.9%), and English (28 | 1.7%), together accounting for 13.3% of all Hanley Hills residents.
| Ancestry | # Population | % Population |
| American | 31 | 1.9% |
| Cuban | 5 | 0.3% |
| English | 28 | 1.7% |
| French | 34 | 2.1% |
| German | 91 | 5.7% |
| Irish | 11 | 0.7% |
| Italian | 31 | 1.9% |
| Mexican | 8 | 0.5% |
| Nigerian | 8 | 0.5% |
| Polish | 25 | 1.5% |
| Scotch-Irish | 14 | 0.9% |
| Scottish | 10 | 0.6% |
| Subsaharan African | 8 | 0.5% |
| Swedish | 12 | 0.7% | View All 14 Rows |
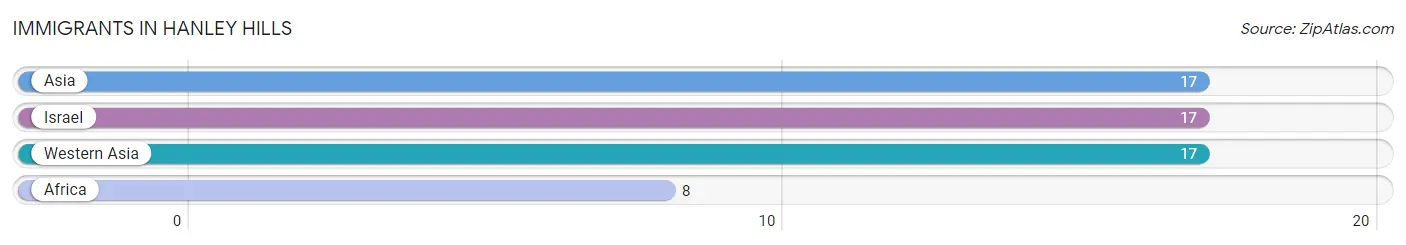
Immigrants in Hanley Hills
The most numerous immigrant groups reported in Hanley Hills came from Asia (17 | 1.1%), Israel (17 | 1.1%), Western Asia (17 | 1.1%), and Africa (8 | 0.5%), together accounting for 3.6% of all Hanley Hills residents.
| Immigration Origin | # Population | % Population |
| Africa | 8 | 0.5% |
| Asia | 17 | 1.1% |
| Israel | 17 | 1.1% |
| Western Asia | 17 | 1.1% | View All 4 Rows |
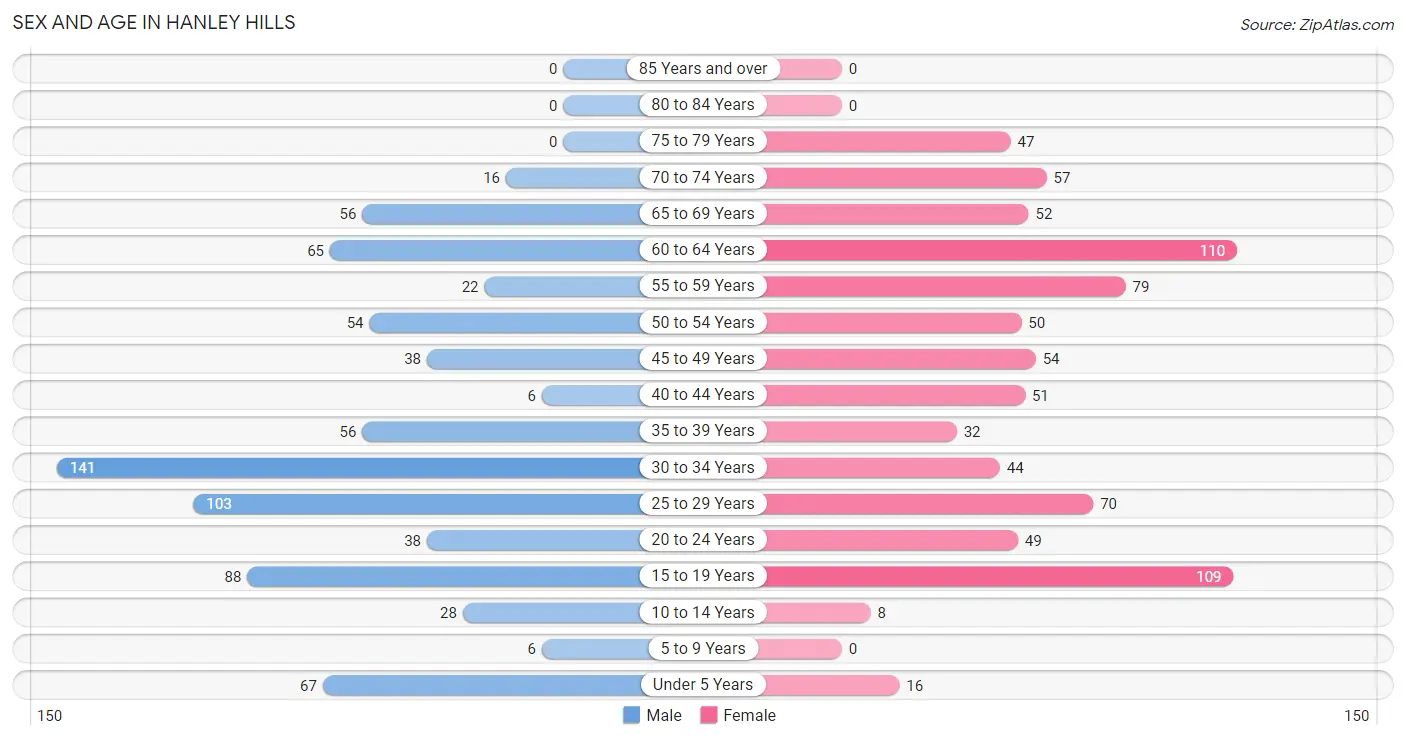
Sex and Age in Hanley Hills
Sex and Age in Hanley Hills
The most populous age groups in Hanley Hills are 30 to 34 Years (141 | 18.0%) for men and 60 to 64 Years (110 | 13.3%) for women.
| Age Bracket | Male | Female |
| Under 5 Years | 67 (8.6%) | 16 (1.9%) |
| 5 to 9 Years | 6 (0.8%) | 0 (0.0%) |
| 10 to 14 Years | 28 (3.6%) | 8 (1.0%) |
| 15 to 19 Years | 88 (11.2%) | 109 (13.2%) |
| 20 to 24 Years | 38 (4.9%) | 49 (5.9%) |
| 25 to 29 Years | 103 (13.1%) | 70 (8.5%) |
| 30 to 34 Years | 141 (18.0%) | 44 (5.3%) |
| 35 to 39 Years | 56 (7.1%) | 32 (3.9%) |
| 40 to 44 Years | 6 (0.8%) | 51 (6.2%) |
| 45 to 49 Years | 38 (4.9%) | 54 (6.5%) |
| 50 to 54 Years | 54 (6.9%) | 50 (6.0%) |
| 55 to 59 Years | 22 (2.8%) | 79 (9.5%) |
| 60 to 64 Years | 65 (8.3%) | 110 (13.3%) |
| 65 to 69 Years | 56 (7.1%) | 52 (6.3%) |
| 70 to 74 Years | 16 (2.0%) | 57 (6.9%) |
| 75 to 79 Years | 0 (0.0%) | 47 (5.7%) |
| 80 to 84 Years | 0 (0.0%) | 0 (0.0%) |
| 85 Years and over | 0 (0.0%) | 0 (0.0%) |
| Total | 784 (100.0%) | 828 (100.0%) |
Families and Households in Hanley Hills
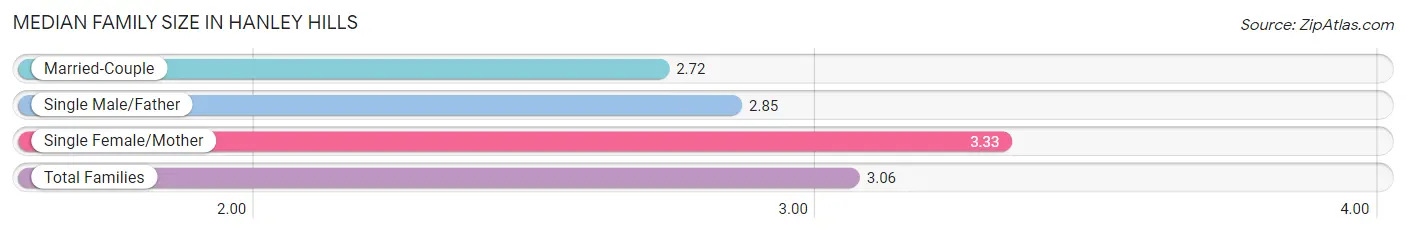
Median Family Size in Hanley Hills
The median family size in Hanley Hills is 3.06 persons per family, with single female/mother families (210 | 54.5%) accounting for the largest median family size of 3.33 persons per family. On the other hand, married-couple families (136 | 35.3%) represent the smallest median family size with 2.72 persons per family.
| Family Type | # Families | Family Size |
| Married-Couple | 136 (35.3%) | 2.72 |
| Single Male/Father | 39 (10.1%) | 2.85 |
| Single Female/Mother | 210 (54.5%) | 3.33 |
| Total Families | 385 (100.0%) | 3.06 |
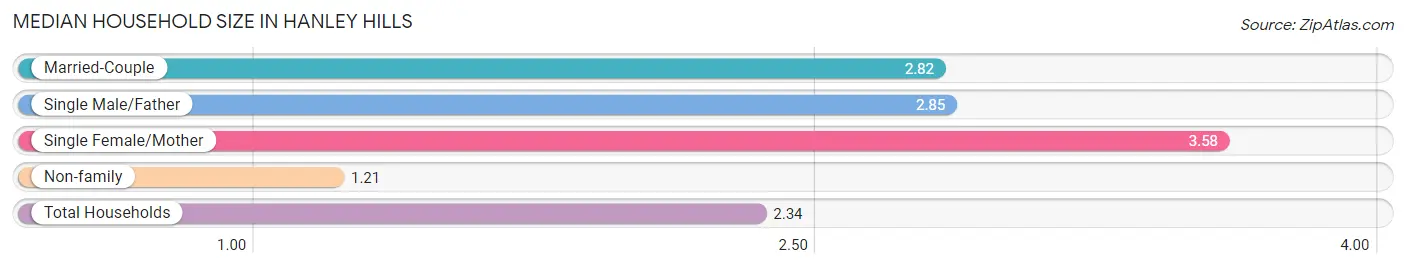
Median Household Size in Hanley Hills
The median household size in Hanley Hills is 2.34 persons per household, with single female/mother households (210 | 30.5%) accounting for the largest median household size of 3.58 persons per household. non-family households (303 | 44.0%) represent the smallest median household size with 1.21 persons per household.
| Household Type | # Households | Household Size |
| Married-Couple | 136 (19.8%) | 2.82 |
| Single Male/Father | 39 (5.7%) | 2.85 |
| Single Female/Mother | 210 (30.5%) | 3.58 |
| Non-family | 303 (44.0%) | 1.21 |
| Total Households | 688 (100.0%) | 2.34 |
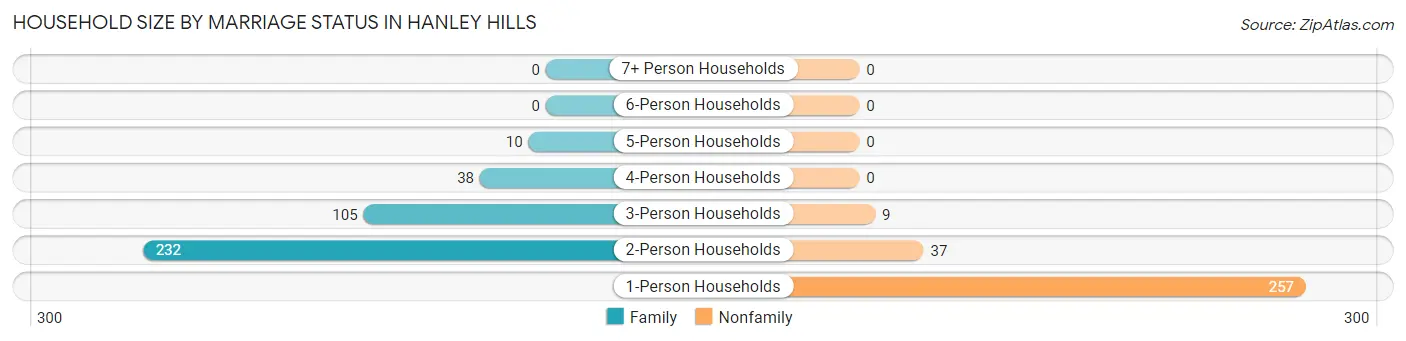
Household Size by Marriage Status in Hanley Hills
Out of a total of 688 households in Hanley Hills, 385 (56.0%) are family households, while 303 (44.0%) are nonfamily households. The most numerous type of family households are 2-person households, comprising 232, and the most common type of nonfamily households are 1-person households, comprising 257.
| Household Size | Family Households | Nonfamily Households |
| 1-Person Households | - | 257 (37.3%) |
| 2-Person Households | 232 (33.7%) | 37 (5.4%) |
| 3-Person Households | 105 (15.3%) | 9 (1.3%) |
| 4-Person Households | 38 (5.5%) | 0 (0.0%) |
| 5-Person Households | 10 (1.5%) | 0 (0.0%) |
| 6-Person Households | 0 (0.0%) | 0 (0.0%) |
| 7+ Person Households | 0 (0.0%) | 0 (0.0%) |
| Total | 385 (56.0%) | 303 (44.0%) |
Female Fertility in Hanley Hills
Fertility by Age in Hanley Hills
Average fertility rate in Hanley Hills is 33.0 births per 1,000 women. Women in the age bracket of 35 to 50 years have the highest fertility rate with 93.0 births per 1,000 women. Women in the age bracket of 35 to 50 years acount for 100.0% of all women with births.
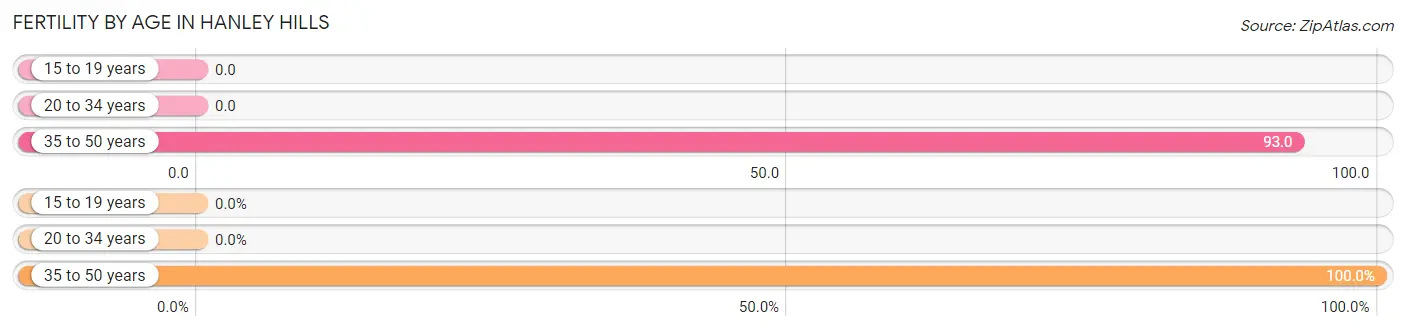
| Age Bracket | Women with Births | Births / 1,000 Women |
| 15 to 19 years | 0 (0.0%) | 0.0 |
| 20 to 34 years | 0 (0.0%) | 0.0 |
| 35 to 50 years | 14 (100.0%) | 93.0 |
| Total | 14 (100.0%) | 33.0 |
Fertility by Age by Marriage Status in Hanley Hills
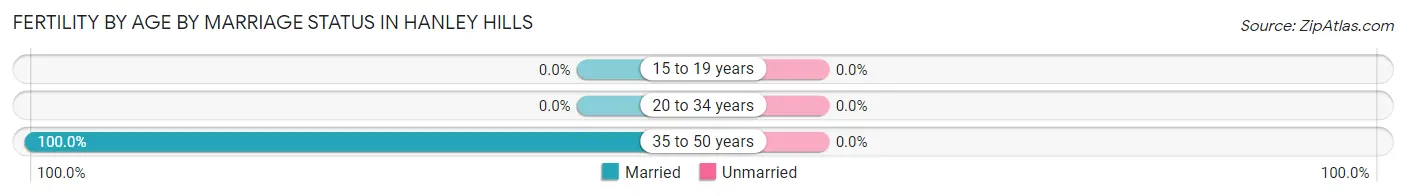
| Age Bracket | Married | Unmarried |
| 15 to 19 years | 0 (0.0%) | 0 (0.0%) |
| 20 to 34 years | 0 (0.0%) | 0 (0.0%) |
| 35 to 50 years | 14 (100.0%) | 0 (0.0%) |
| Total | 14 (100.0%) | 0 (0.0%) |
Fertility by Education in Hanley Hills
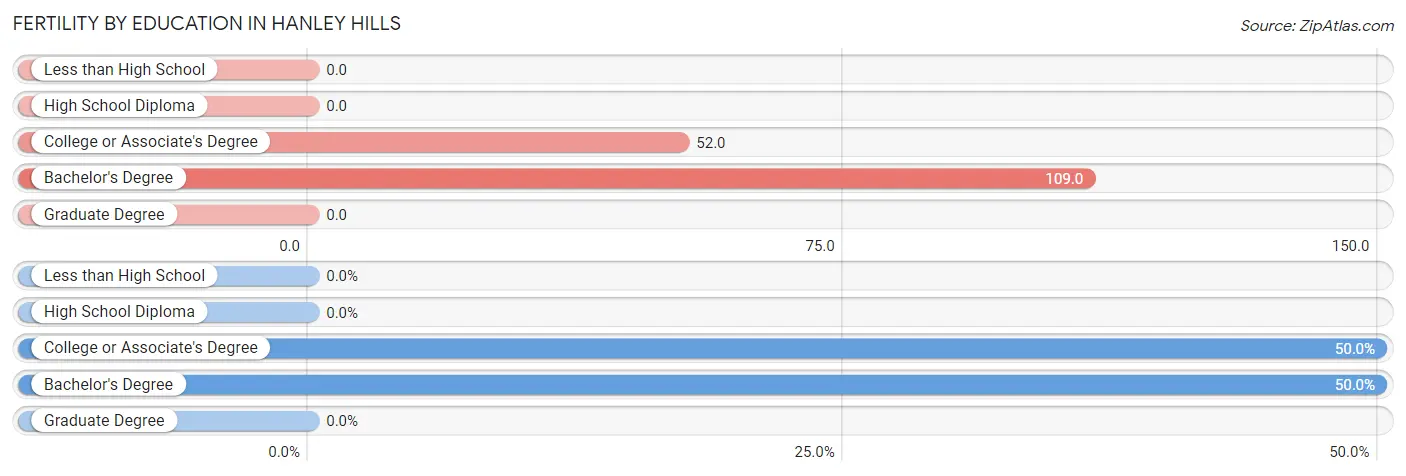
| Educational Attainment | Women with Births | Births / 1,000 Women |
| Less than High School | 0 (0.0%) | 0.0 |
| High School Diploma | 0 (0.0%) | 0.0 |
| College or Associate's Degree | 7 (50.0%) | 52.0 |
| Bachelor's Degree | 7 (50.0%) | 109.0 |
| Graduate Degree | 0 (0.0%) | 0.0 |
| Total | 14 (100.0%) | 33.0 |
Fertility by Education by Marriage Status in Hanley Hills
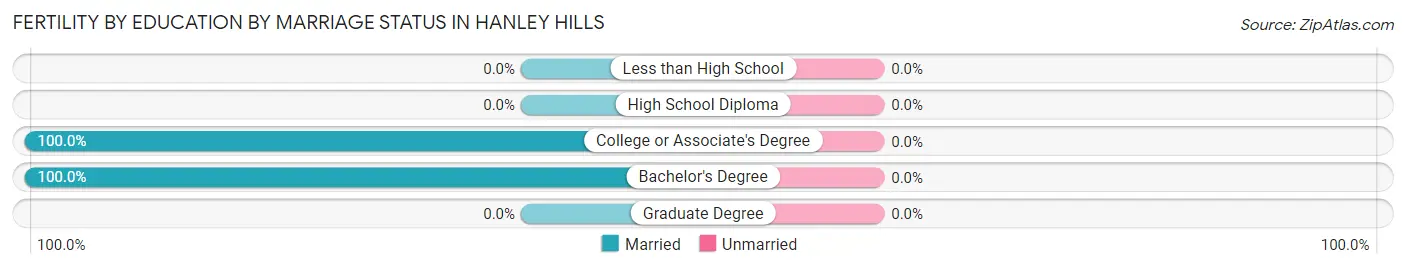
| Educational Attainment | Married | Unmarried |
| Less than High School | 0 (0.0%) | 0 (0.0%) |
| High School Diploma | 0 (0.0%) | 0 (0.0%) |
| College or Associate's Degree | 7 (100.0%) | 0 (0.0%) |
| Bachelor's Degree | 7 (100.0%) | 0 (0.0%) |
| Graduate Degree | 0 (0.0%) | 0 (0.0%) |
| Total | 14 (100.0%) | 0 (0.0%) |
Income in Hanley Hills
Income Overview in Hanley Hills
Per Capita Income in Hanley Hills is $26,807, while median incomes of families and households are $56,563 and $47,083 respectively.
| Characteristic | Number | Measure |
| Per Capita Income | 1,612 | $26,807 |
| Median Family Income | 385 | $56,563 |
| Mean Family Income | 385 | $73,557 |
| Median Household Income | 688 | $47,083 |
| Mean Household Income | 688 | $57,998 |
| Income Deficit | 385 | $0 |
| Wage / Income Gap (%) | 1,612 | 3.09% |
| Wage / Income Gap ($) | 1,612 | 96.91¢ per $1 |
| Gini / Inequality Index | 1,612 | 0.40 |
Earnings by Sex in Hanley Hills
Average Earnings in Hanley Hills are $24,855, $25,380 for men and $24,595 for women, a difference of 3.1%.
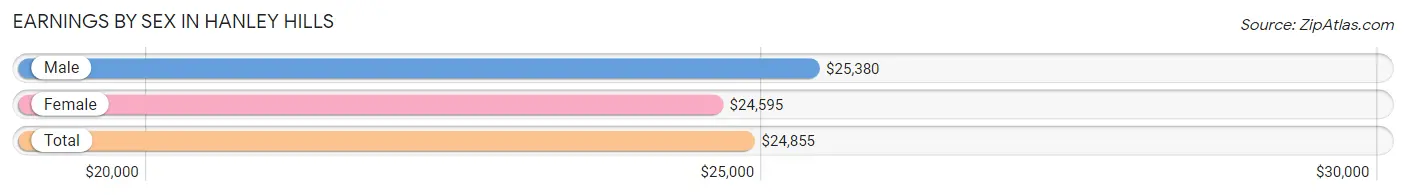
| Sex | Number | Average Earnings |
| Male | 499 (47.1%) | $25,380 |
| Female | 560 (52.9%) | $24,595 |
| Total | 1,059 (100.0%) | $24,855 |
Earnings by Sex by Income Bracket in Hanley Hills
The most common earnings brackets in Hanley Hills are $7,500 to $9,999 for men (92 | 18.4%) and $35,000 to $39,999 for women (123 | 22.0%).
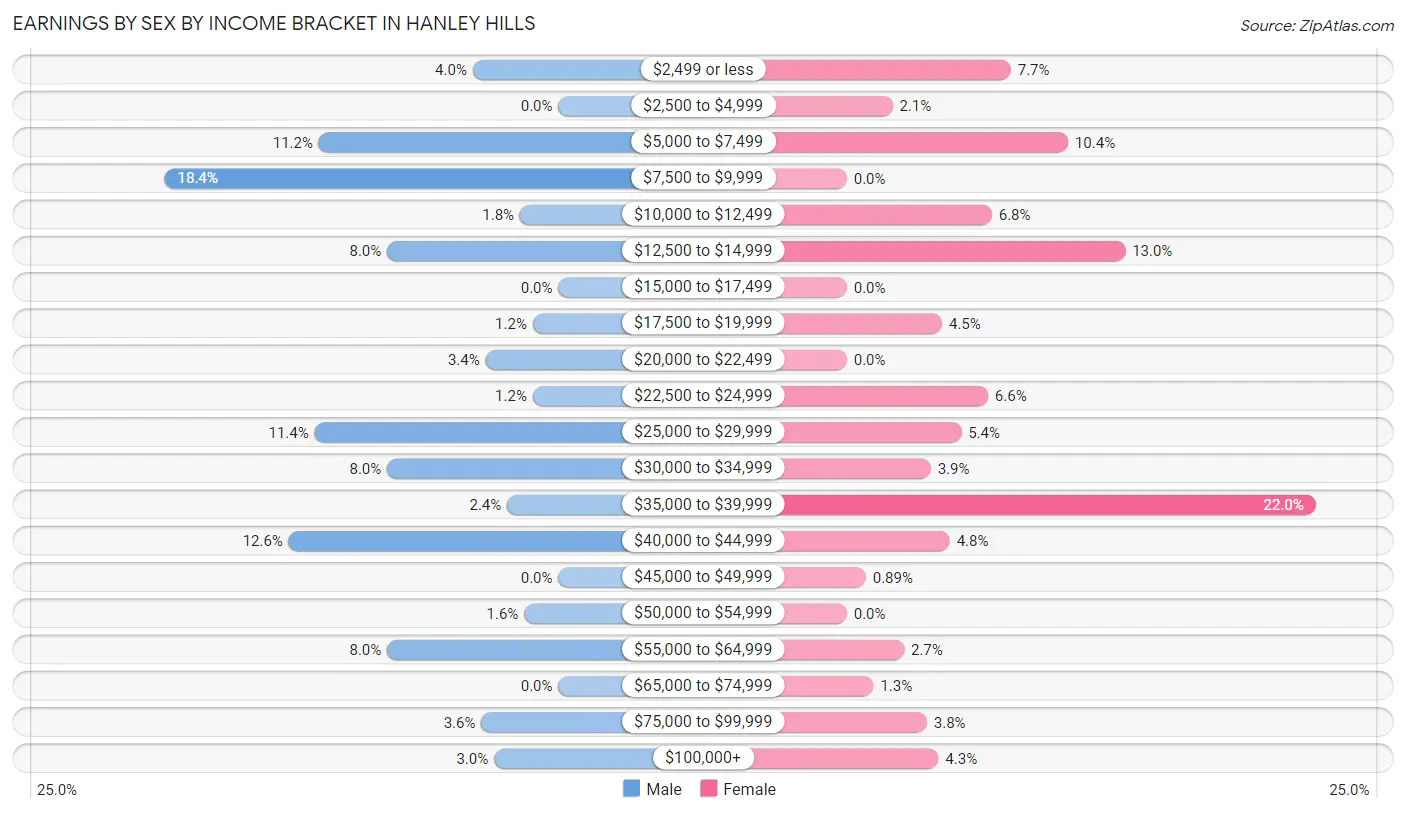
| Income | Male | Female |
| $2,499 or less | 20 (4.0%) | 43 (7.7%) |
| $2,500 to $4,999 | 0 (0.0%) | 12 (2.1%) |
| $5,000 to $7,499 | 56 (11.2%) | 58 (10.4%) |
| $7,500 to $9,999 | 92 (18.4%) | 0 (0.0%) |
| $10,000 to $12,499 | 9 (1.8%) | 38 (6.8%) |
| $12,500 to $14,999 | 40 (8.0%) | 73 (13.0%) |
| $15,000 to $17,499 | 0 (0.0%) | 0 (0.0%) |
| $17,500 to $19,999 | 6 (1.2%) | 25 (4.5%) |
| $20,000 to $22,499 | 17 (3.4%) | 0 (0.0%) |
| $22,500 to $24,999 | 6 (1.2%) | 37 (6.6%) |
| $25,000 to $29,999 | 57 (11.4%) | 30 (5.4%) |
| $30,000 to $34,999 | 40 (8.0%) | 22 (3.9%) |
| $35,000 to $39,999 | 12 (2.4%) | 123 (22.0%) |
| $40,000 to $44,999 | 63 (12.6%) | 27 (4.8%) |
| $45,000 to $49,999 | 0 (0.0%) | 5 (0.9%) |
| $50,000 to $54,999 | 8 (1.6%) | 0 (0.0%) |
| $55,000 to $64,999 | 40 (8.0%) | 15 (2.7%) |
| $65,000 to $74,999 | 0 (0.0%) | 7 (1.3%) |
| $75,000 to $99,999 | 18 (3.6%) | 21 (3.7%) |
| $100,000+ | 15 (3.0%) | 24 (4.3%) |
| Total | 499 (100.0%) | 560 (100.0%) |
Earnings by Sex by Educational Attainment in Hanley Hills
Average earnings in Hanley Hills are $29,559 for men and $37,743 for women, a difference of 21.7%. Men with an educational attainment of bachelor's degree enjoy the highest average annual earnings of $98,542, while those with less than high school education earn the least with $20,795. Women with an educational attainment of college or associate's degree earn the most with the average annual earnings of $41,250, while those with less than high school education have the smallest earnings of $23,906.
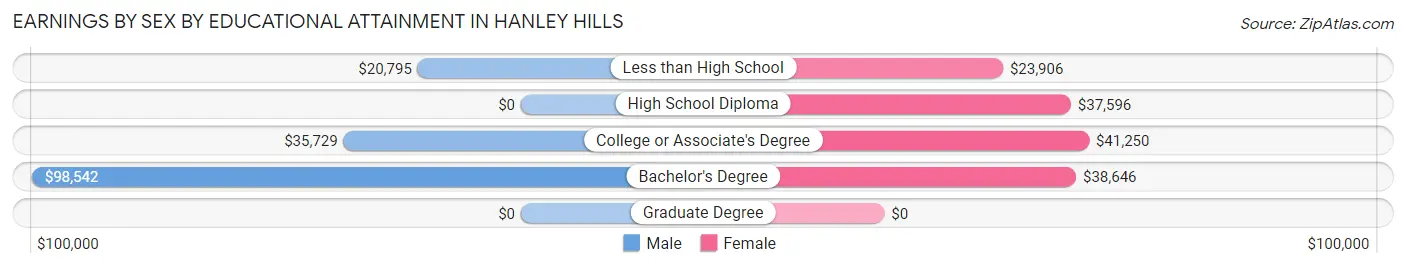
| Educational Attainment | Male Income | Female Income |
| Less than High School | $20,795 | $23,906 |
| High School Diploma | - | - |
| College or Associate's Degree | $35,729 | $41,250 |
| Bachelor's Degree | $98,542 | $38,646 |
| Graduate Degree | - | - |
| Total | $29,559 | $37,743 |
Family Income in Hanley Hills
Family Income Brackets in Hanley Hills
According to the Hanley Hills family income data, there are 98 families falling into the $35,000 to $49,999 income range, which is the most common income bracket and makes up 25.5% of all families. Conversely, the $10,000 to $14,999 income bracket is the least frequent group with only 7 families (1.8%) belonging to this category.
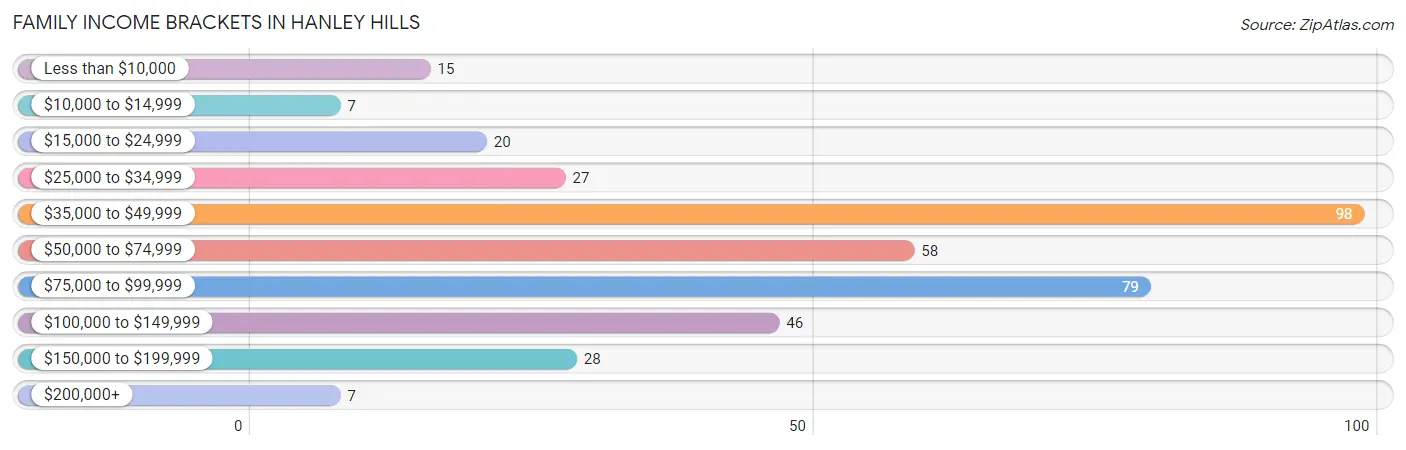
| Income Bracket | # Families | % Families |
| Less than $10,000 | 15 | 3.9% |
| $10,000 to $14,999 | 7 | 1.8% |
| $15,000 to $24,999 | 20 | 5.2% |
| $25,000 to $34,999 | 27 | 7.0% |
| $35,000 to $49,999 | 98 | 25.5% |
| $50,000 to $74,999 | 58 | 15.1% |
| $75,000 to $99,999 | 79 | 20.5% |
| $100,000 to $149,999 | 46 | 11.9% |
| $150,000 to $199,999 | 28 | 7.3% |
| $200,000+ | 7 | 1.8% |
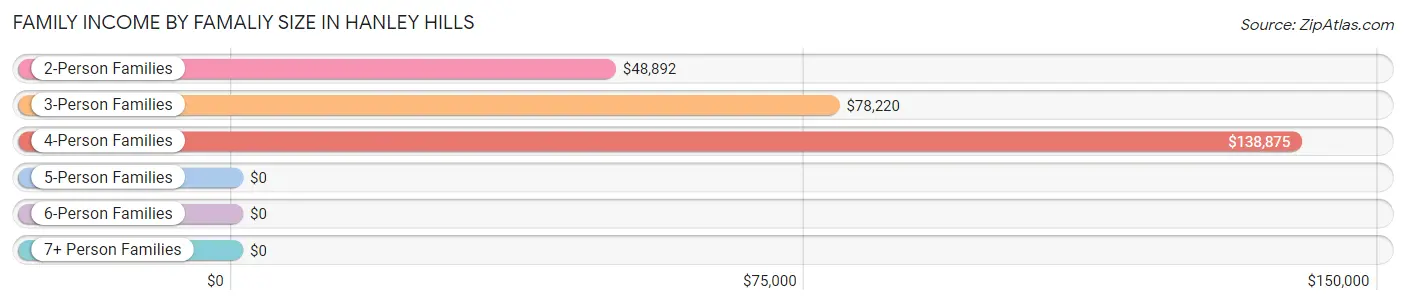
Family Income by Famaliy Size in Hanley Hills
4-person families (33 | 8.6%) account for the highest median family income in Hanley Hills with $138,875 per family, while 4-person families (33 | 8.6%) have the highest median income of $34,719 per family member.
| Income Bracket | # Families | Median Income |
| 2-Person Families | 251 (65.2%) | $48,892 |
| 3-Person Families | 101 (26.2%) | $78,220 |
| 4-Person Families | 33 (8.6%) | $138,875 |
| 5-Person Families | 0 (0.0%) | $0 |
| 6-Person Families | 0 (0.0%) | $0 |
| 7+ Person Families | 0 (0.0%) | $0 |
| Total | 385 (100.0%) | $56,563 |
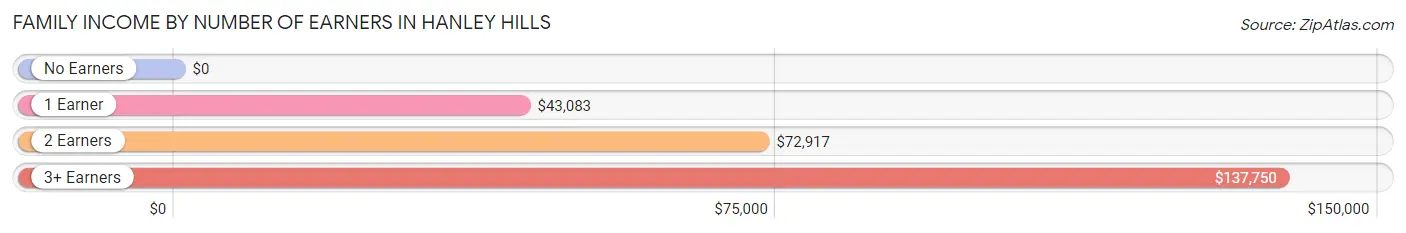
Family Income by Number of Earners in Hanley Hills
| Number of Earners | # Families | Median Income |
| No Earners | 38 (9.9%) | $0 |
| 1 Earner | 125 (32.5%) | $43,083 |
| 2 Earners | 168 (43.6%) | $72,917 |
| 3+ Earners | 54 (14.0%) | $137,750 |
| Total | 385 (100.0%) | $56,563 |
Household Income in Hanley Hills
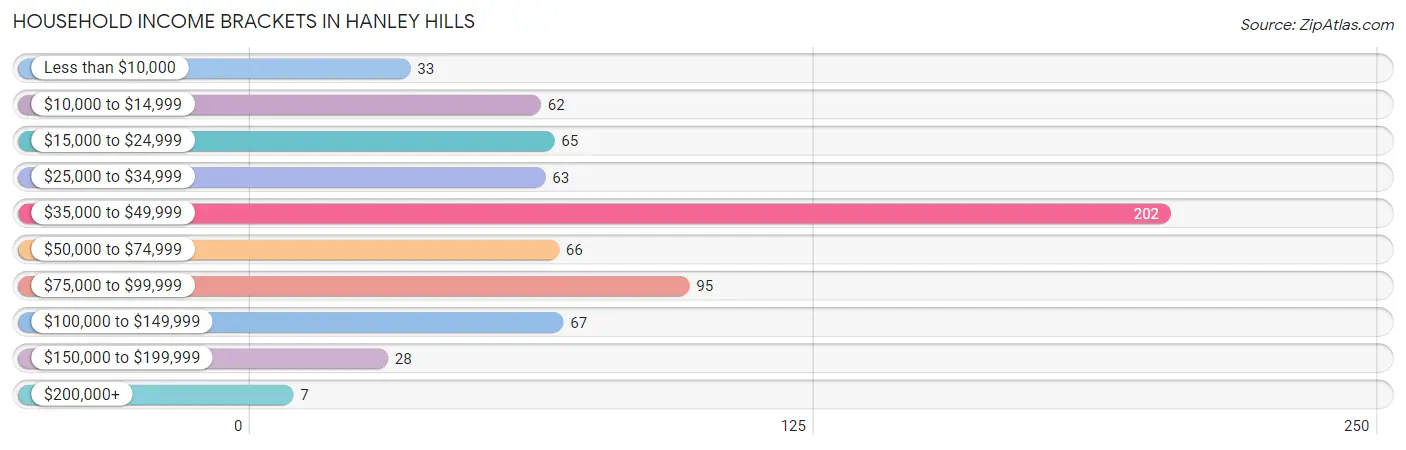
Household Income Brackets in Hanley Hills
With 202 households falling in the category, the $35,000 to $49,999 income range is the most frequent in Hanley Hills, accounting for 29.4% of all households. In contrast, only 7 households (1.0%) fall into the $200,000+ income bracket, making it the least populous group.
| Income Bracket | # Households | % Households |
| Less than $10,000 | 33 | 4.8% |
| $10,000 to $14,999 | 62 | 9.0% |
| $15,000 to $24,999 | 65 | 9.4% |
| $25,000 to $34,999 | 63 | 9.2% |
| $35,000 to $49,999 | 202 | 29.4% |
| $50,000 to $74,999 | 66 | 9.6% |
| $75,000 to $99,999 | 95 | 13.8% |
| $100,000 to $149,999 | 67 | 9.7% |
| $150,000 to $199,999 | 28 | 4.1% |
| $200,000+ | 7 | 1.0% |
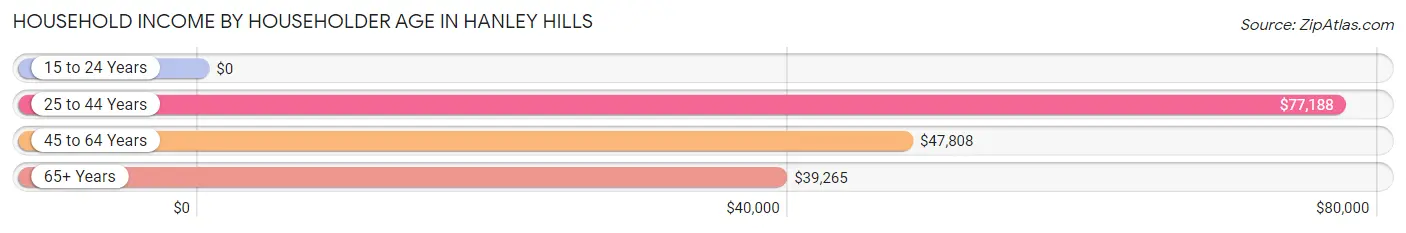
Household Income by Householder Age in Hanley Hills
The median household income in Hanley Hills is $47,083, with the highest median household income of $77,188 found in the 25 to 44 years age bracket for the primary householder. A total of 189 households (27.5%) fall into this category.
| Income Bracket | # Households | Median Income |
| 15 to 24 Years | 0 (0.0%) | $0 |
| 25 to 44 Years | 189 (27.5%) | $77,188 |
| 45 to 64 Years | 311 (45.2%) | $47,808 |
| 65+ Years | 188 (27.3%) | $39,265 |
| Total | 688 (100.0%) | $47,083 |
Poverty in Hanley Hills
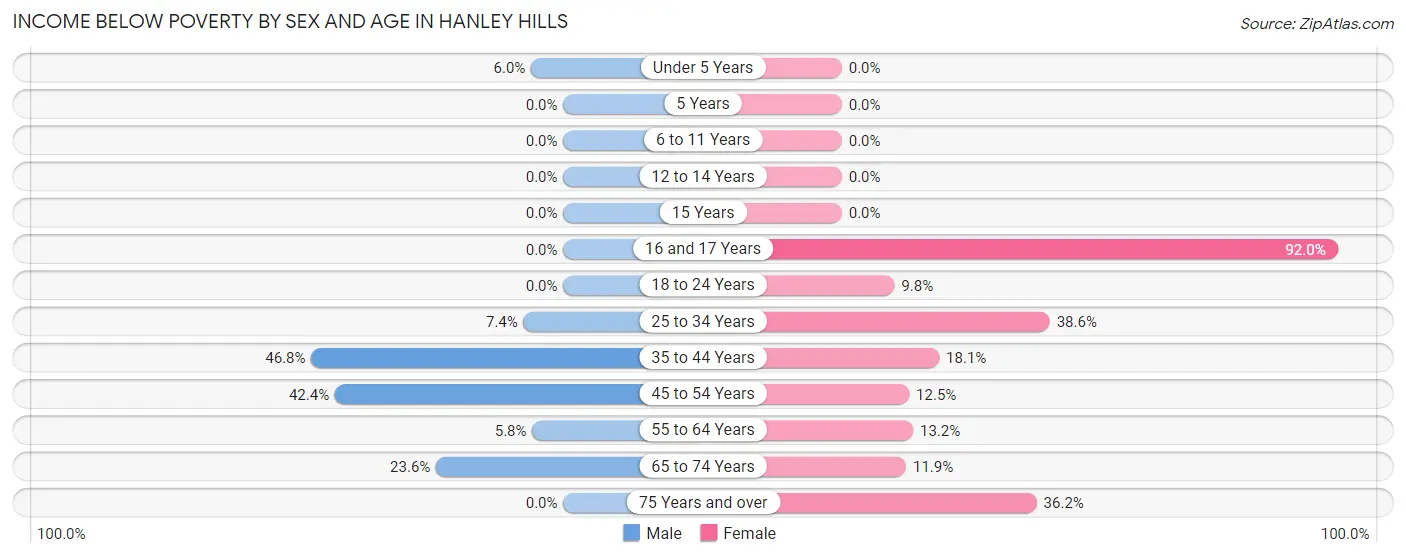
Income Below Poverty by Sex and Age in Hanley Hills
With 14.8% poverty level for males and 19.7% for females among the residents of Hanley Hills, 35 to 44 year old males and 16 and 17 year old females are the most vulnerable to poverty, with 29 males (46.8%) and 23 females (92.0%) in their respective age groups living below the poverty level.
| Age Bracket | Male | Female |
| Under 5 Years | 4 (6.0%) | 0 (0.0%) |
| 5 Years | 0 (0.0%) | 0 (0.0%) |
| 6 to 11 Years | 0 (0.0%) | 0 (0.0%) |
| 12 to 14 Years | 0 (0.0%) | 0 (0.0%) |
| 15 Years | 0 (0.0%) | 0 (0.0%) |
| 16 and 17 Years | 0 (0.0%) | 23 (92.0%) |
| 18 to 24 Years | 0 (0.0%) | 13 (9.8%) |
| 25 to 34 Years | 18 (7.4%) | 44 (38.6%) |
| 35 to 44 Years | 29 (46.8%) | 15 (18.1%) |
| 45 to 54 Years | 39 (42.4%) | 13 (12.5%) |
| 55 to 64 Years | 5 (5.8%) | 25 (13.2%) |
| 65 to 74 Years | 17 (23.6%) | 13 (11.9%) |
| 75 Years and over | 0 (0.0%) | 17 (36.2%) |
| Total | 112 (14.8%) | 163 (19.7%) |
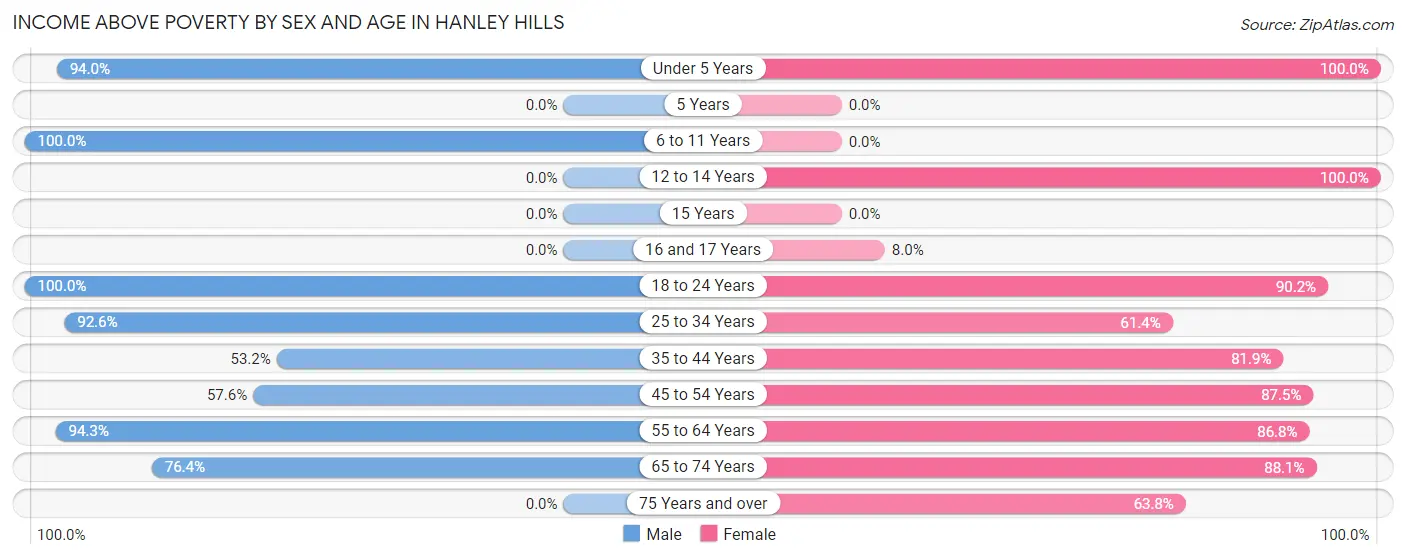
Income Above Poverty by Sex and Age in Hanley Hills
According to the poverty statistics in Hanley Hills, males aged 6 to 11 years and females aged under 5 years are the age groups that are most secure financially, with 100.0% of males and 100.0% of females in these age groups living above the poverty line.
| Age Bracket | Male | Female |
| Under 5 Years | 63 (94.0%) | 16 (100.0%) |
| 5 Years | 0 (0.0%) | 0 (0.0%) |
| 6 to 11 Years | 6 (100.0%) | 0 (0.0%) |
| 12 to 14 Years | 0 (0.0%) | 8 (100.0%) |
| 15 Years | 0 (0.0%) | 0 (0.0%) |
| 16 and 17 Years | 0 (0.0%) | 2 (8.0%) |
| 18 to 24 Years | 126 (100.0%) | 120 (90.2%) |
| 25 to 34 Years | 226 (92.6%) | 70 (61.4%) |
| 35 to 44 Years | 33 (53.2%) | 68 (81.9%) |
| 45 to 54 Years | 53 (57.6%) | 91 (87.5%) |
| 55 to 64 Years | 82 (94.3%) | 164 (86.8%) |
| 65 to 74 Years | 55 (76.4%) | 96 (88.1%) |
| 75 Years and over | 0 (0.0%) | 30 (63.8%) |
| Total | 644 (85.2%) | 665 (80.3%) |
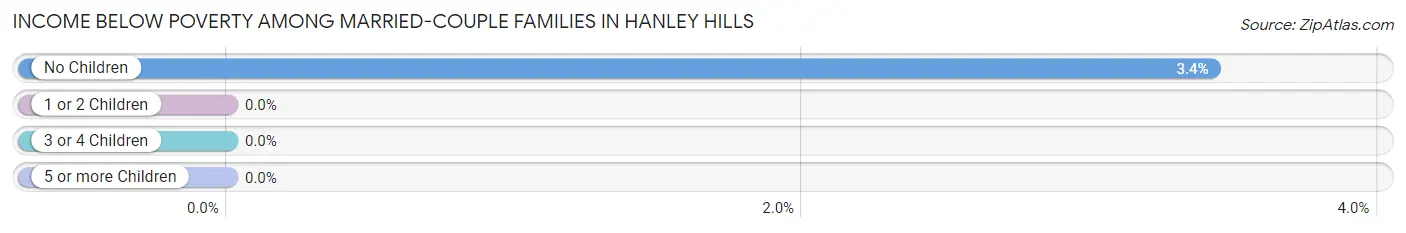
Income Below Poverty Among Married-Couple Families in Hanley Hills
The poverty statistics for married-couple families in Hanley Hills show that 2.9% or 4 of the total 136 families live below the poverty line. Families with no children have the highest poverty rate of 3.4%, comprising of 4 families. On the other hand, families with 1 or 2 children have the lowest poverty rate of 0.0%, which includes 0 families.
| Children | Above Poverty | Below Poverty |
| No Children | 113 (96.6%) | 4 (3.4%) |
| 1 or 2 Children | 19 (100.0%) | 0 (0.0%) |
| 3 or 4 Children | 0 (0.0%) | 0 (0.0%) |
| 5 or more Children | 0 (0.0%) | 0 (0.0%) |
| Total | 132 (97.1%) | 4 (2.9%) |
Income Below Poverty Among Single-Parent Households in Hanley Hills
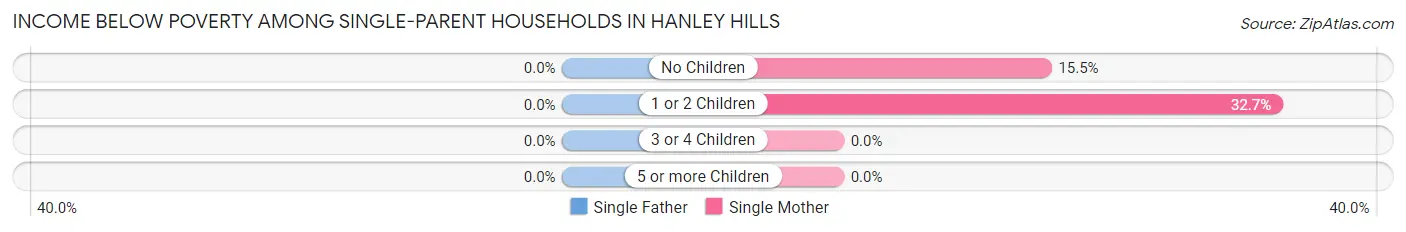
| Children | Single Father | Single Mother |
| No Children | 0 (0.0%) | 24 (15.5%) |
| 1 or 2 Children | 0 (0.0%) | 18 (32.7%) |
| 3 or 4 Children | 0 (0.0%) | 0 (0.0%) |
| 5 or more Children | 0 (0.0%) | 0 (0.0%) |
| Total | 0 (0.0%) | 42 (20.0%) |
Income Below Poverty Among Married-Couple vs Single-Parent Households in Hanley Hills
The poverty data for Hanley Hills shows that 4 of the married-couple family households (2.9%) and 42 of the single-parent households (16.9%) are living below the poverty level. Within the married-couple family households, those with no children have the highest poverty rate, with 4 households (3.4%) falling below the poverty line. Among the single-parent households, those with 1 or 2 children have the highest poverty rate, with 18 household (32.7%) living below poverty.
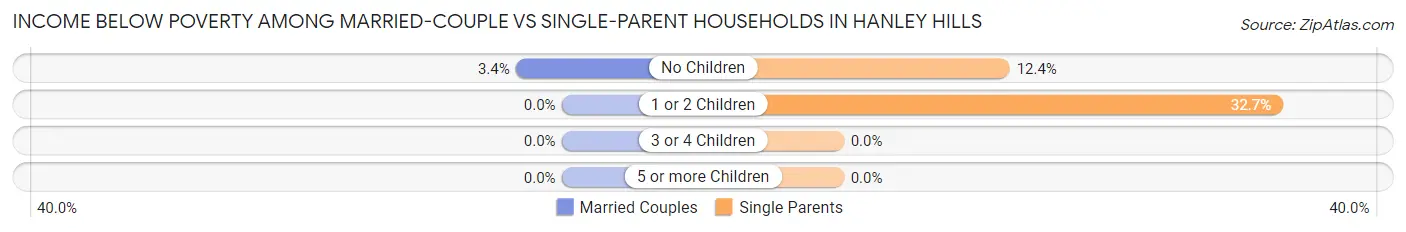
| Children | Married-Couple Families | Single-Parent Households |
| No Children | 4 (3.4%) | 24 (12.4%) |
| 1 or 2 Children | 0 (0.0%) | 18 (32.7%) |
| 3 or 4 Children | 0 (0.0%) | 0 (0.0%) |
| 5 or more Children | 0 (0.0%) | 0 (0.0%) |
| Total | 4 (2.9%) | 42 (16.9%) |
Employment Characteristics in Hanley Hills
Employment by Class of Employer in Hanley Hills
Among the 897 employed individuals in Hanley Hills, private company employees (737 | 82.2%), not-for-profit organizations (93 | 10.4%), and local government employees (50 | 5.6%) make up the most common classes of employment.
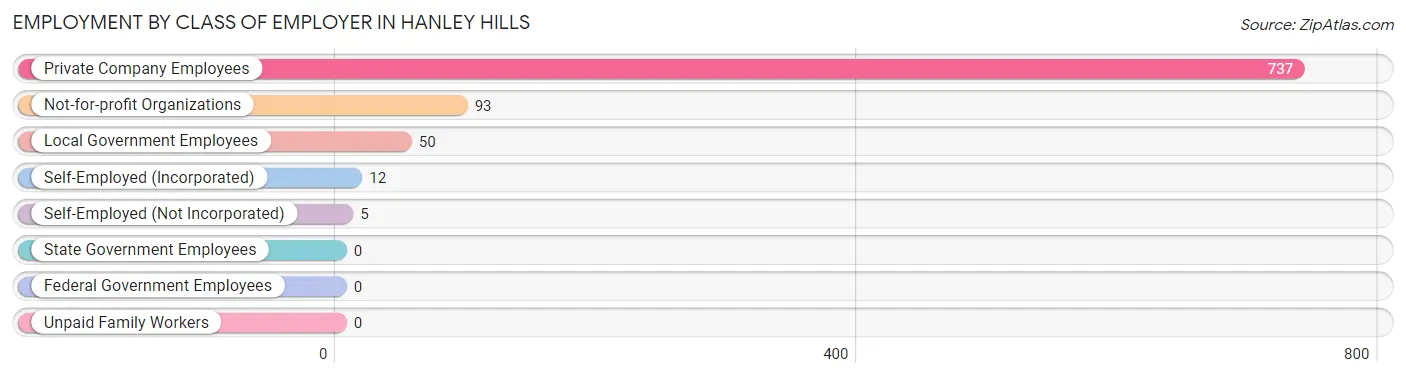
| Employer Class | # Employees | % Employees |
| Private Company Employees | 737 | 82.2% |
| Self-Employed (Incorporated) | 12 | 1.3% |
| Self-Employed (Not Incorporated) | 5 | 0.6% |
| Not-for-profit Organizations | 93 | 10.4% |
| Local Government Employees | 50 | 5.6% |
| State Government Employees | 0 | 0.0% |
| Federal Government Employees | 0 | 0.0% |
| Unpaid Family Workers | 0 | 0.0% |
| Total | 897 | 100.0% |
Employment Status by Age in Hanley Hills
According to the labor force statistics for Hanley Hills, out of the total population over 16 years of age (1,487), 67.6% or 1,005 individuals are in the labor force, with 6.3% or 63 of them unemployed. The age group with the highest labor force participation rate is 25 to 29 years, with 95.4% or 165 individuals in the labor force. Within the labor force, the 16 to 19 years age range has the highest percentage of unemployed individuals, with 14.8% or 23 of them being unemployed.
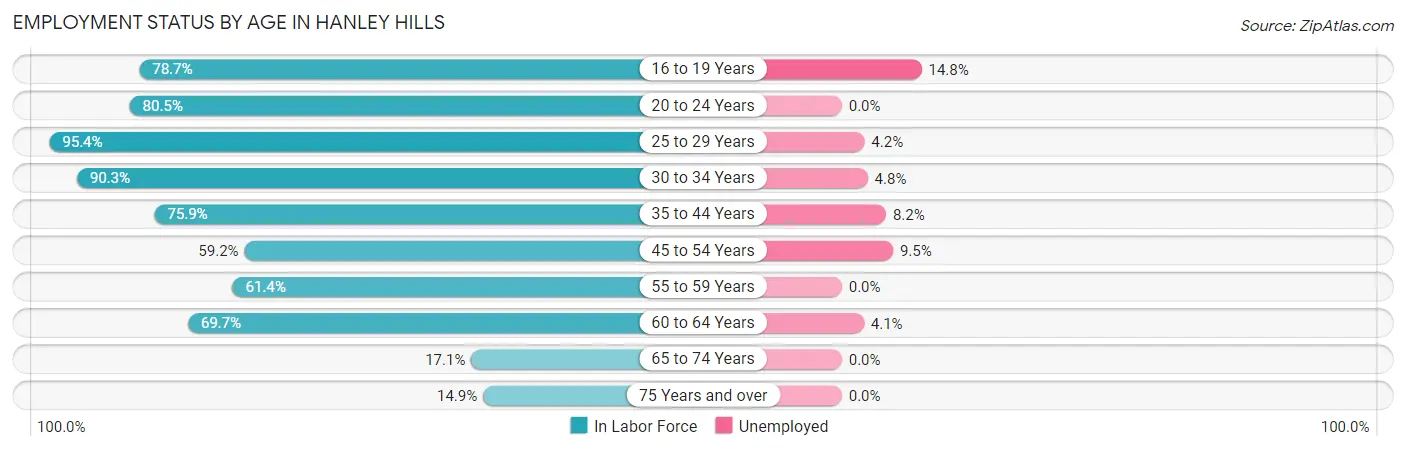
| Age Bracket | In Labor Force | Unemployed |
| 16 to 19 Years | 155 (78.7%) | 23 (14.8%) |
| 20 to 24 Years | 70 (80.5%) | 0 (0.0%) |
| 25 to 29 Years | 165 (95.4%) | 7 (4.2%) |
| 30 to 34 Years | 167 (90.3%) | 8 (4.8%) |
| 35 to 44 Years | 110 (75.9%) | 9 (8.2%) |
| 45 to 54 Years | 116 (59.2%) | 11 (9.5%) |
| 55 to 59 Years | 62 (61.4%) | 0 (0.0%) |
| 60 to 64 Years | 122 (69.7%) | 5 (4.1%) |
| 65 to 74 Years | 31 (17.1%) | 0 (0.0%) |
| 75 Years and over | 7 (14.9%) | 0 (0.0%) |
| Total | 1,005 (67.6%) | 63 (6.3%) |
Employment Status by Educational Attainment in Hanley Hills
According to labor force statistics for Hanley Hills, 76.1% of individuals (742) out of the total population between 25 and 64 years of age (975) are in the labor force, with 5.4% or 40 of them being unemployed. The group with the highest labor force participation rate are those with the educational attainment of college / associate degree, with 83.1% or 266 individuals in the labor force. Within the labor force, individuals with less than high school education have the highest percentage of unemployment, with 22.6% or 12 of them being unemployed.
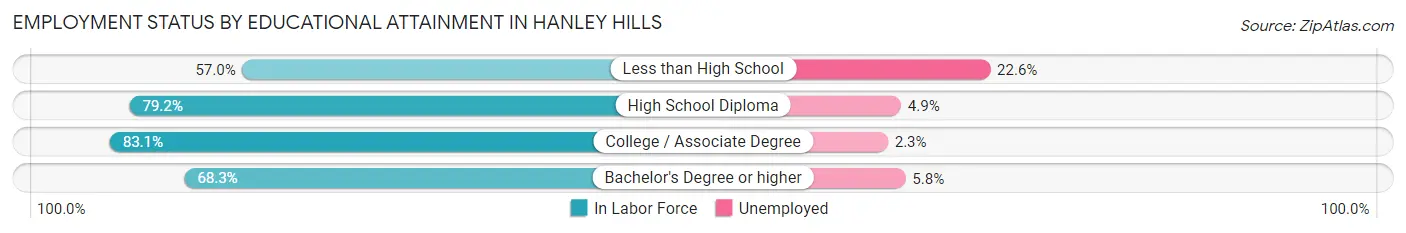
| Educational Attainment | In Labor Force | Unemployed |
| Less than High School | 53 (57.0%) | 21 (22.6%) |
| High School Diploma | 285 (79.2%) | 18 (4.9%) |
| College / Associate Degree | 266 (83.1%) | 7 (2.3%) |
| Bachelor's Degree or higher | 138 (68.3%) | 12 (5.8%) |
| Total | 742 (76.1%) | 53 (5.4%) |
Employment Occupations by Sex in Hanley Hills
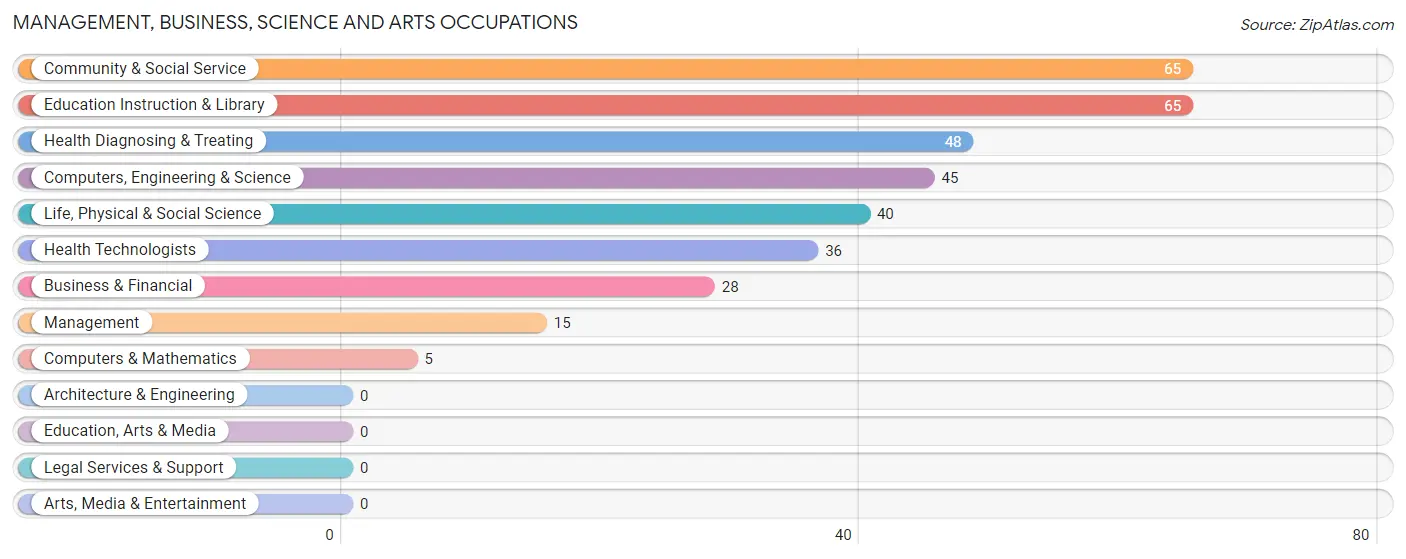
Management, Business, Science and Arts Occupations
The most common Management, Business, Science and Arts occupations in Hanley Hills are Community & Social Service (65 | 6.9%), Education Instruction & Library (65 | 6.9%), Health Diagnosing & Treating (48 | 5.1%), Computers, Engineering & Science (45 | 4.8%), and Life, Physical & Social Science (40 | 4.3%).
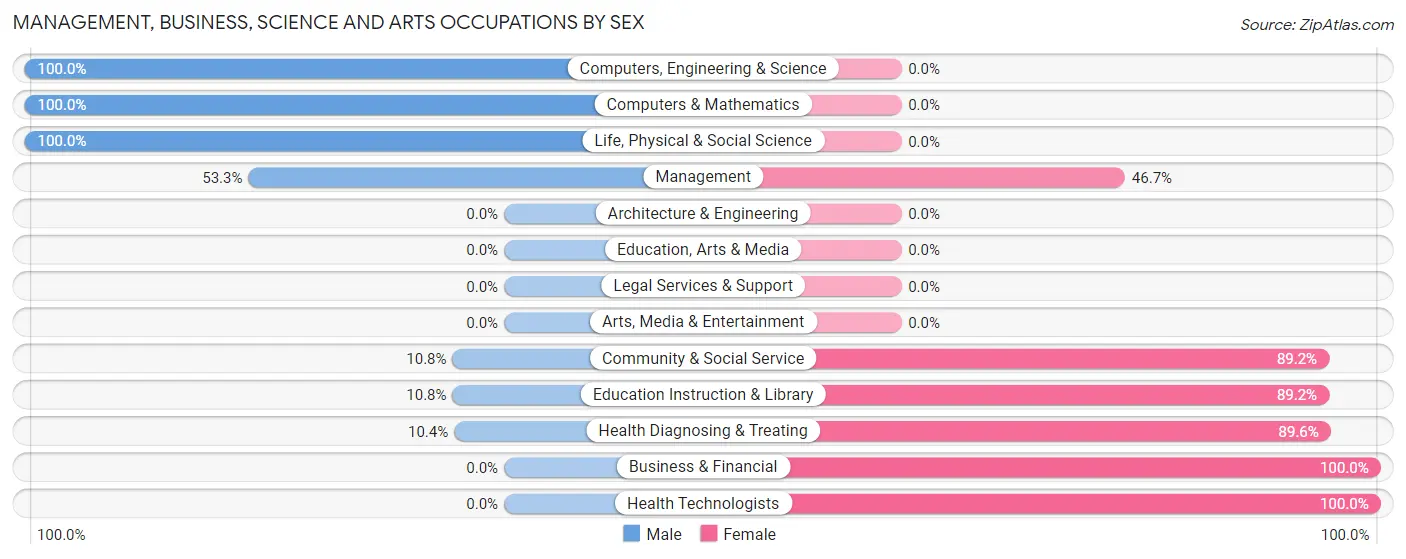
Management, Business, Science and Arts Occupations by Sex
Within the Management, Business, Science and Arts occupations in Hanley Hills, the most male-oriented occupations are Computers, Engineering & Science (100.0%), Computers & Mathematics (100.0%), and Life, Physical & Social Science (100.0%), while the most female-oriented occupations are Business & Financial (100.0%), Health Technologists (100.0%), and Health Diagnosing & Treating (89.6%).
| Occupation | Male | Female |
| Management | 8 (53.3%) | 7 (46.7%) |
| Business & Financial | 0 (0.0%) | 28 (100.0%) |
| Computers, Engineering & Science | 45 (100.0%) | 0 (0.0%) |
| Computers & Mathematics | 5 (100.0%) | 0 (0.0%) |
| Architecture & Engineering | 0 (0.0%) | 0 (0.0%) |
| Life, Physical & Social Science | 40 (100.0%) | 0 (0.0%) |
| Community & Social Service | 7 (10.8%) | 58 (89.2%) |
| Education, Arts & Media | 0 (0.0%) | 0 (0.0%) |
| Legal Services & Support | 0 (0.0%) | 0 (0.0%) |
| Education Instruction & Library | 7 (10.8%) | 58 (89.2%) |
| Arts, Media & Entertainment | 0 (0.0%) | 0 (0.0%) |
| Health Diagnosing & Treating | 5 (10.4%) | 43 (89.6%) |
| Health Technologists | 0 (0.0%) | 36 (100.0%) |
| Total (Category) | 65 (32.3%) | 136 (67.7%) |
| Total (Overall) | 438 (46.5%) | 504 (53.5%) |
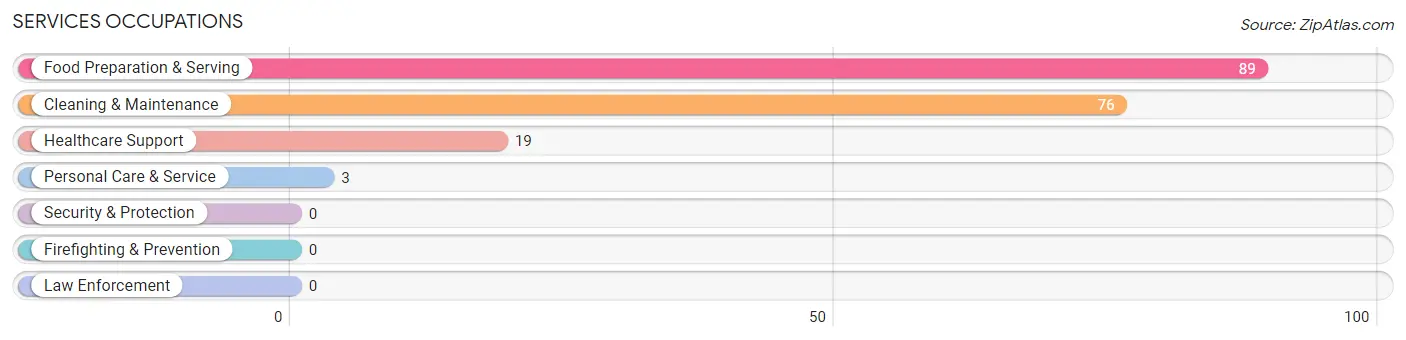
Services Occupations
The most common Services occupations in Hanley Hills are Food Preparation & Serving (89 | 9.5%), Cleaning & Maintenance (76 | 8.1%), Healthcare Support (19 | 2.0%), and Personal Care & Service (3 | 0.3%).
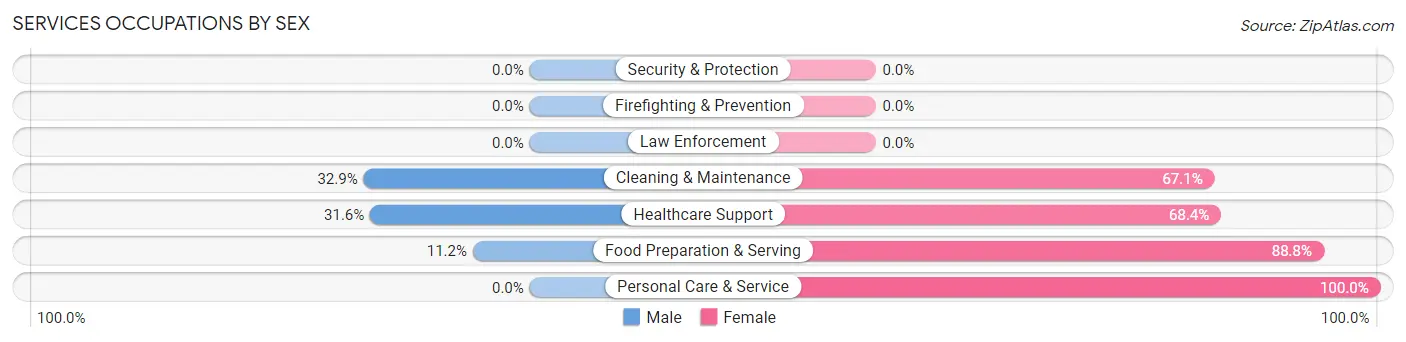
Services Occupations by Sex
Within the Services occupations in Hanley Hills, the most male-oriented occupations are Cleaning & Maintenance (32.9%), Healthcare Support (31.6%), and Food Preparation & Serving (11.2%), while the most female-oriented occupations are Personal Care & Service (100.0%), Food Preparation & Serving (88.8%), and Healthcare Support (68.4%).
| Occupation | Male | Female |
| Healthcare Support | 6 (31.6%) | 13 (68.4%) |
| Security & Protection | 0 (0.0%) | 0 (0.0%) |
| Firefighting & Prevention | 0 (0.0%) | 0 (0.0%) |
| Law Enforcement | 0 (0.0%) | 0 (0.0%) |
| Food Preparation & Serving | 10 (11.2%) | 79 (88.8%) |
| Cleaning & Maintenance | 25 (32.9%) | 51 (67.1%) |
| Personal Care & Service | 0 (0.0%) | 3 (100.0%) |
| Total (Category) | 41 (21.9%) | 146 (78.1%) |
| Total (Overall) | 438 (46.5%) | 504 (53.5%) |
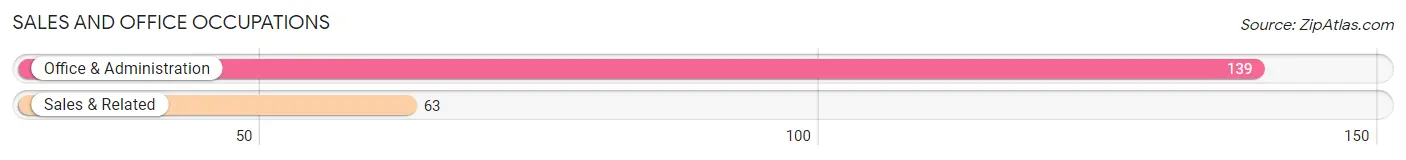
Sales and Office Occupations
The most common Sales and Office occupations in Hanley Hills are Office & Administration (139 | 14.8%), and Sales & Related (63 | 6.7%).
Sales and Office Occupations by Sex
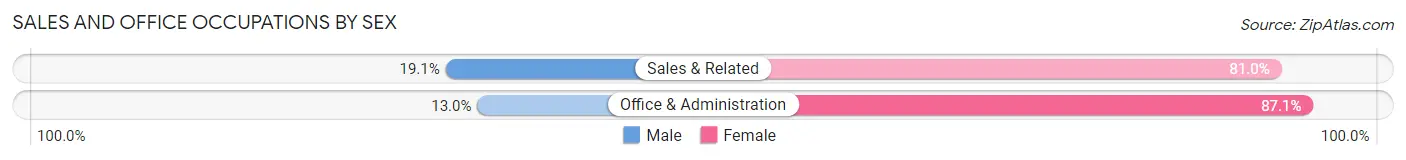
| Occupation | Male | Female |
| Sales & Related | 12 (19.1%) | 51 (80.9%) |
| Office & Administration | 18 (13.0%) | 121 (87.1%) |
| Total (Category) | 30 (14.8%) | 172 (85.2%) |
| Total (Overall) | 438 (46.5%) | 504 (53.5%) |
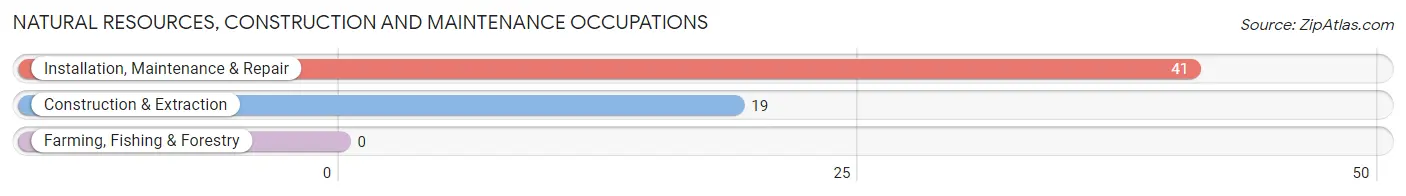
Natural Resources, Construction and Maintenance Occupations
The most common Natural Resources, Construction and Maintenance occupations in Hanley Hills are Installation, Maintenance & Repair (41 | 4.3%), and Construction & Extraction (19 | 2.0%).
Natural Resources, Construction and Maintenance Occupations by Sex
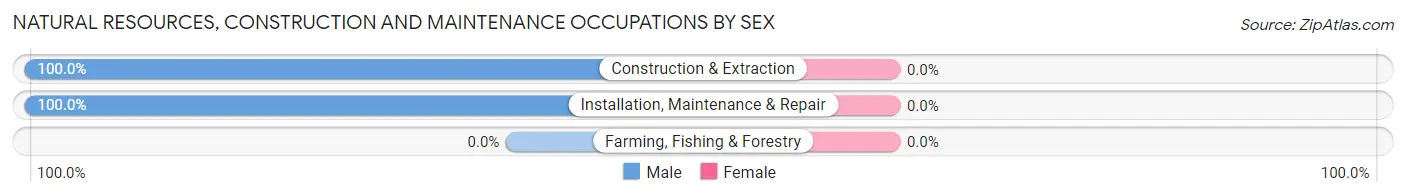
| Occupation | Male | Female |
| Farming, Fishing & Forestry | 0 (0.0%) | 0 (0.0%) |
| Construction & Extraction | 19 (100.0%) | 0 (0.0%) |
| Installation, Maintenance & Repair | 41 (100.0%) | 0 (0.0%) |
| Total (Category) | 60 (100.0%) | 0 (0.0%) |
| Total (Overall) | 438 (46.5%) | 504 (53.5%) |
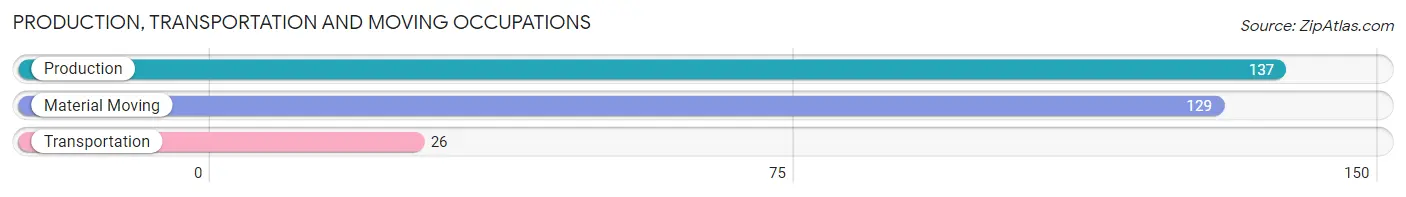
Production, Transportation and Moving Occupations
The most common Production, Transportation and Moving occupations in Hanley Hills are Production (137 | 14.5%), Material Moving (129 | 13.7%), and Transportation (26 | 2.8%).
Production, Transportation and Moving Occupations by Sex
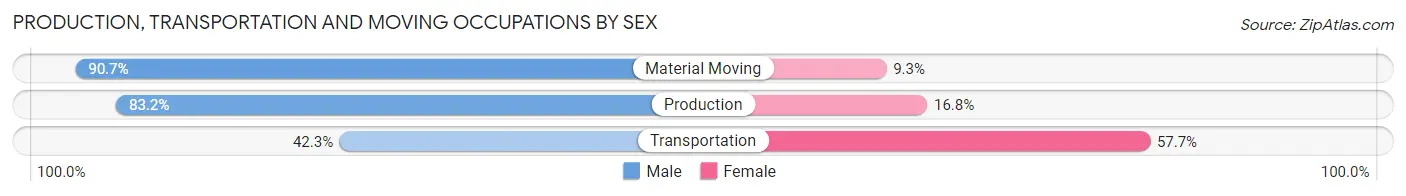
| Occupation | Male | Female |
| Production | 114 (83.2%) | 23 (16.8%) |
| Transportation | 11 (42.3%) | 15 (57.7%) |
| Material Moving | 117 (90.7%) | 12 (9.3%) |
| Total (Category) | 242 (82.9%) | 50 (17.1%) |
| Total (Overall) | 438 (46.5%) | 504 (53.5%) |
Employment Industries by Sex in Hanley Hills
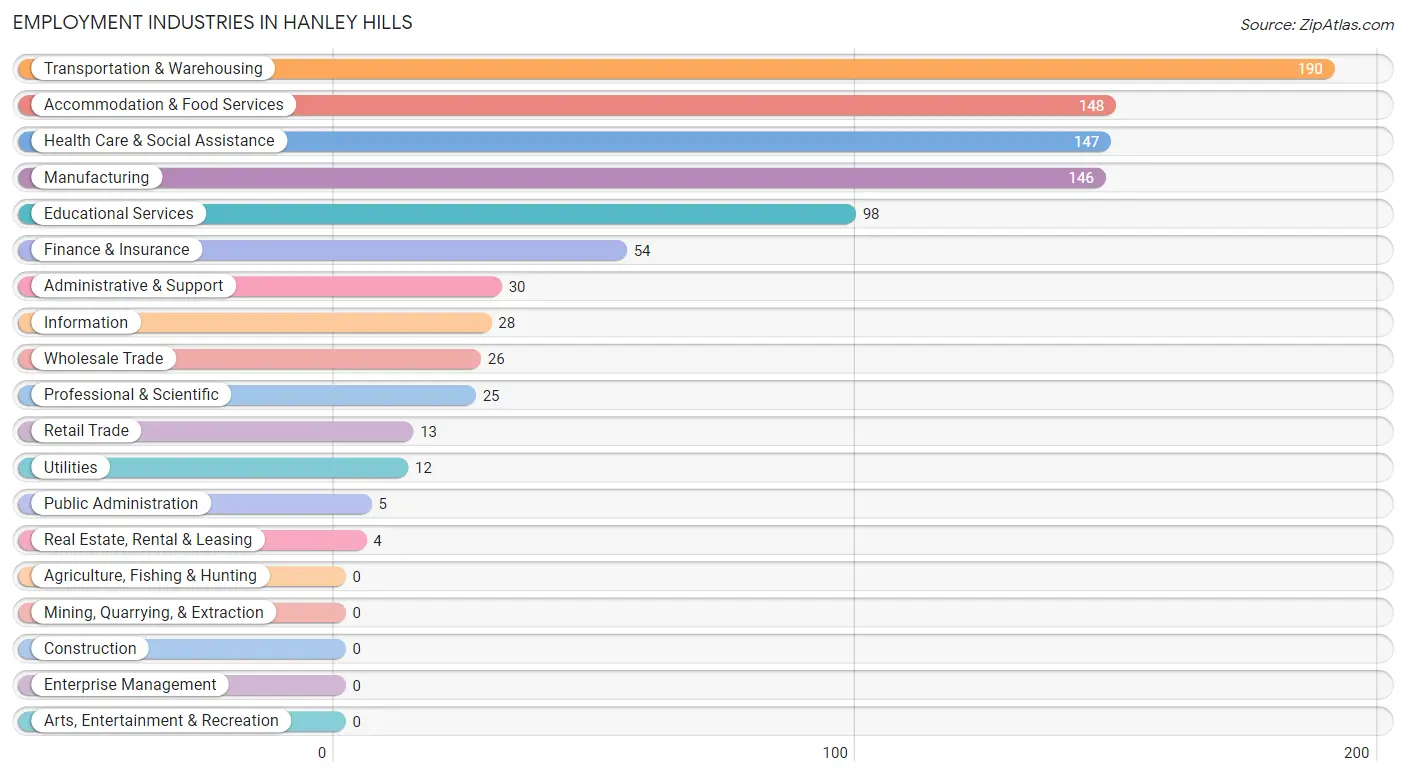
Employment Industries in Hanley Hills
The major employment industries in Hanley Hills include Transportation & Warehousing (190 | 20.2%), Accommodation & Food Services (148 | 15.7%), Health Care & Social Assistance (147 | 15.6%), Manufacturing (146 | 15.5%), and Educational Services (98 | 10.4%).
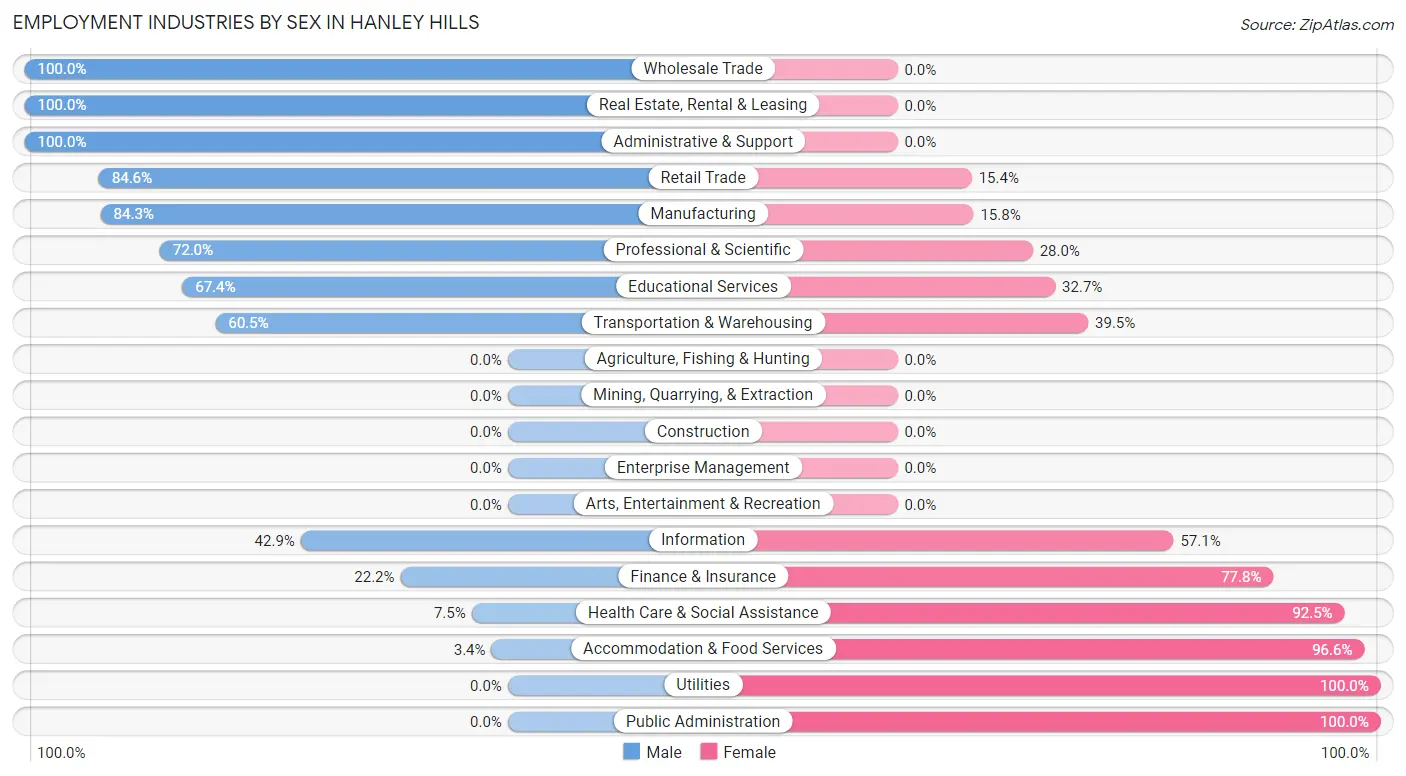
Employment Industries by Sex in Hanley Hills
The Hanley Hills industries that see more men than women are Wholesale Trade (100.0%), Real Estate, Rental & Leasing (100.0%), and Administrative & Support (100.0%), whereas the industries that tend to have a higher number of women are Utilities (100.0%), Public Administration (100.0%), and Accommodation & Food Services (96.6%).
| Industry | Male | Female |
| Agriculture, Fishing & Hunting | 0 (0.0%) | 0 (0.0%) |
| Mining, Quarrying, & Extraction | 0 (0.0%) | 0 (0.0%) |
| Construction | 0 (0.0%) | 0 (0.0%) |
| Manufacturing | 123 (84.3%) | 23 (15.8%) |
| Wholesale Trade | 26 (100.0%) | 0 (0.0%) |
| Retail Trade | 11 (84.6%) | 2 (15.4%) |
| Transportation & Warehousing | 115 (60.5%) | 75 (39.5%) |
| Utilities | 0 (0.0%) | 12 (100.0%) |
| Information | 12 (42.9%) | 16 (57.1%) |
| Finance & Insurance | 12 (22.2%) | 42 (77.8%) |
| Real Estate, Rental & Leasing | 4 (100.0%) | 0 (0.0%) |
| Professional & Scientific | 18 (72.0%) | 7 (28.0%) |
| Enterprise Management | 0 (0.0%) | 0 (0.0%) |
| Administrative & Support | 30 (100.0%) | 0 (0.0%) |
| Educational Services | 66 (67.3%) | 32 (32.7%) |
| Health Care & Social Assistance | 11 (7.5%) | 136 (92.5%) |
| Arts, Entertainment & Recreation | 0 (0.0%) | 0 (0.0%) |
| Accommodation & Food Services | 5 (3.4%) | 143 (96.6%) |
| Public Administration | 0 (0.0%) | 5 (100.0%) |
| Total | 438 (46.5%) | 504 (53.5%) |
Education in Hanley Hills
School Enrollment in Hanley Hills
The most common levels of schooling among the 183 students in Hanley Hills are college / undergraduate (81 | 44.3%), high school (38 | 20.8%), and middle school (36 | 19.7%).
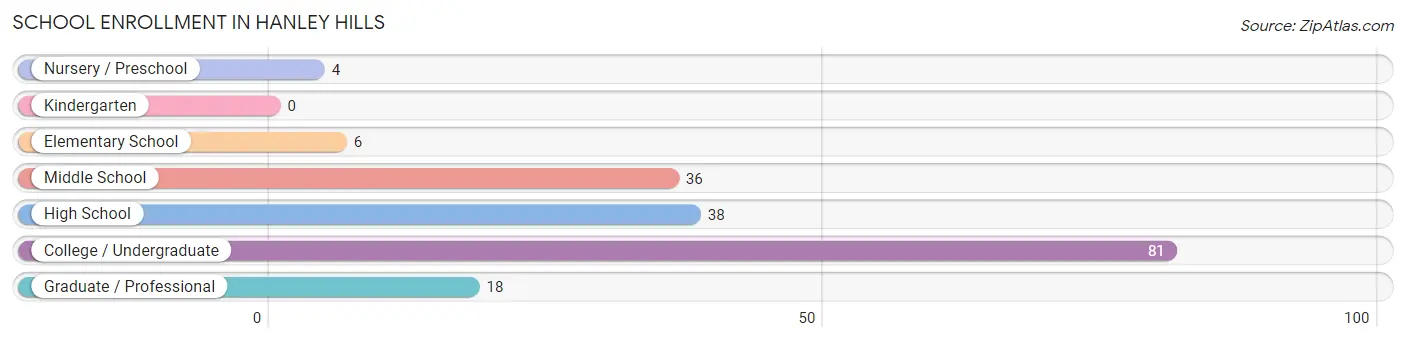
| School Level | # Students | % Students |
| Nursery / Preschool | 4 | 2.2% |
| Kindergarten | 0 | 0.0% |
| Elementary School | 6 | 3.3% |
| Middle School | 36 | 19.7% |
| High School | 38 | 20.8% |
| College / Undergraduate | 81 | 44.3% |
| Graduate / Professional | 18 | 9.8% |
| Total | 183 | 100.0% |
School Enrollment by Age by Funding Source in Hanley Hills
Out of a total of 183 students who are enrolled in schools in Hanley Hills, 87 (47.5%) attend a private institution, while the remaining 96 (52.5%) are enrolled in public schools. The age group of 25 to 34 year olds has the highest likelihood of being enrolled in private schools, with 18 (100.0% in the age bracket) enrolled. Conversely, the age group of 3 to 4 year olds has the lowest likelihood of being enrolled in a private school, with 4 (100.0% in the age bracket) attending a public institution.
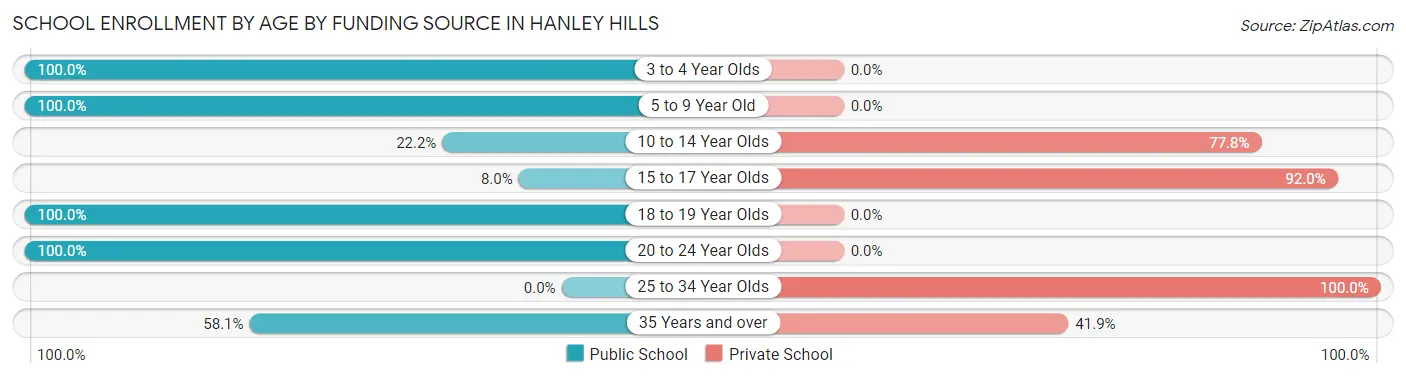
| Age Bracket | Public School | Private School |
| 3 to 4 Year Olds | 4 (100.0%) | 0 (0.0%) |
| 5 to 9 Year Old | 6 (100.0%) | 0 (0.0%) |
| 10 to 14 Year Olds | 8 (22.2%) | 28 (77.8%) |
| 15 to 17 Year Olds | 2 (8.0%) | 23 (92.0%) |
| 18 to 19 Year Olds | 13 (100.0%) | 0 (0.0%) |
| 20 to 24 Year Olds | 38 (100.0%) | 0 (0.0%) |
| 25 to 34 Year Olds | 0 (0.0%) | 18 (100.0%) |
| 35 Years and over | 25 (58.1%) | 18 (41.9%) |
| Total | 96 (52.5%) | 87 (47.5%) |
Educational Attainment by Field of Study in Hanley Hills
Science & technology (74 | 31.4%), arts & humanities (48 | 20.3%), physical & health sciences (33 | 14.0%), psychology (18 | 7.6%), and engineering (15 | 6.4%) are the most common fields of study among 236 individuals in Hanley Hills who have obtained a bachelor's degree or higher.
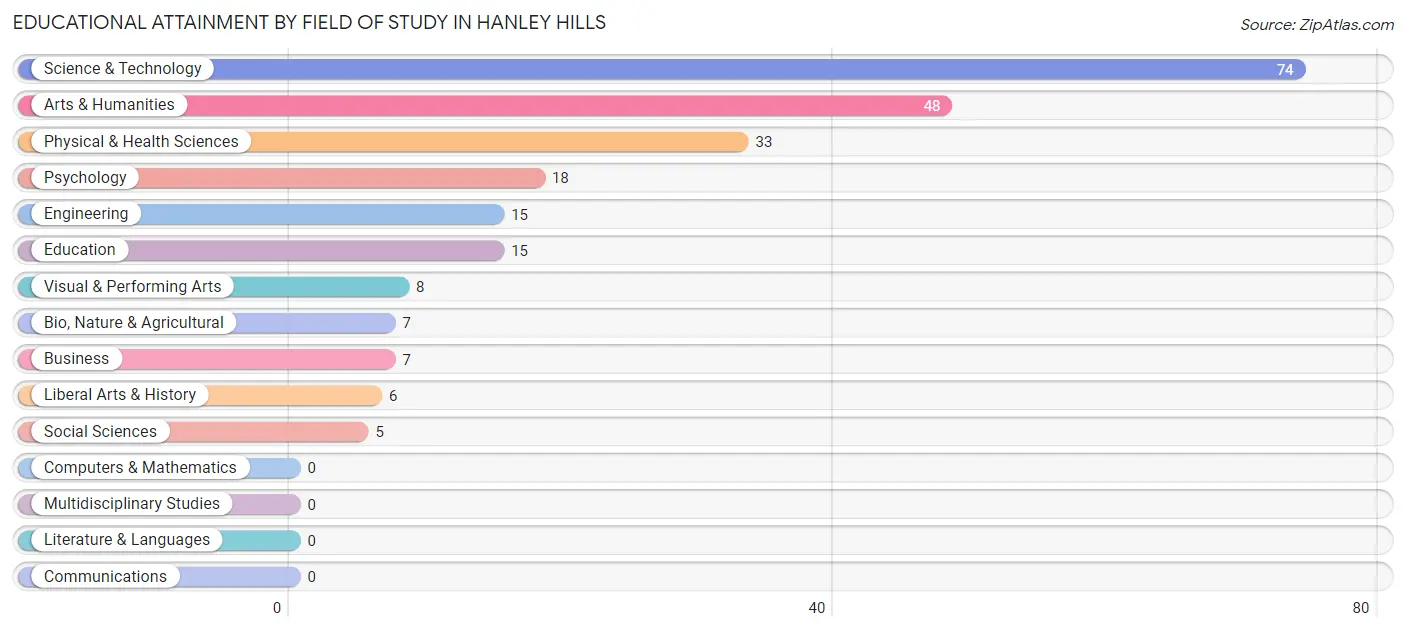
| Field of Study | # Graduates | % Graduates |
| Computers & Mathematics | 0 | 0.0% |
| Bio, Nature & Agricultural | 7 | 3.0% |
| Physical & Health Sciences | 33 | 14.0% |
| Psychology | 18 | 7.6% |
| Social Sciences | 5 | 2.1% |
| Engineering | 15 | 6.4% |
| Multidisciplinary Studies | 0 | 0.0% |
| Science & Technology | 74 | 31.4% |
| Business | 7 | 3.0% |
| Education | 15 | 6.4% |
| Literature & Languages | 0 | 0.0% |
| Liberal Arts & History | 6 | 2.5% |
| Visual & Performing Arts | 8 | 3.4% |
| Communications | 0 | 0.0% |
| Arts & Humanities | 48 | 20.3% |
| Total | 236 | 100.0% |
Transportation & Commute in Hanley Hills
Vehicle Availability by Sex in Hanley Hills
The most prevalent vehicle ownership categories in Hanley Hills are males with 1 vehicle (192, accounting for 46.4%) and females with 1 vehicle (239, making up 39.8%).
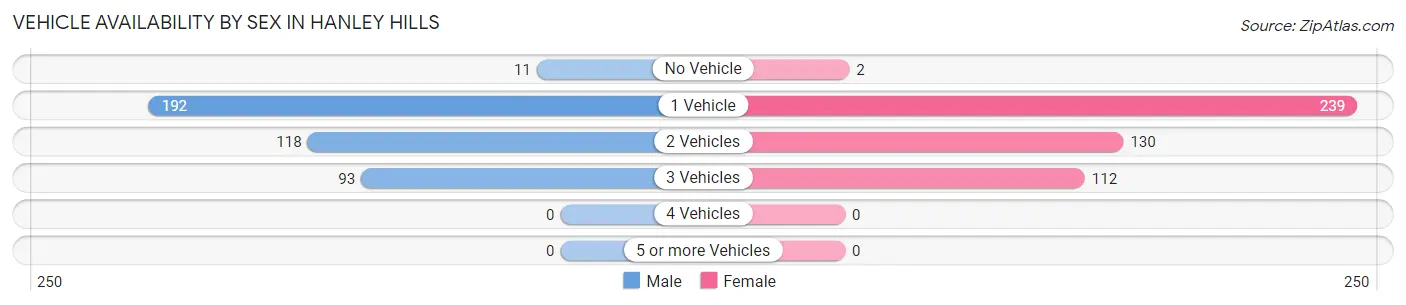
| Vehicles Available | Male | Female |
| No Vehicle | 11 (2.7%) | 2 (0.4%) |
| 1 Vehicle | 192 (46.4%) | 239 (49.5%) |
| 2 Vehicles | 118 (28.5%) | 130 (26.9%) |
| 3 Vehicles | 93 (22.5%) | 112 (23.2%) |
| 4 Vehicles | 0 (0.0%) | 0 (0.0%) |
| 5 or more Vehicles | 0 (0.0%) | 0 (0.0%) |
| Total | 414 (100.0%) | 483 (100.0%) |
Commute Time in Hanley Hills
The most frequently occuring commute durations in Hanley Hills are 15 to 19 minutes (256 commuters, 29.9%), 20 to 24 minutes (233 commuters, 27.2%), and 30 to 34 minutes (109 commuters, 12.7%).
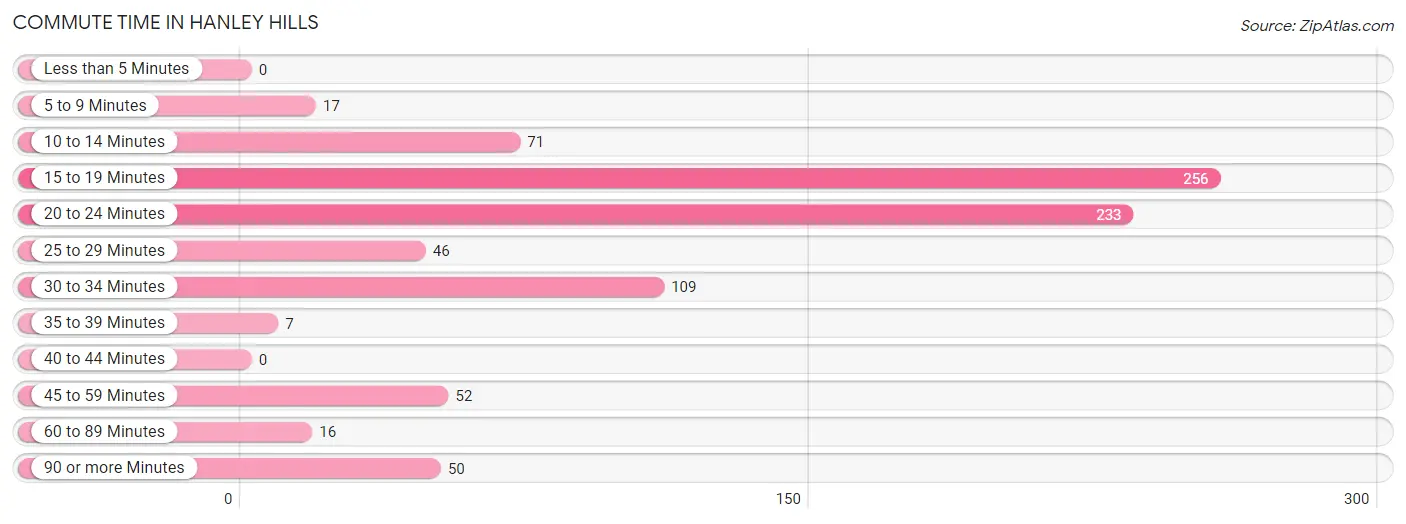
| Commute Time | # Commuters | % Commuters |
| Less than 5 Minutes | 0 | 0.0% |
| 5 to 9 Minutes | 17 | 2.0% |
| 10 to 14 Minutes | 71 | 8.3% |
| 15 to 19 Minutes | 256 | 29.9% |
| 20 to 24 Minutes | 233 | 27.2% |
| 25 to 29 Minutes | 46 | 5.4% |
| 30 to 34 Minutes | 109 | 12.7% |
| 35 to 39 Minutes | 7 | 0.8% |
| 40 to 44 Minutes | 0 | 0.0% |
| 45 to 59 Minutes | 52 | 6.1% |
| 60 to 89 Minutes | 16 | 1.9% |
| 90 or more Minutes | 50 | 5.8% |
Commute Time by Sex in Hanley Hills
The most common commute times in Hanley Hills are 15 to 19 minutes (152 commuters, 36.7%) for males and 20 to 24 minutes (133 commuters, 30.0%) for females.
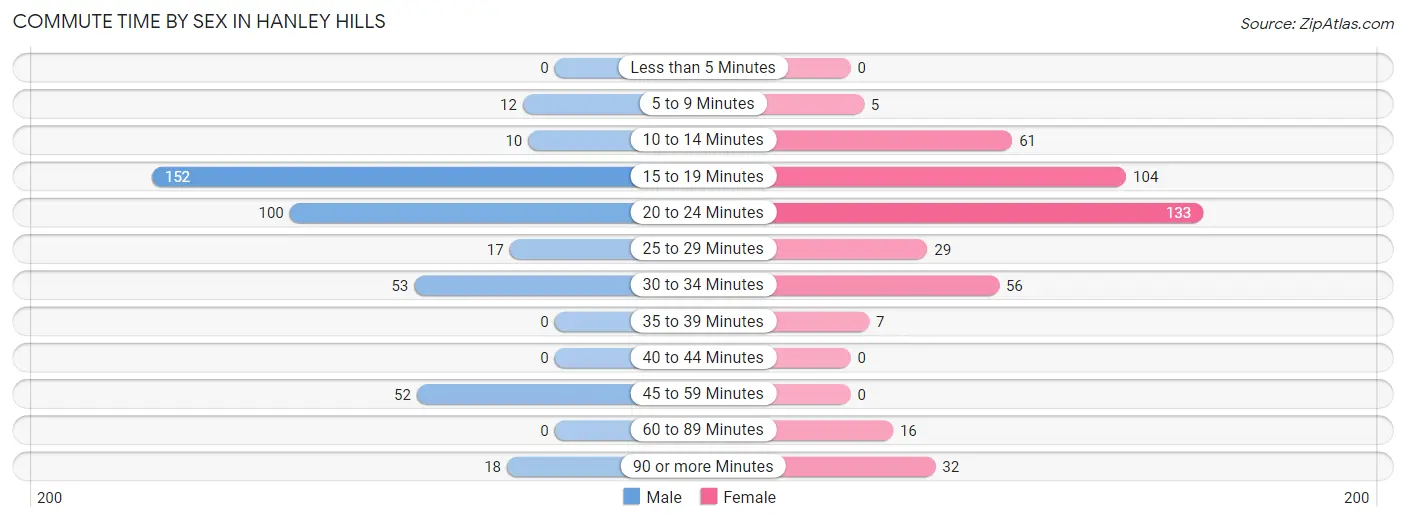
| Commute Time | Male | Female |
| Less than 5 Minutes | 0 (0.0%) | 0 (0.0%) |
| 5 to 9 Minutes | 12 (2.9%) | 5 (1.1%) |
| 10 to 14 Minutes | 10 (2.4%) | 61 (13.8%) |
| 15 to 19 Minutes | 152 (36.7%) | 104 (23.5%) |
| 20 to 24 Minutes | 100 (24.1%) | 133 (30.0%) |
| 25 to 29 Minutes | 17 (4.1%) | 29 (6.6%) |
| 30 to 34 Minutes | 53 (12.8%) | 56 (12.6%) |
| 35 to 39 Minutes | 0 (0.0%) | 7 (1.6%) |
| 40 to 44 Minutes | 0 (0.0%) | 0 (0.0%) |
| 45 to 59 Minutes | 52 (12.6%) | 0 (0.0%) |
| 60 to 89 Minutes | 0 (0.0%) | 16 (3.6%) |
| 90 or more Minutes | 18 (4.3%) | 32 (7.2%) |
Time of Departure to Work by Sex in Hanley Hills
The most frequent times of departure to work in Hanley Hills are 8:00 AM to 8:29 AM (100, 24.1%) for males and 8:00 AM to 8:29 AM (108, 24.4%) for females.
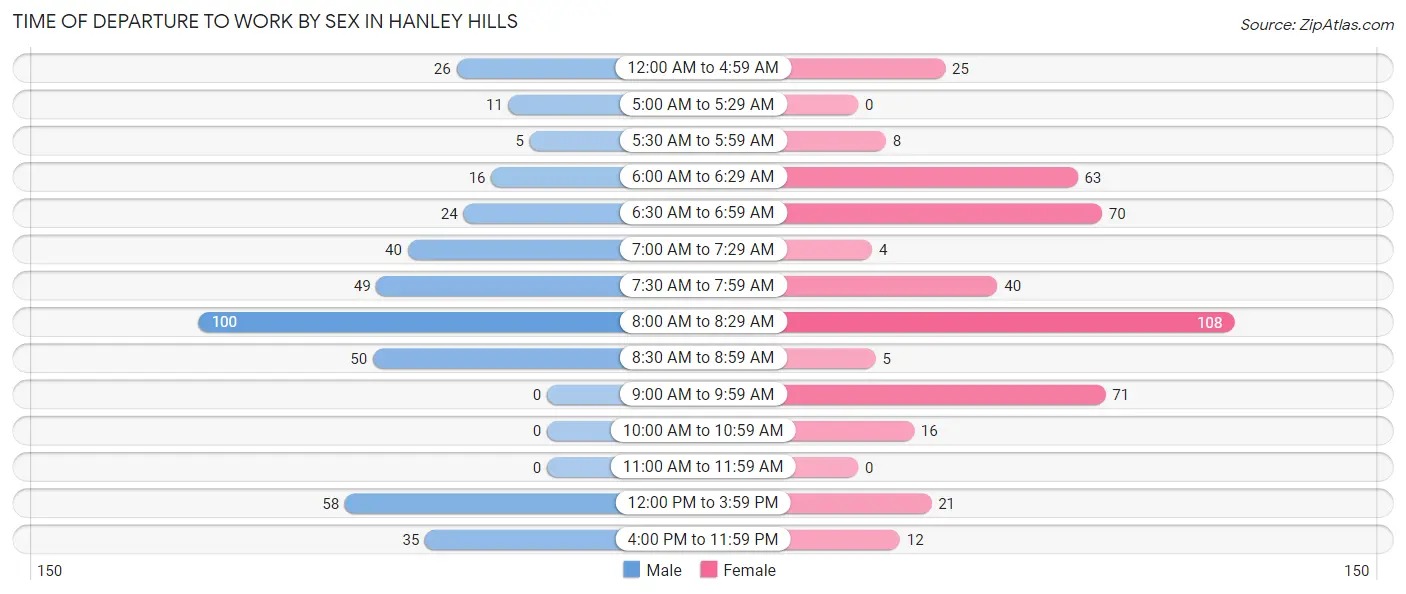
| Time of Departure | Male | Female |
| 12:00 AM to 4:59 AM | 26 (6.3%) | 25 (5.6%) |
| 5:00 AM to 5:29 AM | 11 (2.7%) | 0 (0.0%) |
| 5:30 AM to 5:59 AM | 5 (1.2%) | 8 (1.8%) |
| 6:00 AM to 6:29 AM | 16 (3.9%) | 63 (14.2%) |
| 6:30 AM to 6:59 AM | 24 (5.8%) | 70 (15.8%) |
| 7:00 AM to 7:29 AM | 40 (9.7%) | 4 (0.9%) |
| 7:30 AM to 7:59 AM | 49 (11.8%) | 40 (9.0%) |
| 8:00 AM to 8:29 AM | 100 (24.1%) | 108 (24.4%) |
| 8:30 AM to 8:59 AM | 50 (12.1%) | 5 (1.1%) |
| 9:00 AM to 9:59 AM | 0 (0.0%) | 71 (16.0%) |
| 10:00 AM to 10:59 AM | 0 (0.0%) | 16 (3.6%) |
| 11:00 AM to 11:59 AM | 0 (0.0%) | 0 (0.0%) |
| 12:00 PM to 3:59 PM | 58 (14.0%) | 21 (4.7%) |
| 4:00 PM to 11:59 PM | 35 (8.5%) | 12 (2.7%) |
| Total | 414 (100.0%) | 443 (100.0%) |
Housing Occupancy in Hanley Hills
Occupancy by Ownership in Hanley Hills
Of the total 688 dwellings in Hanley Hills, owner-occupied units account for 408 (59.3%), while renter-occupied units make up 280 (40.7%).
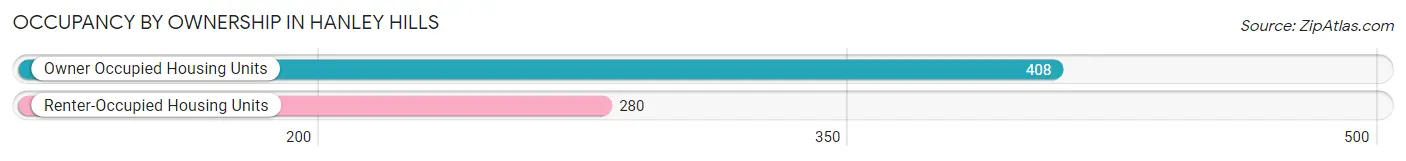
| Occupancy | # Housing Units | % Housing Units |
| Owner Occupied Housing Units | 408 | 59.3% |
| Renter-Occupied Housing Units | 280 | 40.7% |
| Total Occupied Housing Units | 688 | 100.0% |
Occupancy by Household Size in Hanley Hills
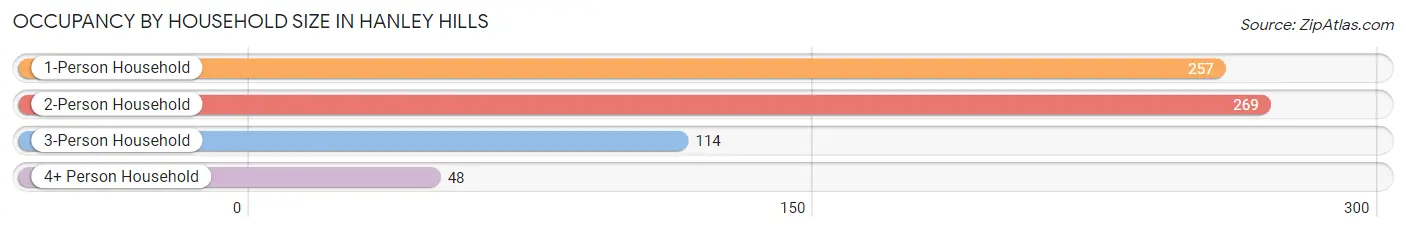
| Household Size | # Housing Units | % Housing Units |
| 1-Person Household | 257 | 37.3% |
| 2-Person Household | 269 | 39.1% |
| 3-Person Household | 114 | 16.6% |
| 4+ Person Household | 48 | 7.0% |
| Total Housing Units | 688 | 100.0% |
Occupancy by Ownership by Household Size in Hanley Hills
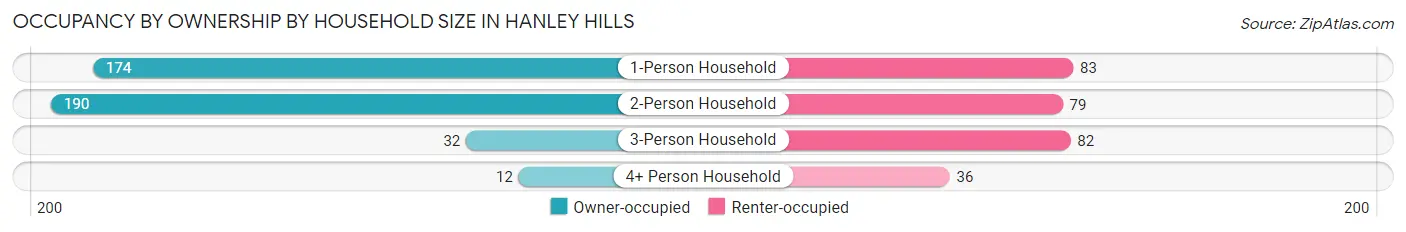
| Household Size | Owner-occupied | Renter-occupied |
| 1-Person Household | 174 (67.7%) | 83 (32.3%) |
| 2-Person Household | 190 (70.6%) | 79 (29.4%) |
| 3-Person Household | 32 (28.1%) | 82 (71.9%) |
| 4+ Person Household | 12 (25.0%) | 36 (75.0%) |
| Total Housing Units | 408 (59.3%) | 280 (40.7%) |
Occupancy by Educational Attainment in Hanley Hills
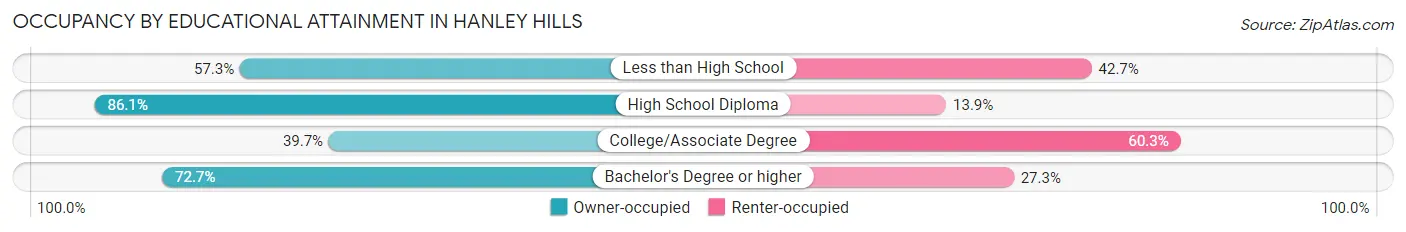
| Household Size | Owner-occupied | Renter-occupied |
| Less than High School | 55 (57.3%) | 41 (42.7%) |
| High School Diploma | 118 (86.1%) | 19 (13.9%) |
| College/Associate Degree | 115 (39.7%) | 175 (60.3%) |
| Bachelor's Degree or higher | 120 (72.7%) | 45 (27.3%) |
Occupancy by Age of Householder in Hanley Hills
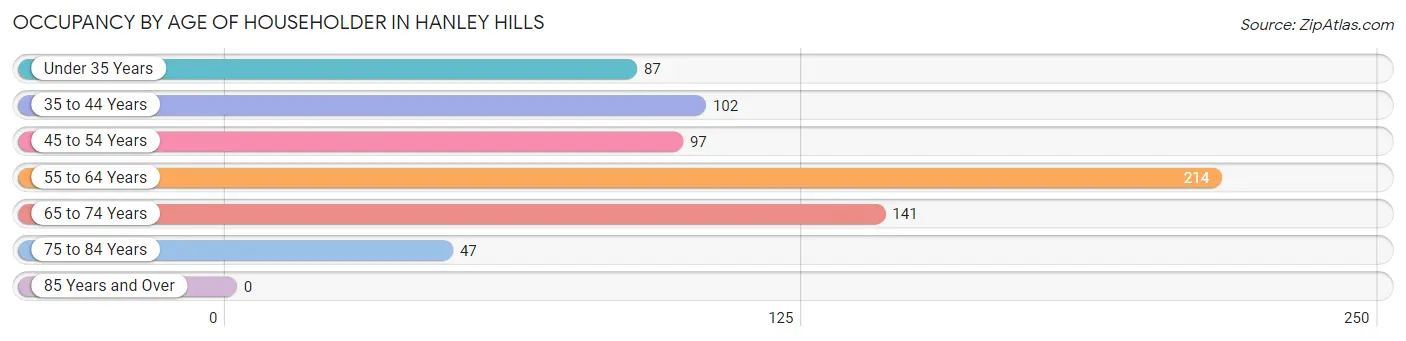
| Age Bracket | # Households | % Households |
| Under 35 Years | 87 | 12.7% |
| 35 to 44 Years | 102 | 14.8% |
| 45 to 54 Years | 97 | 14.1% |
| 55 to 64 Years | 214 | 31.1% |
| 65 to 74 Years | 141 | 20.5% |
| 75 to 84 Years | 47 | 6.8% |
| 85 Years and Over | 0 | 0.0% |
| Total | 688 | 100.0% |
Housing Finances in Hanley Hills
Median Income by Occupancy in Hanley Hills
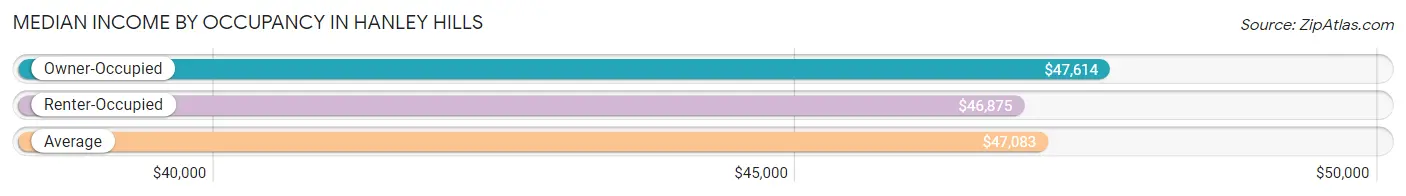
| Occupancy Type | # Households | Median Income |
| Owner-Occupied | 408 (59.3%) | $47,614 |
| Renter-Occupied | 280 (40.7%) | $46,875 |
| Average | 688 (100.0%) | $47,083 |
Occupancy by Householder Income Bracket in Hanley Hills
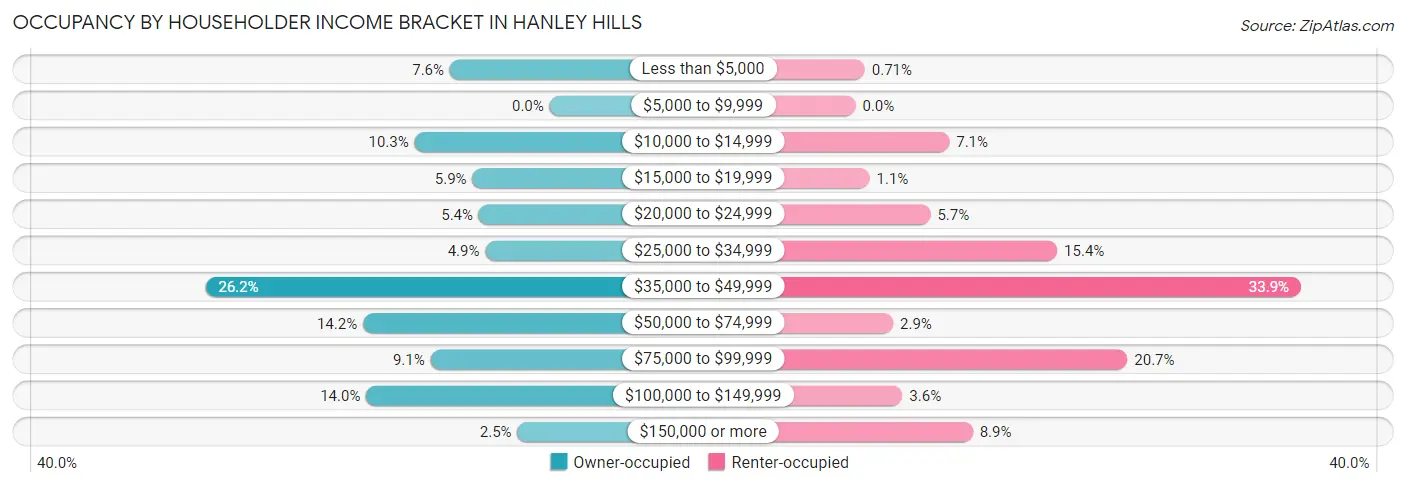
| Income Bracket | Owner-occupied | Renter-occupied |
| Less than $5,000 | 31 (7.6%) | 2 (0.7%) |
| $5,000 to $9,999 | 0 (0.0%) | 0 (0.0%) |
| $10,000 to $14,999 | 42 (10.3%) | 20 (7.1%) |
| $15,000 to $19,999 | 24 (5.9%) | 3 (1.1%) |
| $20,000 to $24,999 | 22 (5.4%) | 16 (5.7%) |
| $25,000 to $34,999 | 20 (4.9%) | 43 (15.4%) |
| $35,000 to $49,999 | 107 (26.2%) | 95 (33.9%) |
| $50,000 to $74,999 | 58 (14.2%) | 8 (2.9%) |
| $75,000 to $99,999 | 37 (9.1%) | 58 (20.7%) |
| $100,000 to $149,999 | 57 (14.0%) | 10 (3.6%) |
| $150,000 or more | 10 (2.5%) | 25 (8.9%) |
| Total | 408 (100.0%) | 280 (100.0%) |
Monthly Housing Cost Tiers in Hanley Hills
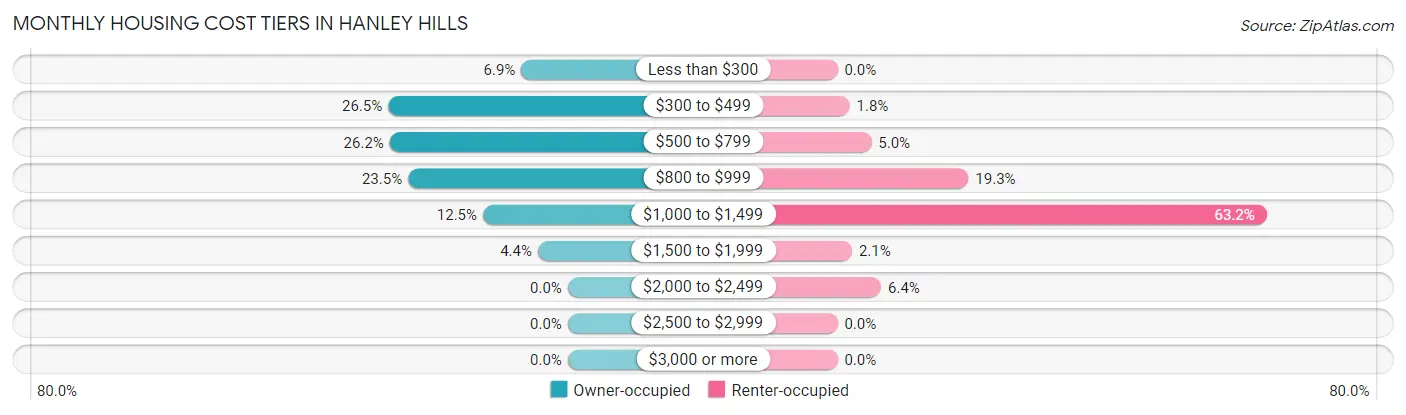
| Monthly Cost | Owner-occupied | Renter-occupied |
| Less than $300 | 28 (6.9%) | 0 (0.0%) |
| $300 to $499 | 108 (26.5%) | 5 (1.8%) |
| $500 to $799 | 107 (26.2%) | 14 (5.0%) |
| $800 to $999 | 96 (23.5%) | 54 (19.3%) |
| $1,000 to $1,499 | 51 (12.5%) | 177 (63.2%) |
| $1,500 to $1,999 | 18 (4.4%) | 6 (2.1%) |
| $2,000 to $2,499 | 0 (0.0%) | 18 (6.4%) |
| $2,500 to $2,999 | 0 (0.0%) | 0 (0.0%) |
| $3,000 or more | 0 (0.0%) | 0 (0.0%) |
| Total | 408 (100.0%) | 280 (100.0%) |
Physical Housing Characteristics in Hanley Hills
Housing Structures in Hanley Hills
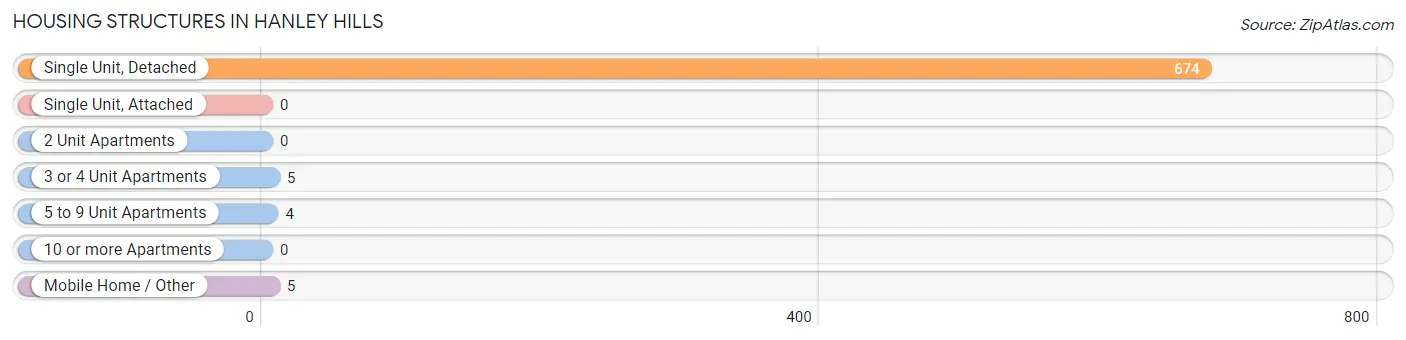
| Structure Type | # Housing Units | % Housing Units |
| Single Unit, Detached | 674 | 98.0% |
| Single Unit, Attached | 0 | 0.0% |
| 2 Unit Apartments | 0 | 0.0% |
| 3 or 4 Unit Apartments | 5 | 0.7% |
| 5 to 9 Unit Apartments | 4 | 0.6% |
| 10 or more Apartments | 0 | 0.0% |
| Mobile Home / Other | 5 | 0.7% |
| Total | 688 | 100.0% |
Housing Structures by Occupancy in Hanley Hills
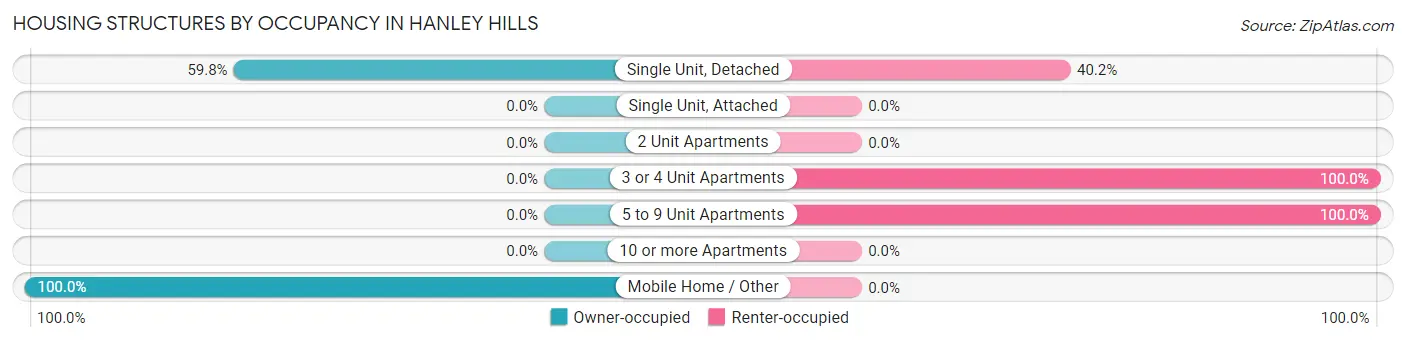
| Structure Type | Owner-occupied | Renter-occupied |
| Single Unit, Detached | 403 (59.8%) | 271 (40.2%) |
| Single Unit, Attached | 0 (0.0%) | 0 (0.0%) |
| 2 Unit Apartments | 0 (0.0%) | 0 (0.0%) |
| 3 or 4 Unit Apartments | 0 (0.0%) | 5 (100.0%) |
| 5 to 9 Unit Apartments | 0 (0.0%) | 4 (100.0%) |
| 10 or more Apartments | 0 (0.0%) | 0 (0.0%) |
| Mobile Home / Other | 5 (100.0%) | 0 (0.0%) |
| Total | 408 (59.3%) | 280 (40.7%) |
Housing Structures by Number of Rooms in Hanley Hills
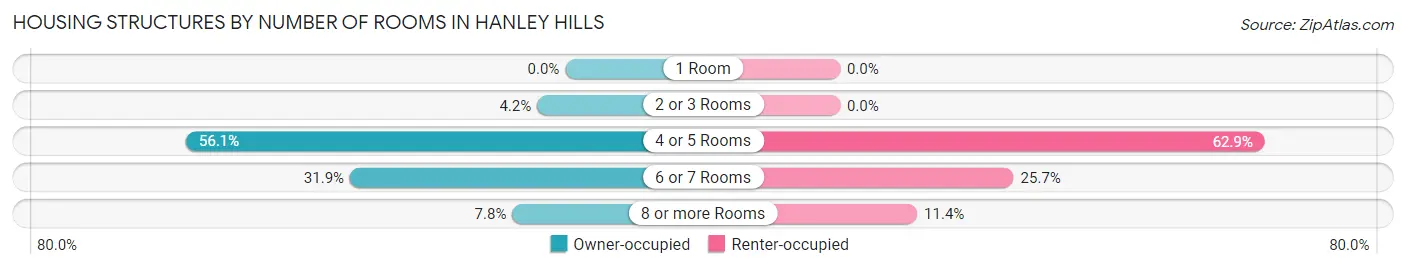
| Number of Rooms | Owner-occupied | Renter-occupied |
| 1 Room | 0 (0.0%) | 0 (0.0%) |
| 2 or 3 Rooms | 17 (4.2%) | 0 (0.0%) |
| 4 or 5 Rooms | 229 (56.1%) | 176 (62.9%) |
| 6 or 7 Rooms | 130 (31.9%) | 72 (25.7%) |
| 8 or more Rooms | 32 (7.8%) | 32 (11.4%) |
| Total | 408 (100.0%) | 280 (100.0%) |
Housing Structure by Heating Type in Hanley Hills
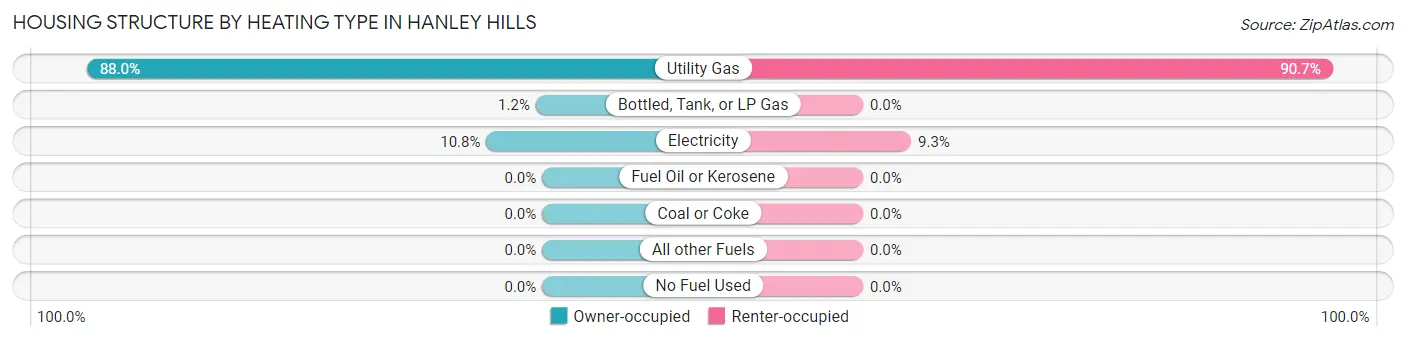
| Heating Type | Owner-occupied | Renter-occupied |
| Utility Gas | 359 (88.0%) | 254 (90.7%) |
| Bottled, Tank, or LP Gas | 5 (1.2%) | 0 (0.0%) |
| Electricity | 44 (10.8%) | 26 (9.3%) |
| Fuel Oil or Kerosene | 0 (0.0%) | 0 (0.0%) |
| Coal or Coke | 0 (0.0%) | 0 (0.0%) |
| All other Fuels | 0 (0.0%) | 0 (0.0%) |
| No Fuel Used | 0 (0.0%) | 0 (0.0%) |
| Total | 408 (100.0%) | 280 (100.0%) |
Household Vehicle Usage in Hanley Hills
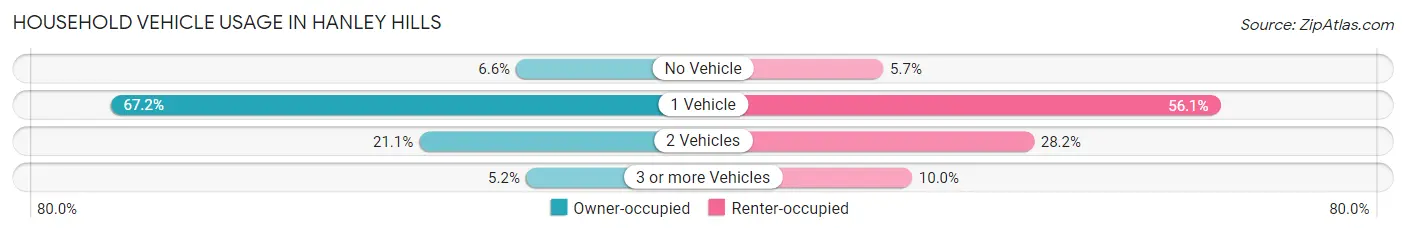
| Vehicles per Household | Owner-occupied | Renter-occupied |
| No Vehicle | 27 (6.6%) | 16 (5.7%) |
| 1 Vehicle | 274 (67.2%) | 157 (56.1%) |
| 2 Vehicles | 86 (21.1%) | 79 (28.2%) |
| 3 or more Vehicles | 21 (5.1%) | 28 (10.0%) |
| Total | 408 (100.0%) | 280 (100.0%) |
Real Estate & Mortgages in Hanley Hills
Real Estate and Mortgage Overview in Hanley Hills
| Characteristic | Without Mortgage | With Mortgage |
| Housing Units | 150 | 258 |
| Median Property Value | $48,400 | $76,800 |
| Median Household Income | $41,250 | $10 |
| Monthly Housing Costs | $386 | $0 |
| Real Estate Taxes | $1,248 | $12 |
Property Value by Mortgage Status in Hanley Hills
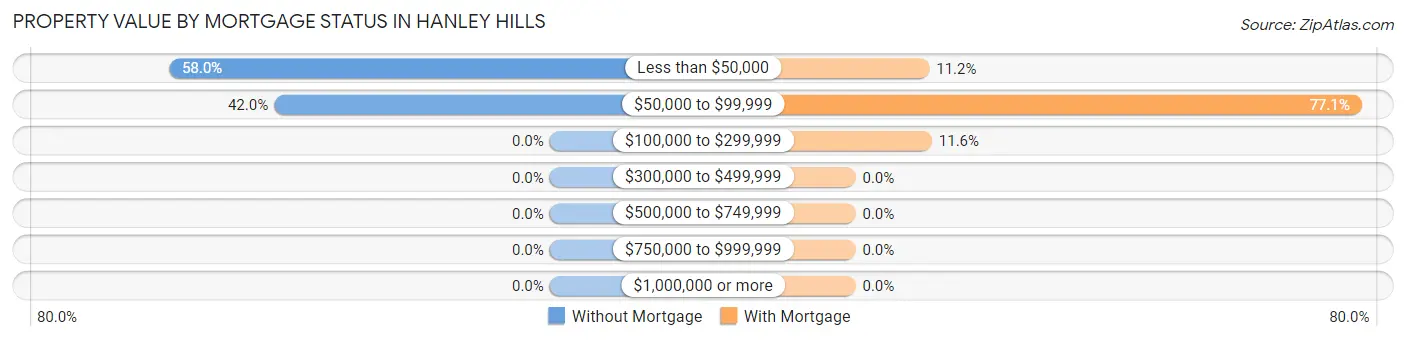
| Property Value | Without Mortgage | With Mortgage |
| Less than $50,000 | 87 (58.0%) | 29 (11.2%) |
| $50,000 to $99,999 | 63 (42.0%) | 199 (77.1%) |
| $100,000 to $299,999 | 0 (0.0%) | 30 (11.6%) |
| $300,000 to $499,999 | 0 (0.0%) | 0 (0.0%) |
| $500,000 to $749,999 | 0 (0.0%) | 0 (0.0%) |
| $750,000 to $999,999 | 0 (0.0%) | 0 (0.0%) |
| $1,000,000 or more | 0 (0.0%) | 0 (0.0%) |
| Total | 150 (100.0%) | 258 (100.0%) |
Household Income by Mortgage Status in Hanley Hills
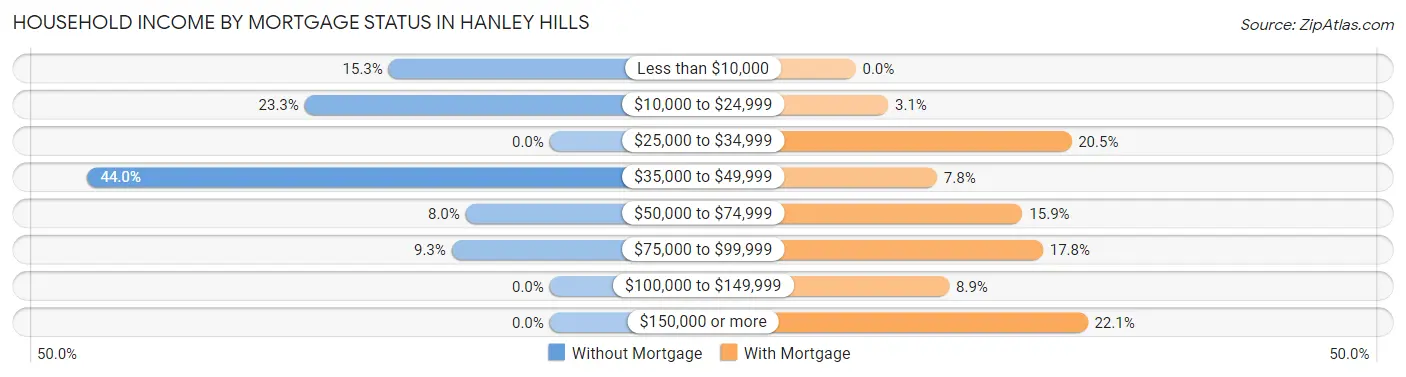
| Household Income | Without Mortgage | With Mortgage |
| Less than $10,000 | 23 (15.3%) | 0 (0.0%) |
| $10,000 to $24,999 | 35 (23.3%) | 8 (3.1%) |
| $25,000 to $34,999 | 0 (0.0%) | 53 (20.5%) |
| $35,000 to $49,999 | 66 (44.0%) | 20 (7.7%) |
| $50,000 to $74,999 | 12 (8.0%) | 41 (15.9%) |
| $75,000 to $99,999 | 14 (9.3%) | 46 (17.8%) |
| $100,000 to $149,999 | 0 (0.0%) | 23 (8.9%) |
| $150,000 or more | 0 (0.0%) | 57 (22.1%) |
| Total | 150 (100.0%) | 258 (100.0%) |
Property Value to Household Income Ratio in Hanley Hills
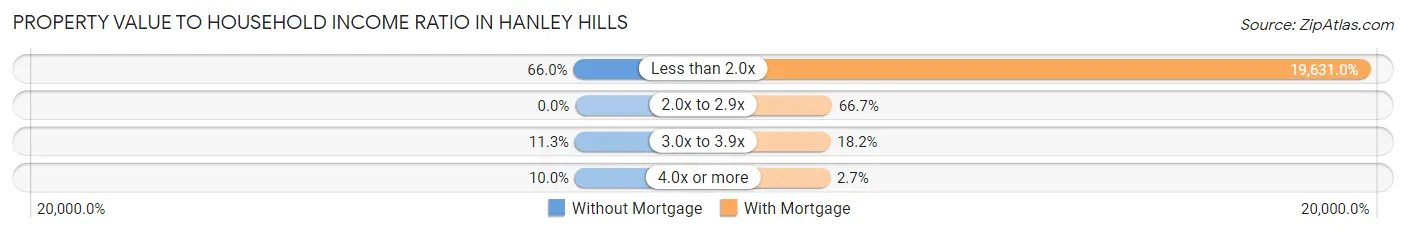
| Value-to-Income Ratio | Without Mortgage | With Mortgage |
| Less than 2.0x | 99 (66.0%) | 50,648 (19,631.0%) |
| 2.0x to 2.9x | 0 (0.0%) | 172 (66.7%) |
| 3.0x to 3.9x | 17 (11.3%) | 47 (18.2%) |
| 4.0x or more | 15 (10.0%) | 7 (2.7%) |
| Total | 150 (100.0%) | 258 (100.0%) |
Real Estate Taxes by Mortgage Status in Hanley Hills
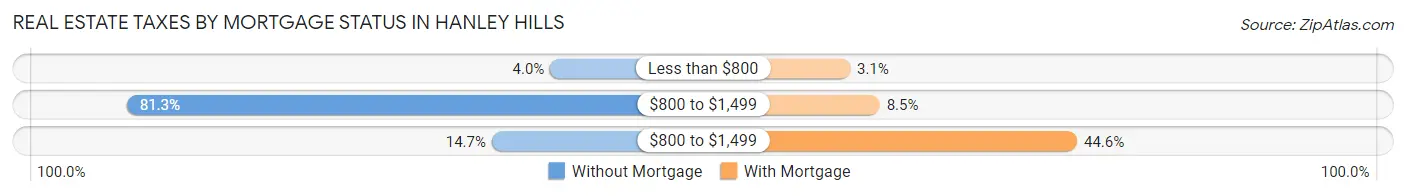
| Property Taxes | Without Mortgage | With Mortgage |
| Less than $800 | 6 (4.0%) | 8 (3.1%) |
| $800 to $1,499 | 122 (81.3%) | 22 (8.5%) |
| $800 to $1,499 | 22 (14.7%) | 115 (44.6%) |
| Total | 150 (100.0%) | 258 (100.0%) |
Health & Disability in Hanley Hills
Health Insurance Coverage by Age in Hanley Hills
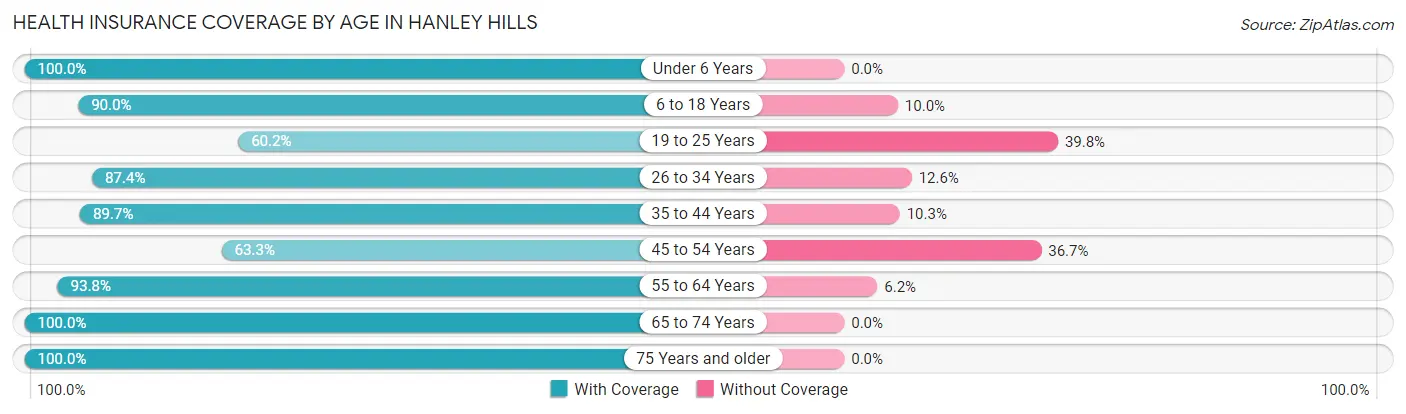
| Age Bracket | With Coverage | Without Coverage |
| Under 6 Years | 83 (100.0%) | 0 (0.0%) |
| 6 to 18 Years | 72 (90.0%) | 8 (10.0%) |
| 19 to 25 Years | 148 (60.2%) | 98 (39.8%) |
| 26 to 34 Years | 313 (87.4%) | 45 (12.6%) |
| 35 to 44 Years | 130 (89.7%) | 15 (10.3%) |
| 45 to 54 Years | 124 (63.3%) | 72 (36.7%) |
| 55 to 64 Years | 259 (93.8%) | 17 (6.2%) |
| 65 to 74 Years | 181 (100.0%) | 0 (0.0%) |
| 75 Years and older | 47 (100.0%) | 0 (0.0%) |
| Total | 1,357 (84.2%) | 255 (15.8%) |
Health Insurance Coverage by Citizenship Status in Hanley Hills
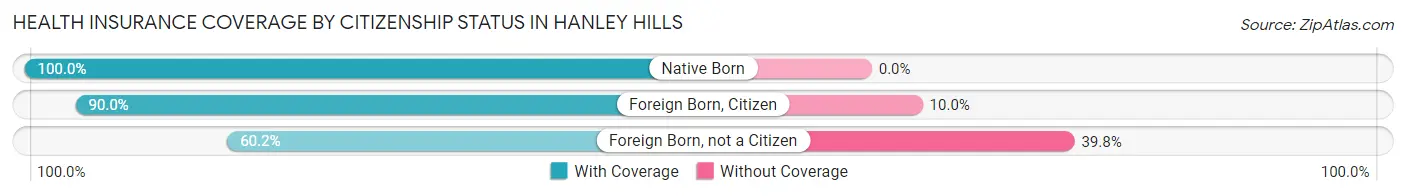
| Citizenship Status | With Coverage | Without Coverage |
| Native Born | 83 (100.0%) | 0 (0.0%) |
| Foreign Born, Citizen | 72 (90.0%) | 8 (10.0%) |
| Foreign Born, not a Citizen | 148 (60.2%) | 98 (39.8%) |
Health Insurance Coverage by Household Income in Hanley Hills
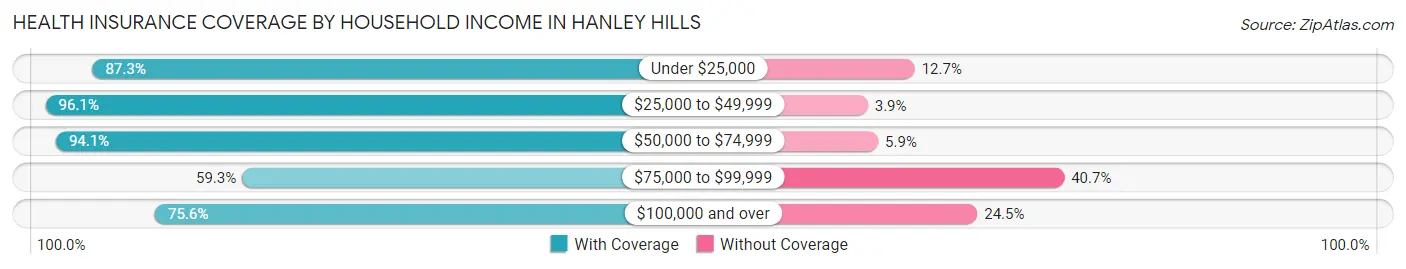
| Household Income | With Coverage | Without Coverage |
| Under $25,000 | 233 (87.3%) | 34 (12.7%) |
| $25,000 to $49,999 | 513 (96.1%) | 21 (3.9%) |
| $50,000 to $74,999 | 192 (94.1%) | 12 (5.9%) |
| $75,000 to $99,999 | 144 (59.3%) | 99 (40.7%) |
| $100,000 and over | 275 (75.5%) | 89 (24.4%) |
Public vs Private Health Insurance Coverage by Age in Hanley Hills
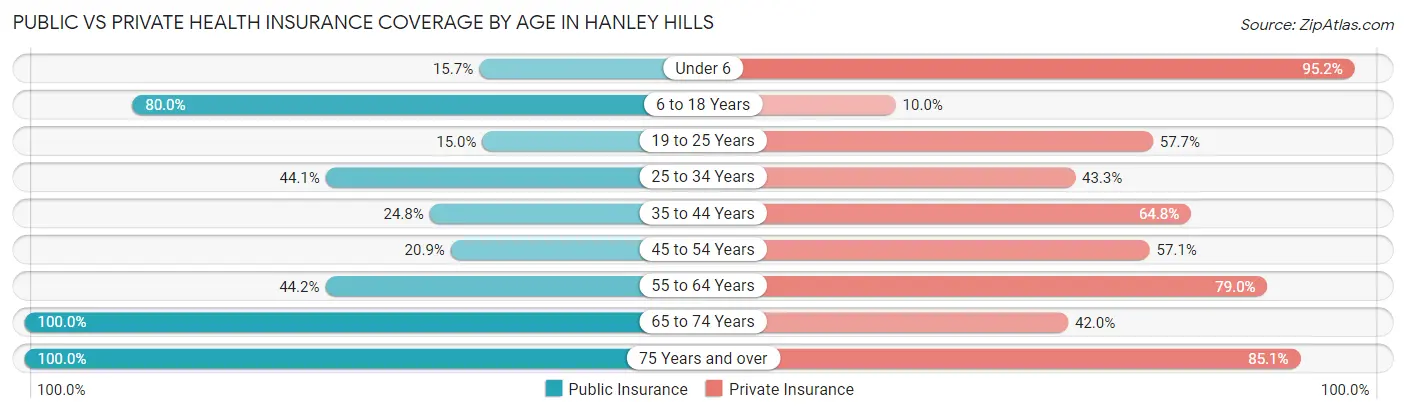
| Age Bracket | Public Insurance | Private Insurance |
| Under 6 | 13 (15.7%) | 79 (95.2%) |
| 6 to 18 Years | 64 (80.0%) | 8 (10.0%) |
| 19 to 25 Years | 37 (15.0%) | 142 (57.7%) |
| 25 to 34 Years | 158 (44.1%) | 155 (43.3%) |
| 35 to 44 Years | 36 (24.8%) | 94 (64.8%) |
| 45 to 54 Years | 41 (20.9%) | 112 (57.1%) |
| 55 to 64 Years | 122 (44.2%) | 218 (79.0%) |
| 65 to 74 Years | 181 (100.0%) | 76 (42.0%) |
| 75 Years and over | 47 (100.0%) | 40 (85.1%) |
| Total | 699 (43.4%) | 924 (57.3%) |
Disability Status by Sex by Age in Hanley Hills
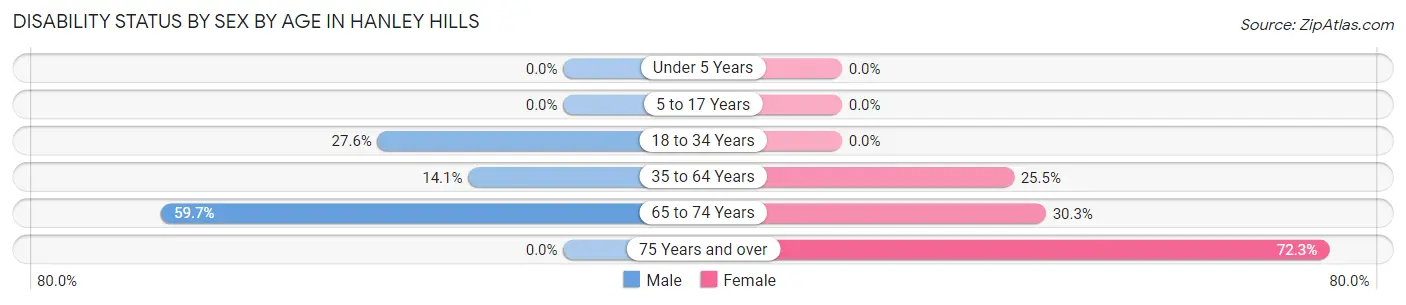
| Age Bracket | Male | Female |
| Under 5 Years | 0 (0.0%) | 0 (0.0%) |
| 5 to 17 Years | 0 (0.0%) | 0 (0.0%) |
| 18 to 34 Years | 102 (27.6%) | 0 (0.0%) |
| 35 to 64 Years | 34 (14.1%) | 96 (25.5%) |
| 65 to 74 Years | 43 (59.7%) | 33 (30.3%) |
| 75 Years and over | 0 (0.0%) | 34 (72.3%) |
Disability Class by Sex by Age in Hanley Hills
Disability Class: Hearing Difficulty
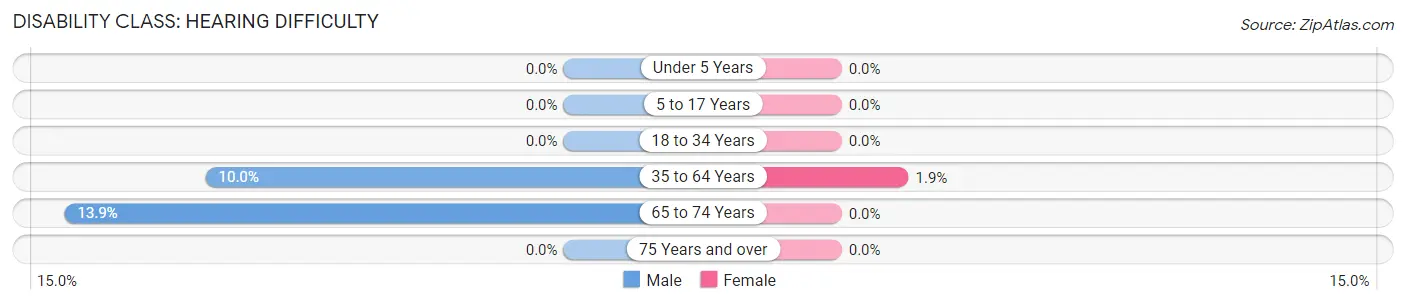
| Age Bracket | Male | Female |
| Under 5 Years | 0 (0.0%) | 0 (0.0%) |
| 5 to 17 Years | 0 (0.0%) | 0 (0.0%) |
| 18 to 34 Years | 0 (0.0%) | 0 (0.0%) |
| 35 to 64 Years | 24 (10.0%) | 7 (1.9%) |
| 65 to 74 Years | 10 (13.9%) | 0 (0.0%) |
| 75 Years and over | 0 (0.0%) | 0 (0.0%) |
Disability Class: Vision Difficulty
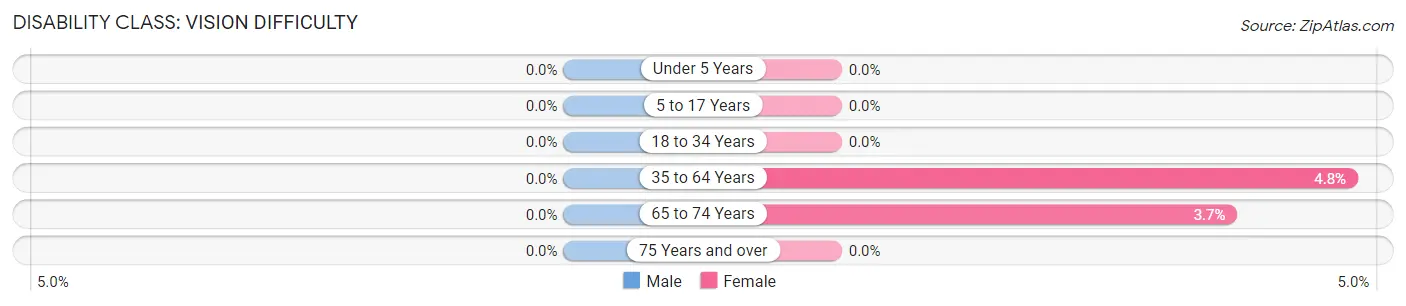
| Age Bracket | Male | Female |
| Under 5 Years | 0 (0.0%) | 0 (0.0%) |
| 5 to 17 Years | 0 (0.0%) | 0 (0.0%) |
| 18 to 34 Years | 0 (0.0%) | 0 (0.0%) |
| 35 to 64 Years | 0 (0.0%) | 18 (4.8%) |
| 65 to 74 Years | 0 (0.0%) | 4 (3.7%) |
| 75 Years and over | 0 (0.0%) | 0 (0.0%) |
Disability Class: Cognitive Difficulty
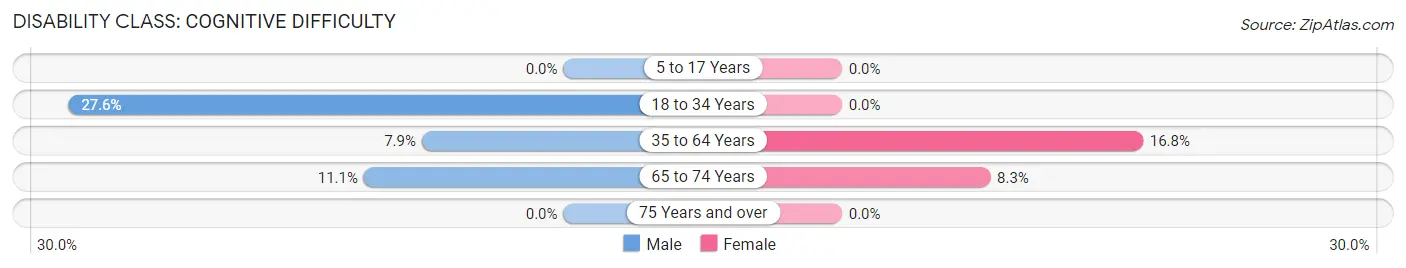
| Age Bracket | Male | Female |
| 5 to 17 Years | 0 (0.0%) | 0 (0.0%) |
| 18 to 34 Years | 102 (27.6%) | 0 (0.0%) |
| 35 to 64 Years | 19 (7.9%) | 63 (16.8%) |
| 65 to 74 Years | 8 (11.1%) | 9 (8.3%) |
| 75 Years and over | 0 (0.0%) | 0 (0.0%) |
Disability Class: Ambulatory Difficulty
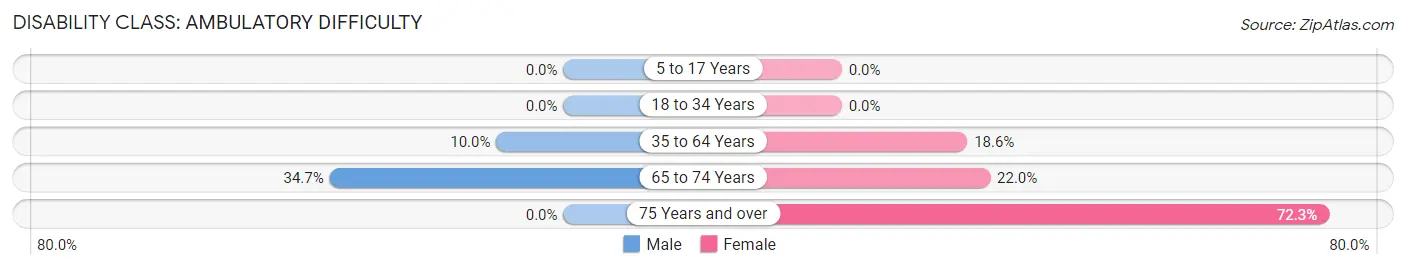
| Age Bracket | Male | Female |
| 5 to 17 Years | 0 (0.0%) | 0 (0.0%) |
| 18 to 34 Years | 0 (0.0%) | 0 (0.0%) |
| 35 to 64 Years | 24 (10.0%) | 70 (18.6%) |
| 65 to 74 Years | 25 (34.7%) | 24 (22.0%) |
| 75 Years and over | 0 (0.0%) | 34 (72.3%) |
Disability Class: Self-Care Difficulty
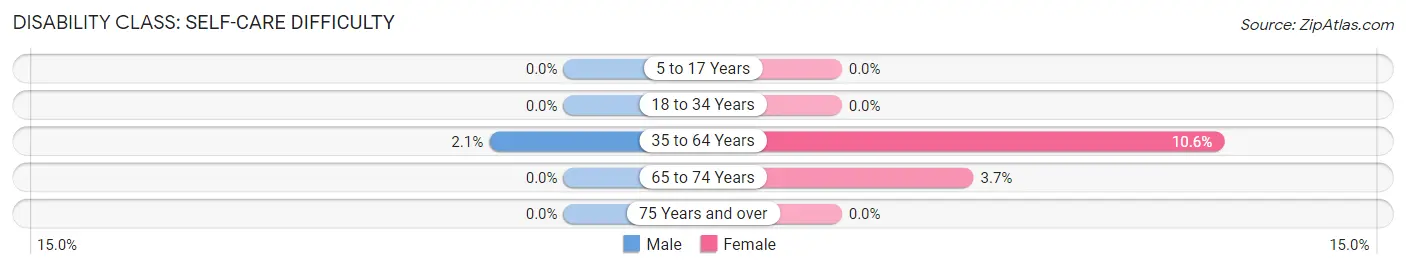
| Age Bracket | Male | Female |
| 5 to 17 Years | 0 (0.0%) | 0 (0.0%) |
| 18 to 34 Years | 0 (0.0%) | 0 (0.0%) |
| 35 to 64 Years | 5 (2.1%) | 40 (10.6%) |
| 65 to 74 Years | 0 (0.0%) | 4 (3.7%) |
| 75 Years and over | 0 (0.0%) | 0 (0.0%) |
Technology Access in Hanley Hills
Computing Device Access in Hanley Hills
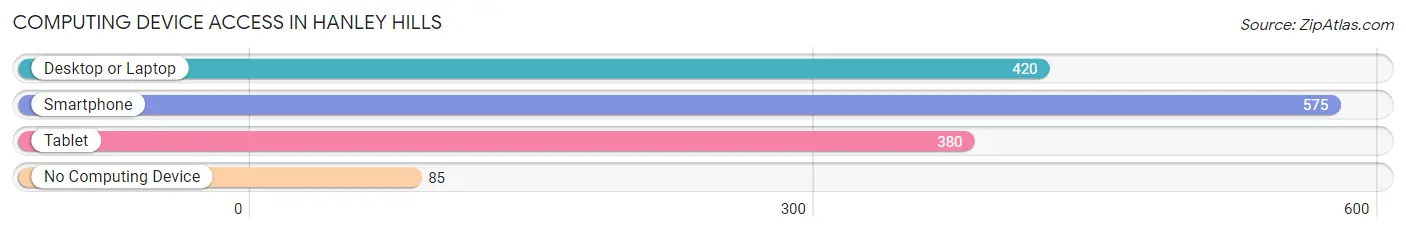
| Device Type | # Households | % Households |
| Desktop or Laptop | 420 | 61.1% |
| Smartphone | 575 | 83.6% |
| Tablet | 380 | 55.2% |
| No Computing Device | 85 | 12.3% |
| Total | 688 | 100.0% |
Internet Access in Hanley Hills
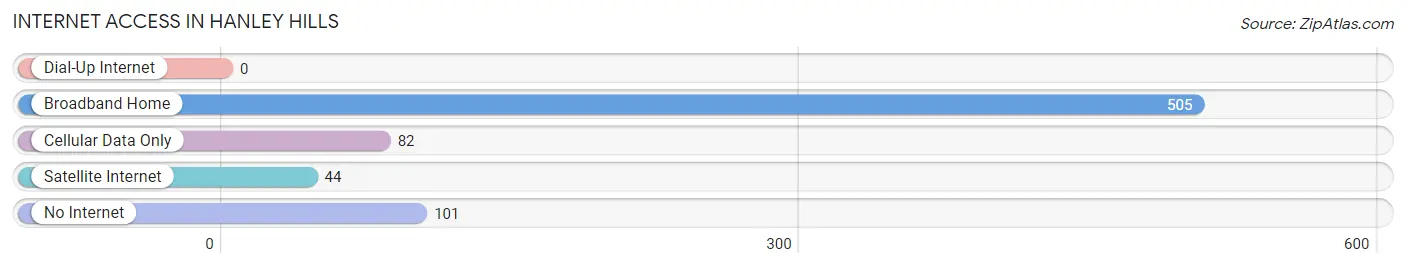
| Internet Type | # Households | % Households |
| Dial-Up Internet | 0 | 0.0% |
| Broadband Home | 505 | 73.4% |
| Cellular Data Only | 82 | 11.9% |
| Satellite Internet | 44 | 6.4% |
| No Internet | 101 | 14.7% |
| Total | 688 | 100.0% |
Hanley Hills Summary
Hanley Hills is a small city located in St. Louis County, Missouri. It is situated just north of the city of St. Louis and is part of the Greater St. Louis metropolitan area. The city was incorporated in 1947 and has a population of approximately 1,500 people.
Geography
Hanley Hills is located in the northern part of St. Louis County, Missouri. It is situated just north of the city of St. Louis and is part of the Greater St. Louis metropolitan area. The city is bordered by the cities of Berkeley, Ferguson, and Jennings. The city is located on a plateau that is approximately 500 feet above sea level. The city is located in the Missouri River Valley and is surrounded by rolling hills and wooded areas.
History
Hanley Hills was founded in 1947 by a group of developers who wanted to create a residential community in the northern part of St. Louis County. The city was named after the Hanley family, who were prominent landowners in the area. The city was incorporated in 1947 and has remained a small, residential community ever since.
Economy
The economy of Hanley Hills is largely based on the service industry. The city is home to a variety of small businesses, including restaurants, retail stores, and professional services. The city also has a few manufacturing companies, including a plastics factory and a printing company.
Demographics
As of the 2010 census, the population of Hanley Hills was 1,500 people. The racial makeup of the city was 79.2% White, 15.3% African American, 0.7% Native American, 0.7% Asian, and 3.9% from other races. The median household income was $45,000, and the median family income was $50,000.
Conclusion
Hanley Hills is a small city located in St. Louis County, Missouri. It is situated just north of the city of St. Louis and is part of the Greater St. Louis metropolitan area. The city was incorporated in 1947 and has a population of approximately 1,500 people. The economy of Hanley Hills is largely based on the service industry, and the city is home to a variety of small businesses. The racial makeup of the city is 79.2% White, 15.3% African American, 0.7% Native American, 0.7% Asian, and 3.9% from other races. The median household income was $45,000, and the median family income was $50,000.
Common Questions
What is the Total Population of Hanley Hills?
Total Population of Hanley Hills is 1,612.
What is the Total Male Population of Hanley Hills?
Total Male Population of Hanley Hills is 784.
What is the Total Female Population of Hanley Hills?
Total Female Population of Hanley Hills is 828.
What is the Ratio of Males per 100 Females in Hanley Hills?
There are 94.69 Males per 100 Females in Hanley Hills.
What is the Ratio of Females per 100 Males in Hanley Hills?
There are 105.61 Females per 100 Males in Hanley Hills.
What is the Median Population Age in Hanley Hills?
Median Population Age in Hanley Hills is 37.6 Years.
What is the Average Family Size in Hanley Hills
Average Family Size in Hanley Hills is 3.1 People.
What is the Average Household Size in Hanley Hills
Average Household Size in Hanley Hills is 2.3 People.
What is Per Capita Income in Hanley Hills?
Per Capita income in Hanley Hills is $26,807.
What is the Median Family Income in Hanley Hills?
Median Family Income in Hanley Hills is $56,563.
What is the Median Household income in Hanley Hills?
Median Household Income in Hanley Hills is $47,083.
What is Income or Wage Gap in Hanley Hills?
Income or Wage Gap in Hanley Hills is 3.1%.
Women in Hanley Hills earn 96.9 cents for every dollar earned by a man.
What is Inequality or Gini Index in Hanley Hills?
Inequality or Gini Index in Hanley Hills is 0.40.
How Large is the Labor Force in Hanley Hills?
There are 1,005 People in the Labor Forcein in Hanley Hills.
What is the Percentage of People in the Labor Force in Hanley Hills?
67.6% of People are in the Labor Force in Hanley Hills.
What is the Unemployment Rate in Hanley Hills?
Unemployment Rate in Hanley Hills is 6.3%.