Yonah, GA
Yonah Map
Yonah Overview
568
TOTAL POPULATION
376
MALE POPULATION
192
FEMALE POPULATION
195.83
MALES / 100 FEMALES
51.06
FEMALES / 100 MALES
36.7
MEDIAN AGE
4.3
AVG FAMILY SIZE
2.7
AVG HOUSEHOLD SIZE
$28,473
PER CAPITA INCOME
$98,310
AVG FAMILY INCOME
$58,580
AVG HOUSEHOLD INCOME
13.4%
WAGE / INCOME GAP [ % ]
86.6¢/ $1
WAGE / INCOME GAP [ $ ]
0.26
INEQUALITY / GINI INDEX
466
LABOR FORCE [ PEOPLE ]
82.0%
PERCENT IN LABOR FORCE
5.4%
UNEMPLOYMENT RATE
Race in Yonah
The most populous races in Yonah are White / Caucasian (568 | 100.0%), and Hispanic or Latino (62 | 10.9%).
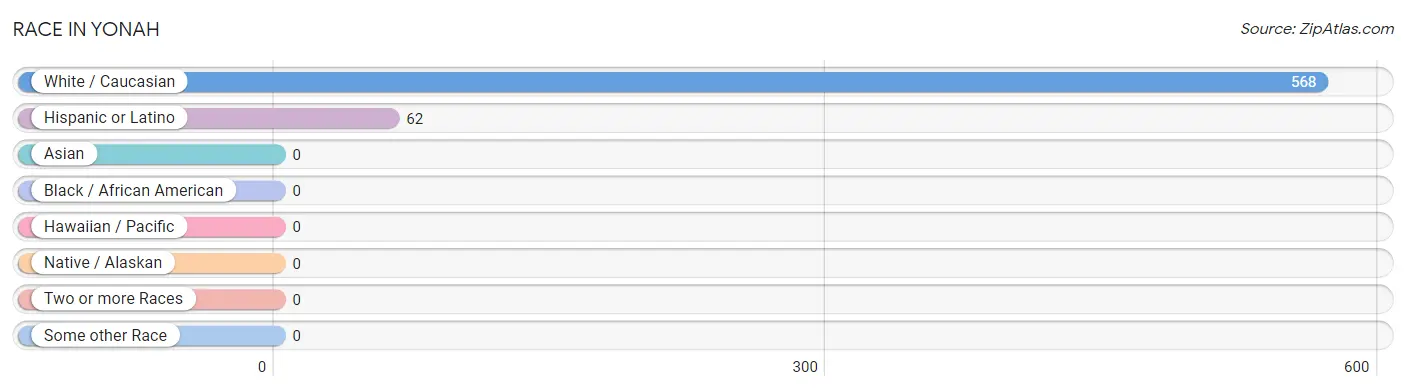
| Race | # Population | % Population |
| Asian | 0 | 0.0% |
| Black / African American | 0 | 0.0% |
| Hawaiian / Pacific | 0 | 0.0% |
| Hispanic or Latino | 62 | 10.9% |
| Native / Alaskan | 0 | 0.0% |
| White / Caucasian | 568 | 100.0% |
| Two or more Races | 0 | 0.0% |
| Some other Race | 0 | 0.0% |
| Total | 568 | 100.0% |
Ancestry in Yonah
The most populous ancestries reported in Yonah are English (122 | 21.5%), Peruvian (54 | 9.5%), South American (54 | 9.5%), Polish (44 | 7.7%), and German (39 | 6.9%), together accounting for 55.1% of all Yonah residents.
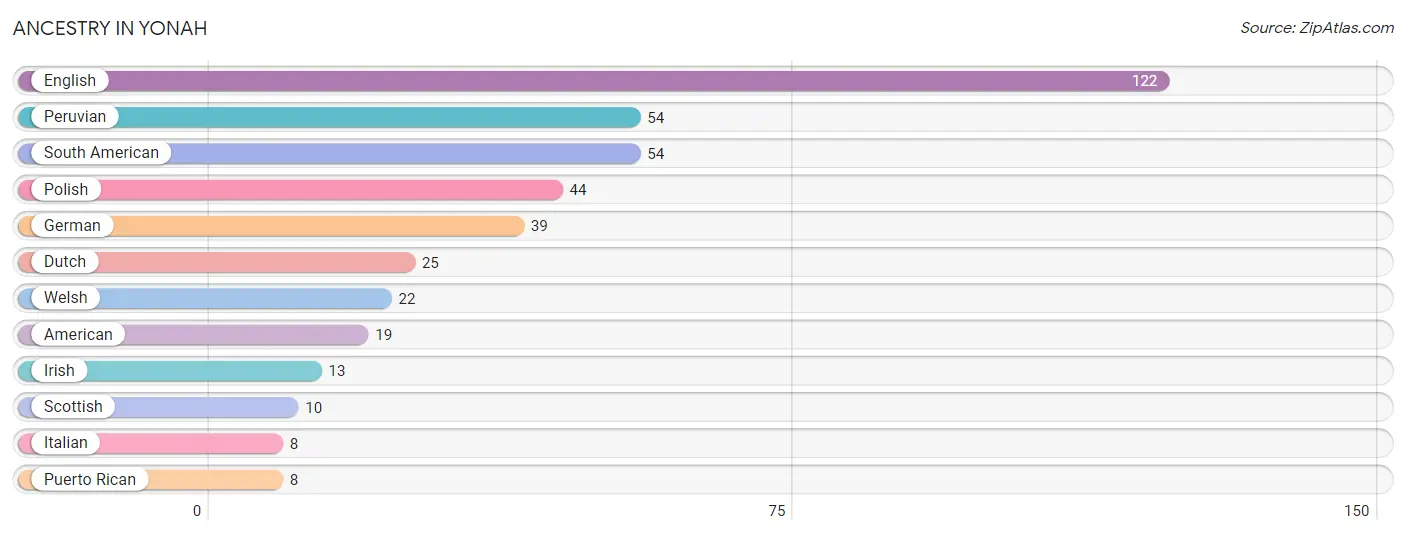
| Ancestry | # Population | % Population |
| American | 19 | 3.4% |
| Dutch | 25 | 4.4% |
| English | 122 | 21.5% |
| German | 39 | 6.9% |
| Irish | 13 | 2.3% |
| Italian | 8 | 1.4% |
| Peruvian | 54 | 9.5% |
| Polish | 44 | 7.7% |
| Puerto Rican | 8 | 1.4% |
| Scottish | 10 | 1.8% |
| South American | 54 | 9.5% |
| Welsh | 22 | 3.9% | View All 12 Rows |
Immigrants in Yonah
The most numerous immigrant groups reported in Yonah came from Latin America (54 | 9.5%), Peru (54 | 9.5%), and South America (54 | 9.5%), together accounting for 28.5% of all Yonah residents.
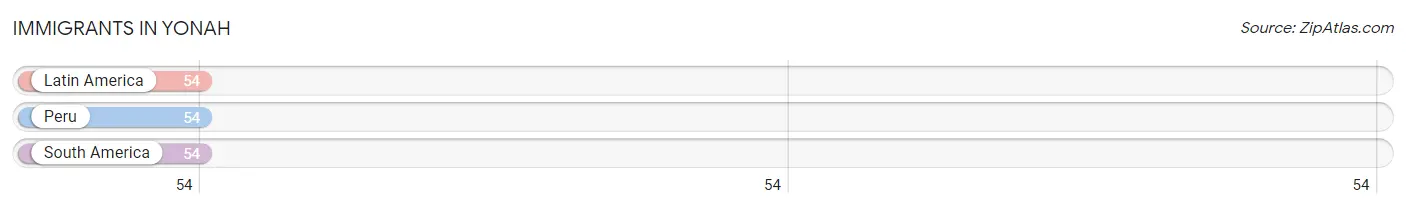
| Immigration Origin | # Population | % Population |
| Latin America | 54 | 9.5% |
| Peru | 54 | 9.5% |
| South America | 54 | 9.5% | View All 3 Rows |
Sex and Age in Yonah
Sex and Age in Yonah
The most populous age groups in Yonah are 20 to 24 Years (157 | 41.8%) for men and 45 to 49 Years (54 | 28.1%) for women.
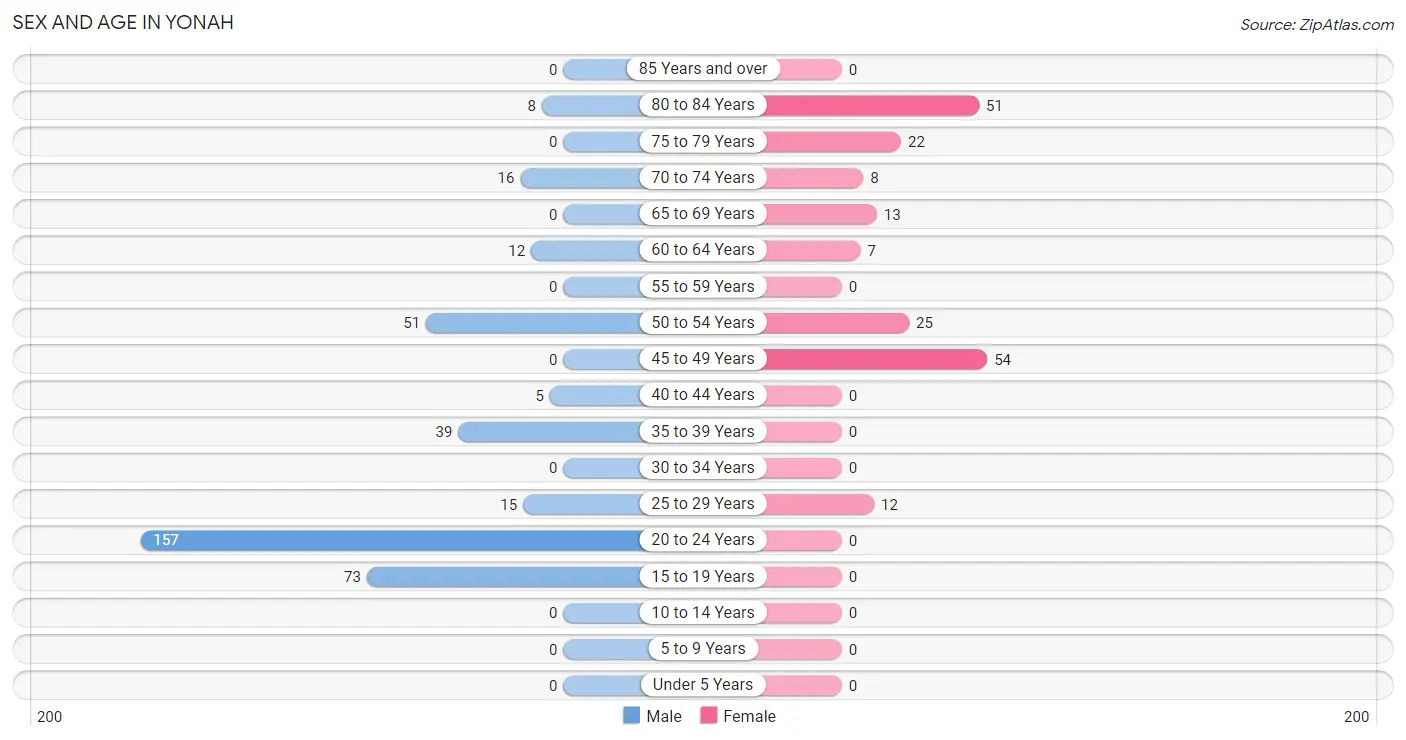
| Age Bracket | Male | Female |
| Under 5 Years | 0 (0.0%) | 0 (0.0%) |
| 5 to 9 Years | 0 (0.0%) | 0 (0.0%) |
| 10 to 14 Years | 0 (0.0%) | 0 (0.0%) |
| 15 to 19 Years | 73 (19.4%) | 0 (0.0%) |
| 20 to 24 Years | 157 (41.8%) | 0 (0.0%) |
| 25 to 29 Years | 15 (4.0%) | 12 (6.2%) |
| 30 to 34 Years | 0 (0.0%) | 0 (0.0%) |
| 35 to 39 Years | 39 (10.4%) | 0 (0.0%) |
| 40 to 44 Years | 5 (1.3%) | 0 (0.0%) |
| 45 to 49 Years | 0 (0.0%) | 54 (28.1%) |
| 50 to 54 Years | 51 (13.6%) | 25 (13.0%) |
| 55 to 59 Years | 0 (0.0%) | 0 (0.0%) |
| 60 to 64 Years | 12 (3.2%) | 7 (3.6%) |
| 65 to 69 Years | 0 (0.0%) | 13 (6.8%) |
| 70 to 74 Years | 16 (4.3%) | 8 (4.2%) |
| 75 to 79 Years | 0 (0.0%) | 22 (11.5%) |
| 80 to 84 Years | 8 (2.1%) | 51 (26.6%) |
| 85 Years and over | 0 (0.0%) | 0 (0.0%) |
| Total | 376 (100.0%) | 192 (100.0%) |
Families and Households in Yonah
Median Family Size in Yonah
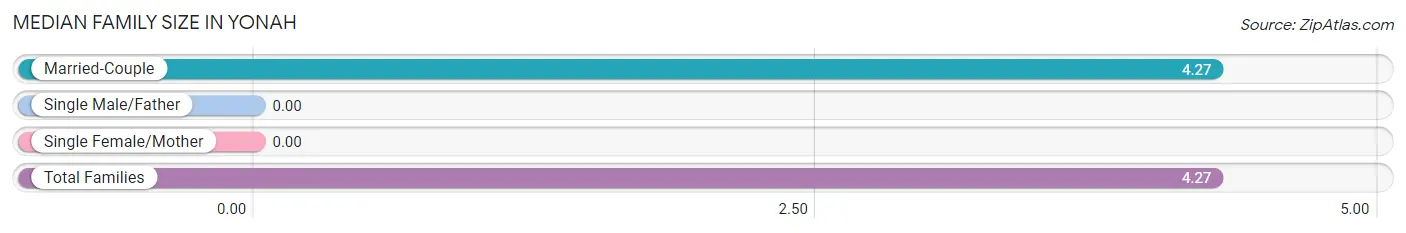
| Family Type | # Families | Family Size |
| Married-Couple | 97 (100.0%) | 4.27 |
| Single Male/Father | 0 (0.0%) | - |
| Single Female/Mother | 0 (0.0%) | - |
| Total Families | 97 (100.0%) | 4.27 |
Median Household Size in Yonah
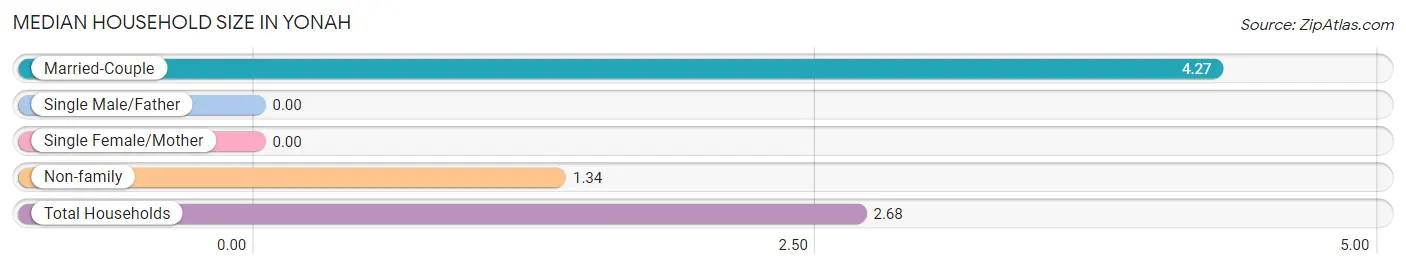
| Household Type | # Households | Household Size |
| Married-Couple | 97 (45.8%) | 4.27 |
| Single Male/Father | 0 (0.0%) | - |
| Single Female/Mother | 0 (0.0%) | - |
| Non-family | 115 (54.2%) | 1.34 |
| Total Households | 212 (100.0%) | 2.68 |
Household Size by Marriage Status in Yonah
Out of a total of 212 households in Yonah, 97 (45.8%) are family households, while 115 (54.2%) are nonfamily households. The most numerous type of family households are 4-person households, comprising 54, and the most common type of nonfamily households are 1-person households, comprising 90.
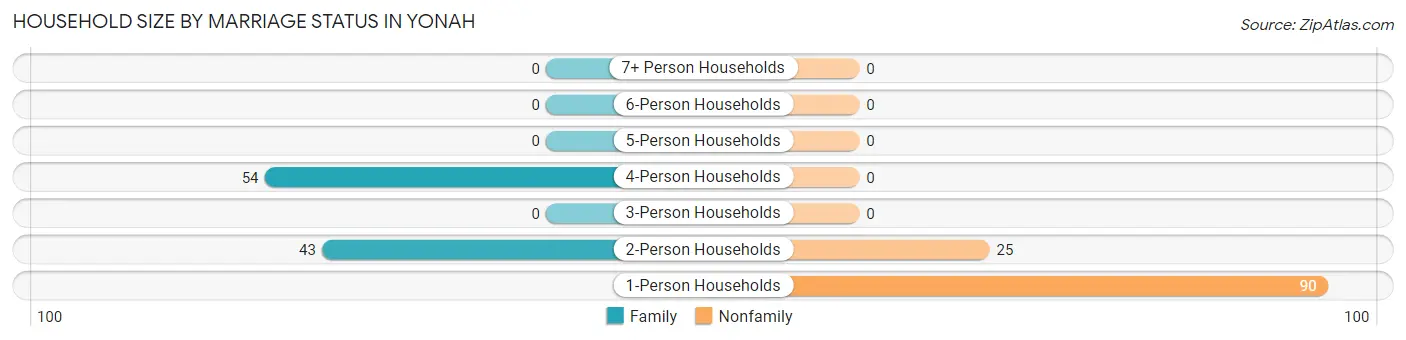
| Household Size | Family Households | Nonfamily Households |
| 1-Person Households | - | 90 (42.4%) |
| 2-Person Households | 43 (20.3%) | 25 (11.8%) |
| 3-Person Households | 0 (0.0%) | 0 (0.0%) |
| 4-Person Households | 54 (25.5%) | 0 (0.0%) |
| 5-Person Households | 0 (0.0%) | 0 (0.0%) |
| 6-Person Households | 0 (0.0%) | 0 (0.0%) |
| 7+ Person Households | 0 (0.0%) | 0 (0.0%) |
| Total | 97 (45.8%) | 115 (54.2%) |
Female Fertility in Yonah
Fertility by Age in Yonah
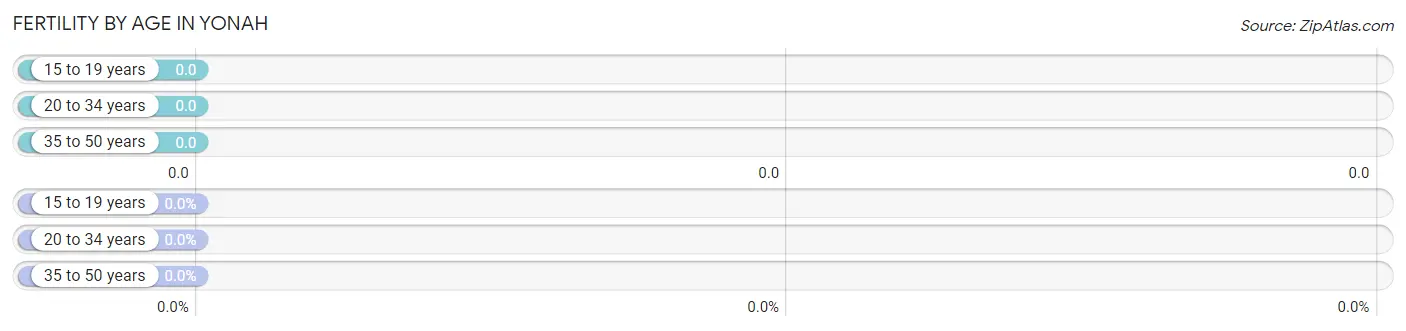
| Age Bracket | Women with Births | Births / 1,000 Women |
| 15 to 19 years | 0 (0.0%) | 0.0 |
| 20 to 34 years | 0 (0.0%) | 0.0 |
| 35 to 50 years | 0 (0.0%) | 0.0 |
| Total | 0 (0.0%) | 0.0 |
Fertility by Age by Marriage Status in Yonah
| Age Bracket | Married | Unmarried |
| 15 to 19 years | 0 (0.0%) | 0 (0.0%) |
| 20 to 34 years | 0 (0.0%) | 0 (0.0%) |
| 35 to 50 years | 0 (0.0%) | 0 (0.0%) |
| Total | 0 (0.0%) | 0 (0.0%) |
Fertility by Education in Yonah
| Educational Attainment | Women with Births | Births / 1,000 Women |
| Less than High School | 0 (0.0%) | 0.0 |
| High School Diploma | 0 (0.0%) | 0.0 |
| College or Associate's Degree | 0 (0.0%) | 0.0 |
| Bachelor's Degree | 0 (0.0%) | 0.0 |
| Graduate Degree | 0 (0.0%) | 0.0 |
| Total | 0 (0.0%) | 0.0 |
Fertility by Education by Marriage Status in Yonah
| Educational Attainment | Married | Unmarried |
| Less than High School | 0 (0.0%) | 0 (0.0%) |
| High School Diploma | 0 (0.0%) | 0 (0.0%) |
| College or Associate's Degree | 0 (0.0%) | 0 (0.0%) |
| Bachelor's Degree | 0 (0.0%) | 0 (0.0%) |
| Graduate Degree | 0 (0.0%) | 0 (0.0%) |
| Total | 0 (0.0%) | 0 (0.0%) |
Income in Yonah
Income Overview in Yonah
Per Capita Income in Yonah is $28,473, while median incomes of families and households are $98,310 and $58,580 respectively.
| Characteristic | Number | Measure |
| Per Capita Income | 568 | $28,473 |
| Median Family Income | 97 | $98,310 |
| Mean Family Income | 97 | $85,081 |
| Median Household Income | 212 | $58,580 |
| Mean Household Income | 212 | $62,627 |
| Income Deficit | 97 | $0 |
| Wage / Income Gap (%) | 568 | 13.36% |
| Wage / Income Gap ($) | 568 | 86.64¢ per $1 |
| Gini / Inequality Index | 568 | 0.26 |
Earnings by Sex in Yonah
Average Earnings in Yonah are $24,212, $23,965 for men and $27,662 for women, a difference of 13.4%.
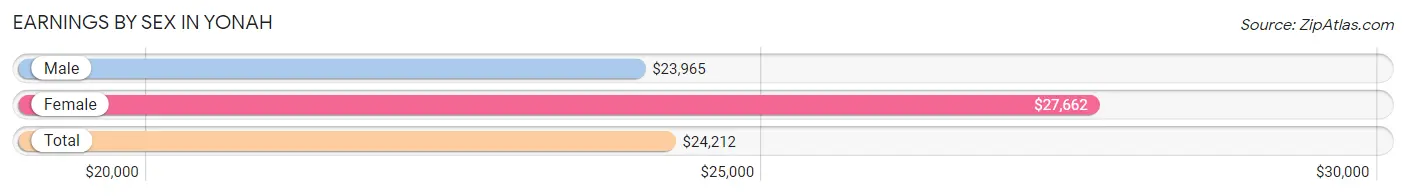
| Sex | Number | Average Earnings |
| Male | 350 (77.6%) | $23,965 |
| Female | 101 (22.4%) | $27,662 |
| Total | 451 (100.0%) | $24,212 |
Earnings by Sex by Income Bracket in Yonah
The most common earnings brackets in Yonah are $22,500 to $24,999 for men (157 | 44.9%) and $25,000 to $29,999 for women (66 | 65.3%).
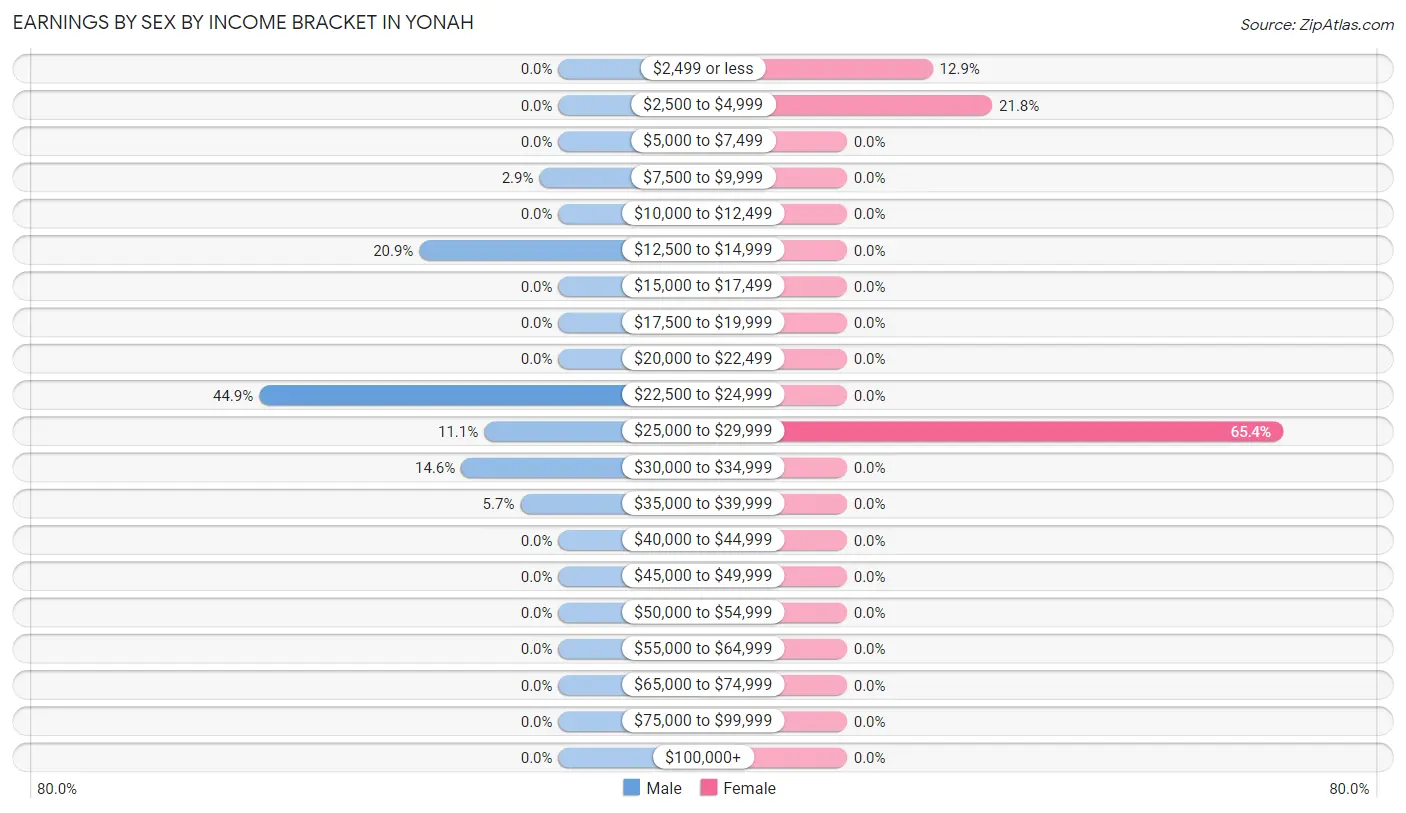
| Income | Male | Female |
| $2,499 or less | 0 (0.0%) | 13 (12.9%) |
| $2,500 to $4,999 | 0 (0.0%) | 22 (21.8%) |
| $5,000 to $7,499 | 0 (0.0%) | 0 (0.0%) |
| $7,500 to $9,999 | 10 (2.9%) | 0 (0.0%) |
| $10,000 to $12,499 | 0 (0.0%) | 0 (0.0%) |
| $12,500 to $14,999 | 73 (20.9%) | 0 (0.0%) |
| $15,000 to $17,499 | 0 (0.0%) | 0 (0.0%) |
| $17,500 to $19,999 | 0 (0.0%) | 0 (0.0%) |
| $20,000 to $22,499 | 0 (0.0%) | 0 (0.0%) |
| $22,500 to $24,999 | 157 (44.9%) | 0 (0.0%) |
| $25,000 to $29,999 | 39 (11.1%) | 66 (65.3%) |
| $30,000 to $34,999 | 51 (14.6%) | 0 (0.0%) |
| $35,000 to $39,999 | 20 (5.7%) | 0 (0.0%) |
| $40,000 to $44,999 | 0 (0.0%) | 0 (0.0%) |
| $45,000 to $49,999 | 0 (0.0%) | 0 (0.0%) |
| $50,000 to $54,999 | 0 (0.0%) | 0 (0.0%) |
| $55,000 to $64,999 | 0 (0.0%) | 0 (0.0%) |
| $65,000 to $74,999 | 0 (0.0%) | 0 (0.0%) |
| $75,000 to $99,999 | 0 (0.0%) | 0 (0.0%) |
| $100,000+ | 0 (0.0%) | 0 (0.0%) |
| Total | 350 (100.0%) | 101 (100.0%) |
Earnings by Sex by Educational Attainment in Yonah
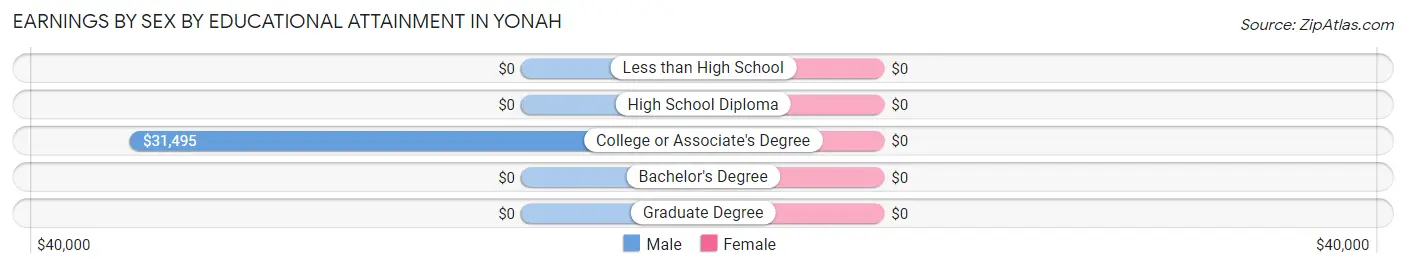
| Educational Attainment | Male Income | Female Income |
| Less than High School | - | - |
| High School Diploma | - | - |
| College or Associate's Degree | $31,495 | $0 |
| Bachelor's Degree | - | - |
| Graduate Degree | - | - |
| Total | $30,539 | $27,662 |
Family Income in Yonah
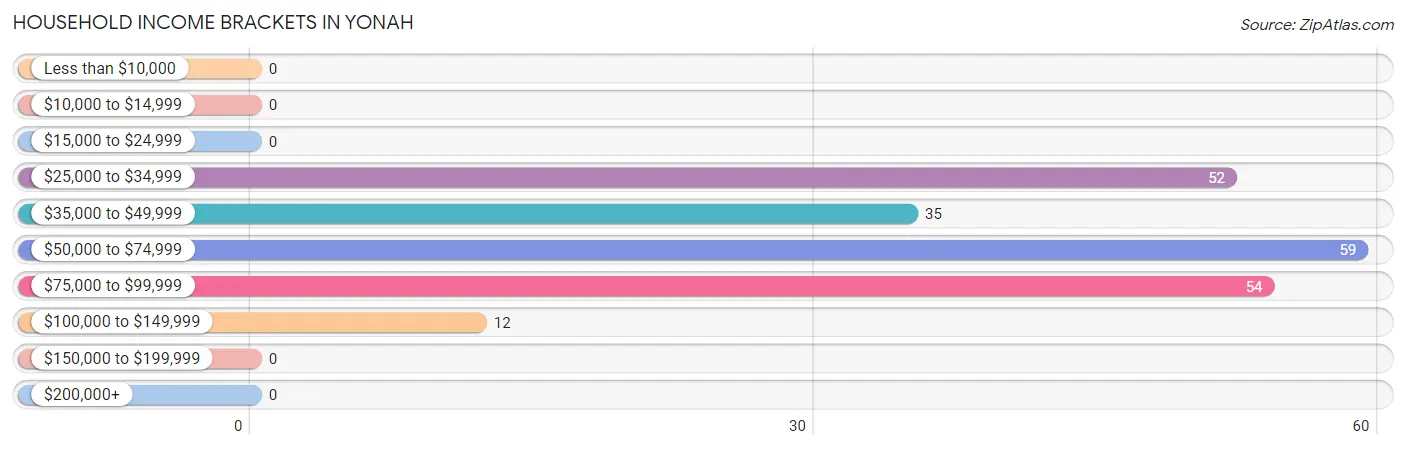
Family Income Brackets in Yonah
According to the Yonah family income data, there are 54 families falling into the $75,000 to $99,999 income range, which is the most common income bracket and makes up 55.7% of all families.
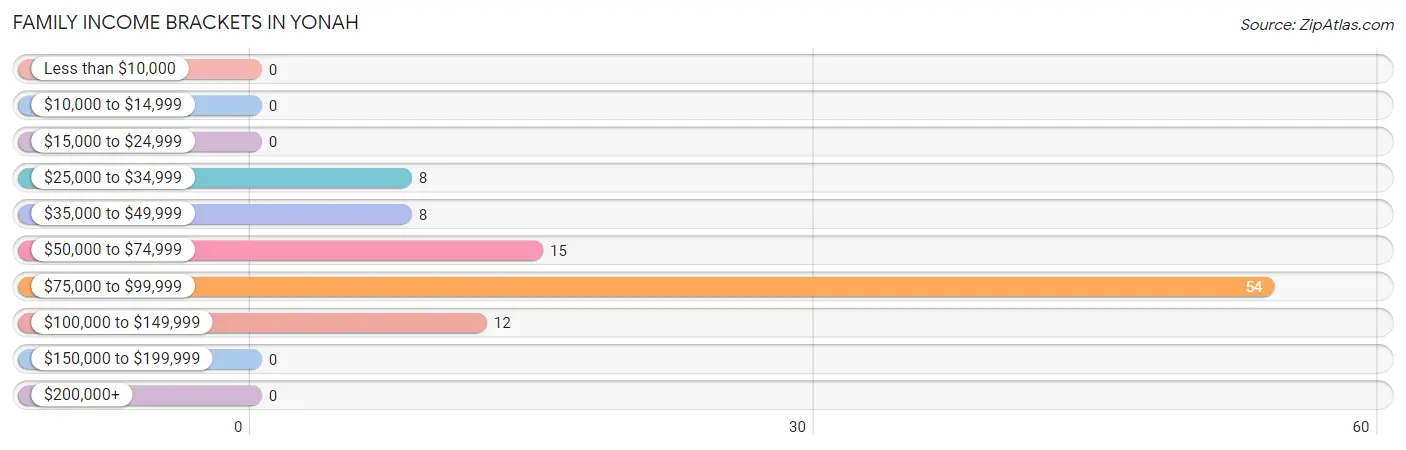
| Income Bracket | # Families | % Families |
| Less than $10,000 | 0 | 0.0% |
| $10,000 to $14,999 | 0 | 0.0% |
| $15,000 to $24,999 | 0 | 0.0% |
| $25,000 to $34,999 | 8 | 8.2% |
| $35,000 to $49,999 | 8 | 8.2% |
| $50,000 to $74,999 | 15 | 15.5% |
| $75,000 to $99,999 | 54 | 55.7% |
| $100,000 to $149,999 | 12 | 12.4% |
| $150,000 to $199,999 | 0 | 0.0% |
| $200,000+ | 0 | 0.0% |
Family Income by Famaliy Size in Yonah
2-person families (43 | 44.3%) account for the highest median family income in Yonah with $63,417 per family, while 2-person families (43 | 44.3%) have the highest median income of $31,708 per family member.
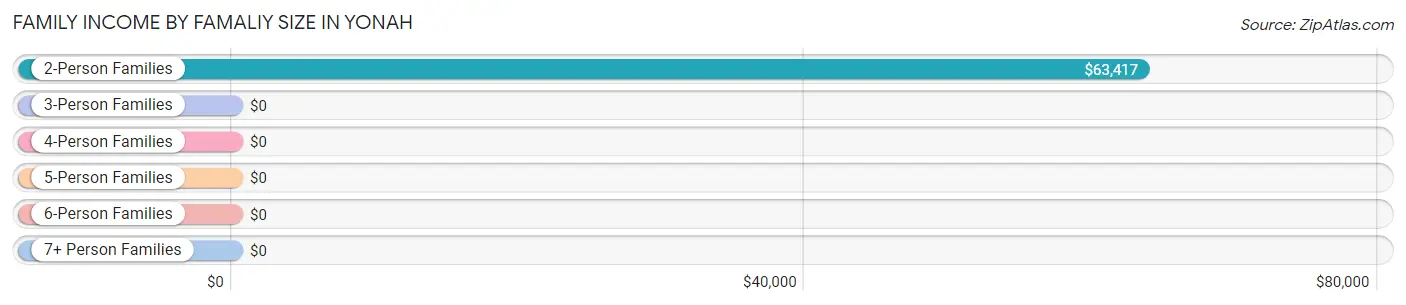
| Income Bracket | # Families | Median Income |
| 2-Person Families | 43 (44.3%) | $63,417 |
| 3-Person Families | 0 (0.0%) | $0 |
| 4-Person Families | 54 (55.7%) | $0 |
| 5-Person Families | 0 (0.0%) | $0 |
| 6-Person Families | 0 (0.0%) | $0 |
| 7+ Person Families | 0 (0.0%) | $0 |
| Total | 97 (100.0%) | $98,310 |
Family Income by Number of Earners in Yonah
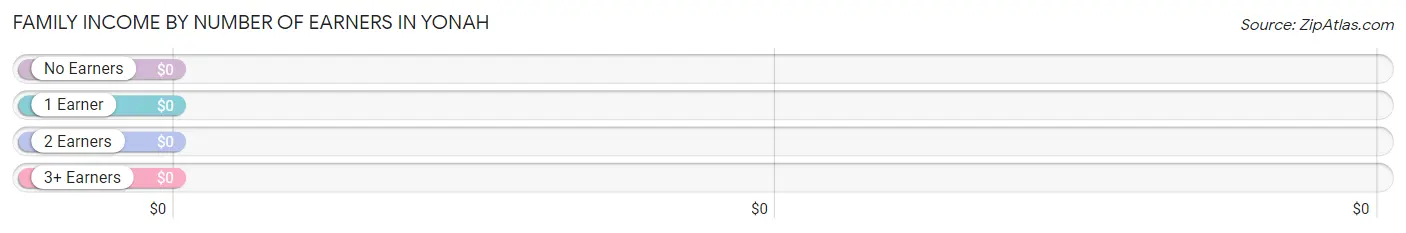
| Number of Earners | # Families | Median Income |
| No Earners | 20 (20.6%) | $0 |
| 1 Earner | 8 (8.3%) | $0 |
| 2 Earners | 15 (15.5%) | $0 |
| 3+ Earners | 54 (55.7%) | $0 |
| Total | 97 (100.0%) | $98,310 |
Household Income in Yonah
Household Income Brackets in Yonah
With 59 households falling in the category, the $50,000 to $74,999 income range is the most frequent in Yonah, accounting for 27.8% of all households.
| Income Bracket | # Households | % Households |
| Less than $10,000 | 0 | 0.0% |
| $10,000 to $14,999 | 0 | 0.0% |
| $15,000 to $24,999 | 0 | 0.0% |
| $25,000 to $34,999 | 52 | 24.5% |
| $35,000 to $49,999 | 35 | 16.5% |
| $50,000 to $74,999 | 59 | 27.8% |
| $75,000 to $99,999 | 54 | 25.5% |
| $100,000 to $149,999 | 12 | 5.7% |
| $150,000 to $199,999 | 0 | 0.0% |
| $200,000+ | 0 | 0.0% |
Household Income by Householder Age in Yonah
The median household income in Yonah is $58,580, with the highest median household income of $98,449 found in the 45 to 64 years age bracket for the primary householder. A total of 91 households (42.9%) fall into this category.
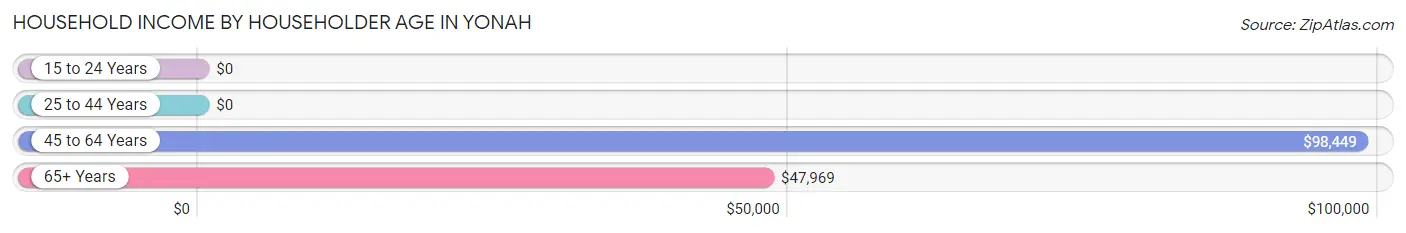
| Income Bracket | # Households | Median Income |
| 15 to 24 Years | 0 (0.0%) | $0 |
| 25 to 44 Years | 20 (9.4%) | $0 |
| 45 to 64 Years | 91 (42.9%) | $98,449 |
| 65+ Years | 101 (47.6%) | $47,969 |
| Total | 212 (100.0%) | $58,580 |
Poverty in Yonah
Income Below Poverty by Sex and Age in Yonah
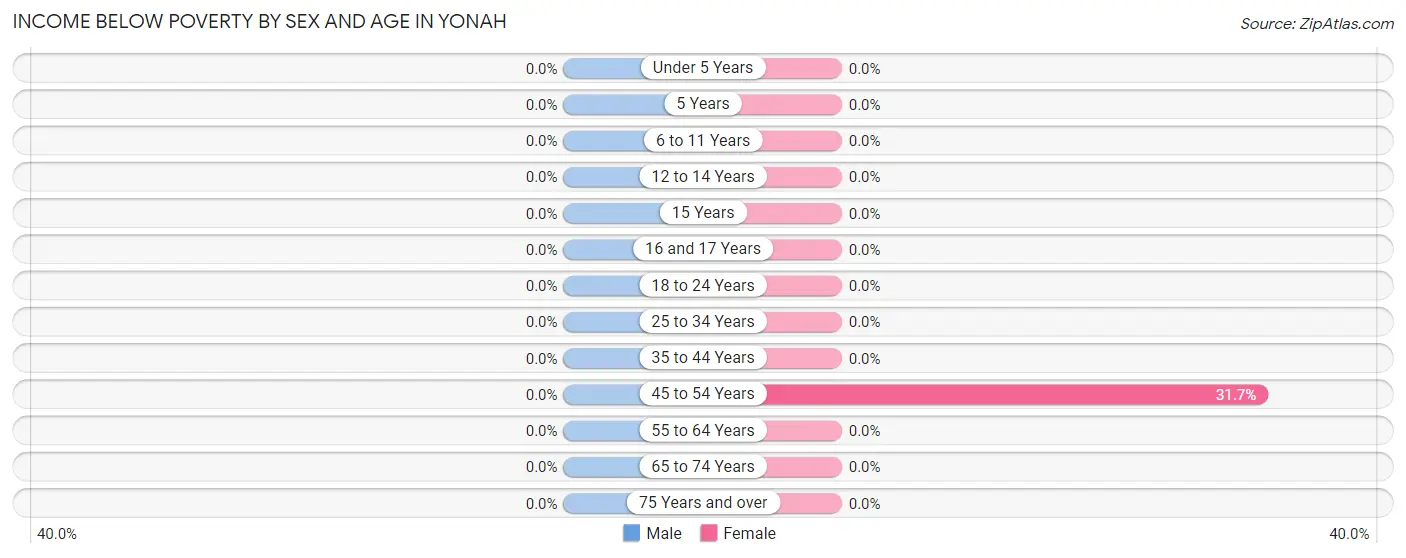
| Age Bracket | Male | Female |
| Under 5 Years | 0 (0.0%) | 0 (0.0%) |
| 5 Years | 0 (0.0%) | 0 (0.0%) |
| 6 to 11 Years | 0 (0.0%) | 0 (0.0%) |
| 12 to 14 Years | 0 (0.0%) | 0 (0.0%) |
| 15 Years | 0 (0.0%) | 0 (0.0%) |
| 16 and 17 Years | 0 (0.0%) | 0 (0.0%) |
| 18 to 24 Years | 0 (0.0%) | 0 (0.0%) |
| 25 to 34 Years | 0 (0.0%) | 0 (0.0%) |
| 35 to 44 Years | 0 (0.0%) | 0 (0.0%) |
| 45 to 54 Years | 0 (0.0%) | 25 (31.7%) |
| 55 to 64 Years | 0 (0.0%) | 0 (0.0%) |
| 65 to 74 Years | 0 (0.0%) | 0 (0.0%) |
| 75 Years and over | 0 (0.0%) | 0 (0.0%) |
| Total | 0 (0.0%) | 25 (13.0%) |
Income Above Poverty by Sex and Age in Yonah
According to the poverty statistics in Yonah, males aged 18 to 24 years and females aged 25 to 34 years are the age groups that are most secure financially, with 100.0% of males and 100.0% of females in these age groups living above the poverty line.
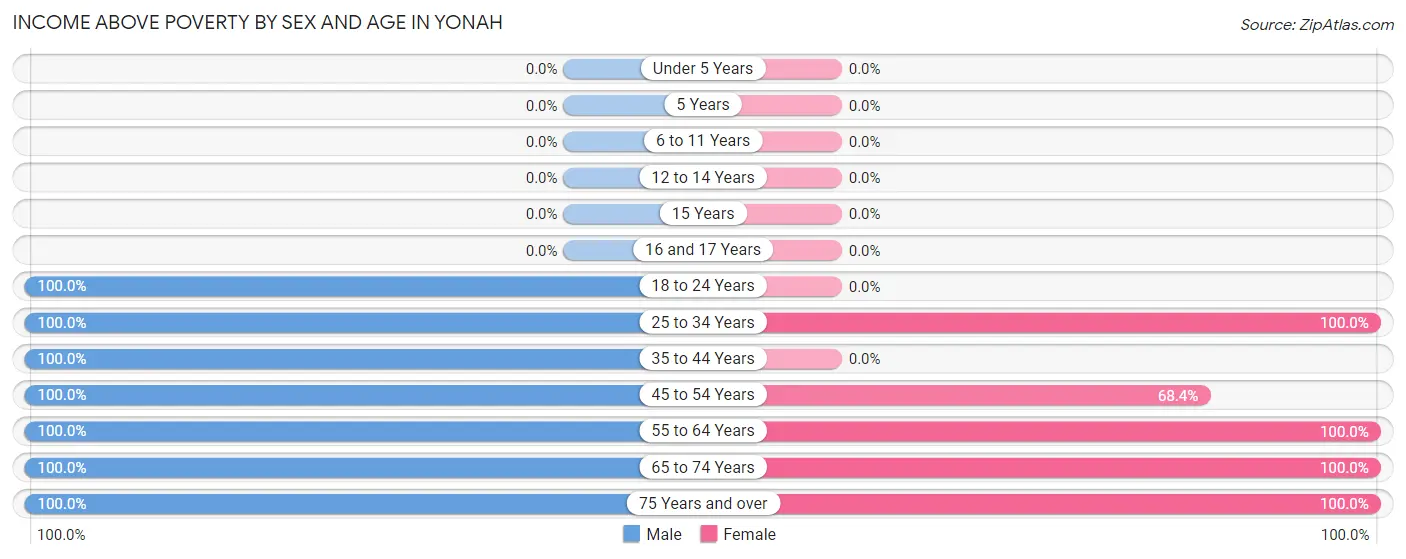
| Age Bracket | Male | Female |
| Under 5 Years | 0 (0.0%) | 0 (0.0%) |
| 5 Years | 0 (0.0%) | 0 (0.0%) |
| 6 to 11 Years | 0 (0.0%) | 0 (0.0%) |
| 12 to 14 Years | 0 (0.0%) | 0 (0.0%) |
| 15 Years | 0 (0.0%) | 0 (0.0%) |
| 16 and 17 Years | 0 (0.0%) | 0 (0.0%) |
| 18 to 24 Years | 230 (100.0%) | 0 (0.0%) |
| 25 to 34 Years | 15 (100.0%) | 12 (100.0%) |
| 35 to 44 Years | 44 (100.0%) | 0 (0.0%) |
| 45 to 54 Years | 51 (100.0%) | 54 (68.3%) |
| 55 to 64 Years | 12 (100.0%) | 7 (100.0%) |
| 65 to 74 Years | 16 (100.0%) | 21 (100.0%) |
| 75 Years and over | 8 (100.0%) | 73 (100.0%) |
| Total | 376 (100.0%) | 167 (87.0%) |
Income Below Poverty Among Married-Couple Families in Yonah
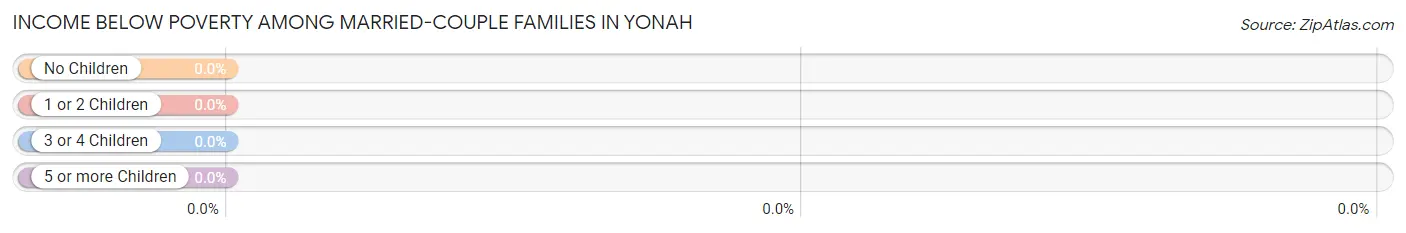
| Children | Above Poverty | Below Poverty |
| No Children | 97 (100.0%) | 0 (0.0%) |
| 1 or 2 Children | 0 (0.0%) | 0 (0.0%) |
| 3 or 4 Children | 0 (0.0%) | 0 (0.0%) |
| 5 or more Children | 0 (0.0%) | 0 (0.0%) |
| Total | 97 (100.0%) | 0 (0.0%) |
Income Below Poverty Among Single-Parent Households in Yonah
| Children | Single Father | Single Mother |
| No Children | 0 (0.0%) | 0 (0.0%) |
| 1 or 2 Children | 0 (0.0%) | 0 (0.0%) |
| 3 or 4 Children | 0 (0.0%) | 0 (0.0%) |
| 5 or more Children | 0 (0.0%) | 0 (0.0%) |
| Total | 0 (0.0%) | 0 (0.0%) |
Income Below Poverty Among Married-Couple vs Single-Parent Households in Yonah
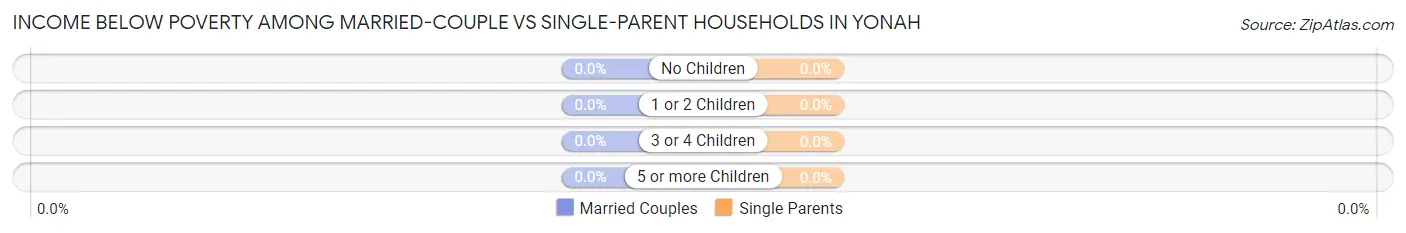
| Children | Married-Couple Families | Single-Parent Households |
| No Children | 0 (0.0%) | 0 (0.0%) |
| 1 or 2 Children | 0 (0.0%) | 0 (0.0%) |
| 3 or 4 Children | 0 (0.0%) | 0 (0.0%) |
| 5 or more Children | 0 (0.0%) | 0 (0.0%) |
| Total | 0 (0.0%) | 0 (0.0%) |
Employment Characteristics in Yonah
Employment by Class of Employer in Yonah
Among the 441 employed individuals in Yonah, private company employees (179 | 40.6%), local government employees (157 | 35.6%), and federal government employees (54 | 12.2%) make up the most common classes of employment.
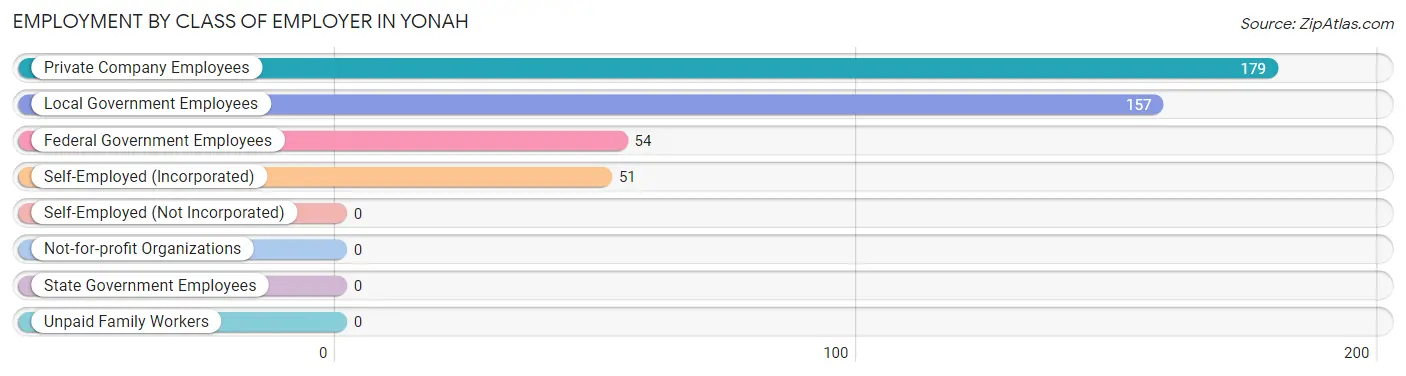
| Employer Class | # Employees | % Employees |
| Private Company Employees | 179 | 40.6% |
| Self-Employed (Incorporated) | 51 | 11.6% |
| Self-Employed (Not Incorporated) | 0 | 0.0% |
| Not-for-profit Organizations | 0 | 0.0% |
| Local Government Employees | 157 | 35.6% |
| State Government Employees | 0 | 0.0% |
| Federal Government Employees | 54 | 12.2% |
| Unpaid Family Workers | 0 | 0.0% |
| Total | 441 | 100.0% |
Employment Status by Age in Yonah
According to the labor force statistics for Yonah, out of the total population over 16 years of age (568), 82.0% or 466 individuals are in the labor force, with 5.4% or 25 of them unemployed. The age group with the highest labor force participation rate is 16 to 19 years, with 100.0% or 73 individuals in the labor force. Within the labor force, the 45 to 54 years age range has the highest percentage of unemployed individuals, with 19.2% or 25 of them being unemployed.
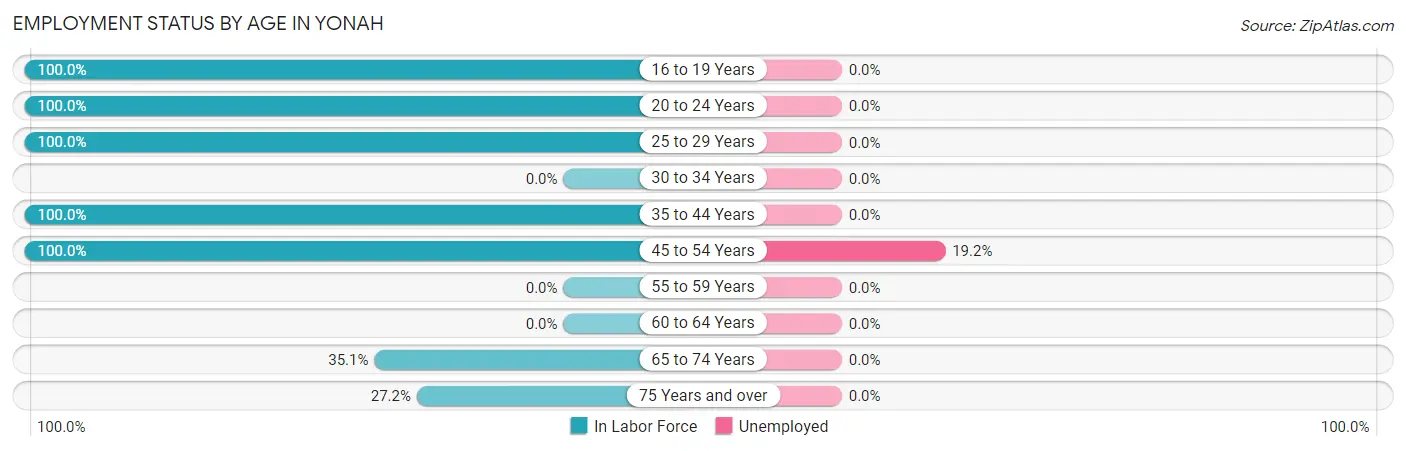
| Age Bracket | In Labor Force | Unemployed |
| 16 to 19 Years | 73 (100.0%) | 0 (0.0%) |
| 20 to 24 Years | 157 (100.0%) | 0 (0.0%) |
| 25 to 29 Years | 27 (100.0%) | 0 (0.0%) |
| 30 to 34 Years | 0 (0.0%) | 0 (0.0%) |
| 35 to 44 Years | 44 (100.0%) | 0 (0.0%) |
| 45 to 54 Years | 130 (100.0%) | 25 (19.2%) |
| 55 to 59 Years | 0 (0.0%) | 0 (0.0%) |
| 60 to 64 Years | 0 (0.0%) | 0 (0.0%) |
| 65 to 74 Years | 13 (35.1%) | 0 (0.0%) |
| 75 Years and over | 22 (27.2%) | 0 (0.0%) |
| Total | 466 (82.0%) | 25 (5.4%) |
Employment Status by Educational Attainment in Yonah
According to labor force statistics for Yonah, 91.4% of individuals (201) out of the total population between 25 and 64 years of age (220) are in the labor force, with 12.4% or 25 of them being unemployed. The group with the highest labor force participation rate are those with the educational attainment of high school diploma, with 100.0% or 39 individuals in the labor force. Within the labor force, individuals with college / associate degree education have the highest percentage of unemployment, with 23.1% or 25 of them being unemployed.
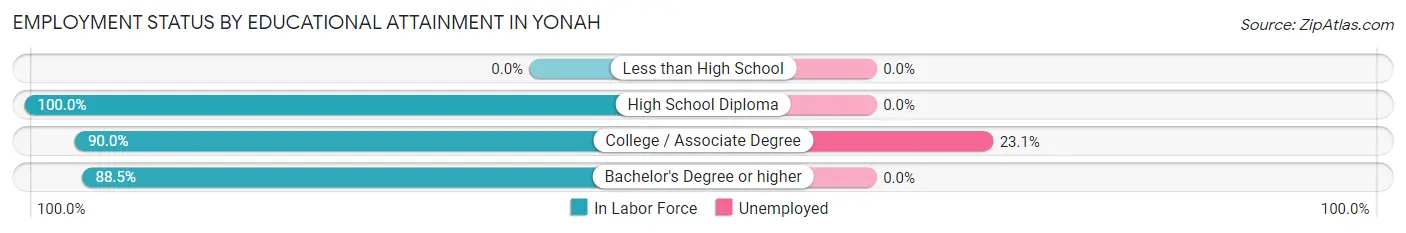
| Educational Attainment | In Labor Force | Unemployed |
| Less than High School | 0 (0.0%) | 0 (0.0%) |
| High School Diploma | 39 (100.0%) | 0 (0.0%) |
| College / Associate Degree | 108 (90.0%) | 28 (23.1%) |
| Bachelor's Degree or higher | 54 (88.5%) | 0 (0.0%) |
| Total | 201 (91.4%) | 27 (12.4%) |
Employment Occupations by Sex in Yonah
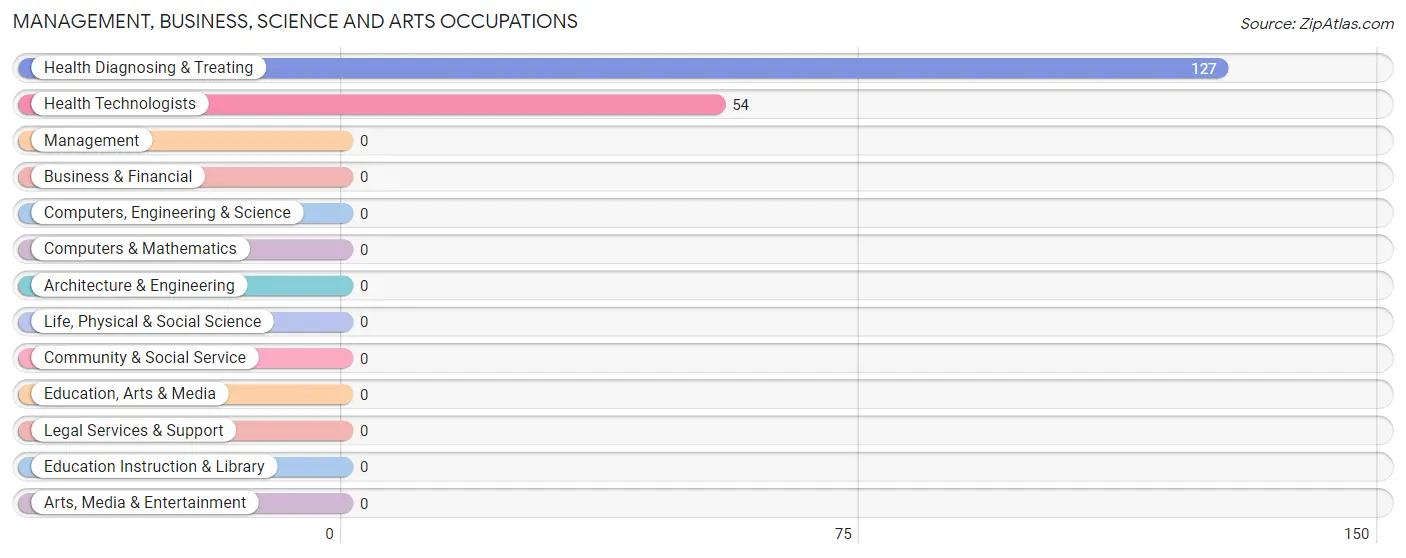
Management, Business, Science and Arts Occupations
The most common Management, Business, Science and Arts occupations in Yonah are Health Diagnosing & Treating (127 | 28.8%), and Health Technologists (54 | 12.2%).
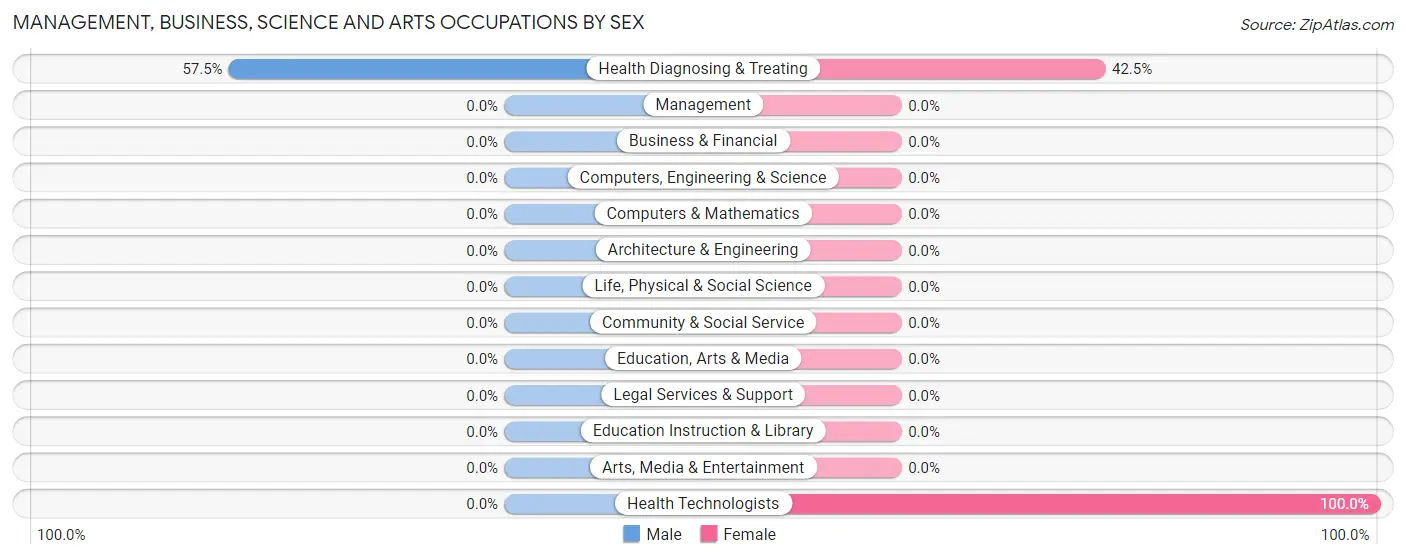
Management, Business, Science and Arts Occupations by Sex
| Occupation | Male | Female |
| Management | 0 (0.0%) | 0 (0.0%) |
| Business & Financial | 0 (0.0%) | 0 (0.0%) |
| Computers, Engineering & Science | 0 (0.0%) | 0 (0.0%) |
| Computers & Mathematics | 0 (0.0%) | 0 (0.0%) |
| Architecture & Engineering | 0 (0.0%) | 0 (0.0%) |
| Life, Physical & Social Science | 0 (0.0%) | 0 (0.0%) |
| Community & Social Service | 0 (0.0%) | 0 (0.0%) |
| Education, Arts & Media | 0 (0.0%) | 0 (0.0%) |
| Legal Services & Support | 0 (0.0%) | 0 (0.0%) |
| Education Instruction & Library | 0 (0.0%) | 0 (0.0%) |
| Arts, Media & Entertainment | 0 (0.0%) | 0 (0.0%) |
| Health Diagnosing & Treating | 73 (57.5%) | 54 (42.5%) |
| Health Technologists | 0 (0.0%) | 54 (100.0%) |
| Total (Category) | 73 (57.5%) | 54 (42.5%) |
| Total (Overall) | 340 (77.1%) | 101 (22.9%) |
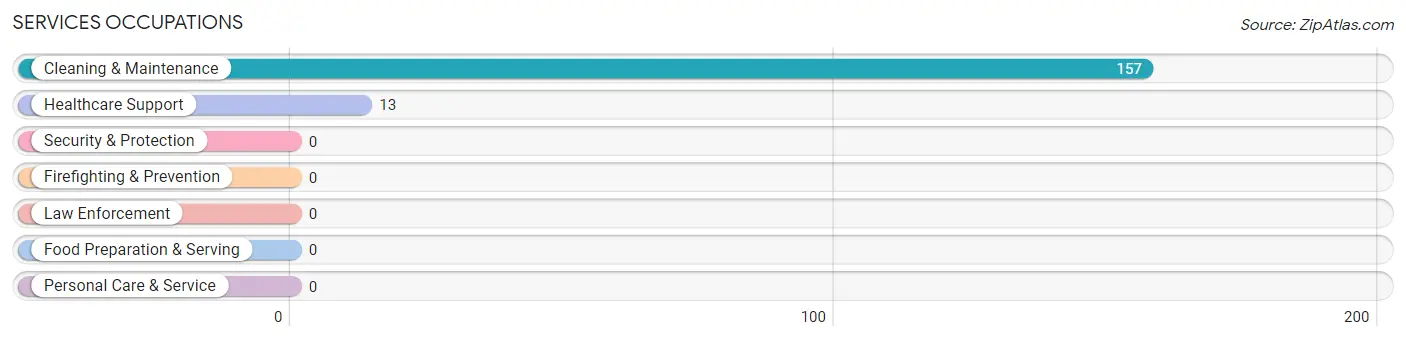
Services Occupations
The most common Services occupations in Yonah are Cleaning & Maintenance (157 | 35.6%), and Healthcare Support (13 | 2.9%).
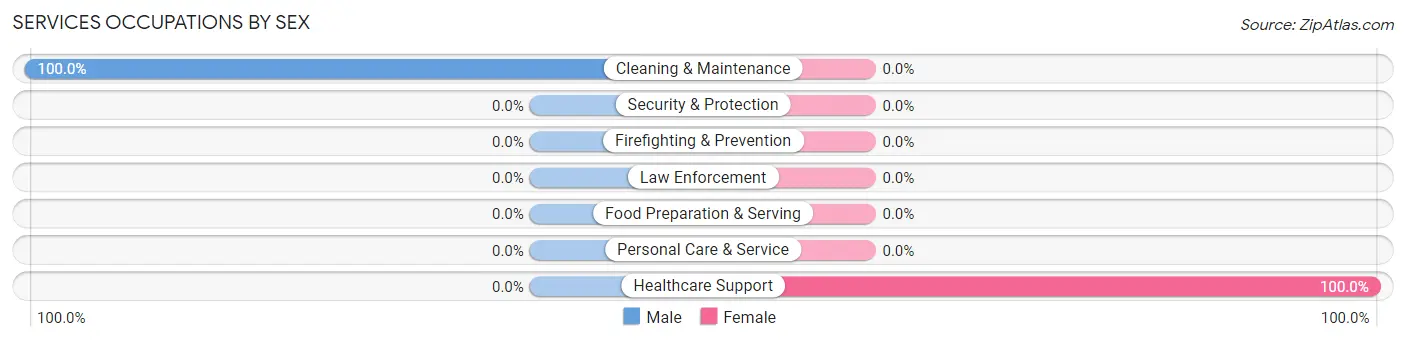
Services Occupations by Sex
| Occupation | Male | Female |
| Healthcare Support | 0 (0.0%) | 13 (100.0%) |
| Security & Protection | 0 (0.0%) | 0 (0.0%) |
| Firefighting & Prevention | 0 (0.0%) | 0 (0.0%) |
| Law Enforcement | 0 (0.0%) | 0 (0.0%) |
| Food Preparation & Serving | 0 (0.0%) | 0 (0.0%) |
| Cleaning & Maintenance | 157 (100.0%) | 0 (0.0%) |
| Personal Care & Service | 0 (0.0%) | 0 (0.0%) |
| Total (Category) | 157 (92.3%) | 13 (7.6%) |
| Total (Overall) | 340 (77.1%) | 101 (22.9%) |
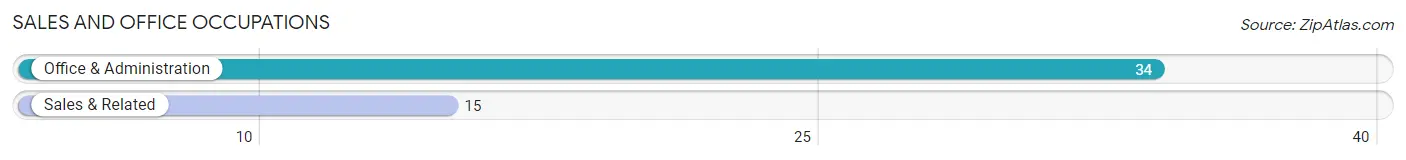
Sales and Office Occupations
The most common Sales and Office occupations in Yonah are Office & Administration (34 | 7.7%), and Sales & Related (15 | 3.4%).
Sales and Office Occupations by Sex
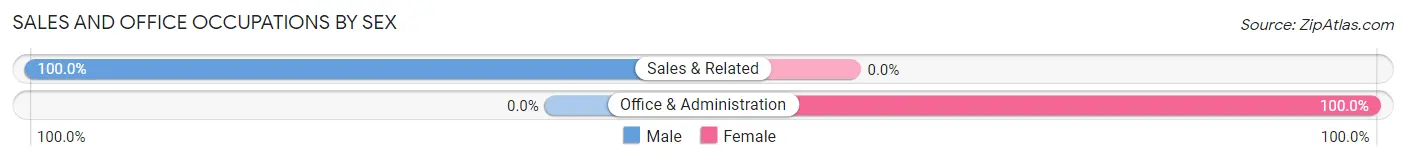
| Occupation | Male | Female |
| Sales & Related | 15 (100.0%) | 0 (0.0%) |
| Office & Administration | 0 (0.0%) | 34 (100.0%) |
| Total (Category) | 15 (30.6%) | 34 (69.4%) |
| Total (Overall) | 340 (77.1%) | 101 (22.9%) |
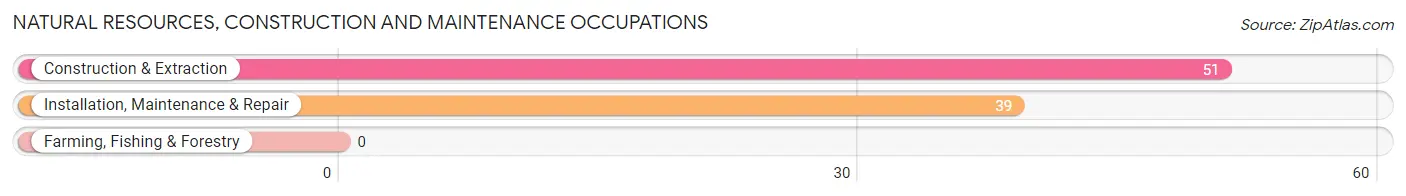
Natural Resources, Construction and Maintenance Occupations
The most common Natural Resources, Construction and Maintenance occupations in Yonah are Construction & Extraction (51 | 11.6%), and Installation, Maintenance & Repair (39 | 8.8%).
Natural Resources, Construction and Maintenance Occupations by Sex
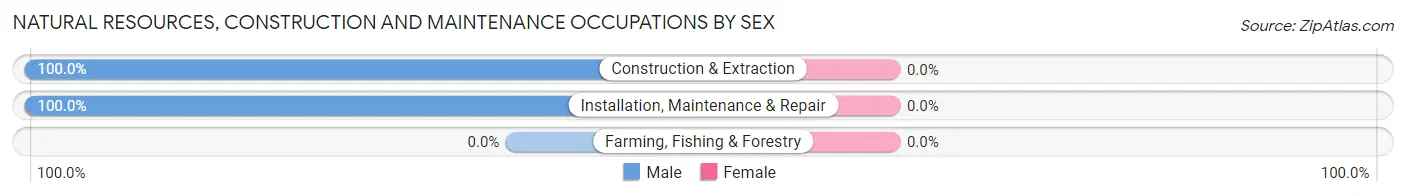
| Occupation | Male | Female |
| Farming, Fishing & Forestry | 0 (0.0%) | 0 (0.0%) |
| Construction & Extraction | 51 (100.0%) | 0 (0.0%) |
| Installation, Maintenance & Repair | 39 (100.0%) | 0 (0.0%) |
| Total (Category) | 90 (100.0%) | 0 (0.0%) |
| Total (Overall) | 340 (77.1%) | 101 (22.9%) |
Production, Transportation and Moving Occupations
The most common Production, Transportation and Moving occupations in Yonah are , and Production (5 | 1.1%).
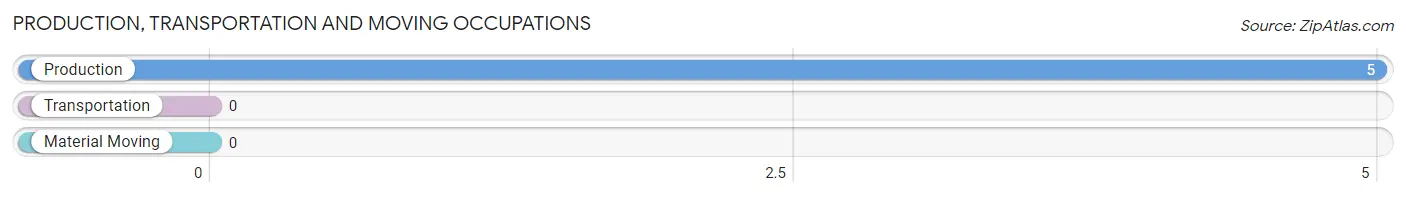
Production, Transportation and Moving Occupations by Sex
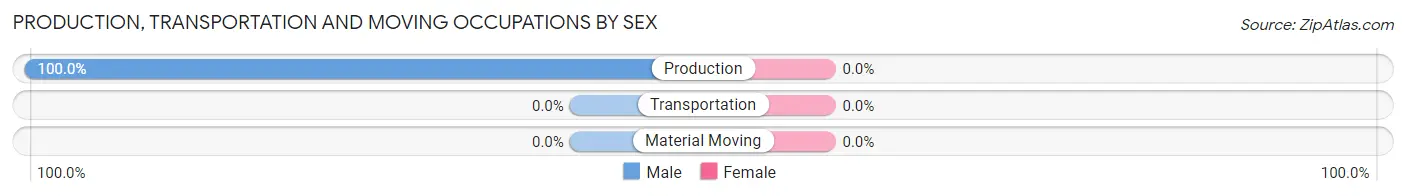
| Occupation | Male | Female |
| Production | 5 (100.0%) | 0 (0.0%) |
| Transportation | 0 (0.0%) | 0 (0.0%) |
| Material Moving | 0 (0.0%) | 0 (0.0%) |
| Total (Category) | 5 (100.0%) | 0 (0.0%) |
| Total (Overall) | 340 (77.1%) | 101 (22.9%) |
Employment Industries by Sex in Yonah
Employment Industries in Yonah
The major employment industries in Yonah include Arts, Entertainment & Recreation (157 | 35.6%), Retail Trade (117 | 26.5%), Construction (73 | 16.6%), Health Care & Social Assistance (67 | 15.2%), and Wholesale Trade (15 | 3.4%).
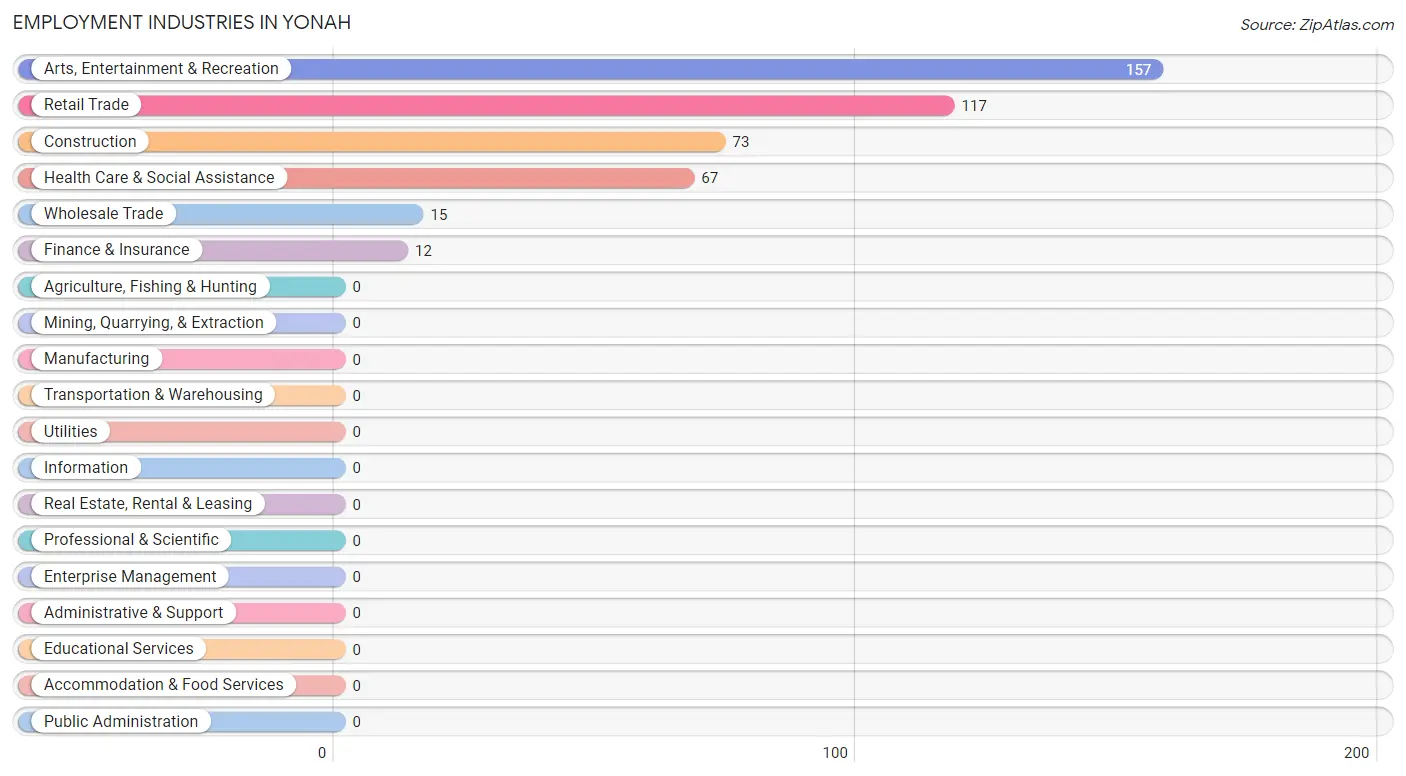
Employment Industries by Sex in Yonah
The Yonah industries that see more men than women are Wholesale Trade (100.0%), Retail Trade (100.0%), and Arts, Entertainment & Recreation (100.0%), whereas the industries that tend to have a higher number of women are Finance & Insurance (100.0%), Health Care & Social Assistance (100.0%), and Construction (30.1%).
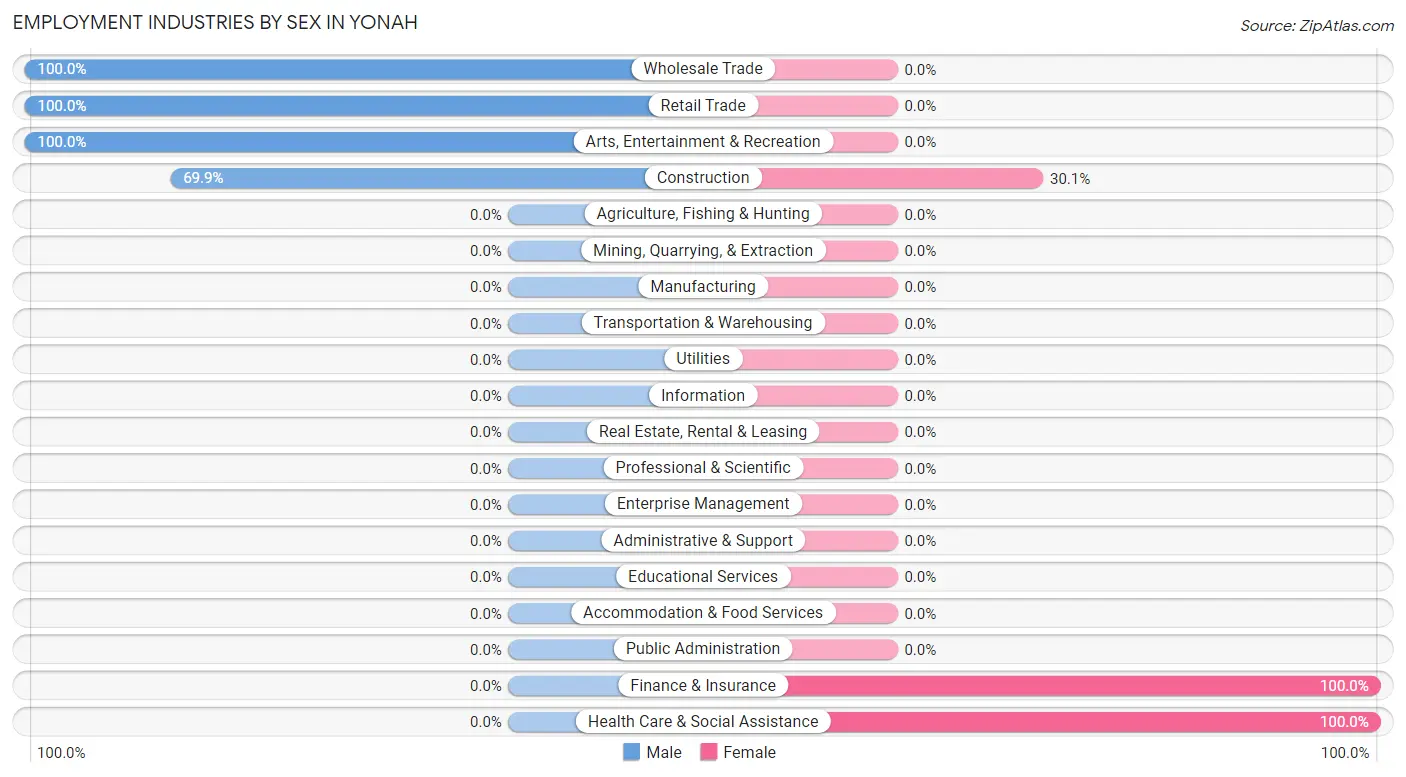
| Industry | Male | Female |
| Agriculture, Fishing & Hunting | 0 (0.0%) | 0 (0.0%) |
| Mining, Quarrying, & Extraction | 0 (0.0%) | 0 (0.0%) |
| Construction | 51 (69.9%) | 22 (30.1%) |
| Manufacturing | 0 (0.0%) | 0 (0.0%) |
| Wholesale Trade | 15 (100.0%) | 0 (0.0%) |
| Retail Trade | 117 (100.0%) | 0 (0.0%) |
| Transportation & Warehousing | 0 (0.0%) | 0 (0.0%) |
| Utilities | 0 (0.0%) | 0 (0.0%) |
| Information | 0 (0.0%) | 0 (0.0%) |
| Finance & Insurance | 0 (0.0%) | 12 (100.0%) |
| Real Estate, Rental & Leasing | 0 (0.0%) | 0 (0.0%) |
| Professional & Scientific | 0 (0.0%) | 0 (0.0%) |
| Enterprise Management | 0 (0.0%) | 0 (0.0%) |
| Administrative & Support | 0 (0.0%) | 0 (0.0%) |
| Educational Services | 0 (0.0%) | 0 (0.0%) |
| Health Care & Social Assistance | 0 (0.0%) | 67 (100.0%) |
| Arts, Entertainment & Recreation | 157 (100.0%) | 0 (0.0%) |
| Accommodation & Food Services | 0 (0.0%) | 0 (0.0%) |
| Public Administration | 0 (0.0%) | 0 (0.0%) |
| Total | 340 (77.1%) | 101 (22.9%) |
Education in Yonah
School Enrollment in Yonah
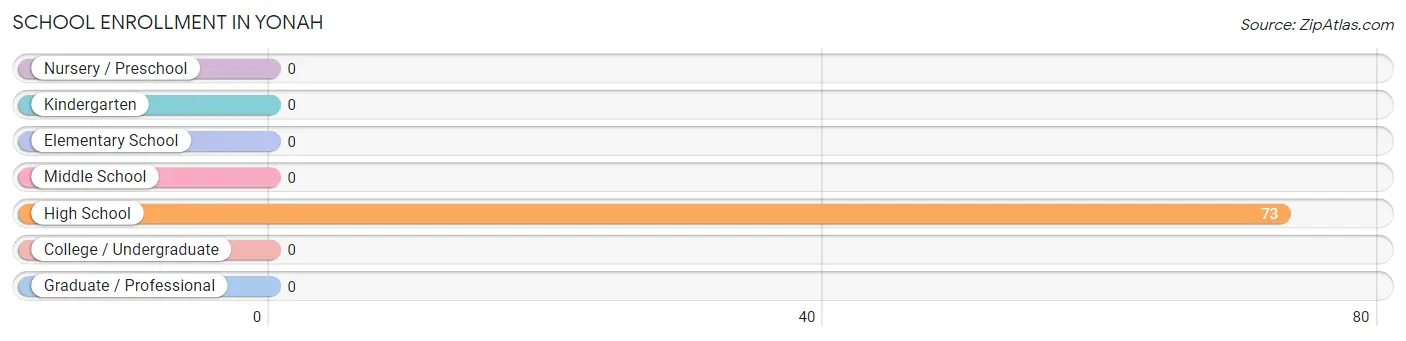
| School Level | # Students | % Students |
| Nursery / Preschool | 0 | 0.0% |
| Kindergarten | 0 | 0.0% |
| Elementary School | 0 | 0.0% |
| Middle School | 0 | 0.0% |
| High School | 73 | 100.0% |
| College / Undergraduate | 0 | 0.0% |
| Graduate / Professional | 0 | 0.0% |
| Total | 73 | 100.0% |
School Enrollment by Age by Funding Source in Yonah
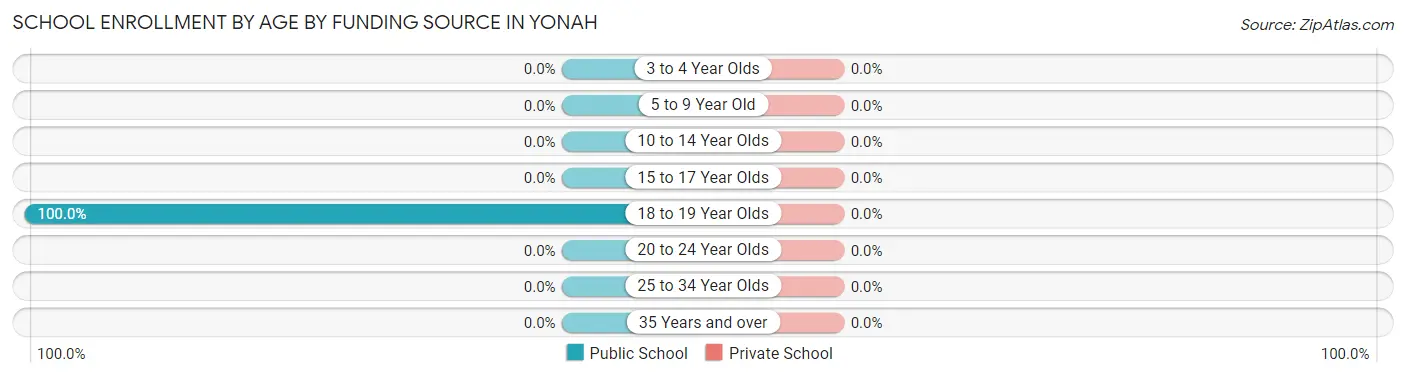
| Age Bracket | Public School | Private School |
| 3 to 4 Year Olds | 0 (0.0%) | 0 (0.0%) |
| 5 to 9 Year Old | 0 (0.0%) | 0 (0.0%) |
| 10 to 14 Year Olds | 0 (0.0%) | 0 (0.0%) |
| 15 to 17 Year Olds | 0 (0.0%) | 0 (0.0%) |
| 18 to 19 Year Olds | 73 (100.0%) | 0 (0.0%) |
| 20 to 24 Year Olds | 0 (0.0%) | 0 (0.0%) |
| 25 to 34 Year Olds | 0 (0.0%) | 0 (0.0%) |
| 35 Years and over | 0 (0.0%) | 0 (0.0%) |
| Total | 73 (100.0%) | 0 (0.0%) |
Educational Attainment by Field of Study in Yonah
Business (54 | 73.0%), education (13 | 17.6%), and science & technology (7 | 9.5%) are the most common fields of study among 74 individuals in Yonah who have obtained a bachelor's degree or higher.
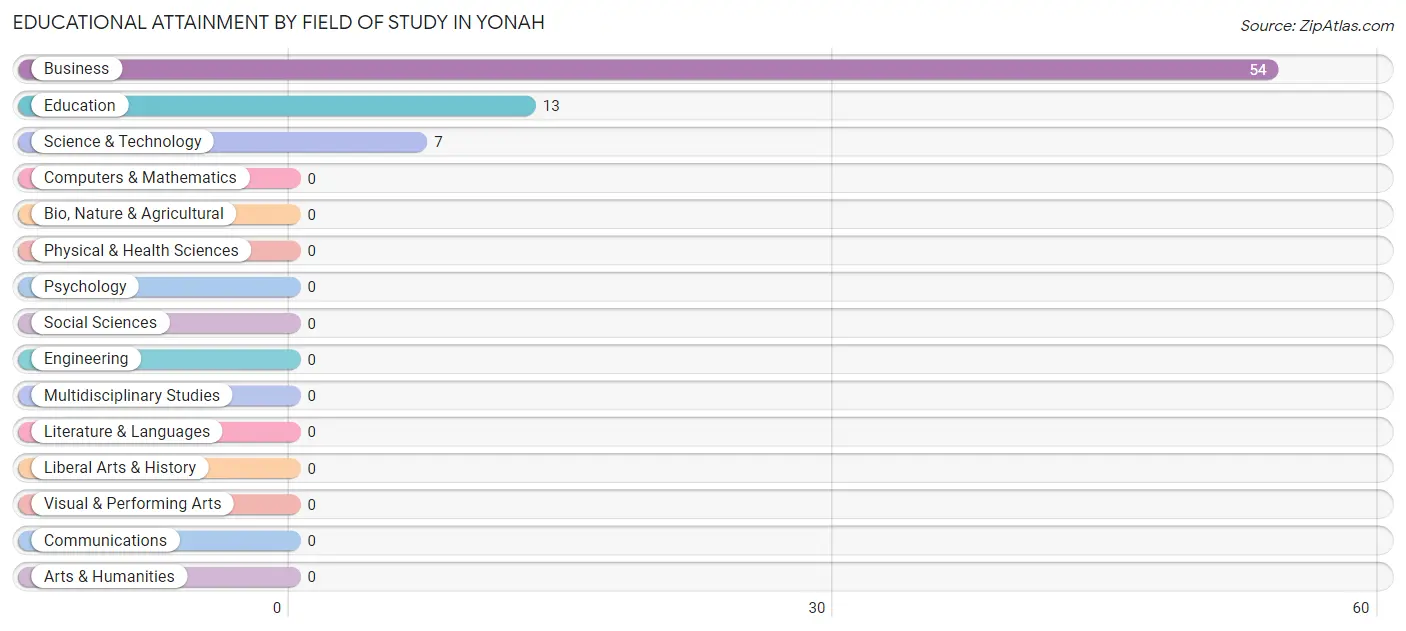
| Field of Study | # Graduates | % Graduates |
| Computers & Mathematics | 0 | 0.0% |
| Bio, Nature & Agricultural | 0 | 0.0% |
| Physical & Health Sciences | 0 | 0.0% |
| Psychology | 0 | 0.0% |
| Social Sciences | 0 | 0.0% |
| Engineering | 0 | 0.0% |
| Multidisciplinary Studies | 0 | 0.0% |
| Science & Technology | 7 | 9.5% |
| Business | 54 | 73.0% |
| Education | 13 | 17.6% |
| Literature & Languages | 0 | 0.0% |
| Liberal Arts & History | 0 | 0.0% |
| Visual & Performing Arts | 0 | 0.0% |
| Communications | 0 | 0.0% |
| Arts & Humanities | 0 | 0.0% |
| Total | 74 | 100.0% |
Transportation & Commute in Yonah
Vehicle Availability by Sex in Yonah
The most prevalent vehicle ownership categories in Yonah are males with 4 vehicles (281, accounting for 82.7%) and females with 4 vehicles (54, making up 278.2%).
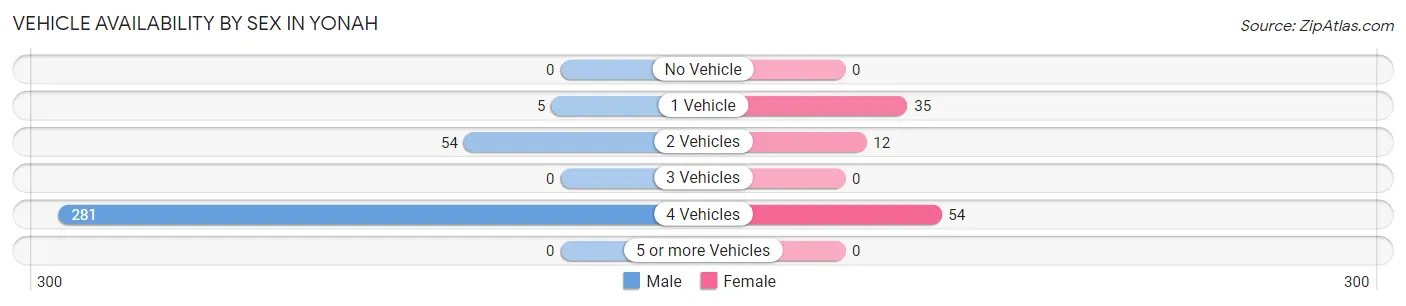
| Vehicles Available | Male | Female |
| No Vehicle | 0 (0.0%) | 0 (0.0%) |
| 1 Vehicle | 5 (1.5%) | 35 (34.6%) |
| 2 Vehicles | 54 (15.9%) | 12 (11.9%) |
| 3 Vehicles | 0 (0.0%) | 0 (0.0%) |
| 4 Vehicles | 281 (82.7%) | 54 (53.5%) |
| 5 or more Vehicles | 0 (0.0%) | 0 (0.0%) |
| Total | 340 (100.0%) | 101 (100.0%) |
Commute Time in Yonah
The most frequently occuring commute durations in Yonah are less than 5 minutes (157 commuters, 45.4%), 5 to 9 minutes (66 commuters, 19.1%), and 45 to 59 minutes (52 commuters, 15.0%).
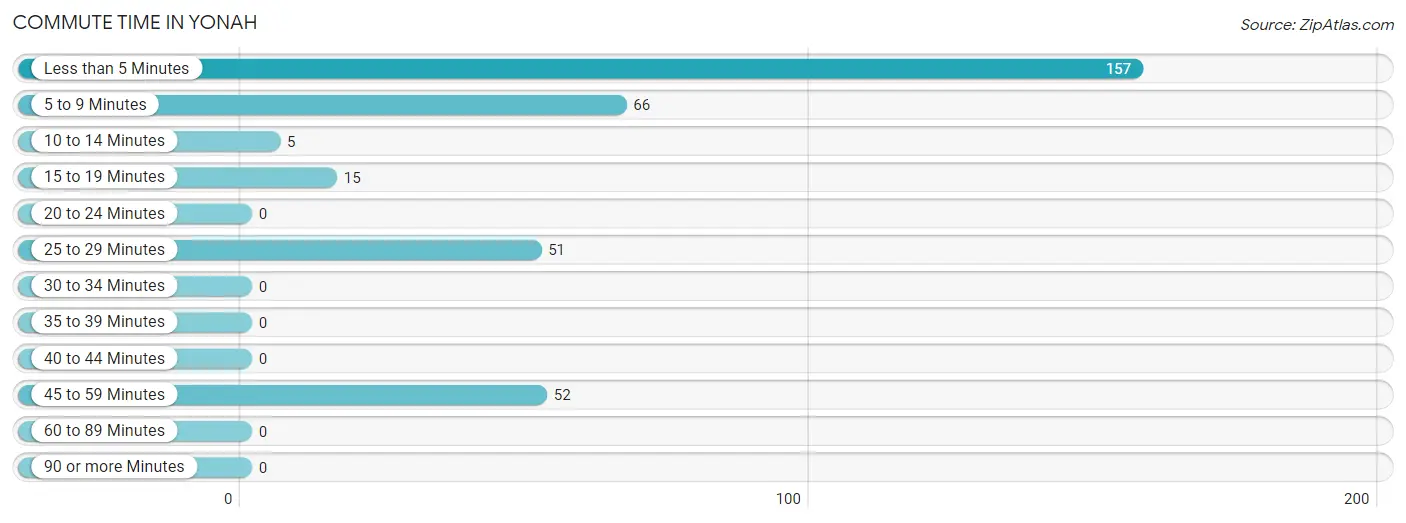
| Commute Time | # Commuters | % Commuters |
| Less than 5 Minutes | 157 | 45.4% |
| 5 to 9 Minutes | 66 | 19.1% |
| 10 to 14 Minutes | 5 | 1.5% |
| 15 to 19 Minutes | 15 | 4.3% |
| 20 to 24 Minutes | 0 | 0.0% |
| 25 to 29 Minutes | 51 | 14.7% |
| 30 to 34 Minutes | 0 | 0.0% |
| 35 to 39 Minutes | 0 | 0.0% |
| 40 to 44 Minutes | 0 | 0.0% |
| 45 to 59 Minutes | 52 | 15.0% |
| 60 to 89 Minutes | 0 | 0.0% |
| 90 or more Minutes | 0 | 0.0% |
Commute Time by Sex in Yonah
The most common commute times in Yonah are less than 5 minutes (157 commuters, 58.8%) for males and 5 to 9 minutes (66 commuters, 83.5%) for females.
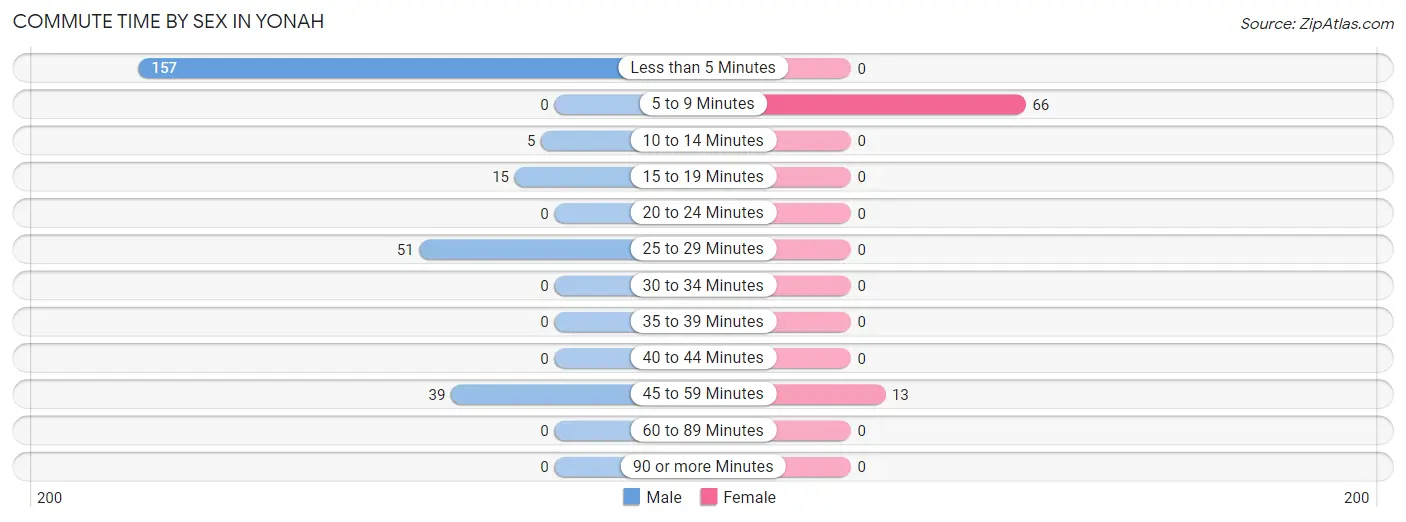
| Commute Time | Male | Female |
| Less than 5 Minutes | 157 (58.8%) | 0 (0.0%) |
| 5 to 9 Minutes | 0 (0.0%) | 66 (83.5%) |
| 10 to 14 Minutes | 5 (1.9%) | 0 (0.0%) |
| 15 to 19 Minutes | 15 (5.6%) | 0 (0.0%) |
| 20 to 24 Minutes | 0 (0.0%) | 0 (0.0%) |
| 25 to 29 Minutes | 51 (19.1%) | 0 (0.0%) |
| 30 to 34 Minutes | 0 (0.0%) | 0 (0.0%) |
| 35 to 39 Minutes | 0 (0.0%) | 0 (0.0%) |
| 40 to 44 Minutes | 0 (0.0%) | 0 (0.0%) |
| 45 to 59 Minutes | 39 (14.6%) | 13 (16.5%) |
| 60 to 89 Minutes | 0 (0.0%) | 0 (0.0%) |
| 90 or more Minutes | 0 (0.0%) | 0 (0.0%) |
Time of Departure to Work by Sex in Yonah
The most frequent times of departure to work in Yonah are 12:00 PM to 3:59 PM (162, 60.7%) for males and 10:00 AM to 10:59 AM (54, 68.3%) for females.
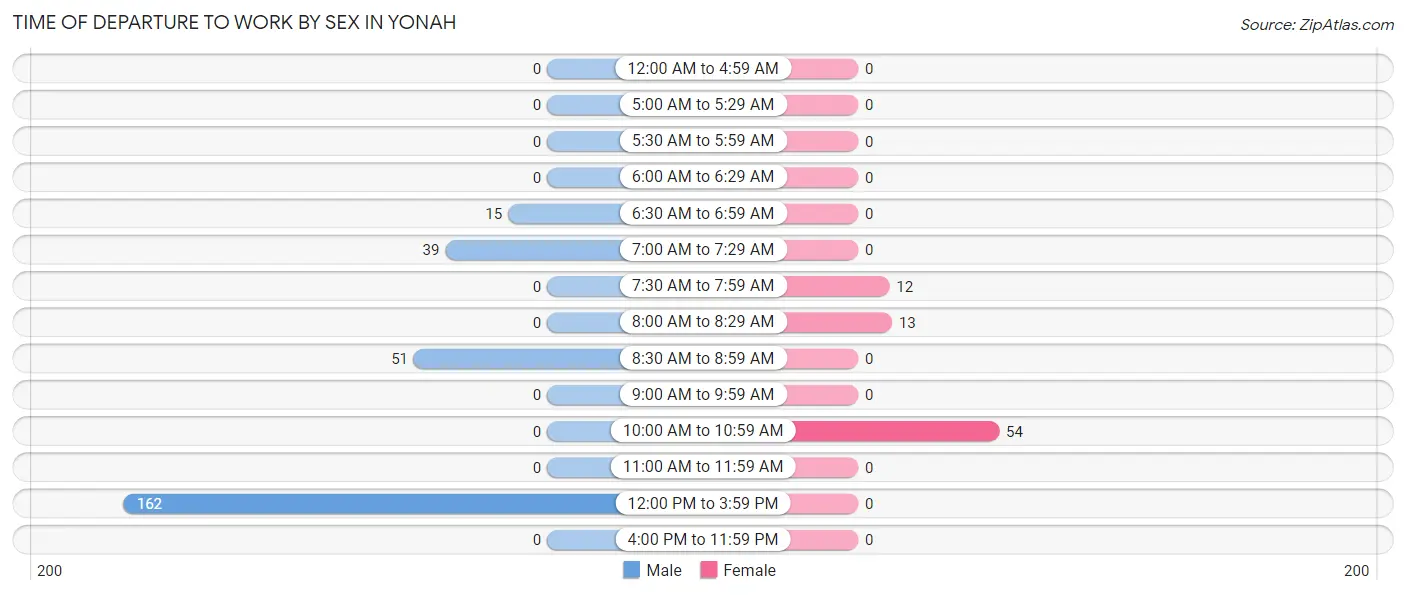
| Time of Departure | Male | Female |
| 12:00 AM to 4:59 AM | 0 (0.0%) | 0 (0.0%) |
| 5:00 AM to 5:29 AM | 0 (0.0%) | 0 (0.0%) |
| 5:30 AM to 5:59 AM | 0 (0.0%) | 0 (0.0%) |
| 6:00 AM to 6:29 AM | 0 (0.0%) | 0 (0.0%) |
| 6:30 AM to 6:59 AM | 15 (5.6%) | 0 (0.0%) |
| 7:00 AM to 7:29 AM | 39 (14.6%) | 0 (0.0%) |
| 7:30 AM to 7:59 AM | 0 (0.0%) | 12 (15.2%) |
| 8:00 AM to 8:29 AM | 0 (0.0%) | 13 (16.5%) |
| 8:30 AM to 8:59 AM | 51 (19.1%) | 0 (0.0%) |
| 9:00 AM to 9:59 AM | 0 (0.0%) | 0 (0.0%) |
| 10:00 AM to 10:59 AM | 0 (0.0%) | 54 (68.3%) |
| 11:00 AM to 11:59 AM | 0 (0.0%) | 0 (0.0%) |
| 12:00 PM to 3:59 PM | 162 (60.7%) | 0 (0.0%) |
| 4:00 PM to 11:59 PM | 0 (0.0%) | 0 (0.0%) |
| Total | 267 (100.0%) | 79 (100.0%) |
Housing Occupancy in Yonah
Occupancy by Ownership in Yonah
Of the total 212 dwellings in Yonah, owner-occupied units account for 139 (65.6%), while renter-occupied units make up 73 (34.4%).
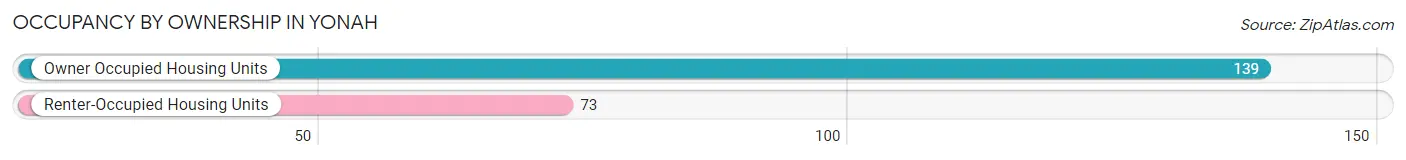
| Occupancy | # Housing Units | % Housing Units |
| Owner Occupied Housing Units | 139 | 65.6% |
| Renter-Occupied Housing Units | 73 | 34.4% |
| Total Occupied Housing Units | 212 | 100.0% |
Occupancy by Household Size in Yonah
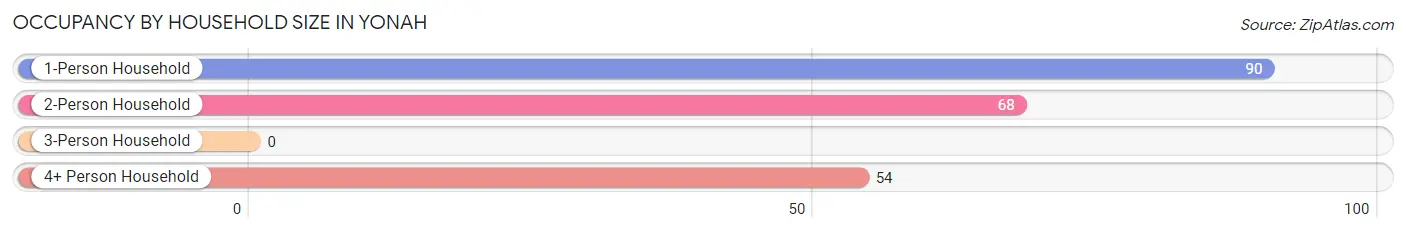
| Household Size | # Housing Units | % Housing Units |
| 1-Person Household | 90 | 42.4% |
| 2-Person Household | 68 | 32.1% |
| 3-Person Household | 0 | 0.0% |
| 4+ Person Household | 54 | 25.5% |
| Total Housing Units | 212 | 100.0% |
Occupancy by Ownership by Household Size in Yonah
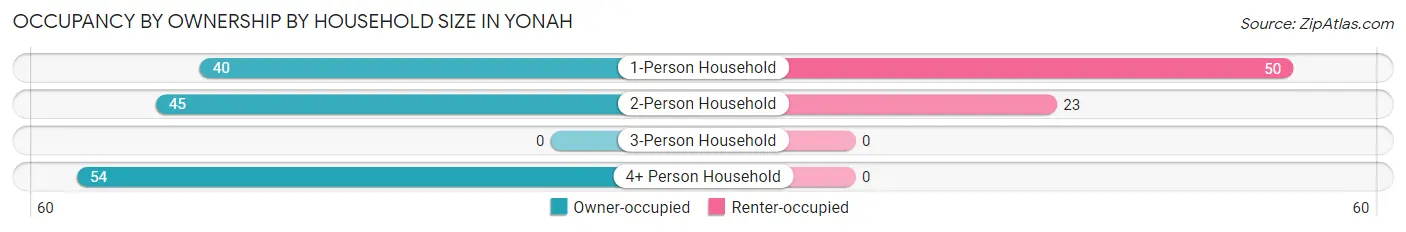
| Household Size | Owner-occupied | Renter-occupied |
| 1-Person Household | 40 (44.4%) | 50 (55.6%) |
| 2-Person Household | 45 (66.2%) | 23 (33.8%) |
| 3-Person Household | 0 (0.0%) | 0 (0.0%) |
| 4+ Person Household | 54 (100.0%) | 0 (0.0%) |
| Total Housing Units | 139 (65.6%) | 73 (34.4%) |
Occupancy by Educational Attainment in Yonah
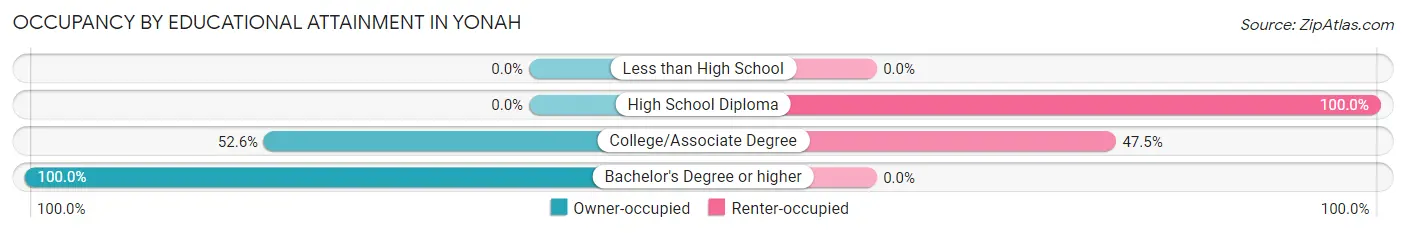
| Household Size | Owner-occupied | Renter-occupied |
| Less than High School | 0 (0.0%) | 0 (0.0%) |
| High School Diploma | 0 (0.0%) | 8 (100.0%) |
| College/Associate Degree | 72 (52.5%) | 65 (47.4%) |
| Bachelor's Degree or higher | 67 (100.0%) | 0 (0.0%) |
Occupancy by Age of Householder in Yonah
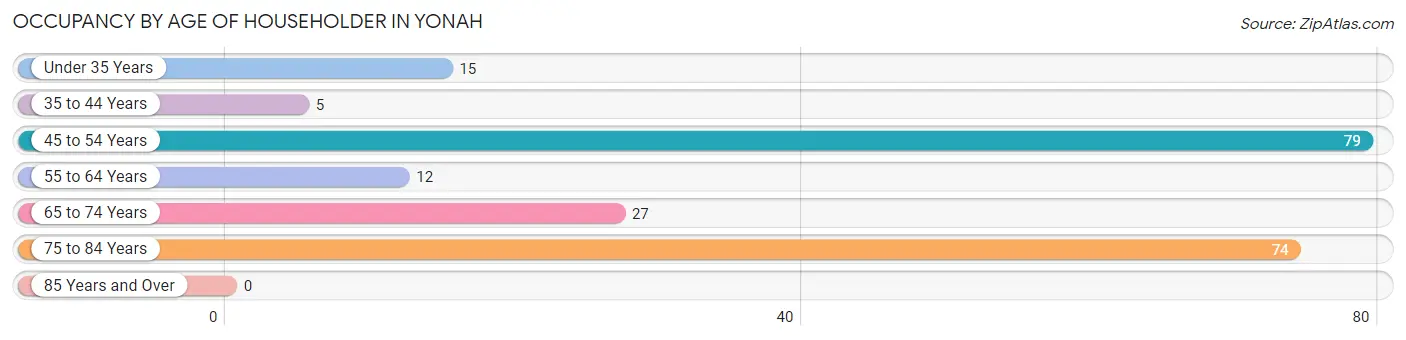
| Age Bracket | # Households | % Households |
| Under 35 Years | 15 | 7.1% |
| 35 to 44 Years | 5 | 2.4% |
| 45 to 54 Years | 79 | 37.3% |
| 55 to 64 Years | 12 | 5.7% |
| 65 to 74 Years | 27 | 12.7% |
| 75 to 84 Years | 74 | 34.9% |
| 85 Years and Over | 0 | 0.0% |
| Total | 212 | 100.0% |
Housing Finances in Yonah
Median Income by Occupancy in Yonah
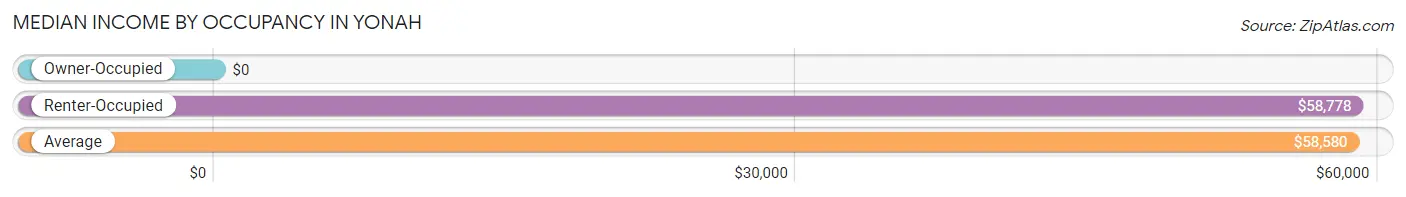
| Occupancy Type | # Households | Median Income |
| Owner-Occupied | 139 (65.6%) | $0 |
| Renter-Occupied | 73 (34.4%) | $58,778 |
| Average | 212 (100.0%) | $58,580 |
Occupancy by Householder Income Bracket in Yonah
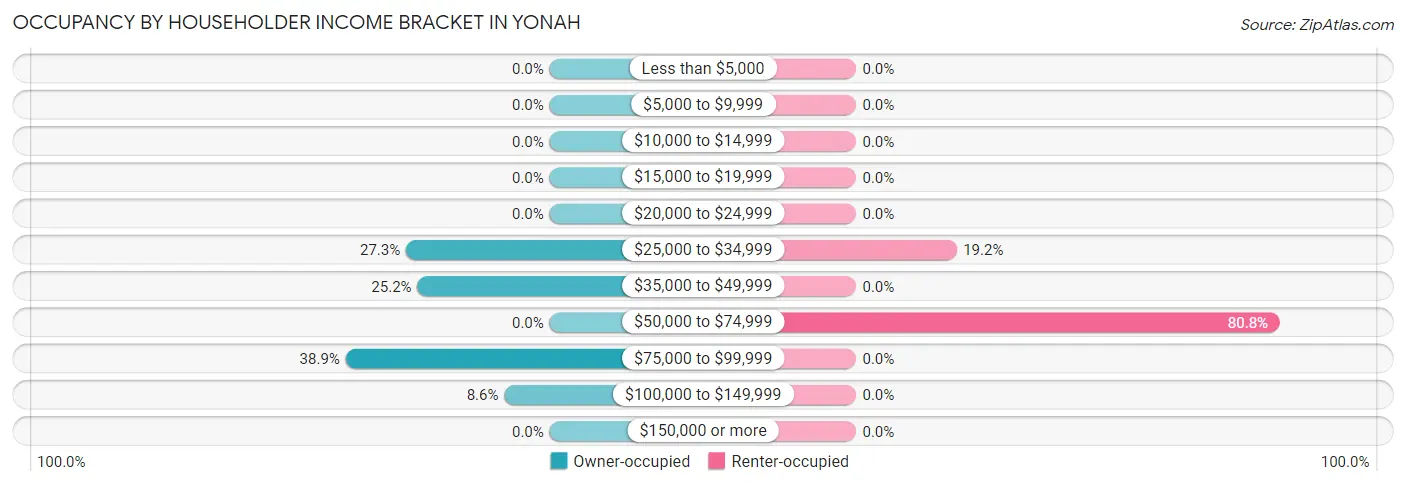
| Income Bracket | Owner-occupied | Renter-occupied |
| Less than $5,000 | 0 (0.0%) | 0 (0.0%) |
| $5,000 to $9,999 | 0 (0.0%) | 0 (0.0%) |
| $10,000 to $14,999 | 0 (0.0%) | 0 (0.0%) |
| $15,000 to $19,999 | 0 (0.0%) | 0 (0.0%) |
| $20,000 to $24,999 | 0 (0.0%) | 0 (0.0%) |
| $25,000 to $34,999 | 38 (27.3%) | 14 (19.2%) |
| $35,000 to $49,999 | 35 (25.2%) | 0 (0.0%) |
| $50,000 to $74,999 | 0 (0.0%) | 59 (80.8%) |
| $75,000 to $99,999 | 54 (38.9%) | 0 (0.0%) |
| $100,000 to $149,999 | 12 (8.6%) | 0 (0.0%) |
| $150,000 or more | 0 (0.0%) | 0 (0.0%) |
| Total | 139 (100.0%) | 73 (100.0%) |
Monthly Housing Cost Tiers in Yonah
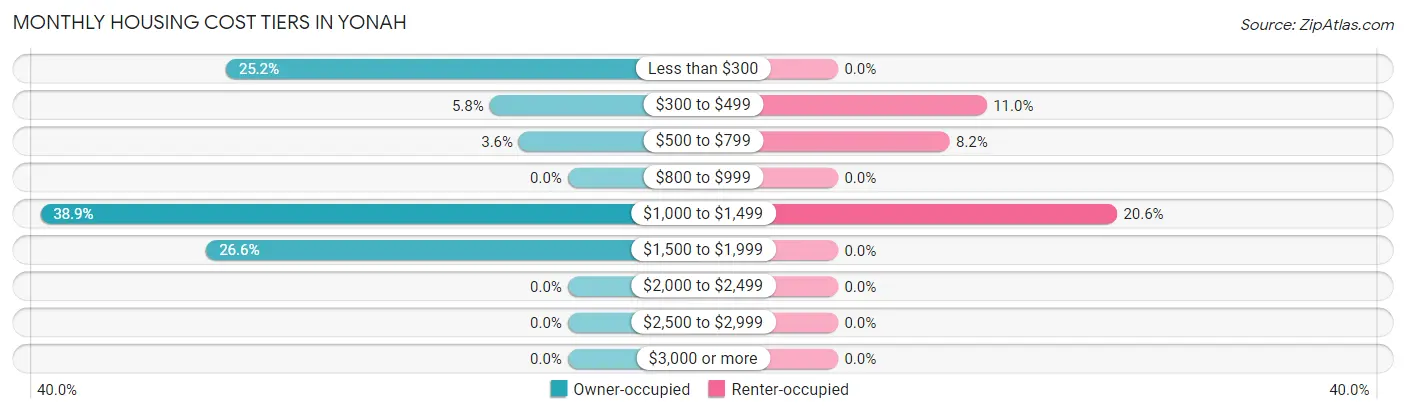
| Monthly Cost | Owner-occupied | Renter-occupied |
| Less than $300 | 35 (25.2%) | 0 (0.0%) |
| $300 to $499 | 8 (5.8%) | 8 (11.0%) |
| $500 to $799 | 5 (3.6%) | 6 (8.2%) |
| $800 to $999 | 0 (0.0%) | 0 (0.0%) |
| $1,000 to $1,499 | 54 (38.9%) | 15 (20.5%) |
| $1,500 to $1,999 | 37 (26.6%) | 0 (0.0%) |
| $2,000 to $2,499 | 0 (0.0%) | 0 (0.0%) |
| $2,500 to $2,999 | 0 (0.0%) | 0 (0.0%) |
| $3,000 or more | 0 (0.0%) | 0 (0.0%) |
| Total | 139 (100.0%) | 73 (100.0%) |
Physical Housing Characteristics in Yonah
Housing Structures in Yonah
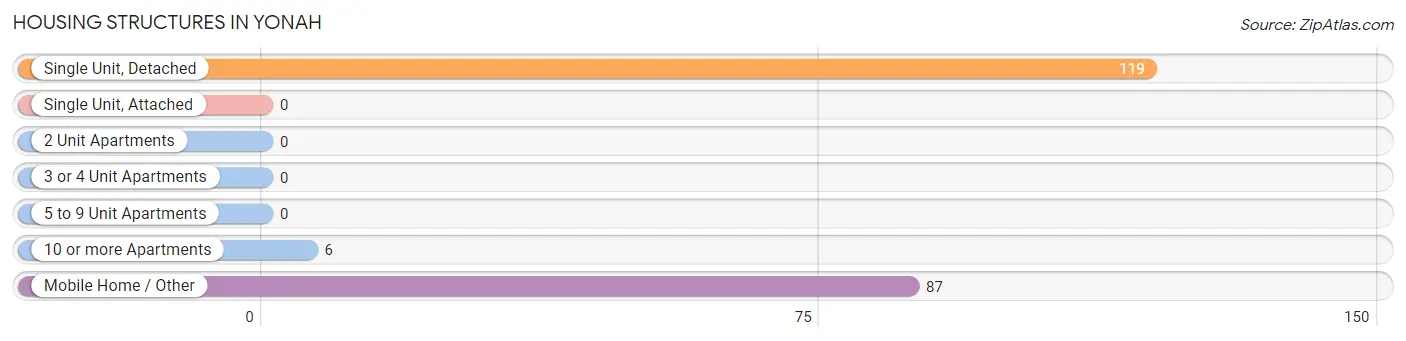
| Structure Type | # Housing Units | % Housing Units |
| Single Unit, Detached | 119 | 56.1% |
| Single Unit, Attached | 0 | 0.0% |
| 2 Unit Apartments | 0 | 0.0% |
| 3 or 4 Unit Apartments | 0 | 0.0% |
| 5 to 9 Unit Apartments | 0 | 0.0% |
| 10 or more Apartments | 6 | 2.8% |
| Mobile Home / Other | 87 | 41.0% |
| Total | 212 | 100.0% |
Housing Structures by Occupancy in Yonah
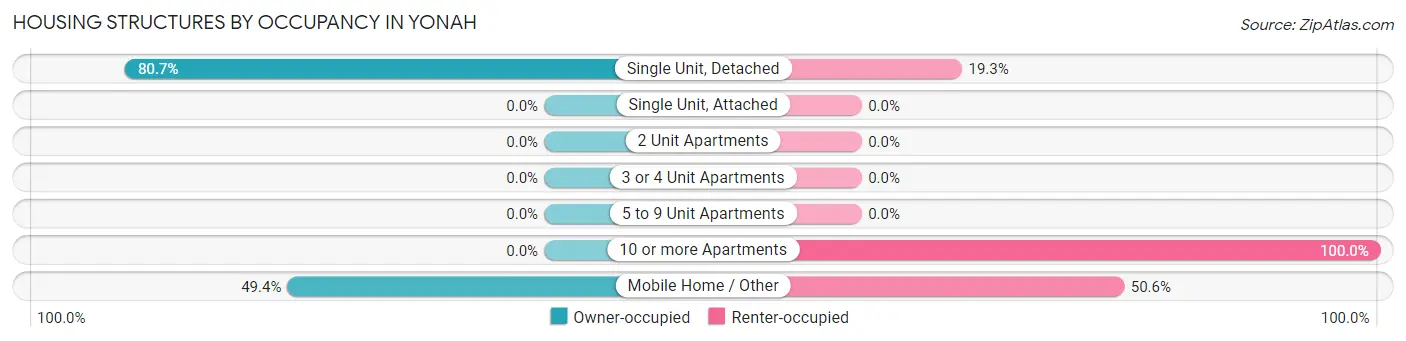
| Structure Type | Owner-occupied | Renter-occupied |
| Single Unit, Detached | 96 (80.7%) | 23 (19.3%) |
| Single Unit, Attached | 0 (0.0%) | 0 (0.0%) |
| 2 Unit Apartments | 0 (0.0%) | 0 (0.0%) |
| 3 or 4 Unit Apartments | 0 (0.0%) | 0 (0.0%) |
| 5 to 9 Unit Apartments | 0 (0.0%) | 0 (0.0%) |
| 10 or more Apartments | 0 (0.0%) | 6 (100.0%) |
| Mobile Home / Other | 43 (49.4%) | 44 (50.6%) |
| Total | 139 (65.6%) | 73 (34.4%) |
Housing Structures by Number of Rooms in Yonah
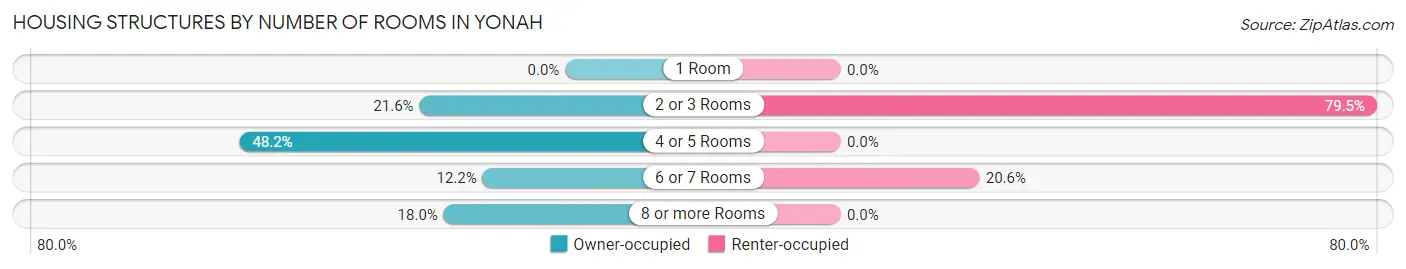
| Number of Rooms | Owner-occupied | Renter-occupied |
| 1 Room | 0 (0.0%) | 0 (0.0%) |
| 2 or 3 Rooms | 30 (21.6%) | 58 (79.4%) |
| 4 or 5 Rooms | 67 (48.2%) | 0 (0.0%) |
| 6 or 7 Rooms | 17 (12.2%) | 15 (20.5%) |
| 8 or more Rooms | 25 (18.0%) | 0 (0.0%) |
| Total | 139 (100.0%) | 73 (100.0%) |
Housing Structure by Heating Type in Yonah
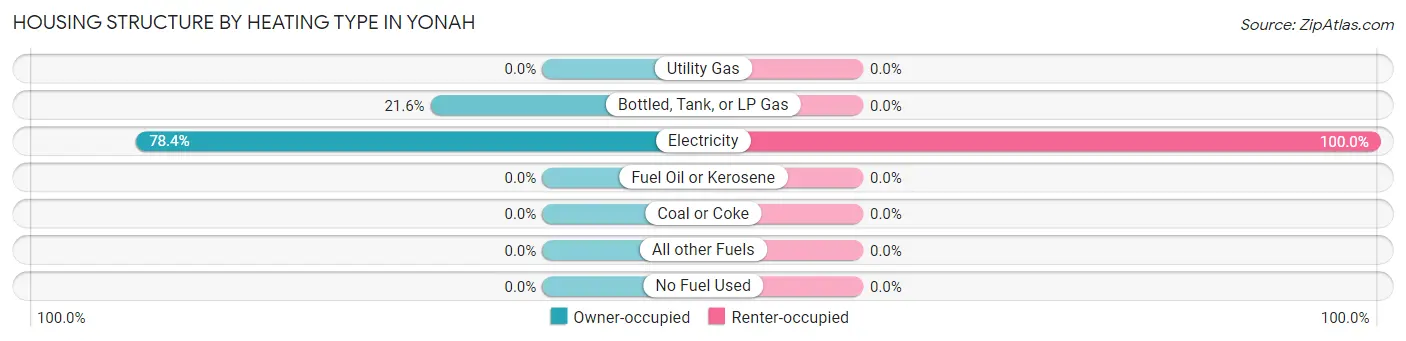
| Heating Type | Owner-occupied | Renter-occupied |
| Utility Gas | 0 (0.0%) | 0 (0.0%) |
| Bottled, Tank, or LP Gas | 30 (21.6%) | 0 (0.0%) |
| Electricity | 109 (78.4%) | 73 (100.0%) |
| Fuel Oil or Kerosene | 0 (0.0%) | 0 (0.0%) |
| Coal or Coke | 0 (0.0%) | 0 (0.0%) |
| All other Fuels | 0 (0.0%) | 0 (0.0%) |
| No Fuel Used | 0 (0.0%) | 0 (0.0%) |
| Total | 139 (100.0%) | 73 (100.0%) |
Household Vehicle Usage in Yonah
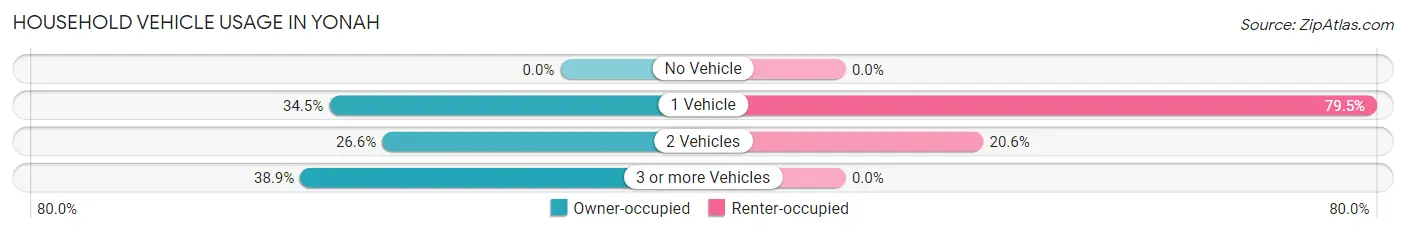
| Vehicles per Household | Owner-occupied | Renter-occupied |
| No Vehicle | 0 (0.0%) | 0 (0.0%) |
| 1 Vehicle | 48 (34.5%) | 58 (79.4%) |
| 2 Vehicles | 37 (26.6%) | 15 (20.5%) |
| 3 or more Vehicles | 54 (38.9%) | 0 (0.0%) |
| Total | 139 (100.0%) | 73 (100.0%) |
Real Estate & Mortgages in Yonah
Real Estate and Mortgage Overview in Yonah
| Characteristic | Without Mortgage | With Mortgage |
| Housing Units | 48 | 91 |
| Median Property Value | - | - |
| Median Household Income | $43,182 | $0 |
| Monthly Housing Costs | $275 | $0 |
| Real Estate Taxes | $827 | $0 |
Property Value by Mortgage Status in Yonah
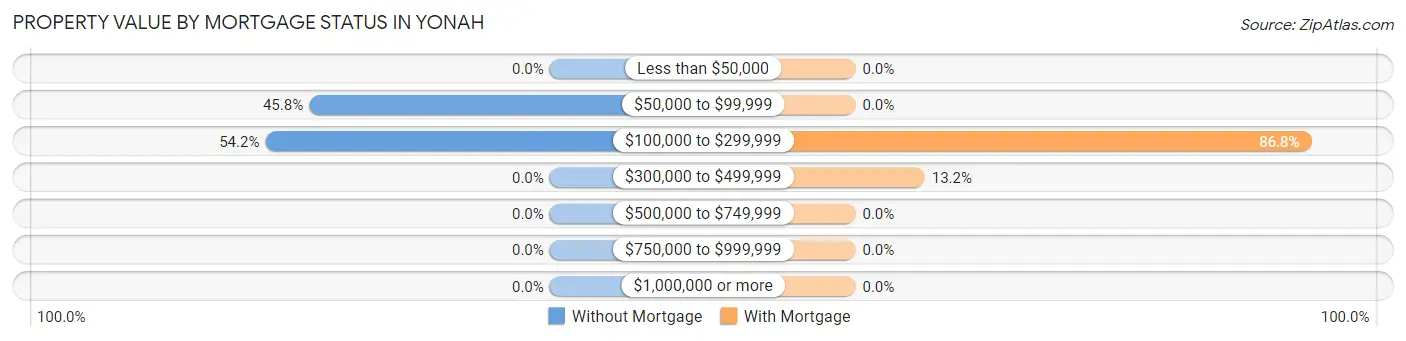
| Property Value | Without Mortgage | With Mortgage |
| Less than $50,000 | 0 (0.0%) | 0 (0.0%) |
| $50,000 to $99,999 | 22 (45.8%) | 0 (0.0%) |
| $100,000 to $299,999 | 26 (54.2%) | 79 (86.8%) |
| $300,000 to $499,999 | 0 (0.0%) | 12 (13.2%) |
| $500,000 to $749,999 | 0 (0.0%) | 0 (0.0%) |
| $750,000 to $999,999 | 0 (0.0%) | 0 (0.0%) |
| $1,000,000 or more | 0 (0.0%) | 0 (0.0%) |
| Total | 48 (100.0%) | 91 (100.0%) |
Household Income by Mortgage Status in Yonah
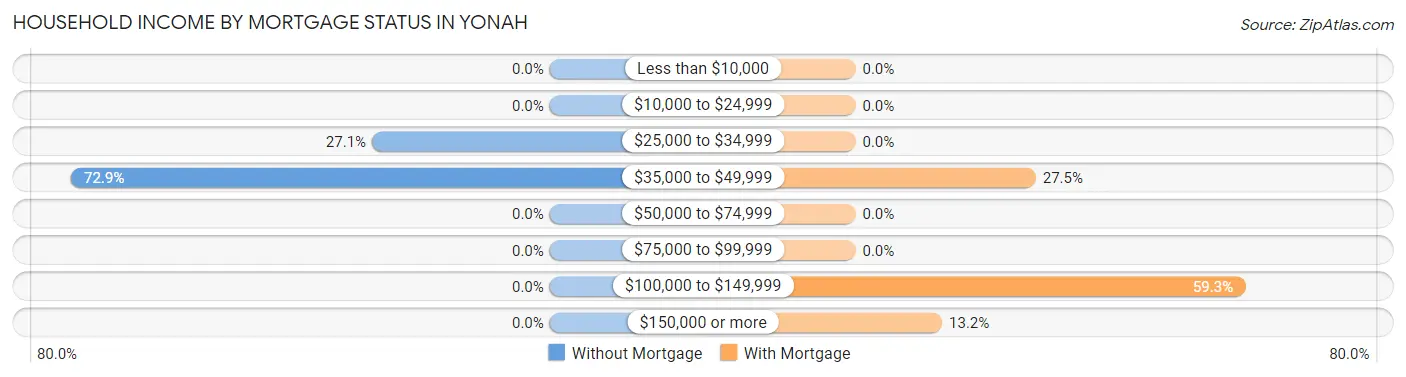
| Household Income | Without Mortgage | With Mortgage |
| Less than $10,000 | 0 (0.0%) | 0 (0.0%) |
| $10,000 to $24,999 | 0 (0.0%) | 0 (0.0%) |
| $25,000 to $34,999 | 13 (27.1%) | 0 (0.0%) |
| $35,000 to $49,999 | 35 (72.9%) | 25 (27.5%) |
| $50,000 to $74,999 | 0 (0.0%) | 0 (0.0%) |
| $75,000 to $99,999 | 0 (0.0%) | 0 (0.0%) |
| $100,000 to $149,999 | 0 (0.0%) | 54 (59.3%) |
| $150,000 or more | 0 (0.0%) | 12 (13.2%) |
| Total | 48 (100.0%) | 91 (100.0%) |
Property Value to Household Income Ratio in Yonah

| Value-to-Income Ratio | Without Mortgage | With Mortgage |
| Less than 2.0x | 22 (45.8%) | 98,449 (108,185.7%) |
| 2.0x to 2.9x | 0 (0.0%) | 54 (59.3%) |
| 3.0x to 3.9x | 0 (0.0%) | 12 (13.2%) |
| 4.0x or more | 26 (54.2%) | 0 (0.0%) |
| Total | 48 (100.0%) | 91 (100.0%) |
Real Estate Taxes by Mortgage Status in Yonah
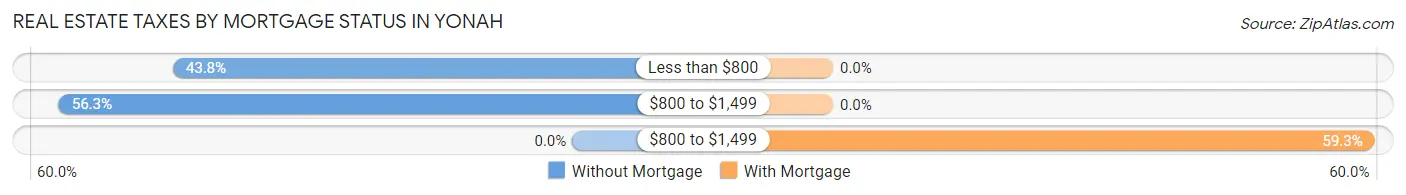
| Property Taxes | Without Mortgage | With Mortgage |
| Less than $800 | 21 (43.8%) | 0 (0.0%) |
| $800 to $1,499 | 27 (56.2%) | 0 (0.0%) |
| $800 to $1,499 | 0 (0.0%) | 54 (59.3%) |
| Total | 48 (100.0%) | 91 (100.0%) |
Health & Disability in Yonah
Health Insurance Coverage by Age in Yonah
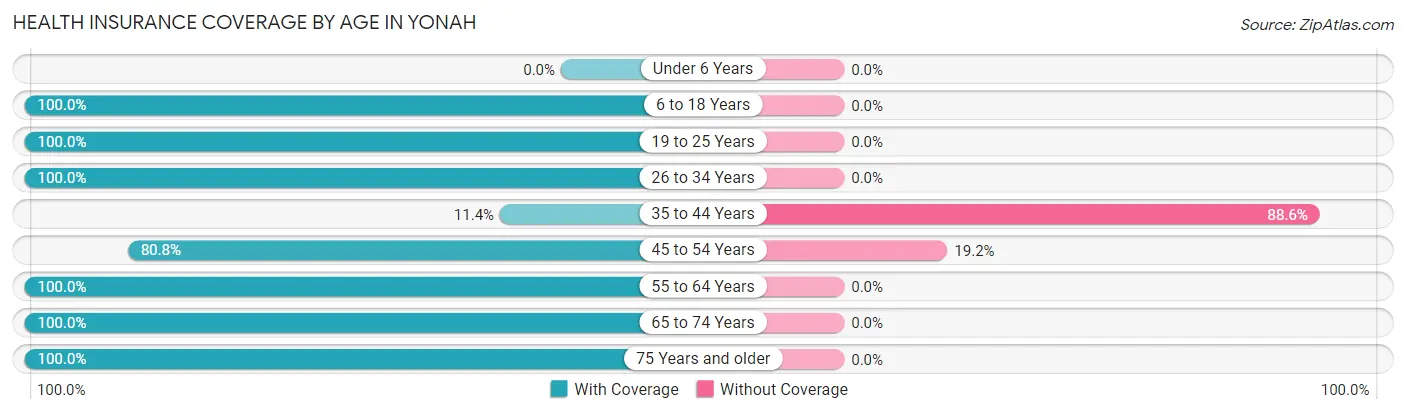
| Age Bracket | With Coverage | Without Coverage |
| Under 6 Years | 0 (0.0%) | 0 (0.0%) |
| 6 to 18 Years | 73 (100.0%) | 0 (0.0%) |
| 19 to 25 Years | 157 (100.0%) | 0 (0.0%) |
| 26 to 34 Years | 27 (100.0%) | 0 (0.0%) |
| 35 to 44 Years | 5 (11.4%) | 39 (88.6%) |
| 45 to 54 Years | 105 (80.8%) | 25 (19.2%) |
| 55 to 64 Years | 19 (100.0%) | 0 (0.0%) |
| 65 to 74 Years | 37 (100.0%) | 0 (0.0%) |
| 75 Years and older | 81 (100.0%) | 0 (0.0%) |
| Total | 504 (88.7%) | 64 (11.3%) |
Health Insurance Coverage by Citizenship Status in Yonah
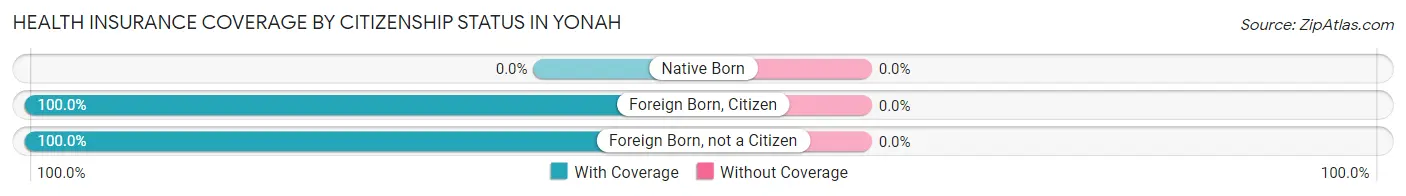
| Citizenship Status | With Coverage | Without Coverage |
| Native Born | 0 (0.0%) | 0 (0.0%) |
| Foreign Born, Citizen | 73 (100.0%) | 0 (0.0%) |
| Foreign Born, not a Citizen | 157 (100.0%) | 0 (0.0%) |
Health Insurance Coverage by Household Income in Yonah
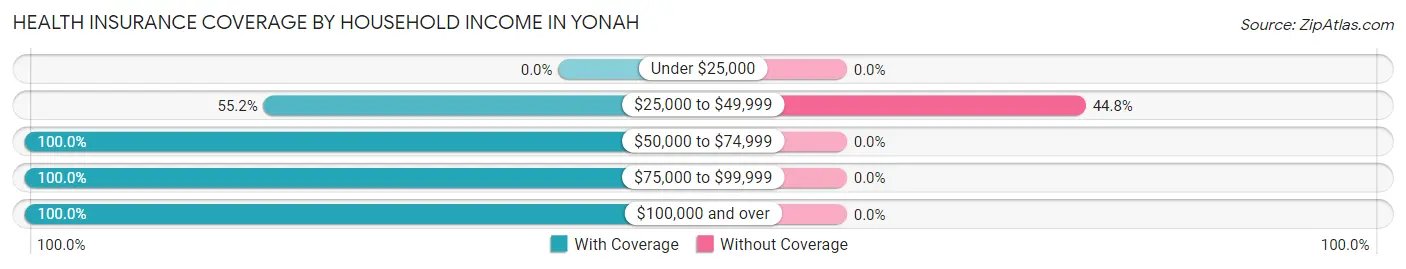
| Household Income | With Coverage | Without Coverage |
| Under $25,000 | 0 (0.0%) | 0 (0.0%) |
| $25,000 to $49,999 | 79 (55.2%) | 64 (44.8%) |
| $50,000 to $74,999 | 71 (100.0%) | 0 (0.0%) |
| $75,000 to $99,999 | 335 (100.0%) | 0 (0.0%) |
| $100,000 and over | 19 (100.0%) | 0 (0.0%) |
Public vs Private Health Insurance Coverage by Age in Yonah
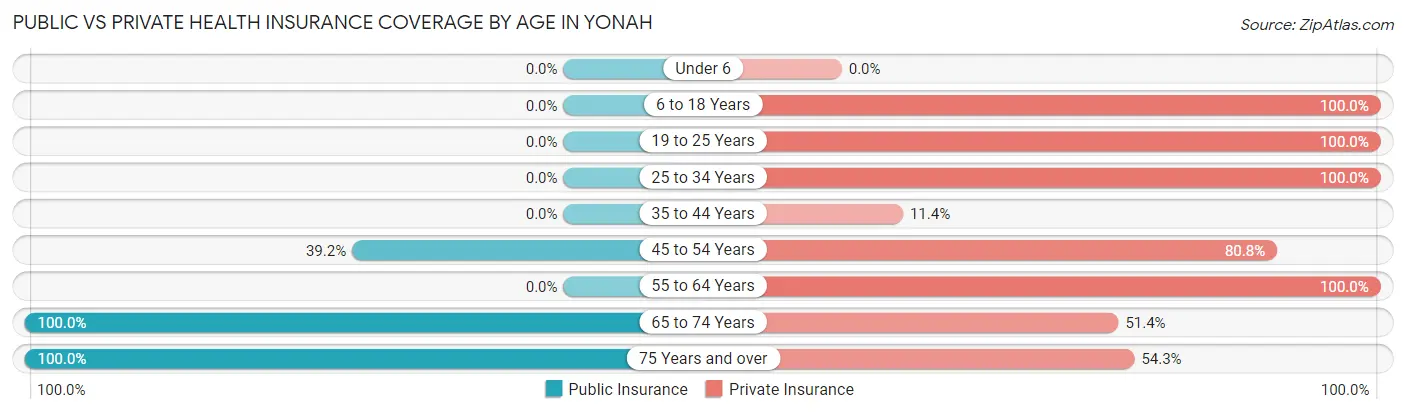
| Age Bracket | Public Insurance | Private Insurance |
| Under 6 | 0 (0.0%) | 0 (0.0%) |
| 6 to 18 Years | 0 (0.0%) | 73 (100.0%) |
| 19 to 25 Years | 0 (0.0%) | 157 (100.0%) |
| 25 to 34 Years | 0 (0.0%) | 27 (100.0%) |
| 35 to 44 Years | 0 (0.0%) | 5 (11.4%) |
| 45 to 54 Years | 51 (39.2%) | 105 (80.8%) |
| 55 to 64 Years | 0 (0.0%) | 19 (100.0%) |
| 65 to 74 Years | 37 (100.0%) | 19 (51.3%) |
| 75 Years and over | 81 (100.0%) | 44 (54.3%) |
| Total | 169 (29.7%) | 449 (79.0%) |
Disability Status by Sex by Age in Yonah
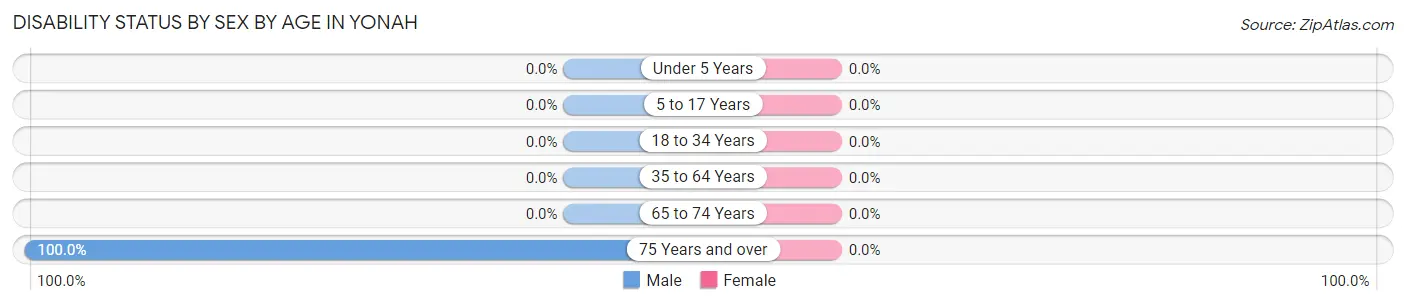
| Age Bracket | Male | Female |
| Under 5 Years | 0 (0.0%) | 0 (0.0%) |
| 5 to 17 Years | 0 (0.0%) | 0 (0.0%) |
| 18 to 34 Years | 0 (0.0%) | 0 (0.0%) |
| 35 to 64 Years | 0 (0.0%) | 0 (0.0%) |
| 65 to 74 Years | 0 (0.0%) | 0 (0.0%) |
| 75 Years and over | 8 (100.0%) | 0 (0.0%) |
Disability Class by Sex by Age in Yonah
Disability Class: Hearing Difficulty
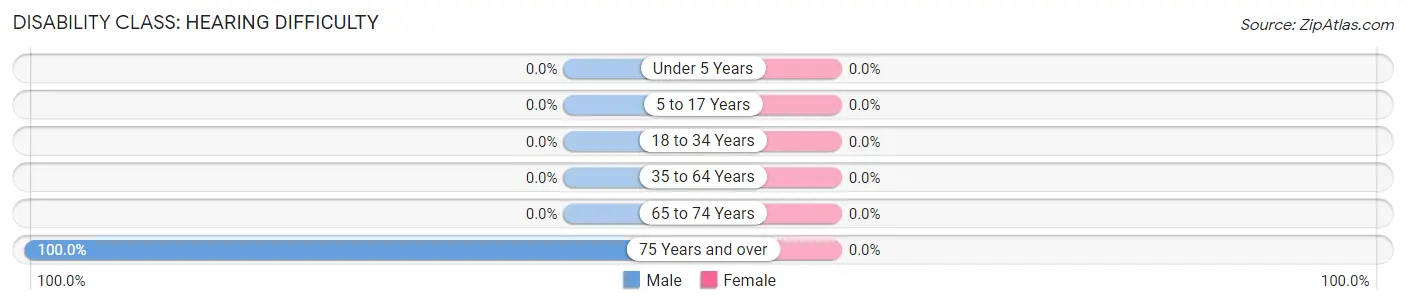
| Age Bracket | Male | Female |
| Under 5 Years | 0 (0.0%) | 0 (0.0%) |
| 5 to 17 Years | 0 (0.0%) | 0 (0.0%) |
| 18 to 34 Years | 0 (0.0%) | 0 (0.0%) |
| 35 to 64 Years | 0 (0.0%) | 0 (0.0%) |
| 65 to 74 Years | 0 (0.0%) | 0 (0.0%) |
| 75 Years and over | 8 (100.0%) | 0 (0.0%) |
Disability Class: Vision Difficulty
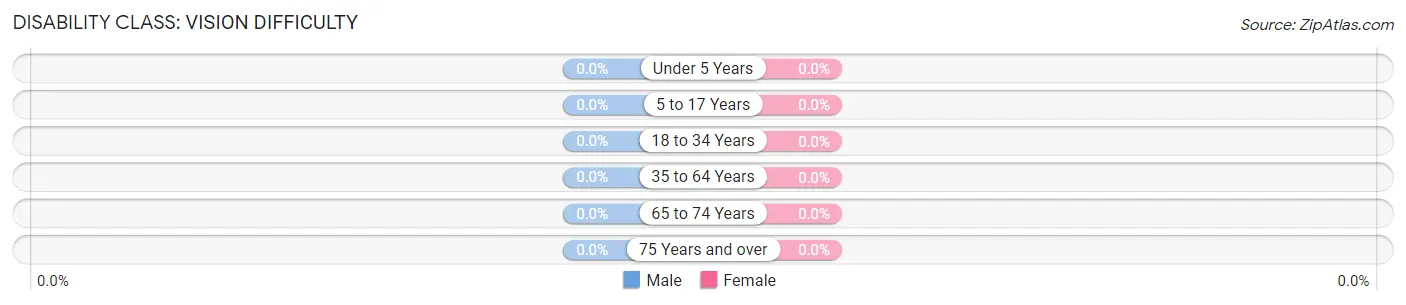
| Age Bracket | Male | Female |
| Under 5 Years | 0 (0.0%) | 0 (0.0%) |
| 5 to 17 Years | 0 (0.0%) | 0 (0.0%) |
| 18 to 34 Years | 0 (0.0%) | 0 (0.0%) |
| 35 to 64 Years | 0 (0.0%) | 0 (0.0%) |
| 65 to 74 Years | 0 (0.0%) | 0 (0.0%) |
| 75 Years and over | 0 (0.0%) | 0 (0.0%) |
Disability Class: Cognitive Difficulty
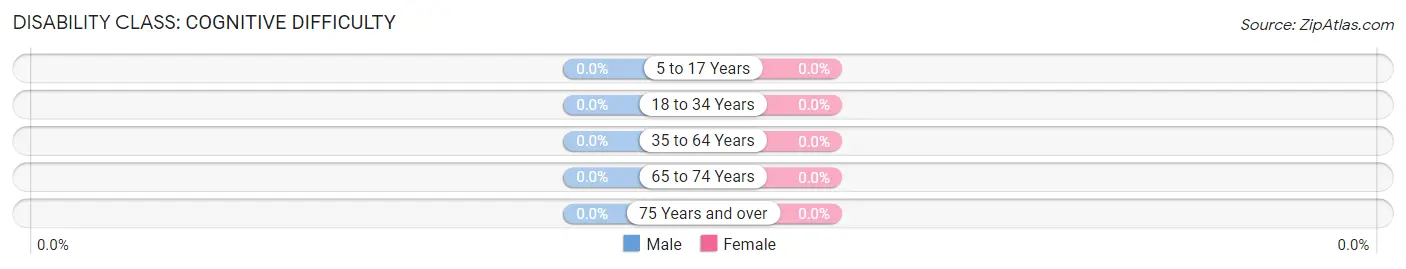
| Age Bracket | Male | Female |
| 5 to 17 Years | 0 (0.0%) | 0 (0.0%) |
| 18 to 34 Years | 0 (0.0%) | 0 (0.0%) |
| 35 to 64 Years | 0 (0.0%) | 0 (0.0%) |
| 65 to 74 Years | 0 (0.0%) | 0 (0.0%) |
| 75 Years and over | 0 (0.0%) | 0 (0.0%) |
Disability Class: Ambulatory Difficulty
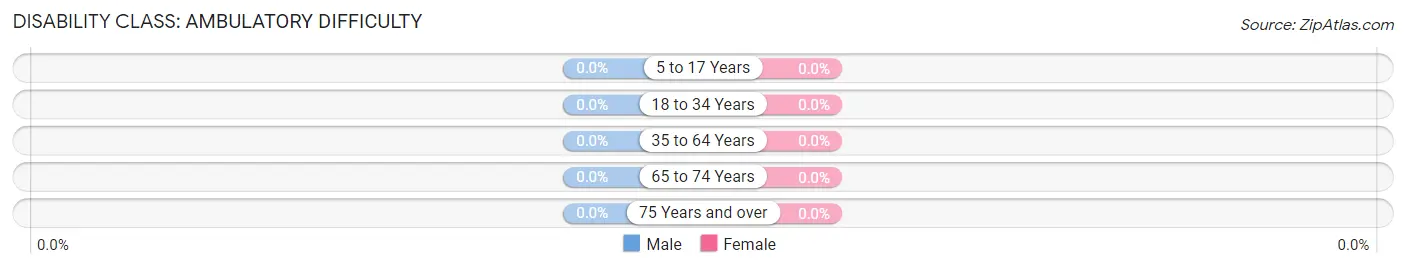
| Age Bracket | Male | Female |
| 5 to 17 Years | 0 (0.0%) | 0 (0.0%) |
| 18 to 34 Years | 0 (0.0%) | 0 (0.0%) |
| 35 to 64 Years | 0 (0.0%) | 0 (0.0%) |
| 65 to 74 Years | 0 (0.0%) | 0 (0.0%) |
| 75 Years and over | 0 (0.0%) | 0 (0.0%) |
Disability Class: Self-Care Difficulty

| Age Bracket | Male | Female |
| 5 to 17 Years | 0 (0.0%) | 0 (0.0%) |
| 18 to 34 Years | 0 (0.0%) | 0 (0.0%) |
| 35 to 64 Years | 0 (0.0%) | 0 (0.0%) |
| 65 to 74 Years | 0 (0.0%) | 0 (0.0%) |
| 75 Years and over | 0 (0.0%) | 0 (0.0%) |
Technology Access in Yonah
Computing Device Access in Yonah
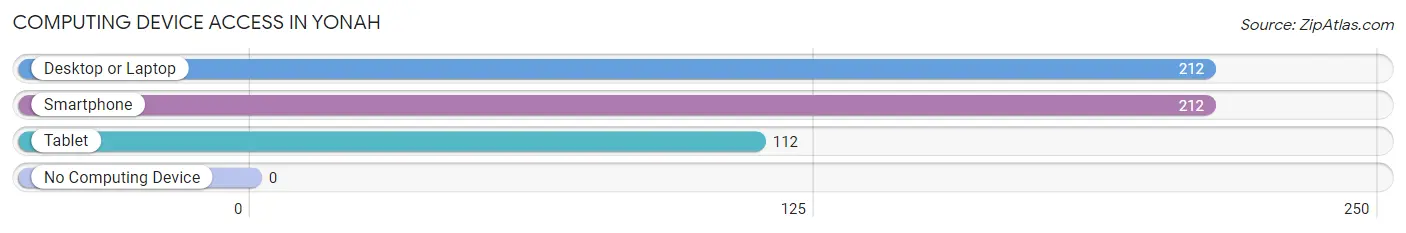
| Device Type | # Households | % Households |
| Desktop or Laptop | 212 | 100.0% |
| Smartphone | 212 | 100.0% |
| Tablet | 112 | 52.8% |
| No Computing Device | 0 | 0.0% |
| Total | 212 | 100.0% |
Internet Access in Yonah
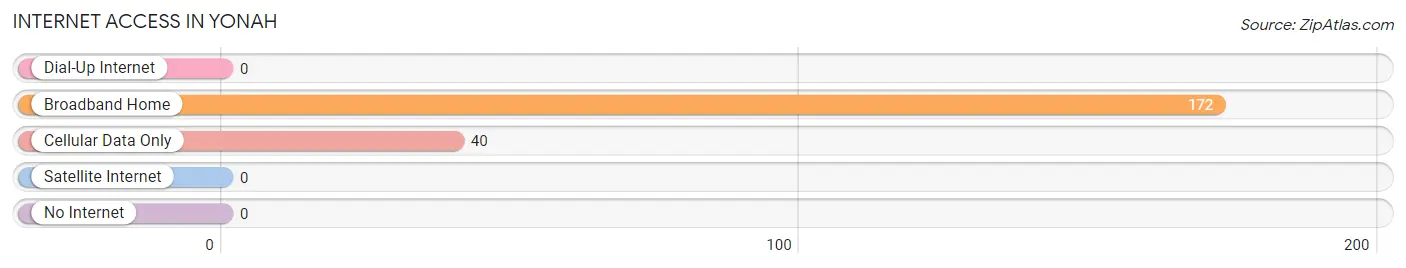
| Internet Type | # Households | % Households |
| Dial-Up Internet | 0 | 0.0% |
| Broadband Home | 172 | 81.1% |
| Cellular Data Only | 40 | 18.9% |
| Satellite Internet | 0 | 0.0% |
| No Internet | 0 | 0.0% |
| Total | 212 | 100.0% |
Yonah Summary
Yonah, Georgia is a small town located in White County, Georgia, United States. It is situated in the foothills of the Blue Ridge Mountains, approximately 80 miles northeast of Atlanta. The town was named after the Cherokee chief Yonah, who lived in the area in the early 1800s. The population of Yonah was estimated to be 1,072 in 2019.
History
Yonah was founded in 1832 by a group of settlers from North Carolina. The town was originally known as "Yonah's Town" after the Cherokee chief Yonah, who lived in the area. The town was incorporated in 1883 and was named after the chief.
The town was a major center for the production of cotton and other agricultural products. The town also had a number of mills, including a grist mill, a saw mill, and a cotton gin. The town was also home to a number of stores, churches, and schools.
In the late 19th century, the town was a major stop on the Gainesville, Jefferson, and Southern Railroad. The railroad was later replaced by the Gainesville Midland Railway, which ran through the town until the 1950s.
Geography
Yonah is located in White County, Georgia, in the foothills of the Blue Ridge Mountains. The town is situated at an elevation of 1,072 feet (326 m) above sea level. The town is located approximately 80 miles (129 km) northeast of Atlanta.
The town is located in the Chattahoochee National Forest and is surrounded by the Chattahoochee-Oconee National Forest. The town is also located near the Chattahoochee River, which is a popular destination for fishing and other recreational activities.
Economy
The economy of Yonah is largely based on agriculture and tourism. The town is home to a number of farms, which produce a variety of crops, including corn, soybeans, and cotton. The town is also home to a number of tourist attractions, including the Yonah Mountain Vineyards, which produces a variety of wines.
The town is also home to a number of small businesses, including restaurants, shops, and other services. The town is also home to a number of manufacturing companies, including a furniture factory and a textile mill.
Demographics
The population of Yonah was estimated to be 1,072 in 2019. The town has a median age of 44.7 years, with a gender ratio of 50.3% male and 49.7% female. The racial makeup of the town is 97.2% White, 0.9% African American, 0.3% Native American, 0.3% Asian, and 1.3% from other races.
The town has a median household income of $41,944 and a poverty rate of 16.3%. The town has a high school graduation rate of 87.3%. The town is served by the White County School District.
Conclusion
Yonah, Georgia is a small town located in White County, Georgia, United States. It is situated in the foothills of the Blue Ridge Mountains, approximately 80 miles northeast of Atlanta. The town was named after the Cherokee chief Yonah, who lived in the area in the early 1800s. The population of Yonah was estimated to be 1,072 in 2019. The economy of Yonah is largely based on agriculture and tourism. The town is home to a number of farms, which produce a variety of crops, including corn, soybeans, and cotton. The town is also home to a number of tourist attractions, including the Yonah Mountain Vineyards, which produces a variety of wines. The town has a median age of 44.7 years, with a gender ratio of 50.3% male and 49.7% female. The racial makeup of the town is 97.2% White, 0.9% African American, 0.3% Native American, 0.3% Asian, and 1.3% from other races. The town has a median household income of $41,944 and a poverty rate of 16.3%. The town has a high school graduation rate of 87.3%.
Common Questions
What is the Total Population of Yonah?
Total Population of Yonah is 568.
What is the Total Male Population of Yonah?
Total Male Population of Yonah is 376.
What is the Total Female Population of Yonah?
Total Female Population of Yonah is 192.
What is the Ratio of Males per 100 Females in Yonah?
There are 195.83 Males per 100 Females in Yonah.
What is the Ratio of Females per 100 Males in Yonah?
There are 51.06 Females per 100 Males in Yonah.
What is the Median Population Age in Yonah?
Median Population Age in Yonah is 36.7 Years.
What is the Average Family Size in Yonah
Average Family Size in Yonah is 4.3 People.
What is the Average Household Size in Yonah
Average Household Size in Yonah is 2.7 People.
What is Per Capita Income in Yonah?
Per Capita income in Yonah is $28,473.
What is the Median Family Income in Yonah?
Median Family Income in Yonah is $98,310.
What is the Median Household income in Yonah?
Median Household Income in Yonah is $58,580.
What is Income or Wage Gap in Yonah?
Income or Wage Gap in Yonah is 13.4%.
Women in Yonah earn 86.6 cents for every dollar earned by a man.
What is Inequality or Gini Index in Yonah?
Inequality or Gini Index in Yonah is 0.26.
How Large is the Labor Force in Yonah?
There are 466 People in the Labor Forcein in Yonah.
What is the Percentage of People in the Labor Force in Yonah?
82.0% of People are in the Labor Force in Yonah.
What is the Unemployment Rate in Yonah?
Unemployment Rate in Yonah is 5.4%.