Island Walk, FL
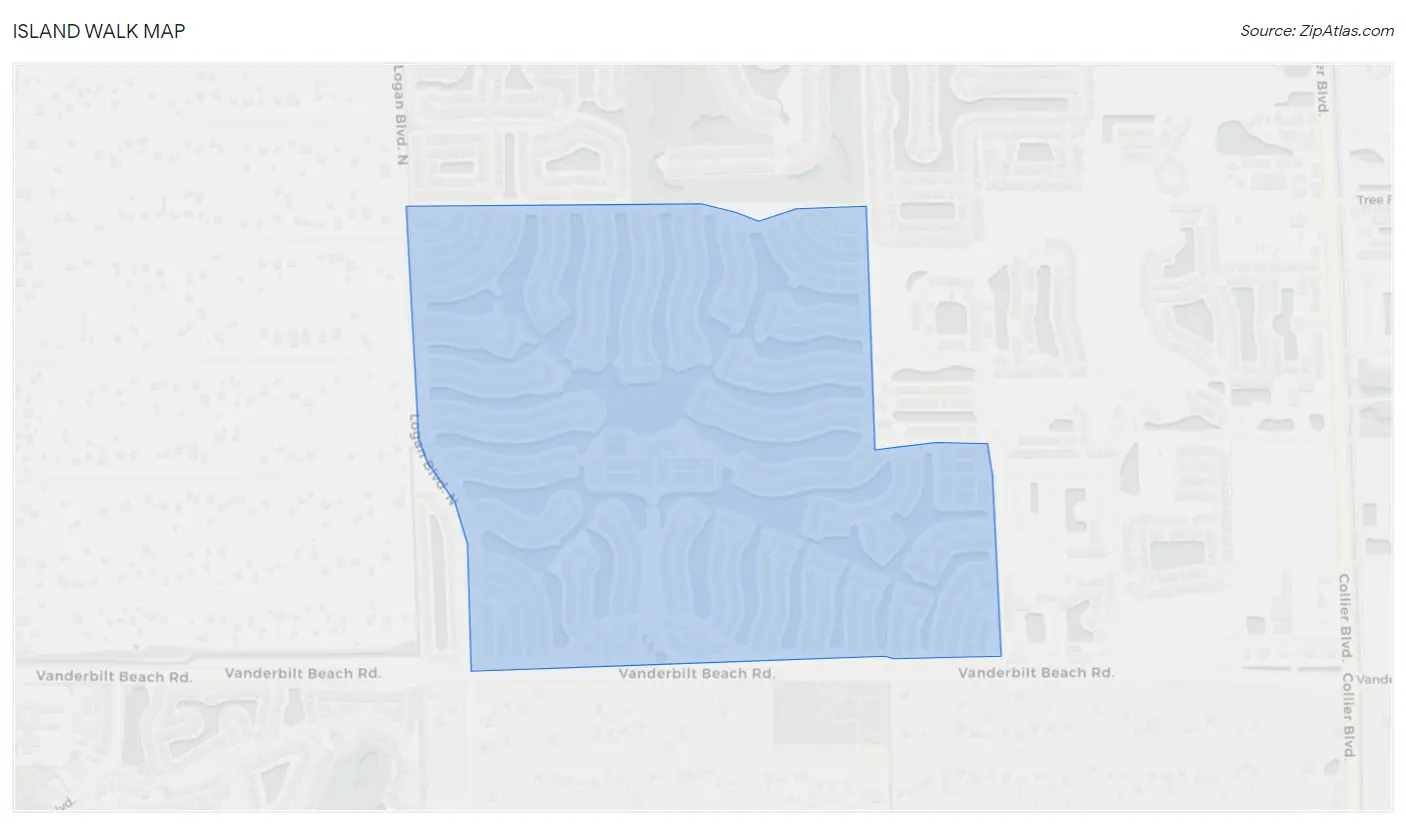
Island Walk Map
Island Walk Overview
2,679
TOTAL POPULATION
1,043
MALE POPULATION
1,636
FEMALE POPULATION
63.75
MALES / 100 FEMALES
156.86
FEMALES / 100 MALES
67.8
MEDIAN AGE
2.3
AVG FAMILY SIZE
2.1
AVG HOUSEHOLD SIZE
$38,758
PER CAPITA INCOME
$84,688
AVG FAMILY INCOME
$76,315
AVG HOUSEHOLD INCOME
0.39
INEQUALITY / GINI INDEX
816
LABOR FORCE [ PEOPLE ]
31.9%
PERCENT IN LABOR FORCE
15.6%
UNEMPLOYMENT RATE
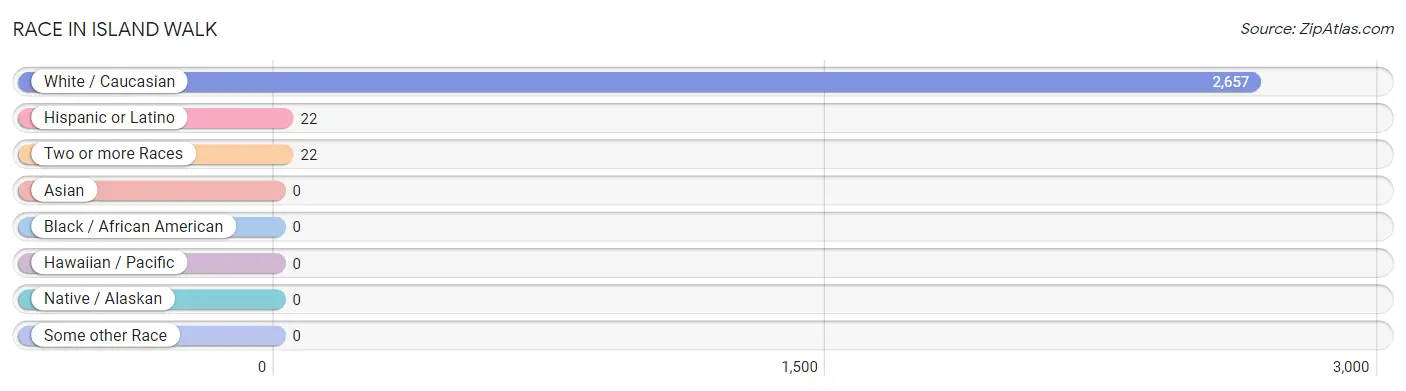
Race in Island Walk
The most populous races in Island Walk are White / Caucasian (2,657 | 99.2%), Hispanic or Latino (22 | 0.8%), and Two or more Races (22 | 0.8%).
| Race | # Population | % Population |
| Asian | 0 | 0.0% |
| Black / African American | 0 | 0.0% |
| Hawaiian / Pacific | 0 | 0.0% |
| Hispanic or Latino | 22 | 0.8% |
| Native / Alaskan | 0 | 0.0% |
| White / Caucasian | 2,657 | 99.2% |
| Two or more Races | 22 | 0.8% |
| Some other Race | 0 | 0.0% |
| Total | 2,679 | 100.0% |
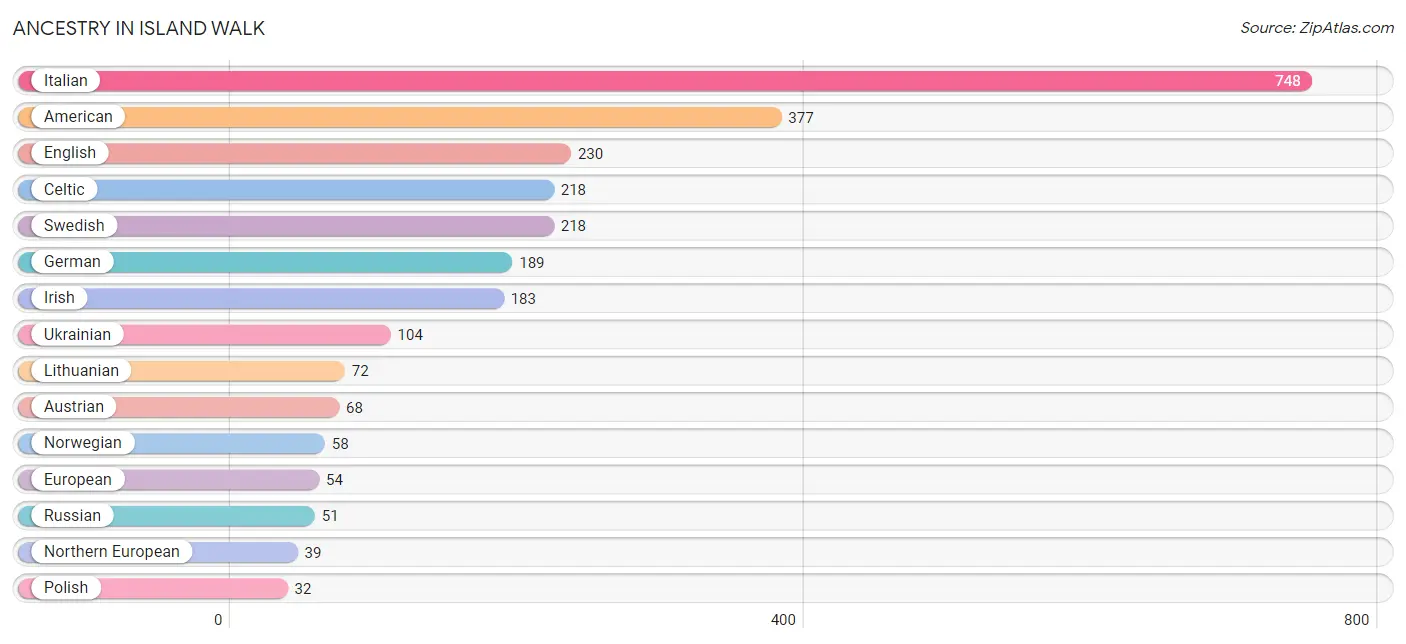
Ancestry in Island Walk
The most populous ancestries reported in Island Walk are Italian (748 | 27.9%), American (377 | 14.1%), English (230 | 8.6%), Celtic (218 | 8.1%), and Swedish (218 | 8.1%), together accounting for 66.9% of all Island Walk residents.
| Ancestry | # Population | % Population |
| American | 377 | 14.1% |
| Austrian | 68 | 2.5% |
| Celtic | 218 | 8.1% |
| Czech | 25 | 0.9% |
| Dutch | 20 | 0.7% |
| English | 230 | 8.6% |
| European | 54 | 2.0% |
| German | 189 | 7.0% |
| Hungarian | 26 | 1.0% |
| Irish | 183 | 6.8% |
| Italian | 748 | 27.9% |
| Lithuanian | 72 | 2.7% |
| Northern European | 39 | 1.5% |
| Norwegian | 58 | 2.2% |
| Peruvian | 22 | 0.8% |
| Polish | 32 | 1.2% |
| Russian | 51 | 1.9% |
| Scotch-Irish | 15 | 0.6% |
| Scottish | 31 | 1.2% |
| Slovak | 10 | 0.4% |
| South American | 22 | 0.8% |
| Swedish | 218 | 8.1% |
| Ukrainian | 104 | 3.9% | View All 23 Rows |
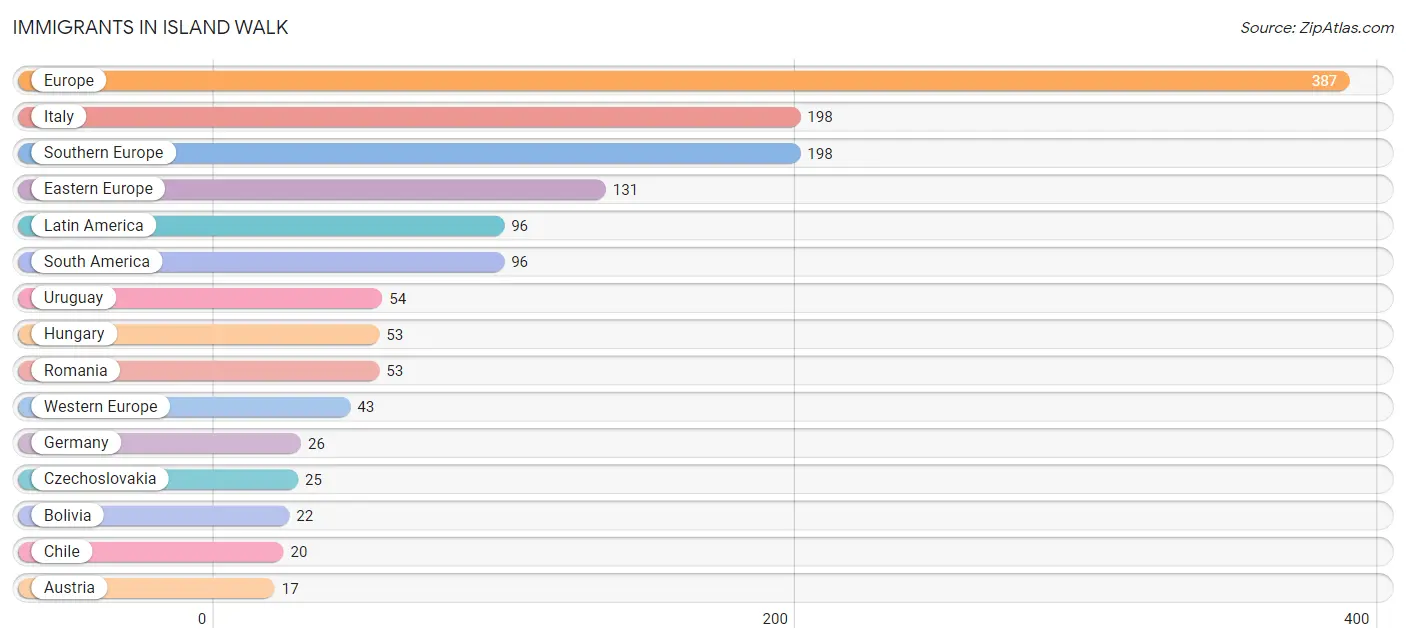
Immigrants in Island Walk
The most numerous immigrant groups reported in Island Walk came from Europe (387 | 14.4%), Italy (198 | 7.4%), Southern Europe (198 | 7.4%), Eastern Europe (131 | 4.9%), and Latin America (96 | 3.6%), together accounting for 37.7% of all Island Walk residents.
| Immigration Origin | # Population | % Population |
| Austria | 17 | 0.6% |
| Bolivia | 22 | 0.8% |
| Chile | 20 | 0.7% |
| Czechoslovakia | 25 | 0.9% |
| Eastern Europe | 131 | 4.9% |
| England | 15 | 0.6% |
| Europe | 387 | 14.4% |
| Germany | 26 | 1.0% |
| Hungary | 53 | 2.0% |
| Italy | 198 | 7.4% |
| Latin America | 96 | 3.6% |
| Northern Europe | 15 | 0.6% |
| Romania | 53 | 2.0% |
| South America | 96 | 3.6% |
| Southern Europe | 198 | 7.4% |
| Uruguay | 54 | 2.0% |
| Western Europe | 43 | 1.6% | View All 17 Rows |
Sex and Age in Island Walk
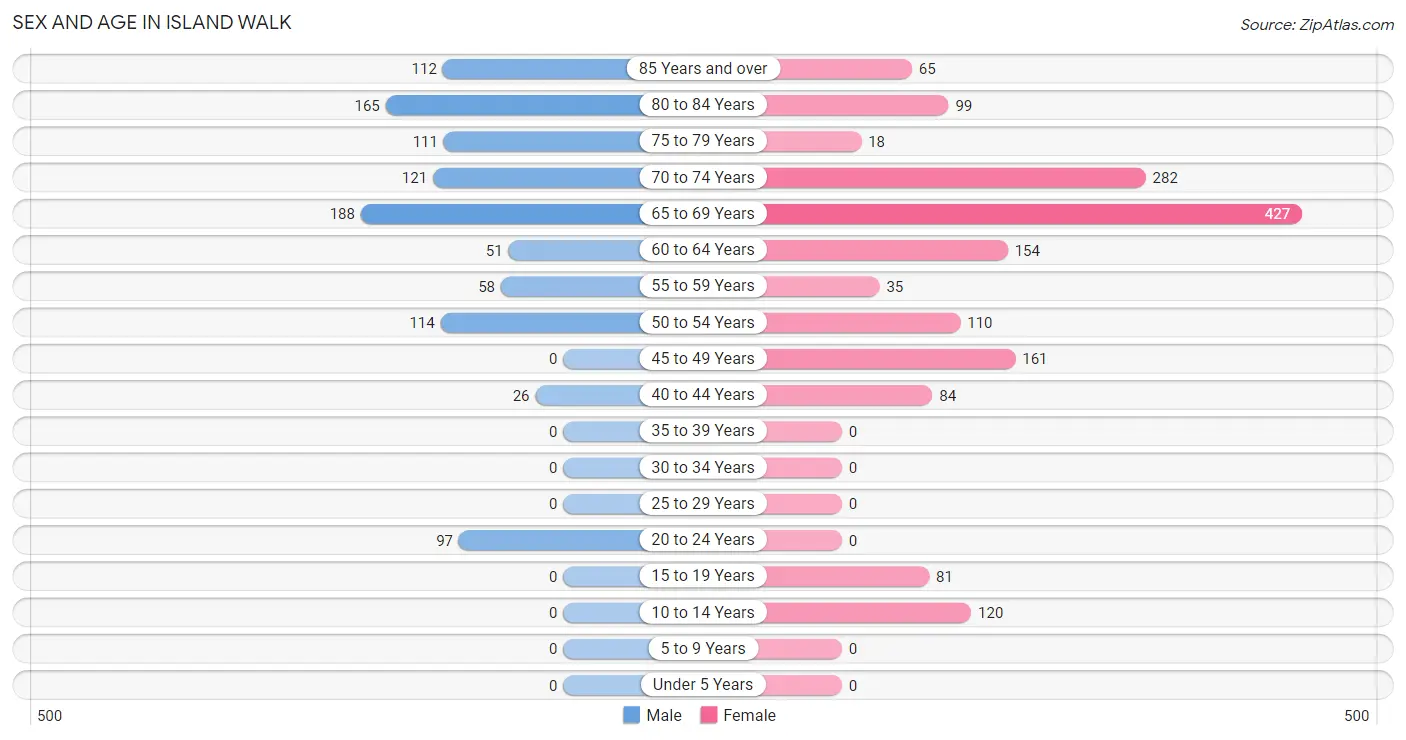
Sex and Age in Island Walk
The most populous age groups in Island Walk are 65 to 69 Years (188 | 18.0%) for men and 65 to 69 Years (427 | 26.1%) for women.
| Age Bracket | Male | Female |
| Under 5 Years | 0 (0.0%) | 0 (0.0%) |
| 5 to 9 Years | 0 (0.0%) | 0 (0.0%) |
| 10 to 14 Years | 0 (0.0%) | 120 (7.3%) |
| 15 to 19 Years | 0 (0.0%) | 81 (5.0%) |
| 20 to 24 Years | 97 (9.3%) | 0 (0.0%) |
| 25 to 29 Years | 0 (0.0%) | 0 (0.0%) |
| 30 to 34 Years | 0 (0.0%) | 0 (0.0%) |
| 35 to 39 Years | 0 (0.0%) | 0 (0.0%) |
| 40 to 44 Years | 26 (2.5%) | 84 (5.1%) |
| 45 to 49 Years | 0 (0.0%) | 161 (9.8%) |
| 50 to 54 Years | 114 (10.9%) | 110 (6.7%) |
| 55 to 59 Years | 58 (5.6%) | 35 (2.1%) |
| 60 to 64 Years | 51 (4.9%) | 154 (9.4%) |
| 65 to 69 Years | 188 (18.0%) | 427 (26.1%) |
| 70 to 74 Years | 121 (11.6%) | 282 (17.2%) |
| 75 to 79 Years | 111 (10.6%) | 18 (1.1%) |
| 80 to 84 Years | 165 (15.8%) | 99 (6.0%) |
| 85 Years and over | 112 (10.7%) | 65 (4.0%) |
| Total | 1,043 (100.0%) | 1,636 (100.0%) |
Families and Households in Island Walk
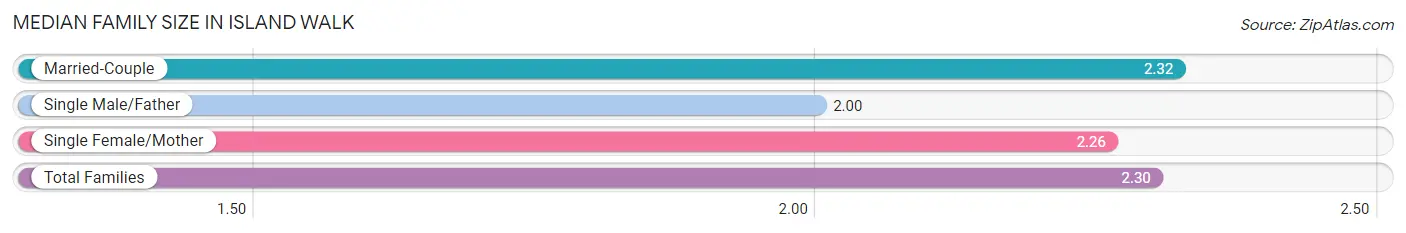
Median Family Size in Island Walk
The median family size in Island Walk is 2.30 persons per family, with married-couple families (824 | 81.4%) accounting for the largest median family size of 2.32 persons per family. On the other hand, single male/father families (10 | 1.0%) represent the smallest median family size with 2.00 persons per family.
| Family Type | # Families | Family Size |
| Married-Couple | 824 (81.4%) | 2.32 |
| Single Male/Father | 10 (1.0%) | 2.00 |
| Single Female/Mother | 178 (17.6%) | 2.26 |
| Total Families | 1,012 (100.0%) | 2.30 |
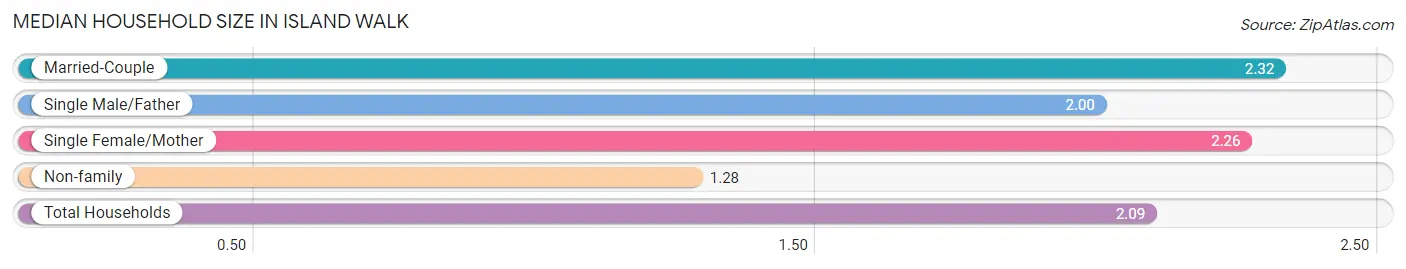
Median Household Size in Island Walk
The median household size in Island Walk is 2.09 persons per household, with married-couple households (824 | 64.2%) accounting for the largest median household size of 2.32 persons per household. non-family households (271 | 21.1%) represent the smallest median household size with 1.28 persons per household.
| Household Type | # Households | Household Size |
| Married-Couple | 824 (64.2%) | 2.32 |
| Single Male/Father | 10 (0.8%) | 2.00 |
| Single Female/Mother | 178 (13.9%) | 2.26 |
| Non-family | 271 (21.1%) | 1.28 |
| Total Households | 1,283 (100.0%) | 2.09 |
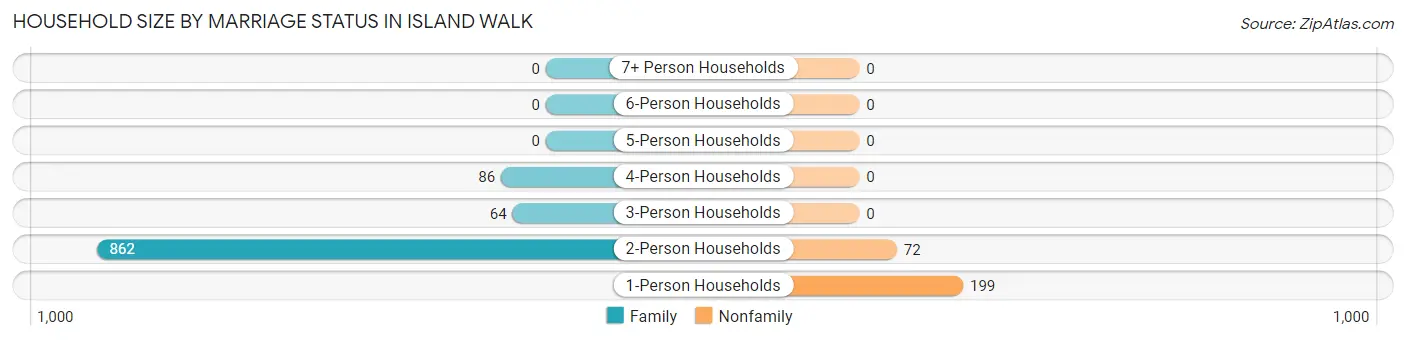
Household Size by Marriage Status in Island Walk
Out of a total of 1,283 households in Island Walk, 1,012 (78.9%) are family households, while 271 (21.1%) are nonfamily households. The most numerous type of family households are 2-person households, comprising 862, and the most common type of nonfamily households are 1-person households, comprising 199.
| Household Size | Family Households | Nonfamily Households |
| 1-Person Households | - | 199 (15.5%) |
| 2-Person Households | 862 (67.2%) | 72 (5.6%) |
| 3-Person Households | 64 (5.0%) | 0 (0.0%) |
| 4-Person Households | 86 (6.7%) | 0 (0.0%) |
| 5-Person Households | 0 (0.0%) | 0 (0.0%) |
| 6-Person Households | 0 (0.0%) | 0 (0.0%) |
| 7+ Person Households | 0 (0.0%) | 0 (0.0%) |
| Total | 1,012 (78.9%) | 271 (21.1%) |
Female Fertility in Island Walk
Fertility by Age in Island Walk
| Age Bracket | Women with Births | Births / 1,000 Women |
| 15 to 19 years | 0 (0.0%) | 0.0 |
| 20 to 34 years | 0 (0.0%) | 0.0 |
| 35 to 50 years | 0 (0.0%) | 0.0 |
| Total | 0 (0.0%) | 0.0 |
Fertility by Age by Marriage Status in Island Walk
| Age Bracket | Married | Unmarried |
| 15 to 19 years | 0 (0.0%) | 0 (0.0%) |
| 20 to 34 years | 0 (0.0%) | 0 (0.0%) |
| 35 to 50 years | 0 (0.0%) | 0 (0.0%) |
| Total | 0 (0.0%) | 0 (0.0%) |
Fertility by Education in Island Walk
| Educational Attainment | Women with Births | Births / 1,000 Women |
| Less than High School | 0 (0.0%) | 0.0 |
| High School Diploma | 0 (0.0%) | 0.0 |
| College or Associate's Degree | 0 (0.0%) | 0.0 |
| Bachelor's Degree | 0 (0.0%) | 0.0 |
| Graduate Degree | 0 (0.0%) | 0.0 |
| Total | 0 (0.0%) | 0.0 |
Fertility by Education by Marriage Status in Island Walk
| Educational Attainment | Married | Unmarried |
| Less than High School | 0 (0.0%) | 0 (0.0%) |
| High School Diploma | 0 (0.0%) | 0 (0.0%) |
| College or Associate's Degree | 0 (0.0%) | 0 (0.0%) |
| Bachelor's Degree | 0 (0.0%) | 0 (0.0%) |
| Graduate Degree | 0 (0.0%) | 0 (0.0%) |
| Total | 0 (0.0%) | 0 (0.0%) |
Income in Island Walk
Income Overview in Island Walk
Per Capita Income in Island Walk is $38,758, while median incomes of families and households are $84,688 and $76,315 respectively.
| Characteristic | Number | Measure |
| Per Capita Income | 2,679 | $38,758 |
| Median Family Income | 1,012 | $84,688 |
| Mean Family Income | 1,012 | $89,785 |
| Median Household Income | 1,283 | $76,315 |
| Mean Household Income | 1,283 | $80,498 |
| Income Deficit | 1,012 | $0 |
| Wage / Income Gap (%) | 2,679 | 0.00% |
| Wage / Income Gap ($) | 2,679 | 100.00¢ per $1 |
| Gini / Inequality Index | 2,679 | 0.39 |
Earnings by Sex in Island Walk
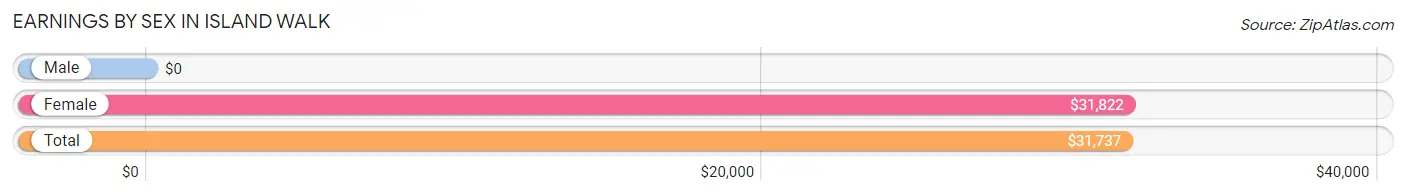
| Sex | Number | Average Earnings |
| Male | 326 (36.9%) | $0 |
| Female | 558 (63.1%) | $31,822 |
| Total | 884 (100.0%) | $31,737 |
Earnings by Sex by Income Bracket in Island Walk
The most common earnings brackets in Island Walk are $5,000 to $7,499 for men (97 | 29.7%) and $65,000 to $74,999 for women (160 | 28.7%).
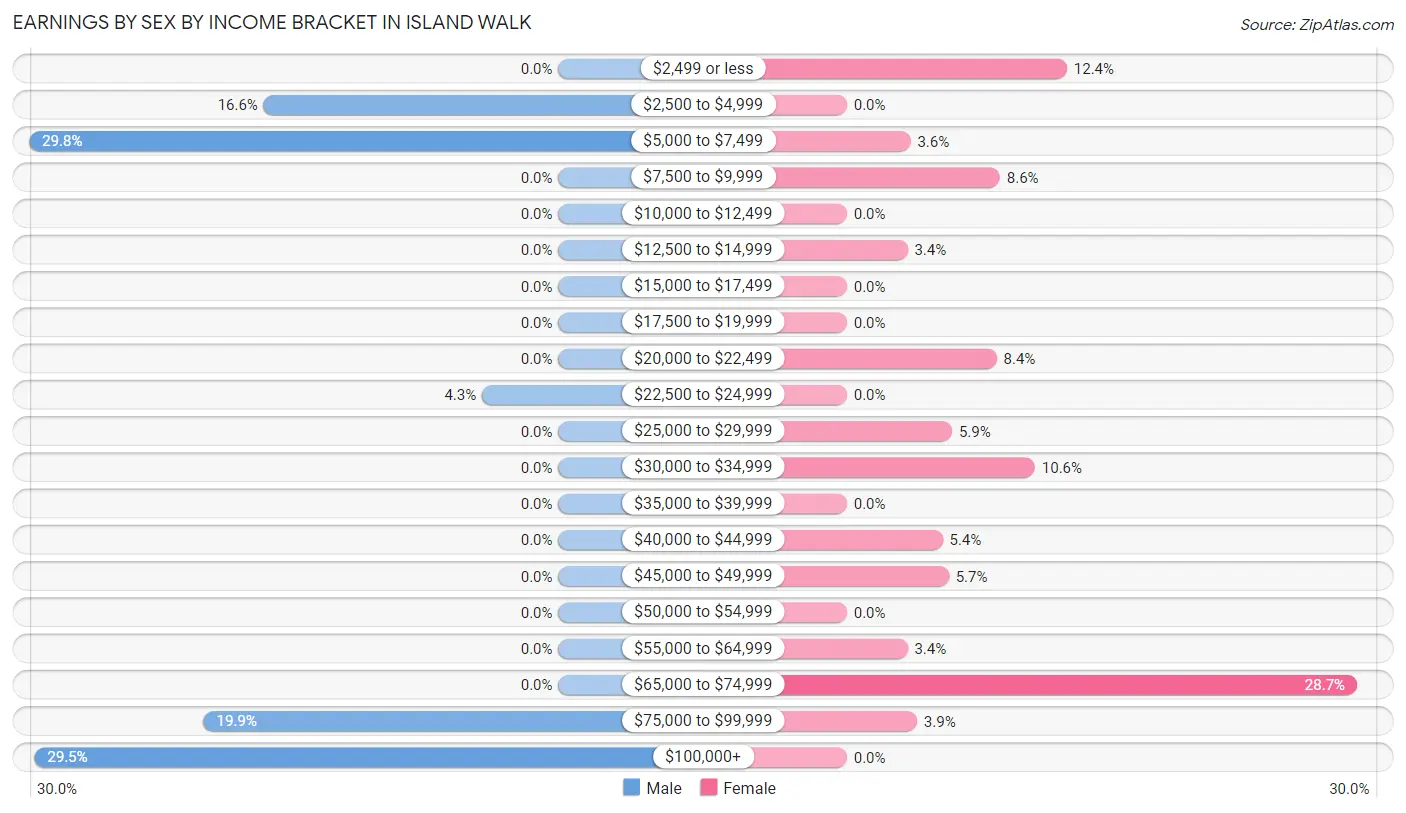
| Income | Male | Female |
| $2,499 or less | 0 (0.0%) | 69 (12.4%) |
| $2,500 to $4,999 | 54 (16.6%) | 0 (0.0%) |
| $5,000 to $7,499 | 97 (29.7%) | 20 (3.6%) |
| $7,500 to $9,999 | 0 (0.0%) | 48 (8.6%) |
| $10,000 to $12,499 | 0 (0.0%) | 0 (0.0%) |
| $12,500 to $14,999 | 0 (0.0%) | 19 (3.4%) |
| $15,000 to $17,499 | 0 (0.0%) | 0 (0.0%) |
| $17,500 to $19,999 | 0 (0.0%) | 0 (0.0%) |
| $20,000 to $22,499 | 0 (0.0%) | 47 (8.4%) |
| $22,500 to $24,999 | 14 (4.3%) | 0 (0.0%) |
| $25,000 to $29,999 | 0 (0.0%) | 33 (5.9%) |
| $30,000 to $34,999 | 0 (0.0%) | 59 (10.6%) |
| $35,000 to $39,999 | 0 (0.0%) | 0 (0.0%) |
| $40,000 to $44,999 | 0 (0.0%) | 30 (5.4%) |
| $45,000 to $49,999 | 0 (0.0%) | 32 (5.7%) |
| $50,000 to $54,999 | 0 (0.0%) | 0 (0.0%) |
| $55,000 to $64,999 | 0 (0.0%) | 19 (3.4%) |
| $65,000 to $74,999 | 0 (0.0%) | 160 (28.7%) |
| $75,000 to $99,999 | 65 (19.9%) | 22 (3.9%) |
| $100,000+ | 96 (29.4%) | 0 (0.0%) |
| Total | 326 (100.0%) | 558 (100.0%) |
Earnings by Sex by Educational Attainment in Island Walk
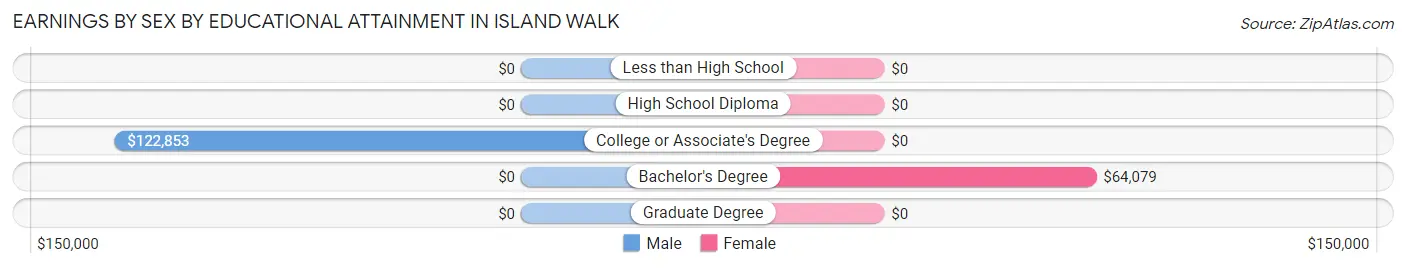
| Educational Attainment | Male Income | Female Income |
| Less than High School | - | - |
| High School Diploma | - | - |
| College or Associate's Degree | $122,853 | $0 |
| Bachelor's Degree | - | - |
| Graduate Degree | - | - |
| Total | $98,221 | $0 |
Family Income in Island Walk
Family Income Brackets in Island Walk
According to the Island Walk family income data, there are 257 families falling into the $75,000 to $99,999 income range, which is the most common income bracket and makes up 25.4% of all families.
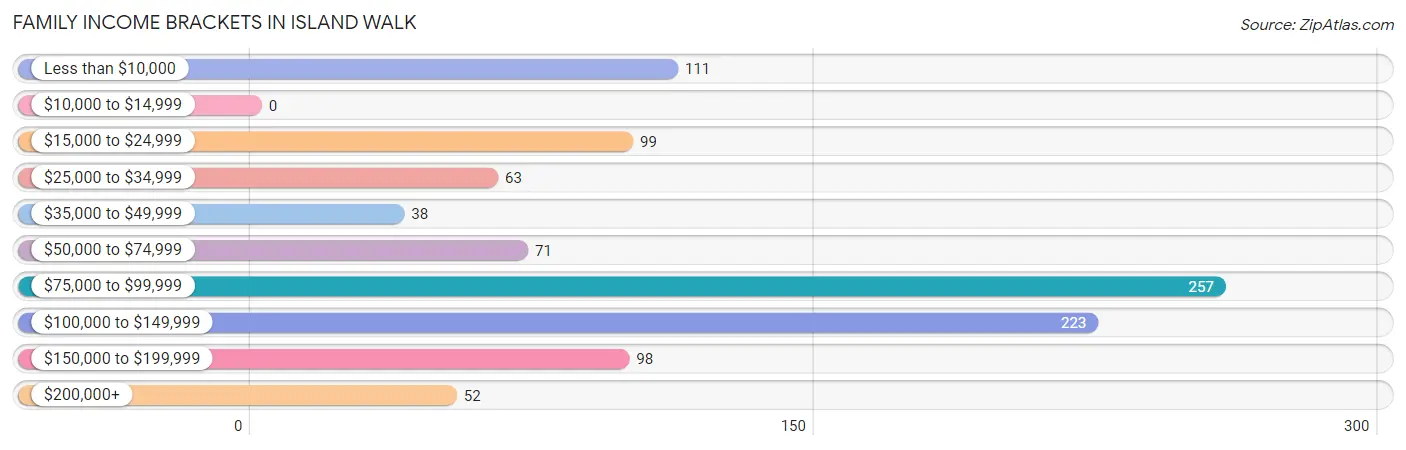
| Income Bracket | # Families | % Families |
| Less than $10,000 | 111 | 11.0% |
| $10,000 to $14,999 | 0 | 0.0% |
| $15,000 to $24,999 | 99 | 9.8% |
| $25,000 to $34,999 | 63 | 6.2% |
| $35,000 to $49,999 | 38 | 3.8% |
| $50,000 to $74,999 | 71 | 7.0% |
| $75,000 to $99,999 | 257 | 25.4% |
| $100,000 to $149,999 | 223 | 22.0% |
| $150,000 to $199,999 | 98 | 9.7% |
| $200,000+ | 52 | 5.1% |
Family Income by Famaliy Size in Island Walk
2-person families (862 | 85.2%) account for the highest median family income in Island Walk with $76,276 per family, while 2-person families (862 | 85.2%) have the highest median income of $38,138 per family member.
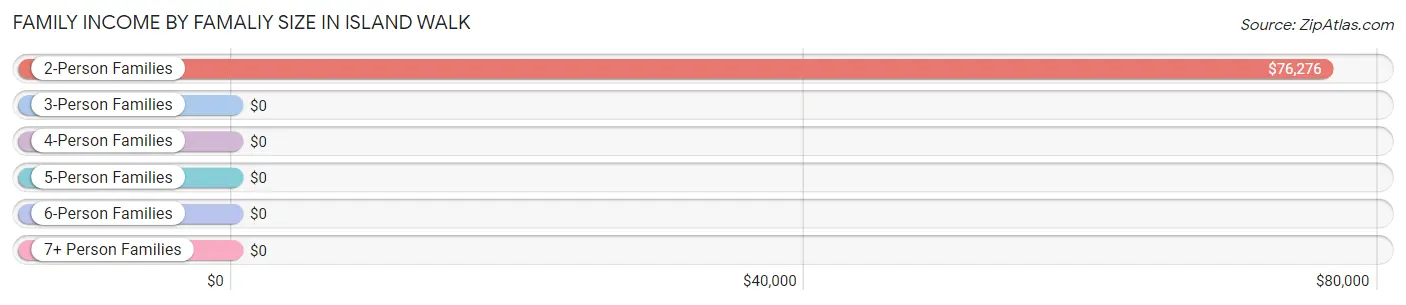
| Income Bracket | # Families | Median Income |
| 2-Person Families | 862 (85.2%) | $76,276 |
| 3-Person Families | 64 (6.3%) | $0 |
| 4-Person Families | 86 (8.5%) | $0 |
| 5-Person Families | 0 (0.0%) | $0 |
| 6-Person Families | 0 (0.0%) | $0 |
| 7+ Person Families | 0 (0.0%) | $0 |
| Total | 1,012 (100.0%) | $84,688 |
Family Income by Number of Earners in Island Walk
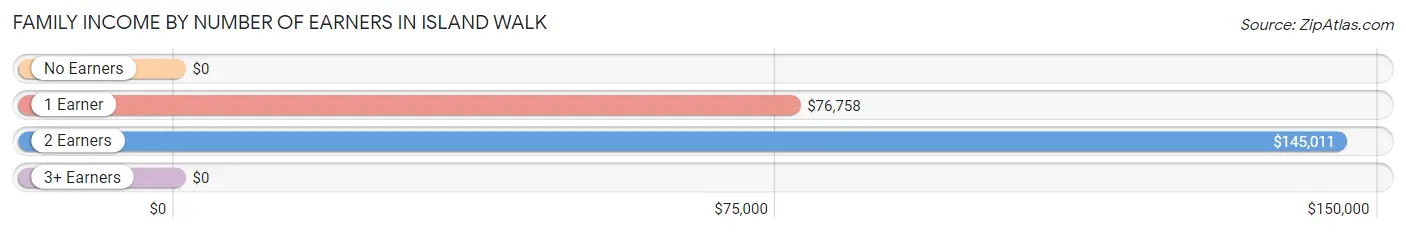
| Number of Earners | # Families | Median Income |
| No Earners | 530 (52.4%) | $0 |
| 1 Earner | 261 (25.8%) | $76,758 |
| 2 Earners | 221 (21.8%) | $145,011 |
| 3+ Earners | 0 (0.0%) | $0 |
| Total | 1,012 (100.0%) | $84,688 |
Household Income in Island Walk
Household Income Brackets in Island Walk
With 328 households falling in the category, the $75,000 to $99,999 income range is the most frequent in Island Walk, accounting for 25.6% of all households.
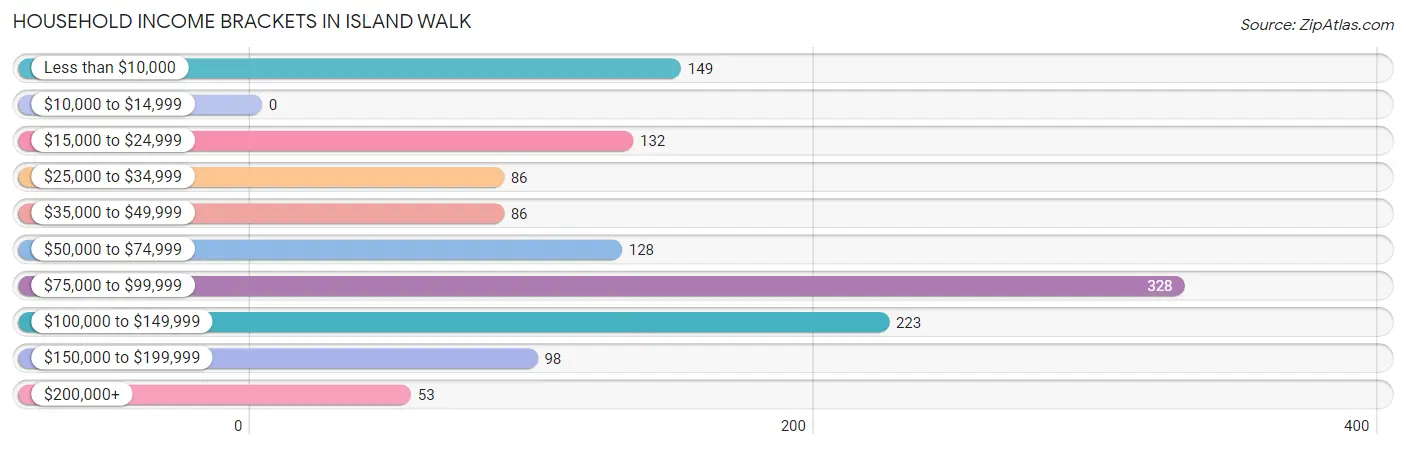
| Income Bracket | # Households | % Households |
| Less than $10,000 | 149 | 11.6% |
| $10,000 to $14,999 | 0 | 0.0% |
| $15,000 to $24,999 | 132 | 10.3% |
| $25,000 to $34,999 | 86 | 6.7% |
| $35,000 to $49,999 | 86 | 6.7% |
| $50,000 to $74,999 | 128 | 10.0% |
| $75,000 to $99,999 | 328 | 25.6% |
| $100,000 to $149,999 | 223 | 17.4% |
| $150,000 to $199,999 | 98 | 7.6% |
| $200,000+ | 53 | 4.1% |
Household Income by Householder Age in Island Walk
The median household income in Island Walk is $76,315, with the highest median household income of $135,897 found in the 45 to 64 years age bracket for the primary householder. A total of 252 households (19.6%) fall into this category.
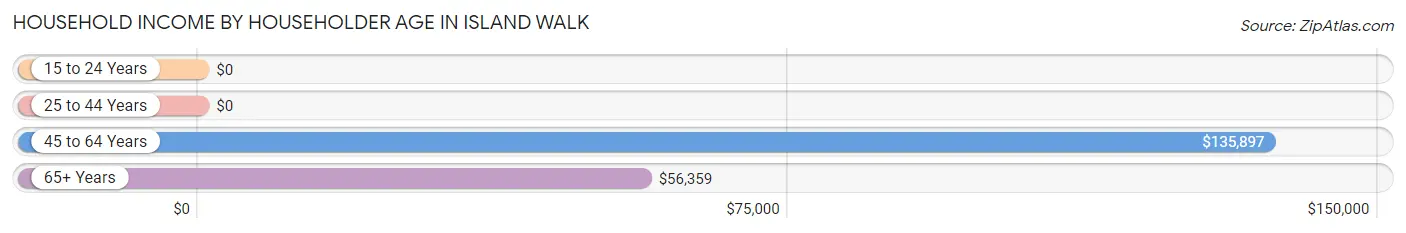
| Income Bracket | # Households | Median Income |
| 15 to 24 Years | 0 (0.0%) | $0 |
| 25 to 44 Years | 47 (3.7%) | $0 |
| 45 to 64 Years | 252 (19.6%) | $135,897 |
| 65+ Years | 984 (76.7%) | $56,359 |
| Total | 1,283 (100.0%) | $76,315 |
Poverty in Island Walk
Income Below Poverty by Sex and Age in Island Walk
With 10.6% poverty level for males and 8.6% for females among the residents of Island Walk, 65 to 74 year old males and 55 to 64 year old females are the most vulnerable to poverty, with 111 males (35.9%) and 123 females (65.1%) in their respective age groups living below the poverty level.
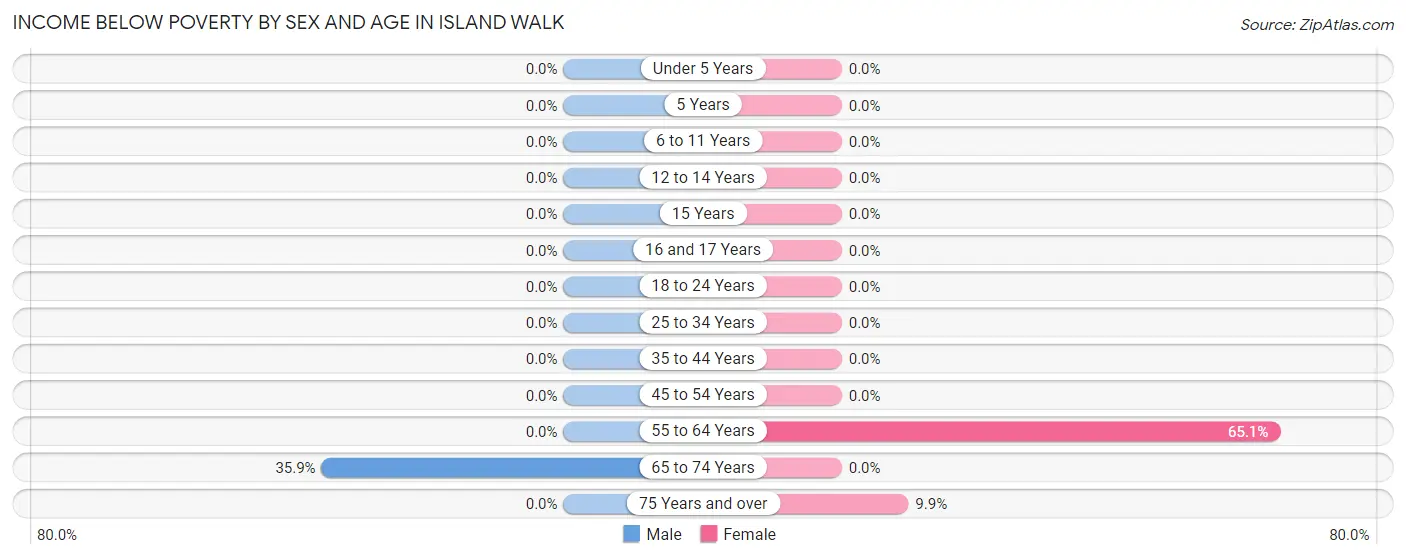
| Age Bracket | Male | Female |
| Under 5 Years | 0 (0.0%) | 0 (0.0%) |
| 5 Years | 0 (0.0%) | 0 (0.0%) |
| 6 to 11 Years | 0 (0.0%) | 0 (0.0%) |
| 12 to 14 Years | 0 (0.0%) | 0 (0.0%) |
| 15 Years | 0 (0.0%) | 0 (0.0%) |
| 16 and 17 Years | 0 (0.0%) | 0 (0.0%) |
| 18 to 24 Years | 0 (0.0%) | 0 (0.0%) |
| 25 to 34 Years | 0 (0.0%) | 0 (0.0%) |
| 35 to 44 Years | 0 (0.0%) | 0 (0.0%) |
| 45 to 54 Years | 0 (0.0%) | 0 (0.0%) |
| 55 to 64 Years | 0 (0.0%) | 123 (65.1%) |
| 65 to 74 Years | 111 (35.9%) | 0 (0.0%) |
| 75 Years and over | 0 (0.0%) | 18 (9.9%) |
| Total | 111 (10.6%) | 141 (8.6%) |
Income Above Poverty by Sex and Age in Island Walk
According to the poverty statistics in Island Walk, males aged 18 to 24 years and females aged 6 to 11 years are the age groups that are most secure financially, with 100.0% of males and 100.0% of females in these age groups living above the poverty line.
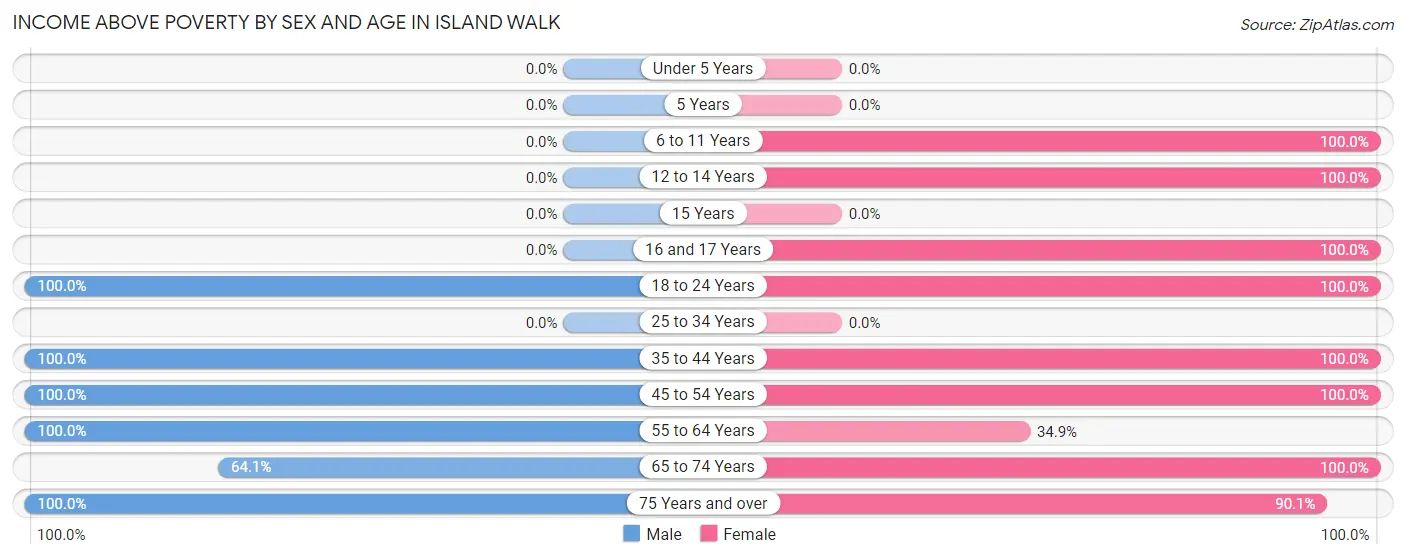
| Age Bracket | Male | Female |
| Under 5 Years | 0 (0.0%) | 0 (0.0%) |
| 5 Years | 0 (0.0%) | 0 (0.0%) |
| 6 to 11 Years | 0 (0.0%) | 38 (100.0%) |
| 12 to 14 Years | 0 (0.0%) | 82 (100.0%) |
| 15 Years | 0 (0.0%) | 0 (0.0%) |
| 16 and 17 Years | 0 (0.0%) | 71 (100.0%) |
| 18 to 24 Years | 97 (100.0%) | 10 (100.0%) |
| 25 to 34 Years | 0 (0.0%) | 0 (0.0%) |
| 35 to 44 Years | 26 (100.0%) | 84 (100.0%) |
| 45 to 54 Years | 114 (100.0%) | 271 (100.0%) |
| 55 to 64 Years | 109 (100.0%) | 66 (34.9%) |
| 65 to 74 Years | 198 (64.1%) | 709 (100.0%) |
| 75 Years and over | 388 (100.0%) | 164 (90.1%) |
| Total | 932 (89.4%) | 1,495 (91.4%) |
Income Below Poverty Among Married-Couple Families in Island Walk
The poverty statistics for married-couple families in Island Walk show that 13.5% or 111 of the total 824 families live below the poverty line. Families with no children have the highest poverty rate of 15.0%, comprising of 111 families. On the other hand, families with 1 or 2 children have the lowest poverty rate of 0.0%, which includes 0 families.
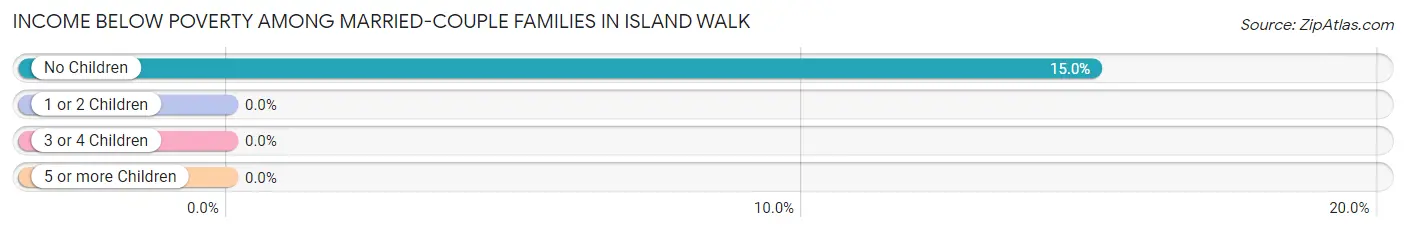
| Children | Above Poverty | Below Poverty |
| No Children | 627 (85.0%) | 111 (15.0%) |
| 1 or 2 Children | 86 (100.0%) | 0 (0.0%) |
| 3 or 4 Children | 0 (0.0%) | 0 (0.0%) |
| 5 or more Children | 0 (0.0%) | 0 (0.0%) |
| Total | 713 (86.5%) | 111 (13.5%) |
Income Below Poverty Among Single-Parent Households in Island Walk
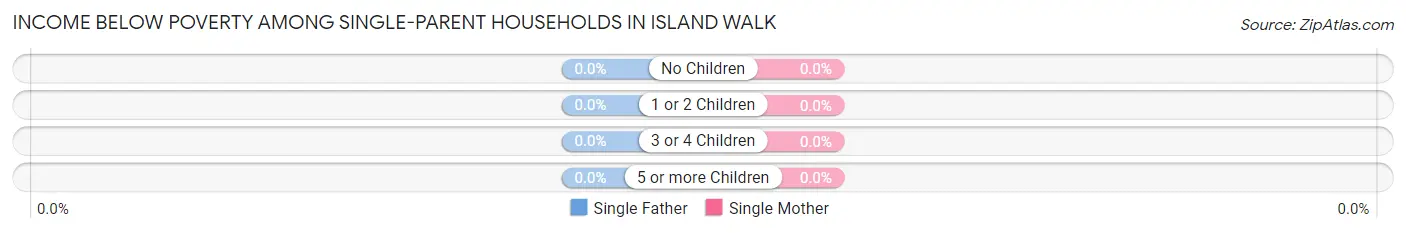
| Children | Single Father | Single Mother |
| No Children | 0 (0.0%) | 0 (0.0%) |
| 1 or 2 Children | 0 (0.0%) | 0 (0.0%) |
| 3 or 4 Children | 0 (0.0%) | 0 (0.0%) |
| 5 or more Children | 0 (0.0%) | 0 (0.0%) |
| Total | 0 (0.0%) | 0 (0.0%) |
Income Below Poverty Among Married-Couple vs Single-Parent Households in Island Walk
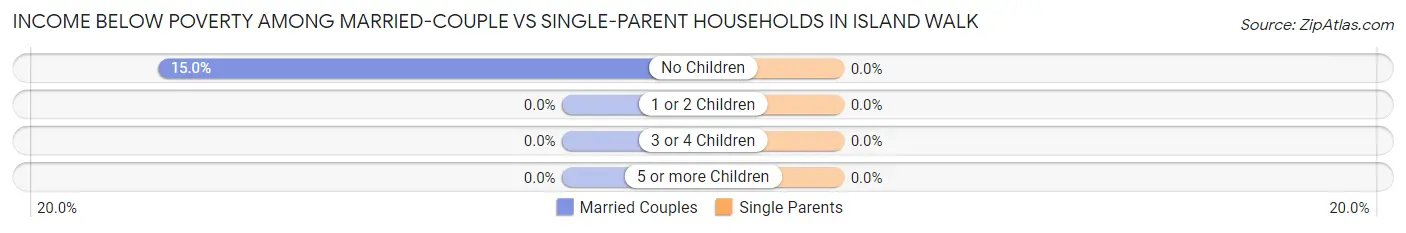
| Children | Married-Couple Families | Single-Parent Households |
| No Children | 111 (15.0%) | 0 (0.0%) |
| 1 or 2 Children | 0 (0.0%) | 0 (0.0%) |
| 3 or 4 Children | 0 (0.0%) | 0 (0.0%) |
| 5 or more Children | 0 (0.0%) | 0 (0.0%) |
| Total | 111 (13.5%) | 0 (0.0%) |
Employment Characteristics in Island Walk
Employment by Class of Employer in Island Walk
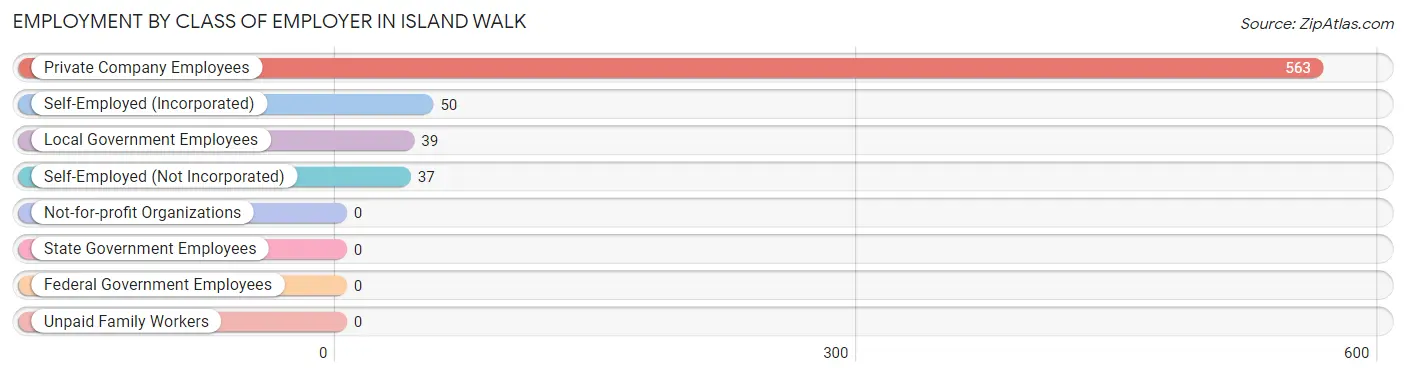
Among the 689 employed individuals in Island Walk, private company employees (563 | 81.7%), self-employed (incorporated) (50 | 7.3%), and local government employees (39 | 5.7%) make up the most common classes of employment.
| Employer Class | # Employees | % Employees |
| Private Company Employees | 563 | 81.7% |
| Self-Employed (Incorporated) | 50 | 7.3% |
| Self-Employed (Not Incorporated) | 37 | 5.4% |
| Not-for-profit Organizations | 0 | 0.0% |
| Local Government Employees | 39 | 5.7% |
| State Government Employees | 0 | 0.0% |
| Federal Government Employees | 0 | 0.0% |
| Unpaid Family Workers | 0 | 0.0% |
| Total | 689 | 100.0% |
Employment Status by Age in Island Walk
According to the labor force statistics for Island Walk, out of the total population over 16 years of age (2,559), 31.9% or 816 individuals are in the labor force, with 15.6% or 127 of them unemployed. The age group with the highest labor force participation rate is 45 to 54 years, with 65.7% or 253 individuals in the labor force. Within the labor force, the 60 to 64 years age range has the highest percentage of unemployed individuals, with 42.6% or 20 of them being unemployed.
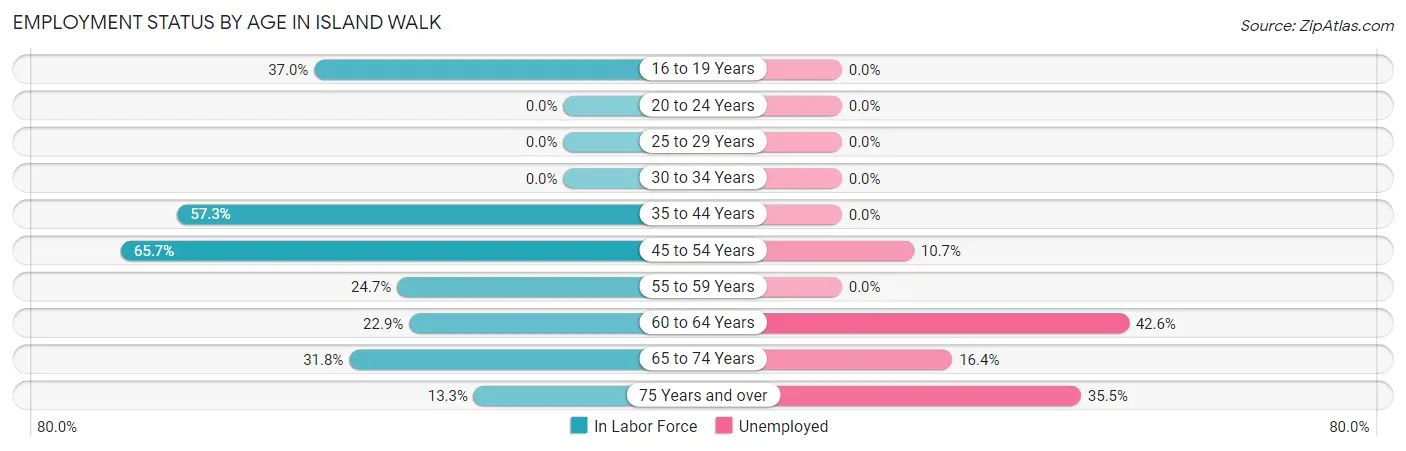
| Age Bracket | In Labor Force | Unemployed |
| 16 to 19 Years | 30 (37.0%) | 0 (0.0%) |
| 20 to 24 Years | 0 (0.0%) | 0 (0.0%) |
| 25 to 29 Years | 0 (0.0%) | 0 (0.0%) |
| 30 to 34 Years | 0 (0.0%) | 0 (0.0%) |
| 35 to 44 Years | 63 (57.3%) | 0 (0.0%) |
| 45 to 54 Years | 253 (65.7%) | 27 (10.7%) |
| 55 to 59 Years | 23 (24.7%) | 0 (0.0%) |
| 60 to 64 Years | 47 (22.9%) | 20 (42.6%) |
| 65 to 74 Years | 324 (31.8%) | 53 (16.4%) |
| 75 Years and over | 76 (13.3%) | 27 (35.5%) |
| Total | 816 (31.9%) | 127 (15.6%) |
Employment Status by Educational Attainment in Island Walk
According to labor force statistics for Island Walk, 48.7% of individuals (386) out of the total population between 25 and 64 years of age (793) are in the labor force, with 12.2% or 47 of them being unemployed. The group with the highest labor force participation rate are those with the educational attainment of college / associate degree, with 100.0% or 188 individuals in the labor force. Within the labor force, individuals with bachelor's degree or higher education have the highest percentage of unemployment, with 19.9% or 27 of them being unemployed.
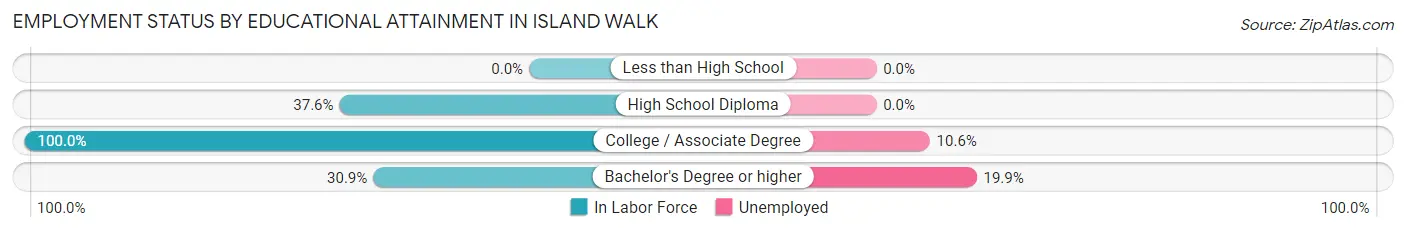
| Educational Attainment | In Labor Force | Unemployed |
| Less than High School | 0 (0.0%) | 0 (0.0%) |
| High School Diploma | 62 (37.6%) | 0 (0.0%) |
| College / Associate Degree | 188 (100.0%) | 20 (10.6%) |
| Bachelor's Degree or higher | 136 (30.9%) | 88 (19.9%) |
| Total | 386 (48.7%) | 97 (12.2%) |
Employment Occupations by Sex in Island Walk
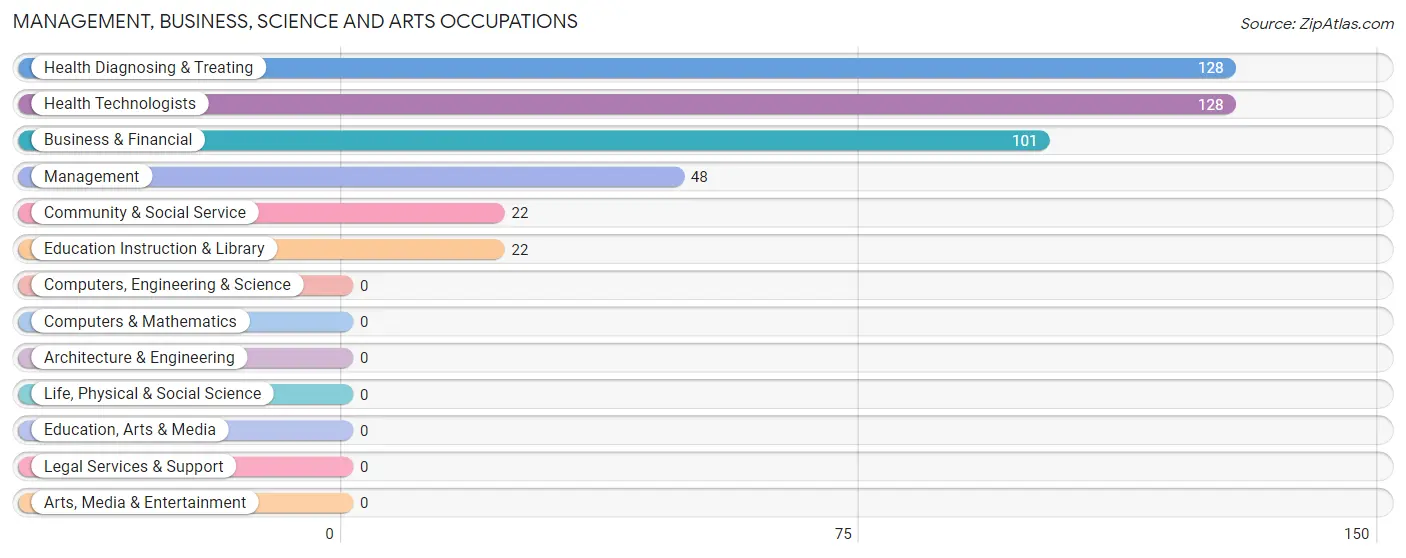
Management, Business, Science and Arts Occupations
The most common Management, Business, Science and Arts occupations in Island Walk are Health Diagnosing & Treating (128 | 18.6%), Health Technologists (128 | 18.6%), Business & Financial (101 | 14.7%), Management (48 | 7.0%), and Community & Social Service (22 | 3.2%).
Management, Business, Science and Arts Occupations by Sex
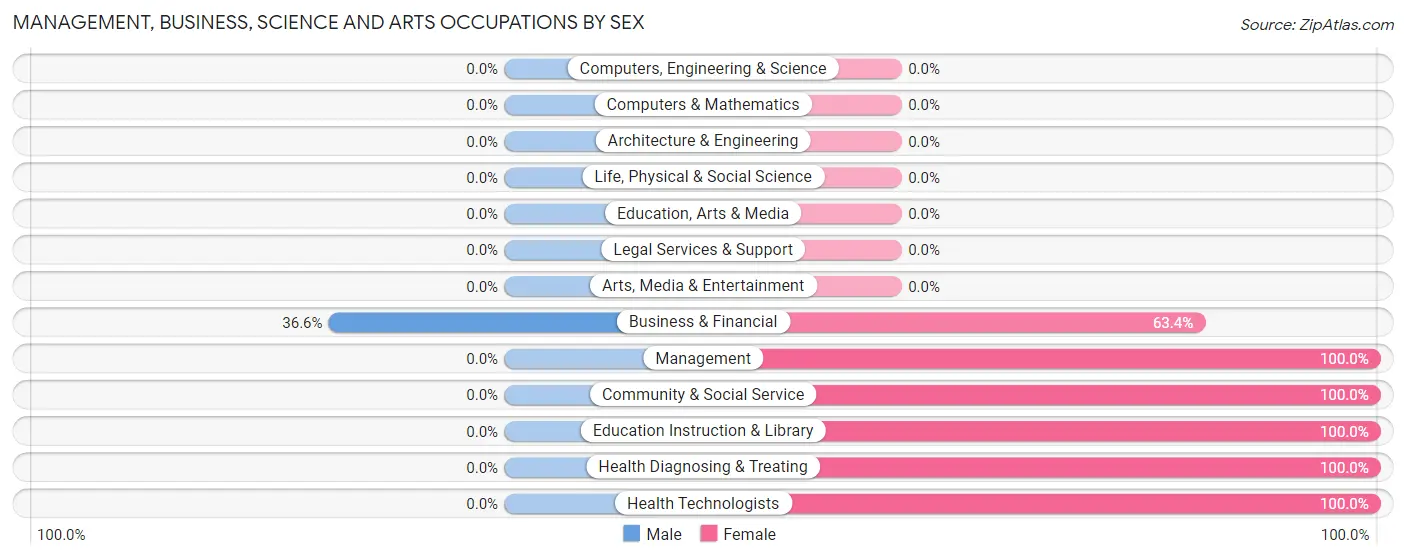
| Occupation | Male | Female |
| Management | 0 (0.0%) | 48 (100.0%) |
| Business & Financial | 37 (36.6%) | 64 (63.4%) |
| Computers, Engineering & Science | 0 (0.0%) | 0 (0.0%) |
| Computers & Mathematics | 0 (0.0%) | 0 (0.0%) |
| Architecture & Engineering | 0 (0.0%) | 0 (0.0%) |
| Life, Physical & Social Science | 0 (0.0%) | 0 (0.0%) |
| Community & Social Service | 0 (0.0%) | 22 (100.0%) |
| Education, Arts & Media | 0 (0.0%) | 0 (0.0%) |
| Legal Services & Support | 0 (0.0%) | 0 (0.0%) |
| Education Instruction & Library | 0 (0.0%) | 22 (100.0%) |
| Arts, Media & Entertainment | 0 (0.0%) | 0 (0.0%) |
| Health Diagnosing & Treating | 0 (0.0%) | 128 (100.0%) |
| Health Technologists | 0 (0.0%) | 128 (100.0%) |
| Total (Category) | 37 (12.4%) | 262 (87.6%) |
| Total (Overall) | 229 (33.2%) | 460 (66.8%) |
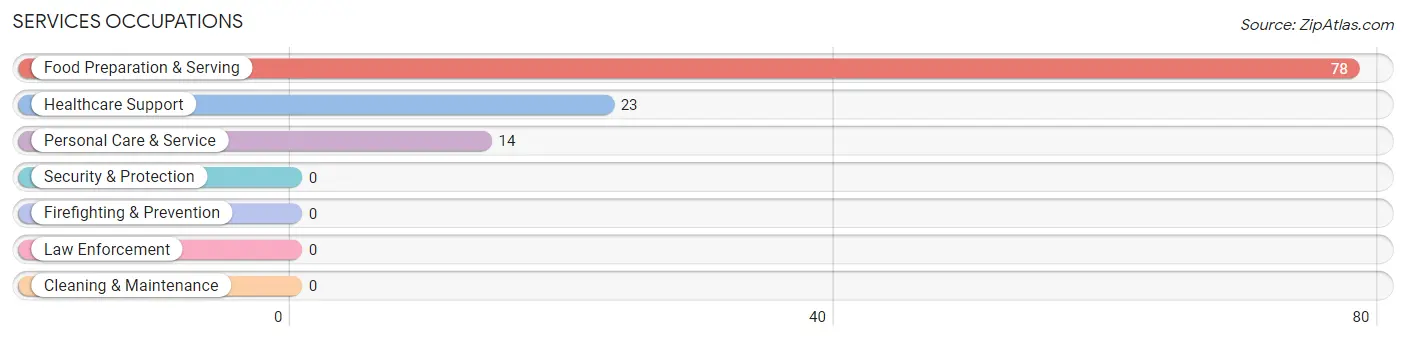
Services Occupations
The most common Services occupations in Island Walk are Food Preparation & Serving (78 | 11.3%), Healthcare Support (23 | 3.3%), and Personal Care & Service (14 | 2.0%).
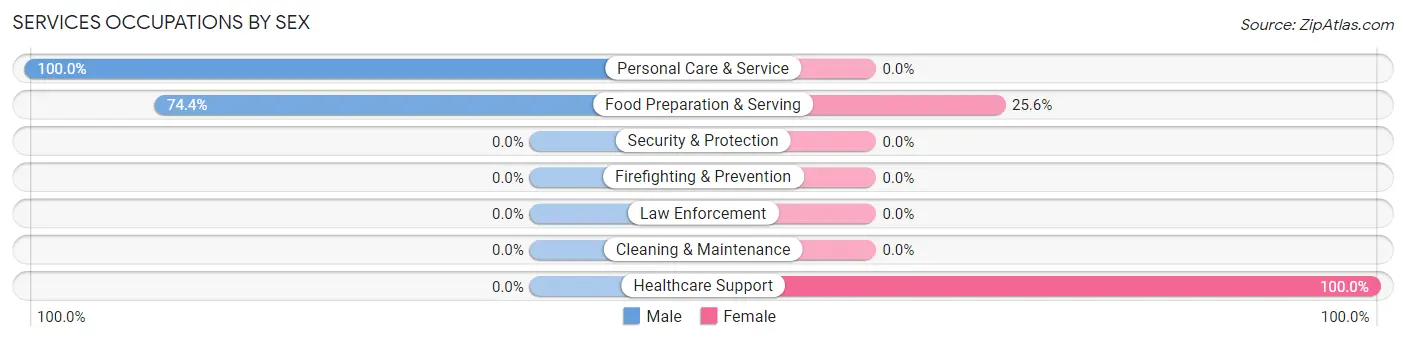
Services Occupations by Sex
Within the Services occupations in Island Walk, the most male-oriented occupations are Personal Care & Service (100.0%), and Food Preparation & Serving (74.4%), while the most female-oriented occupations are Healthcare Support (100.0%), and Food Preparation & Serving (25.6%).
| Occupation | Male | Female |
| Healthcare Support | 0 (0.0%) | 23 (100.0%) |
| Security & Protection | 0 (0.0%) | 0 (0.0%) |
| Firefighting & Prevention | 0 (0.0%) | 0 (0.0%) |
| Law Enforcement | 0 (0.0%) | 0 (0.0%) |
| Food Preparation & Serving | 58 (74.4%) | 20 (25.6%) |
| Cleaning & Maintenance | 0 (0.0%) | 0 (0.0%) |
| Personal Care & Service | 14 (100.0%) | 0 (0.0%) |
| Total (Category) | 72 (62.6%) | 43 (37.4%) |
| Total (Overall) | 229 (33.2%) | 460 (66.8%) |
Sales and Office Occupations
The most common Sales and Office occupations in Island Walk are Office & Administration (94 | 13.6%), and Sales & Related (62 | 9.0%).
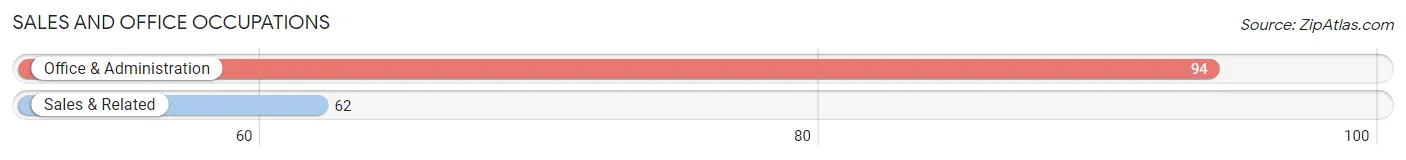
Sales and Office Occupations by Sex

| Occupation | Male | Female |
| Sales & Related | 0 (0.0%) | 62 (100.0%) |
| Office & Administration | 20 (21.3%) | 74 (78.7%) |
| Total (Category) | 20 (12.8%) | 136 (87.2%) |
| Total (Overall) | 229 (33.2%) | 460 (66.8%) |
Natural Resources, Construction and Maintenance Occupations
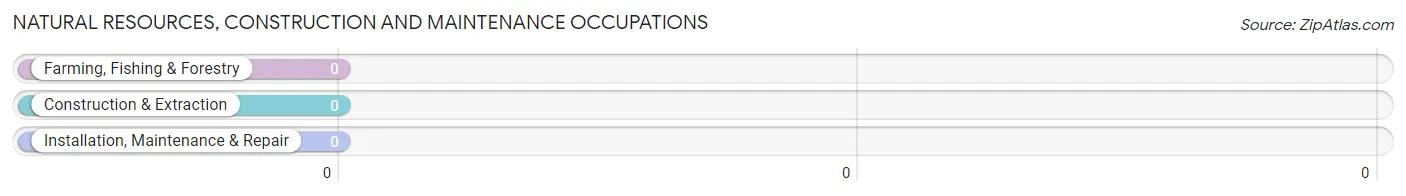
Natural Resources, Construction and Maintenance Occupations by Sex
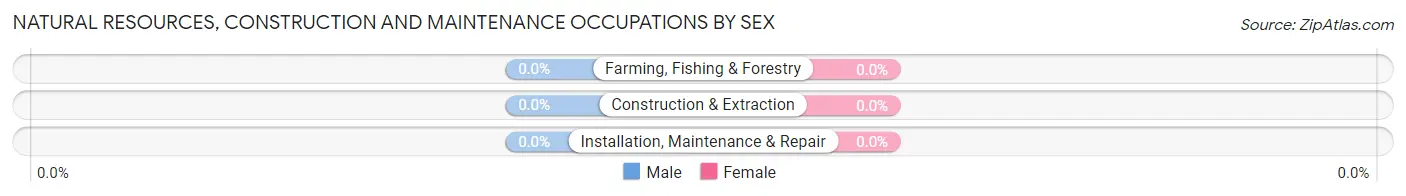
| Occupation | Male | Female |
| Farming, Fishing & Forestry | 0 (0.0%) | 0 (0.0%) |
| Construction & Extraction | 0 (0.0%) | 0 (0.0%) |
| Installation, Maintenance & Repair | 0 (0.0%) | 0 (0.0%) |
| Total (Category) | 0 (0.0%) | 0 (0.0%) |
| Total (Overall) | 229 (33.2%) | 460 (66.8%) |
Production, Transportation and Moving Occupations
The most common Production, Transportation and Moving occupations in Island Walk are , and Transportation (119 | 17.3%).
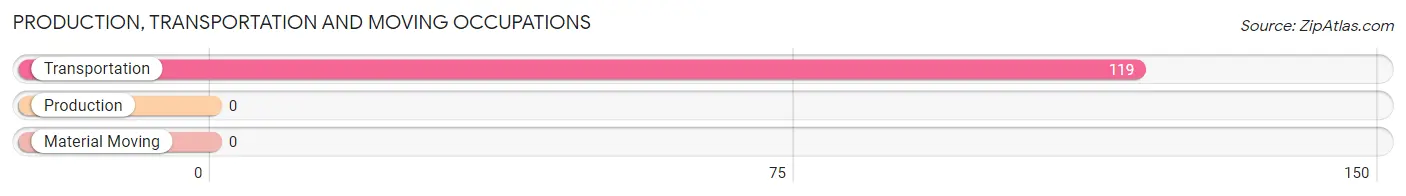
Production, Transportation and Moving Occupations by Sex
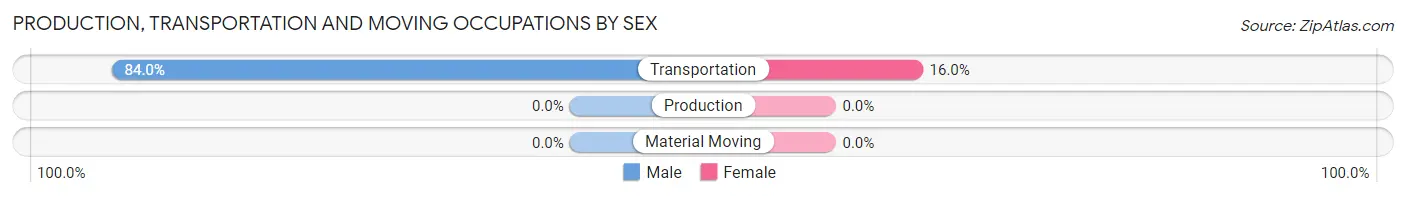
| Occupation | Male | Female |
| Production | 0 (0.0%) | 0 (0.0%) |
| Transportation | 100 (84.0%) | 19 (16.0%) |
| Material Moving | 0 (0.0%) | 0 (0.0%) |
| Total (Category) | 100 (84.0%) | 19 (16.0%) |
| Total (Overall) | 229 (33.2%) | 460 (66.8%) |
Employment Industries by Sex in Island Walk
Employment Industries in Island Walk
The major employment industries in Island Walk include Accommodation & Food Services (156 | 22.6%), Health Care & Social Assistance (151 | 21.9%), Professional & Scientific (121 | 17.6%), Transportation & Warehousing (119 | 17.3%), and Arts, Entertainment & Recreation (39 | 5.7%).

Employment Industries by Sex in Island Walk
The Island Walk industries that see more men than women are Transportation & Warehousing (84.0%), Professional & Scientific (47.1%), and Accommodation & Food Services (37.2%), whereas the industries that tend to have a higher number of women are Wholesale Trade (100.0%), Administrative & Support (100.0%), and Educational Services (100.0%).
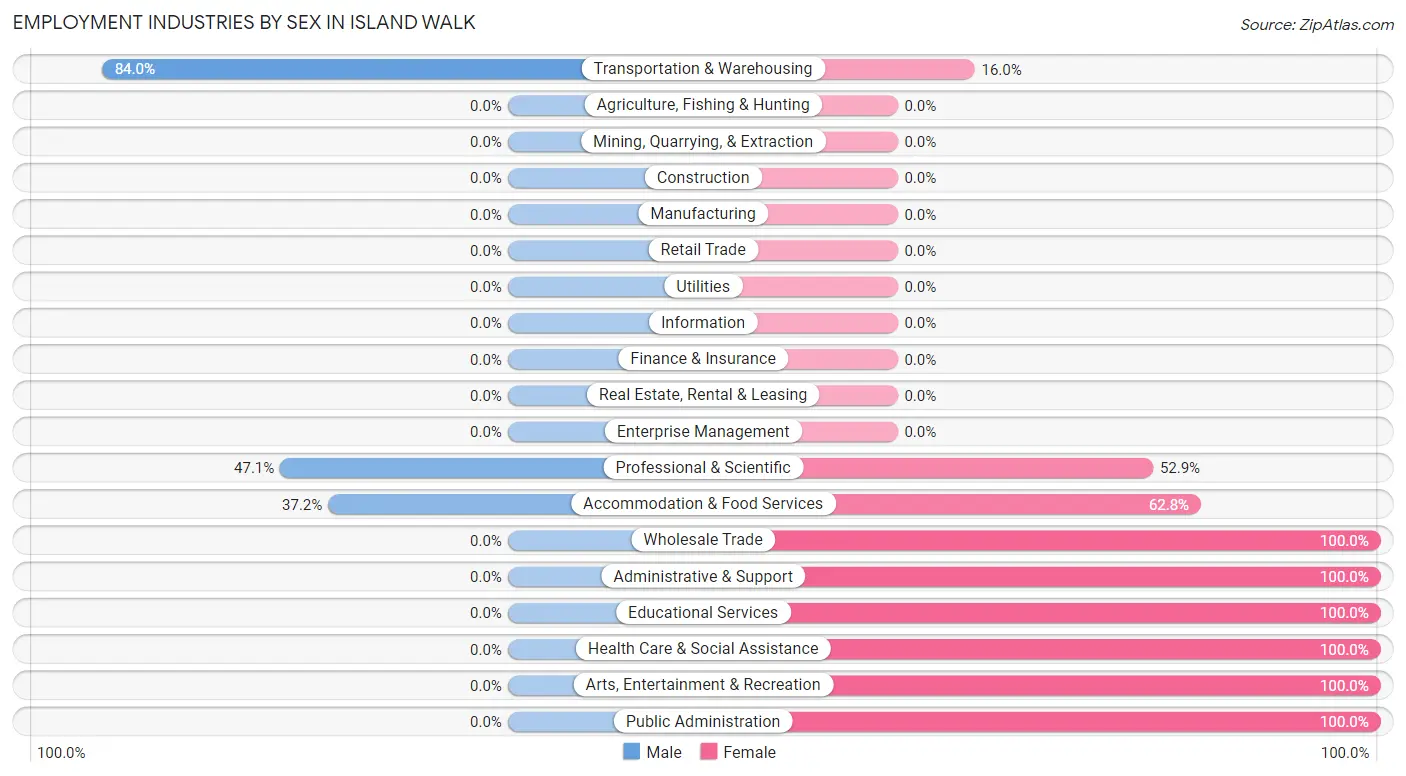
| Industry | Male | Female |
| Agriculture, Fishing & Hunting | 0 (0.0%) | 0 (0.0%) |
| Mining, Quarrying, & Extraction | 0 (0.0%) | 0 (0.0%) |
| Construction | 0 (0.0%) | 0 (0.0%) |
| Manufacturing | 0 (0.0%) | 0 (0.0%) |
| Wholesale Trade | 0 (0.0%) | 32 (100.0%) |
| Retail Trade | 0 (0.0%) | 0 (0.0%) |
| Transportation & Warehousing | 100 (84.0%) | 19 (16.0%) |
| Utilities | 0 (0.0%) | 0 (0.0%) |
| Information | 0 (0.0%) | 0 (0.0%) |
| Finance & Insurance | 0 (0.0%) | 0 (0.0%) |
| Real Estate, Rental & Leasing | 0 (0.0%) | 0 (0.0%) |
| Professional & Scientific | 57 (47.1%) | 64 (52.9%) |
| Enterprise Management | 0 (0.0%) | 0 (0.0%) |
| Administrative & Support | 0 (0.0%) | 18 (100.0%) |
| Educational Services | 0 (0.0%) | 22 (100.0%) |
| Health Care & Social Assistance | 0 (0.0%) | 151 (100.0%) |
| Arts, Entertainment & Recreation | 0 (0.0%) | 39 (100.0%) |
| Accommodation & Food Services | 58 (37.2%) | 98 (62.8%) |
| Public Administration | 0 (0.0%) | 17 (100.0%) |
| Total | 229 (33.2%) | 460 (66.8%) |
Education in Island Walk
School Enrollment in Island Walk
The most common levels of schooling among the 288 students in Island Walk are college / undergraduate (97 | 33.7%), middle school (82 | 28.5%), and high school (71 | 24.6%).
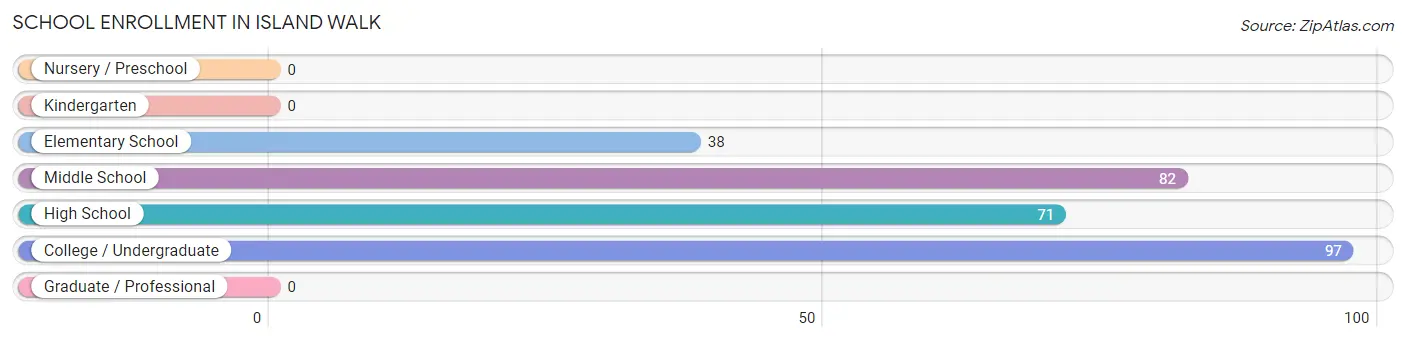
| School Level | # Students | % Students |
| Nursery / Preschool | 0 | 0.0% |
| Kindergarten | 0 | 0.0% |
| Elementary School | 38 | 13.2% |
| Middle School | 82 | 28.5% |
| High School | 71 | 24.6% |
| College / Undergraduate | 97 | 33.7% |
| Graduate / Professional | 0 | 0.0% |
| Total | 288 | 100.0% |
School Enrollment by Age by Funding Source in Island Walk
Out of a total of 288 students who are enrolled in schools in Island Walk, 20 (6.9%) attend a private institution, while the remaining 268 (93.1%) are enrolled in public schools. The age group of 15 to 17 year olds has the highest likelihood of being enrolled in private schools, with 20 (28.2% in the age bracket) enrolled. Conversely, the age group of 10 to 14 year olds has the lowest likelihood of being enrolled in a private school, with 120 (100.0% in the age bracket) attending a public institution.
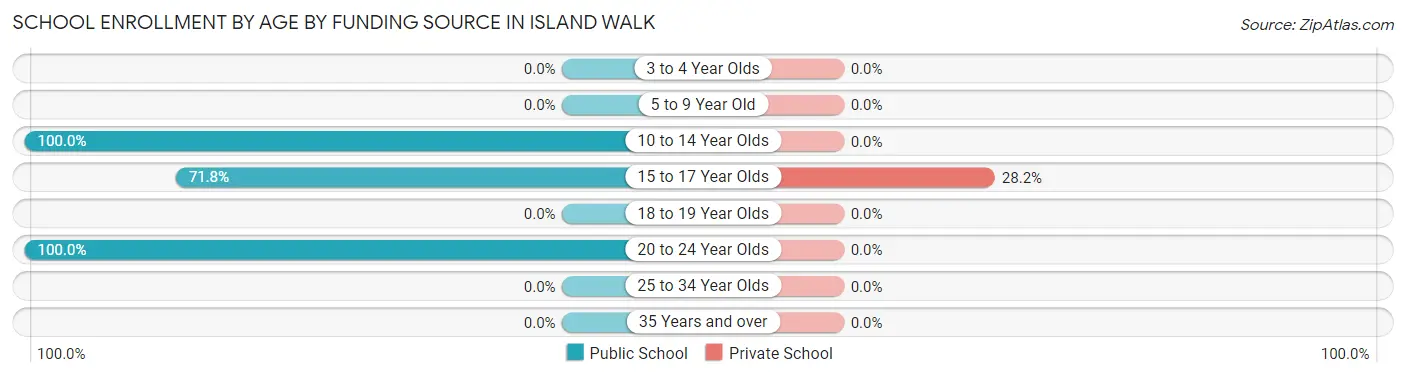
| Age Bracket | Public School | Private School |
| 3 to 4 Year Olds | 0 (0.0%) | 0 (0.0%) |
| 5 to 9 Year Old | 0 (0.0%) | 0 (0.0%) |
| 10 to 14 Year Olds | 120 (100.0%) | 0 (0.0%) |
| 15 to 17 Year Olds | 51 (71.8%) | 20 (28.2%) |
| 18 to 19 Year Olds | 0 (0.0%) | 0 (0.0%) |
| 20 to 24 Year Olds | 97 (100.0%) | 0 (0.0%) |
| 25 to 34 Year Olds | 0 (0.0%) | 0 (0.0%) |
| 35 Years and over | 0 (0.0%) | 0 (0.0%) |
| Total | 268 (93.1%) | 20 (6.9%) |
Educational Attainment by Field of Study in Island Walk
Business (305 | 29.6%), science & technology (164 | 15.9%), liberal arts & history (122 | 11.8%), bio, nature & agricultural (99 | 9.6%), and arts & humanities (80 | 7.8%) are the most common fields of study among 1,031 individuals in Island Walk who have obtained a bachelor's degree or higher.
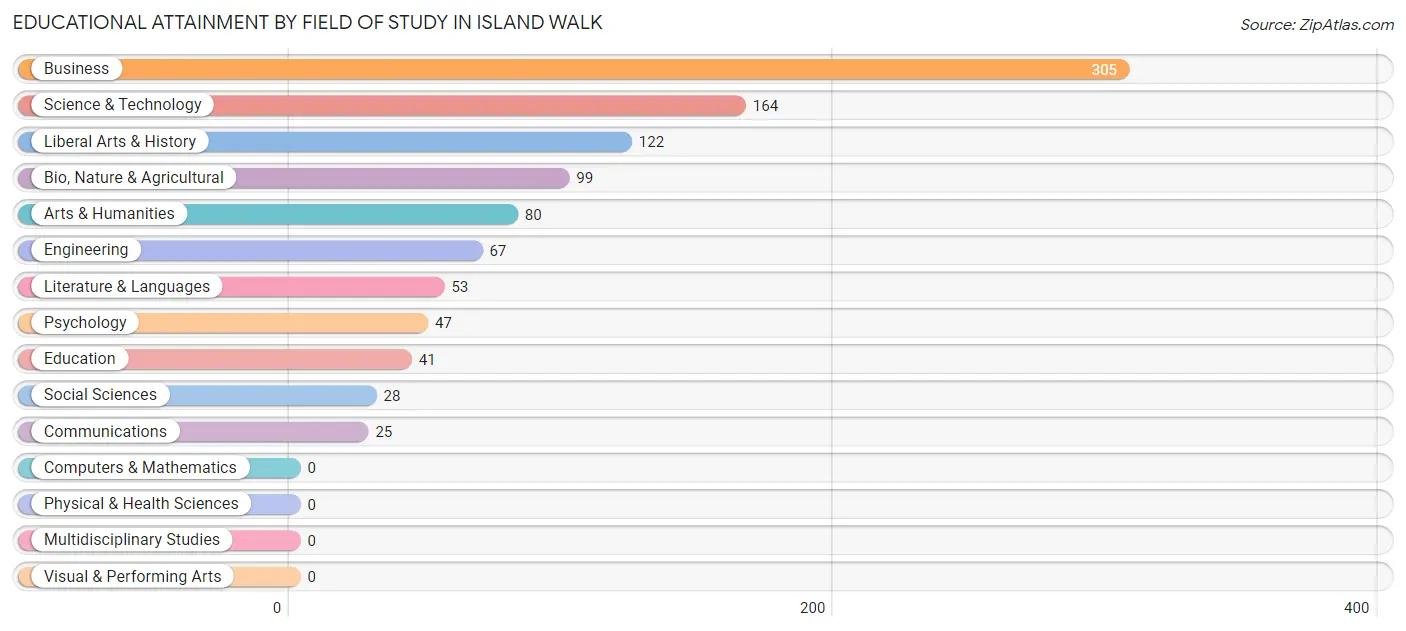
| Field of Study | # Graduates | % Graduates |
| Computers & Mathematics | 0 | 0.0% |
| Bio, Nature & Agricultural | 99 | 9.6% |
| Physical & Health Sciences | 0 | 0.0% |
| Psychology | 47 | 4.6% |
| Social Sciences | 28 | 2.7% |
| Engineering | 67 | 6.5% |
| Multidisciplinary Studies | 0 | 0.0% |
| Science & Technology | 164 | 15.9% |
| Business | 305 | 29.6% |
| Education | 41 | 4.0% |
| Literature & Languages | 53 | 5.1% |
| Liberal Arts & History | 122 | 11.8% |
| Visual & Performing Arts | 0 | 0.0% |
| Communications | 25 | 2.4% |
| Arts & Humanities | 80 | 7.8% |
| Total | 1,031 | 100.0% |
Transportation & Commute in Island Walk
Vehicle Availability by Sex in Island Walk
The most prevalent vehicle ownership categories in Island Walk are males with 2 vehicles (145, accounting for 63.3%) and females with 2 vehicles (277, making up 31.5%).
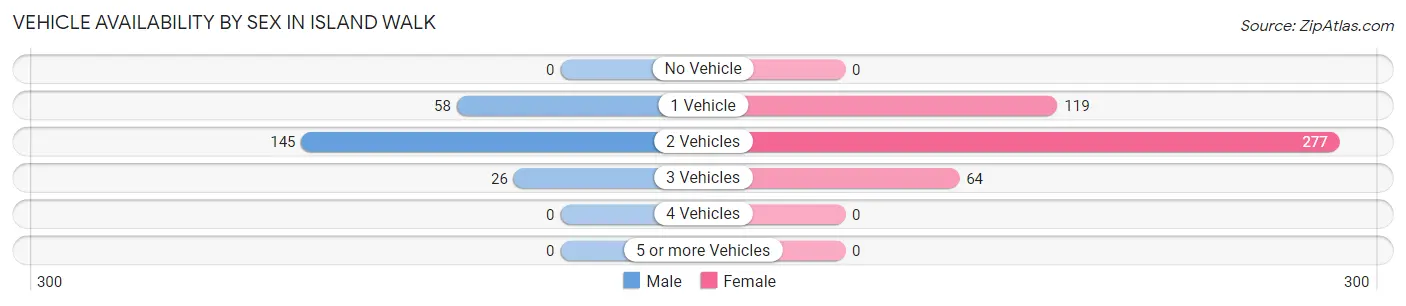
| Vehicles Available | Male | Female |
| No Vehicle | 0 (0.0%) | 0 (0.0%) |
| 1 Vehicle | 58 (25.3%) | 119 (25.9%) |
| 2 Vehicles | 145 (63.3%) | 277 (60.2%) |
| 3 Vehicles | 26 (11.4%) | 64 (13.9%) |
| 4 Vehicles | 0 (0.0%) | 0 (0.0%) |
| 5 or more Vehicles | 0 (0.0%) | 0 (0.0%) |
| Total | 229 (100.0%) | 460 (100.0%) |
Commute Time in Island Walk
The most frequently occuring commute durations in Island Walk are 20 to 24 minutes (222 commuters, 36.9%), 15 to 19 minutes (136 commuters, 22.6%), and 25 to 29 minutes (95 commuters, 15.8%).
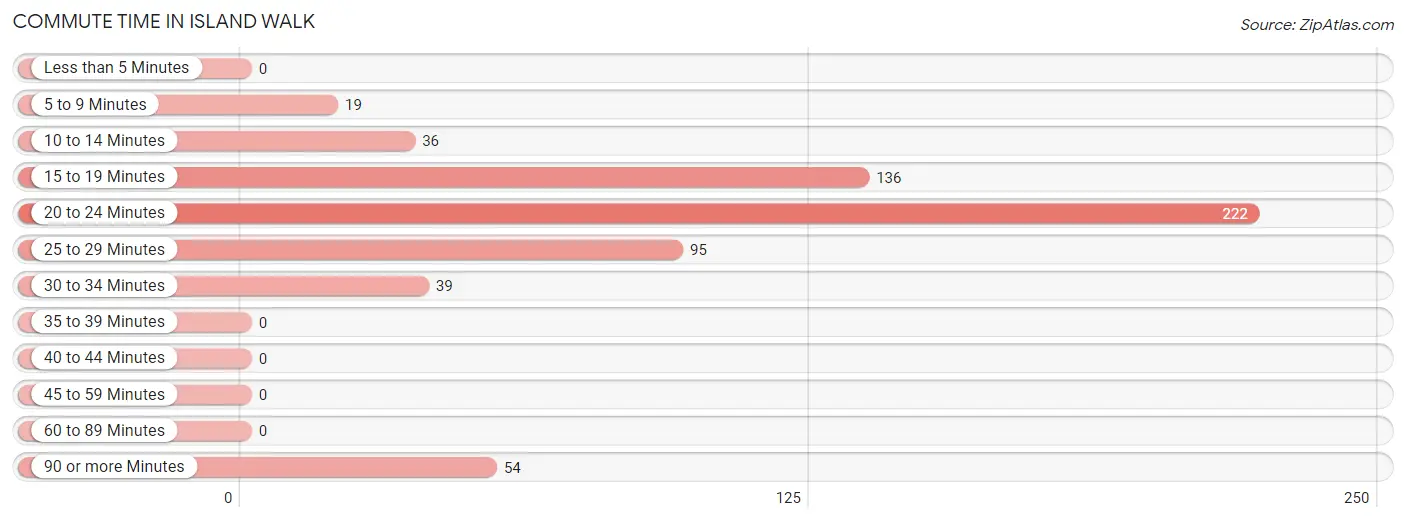
| Commute Time | # Commuters | % Commuters |
| Less than 5 Minutes | 0 | 0.0% |
| 5 to 9 Minutes | 19 | 3.2% |
| 10 to 14 Minutes | 36 | 6.0% |
| 15 to 19 Minutes | 136 | 22.6% |
| 20 to 24 Minutes | 222 | 36.9% |
| 25 to 29 Minutes | 95 | 15.8% |
| 30 to 34 Minutes | 39 | 6.5% |
| 35 to 39 Minutes | 0 | 0.0% |
| 40 to 44 Minutes | 0 | 0.0% |
| 45 to 59 Minutes | 0 | 0.0% |
| 60 to 89 Minutes | 0 | 0.0% |
| 90 or more Minutes | 54 | 9.0% |
Commute Time by Sex in Island Walk
The most common commute times in Island Walk are 15 to 19 minutes (72 commuters, 36.4%) for males and 20 to 24 minutes (222 commuters, 55.1%) for females.
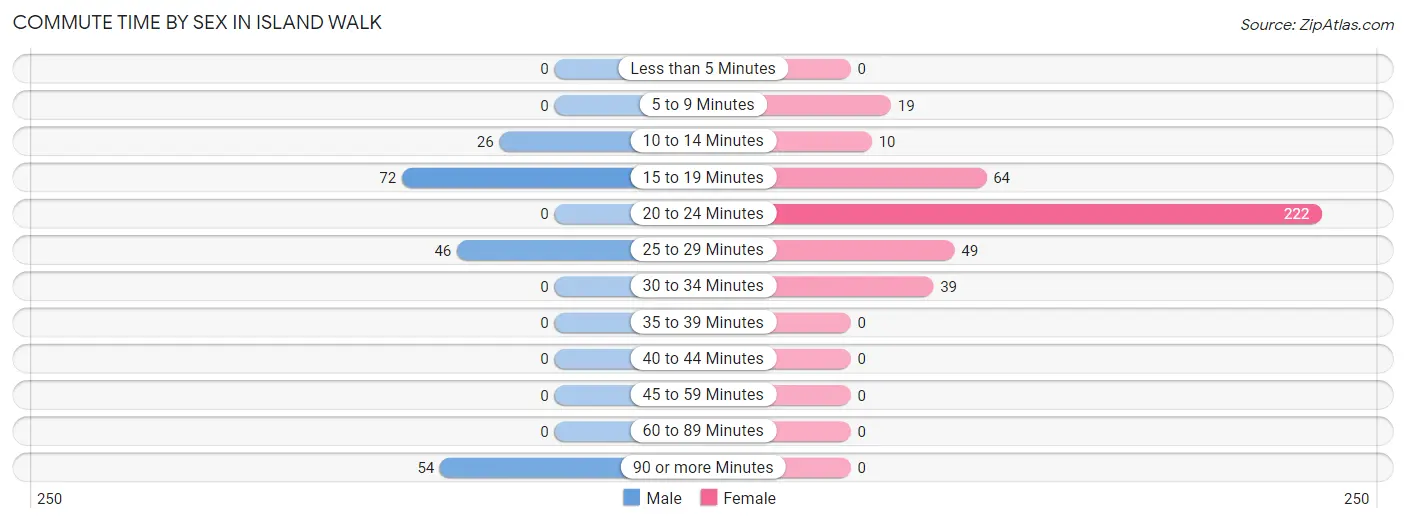
| Commute Time | Male | Female |
| Less than 5 Minutes | 0 (0.0%) | 0 (0.0%) |
| 5 to 9 Minutes | 0 (0.0%) | 19 (4.7%) |
| 10 to 14 Minutes | 26 (13.1%) | 10 (2.5%) |
| 15 to 19 Minutes | 72 (36.4%) | 64 (15.9%) |
| 20 to 24 Minutes | 0 (0.0%) | 222 (55.1%) |
| 25 to 29 Minutes | 46 (23.2%) | 49 (12.2%) |
| 30 to 34 Minutes | 0 (0.0%) | 39 (9.7%) |
| 35 to 39 Minutes | 0 (0.0%) | 0 (0.0%) |
| 40 to 44 Minutes | 0 (0.0%) | 0 (0.0%) |
| 45 to 59 Minutes | 0 (0.0%) | 0 (0.0%) |
| 60 to 89 Minutes | 0 (0.0%) | 0 (0.0%) |
| 90 or more Minutes | 54 (27.3%) | 0 (0.0%) |
Time of Departure to Work by Sex in Island Walk
The most frequent times of departure to work in Island Walk are 12:00 AM to 4:59 AM (114, 57.6%) for males and 8:30 AM to 8:59 AM (132, 32.8%) for females.
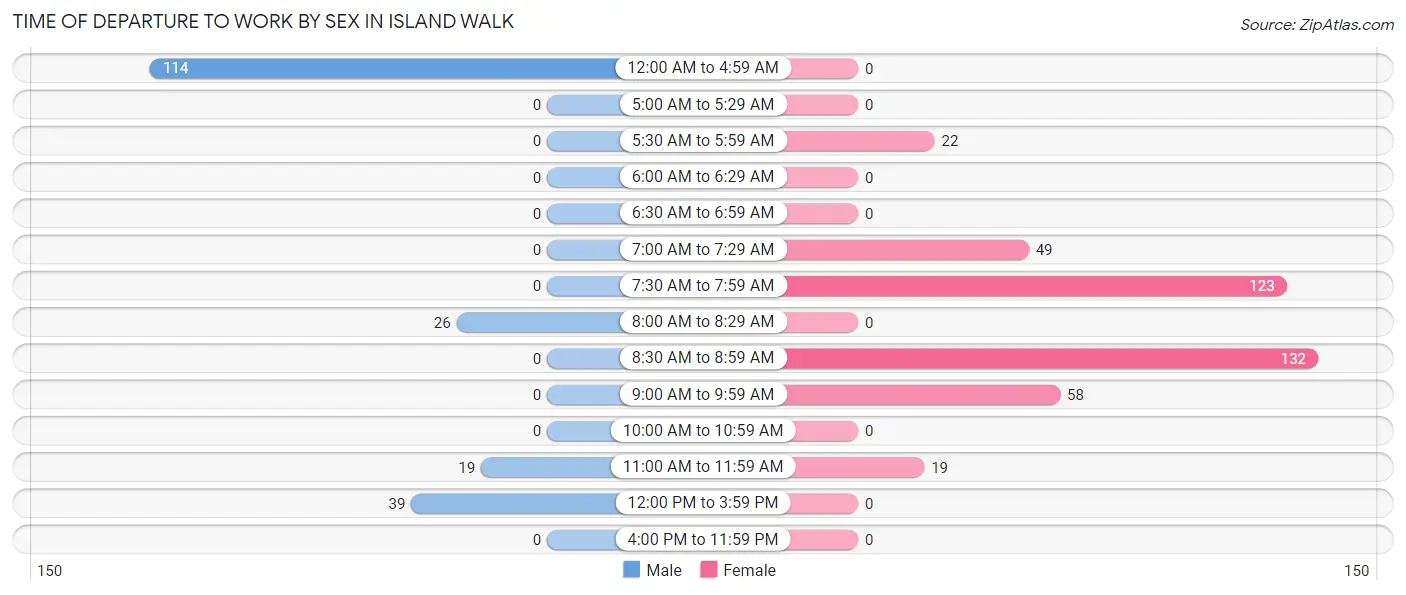
| Time of Departure | Male | Female |
| 12:00 AM to 4:59 AM | 114 (57.6%) | 0 (0.0%) |
| 5:00 AM to 5:29 AM | 0 (0.0%) | 0 (0.0%) |
| 5:30 AM to 5:59 AM | 0 (0.0%) | 22 (5.5%) |
| 6:00 AM to 6:29 AM | 0 (0.0%) | 0 (0.0%) |
| 6:30 AM to 6:59 AM | 0 (0.0%) | 0 (0.0%) |
| 7:00 AM to 7:29 AM | 0 (0.0%) | 49 (12.2%) |
| 7:30 AM to 7:59 AM | 0 (0.0%) | 123 (30.5%) |
| 8:00 AM to 8:29 AM | 26 (13.1%) | 0 (0.0%) |
| 8:30 AM to 8:59 AM | 0 (0.0%) | 132 (32.8%) |
| 9:00 AM to 9:59 AM | 0 (0.0%) | 58 (14.4%) |
| 10:00 AM to 10:59 AM | 0 (0.0%) | 0 (0.0%) |
| 11:00 AM to 11:59 AM | 19 (9.6%) | 19 (4.7%) |
| 12:00 PM to 3:59 PM | 39 (19.7%) | 0 (0.0%) |
| 4:00 PM to 11:59 PM | 0 (0.0%) | 0 (0.0%) |
| Total | 198 (100.0%) | 403 (100.0%) |
Housing Occupancy in Island Walk
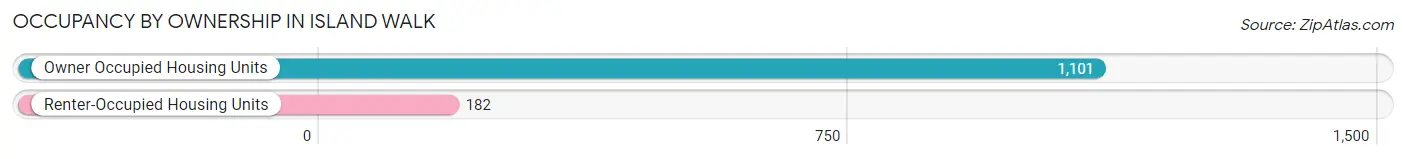
Occupancy by Ownership in Island Walk
Of the total 1,283 dwellings in Island Walk, owner-occupied units account for 1,101 (85.8%), while renter-occupied units make up 182 (14.2%).
| Occupancy | # Housing Units | % Housing Units |
| Owner Occupied Housing Units | 1,101 | 85.8% |
| Renter-Occupied Housing Units | 182 | 14.2% |
| Total Occupied Housing Units | 1,283 | 100.0% |
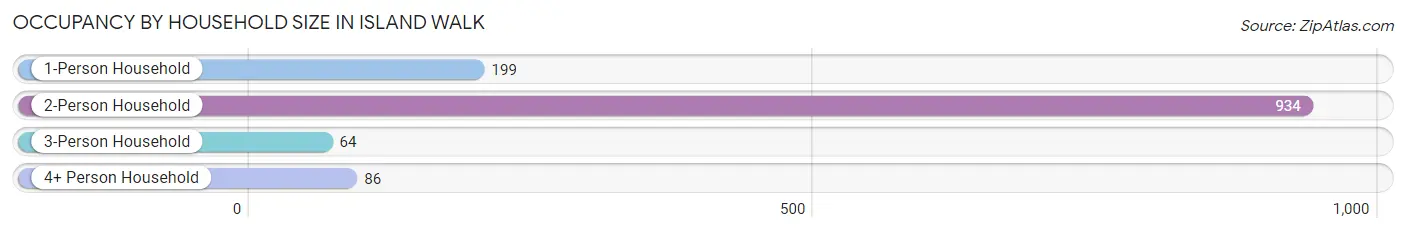
Occupancy by Household Size in Island Walk
| Household Size | # Housing Units | % Housing Units |
| 1-Person Household | 199 | 15.5% |
| 2-Person Household | 934 | 72.8% |
| 3-Person Household | 64 | 5.0% |
| 4+ Person Household | 86 | 6.7% |
| Total Housing Units | 1,283 | 100.0% |
Occupancy by Ownership by Household Size in Island Walk
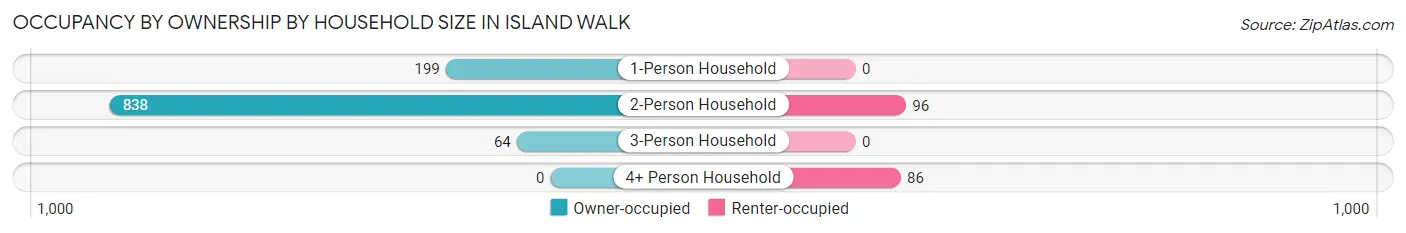
| Household Size | Owner-occupied | Renter-occupied |
| 1-Person Household | 199 (100.0%) | 0 (0.0%) |
| 2-Person Household | 838 (89.7%) | 96 (10.3%) |
| 3-Person Household | 64 (100.0%) | 0 (0.0%) |
| 4+ Person Household | 0 (0.0%) | 86 (100.0%) |
| Total Housing Units | 1,101 (85.8%) | 182 (14.2%) |
Occupancy by Educational Attainment in Island Walk
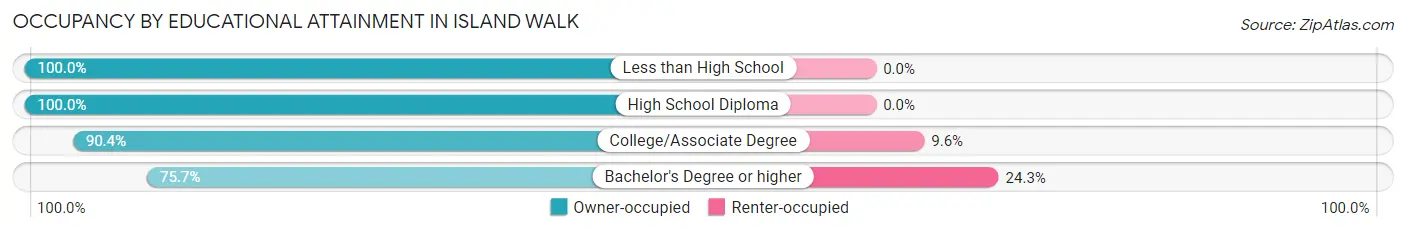
| Household Size | Owner-occupied | Renter-occupied |
| Less than High School | 142 (100.0%) | 0 (0.0%) |
| High School Diploma | 144 (100.0%) | 0 (0.0%) |
| College/Associate Degree | 369 (90.4%) | 39 (9.6%) |
| Bachelor's Degree or higher | 446 (75.7%) | 143 (24.3%) |
Occupancy by Age of Householder in Island Walk
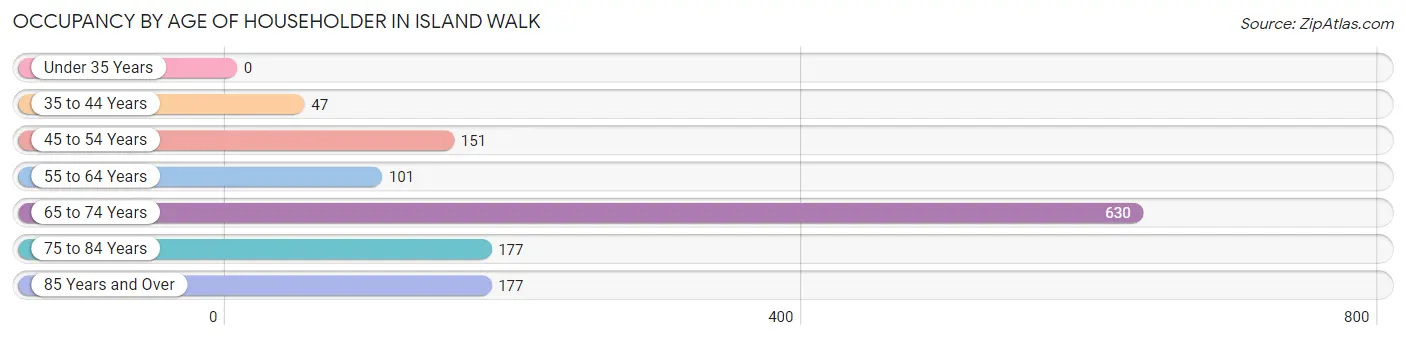
| Age Bracket | # Households | % Households |
| Under 35 Years | 0 | 0.0% |
| 35 to 44 Years | 47 | 3.7% |
| 45 to 54 Years | 151 | 11.8% |
| 55 to 64 Years | 101 | 7.9% |
| 65 to 74 Years | 630 | 49.1% |
| 75 to 84 Years | 177 | 13.8% |
| 85 Years and Over | 177 | 13.8% |
| Total | 1,283 | 100.0% |
Housing Finances in Island Walk
Median Income by Occupancy in Island Walk
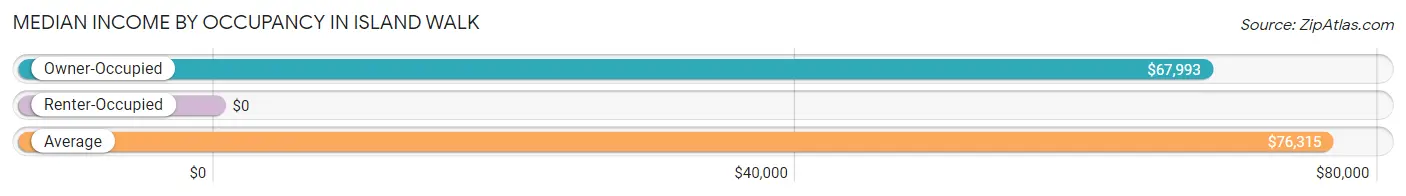
| Occupancy Type | # Households | Median Income |
| Owner-Occupied | 1,101 (85.8%) | $67,993 |
| Renter-Occupied | 182 (14.2%) | $0 |
| Average | 1,283 (100.0%) | $76,315 |
Occupancy by Householder Income Bracket in Island Walk
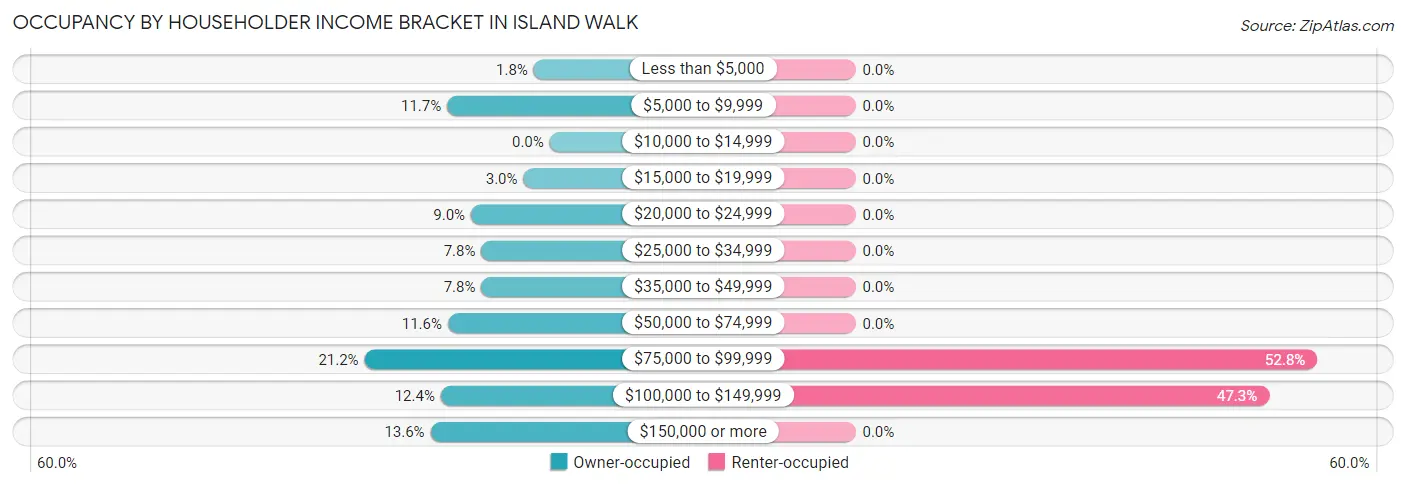
| Income Bracket | Owner-occupied | Renter-occupied |
| Less than $5,000 | 20 (1.8%) | 0 (0.0%) |
| $5,000 to $9,999 | 129 (11.7%) | 0 (0.0%) |
| $10,000 to $14,999 | 0 (0.0%) | 0 (0.0%) |
| $15,000 to $19,999 | 33 (3.0%) | 0 (0.0%) |
| $20,000 to $24,999 | 99 (9.0%) | 0 (0.0%) |
| $25,000 to $34,999 | 86 (7.8%) | 0 (0.0%) |
| $35,000 to $49,999 | 86 (7.8%) | 0 (0.0%) |
| $50,000 to $74,999 | 128 (11.6%) | 0 (0.0%) |
| $75,000 to $99,999 | 233 (21.2%) | 96 (52.7%) |
| $100,000 to $149,999 | 137 (12.4%) | 86 (47.2%) |
| $150,000 or more | 150 (13.6%) | 0 (0.0%) |
| Total | 1,101 (100.0%) | 182 (100.0%) |
Monthly Housing Cost Tiers in Island Walk
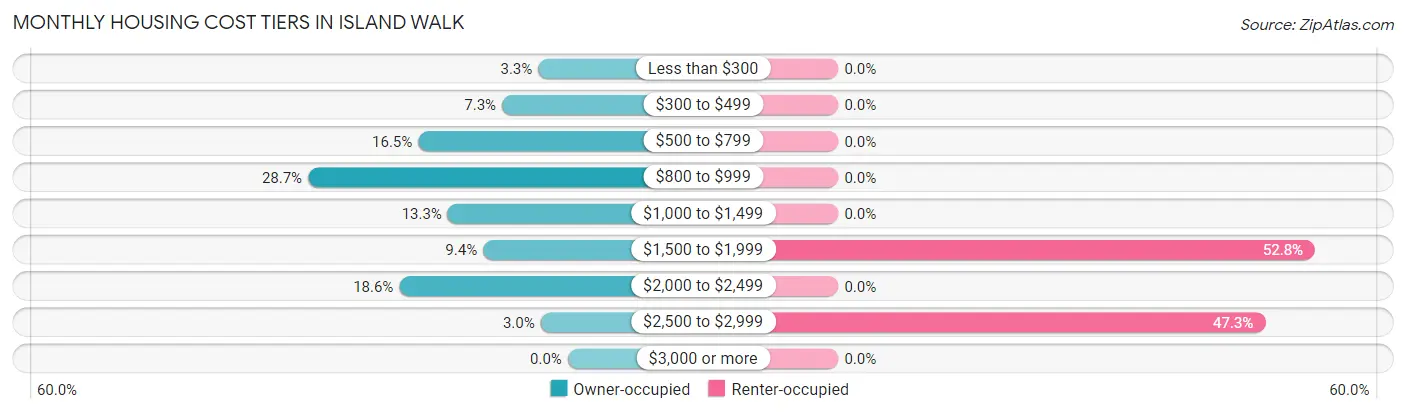
| Monthly Cost | Owner-occupied | Renter-occupied |
| Less than $300 | 36 (3.3%) | 0 (0.0%) |
| $300 to $499 | 80 (7.3%) | 0 (0.0%) |
| $500 to $799 | 182 (16.5%) | 0 (0.0%) |
| $800 to $999 | 316 (28.7%) | 0 (0.0%) |
| $1,000 to $1,499 | 146 (13.3%) | 0 (0.0%) |
| $1,500 to $1,999 | 103 (9.4%) | 96 (52.7%) |
| $2,000 to $2,499 | 205 (18.6%) | 0 (0.0%) |
| $2,500 to $2,999 | 33 (3.0%) | 86 (47.2%) |
| $3,000 or more | 0 (0.0%) | 0 (0.0%) |
| Total | 1,101 (100.0%) | 182 (100.0%) |
Physical Housing Characteristics in Island Walk
Housing Structures in Island Walk
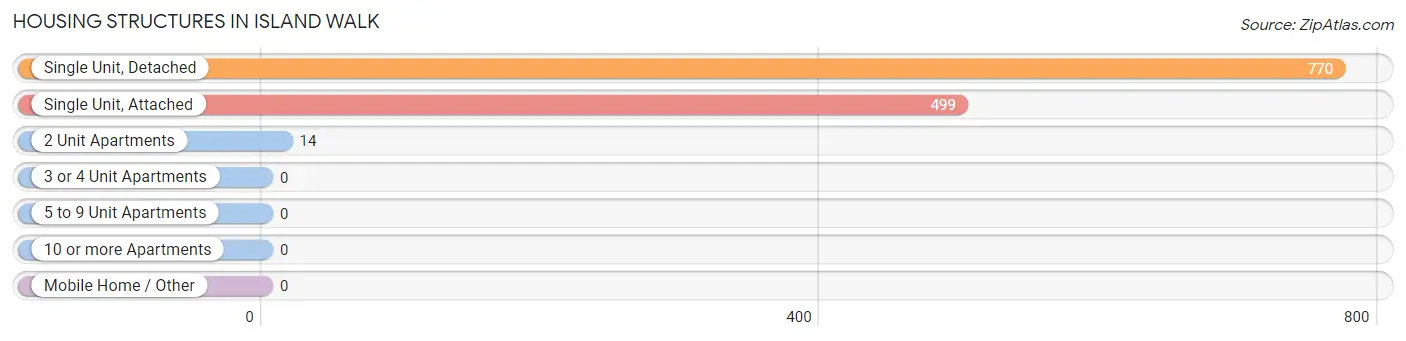
| Structure Type | # Housing Units | % Housing Units |
| Single Unit, Detached | 770 | 60.0% |
| Single Unit, Attached | 499 | 38.9% |
| 2 Unit Apartments | 14 | 1.1% |
| 3 or 4 Unit Apartments | 0 | 0.0% |
| 5 to 9 Unit Apartments | 0 | 0.0% |
| 10 or more Apartments | 0 | 0.0% |
| Mobile Home / Other | 0 | 0.0% |
| Total | 1,283 | 100.0% |
Housing Structures by Occupancy in Island Walk
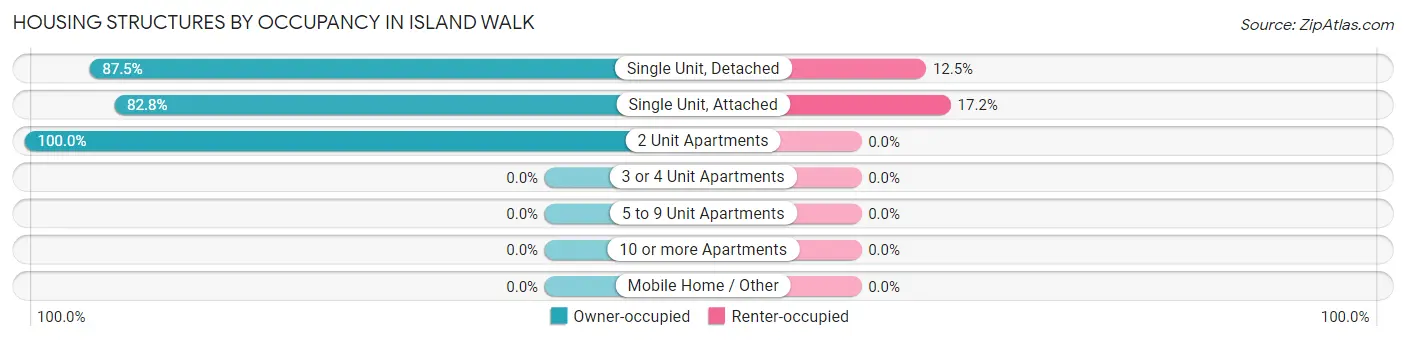
| Structure Type | Owner-occupied | Renter-occupied |
| Single Unit, Detached | 674 (87.5%) | 96 (12.5%) |
| Single Unit, Attached | 413 (82.8%) | 86 (17.2%) |
| 2 Unit Apartments | 14 (100.0%) | 0 (0.0%) |
| 3 or 4 Unit Apartments | 0 (0.0%) | 0 (0.0%) |
| 5 to 9 Unit Apartments | 0 (0.0%) | 0 (0.0%) |
| 10 or more Apartments | 0 (0.0%) | 0 (0.0%) |
| Mobile Home / Other | 0 (0.0%) | 0 (0.0%) |
| Total | 1,101 (85.8%) | 182 (14.2%) |
Housing Structures by Number of Rooms in Island Walk
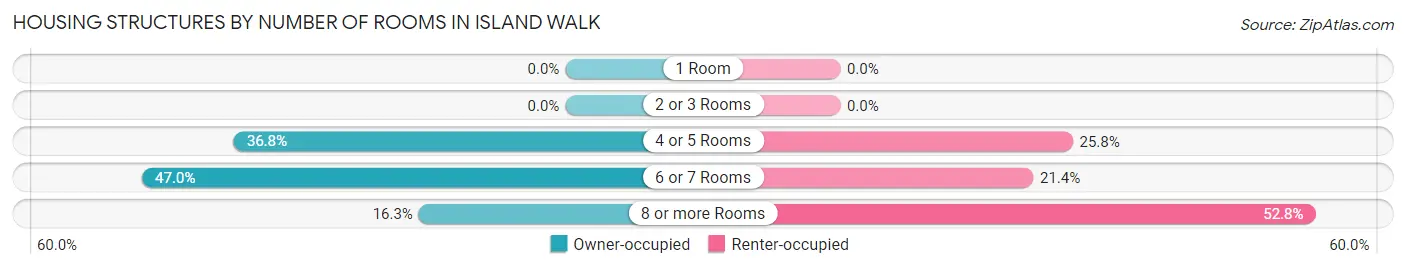
| Number of Rooms | Owner-occupied | Renter-occupied |
| 1 Room | 0 (0.0%) | 0 (0.0%) |
| 2 or 3 Rooms | 0 (0.0%) | 0 (0.0%) |
| 4 or 5 Rooms | 405 (36.8%) | 47 (25.8%) |
| 6 or 7 Rooms | 517 (47.0%) | 39 (21.4%) |
| 8 or more Rooms | 179 (16.3%) | 96 (52.7%) |
| Total | 1,101 (100.0%) | 182 (100.0%) |
Housing Structure by Heating Type in Island Walk
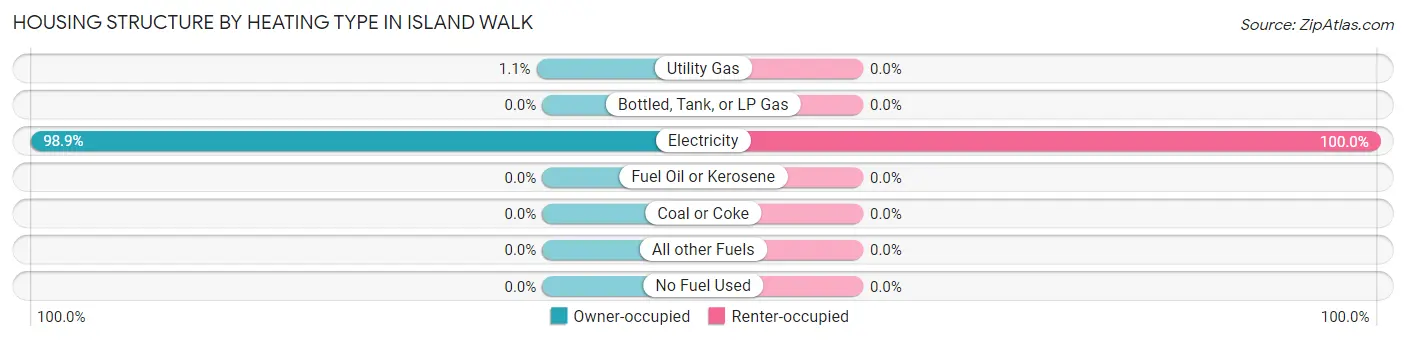
| Heating Type | Owner-occupied | Renter-occupied |
| Utility Gas | 12 (1.1%) | 0 (0.0%) |
| Bottled, Tank, or LP Gas | 0 (0.0%) | 0 (0.0%) |
| Electricity | 1,089 (98.9%) | 182 (100.0%) |
| Fuel Oil or Kerosene | 0 (0.0%) | 0 (0.0%) |
| Coal or Coke | 0 (0.0%) | 0 (0.0%) |
| All other Fuels | 0 (0.0%) | 0 (0.0%) |
| No Fuel Used | 0 (0.0%) | 0 (0.0%) |
| Total | 1,101 (100.0%) | 182 (100.0%) |
Household Vehicle Usage in Island Walk
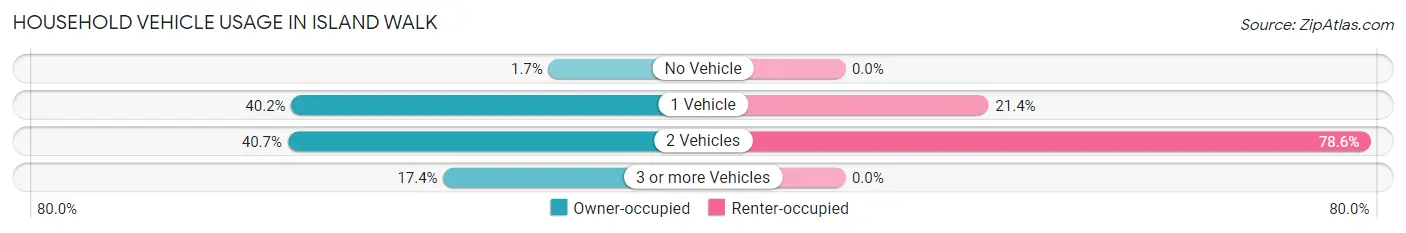
| Vehicles per Household | Owner-occupied | Renter-occupied |
| No Vehicle | 19 (1.7%) | 0 (0.0%) |
| 1 Vehicle | 442 (40.2%) | 39 (21.4%) |
| 2 Vehicles | 448 (40.7%) | 143 (78.6%) |
| 3 or more Vehicles | 192 (17.4%) | 0 (0.0%) |
| Total | 1,101 (100.0%) | 182 (100.0%) |
Real Estate & Mortgages in Island Walk
Real Estate and Mortgage Overview in Island Walk
| Characteristic | Without Mortgage | With Mortgage |
| Housing Units | 648 | 453 |
| Median Property Value | $500,000 | $602,400 |
| Median Household Income | $66,250 | $11 |
| Monthly Housing Costs | $827 | $0 |
| Real Estate Taxes | $3,640 | $0 |
Property Value by Mortgage Status in Island Walk
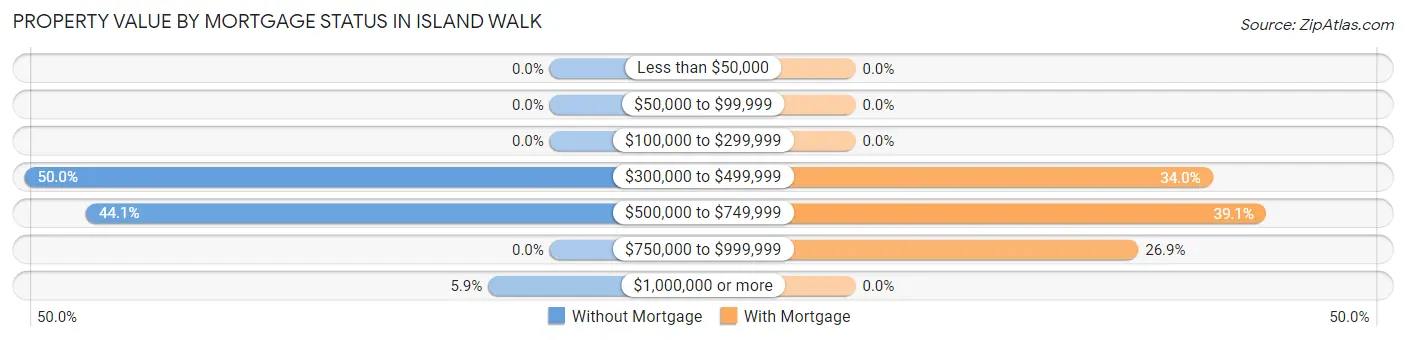
| Property Value | Without Mortgage | With Mortgage |
| Less than $50,000 | 0 (0.0%) | 0 (0.0%) |
| $50,000 to $99,999 | 0 (0.0%) | 0 (0.0%) |
| $100,000 to $299,999 | 0 (0.0%) | 0 (0.0%) |
| $300,000 to $499,999 | 324 (50.0%) | 154 (34.0%) |
| $500,000 to $749,999 | 286 (44.1%) | 177 (39.1%) |
| $750,000 to $999,999 | 0 (0.0%) | 122 (26.9%) |
| $1,000,000 or more | 38 (5.9%) | 0 (0.0%) |
| Total | 648 (100.0%) | 453 (100.0%) |
Household Income by Mortgage Status in Island Walk
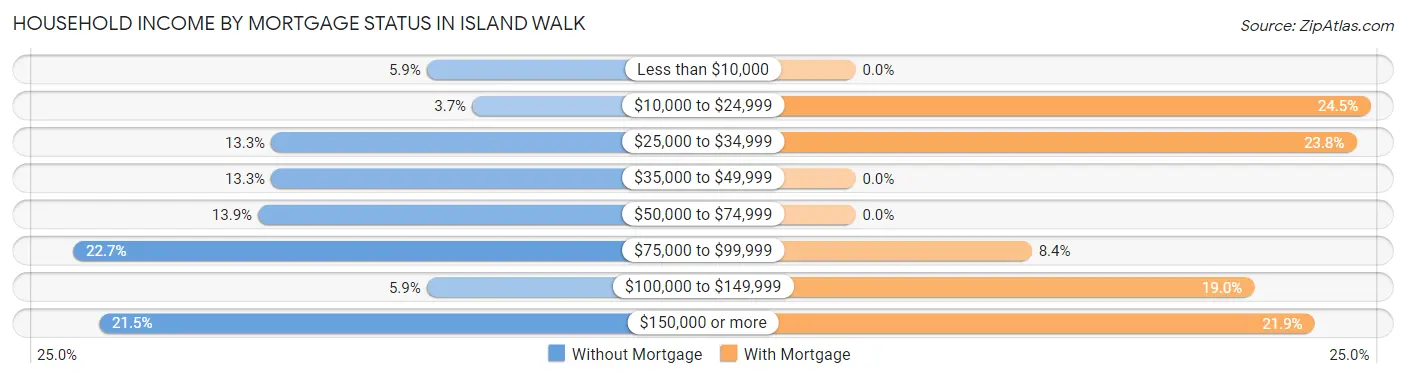
| Household Income | Without Mortgage | With Mortgage |
| Less than $10,000 | 38 (5.9%) | 0 (0.0%) |
| $10,000 to $24,999 | 24 (3.7%) | 111 (24.5%) |
| $25,000 to $34,999 | 86 (13.3%) | 108 (23.8%) |
| $35,000 to $49,999 | 86 (13.3%) | 0 (0.0%) |
| $50,000 to $74,999 | 90 (13.9%) | 0 (0.0%) |
| $75,000 to $99,999 | 147 (22.7%) | 38 (8.4%) |
| $100,000 to $149,999 | 38 (5.9%) | 86 (19.0%) |
| $150,000 or more | 139 (21.4%) | 99 (21.8%) |
| Total | 648 (100.0%) | 453 (100.0%) |
Property Value to Household Income Ratio in Island Walk
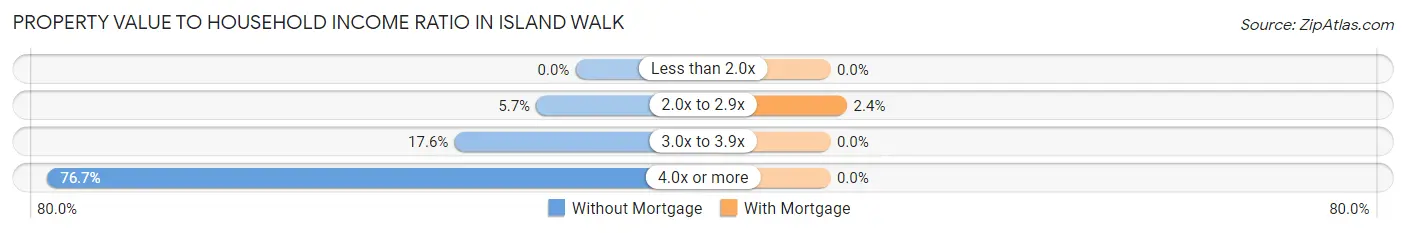
| Value-to-Income Ratio | Without Mortgage | With Mortgage |
| Less than 2.0x | 0 (0.0%) | 0 (0.0%) |
| 2.0x to 2.9x | 37 (5.7%) | 11 (2.4%) |
| 3.0x to 3.9x | 114 (17.6%) | 0 (0.0%) |
| 4.0x or more | 497 (76.7%) | 0 (0.0%) |
| Total | 648 (100.0%) | 453 (100.0%) |
Real Estate Taxes by Mortgage Status in Island Walk
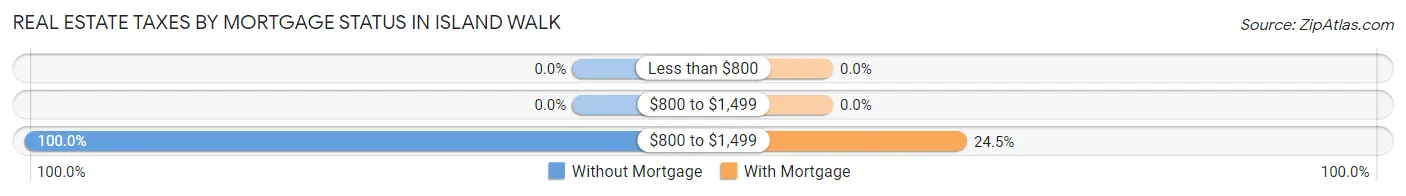
| Property Taxes | Without Mortgage | With Mortgage |
| Less than $800 | 0 (0.0%) | 0 (0.0%) |
| $800 to $1,499 | 0 (0.0%) | 0 (0.0%) |
| $800 to $1,499 | 648 (100.0%) | 111 (24.5%) |
| Total | 648 (100.0%) | 453 (100.0%) |
Health & Disability in Island Walk
Health Insurance Coverage by Age in Island Walk
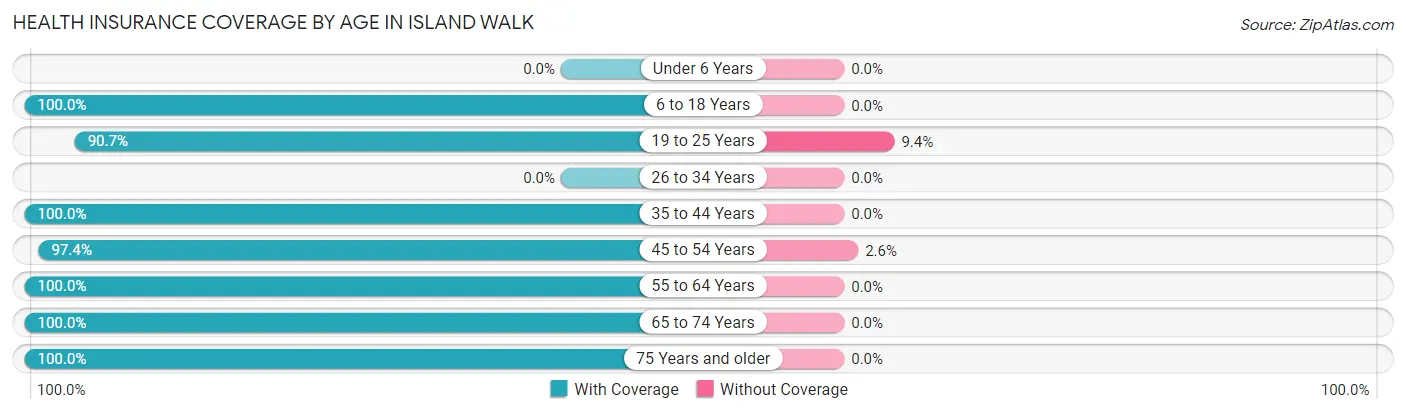
| Age Bracket | With Coverage | Without Coverage |
| Under 6 Years | 0 (0.0%) | 0 (0.0%) |
| 6 to 18 Years | 191 (100.0%) | 0 (0.0%) |
| 19 to 25 Years | 97 (90.6%) | 10 (9.3%) |
| 26 to 34 Years | 0 (0.0%) | 0 (0.0%) |
| 35 to 44 Years | 110 (100.0%) | 0 (0.0%) |
| 45 to 54 Years | 375 (97.4%) | 10 (2.6%) |
| 55 to 64 Years | 298 (100.0%) | 0 (0.0%) |
| 65 to 74 Years | 1,018 (100.0%) | 0 (0.0%) |
| 75 Years and older | 570 (100.0%) | 0 (0.0%) |
| Total | 2,659 (99.3%) | 20 (0.7%) |
Health Insurance Coverage by Citizenship Status in Island Walk
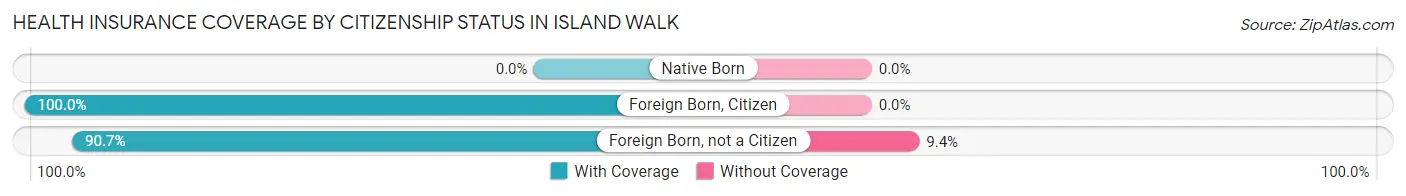
| Citizenship Status | With Coverage | Without Coverage |
| Native Born | 0 (0.0%) | 0 (0.0%) |
| Foreign Born, Citizen | 191 (100.0%) | 0 (0.0%) |
| Foreign Born, not a Citizen | 97 (90.6%) | 10 (9.3%) |
Health Insurance Coverage by Household Income in Island Walk
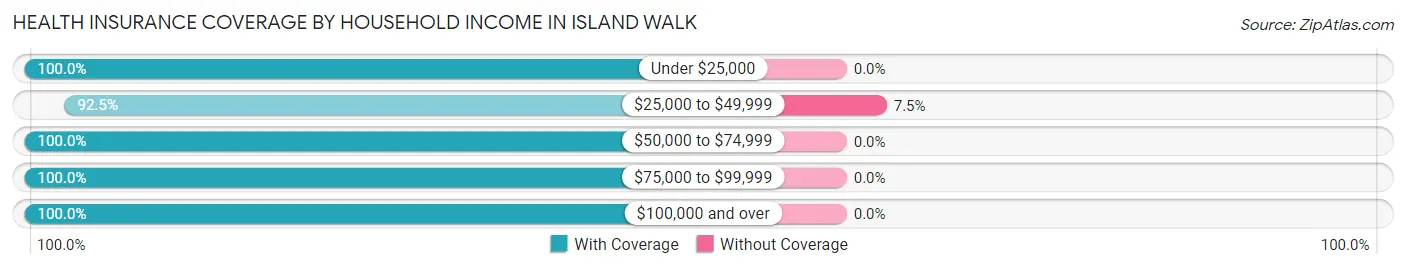
| Household Income | With Coverage | Without Coverage |
| Under $25,000 | 502 (100.0%) | 0 (0.0%) |
| $25,000 to $49,999 | 247 (92.5%) | 20 (7.5%) |
| $50,000 to $74,999 | 233 (100.0%) | 0 (0.0%) |
| $75,000 to $99,999 | 678 (100.0%) | 0 (0.0%) |
| $100,000 and over | 999 (100.0%) | 0 (0.0%) |
Public vs Private Health Insurance Coverage by Age in Island Walk
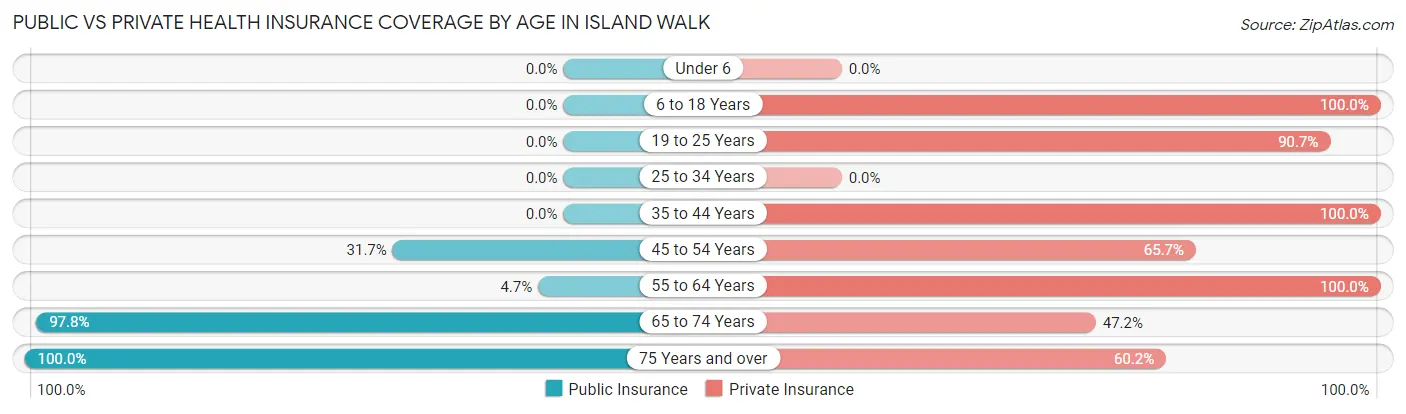
| Age Bracket | Public Insurance | Private Insurance |
| Under 6 | 0 (0.0%) | 0 (0.0%) |
| 6 to 18 Years | 0 (0.0%) | 191 (100.0%) |
| 19 to 25 Years | 0 (0.0%) | 97 (90.6%) |
| 25 to 34 Years | 0 (0.0%) | 0 (0.0%) |
| 35 to 44 Years | 0 (0.0%) | 110 (100.0%) |
| 45 to 54 Years | 122 (31.7%) | 253 (65.7%) |
| 55 to 64 Years | 14 (4.7%) | 298 (100.0%) |
| 65 to 74 Years | 996 (97.8%) | 480 (47.1%) |
| 75 Years and over | 570 (100.0%) | 343 (60.2%) |
| Total | 1,702 (63.5%) | 1,772 (66.1%) |
Disability Status by Sex by Age in Island Walk
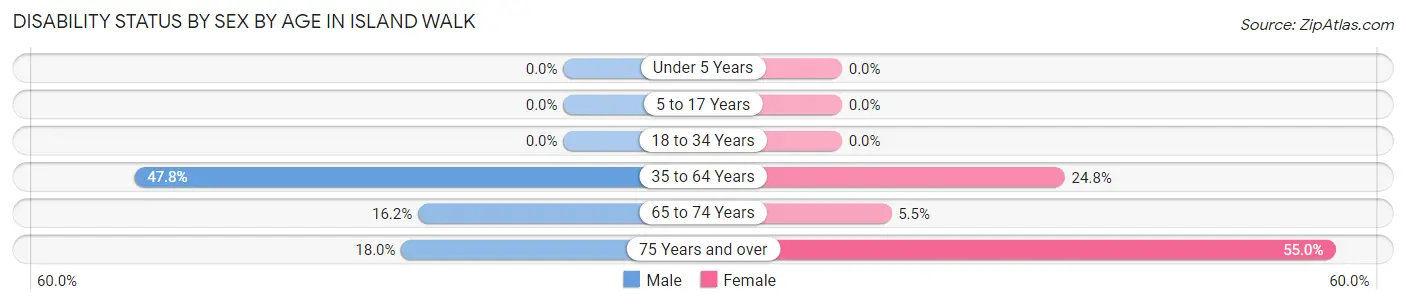
| Age Bracket | Male | Female |
| Under 5 Years | 0 (0.0%) | 0 (0.0%) |
| 5 to 17 Years | 0 (0.0%) | 0 (0.0%) |
| 18 to 34 Years | 0 (0.0%) | 0 (0.0%) |
| 35 to 64 Years | 119 (47.8%) | 135 (24.8%) |
| 65 to 74 Years | 50 (16.2%) | 39 (5.5%) |
| 75 Years and over | 70 (18.0%) | 100 (54.9%) |
Disability Class by Sex by Age in Island Walk
Disability Class: Hearing Difficulty
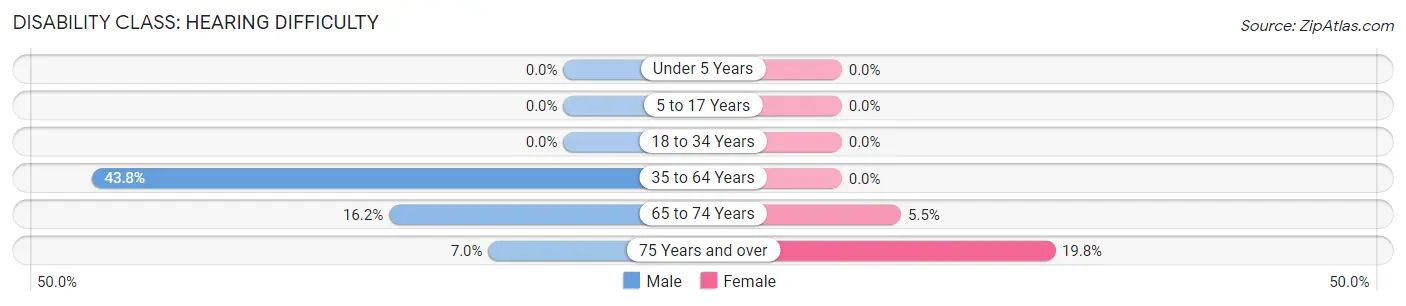
| Age Bracket | Male | Female |
| Under 5 Years | 0 (0.0%) | 0 (0.0%) |
| 5 to 17 Years | 0 (0.0%) | 0 (0.0%) |
| 18 to 34 Years | 0 (0.0%) | 0 (0.0%) |
| 35 to 64 Years | 109 (43.8%) | 0 (0.0%) |
| 65 to 74 Years | 50 (16.2%) | 39 (5.5%) |
| 75 Years and over | 27 (7.0%) | 36 (19.8%) |
Disability Class: Vision Difficulty
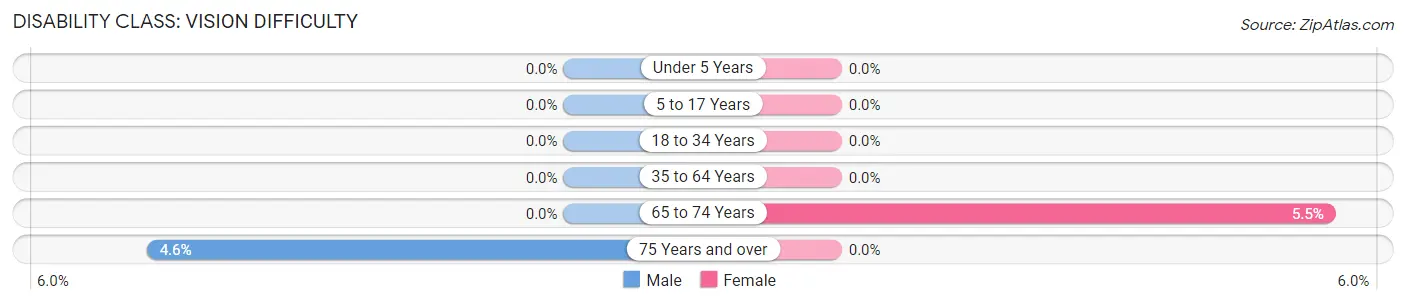
| Age Bracket | Male | Female |
| Under 5 Years | 0 (0.0%) | 0 (0.0%) |
| 5 to 17 Years | 0 (0.0%) | 0 (0.0%) |
| 18 to 34 Years | 0 (0.0%) | 0 (0.0%) |
| 35 to 64 Years | 0 (0.0%) | 0 (0.0%) |
| 65 to 74 Years | 0 (0.0%) | 39 (5.5%) |
| 75 Years and over | 18 (4.6%) | 0 (0.0%) |
Disability Class: Cognitive Difficulty
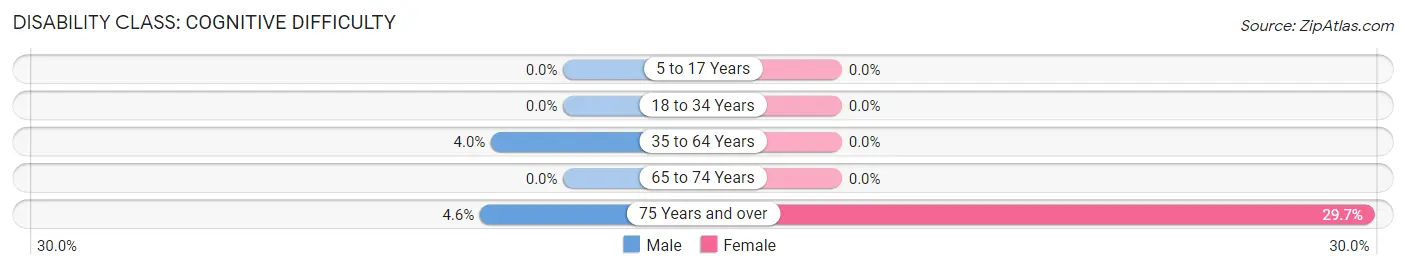
| Age Bracket | Male | Female |
| 5 to 17 Years | 0 (0.0%) | 0 (0.0%) |
| 18 to 34 Years | 0 (0.0%) | 0 (0.0%) |
| 35 to 64 Years | 10 (4.0%) | 0 (0.0%) |
| 65 to 74 Years | 0 (0.0%) | 0 (0.0%) |
| 75 Years and over | 18 (4.6%) | 54 (29.7%) |
Disability Class: Ambulatory Difficulty
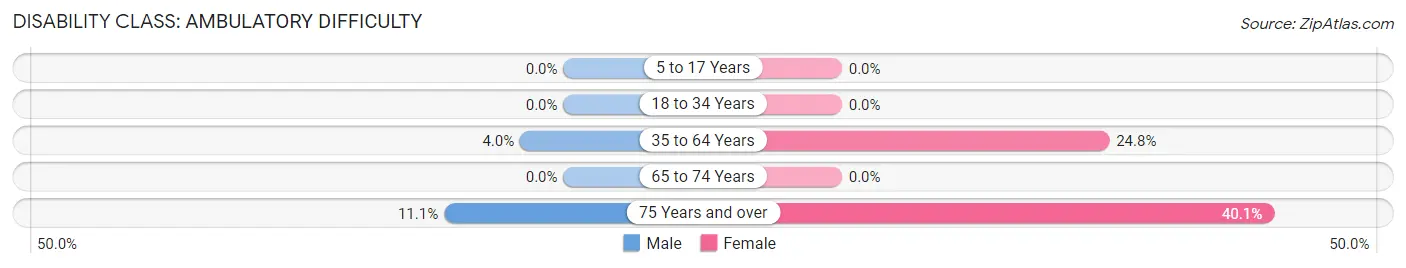
| Age Bracket | Male | Female |
| 5 to 17 Years | 0 (0.0%) | 0 (0.0%) |
| 18 to 34 Years | 0 (0.0%) | 0 (0.0%) |
| 35 to 64 Years | 10 (4.0%) | 135 (24.8%) |
| 65 to 74 Years | 0 (0.0%) | 0 (0.0%) |
| 75 Years and over | 43 (11.1%) | 73 (40.1%) |
Disability Class: Self-Care Difficulty
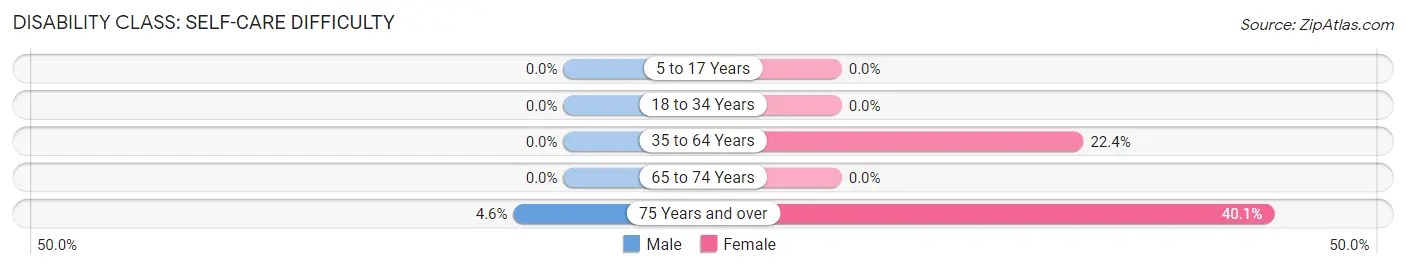
| Age Bracket | Male | Female |
| 5 to 17 Years | 0 (0.0%) | 0 (0.0%) |
| 18 to 34 Years | 0 (0.0%) | 0 (0.0%) |
| 35 to 64 Years | 0 (0.0%) | 122 (22.4%) |
| 65 to 74 Years | 0 (0.0%) | 0 (0.0%) |
| 75 Years and over | 18 (4.6%) | 73 (40.1%) |
Technology Access in Island Walk
Computing Device Access in Island Walk
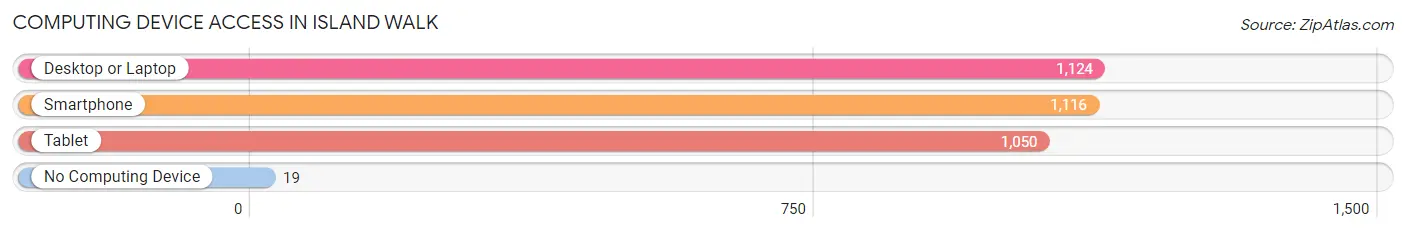
| Device Type | # Households | % Households |
| Desktop or Laptop | 1,124 | 87.6% |
| Smartphone | 1,116 | 87.0% |
| Tablet | 1,050 | 81.8% |
| No Computing Device | 19 | 1.5% |
| Total | 1,283 | 100.0% |
Internet Access in Island Walk
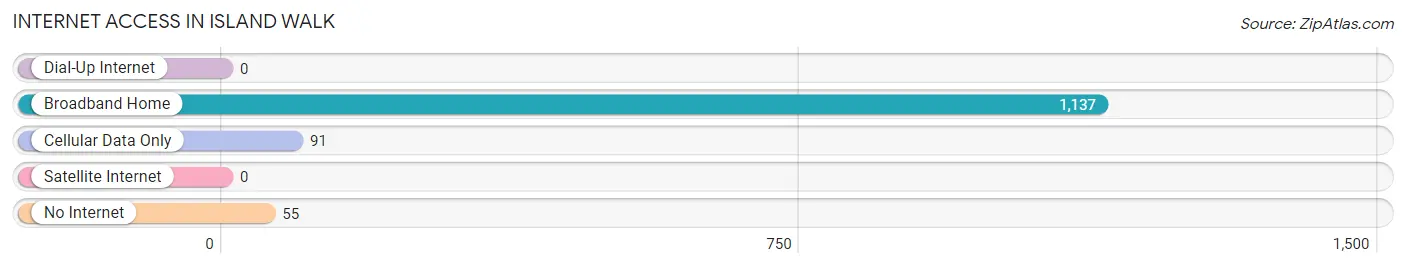
| Internet Type | # Households | % Households |
| Dial-Up Internet | 0 | 0.0% |
| Broadband Home | 1,137 | 88.6% |
| Cellular Data Only | 91 | 7.1% |
| Satellite Internet | 0 | 0.0% |
| No Internet | 55 | 4.3% |
| Total | 1,283 | 100.0% |
Island Walk Summary
Island Walk is a census-designated place (CDP) located in Collier County, Florida, United States. It is situated in the southwestern part of the county, approximately 20 miles east of Naples. As of the 2010 census, the population of Island Walk was 4,854.
Geography
Island Walk is located at 26°14'17" North, 81°37'45" West (26.238, -81.629). It is situated in the southwestern part of Collier County, approximately 20 miles east of Naples. The CDP has a total area of 4.2 square miles, all of which is land.
History
Island Walk was first settled in the late 19th century by a group of fishermen and farmers. The area was originally known as "Island Walk" due to the fact that the land was surrounded by water on three sides. The first post office was established in the area in 1891.
In the early 20th century, the area began to attract more settlers, and by the 1950s, the population had grown to over 1,000. In the 1970s, the area was annexed by Collier County and became a census-designated place.
Economy
Island Walk is primarily a residential community, with most of its residents employed in the nearby cities of Naples and Fort Myers. The area is also home to a number of small businesses, including restaurants, retail stores, and professional services.
Demographics
As of the 2010 census, there were 4,854 people, 1,945 households, and 1,541 families residing in Island Walk. The population density was 1,159.3 people per square mile. The racial makeup of the CDP was 94.2% White, 1.7% African American, 0.3% Native American, 1.2% Asian, 0.1% Pacific Islander, 1.2% from other races, and 1.5% from two or more races. Hispanic or Latino of any race were 5.2% of the population.
The median income for a household in Island Walk was $60,938, and the median income for a family was $68,938. The per capita income for the CDP was $30,938. About 4.2% of families and 5.2% of the population were below the poverty line, including 6.2% of those under age 18 and 4.2% of those age 65 or over.
Common Questions
What is the Total Population of Island Walk?
Total Population of Island Walk is 2,679.
What is the Total Male Population of Island Walk?
Total Male Population of Island Walk is 1,043.
What is the Total Female Population of Island Walk?
Total Female Population of Island Walk is 1,636.
What is the Ratio of Males per 100 Females in Island Walk?
There are 63.75 Males per 100 Females in Island Walk.
What is the Ratio of Females per 100 Males in Island Walk?
There are 156.86 Females per 100 Males in Island Walk.
What is the Median Population Age in Island Walk?
Median Population Age in Island Walk is 67.8 Years.
What is the Average Family Size in Island Walk
Average Family Size in Island Walk is 2.3 People.
What is the Average Household Size in Island Walk
Average Household Size in Island Walk is 2.1 People.
What is Per Capita Income in Island Walk?
Per Capita income in Island Walk is $38,758.
What is the Median Family Income in Island Walk?
Median Family Income in Island Walk is $84,688.
What is the Median Household income in Island Walk?
Median Household Income in Island Walk is $76,315.
What is Inequality or Gini Index in Island Walk?
Inequality or Gini Index in Island Walk is 0.39.
How Large is the Labor Force in Island Walk?
There are 816 People in the Labor Forcein in Island Walk.
What is the Percentage of People in the Labor Force in Island Walk?
31.9% of People are in the Labor Force in Island Walk.
What is the Unemployment Rate in Island Walk?
Unemployment Rate in Island Walk is 15.6%.