River Ridge, FL
River Ridge Map
River Ridge Overview
4,705
TOTAL POPULATION
2,223
MALE POPULATION
2,482
FEMALE POPULATION
89.56
MALES / 100 FEMALES
111.65
FEMALES / 100 MALES
50.7
MEDIAN AGE
2.9
AVG FAMILY SIZE
2.8
AVG HOUSEHOLD SIZE
$48,370
PER CAPITA INCOME
$95,848
AVG FAMILY INCOME
$97,039
AVG HOUSEHOLD INCOME
7.5%
WAGE / INCOME GAP [ % ]
92.5¢/ $1
WAGE / INCOME GAP [ $ ]
0.44
INEQUALITY / GINI INDEX
2,695
LABOR FORCE [ PEOPLE ]
62.5%
PERCENT IN LABOR FORCE
12.8%
UNEMPLOYMENT RATE
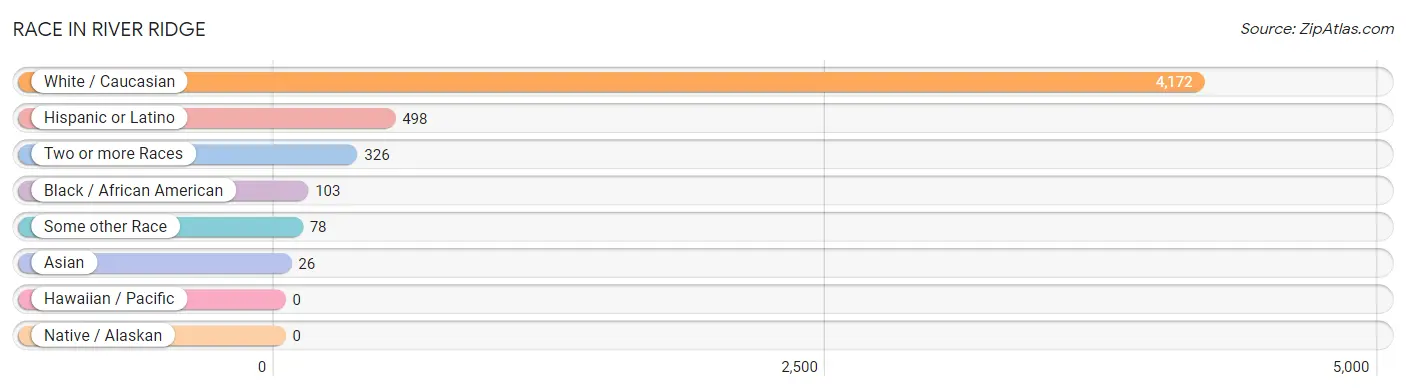
Race in River Ridge
The most populous races in River Ridge are White / Caucasian (4,172 | 88.7%), Hispanic or Latino (498 | 10.6%), and Two or more Races (326 | 6.9%).
| Race | # Population | % Population |
| Asian | 26 | 0.5% |
| Black / African American | 103 | 2.2% |
| Hawaiian / Pacific | 0 | 0.0% |
| Hispanic or Latino | 498 | 10.6% |
| Native / Alaskan | 0 | 0.0% |
| White / Caucasian | 4,172 | 88.7% |
| Two or more Races | 326 | 6.9% |
| Some other Race | 78 | 1.7% |
| Total | 4,705 | 100.0% |
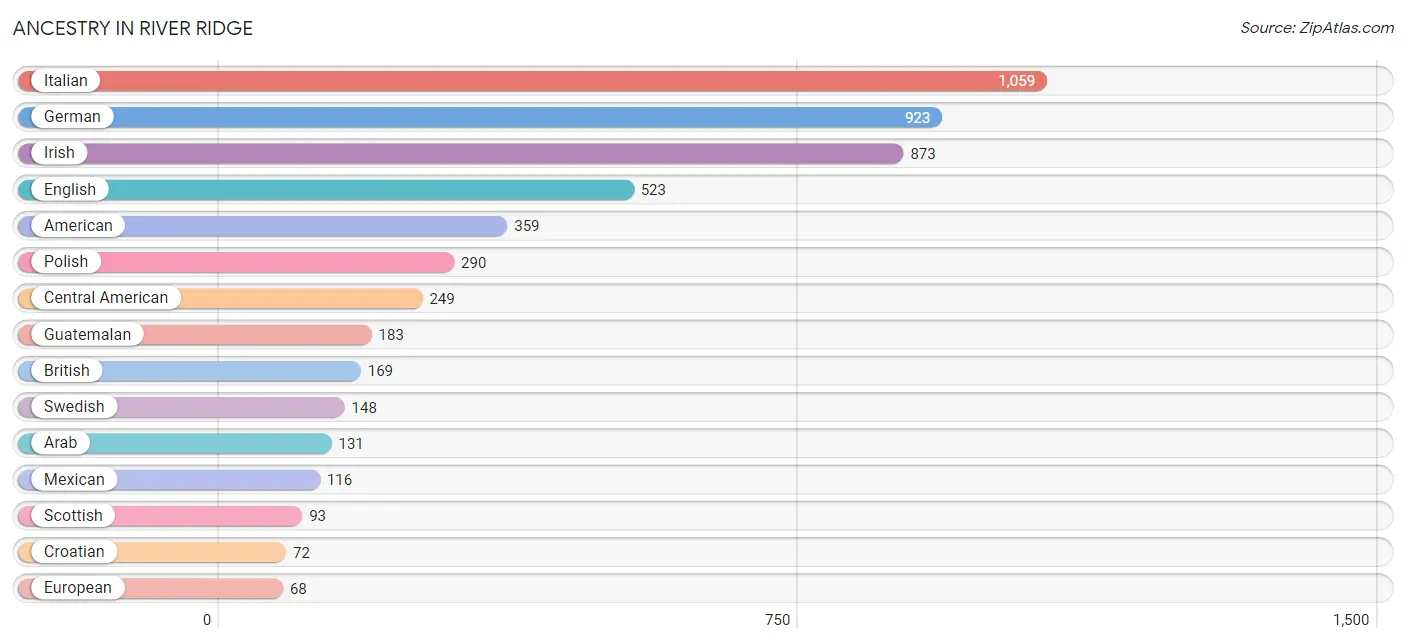
Ancestry in River Ridge
The most populous ancestries reported in River Ridge are Italian (1,059 | 22.5%), German (923 | 19.6%), Irish (873 | 18.5%), English (523 | 11.1%), and American (359 | 7.6%), together accounting for 79.4% of all River Ridge residents.
| Ancestry | # Population | % Population |
| American | 359 | 7.6% |
| Arab | 131 | 2.8% |
| Belgian | 26 | 0.5% |
| British | 169 | 3.6% |
| Central American | 249 | 5.3% |
| Central American Indian | 25 | 0.5% |
| Costa Rican | 31 | 0.7% |
| Croatian | 72 | 1.5% |
| Cuban | 24 | 0.5% |
| Czech | 18 | 0.4% |
| Dutch | 17 | 0.4% |
| Egyptian | 30 | 0.6% |
| English | 523 | 11.1% |
| European | 68 | 1.5% |
| French | 22 | 0.5% |
| French Canadian | 47 | 1.0% |
| German | 923 | 19.6% |
| Guatemalan | 183 | 3.9% |
| Hungarian | 52 | 1.1% |
| Iranian | 19 | 0.4% |
| Irish | 873 | 18.5% |
| Iroquois | 47 | 1.0% |
| Italian | 1,059 | 22.5% |
| Korean | 49 | 1.0% |
| Mexican | 116 | 2.5% |
| Mexican American Indian | 23 | 0.5% |
| Nicaraguan | 35 | 0.7% |
| Norwegian | 6 | 0.1% |
| Peruvian | 25 | 0.5% |
| Polish | 290 | 6.2% |
| Pueblo | 23 | 0.5% |
| Puerto Rican | 23 | 0.5% |
| Russian | 52 | 1.1% |
| Scotch-Irish | 33 | 0.7% |
| Scottish | 93 | 2.0% |
| South American | 25 | 0.5% |
| Spaniard | 61 | 1.3% |
| Swedish | 148 | 3.2% |
| Ukrainian | 44 | 0.9% |
| Yugoslavian | 25 | 0.5% | View All 40 Rows |
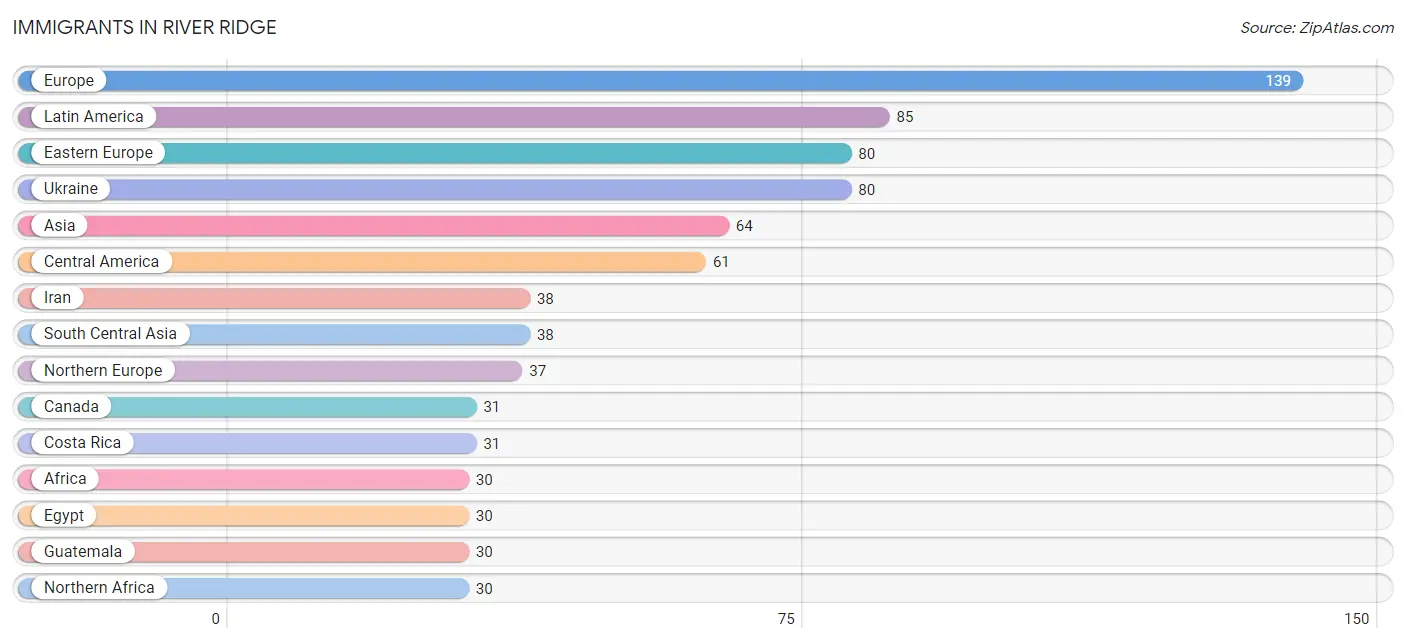
Immigrants in River Ridge
The most numerous immigrant groups reported in River Ridge came from Europe (139 | 2.9%), Latin America (85 | 1.8%), Eastern Europe (80 | 1.7%), Ukraine (80 | 1.7%), and Asia (64 | 1.4%), together accounting for 9.5% of all River Ridge residents.
| Immigration Origin | # Population | % Population |
| Africa | 30 | 0.6% |
| Asia | 64 | 1.4% |
| Canada | 31 | 0.7% |
| Caribbean | 24 | 0.5% |
| Central America | 61 | 1.3% |
| Costa Rica | 31 | 0.7% |
| Cuba | 24 | 0.5% |
| Eastern Europe | 80 | 1.7% |
| Egypt | 30 | 0.6% |
| England | 24 | 0.5% |
| Europe | 139 | 2.9% |
| Germany | 22 | 0.5% |
| Guatemala | 30 | 0.6% |
| Iran | 38 | 0.8% |
| Latin America | 85 | 1.8% |
| Northern Africa | 30 | 0.6% |
| Northern Europe | 37 | 0.8% |
| Philippines | 26 | 0.5% |
| Scotland | 13 | 0.3% |
| South Central Asia | 38 | 0.8% |
| South Eastern Asia | 26 | 0.5% |
| Ukraine | 80 | 1.7% |
| Western Europe | 22 | 0.5% | View All 23 Rows |
Sex and Age in River Ridge
Sex and Age in River Ridge
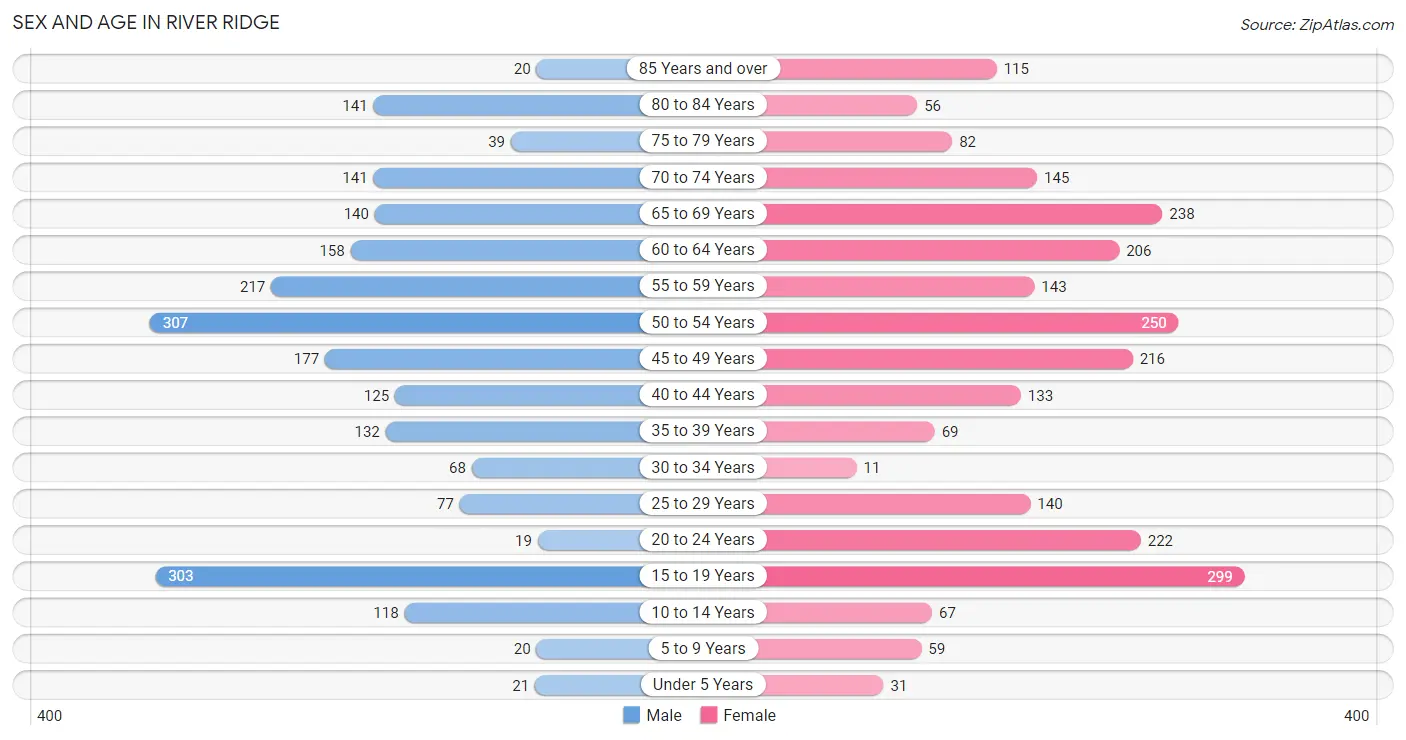
The most populous age groups in River Ridge are 50 to 54 Years (307 | 13.8%) for men and 15 to 19 Years (299 | 12.0%) for women.
| Age Bracket | Male | Female |
| Under 5 Years | 21 (0.9%) | 31 (1.3%) |
| 5 to 9 Years | 20 (0.9%) | 59 (2.4%) |
| 10 to 14 Years | 118 (5.3%) | 67 (2.7%) |
| 15 to 19 Years | 303 (13.6%) | 299 (12.0%) |
| 20 to 24 Years | 19 (0.9%) | 222 (8.9%) |
| 25 to 29 Years | 77 (3.5%) | 140 (5.6%) |
| 30 to 34 Years | 68 (3.1%) | 11 (0.4%) |
| 35 to 39 Years | 132 (5.9%) | 69 (2.8%) |
| 40 to 44 Years | 125 (5.6%) | 133 (5.4%) |
| 45 to 49 Years | 177 (8.0%) | 216 (8.7%) |
| 50 to 54 Years | 307 (13.8%) | 250 (10.1%) |
| 55 to 59 Years | 217 (9.8%) | 143 (5.8%) |
| 60 to 64 Years | 158 (7.1%) | 206 (8.3%) |
| 65 to 69 Years | 140 (6.3%) | 238 (9.6%) |
| 70 to 74 Years | 141 (6.3%) | 145 (5.8%) |
| 75 to 79 Years | 39 (1.8%) | 82 (3.3%) |
| 80 to 84 Years | 141 (6.3%) | 56 (2.3%) |
| 85 Years and over | 20 (0.9%) | 115 (4.6%) |
| Total | 2,223 (100.0%) | 2,482 (100.0%) |
Families and Households in River Ridge
Median Family Size in River Ridge
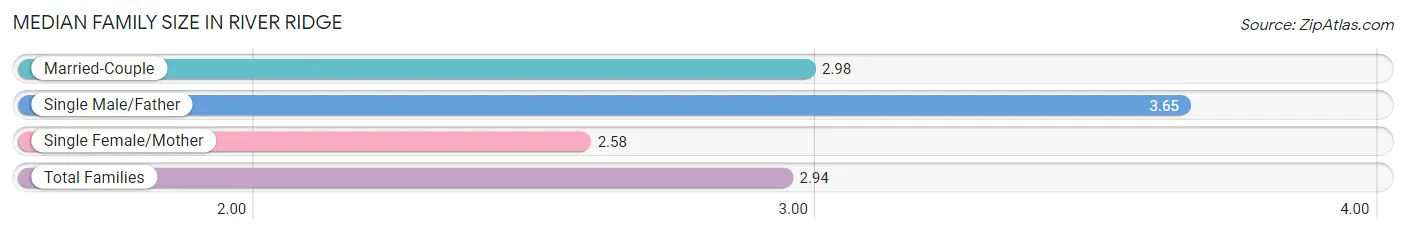
The median family size in River Ridge is 2.94 persons per family, with single male/father families (72 | 5.7%) accounting for the largest median family size of 3.65 persons per family. On the other hand, single female/mother families (249 | 19.7%) represent the smallest median family size with 2.58 persons per family.
| Family Type | # Families | Family Size |
| Married-Couple | 942 (74.6%) | 2.98 |
| Single Male/Father | 72 (5.7%) | 3.65 |
| Single Female/Mother | 249 (19.7%) | 2.58 |
| Total Families | 1,263 (100.0%) | 2.94 |
Median Household Size in River Ridge
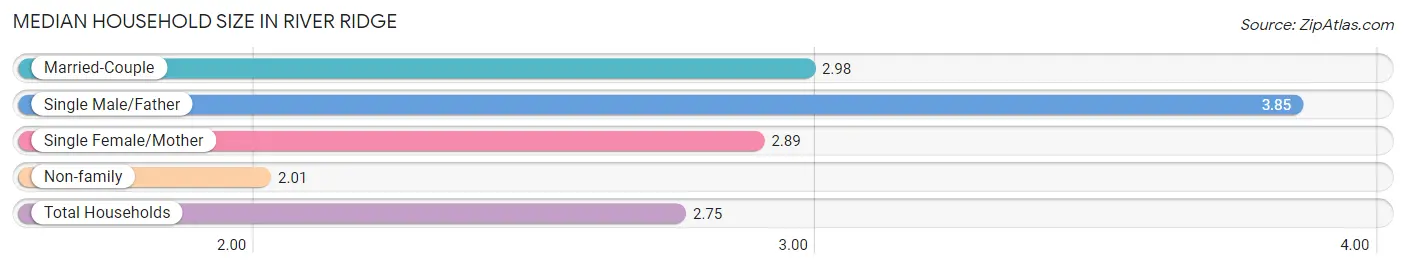
The median household size in River Ridge is 2.75 persons per household, with single male/father households (72 | 4.2%) accounting for the largest median household size of 3.85 persons per household. non-family households (447 | 26.1%) represent the smallest median household size with 2.01 persons per household.
| Household Type | # Households | Household Size |
| Married-Couple | 942 (55.1%) | 2.98 |
| Single Male/Father | 72 (4.2%) | 3.85 |
| Single Female/Mother | 249 (14.6%) | 2.89 |
| Non-family | 447 (26.1%) | 2.01 |
| Total Households | 1,710 (100.0%) | 2.75 |
Household Size by Marriage Status in River Ridge
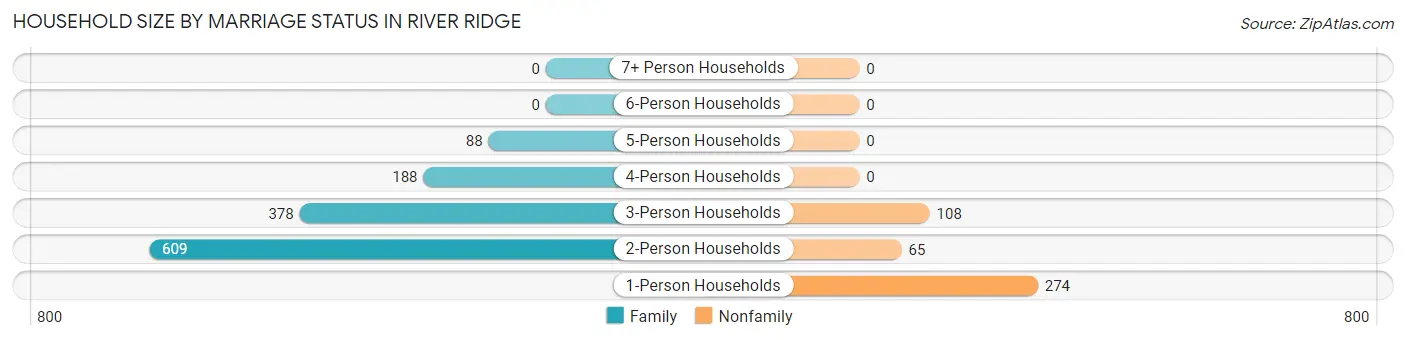
Out of a total of 1,710 households in River Ridge, 1,263 (73.9%) are family households, while 447 (26.1%) are nonfamily households. The most numerous type of family households are 2-person households, comprising 609, and the most common type of nonfamily households are 1-person households, comprising 274.
| Household Size | Family Households | Nonfamily Households |
| 1-Person Households | - | 274 (16.0%) |
| 2-Person Households | 609 (35.6%) | 65 (3.8%) |
| 3-Person Households | 378 (22.1%) | 108 (6.3%) |
| 4-Person Households | 188 (11.0%) | 0 (0.0%) |
| 5-Person Households | 88 (5.1%) | 0 (0.0%) |
| 6-Person Households | 0 (0.0%) | 0 (0.0%) |
| 7+ Person Households | 0 (0.0%) | 0 (0.0%) |
| Total | 1,263 (73.9%) | 447 (26.1%) |
Female Fertility in River Ridge
Fertility by Age in River Ridge
| Age Bracket | Women with Births | Births / 1,000 Women |
| 15 to 19 years | 0 (0.0%) | 0.0 |
| 20 to 34 years | 0 (0.0%) | 0.0 |
| 35 to 50 years | 0 (0.0%) | 0.0 |
| Total | 0 (0.0%) | 0.0 |
Fertility by Age by Marriage Status in River Ridge
| Age Bracket | Married | Unmarried |
| 15 to 19 years | 0 (0.0%) | 0 (0.0%) |
| 20 to 34 years | 0 (0.0%) | 0 (0.0%) |
| 35 to 50 years | 0 (0.0%) | 0 (0.0%) |
| Total | 0 (0.0%) | 0 (0.0%) |
Fertility by Education in River Ridge
| Educational Attainment | Women with Births | Births / 1,000 Women |
| Less than High School | 0 (0.0%) | 0.0 |
| High School Diploma | 0 (0.0%) | 0.0 |
| College or Associate's Degree | 0 (0.0%) | 0.0 |
| Bachelor's Degree | 0 (0.0%) | 0.0 |
| Graduate Degree | 0 (0.0%) | 0.0 |
| Total | 0 (0.0%) | 0.0 |
Fertility by Education by Marriage Status in River Ridge
| Educational Attainment | Married | Unmarried |
| Less than High School | 0 (0.0%) | 0 (0.0%) |
| High School Diploma | 0 (0.0%) | 0 (0.0%) |
| College or Associate's Degree | 0 (0.0%) | 0 (0.0%) |
| Bachelor's Degree | 0 (0.0%) | 0 (0.0%) |
| Graduate Degree | 0 (0.0%) | 0 (0.0%) |
| Total | 0 (0.0%) | 0 (0.0%) |
Income in River Ridge
Income Overview in River Ridge
Per Capita Income in River Ridge is $48,370, while median incomes of families and households are $95,848 and $97,039 respectively.
| Characteristic | Number | Measure |
| Per Capita Income | 4,705 | $48,370 |
| Median Family Income | 1,263 | $95,848 |
| Mean Family Income | 1,263 | $114,325 |
| Median Household Income | 1,710 | $97,039 |
| Mean Household Income | 1,710 | $124,988 |
| Income Deficit | 1,263 | $0 |
| Wage / Income Gap (%) | 4,705 | 7.50% |
| Wage / Income Gap ($) | 4,705 | 92.50¢ per $1 |
| Gini / Inequality Index | 4,705 | 0.44 |
Earnings by Sex in River Ridge
Average Earnings in River Ridge are $44,077, $41,683 for men and $45,065 for women, a difference of 7.5%.
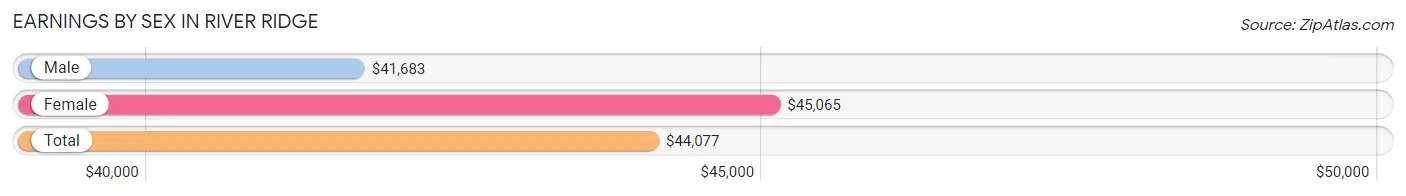
| Sex | Number | Average Earnings |
| Male | 1,336 (48.9%) | $41,683 |
| Female | 1,395 (51.1%) | $45,065 |
| Total | 2,731 (100.0%) | $44,077 |
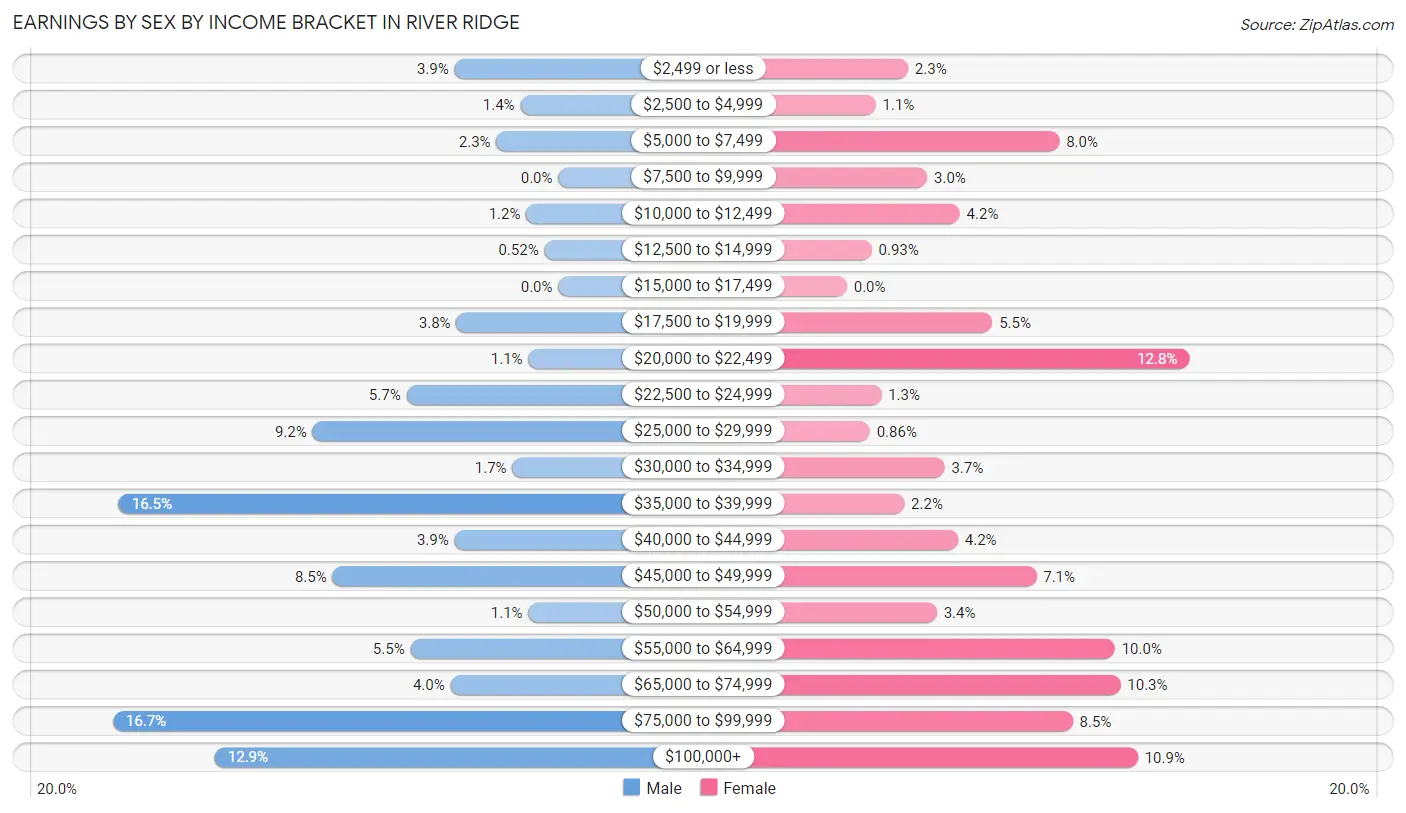
Earnings by Sex by Income Bracket in River Ridge
The most common earnings brackets in River Ridge are $75,000 to $99,999 for men (223 | 16.7%) and $20,000 to $22,499 for women (179 | 12.8%).
| Income | Male | Female |
| $2,499 or less | 52 (3.9%) | 32 (2.3%) |
| $2,500 to $4,999 | 19 (1.4%) | 15 (1.1%) |
| $5,000 to $7,499 | 31 (2.3%) | 111 (8.0%) |
| $7,500 to $9,999 | 0 (0.0%) | 42 (3.0%) |
| $10,000 to $12,499 | 16 (1.2%) | 59 (4.2%) |
| $12,500 to $14,999 | 7 (0.5%) | 13 (0.9%) |
| $15,000 to $17,499 | 0 (0.0%) | 0 (0.0%) |
| $17,500 to $19,999 | 51 (3.8%) | 76 (5.4%) |
| $20,000 to $22,499 | 15 (1.1%) | 179 (12.8%) |
| $22,500 to $24,999 | 76 (5.7%) | 18 (1.3%) |
| $25,000 to $29,999 | 123 (9.2%) | 12 (0.9%) |
| $30,000 to $34,999 | 23 (1.7%) | 51 (3.7%) |
| $35,000 to $39,999 | 220 (16.5%) | 30 (2.1%) |
| $40,000 to $44,999 | 52 (3.9%) | 58 (4.2%) |
| $45,000 to $49,999 | 113 (8.5%) | 99 (7.1%) |
| $50,000 to $54,999 | 15 (1.1%) | 47 (3.4%) |
| $55,000 to $64,999 | 74 (5.5%) | 140 (10.0%) |
| $65,000 to $74,999 | 54 (4.0%) | 143 (10.2%) |
| $75,000 to $99,999 | 223 (16.7%) | 118 (8.5%) |
| $100,000+ | 172 (12.9%) | 152 (10.9%) |
| Total | 1,336 (100.0%) | 1,395 (100.0%) |
Earnings by Sex by Educational Attainment in River Ridge
Average earnings in River Ridge are $45,431 for men and $57,265 for women, a difference of 20.7%. Men with an educational attainment of graduate degree enjoy the highest average annual earnings of $250,001, while those with high school diploma education earn the least with $38,858. Women with an educational attainment of high school diploma earn the most with the average annual earnings of $73,698, while those with college or associate's degree education have the smallest earnings of $48,720.
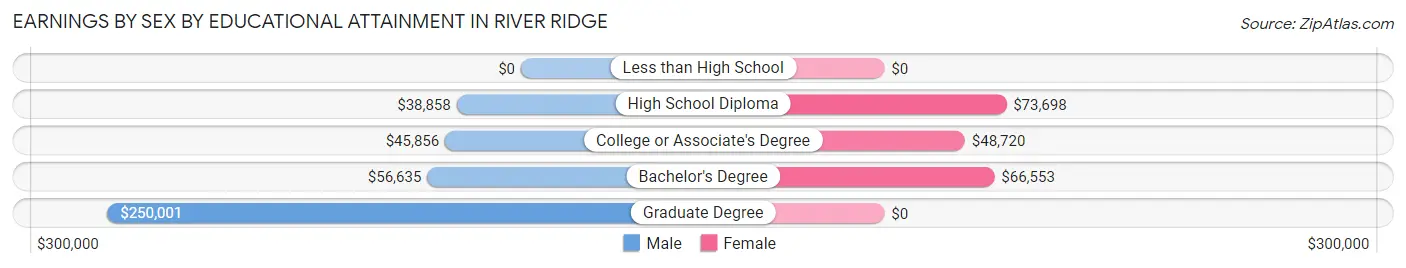
| Educational Attainment | Male Income | Female Income |
| Less than High School | - | - |
| High School Diploma | $38,858 | $73,698 |
| College or Associate's Degree | $45,856 | $48,720 |
| Bachelor's Degree | $56,635 | $66,553 |
| Graduate Degree | $250,001 | $0 |
| Total | $45,431 | $57,265 |
Family Income in River Ridge
Family Income Brackets in River Ridge
According to the River Ridge family income data, there are 325 families falling into the $100,000 to $149,999 income range, which is the most common income bracket and makes up 25.7% of all families.
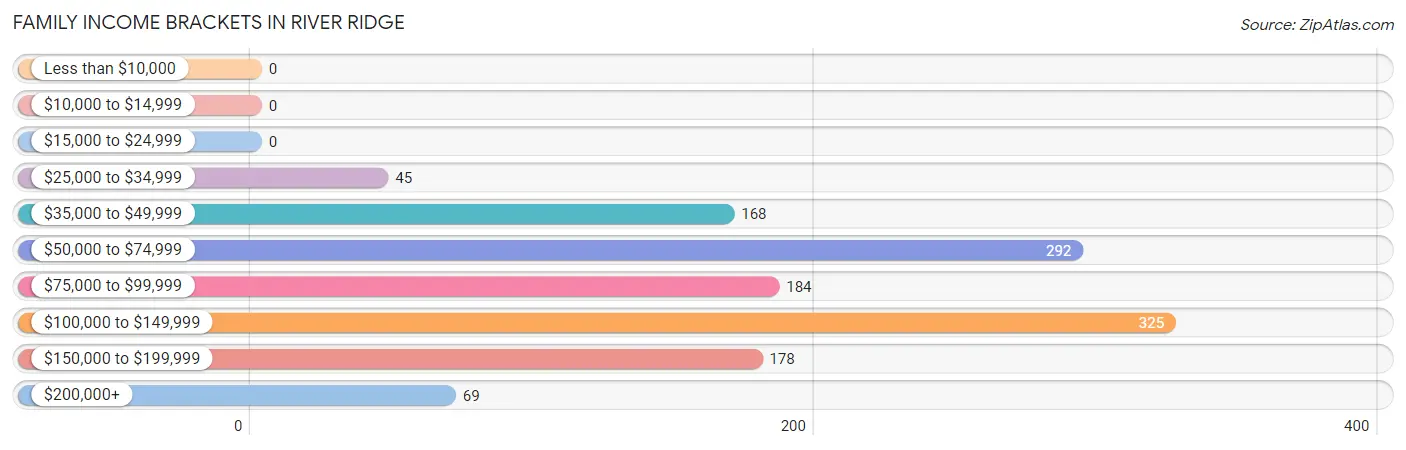
| Income Bracket | # Families | % Families |
| Less than $10,000 | 0 | 0.0% |
| $10,000 to $14,999 | 0 | 0.0% |
| $15,000 to $24,999 | 0 | 0.0% |
| $25,000 to $34,999 | 45 | 3.6% |
| $35,000 to $49,999 | 168 | 13.3% |
| $50,000 to $74,999 | 292 | 23.1% |
| $75,000 to $99,999 | 184 | 14.6% |
| $100,000 to $149,999 | 325 | 25.7% |
| $150,000 to $199,999 | 178 | 14.1% |
| $200,000+ | 69 | 5.5% |
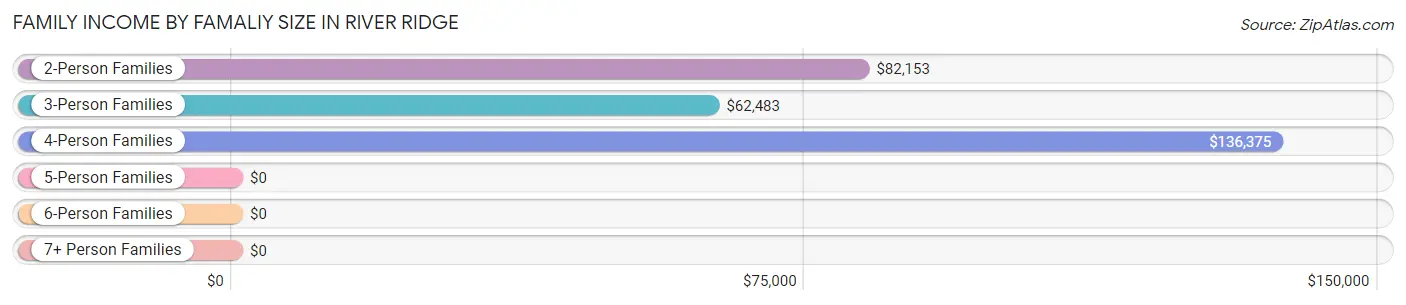
Family Income by Famaliy Size in River Ridge
4-person families (164 | 13.0%) account for the highest median family income in River Ridge with $136,375 per family, while 2-person families (609 | 48.2%) have the highest median income of $41,076 per family member.
| Income Bracket | # Families | Median Income |
| 2-Person Families | 609 (48.2%) | $82,153 |
| 3-Person Families | 433 (34.3%) | $62,483 |
| 4-Person Families | 164 (13.0%) | $136,375 |
| 5-Person Families | 57 (4.5%) | $0 |
| 6-Person Families | 0 (0.0%) | $0 |
| 7+ Person Families | 0 (0.0%) | $0 |
| Total | 1,263 (100.0%) | $95,848 |
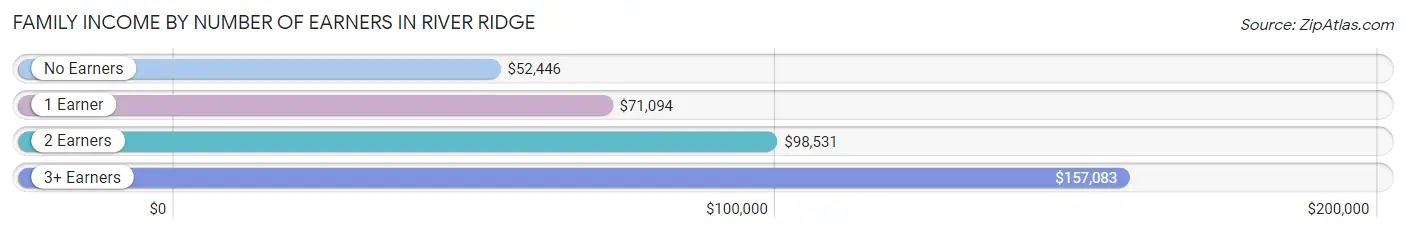
Family Income by Number of Earners in River Ridge
The median family income in River Ridge is $95,848, with families comprising 3+ earners (195) having the highest median family income of $157,083, while families with no earners (237) have the lowest median family income of $52,446, accounting for 15.4% and 18.8% of families, respectively.
| Number of Earners | # Families | Median Income |
| No Earners | 237 (18.8%) | $52,446 |
| 1 Earner | 382 (30.2%) | $71,094 |
| 2 Earners | 449 (35.5%) | $98,531 |
| 3+ Earners | 195 (15.4%) | $157,083 |
| Total | 1,263 (100.0%) | $95,848 |
Household Income in River Ridge
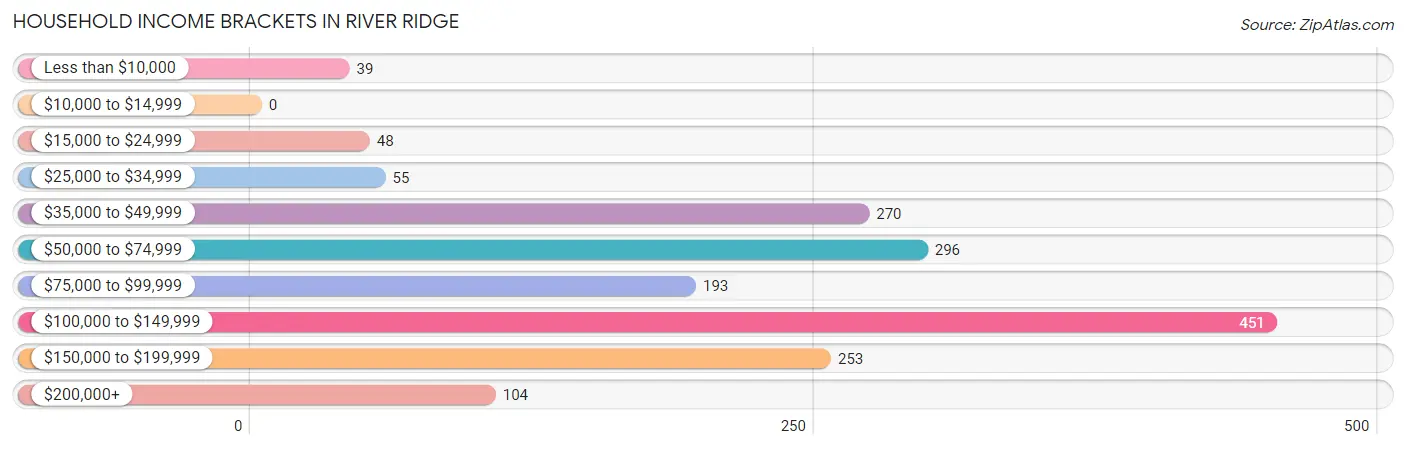
Household Income Brackets in River Ridge
With 451 households falling in the category, the $100,000 to $149,999 income range is the most frequent in River Ridge, accounting for 26.4% of all households.
| Income Bracket | # Households | % Households |
| Less than $10,000 | 39 | 2.3% |
| $10,000 to $14,999 | 0 | 0.0% |
| $15,000 to $24,999 | 48 | 2.8% |
| $25,000 to $34,999 | 55 | 3.2% |
| $35,000 to $49,999 | 270 | 15.8% |
| $50,000 to $74,999 | 296 | 17.3% |
| $75,000 to $99,999 | 193 | 11.3% |
| $100,000 to $149,999 | 451 | 26.4% |
| $150,000 to $199,999 | 253 | 14.8% |
| $200,000+ | 104 | 6.1% |
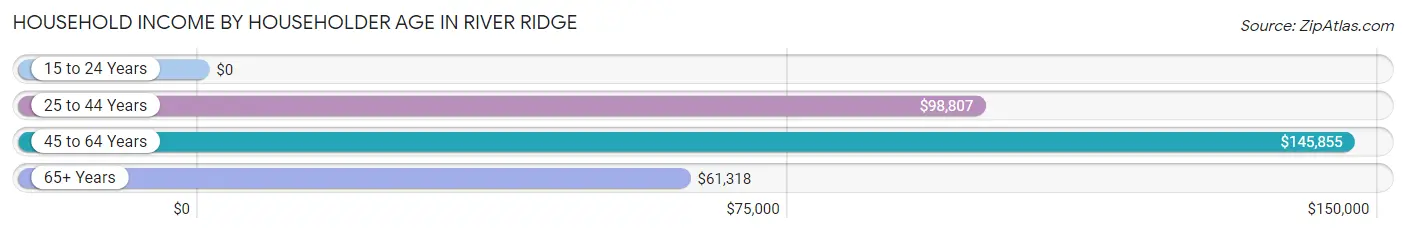
Household Income by Householder Age in River Ridge
The median household income in River Ridge is $97,039, with the highest median household income of $145,855 found in the 45 to 64 years age bracket for the primary householder. A total of 802 households (46.9%) fall into this category.
| Income Bracket | # Households | Median Income |
| 15 to 24 Years | 0 (0.0%) | $0 |
| 25 to 44 Years | 315 (18.4%) | $98,807 |
| 45 to 64 Years | 802 (46.9%) | $145,855 |
| 65+ Years | 593 (34.7%) | $61,318 |
| Total | 1,710 (100.0%) | $97,039 |
Poverty in River Ridge
Income Below Poverty by Sex and Age in River Ridge
With 0.8% poverty level for males and 2.8% for females among the residents of River Ridge, 65 to 74 year old males and 75 year old and over females are the most vulnerable to poverty, with 18 males (6.4%) and 68 females (26.9%) in their respective age groups living below the poverty level.
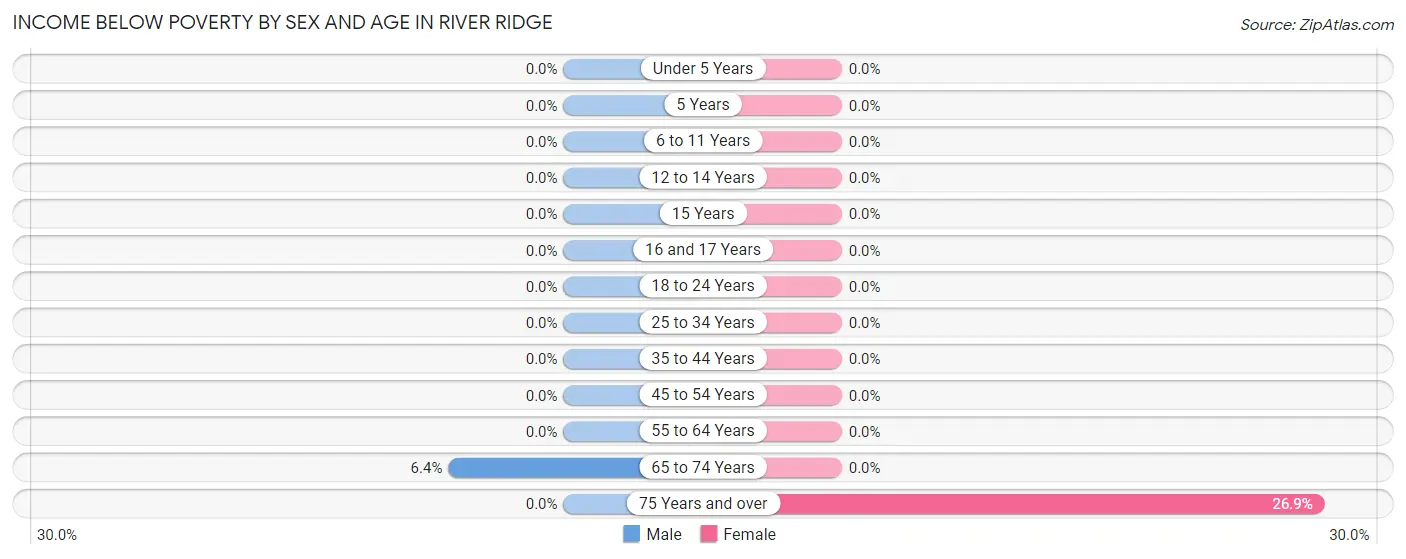
| Age Bracket | Male | Female |
| Under 5 Years | 0 (0.0%) | 0 (0.0%) |
| 5 Years | 0 (0.0%) | 0 (0.0%) |
| 6 to 11 Years | 0 (0.0%) | 0 (0.0%) |
| 12 to 14 Years | 0 (0.0%) | 0 (0.0%) |
| 15 Years | 0 (0.0%) | 0 (0.0%) |
| 16 and 17 Years | 0 (0.0%) | 0 (0.0%) |
| 18 to 24 Years | 0 (0.0%) | 0 (0.0%) |
| 25 to 34 Years | 0 (0.0%) | 0 (0.0%) |
| 35 to 44 Years | 0 (0.0%) | 0 (0.0%) |
| 45 to 54 Years | 0 (0.0%) | 0 (0.0%) |
| 55 to 64 Years | 0 (0.0%) | 0 (0.0%) |
| 65 to 74 Years | 18 (6.4%) | 0 (0.0%) |
| 75 Years and over | 0 (0.0%) | 68 (26.9%) |
| Total | 18 (0.8%) | 68 (2.8%) |
Income Above Poverty by Sex and Age in River Ridge
According to the poverty statistics in River Ridge, males aged under 5 years and females aged under 5 years are the age groups that are most secure financially, with 100.0% of males and 100.0% of females in these age groups living above the poverty line.
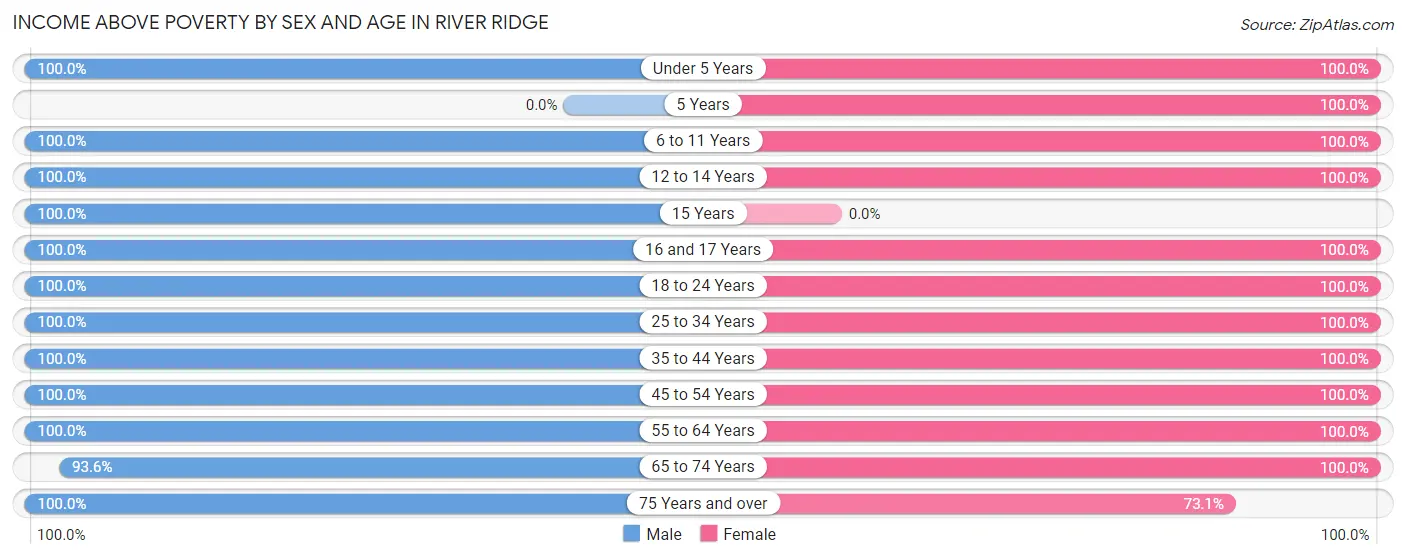
| Age Bracket | Male | Female |
| Under 5 Years | 21 (100.0%) | 31 (100.0%) |
| 5 Years | 0 (0.0%) | 59 (100.0%) |
| 6 to 11 Years | 46 (100.0%) | 12 (100.0%) |
| 12 to 14 Years | 69 (100.0%) | 49 (100.0%) |
| 15 Years | 77 (100.0%) | 0 (0.0%) |
| 16 and 17 Years | 147 (100.0%) | 198 (100.0%) |
| 18 to 24 Years | 98 (100.0%) | 323 (100.0%) |
| 25 to 34 Years | 145 (100.0%) | 151 (100.0%) |
| 35 to 44 Years | 257 (100.0%) | 202 (100.0%) |
| 45 to 54 Years | 484 (100.0%) | 466 (100.0%) |
| 55 to 64 Years | 375 (100.0%) | 349 (100.0%) |
| 65 to 74 Years | 263 (93.6%) | 383 (100.0%) |
| 75 Years and over | 200 (100.0%) | 185 (73.1%) |
| Total | 2,182 (99.2%) | 2,408 (97.3%) |
Income Below Poverty Among Married-Couple Families in River Ridge
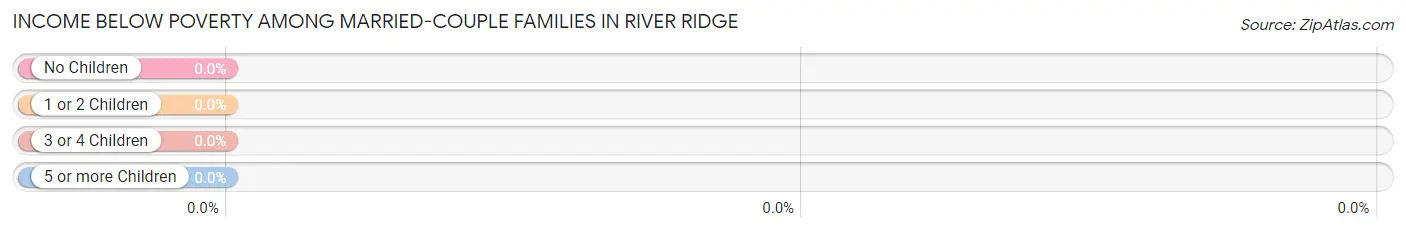
| Children | Above Poverty | Below Poverty |
| No Children | 609 (100.0%) | 0 (0.0%) |
| 1 or 2 Children | 333 (100.0%) | 0 (0.0%) |
| 3 or 4 Children | 0 (0.0%) | 0 (0.0%) |
| 5 or more Children | 0 (0.0%) | 0 (0.0%) |
| Total | 942 (100.0%) | 0 (0.0%) |
Income Below Poverty Among Single-Parent Households in River Ridge
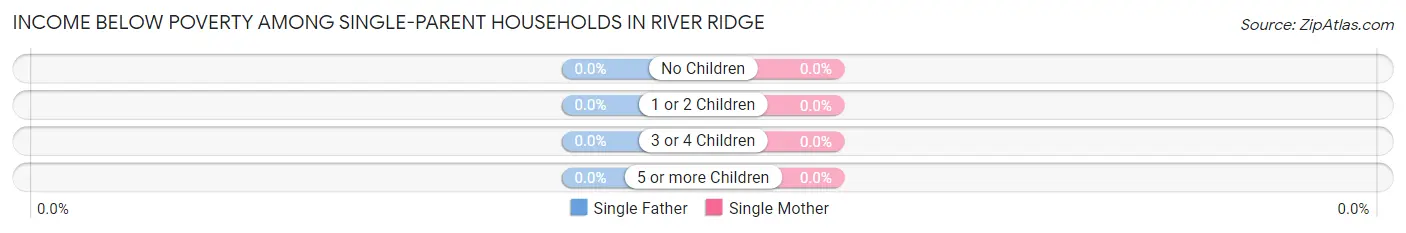
| Children | Single Father | Single Mother |
| No Children | 0 (0.0%) | 0 (0.0%) |
| 1 or 2 Children | 0 (0.0%) | 0 (0.0%) |
| 3 or 4 Children | 0 (0.0%) | 0 (0.0%) |
| 5 or more Children | 0 (0.0%) | 0 (0.0%) |
| Total | 0 (0.0%) | 0 (0.0%) |
Income Below Poverty Among Married-Couple vs Single-Parent Households in River Ridge
| Children | Married-Couple Families | Single-Parent Households |
| No Children | 0 (0.0%) | 0 (0.0%) |
| 1 or 2 Children | 0 (0.0%) | 0 (0.0%) |
| 3 or 4 Children | 0 (0.0%) | 0 (0.0%) |
| 5 or more Children | 0 (0.0%) | 0 (0.0%) |
| Total | 0 (0.0%) | 0 (0.0%) |
Employment Characteristics in River Ridge
Employment by Class of Employer in River Ridge
Among the 2,341 employed individuals in River Ridge, private company employees (1,582 | 67.6%), local government employees (295 | 12.6%), and self-employed (not incorporated) (240 | 10.2%) make up the most common classes of employment.
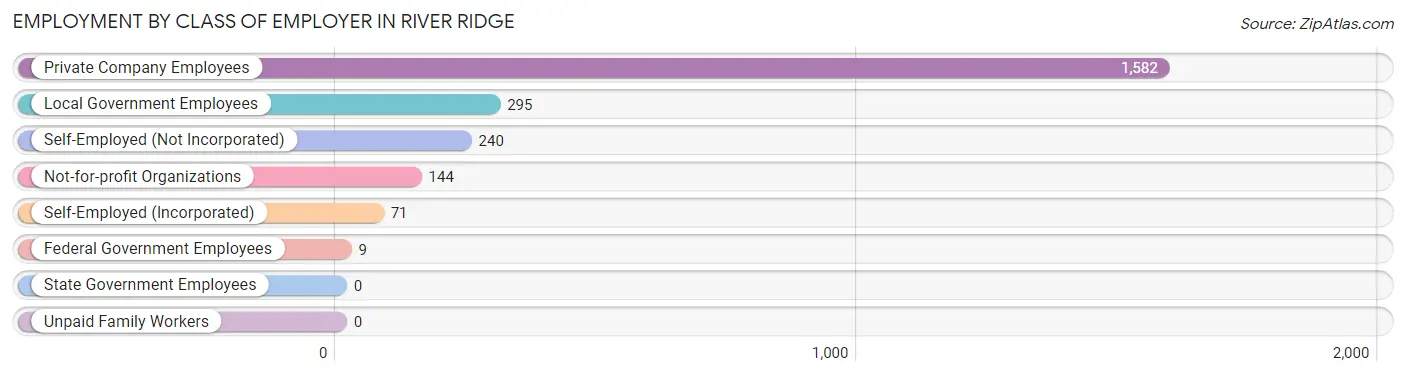
| Employer Class | # Employees | % Employees |
| Private Company Employees | 1,582 | 67.6% |
| Self-Employed (Incorporated) | 71 | 3.0% |
| Self-Employed (Not Incorporated) | 240 | 10.2% |
| Not-for-profit Organizations | 144 | 6.1% |
| Local Government Employees | 295 | 12.6% |
| State Government Employees | 0 | 0.0% |
| Federal Government Employees | 9 | 0.4% |
| Unpaid Family Workers | 0 | 0.0% |
| Total | 2,341 | 100.0% |
Employment Status by Age in River Ridge
According to the labor force statistics for River Ridge, out of the total population over 16 years of age (4,312), 62.5% or 2,695 individuals are in the labor force, with 12.8% or 345 of them unemployed. The age group with the highest labor force participation rate is 30 to 34 years, with 100.0% or 79 individuals in the labor force. Within the labor force, the 60 to 64 years age range has the highest percentage of unemployed individuals, with 37.9% or 33 of them being unemployed.
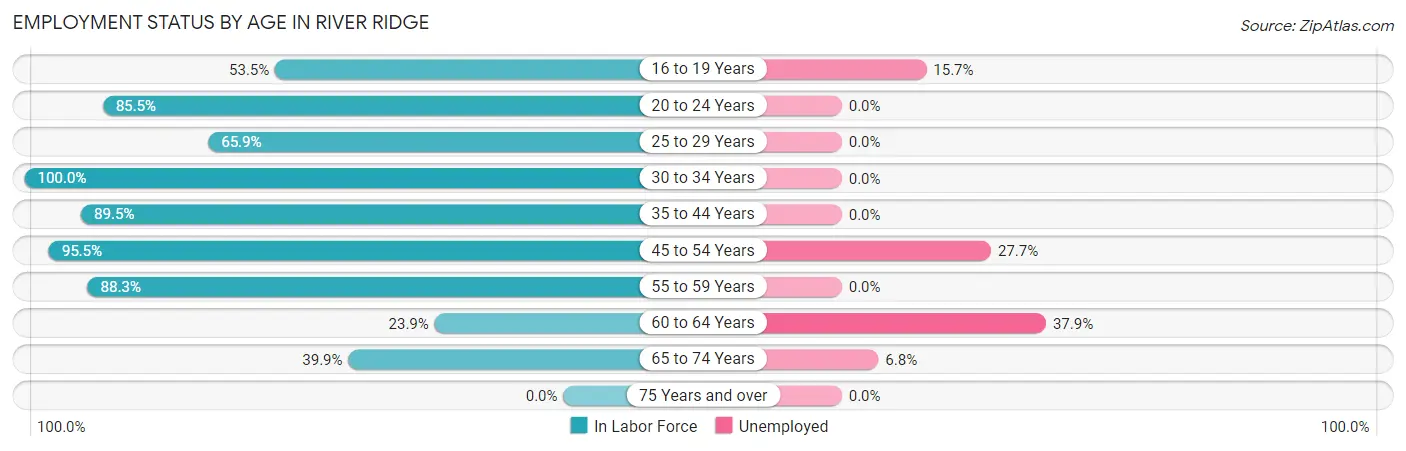
| Age Bracket | In Labor Force | Unemployed |
| 16 to 19 Years | 281 (53.5%) | 44 (15.7%) |
| 20 to 24 Years | 206 (85.5%) | 0 (0.0%) |
| 25 to 29 Years | 143 (65.9%) | 0 (0.0%) |
| 30 to 34 Years | 79 (100.0%) | 0 (0.0%) |
| 35 to 44 Years | 411 (89.5%) | 0 (0.0%) |
| 45 to 54 Years | 907 (95.5%) | 251 (27.7%) |
| 55 to 59 Years | 318 (88.3%) | 0 (0.0%) |
| 60 to 64 Years | 87 (23.9%) | 33 (37.9%) |
| 65 to 74 Years | 265 (39.9%) | 18 (6.8%) |
| 75 Years and over | 0 (0.0%) | 0 (0.0%) |
| Total | 2,695 (62.5%) | 345 (12.8%) |
Employment Status by Educational Attainment in River Ridge
According to labor force statistics for River Ridge, 80.1% of individuals (1,946) out of the total population between 25 and 64 years of age (2,429) are in the labor force, with 14.6% or 284 of them being unemployed. The group with the highest labor force participation rate are those with the educational attainment of college / associate degree, with 87.3% or 830 individuals in the labor force. Within the labor force, individuals with high school diploma education have the highest percentage of unemployment, with 23.0% or 135 of them being unemployed.
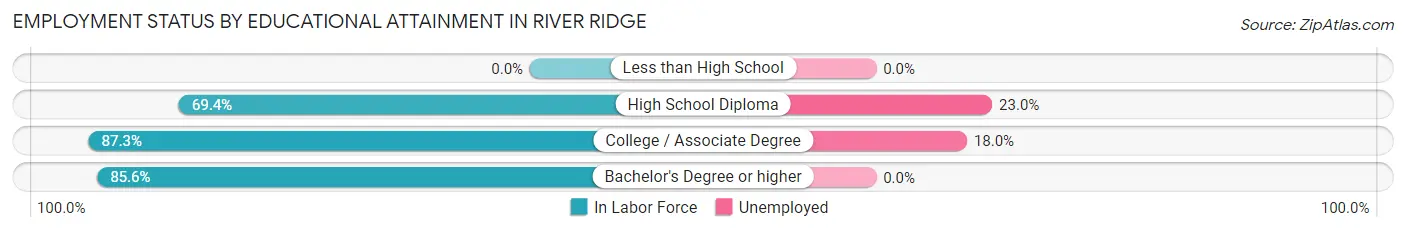
| Educational Attainment | In Labor Force | Unemployed |
| Less than High School | 0 (0.0%) | 0 (0.0%) |
| High School Diploma | 587 (69.4%) | 195 (23.0%) |
| College / Associate Degree | 830 (87.3%) | 171 (18.0%) |
| Bachelor's Degree or higher | 528 (85.6%) | 0 (0.0%) |
| Total | 1,946 (80.1%) | 355 (14.6%) |
Employment Occupations by Sex in River Ridge
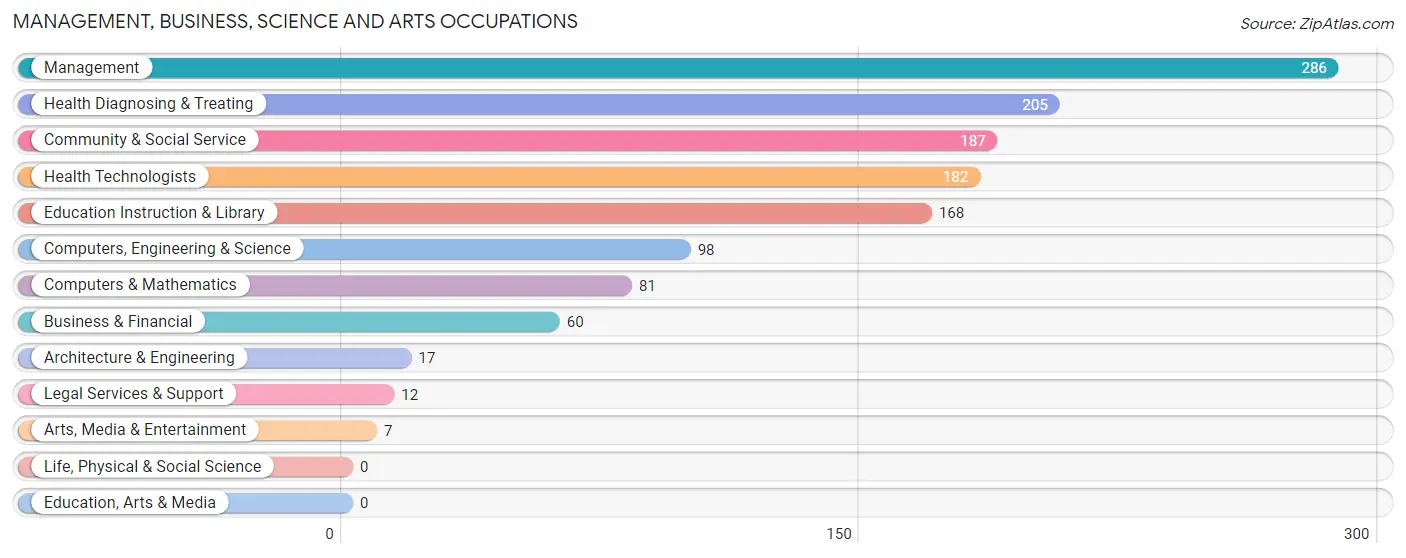
Management, Business, Science and Arts Occupations
The most common Management, Business, Science and Arts occupations in River Ridge are Management (286 | 12.2%), Health Diagnosing & Treating (205 | 8.7%), Community & Social Service (187 | 8.0%), Health Technologists (182 | 7.7%), and Education Instruction & Library (168 | 7.1%).
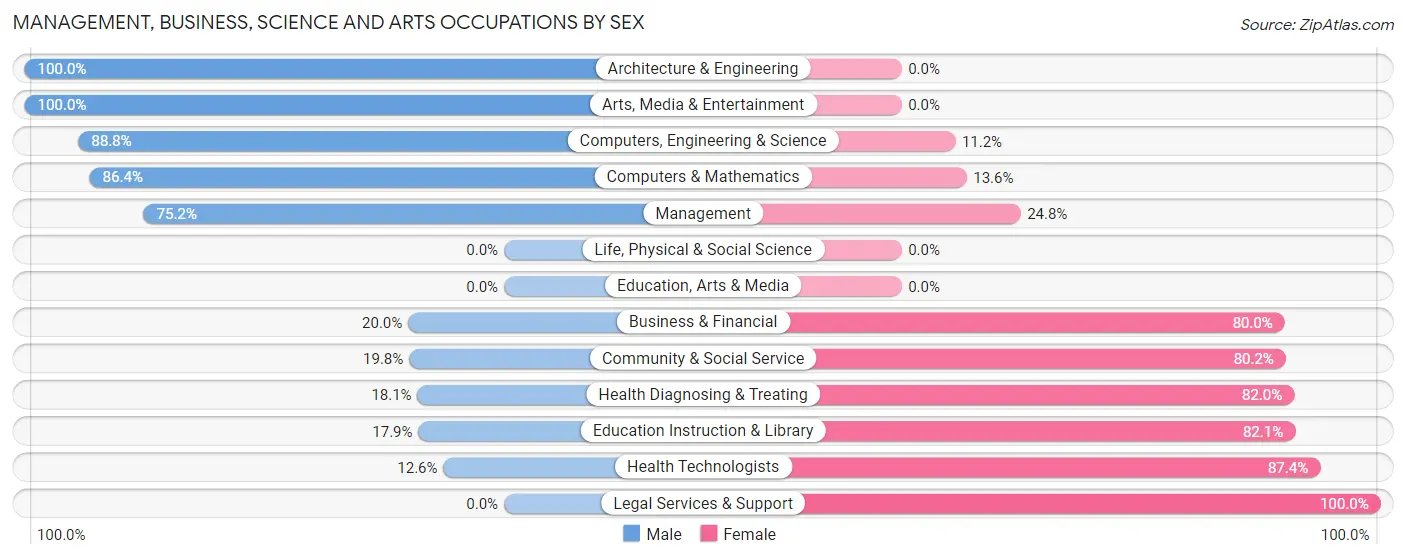
Management, Business, Science and Arts Occupations by Sex
Within the Management, Business, Science and Arts occupations in River Ridge, the most male-oriented occupations are Architecture & Engineering (100.0%), Arts, Media & Entertainment (100.0%), and Computers, Engineering & Science (88.8%), while the most female-oriented occupations are Legal Services & Support (100.0%), Health Technologists (87.4%), and Education Instruction & Library (82.1%).
| Occupation | Male | Female |
| Management | 215 (75.2%) | 71 (24.8%) |
| Business & Financial | 12 (20.0%) | 48 (80.0%) |
| Computers, Engineering & Science | 87 (88.8%) | 11 (11.2%) |
| Computers & Mathematics | 70 (86.4%) | 11 (13.6%) |
| Architecture & Engineering | 17 (100.0%) | 0 (0.0%) |
| Life, Physical & Social Science | 0 (0.0%) | 0 (0.0%) |
| Community & Social Service | 37 (19.8%) | 150 (80.2%) |
| Education, Arts & Media | 0 (0.0%) | 0 (0.0%) |
| Legal Services & Support | 0 (0.0%) | 12 (100.0%) |
| Education Instruction & Library | 30 (17.9%) | 138 (82.1%) |
| Arts, Media & Entertainment | 7 (100.0%) | 0 (0.0%) |
| Health Diagnosing & Treating | 37 (18.0%) | 168 (82.0%) |
| Health Technologists | 23 (12.6%) | 159 (87.4%) |
| Total (Category) | 388 (46.4%) | 448 (53.6%) |
| Total (Overall) | 1,043 (44.4%) | 1,308 (55.6%) |
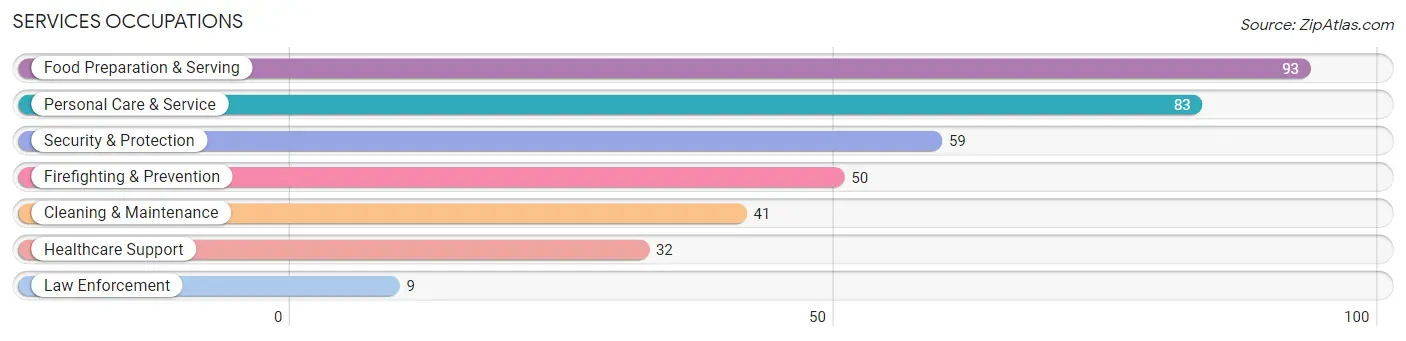
Services Occupations
The most common Services occupations in River Ridge are Food Preparation & Serving (93 | 4.0%), Personal Care & Service (83 | 3.5%), Security & Protection (59 | 2.5%), Firefighting & Prevention (50 | 2.1%), and Cleaning & Maintenance (41 | 1.7%).
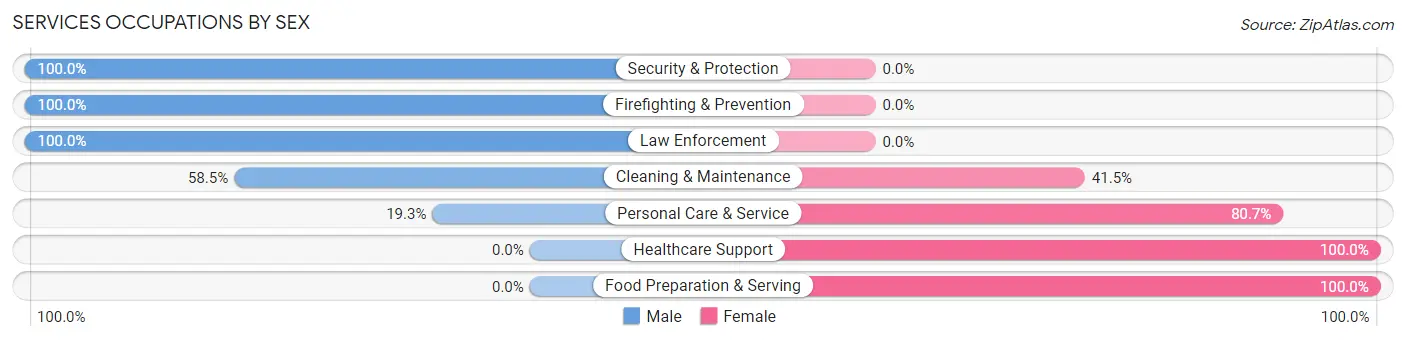
Services Occupations by Sex
Within the Services occupations in River Ridge, the most male-oriented occupations are Security & Protection (100.0%), Firefighting & Prevention (100.0%), and Law Enforcement (100.0%), while the most female-oriented occupations are Healthcare Support (100.0%), Food Preparation & Serving (100.0%), and Personal Care & Service (80.7%).
| Occupation | Male | Female |
| Healthcare Support | 0 (0.0%) | 32 (100.0%) |
| Security & Protection | 59 (100.0%) | 0 (0.0%) |
| Firefighting & Prevention | 50 (100.0%) | 0 (0.0%) |
| Law Enforcement | 9 (100.0%) | 0 (0.0%) |
| Food Preparation & Serving | 0 (0.0%) | 93 (100.0%) |
| Cleaning & Maintenance | 24 (58.5%) | 17 (41.5%) |
| Personal Care & Service | 16 (19.3%) | 67 (80.7%) |
| Total (Category) | 99 (32.1%) | 209 (67.9%) |
| Total (Overall) | 1,043 (44.4%) | 1,308 (55.6%) |
Sales and Office Occupations
The most common Sales and Office occupations in River Ridge are Sales & Related (565 | 24.0%), and Office & Administration (329 | 14.0%).

Sales and Office Occupations by Sex

| Occupation | Male | Female |
| Sales & Related | 219 (38.8%) | 346 (61.2%) |
| Office & Administration | 24 (7.3%) | 305 (92.7%) |
| Total (Category) | 243 (27.2%) | 651 (72.8%) |
| Total (Overall) | 1,043 (44.4%) | 1,308 (55.6%) |
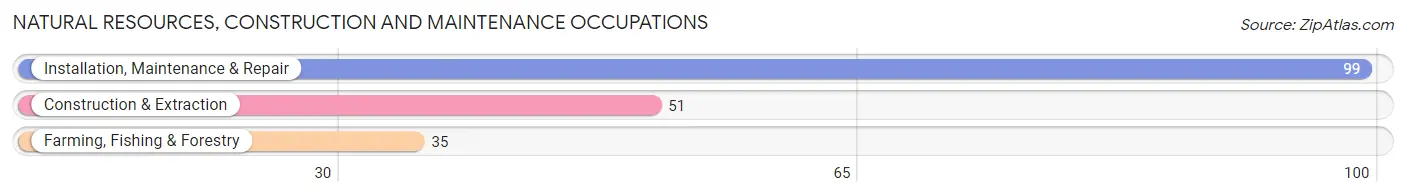
Natural Resources, Construction and Maintenance Occupations
The most common Natural Resources, Construction and Maintenance occupations in River Ridge are Installation, Maintenance & Repair (99 | 4.2%), Construction & Extraction (51 | 2.2%), and Farming, Fishing & Forestry (35 | 1.5%).
Natural Resources, Construction and Maintenance Occupations by Sex
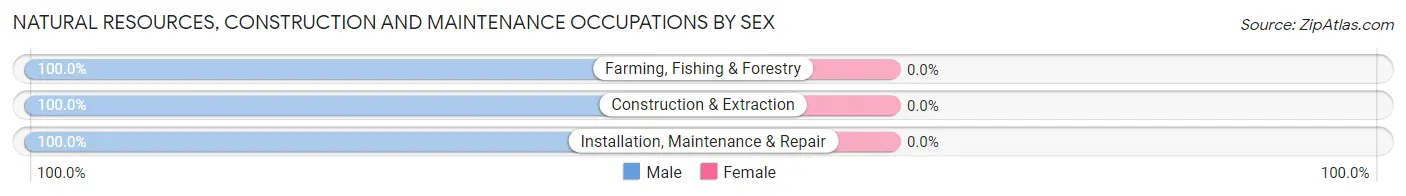
| Occupation | Male | Female |
| Farming, Fishing & Forestry | 35 (100.0%) | 0 (0.0%) |
| Construction & Extraction | 51 (100.0%) | 0 (0.0%) |
| Installation, Maintenance & Repair | 99 (100.0%) | 0 (0.0%) |
| Total (Category) | 185 (100.0%) | 0 (0.0%) |
| Total (Overall) | 1,043 (44.4%) | 1,308 (55.6%) |
Production, Transportation and Moving Occupations
The most common Production, Transportation and Moving occupations in River Ridge are Material Moving (61 | 2.6%), Transportation (51 | 2.2%), and Production (16 | 0.7%).

Production, Transportation and Moving Occupations by Sex
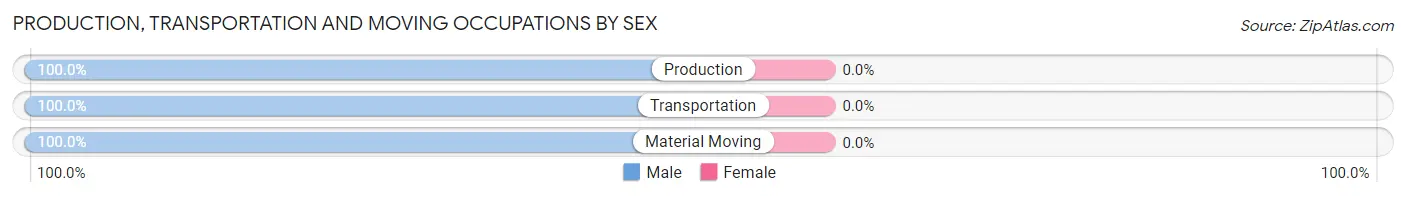
| Occupation | Male | Female |
| Production | 16 (100.0%) | 0 (0.0%) |
| Transportation | 51 (100.0%) | 0 (0.0%) |
| Material Moving | 61 (100.0%) | 0 (0.0%) |
| Total (Category) | 128 (100.0%) | 0 (0.0%) |
| Total (Overall) | 1,043 (44.4%) | 1,308 (55.6%) |
Employment Industries by Sex in River Ridge
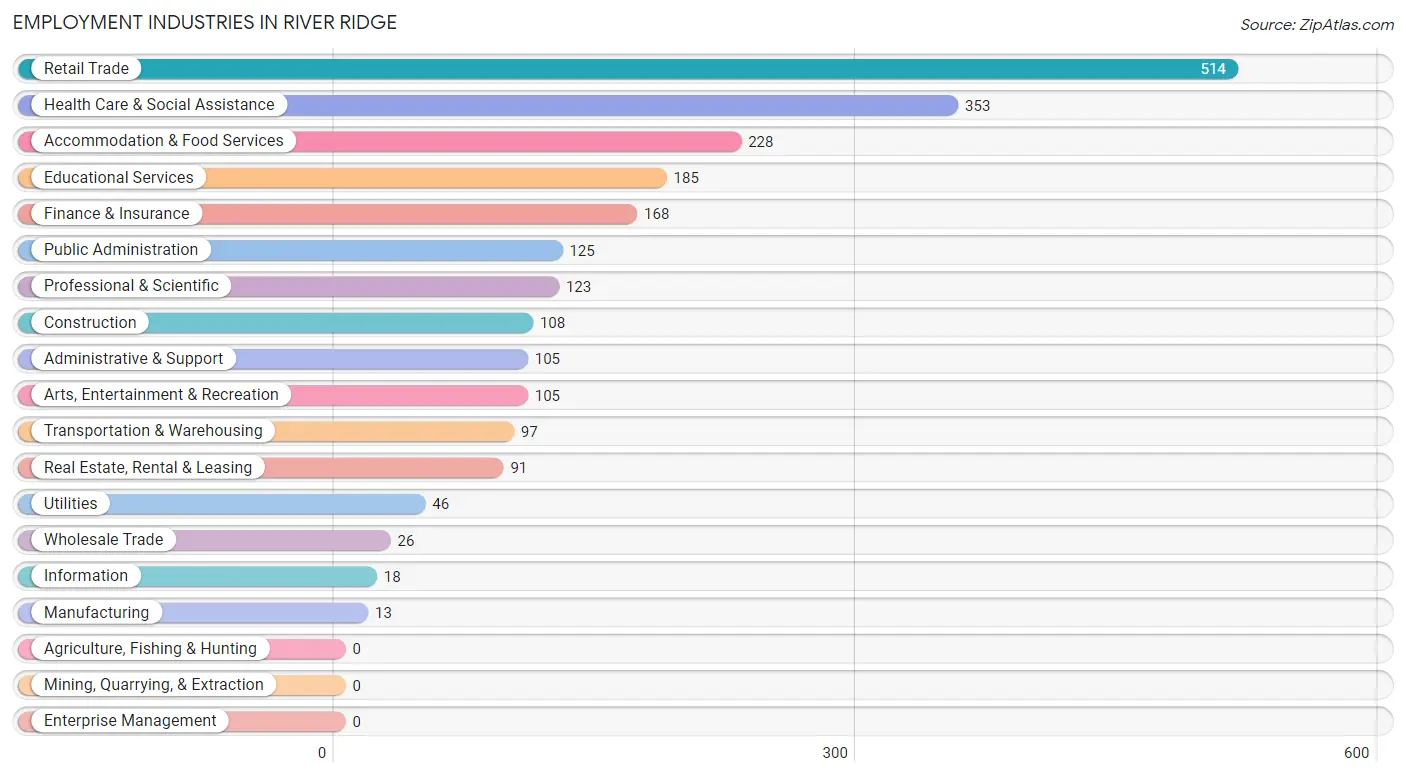
Employment Industries in River Ridge
The major employment industries in River Ridge include Retail Trade (514 | 21.9%), Health Care & Social Assistance (353 | 15.0%), Accommodation & Food Services (228 | 9.7%), Educational Services (185 | 7.9%), and Finance & Insurance (168 | 7.1%).
Employment Industries by Sex in River Ridge
The River Ridge industries that see more men than women are Wholesale Trade (100.0%), Utilities (100.0%), and Information (100.0%), whereas the industries that tend to have a higher number of women are Manufacturing (100.0%), Health Care & Social Assistance (89.5%), and Educational Services (83.8%).
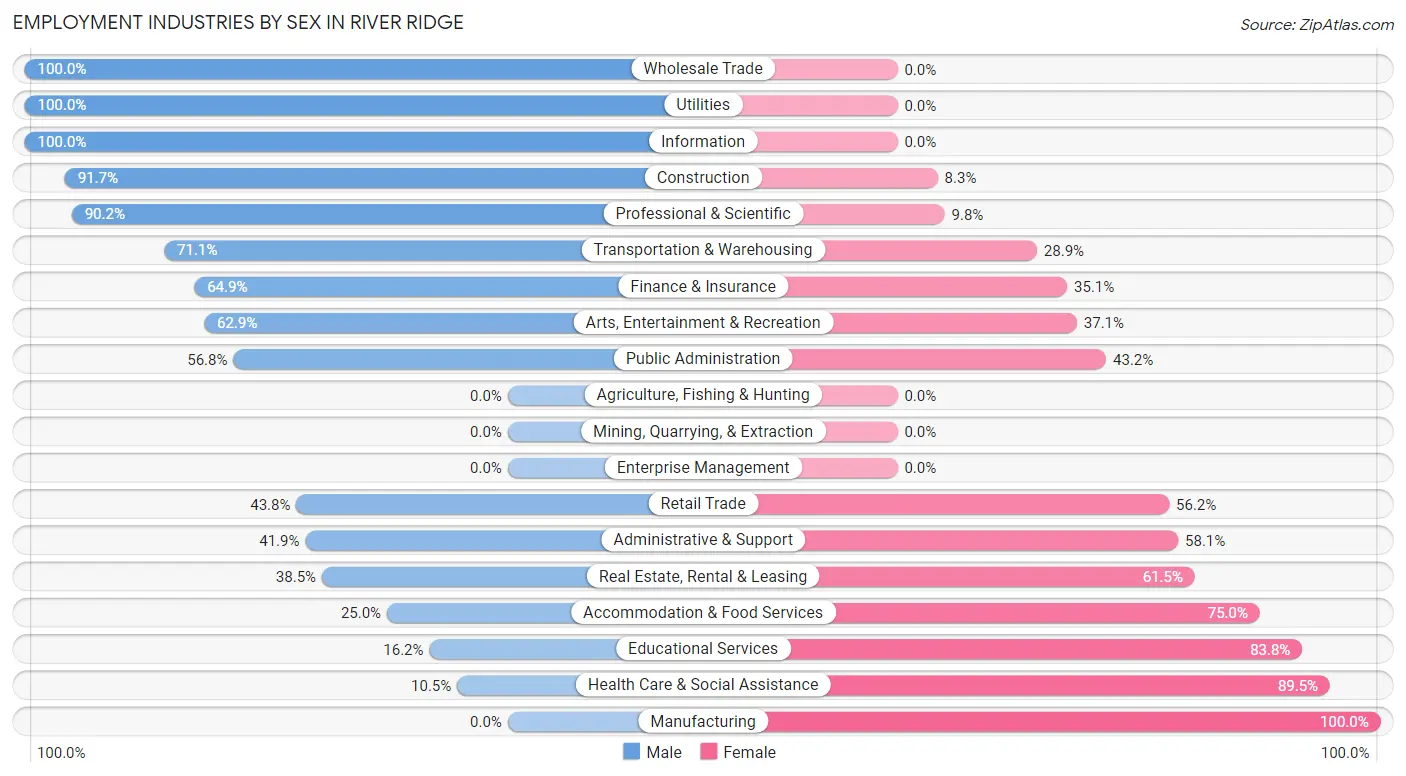
| Industry | Male | Female |
| Agriculture, Fishing & Hunting | 0 (0.0%) | 0 (0.0%) |
| Mining, Quarrying, & Extraction | 0 (0.0%) | 0 (0.0%) |
| Construction | 99 (91.7%) | 9 (8.3%) |
| Manufacturing | 0 (0.0%) | 13 (100.0%) |
| Wholesale Trade | 26 (100.0%) | 0 (0.0%) |
| Retail Trade | 225 (43.8%) | 289 (56.2%) |
| Transportation & Warehousing | 69 (71.1%) | 28 (28.9%) |
| Utilities | 46 (100.0%) | 0 (0.0%) |
| Information | 18 (100.0%) | 0 (0.0%) |
| Finance & Insurance | 109 (64.9%) | 59 (35.1%) |
| Real Estate, Rental & Leasing | 35 (38.5%) | 56 (61.5%) |
| Professional & Scientific | 111 (90.2%) | 12 (9.8%) |
| Enterprise Management | 0 (0.0%) | 0 (0.0%) |
| Administrative & Support | 44 (41.9%) | 61 (58.1%) |
| Educational Services | 30 (16.2%) | 155 (83.8%) |
| Health Care & Social Assistance | 37 (10.5%) | 316 (89.5%) |
| Arts, Entertainment & Recreation | 66 (62.9%) | 39 (37.1%) |
| Accommodation & Food Services | 57 (25.0%) | 171 (75.0%) |
| Public Administration | 71 (56.8%) | 54 (43.2%) |
| Total | 1,043 (44.4%) | 1,308 (55.6%) |
Education in River Ridge
School Enrollment in River Ridge
The most common levels of schooling among the 1,038 students in River Ridge are high school (533 | 51.3%), college / undergraduate (322 | 31.0%), and middle school (128 | 12.3%).
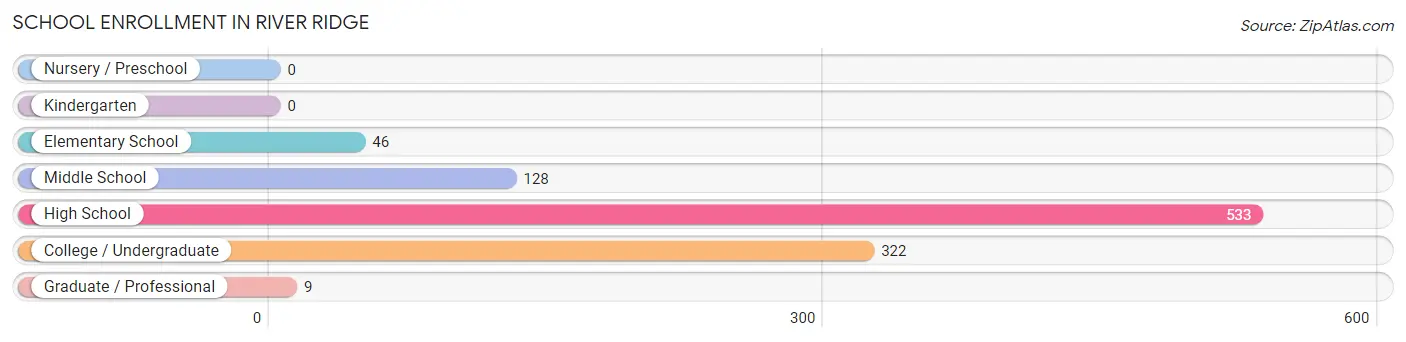
| School Level | # Students | % Students |
| Nursery / Preschool | 0 | 0.0% |
| Kindergarten | 0 | 0.0% |
| Elementary School | 46 | 4.4% |
| Middle School | 128 | 12.3% |
| High School | 533 | 51.3% |
| College / Undergraduate | 322 | 31.0% |
| Graduate / Professional | 9 | 0.9% |
| Total | 1,038 | 100.0% |
School Enrollment by Age by Funding Source in River Ridge
Out of a total of 1,038 students who are enrolled in schools in River Ridge, 54 (5.2%) attend a private institution, while the remaining 984 (94.8%) are enrolled in public schools. The age group of 25 to 34 year olds has the highest likelihood of being enrolled in private schools, with 12 (100.0% in the age bracket) enrolled. Conversely, the age group of 18 to 19 year olds has the lowest likelihood of being enrolled in a private school, with 145 (100.0% in the age bracket) attending a public institution.
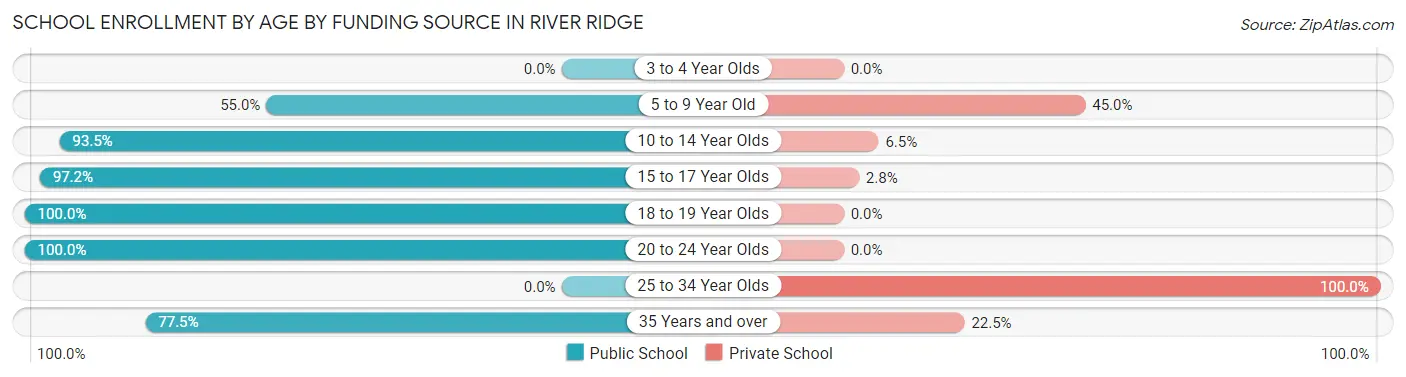
| Age Bracket | Public School | Private School |
| 3 to 4 Year Olds | 0 (0.0%) | 0 (0.0%) |
| 5 to 9 Year Old | 11 (55.0%) | 9 (45.0%) |
| 10 to 14 Year Olds | 173 (93.5%) | 12 (6.5%) |
| 15 to 17 Year Olds | 410 (97.2%) | 12 (2.8%) |
| 18 to 19 Year Olds | 145 (100.0%) | 0 (0.0%) |
| 20 to 24 Year Olds | 214 (100.0%) | 0 (0.0%) |
| 25 to 34 Year Olds | 0 (0.0%) | 12 (100.0%) |
| 35 Years and over | 31 (77.5%) | 9 (22.5%) |
| Total | 984 (94.8%) | 54 (5.2%) |
Educational Attainment by Field of Study in River Ridge
Education (190 | 20.6%), business (171 | 18.5%), science & technology (161 | 17.4%), arts & humanities (114 | 12.3%), and engineering (81 | 8.8%) are the most common fields of study among 923 individuals in River Ridge who have obtained a bachelor's degree or higher.
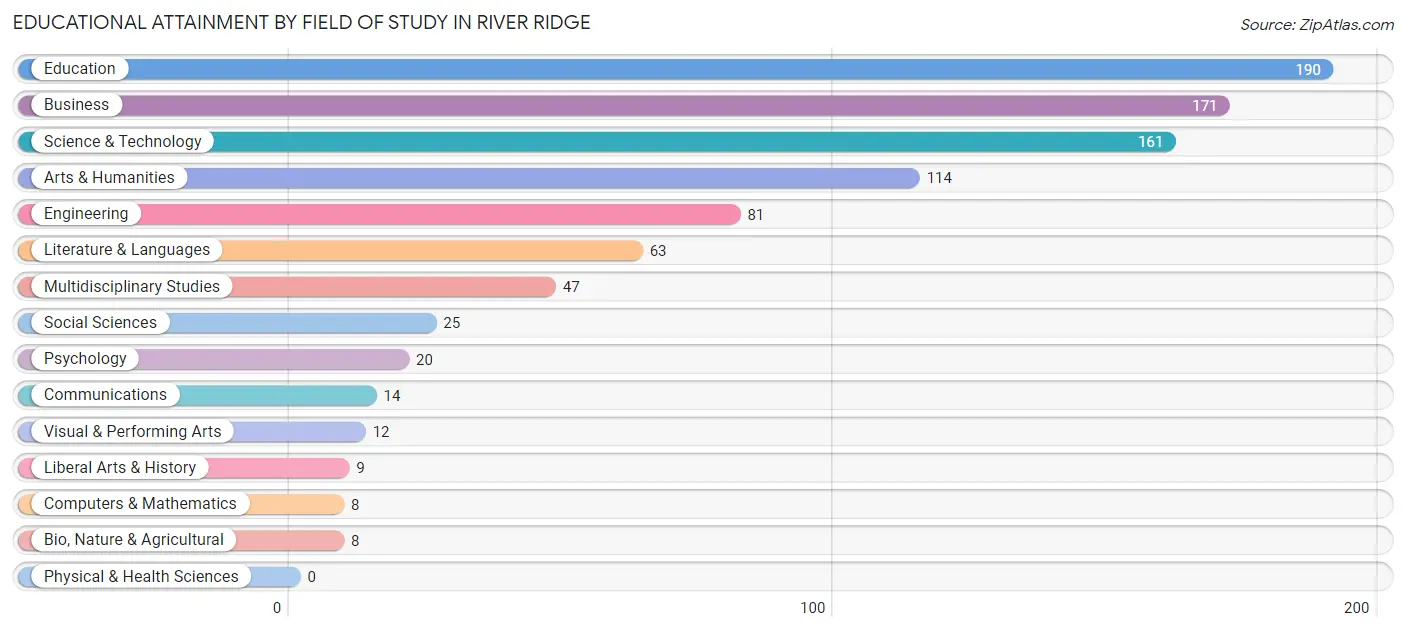
| Field of Study | # Graduates | % Graduates |
| Computers & Mathematics | 8 | 0.9% |
| Bio, Nature & Agricultural | 8 | 0.9% |
| Physical & Health Sciences | 0 | 0.0% |
| Psychology | 20 | 2.2% |
| Social Sciences | 25 | 2.7% |
| Engineering | 81 | 8.8% |
| Multidisciplinary Studies | 47 | 5.1% |
| Science & Technology | 161 | 17.4% |
| Business | 171 | 18.5% |
| Education | 190 | 20.6% |
| Literature & Languages | 63 | 6.8% |
| Liberal Arts & History | 9 | 1.0% |
| Visual & Performing Arts | 12 | 1.3% |
| Communications | 14 | 1.5% |
| Arts & Humanities | 114 | 12.3% |
| Total | 923 | 100.0% |
Transportation & Commute in River Ridge
Vehicle Availability by Sex in River Ridge
The most prevalent vehicle ownership categories in River Ridge are males with 2 vehicles (509, accounting for 48.8%) and females with 2 vehicles (596, making up 39.2%).
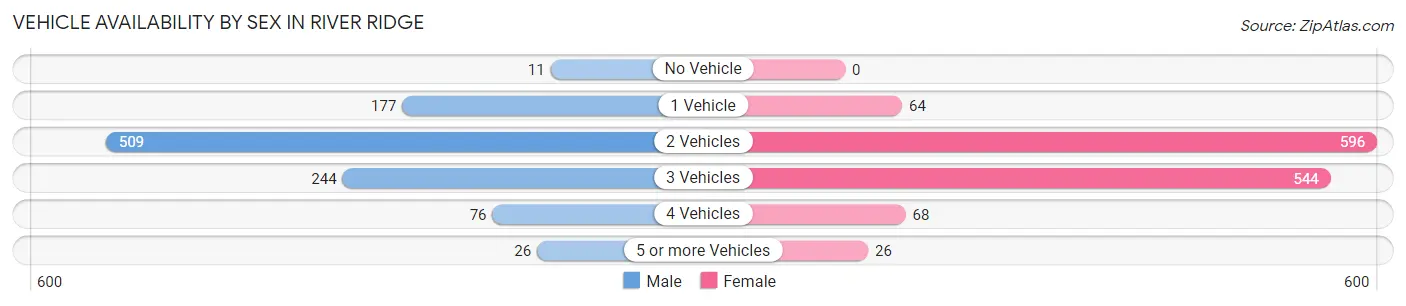
| Vehicles Available | Male | Female |
| No Vehicle | 11 (1.1%) | 0 (0.0%) |
| 1 Vehicle | 177 (17.0%) | 64 (4.9%) |
| 2 Vehicles | 509 (48.8%) | 596 (45.9%) |
| 3 Vehicles | 244 (23.4%) | 544 (41.9%) |
| 4 Vehicles | 76 (7.3%) | 68 (5.2%) |
| 5 or more Vehicles | 26 (2.5%) | 26 (2.0%) |
| Total | 1,043 (100.0%) | 1,298 (100.0%) |
Commute Time in River Ridge
The most frequently occuring commute durations in River Ridge are 20 to 24 minutes (548 commuters, 26.1%), 60 to 89 minutes (353 commuters, 16.8%), and 15 to 19 minutes (262 commuters, 12.5%).
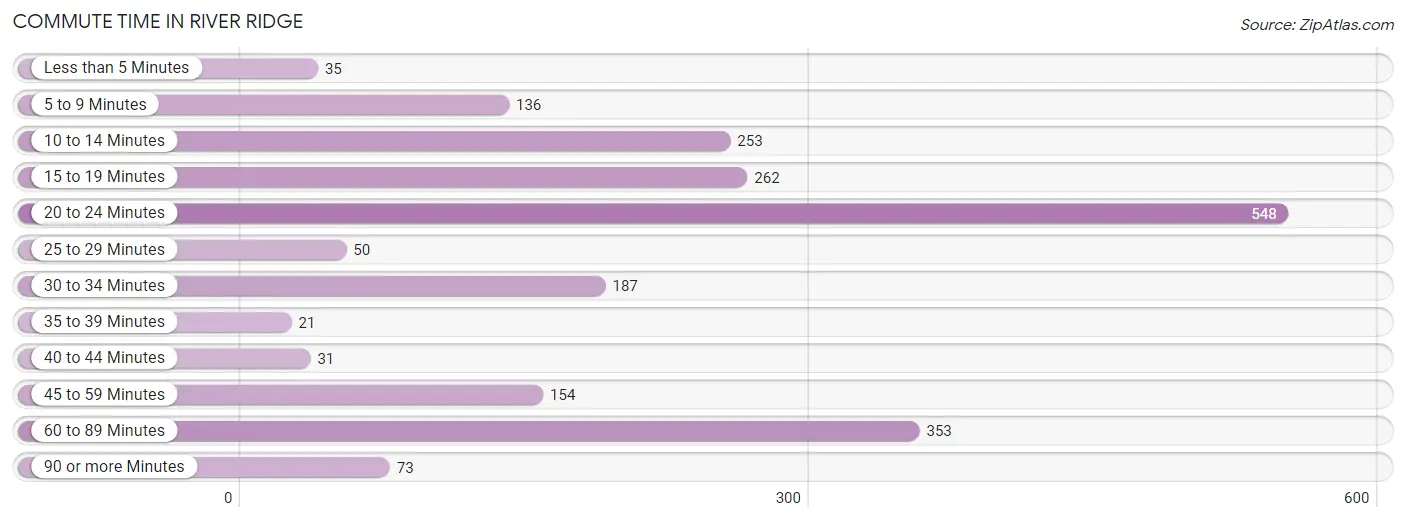
| Commute Time | # Commuters | % Commuters |
| Less than 5 Minutes | 35 | 1.7% |
| 5 to 9 Minutes | 136 | 6.5% |
| 10 to 14 Minutes | 253 | 12.0% |
| 15 to 19 Minutes | 262 | 12.5% |
| 20 to 24 Minutes | 548 | 26.1% |
| 25 to 29 Minutes | 50 | 2.4% |
| 30 to 34 Minutes | 187 | 8.9% |
| 35 to 39 Minutes | 21 | 1.0% |
| 40 to 44 Minutes | 31 | 1.5% |
| 45 to 59 Minutes | 154 | 7.3% |
| 60 to 89 Minutes | 353 | 16.8% |
| 90 or more Minutes | 73 | 3.5% |
Commute Time by Sex in River Ridge
The most common commute times in River Ridge are 60 to 89 minutes (178 commuters, 19.8%) for males and 20 to 24 minutes (456 commuters, 37.8%) for females.
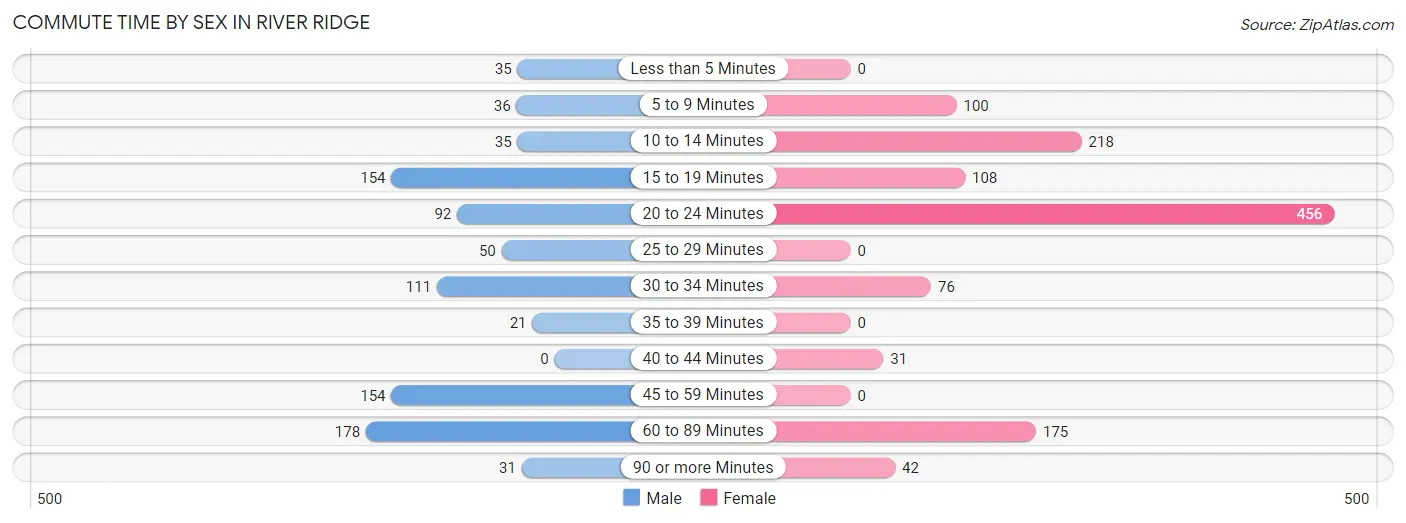
| Commute Time | Male | Female |
| Less than 5 Minutes | 35 (3.9%) | 0 (0.0%) |
| 5 to 9 Minutes | 36 (4.0%) | 100 (8.3%) |
| 10 to 14 Minutes | 35 (3.9%) | 218 (18.1%) |
| 15 to 19 Minutes | 154 (17.2%) | 108 (9.0%) |
| 20 to 24 Minutes | 92 (10.3%) | 456 (37.8%) |
| 25 to 29 Minutes | 50 (5.6%) | 0 (0.0%) |
| 30 to 34 Minutes | 111 (12.4%) | 76 (6.3%) |
| 35 to 39 Minutes | 21 (2.3%) | 0 (0.0%) |
| 40 to 44 Minutes | 0 (0.0%) | 31 (2.6%) |
| 45 to 59 Minutes | 154 (17.2%) | 0 (0.0%) |
| 60 to 89 Minutes | 178 (19.8%) | 175 (14.5%) |
| 90 or more Minutes | 31 (3.5%) | 42 (3.5%) |
Time of Departure to Work by Sex in River Ridge
The most frequent times of departure to work in River Ridge are 6:30 AM to 6:59 AM (196, 21.8%) for males and 7:30 AM to 7:59 AM (273, 22.6%) for females.
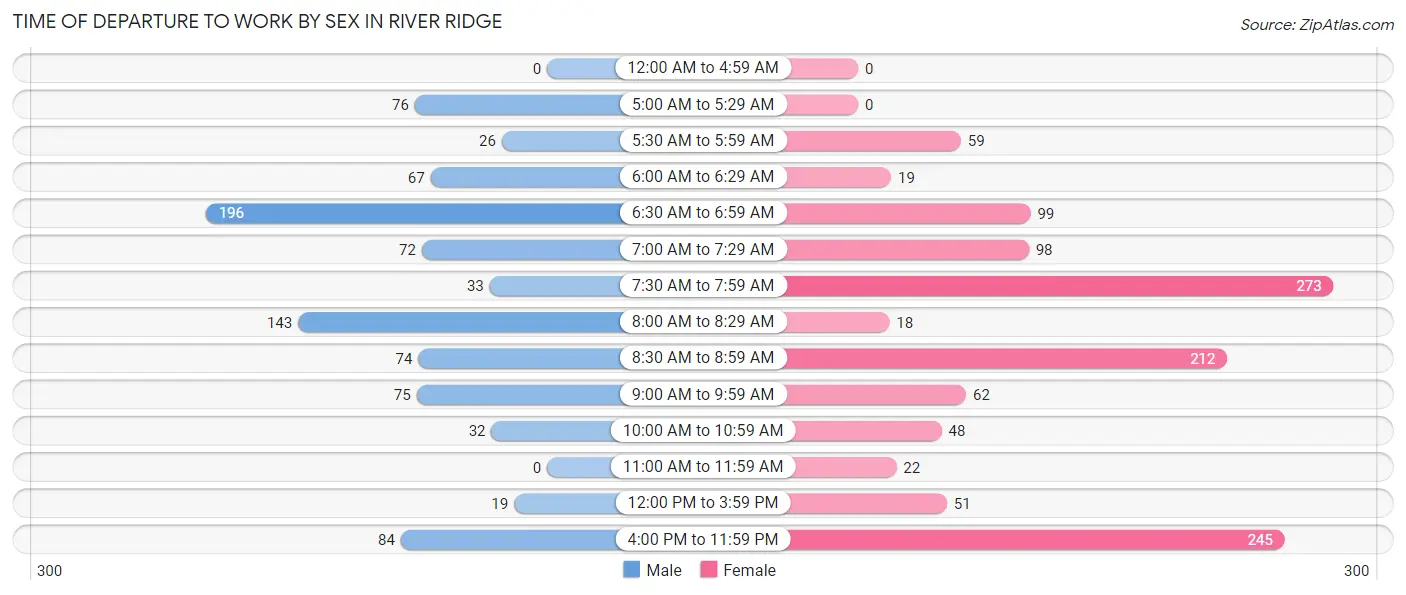
| Time of Departure | Male | Female |
| 12:00 AM to 4:59 AM | 0 (0.0%) | 0 (0.0%) |
| 5:00 AM to 5:29 AM | 76 (8.5%) | 0 (0.0%) |
| 5:30 AM to 5:59 AM | 26 (2.9%) | 59 (4.9%) |
| 6:00 AM to 6:29 AM | 67 (7.5%) | 19 (1.6%) |
| 6:30 AM to 6:59 AM | 196 (21.8%) | 99 (8.2%) |
| 7:00 AM to 7:29 AM | 72 (8.0%) | 98 (8.1%) |
| 7:30 AM to 7:59 AM | 33 (3.7%) | 273 (22.6%) |
| 8:00 AM to 8:29 AM | 143 (15.9%) | 18 (1.5%) |
| 8:30 AM to 8:59 AM | 74 (8.3%) | 212 (17.6%) |
| 9:00 AM to 9:59 AM | 75 (8.4%) | 62 (5.1%) |
| 10:00 AM to 10:59 AM | 32 (3.6%) | 48 (4.0%) |
| 11:00 AM to 11:59 AM | 0 (0.0%) | 22 (1.8%) |
| 12:00 PM to 3:59 PM | 19 (2.1%) | 51 (4.2%) |
| 4:00 PM to 11:59 PM | 84 (9.4%) | 245 (20.3%) |
| Total | 897 (100.0%) | 1,206 (100.0%) |
Housing Occupancy in River Ridge
Occupancy by Ownership in River Ridge
Of the total 1,710 dwellings in River Ridge, owner-occupied units account for 1,223 (71.5%), while renter-occupied units make up 487 (28.5%).
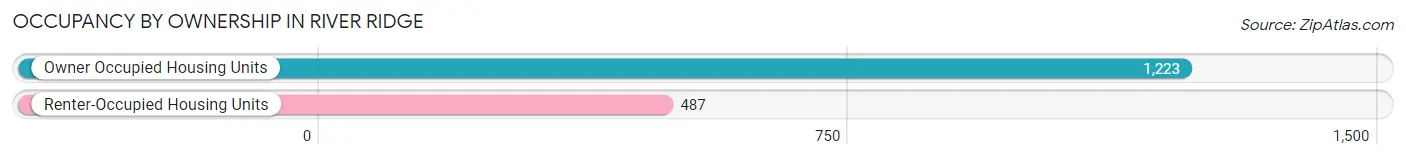
| Occupancy | # Housing Units | % Housing Units |
| Owner Occupied Housing Units | 1,223 | 71.5% |
| Renter-Occupied Housing Units | 487 | 28.5% |
| Total Occupied Housing Units | 1,710 | 100.0% |
Occupancy by Household Size in River Ridge
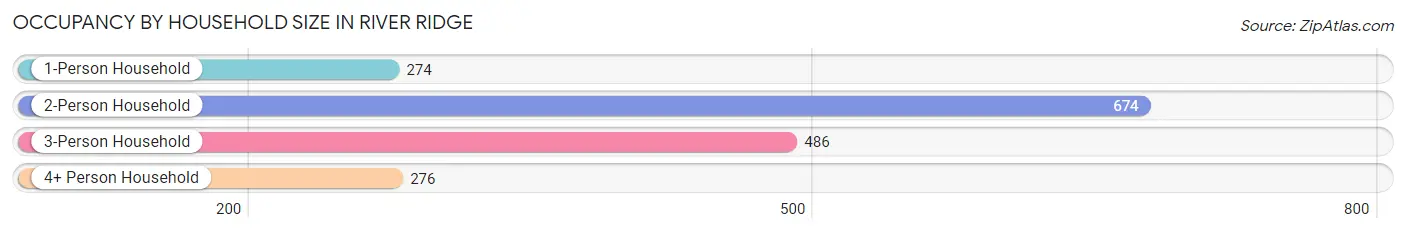
| Household Size | # Housing Units | % Housing Units |
| 1-Person Household | 274 | 16.0% |
| 2-Person Household | 674 | 39.4% |
| 3-Person Household | 486 | 28.4% |
| 4+ Person Household | 276 | 16.1% |
| Total Housing Units | 1,710 | 100.0% |
Occupancy by Ownership by Household Size in River Ridge
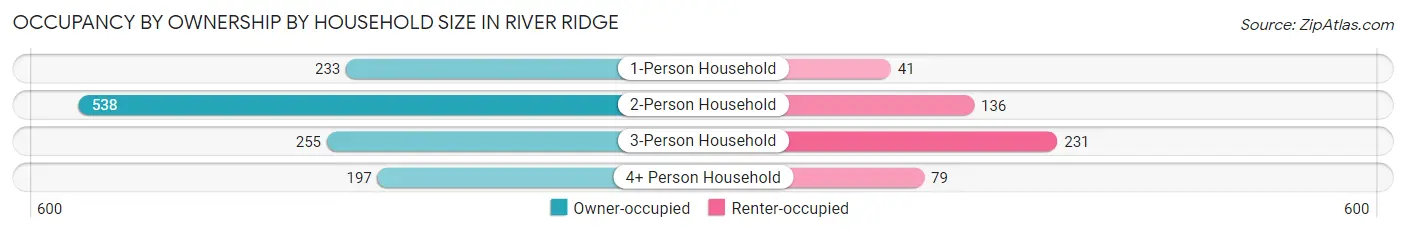
| Household Size | Owner-occupied | Renter-occupied |
| 1-Person Household | 233 (85.0%) | 41 (15.0%) |
| 2-Person Household | 538 (79.8%) | 136 (20.2%) |
| 3-Person Household | 255 (52.5%) | 231 (47.5%) |
| 4+ Person Household | 197 (71.4%) | 79 (28.6%) |
| Total Housing Units | 1,223 (71.5%) | 487 (28.5%) |
Occupancy by Educational Attainment in River Ridge
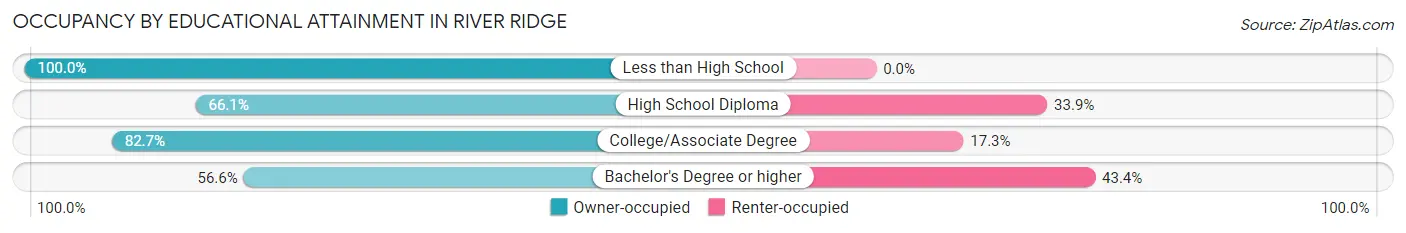
| Household Size | Owner-occupied | Renter-occupied |
| Less than High School | 58 (100.0%) | 0 (0.0%) |
| High School Diploma | 234 (66.1%) | 120 (33.9%) |
| College/Associate Degree | 622 (82.7%) | 130 (17.3%) |
| Bachelor's Degree or higher | 309 (56.6%) | 237 (43.4%) |
Occupancy by Age of Householder in River Ridge
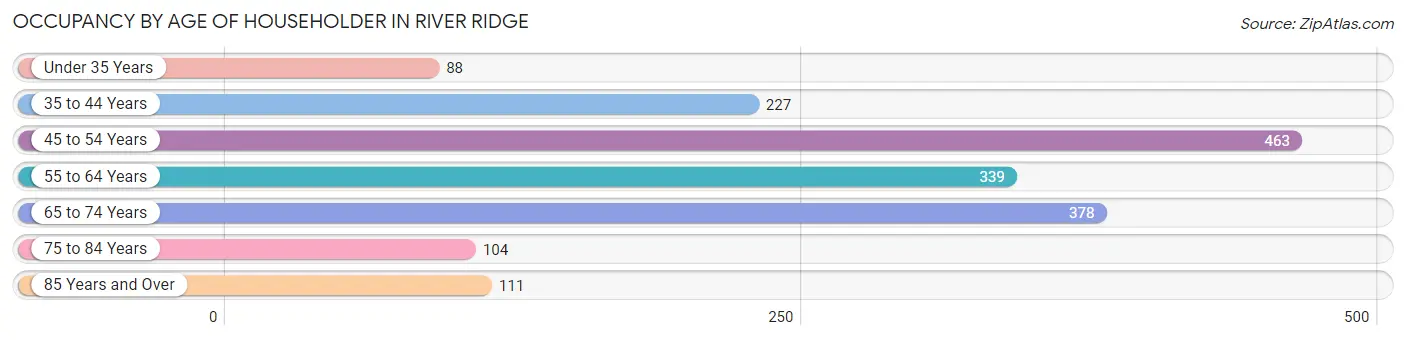
| Age Bracket | # Households | % Households |
| Under 35 Years | 88 | 5.1% |
| 35 to 44 Years | 227 | 13.3% |
| 45 to 54 Years | 463 | 27.1% |
| 55 to 64 Years | 339 | 19.8% |
| 65 to 74 Years | 378 | 22.1% |
| 75 to 84 Years | 104 | 6.1% |
| 85 Years and Over | 111 | 6.5% |
| Total | 1,710 | 100.0% |
Housing Finances in River Ridge
Median Income by Occupancy in River Ridge
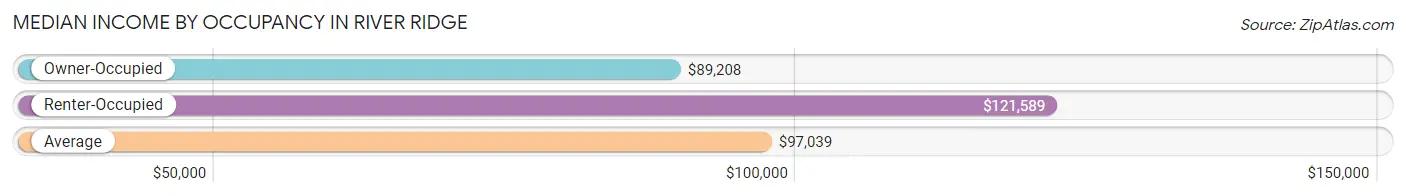
| Occupancy Type | # Households | Median Income |
| Owner-Occupied | 1,223 (71.5%) | $89,208 |
| Renter-Occupied | 487 (28.5%) | $121,589 |
| Average | 1,710 (100.0%) | $97,039 |
Occupancy by Householder Income Bracket in River Ridge
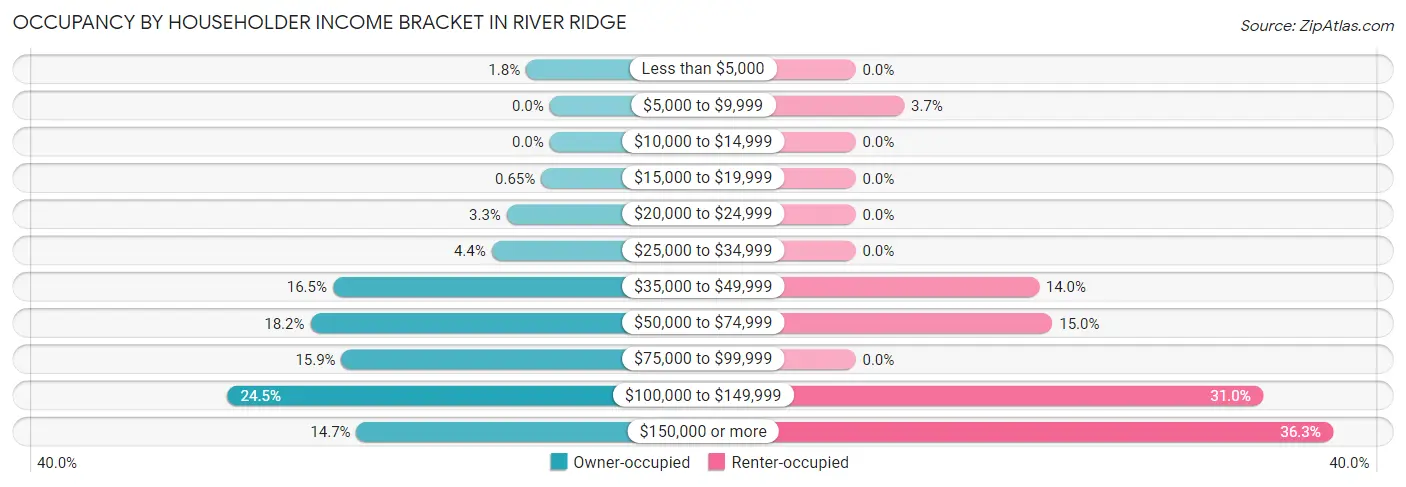
| Income Bracket | Owner-occupied | Renter-occupied |
| Less than $5,000 | 22 (1.8%) | 0 (0.0%) |
| $5,000 to $9,999 | 0 (0.0%) | 18 (3.7%) |
| $10,000 to $14,999 | 0 (0.0%) | 0 (0.0%) |
| $15,000 to $19,999 | 8 (0.6%) | 0 (0.0%) |
| $20,000 to $24,999 | 40 (3.3%) | 0 (0.0%) |
| $25,000 to $34,999 | 54 (4.4%) | 0 (0.0%) |
| $35,000 to $49,999 | 202 (16.5%) | 68 (14.0%) |
| $50,000 to $74,999 | 223 (18.2%) | 73 (15.0%) |
| $75,000 to $99,999 | 194 (15.9%) | 0 (0.0%) |
| $100,000 to $149,999 | 300 (24.5%) | 151 (31.0%) |
| $150,000 or more | 180 (14.7%) | 177 (36.3%) |
| Total | 1,223 (100.0%) | 487 (100.0%) |
Monthly Housing Cost Tiers in River Ridge
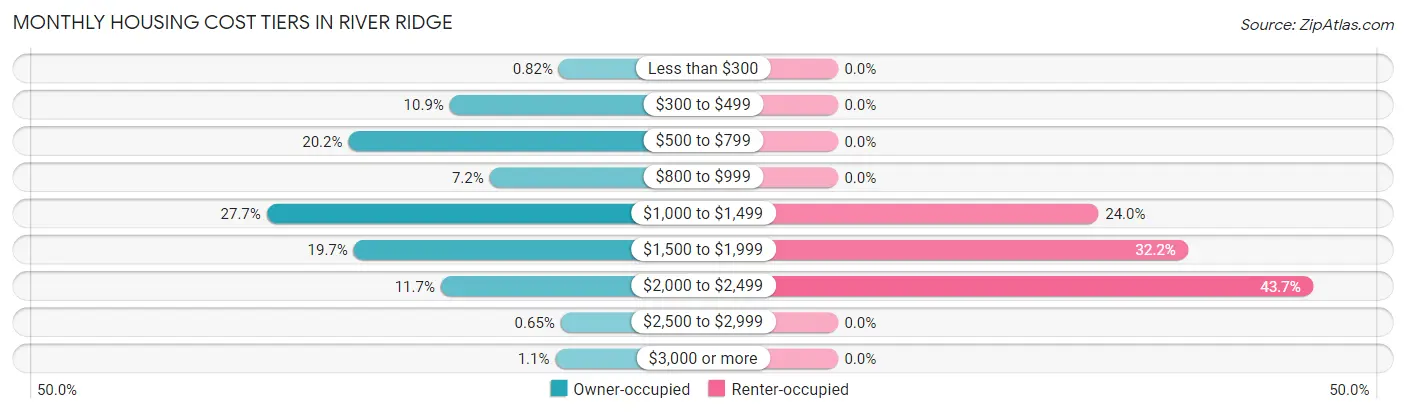
| Monthly Cost | Owner-occupied | Renter-occupied |
| Less than $300 | 10 (0.8%) | 0 (0.0%) |
| $300 to $499 | 133 (10.9%) | 0 (0.0%) |
| $500 to $799 | 247 (20.2%) | 0 (0.0%) |
| $800 to $999 | 88 (7.2%) | 0 (0.0%) |
| $1,000 to $1,499 | 339 (27.7%) | 117 (24.0%) |
| $1,500 to $1,999 | 241 (19.7%) | 157 (32.2%) |
| $2,000 to $2,499 | 143 (11.7%) | 213 (43.7%) |
| $2,500 to $2,999 | 8 (0.6%) | 0 (0.0%) |
| $3,000 or more | 14 (1.1%) | 0 (0.0%) |
| Total | 1,223 (100.0%) | 487 (100.0%) |
Physical Housing Characteristics in River Ridge
Housing Structures in River Ridge
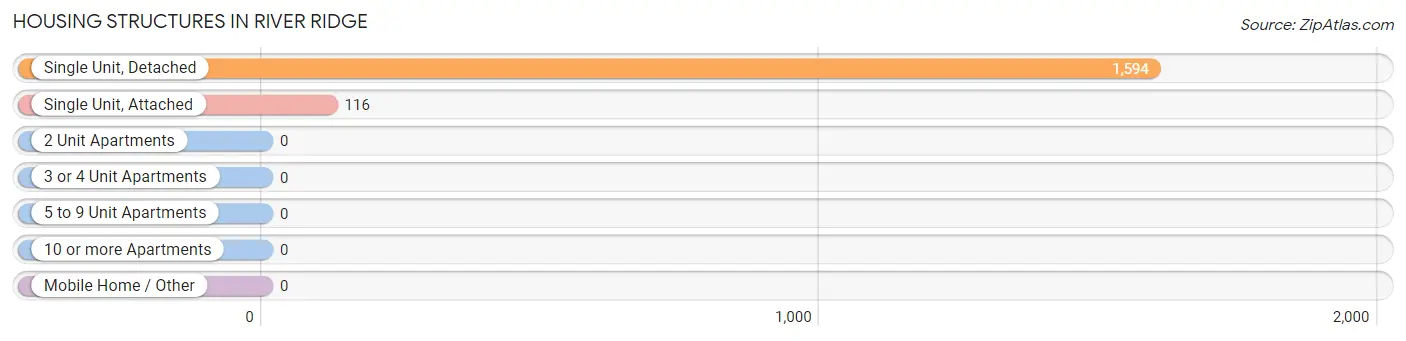
| Structure Type | # Housing Units | % Housing Units |
| Single Unit, Detached | 1,594 | 93.2% |
| Single Unit, Attached | 116 | 6.8% |
| 2 Unit Apartments | 0 | 0.0% |
| 3 or 4 Unit Apartments | 0 | 0.0% |
| 5 to 9 Unit Apartments | 0 | 0.0% |
| 10 or more Apartments | 0 | 0.0% |
| Mobile Home / Other | 0 | 0.0% |
| Total | 1,710 | 100.0% |
Housing Structures by Occupancy in River Ridge
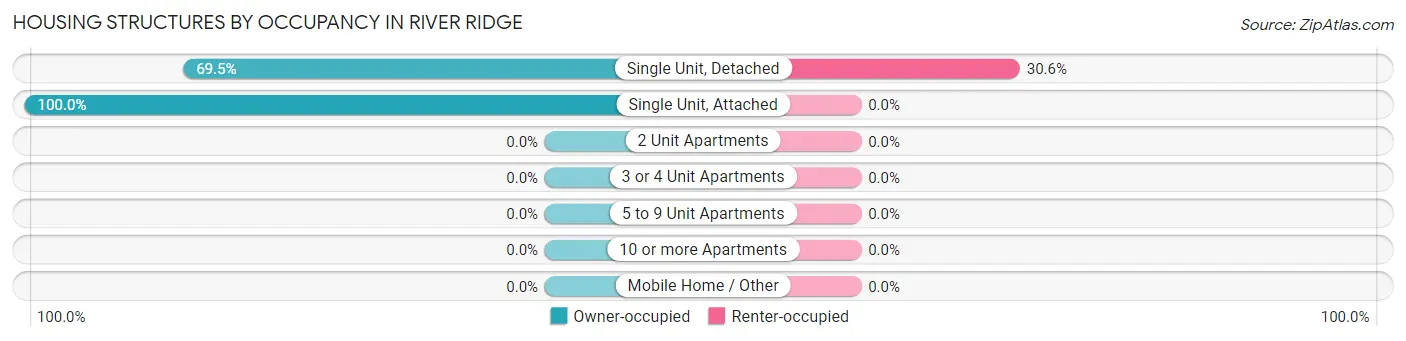
| Structure Type | Owner-occupied | Renter-occupied |
| Single Unit, Detached | 1,107 (69.5%) | 487 (30.5%) |
| Single Unit, Attached | 116 (100.0%) | 0 (0.0%) |
| 2 Unit Apartments | 0 (0.0%) | 0 (0.0%) |
| 3 or 4 Unit Apartments | 0 (0.0%) | 0 (0.0%) |
| 5 to 9 Unit Apartments | 0 (0.0%) | 0 (0.0%) |
| 10 or more Apartments | 0 (0.0%) | 0 (0.0%) |
| Mobile Home / Other | 0 (0.0%) | 0 (0.0%) |
| Total | 1,223 (71.5%) | 487 (28.5%) |
Housing Structures by Number of Rooms in River Ridge
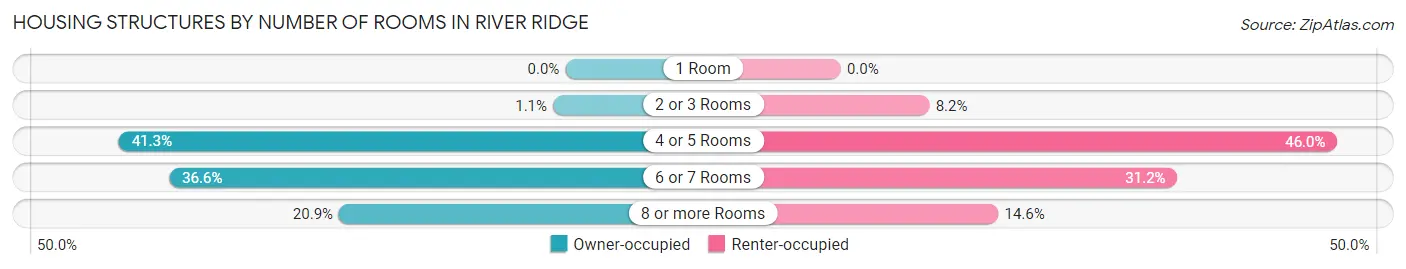
| Number of Rooms | Owner-occupied | Renter-occupied |
| 1 Room | 0 (0.0%) | 0 (0.0%) |
| 2 or 3 Rooms | 14 (1.1%) | 40 (8.2%) |
| 4 or 5 Rooms | 505 (41.3%) | 224 (46.0%) |
| 6 or 7 Rooms | 448 (36.6%) | 152 (31.2%) |
| 8 or more Rooms | 256 (20.9%) | 71 (14.6%) |
| Total | 1,223 (100.0%) | 487 (100.0%) |
Housing Structure by Heating Type in River Ridge
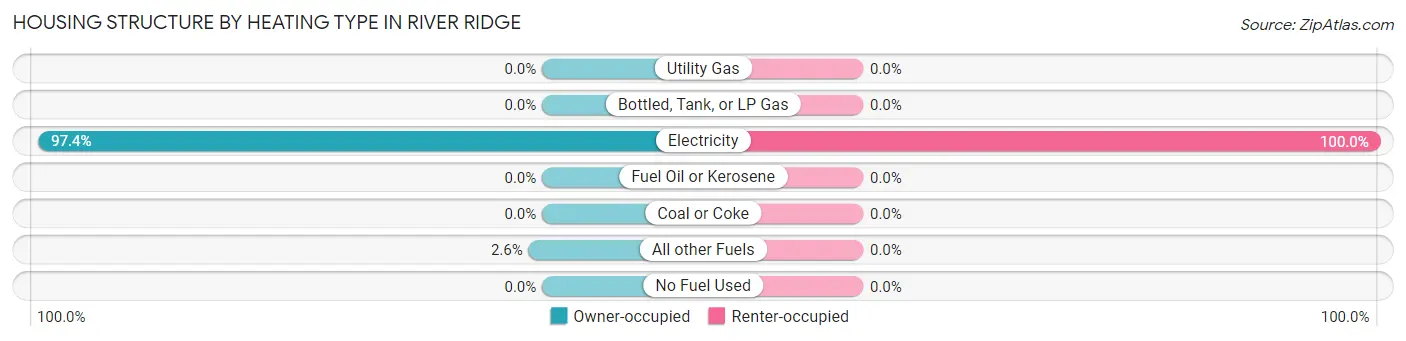
| Heating Type | Owner-occupied | Renter-occupied |
| Utility Gas | 0 (0.0%) | 0 (0.0%) |
| Bottled, Tank, or LP Gas | 0 (0.0%) | 0 (0.0%) |
| Electricity | 1,191 (97.4%) | 487 (100.0%) |
| Fuel Oil or Kerosene | 0 (0.0%) | 0 (0.0%) |
| Coal or Coke | 0 (0.0%) | 0 (0.0%) |
| All other Fuels | 32 (2.6%) | 0 (0.0%) |
| No Fuel Used | 0 (0.0%) | 0 (0.0%) |
| Total | 1,223 (100.0%) | 487 (100.0%) |
Household Vehicle Usage in River Ridge
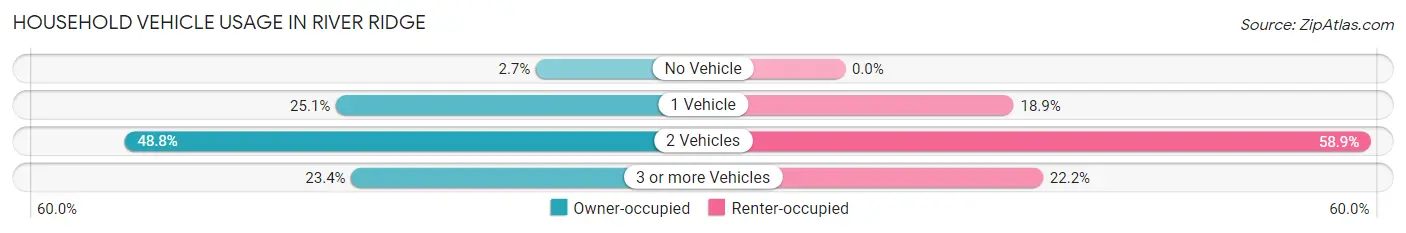
| Vehicles per Household | Owner-occupied | Renter-occupied |
| No Vehicle | 33 (2.7%) | 0 (0.0%) |
| 1 Vehicle | 307 (25.1%) | 92 (18.9%) |
| 2 Vehicles | 597 (48.8%) | 287 (58.9%) |
| 3 or more Vehicles | 286 (23.4%) | 108 (22.2%) |
| Total | 1,223 (100.0%) | 487 (100.0%) |
Real Estate & Mortgages in River Ridge
Real Estate and Mortgage Overview in River Ridge
| Characteristic | Without Mortgage | With Mortgage |
| Housing Units | 408 | 815 |
| Median Property Value | $197,900 | $278,100 |
| Median Household Income | $61,971 | $102 |
| Monthly Housing Costs | $582 | $14 |
| Real Estate Taxes | $1,308 | $22 |
Property Value by Mortgage Status in River Ridge
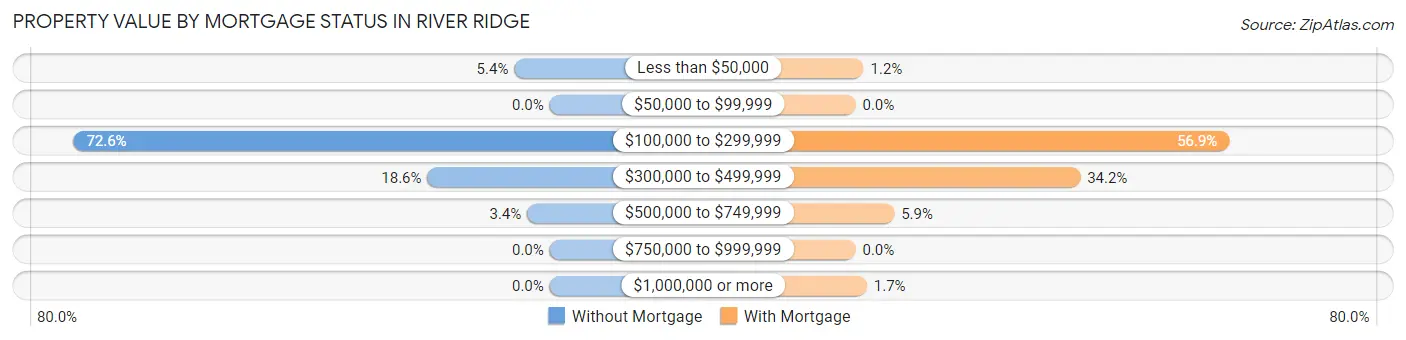
| Property Value | Without Mortgage | With Mortgage |
| Less than $50,000 | 22 (5.4%) | 10 (1.2%) |
| $50,000 to $99,999 | 0 (0.0%) | 0 (0.0%) |
| $100,000 to $299,999 | 296 (72.6%) | 464 (56.9%) |
| $300,000 to $499,999 | 76 (18.6%) | 279 (34.2%) |
| $500,000 to $749,999 | 14 (3.4%) | 48 (5.9%) |
| $750,000 to $999,999 | 0 (0.0%) | 0 (0.0%) |
| $1,000,000 or more | 0 (0.0%) | 14 (1.7%) |
| Total | 408 (100.0%) | 815 (100.0%) |
Household Income by Mortgage Status in River Ridge
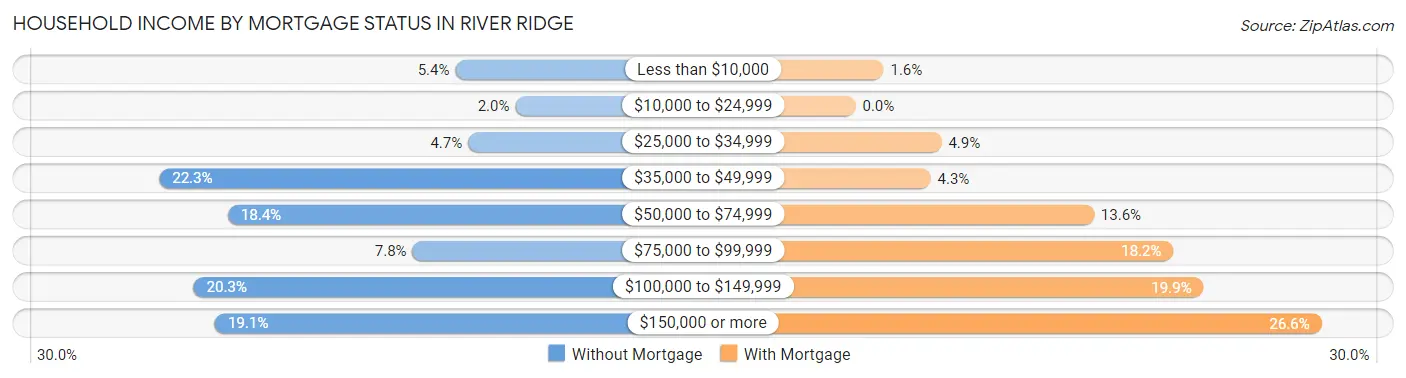
| Household Income | Without Mortgage | With Mortgage |
| Less than $10,000 | 22 (5.4%) | 13 (1.6%) |
| $10,000 to $24,999 | 8 (2.0%) | 0 (0.0%) |
| $25,000 to $34,999 | 19 (4.7%) | 40 (4.9%) |
| $35,000 to $49,999 | 91 (22.3%) | 35 (4.3%) |
| $50,000 to $74,999 | 75 (18.4%) | 111 (13.6%) |
| $75,000 to $99,999 | 32 (7.8%) | 148 (18.2%) |
| $100,000 to $149,999 | 83 (20.3%) | 162 (19.9%) |
| $150,000 or more | 78 (19.1%) | 217 (26.6%) |
| Total | 408 (100.0%) | 815 (100.0%) |
Property Value to Household Income Ratio in River Ridge
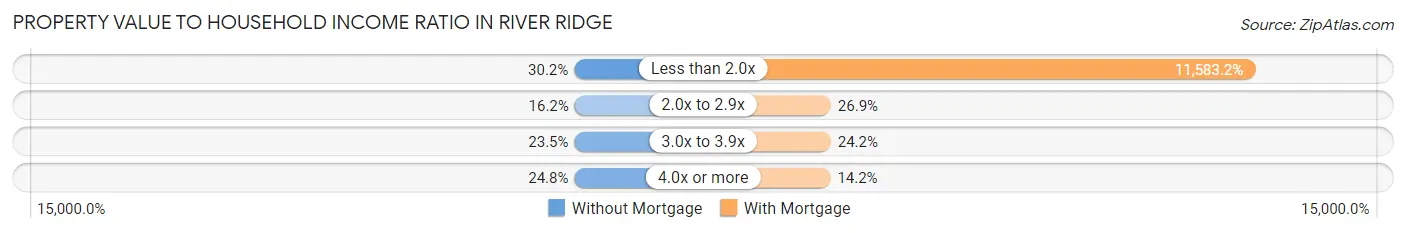
| Value-to-Income Ratio | Without Mortgage | With Mortgage |
| Less than 2.0x | 123 (30.1%) | 94,403 (11,583.2%) |
| 2.0x to 2.9x | 66 (16.2%) | 219 (26.9%) |
| 3.0x to 3.9x | 96 (23.5%) | 197 (24.2%) |
| 4.0x or more | 101 (24.7%) | 116 (14.2%) |
| Total | 408 (100.0%) | 815 (100.0%) |
Real Estate Taxes by Mortgage Status in River Ridge
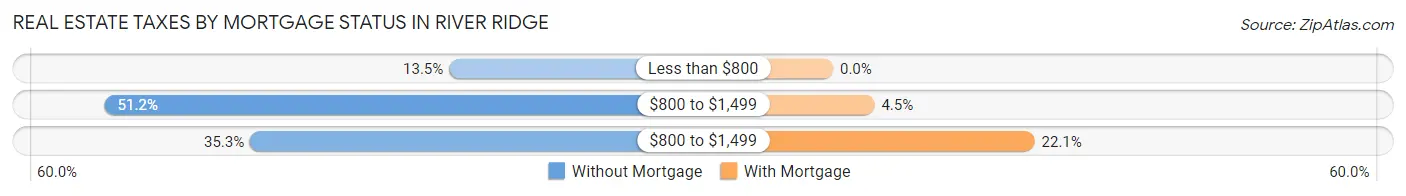
| Property Taxes | Without Mortgage | With Mortgage |
| Less than $800 | 55 (13.5%) | 0 (0.0%) |
| $800 to $1,499 | 209 (51.2%) | 37 (4.5%) |
| $800 to $1,499 | 144 (35.3%) | 180 (22.1%) |
| Total | 408 (100.0%) | 815 (100.0%) |
Health & Disability in River Ridge
Health Insurance Coverage by Age in River Ridge
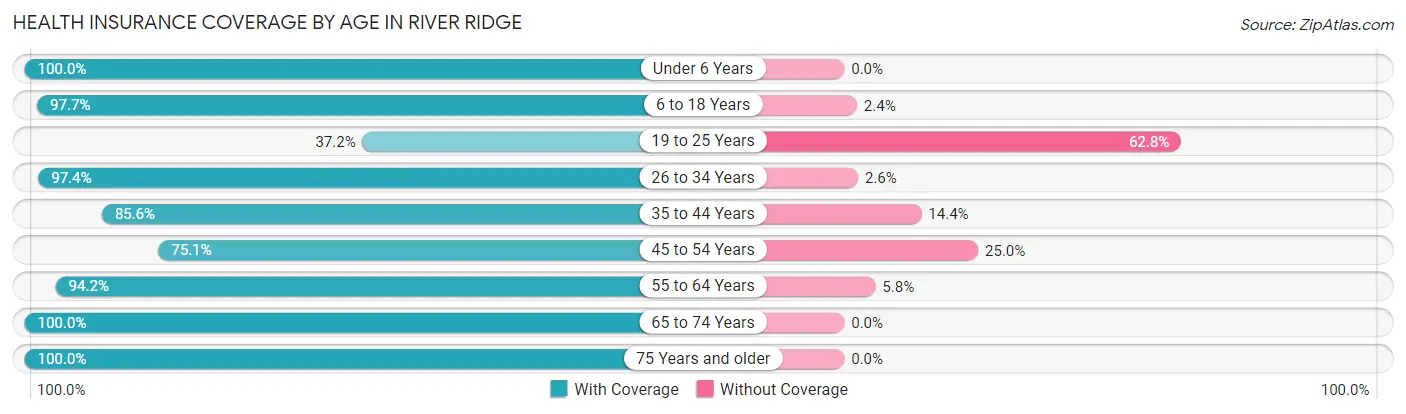
| Age Bracket | With Coverage | Without Coverage |
| Under 6 Years | 111 (100.0%) | 0 (0.0%) |
| 6 to 18 Years | 707 (97.7%) | 17 (2.4%) |
| 19 to 25 Years | 129 (37.2%) | 218 (62.8%) |
| 26 to 34 Years | 266 (97.4%) | 7 (2.6%) |
| 35 to 44 Years | 393 (85.6%) | 66 (14.4%) |
| 45 to 54 Years | 713 (75.0%) | 237 (24.9%) |
| 55 to 64 Years | 682 (94.2%) | 42 (5.8%) |
| 65 to 74 Years | 664 (100.0%) | 0 (0.0%) |
| 75 Years and older | 453 (100.0%) | 0 (0.0%) |
| Total | 4,118 (87.5%) | 587 (12.5%) |
Health Insurance Coverage by Citizenship Status in River Ridge
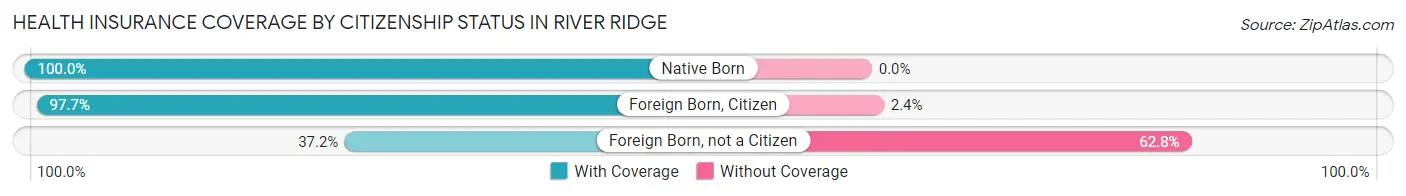
| Citizenship Status | With Coverage | Without Coverage |
| Native Born | 111 (100.0%) | 0 (0.0%) |
| Foreign Born, Citizen | 707 (97.7%) | 17 (2.4%) |
| Foreign Born, not a Citizen | 129 (37.2%) | 218 (62.8%) |
Health Insurance Coverage by Household Income in River Ridge
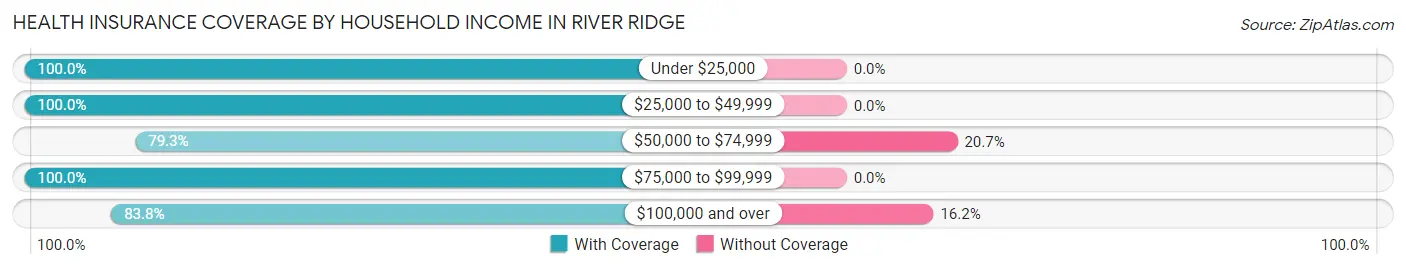
| Household Income | With Coverage | Without Coverage |
| Under $25,000 | 88 (100.0%) | 0 (0.0%) |
| $25,000 to $49,999 | 670 (100.0%) | 0 (0.0%) |
| $50,000 to $74,999 | 554 (79.3%) | 145 (20.7%) |
| $75,000 to $99,999 | 527 (100.0%) | 0 (0.0%) |
| $100,000 and over | 2,279 (83.8%) | 442 (16.2%) |
Public vs Private Health Insurance Coverage by Age in River Ridge
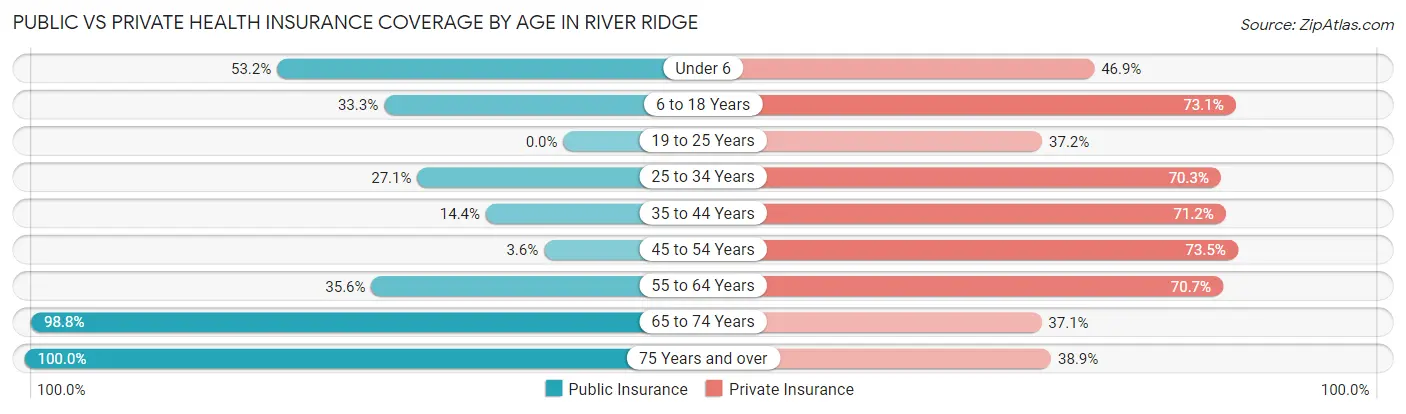
| Age Bracket | Public Insurance | Private Insurance |
| Under 6 | 59 (53.1%) | 52 (46.9%) |
| 6 to 18 Years | 241 (33.3%) | 529 (73.1%) |
| 19 to 25 Years | 0 (0.0%) | 129 (37.2%) |
| 25 to 34 Years | 74 (27.1%) | 192 (70.3%) |
| 35 to 44 Years | 66 (14.4%) | 327 (71.2%) |
| 45 to 54 Years | 34 (3.6%) | 698 (73.5%) |
| 55 to 64 Years | 258 (35.6%) | 512 (70.7%) |
| 65 to 74 Years | 656 (98.8%) | 246 (37.0%) |
| 75 Years and over | 453 (100.0%) | 176 (38.9%) |
| Total | 1,841 (39.1%) | 2,861 (60.8%) |
Disability Status by Sex by Age in River Ridge
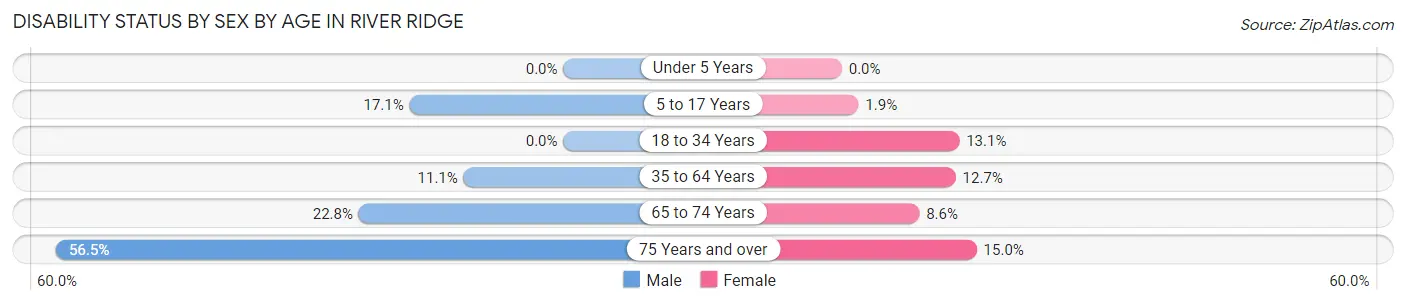
| Age Bracket | Male | Female |
| Under 5 Years | 0 (0.0%) | 0 (0.0%) |
| 5 to 17 Years | 62 (17.1%) | 6 (1.8%) |
| 18 to 34 Years | 0 (0.0%) | 62 (13.1%) |
| 35 to 64 Years | 124 (11.1%) | 129 (12.7%) |
| 65 to 74 Years | 64 (22.8%) | 33 (8.6%) |
| 75 Years and over | 113 (56.5%) | 38 (15.0%) |
Disability Class by Sex by Age in River Ridge
Disability Class: Hearing Difficulty
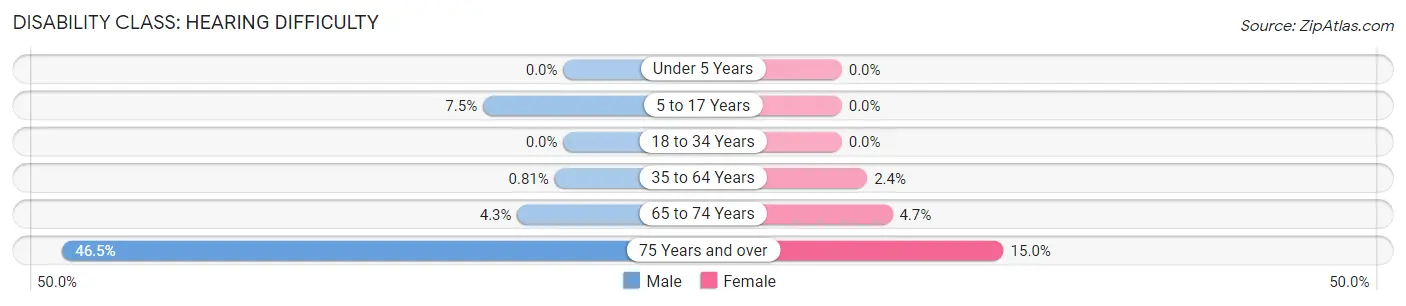
| Age Bracket | Male | Female |
| Under 5 Years | 0 (0.0%) | 0 (0.0%) |
| 5 to 17 Years | 27 (7.5%) | 0 (0.0%) |
| 18 to 34 Years | 0 (0.0%) | 0 (0.0%) |
| 35 to 64 Years | 9 (0.8%) | 24 (2.4%) |
| 65 to 74 Years | 12 (4.3%) | 18 (4.7%) |
| 75 Years and over | 93 (46.5%) | 38 (15.0%) |
Disability Class: Vision Difficulty
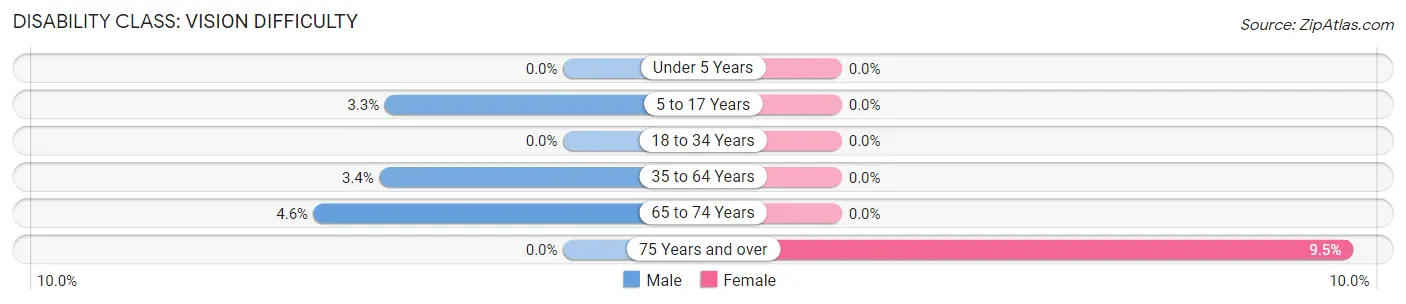
| Age Bracket | Male | Female |
| Under 5 Years | 0 (0.0%) | 0 (0.0%) |
| 5 to 17 Years | 12 (3.3%) | 0 (0.0%) |
| 18 to 34 Years | 0 (0.0%) | 0 (0.0%) |
| 35 to 64 Years | 38 (3.4%) | 0 (0.0%) |
| 65 to 74 Years | 13 (4.6%) | 0 (0.0%) |
| 75 Years and over | 0 (0.0%) | 24 (9.5%) |
Disability Class: Cognitive Difficulty
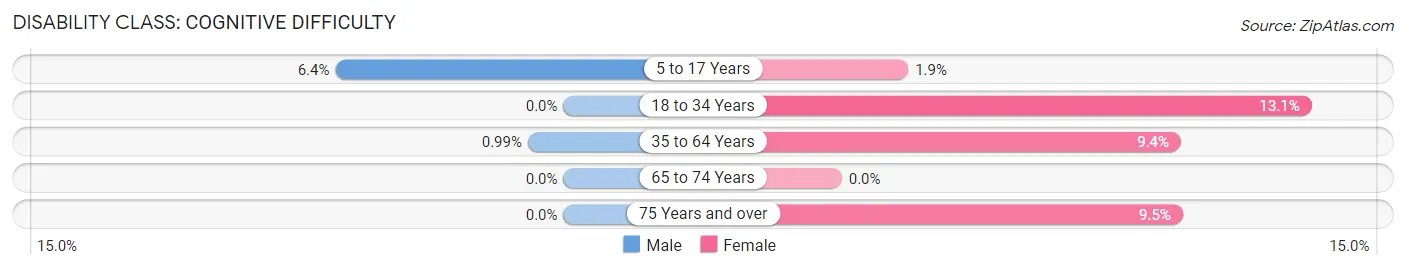
| Age Bracket | Male | Female |
| 5 to 17 Years | 23 (6.4%) | 6 (1.8%) |
| 18 to 34 Years | 0 (0.0%) | 62 (13.1%) |
| 35 to 64 Years | 11 (1.0%) | 96 (9.4%) |
| 65 to 74 Years | 0 (0.0%) | 0 (0.0%) |
| 75 Years and over | 0 (0.0%) | 24 (9.5%) |
Disability Class: Ambulatory Difficulty
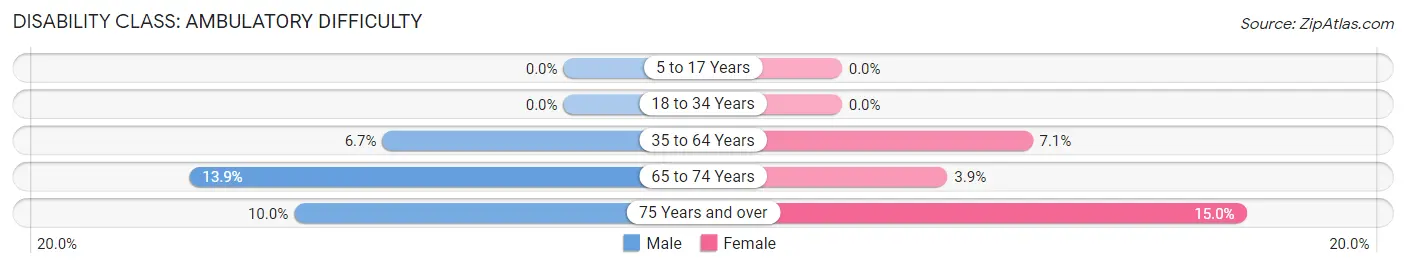
| Age Bracket | Male | Female |
| 5 to 17 Years | 0 (0.0%) | 0 (0.0%) |
| 18 to 34 Years | 0 (0.0%) | 0 (0.0%) |
| 35 to 64 Years | 75 (6.7%) | 72 (7.1%) |
| 65 to 74 Years | 39 (13.9%) | 15 (3.9%) |
| 75 Years and over | 20 (10.0%) | 38 (15.0%) |
Disability Class: Self-Care Difficulty
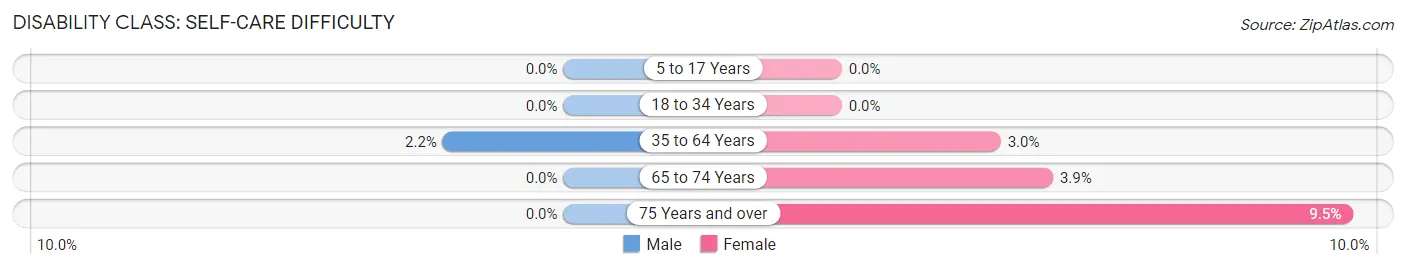
| Age Bracket | Male | Female |
| 5 to 17 Years | 0 (0.0%) | 0 (0.0%) |
| 18 to 34 Years | 0 (0.0%) | 0 (0.0%) |
| 35 to 64 Years | 25 (2.2%) | 30 (2.9%) |
| 65 to 74 Years | 0 (0.0%) | 15 (3.9%) |
| 75 Years and over | 0 (0.0%) | 24 (9.5%) |
Technology Access in River Ridge
Computing Device Access in River Ridge
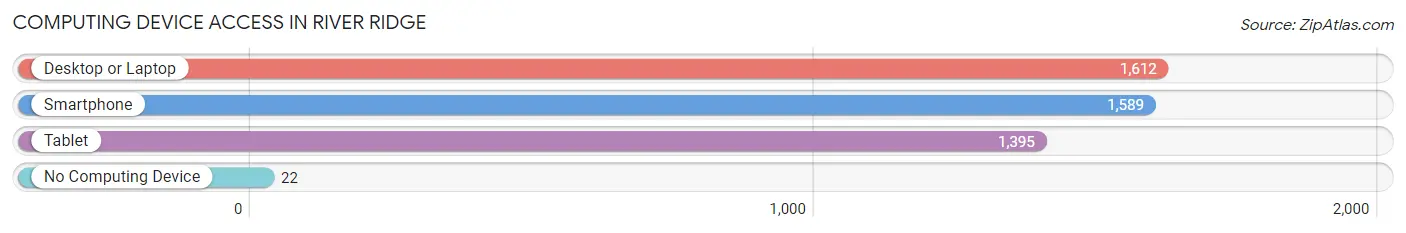
| Device Type | # Households | % Households |
| Desktop or Laptop | 1,612 | 94.3% |
| Smartphone | 1,589 | 92.9% |
| Tablet | 1,395 | 81.6% |
| No Computing Device | 22 | 1.3% |
| Total | 1,710 | 100.0% |
Internet Access in River Ridge
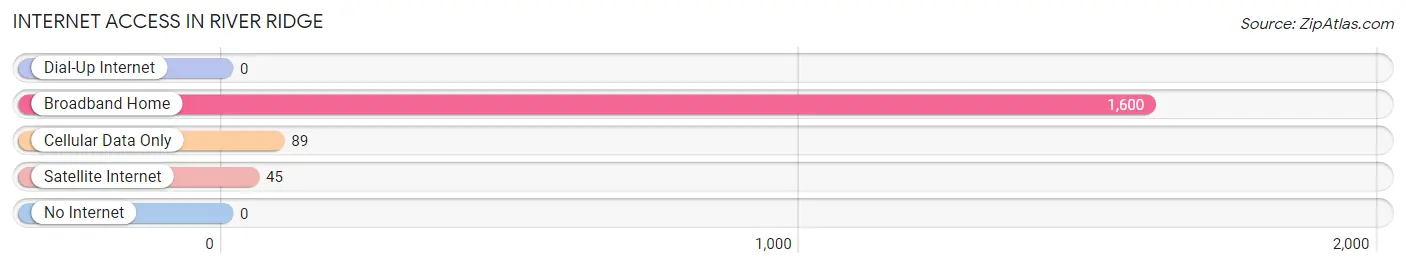
| Internet Type | # Households | % Households |
| Dial-Up Internet | 0 | 0.0% |
| Broadband Home | 1,600 | 93.6% |
| Cellular Data Only | 89 | 5.2% |
| Satellite Internet | 45 | 2.6% |
| No Internet | 0 | 0.0% |
| Total | 1,710 | 100.0% |
River Ridge Summary
River Ridge is a small unincorporated community located in Pasco County, Florida. It is situated on the banks of the Anclote River, approximately 25 miles north of Tampa. The community is home to a population of approximately 1,000 people, and is known for its rural atmosphere and small-town charm.
History
The area that is now River Ridge was first settled in the late 1800s by a group of settlers from Georgia. The settlers were attracted to the area due to its abundance of natural resources, including timber, fish, and game. The settlers established a small community and named it River Ridge, after the nearby Anclote River.
In the early 1900s, the community began to grow and develop. A post office was established in 1910, and a school was built in 1912. The community also had a general store, a blacksmith shop, and a sawmill.
In the 1920s, the community began to decline due to the Great Depression. Many of the residents moved away in search of work, and the population dwindled. However, the community was able to survive and remain relatively unchanged until the 1950s.
In the 1950s, the population began to grow again as new residents moved to the area. The community was able to attract new businesses, including a grocery store, a gas station, and a hardware store. The population continued to grow throughout the 1960s and 1970s, and the community began to develop into a small town.
Geography
River Ridge is located in Pasco County, Florida. It is situated on the banks of the Anclote River, approximately 25 miles north of Tampa. The community is located in a rural area, and is surrounded by forests and wetlands. The climate is subtropical, with hot, humid summers and mild winters.
Economy
The economy of River Ridge is largely based on agriculture and tourism. The area is home to several farms, which produce a variety of crops, including citrus fruits, vegetables, and hay. The community is also home to several small businesses, including restaurants, convenience stores, and gas stations.
Tourism is an important part of the local economy. The area is home to several parks and nature preserves, which attract visitors from all over the state. The community is also home to several popular fishing spots, which attract anglers from all over the country.
Demographics
As of the 2010 census, the population of River Ridge was 1,000. The racial makeup of the community was 97.2% White, 0.7% African American, 0.3% Native American, 0.3% Asian, and 1.5% from other races. The median household income was $45,000, and the median age was 44.
Conclusion
River Ridge is a small unincorporated community located in Pasco County, Florida. It is situated on the banks of the Anclote River, approximately 25 miles north of Tampa. The community is home to a population of approximately 1,000 people, and is known for its rural atmosphere and small-town charm. The economy of River Ridge is largely based on agriculture and tourism, and the population is predominantly White. The community is home to several parks and nature preserves, which attract visitors from all over the state.
Common Questions
What is the Total Population of River Ridge?
Total Population of River Ridge is 4,705.
What is the Total Male Population of River Ridge?
Total Male Population of River Ridge is 2,223.
What is the Total Female Population of River Ridge?
Total Female Population of River Ridge is 2,482.
What is the Ratio of Males per 100 Females in River Ridge?
There are 89.56 Males per 100 Females in River Ridge.
What is the Ratio of Females per 100 Males in River Ridge?
There are 111.65 Females per 100 Males in River Ridge.
What is the Median Population Age in River Ridge?
Median Population Age in River Ridge is 50.7 Years.
What is the Average Family Size in River Ridge
Average Family Size in River Ridge is 2.9 People.
What is the Average Household Size in River Ridge
Average Household Size in River Ridge is 2.8 People.
What is Per Capita Income in River Ridge?
Per Capita income in River Ridge is $48,370.
What is the Median Family Income in River Ridge?
Median Family Income in River Ridge is $95,848.
What is the Median Household income in River Ridge?
Median Household Income in River Ridge is $97,039.
What is Income or Wage Gap in River Ridge?
Income or Wage Gap in River Ridge is 7.5%.
Women in River Ridge earn 92.5 cents for every dollar earned by a man.
What is Inequality or Gini Index in River Ridge?
Inequality or Gini Index in River Ridge is 0.44.
How Large is the Labor Force in River Ridge?
There are 2,695 People in the Labor Forcein in River Ridge.
What is the Percentage of People in the Labor Force in River Ridge?
62.5% of People are in the Labor Force in River Ridge.
What is the Unemployment Rate in River Ridge?
Unemployment Rate in River Ridge is 12.8%.