Gifford, FL
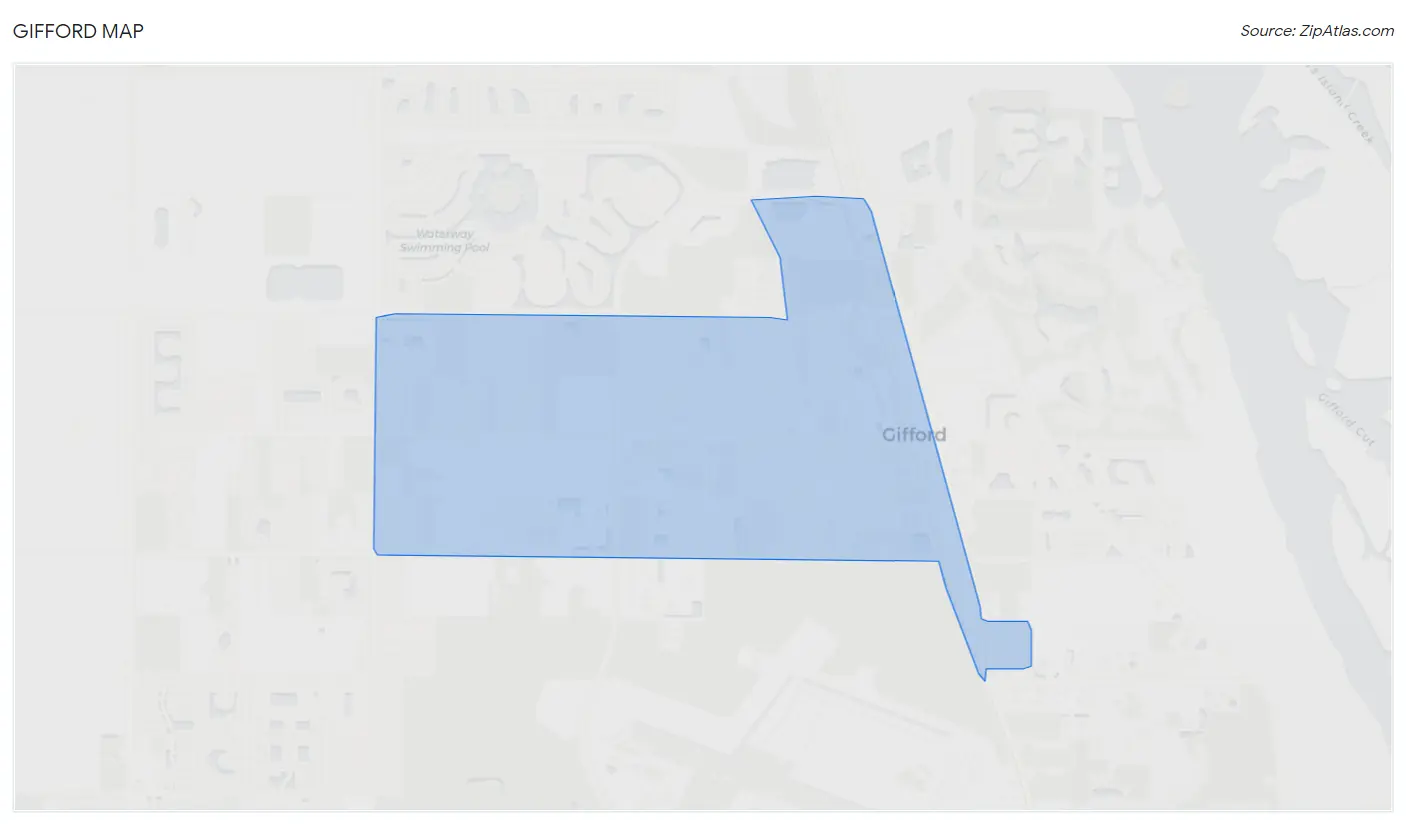
Gifford Map
Gifford Overview
4,868
TOTAL POPULATION
2,205
MALE POPULATION
2,663
FEMALE POPULATION
82.80
MALES / 100 FEMALES
120.77
FEMALES / 100 MALES
31.6
MEDIAN AGE
4.7
AVG FAMILY SIZE
3.3
AVG HOUSEHOLD SIZE
$15,831
PER CAPITA INCOME
$25,195
AVG FAMILY INCOME
$23,969
AVG HOUSEHOLD INCOME
12.6%
WAGE / INCOME GAP [ % ]
87.4¢/ $1
WAGE / INCOME GAP [ $ ]
0.57
INEQUALITY / GINI INDEX
1,745
LABOR FORCE [ PEOPLE ]
52.4%
PERCENT IN LABOR FORCE
12.8%
UNEMPLOYMENT RATE
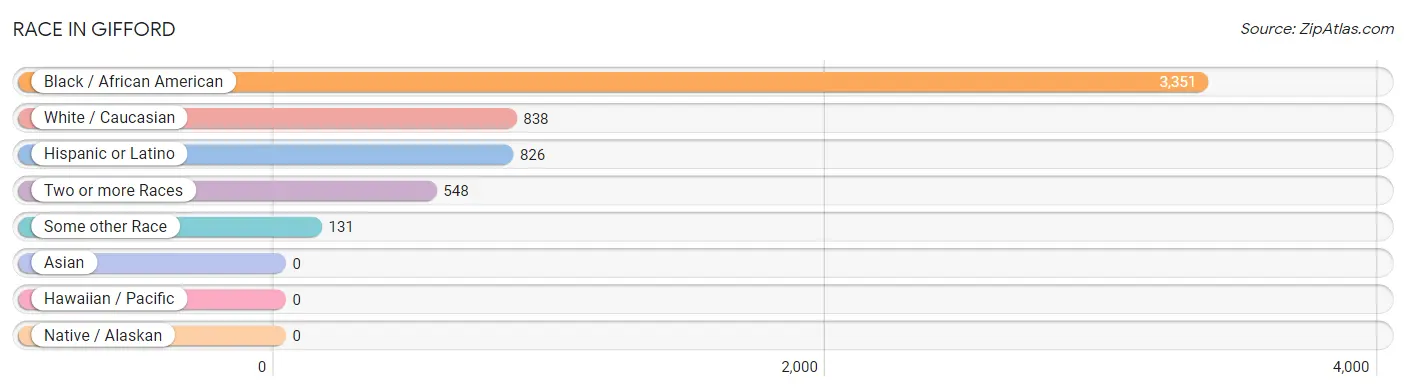
Race in Gifford
The most populous races in Gifford are Black / African American (3,351 | 68.8%), White / Caucasian (838 | 17.2%), and Hispanic or Latino (826 | 17.0%).
| Race | # Population | % Population |
| Asian | 0 | 0.0% |
| Black / African American | 3,351 | 68.8% |
| Hawaiian / Pacific | 0 | 0.0% |
| Hispanic or Latino | 826 | 17.0% |
| Native / Alaskan | 0 | 0.0% |
| White / Caucasian | 838 | 17.2% |
| Two or more Races | 548 | 11.3% |
| Some other Race | 131 | 2.7% |
| Total | 4,868 | 100.0% |
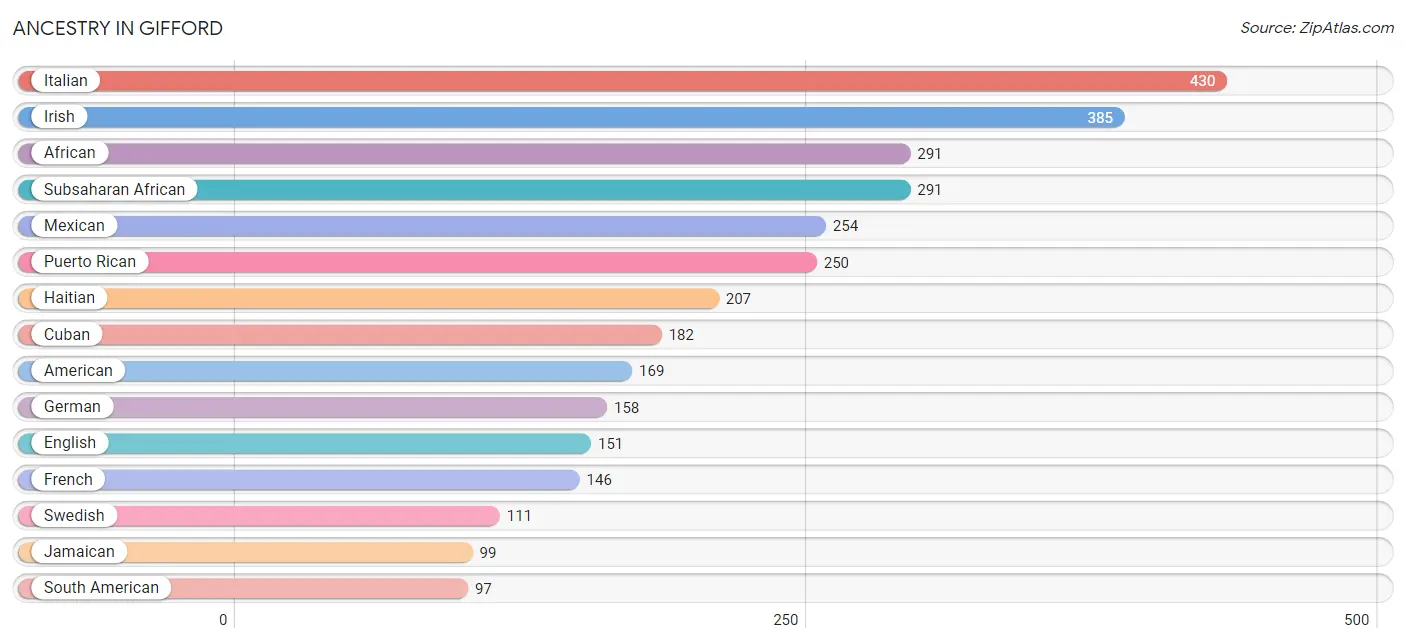
Ancestry in Gifford
The most populous ancestries reported in Gifford are Italian (430 | 8.8%), Irish (385 | 7.9%), African (291 | 6.0%), Subsaharan African (291 | 6.0%), and Mexican (254 | 5.2%), together accounting for 33.9% of all Gifford residents.
| Ancestry | # Population | % Population |
| African | 291 | 6.0% |
| American | 169 | 3.5% |
| British | 19 | 0.4% |
| Central American | 43 | 0.9% |
| Colombian | 85 | 1.8% |
| Cuban | 182 | 3.7% |
| English | 151 | 3.1% |
| European | 16 | 0.3% |
| French | 146 | 3.0% |
| German | 158 | 3.3% |
| Haitian | 207 | 4.3% |
| Irish | 385 | 7.9% |
| Italian | 430 | 8.8% |
| Jamaican | 99 | 2.0% |
| Lithuanian | 52 | 1.1% |
| Mexican | 254 | 5.2% |
| Puerto Rican | 250 | 5.1% |
| Salvadoran | 43 | 0.9% |
| Scotch-Irish | 4 | 0.1% |
| South American | 97 | 2.0% |
| Subsaharan African | 291 | 6.0% |
| Swedish | 111 | 2.3% |
| Venezuelan | 12 | 0.3% |
| Welsh | 9 | 0.2% | View All 24 Rows |
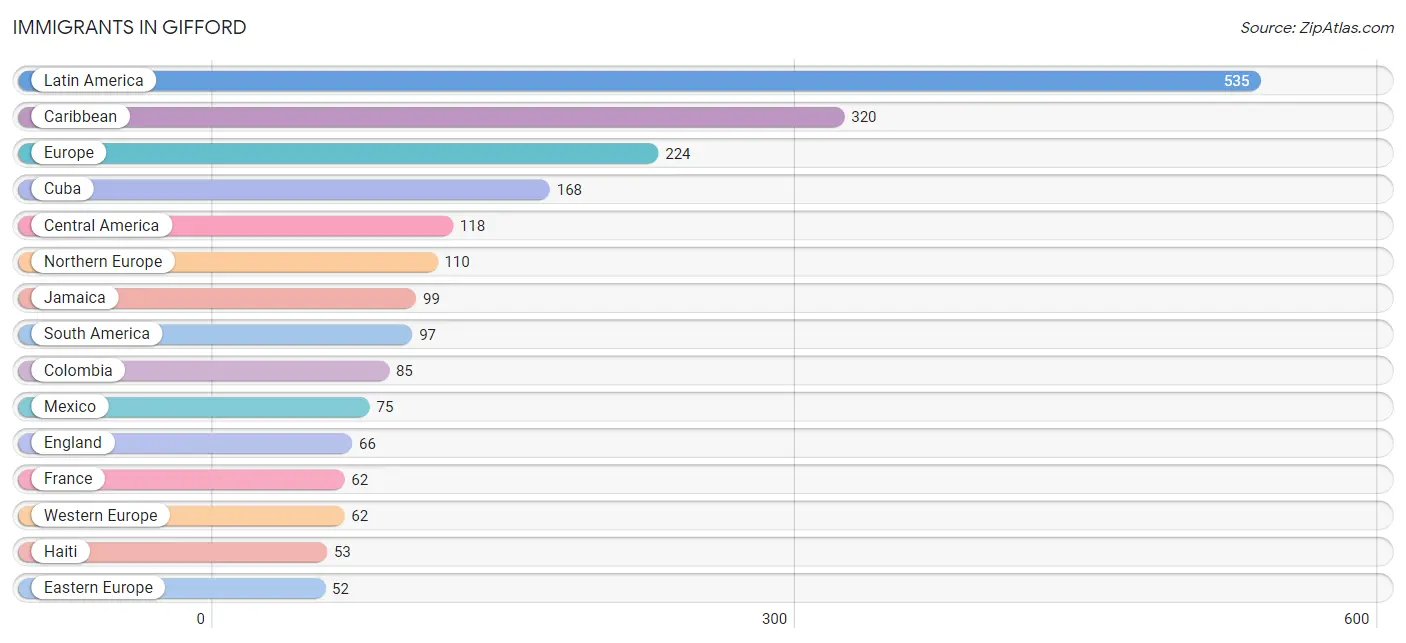
Immigrants in Gifford
The most numerous immigrant groups reported in Gifford came from Latin America (535 | 11.0%), Caribbean (320 | 6.6%), Europe (224 | 4.6%), Cuba (168 | 3.5%), and Central America (118 | 2.4%), together accounting for 28.0% of all Gifford residents.
| Immigration Origin | # Population | % Population |
| Canada | 22 | 0.4% |
| Caribbean | 320 | 6.6% |
| Central America | 118 | 2.4% |
| Colombia | 85 | 1.8% |
| Cuba | 168 | 3.5% |
| Eastern Europe | 52 | 1.1% |
| El Salvador | 43 | 0.9% |
| England | 66 | 1.4% |
| Europe | 224 | 4.6% |
| France | 62 | 1.3% |
| Haiti | 53 | 1.1% |
| Jamaica | 99 | 2.0% |
| Latin America | 535 | 11.0% |
| Lithuania | 52 | 1.1% |
| Mexico | 75 | 1.5% |
| Northern Europe | 110 | 2.3% |
| South America | 97 | 2.0% |
| Venezuela | 12 | 0.3% |
| Western Europe | 62 | 1.3% | View All 19 Rows |
Sex and Age in Gifford
Sex and Age in Gifford
The most populous age groups in Gifford are 10 to 14 Years (289 | 13.1%) for men and 10 to 14 Years (366 | 13.7%) for women.
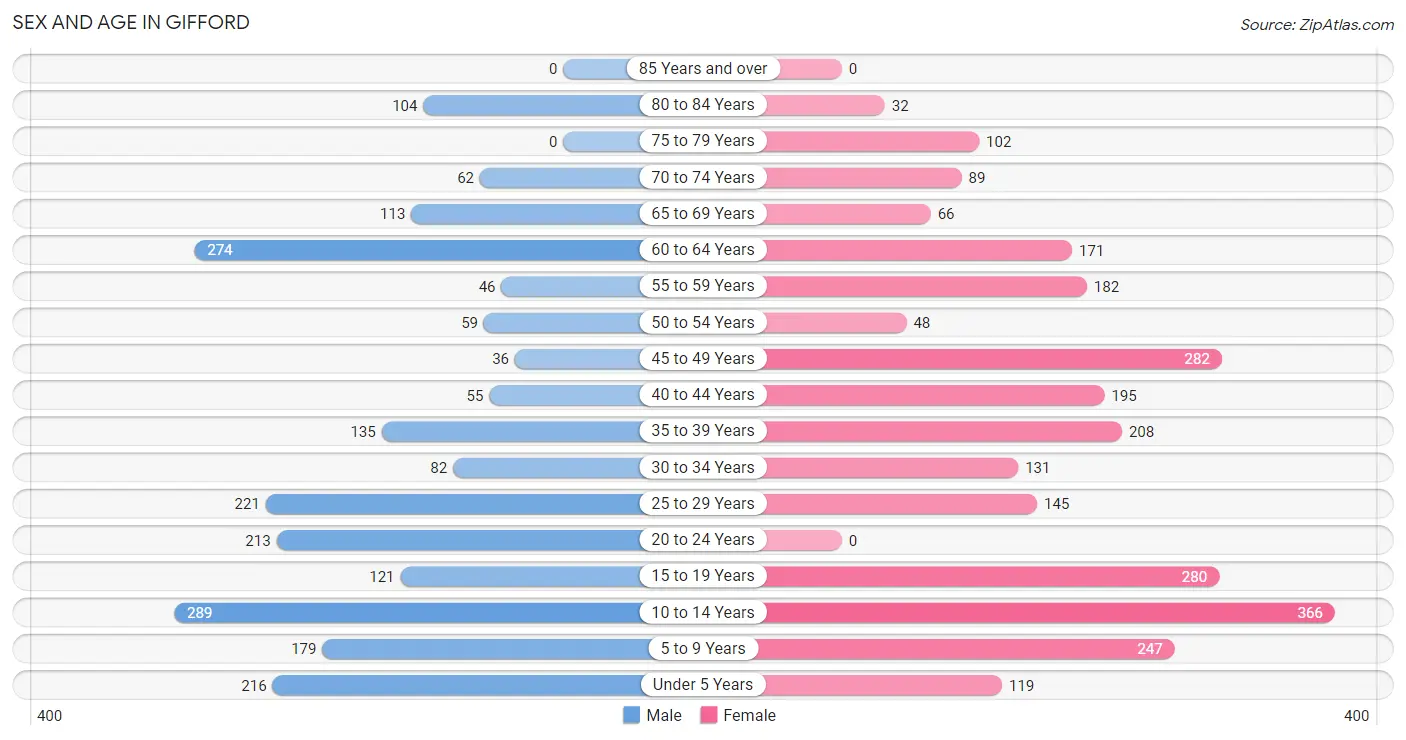
| Age Bracket | Male | Female |
| Under 5 Years | 216 (9.8%) | 119 (4.5%) |
| 5 to 9 Years | 179 (8.1%) | 247 (9.3%) |
| 10 to 14 Years | 289 (13.1%) | 366 (13.7%) |
| 15 to 19 Years | 121 (5.5%) | 280 (10.5%) |
| 20 to 24 Years | 213 (9.7%) | 0 (0.0%) |
| 25 to 29 Years | 221 (10.0%) | 145 (5.4%) |
| 30 to 34 Years | 82 (3.7%) | 131 (4.9%) |
| 35 to 39 Years | 135 (6.1%) | 208 (7.8%) |
| 40 to 44 Years | 55 (2.5%) | 195 (7.3%) |
| 45 to 49 Years | 36 (1.6%) | 282 (10.6%) |
| 50 to 54 Years | 59 (2.7%) | 48 (1.8%) |
| 55 to 59 Years | 46 (2.1%) | 182 (6.8%) |
| 60 to 64 Years | 274 (12.4%) | 171 (6.4%) |
| 65 to 69 Years | 113 (5.1%) | 66 (2.5%) |
| 70 to 74 Years | 62 (2.8%) | 89 (3.3%) |
| 75 to 79 Years | 0 (0.0%) | 102 (3.8%) |
| 80 to 84 Years | 104 (4.7%) | 32 (1.2%) |
| 85 Years and over | 0 (0.0%) | 0 (0.0%) |
| Total | 2,205 (100.0%) | 2,663 (100.0%) |
Families and Households in Gifford
Median Family Size in Gifford
The median family size in Gifford is 4.69 persons per family, with single female/mother families (494 | 61.1%) accounting for the largest median family size of 5.67 persons per family. On the other hand, single male/father families (57 | 7.0%) represent the smallest median family size with 2.74 persons per family.
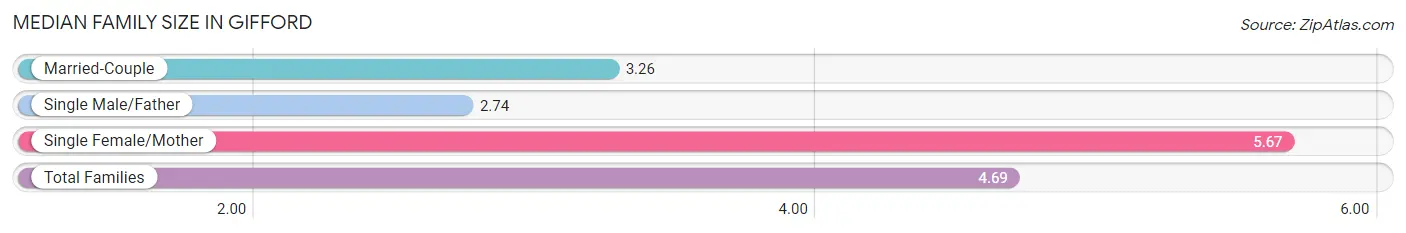
| Family Type | # Families | Family Size |
| Married-Couple | 258 (31.9%) | 3.26 |
| Single Male/Father | 57 (7.0%) | 2.74 |
| Single Female/Mother | 494 (61.1%) | 5.67 |
| Total Families | 809 (100.0%) | 4.69 |
Median Household Size in Gifford
The median household size in Gifford is 3.26 persons per household, with single female/mother households (494 | 33.2%) accounting for the largest median household size of 5.67 persons per household. non-family households (677 | 45.6%) represent the smallest median household size with 1.55 persons per household.
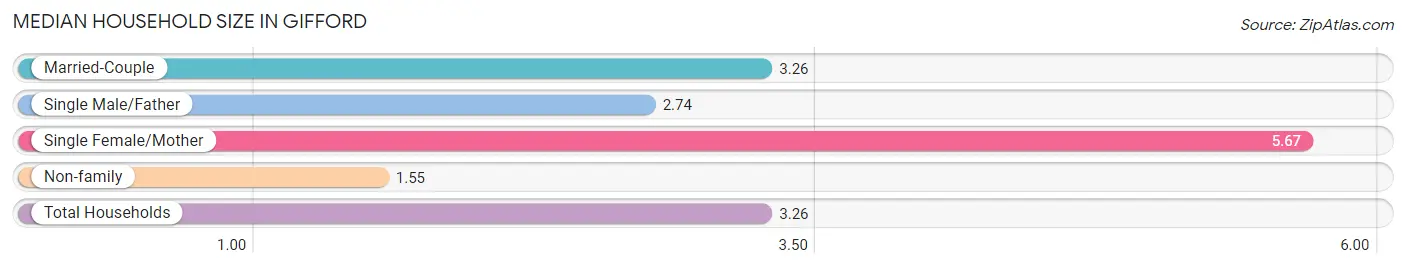
| Household Type | # Households | Household Size |
| Married-Couple | 258 (17.4%) | 3.26 |
| Single Male/Father | 57 (3.8%) | 2.74 |
| Single Female/Mother | 494 (33.2%) | 5.67 |
| Non-family | 677 (45.6%) | 1.55 |
| Total Households | 1,486 (100.0%) | 3.26 |
Household Size by Marriage Status in Gifford
Out of a total of 1,486 households in Gifford, 809 (54.4%) are family households, while 677 (45.6%) are nonfamily households. The most numerous type of family households are 2-person households, comprising 285, and the most common type of nonfamily households are 1-person households, comprising 535.
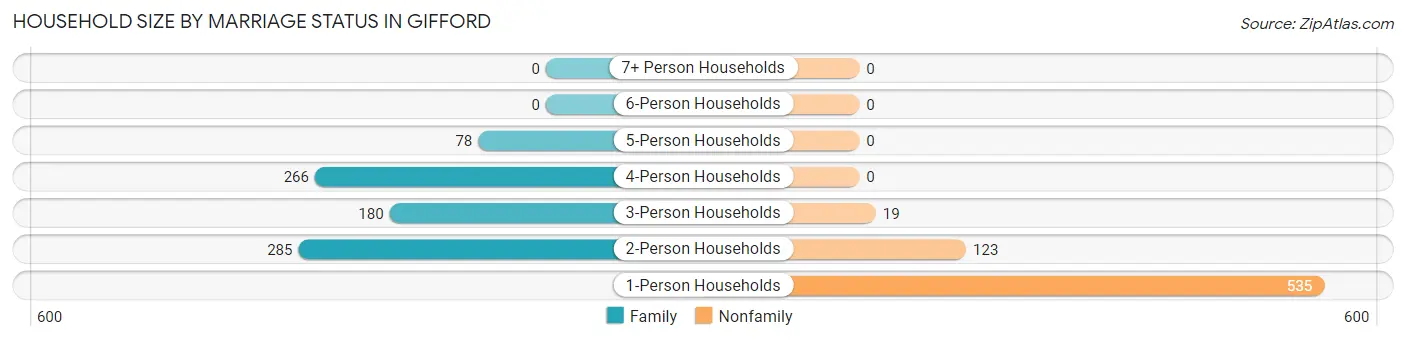
| Household Size | Family Households | Nonfamily Households |
| 1-Person Households | - | 535 (36.0%) |
| 2-Person Households | 285 (19.2%) | 123 (8.3%) |
| 3-Person Households | 180 (12.1%) | 19 (1.3%) |
| 4-Person Households | 266 (17.9%) | 0 (0.0%) |
| 5-Person Households | 78 (5.2%) | 0 (0.0%) |
| 6-Person Households | 0 (0.0%) | 0 (0.0%) |
| 7+ Person Households | 0 (0.0%) | 0 (0.0%) |
| Total | 809 (54.4%) | 677 (45.6%) |
Female Fertility in Gifford
Fertility by Age in Gifford
| Age Bracket | Women with Births | Births / 1,000 Women |
| 15 to 19 years | 0 (0.0%) | 0.0 |
| 20 to 34 years | 0 (0.0%) | 0.0 |
| 35 to 50 years | 0 (0.0%) | 0.0 |
| Total | 0 (0.0%) | 0.0 |
Fertility by Age by Marriage Status in Gifford
| Age Bracket | Married | Unmarried |
| 15 to 19 years | 0 (0.0%) | 0 (0.0%) |
| 20 to 34 years | 0 (0.0%) | 0 (0.0%) |
| 35 to 50 years | 0 (0.0%) | 0 (0.0%) |
| Total | 0 (0.0%) | 0 (0.0%) |
Fertility by Education in Gifford
| Educational Attainment | Women with Births | Births / 1,000 Women |
| Less than High School | 0 (0.0%) | 0.0 |
| High School Diploma | 0 (0.0%) | 0.0 |
| College or Associate's Degree | 0 (0.0%) | 0.0 |
| Bachelor's Degree | 0 (0.0%) | 0.0 |
| Graduate Degree | 0 (0.0%) | 0.0 |
| Total | 0 (0.0%) | 0.0 |
Fertility by Education by Marriage Status in Gifford
| Educational Attainment | Married | Unmarried |
| Less than High School | 0 (0.0%) | 0 (0.0%) |
| High School Diploma | 0 (0.0%) | 0 (0.0%) |
| College or Associate's Degree | 0 (0.0%) | 0 (0.0%) |
| Bachelor's Degree | 0 (0.0%) | 0 (0.0%) |
| Graduate Degree | 0 (0.0%) | 0 (0.0%) |
| Total | 0 (0.0%) | 0 (0.0%) |
Income in Gifford
Income Overview in Gifford
Per Capita Income in Gifford is $15,831, while median incomes of families and households are $25,195 and $23,969 respectively.
| Characteristic | Number | Measure |
| Per Capita Income | 4,868 | $15,831 |
| Median Family Income | 809 | $25,195 |
| Mean Family Income | 809 | $49,704 |
| Median Household Income | 1,486 | $23,969 |
| Mean Household Income | 1,486 | $43,424 |
| Income Deficit | 809 | $0 |
| Wage / Income Gap (%) | 4,868 | 12.61% |
| Wage / Income Gap ($) | 4,868 | 87.39¢ per $1 |
| Gini / Inequality Index | 4,868 | 0.57 |
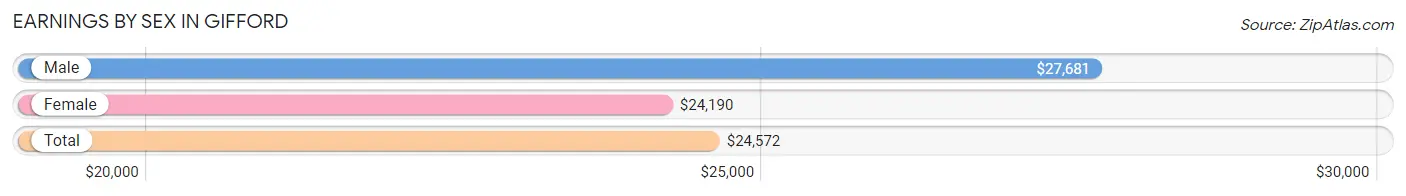
Earnings by Sex in Gifford
Average Earnings in Gifford are $24,572, $27,681 for men and $24,190 for women, a difference of 12.6%.
| Sex | Number | Average Earnings |
| Male | 673 (42.0%) | $27,681 |
| Female | 930 (58.0%) | $24,190 |
| Total | 1,603 (100.0%) | $24,572 |
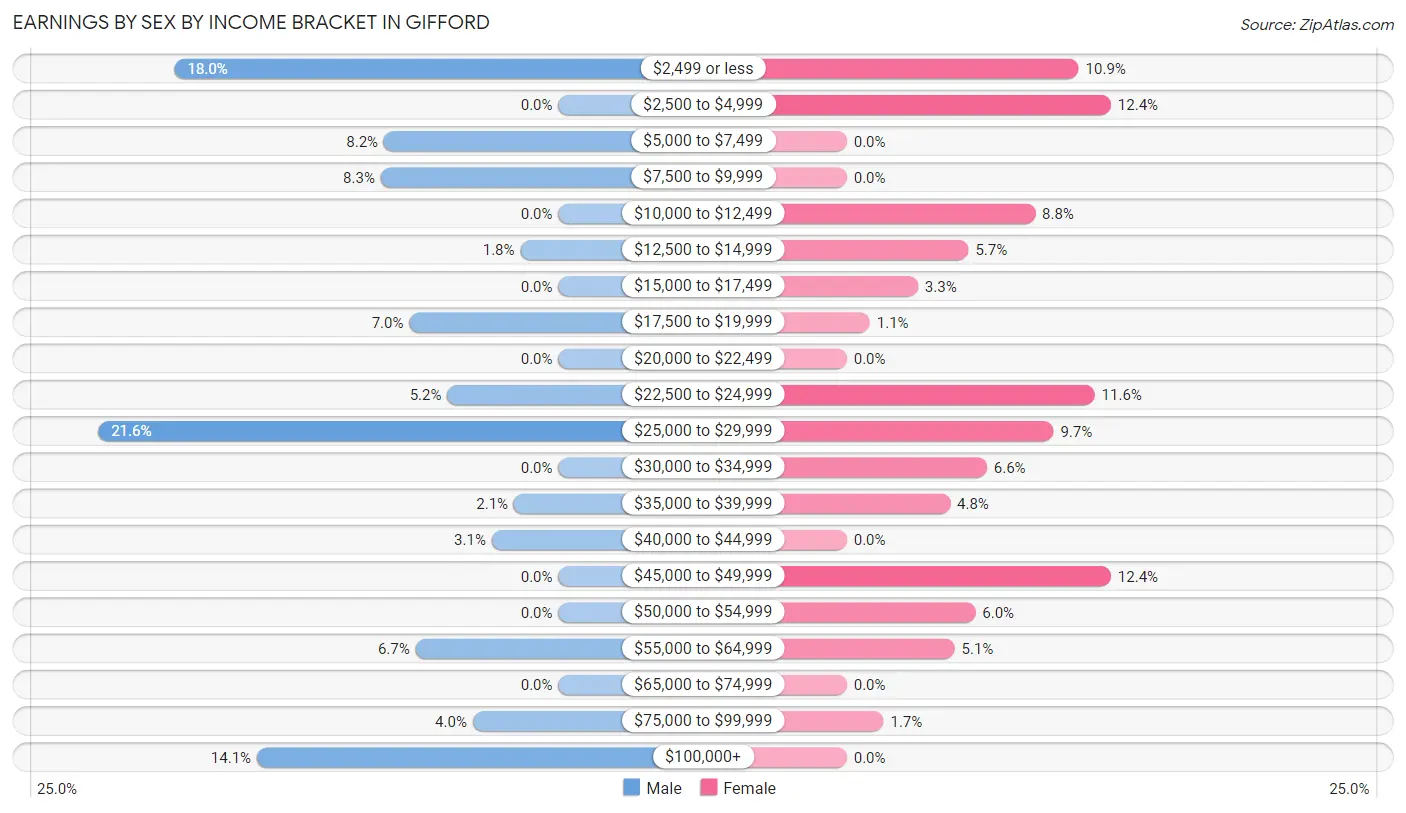
Earnings by Sex by Income Bracket in Gifford
The most common earnings brackets in Gifford are $25,000 to $29,999 for men (145 | 21.5%) and $2,500 to $4,999 for women (115 | 12.4%).
| Income | Male | Female |
| $2,499 or less | 121 (18.0%) | 101 (10.9%) |
| $2,500 to $4,999 | 0 (0.0%) | 115 (12.4%) |
| $5,000 to $7,499 | 55 (8.2%) | 0 (0.0%) |
| $7,500 to $9,999 | 56 (8.3%) | 0 (0.0%) |
| $10,000 to $12,499 | 0 (0.0%) | 82 (8.8%) |
| $12,500 to $14,999 | 12 (1.8%) | 53 (5.7%) |
| $15,000 to $17,499 | 0 (0.0%) | 31 (3.3%) |
| $17,500 to $19,999 | 47 (7.0%) | 10 (1.1%) |
| $20,000 to $22,499 | 0 (0.0%) | 0 (0.0%) |
| $22,500 to $24,999 | 35 (5.2%) | 108 (11.6%) |
| $25,000 to $29,999 | 145 (21.5%) | 90 (9.7%) |
| $30,000 to $34,999 | 0 (0.0%) | 61 (6.6%) |
| $35,000 to $39,999 | 14 (2.1%) | 45 (4.8%) |
| $40,000 to $44,999 | 21 (3.1%) | 0 (0.0%) |
| $45,000 to $49,999 | 0 (0.0%) | 115 (12.4%) |
| $50,000 to $54,999 | 0 (0.0%) | 56 (6.0%) |
| $55,000 to $64,999 | 45 (6.7%) | 47 (5.1%) |
| $65,000 to $74,999 | 0 (0.0%) | 0 (0.0%) |
| $75,000 to $99,999 | 27 (4.0%) | 16 (1.7%) |
| $100,000+ | 95 (14.1%) | 0 (0.0%) |
| Total | 673 (100.0%) | 930 (100.0%) |
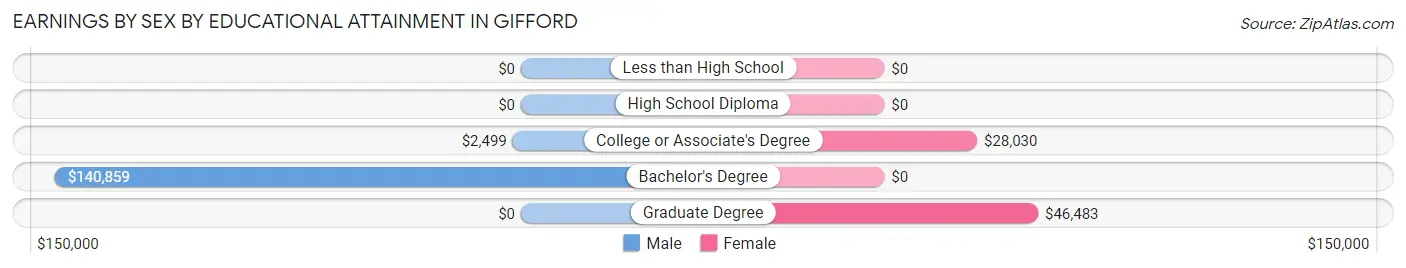
Earnings by Sex by Educational Attainment in Gifford
Average earnings in Gifford are $28,457 for men and $27,889 for women, a difference of 2.0%. Men with an educational attainment of bachelor's degree enjoy the highest average annual earnings of $140,859, while those with college or associate's degree education earn the least with $2,499. Women with an educational attainment of graduate degree earn the most with the average annual earnings of $46,483, while those with college or associate's degree education have the smallest earnings of $28,030.
| Educational Attainment | Male Income | Female Income |
| Less than High School | - | - |
| High School Diploma | - | - |
| College or Associate's Degree | $2,499 | $28,030 |
| Bachelor's Degree | $140,859 | $0 |
| Graduate Degree | - | - |
| Total | $28,457 | $27,889 |
Family Income in Gifford
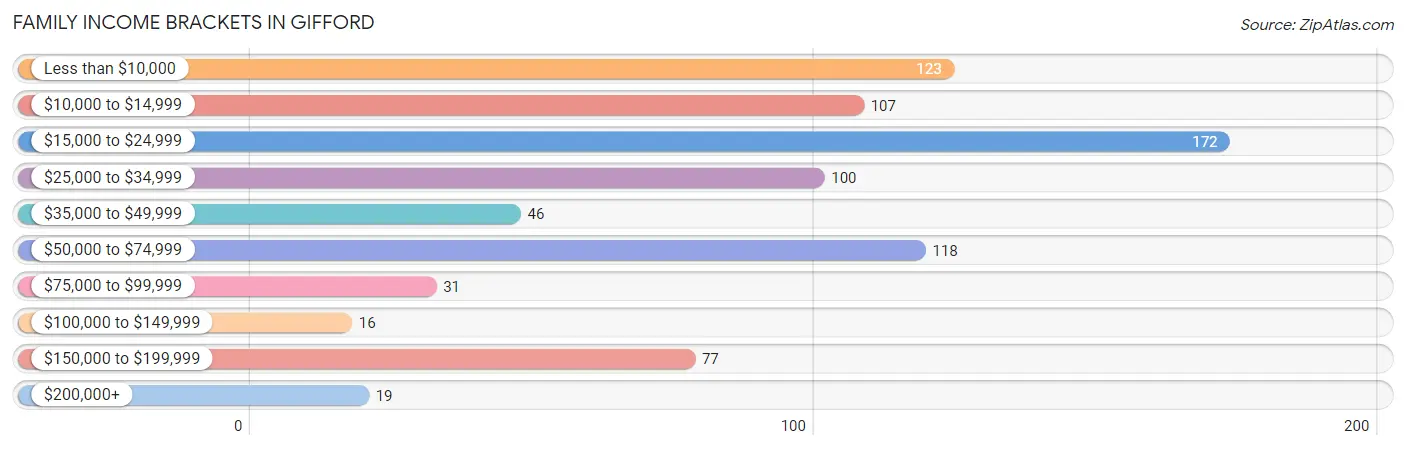
Family Income Brackets in Gifford
According to the Gifford family income data, there are 172 families falling into the $15,000 to $24,999 income range, which is the most common income bracket and makes up 21.3% of all families. Conversely, the $100,000 to $149,999 income bracket is the least frequent group with only 16 families (2.0%) belonging to this category.
| Income Bracket | # Families | % Families |
| Less than $10,000 | 123 | 15.2% |
| $10,000 to $14,999 | 107 | 13.2% |
| $15,000 to $24,999 | 172 | 21.3% |
| $25,000 to $34,999 | 100 | 12.4% |
| $35,000 to $49,999 | 46 | 5.7% |
| $50,000 to $74,999 | 118 | 14.6% |
| $75,000 to $99,999 | 31 | 3.8% |
| $100,000 to $149,999 | 16 | 2.0% |
| $150,000 to $199,999 | 77 | 9.5% |
| $200,000+ | 19 | 2.3% |
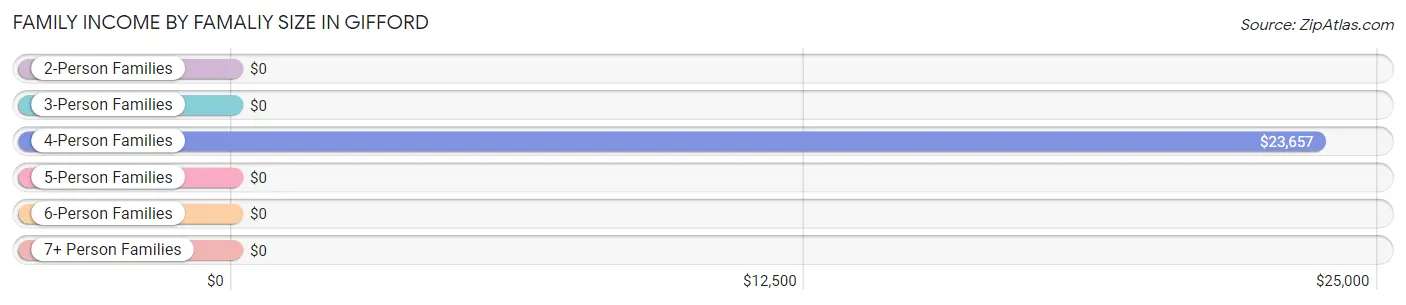
Family Income by Famaliy Size in Gifford
4-person families (266 | 32.9%) account for the highest median family income in Gifford with $23,657 per family, while 4-person families (266 | 32.9%) have the highest median income of $5,914 per family member.
| Income Bracket | # Families | Median Income |
| 2-Person Families | 285 (35.2%) | $0 |
| 3-Person Families | 180 (22.3%) | $0 |
| 4-Person Families | 266 (32.9%) | $23,657 |
| 5-Person Families | 78 (9.6%) | $0 |
| 6-Person Families | 0 (0.0%) | $0 |
| 7+ Person Families | 0 (0.0%) | $0 |
| Total | 809 (100.0%) | $25,195 |
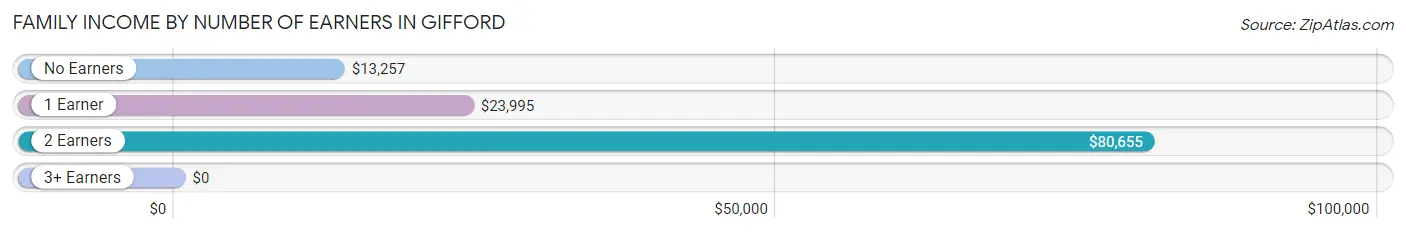
Family Income by Number of Earners in Gifford
| Number of Earners | # Families | Median Income |
| No Earners | 249 (30.8%) | $13,257 |
| 1 Earner | 283 (35.0%) | $23,995 |
| 2 Earners | 245 (30.3%) | $80,655 |
| 3+ Earners | 32 (4.0%) | $0 |
| Total | 809 (100.0%) | $25,195 |
Household Income in Gifford
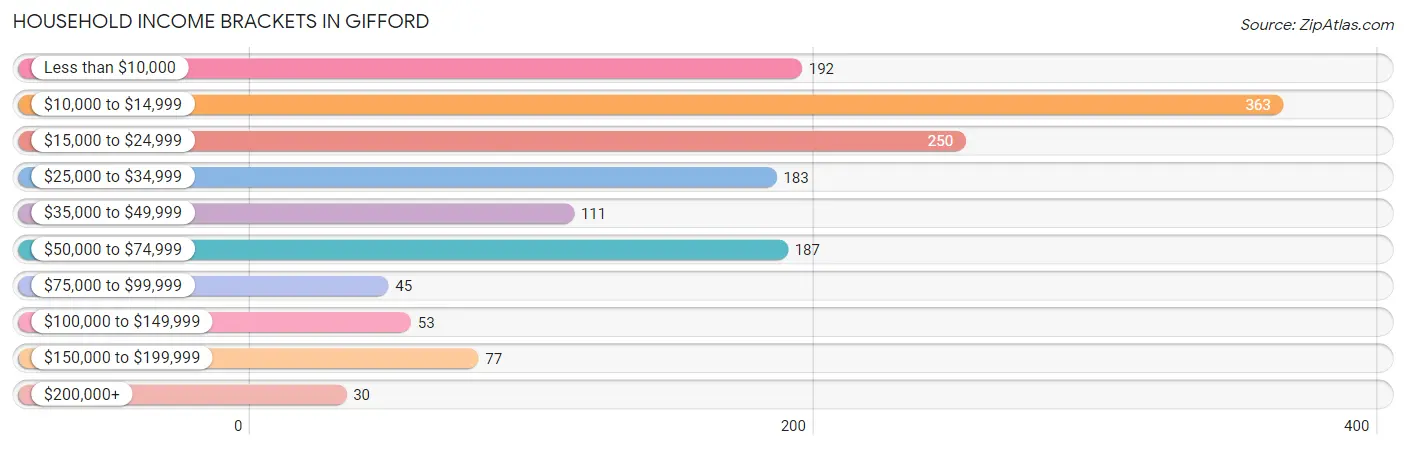
Household Income Brackets in Gifford
With 363 households falling in the category, the $10,000 to $14,999 income range is the most frequent in Gifford, accounting for 24.4% of all households. In contrast, only 30 households (2.0%) fall into the $200,000+ income bracket, making it the least populous group.
| Income Bracket | # Households | % Households |
| Less than $10,000 | 192 | 12.9% |
| $10,000 to $14,999 | 363 | 24.4% |
| $15,000 to $24,999 | 250 | 16.8% |
| $25,000 to $34,999 | 183 | 12.3% |
| $35,000 to $49,999 | 111 | 7.5% |
| $50,000 to $74,999 | 187 | 12.6% |
| $75,000 to $99,999 | 45 | 3.0% |
| $100,000 to $149,999 | 53 | 3.6% |
| $150,000 to $199,999 | 77 | 5.2% |
| $200,000+ | 30 | 2.0% |
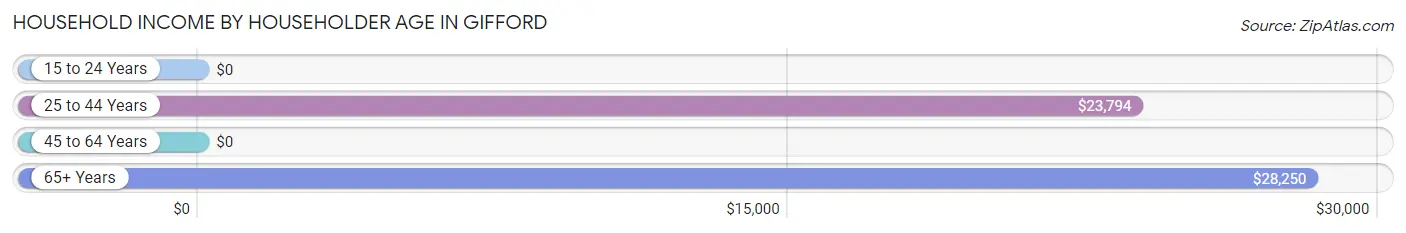
Household Income by Householder Age in Gifford
The median household income in Gifford is $23,969, with the highest median household income of $28,250 found in the 65+ years age bracket for the primary householder. A total of 367 households (24.7%) fall into this category.
| Income Bracket | # Households | Median Income |
| 15 to 24 Years | 0 (0.0%) | $0 |
| 25 to 44 Years | 492 (33.1%) | $23,794 |
| 45 to 64 Years | 627 (42.2%) | $0 |
| 65+ Years | 367 (24.7%) | $28,250 |
| Total | 1,486 (100.0%) | $23,969 |
Poverty in Gifford
Income Below Poverty by Sex and Age in Gifford
With 61.9% poverty level for males and 62.5% for females among the residents of Gifford, under 5 year old males and under 5 year old females are the most vulnerable to poverty, with 216 males (100.0%) and 119 females (100.0%) in their respective age groups living below the poverty level.
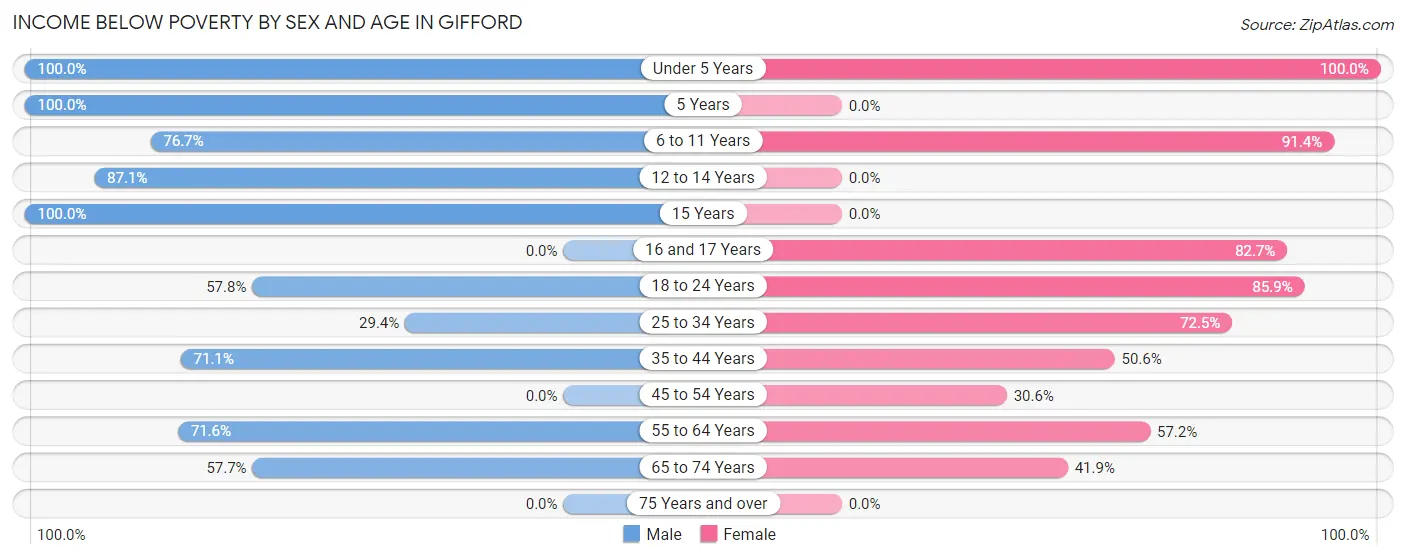
| Age Bracket | Male | Female |
| Under 5 Years | 216 (100.0%) | 119 (100.0%) |
| 5 Years | 30 (100.0%) | 0 (0.0%) |
| 6 to 11 Years | 197 (76.6%) | 560 (91.3%) |
| 12 to 14 Years | 135 (87.1%) | 0 (0.0%) |
| 15 Years | 93 (100.0%) | 0 (0.0%) |
| 16 and 17 Years | 0 (0.0%) | 62 (82.7%) |
| 18 to 24 Years | 123 (57.8%) | 152 (85.9%) |
| 25 to 34 Years | 89 (29.4%) | 200 (72.5%) |
| 35 to 44 Years | 135 (71.1%) | 204 (50.6%) |
| 45 to 54 Years | 0 (0.0%) | 101 (30.6%) |
| 55 to 64 Years | 229 (71.6%) | 202 (57.2%) |
| 65 to 74 Years | 101 (57.7%) | 65 (41.9%) |
| 75 Years and over | 0 (0.0%) | 0 (0.0%) |
| Total | 1,348 (61.9%) | 1,665 (62.5%) |
Income Above Poverty by Sex and Age in Gifford
According to the poverty statistics in Gifford, males aged 16 and 17 years and females aged 15 years are the age groups that are most secure financially, with 100.0% of males and 100.0% of females in these age groups living above the poverty line.
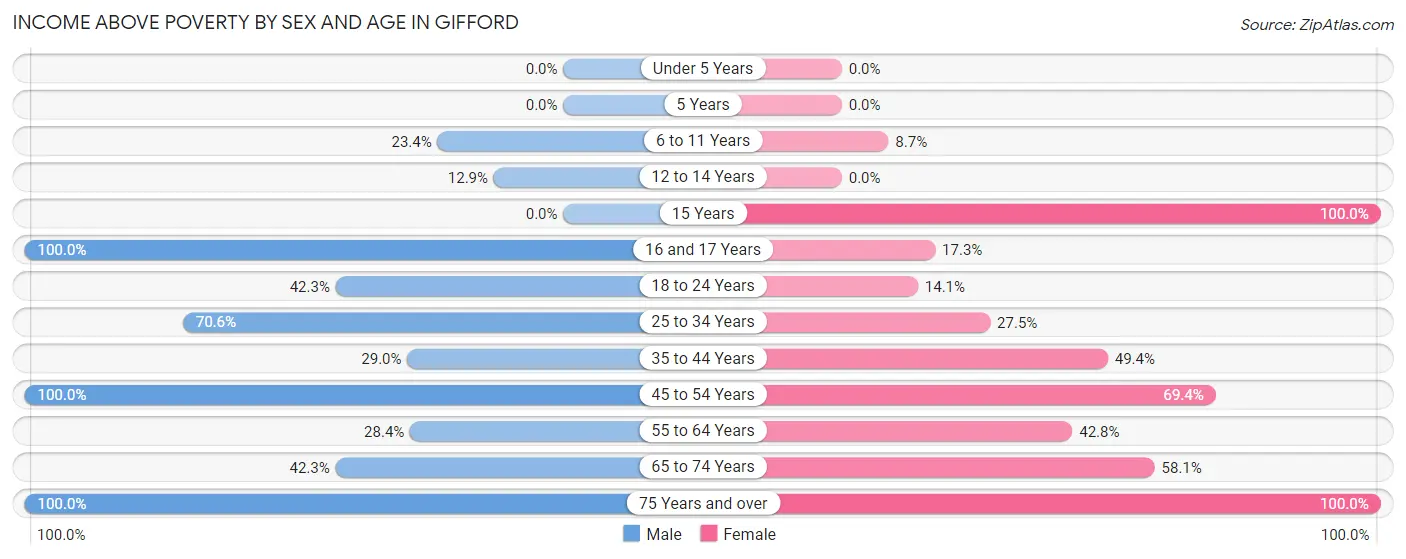
| Age Bracket | Male | Female |
| Under 5 Years | 0 (0.0%) | 0 (0.0%) |
| 5 Years | 0 (0.0%) | 0 (0.0%) |
| 6 to 11 Years | 60 (23.4%) | 53 (8.6%) |
| 12 to 14 Years | 20 (12.9%) | 0 (0.0%) |
| 15 Years | 0 (0.0%) | 28 (100.0%) |
| 16 and 17 Years | 28 (100.0%) | 13 (17.3%) |
| 18 to 24 Years | 90 (42.2%) | 25 (14.1%) |
| 25 to 34 Years | 214 (70.6%) | 76 (27.5%) |
| 35 to 44 Years | 55 (28.9%) | 199 (49.4%) |
| 45 to 54 Years | 95 (100.0%) | 229 (69.4%) |
| 55 to 64 Years | 91 (28.4%) | 151 (42.8%) |
| 65 to 74 Years | 74 (42.3%) | 90 (58.1%) |
| 75 Years and over | 104 (100.0%) | 134 (100.0%) |
| Total | 831 (38.1%) | 998 (37.5%) |
Income Below Poverty Among Married-Couple Families in Gifford
The poverty statistics for married-couple families in Gifford show that 11.2% or 29 of the total 258 families live below the poverty line. Families with 1 or 2 children have the highest poverty rate of 63.0%, comprising of 17 families. On the other hand, families with 3 or 4 children have the lowest poverty rate of 0.0%, which includes 0 families.
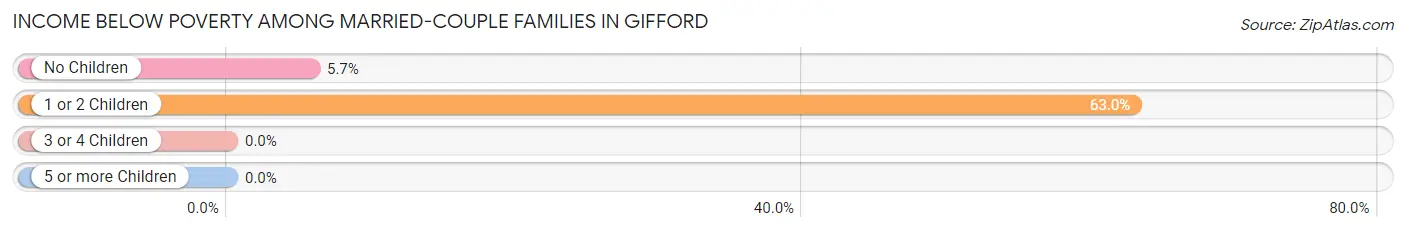
| Children | Above Poverty | Below Poverty |
| No Children | 198 (94.3%) | 12 (5.7%) |
| 1 or 2 Children | 10 (37.0%) | 17 (63.0%) |
| 3 or 4 Children | 21 (100.0%) | 0 (0.0%) |
| 5 or more Children | 0 (0.0%) | 0 (0.0%) |
| Total | 229 (88.8%) | 29 (11.2%) |
Income Below Poverty Among Single-Parent Households in Gifford
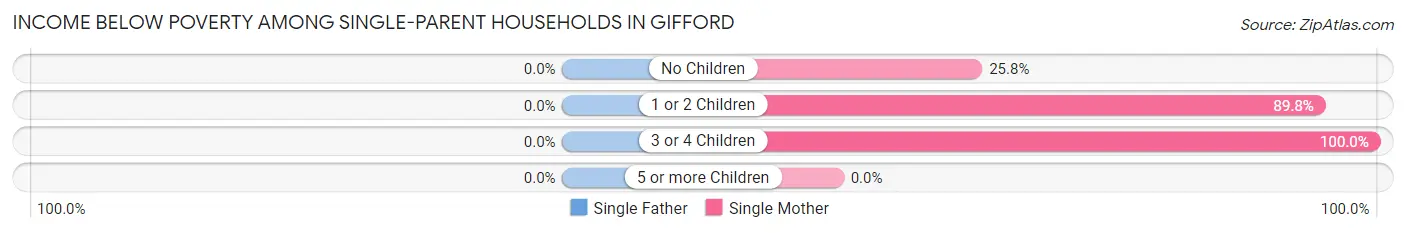
| Children | Single Father | Single Mother |
| No Children | 0 (0.0%) | 16 (25.8%) |
| 1 or 2 Children | 0 (0.0%) | 193 (89.8%) |
| 3 or 4 Children | 0 (0.0%) | 217 (100.0%) |
| 5 or more Children | 0 (0.0%) | 0 (0.0%) |
| Total | 0 (0.0%) | 426 (86.2%) |
Income Below Poverty Among Married-Couple vs Single-Parent Households in Gifford
The poverty data for Gifford shows that 29 of the married-couple family households (11.2%) and 426 of the single-parent households (77.3%) are living below the poverty level. Within the married-couple family households, those with 1 or 2 children have the highest poverty rate, with 17 households (63.0%) falling below the poverty line. Among the single-parent households, those with 3 or 4 children have the highest poverty rate, with 217 household (100.0%) living below poverty.
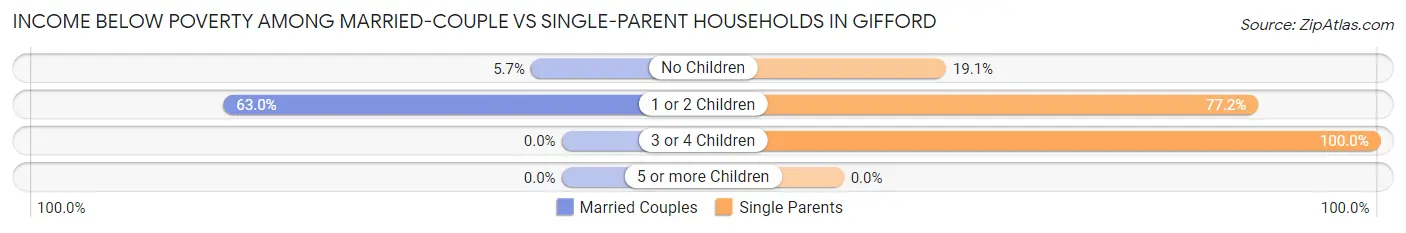
| Children | Married-Couple Families | Single-Parent Households |
| No Children | 12 (5.7%) | 16 (19.1%) |
| 1 or 2 Children | 17 (63.0%) | 193 (77.2%) |
| 3 or 4 Children | 0 (0.0%) | 217 (100.0%) |
| 5 or more Children | 0 (0.0%) | 0 (0.0%) |
| Total | 29 (11.2%) | 426 (77.3%) |
Employment Characteristics in Gifford
Employment by Class of Employer in Gifford
Among the 1,344 employed individuals in Gifford, private company employees (1,023 | 76.1%), not-for-profit organizations (116 | 8.6%), and state government employees (86 | 6.4%) make up the most common classes of employment.
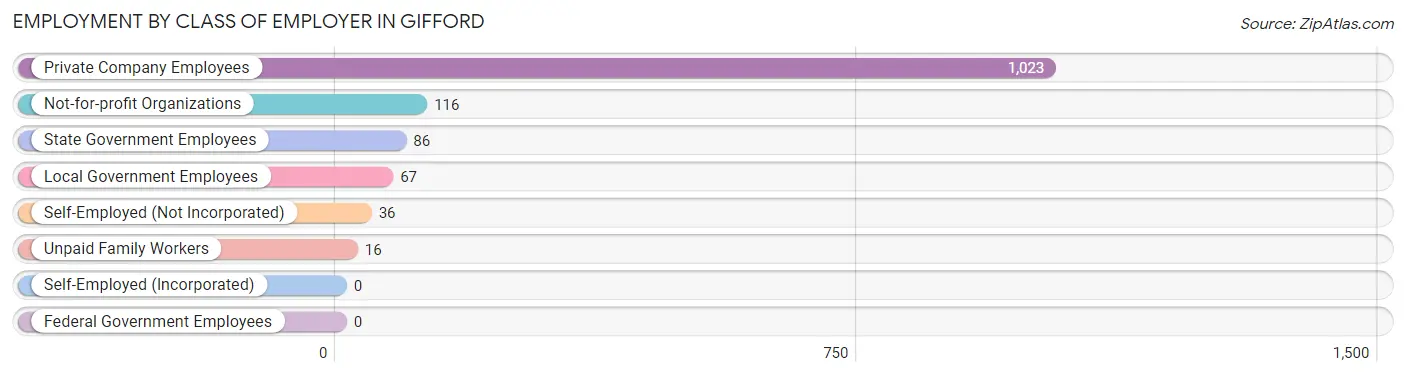
| Employer Class | # Employees | % Employees |
| Private Company Employees | 1,023 | 76.1% |
| Self-Employed (Incorporated) | 0 | 0.0% |
| Self-Employed (Not Incorporated) | 36 | 2.7% |
| Not-for-profit Organizations | 116 | 8.6% |
| Local Government Employees | 67 | 5.0% |
| State Government Employees | 86 | 6.4% |
| Federal Government Employees | 0 | 0.0% |
| Unpaid Family Workers | 16 | 1.2% |
| Total | 1,344 | 100.0% |
Employment Status by Age in Gifford
According to the labor force statistics for Gifford, out of the total population over 16 years of age (3,331), 52.4% or 1,745 individuals are in the labor force, with 12.8% or 223 of them unemployed. The age group with the highest labor force participation rate is 30 to 34 years, with 100.0% or 213 individuals in the labor force. Within the labor force, the 16 to 19 years age range has the highest percentage of unemployed individuals, with 80.9% or 123 of them being unemployed.
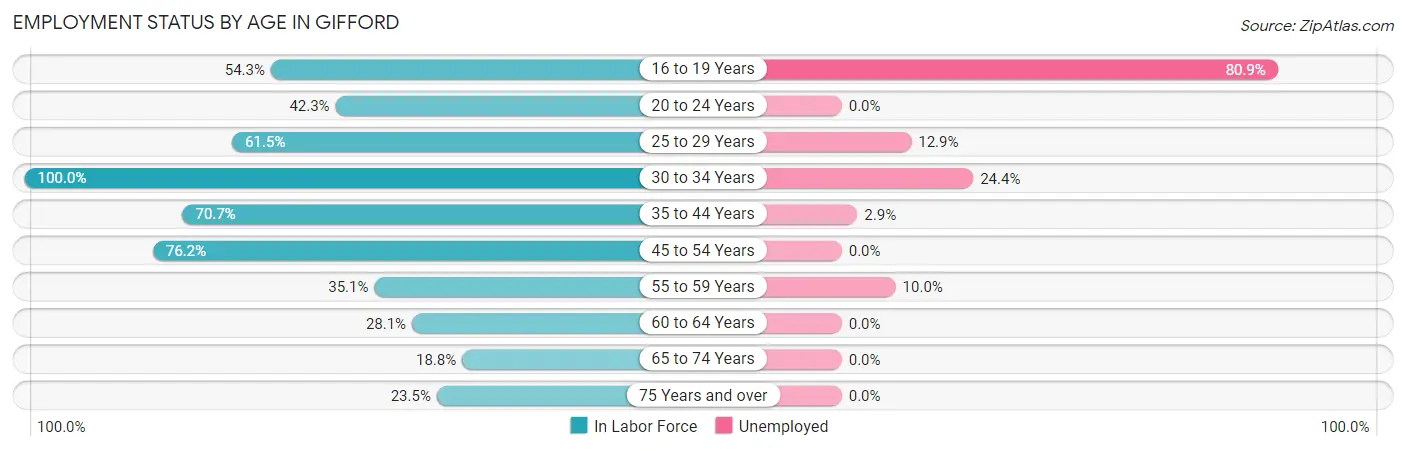
| Age Bracket | In Labor Force | Unemployed |
| 16 to 19 Years | 152 (54.3%) | 123 (80.9%) |
| 20 to 24 Years | 90 (42.3%) | 0 (0.0%) |
| 25 to 29 Years | 225 (61.5%) | 29 (12.9%) |
| 30 to 34 Years | 213 (100.0%) | 52 (24.4%) |
| 35 to 44 Years | 419 (70.7%) | 12 (2.9%) |
| 45 to 54 Years | 324 (76.2%) | 0 (0.0%) |
| 55 to 59 Years | 80 (35.1%) | 8 (10.0%) |
| 60 to 64 Years | 125 (28.1%) | 0 (0.0%) |
| 65 to 74 Years | 62 (18.8%) | 0 (0.0%) |
| 75 Years and over | 56 (23.5%) | 0 (0.0%) |
| Total | 1,745 (52.4%) | 223 (12.8%) |
Employment Status by Educational Attainment in Gifford
According to labor force statistics for Gifford, 61.1% of individuals (1,387) out of the total population between 25 and 64 years of age (2,270) are in the labor force, with 7.3% or 101 of them being unemployed. The group with the highest labor force participation rate are those with the educational attainment of bachelor's degree or higher, with 76.8% or 288 individuals in the labor force. Within the labor force, individuals with high school diploma education have the highest percentage of unemployment, with 13.6% or 81 of them being unemployed.
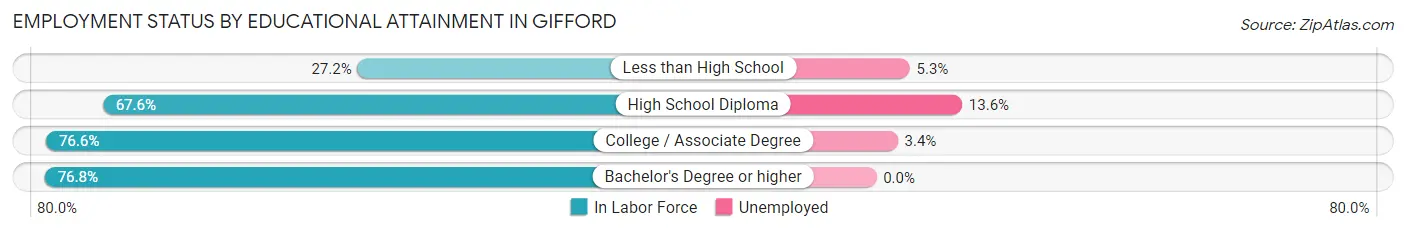
| Educational Attainment | In Labor Force | Unemployed |
| Less than High School | 151 (27.2%) | 29 (5.3%) |
| High School Diploma | 594 (67.6%) | 120 (13.6%) |
| College / Associate Degree | 353 (76.6%) | 16 (3.4%) |
| Bachelor's Degree or higher | 288 (76.8%) | 0 (0.0%) |
| Total | 1,387 (61.1%) | 166 (7.3%) |
Employment Occupations by Sex in Gifford
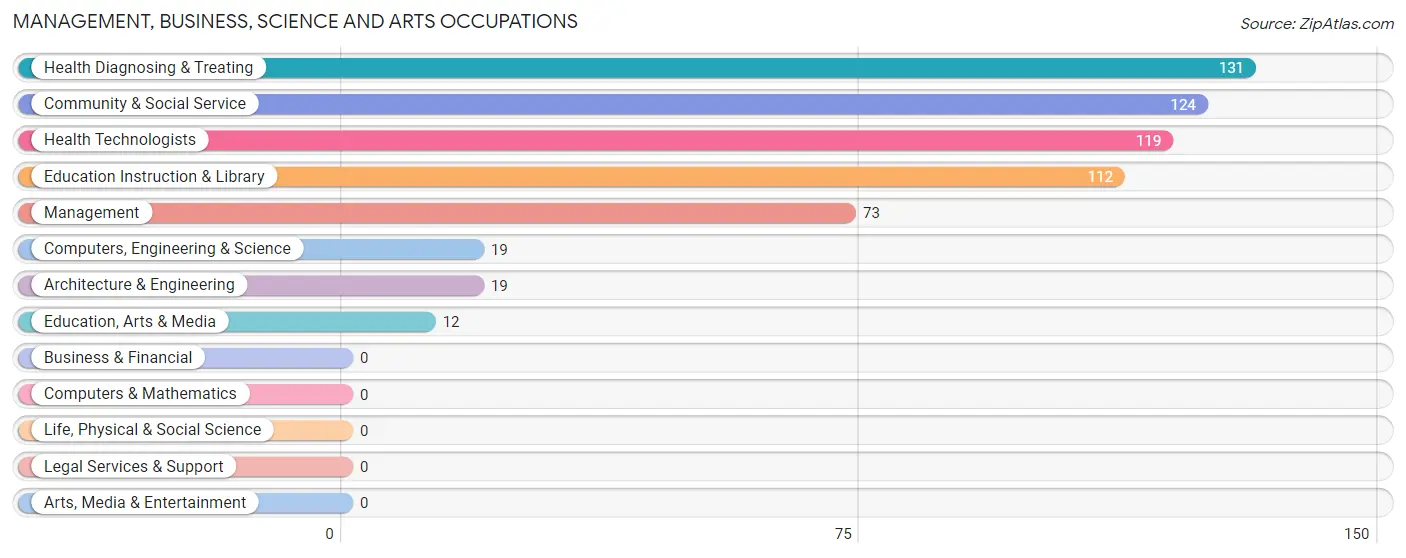
Management, Business, Science and Arts Occupations
The most common Management, Business, Science and Arts occupations in Gifford are Health Diagnosing & Treating (131 | 8.6%), Community & Social Service (124 | 8.2%), Health Technologists (119 | 7.8%), Education Instruction & Library (112 | 7.4%), and Management (73 | 4.8%).
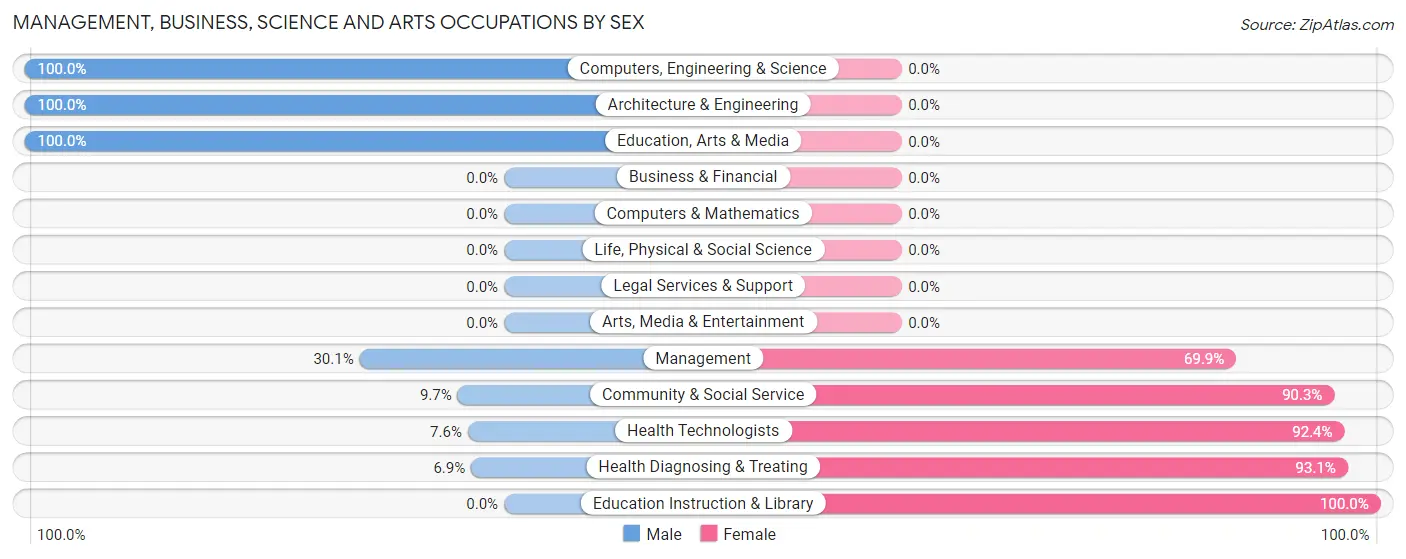
Management, Business, Science and Arts Occupations by Sex
Within the Management, Business, Science and Arts occupations in Gifford, the most male-oriented occupations are Computers, Engineering & Science (100.0%), Architecture & Engineering (100.0%), and Education, Arts & Media (100.0%), while the most female-oriented occupations are Education Instruction & Library (100.0%), Health Diagnosing & Treating (93.1%), and Health Technologists (92.4%).
| Occupation | Male | Female |
| Management | 22 (30.1%) | 51 (69.9%) |
| Business & Financial | 0 (0.0%) | 0 (0.0%) |
| Computers, Engineering & Science | 19 (100.0%) | 0 (0.0%) |
| Computers & Mathematics | 0 (0.0%) | 0 (0.0%) |
| Architecture & Engineering | 19 (100.0%) | 0 (0.0%) |
| Life, Physical & Social Science | 0 (0.0%) | 0 (0.0%) |
| Community & Social Service | 12 (9.7%) | 112 (90.3%) |
| Education, Arts & Media | 12 (100.0%) | 0 (0.0%) |
| Legal Services & Support | 0 (0.0%) | 0 (0.0%) |
| Education Instruction & Library | 0 (0.0%) | 112 (100.0%) |
| Arts, Media & Entertainment | 0 (0.0%) | 0 (0.0%) |
| Health Diagnosing & Treating | 9 (6.9%) | 122 (93.1%) |
| Health Technologists | 9 (7.6%) | 110 (92.4%) |
| Total (Category) | 62 (17.9%) | 285 (82.1%) |
| Total (Overall) | 661 (43.4%) | 861 (56.6%) |
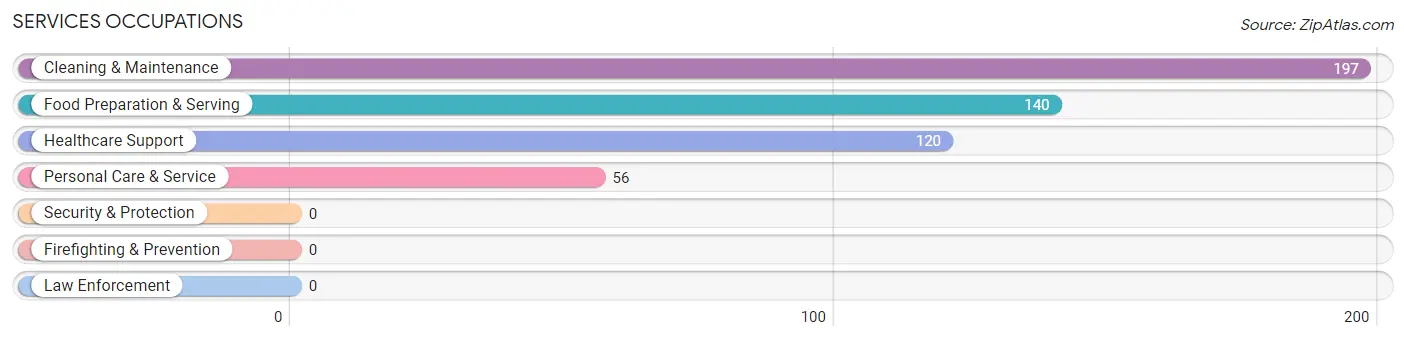
Services Occupations
The most common Services occupations in Gifford are Cleaning & Maintenance (197 | 12.9%), Food Preparation & Serving (140 | 9.2%), Healthcare Support (120 | 7.9%), and Personal Care & Service (56 | 3.7%).
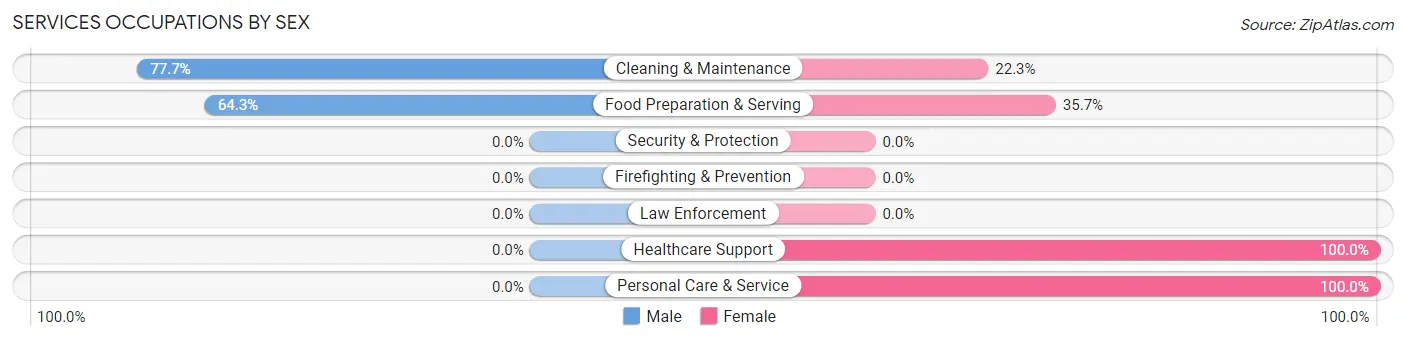
Services Occupations by Sex
Within the Services occupations in Gifford, the most male-oriented occupations are Cleaning & Maintenance (77.7%), and Food Preparation & Serving (64.3%), while the most female-oriented occupations are Healthcare Support (100.0%), Personal Care & Service (100.0%), and Food Preparation & Serving (35.7%).
| Occupation | Male | Female |
| Healthcare Support | 0 (0.0%) | 120 (100.0%) |
| Security & Protection | 0 (0.0%) | 0 (0.0%) |
| Firefighting & Prevention | 0 (0.0%) | 0 (0.0%) |
| Law Enforcement | 0 (0.0%) | 0 (0.0%) |
| Food Preparation & Serving | 90 (64.3%) | 50 (35.7%) |
| Cleaning & Maintenance | 153 (77.7%) | 44 (22.3%) |
| Personal Care & Service | 0 (0.0%) | 56 (100.0%) |
| Total (Category) | 243 (47.4%) | 270 (52.6%) |
| Total (Overall) | 661 (43.4%) | 861 (56.6%) |
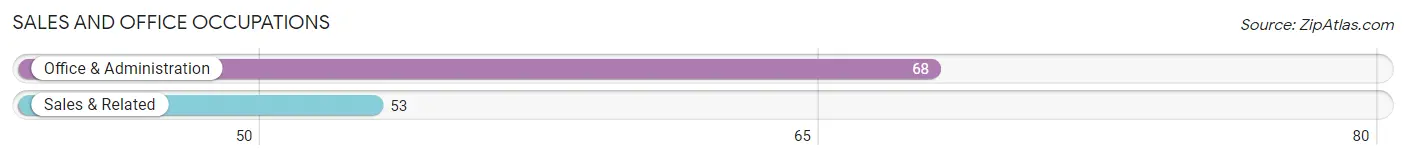
Sales and Office Occupations
The most common Sales and Office occupations in Gifford are Office & Administration (68 | 4.5%), and Sales & Related (53 | 3.5%).
Sales and Office Occupations by Sex
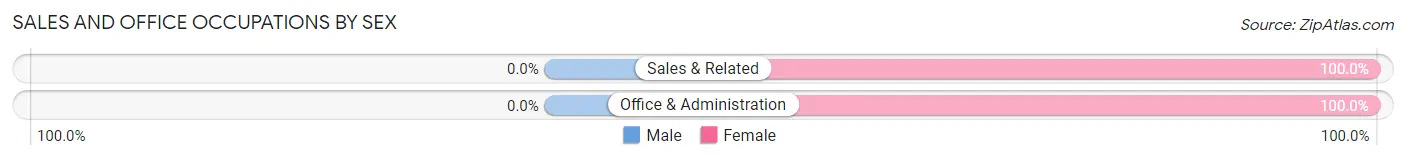
| Occupation | Male | Female |
| Sales & Related | 0 (0.0%) | 53 (100.0%) |
| Office & Administration | 0 (0.0%) | 68 (100.0%) |
| Total (Category) | 0 (0.0%) | 121 (100.0%) |
| Total (Overall) | 661 (43.4%) | 861 (56.6%) |
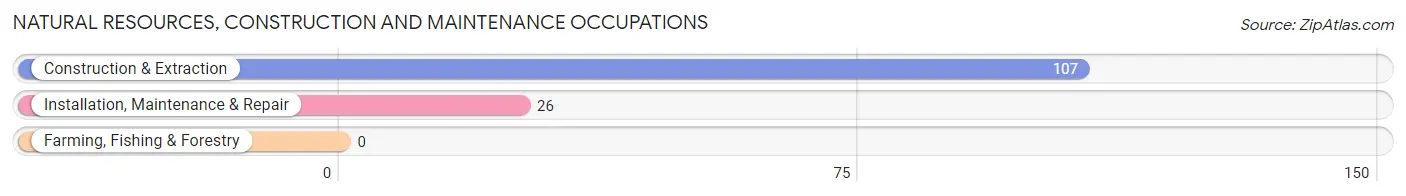
Natural Resources, Construction and Maintenance Occupations
The most common Natural Resources, Construction and Maintenance occupations in Gifford are Construction & Extraction (107 | 7.0%), and Installation, Maintenance & Repair (26 | 1.7%).
Natural Resources, Construction and Maintenance Occupations by Sex
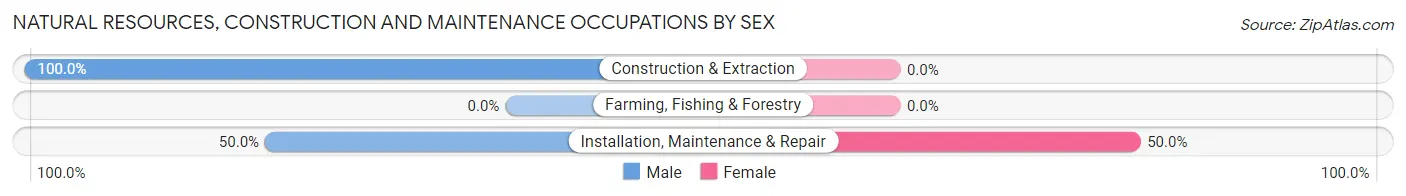
| Occupation | Male | Female |
| Farming, Fishing & Forestry | 0 (0.0%) | 0 (0.0%) |
| Construction & Extraction | 107 (100.0%) | 0 (0.0%) |
| Installation, Maintenance & Repair | 13 (50.0%) | 13 (50.0%) |
| Total (Category) | 120 (90.2%) | 13 (9.8%) |
| Total (Overall) | 661 (43.4%) | 861 (56.6%) |
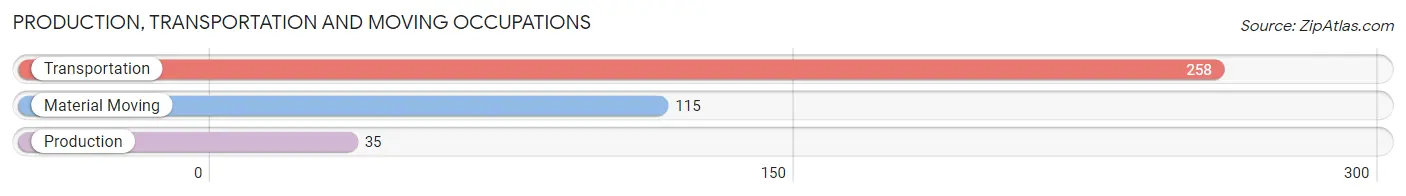
Production, Transportation and Moving Occupations
The most common Production, Transportation and Moving occupations in Gifford are Transportation (258 | 17.0%), Material Moving (115 | 7.6%), and Production (35 | 2.3%).
Production, Transportation and Moving Occupations by Sex
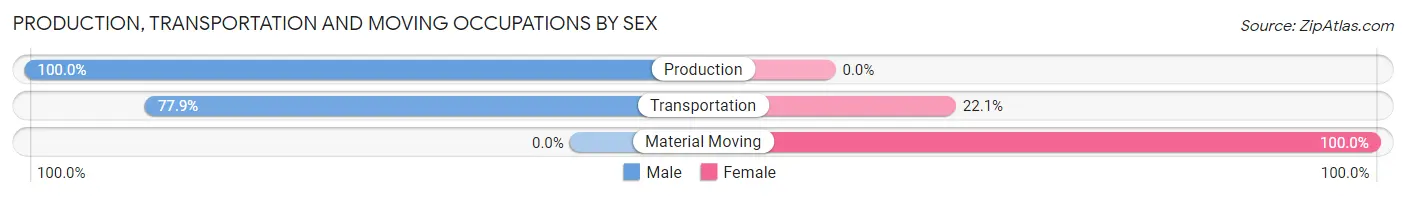
| Occupation | Male | Female |
| Production | 35 (100.0%) | 0 (0.0%) |
| Transportation | 201 (77.9%) | 57 (22.1%) |
| Material Moving | 0 (0.0%) | 115 (100.0%) |
| Total (Category) | 236 (57.8%) | 172 (42.2%) |
| Total (Overall) | 661 (43.4%) | 861 (56.6%) |
Employment Industries by Sex in Gifford
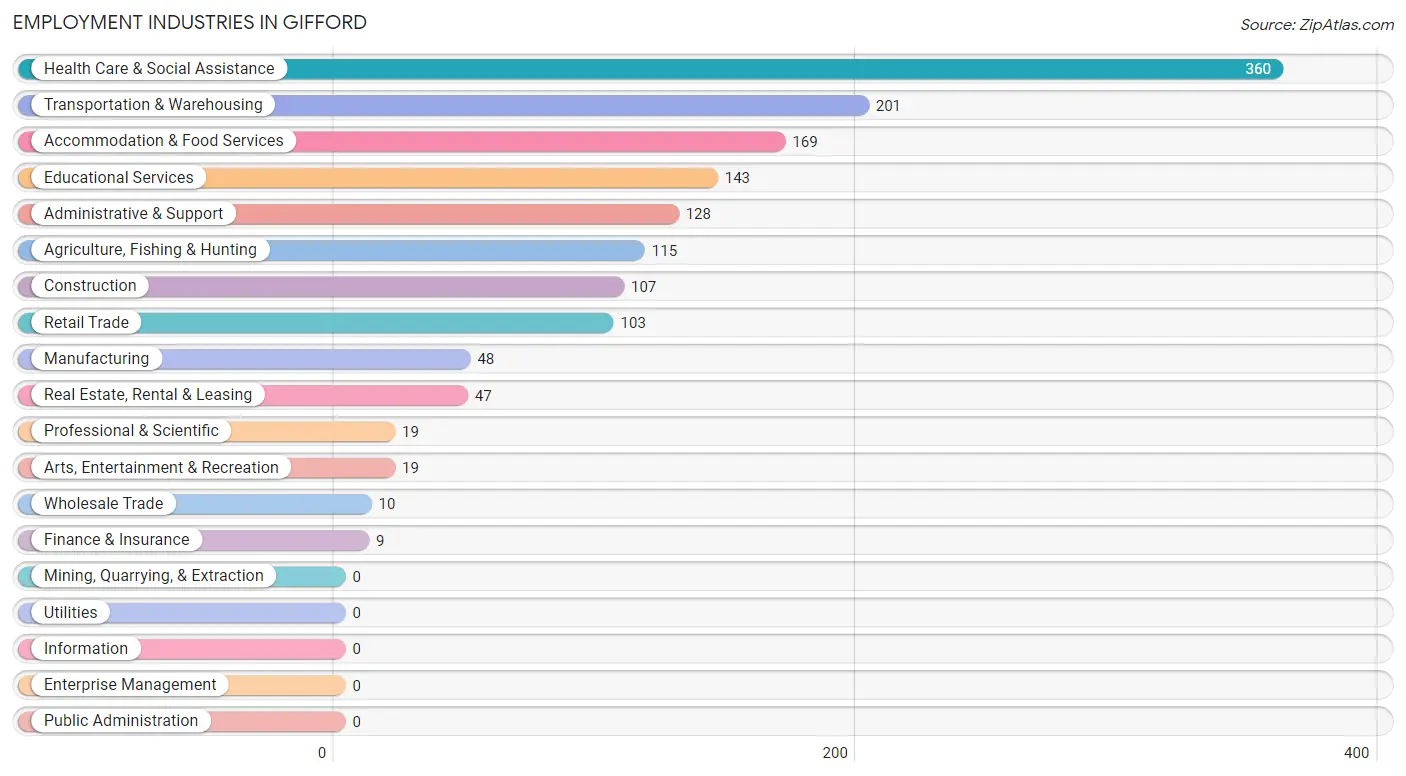
Employment Industries in Gifford
The major employment industries in Gifford include Health Care & Social Assistance (360 | 23.6%), Transportation & Warehousing (201 | 13.2%), Accommodation & Food Services (169 | 11.1%), Educational Services (143 | 9.4%), and Administrative & Support (128 | 8.4%).
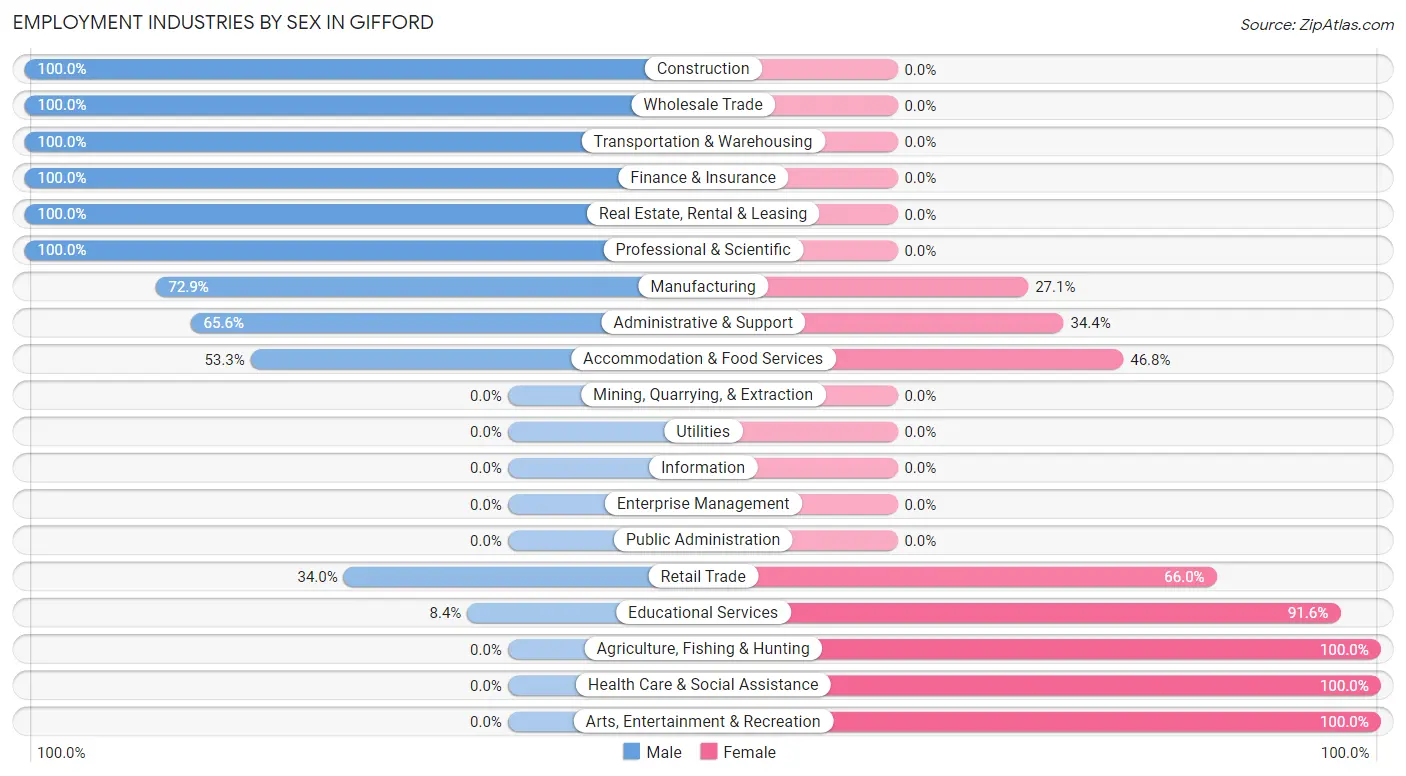
Employment Industries by Sex in Gifford
The Gifford industries that see more men than women are Construction (100.0%), Wholesale Trade (100.0%), and Transportation & Warehousing (100.0%), whereas the industries that tend to have a higher number of women are Agriculture, Fishing & Hunting (100.0%), Health Care & Social Assistance (100.0%), and Arts, Entertainment & Recreation (100.0%).
| Industry | Male | Female |
| Agriculture, Fishing & Hunting | 0 (0.0%) | 115 (100.0%) |
| Mining, Quarrying, & Extraction | 0 (0.0%) | 0 (0.0%) |
| Construction | 107 (100.0%) | 0 (0.0%) |
| Manufacturing | 35 (72.9%) | 13 (27.1%) |
| Wholesale Trade | 10 (100.0%) | 0 (0.0%) |
| Retail Trade | 35 (34.0%) | 68 (66.0%) |
| Transportation & Warehousing | 201 (100.0%) | 0 (0.0%) |
| Utilities | 0 (0.0%) | 0 (0.0%) |
| Information | 0 (0.0%) | 0 (0.0%) |
| Finance & Insurance | 9 (100.0%) | 0 (0.0%) |
| Real Estate, Rental & Leasing | 47 (100.0%) | 0 (0.0%) |
| Professional & Scientific | 19 (100.0%) | 0 (0.0%) |
| Enterprise Management | 0 (0.0%) | 0 (0.0%) |
| Administrative & Support | 84 (65.6%) | 44 (34.4%) |
| Educational Services | 12 (8.4%) | 131 (91.6%) |
| Health Care & Social Assistance | 0 (0.0%) | 360 (100.0%) |
| Arts, Entertainment & Recreation | 0 (0.0%) | 19 (100.0%) |
| Accommodation & Food Services | 90 (53.2%) | 79 (46.8%) |
| Public Administration | 0 (0.0%) | 0 (0.0%) |
| Total | 661 (43.4%) | 861 (56.6%) |
Education in Gifford
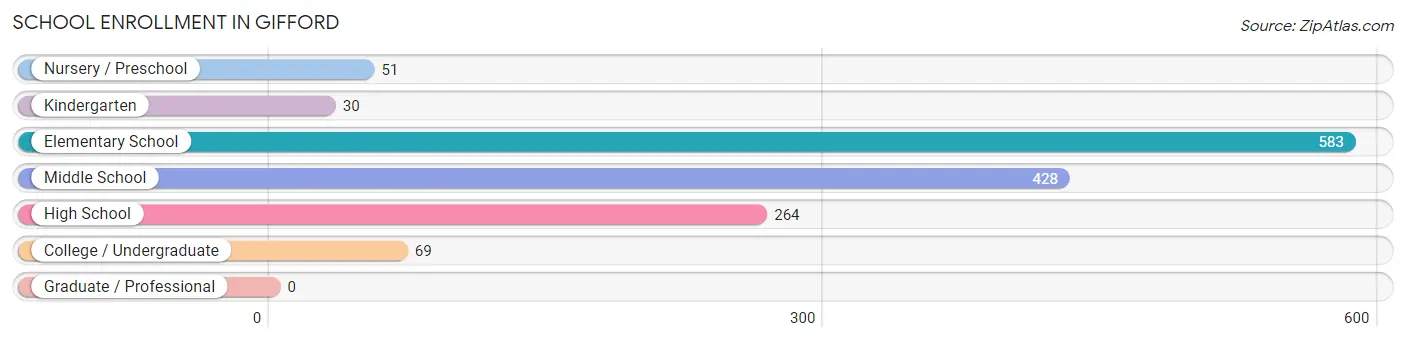
School Enrollment in Gifford
The most common levels of schooling among the 1,425 students in Gifford are elementary school (583 | 40.9%), middle school (428 | 30.0%), and high school (264 | 18.5%).
| School Level | # Students | % Students |
| Nursery / Preschool | 51 | 3.6% |
| Kindergarten | 30 | 2.1% |
| Elementary School | 583 | 40.9% |
| Middle School | 428 | 30.0% |
| High School | 264 | 18.5% |
| College / Undergraduate | 69 | 4.8% |
| Graduate / Professional | 0 | 0.0% |
| Total | 1,425 | 100.0% |
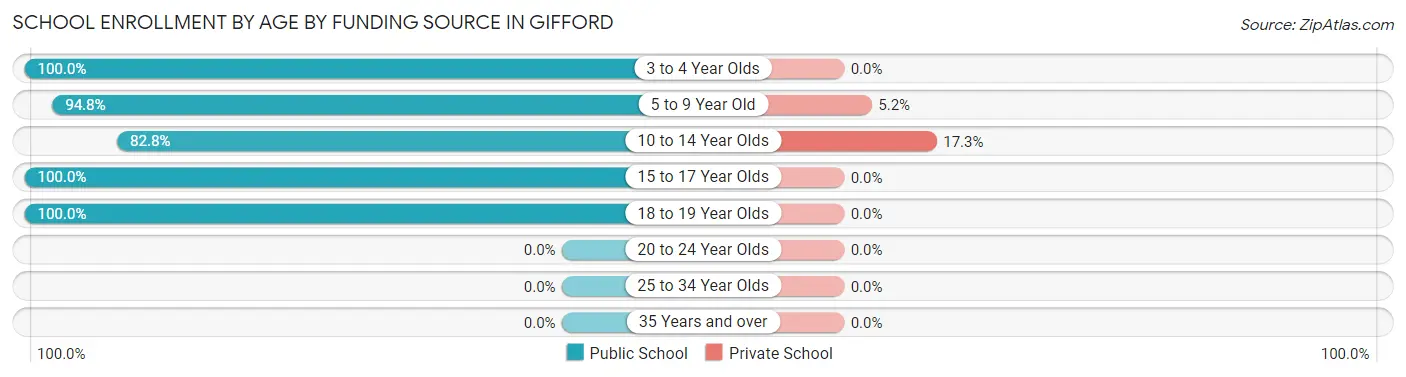
School Enrollment by Age by Funding Source in Gifford
Out of a total of 1,425 students who are enrolled in schools in Gifford, 135 (9.5%) attend a private institution, while the remaining 1,290 (90.5%) are enrolled in public schools. The age group of 10 to 14 year olds has the highest likelihood of being enrolled in private schools, with 113 (17.2% in the age bracket) enrolled. Conversely, the age group of 3 to 4 year olds has the lowest likelihood of being enrolled in a private school, with 51 (100.0% in the age bracket) attending a public institution.
| Age Bracket | Public School | Private School |
| 3 to 4 Year Olds | 51 (100.0%) | 0 (0.0%) |
| 5 to 9 Year Old | 404 (94.8%) | 22 (5.2%) |
| 10 to 14 Year Olds | 542 (82.8%) | 113 (17.2%) |
| 15 to 17 Year Olds | 224 (100.0%) | 0 (0.0%) |
| 18 to 19 Year Olds | 69 (100.0%) | 0 (0.0%) |
| 20 to 24 Year Olds | 0 (0.0%) | 0 (0.0%) |
| 25 to 34 Year Olds | 0 (0.0%) | 0 (0.0%) |
| 35 Years and over | 0 (0.0%) | 0 (0.0%) |
| Total | 1,290 (90.5%) | 135 (9.5%) |
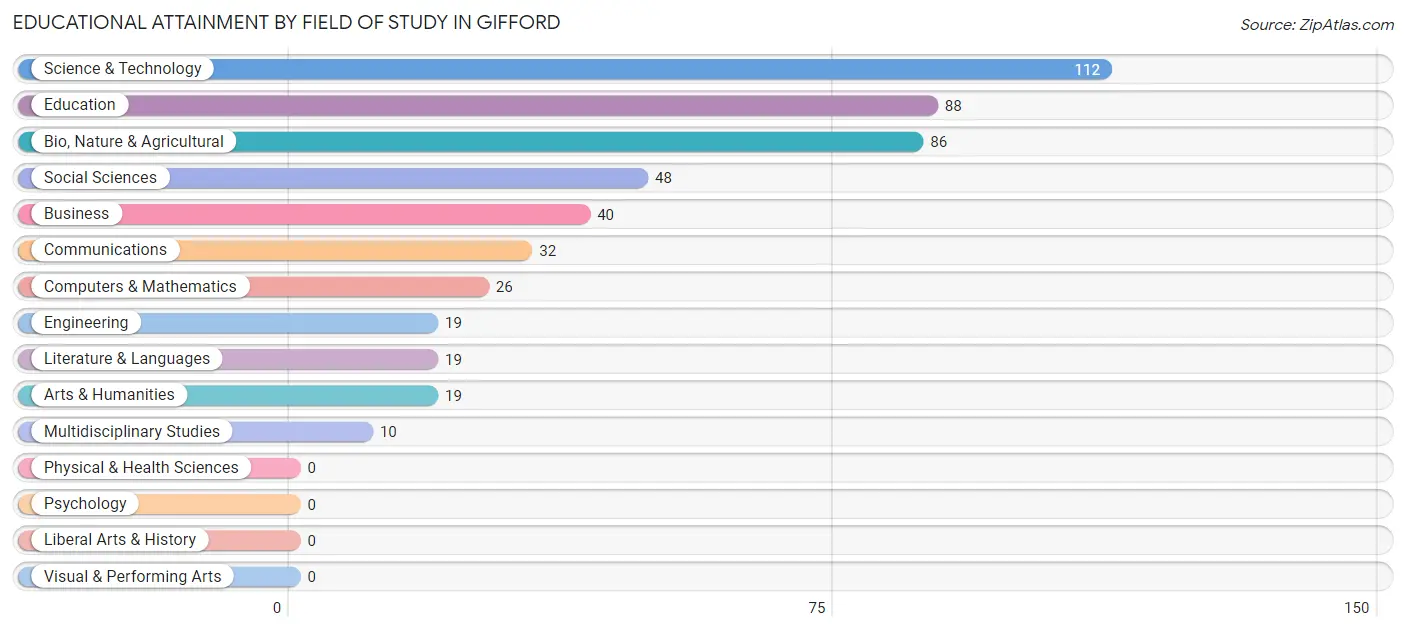
Educational Attainment by Field of Study in Gifford
Science & technology (112 | 22.4%), education (88 | 17.6%), bio, nature & agricultural (86 | 17.2%), social sciences (48 | 9.6%), and business (40 | 8.0%) are the most common fields of study among 499 individuals in Gifford who have obtained a bachelor's degree or higher.
| Field of Study | # Graduates | % Graduates |
| Computers & Mathematics | 26 | 5.2% |
| Bio, Nature & Agricultural | 86 | 17.2% |
| Physical & Health Sciences | 0 | 0.0% |
| Psychology | 0 | 0.0% |
| Social Sciences | 48 | 9.6% |
| Engineering | 19 | 3.8% |
| Multidisciplinary Studies | 10 | 2.0% |
| Science & Technology | 112 | 22.4% |
| Business | 40 | 8.0% |
| Education | 88 | 17.6% |
| Literature & Languages | 19 | 3.8% |
| Liberal Arts & History | 0 | 0.0% |
| Visual & Performing Arts | 0 | 0.0% |
| Communications | 32 | 6.4% |
| Arts & Humanities | 19 | 3.8% |
| Total | 499 | 100.0% |
Transportation & Commute in Gifford
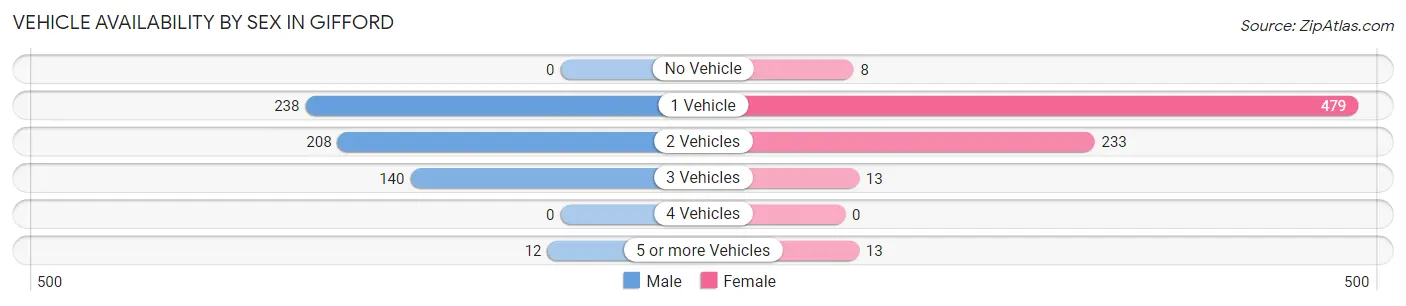
Vehicle Availability by Sex in Gifford
The most prevalent vehicle ownership categories in Gifford are males with 1 vehicle (238, accounting for 39.8%) and females with 1 vehicle (479, making up 31.9%).
| Vehicles Available | Male | Female |
| No Vehicle | 0 (0.0%) | 8 (1.1%) |
| 1 Vehicle | 238 (39.8%) | 479 (64.2%) |
| 2 Vehicles | 208 (34.8%) | 233 (31.2%) |
| 3 Vehicles | 140 (23.4%) | 13 (1.7%) |
| 4 Vehicles | 0 (0.0%) | 0 (0.0%) |
| 5 or more Vehicles | 12 (2.0%) | 13 (1.7%) |
| Total | 598 (100.0%) | 746 (100.0%) |
Commute Time in Gifford
The most frequently occuring commute durations in Gifford are 5 to 9 minutes (349 commuters, 27.4%), 15 to 19 minutes (343 commuters, 27.0%), and 20 to 24 minutes (223 commuters, 17.5%).
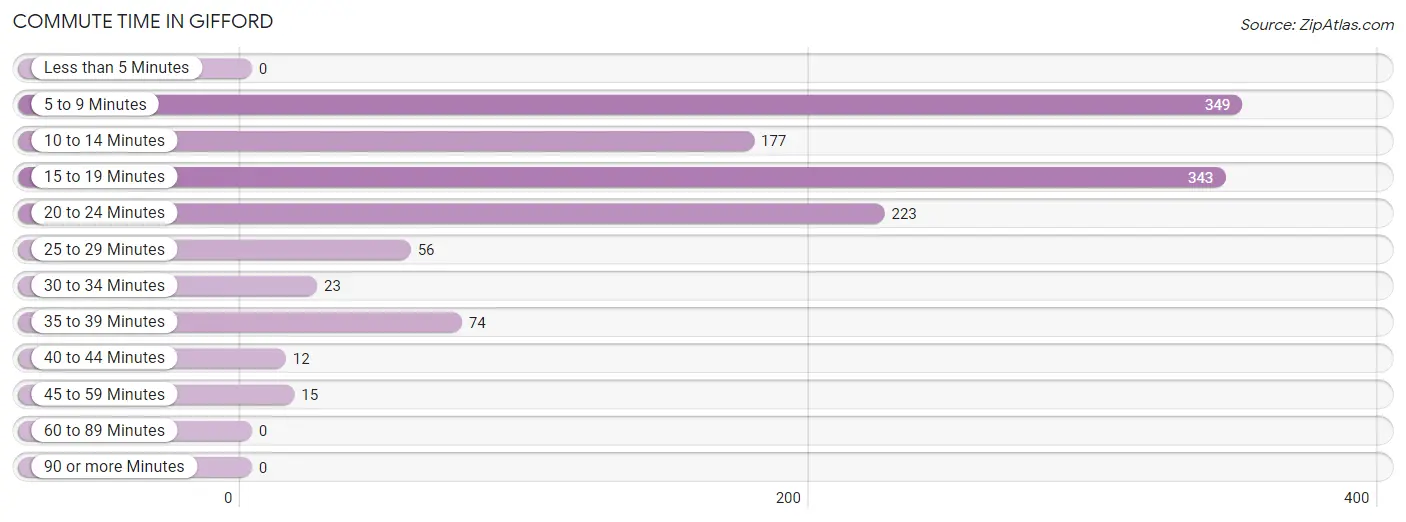
| Commute Time | # Commuters | % Commuters |
| Less than 5 Minutes | 0 | 0.0% |
| 5 to 9 Minutes | 349 | 27.4% |
| 10 to 14 Minutes | 177 | 13.9% |
| 15 to 19 Minutes | 343 | 27.0% |
| 20 to 24 Minutes | 223 | 17.5% |
| 25 to 29 Minutes | 56 | 4.4% |
| 30 to 34 Minutes | 23 | 1.8% |
| 35 to 39 Minutes | 74 | 5.8% |
| 40 to 44 Minutes | 12 | 0.9% |
| 45 to 59 Minutes | 15 | 1.2% |
| 60 to 89 Minutes | 0 | 0.0% |
| 90 or more Minutes | 0 | 0.0% |
Commute Time by Sex in Gifford
The most common commute times in Gifford are 15 to 19 minutes (244 commuters, 42.1%) for males and 5 to 9 minutes (298 commuters, 43.0%) for females.
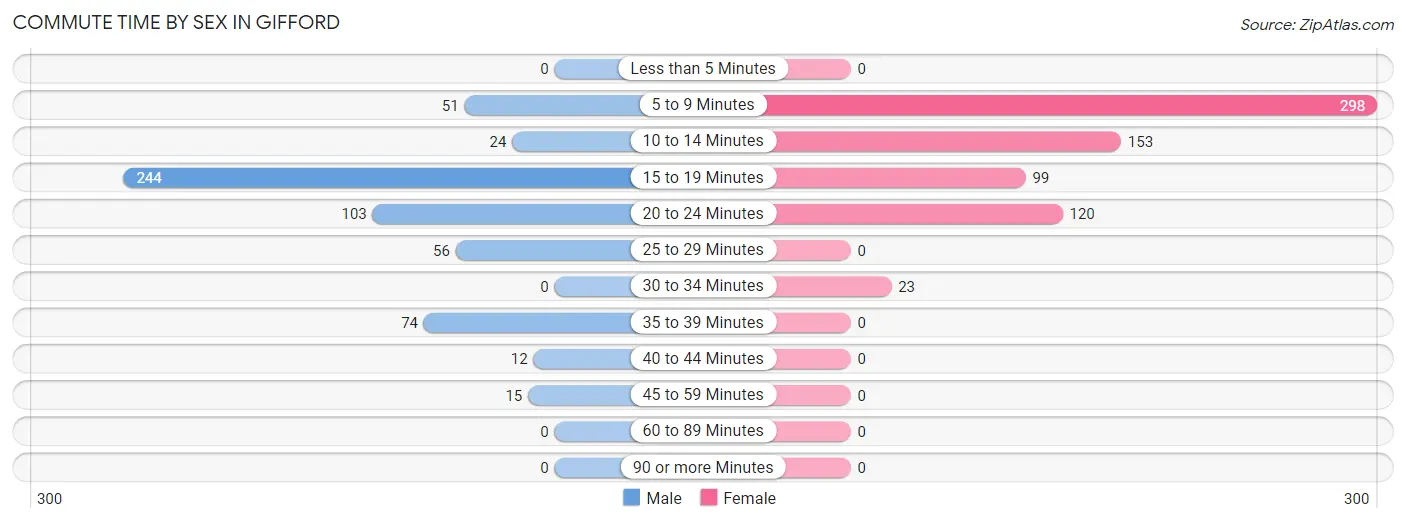
| Commute Time | Male | Female |
| Less than 5 Minutes | 0 (0.0%) | 0 (0.0%) |
| 5 to 9 Minutes | 51 (8.8%) | 298 (43.0%) |
| 10 to 14 Minutes | 24 (4.2%) | 153 (22.1%) |
| 15 to 19 Minutes | 244 (42.1%) | 99 (14.3%) |
| 20 to 24 Minutes | 103 (17.8%) | 120 (17.3%) |
| 25 to 29 Minutes | 56 (9.7%) | 0 (0.0%) |
| 30 to 34 Minutes | 0 (0.0%) | 23 (3.3%) |
| 35 to 39 Minutes | 74 (12.8%) | 0 (0.0%) |
| 40 to 44 Minutes | 12 (2.1%) | 0 (0.0%) |
| 45 to 59 Minutes | 15 (2.6%) | 0 (0.0%) |
| 60 to 89 Minutes | 0 (0.0%) | 0 (0.0%) |
| 90 or more Minutes | 0 (0.0%) | 0 (0.0%) |
Time of Departure to Work by Sex in Gifford
The most frequent times of departure to work in Gifford are 5:00 AM to 5:29 AM (253, 43.7%) for males and 7:30 AM to 7:59 AM (245, 35.3%) for females.
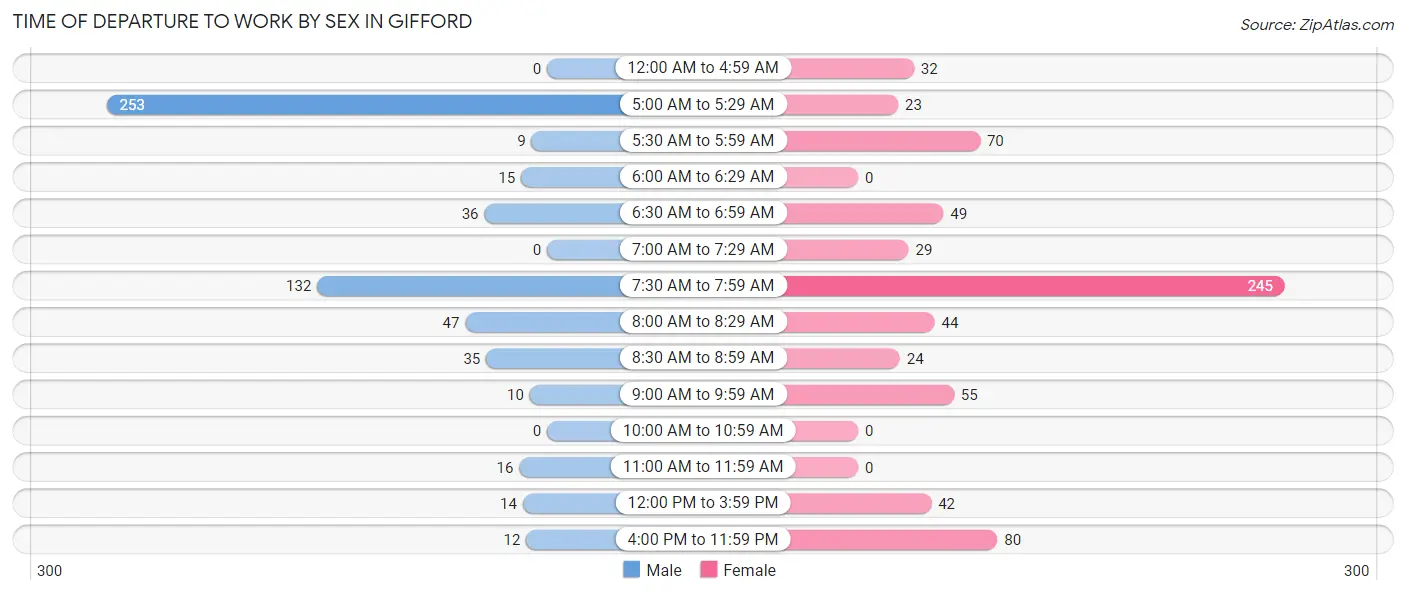
| Time of Departure | Male | Female |
| 12:00 AM to 4:59 AM | 0 (0.0%) | 32 (4.6%) |
| 5:00 AM to 5:29 AM | 253 (43.7%) | 23 (3.3%) |
| 5:30 AM to 5:59 AM | 9 (1.5%) | 70 (10.1%) |
| 6:00 AM to 6:29 AM | 15 (2.6%) | 0 (0.0%) |
| 6:30 AM to 6:59 AM | 36 (6.2%) | 49 (7.1%) |
| 7:00 AM to 7:29 AM | 0 (0.0%) | 29 (4.2%) |
| 7:30 AM to 7:59 AM | 132 (22.8%) | 245 (35.3%) |
| 8:00 AM to 8:29 AM | 47 (8.1%) | 44 (6.4%) |
| 8:30 AM to 8:59 AM | 35 (6.0%) | 24 (3.5%) |
| 9:00 AM to 9:59 AM | 10 (1.7%) | 55 (7.9%) |
| 10:00 AM to 10:59 AM | 0 (0.0%) | 0 (0.0%) |
| 11:00 AM to 11:59 AM | 16 (2.8%) | 0 (0.0%) |
| 12:00 PM to 3:59 PM | 14 (2.4%) | 42 (6.1%) |
| 4:00 PM to 11:59 PM | 12 (2.1%) | 80 (11.5%) |
| Total | 579 (100.0%) | 693 (100.0%) |
Housing Occupancy in Gifford
Occupancy by Ownership in Gifford
Of the total 1,486 dwellings in Gifford, owner-occupied units account for 727 (48.9%), while renter-occupied units make up 759 (51.1%).
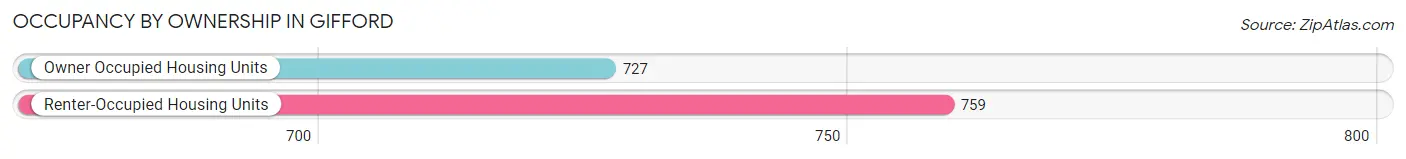
| Occupancy | # Housing Units | % Housing Units |
| Owner Occupied Housing Units | 727 | 48.9% |
| Renter-Occupied Housing Units | 759 | 51.1% |
| Total Occupied Housing Units | 1,486 | 100.0% |
Occupancy by Household Size in Gifford
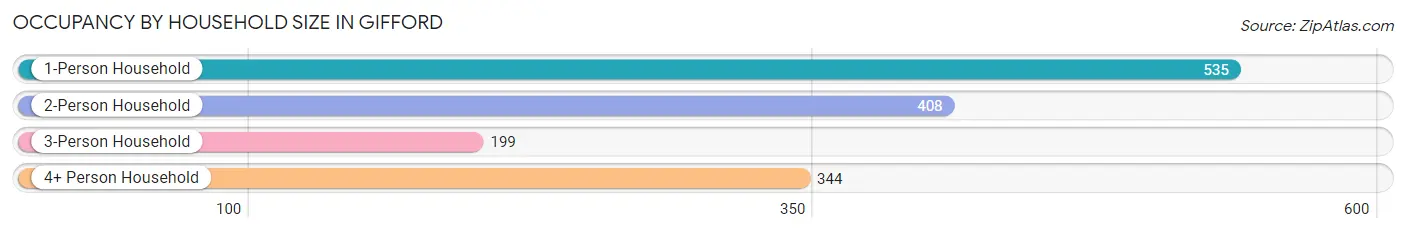
| Household Size | # Housing Units | % Housing Units |
| 1-Person Household | 535 | 36.0% |
| 2-Person Household | 408 | 27.5% |
| 3-Person Household | 199 | 13.4% |
| 4+ Person Household | 344 | 23.2% |
| Total Housing Units | 1,486 | 100.0% |
Occupancy by Ownership by Household Size in Gifford
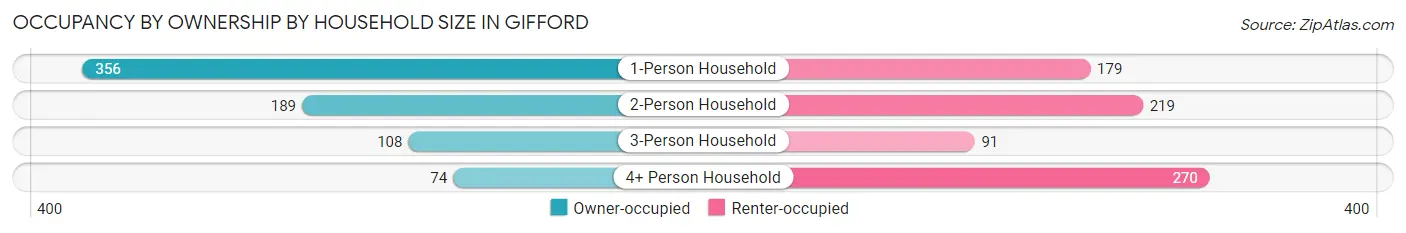
| Household Size | Owner-occupied | Renter-occupied |
| 1-Person Household | 356 (66.5%) | 179 (33.5%) |
| 2-Person Household | 189 (46.3%) | 219 (53.7%) |
| 3-Person Household | 108 (54.3%) | 91 (45.7%) |
| 4+ Person Household | 74 (21.5%) | 270 (78.5%) |
| Total Housing Units | 727 (48.9%) | 759 (51.1%) |
Occupancy by Educational Attainment in Gifford
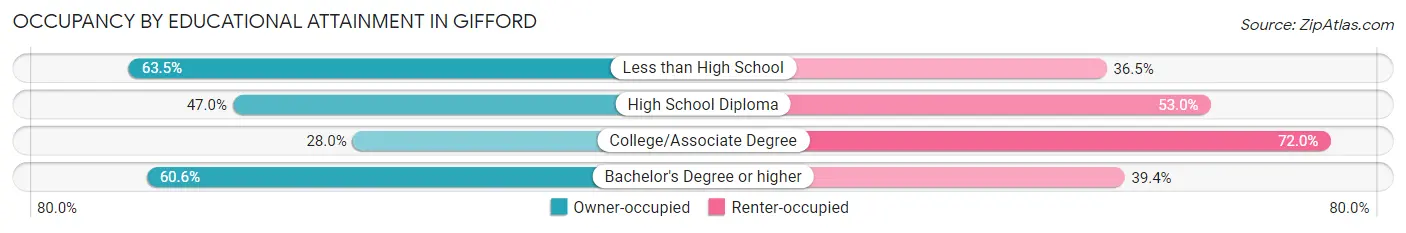
| Household Size | Owner-occupied | Renter-occupied |
| Less than High School | 245 (63.5%) | 141 (36.5%) |
| High School Diploma | 195 (47.0%) | 220 (53.0%) |
| College/Associate Degree | 110 (28.0%) | 283 (72.0%) |
| Bachelor's Degree or higher | 177 (60.6%) | 115 (39.4%) |
Occupancy by Age of Householder in Gifford
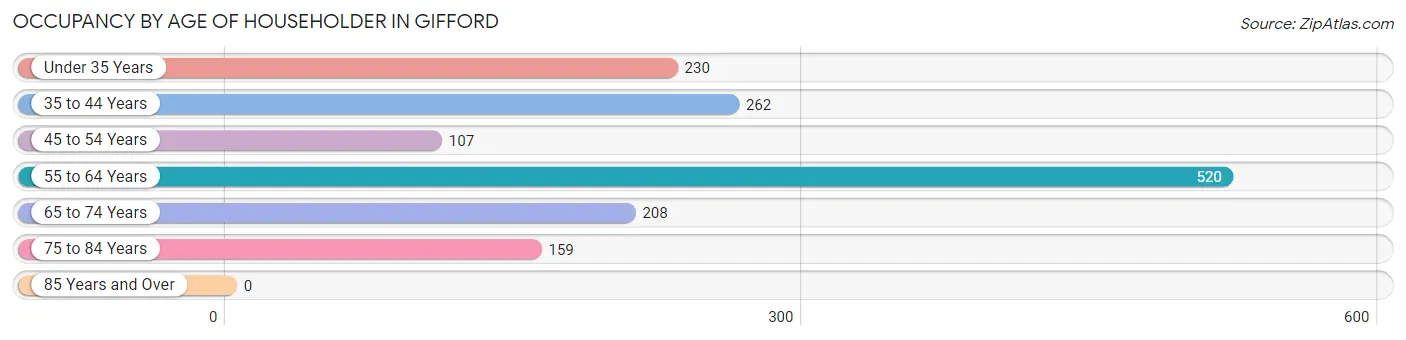
| Age Bracket | # Households | % Households |
| Under 35 Years | 230 | 15.5% |
| 35 to 44 Years | 262 | 17.6% |
| 45 to 54 Years | 107 | 7.2% |
| 55 to 64 Years | 520 | 35.0% |
| 65 to 74 Years | 208 | 14.0% |
| 75 to 84 Years | 159 | 10.7% |
| 85 Years and Over | 0 | 0.0% |
| Total | 1,486 | 100.0% |
Housing Finances in Gifford
Median Income by Occupancy in Gifford
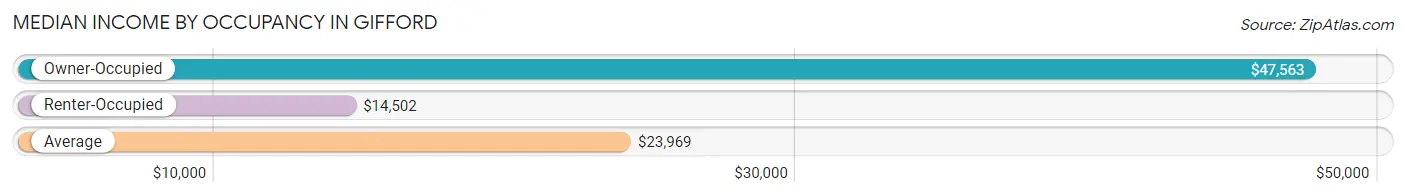
| Occupancy Type | # Households | Median Income |
| Owner-Occupied | 727 (48.9%) | $47,563 |
| Renter-Occupied | 759 (51.1%) | $14,502 |
| Average | 1,486 (100.0%) | $23,969 |
Occupancy by Householder Income Bracket in Gifford
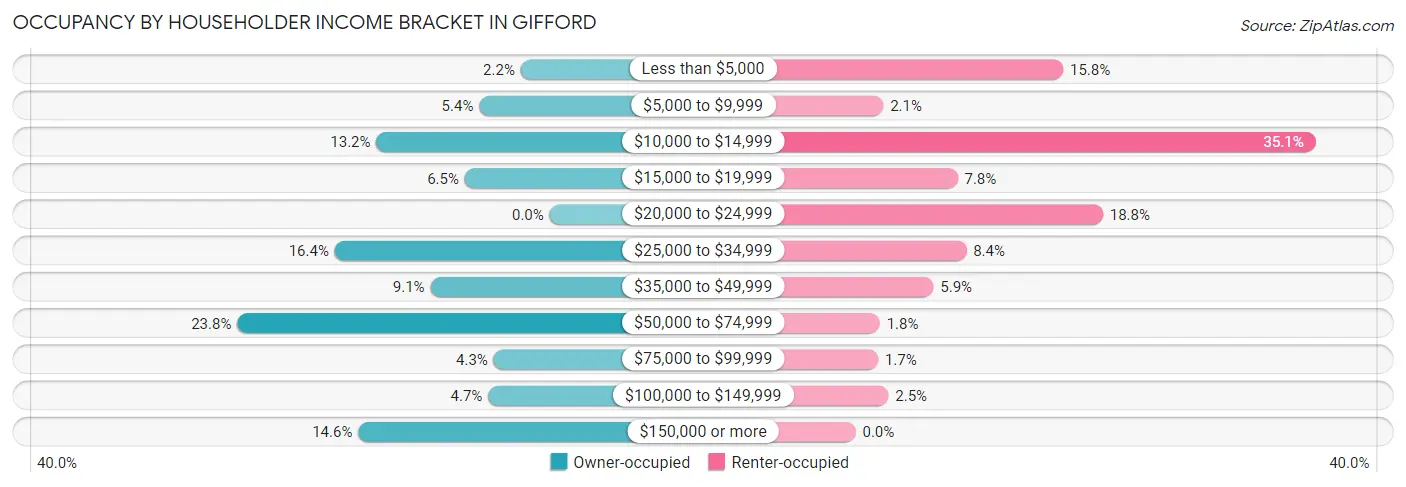
| Income Bracket | Owner-occupied | Renter-occupied |
| Less than $5,000 | 16 (2.2%) | 120 (15.8%) |
| $5,000 to $9,999 | 39 (5.4%) | 16 (2.1%) |
| $10,000 to $14,999 | 96 (13.2%) | 266 (35.0%) |
| $15,000 to $19,999 | 47 (6.5%) | 59 (7.8%) |
| $20,000 to $24,999 | 0 (0.0%) | 143 (18.8%) |
| $25,000 to $34,999 | 119 (16.4%) | 64 (8.4%) |
| $35,000 to $49,999 | 66 (9.1%) | 45 (5.9%) |
| $50,000 to $74,999 | 173 (23.8%) | 14 (1.8%) |
| $75,000 to $99,999 | 31 (4.3%) | 13 (1.7%) |
| $100,000 to $149,999 | 34 (4.7%) | 19 (2.5%) |
| $150,000 or more | 106 (14.6%) | 0 (0.0%) |
| Total | 727 (100.0%) | 759 (100.0%) |
Monthly Housing Cost Tiers in Gifford
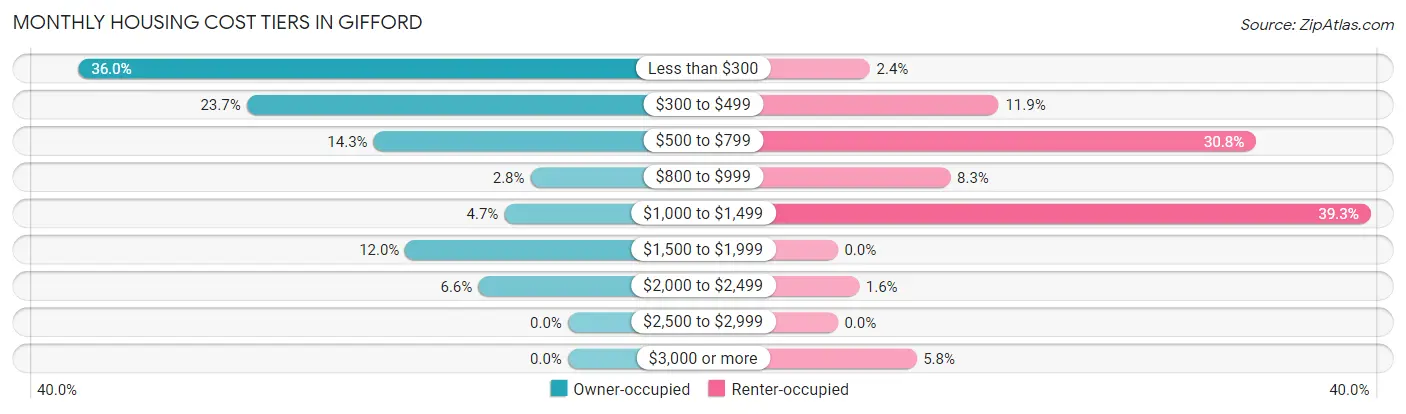
| Monthly Cost | Owner-occupied | Renter-occupied |
| Less than $300 | 262 (36.0%) | 18 (2.4%) |
| $300 to $499 | 172 (23.7%) | 90 (11.9%) |
| $500 to $799 | 104 (14.3%) | 234 (30.8%) |
| $800 to $999 | 20 (2.8%) | 63 (8.3%) |
| $1,000 to $1,499 | 34 (4.7%) | 298 (39.3%) |
| $1,500 to $1,999 | 87 (12.0%) | 0 (0.0%) |
| $2,000 to $2,499 | 48 (6.6%) | 12 (1.6%) |
| $2,500 to $2,999 | 0 (0.0%) | 0 (0.0%) |
| $3,000 or more | 0 (0.0%) | 44 (5.8%) |
| Total | 727 (100.0%) | 759 (100.0%) |
Physical Housing Characteristics in Gifford
Housing Structures in Gifford
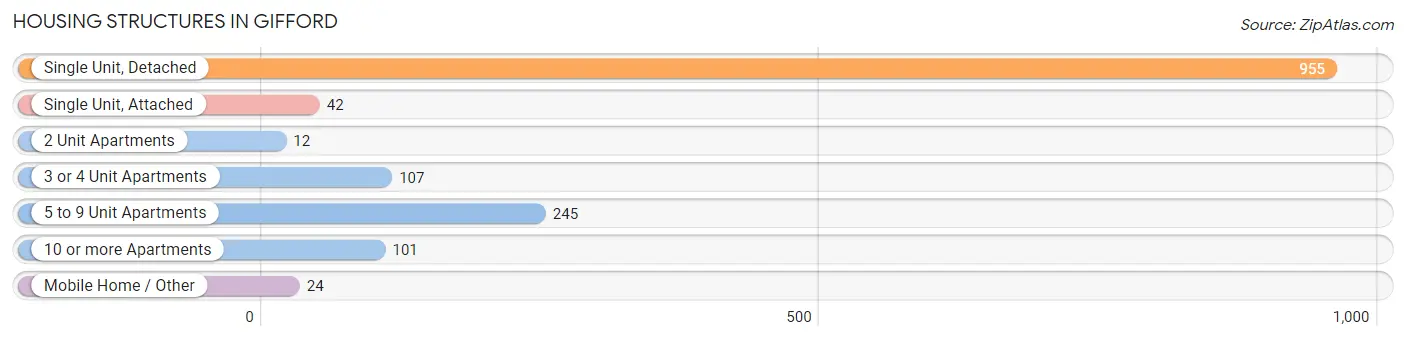
| Structure Type | # Housing Units | % Housing Units |
| Single Unit, Detached | 955 | 64.3% |
| Single Unit, Attached | 42 | 2.8% |
| 2 Unit Apartments | 12 | 0.8% |
| 3 or 4 Unit Apartments | 107 | 7.2% |
| 5 to 9 Unit Apartments | 245 | 16.5% |
| 10 or more Apartments | 101 | 6.8% |
| Mobile Home / Other | 24 | 1.6% |
| Total | 1,486 | 100.0% |
Housing Structures by Occupancy in Gifford
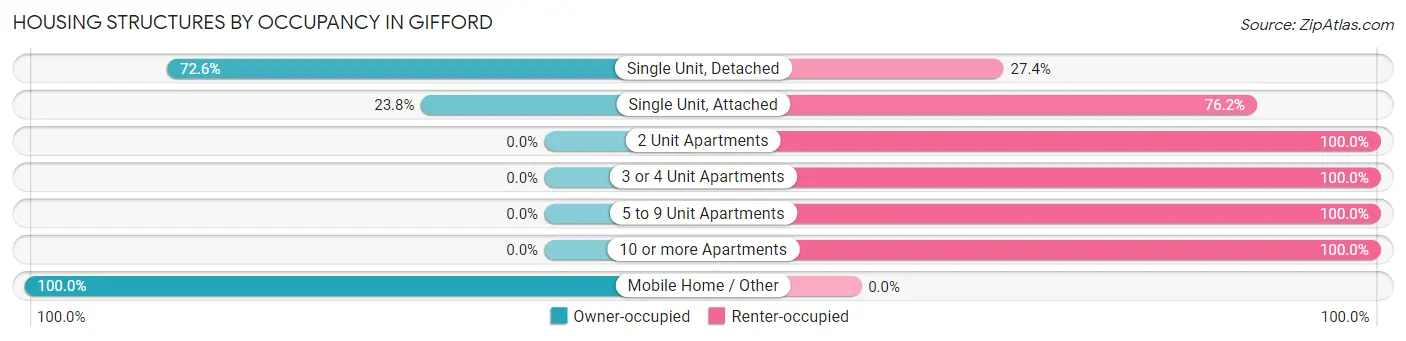
| Structure Type | Owner-occupied | Renter-occupied |
| Single Unit, Detached | 693 (72.6%) | 262 (27.4%) |
| Single Unit, Attached | 10 (23.8%) | 32 (76.2%) |
| 2 Unit Apartments | 0 (0.0%) | 12 (100.0%) |
| 3 or 4 Unit Apartments | 0 (0.0%) | 107 (100.0%) |
| 5 to 9 Unit Apartments | 0 (0.0%) | 245 (100.0%) |
| 10 or more Apartments | 0 (0.0%) | 101 (100.0%) |
| Mobile Home / Other | 24 (100.0%) | 0 (0.0%) |
| Total | 727 (48.9%) | 759 (51.1%) |
Housing Structures by Number of Rooms in Gifford
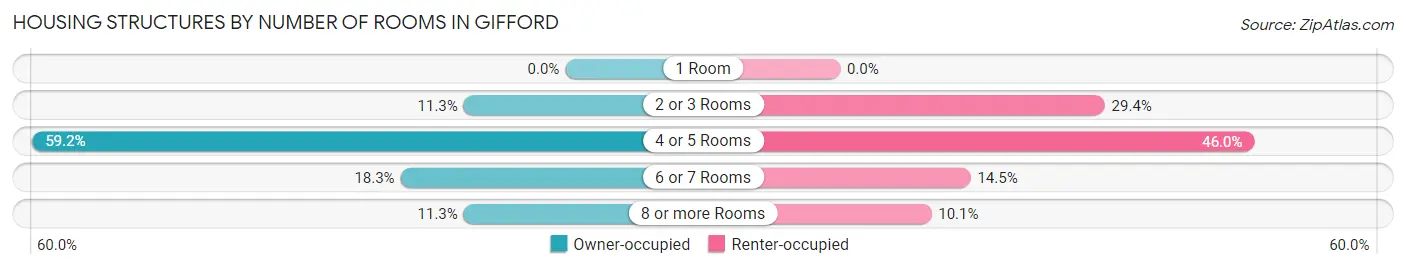
| Number of Rooms | Owner-occupied | Renter-occupied |
| 1 Room | 0 (0.0%) | 0 (0.0%) |
| 2 or 3 Rooms | 82 (11.3%) | 223 (29.4%) |
| 4 or 5 Rooms | 430 (59.2%) | 349 (46.0%) |
| 6 or 7 Rooms | 133 (18.3%) | 110 (14.5%) |
| 8 or more Rooms | 82 (11.3%) | 77 (10.1%) |
| Total | 727 (100.0%) | 759 (100.0%) |
Housing Structure by Heating Type in Gifford
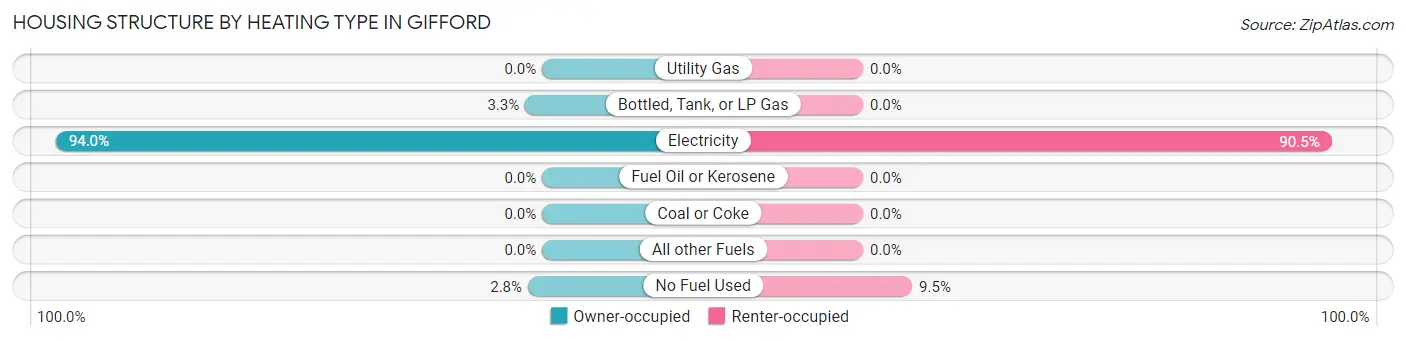
| Heating Type | Owner-occupied | Renter-occupied |
| Utility Gas | 0 (0.0%) | 0 (0.0%) |
| Bottled, Tank, or LP Gas | 24 (3.3%) | 0 (0.0%) |
| Electricity | 683 (94.0%) | 687 (90.5%) |
| Fuel Oil or Kerosene | 0 (0.0%) | 0 (0.0%) |
| Coal or Coke | 0 (0.0%) | 0 (0.0%) |
| All other Fuels | 0 (0.0%) | 0 (0.0%) |
| No Fuel Used | 20 (2.8%) | 72 (9.5%) |
| Total | 727 (100.0%) | 759 (100.0%) |
Household Vehicle Usage in Gifford
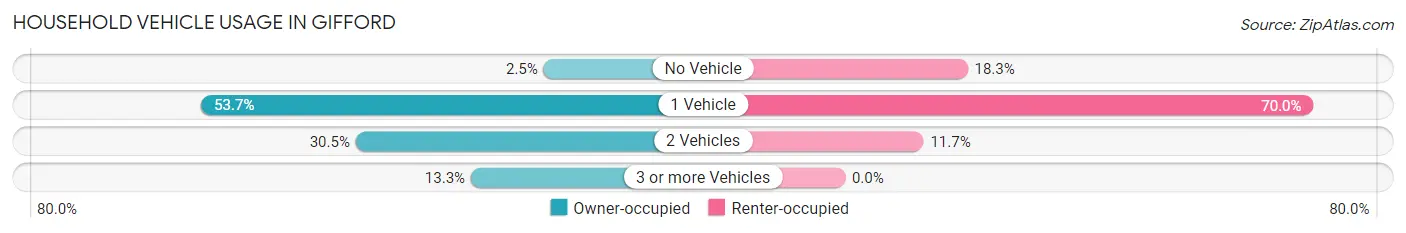
| Vehicles per Household | Owner-occupied | Renter-occupied |
| No Vehicle | 18 (2.5%) | 139 (18.3%) |
| 1 Vehicle | 390 (53.6%) | 531 (70.0%) |
| 2 Vehicles | 222 (30.5%) | 89 (11.7%) |
| 3 or more Vehicles | 97 (13.3%) | 0 (0.0%) |
| Total | 727 (100.0%) | 759 (100.0%) |
Real Estate & Mortgages in Gifford
Real Estate and Mortgage Overview in Gifford
| Characteristic | Without Mortgage | With Mortgage |
| Housing Units | 506 | 221 |
| Median Property Value | $135,900 | $320,800 |
| Median Household Income | - | - |
| Monthly Housing Costs | $286 | $0 |
| Real Estate Taxes | $648 | $0 |
Property Value by Mortgage Status in Gifford
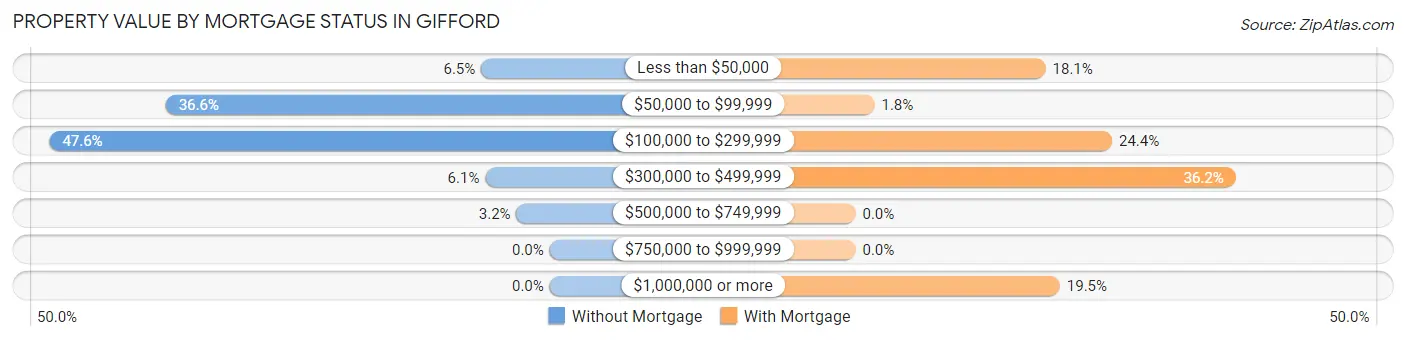
| Property Value | Without Mortgage | With Mortgage |
| Less than $50,000 | 33 (6.5%) | 40 (18.1%) |
| $50,000 to $99,999 | 185 (36.6%) | 4 (1.8%) |
| $100,000 to $299,999 | 241 (47.6%) | 54 (24.4%) |
| $300,000 to $499,999 | 31 (6.1%) | 80 (36.2%) |
| $500,000 to $749,999 | 16 (3.2%) | 0 (0.0%) |
| $750,000 to $999,999 | 0 (0.0%) | 0 (0.0%) |
| $1,000,000 or more | 0 (0.0%) | 43 (19.5%) |
| Total | 506 (100.0%) | 221 (100.0%) |
Household Income by Mortgage Status in Gifford
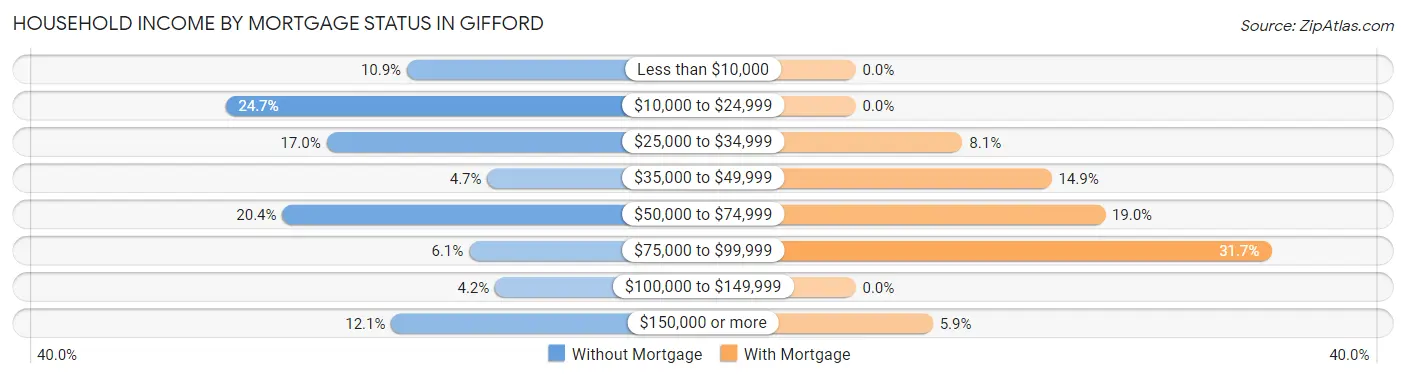
| Household Income | Without Mortgage | With Mortgage |
| Less than $10,000 | 55 (10.9%) | 0 (0.0%) |
| $10,000 to $24,999 | 125 (24.7%) | 0 (0.0%) |
| $25,000 to $34,999 | 86 (17.0%) | 18 (8.1%) |
| $35,000 to $49,999 | 24 (4.7%) | 33 (14.9%) |
| $50,000 to $74,999 | 103 (20.4%) | 42 (19.0%) |
| $75,000 to $99,999 | 31 (6.1%) | 70 (31.7%) |
| $100,000 to $149,999 | 21 (4.2%) | 0 (0.0%) |
| $150,000 or more | 61 (12.1%) | 13 (5.9%) |
| Total | 506 (100.0%) | 221 (100.0%) |
Property Value to Household Income Ratio in Gifford
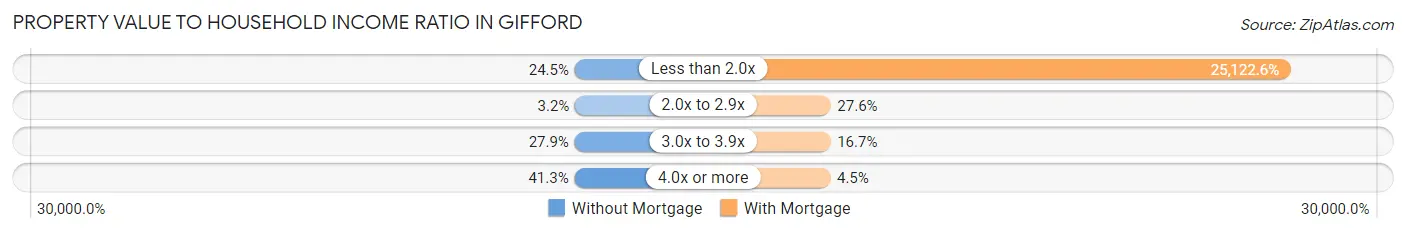
| Value-to-Income Ratio | Without Mortgage | With Mortgage |
| Less than 2.0x | 124 (24.5%) | 55,521 (25,122.6%) |
| 2.0x to 2.9x | 16 (3.2%) | 61 (27.6%) |
| 3.0x to 3.9x | 141 (27.9%) | 37 (16.7%) |
| 4.0x or more | 209 (41.3%) | 10 (4.5%) |
| Total | 506 (100.0%) | 221 (100.0%) |
Real Estate Taxes by Mortgage Status in Gifford
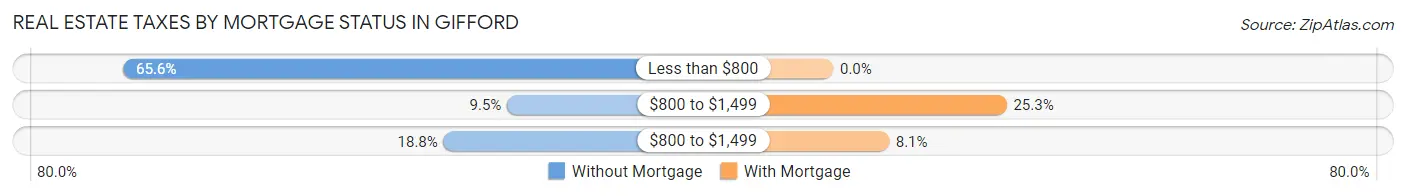
| Property Taxes | Without Mortgage | With Mortgage |
| Less than $800 | 332 (65.6%) | 0 (0.0%) |
| $800 to $1,499 | 48 (9.5%) | 56 (25.3%) |
| $800 to $1,499 | 95 (18.8%) | 18 (8.1%) |
| Total | 506 (100.0%) | 221 (100.0%) |
Health & Disability in Gifford
Health Insurance Coverage by Age in Gifford
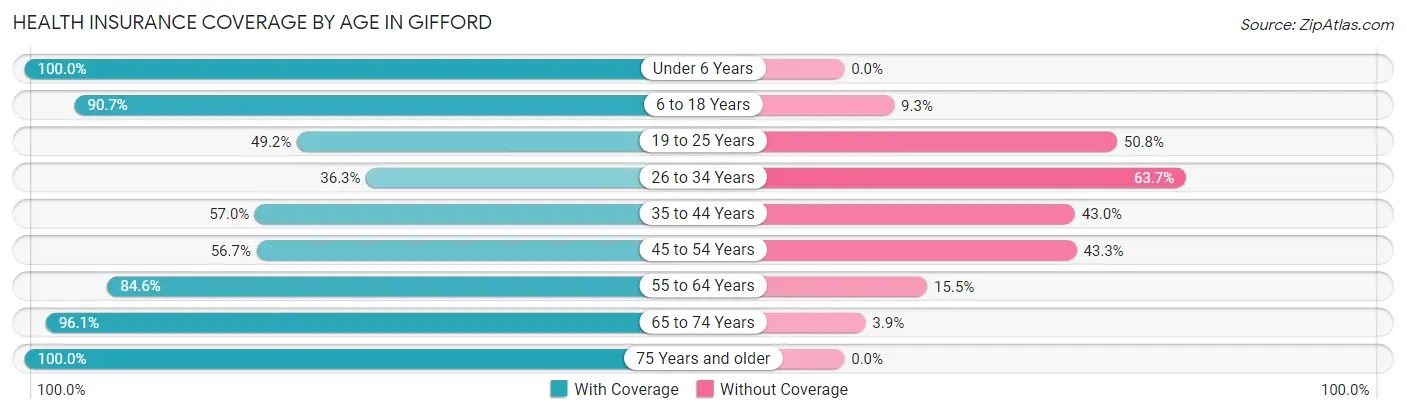
| Age Bracket | With Coverage | Without Coverage |
| Under 6 Years | 365 (100.0%) | 0 (0.0%) |
| 6 to 18 Years | 1,317 (90.7%) | 135 (9.3%) |
| 19 to 25 Years | 239 (49.2%) | 247 (50.8%) |
| 26 to 34 Years | 111 (36.3%) | 195 (63.7%) |
| 35 to 44 Years | 338 (57.0%) | 255 (43.0%) |
| 45 to 54 Years | 241 (56.7%) | 184 (43.3%) |
| 55 to 64 Years | 569 (84.6%) | 104 (15.4%) |
| 65 to 74 Years | 317 (96.1%) | 13 (3.9%) |
| 75 Years and older | 238 (100.0%) | 0 (0.0%) |
| Total | 3,735 (76.7%) | 1,133 (23.3%) |
Health Insurance Coverage by Citizenship Status in Gifford
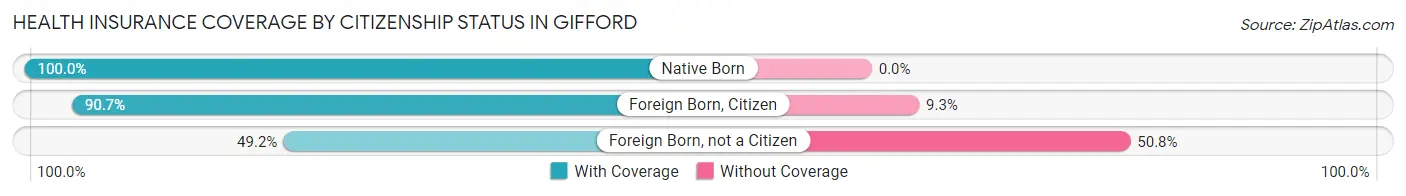
| Citizenship Status | With Coverage | Without Coverage |
| Native Born | 365 (100.0%) | 0 (0.0%) |
| Foreign Born, Citizen | 1,317 (90.7%) | 135 (9.3%) |
| Foreign Born, not a Citizen | 239 (49.2%) | 247 (50.8%) |
Health Insurance Coverage by Household Income in Gifford
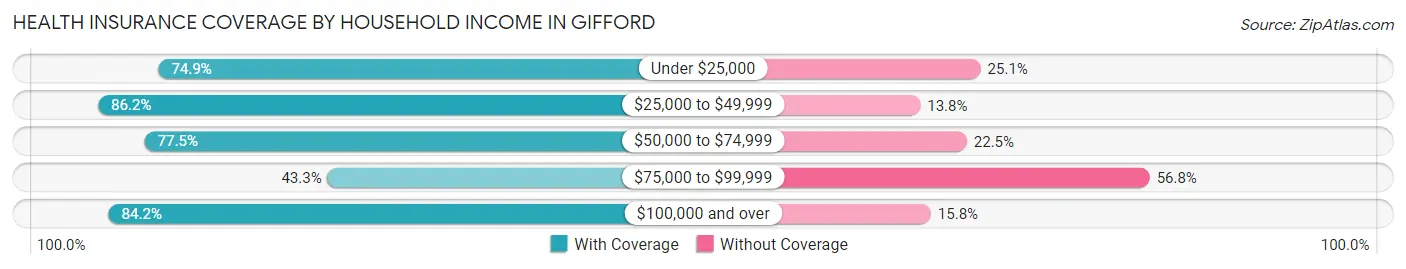
| Household Income | With Coverage | Without Coverage |
| Under $25,000 | 1,873 (74.9%) | 627 (25.1%) |
| $25,000 to $49,999 | 864 (86.2%) | 138 (13.8%) |
| $50,000 to $74,999 | 517 (77.5%) | 150 (22.5%) |
| $75,000 to $99,999 | 109 (43.2%) | 143 (56.8%) |
| $100,000 and over | 358 (84.2%) | 67 (15.8%) |
Public vs Private Health Insurance Coverage by Age in Gifford
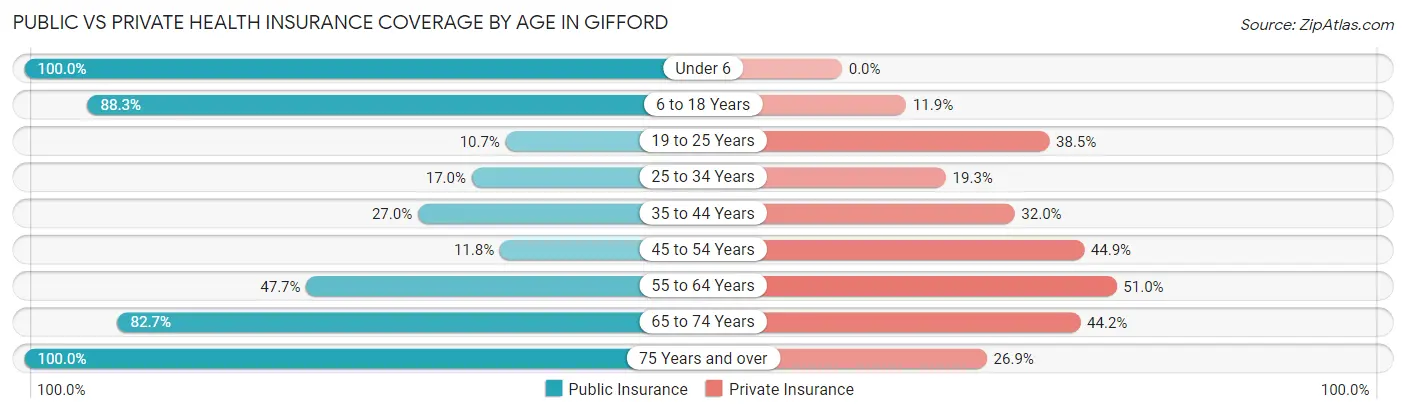
| Age Bracket | Public Insurance | Private Insurance |
| Under 6 | 365 (100.0%) | 0 (0.0%) |
| 6 to 18 Years | 1,282 (88.3%) | 173 (11.9%) |
| 19 to 25 Years | 52 (10.7%) | 187 (38.5%) |
| 25 to 34 Years | 52 (17.0%) | 59 (19.3%) |
| 35 to 44 Years | 160 (27.0%) | 190 (32.0%) |
| 45 to 54 Years | 50 (11.8%) | 191 (44.9%) |
| 55 to 64 Years | 321 (47.7%) | 343 (51.0%) |
| 65 to 74 Years | 273 (82.7%) | 146 (44.2%) |
| 75 Years and over | 238 (100.0%) | 64 (26.9%) |
| Total | 2,793 (57.4%) | 1,353 (27.8%) |
Disability Status by Sex by Age in Gifford
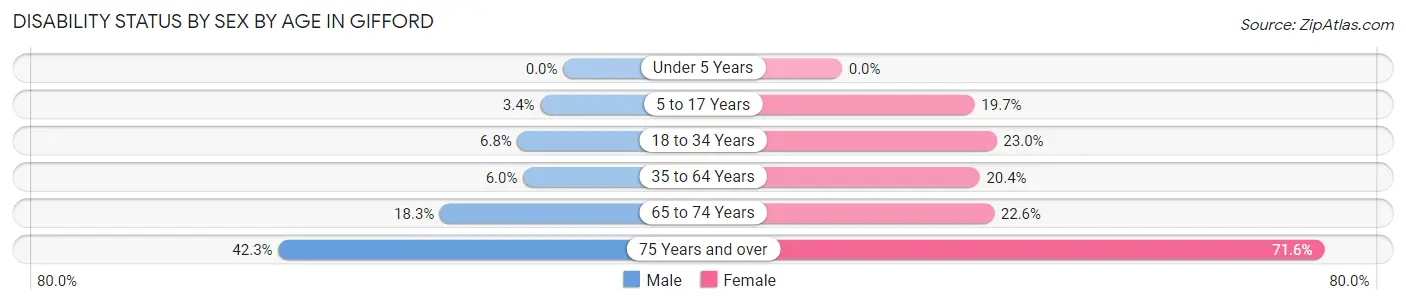
| Age Bracket | Male | Female |
| Under 5 Years | 0 (0.0%) | 0 (0.0%) |
| 5 to 17 Years | 20 (3.4%) | 141 (19.7%) |
| 18 to 34 Years | 35 (6.8%) | 104 (23.0%) |
| 35 to 64 Years | 36 (5.9%) | 222 (20.4%) |
| 65 to 74 Years | 32 (18.3%) | 35 (22.6%) |
| 75 Years and over | 44 (42.3%) | 96 (71.6%) |
Disability Class by Sex by Age in Gifford
Disability Class: Hearing Difficulty
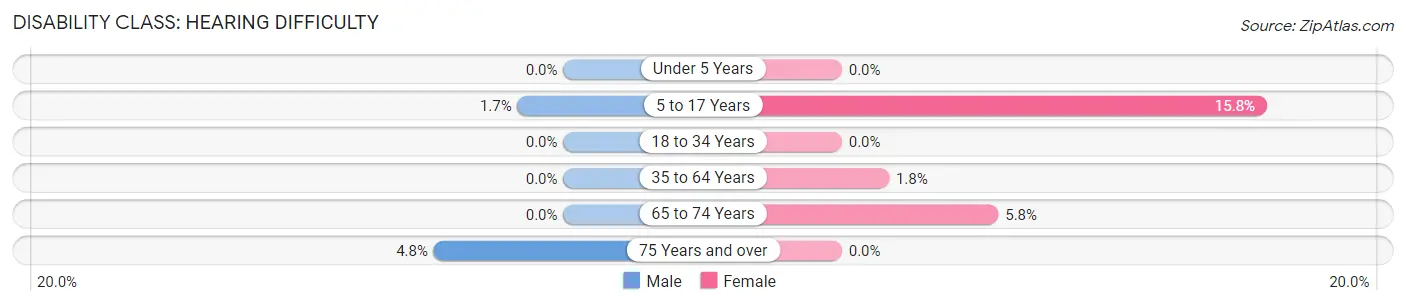
| Age Bracket | Male | Female |
| Under 5 Years | 0 (0.0%) | 0 (0.0%) |
| 5 to 17 Years | 10 (1.7%) | 113 (15.8%) |
| 18 to 34 Years | 0 (0.0%) | 0 (0.0%) |
| 35 to 64 Years | 0 (0.0%) | 19 (1.8%) |
| 65 to 74 Years | 0 (0.0%) | 9 (5.8%) |
| 75 Years and over | 5 (4.8%) | 0 (0.0%) |
Disability Class: Vision Difficulty
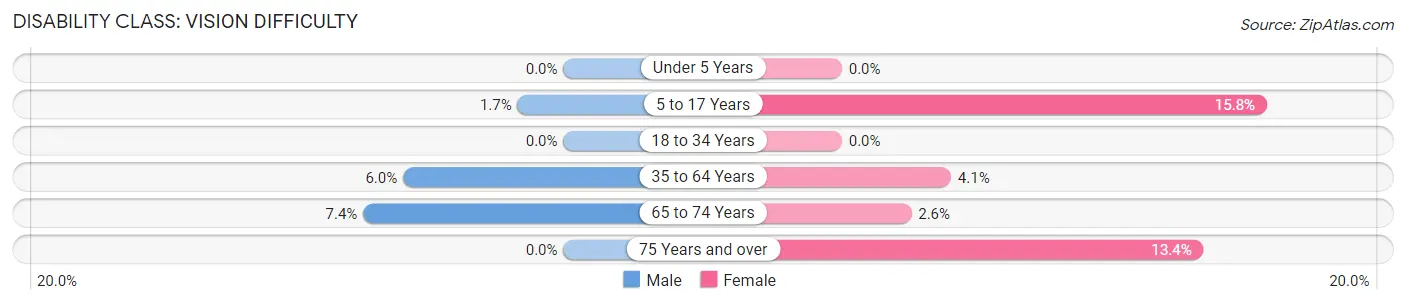
| Age Bracket | Male | Female |
| Under 5 Years | 0 (0.0%) | 0 (0.0%) |
| 5 to 17 Years | 10 (1.7%) | 113 (15.8%) |
| 18 to 34 Years | 0 (0.0%) | 0 (0.0%) |
| 35 to 64 Years | 36 (5.9%) | 44 (4.1%) |
| 65 to 74 Years | 13 (7.4%) | 4 (2.6%) |
| 75 Years and over | 0 (0.0%) | 18 (13.4%) |
Disability Class: Cognitive Difficulty
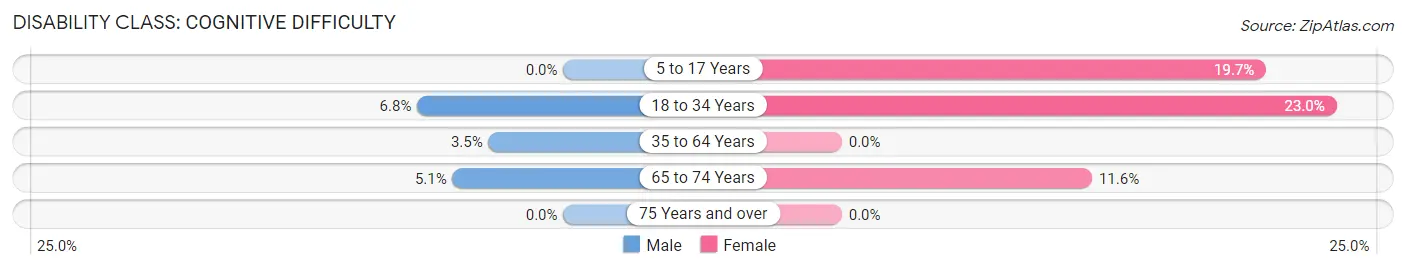
| Age Bracket | Male | Female |
| 5 to 17 Years | 0 (0.0%) | 141 (19.7%) |
| 18 to 34 Years | 35 (6.8%) | 104 (23.0%) |
| 35 to 64 Years | 21 (3.5%) | 0 (0.0%) |
| 65 to 74 Years | 9 (5.1%) | 18 (11.6%) |
| 75 Years and over | 0 (0.0%) | 0 (0.0%) |
Disability Class: Ambulatory Difficulty
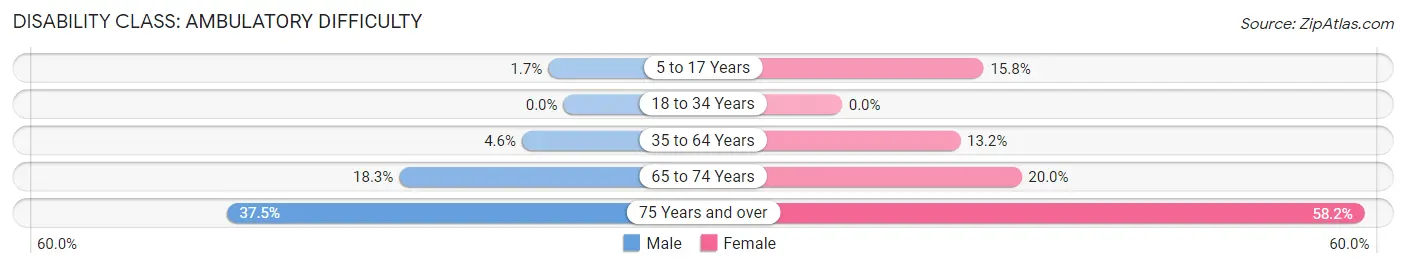
| Age Bracket | Male | Female |
| 5 to 17 Years | 10 (1.7%) | 113 (15.8%) |
| 18 to 34 Years | 0 (0.0%) | 0 (0.0%) |
| 35 to 64 Years | 28 (4.6%) | 143 (13.2%) |
| 65 to 74 Years | 32 (18.3%) | 31 (20.0%) |
| 75 Years and over | 39 (37.5%) | 78 (58.2%) |
Disability Class: Self-Care Difficulty
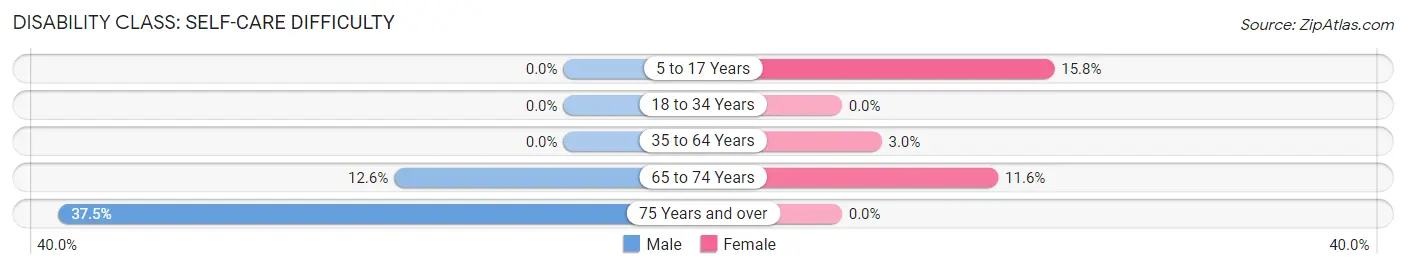
| Age Bracket | Male | Female |
| 5 to 17 Years | 0 (0.0%) | 113 (15.8%) |
| 18 to 34 Years | 0 (0.0%) | 0 (0.0%) |
| 35 to 64 Years | 0 (0.0%) | 32 (2.9%) |
| 65 to 74 Years | 22 (12.6%) | 18 (11.6%) |
| 75 Years and over | 39 (37.5%) | 0 (0.0%) |
Technology Access in Gifford
Computing Device Access in Gifford
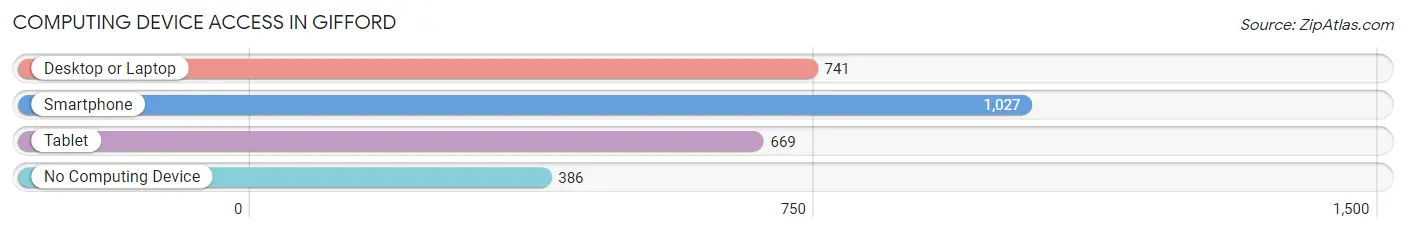
| Device Type | # Households | % Households |
| Desktop or Laptop | 741 | 49.9% |
| Smartphone | 1,027 | 69.1% |
| Tablet | 669 | 45.0% |
| No Computing Device | 386 | 26.0% |
| Total | 1,486 | 100.0% |
Internet Access in Gifford
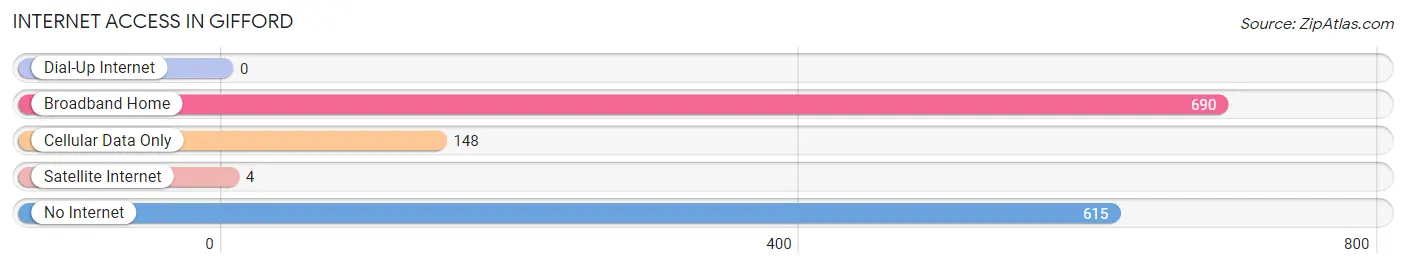
| Internet Type | # Households | % Households |
| Dial-Up Internet | 0 | 0.0% |
| Broadband Home | 690 | 46.4% |
| Cellular Data Only | 148 | 10.0% |
| Satellite Internet | 4 | 0.3% |
| No Internet | 615 | 41.4% |
| Total | 1,486 | 100.0% |
Gifford Summary
Gifford is a small unincorporated community located in Indian River County, Florida. It is situated on the east side of the Indian River Lagoon, just south of the city of Vero Beach. The population of Gifford was estimated to be 2,845 in 2019.
History
Gifford was founded in the late 19th century by settlers from the Bahamas. The settlement was named after Captain William Gifford, a British naval officer who had served in the area during the Second Seminole War. The settlement grew slowly, and by the early 20th century, it had become a small farming community.
In the 1920s, Gifford began to experience a period of growth as the citrus industry began to expand in the area. The town was incorporated in 1925, and the population grew to over 1,000 by the 1930s.
In the 1950s, Gifford began to experience a period of decline as the citrus industry began to decline. The population dropped to just over 500 by the 1960s.
In the 1970s, Gifford began to experience a period of revitalization as the area began to attract new businesses and residents. The population grew to over 1,500 by the 1980s.
Geography
Gifford is located in Indian River County, Florida, on the east side of the Indian River Lagoon. It is situated just south of the city of Vero Beach. The town is bordered by the Indian River to the east, the St. Sebastian River to the south, and the Atlantic Ocean to the east.
The town has a total area of 2.2 square miles, all of which is land. The terrain is mostly flat, with some low hills in the northern part of the town.
Economy
Gifford’s economy is largely based on agriculture and tourism. The town is home to several citrus groves, as well as a number of small businesses. Tourism is also an important part of the local economy, with many visitors coming to the area to enjoy the beaches, fishing, and other outdoor activities.
Demographics
As of the 2019 census, Gifford had a population of 2,845. The racial makeup of the town was 79.3% White, 15.2% African American, 0.7% Native American, 0.7% Asian, 0.1% Pacific Islander, and 3.9% from other races. Hispanic or Latino of any race were 8.2% of the population.
The median household income in Gifford was $37,917, and the median family income was $45,917. The per capita income was $19,917. About 17.2% of the population was below the poverty line.
Common Questions
What is the Total Population of Gifford?
Total Population of Gifford is 4,868.
What is the Total Male Population of Gifford?
Total Male Population of Gifford is 2,205.
What is the Total Female Population of Gifford?
Total Female Population of Gifford is 2,663.
What is the Ratio of Males per 100 Females in Gifford?
There are 82.80 Males per 100 Females in Gifford.
What is the Ratio of Females per 100 Males in Gifford?
There are 120.77 Females per 100 Males in Gifford.
What is the Median Population Age in Gifford?
Median Population Age in Gifford is 31.6 Years.
What is the Average Family Size in Gifford
Average Family Size in Gifford is 4.7 People.
What is the Average Household Size in Gifford
Average Household Size in Gifford is 3.3 People.
What is Per Capita Income in Gifford?
Per Capita income in Gifford is $15,831.
What is the Median Family Income in Gifford?
Median Family Income in Gifford is $25,195.
What is the Median Household income in Gifford?
Median Household Income in Gifford is $23,969.
What is Income or Wage Gap in Gifford?
Income or Wage Gap in Gifford is 12.6%.
Women in Gifford earn 87.4 cents for every dollar earned by a man.
What is Inequality or Gini Index in Gifford?
Inequality or Gini Index in Gifford is 0.57.
How Large is the Labor Force in Gifford?
There are 1,745 People in the Labor Forcein in Gifford.
What is the Percentage of People in the Labor Force in Gifford?
52.4% of People are in the Labor Force in Gifford.
What is the Unemployment Rate in Gifford?
Unemployment Rate in Gifford is 12.8%.