Grant Valkaria, FL
Grant Valkaria Map
Grant Valkaria Overview
4,520
TOTAL POPULATION
2,101
MALE POPULATION
2,419
FEMALE POPULATION
86.85
MALES / 100 FEMALES
115.14
FEMALES / 100 MALES
54.3
MEDIAN AGE
3.0
AVG FAMILY SIZE
2.7
AVG HOUSEHOLD SIZE
$45,113
PER CAPITA INCOME
$119,609
AVG FAMILY INCOME
$109,850
AVG HOUSEHOLD INCOME
50.6%
WAGE / INCOME GAP [ % ]
49.4¢/ $1
WAGE / INCOME GAP [ $ ]
0.41
INEQUALITY / GINI INDEX
1,944
LABOR FORCE [ PEOPLE ]
48.9%
PERCENT IN LABOR FORCE
1.1%
UNEMPLOYMENT RATE
Grant Valkaria Area Codes
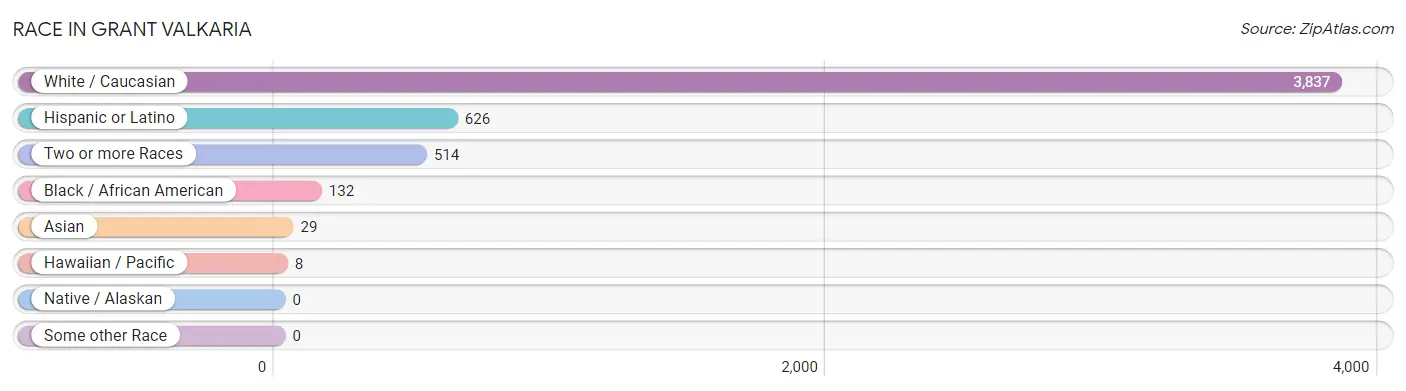
Race in Grant Valkaria
The most populous races in Grant Valkaria are White / Caucasian (3,837 | 84.9%), Hispanic or Latino (626 | 13.9%), and Two or more Races (514 | 11.4%).
| Race | # Population | % Population |
| Asian | 29 | 0.6% |
| Black / African American | 132 | 2.9% |
| Hawaiian / Pacific | 8 | 0.2% |
| Hispanic or Latino | 626 | 13.9% |
| Native / Alaskan | 0 | 0.0% |
| White / Caucasian | 3,837 | 84.9% |
| Two or more Races | 514 | 11.4% |
| Some other Race | 0 | 0.0% |
| Total | 4,520 | 100.0% |
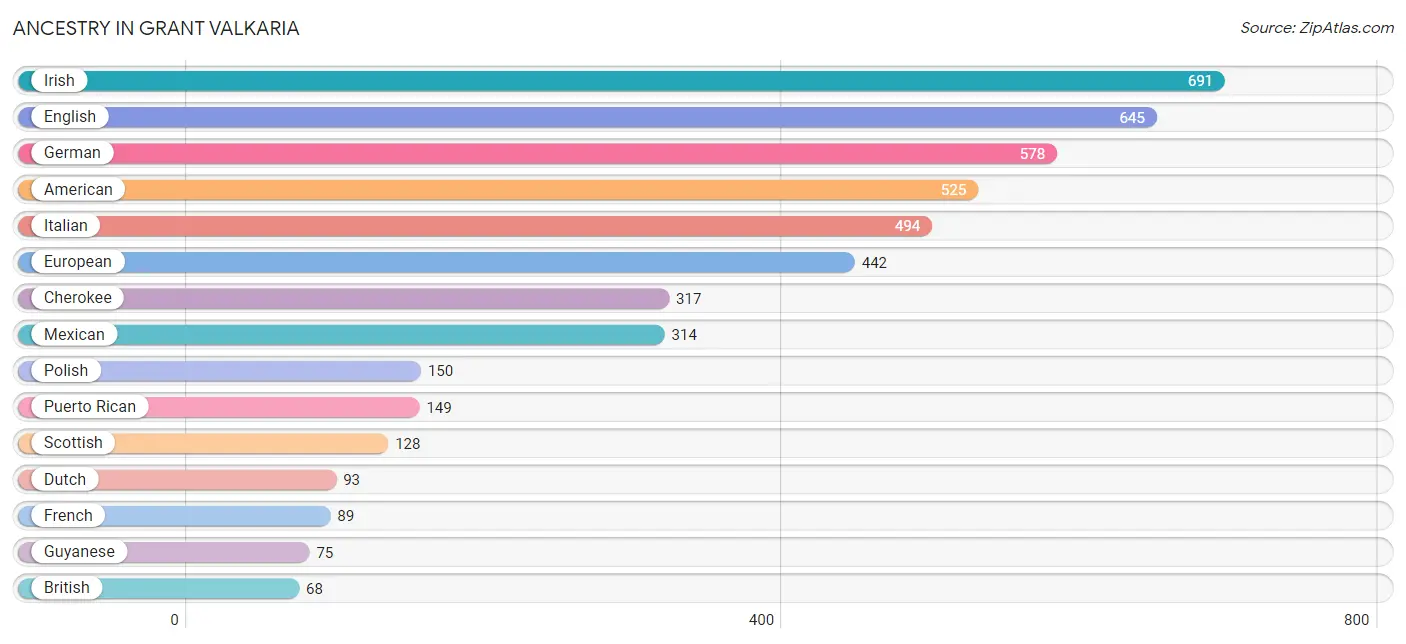
Ancestry in Grant Valkaria
The most populous ancestries reported in Grant Valkaria are Irish (691 | 15.3%), English (645 | 14.3%), German (578 | 12.8%), American (525 | 11.6%), and Italian (494 | 10.9%), together accounting for 64.9% of all Grant Valkaria residents.
| Ancestry | # Population | % Population |
| American | 525 | 11.6% |
| Arab | 5 | 0.1% |
| Blackfeet | 4 | 0.1% |
| British | 68 | 1.5% |
| Bulgarian | 3 | 0.1% |
| Central American | 21 | 0.5% |
| Cherokee | 317 | 7.0% |
| Colombian | 7 | 0.2% |
| Cuban | 50 | 1.1% |
| Czech | 4 | 0.1% |
| Czechoslovakian | 29 | 0.6% |
| Danish | 17 | 0.4% |
| Dominican | 64 | 1.4% |
| Dutch | 93 | 2.1% |
| Eastern European | 6 | 0.1% |
| English | 645 | 14.3% |
| European | 442 | 9.8% |
| French | 89 | 2.0% |
| French Canadian | 4 | 0.1% |
| German | 578 | 12.8% |
| Greek | 10 | 0.2% |
| Guyanese | 75 | 1.7% |
| Haitian | 9 | 0.2% |
| Hungarian | 34 | 0.7% |
| Irish | 691 | 15.3% |
| Italian | 494 | 10.9% |
| Jamaican | 16 | 0.4% |
| Korean | 67 | 1.5% |
| Lebanese | 5 | 0.1% |
| Mexican | 314 | 7.0% |
| Northern European | 18 | 0.4% |
| Norwegian | 24 | 0.5% |
| Panamanian | 21 | 0.5% |
| Pennsylvania German | 14 | 0.3% |
| Peruvian | 4 | 0.1% |
| Polish | 150 | 3.3% |
| Portuguese | 3 | 0.1% |
| Puerto Rican | 149 | 3.3% |
| Russian | 14 | 0.3% |
| Scotch-Irish | 5 | 0.1% |
| Scottish | 128 | 2.8% |
| Slovak | 4 | 0.1% |
| South American | 11 | 0.2% |
| Spaniard | 17 | 0.4% |
| Swedish | 24 | 0.5% |
| Swiss | 41 | 0.9% |
| Turkish | 13 | 0.3% |
| Ukrainian | 7 | 0.2% |
| Welsh | 41 | 0.9% |
| West Indian | 16 | 0.4% | View All 50 Rows |
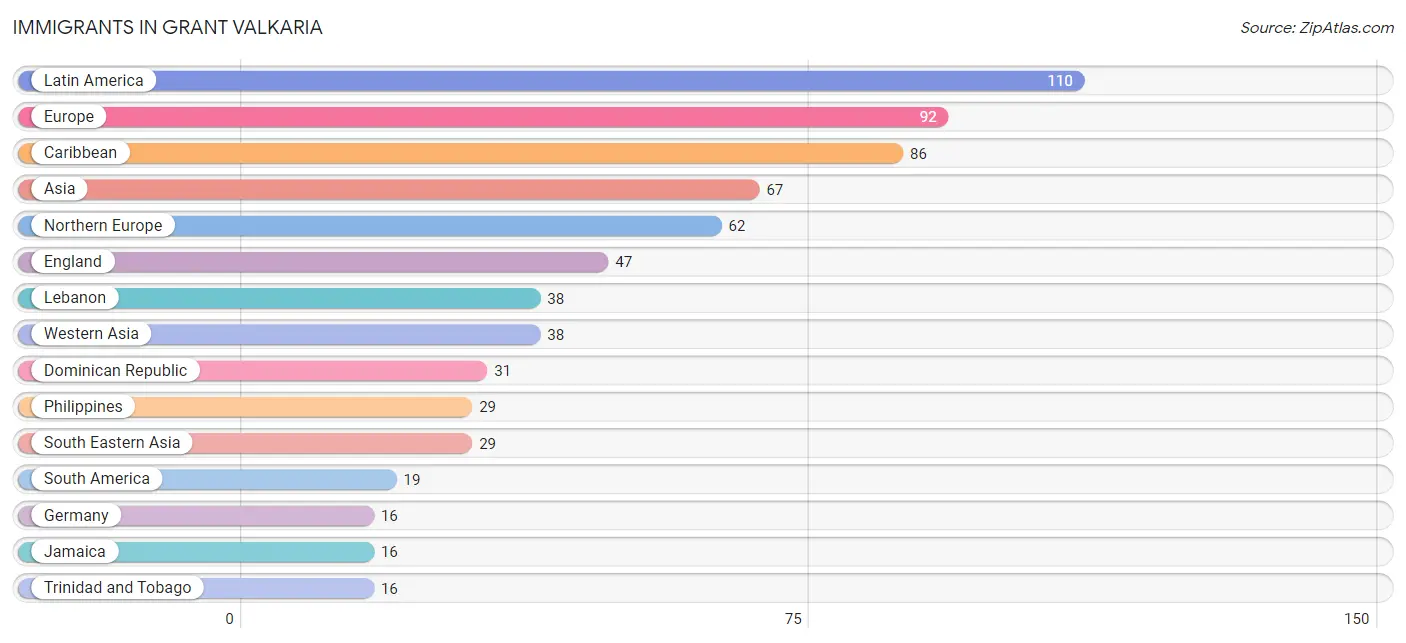
Immigrants in Grant Valkaria
The most numerous immigrant groups reported in Grant Valkaria came from Latin America (110 | 2.4%), Europe (92 | 2.0%), Caribbean (86 | 1.9%), Asia (67 | 1.5%), and Northern Europe (62 | 1.4%), together accounting for 9.2% of all Grant Valkaria residents.
| Immigration Origin | # Population | % Population |
| Asia | 67 | 1.5% |
| Brazil | 8 | 0.2% |
| Caribbean | 86 | 1.9% |
| Central America | 5 | 0.1% |
| Colombia | 7 | 0.2% |
| Cuba | 8 | 0.2% |
| Dominican Republic | 31 | 0.7% |
| England | 47 | 1.0% |
| Europe | 92 | 2.0% |
| Germany | 16 | 0.4% |
| Greece | 10 | 0.2% |
| Grenada | 15 | 0.3% |
| Italy | 4 | 0.1% |
| Jamaica | 16 | 0.4% |
| Latin America | 110 | 2.4% |
| Lebanon | 38 | 0.8% |
| Northern Europe | 62 | 1.4% |
| Panama | 5 | 0.1% |
| Peru | 4 | 0.1% |
| Philippines | 29 | 0.6% |
| South America | 19 | 0.4% |
| South Eastern Asia | 29 | 0.6% |
| Southern Europe | 14 | 0.3% |
| Trinidad and Tobago | 16 | 0.4% |
| Western Asia | 38 | 0.8% |
| Western Europe | 16 | 0.4% | View All 26 Rows |
Sex and Age in Grant Valkaria
Sex and Age in Grant Valkaria
The most populous age groups in Grant Valkaria are 55 to 59 Years (318 | 15.1%) for men and 65 to 69 Years (373 | 15.4%) for women.
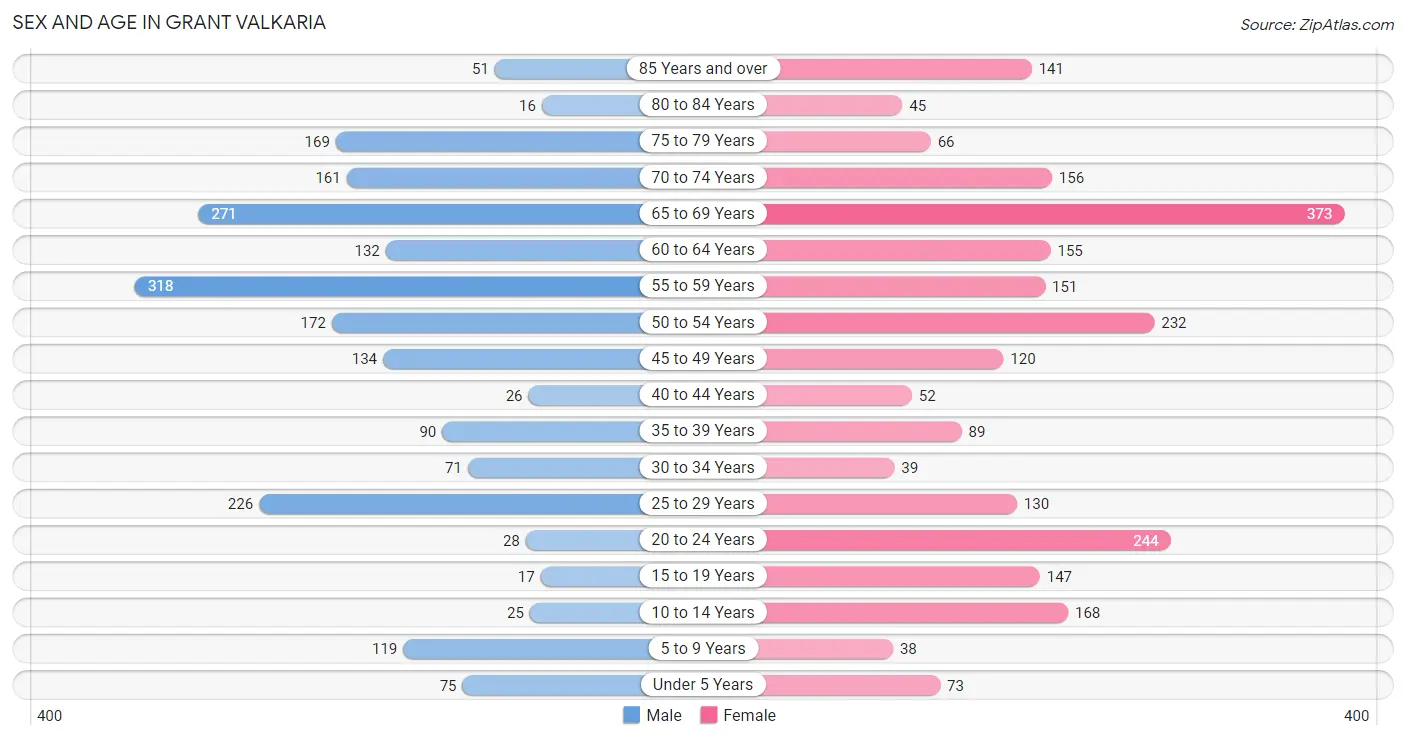
| Age Bracket | Male | Female |
| Under 5 Years | 75 (3.6%) | 73 (3.0%) |
| 5 to 9 Years | 119 (5.7%) | 38 (1.6%) |
| 10 to 14 Years | 25 (1.2%) | 168 (7.0%) |
| 15 to 19 Years | 17 (0.8%) | 147 (6.1%) |
| 20 to 24 Years | 28 (1.3%) | 244 (10.1%) |
| 25 to 29 Years | 226 (10.8%) | 130 (5.4%) |
| 30 to 34 Years | 71 (3.4%) | 39 (1.6%) |
| 35 to 39 Years | 90 (4.3%) | 89 (3.7%) |
| 40 to 44 Years | 26 (1.2%) | 52 (2.1%) |
| 45 to 49 Years | 134 (6.4%) | 120 (5.0%) |
| 50 to 54 Years | 172 (8.2%) | 232 (9.6%) |
| 55 to 59 Years | 318 (15.1%) | 151 (6.2%) |
| 60 to 64 Years | 132 (6.3%) | 155 (6.4%) |
| 65 to 69 Years | 271 (12.9%) | 373 (15.4%) |
| 70 to 74 Years | 161 (7.7%) | 156 (6.5%) |
| 75 to 79 Years | 169 (8.0%) | 66 (2.7%) |
| 80 to 84 Years | 16 (0.8%) | 45 (1.9%) |
| 85 Years and over | 51 (2.4%) | 141 (5.8%) |
| Total | 2,101 (100.0%) | 2,419 (100.0%) |
Families and Households in Grant Valkaria
Median Family Size in Grant Valkaria
The median family size in Grant Valkaria is 2.99 persons per family, with single male/father families (32 | 2.4%) accounting for the largest median family size of 3.5 persons per family. On the other hand, single female/mother families (46 | 3.4%) represent the smallest median family size with 2.59 persons per family.
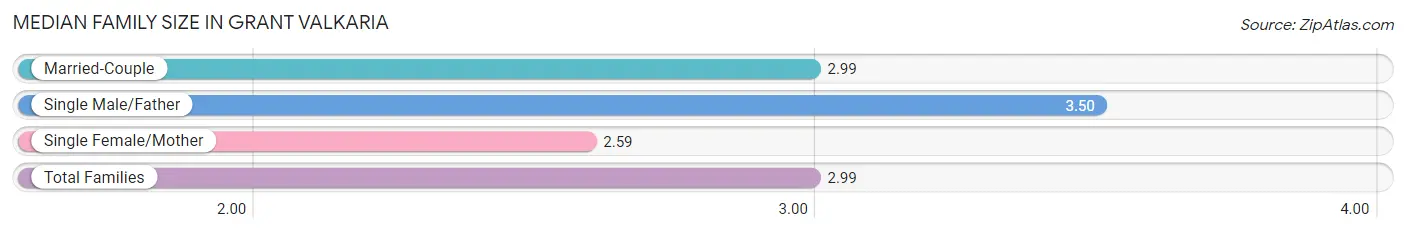
| Family Type | # Families | Family Size |
| Married-Couple | 1,283 (94.3%) | 2.99 |
| Single Male/Father | 32 (2.4%) | 3.50 |
| Single Female/Mother | 46 (3.4%) | 2.59 |
| Total Families | 1,361 (100.0%) | 2.99 |
Median Household Size in Grant Valkaria
The median household size in Grant Valkaria is 2.74 persons per household, with single male/father households (32 | 1.9%) accounting for the largest median household size of 3.75 persons per household. non-family households (290 | 17.6%) represent the smallest median household size with 1.38 persons per household.
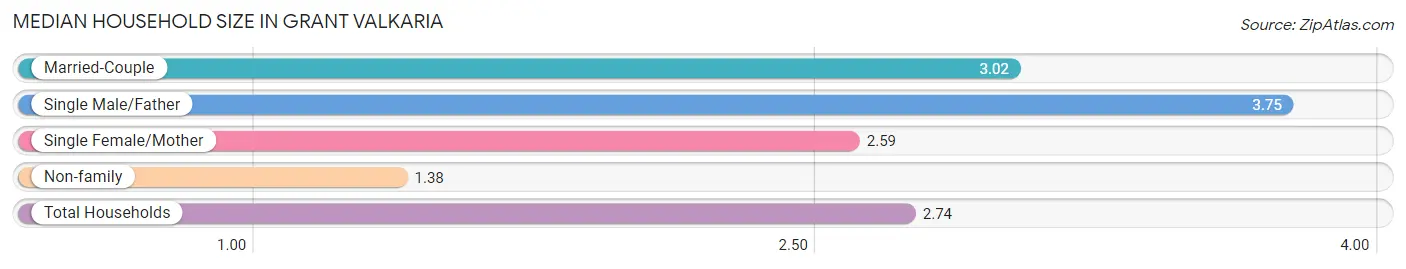
| Household Type | # Households | Household Size |
| Married-Couple | 1,283 (77.7%) | 3.02 |
| Single Male/Father | 32 (1.9%) | 3.75 |
| Single Female/Mother | 46 (2.8%) | 2.59 |
| Non-family | 290 (17.6%) | 1.38 |
| Total Households | 1,651 (100.0%) | 2.74 |
Household Size by Marriage Status in Grant Valkaria
Out of a total of 1,651 households in Grant Valkaria, 1,361 (82.4%) are family households, while 290 (17.6%) are nonfamily households. The most numerous type of family households are 2-person households, comprising 922, and the most common type of nonfamily households are 1-person households, comprising 175.
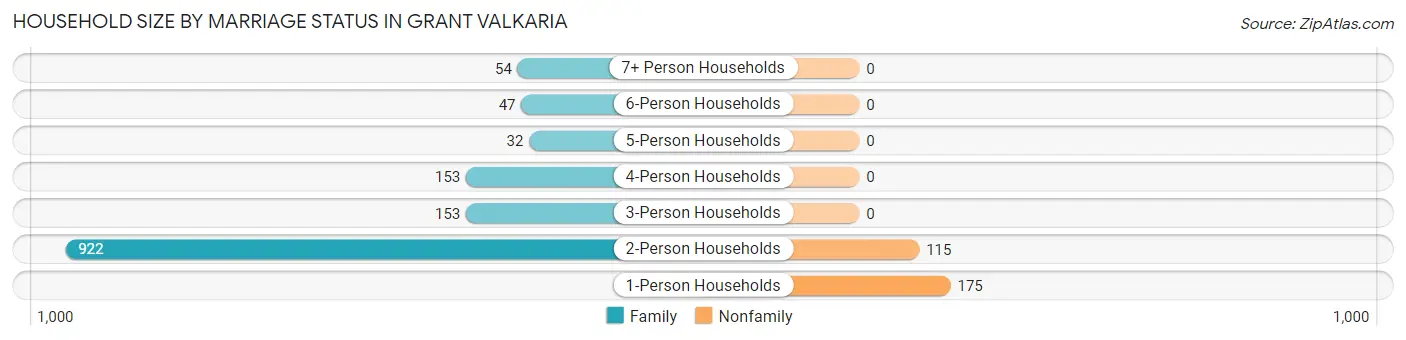
| Household Size | Family Households | Nonfamily Households |
| 1-Person Households | - | 175 (10.6%) |
| 2-Person Households | 922 (55.8%) | 115 (7.0%) |
| 3-Person Households | 153 (9.3%) | 0 (0.0%) |
| 4-Person Households | 153 (9.3%) | 0 (0.0%) |
| 5-Person Households | 32 (1.9%) | 0 (0.0%) |
| 6-Person Households | 47 (2.9%) | 0 (0.0%) |
| 7+ Person Households | 54 (3.3%) | 0 (0.0%) |
| Total | 1,361 (82.4%) | 290 (17.6%) |
Female Fertility in Grant Valkaria
Fertility by Age in Grant Valkaria
Average fertility rate in Grant Valkaria is 80.0 births per 1,000 women. Women in the age bracket of 20 to 34 years have the highest fertility rate with 172.0 births per 1,000 women. Women in the age bracket of 20 to 34 years acount for 100.0% of all women with births.
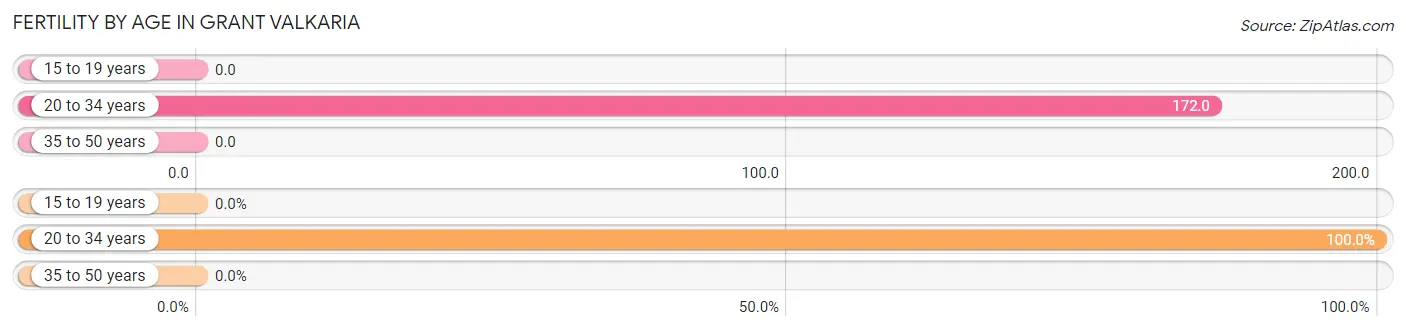
| Age Bracket | Women with Births | Births / 1,000 Women |
| 15 to 19 years | 0 (0.0%) | 0.0 |
| 20 to 34 years | 71 (100.0%) | 172.0 |
| 35 to 50 years | 0 (0.0%) | 0.0 |
| Total | 71 (100.0%) | 80.0 |
Fertility by Age by Marriage Status in Grant Valkaria
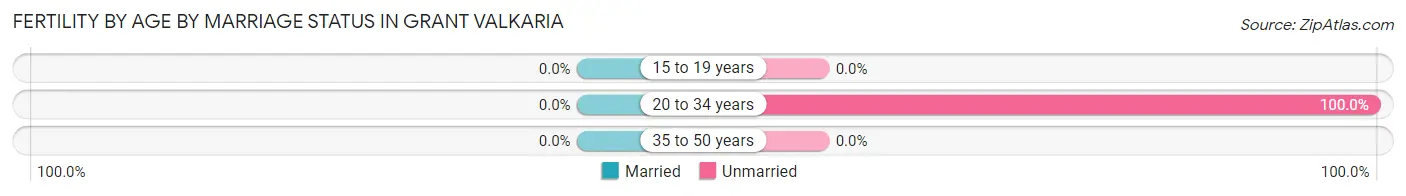
| Age Bracket | Married | Unmarried |
| 15 to 19 years | 0 (0.0%) | 0 (0.0%) |
| 20 to 34 years | 0 (0.0%) | 71 (100.0%) |
| 35 to 50 years | 0 (0.0%) | 0 (0.0%) |
| Total | 0 (0.0%) | 71 (100.0%) |
Fertility by Education in Grant Valkaria
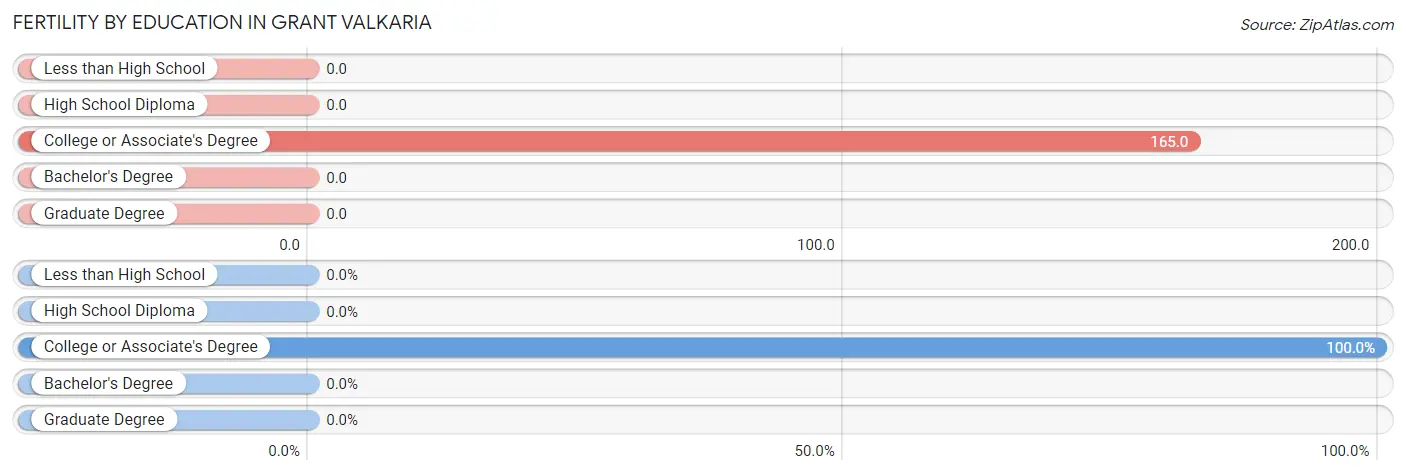
| Educational Attainment | Women with Births | Births / 1,000 Women |
| Less than High School | 0 (0.0%) | 0.0 |
| High School Diploma | 0 (0.0%) | 0.0 |
| College or Associate's Degree | 71 (100.0%) | 165.0 |
| Bachelor's Degree | 0 (0.0%) | 0.0 |
| Graduate Degree | 0 (0.0%) | 0.0 |
| Total | 71 (100.0%) | 80.0 |
Fertility by Education by Marriage Status in Grant Valkaria
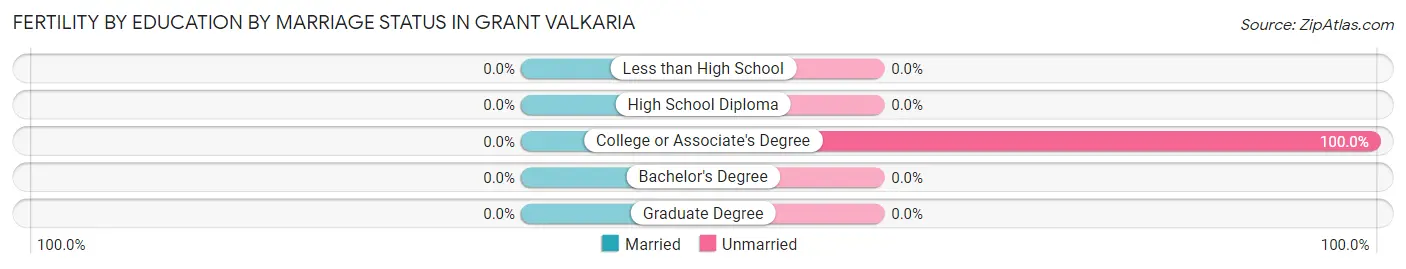
| Educational Attainment | Married | Unmarried |
| Less than High School | 0 (0.0%) | 0 (0.0%) |
| High School Diploma | 0 (0.0%) | 0 (0.0%) |
| College or Associate's Degree | 0 (0.0%) | 71 (100.0%) |
| Bachelor's Degree | 0 (0.0%) | 0 (0.0%) |
| Graduate Degree | 0 (0.0%) | 0 (0.0%) |
| Total | 0 (0.0%) | 71 (100.0%) |
Income in Grant Valkaria
Income Overview in Grant Valkaria
Per Capita Income in Grant Valkaria is $45,113, while median incomes of families and households are $119,609 and $109,850 respectively.
| Characteristic | Number | Measure |
| Per Capita Income | 4,520 | $45,113 |
| Median Family Income | 1,361 | $119,609 |
| Mean Family Income | 1,361 | $129,883 |
| Median Household Income | 1,651 | $109,850 |
| Mean Household Income | 1,651 | $121,021 |
| Income Deficit | 1,361 | $0 |
| Wage / Income Gap (%) | 4,520 | 50.62% |
| Wage / Income Gap ($) | 4,520 | 49.38¢ per $1 |
| Gini / Inequality Index | 4,520 | 0.41 |
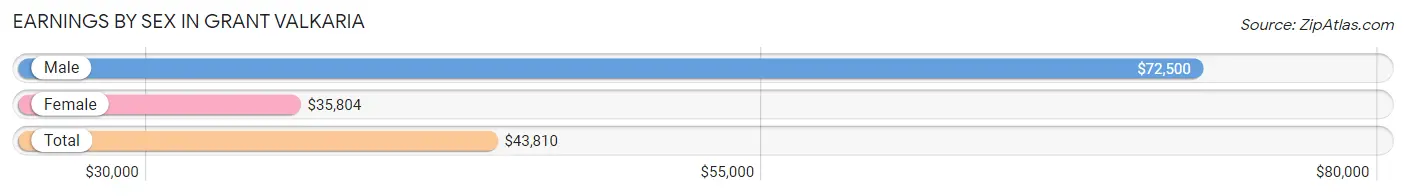
Earnings by Sex in Grant Valkaria
Average Earnings in Grant Valkaria are $43,810, $72,500 for men and $35,804 for women, a difference of 50.6%.
| Sex | Number | Average Earnings |
| Male | 1,060 (51.3%) | $72,500 |
| Female | 1,008 (48.7%) | $35,804 |
| Total | 2,068 (100.0%) | $43,810 |
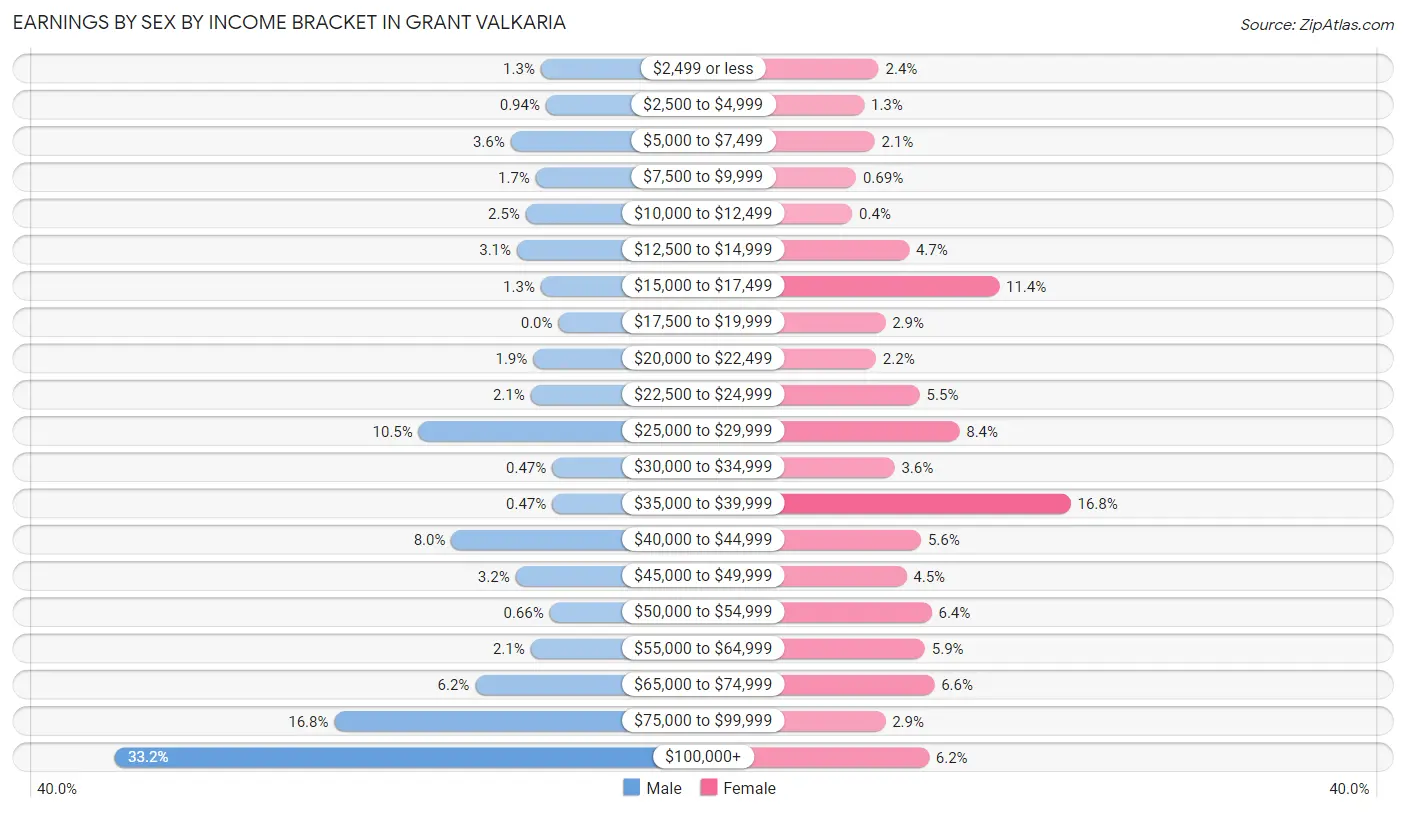
Earnings by Sex by Income Bracket in Grant Valkaria
The most common earnings brackets in Grant Valkaria are $100,000+ for men (352 | 33.2%) and $35,000 to $39,999 for women (169 | 16.8%).
| Income | Male | Female |
| $2,499 or less | 14 (1.3%) | 24 (2.4%) |
| $2,500 to $4,999 | 10 (0.9%) | 13 (1.3%) |
| $5,000 to $7,499 | 38 (3.6%) | 21 (2.1%) |
| $7,500 to $9,999 | 18 (1.7%) | 7 (0.7%) |
| $10,000 to $12,499 | 26 (2.5%) | 4 (0.4%) |
| $12,500 to $14,999 | 33 (3.1%) | 47 (4.7%) |
| $15,000 to $17,499 | 14 (1.3%) | 115 (11.4%) |
| $17,500 to $19,999 | 0 (0.0%) | 29 (2.9%) |
| $20,000 to $22,499 | 20 (1.9%) | 22 (2.2%) |
| $22,500 to $24,999 | 22 (2.1%) | 55 (5.5%) |
| $25,000 to $29,999 | 111 (10.5%) | 85 (8.4%) |
| $30,000 to $34,999 | 5 (0.5%) | 36 (3.6%) |
| $35,000 to $39,999 | 5 (0.5%) | 169 (16.8%) |
| $40,000 to $44,999 | 85 (8.0%) | 56 (5.6%) |
| $45,000 to $49,999 | 34 (3.2%) | 45 (4.5%) |
| $50,000 to $54,999 | 7 (0.7%) | 64 (6.4%) |
| $55,000 to $64,999 | 22 (2.1%) | 59 (5.9%) |
| $65,000 to $74,999 | 66 (6.2%) | 66 (6.6%) |
| $75,000 to $99,999 | 178 (16.8%) | 29 (2.9%) |
| $100,000+ | 352 (33.2%) | 62 (6.1%) |
| Total | 1,060 (100.0%) | 1,008 (100.0%) |
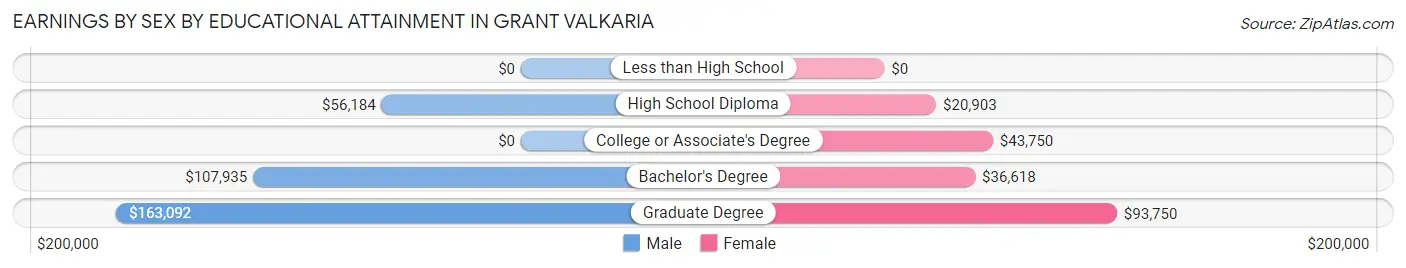
Earnings by Sex by Educational Attainment in Grant Valkaria
Average earnings in Grant Valkaria are $76,167 for men and $38,317 for women, a difference of 49.7%. Men with an educational attainment of graduate degree enjoy the highest average annual earnings of $163,092, while those with high school diploma education earn the least with $56,184. Women with an educational attainment of graduate degree earn the most with the average annual earnings of $93,750, while those with high school diploma education have the smallest earnings of $20,903.
| Educational Attainment | Male Income | Female Income |
| Less than High School | - | - |
| High School Diploma | $56,184 | $20,903 |
| College or Associate's Degree | - | - |
| Bachelor's Degree | $107,935 | $36,618 |
| Graduate Degree | $163,092 | $93,750 |
| Total | $76,167 | $38,317 |
Family Income in Grant Valkaria
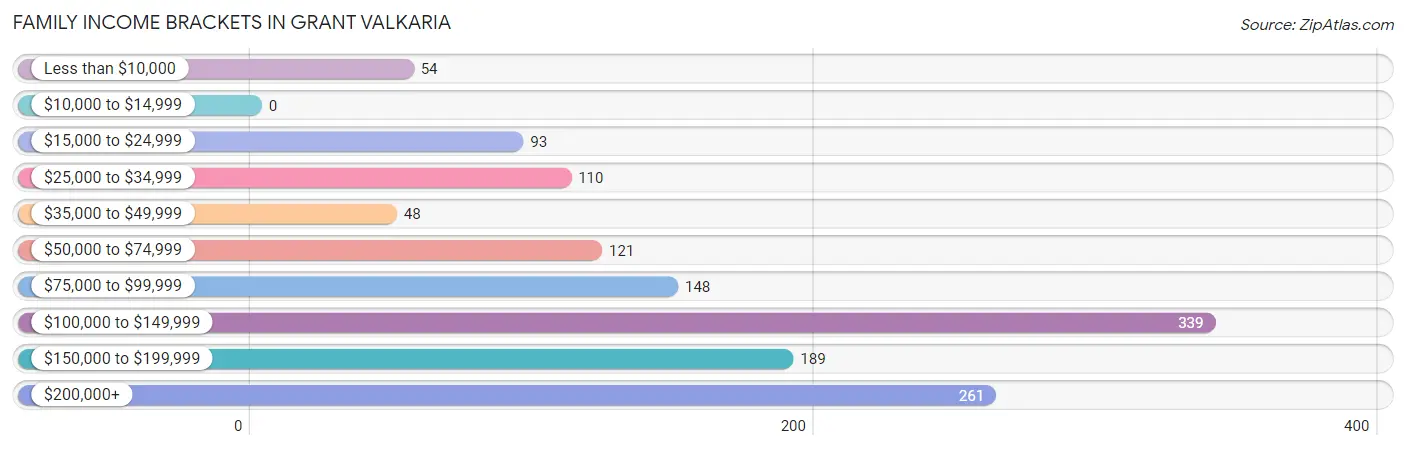
Family Income Brackets in Grant Valkaria
According to the Grant Valkaria family income data, there are 339 families falling into the $100,000 to $149,999 income range, which is the most common income bracket and makes up 24.9% of all families.
| Income Bracket | # Families | % Families |
| Less than $10,000 | 54 | 4.0% |
| $10,000 to $14,999 | 0 | 0.0% |
| $15,000 to $24,999 | 93 | 6.8% |
| $25,000 to $34,999 | 110 | 8.1% |
| $35,000 to $49,999 | 48 | 3.5% |
| $50,000 to $74,999 | 121 | 8.9% |
| $75,000 to $99,999 | 148 | 10.9% |
| $100,000 to $149,999 | 339 | 24.9% |
| $150,000 to $199,999 | 189 | 13.9% |
| $200,000+ | 261 | 19.2% |
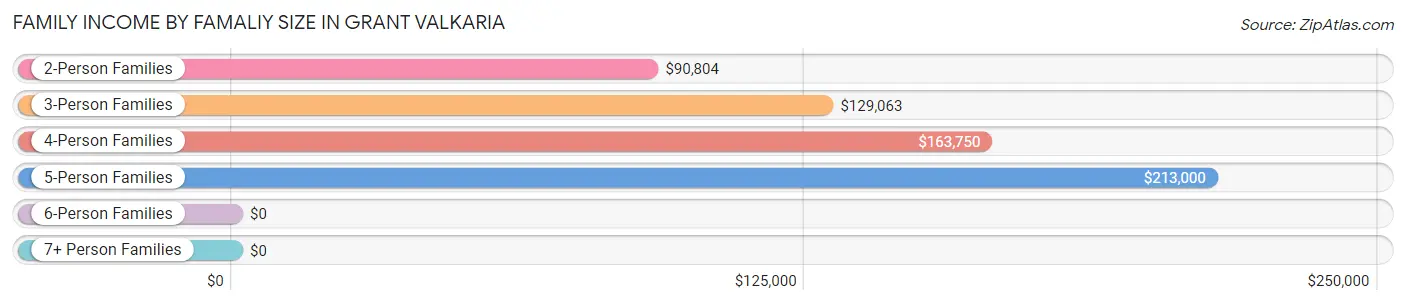
Family Income by Famaliy Size in Grant Valkaria
5-person families (32 | 2.4%) account for the highest median family income in Grant Valkaria with $213,000 per family, while 2-person families (931 | 68.4%) have the highest median income of $45,402 per family member.
| Income Bracket | # Families | Median Income |
| 2-Person Families | 931 (68.4%) | $90,804 |
| 3-Person Families | 180 (13.2%) | $129,063 |
| 4-Person Families | 117 (8.6%) | $163,750 |
| 5-Person Families | 32 (2.4%) | $213,000 |
| 6-Person Families | 47 (3.5%) | $0 |
| 7+ Person Families | 54 (4.0%) | $0 |
| Total | 1,361 (100.0%) | $119,609 |
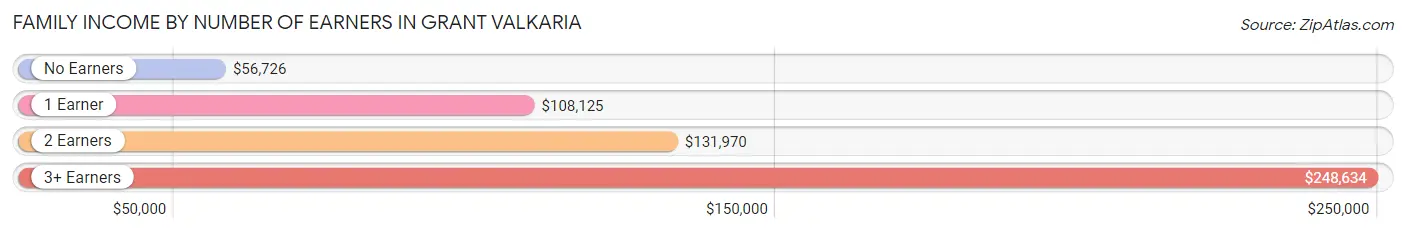
Family Income by Number of Earners in Grant Valkaria
The median family income in Grant Valkaria is $119,609, with families comprising 3+ earners (115) having the highest median family income of $248,634, while families with no earners (416) have the lowest median family income of $56,726, accounting for 8.5% and 30.6% of families, respectively.
| Number of Earners | # Families | Median Income |
| No Earners | 416 (30.6%) | $56,726 |
| 1 Earner | 444 (32.6%) | $108,125 |
| 2 Earners | 386 (28.4%) | $131,970 |
| 3+ Earners | 115 (8.5%) | $248,634 |
| Total | 1,361 (100.0%) | $119,609 |
Household Income in Grant Valkaria
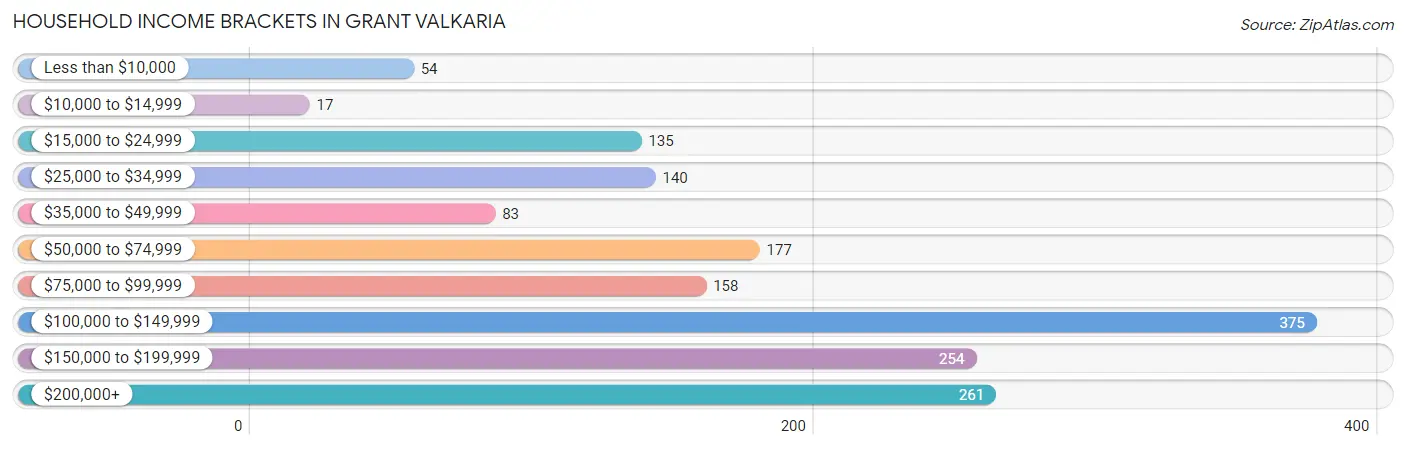
Household Income Brackets in Grant Valkaria
With 375 households falling in the category, the $100,000 to $149,999 income range is the most frequent in Grant Valkaria, accounting for 22.7% of all households. In contrast, only 17 households (1.0%) fall into the $10,000 to $14,999 income bracket, making it the least populous group.
| Income Bracket | # Households | % Households |
| Less than $10,000 | 54 | 3.3% |
| $10,000 to $14,999 | 17 | 1.0% |
| $15,000 to $24,999 | 135 | 8.2% |
| $25,000 to $34,999 | 140 | 8.5% |
| $35,000 to $49,999 | 83 | 5.0% |
| $50,000 to $74,999 | 177 | 10.7% |
| $75,000 to $99,999 | 158 | 9.6% |
| $100,000 to $149,999 | 375 | 22.7% |
| $150,000 to $199,999 | 254 | 15.4% |
| $200,000+ | 261 | 15.8% |
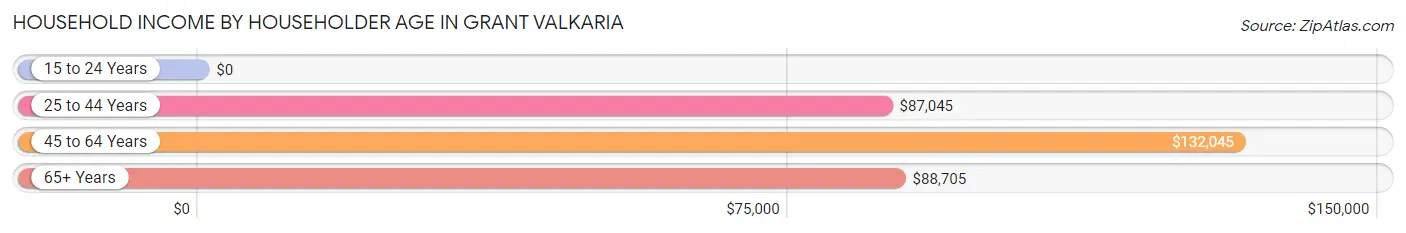
Household Income by Householder Age in Grant Valkaria
The median household income in Grant Valkaria is $109,850, with the highest median household income of $132,045 found in the 45 to 64 years age bracket for the primary householder. A total of 692 households (41.9%) fall into this category.
| Income Bracket | # Households | Median Income |
| 15 to 24 Years | 0 (0.0%) | $0 |
| 25 to 44 Years | 202 (12.2%) | $87,045 |
| 45 to 64 Years | 692 (41.9%) | $132,045 |
| 65+ Years | 757 (45.9%) | $88,705 |
| Total | 1,651 (100.0%) | $109,850 |
Poverty in Grant Valkaria
Income Below Poverty by Sex and Age in Grant Valkaria
With 5.1% poverty level for males and 11.0% for females among the residents of Grant Valkaria, 35 to 44 year old males and 15 year old females are the most vulnerable to poverty, with 38 males (32.8%) and 46 females (100.0%) in their respective age groups living below the poverty level.
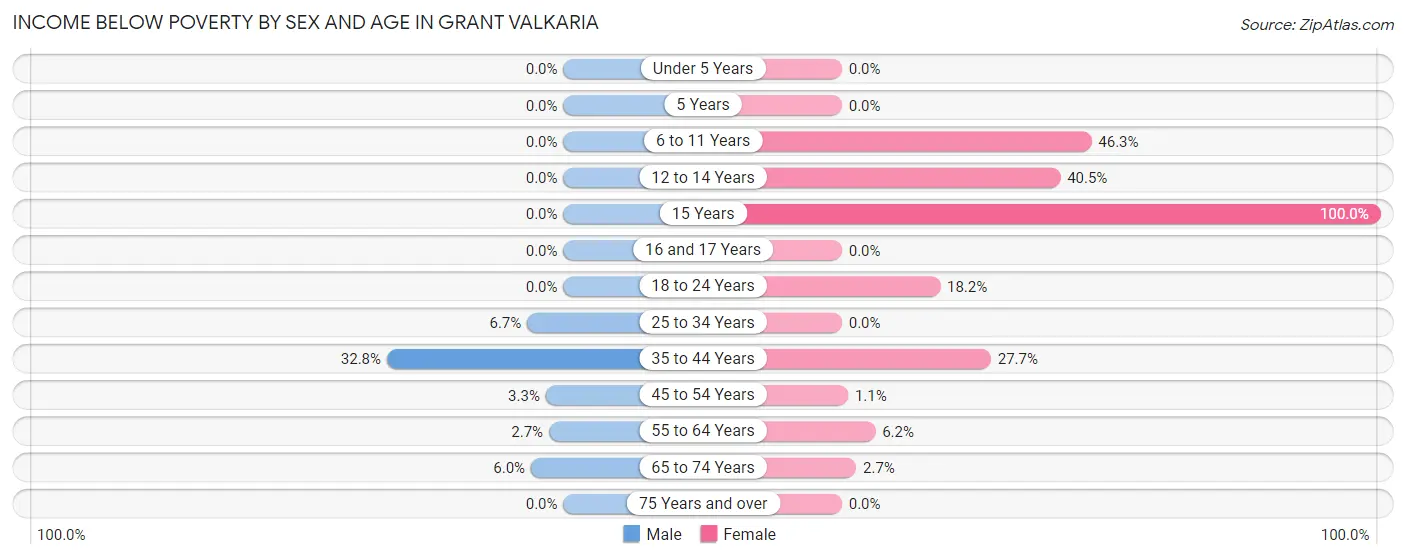
| Age Bracket | Male | Female |
| Under 5 Years | 0 (0.0%) | 0 (0.0%) |
| 5 Years | 0 (0.0%) | 0 (0.0%) |
| 6 to 11 Years | 0 (0.0%) | 44 (46.3%) |
| 12 to 14 Years | 0 (0.0%) | 45 (40.5%) |
| 15 Years | 0 (0.0%) | 46 (100.0%) |
| 16 and 17 Years | 0 (0.0%) | 0 (0.0%) |
| 18 to 24 Years | 0 (0.0%) | 56 (18.2%) |
| 25 to 34 Years | 20 (6.7%) | 0 (0.0%) |
| 35 to 44 Years | 38 (32.8%) | 39 (27.7%) |
| 45 to 54 Years | 10 (3.3%) | 4 (1.1%) |
| 55 to 64 Years | 12 (2.7%) | 19 (6.2%) |
| 65 to 74 Years | 26 (6.0%) | 14 (2.6%) |
| 75 Years and over | 0 (0.0%) | 0 (0.0%) |
| Total | 106 (5.1%) | 267 (11.0%) |
Income Above Poverty by Sex and Age in Grant Valkaria
According to the poverty statistics in Grant Valkaria, males aged under 5 years and females aged under 5 years are the age groups that are most secure financially, with 100.0% of males and 100.0% of females in these age groups living above the poverty line.
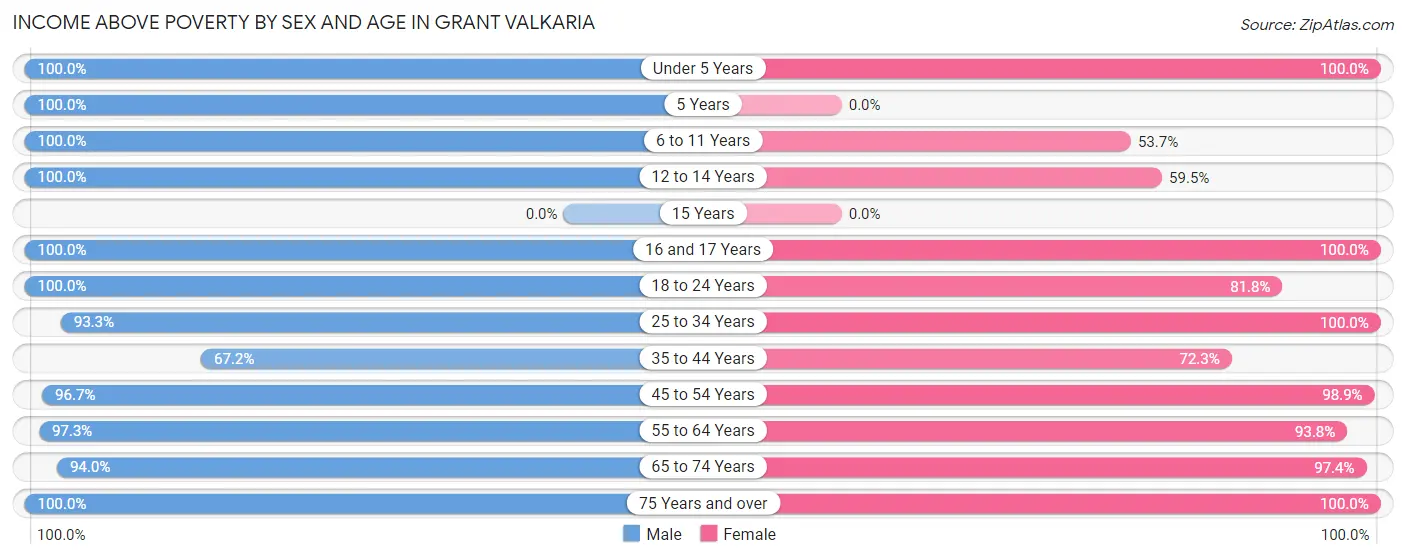
| Age Bracket | Male | Female |
| Under 5 Years | 75 (100.0%) | 73 (100.0%) |
| 5 Years | 29 (100.0%) | 0 (0.0%) |
| 6 to 11 Years | 112 (100.0%) | 51 (53.7%) |
| 12 to 14 Years | 3 (100.0%) | 66 (59.5%) |
| 15 Years | 0 (0.0%) | 0 (0.0%) |
| 16 and 17 Years | 3 (100.0%) | 38 (100.0%) |
| 18 to 24 Years | 42 (100.0%) | 251 (81.8%) |
| 25 to 34 Years | 277 (93.3%) | 169 (100.0%) |
| 35 to 44 Years | 78 (67.2%) | 102 (72.3%) |
| 45 to 54 Years | 296 (96.7%) | 348 (98.9%) |
| 55 to 64 Years | 438 (97.3%) | 287 (93.8%) |
| 65 to 74 Years | 406 (94.0%) | 515 (97.4%) |
| 75 Years and over | 236 (100.0%) | 252 (100.0%) |
| Total | 1,995 (95.0%) | 2,152 (89.0%) |
Income Below Poverty Among Married-Couple Families in Grant Valkaria
The poverty statistics for married-couple families in Grant Valkaria show that 5.0% or 64 of the total 1,283 families live below the poverty line. Families with 3 or 4 children have the highest poverty rate of 67.2%, comprising of 39 families. On the other hand, families with 1 or 2 children have the lowest poverty rate of 0.0%, which includes 0 families.
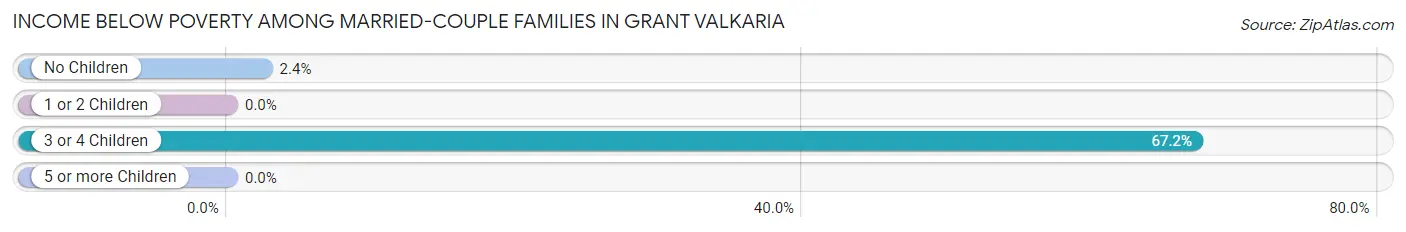
| Children | Above Poverty | Below Poverty |
| No Children | 1,012 (97.6%) | 25 (2.4%) |
| 1 or 2 Children | 188 (100.0%) | 0 (0.0%) |
| 3 or 4 Children | 19 (32.8%) | 39 (67.2%) |
| 5 or more Children | 0 (0.0%) | 0 (0.0%) |
| Total | 1,219 (95.0%) | 64 (5.0%) |
Income Below Poverty Among Single-Parent Households in Grant Valkaria
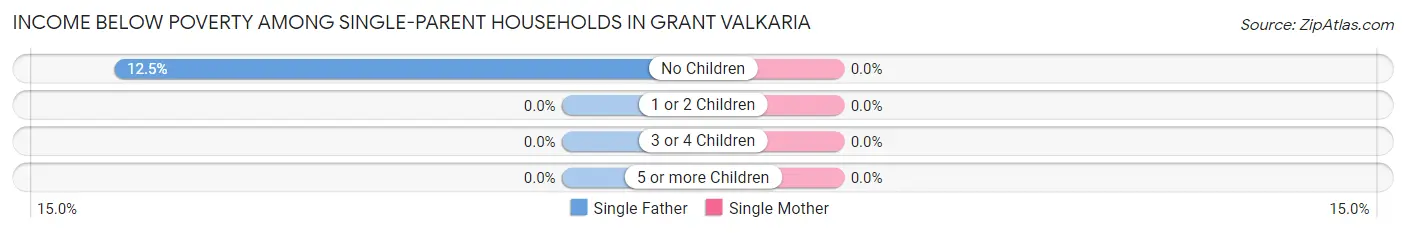
| Children | Single Father | Single Mother |
| No Children | 4 (12.5%) | 0 (0.0%) |
| 1 or 2 Children | 0 (0.0%) | 0 (0.0%) |
| 3 or 4 Children | 0 (0.0%) | 0 (0.0%) |
| 5 or more Children | 0 (0.0%) | 0 (0.0%) |
| Total | 4 (12.5%) | 0 (0.0%) |
Income Below Poverty Among Married-Couple vs Single-Parent Households in Grant Valkaria
The poverty data for Grant Valkaria shows that 64 of the married-couple family households (5.0%) and 4 of the single-parent households (5.1%) are living below the poverty level. Within the married-couple family households, those with 3 or 4 children have the highest poverty rate, with 39 households (67.2%) falling below the poverty line. Among the single-parent households, those with no children have the highest poverty rate, with 4 household (6.4%) living below poverty.
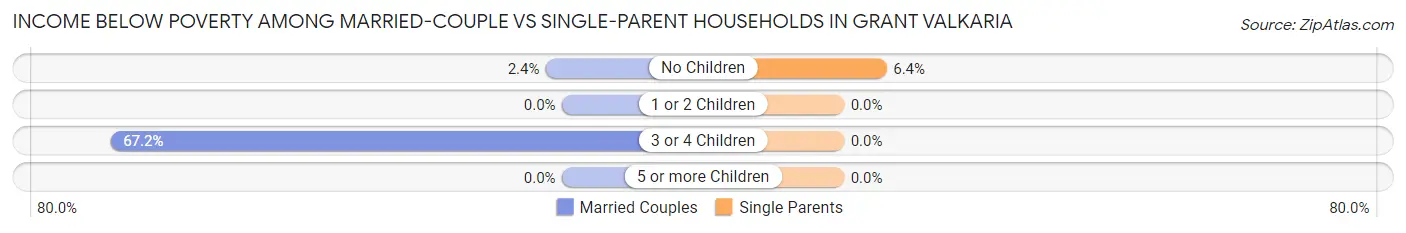
| Children | Married-Couple Families | Single-Parent Households |
| No Children | 25 (2.4%) | 4 (6.4%) |
| 1 or 2 Children | 0 (0.0%) | 0 (0.0%) |
| 3 or 4 Children | 39 (67.2%) | 0 (0.0%) |
| 5 or more Children | 0 (0.0%) | 0 (0.0%) |
| Total | 64 (5.0%) | 4 (5.1%) |
Employment Characteristics in Grant Valkaria
Employment by Class of Employer in Grant Valkaria
Among the 1,896 employed individuals in Grant Valkaria, private company employees (1,249 | 65.9%), not-for-profit organizations (230 | 12.1%), and self-employed (incorporated) (138 | 7.3%) make up the most common classes of employment.
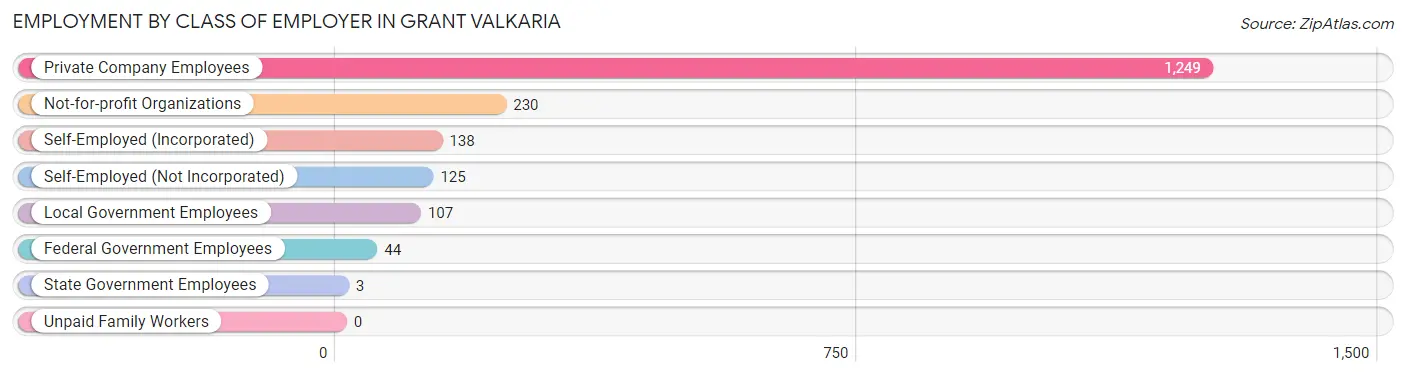
| Employer Class | # Employees | % Employees |
| Private Company Employees | 1,249 | 65.9% |
| Self-Employed (Incorporated) | 138 | 7.3% |
| Self-Employed (Not Incorporated) | 125 | 6.6% |
| Not-for-profit Organizations | 230 | 12.1% |
| Local Government Employees | 107 | 5.6% |
| State Government Employees | 3 | 0.2% |
| Federal Government Employees | 44 | 2.3% |
| Unpaid Family Workers | 0 | 0.0% |
| Total | 1,896 | 100.0% |
Employment Status by Age in Grant Valkaria
According to the labor force statistics for Grant Valkaria, out of the total population over 16 years of age (3,976), 48.9% or 1,944 individuals are in the labor force, with 1.1% or 21 of them unemployed. The age group with the highest labor force participation rate is 25 to 29 years, with 95.5% or 340 individuals in the labor force. Within the labor force, the 25 to 29 years age range has the highest percentage of unemployed individuals, with 6.5% or 22 of them being unemployed.
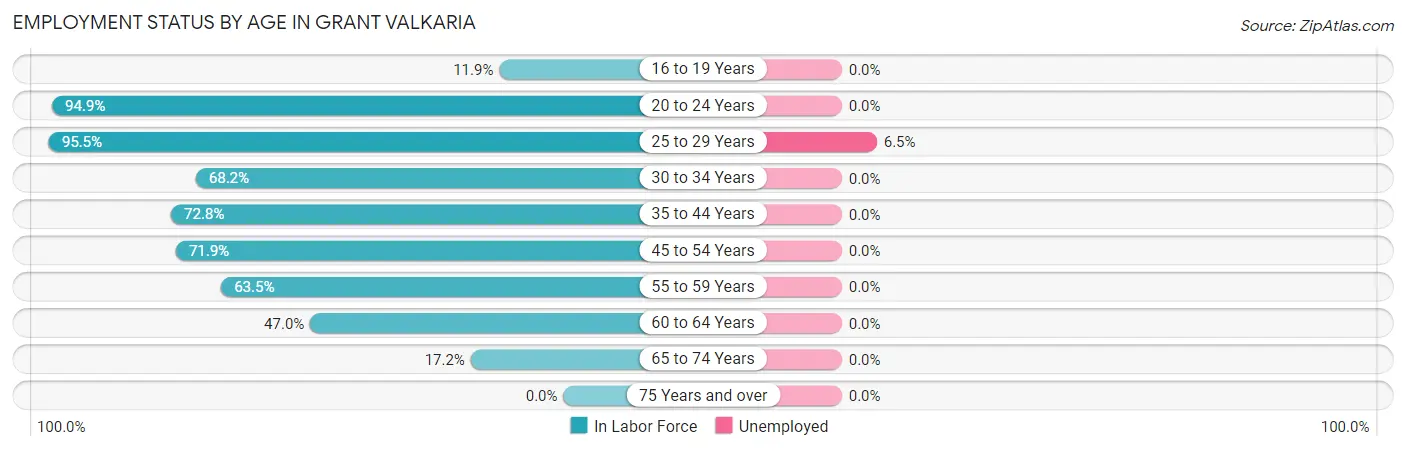
| Age Bracket | In Labor Force | Unemployed |
| 16 to 19 Years | 14 (11.9%) | 0 (0.0%) |
| 20 to 24 Years | 258 (94.9%) | 0 (0.0%) |
| 25 to 29 Years | 340 (95.5%) | 22 (6.5%) |
| 30 to 34 Years | 75 (68.2%) | 0 (0.0%) |
| 35 to 44 Years | 187 (72.8%) | 0 (0.0%) |
| 45 to 54 Years | 473 (71.9%) | 0 (0.0%) |
| 55 to 59 Years | 298 (63.5%) | 0 (0.0%) |
| 60 to 64 Years | 135 (47.0%) | 0 (0.0%) |
| 65 to 74 Years | 165 (17.2%) | 0 (0.0%) |
| 75 Years and over | 0 (0.0%) | 0 (0.0%) |
| Total | 1,944 (48.9%) | 21 (1.1%) |
Employment Status by Educational Attainment in Grant Valkaria
According to labor force statistics for Grant Valkaria, 70.6% of individuals (1,509) out of the total population between 25 and 64 years of age (2,137) are in the labor force, with 1.5% or 23 of them being unemployed. The group with the highest labor force participation rate are those with the educational attainment of less than high school, with 84.9% or 45 individuals in the labor force. Within the labor force, individuals with bachelor's degree or higher education have the highest percentage of unemployment, with 5.1% or 22 of them being unemployed.
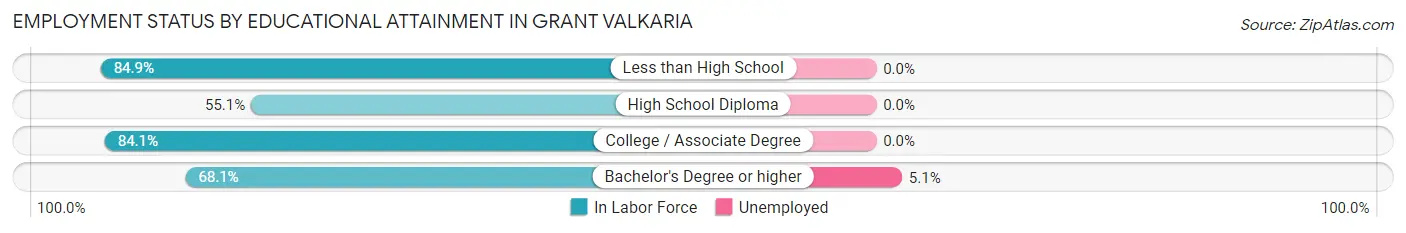
| Educational Attainment | In Labor Force | Unemployed |
| Less than High School | 45 (84.9%) | 0 (0.0%) |
| High School Diploma | 359 (55.1%) | 0 (0.0%) |
| College / Associate Degree | 675 (84.1%) | 0 (0.0%) |
| Bachelor's Degree or higher | 429 (68.1%) | 32 (5.1%) |
| Total | 1,509 (70.6%) | 32 (1.5%) |
Employment Occupations by Sex in Grant Valkaria
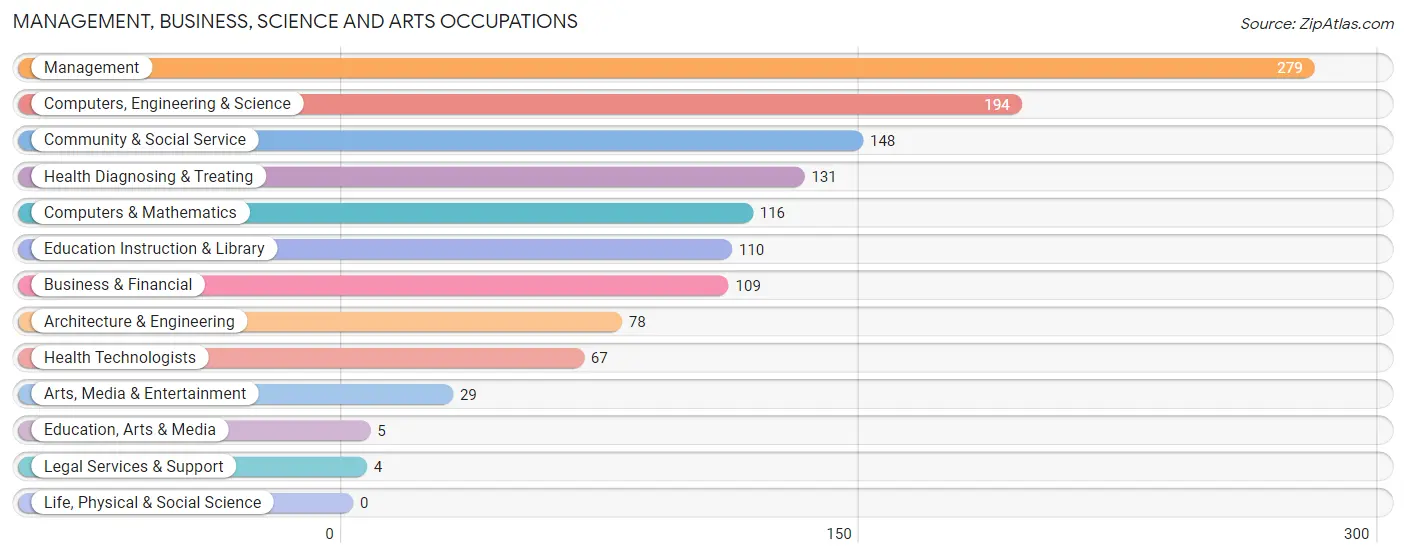
Management, Business, Science and Arts Occupations
The most common Management, Business, Science and Arts occupations in Grant Valkaria are Management (279 | 14.5%), Computers, Engineering & Science (194 | 10.1%), Community & Social Service (148 | 7.7%), Health Diagnosing & Treating (131 | 6.8%), and Computers & Mathematics (116 | 6.0%).
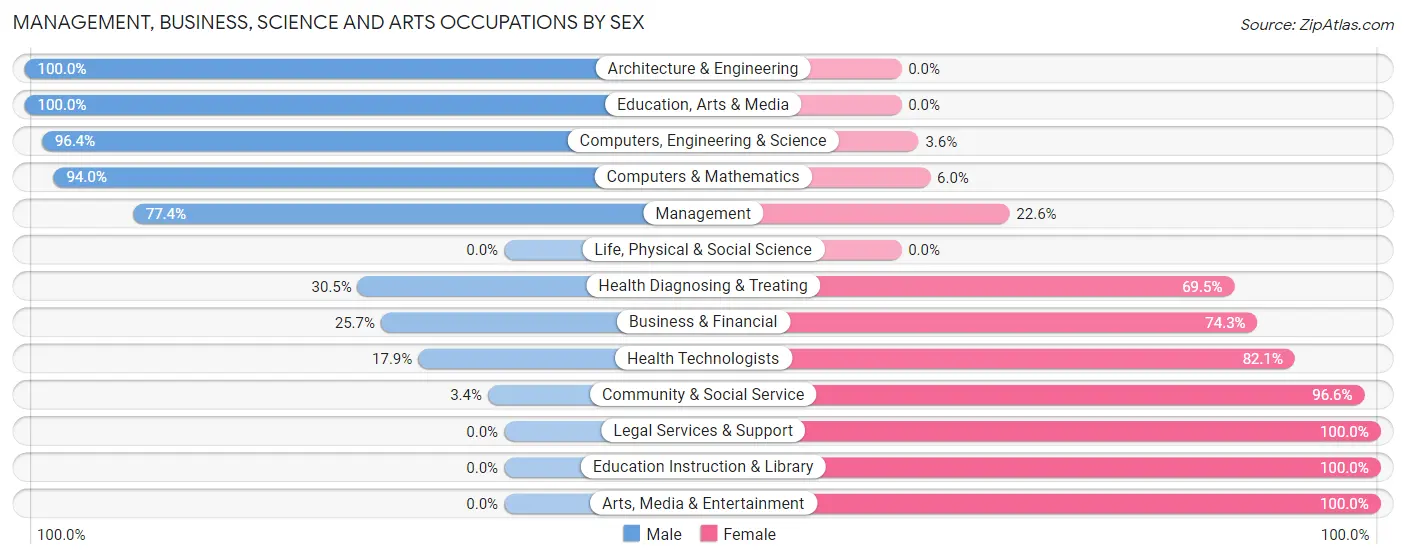
Management, Business, Science and Arts Occupations by Sex
Within the Management, Business, Science and Arts occupations in Grant Valkaria, the most male-oriented occupations are Architecture & Engineering (100.0%), Education, Arts & Media (100.0%), and Computers, Engineering & Science (96.4%), while the most female-oriented occupations are Legal Services & Support (100.0%), Education Instruction & Library (100.0%), and Arts, Media & Entertainment (100.0%).
| Occupation | Male | Female |
| Management | 216 (77.4%) | 63 (22.6%) |
| Business & Financial | 28 (25.7%) | 81 (74.3%) |
| Computers, Engineering & Science | 187 (96.4%) | 7 (3.6%) |
| Computers & Mathematics | 109 (94.0%) | 7 (6.0%) |
| Architecture & Engineering | 78 (100.0%) | 0 (0.0%) |
| Life, Physical & Social Science | 0 (0.0%) | 0 (0.0%) |
| Community & Social Service | 5 (3.4%) | 143 (96.6%) |
| Education, Arts & Media | 5 (100.0%) | 0 (0.0%) |
| Legal Services & Support | 0 (0.0%) | 4 (100.0%) |
| Education Instruction & Library | 0 (0.0%) | 110 (100.0%) |
| Arts, Media & Entertainment | 0 (0.0%) | 29 (100.0%) |
| Health Diagnosing & Treating | 40 (30.5%) | 91 (69.5%) |
| Health Technologists | 12 (17.9%) | 55 (82.1%) |
| Total (Category) | 476 (55.3%) | 385 (44.7%) |
| Total (Overall) | 950 (49.4%) | 973 (50.6%) |
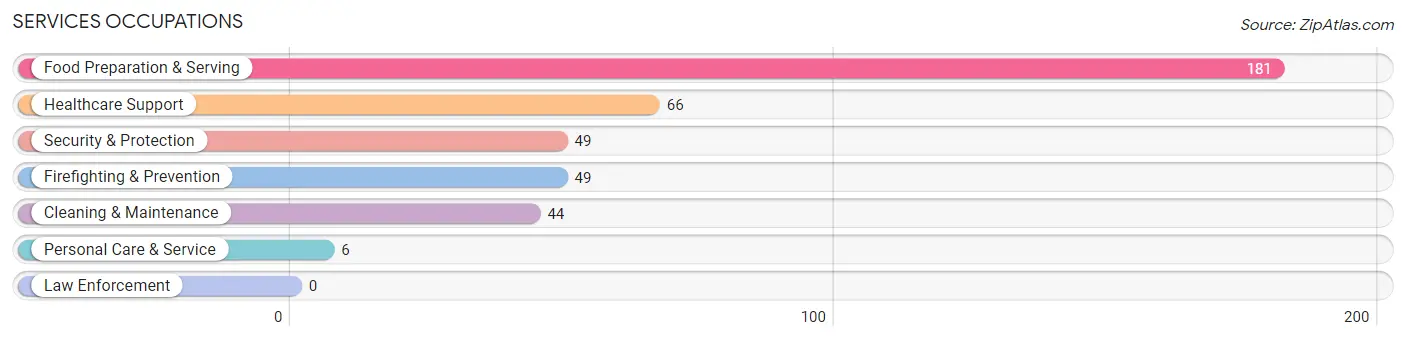
Services Occupations
The most common Services occupations in Grant Valkaria are Food Preparation & Serving (181 | 9.4%), Healthcare Support (66 | 3.4%), Security & Protection (49 | 2.5%), Firefighting & Prevention (49 | 2.5%), and Cleaning & Maintenance (44 | 2.3%).
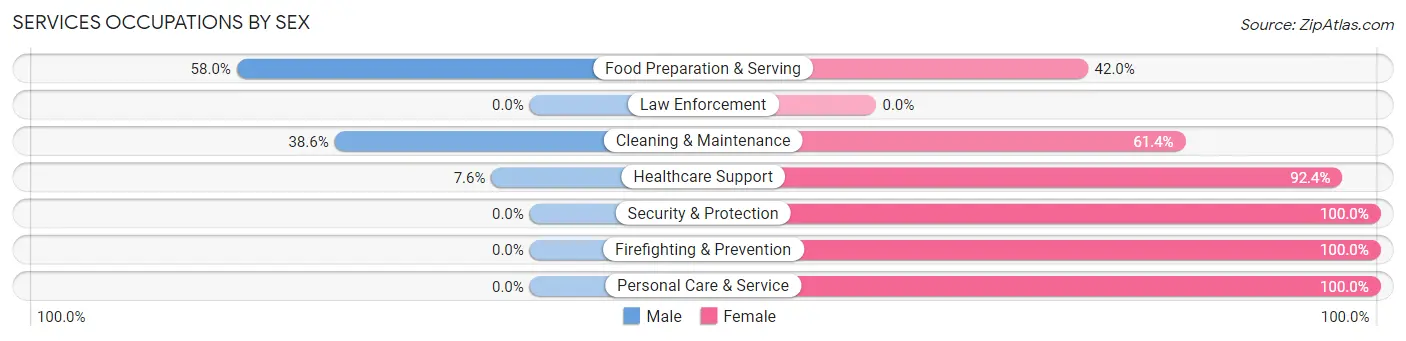
Services Occupations by Sex
Within the Services occupations in Grant Valkaria, the most male-oriented occupations are Food Preparation & Serving (58.0%), Cleaning & Maintenance (38.6%), and Healthcare Support (7.6%), while the most female-oriented occupations are Security & Protection (100.0%), Firefighting & Prevention (100.0%), and Personal Care & Service (100.0%).
| Occupation | Male | Female |
| Healthcare Support | 5 (7.6%) | 61 (92.4%) |
| Security & Protection | 0 (0.0%) | 49 (100.0%) |
| Firefighting & Prevention | 0 (0.0%) | 49 (100.0%) |
| Law Enforcement | 0 (0.0%) | 0 (0.0%) |
| Food Preparation & Serving | 105 (58.0%) | 76 (42.0%) |
| Cleaning & Maintenance | 17 (38.6%) | 27 (61.4%) |
| Personal Care & Service | 0 (0.0%) | 6 (100.0%) |
| Total (Category) | 127 (36.7%) | 219 (63.3%) |
| Total (Overall) | 950 (49.4%) | 973 (50.6%) |
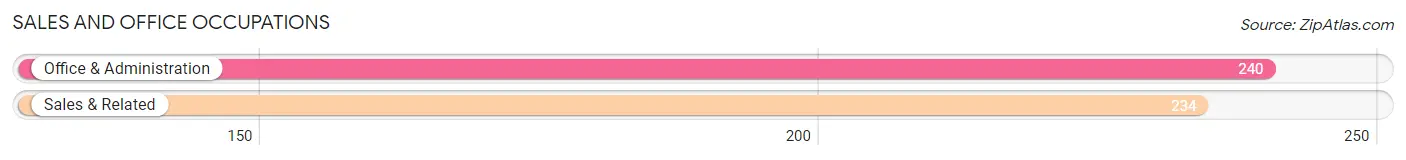
Sales and Office Occupations
The most common Sales and Office occupations in Grant Valkaria are Office & Administration (240 | 12.5%), and Sales & Related (234 | 12.2%).
Sales and Office Occupations by Sex
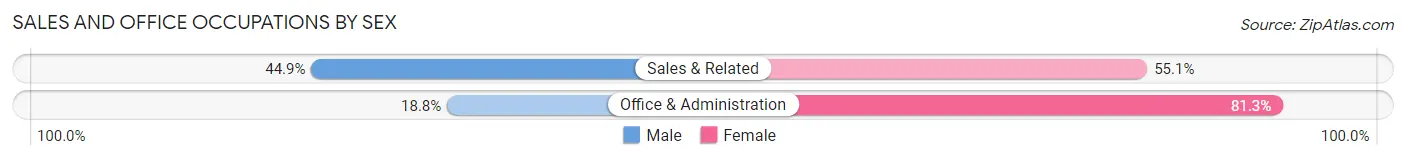
| Occupation | Male | Female |
| Sales & Related | 105 (44.9%) | 129 (55.1%) |
| Office & Administration | 45 (18.8%) | 195 (81.2%) |
| Total (Category) | 150 (31.7%) | 324 (68.3%) |
| Total (Overall) | 950 (49.4%) | 973 (50.6%) |
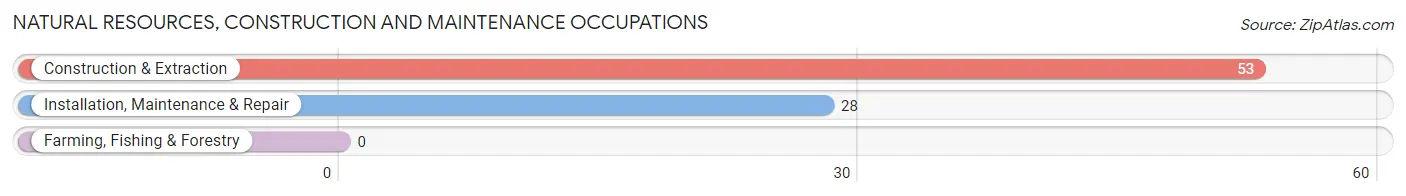
Natural Resources, Construction and Maintenance Occupations
The most common Natural Resources, Construction and Maintenance occupations in Grant Valkaria are Construction & Extraction (53 | 2.8%), and Installation, Maintenance & Repair (28 | 1.5%).
Natural Resources, Construction and Maintenance Occupations by Sex
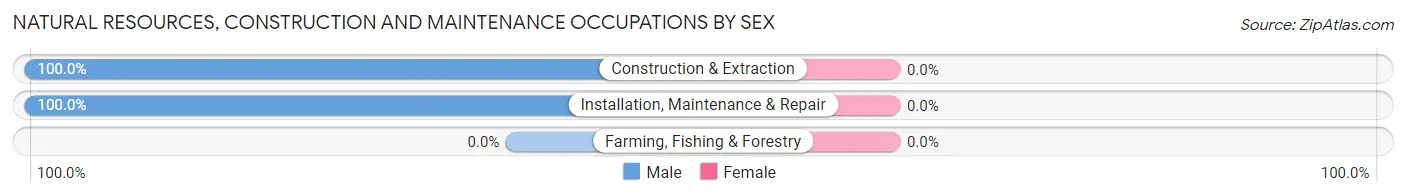
| Occupation | Male | Female |
| Farming, Fishing & Forestry | 0 (0.0%) | 0 (0.0%) |
| Construction & Extraction | 53 (100.0%) | 0 (0.0%) |
| Installation, Maintenance & Repair | 28 (100.0%) | 0 (0.0%) |
| Total (Category) | 81 (100.0%) | 0 (0.0%) |
| Total (Overall) | 950 (49.4%) | 973 (50.6%) |
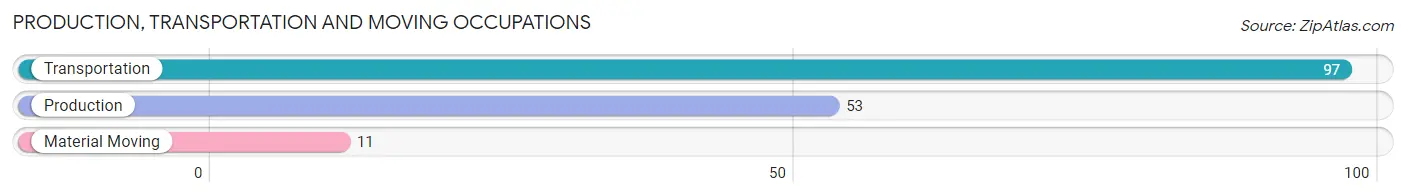
Production, Transportation and Moving Occupations
The most common Production, Transportation and Moving occupations in Grant Valkaria are Transportation (97 | 5.0%), Production (53 | 2.8%), and Material Moving (11 | 0.6%).
Production, Transportation and Moving Occupations by Sex
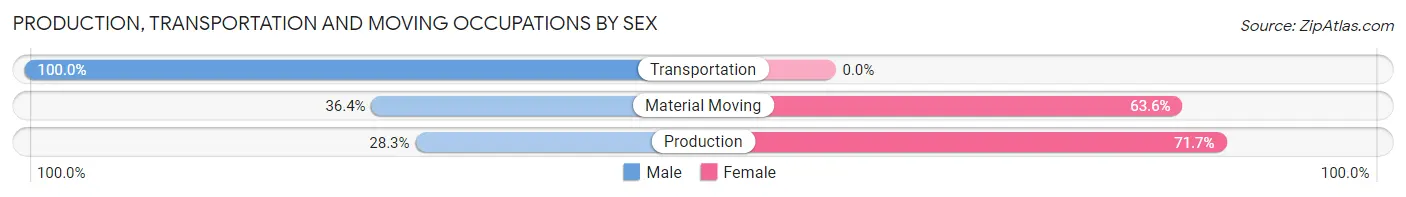
| Occupation | Male | Female |
| Production | 15 (28.3%) | 38 (71.7%) |
| Transportation | 97 (100.0%) | 0 (0.0%) |
| Material Moving | 4 (36.4%) | 7 (63.6%) |
| Total (Category) | 116 (72.1%) | 45 (28.0%) |
| Total (Overall) | 950 (49.4%) | 973 (50.6%) |
Employment Industries by Sex in Grant Valkaria
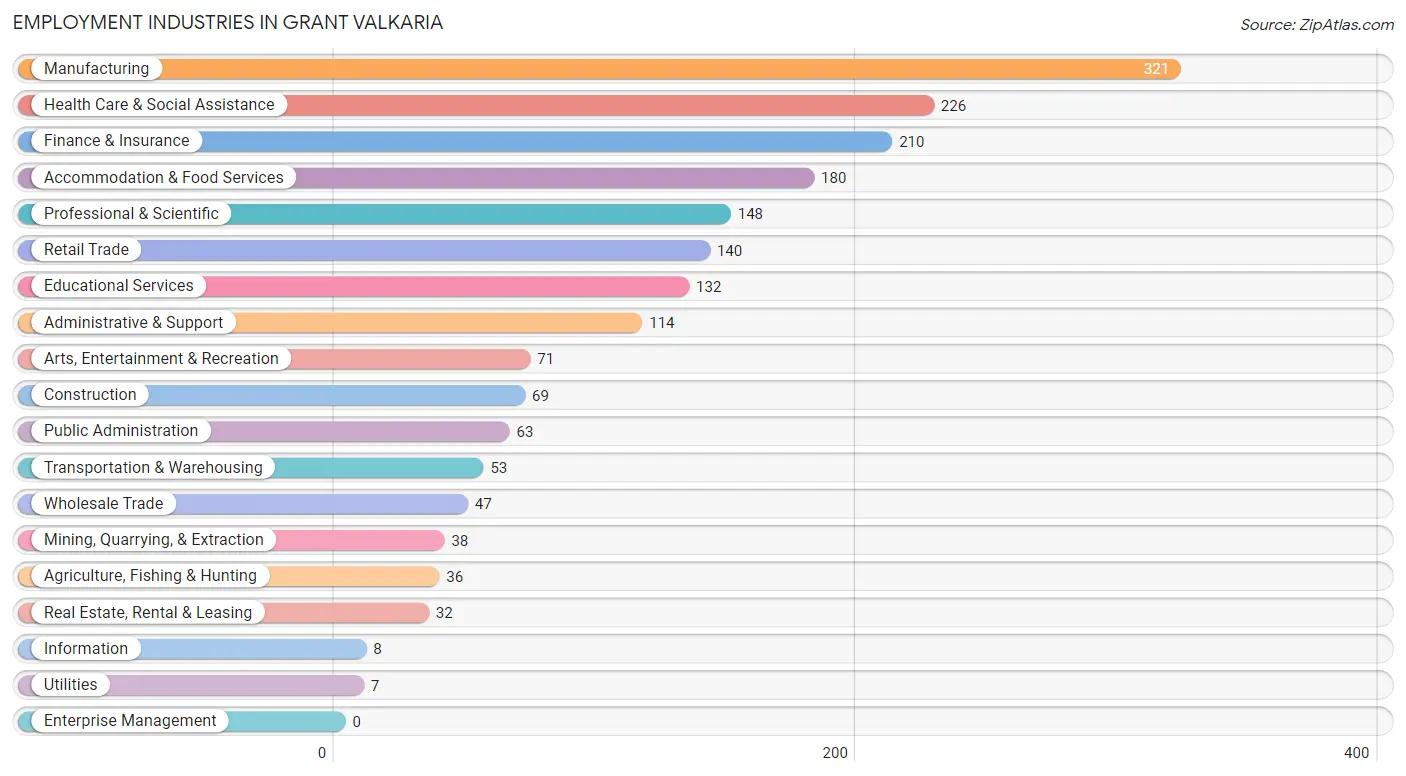
Employment Industries in Grant Valkaria
The major employment industries in Grant Valkaria include Manufacturing (321 | 16.7%), Health Care & Social Assistance (226 | 11.7%), Finance & Insurance (210 | 10.9%), Accommodation & Food Services (180 | 9.4%), and Professional & Scientific (148 | 7.7%).
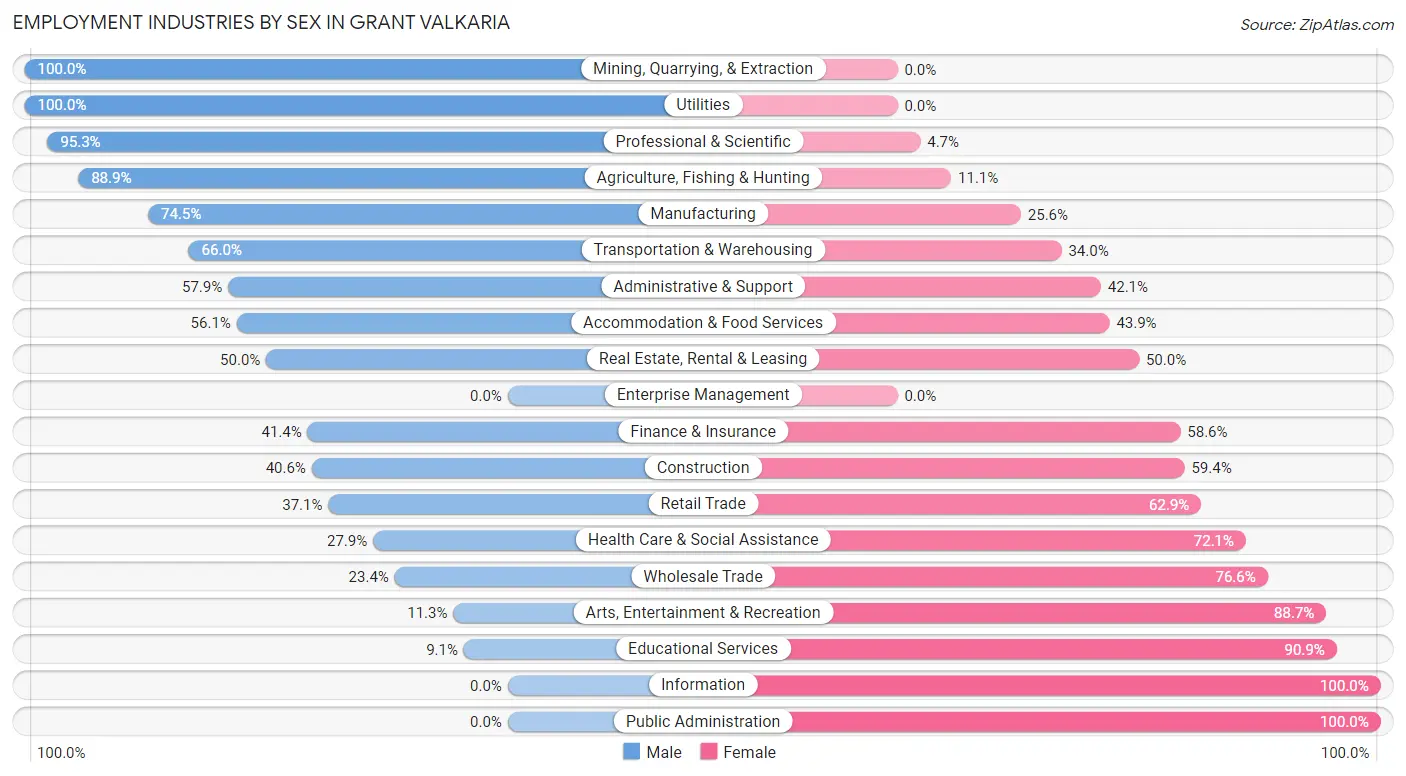
Employment Industries by Sex in Grant Valkaria
The Grant Valkaria industries that see more men than women are Mining, Quarrying, & Extraction (100.0%), Utilities (100.0%), and Professional & Scientific (95.3%), whereas the industries that tend to have a higher number of women are Information (100.0%), Public Administration (100.0%), and Educational Services (90.9%).
| Industry | Male | Female |
| Agriculture, Fishing & Hunting | 32 (88.9%) | 4 (11.1%) |
| Mining, Quarrying, & Extraction | 38 (100.0%) | 0 (0.0%) |
| Construction | 28 (40.6%) | 41 (59.4%) |
| Manufacturing | 239 (74.5%) | 82 (25.6%) |
| Wholesale Trade | 11 (23.4%) | 36 (76.6%) |
| Retail Trade | 52 (37.1%) | 88 (62.9%) |
| Transportation & Warehousing | 35 (66.0%) | 18 (34.0%) |
| Utilities | 7 (100.0%) | 0 (0.0%) |
| Information | 0 (0.0%) | 8 (100.0%) |
| Finance & Insurance | 87 (41.4%) | 123 (58.6%) |
| Real Estate, Rental & Leasing | 16 (50.0%) | 16 (50.0%) |
| Professional & Scientific | 141 (95.3%) | 7 (4.7%) |
| Enterprise Management | 0 (0.0%) | 0 (0.0%) |
| Administrative & Support | 66 (57.9%) | 48 (42.1%) |
| Educational Services | 12 (9.1%) | 120 (90.9%) |
| Health Care & Social Assistance | 63 (27.9%) | 163 (72.1%) |
| Arts, Entertainment & Recreation | 8 (11.3%) | 63 (88.7%) |
| Accommodation & Food Services | 101 (56.1%) | 79 (43.9%) |
| Public Administration | 0 (0.0%) | 63 (100.0%) |
| Total | 950 (49.4%) | 973 (50.6%) |
Education in Grant Valkaria
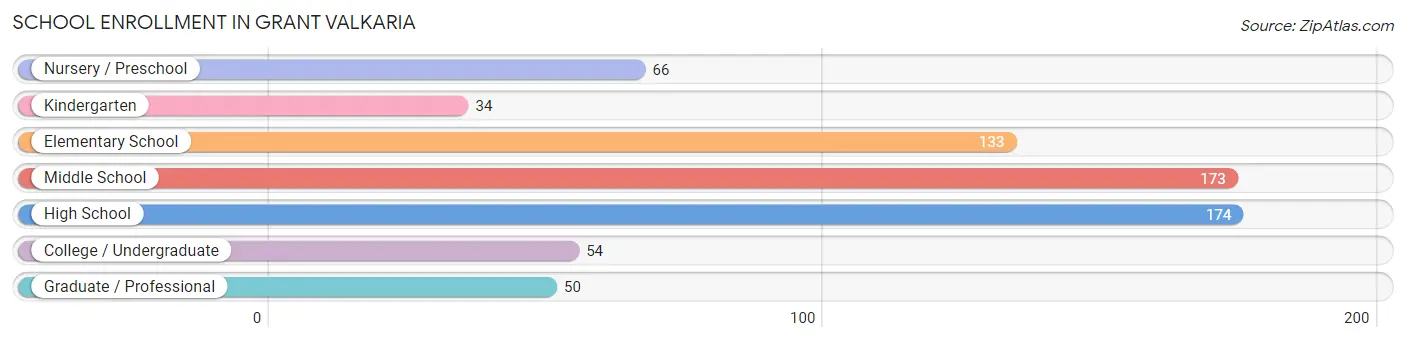
School Enrollment in Grant Valkaria
The most common levels of schooling among the 684 students in Grant Valkaria are high school (174 | 25.4%), middle school (173 | 25.3%), and elementary school (133 | 19.4%).
| School Level | # Students | % Students |
| Nursery / Preschool | 66 | 9.7% |
| Kindergarten | 34 | 5.0% |
| Elementary School | 133 | 19.4% |
| Middle School | 173 | 25.3% |
| High School | 174 | 25.4% |
| College / Undergraduate | 54 | 7.9% |
| Graduate / Professional | 50 | 7.3% |
| Total | 684 | 100.0% |
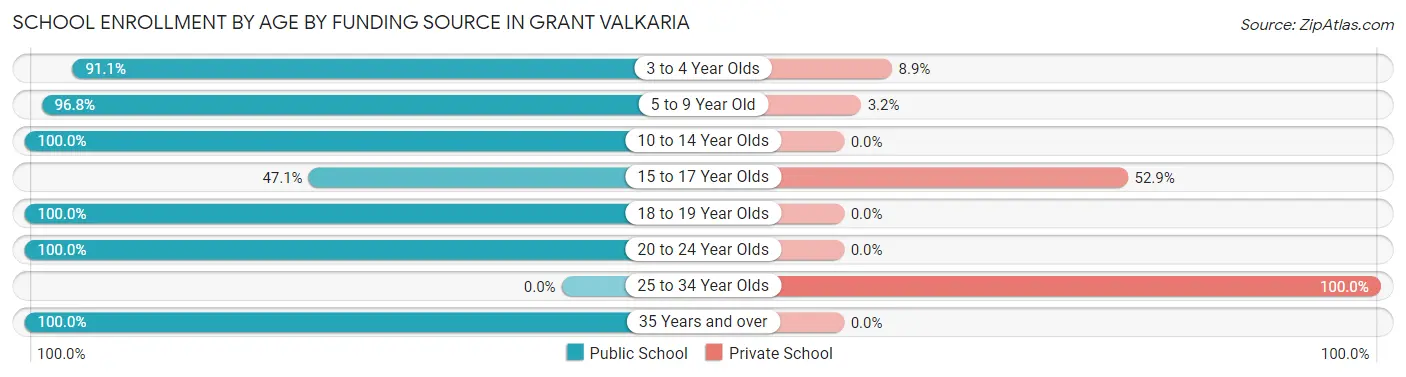
School Enrollment by Age by Funding Source in Grant Valkaria
Out of a total of 684 students who are enrolled in schools in Grant Valkaria, 101 (14.8%) attend a private institution, while the remaining 583 (85.2%) are enrolled in public schools. The age group of 25 to 34 year olds has the highest likelihood of being enrolled in private schools, with 45 (100.0% in the age bracket) enrolled. Conversely, the age group of 10 to 14 year olds has the lowest likelihood of being enrolled in a private school, with 193 (100.0% in the age bracket) attending a public institution.
| Age Bracket | Public School | Private School |
| 3 to 4 Year Olds | 51 (91.1%) | 5 (8.9%) |
| 5 to 9 Year Old | 152 (96.8%) | 5 (3.2%) |
| 10 to 14 Year Olds | 193 (100.0%) | 0 (0.0%) |
| 15 to 17 Year Olds | 41 (47.1%) | 46 (52.9%) |
| 18 to 19 Year Olds | 69 (100.0%) | 0 (0.0%) |
| 20 to 24 Year Olds | 37 (100.0%) | 0 (0.0%) |
| 25 to 34 Year Olds | 0 (0.0%) | 45 (100.0%) |
| 35 Years and over | 40 (100.0%) | 0 (0.0%) |
| Total | 583 (85.2%) | 101 (14.8%) |
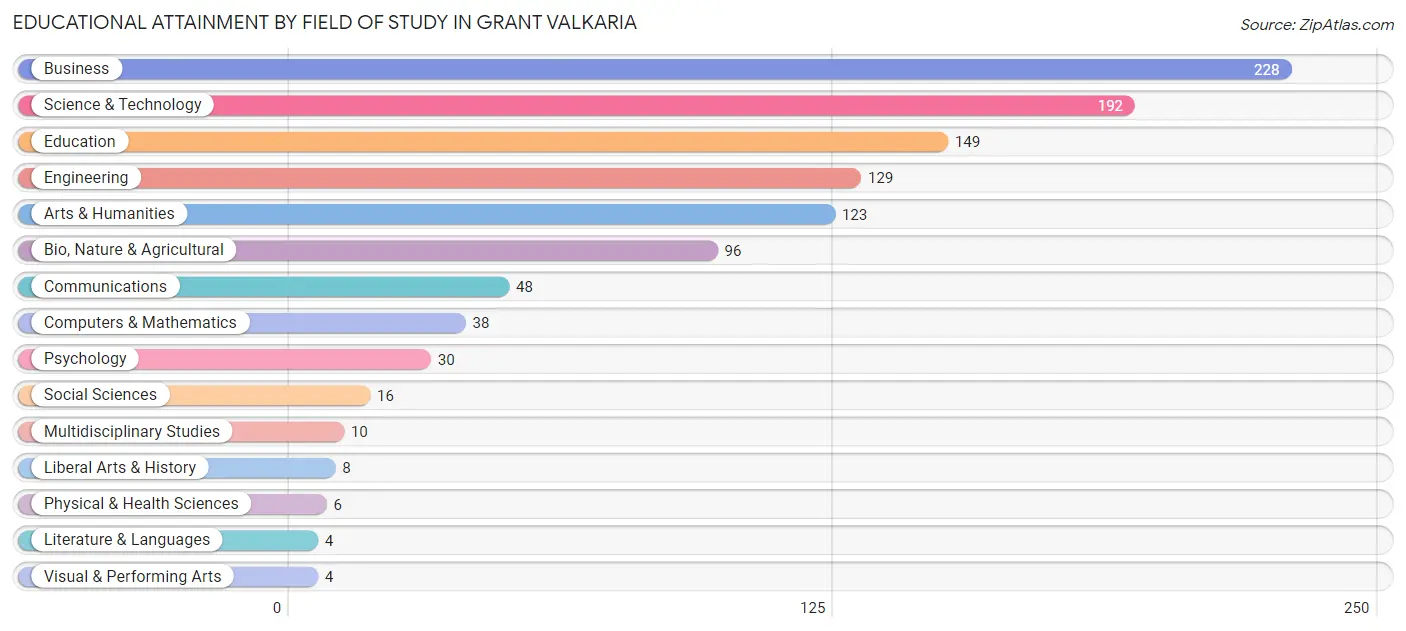
Educational Attainment by Field of Study in Grant Valkaria
Business (228 | 21.1%), science & technology (192 | 17.8%), education (149 | 13.8%), engineering (129 | 11.9%), and arts & humanities (123 | 11.4%) are the most common fields of study among 1,081 individuals in Grant Valkaria who have obtained a bachelor's degree or higher.
| Field of Study | # Graduates | % Graduates |
| Computers & Mathematics | 38 | 3.5% |
| Bio, Nature & Agricultural | 96 | 8.9% |
| Physical & Health Sciences | 6 | 0.6% |
| Psychology | 30 | 2.8% |
| Social Sciences | 16 | 1.5% |
| Engineering | 129 | 11.9% |
| Multidisciplinary Studies | 10 | 0.9% |
| Science & Technology | 192 | 17.8% |
| Business | 228 | 21.1% |
| Education | 149 | 13.8% |
| Literature & Languages | 4 | 0.4% |
| Liberal Arts & History | 8 | 0.7% |
| Visual & Performing Arts | 4 | 0.4% |
| Communications | 48 | 4.4% |
| Arts & Humanities | 123 | 11.4% |
| Total | 1,081 | 100.0% |
Transportation & Commute in Grant Valkaria
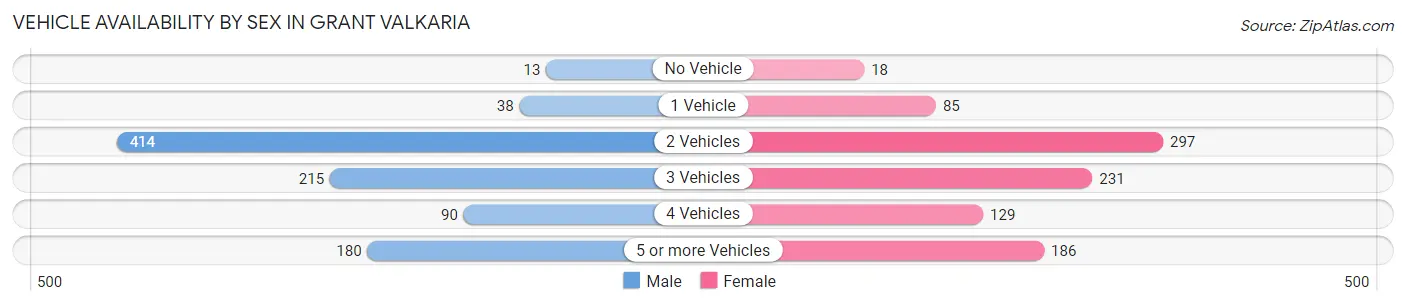
Vehicle Availability by Sex in Grant Valkaria
The most prevalent vehicle ownership categories in Grant Valkaria are males with 2 vehicles (414, accounting for 43.6%) and females with 2 vehicles (297, making up 43.8%).
| Vehicles Available | Male | Female |
| No Vehicle | 13 (1.4%) | 18 (1.9%) |
| 1 Vehicle | 38 (4.0%) | 85 (9.0%) |
| 2 Vehicles | 414 (43.6%) | 297 (31.4%) |
| 3 Vehicles | 215 (22.6%) | 231 (24.4%) |
| 4 Vehicles | 90 (9.5%) | 129 (13.6%) |
| 5 or more Vehicles | 180 (19.0%) | 186 (19.7%) |
| Total | 950 (100.0%) | 946 (100.0%) |
Commute Time in Grant Valkaria
The most frequently occuring commute durations in Grant Valkaria are 20 to 24 minutes (425 commuters, 26.3%), 25 to 29 minutes (297 commuters, 18.4%), and 15 to 19 minutes (184 commuters, 11.4%).
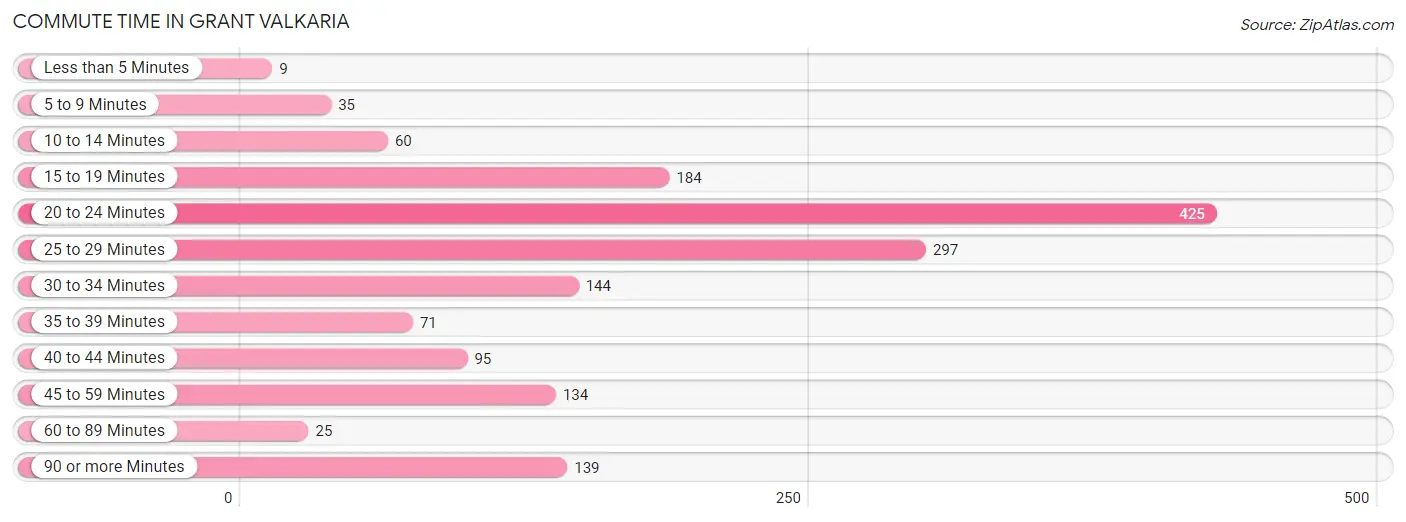
| Commute Time | # Commuters | % Commuters |
| Less than 5 Minutes | 9 | 0.6% |
| 5 to 9 Minutes | 35 | 2.2% |
| 10 to 14 Minutes | 60 | 3.7% |
| 15 to 19 Minutes | 184 | 11.4% |
| 20 to 24 Minutes | 425 | 26.3% |
| 25 to 29 Minutes | 297 | 18.4% |
| 30 to 34 Minutes | 144 | 8.9% |
| 35 to 39 Minutes | 71 | 4.4% |
| 40 to 44 Minutes | 95 | 5.9% |
| 45 to 59 Minutes | 134 | 8.3% |
| 60 to 89 Minutes | 25 | 1.5% |
| 90 or more Minutes | 139 | 8.6% |
Commute Time by Sex in Grant Valkaria
The most common commute times in Grant Valkaria are 20 to 24 minutes (214 commuters, 27.9%) for males and 20 to 24 minutes (211 commuters, 24.8%) for females.
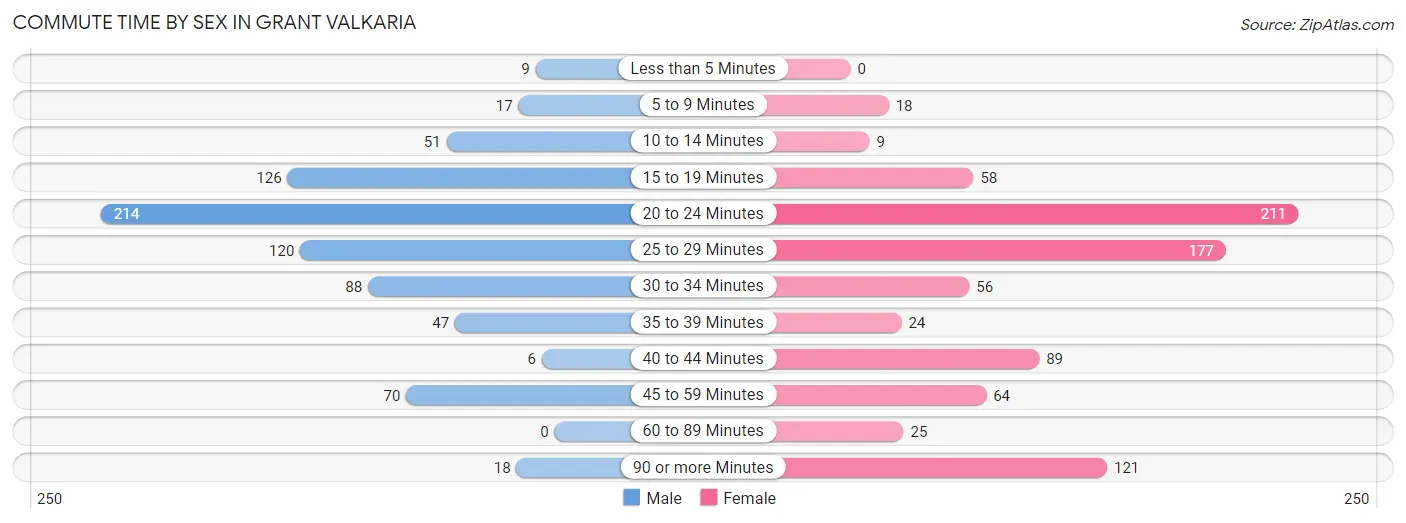
| Commute Time | Male | Female |
| Less than 5 Minutes | 9 (1.2%) | 0 (0.0%) |
| 5 to 9 Minutes | 17 (2.2%) | 18 (2.1%) |
| 10 to 14 Minutes | 51 (6.7%) | 9 (1.1%) |
| 15 to 19 Minutes | 126 (16.5%) | 58 (6.8%) |
| 20 to 24 Minutes | 214 (27.9%) | 211 (24.8%) |
| 25 to 29 Minutes | 120 (15.7%) | 177 (20.8%) |
| 30 to 34 Minutes | 88 (11.5%) | 56 (6.6%) |
| 35 to 39 Minutes | 47 (6.1%) | 24 (2.8%) |
| 40 to 44 Minutes | 6 (0.8%) | 89 (10.4%) |
| 45 to 59 Minutes | 70 (9.1%) | 64 (7.5%) |
| 60 to 89 Minutes | 0 (0.0%) | 25 (2.9%) |
| 90 or more Minutes | 18 (2.4%) | 121 (14.2%) |
Time of Departure to Work by Sex in Grant Valkaria
The most frequent times of departure to work in Grant Valkaria are 7:00 AM to 7:29 AM (143, 18.7%) for males and 7:00 AM to 7:29 AM (150, 17.6%) for females.
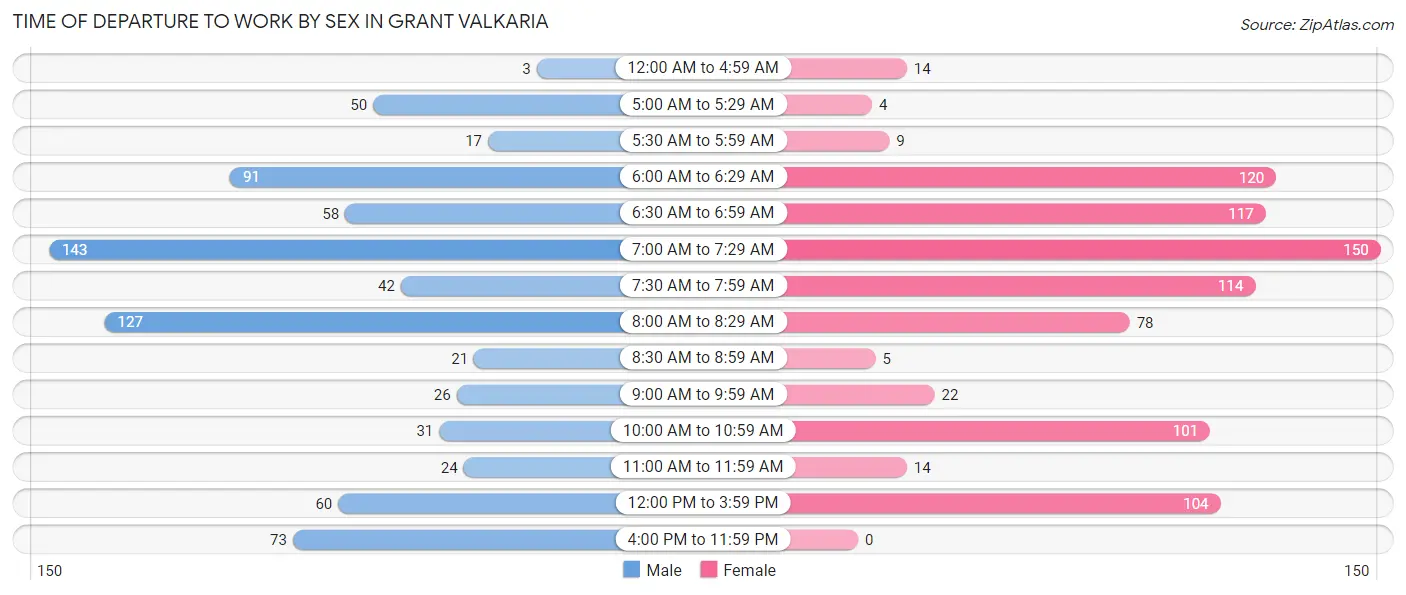
| Time of Departure | Male | Female |
| 12:00 AM to 4:59 AM | 3 (0.4%) | 14 (1.6%) |
| 5:00 AM to 5:29 AM | 50 (6.5%) | 4 (0.5%) |
| 5:30 AM to 5:59 AM | 17 (2.2%) | 9 (1.1%) |
| 6:00 AM to 6:29 AM | 91 (11.9%) | 120 (14.1%) |
| 6:30 AM to 6:59 AM | 58 (7.6%) | 117 (13.7%) |
| 7:00 AM to 7:29 AM | 143 (18.7%) | 150 (17.6%) |
| 7:30 AM to 7:59 AM | 42 (5.5%) | 114 (13.4%) |
| 8:00 AM to 8:29 AM | 127 (16.6%) | 78 (9.1%) |
| 8:30 AM to 8:59 AM | 21 (2.7%) | 5 (0.6%) |
| 9:00 AM to 9:59 AM | 26 (3.4%) | 22 (2.6%) |
| 10:00 AM to 10:59 AM | 31 (4.1%) | 101 (11.8%) |
| 11:00 AM to 11:59 AM | 24 (3.1%) | 14 (1.6%) |
| 12:00 PM to 3:59 PM | 60 (7.8%) | 104 (12.2%) |
| 4:00 PM to 11:59 PM | 73 (9.5%) | 0 (0.0%) |
| Total | 766 (100.0%) | 852 (100.0%) |
Housing Occupancy in Grant Valkaria
Occupancy by Ownership in Grant Valkaria
Of the total 1,651 dwellings in Grant Valkaria, owner-occupied units account for 1,538 (93.2%), while renter-occupied units make up 113 (6.8%).
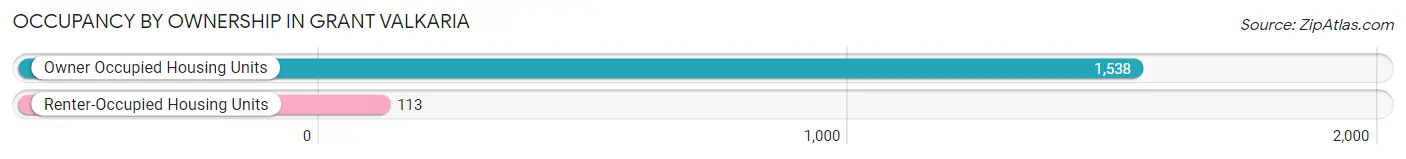
| Occupancy | # Housing Units | % Housing Units |
| Owner Occupied Housing Units | 1,538 | 93.2% |
| Renter-Occupied Housing Units | 113 | 6.8% |
| Total Occupied Housing Units | 1,651 | 100.0% |
Occupancy by Household Size in Grant Valkaria
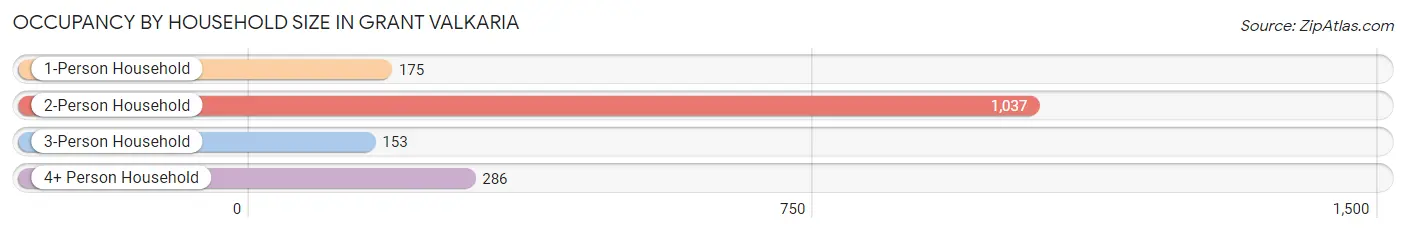
| Household Size | # Housing Units | % Housing Units |
| 1-Person Household | 175 | 10.6% |
| 2-Person Household | 1,037 | 62.8% |
| 3-Person Household | 153 | 9.3% |
| 4+ Person Household | 286 | 17.3% |
| Total Housing Units | 1,651 | 100.0% |
Occupancy by Ownership by Household Size in Grant Valkaria
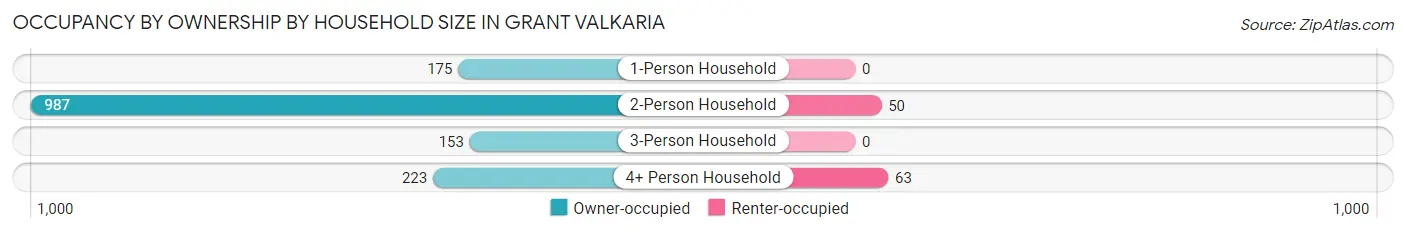
| Household Size | Owner-occupied | Renter-occupied |
| 1-Person Household | 175 (100.0%) | 0 (0.0%) |
| 2-Person Household | 987 (95.2%) | 50 (4.8%) |
| 3-Person Household | 153 (100.0%) | 0 (0.0%) |
| 4+ Person Household | 223 (78.0%) | 63 (22.0%) |
| Total Housing Units | 1,538 (93.2%) | 113 (6.8%) |
Occupancy by Educational Attainment in Grant Valkaria
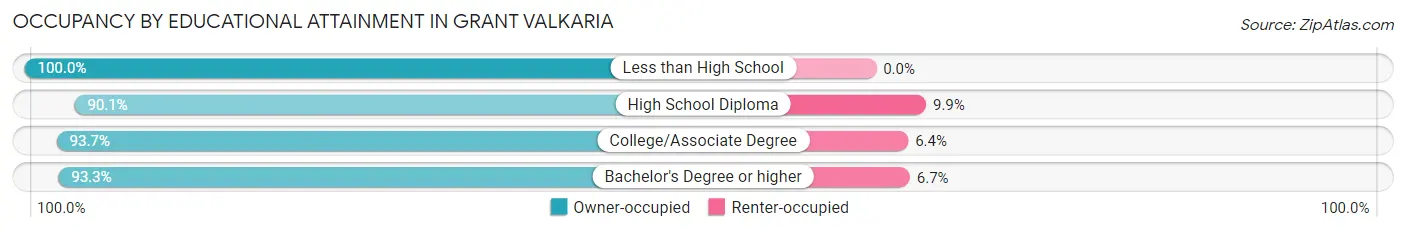
| Household Size | Owner-occupied | Renter-occupied |
| Less than High School | 102 (100.0%) | 0 (0.0%) |
| High School Diploma | 319 (90.1%) | 35 (9.9%) |
| College/Associate Degree | 516 (93.6%) | 35 (6.4%) |
| Bachelor's Degree or higher | 601 (93.3%) | 43 (6.7%) |
Occupancy by Age of Householder in Grant Valkaria
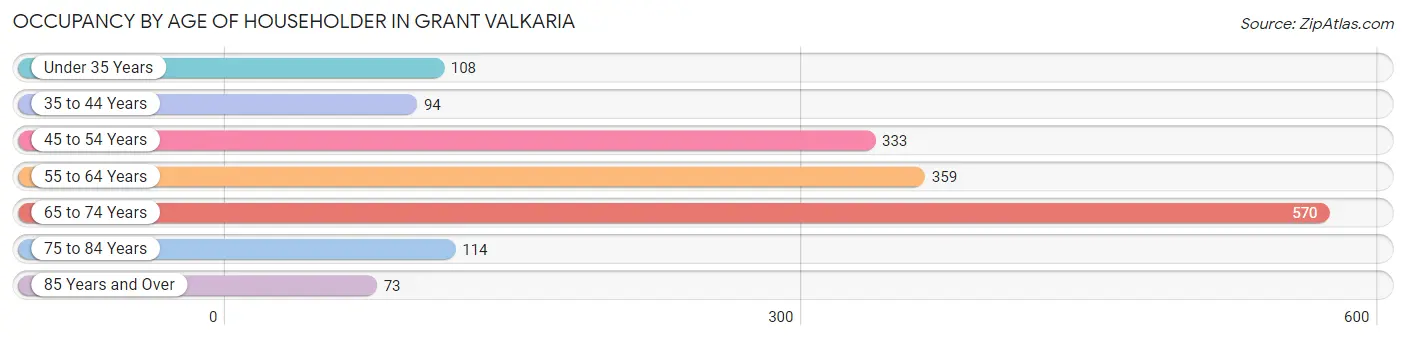
| Age Bracket | # Households | % Households |
| Under 35 Years | 108 | 6.5% |
| 35 to 44 Years | 94 | 5.7% |
| 45 to 54 Years | 333 | 20.2% |
| 55 to 64 Years | 359 | 21.7% |
| 65 to 74 Years | 570 | 34.5% |
| 75 to 84 Years | 114 | 6.9% |
| 85 Years and Over | 73 | 4.4% |
| Total | 1,651 | 100.0% |
Housing Finances in Grant Valkaria
Median Income by Occupancy in Grant Valkaria
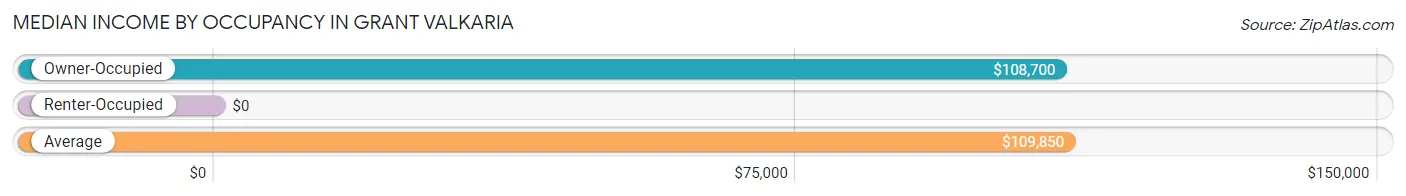
| Occupancy Type | # Households | Median Income |
| Owner-Occupied | 1,538 (93.2%) | $108,700 |
| Renter-Occupied | 113 (6.8%) | $0 |
| Average | 1,651 (100.0%) | $109,850 |
Occupancy by Householder Income Bracket in Grant Valkaria
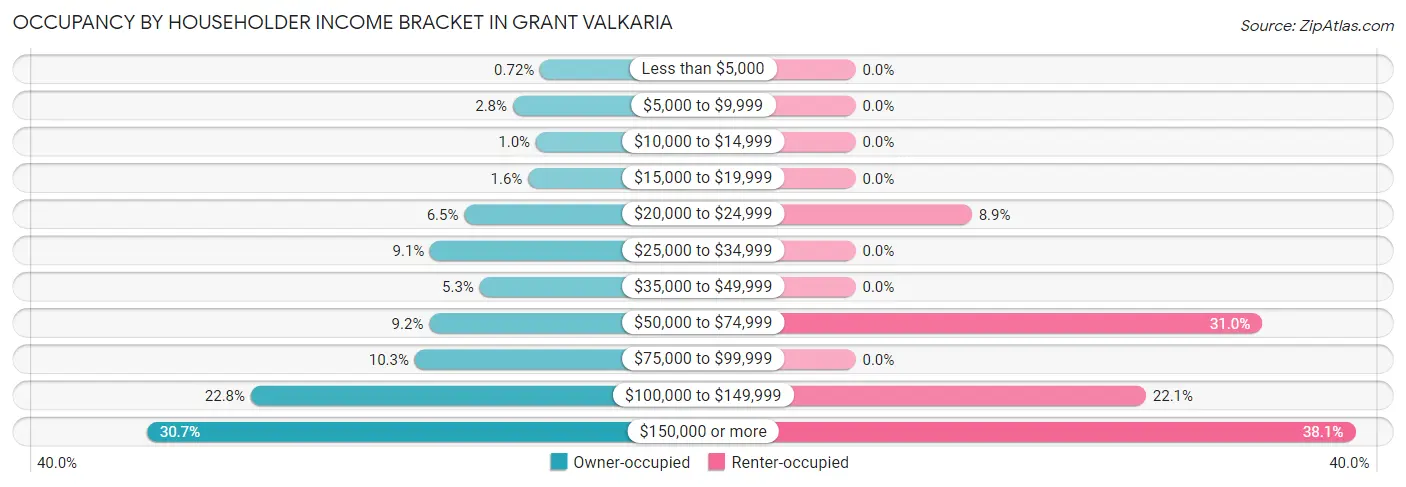
| Income Bracket | Owner-occupied | Renter-occupied |
| Less than $5,000 | 11 (0.7%) | 0 (0.0%) |
| $5,000 to $9,999 | 43 (2.8%) | 0 (0.0%) |
| $10,000 to $14,999 | 16 (1.0%) | 0 (0.0%) |
| $15,000 to $19,999 | 25 (1.6%) | 0 (0.0%) |
| $20,000 to $24,999 | 100 (6.5%) | 10 (8.8%) |
| $25,000 to $34,999 | 140 (9.1%) | 0 (0.0%) |
| $35,000 to $49,999 | 82 (5.3%) | 0 (0.0%) |
| $50,000 to $74,999 | 141 (9.2%) | 35 (31.0%) |
| $75,000 to $99,999 | 158 (10.3%) | 0 (0.0%) |
| $100,000 to $149,999 | 350 (22.8%) | 25 (22.1%) |
| $150,000 or more | 472 (30.7%) | 43 (38.1%) |
| Total | 1,538 (100.0%) | 113 (100.0%) |
Monthly Housing Cost Tiers in Grant Valkaria
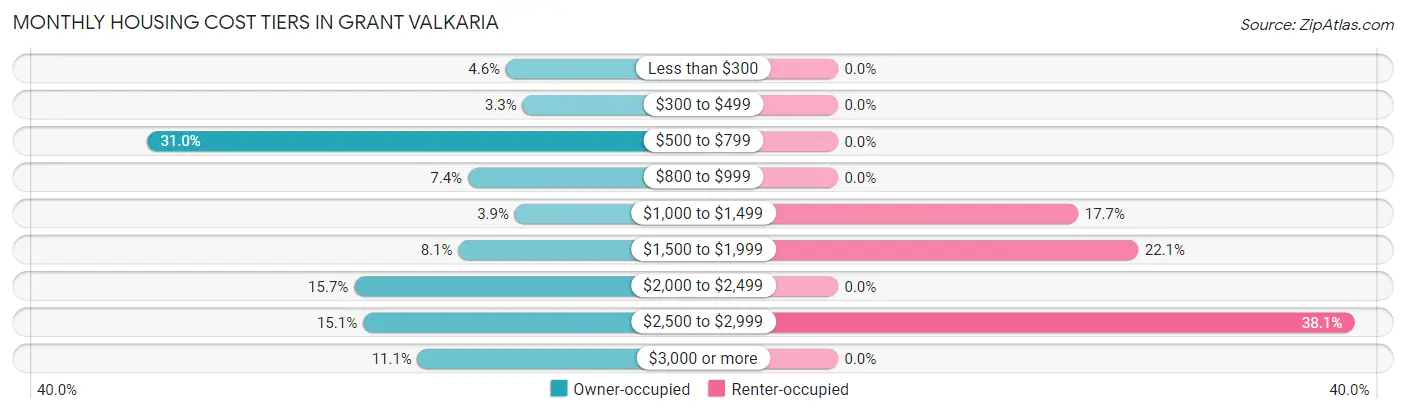
| Monthly Cost | Owner-occupied | Renter-occupied |
| Less than $300 | 70 (4.5%) | 0 (0.0%) |
| $300 to $499 | 51 (3.3%) | 0 (0.0%) |
| $500 to $799 | 476 (30.9%) | 0 (0.0%) |
| $800 to $999 | 113 (7.3%) | 0 (0.0%) |
| $1,000 to $1,499 | 60 (3.9%) | 20 (17.7%) |
| $1,500 to $1,999 | 124 (8.1%) | 25 (22.1%) |
| $2,000 to $2,499 | 242 (15.7%) | 0 (0.0%) |
| $2,500 to $2,999 | 232 (15.1%) | 43 (38.1%) |
| $3,000 or more | 170 (11.1%) | 0 (0.0%) |
| Total | 1,538 (100.0%) | 113 (100.0%) |
Physical Housing Characteristics in Grant Valkaria
Housing Structures in Grant Valkaria
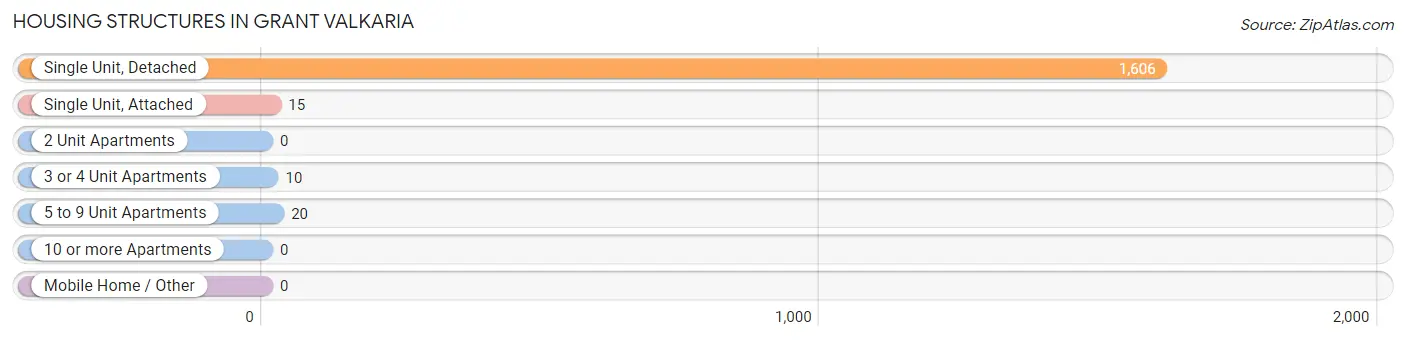
| Structure Type | # Housing Units | % Housing Units |
| Single Unit, Detached | 1,606 | 97.3% |
| Single Unit, Attached | 15 | 0.9% |
| 2 Unit Apartments | 0 | 0.0% |
| 3 or 4 Unit Apartments | 10 | 0.6% |
| 5 to 9 Unit Apartments | 20 | 1.2% |
| 10 or more Apartments | 0 | 0.0% |
| Mobile Home / Other | 0 | 0.0% |
| Total | 1,651 | 100.0% |
Housing Structures by Occupancy in Grant Valkaria
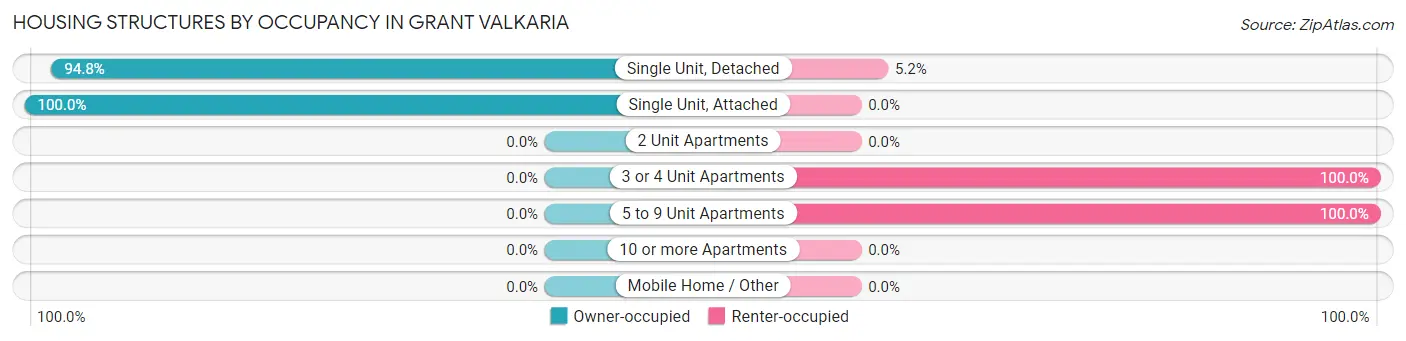
| Structure Type | Owner-occupied | Renter-occupied |
| Single Unit, Detached | 1,523 (94.8%) | 83 (5.2%) |
| Single Unit, Attached | 15 (100.0%) | 0 (0.0%) |
| 2 Unit Apartments | 0 (0.0%) | 0 (0.0%) |
| 3 or 4 Unit Apartments | 0 (0.0%) | 10 (100.0%) |
| 5 to 9 Unit Apartments | 0 (0.0%) | 20 (100.0%) |
| 10 or more Apartments | 0 (0.0%) | 0 (0.0%) |
| Mobile Home / Other | 0 (0.0%) | 0 (0.0%) |
| Total | 1,538 (93.2%) | 113 (6.8%) |
Housing Structures by Number of Rooms in Grant Valkaria
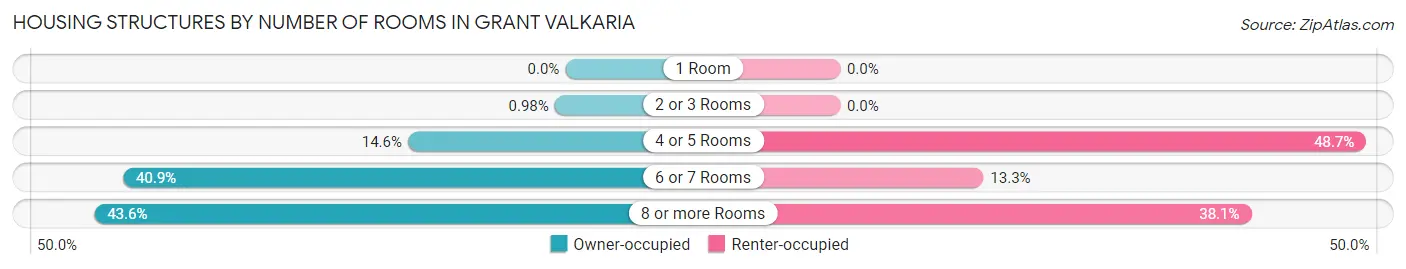
| Number of Rooms | Owner-occupied | Renter-occupied |
| 1 Room | 0 (0.0%) | 0 (0.0%) |
| 2 or 3 Rooms | 15 (1.0%) | 0 (0.0%) |
| 4 or 5 Rooms | 224 (14.6%) | 55 (48.7%) |
| 6 or 7 Rooms | 629 (40.9%) | 15 (13.3%) |
| 8 or more Rooms | 670 (43.6%) | 43 (38.1%) |
| Total | 1,538 (100.0%) | 113 (100.0%) |
Housing Structure by Heating Type in Grant Valkaria
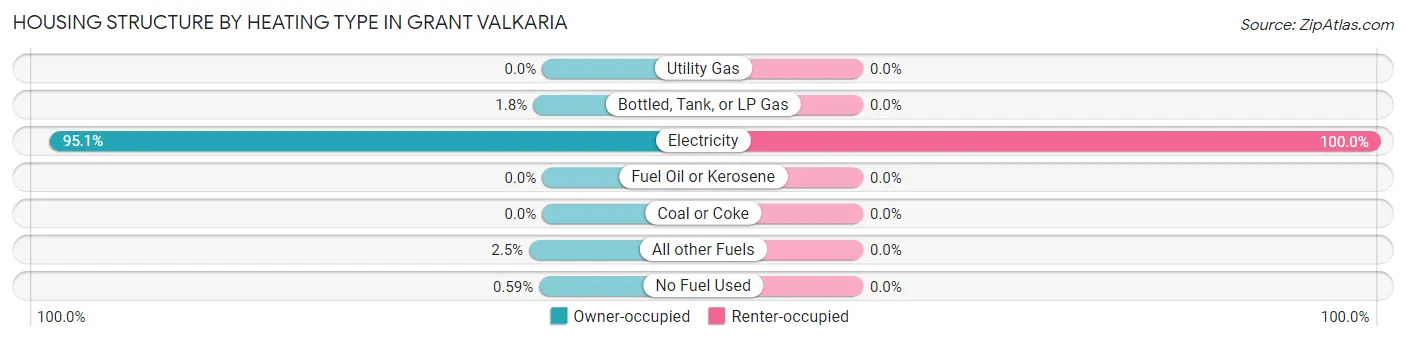
| Heating Type | Owner-occupied | Renter-occupied |
| Utility Gas | 0 (0.0%) | 0 (0.0%) |
| Bottled, Tank, or LP Gas | 27 (1.8%) | 0 (0.0%) |
| Electricity | 1,463 (95.1%) | 113 (100.0%) |
| Fuel Oil or Kerosene | 0 (0.0%) | 0 (0.0%) |
| Coal or Coke | 0 (0.0%) | 0 (0.0%) |
| All other Fuels | 39 (2.5%) | 0 (0.0%) |
| No Fuel Used | 9 (0.6%) | 0 (0.0%) |
| Total | 1,538 (100.0%) | 113 (100.0%) |
Household Vehicle Usage in Grant Valkaria
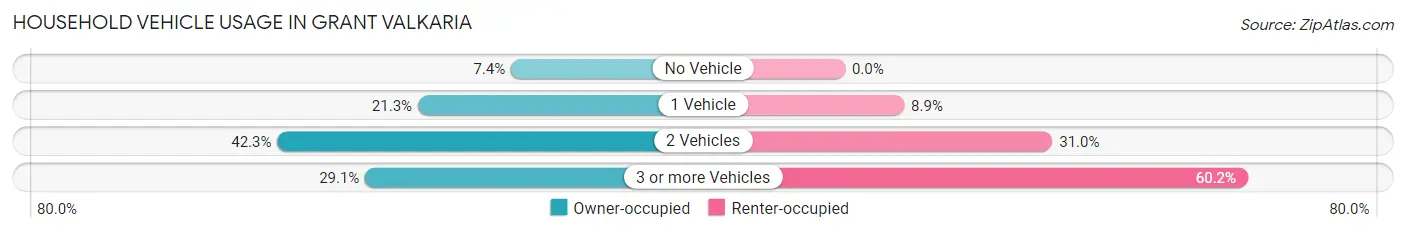
| Vehicles per Household | Owner-occupied | Renter-occupied |
| No Vehicle | 113 (7.3%) | 0 (0.0%) |
| 1 Vehicle | 327 (21.3%) | 10 (8.8%) |
| 2 Vehicles | 650 (42.3%) | 35 (31.0%) |
| 3 or more Vehicles | 448 (29.1%) | 68 (60.2%) |
| Total | 1,538 (100.0%) | 113 (100.0%) |
Real Estate & Mortgages in Grant Valkaria
Real Estate and Mortgage Overview in Grant Valkaria
| Characteristic | Without Mortgage | With Mortgage |
| Housing Units | 705 | 833 |
| Median Property Value | $376,700 | $464,400 |
| Median Household Income | $91,518 | $291 |
| Monthly Housing Costs | $652 | $170 |
| Real Estate Taxes | $2,971 | $5 |
Property Value by Mortgage Status in Grant Valkaria
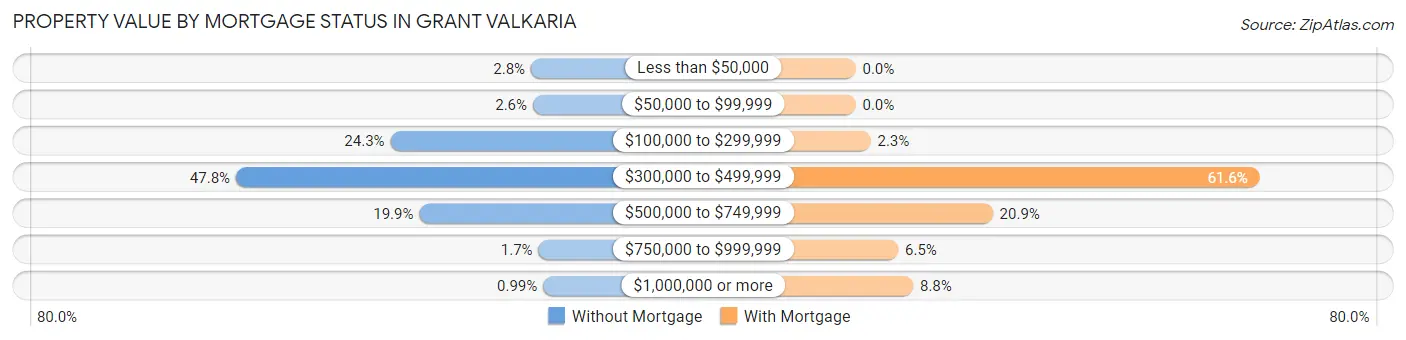
| Property Value | Without Mortgage | With Mortgage |
| Less than $50,000 | 20 (2.8%) | 0 (0.0%) |
| $50,000 to $99,999 | 18 (2.5%) | 0 (0.0%) |
| $100,000 to $299,999 | 171 (24.3%) | 19 (2.3%) |
| $300,000 to $499,999 | 337 (47.8%) | 513 (61.6%) |
| $500,000 to $749,999 | 140 (19.9%) | 174 (20.9%) |
| $750,000 to $999,999 | 12 (1.7%) | 54 (6.5%) |
| $1,000,000 or more | 7 (1.0%) | 73 (8.8%) |
| Total | 705 (100.0%) | 833 (100.0%) |
Household Income by Mortgage Status in Grant Valkaria
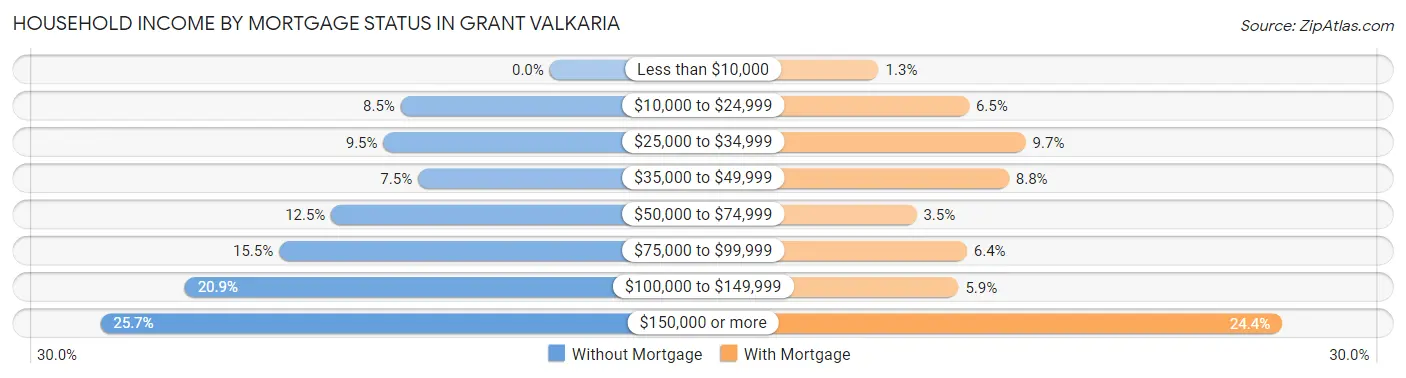
| Household Income | Without Mortgage | With Mortgage |
| Less than $10,000 | 0 (0.0%) | 11 (1.3%) |
| $10,000 to $24,999 | 60 (8.5%) | 54 (6.5%) |
| $25,000 to $34,999 | 67 (9.5%) | 81 (9.7%) |
| $35,000 to $49,999 | 53 (7.5%) | 73 (8.8%) |
| $50,000 to $74,999 | 88 (12.5%) | 29 (3.5%) |
| $75,000 to $99,999 | 109 (15.5%) | 53 (6.4%) |
| $100,000 to $149,999 | 147 (20.8%) | 49 (5.9%) |
| $150,000 or more | 181 (25.7%) | 203 (24.4%) |
| Total | 705 (100.0%) | 833 (100.0%) |
Property Value to Household Income Ratio in Grant Valkaria
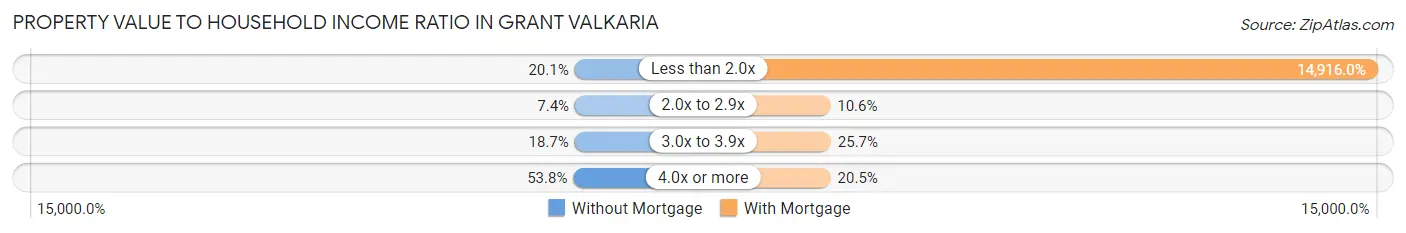
| Value-to-Income Ratio | Without Mortgage | With Mortgage |
| Less than 2.0x | 142 (20.1%) | 124,250 (14,916.0%) |
| 2.0x to 2.9x | 52 (7.4%) | 88 (10.6%) |
| 3.0x to 3.9x | 132 (18.7%) | 214 (25.7%) |
| 4.0x or more | 379 (53.8%) | 171 (20.5%) |
| Total | 705 (100.0%) | 833 (100.0%) |
Real Estate Taxes by Mortgage Status in Grant Valkaria
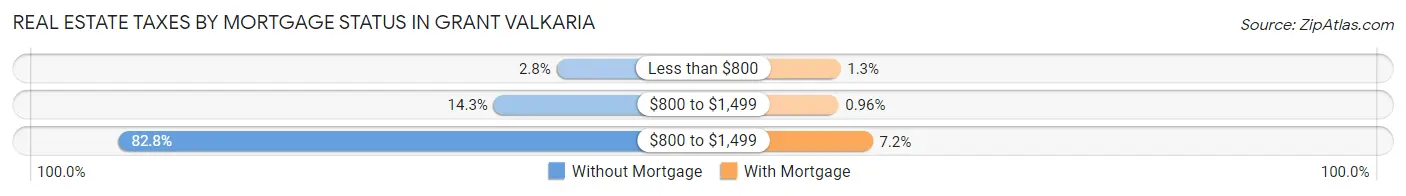
| Property Taxes | Without Mortgage | With Mortgage |
| Less than $800 | 20 (2.8%) | 11 (1.3%) |
| $800 to $1,499 | 101 (14.3%) | 8 (1.0%) |
| $800 to $1,499 | 584 (82.8%) | 60 (7.2%) |
| Total | 705 (100.0%) | 833 (100.0%) |
Health & Disability in Grant Valkaria
Health Insurance Coverage by Age in Grant Valkaria
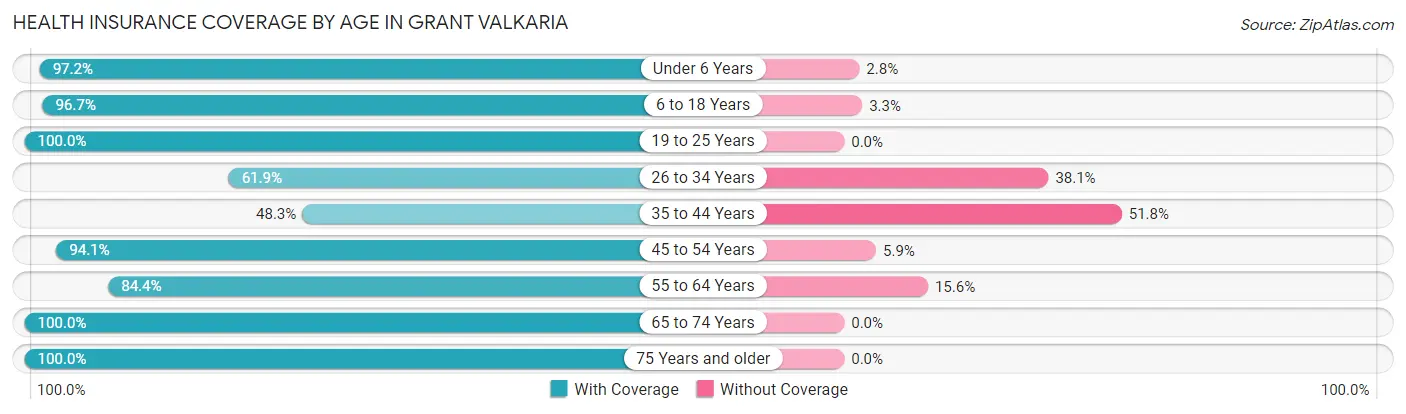
| Age Bracket | With Coverage | Without Coverage |
| Under 6 Years | 172 (97.2%) | 5 (2.8%) |
| 6 to 18 Years | 463 (96.7%) | 16 (3.3%) |
| 19 to 25 Years | 371 (100.0%) | 0 (0.0%) |
| 26 to 34 Years | 231 (61.9%) | 142 (38.1%) |
| 35 to 44 Years | 124 (48.2%) | 133 (51.7%) |
| 45 to 54 Years | 619 (94.1%) | 39 (5.9%) |
| 55 to 64 Years | 638 (84.4%) | 118 (15.6%) |
| 65 to 74 Years | 961 (100.0%) | 0 (0.0%) |
| 75 Years and older | 488 (100.0%) | 0 (0.0%) |
| Total | 4,067 (90.0%) | 453 (10.0%) |
Health Insurance Coverage by Citizenship Status in Grant Valkaria
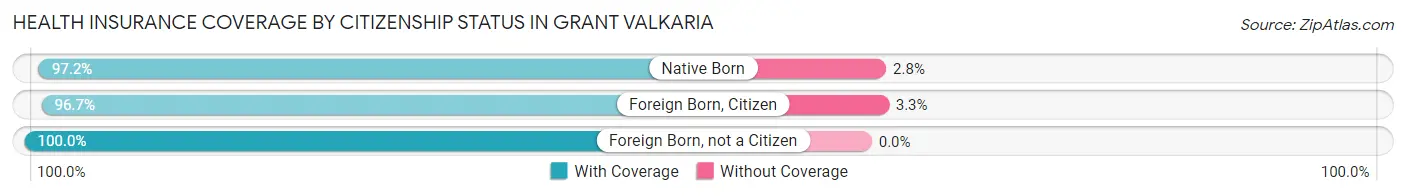
| Citizenship Status | With Coverage | Without Coverage |
| Native Born | 172 (97.2%) | 5 (2.8%) |
| Foreign Born, Citizen | 463 (96.7%) | 16 (3.3%) |
| Foreign Born, not a Citizen | 371 (100.0%) | 0 (0.0%) |
Health Insurance Coverage by Household Income in Grant Valkaria
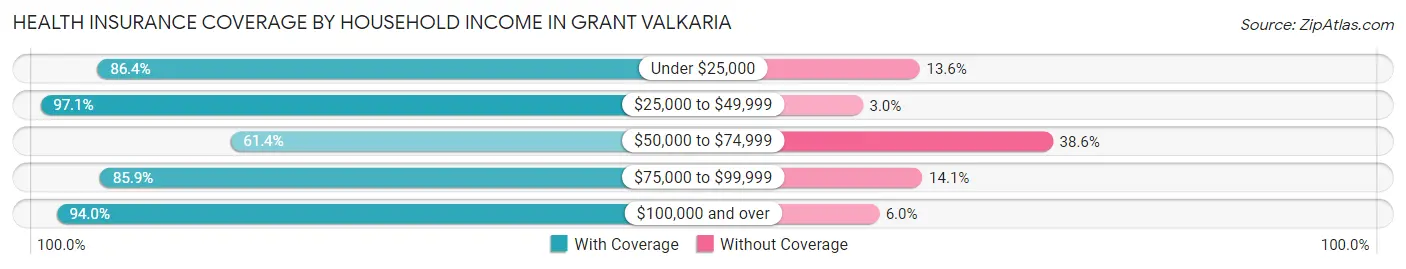
| Household Income | With Coverage | Without Coverage |
| Under $25,000 | 488 (86.4%) | 77 (13.6%) |
| $25,000 to $49,999 | 362 (97.1%) | 11 (2.9%) |
| $50,000 to $74,999 | 231 (61.4%) | 145 (38.6%) |
| $75,000 to $99,999 | 298 (85.9%) | 49 (14.1%) |
| $100,000 and over | 2,688 (94.0%) | 171 (6.0%) |
Public vs Private Health Insurance Coverage by Age in Grant Valkaria
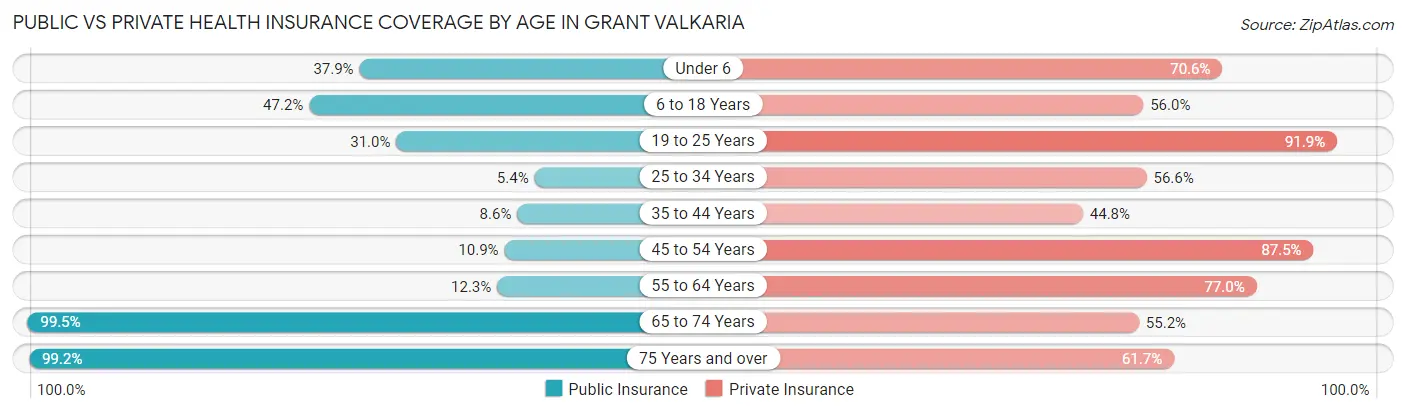
| Age Bracket | Public Insurance | Private Insurance |
| Under 6 | 67 (37.9%) | 125 (70.6%) |
| 6 to 18 Years | 226 (47.2%) | 268 (55.9%) |
| 19 to 25 Years | 115 (31.0%) | 341 (91.9%) |
| 25 to 34 Years | 20 (5.4%) | 211 (56.6%) |
| 35 to 44 Years | 22 (8.6%) | 115 (44.8%) |
| 45 to 54 Years | 72 (10.9%) | 576 (87.5%) |
| 55 to 64 Years | 93 (12.3%) | 582 (77.0%) |
| 65 to 74 Years | 956 (99.5%) | 530 (55.1%) |
| 75 Years and over | 484 (99.2%) | 301 (61.7%) |
| Total | 2,055 (45.5%) | 3,049 (67.5%) |
Disability Status by Sex by Age in Grant Valkaria
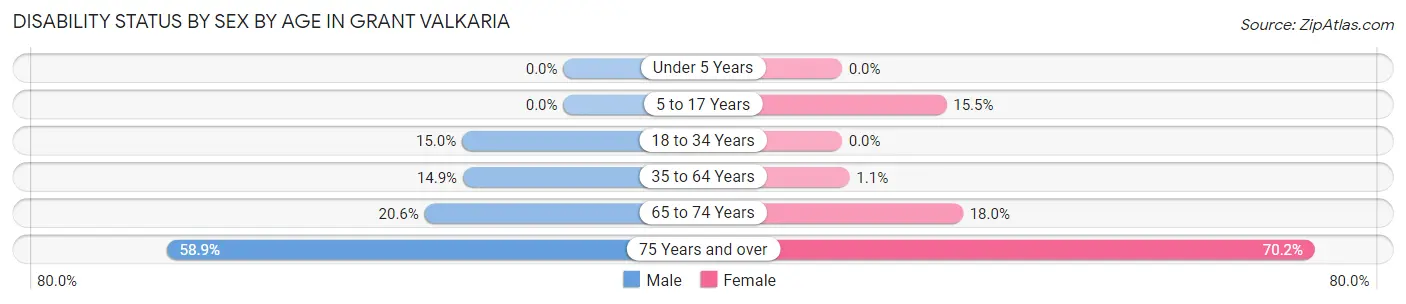
| Age Bracket | Male | Female |
| Under 5 Years | 0 (0.0%) | 0 (0.0%) |
| 5 to 17 Years | 0 (0.0%) | 45 (15.5%) |
| 18 to 34 Years | 51 (15.0%) | 0 (0.0%) |
| 35 to 64 Years | 130 (14.9%) | 9 (1.1%) |
| 65 to 74 Years | 89 (20.6%) | 95 (18.0%) |
| 75 Years and over | 139 (58.9%) | 177 (70.2%) |
Disability Class by Sex by Age in Grant Valkaria
Disability Class: Hearing Difficulty
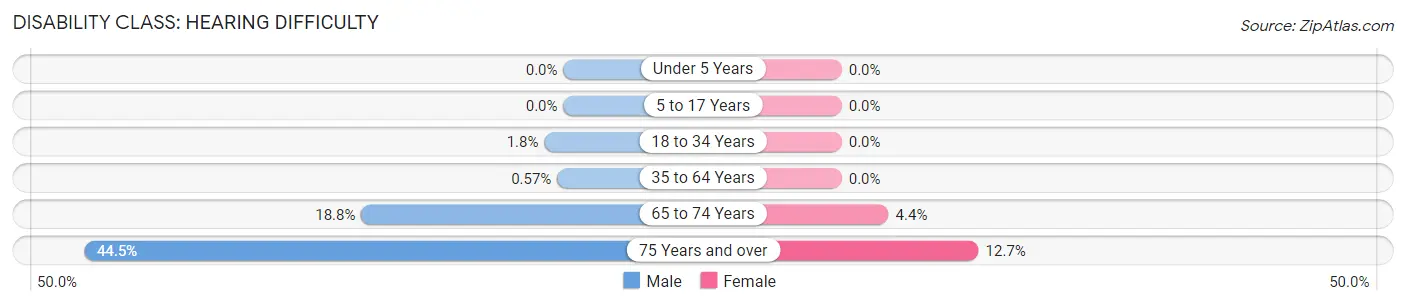
| Age Bracket | Male | Female |
| Under 5 Years | 0 (0.0%) | 0 (0.0%) |
| 5 to 17 Years | 0 (0.0%) | 0 (0.0%) |
| 18 to 34 Years | 6 (1.8%) | 0 (0.0%) |
| 35 to 64 Years | 5 (0.6%) | 0 (0.0%) |
| 65 to 74 Years | 81 (18.8%) | 23 (4.3%) |
| 75 Years and over | 105 (44.5%) | 32 (12.7%) |
Disability Class: Vision Difficulty
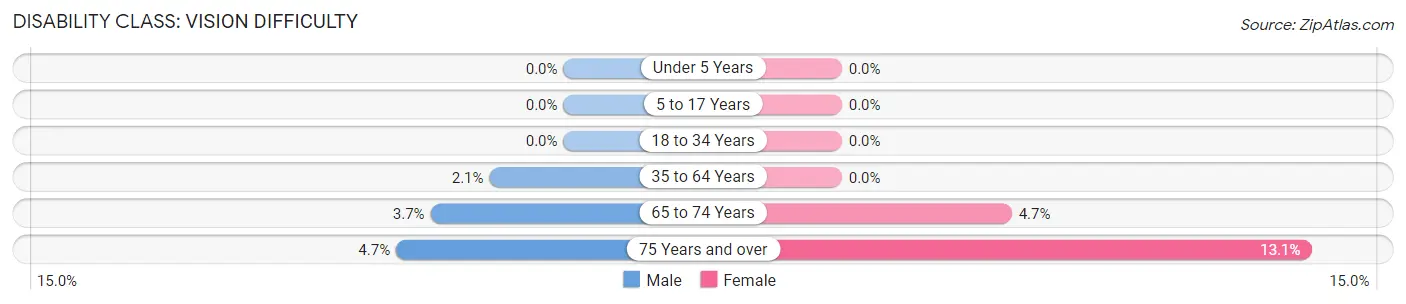
| Age Bracket | Male | Female |
| Under 5 Years | 0 (0.0%) | 0 (0.0%) |
| 5 to 17 Years | 0 (0.0%) | 0 (0.0%) |
| 18 to 34 Years | 0 (0.0%) | 0 (0.0%) |
| 35 to 64 Years | 18 (2.1%) | 0 (0.0%) |
| 65 to 74 Years | 16 (3.7%) | 25 (4.7%) |
| 75 Years and over | 11 (4.7%) | 33 (13.1%) |
Disability Class: Cognitive Difficulty
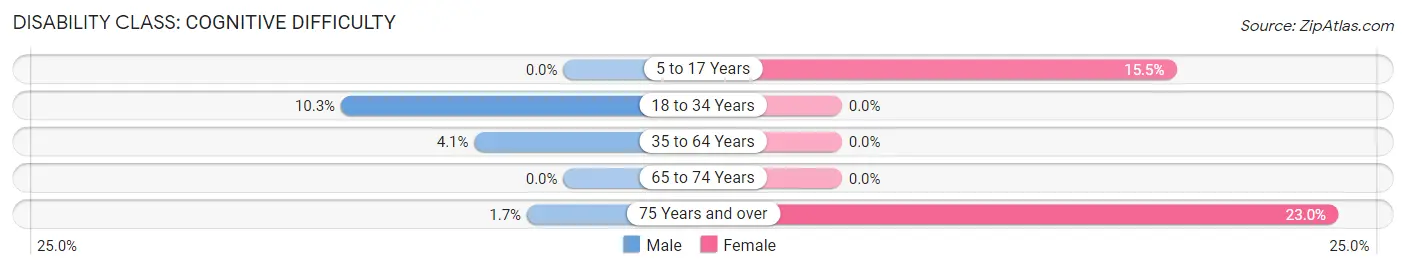
| Age Bracket | Male | Female |
| 5 to 17 Years | 0 (0.0%) | 45 (15.5%) |
| 18 to 34 Years | 35 (10.3%) | 0 (0.0%) |
| 35 to 64 Years | 36 (4.1%) | 0 (0.0%) |
| 65 to 74 Years | 0 (0.0%) | 0 (0.0%) |
| 75 Years and over | 4 (1.7%) | 58 (23.0%) |
Disability Class: Ambulatory Difficulty
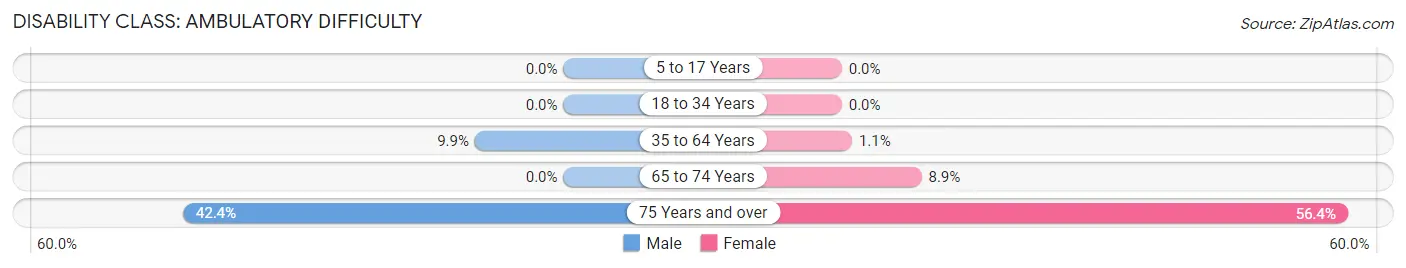
| Age Bracket | Male | Female |
| 5 to 17 Years | 0 (0.0%) | 0 (0.0%) |
| 18 to 34 Years | 0 (0.0%) | 0 (0.0%) |
| 35 to 64 Years | 86 (9.9%) | 9 (1.1%) |
| 65 to 74 Years | 0 (0.0%) | 47 (8.9%) |
| 75 Years and over | 100 (42.4%) | 142 (56.4%) |
Disability Class: Self-Care Difficulty
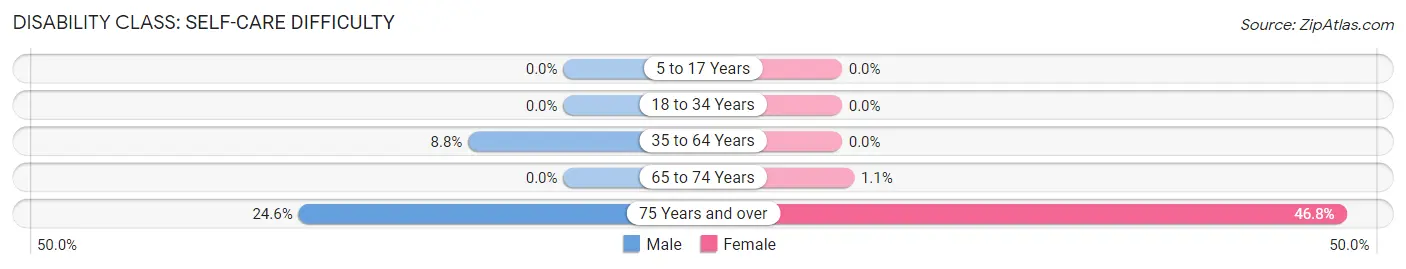
| Age Bracket | Male | Female |
| 5 to 17 Years | 0 (0.0%) | 0 (0.0%) |
| 18 to 34 Years | 0 (0.0%) | 0 (0.0%) |
| 35 to 64 Years | 77 (8.8%) | 0 (0.0%) |
| 65 to 74 Years | 0 (0.0%) | 6 (1.1%) |
| 75 Years and over | 58 (24.6%) | 118 (46.8%) |
Technology Access in Grant Valkaria
Computing Device Access in Grant Valkaria
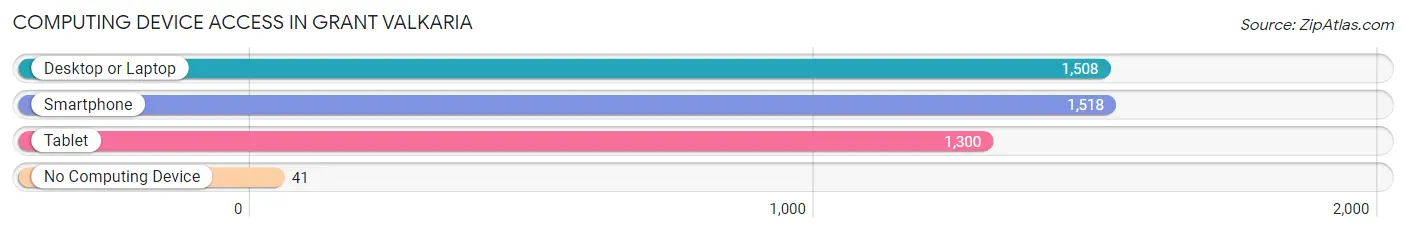
| Device Type | # Households | % Households |
| Desktop or Laptop | 1,508 | 91.3% |
| Smartphone | 1,518 | 91.9% |
| Tablet | 1,300 | 78.7% |
| No Computing Device | 41 | 2.5% |
| Total | 1,651 | 100.0% |
Internet Access in Grant Valkaria
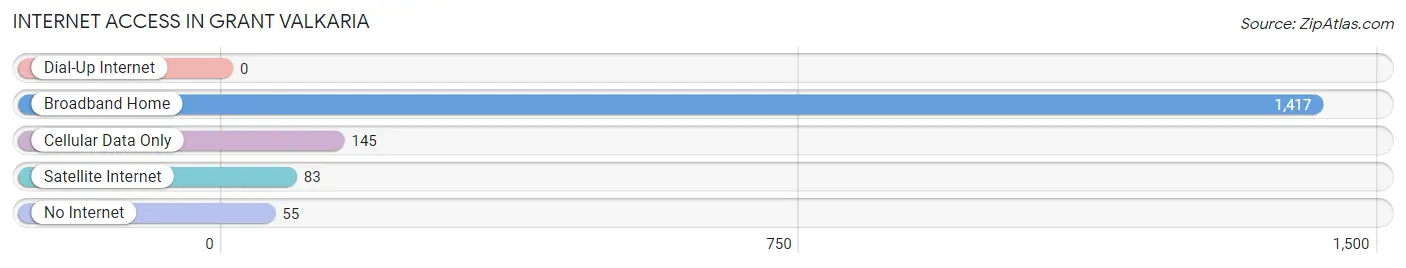
| Internet Type | # Households | % Households |
| Dial-Up Internet | 0 | 0.0% |
| Broadband Home | 1,417 | 85.8% |
| Cellular Data Only | 145 | 8.8% |
| Satellite Internet | 83 | 5.0% |
| No Internet | 55 | 3.3% |
| Total | 1,651 | 100.0% |
Grant Valkaria Summary
Valkaria, Florida is a small unincorporated community located in Brevard County, Florida. It is situated on the Indian River Lagoon, just south of Melbourne and north of Sebastian. The population of Valkaria was estimated to be 1,845 in 2019.
History
Valkaria was originally inhabited by the Ais Indians, who were part of the Seminole tribe. The area was first settled by Europeans in the late 1800s, when a group of Swedish immigrants arrived and established a small fishing village. The village was named Valkaria, after the Swedish word for “falcon”.
In the early 1900s, the area began to grow as more settlers arrived. The town was incorporated in 1925 and the first post office was established in 1926. The town was primarily a fishing and farming community until the 1950s, when the area began to experience rapid growth due to the development of the nearby Patrick Air Force Base.
Geography
Valkaria is located in Brevard County, Florida, on the Indian River Lagoon. It is situated between Melbourne and Sebastian, and is approximately 25 miles south of the Kennedy Space Center. The town is bordered by the Indian River to the east, the St. Sebastian River to the west, and the Atlantic Ocean to the south.
The town has a total area of 4.2 square miles, of which 3.9 square miles is land and 0.3 square miles is water. The terrain is mostly flat, with some areas of marshland and mangroves.
Economy
The economy of Valkaria is largely based on tourism and fishing. The town is home to several marinas, boat ramps, and fishing charters. There are also several restaurants and bars in the area, as well as a few small retail stores.
The town is also home to the Valkaria Airport, which is a general aviation facility. The airport is used for recreational flying, as well as for air charter services.
Demographics
As of the 2019 census, the population of Valkaria was estimated to be 1,845. The racial makeup of the town was 94.3% White, 2.2% African American, 0.7% Native American, 0.7% Asian, 0.2% Pacific Islander, 0.7% from other races, and 1.2% from two or more races. Hispanic or Latino of any race were 3.2% of the population.
The median household income in Valkaria was $45,938, and the median family income was $50,938. The per capita income for the town was $22,938. About 8.3% of families and 10.2% of the population were below the poverty line, including 14.3% of those under age 18 and 6.2% of those age 65 or over.
Valkaria is a small, quiet community with a rich history and a bright future. The town is home to a diverse population and a thriving economy, and is a great place to live, work, and play.
Common Questions
What is the Total Population of Grant Valkaria?
Total Population of Grant Valkaria is 4,520.
What is the Total Male Population of Grant Valkaria?
Total Male Population of Grant Valkaria is 2,101.
What is the Total Female Population of Grant Valkaria?
Total Female Population of Grant Valkaria is 2,419.
What is the Ratio of Males per 100 Females in Grant Valkaria?
There are 86.85 Males per 100 Females in Grant Valkaria.
What is the Ratio of Females per 100 Males in Grant Valkaria?
There are 115.14 Females per 100 Males in Grant Valkaria.
What is the Median Population Age in Grant Valkaria?
Median Population Age in Grant Valkaria is 54.3 Years.
What is the Average Family Size in Grant Valkaria
Average Family Size in Grant Valkaria is 3.0 People.
What is the Average Household Size in Grant Valkaria
Average Household Size in Grant Valkaria is 2.7 People.
What is Per Capita Income in Grant Valkaria?
Per Capita income in Grant Valkaria is $45,113.
What is the Median Family Income in Grant Valkaria?
Median Family Income in Grant Valkaria is $119,609.
What is the Median Household income in Grant Valkaria?
Median Household Income in Grant Valkaria is $109,850.
What is Income or Wage Gap in Grant Valkaria?
Income or Wage Gap in Grant Valkaria is 50.6%.
Women in Grant Valkaria earn 49.4 cents for every dollar earned by a man.
What is Inequality or Gini Index in Grant Valkaria?
Inequality or Gini Index in Grant Valkaria is 0.41.
How Large is the Labor Force in Grant Valkaria?
There are 1,944 People in the Labor Forcein in Grant Valkaria.
What is the Percentage of People in the Labor Force in Grant Valkaria?
48.9% of People are in the Labor Force in Grant Valkaria.
What is the Unemployment Rate in Grant Valkaria?
Unemployment Rate in Grant Valkaria is 1.1%.