Brookridge, FL
Brookridge Map
Brookridge Overview
4,783
TOTAL POPULATION
2,310
MALE POPULATION
2,473
FEMALE POPULATION
93.41
MALES / 100 FEMALES
107.06
FEMALES / 100 MALES
67.0
MEDIAN AGE
2.4
AVG FAMILY SIZE
2.0
AVG HOUSEHOLD SIZE
$32,191
PER CAPITA INCOME
$60,284
AVG FAMILY INCOME
$49,240
AVG HOUSEHOLD INCOME
20.0%
WAGE / INCOME GAP [ % ]
80.0¢/ $1
WAGE / INCOME GAP [ $ ]
0.39
INEQUALITY / GINI INDEX
1,109
LABOR FORCE [ PEOPLE ]
25.6%
PERCENT IN LABOR FORCE
1.4%
UNEMPLOYMENT RATE
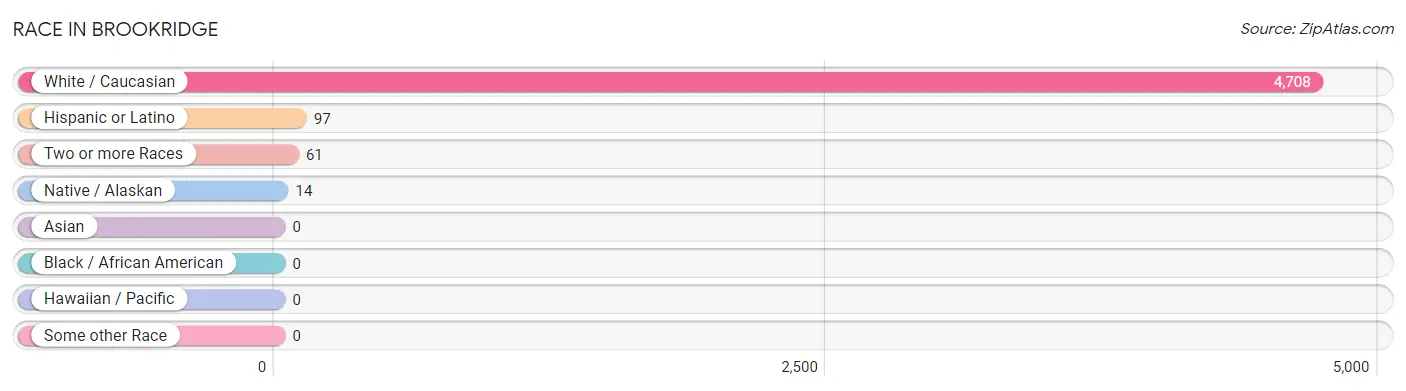
Race in Brookridge
The most populous races in Brookridge are White / Caucasian (4,708 | 98.4%), Hispanic or Latino (97 | 2.0%), and Two or more Races (61 | 1.3%).
| Race | # Population | % Population |
| Asian | 0 | 0.0% |
| Black / African American | 0 | 0.0% |
| Hawaiian / Pacific | 0 | 0.0% |
| Hispanic or Latino | 97 | 2.0% |
| Native / Alaskan | 14 | 0.3% |
| White / Caucasian | 4,708 | 98.4% |
| Two or more Races | 61 | 1.3% |
| Some other Race | 0 | 0.0% |
| Total | 4,783 | 100.0% |
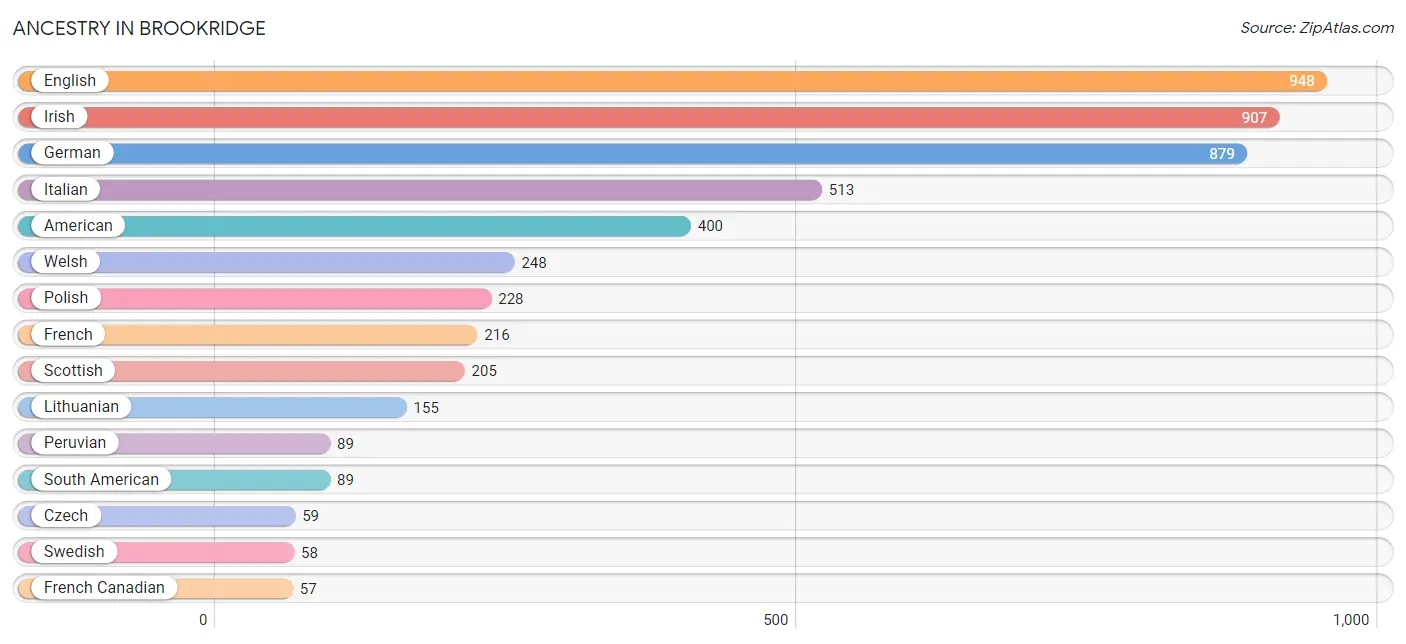
Ancestry in Brookridge
The most populous ancestries reported in Brookridge are English (948 | 19.8%), Irish (907 | 19.0%), German (879 | 18.4%), Italian (513 | 10.7%), and American (400 | 8.4%), together accounting for 76.3% of all Brookridge residents.
| Ancestry | # Population | % Population |
| American | 400 | 8.4% |
| Arab | 14 | 0.3% |
| Austrian | 14 | 0.3% |
| Bermudan | 16 | 0.3% |
| British | 16 | 0.3% |
| Central American | 8 | 0.2% |
| Czech | 59 | 1.2% |
| Danish | 19 | 0.4% |
| Dutch | 49 | 1.0% |
| Eastern European | 18 | 0.4% |
| English | 948 | 19.8% |
| European | 15 | 0.3% |
| Finnish | 14 | 0.3% |
| French | 216 | 4.5% |
| French Canadian | 57 | 1.2% |
| German | 879 | 18.4% |
| Hungarian | 10 | 0.2% |
| Irish | 907 | 19.0% |
| Italian | 513 | 10.7% |
| Lithuanian | 155 | 3.2% |
| Pennsylvania German | 31 | 0.6% |
| Peruvian | 89 | 1.9% |
| Polish | 228 | 4.8% |
| Salvadoran | 8 | 0.2% |
| Scotch-Irish | 37 | 0.8% |
| Scottish | 205 | 4.3% |
| Slovak | 8 | 0.2% |
| South American | 89 | 1.9% |
| Swedish | 58 | 1.2% |
| Syrian | 14 | 0.3% |
| Welsh | 248 | 5.2% | View All 31 Rows |
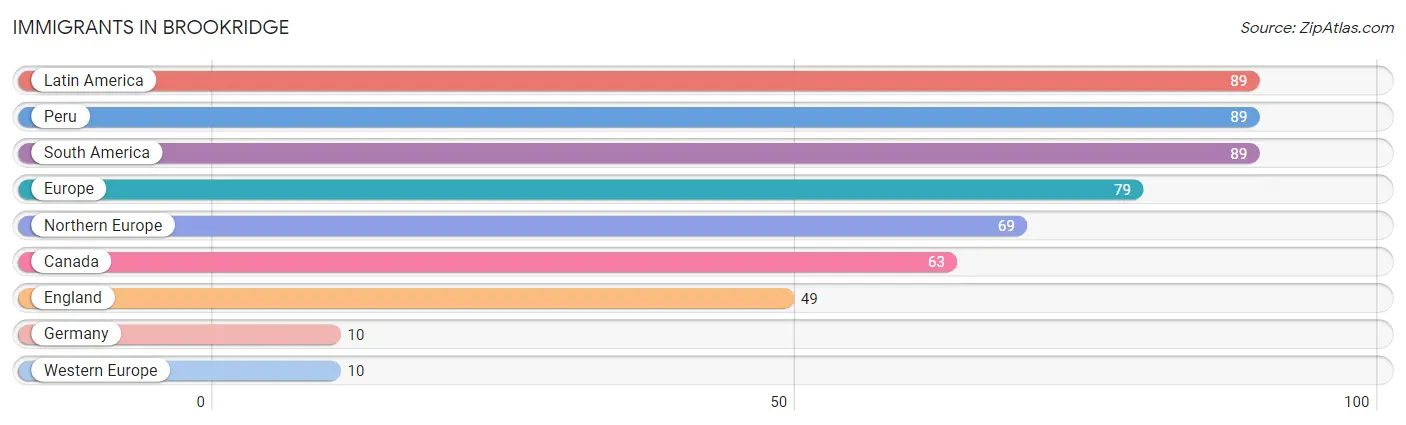
Immigrants in Brookridge
The most numerous immigrant groups reported in Brookridge came from Latin America (89 | 1.9%), Peru (89 | 1.9%), South America (89 | 1.9%), Europe (79 | 1.7%), and Northern Europe (69 | 1.4%), together accounting for 8.7% of all Brookridge residents.
| Immigration Origin | # Population | % Population |
| Canada | 63 | 1.3% |
| England | 49 | 1.0% |
| Europe | 79 | 1.7% |
| Germany | 10 | 0.2% |
| Latin America | 89 | 1.9% |
| Northern Europe | 69 | 1.4% |
| Peru | 89 | 1.9% |
| South America | 89 | 1.9% |
| Western Europe | 10 | 0.2% | View All 9 Rows |
Sex and Age in Brookridge
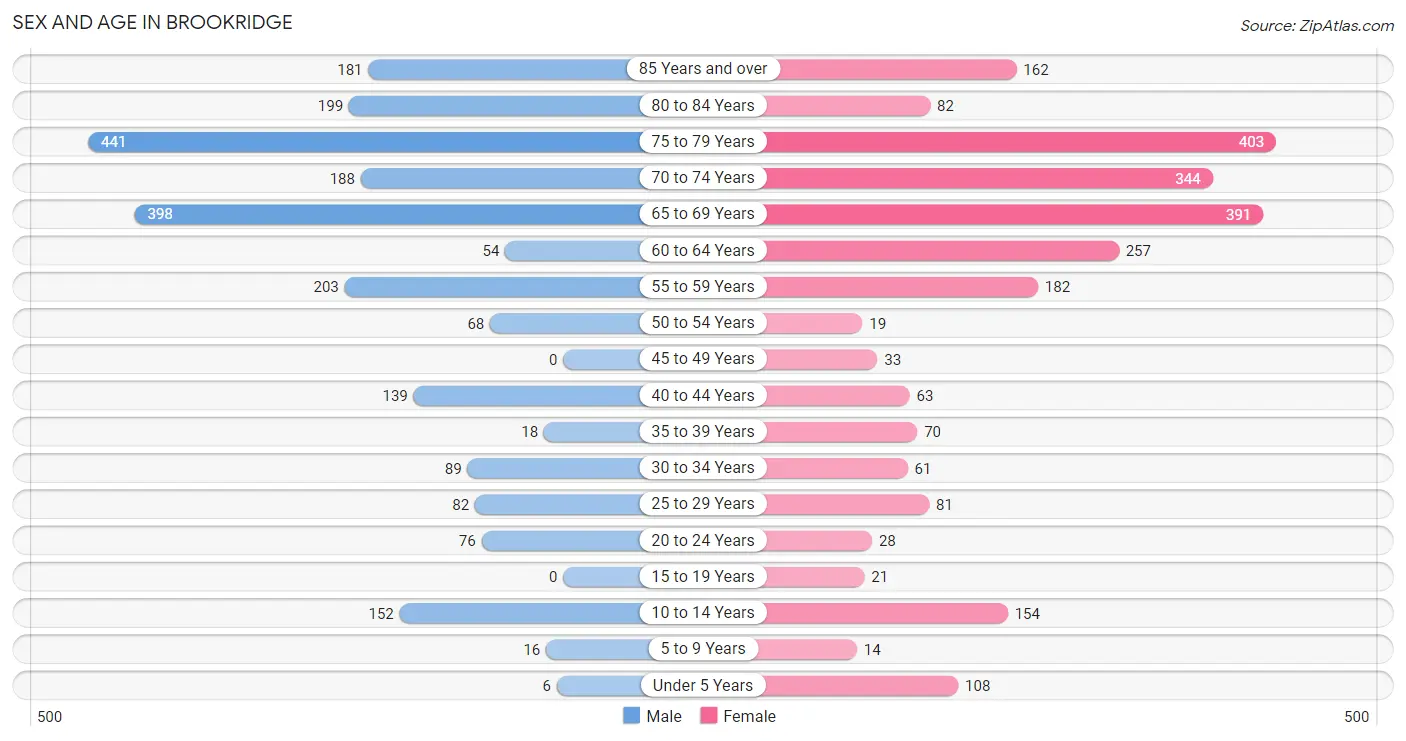
Sex and Age in Brookridge
The most populous age groups in Brookridge are 75 to 79 Years (441 | 19.1%) for men and 75 to 79 Years (403 | 16.3%) for women.
| Age Bracket | Male | Female |
| Under 5 Years | 6 (0.3%) | 108 (4.4%) |
| 5 to 9 Years | 16 (0.7%) | 14 (0.6%) |
| 10 to 14 Years | 152 (6.6%) | 154 (6.2%) |
| 15 to 19 Years | 0 (0.0%) | 21 (0.9%) |
| 20 to 24 Years | 76 (3.3%) | 28 (1.1%) |
| 25 to 29 Years | 82 (3.5%) | 81 (3.3%) |
| 30 to 34 Years | 89 (3.8%) | 61 (2.5%) |
| 35 to 39 Years | 18 (0.8%) | 70 (2.8%) |
| 40 to 44 Years | 139 (6.0%) | 63 (2.5%) |
| 45 to 49 Years | 0 (0.0%) | 33 (1.3%) |
| 50 to 54 Years | 68 (2.9%) | 19 (0.8%) |
| 55 to 59 Years | 203 (8.8%) | 182 (7.4%) |
| 60 to 64 Years | 54 (2.3%) | 257 (10.4%) |
| 65 to 69 Years | 398 (17.2%) | 391 (15.8%) |
| 70 to 74 Years | 188 (8.1%) | 344 (13.9%) |
| 75 to 79 Years | 441 (19.1%) | 403 (16.3%) |
| 80 to 84 Years | 199 (8.6%) | 82 (3.3%) |
| 85 Years and over | 181 (7.8%) | 162 (6.6%) |
| Total | 2,310 (100.0%) | 2,473 (100.0%) |
Families and Households in Brookridge
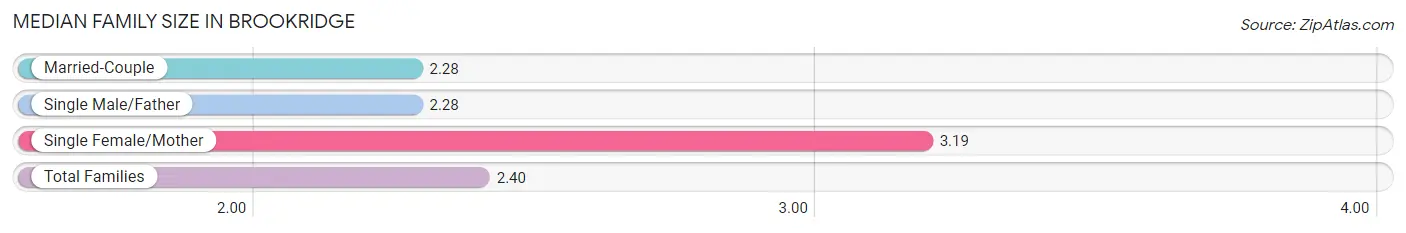
Median Family Size in Brookridge
The median family size in Brookridge is 2.40 persons per family, with single female/mother families (181 | 12.9%) accounting for the largest median family size of 3.19 persons per family. On the other hand, married-couple families (1,147 | 81.8%) represent the smallest median family size with 2.28 persons per family.
| Family Type | # Families | Family Size |
| Married-Couple | 1,147 (81.8%) | 2.28 |
| Single Male/Father | 75 (5.3%) | 2.28 |
| Single Female/Mother | 181 (12.9%) | 3.19 |
| Total Families | 1,403 (100.0%) | 2.40 |
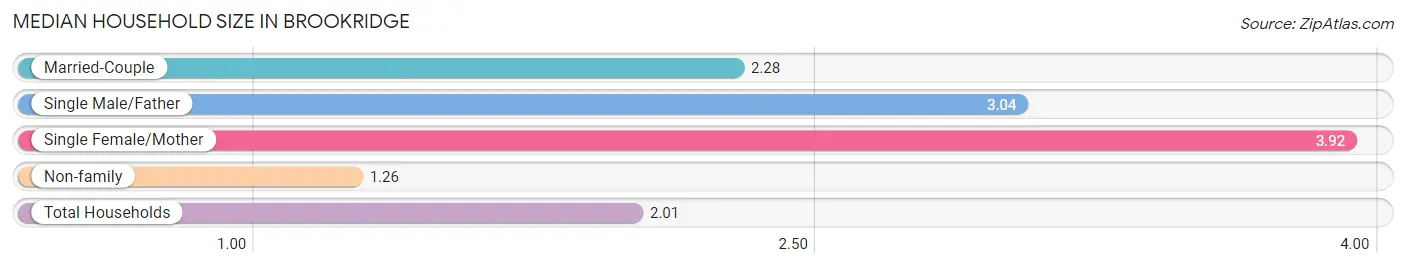
Median Household Size in Brookridge
The median household size in Brookridge is 2.01 persons per household, with single female/mother households (181 | 7.6%) accounting for the largest median household size of 3.92 persons per household. non-family households (972 | 40.9%) represent the smallest median household size with 1.26 persons per household.
| Household Type | # Households | Household Size |
| Married-Couple | 1,147 (48.3%) | 2.28 |
| Single Male/Father | 75 (3.2%) | 3.04 |
| Single Female/Mother | 181 (7.6%) | 3.92 |
| Non-family | 972 (40.9%) | 1.26 |
| Total Households | 2,375 (100.0%) | 2.01 |
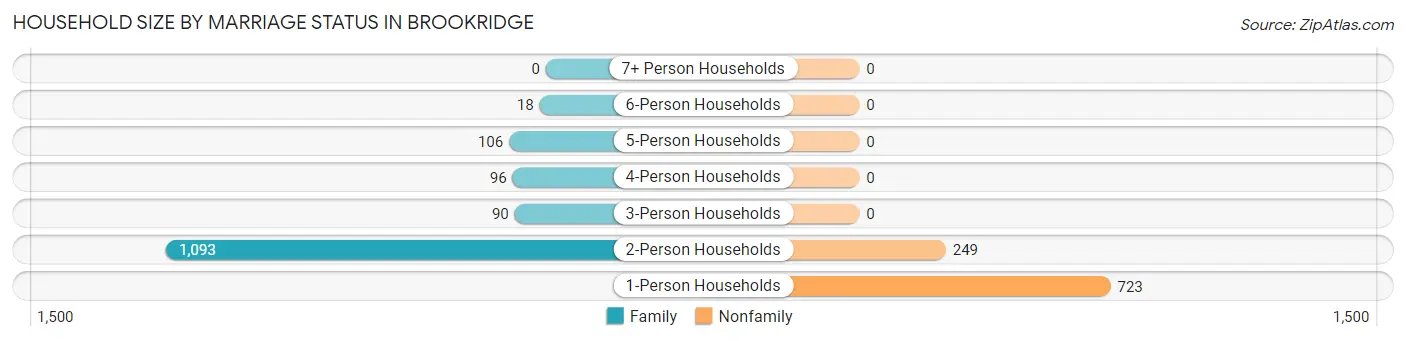
Household Size by Marriage Status in Brookridge
Out of a total of 2,375 households in Brookridge, 1,403 (59.1%) are family households, while 972 (40.9%) are nonfamily households. The most numerous type of family households are 2-person households, comprising 1,093, and the most common type of nonfamily households are 1-person households, comprising 723.
| Household Size | Family Households | Nonfamily Households |
| 1-Person Households | - | 723 (30.4%) |
| 2-Person Households | 1,093 (46.0%) | 249 (10.5%) |
| 3-Person Households | 90 (3.8%) | 0 (0.0%) |
| 4-Person Households | 96 (4.0%) | 0 (0.0%) |
| 5-Person Households | 106 (4.5%) | 0 (0.0%) |
| 6-Person Households | 18 (0.8%) | 0 (0.0%) |
| 7+ Person Households | 0 (0.0%) | 0 (0.0%) |
| Total | 1,403 (59.1%) | 972 (40.9%) |
Female Fertility in Brookridge
Fertility by Age in Brookridge
| Age Bracket | Women with Births | Births / 1,000 Women |
| 15 to 19 years | 0 (0.0%) | 0.0 |
| 20 to 34 years | 0 (0.0%) | 0.0 |
| 35 to 50 years | 0 (0.0%) | 0.0 |
| Total | 0 (0.0%) | 0.0 |
Fertility by Age by Marriage Status in Brookridge
| Age Bracket | Married | Unmarried |
| 15 to 19 years | 0 (0.0%) | 0 (0.0%) |
| 20 to 34 years | 0 (0.0%) | 0 (0.0%) |
| 35 to 50 years | 0 (0.0%) | 0 (0.0%) |
| Total | 0 (0.0%) | 0 (0.0%) |
Fertility by Education in Brookridge
| Educational Attainment | Women with Births | Births / 1,000 Women |
| Less than High School | 0 (0.0%) | 0.0 |
| High School Diploma | 0 (0.0%) | 0.0 |
| College or Associate's Degree | 0 (0.0%) | 0.0 |
| Bachelor's Degree | 0 (0.0%) | 0.0 |
| Graduate Degree | 0 (0.0%) | 0.0 |
| Total | 0 (0.0%) | 0.0 |
Fertility by Education by Marriage Status in Brookridge
| Educational Attainment | Married | Unmarried |
| Less than High School | 0 (0.0%) | 0 (0.0%) |
| High School Diploma | 0 (0.0%) | 0 (0.0%) |
| College or Associate's Degree | 0 (0.0%) | 0 (0.0%) |
| Bachelor's Degree | 0 (0.0%) | 0 (0.0%) |
| Graduate Degree | 0 (0.0%) | 0 (0.0%) |
| Total | 0 (0.0%) | 0 (0.0%) |
Income in Brookridge
Income Overview in Brookridge
Per Capita Income in Brookridge is $32,191, while median incomes of families and households are $60,284 and $49,240 respectively.
| Characteristic | Number | Measure |
| Per Capita Income | 4,783 | $32,191 |
| Median Family Income | 1,403 | $60,284 |
| Mean Family Income | 1,403 | $75,550 |
| Median Household Income | 2,375 | $49,240 |
| Mean Household Income | 2,375 | $63,549 |
| Income Deficit | 1,403 | $0 |
| Wage / Income Gap (%) | 4,783 | 20.04% |
| Wage / Income Gap ($) | 4,783 | 79.96¢ per $1 |
| Gini / Inequality Index | 4,783 | 0.39 |
Earnings by Sex in Brookridge
Average Earnings in Brookridge are $30,045, $24,789 for men and $31,003 for women, a difference of 20.0%.
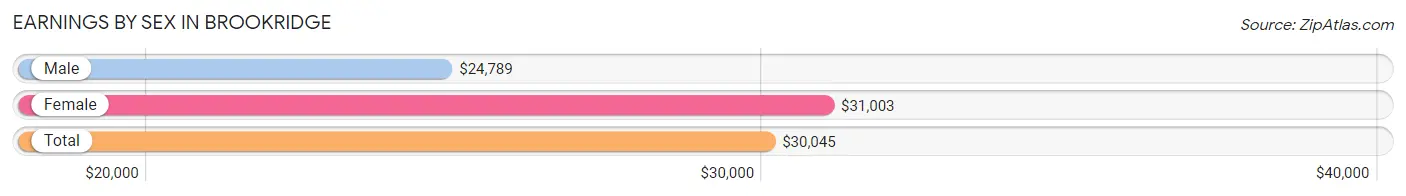
| Sex | Number | Average Earnings |
| Male | 667 (55.0%) | $24,789 |
| Female | 545 (45.0%) | $31,003 |
| Total | 1,212 (100.0%) | $30,045 |
Earnings by Sex by Income Bracket in Brookridge
The most common earnings brackets in Brookridge are $22,500 to $24,999 for men (89 | 13.3%) and $30,000 to $34,999 for women (81 | 14.9%).
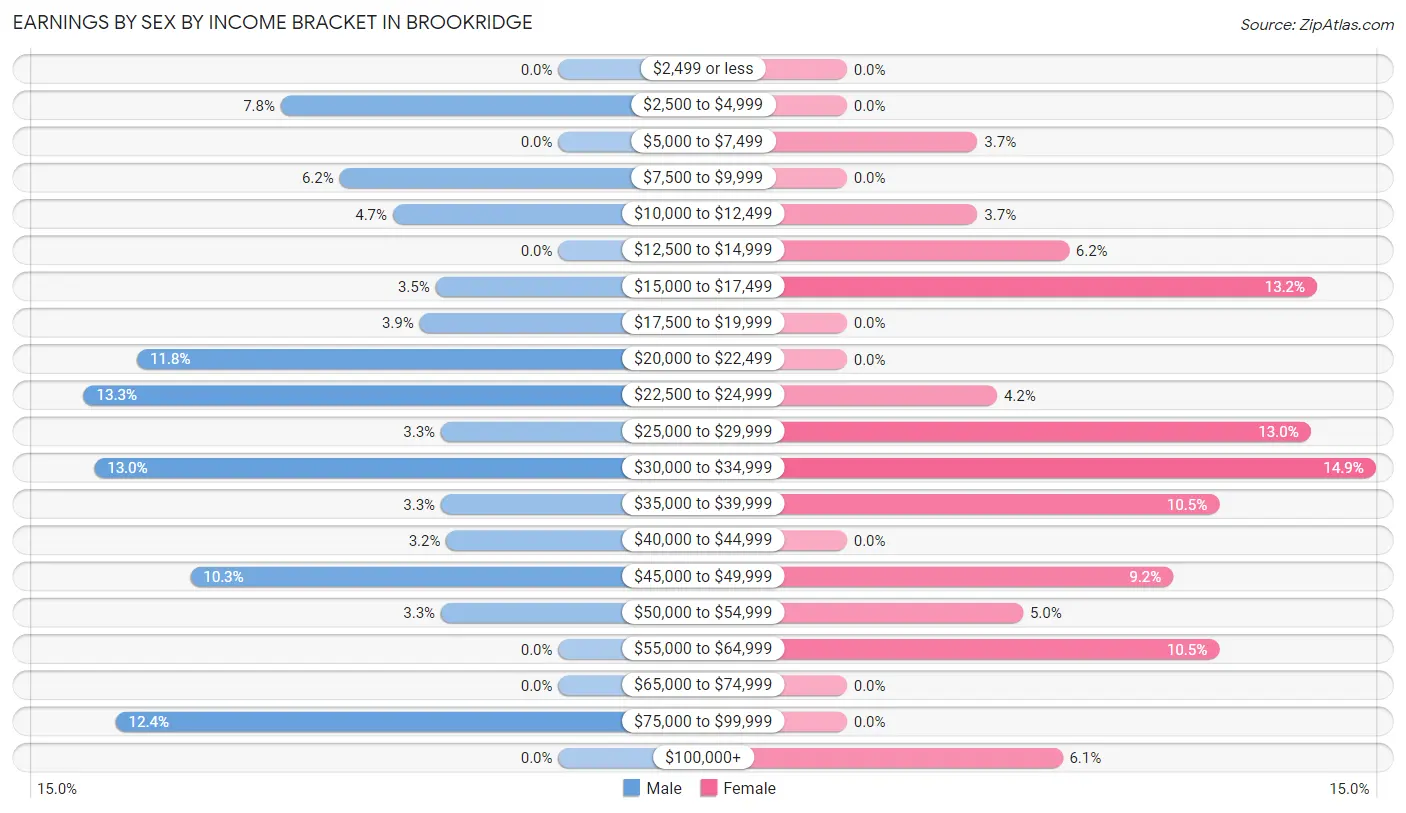
| Income | Male | Female |
| $2,499 or less | 0 (0.0%) | 0 (0.0%) |
| $2,500 to $4,999 | 52 (7.8%) | 0 (0.0%) |
| $5,000 to $7,499 | 0 (0.0%) | 20 (3.7%) |
| $7,500 to $9,999 | 41 (6.1%) | 0 (0.0%) |
| $10,000 to $12,499 | 31 (4.6%) | 20 (3.7%) |
| $12,500 to $14,999 | 0 (0.0%) | 34 (6.2%) |
| $15,000 to $17,499 | 23 (3.5%) | 72 (13.2%) |
| $17,500 to $19,999 | 26 (3.9%) | 0 (0.0%) |
| $20,000 to $22,499 | 79 (11.8%) | 0 (0.0%) |
| $22,500 to $24,999 | 89 (13.3%) | 23 (4.2%) |
| $25,000 to $29,999 | 22 (3.3%) | 71 (13.0%) |
| $30,000 to $34,999 | 87 (13.0%) | 81 (14.9%) |
| $35,000 to $39,999 | 22 (3.3%) | 57 (10.5%) |
| $40,000 to $44,999 | 21 (3.2%) | 0 (0.0%) |
| $45,000 to $49,999 | 69 (10.3%) | 50 (9.2%) |
| $50,000 to $54,999 | 22 (3.3%) | 27 (5.0%) |
| $55,000 to $64,999 | 0 (0.0%) | 57 (10.5%) |
| $65,000 to $74,999 | 0 (0.0%) | 0 (0.0%) |
| $75,000 to $99,999 | 83 (12.4%) | 0 (0.0%) |
| $100,000+ | 0 (0.0%) | 33 (6.1%) |
| Total | 667 (100.0%) | 545 (100.0%) |
Earnings by Sex by Educational Attainment in Brookridge
Average earnings in Brookridge are $25,682 for men and $31,343 for women, a difference of 18.1%. Men with an educational attainment of college or associate's degree enjoy the highest average annual earnings of $31,290, while those with high school diploma education earn the least with $26,364. Women with an educational attainment of graduate degree earn the most with the average annual earnings of $108,750, while those with college or associate's degree education have the smallest earnings of $30,617.
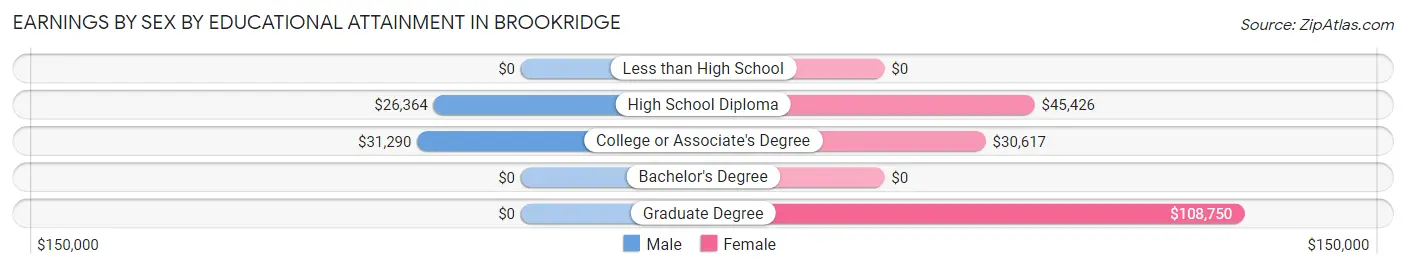
| Educational Attainment | Male Income | Female Income |
| Less than High School | - | - |
| High School Diploma | $26,364 | $45,426 |
| College or Associate's Degree | $31,290 | $30,617 |
| Bachelor's Degree | - | - |
| Graduate Degree | - | - |
| Total | $25,682 | $31,343 |
Family Income in Brookridge
Family Income Brackets in Brookridge
According to the Brookridge family income data, there are 325 families falling into the $50,000 to $74,999 income range, which is the most common income bracket and makes up 23.2% of all families.
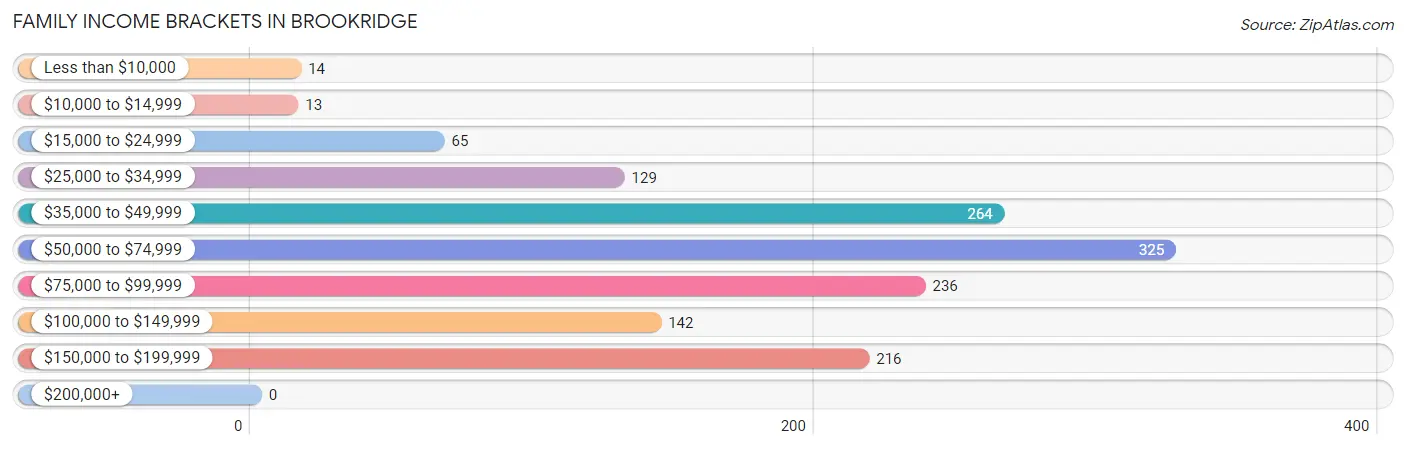
| Income Bracket | # Families | % Families |
| Less than $10,000 | 14 | 1.0% |
| $10,000 to $14,999 | 13 | 0.9% |
| $15,000 to $24,999 | 65 | 4.6% |
| $25,000 to $34,999 | 129 | 9.2% |
| $35,000 to $49,999 | 264 | 18.8% |
| $50,000 to $74,999 | 325 | 23.2% |
| $75,000 to $99,999 | 236 | 16.8% |
| $100,000 to $149,999 | 142 | 10.1% |
| $150,000 to $199,999 | 216 | 15.4% |
| $200,000+ | 0 | 0.0% |
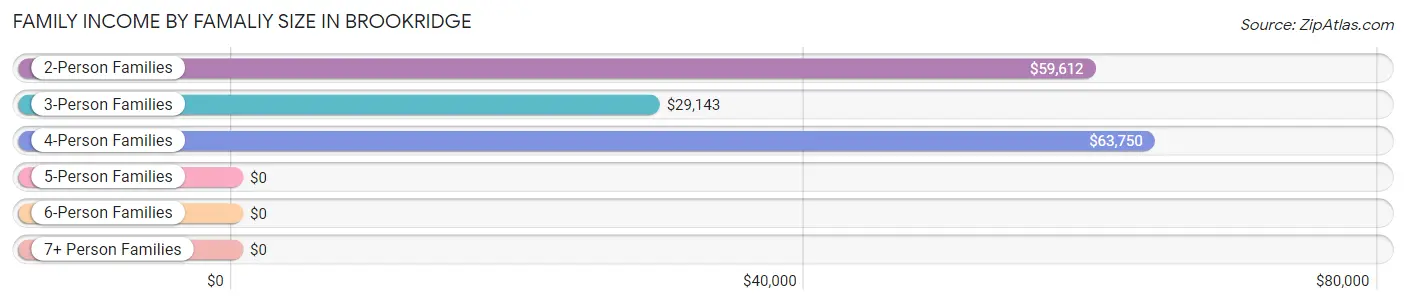
Family Income by Famaliy Size in Brookridge
4-person families (44 | 3.1%) account for the highest median family income in Brookridge with $63,750 per family, while 2-person families (1,161 | 82.8%) have the highest median income of $29,806 per family member.
| Income Bracket | # Families | Median Income |
| 2-Person Families | 1,161 (82.8%) | $59,612 |
| 3-Person Families | 92 (6.6%) | $29,143 |
| 4-Person Families | 44 (3.1%) | $63,750 |
| 5-Person Families | 106 (7.6%) | $0 |
| 6-Person Families | 0 (0.0%) | $0 |
| 7+ Person Families | 0 (0.0%) | $0 |
| Total | 1,403 (100.0%) | $60,284 |
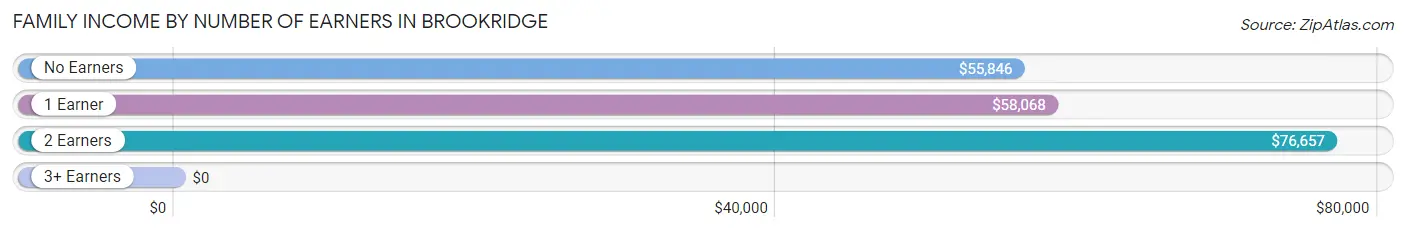
Family Income by Number of Earners in Brookridge
| Number of Earners | # Families | Median Income |
| No Earners | 921 (65.6%) | $55,846 |
| 1 Earner | 340 (24.2%) | $58,068 |
| 2 Earners | 142 (10.1%) | $76,657 |
| 3+ Earners | 0 (0.0%) | $0 |
| Total | 1,403 (100.0%) | $60,284 |
Household Income in Brookridge
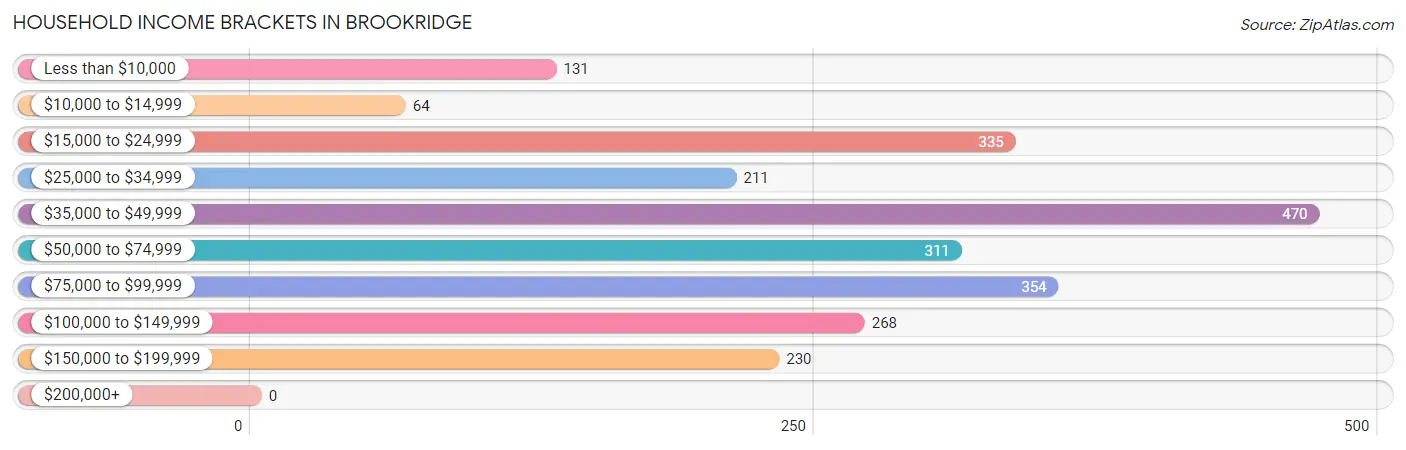
Household Income Brackets in Brookridge
With 470 households falling in the category, the $35,000 to $49,999 income range is the most frequent in Brookridge, accounting for 19.8% of all households.
| Income Bracket | # Households | % Households |
| Less than $10,000 | 131 | 5.5% |
| $10,000 to $14,999 | 64 | 2.7% |
| $15,000 to $24,999 | 335 | 14.1% |
| $25,000 to $34,999 | 211 | 8.9% |
| $35,000 to $49,999 | 470 | 19.8% |
| $50,000 to $74,999 | 311 | 13.1% |
| $75,000 to $99,999 | 354 | 14.9% |
| $100,000 to $149,999 | 268 | 11.3% |
| $150,000 to $199,999 | 230 | 9.7% |
| $200,000+ | 0 | 0.0% |
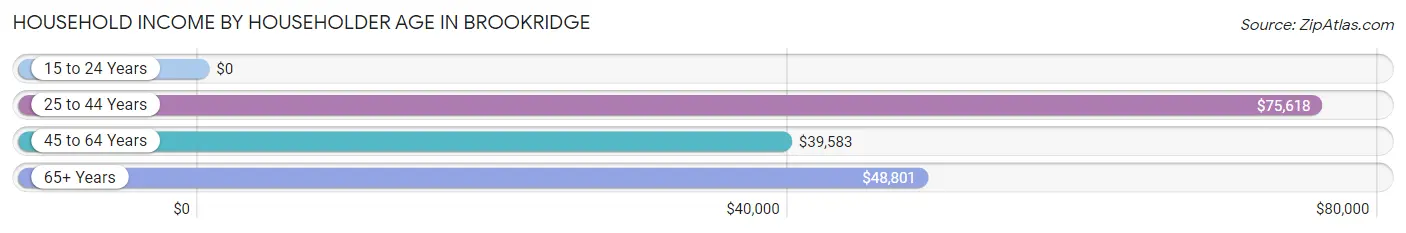
Household Income by Householder Age in Brookridge
The median household income in Brookridge is $49,240, with the highest median household income of $75,618 found in the 25 to 44 years age bracket for the primary householder. A total of 302 households (12.7%) fall into this category. Meanwhile, the 15 to 24 years age bracket for the primary householder has the lowest median household income of $0, with 3 households (0.1%) in this group.
| Income Bracket | # Households | Median Income |
| 15 to 24 Years | 3 (0.1%) | $0 |
| 25 to 44 Years | 302 (12.7%) | $75,618 |
| 45 to 64 Years | 383 (16.1%) | $39,583 |
| 65+ Years | 1,687 (71.0%) | $48,801 |
| Total | 2,375 (100.0%) | $49,240 |
Poverty in Brookridge
Income Below Poverty by Sex and Age in Brookridge
With 7.5% poverty level for males and 6.3% for females among the residents of Brookridge, 45 to 54 year old males and 55 to 64 year old females are the most vulnerable to poverty, with 25 males (36.8%) and 57 females (13.0%) in their respective age groups living below the poverty level.
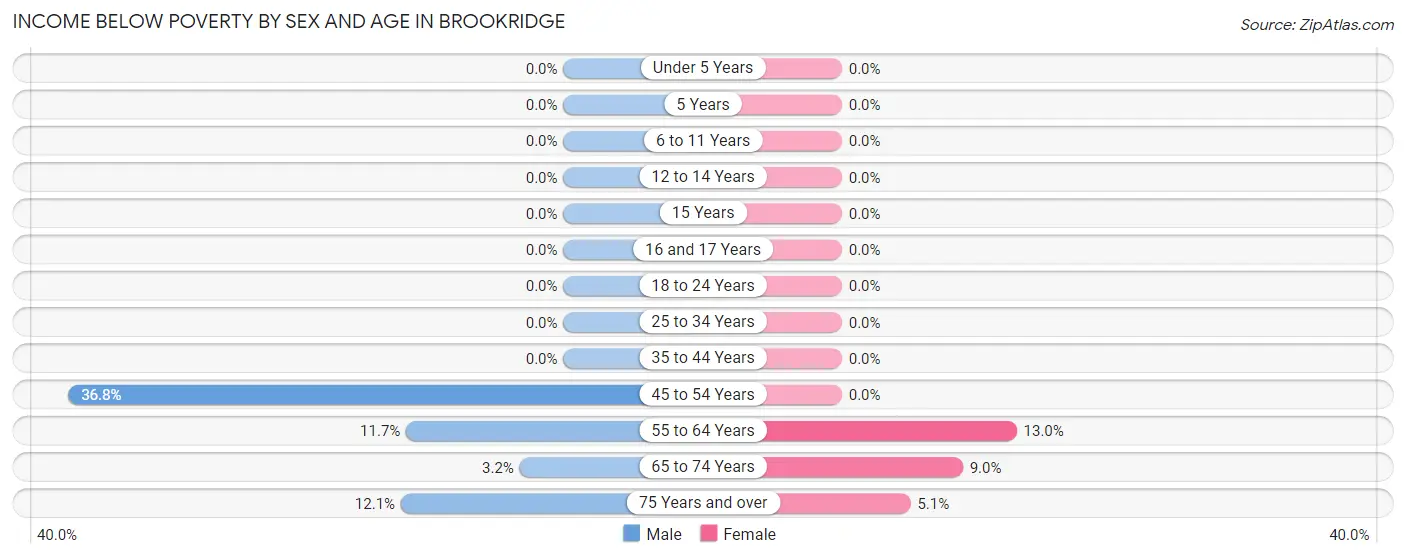
| Age Bracket | Male | Female |
| Under 5 Years | 0 (0.0%) | 0 (0.0%) |
| 5 Years | 0 (0.0%) | 0 (0.0%) |
| 6 to 11 Years | 0 (0.0%) | 0 (0.0%) |
| 12 to 14 Years | 0 (0.0%) | 0 (0.0%) |
| 15 Years | 0 (0.0%) | 0 (0.0%) |
| 16 and 17 Years | 0 (0.0%) | 0 (0.0%) |
| 18 to 24 Years | 0 (0.0%) | 0 (0.0%) |
| 25 to 34 Years | 0 (0.0%) | 0 (0.0%) |
| 35 to 44 Years | 0 (0.0%) | 0 (0.0%) |
| 45 to 54 Years | 25 (36.8%) | 0 (0.0%) |
| 55 to 64 Years | 30 (11.7%) | 57 (13.0%) |
| 65 to 74 Years | 19 (3.2%) | 66 (9.0%) |
| 75 Years and over | 99 (12.1%) | 33 (5.1%) |
| Total | 173 (7.5%) | 156 (6.3%) |
Income Above Poverty by Sex and Age in Brookridge
According to the poverty statistics in Brookridge, males aged under 5 years and females aged under 5 years are the age groups that are most secure financially, with 100.0% of males and 100.0% of females in these age groups living above the poverty line.
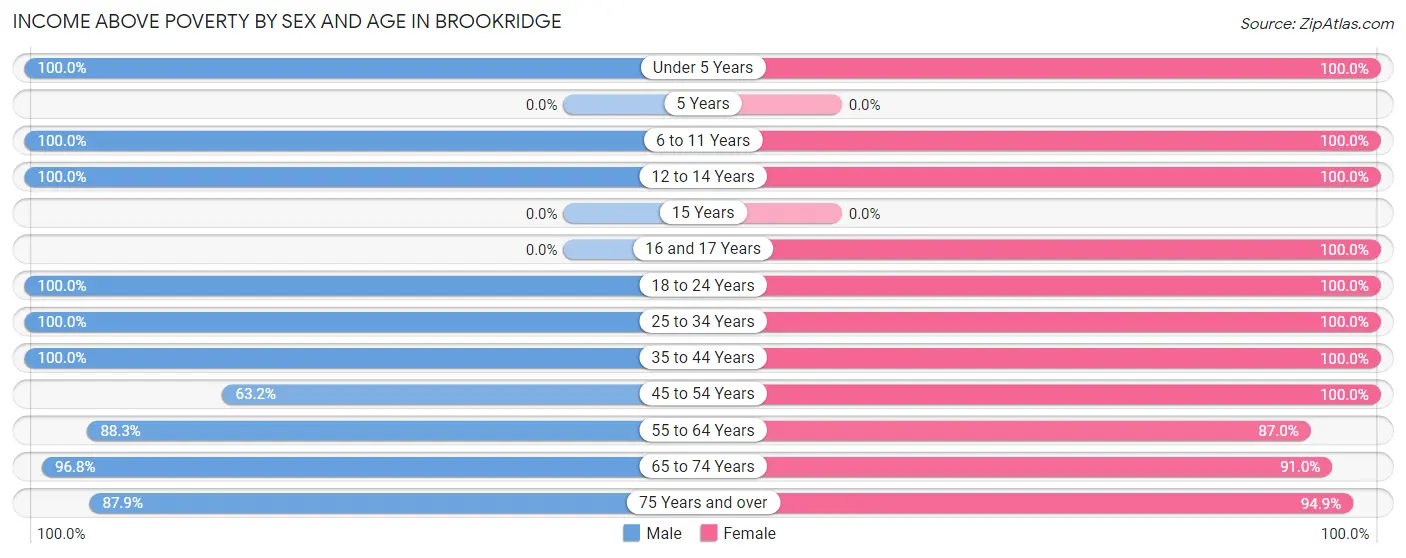
| Age Bracket | Male | Female |
| Under 5 Years | 6 (100.0%) | 108 (100.0%) |
| 5 Years | 0 (0.0%) | 0 (0.0%) |
| 6 to 11 Years | 99 (100.0%) | 97 (100.0%) |
| 12 to 14 Years | 69 (100.0%) | 71 (100.0%) |
| 15 Years | 0 (0.0%) | 0 (0.0%) |
| 16 and 17 Years | 0 (0.0%) | 21 (100.0%) |
| 18 to 24 Years | 76 (100.0%) | 28 (100.0%) |
| 25 to 34 Years | 171 (100.0%) | 142 (100.0%) |
| 35 to 44 Years | 157 (100.0%) | 133 (100.0%) |
| 45 to 54 Years | 43 (63.2%) | 52 (100.0%) |
| 55 to 64 Years | 227 (88.3%) | 382 (87.0%) |
| 65 to 74 Years | 567 (96.8%) | 669 (91.0%) |
| 75 Years and over | 722 (87.9%) | 614 (94.9%) |
| Total | 2,137 (92.5%) | 2,317 (93.7%) |
Income Below Poverty Among Married-Couple Families in Brookridge
The poverty statistics for married-couple families in Brookridge show that 2.4% or 27 of the total 1,147 families live below the poverty line. Families with no children have the highest poverty rate of 2.6%, comprising of 27 families. On the other hand, families with 1 or 2 children have the lowest poverty rate of 0.0%, which includes 0 families.
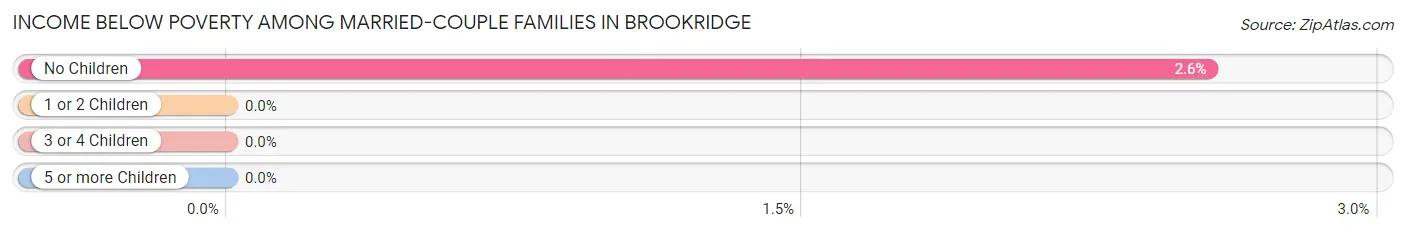
| Children | Above Poverty | Below Poverty |
| No Children | 1,027 (97.4%) | 27 (2.6%) |
| 1 or 2 Children | 4 (100.0%) | 0 (0.0%) |
| 3 or 4 Children | 89 (100.0%) | 0 (0.0%) |
| 5 or more Children | 0 (0.0%) | 0 (0.0%) |
| Total | 1,120 (97.7%) | 27 (2.4%) |
Income Below Poverty Among Single-Parent Households in Brookridge
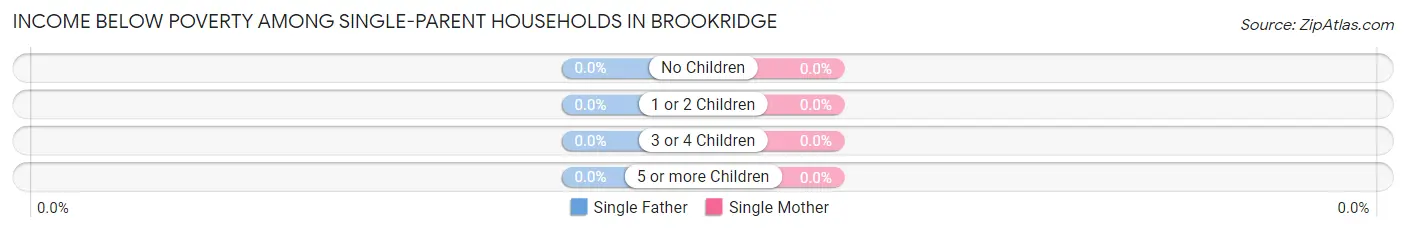
| Children | Single Father | Single Mother |
| No Children | 0 (0.0%) | 0 (0.0%) |
| 1 or 2 Children | 0 (0.0%) | 0 (0.0%) |
| 3 or 4 Children | 0 (0.0%) | 0 (0.0%) |
| 5 or more Children | 0 (0.0%) | 0 (0.0%) |
| Total | 0 (0.0%) | 0 (0.0%) |
Income Below Poverty Among Married-Couple vs Single-Parent Households in Brookridge
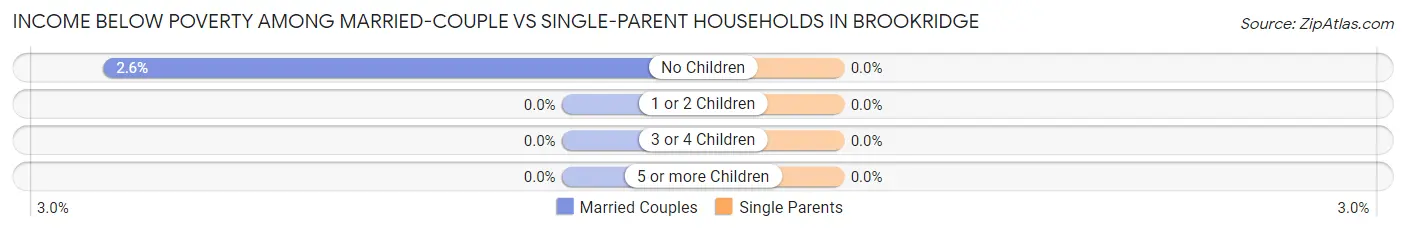
| Children | Married-Couple Families | Single-Parent Households |
| No Children | 27 (2.6%) | 0 (0.0%) |
| 1 or 2 Children | 0 (0.0%) | 0 (0.0%) |
| 3 or 4 Children | 0 (0.0%) | 0 (0.0%) |
| 5 or more Children | 0 (0.0%) | 0 (0.0%) |
| Total | 27 (2.4%) | 0 (0.0%) |
Employment Characteristics in Brookridge
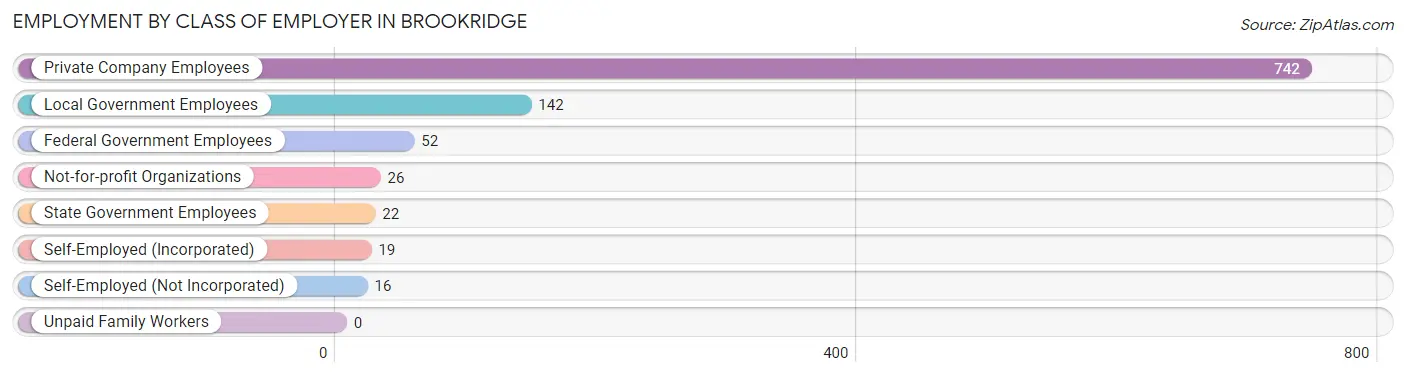
Employment by Class of Employer in Brookridge
Among the 1,019 employed individuals in Brookridge, private company employees (742 | 72.8%), local government employees (142 | 13.9%), and federal government employees (52 | 5.1%) make up the most common classes of employment.
| Employer Class | # Employees | % Employees |
| Private Company Employees | 742 | 72.8% |
| Self-Employed (Incorporated) | 19 | 1.9% |
| Self-Employed (Not Incorporated) | 16 | 1.6% |
| Not-for-profit Organizations | 26 | 2.5% |
| Local Government Employees | 142 | 13.9% |
| State Government Employees | 22 | 2.2% |
| Federal Government Employees | 52 | 5.1% |
| Unpaid Family Workers | 0 | 0.0% |
| Total | 1,019 | 100.0% |
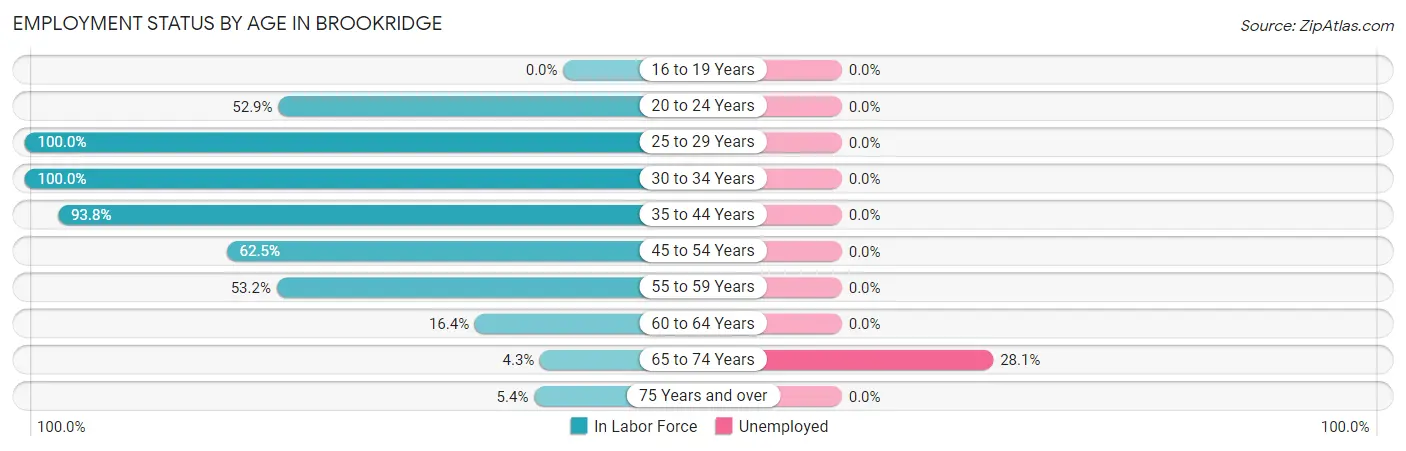
Employment Status by Age in Brookridge
According to the labor force statistics for Brookridge, out of the total population over 16 years of age (4,333), 25.6% or 1,109 individuals are in the labor force, with 1.4% or 16 of them unemployed. The age group with the highest labor force participation rate is 25 to 29 years, with 100.0% or 163 individuals in the labor force. Within the labor force, the 65 to 74 years age range has the highest percentage of unemployed individuals, with 28.1% or 16 of them being unemployed.
| Age Bracket | In Labor Force | Unemployed |
| 16 to 19 Years | 0 (0.0%) | 0 (0.0%) |
| 20 to 24 Years | 55 (52.9%) | 0 (0.0%) |
| 25 to 29 Years | 163 (100.0%) | 0 (0.0%) |
| 30 to 34 Years | 150 (100.0%) | 0 (0.0%) |
| 35 to 44 Years | 272 (93.8%) | 0 (0.0%) |
| 45 to 54 Years | 75 (62.5%) | 0 (0.0%) |
| 55 to 59 Years | 205 (53.2%) | 0 (0.0%) |
| 60 to 64 Years | 51 (16.4%) | 0 (0.0%) |
| 65 to 74 Years | 57 (4.3%) | 16 (28.1%) |
| 75 Years and over | 79 (5.4%) | 0 (0.0%) |
| Total | 1,109 (25.6%) | 16 (1.4%) |
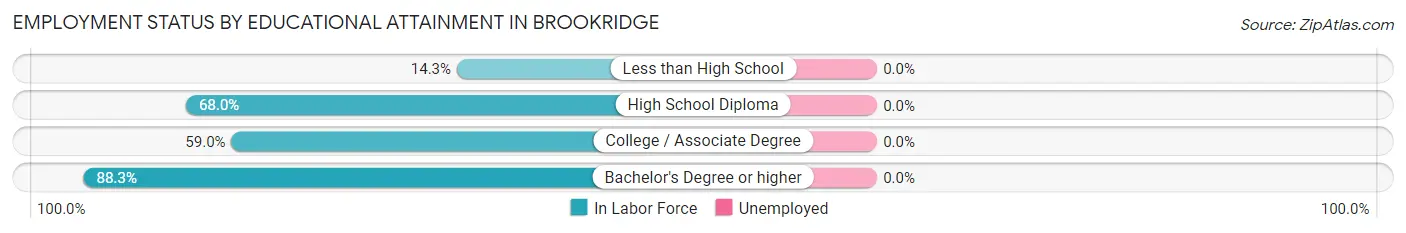
Employment Status by Educational Attainment in Brookridge
| Educational Attainment | In Labor Force | Unemployed |
| Less than High School | 11 (14.3%) | 0 (0.0%) |
| High School Diploma | 440 (68.0%) | 0 (0.0%) |
| College / Associate Degree | 299 (59.0%) | 0 (0.0%) |
| Bachelor's Degree or higher | 166 (88.3%) | 0 (0.0%) |
| Total | 917 (64.6%) | 0 (0.0%) |
Employment Occupations by Sex in Brookridge
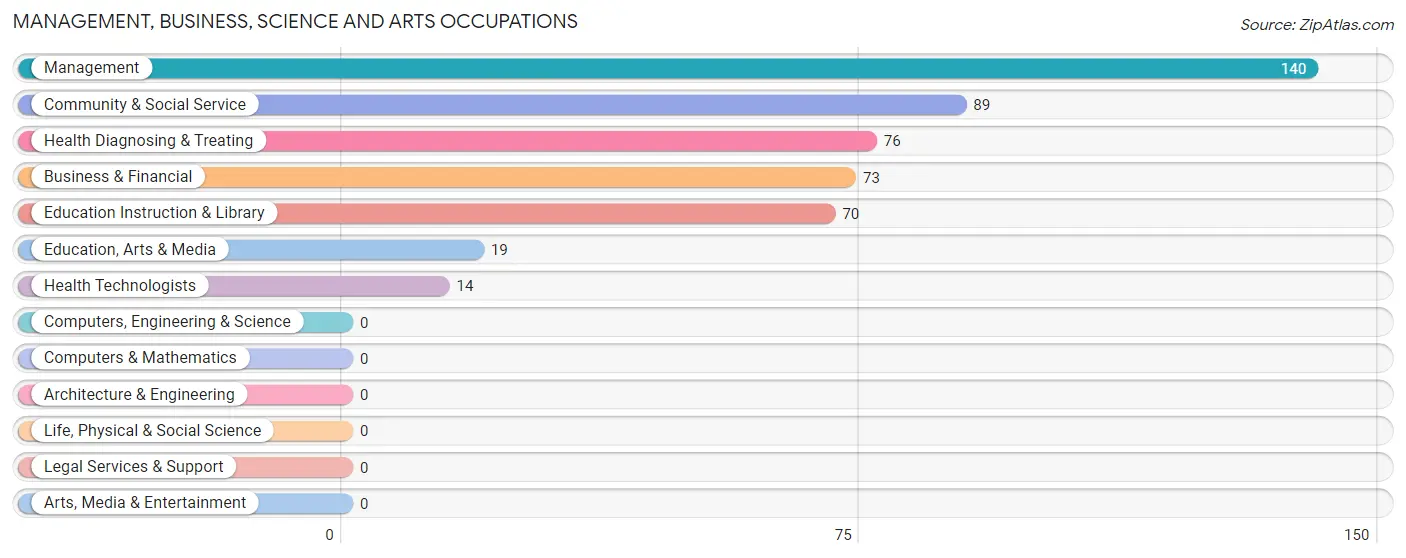
Management, Business, Science and Arts Occupations
The most common Management, Business, Science and Arts occupations in Brookridge are Management (140 | 12.8%), Community & Social Service (89 | 8.2%), Health Diagnosing & Treating (76 | 7.0%), Business & Financial (73 | 6.7%), and Education Instruction & Library (70 | 6.4%).
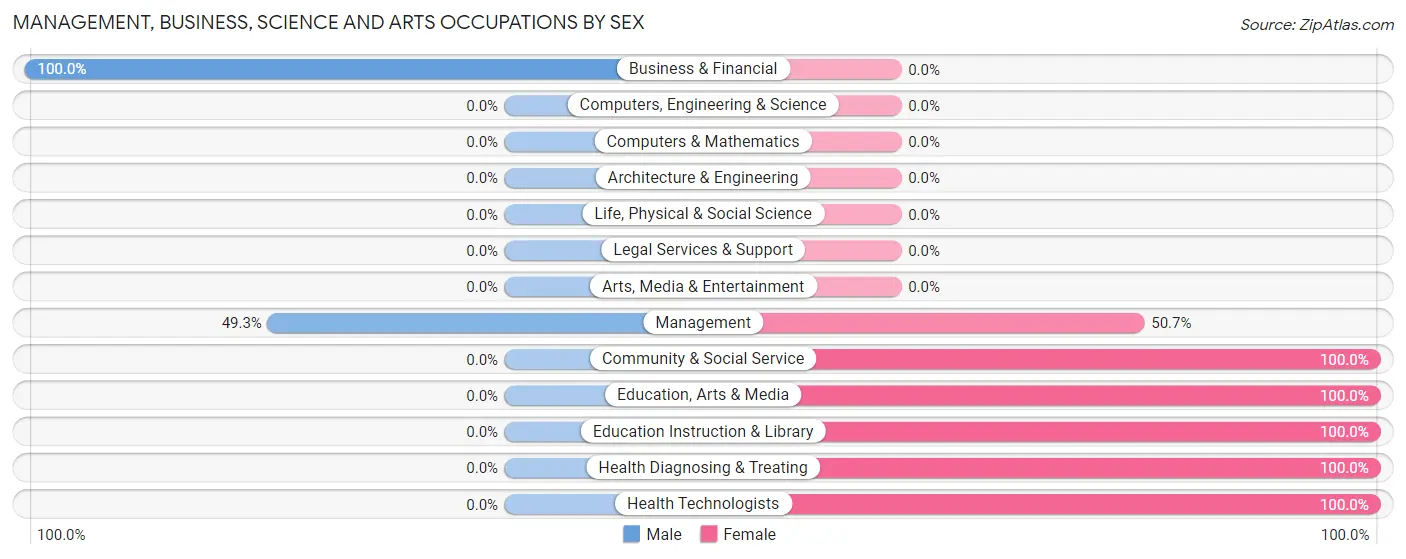
Management, Business, Science and Arts Occupations by Sex
Within the Management, Business, Science and Arts occupations in Brookridge, the most male-oriented occupations are Business & Financial (100.0%), and Management (49.3%), while the most female-oriented occupations are Community & Social Service (100.0%), Education, Arts & Media (100.0%), and Education Instruction & Library (100.0%).
| Occupation | Male | Female |
| Management | 69 (49.3%) | 71 (50.7%) |
| Business & Financial | 73 (100.0%) | 0 (0.0%) |
| Computers, Engineering & Science | 0 (0.0%) | 0 (0.0%) |
| Computers & Mathematics | 0 (0.0%) | 0 (0.0%) |
| Architecture & Engineering | 0 (0.0%) | 0 (0.0%) |
| Life, Physical & Social Science | 0 (0.0%) | 0 (0.0%) |
| Community & Social Service | 0 (0.0%) | 89 (100.0%) |
| Education, Arts & Media | 0 (0.0%) | 19 (100.0%) |
| Legal Services & Support | 0 (0.0%) | 0 (0.0%) |
| Education Instruction & Library | 0 (0.0%) | 70 (100.0%) |
| Arts, Media & Entertainment | 0 (0.0%) | 0 (0.0%) |
| Health Diagnosing & Treating | 0 (0.0%) | 76 (100.0%) |
| Health Technologists | 0 (0.0%) | 14 (100.0%) |
| Total (Category) | 142 (37.6%) | 236 (62.4%) |
| Total (Overall) | 565 (51.7%) | 527 (48.3%) |
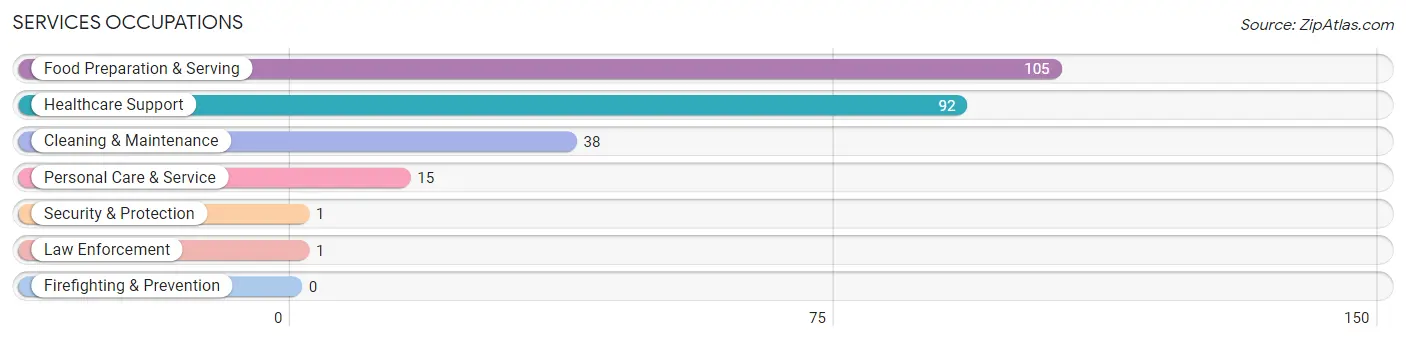
Services Occupations
The most common Services occupations in Brookridge are Food Preparation & Serving (105 | 9.6%), Healthcare Support (92 | 8.4%), Cleaning & Maintenance (38 | 3.5%), Personal Care & Service (15 | 1.4%), and Security & Protection (1 | 0.1%).
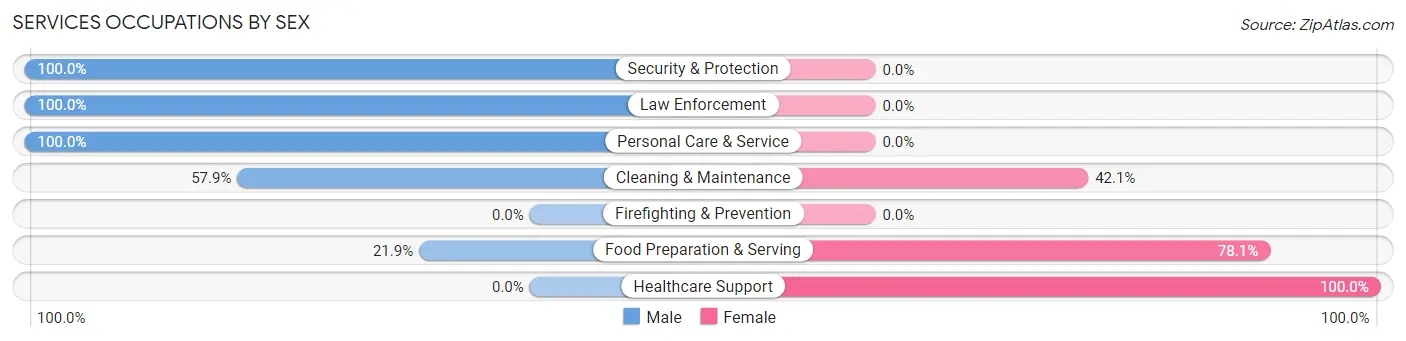
Services Occupations by Sex
Within the Services occupations in Brookridge, the most male-oriented occupations are Security & Protection (100.0%), Law Enforcement (100.0%), and Personal Care & Service (100.0%), while the most female-oriented occupations are Healthcare Support (100.0%), Food Preparation & Serving (78.1%), and Cleaning & Maintenance (42.1%).
| Occupation | Male | Female |
| Healthcare Support | 0 (0.0%) | 92 (100.0%) |
| Security & Protection | 1 (100.0%) | 0 (0.0%) |
| Firefighting & Prevention | 0 (0.0%) | 0 (0.0%) |
| Law Enforcement | 1 (100.0%) | 0 (0.0%) |
| Food Preparation & Serving | 23 (21.9%) | 82 (78.1%) |
| Cleaning & Maintenance | 22 (57.9%) | 16 (42.1%) |
| Personal Care & Service | 15 (100.0%) | 0 (0.0%) |
| Total (Category) | 61 (24.3%) | 190 (75.7%) |
| Total (Overall) | 565 (51.7%) | 527 (48.3%) |
Sales and Office Occupations
The most common Sales and Office occupations in Brookridge are Office & Administration (183 | 16.8%), and Sales & Related (134 | 12.3%).
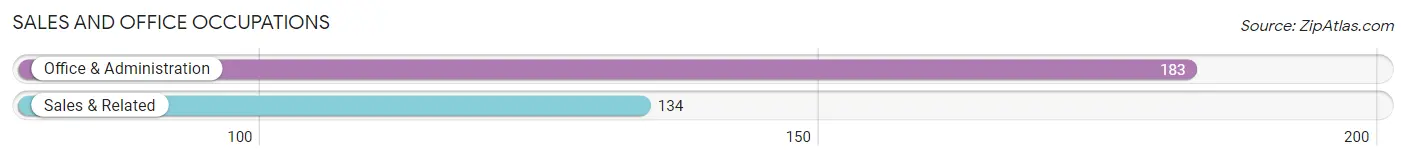
Sales and Office Occupations by Sex

| Occupation | Male | Female |
| Sales & Related | 91 (67.9%) | 43 (32.1%) |
| Office & Administration | 183 (100.0%) | 0 (0.0%) |
| Total (Category) | 274 (86.4%) | 43 (13.6%) |
| Total (Overall) | 565 (51.7%) | 527 (48.3%) |
Natural Resources, Construction and Maintenance Occupations
The most common Natural Resources, Construction and Maintenance occupations in Brookridge are , and Construction & Extraction (22 | 2.0%).
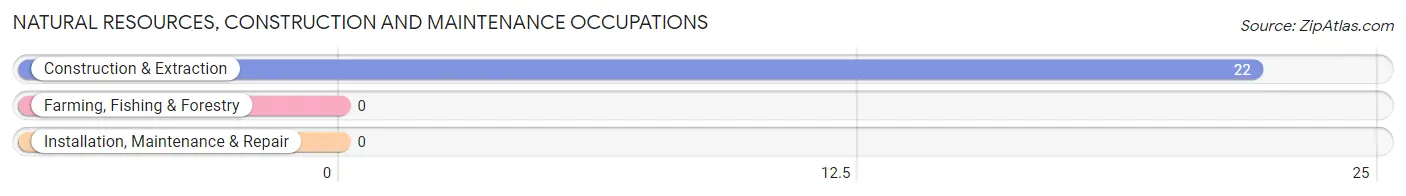
Natural Resources, Construction and Maintenance Occupations by Sex
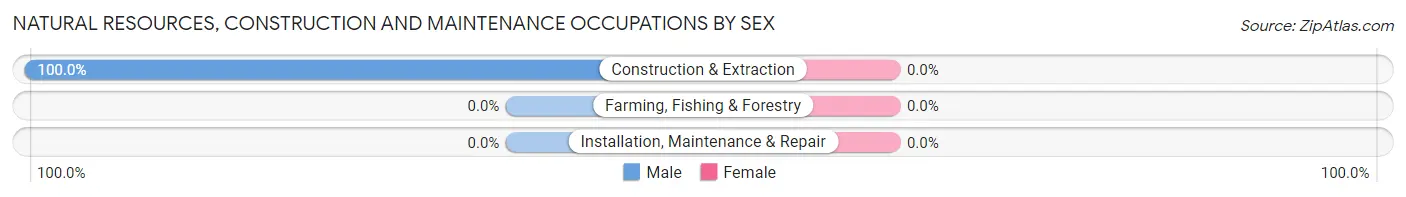
| Occupation | Male | Female |
| Farming, Fishing & Forestry | 0 (0.0%) | 0 (0.0%) |
| Construction & Extraction | 22 (100.0%) | 0 (0.0%) |
| Installation, Maintenance & Repair | 0 (0.0%) | 0 (0.0%) |
| Total (Category) | 22 (100.0%) | 0 (0.0%) |
| Total (Overall) | 565 (51.7%) | 527 (48.3%) |
Production, Transportation and Moving Occupations
The most common Production, Transportation and Moving occupations in Brookridge are Production (47 | 4.3%), Transportation (39 | 3.6%), and Material Moving (38 | 3.5%).
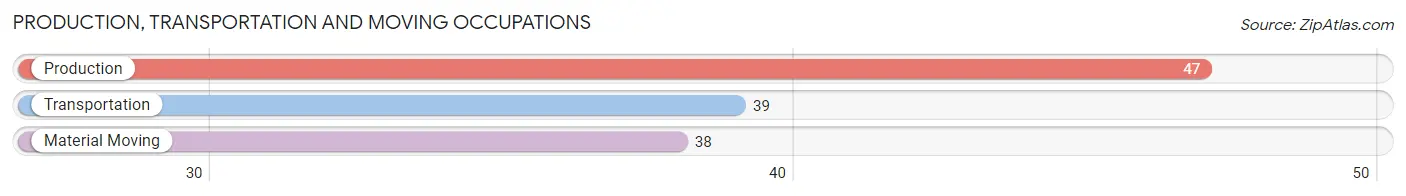
Production, Transportation and Moving Occupations by Sex
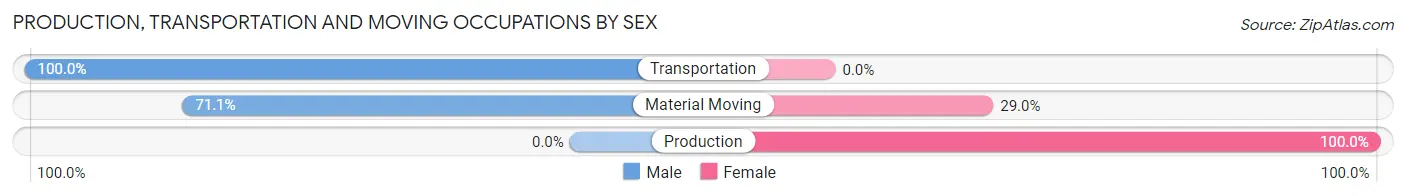
| Occupation | Male | Female |
| Production | 0 (0.0%) | 47 (100.0%) |
| Transportation | 39 (100.0%) | 0 (0.0%) |
| Material Moving | 27 (71.1%) | 11 (28.9%) |
| Total (Category) | 66 (53.2%) | 58 (46.8%) |
| Total (Overall) | 565 (51.7%) | 527 (48.3%) |
Employment Industries by Sex in Brookridge
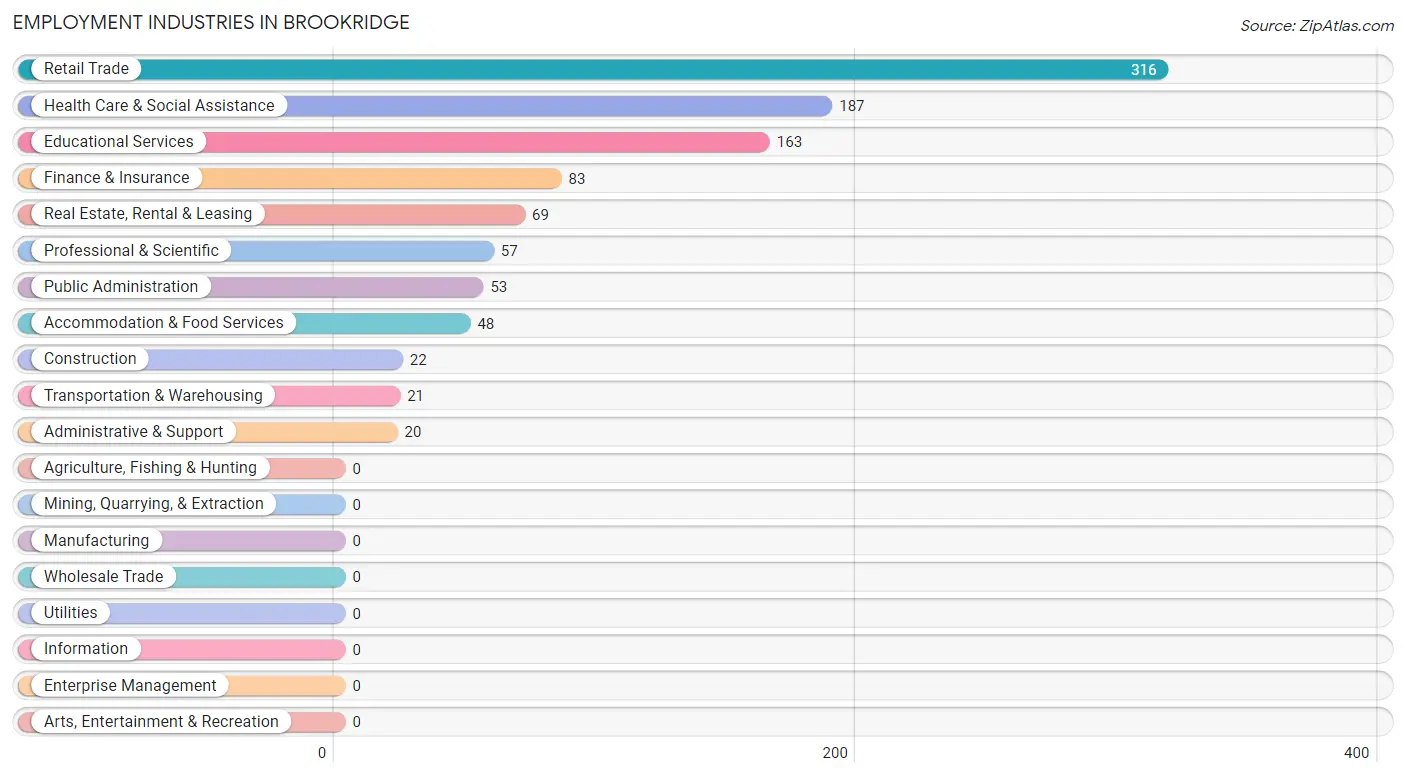
Employment Industries in Brookridge
The major employment industries in Brookridge include Retail Trade (316 | 28.9%), Health Care & Social Assistance (187 | 17.1%), Educational Services (163 | 14.9%), Finance & Insurance (83 | 7.6%), and Real Estate, Rental & Leasing (69 | 6.3%).
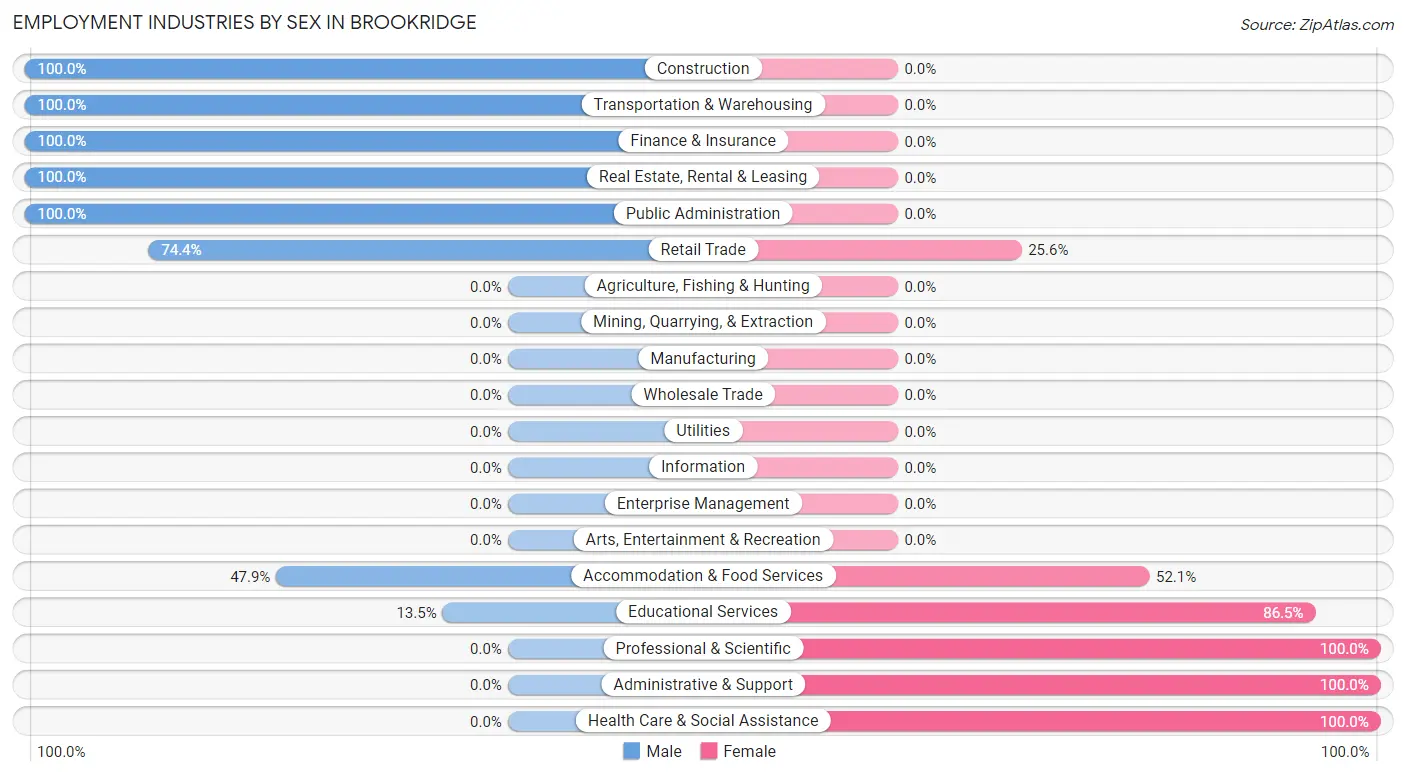
Employment Industries by Sex in Brookridge
The Brookridge industries that see more men than women are Construction (100.0%), Transportation & Warehousing (100.0%), and Finance & Insurance (100.0%), whereas the industries that tend to have a higher number of women are Professional & Scientific (100.0%), Administrative & Support (100.0%), and Health Care & Social Assistance (100.0%).
| Industry | Male | Female |
| Agriculture, Fishing & Hunting | 0 (0.0%) | 0 (0.0%) |
| Mining, Quarrying, & Extraction | 0 (0.0%) | 0 (0.0%) |
| Construction | 22 (100.0%) | 0 (0.0%) |
| Manufacturing | 0 (0.0%) | 0 (0.0%) |
| Wholesale Trade | 0 (0.0%) | 0 (0.0%) |
| Retail Trade | 235 (74.4%) | 81 (25.6%) |
| Transportation & Warehousing | 21 (100.0%) | 0 (0.0%) |
| Utilities | 0 (0.0%) | 0 (0.0%) |
| Information | 0 (0.0%) | 0 (0.0%) |
| Finance & Insurance | 83 (100.0%) | 0 (0.0%) |
| Real Estate, Rental & Leasing | 69 (100.0%) | 0 (0.0%) |
| Professional & Scientific | 0 (0.0%) | 57 (100.0%) |
| Enterprise Management | 0 (0.0%) | 0 (0.0%) |
| Administrative & Support | 0 (0.0%) | 20 (100.0%) |
| Educational Services | 22 (13.5%) | 141 (86.5%) |
| Health Care & Social Assistance | 0 (0.0%) | 187 (100.0%) |
| Arts, Entertainment & Recreation | 0 (0.0%) | 0 (0.0%) |
| Accommodation & Food Services | 23 (47.9%) | 25 (52.1%) |
| Public Administration | 53 (100.0%) | 0 (0.0%) |
| Total | 565 (51.7%) | 527 (48.3%) |
Education in Brookridge
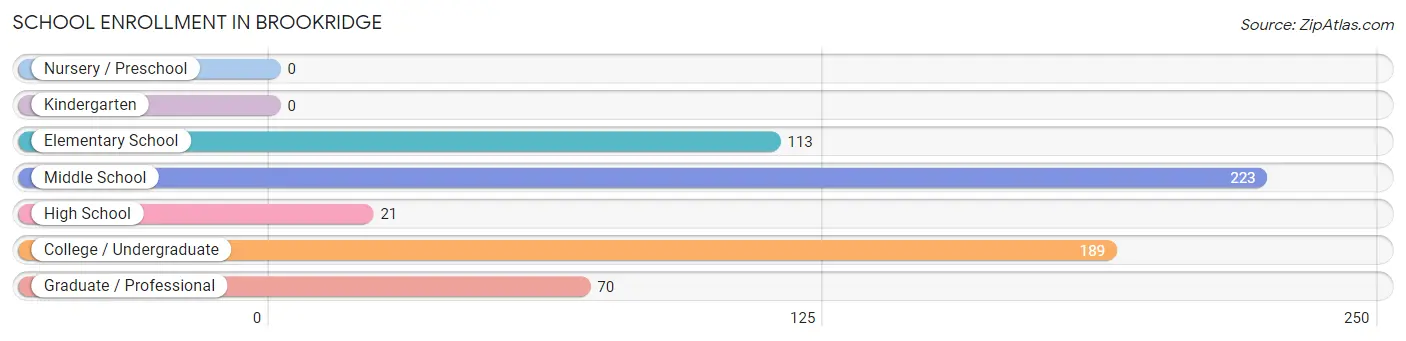
School Enrollment in Brookridge
The most common levels of schooling among the 616 students in Brookridge are middle school (223 | 36.2%), college / undergraduate (189 | 30.7%), and elementary school (113 | 18.3%).
| School Level | # Students | % Students |
| Nursery / Preschool | 0 | 0.0% |
| Kindergarten | 0 | 0.0% |
| Elementary School | 113 | 18.3% |
| Middle School | 223 | 36.2% |
| High School | 21 | 3.4% |
| College / Undergraduate | 189 | 30.7% |
| Graduate / Professional | 70 | 11.4% |
| Total | 616 | 100.0% |
School Enrollment by Age by Funding Source in Brookridge
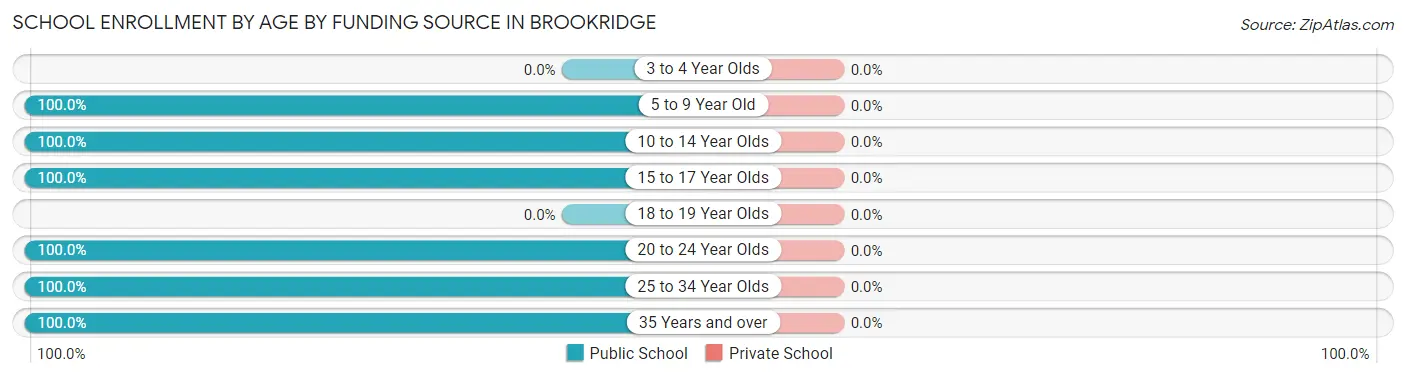
| Age Bracket | Public School | Private School |
| 3 to 4 Year Olds | 0 (0.0%) | 0 (0.0%) |
| 5 to 9 Year Old | 30 (100.0%) | 0 (0.0%) |
| 10 to 14 Year Olds | 306 (100.0%) | 0 (0.0%) |
| 15 to 17 Year Olds | 21 (100.0%) | 0 (0.0%) |
| 18 to 19 Year Olds | 0 (0.0%) | 0 (0.0%) |
| 20 to 24 Year Olds | 78 (100.0%) | 0 (0.0%) |
| 25 to 34 Year Olds | 89 (100.0%) | 0 (0.0%) |
| 35 Years and over | 92 (100.0%) | 0 (0.0%) |
| Total | 616 (100.0%) | 0 (0.0%) |
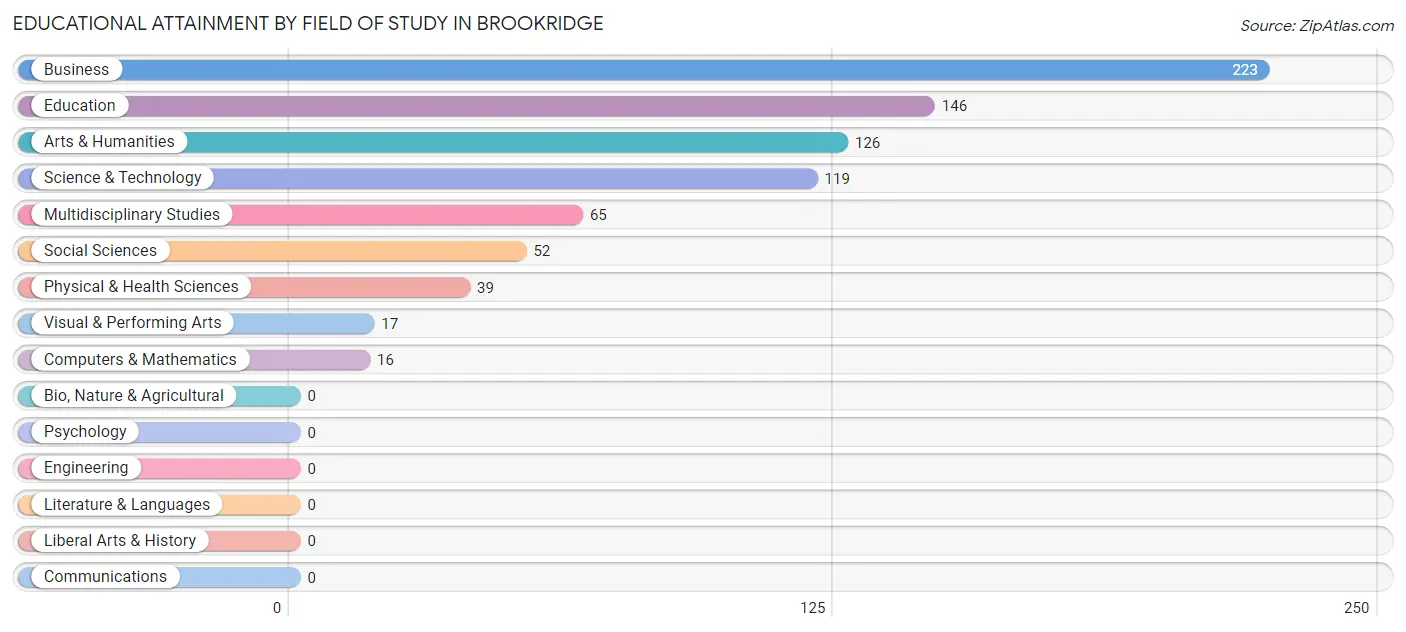
Educational Attainment by Field of Study in Brookridge
Business (223 | 27.8%), education (146 | 18.2%), arts & humanities (126 | 15.7%), science & technology (119 | 14.8%), and multidisciplinary studies (65 | 8.1%) are the most common fields of study among 803 individuals in Brookridge who have obtained a bachelor's degree or higher.
| Field of Study | # Graduates | % Graduates |
| Computers & Mathematics | 16 | 2.0% |
| Bio, Nature & Agricultural | 0 | 0.0% |
| Physical & Health Sciences | 39 | 4.9% |
| Psychology | 0 | 0.0% |
| Social Sciences | 52 | 6.5% |
| Engineering | 0 | 0.0% |
| Multidisciplinary Studies | 65 | 8.1% |
| Science & Technology | 119 | 14.8% |
| Business | 223 | 27.8% |
| Education | 146 | 18.2% |
| Literature & Languages | 0 | 0.0% |
| Liberal Arts & History | 0 | 0.0% |
| Visual & Performing Arts | 17 | 2.1% |
| Communications | 0 | 0.0% |
| Arts & Humanities | 126 | 15.7% |
| Total | 803 | 100.0% |
Transportation & Commute in Brookridge
Vehicle Availability by Sex in Brookridge
The most prevalent vehicle ownership categories in Brookridge are males with 2 vehicles (339, accounting for 68.9%) and females with 2 vehicles (197, making up 64.3%).
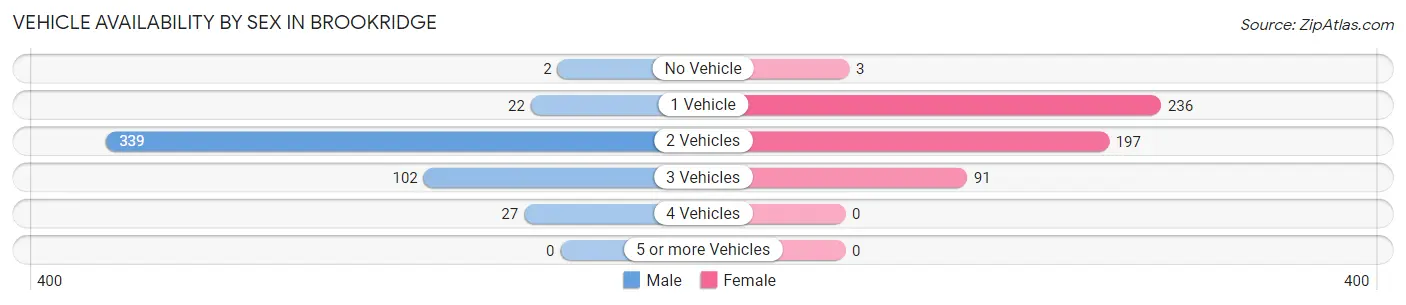
| Vehicles Available | Male | Female |
| No Vehicle | 2 (0.4%) | 3 (0.6%) |
| 1 Vehicle | 22 (4.5%) | 236 (44.8%) |
| 2 Vehicles | 339 (68.9%) | 197 (37.4%) |
| 3 Vehicles | 102 (20.7%) | 91 (17.3%) |
| 4 Vehicles | 27 (5.5%) | 0 (0.0%) |
| 5 or more Vehicles | 0 (0.0%) | 0 (0.0%) |
| Total | 492 (100.0%) | 527 (100.0%) |
Commute Time in Brookridge
The most frequently occuring commute durations in Brookridge are 15 to 19 minutes (320 commuters, 34.3%), 5 to 9 minutes (261 commuters, 28.0%), and 20 to 24 minutes (107 commuters, 11.5%).
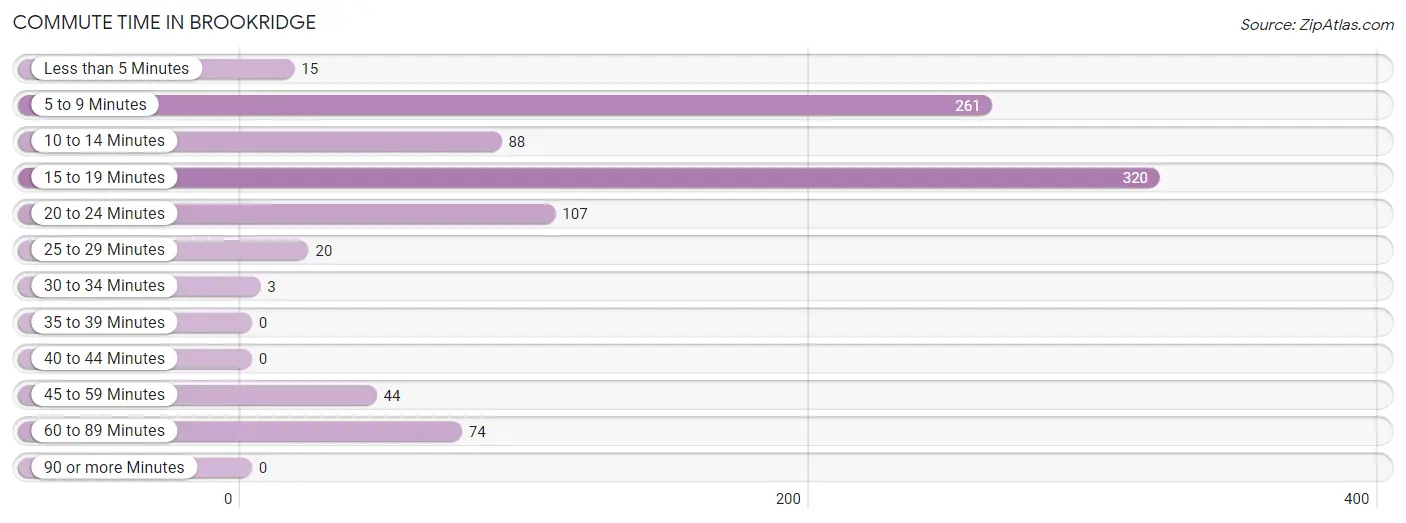
| Commute Time | # Commuters | % Commuters |
| Less than 5 Minutes | 15 | 1.6% |
| 5 to 9 Minutes | 261 | 28.0% |
| 10 to 14 Minutes | 88 | 9.4% |
| 15 to 19 Minutes | 320 | 34.3% |
| 20 to 24 Minutes | 107 | 11.5% |
| 25 to 29 Minutes | 20 | 2.1% |
| 30 to 34 Minutes | 3 | 0.3% |
| 35 to 39 Minutes | 0 | 0.0% |
| 40 to 44 Minutes | 0 | 0.0% |
| 45 to 59 Minutes | 44 | 4.7% |
| 60 to 89 Minutes | 74 | 7.9% |
| 90 or more Minutes | 0 | 0.0% |
Commute Time by Sex in Brookridge
The most common commute times in Brookridge are 15 to 19 minutes (143 commuters, 29.7%) for males and 15 to 19 minutes (177 commuters, 39.3%) for females.
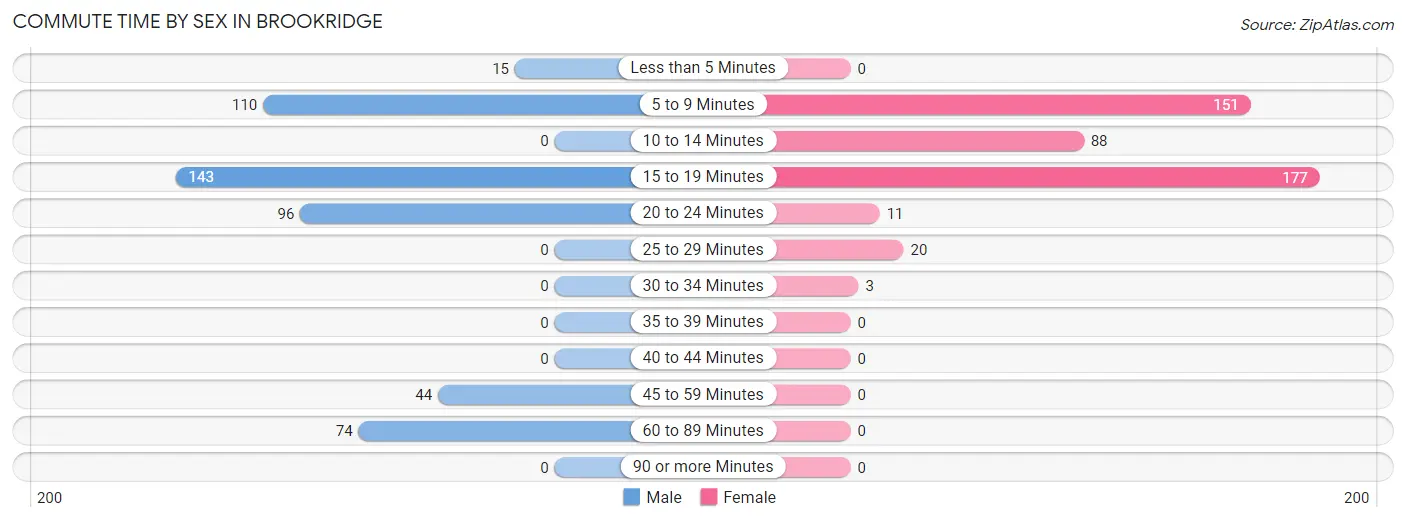
| Commute Time | Male | Female |
| Less than 5 Minutes | 15 (3.1%) | 0 (0.0%) |
| 5 to 9 Minutes | 110 (22.8%) | 151 (33.6%) |
| 10 to 14 Minutes | 0 (0.0%) | 88 (19.6%) |
| 15 to 19 Minutes | 143 (29.7%) | 177 (39.3%) |
| 20 to 24 Minutes | 96 (19.9%) | 11 (2.4%) |
| 25 to 29 Minutes | 0 (0.0%) | 20 (4.4%) |
| 30 to 34 Minutes | 0 (0.0%) | 3 (0.7%) |
| 35 to 39 Minutes | 0 (0.0%) | 0 (0.0%) |
| 40 to 44 Minutes | 0 (0.0%) | 0 (0.0%) |
| 45 to 59 Minutes | 44 (9.1%) | 0 (0.0%) |
| 60 to 89 Minutes | 74 (15.3%) | 0 (0.0%) |
| 90 or more Minutes | 0 (0.0%) | 0 (0.0%) |
Time of Departure to Work by Sex in Brookridge
The most frequent times of departure to work in Brookridge are 7:30 AM to 7:59 AM (114, 23.6%) for males and 6:00 AM to 6:29 AM (115, 25.6%) for females.
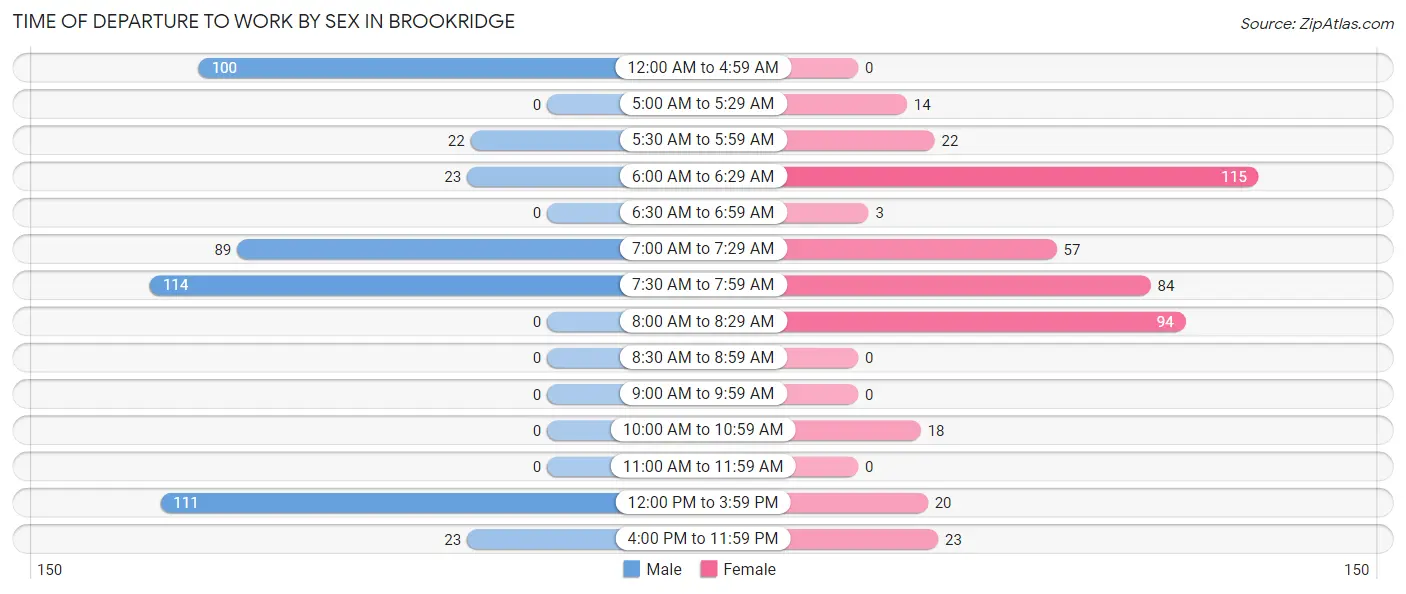
| Time of Departure | Male | Female |
| 12:00 AM to 4:59 AM | 100 (20.7%) | 0 (0.0%) |
| 5:00 AM to 5:29 AM | 0 (0.0%) | 14 (3.1%) |
| 5:30 AM to 5:59 AM | 22 (4.6%) | 22 (4.9%) |
| 6:00 AM to 6:29 AM | 23 (4.8%) | 115 (25.6%) |
| 6:30 AM to 6:59 AM | 0 (0.0%) | 3 (0.7%) |
| 7:00 AM to 7:29 AM | 89 (18.5%) | 57 (12.7%) |
| 7:30 AM to 7:59 AM | 114 (23.6%) | 84 (18.7%) |
| 8:00 AM to 8:29 AM | 0 (0.0%) | 94 (20.9%) |
| 8:30 AM to 8:59 AM | 0 (0.0%) | 0 (0.0%) |
| 9:00 AM to 9:59 AM | 0 (0.0%) | 0 (0.0%) |
| 10:00 AM to 10:59 AM | 0 (0.0%) | 18 (4.0%) |
| 11:00 AM to 11:59 AM | 0 (0.0%) | 0 (0.0%) |
| 12:00 PM to 3:59 PM | 111 (23.0%) | 20 (4.4%) |
| 4:00 PM to 11:59 PM | 23 (4.8%) | 23 (5.1%) |
| Total | 482 (100.0%) | 450 (100.0%) |
Housing Occupancy in Brookridge
Occupancy by Ownership in Brookridge
Of the total 2,375 dwellings in Brookridge, owner-occupied units account for 2,086 (87.8%), while renter-occupied units make up 289 (12.2%).
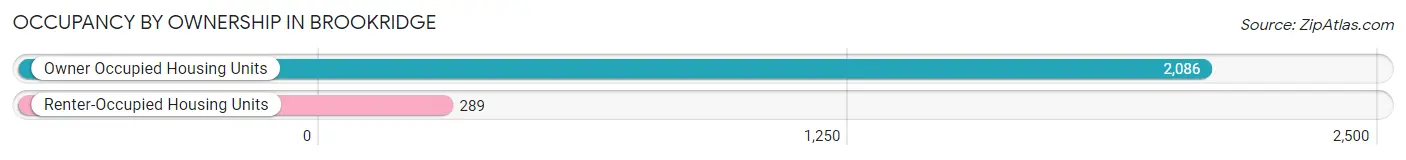
| Occupancy | # Housing Units | % Housing Units |
| Owner Occupied Housing Units | 2,086 | 87.8% |
| Renter-Occupied Housing Units | 289 | 12.2% |
| Total Occupied Housing Units | 2,375 | 100.0% |
Occupancy by Household Size in Brookridge
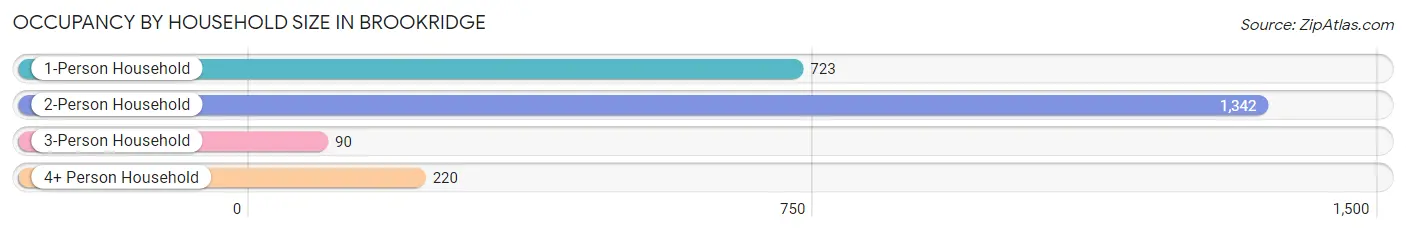
| Household Size | # Housing Units | % Housing Units |
| 1-Person Household | 723 | 30.4% |
| 2-Person Household | 1,342 | 56.5% |
| 3-Person Household | 90 | 3.8% |
| 4+ Person Household | 220 | 9.3% |
| Total Housing Units | 2,375 | 100.0% |
Occupancy by Ownership by Household Size in Brookridge
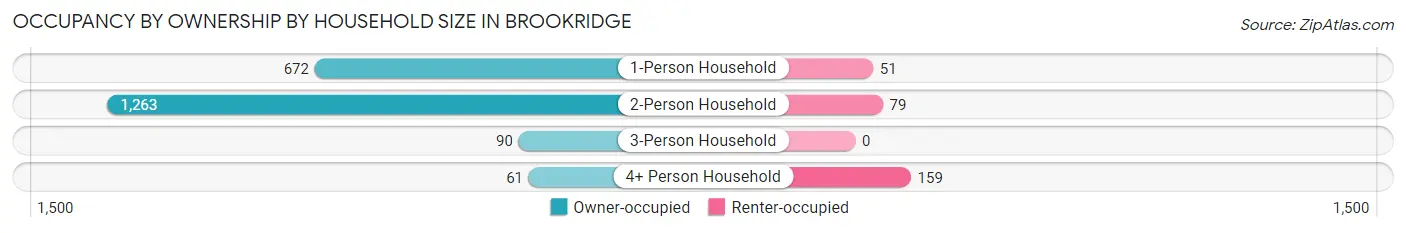
| Household Size | Owner-occupied | Renter-occupied |
| 1-Person Household | 672 (92.9%) | 51 (7.0%) |
| 2-Person Household | 1,263 (94.1%) | 79 (5.9%) |
| 3-Person Household | 90 (100.0%) | 0 (0.0%) |
| 4+ Person Household | 61 (27.7%) | 159 (72.3%) |
| Total Housing Units | 2,086 (87.8%) | 289 (12.2%) |
Occupancy by Educational Attainment in Brookridge
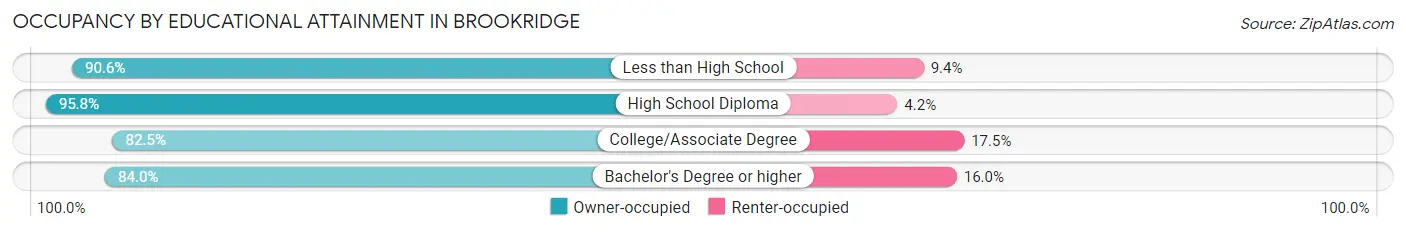
| Household Size | Owner-occupied | Renter-occupied |
| Less than High School | 173 (90.6%) | 18 (9.4%) |
| High School Diploma | 751 (95.8%) | 33 (4.2%) |
| College/Associate Degree | 794 (82.5%) | 168 (17.5%) |
| Bachelor's Degree or higher | 368 (84.0%) | 70 (16.0%) |
Occupancy by Age of Householder in Brookridge
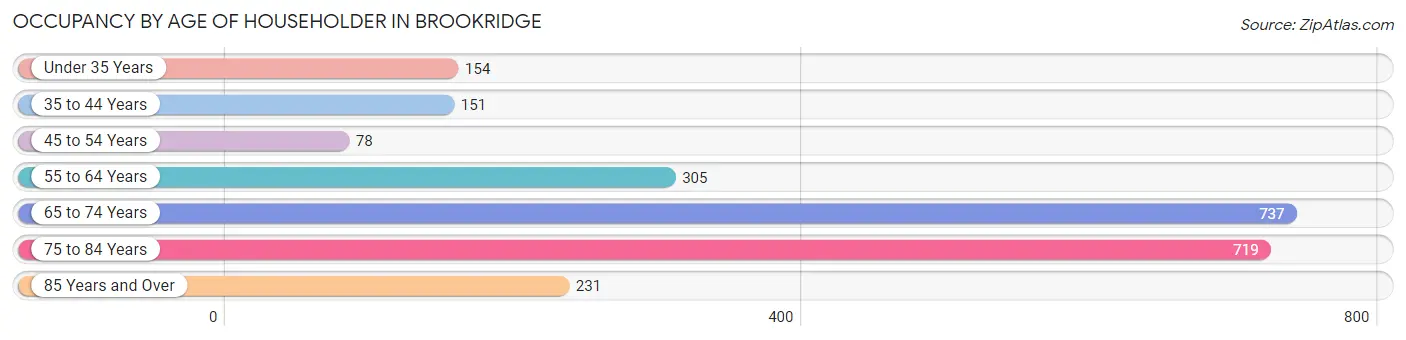
| Age Bracket | # Households | % Households |
| Under 35 Years | 154 | 6.5% |
| 35 to 44 Years | 151 | 6.4% |
| 45 to 54 Years | 78 | 3.3% |
| 55 to 64 Years | 305 | 12.8% |
| 65 to 74 Years | 737 | 31.0% |
| 75 to 84 Years | 719 | 30.3% |
| 85 Years and Over | 231 | 9.7% |
| Total | 2,375 | 100.0% |
Housing Finances in Brookridge
Median Income by Occupancy in Brookridge
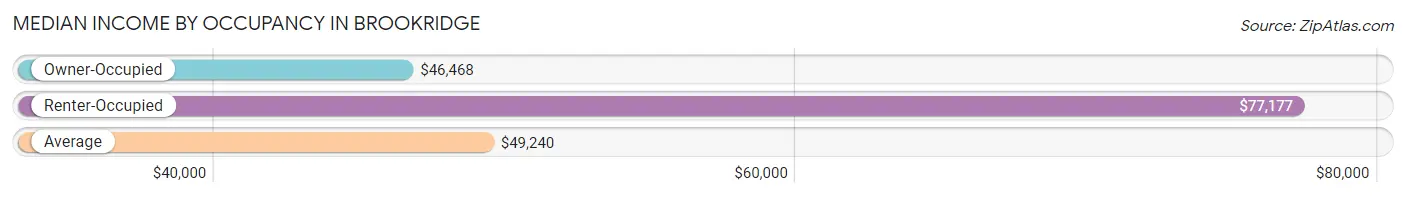
| Occupancy Type | # Households | Median Income |
| Owner-Occupied | 2,086 (87.8%) | $46,468 |
| Renter-Occupied | 289 (12.2%) | $77,177 |
| Average | 2,375 (100.0%) | $49,240 |
Occupancy by Householder Income Bracket in Brookridge
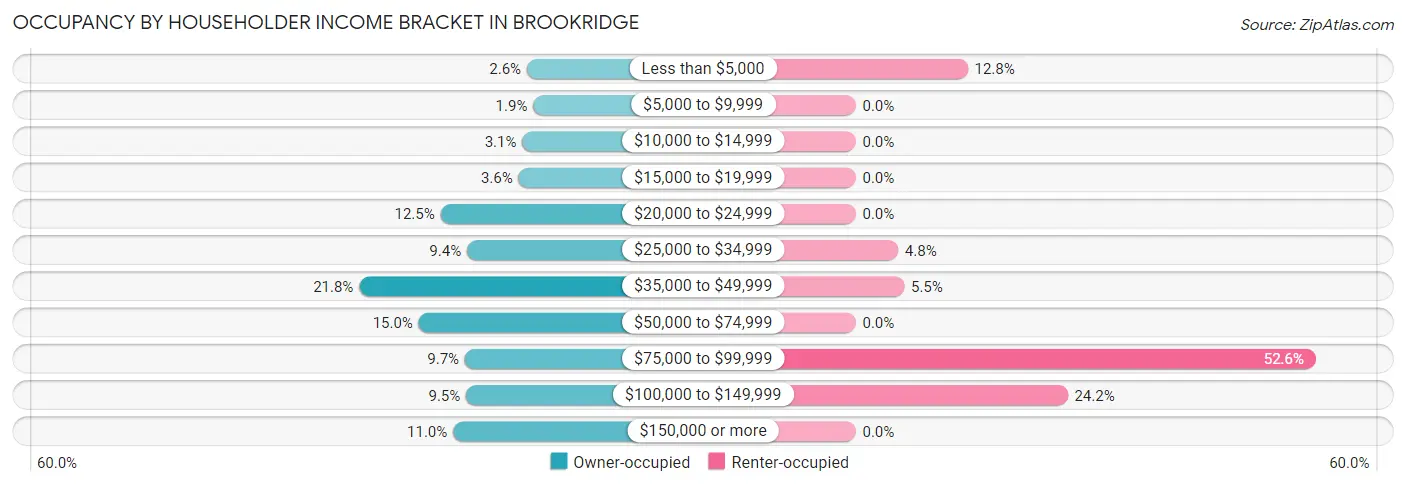
| Income Bracket | Owner-occupied | Renter-occupied |
| Less than $5,000 | 54 (2.6%) | 37 (12.8%) |
| $5,000 to $9,999 | 39 (1.9%) | 0 (0.0%) |
| $10,000 to $14,999 | 65 (3.1%) | 0 (0.0%) |
| $15,000 to $19,999 | 74 (3.5%) | 0 (0.0%) |
| $20,000 to $24,999 | 260 (12.5%) | 0 (0.0%) |
| $25,000 to $34,999 | 197 (9.4%) | 14 (4.8%) |
| $35,000 to $49,999 | 454 (21.8%) | 16 (5.5%) |
| $50,000 to $74,999 | 312 (15.0%) | 0 (0.0%) |
| $75,000 to $99,999 | 202 (9.7%) | 152 (52.6%) |
| $100,000 to $149,999 | 199 (9.5%) | 70 (24.2%) |
| $150,000 or more | 230 (11.0%) | 0 (0.0%) |
| Total | 2,086 (100.0%) | 289 (100.0%) |
Monthly Housing Cost Tiers in Brookridge
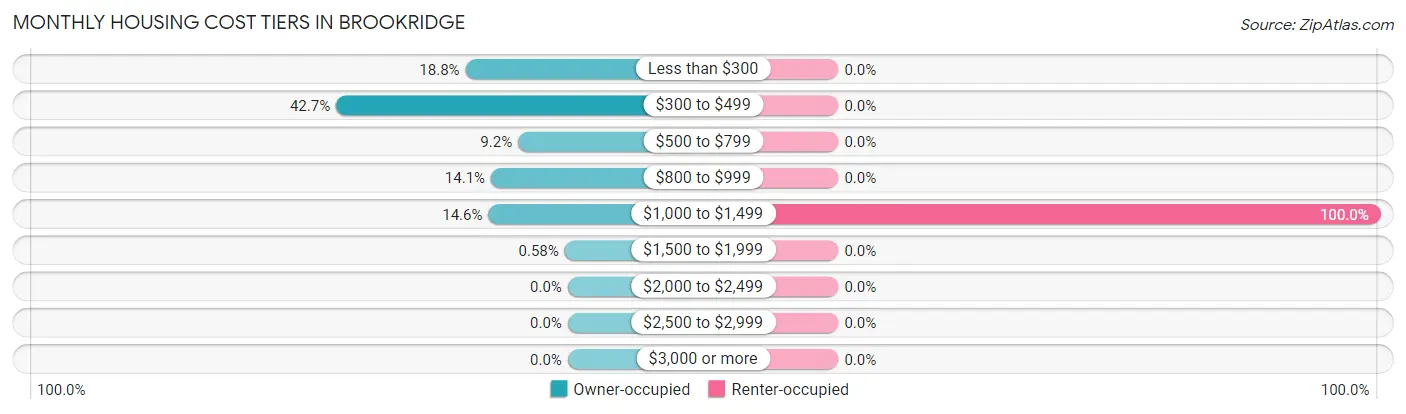
| Monthly Cost | Owner-occupied | Renter-occupied |
| Less than $300 | 393 (18.8%) | 0 (0.0%) |
| $300 to $499 | 890 (42.7%) | 0 (0.0%) |
| $500 to $799 | 191 (9.2%) | 0 (0.0%) |
| $800 to $999 | 295 (14.1%) | 0 (0.0%) |
| $1,000 to $1,499 | 305 (14.6%) | 289 (100.0%) |
| $1,500 to $1,999 | 12 (0.6%) | 0 (0.0%) |
| $2,000 to $2,499 | 0 (0.0%) | 0 (0.0%) |
| $2,500 to $2,999 | 0 (0.0%) | 0 (0.0%) |
| $3,000 or more | 0 (0.0%) | 0 (0.0%) |
| Total | 2,086 (100.0%) | 289 (100.0%) |
Physical Housing Characteristics in Brookridge
Housing Structures in Brookridge
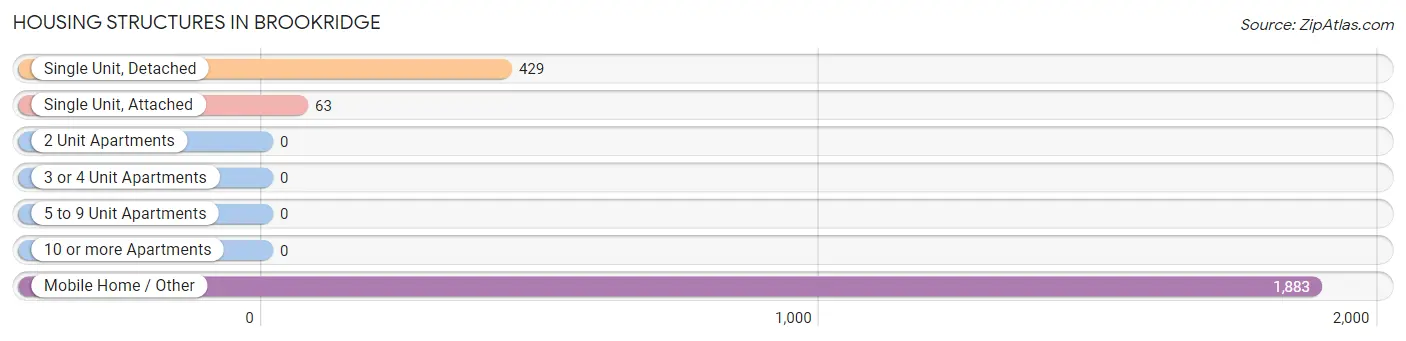
| Structure Type | # Housing Units | % Housing Units |
| Single Unit, Detached | 429 | 18.1% |
| Single Unit, Attached | 63 | 2.6% |
| 2 Unit Apartments | 0 | 0.0% |
| 3 or 4 Unit Apartments | 0 | 0.0% |
| 5 to 9 Unit Apartments | 0 | 0.0% |
| 10 or more Apartments | 0 | 0.0% |
| Mobile Home / Other | 1,883 | 79.3% |
| Total | 2,375 | 100.0% |
Housing Structures by Occupancy in Brookridge
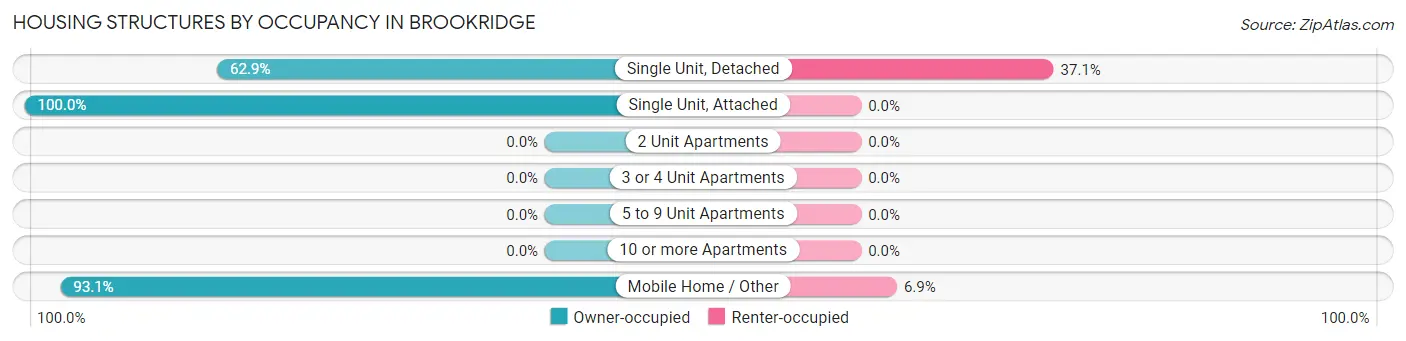
| Structure Type | Owner-occupied | Renter-occupied |
| Single Unit, Detached | 270 (62.9%) | 159 (37.1%) |
| Single Unit, Attached | 63 (100.0%) | 0 (0.0%) |
| 2 Unit Apartments | 0 (0.0%) | 0 (0.0%) |
| 3 or 4 Unit Apartments | 0 (0.0%) | 0 (0.0%) |
| 5 to 9 Unit Apartments | 0 (0.0%) | 0 (0.0%) |
| 10 or more Apartments | 0 (0.0%) | 0 (0.0%) |
| Mobile Home / Other | 1,753 (93.1%) | 130 (6.9%) |
| Total | 2,086 (87.8%) | 289 (12.2%) |
Housing Structures by Number of Rooms in Brookridge
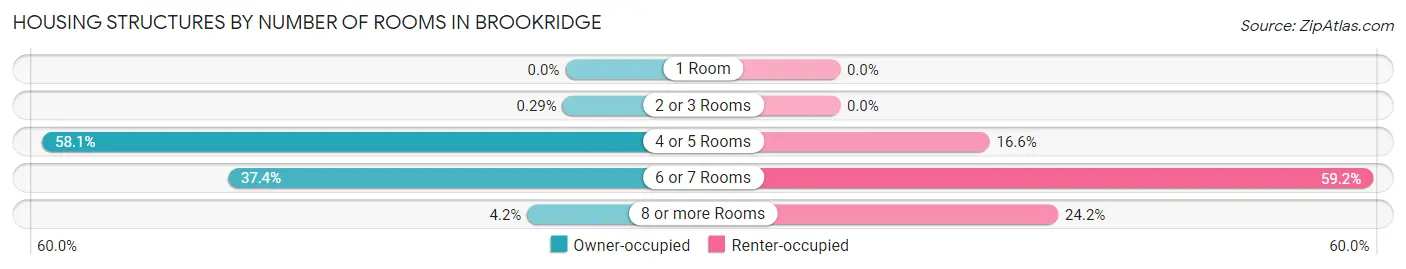
| Number of Rooms | Owner-occupied | Renter-occupied |
| 1 Room | 0 (0.0%) | 0 (0.0%) |
| 2 or 3 Rooms | 6 (0.3%) | 0 (0.0%) |
| 4 or 5 Rooms | 1,211 (58.1%) | 48 (16.6%) |
| 6 or 7 Rooms | 781 (37.4%) | 171 (59.2%) |
| 8 or more Rooms | 88 (4.2%) | 70 (24.2%) |
| Total | 2,086 (100.0%) | 289 (100.0%) |
Housing Structure by Heating Type in Brookridge
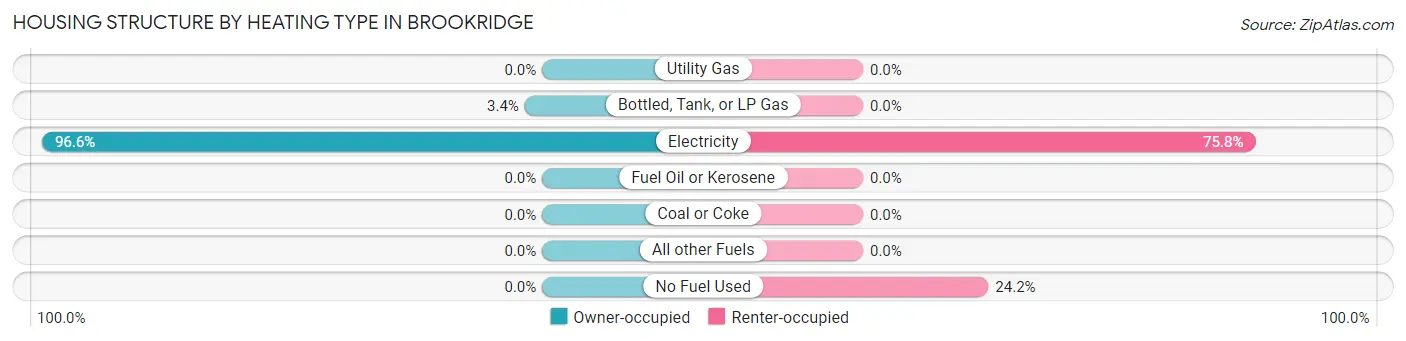
| Heating Type | Owner-occupied | Renter-occupied |
| Utility Gas | 0 (0.0%) | 0 (0.0%) |
| Bottled, Tank, or LP Gas | 70 (3.4%) | 0 (0.0%) |
| Electricity | 2,016 (96.6%) | 219 (75.8%) |
| Fuel Oil or Kerosene | 0 (0.0%) | 0 (0.0%) |
| Coal or Coke | 0 (0.0%) | 0 (0.0%) |
| All other Fuels | 0 (0.0%) | 0 (0.0%) |
| No Fuel Used | 0 (0.0%) | 70 (24.2%) |
| Total | 2,086 (100.0%) | 289 (100.0%) |
Household Vehicle Usage in Brookridge
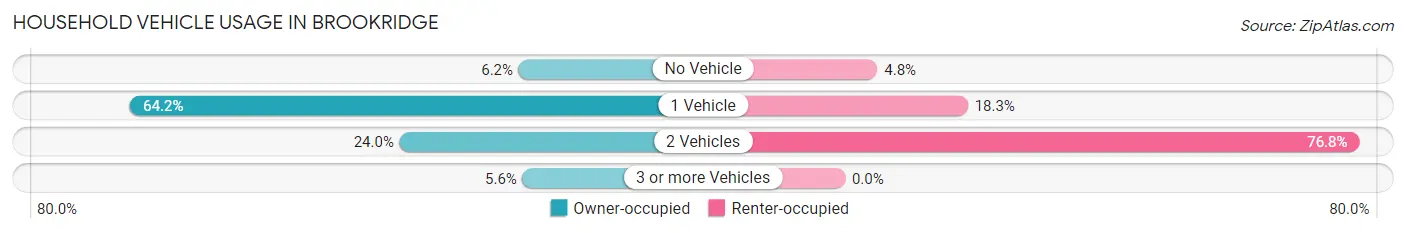
| Vehicles per Household | Owner-occupied | Renter-occupied |
| No Vehicle | 129 (6.2%) | 14 (4.8%) |
| 1 Vehicle | 1,340 (64.2%) | 53 (18.3%) |
| 2 Vehicles | 500 (24.0%) | 222 (76.8%) |
| 3 or more Vehicles | 117 (5.6%) | 0 (0.0%) |
| Total | 2,086 (100.0%) | 289 (100.0%) |
Real Estate & Mortgages in Brookridge
Real Estate and Mortgage Overview in Brookridge
| Characteristic | Without Mortgage | With Mortgage |
| Housing Units | 1,324 | 762 |
| Median Property Value | $98,800 | $134,100 |
| Median Household Income | $40,929 | $9 |
| Monthly Housing Costs | $342 | $0 |
| Real Estate Taxes | $873 | $0 |
Property Value by Mortgage Status in Brookridge
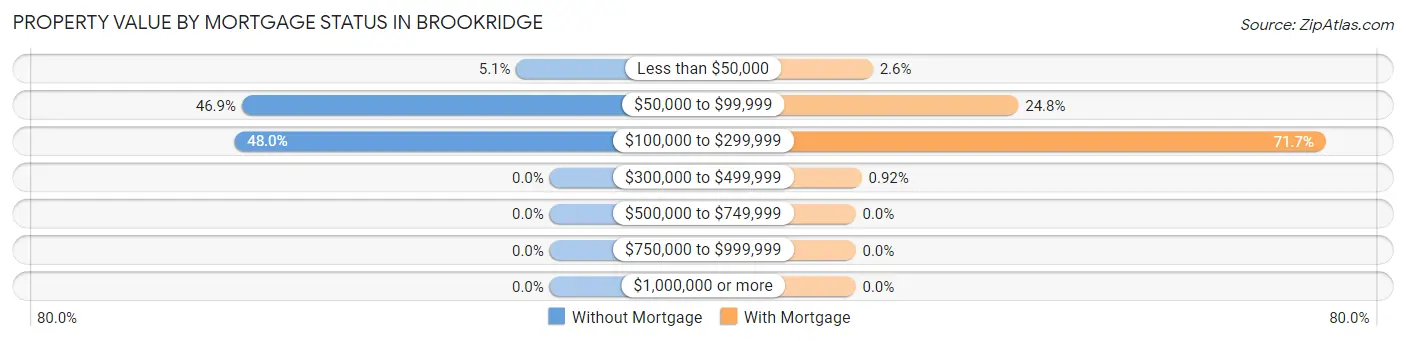
| Property Value | Without Mortgage | With Mortgage |
| Less than $50,000 | 67 (5.1%) | 20 (2.6%) |
| $50,000 to $99,999 | 621 (46.9%) | 189 (24.8%) |
| $100,000 to $299,999 | 636 (48.0%) | 546 (71.7%) |
| $300,000 to $499,999 | 0 (0.0%) | 7 (0.9%) |
| $500,000 to $749,999 | 0 (0.0%) | 0 (0.0%) |
| $750,000 to $999,999 | 0 (0.0%) | 0 (0.0%) |
| $1,000,000 or more | 0 (0.0%) | 0 (0.0%) |
| Total | 1,324 (100.0%) | 762 (100.0%) |
Household Income by Mortgage Status in Brookridge
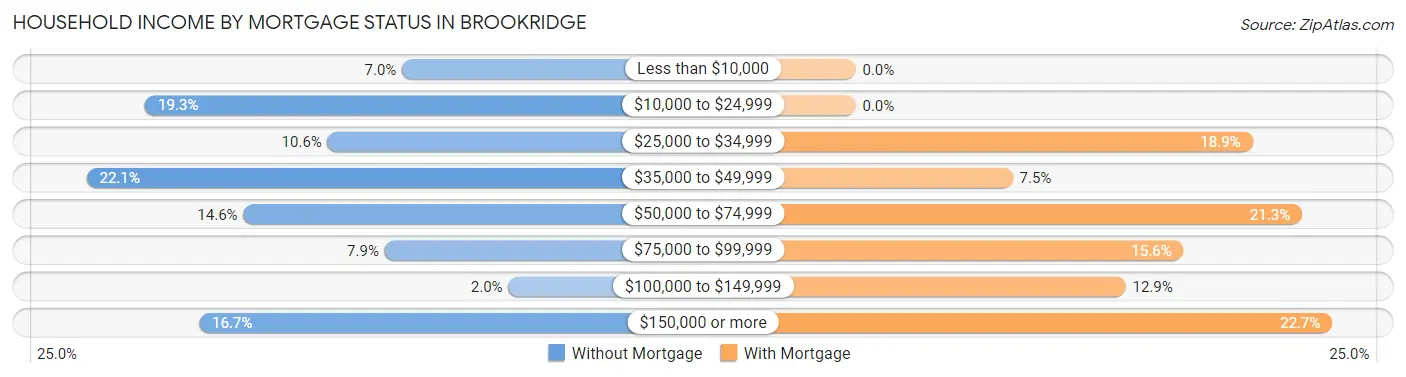
| Household Income | Without Mortgage | With Mortgage |
| Less than $10,000 | 93 (7.0%) | 0 (0.0%) |
| $10,000 to $24,999 | 255 (19.3%) | 0 (0.0%) |
| $25,000 to $34,999 | 140 (10.6%) | 144 (18.9%) |
| $35,000 to $49,999 | 292 (22.1%) | 57 (7.5%) |
| $50,000 to $74,999 | 193 (14.6%) | 162 (21.3%) |
| $75,000 to $99,999 | 104 (7.9%) | 119 (15.6%) |
| $100,000 to $149,999 | 26 (2.0%) | 98 (12.9%) |
| $150,000 or more | 221 (16.7%) | 173 (22.7%) |
| Total | 1,324 (100.0%) | 762 (100.0%) |
Property Value to Household Income Ratio in Brookridge
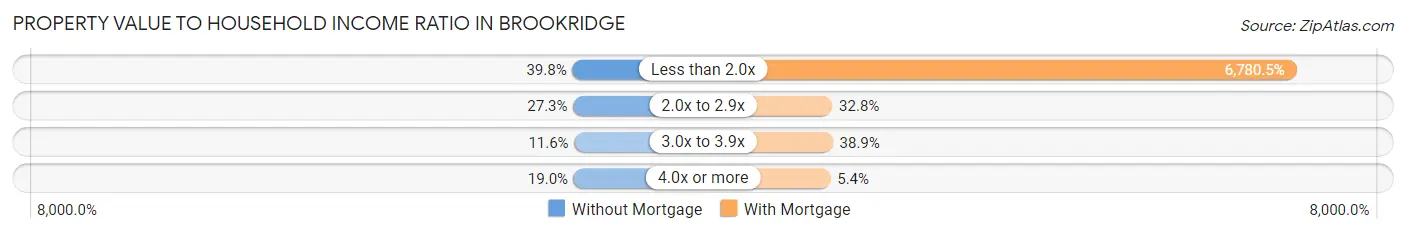
| Value-to-Income Ratio | Without Mortgage | With Mortgage |
| Less than 2.0x | 527 (39.8%) | 51,667 (6,780.5%) |
| 2.0x to 2.9x | 362 (27.3%) | 250 (32.8%) |
| 3.0x to 3.9x | 153 (11.6%) | 296 (38.9%) |
| 4.0x or more | 251 (19.0%) | 41 (5.4%) |
| Total | 1,324 (100.0%) | 762 (100.0%) |
Real Estate Taxes by Mortgage Status in Brookridge
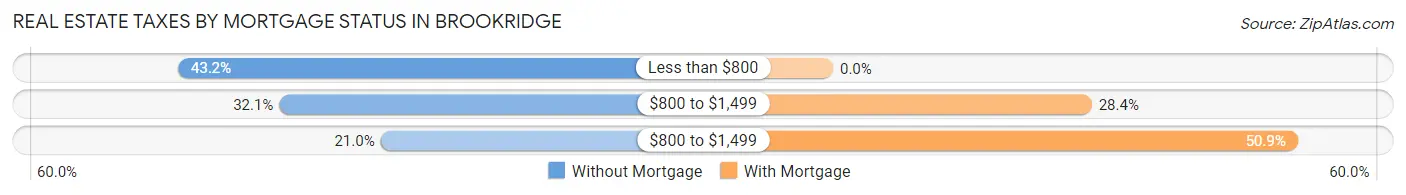
| Property Taxes | Without Mortgage | With Mortgage |
| Less than $800 | 572 (43.2%) | 0 (0.0%) |
| $800 to $1,499 | 425 (32.1%) | 216 (28.3%) |
| $800 to $1,499 | 278 (21.0%) | 388 (50.9%) |
| Total | 1,324 (100.0%) | 762 (100.0%) |
Health & Disability in Brookridge
Health Insurance Coverage by Age in Brookridge
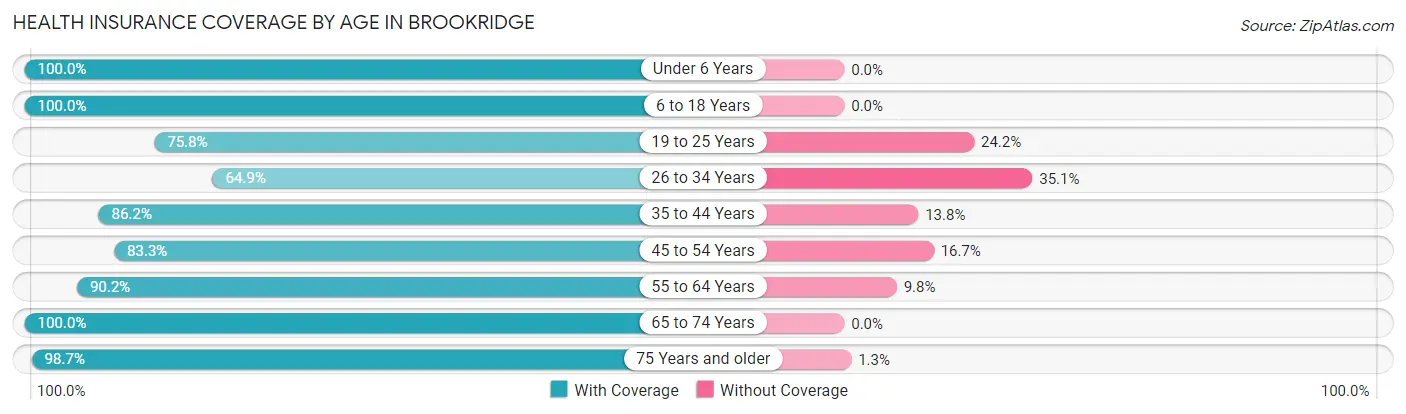
| Age Bracket | With Coverage | Without Coverage |
| Under 6 Years | 114 (100.0%) | 0 (0.0%) |
| 6 to 18 Years | 357 (100.0%) | 0 (0.0%) |
| 19 to 25 Years | 141 (75.8%) | 45 (24.2%) |
| 26 to 34 Years | 150 (64.9%) | 81 (35.1%) |
| 35 to 44 Years | 250 (86.2%) | 40 (13.8%) |
| 45 to 54 Years | 100 (83.3%) | 20 (16.7%) |
| 55 to 64 Years | 628 (90.2%) | 68 (9.8%) |
| 65 to 74 Years | 1,321 (100.0%) | 0 (0.0%) |
| 75 Years and older | 1,449 (98.7%) | 19 (1.3%) |
| Total | 4,510 (94.3%) | 273 (5.7%) |
Health Insurance Coverage by Citizenship Status in Brookridge
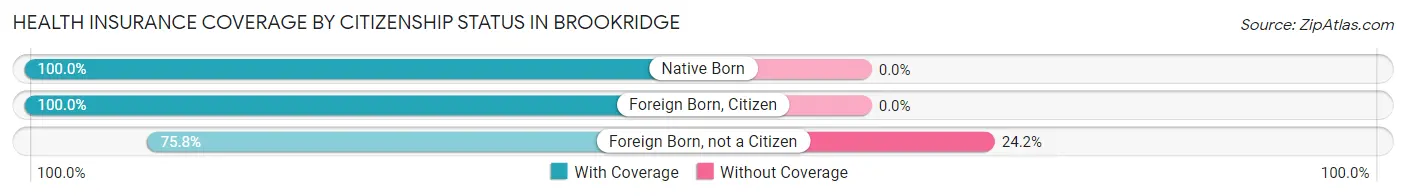
| Citizenship Status | With Coverage | Without Coverage |
| Native Born | 114 (100.0%) | 0 (0.0%) |
| Foreign Born, Citizen | 357 (100.0%) | 0 (0.0%) |
| Foreign Born, not a Citizen | 141 (75.8%) | 45 (24.2%) |
Health Insurance Coverage by Household Income in Brookridge
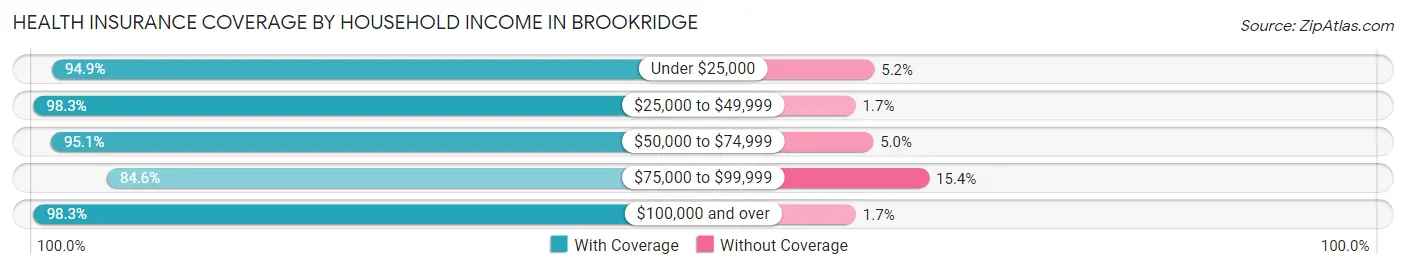
| Household Income | With Coverage | Without Coverage |
| Under $25,000 | 681 (94.9%) | 37 (5.1%) |
| $25,000 to $49,999 | 1,065 (98.3%) | 18 (1.7%) |
| $50,000 to $74,999 | 595 (95.1%) | 31 (5.0%) |
| $75,000 to $99,999 | 905 (84.6%) | 165 (15.4%) |
| $100,000 and over | 1,264 (98.3%) | 22 (1.7%) |
Public vs Private Health Insurance Coverage by Age in Brookridge
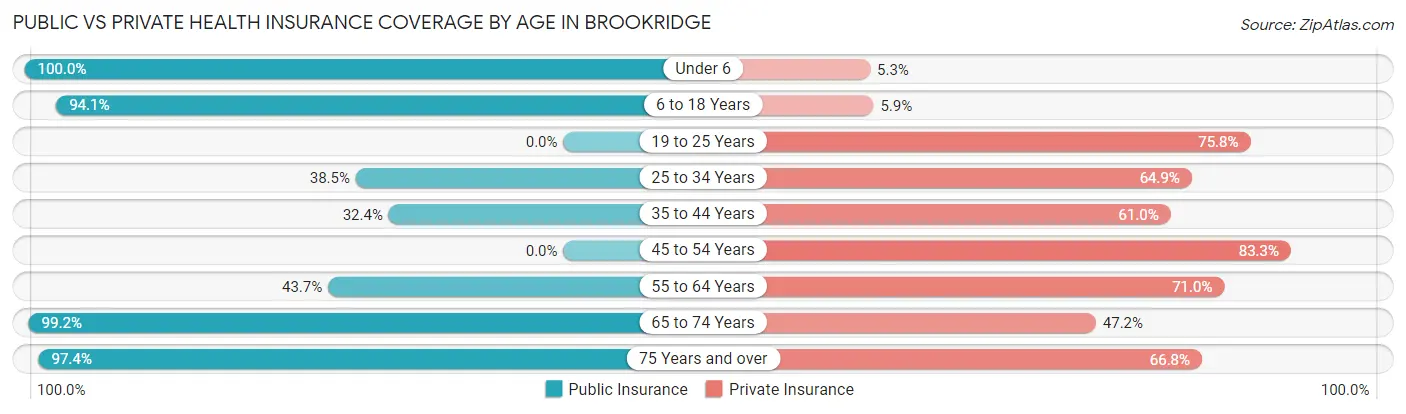
| Age Bracket | Public Insurance | Private Insurance |
| Under 6 | 114 (100.0%) | 6 (5.3%) |
| 6 to 18 Years | 336 (94.1%) | 21 (5.9%) |
| 19 to 25 Years | 0 (0.0%) | 141 (75.8%) |
| 25 to 34 Years | 89 (38.5%) | 150 (64.9%) |
| 35 to 44 Years | 94 (32.4%) | 177 (61.0%) |
| 45 to 54 Years | 0 (0.0%) | 100 (83.3%) |
| 55 to 64 Years | 304 (43.7%) | 494 (71.0%) |
| 65 to 74 Years | 1,311 (99.2%) | 623 (47.2%) |
| 75 Years and over | 1,430 (97.4%) | 981 (66.8%) |
| Total | 3,678 (76.9%) | 2,693 (56.3%) |
Disability Status by Sex by Age in Brookridge
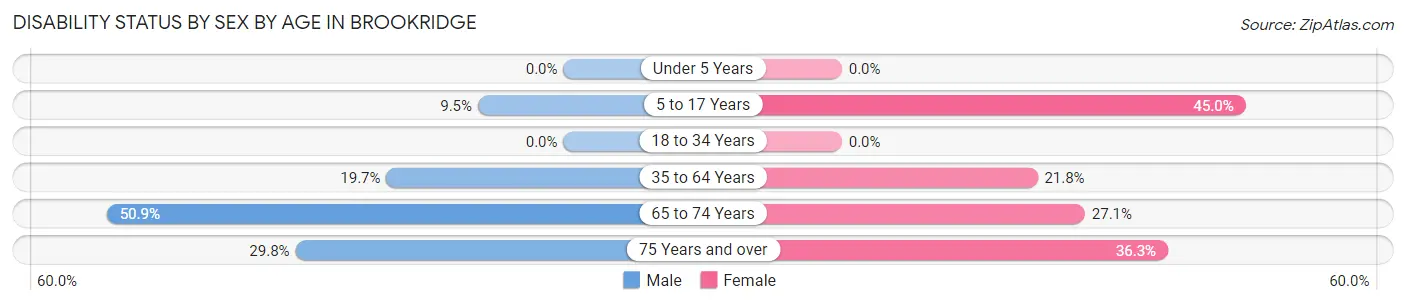
| Age Bracket | Male | Female |
| Under 5 Years | 0 (0.0%) | 0 (0.0%) |
| 5 to 17 Years | 16 (9.5%) | 85 (45.0%) |
| 18 to 34 Years | 0 (0.0%) | 0 (0.0%) |
| 35 to 64 Years | 95 (19.7%) | 136 (21.8%) |
| 65 to 74 Years | 298 (50.8%) | 199 (27.1%) |
| 75 Years and over | 245 (29.8%) | 235 (36.3%) |
Disability Class by Sex by Age in Brookridge
Disability Class: Hearing Difficulty
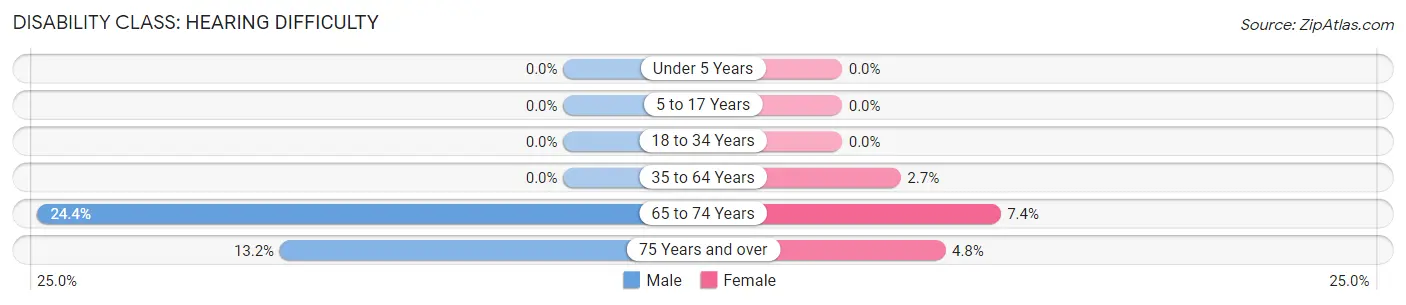
| Age Bracket | Male | Female |
| Under 5 Years | 0 (0.0%) | 0 (0.0%) |
| 5 to 17 Years | 0 (0.0%) | 0 (0.0%) |
| 18 to 34 Years | 0 (0.0%) | 0 (0.0%) |
| 35 to 64 Years | 0 (0.0%) | 17 (2.7%) |
| 65 to 74 Years | 143 (24.4%) | 54 (7.3%) |
| 75 Years and over | 108 (13.2%) | 31 (4.8%) |
Disability Class: Vision Difficulty
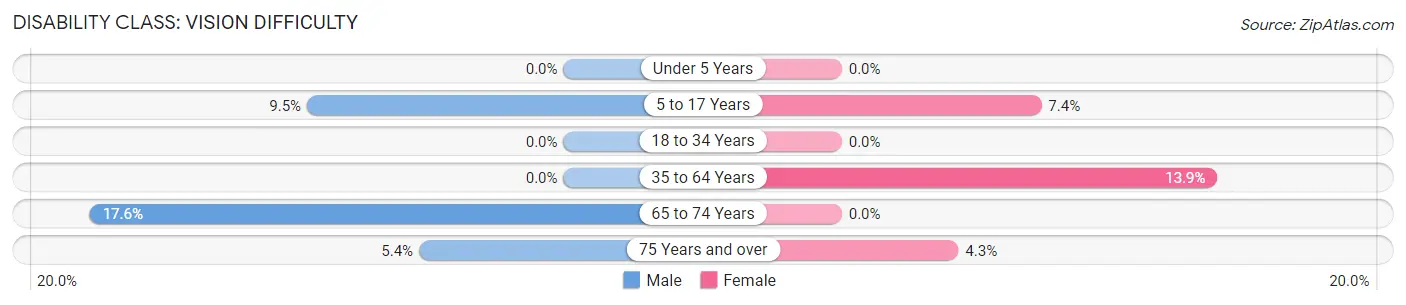
| Age Bracket | Male | Female |
| Under 5 Years | 0 (0.0%) | 0 (0.0%) |
| 5 to 17 Years | 16 (9.5%) | 14 (7.4%) |
| 18 to 34 Years | 0 (0.0%) | 0 (0.0%) |
| 35 to 64 Years | 0 (0.0%) | 87 (13.9%) |
| 65 to 74 Years | 103 (17.6%) | 0 (0.0%) |
| 75 Years and over | 44 (5.4%) | 28 (4.3%) |
Disability Class: Cognitive Difficulty
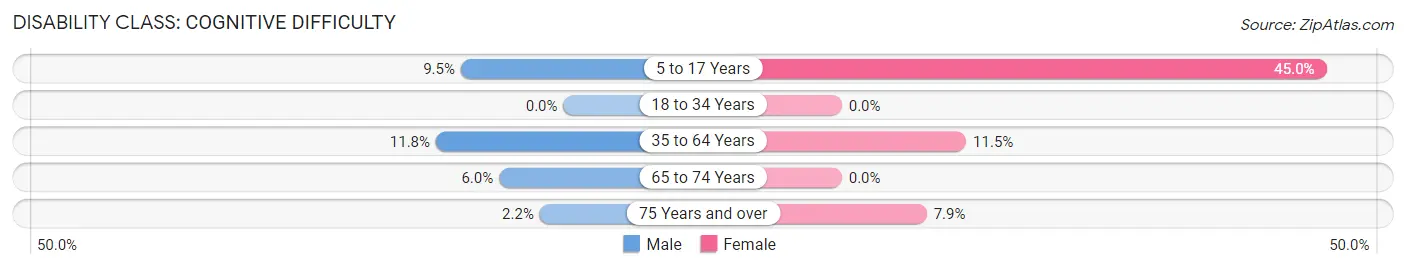
| Age Bracket | Male | Female |
| 5 to 17 Years | 16 (9.5%) | 85 (45.0%) |
| 18 to 34 Years | 0 (0.0%) | 0 (0.0%) |
| 35 to 64 Years | 57 (11.8%) | 72 (11.5%) |
| 65 to 74 Years | 35 (6.0%) | 0 (0.0%) |
| 75 Years and over | 18 (2.2%) | 51 (7.9%) |
Disability Class: Ambulatory Difficulty
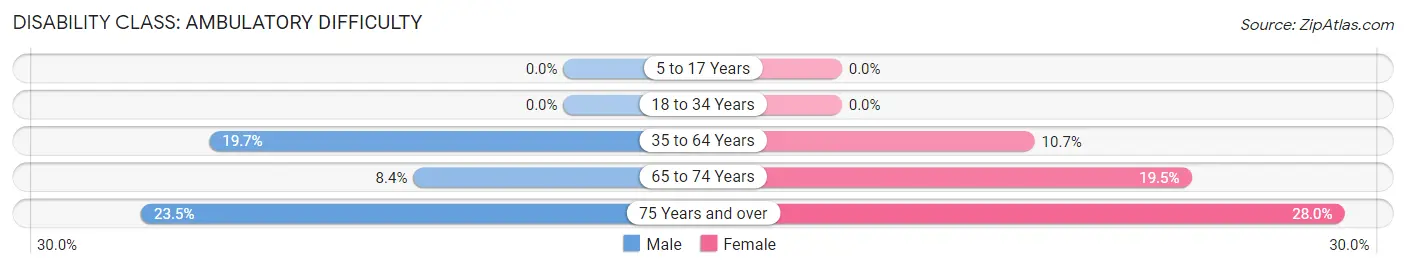
| Age Bracket | Male | Female |
| 5 to 17 Years | 0 (0.0%) | 0 (0.0%) |
| 18 to 34 Years | 0 (0.0%) | 0 (0.0%) |
| 35 to 64 Years | 95 (19.7%) | 67 (10.7%) |
| 65 to 74 Years | 49 (8.4%) | 143 (19.5%) |
| 75 Years and over | 193 (23.5%) | 181 (28.0%) |
Disability Class: Self-Care Difficulty
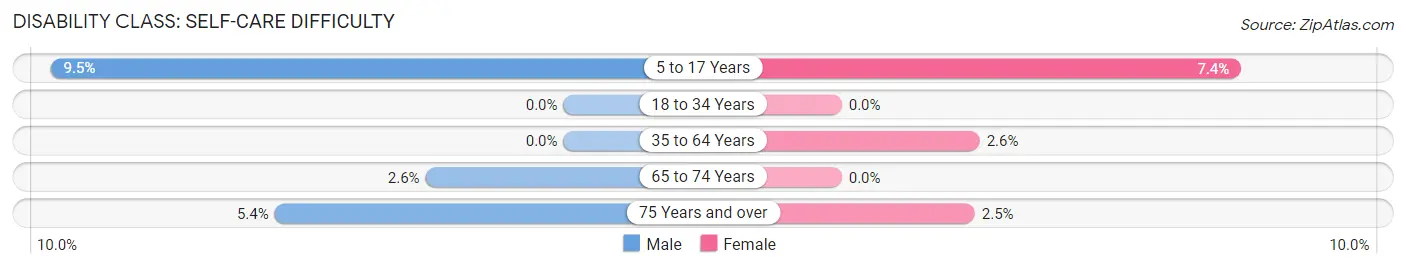
| Age Bracket | Male | Female |
| 5 to 17 Years | 16 (9.5%) | 14 (7.4%) |
| 18 to 34 Years | 0 (0.0%) | 0 (0.0%) |
| 35 to 64 Years | 0 (0.0%) | 16 (2.6%) |
| 65 to 74 Years | 15 (2.6%) | 0 (0.0%) |
| 75 Years and over | 44 (5.4%) | 16 (2.5%) |
Technology Access in Brookridge
Computing Device Access in Brookridge
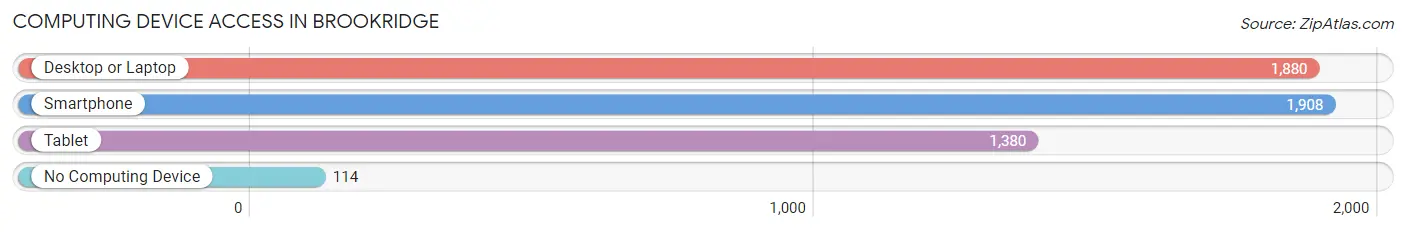
| Device Type | # Households | % Households |
| Desktop or Laptop | 1,880 | 79.2% |
| Smartphone | 1,908 | 80.3% |
| Tablet | 1,380 | 58.1% |
| No Computing Device | 114 | 4.8% |
| Total | 2,375 | 100.0% |
Internet Access in Brookridge
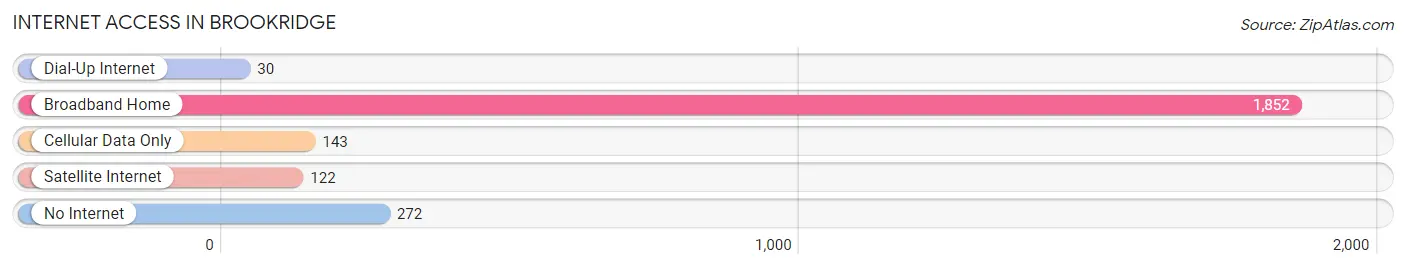
| Internet Type | # Households | % Households |
| Dial-Up Internet | 30 | 1.3% |
| Broadband Home | 1,852 | 78.0% |
| Cellular Data Only | 143 | 6.0% |
| Satellite Internet | 122 | 5.1% |
| No Internet | 272 | 11.5% |
| Total | 2,375 | 100.0% |
Brookridge Summary
Brookridge is a census-designated place (CDP) located in Hernando County, Florida, United States. The population was 2,845 at the 2010 census. It is part of the Tampa-St. Petersburg-Clearwater Metropolitan Statistical Area.
Geography
Brookridge is located at 28 30 25 North 82 30 17 West 28 506944 82 504722
According to the United States Census Bureau, the CDP has a total area of 4.2 square miles (10.8 km2), of which 4.1 square miles (10.6 km2) is land and 0.1 square miles (0.2 km2) (2.44%) is water.
History
The area that is now Brookridge was originally part of the Withlacoochee State Forest. In the late 1950s, the area was developed as a retirement community. The community was named after the nearby Brookridge Golf and Country Club, which was established in 1959.
Demographics
As of the census of 2000, there were 2,845 people, 1,521 households, and 1,039 families residing in the CDP. The population density was 690.3 people per square mile (266.7/km2). There were 1,717 housing units at an average density of 416.7/sq mi (160.6/km2). The racial makeup of the CDP was 97.90% White, 0.53% African American, 0.21% Native American, 0.53% Asian, 0.04% Pacific Islander, 0.21% from other races, and 0.59% from two or more races. Hispanic or Latino of any race were 1.90% of the population.
There were 1,521 households, out of which 8.2% had children under the age of 18 living with them, 63.2% were married couples living together, 5.7% had a female householder with no husband present, and 28.7% were non-families. 24.2% of all households were made up of individuals, and 16.2% had someone living alone who was 65 years of age or older. The average household size was 1.87 and the average family size was 2.17.
In the CDP, the population was spread out, with 6.7% under the age of 18, 2.3% from 18 to 24, 11.2% from 25 to 44, 28.2% from 45 to 64, and 51.6% who were 65 years of age or older. The median age was 68 years. For every 100 females, there were 86.2 males. For every 100 females age 18 and over, there were 84.7 males.
The median income for a household in the CDP was $37,917, and the median income for a family was $41,964. Males had a median income of $30,938 versus $25,000 for females. The per capita income for the CDP was $22,945. About 4.2% of families and 5.7% of the population were below the poverty line, including none of those under age 18 and 6.2% of those age 65 or over.
Economy
The economy of Brookridge is largely based on tourism and retirement. The area is home to several golf courses, including the Brookridge Golf and Country Club, which is the largest and most popular. The area also has several restaurants, shopping centers, and other attractions. The area is also home to several retirement communities, including the Brookridge Retirement Community, which is the largest and most popular. The area also has several medical facilities, including the Brookridge Medical Center.
Common Questions
What is the Total Population of Brookridge?
Total Population of Brookridge is 4,783.
What is the Total Male Population of Brookridge?
Total Male Population of Brookridge is 2,310.
What is the Total Female Population of Brookridge?
Total Female Population of Brookridge is 2,473.
What is the Ratio of Males per 100 Females in Brookridge?
There are 93.41 Males per 100 Females in Brookridge.
What is the Ratio of Females per 100 Males in Brookridge?
There are 107.06 Females per 100 Males in Brookridge.
What is the Median Population Age in Brookridge?
Median Population Age in Brookridge is 67.0 Years.
What is the Average Family Size in Brookridge
Average Family Size in Brookridge is 2.4 People.
What is the Average Household Size in Brookridge
Average Household Size in Brookridge is 2.0 People.
What is Per Capita Income in Brookridge?
Per Capita income in Brookridge is $32,191.
What is the Median Family Income in Brookridge?
Median Family Income in Brookridge is $60,284.
What is the Median Household income in Brookridge?
Median Household Income in Brookridge is $49,240.
What is Income or Wage Gap in Brookridge?
Income or Wage Gap in Brookridge is 20.0%.
Women in Brookridge earn 80.0 cents for every dollar earned by a man.
What is Inequality or Gini Index in Brookridge?
Inequality or Gini Index in Brookridge is 0.39.
How Large is the Labor Force in Brookridge?
There are 1,109 People in the Labor Forcein in Brookridge.
What is the Percentage of People in the Labor Force in Brookridge?
25.6% of People are in the Labor Force in Brookridge.
What is the Unemployment Rate in Brookridge?
Unemployment Rate in Brookridge is 1.4%.