St George Island, FL
St George Island Map
St George Island Overview
970
TOTAL POPULATION
507
MALE POPULATION
463
FEMALE POPULATION
109.50
MALES / 100 FEMALES
91.32
FEMALES / 100 MALES
63.9
MEDIAN AGE
2.3
AVG FAMILY SIZE
2.0
AVG HOUSEHOLD SIZE
$66,670
PER CAPITA INCOME
$121,324
AVG FAMILY INCOME
$90,000
AVG HOUSEHOLD INCOME
0.49
INEQUALITY / GINI INDEX
438
LABOR FORCE [ PEOPLE ]
46.7%
PERCENT IN LABOR FORCE
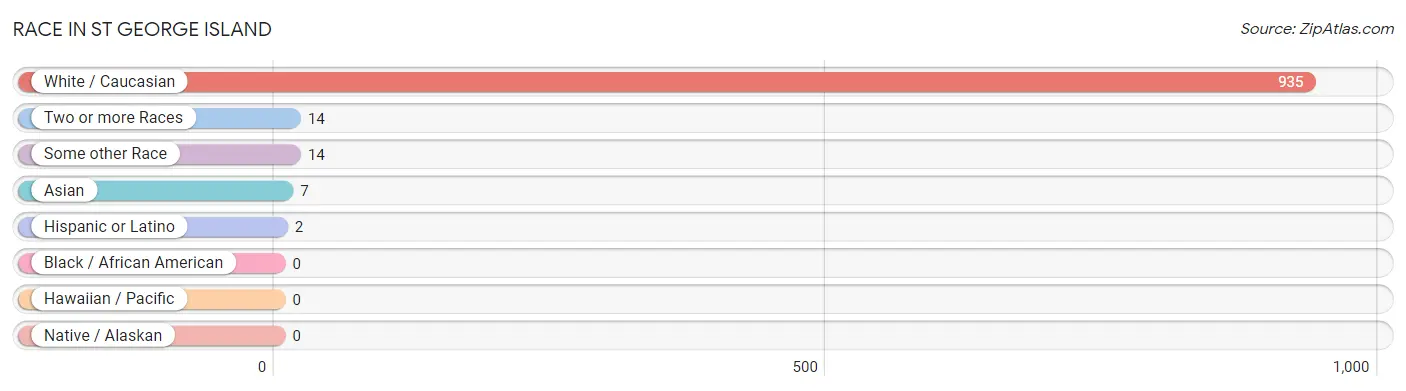
Race in St George Island
The most populous races in St George Island are White / Caucasian (935 | 96.4%), Two or more Races (14 | 1.4%), and Some other Race (14 | 1.4%).
| Race | # Population | % Population |
| Asian | 7 | 0.7% |
| Black / African American | 0 | 0.0% |
| Hawaiian / Pacific | 0 | 0.0% |
| Hispanic or Latino | 2 | 0.2% |
| Native / Alaskan | 0 | 0.0% |
| White / Caucasian | 935 | 96.4% |
| Two or more Races | 14 | 1.4% |
| Some other Race | 14 | 1.4% |
| Total | 970 | 100.0% |
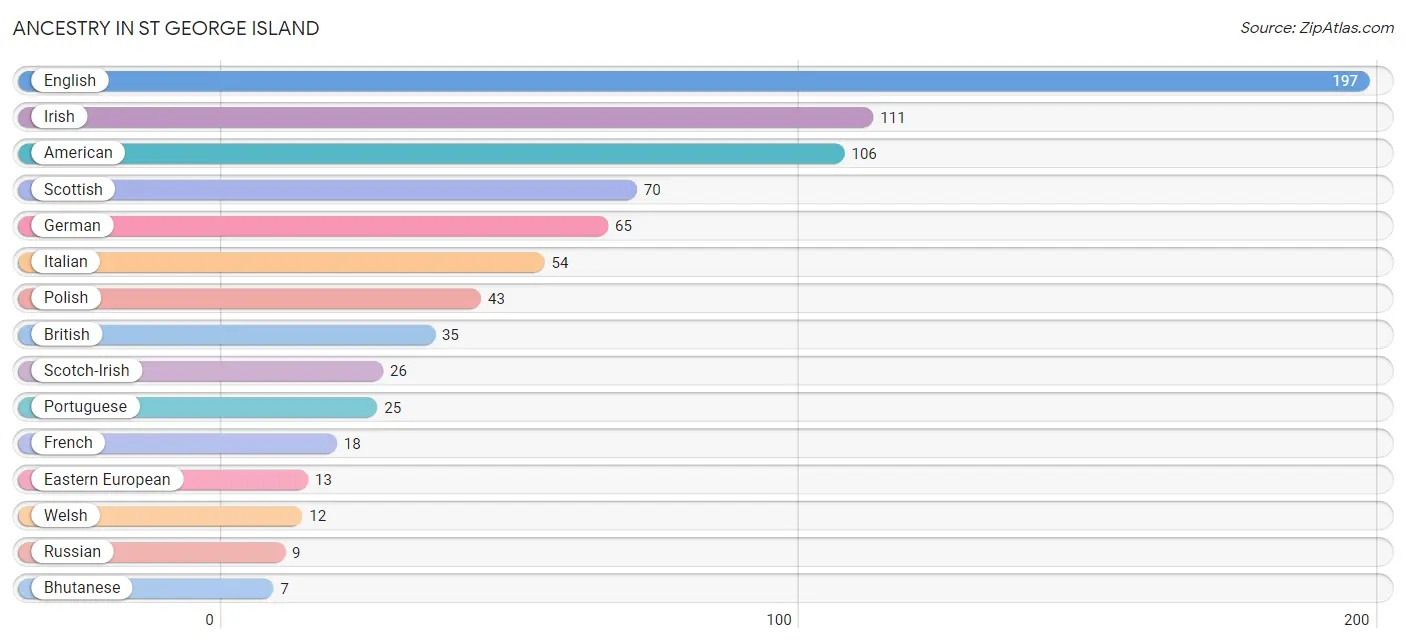
Ancestry in St George Island
The most populous ancestries reported in St George Island are English (197 | 20.3%), Irish (111 | 11.4%), American (106 | 10.9%), Scottish (70 | 7.2%), and German (65 | 6.7%), together accounting for 56.6% of all St George Island residents.
| Ancestry | # Population | % Population |
| American | 106 | 10.9% |
| Arab | 4 | 0.4% |
| Austrian | 5 | 0.5% |
| Bhutanese | 7 | 0.7% |
| British | 35 | 3.6% |
| Cuban | 2 | 0.2% |
| Dutch | 6 | 0.6% |
| Eastern European | 13 | 1.3% |
| English | 197 | 20.3% |
| French | 18 | 1.9% |
| German | 65 | 6.7% |
| Greek | 6 | 0.6% |
| Hungarian | 5 | 0.5% |
| Irish | 111 | 11.4% |
| Italian | 54 | 5.6% |
| Lebanese | 4 | 0.4% |
| Luxembourger | 3 | 0.3% |
| Northern European | 3 | 0.3% |
| Polish | 43 | 4.4% |
| Portuguese | 25 | 2.6% |
| Russian | 9 | 0.9% |
| Scotch-Irish | 26 | 2.7% |
| Scottish | 70 | 7.2% |
| Welsh | 12 | 1.2% | View All 24 Rows |
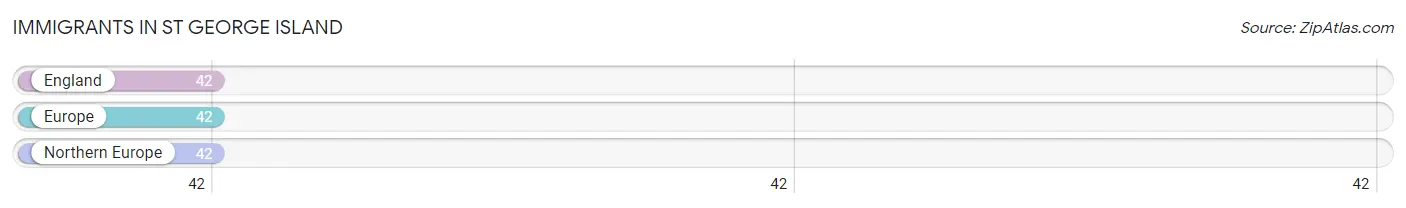
Immigrants in St George Island
The most numerous immigrant groups reported in St George Island came from England (42 | 4.3%), Europe (42 | 4.3%), and Northern Europe (42 | 4.3%), together accounting for 13.0% of all St George Island residents.
| Immigration Origin | # Population | % Population |
| England | 42 | 4.3% |
| Europe | 42 | 4.3% |
| Northern Europe | 42 | 4.3% | View All 3 Rows |
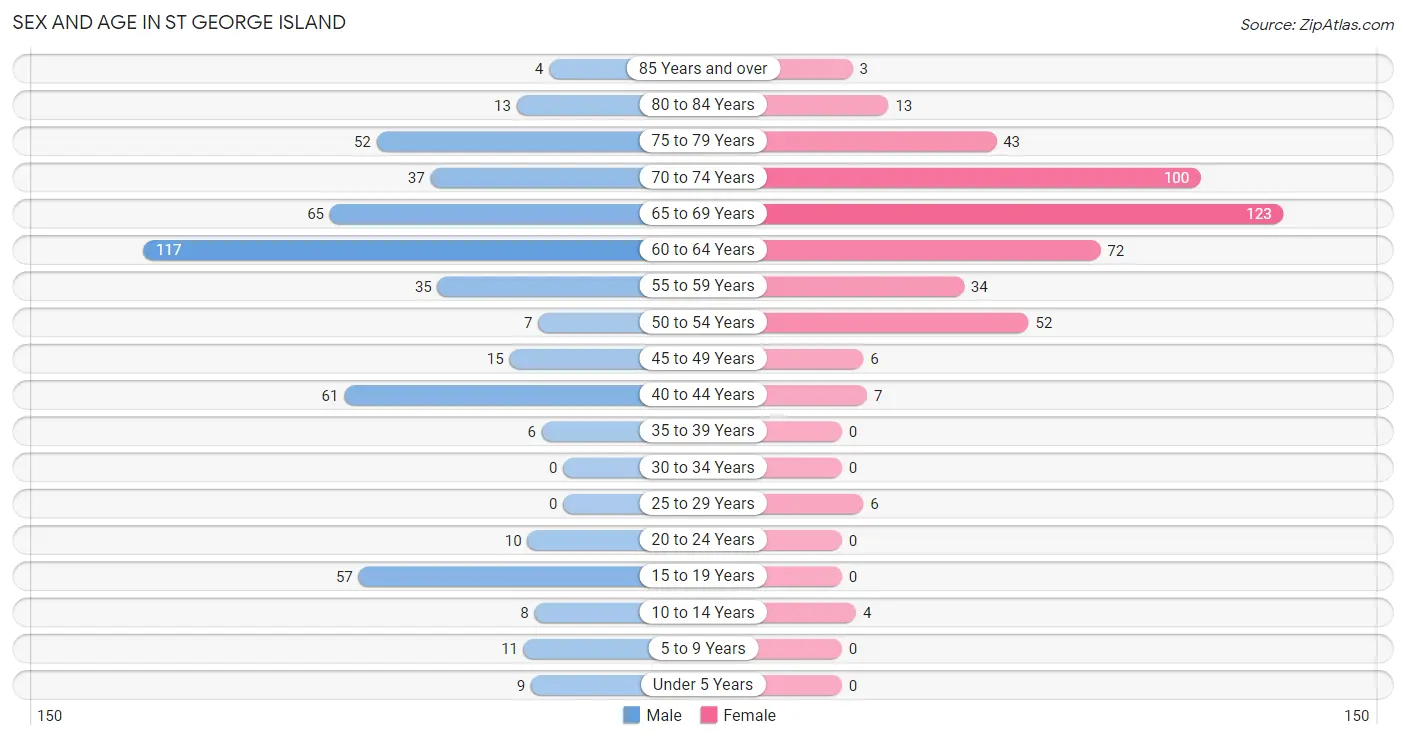
Sex and Age in St George Island
Sex and Age in St George Island
The most populous age groups in St George Island are 60 to 64 Years (117 | 23.1%) for men and 65 to 69 Years (123 | 26.6%) for women.
| Age Bracket | Male | Female |
| Under 5 Years | 9 (1.8%) | 0 (0.0%) |
| 5 to 9 Years | 11 (2.2%) | 0 (0.0%) |
| 10 to 14 Years | 8 (1.6%) | 4 (0.9%) |
| 15 to 19 Years | 57 (11.2%) | 0 (0.0%) |
| 20 to 24 Years | 10 (2.0%) | 0 (0.0%) |
| 25 to 29 Years | 0 (0.0%) | 6 (1.3%) |
| 30 to 34 Years | 0 (0.0%) | 0 (0.0%) |
| 35 to 39 Years | 6 (1.2%) | 0 (0.0%) |
| 40 to 44 Years | 61 (12.0%) | 7 (1.5%) |
| 45 to 49 Years | 15 (3.0%) | 6 (1.3%) |
| 50 to 54 Years | 7 (1.4%) | 52 (11.2%) |
| 55 to 59 Years | 35 (6.9%) | 34 (7.3%) |
| 60 to 64 Years | 117 (23.1%) | 72 (15.5%) |
| 65 to 69 Years | 65 (12.8%) | 123 (26.6%) |
| 70 to 74 Years | 37 (7.3%) | 100 (21.6%) |
| 75 to 79 Years | 52 (10.3%) | 43 (9.3%) |
| 80 to 84 Years | 13 (2.6%) | 13 (2.8%) |
| 85 Years and over | 4 (0.8%) | 3 (0.6%) |
| Total | 507 (100.0%) | 463 (100.0%) |
Families and Households in St George Island
Median Family Size in St George Island
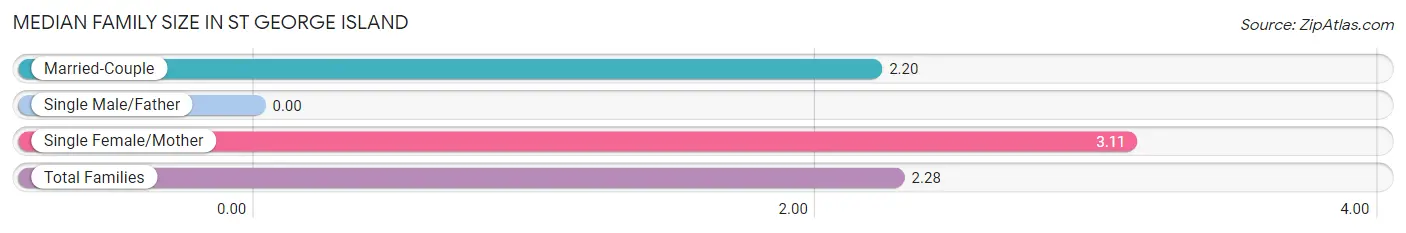
| Family Type | # Families | Family Size |
| Married-Couple | 291 (91.5%) | 2.20 |
| Single Male/Father | 0 (0.0%) | - |
| Single Female/Mother | 27 (8.5%) | 3.11 |
| Total Families | 318 (100.0%) | 2.28 |
Median Household Size in St George Island
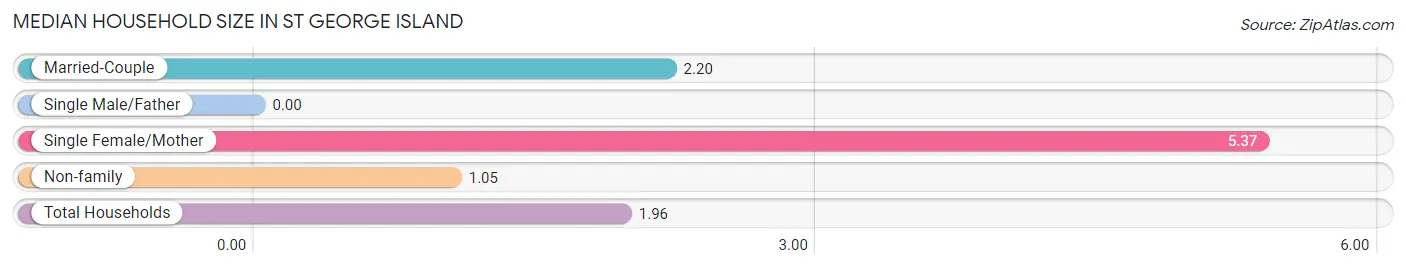
| Household Type | # Households | Household Size |
| Married-Couple | 291 (58.9%) | 2.20 |
| Single Male/Father | 0 (0.0%) | - |
| Single Female/Mother | 27 (5.5%) | 5.37 |
| Non-family | 176 (35.6%) | 1.05 |
| Total Households | 494 (100.0%) | 1.96 |
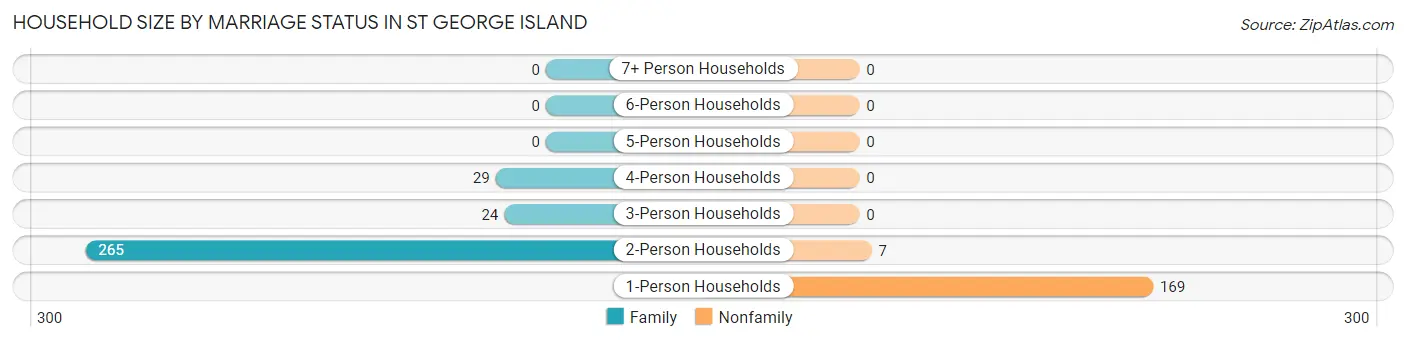
Household Size by Marriage Status in St George Island
Out of a total of 494 households in St George Island, 318 (64.4%) are family households, while 176 (35.6%) are nonfamily households. The most numerous type of family households are 2-person households, comprising 265, and the most common type of nonfamily households are 1-person households, comprising 169.
| Household Size | Family Households | Nonfamily Households |
| 1-Person Households | - | 169 (34.2%) |
| 2-Person Households | 265 (53.6%) | 7 (1.4%) |
| 3-Person Households | 24 (4.9%) | 0 (0.0%) |
| 4-Person Households | 29 (5.9%) | 0 (0.0%) |
| 5-Person Households | 0 (0.0%) | 0 (0.0%) |
| 6-Person Households | 0 (0.0%) | 0 (0.0%) |
| 7+ Person Households | 0 (0.0%) | 0 (0.0%) |
| Total | 318 (64.4%) | 176 (35.6%) |
Female Fertility in St George Island
Fertility by Age in St George Island
| Age Bracket | Women with Births | Births / 1,000 Women |
| 15 to 19 years | 0 (0.0%) | 0.0 |
| 20 to 34 years | 0 (0.0%) | 0.0 |
| 35 to 50 years | 0 (0.0%) | 0.0 |
| Total | 0 (0.0%) | 0.0 |
Fertility by Age by Marriage Status in St George Island
| Age Bracket | Married | Unmarried |
| 15 to 19 years | 0 (0.0%) | 0 (0.0%) |
| 20 to 34 years | 0 (0.0%) | 0 (0.0%) |
| 35 to 50 years | 0 (0.0%) | 0 (0.0%) |
| Total | 0 (0.0%) | 0 (0.0%) |
Fertility by Education in St George Island
| Educational Attainment | Women with Births | Births / 1,000 Women |
| Less than High School | 0 (0.0%) | 0.0 |
| High School Diploma | 0 (0.0%) | 0.0 |
| College or Associate's Degree | 0 (0.0%) | 0.0 |
| Bachelor's Degree | 0 (0.0%) | 0.0 |
| Graduate Degree | 0 (0.0%) | 0.0 |
| Total | 0 (0.0%) | 0.0 |
Fertility by Education by Marriage Status in St George Island
| Educational Attainment | Married | Unmarried |
| Less than High School | 0 (0.0%) | 0 (0.0%) |
| High School Diploma | 0 (0.0%) | 0 (0.0%) |
| College or Associate's Degree | 0 (0.0%) | 0 (0.0%) |
| Bachelor's Degree | 0 (0.0%) | 0 (0.0%) |
| Graduate Degree | 0 (0.0%) | 0 (0.0%) |
| Total | 0 (0.0%) | 0 (0.0%) |
Income in St George Island
Income Overview in St George Island
Per Capita Income in St George Island is $66,670, while median incomes of families and households are $121,324 and $90,000 respectively.
| Characteristic | Number | Measure |
| Per Capita Income | 970 | $66,670 |
| Median Family Income | 318 | $121,324 |
| Mean Family Income | 318 | $163,348 |
| Median Household Income | 494 | $90,000 |
| Mean Household Income | 494 | $123,627 |
| Income Deficit | 318 | $0 |
| Wage / Income Gap (%) | 970 | 0.00% |
| Wage / Income Gap ($) | 970 | 100.00¢ per $1 |
| Gini / Inequality Index | 970 | 0.49 |
Earnings by Sex in St George Island
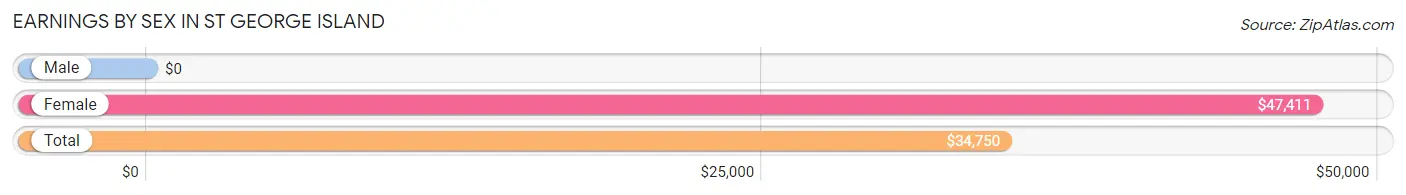
| Sex | Number | Average Earnings |
| Male | 344 (68.7%) | $0 |
| Female | 157 (31.3%) | $47,411 |
| Total | 501 (100.0%) | $34,750 |
Earnings by Sex by Income Bracket in St George Island
The most common earnings brackets in St George Island are $100,000+ for men (100 | 29.1%) and $100,000+ for women (43 | 27.4%).
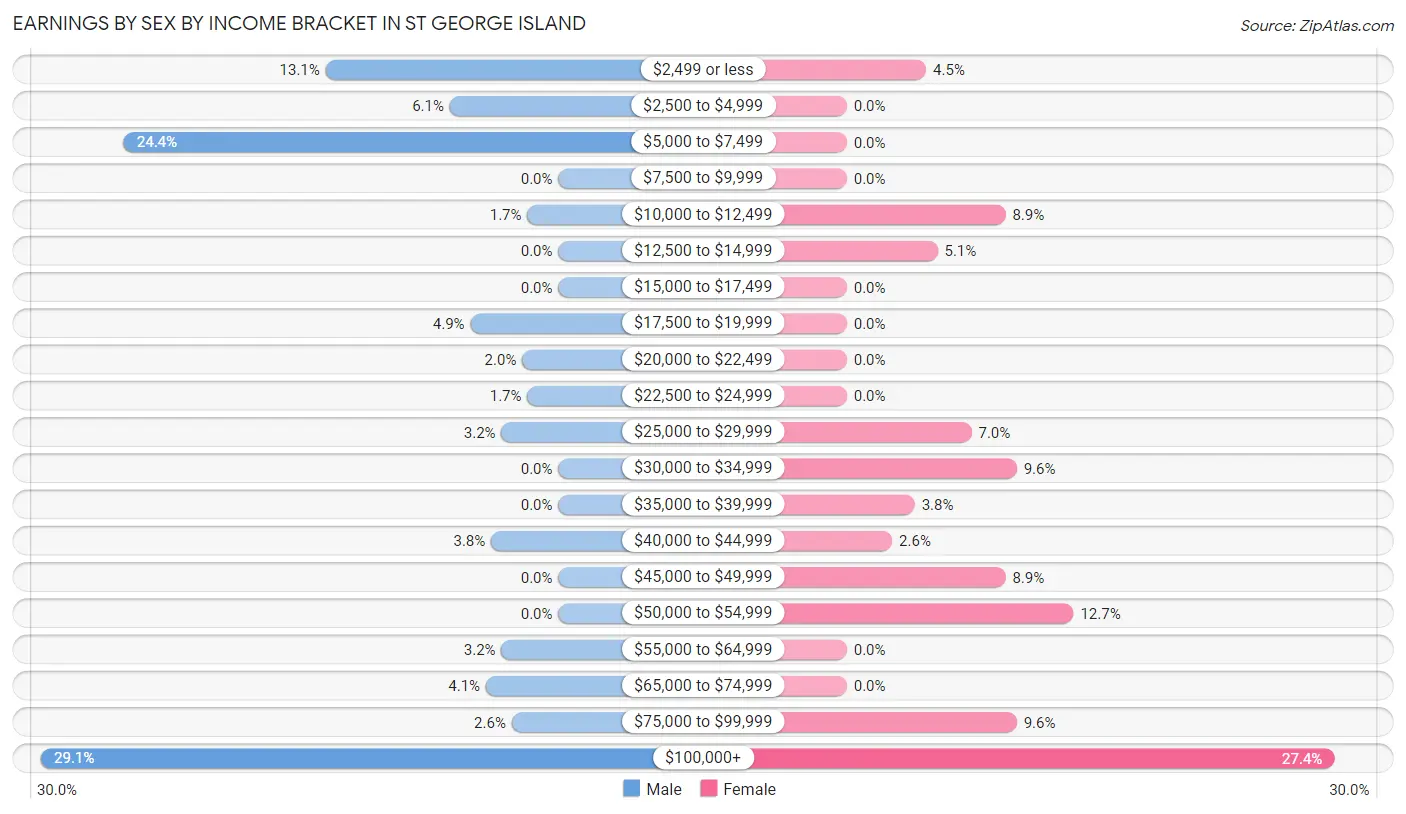
| Income | Male | Female |
| $2,499 or less | 45 (13.1%) | 7 (4.5%) |
| $2,500 to $4,999 | 21 (6.1%) | 0 (0.0%) |
| $5,000 to $7,499 | 84 (24.4%) | 0 (0.0%) |
| $7,500 to $9,999 | 0 (0.0%) | 0 (0.0%) |
| $10,000 to $12,499 | 6 (1.7%) | 14 (8.9%) |
| $12,500 to $14,999 | 0 (0.0%) | 8 (5.1%) |
| $15,000 to $17,499 | 0 (0.0%) | 0 (0.0%) |
| $17,500 to $19,999 | 17 (4.9%) | 0 (0.0%) |
| $20,000 to $22,499 | 7 (2.0%) | 0 (0.0%) |
| $22,500 to $24,999 | 6 (1.7%) | 0 (0.0%) |
| $25,000 to $29,999 | 11 (3.2%) | 11 (7.0%) |
| $30,000 to $34,999 | 0 (0.0%) | 15 (9.6%) |
| $35,000 to $39,999 | 0 (0.0%) | 6 (3.8%) |
| $40,000 to $44,999 | 13 (3.8%) | 4 (2.5%) |
| $45,000 to $49,999 | 0 (0.0%) | 14 (8.9%) |
| $50,000 to $54,999 | 0 (0.0%) | 20 (12.7%) |
| $55,000 to $64,999 | 11 (3.2%) | 0 (0.0%) |
| $65,000 to $74,999 | 14 (4.1%) | 0 (0.0%) |
| $75,000 to $99,999 | 9 (2.6%) | 15 (9.6%) |
| $100,000+ | 100 (29.1%) | 43 (27.4%) |
| Total | 344 (100.0%) | 157 (100.0%) |
Earnings by Sex by Educational Attainment in St George Island
| Educational Attainment | Male Income | Female Income |
| Less than High School | - | - |
| High School Diploma | - | - |
| College or Associate's Degree | - | - |
| Bachelor's Degree | - | - |
| Graduate Degree | - | - |
| Total | - | - |
Family Income in St George Island
Family Income Brackets in St George Island
According to the St George Island family income data, there are 86 families falling into the $100,000 to $149,999 income range, which is the most common income bracket and makes up 27.0% of all families.
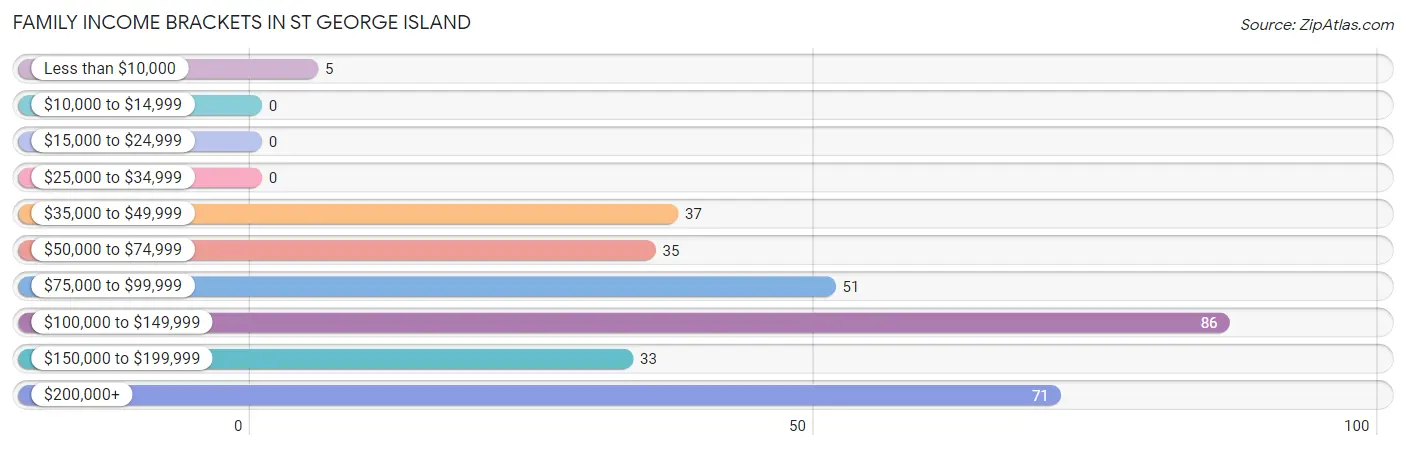
| Income Bracket | # Families | % Families |
| Less than $10,000 | 5 | 1.6% |
| $10,000 to $14,999 | 0 | 0.0% |
| $15,000 to $24,999 | 0 | 0.0% |
| $25,000 to $34,999 | 0 | 0.0% |
| $35,000 to $49,999 | 37 | 11.6% |
| $50,000 to $74,999 | 35 | 11.0% |
| $75,000 to $99,999 | 51 | 16.0% |
| $100,000 to $149,999 | 86 | 27.0% |
| $150,000 to $199,999 | 33 | 10.4% |
| $200,000+ | 71 | 22.3% |
Family Income by Famaliy Size in St George Island
2-person families (265 | 83.3%) account for the highest median family income in St George Island with $125,179 per family, while 2-person families (265 | 83.3%) have the highest median income of $62,590 per family member.
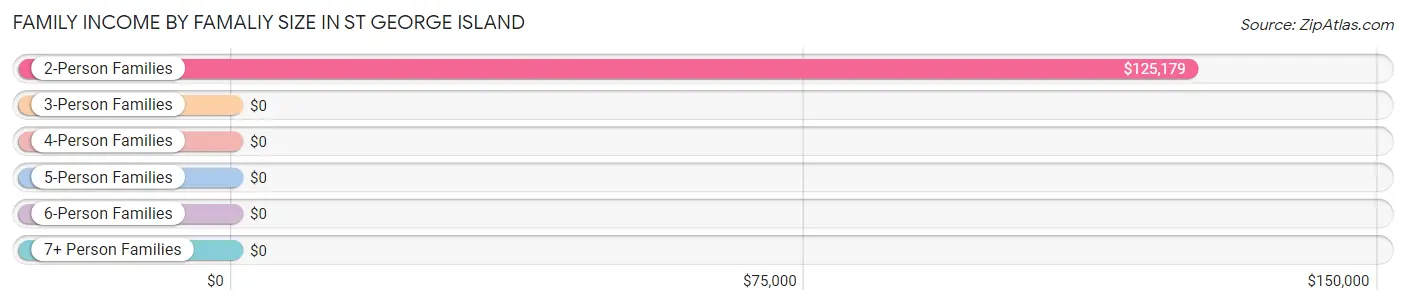
| Income Bracket | # Families | Median Income |
| 2-Person Families | 265 (83.3%) | $125,179 |
| 3-Person Families | 51 (16.0%) | $0 |
| 4-Person Families | 2 (0.6%) | $0 |
| 5-Person Families | 0 (0.0%) | $0 |
| 6-Person Families | 0 (0.0%) | $0 |
| 7+ Person Families | 0 (0.0%) | $0 |
| Total | 318 (100.0%) | $121,324 |
Family Income by Number of Earners in St George Island
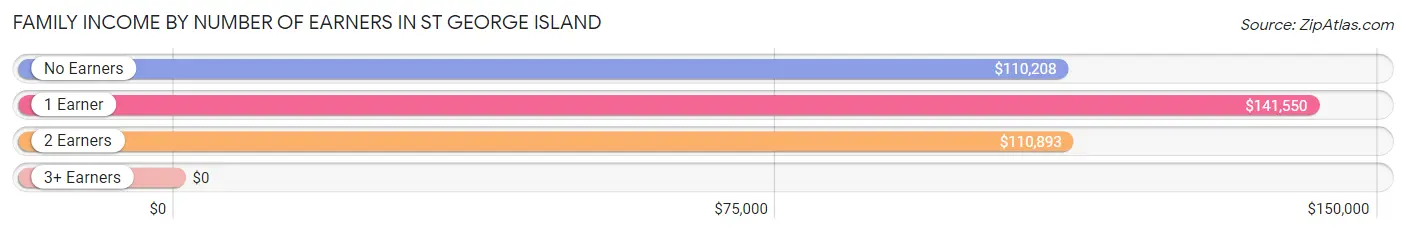
| Number of Earners | # Families | Median Income |
| No Earners | 93 (29.2%) | $110,208 |
| 1 Earner | 81 (25.5%) | $141,550 |
| 2 Earners | 133 (41.8%) | $110,893 |
| 3+ Earners | 11 (3.5%) | $0 |
| Total | 318 (100.0%) | $121,324 |
Household Income in St George Island
Household Income Brackets in St George Island
With 113 households falling in the category, the $100,000 to $149,999 income range is the most frequent in St George Island, accounting for 22.9% of all households.
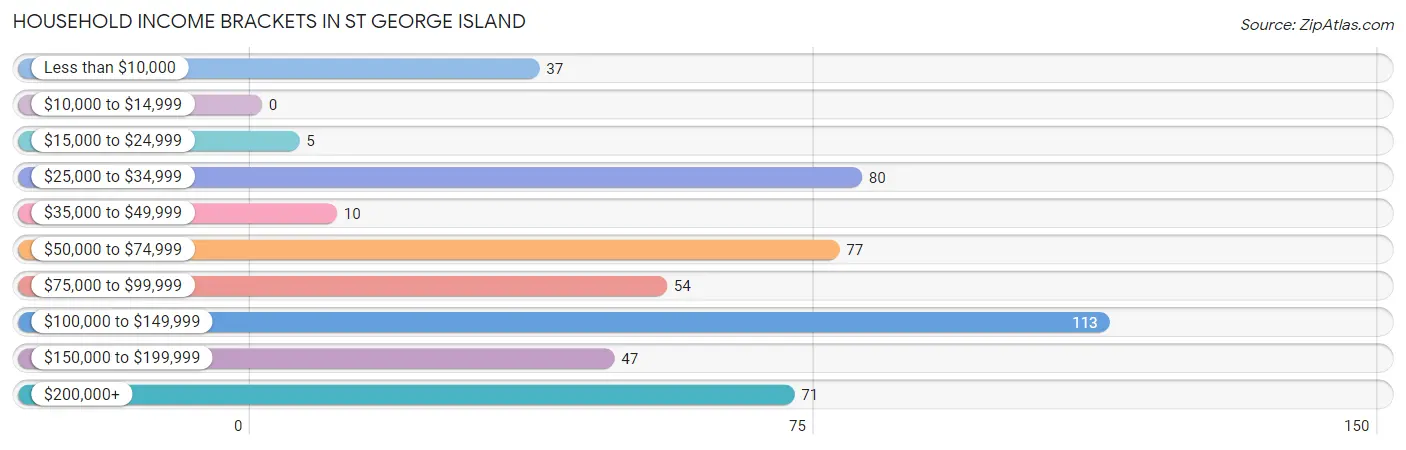
| Income Bracket | # Households | % Households |
| Less than $10,000 | 37 | 7.5% |
| $10,000 to $14,999 | 0 | 0.0% |
| $15,000 to $24,999 | 5 | 1.0% |
| $25,000 to $34,999 | 80 | 16.2% |
| $35,000 to $49,999 | 10 | 2.0% |
| $50,000 to $74,999 | 77 | 15.6% |
| $75,000 to $99,999 | 54 | 10.9% |
| $100,000 to $149,999 | 113 | 22.9% |
| $150,000 to $199,999 | 47 | 9.5% |
| $200,000+ | 71 | 14.4% |
Household Income by Householder Age in St George Island
The median household income in St George Island is $90,000, with the highest median household income of $122,222 found in the 45 to 64 years age bracket for the primary householder. A total of 180 households (36.4%) fall into this category.
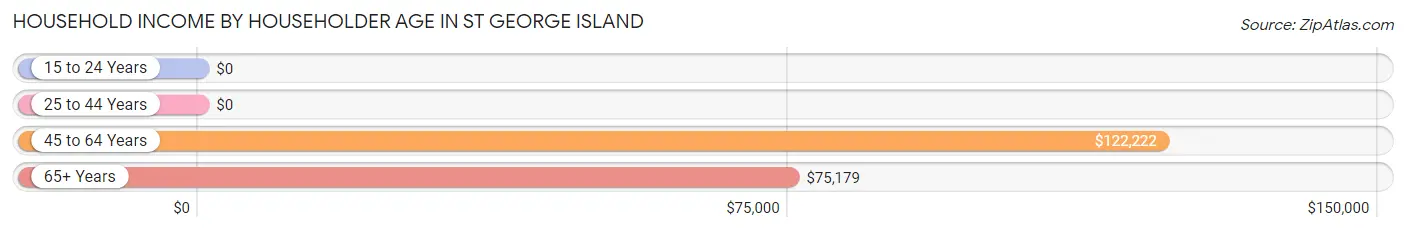
| Income Bracket | # Households | Median Income |
| 15 to 24 Years | 0 (0.0%) | $0 |
| 25 to 44 Years | 13 (2.6%) | $0 |
| 45 to 64 Years | 180 (36.4%) | $122,222 |
| 65+ Years | 301 (60.9%) | $75,179 |
| Total | 494 (100.0%) | $90,000 |
Poverty in St George Island
Income Below Poverty by Sex and Age in St George Island
With 14.4% poverty level for males and 8.0% for females among the residents of St George Island, 35 to 44 year old males and 75 year old and over females are the most vulnerable to poverty, with 61 males (91.0%) and 21 females (35.6%) in their respective age groups living below the poverty level.
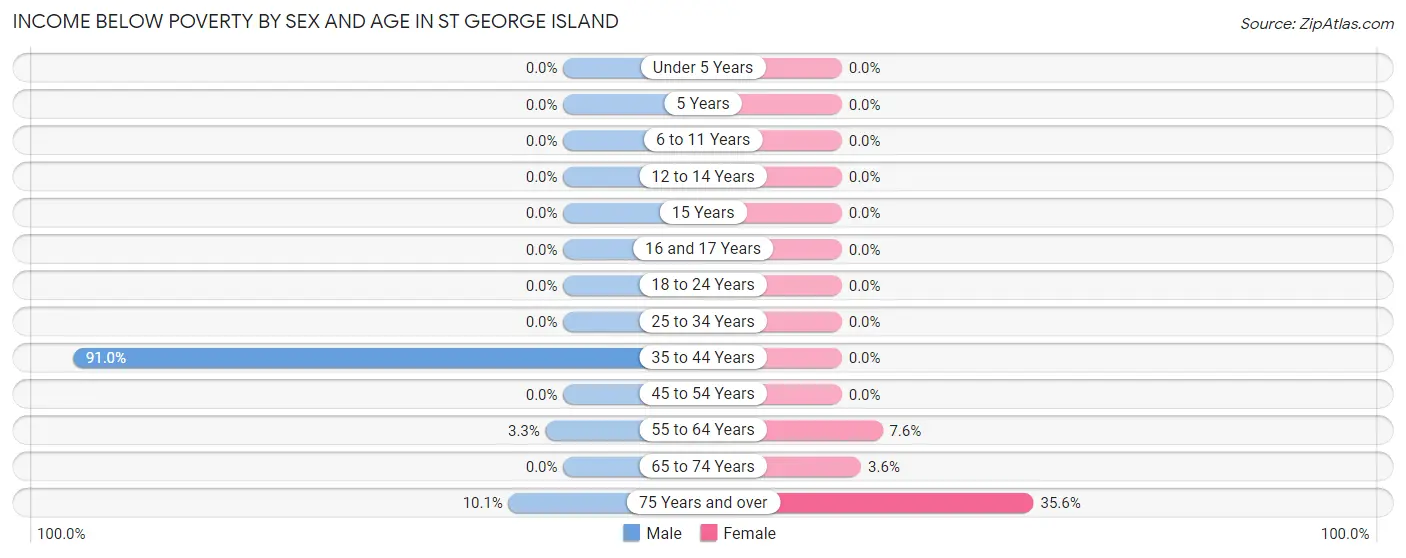
| Age Bracket | Male | Female |
| Under 5 Years | 0 (0.0%) | 0 (0.0%) |
| 5 Years | 0 (0.0%) | 0 (0.0%) |
| 6 to 11 Years | 0 (0.0%) | 0 (0.0%) |
| 12 to 14 Years | 0 (0.0%) | 0 (0.0%) |
| 15 Years | 0 (0.0%) | 0 (0.0%) |
| 16 and 17 Years | 0 (0.0%) | 0 (0.0%) |
| 18 to 24 Years | 0 (0.0%) | 0 (0.0%) |
| 25 to 34 Years | 0 (0.0%) | 0 (0.0%) |
| 35 to 44 Years | 61 (91.0%) | 0 (0.0%) |
| 45 to 54 Years | 0 (0.0%) | 0 (0.0%) |
| 55 to 64 Years | 5 (3.3%) | 8 (7.5%) |
| 65 to 74 Years | 0 (0.0%) | 8 (3.6%) |
| 75 Years and over | 7 (10.1%) | 21 (35.6%) |
| Total | 73 (14.4%) | 37 (8.0%) |
Income Above Poverty by Sex and Age in St George Island
According to the poverty statistics in St George Island, males aged under 5 years and females aged 12 to 14 years are the age groups that are most secure financially, with 100.0% of males and 100.0% of females in these age groups living above the poverty line.
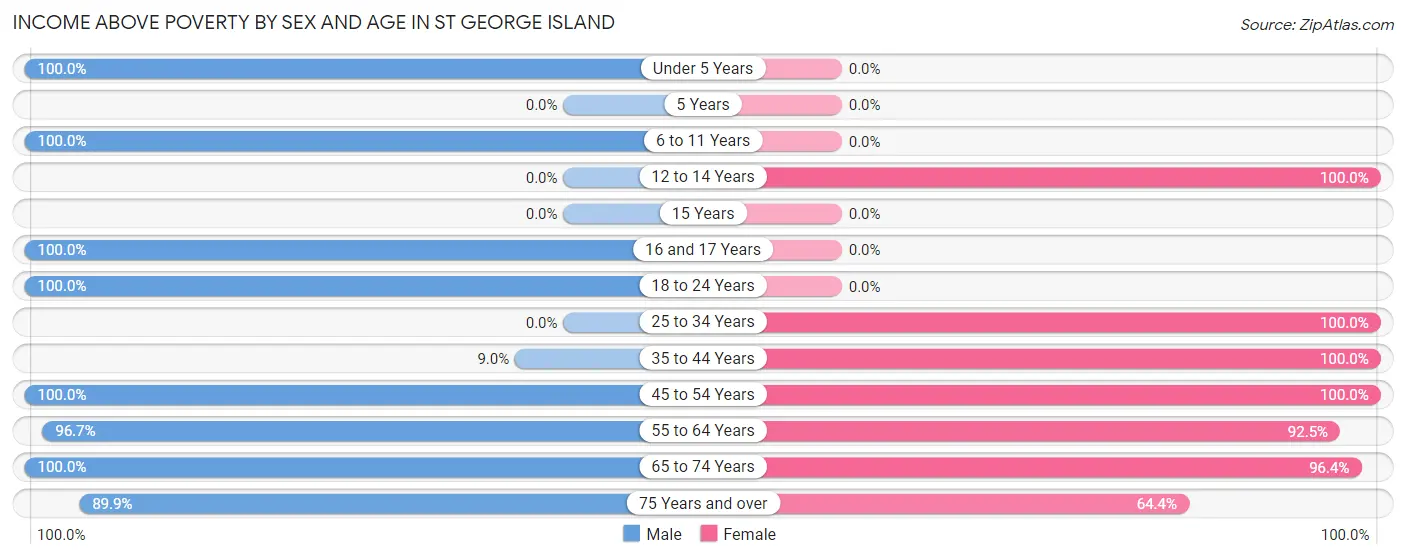
| Age Bracket | Male | Female |
| Under 5 Years | 9 (100.0%) | 0 (0.0%) |
| 5 Years | 0 (0.0%) | 0 (0.0%) |
| 6 to 11 Years | 19 (100.0%) | 0 (0.0%) |
| 12 to 14 Years | 0 (0.0%) | 4 (100.0%) |
| 15 Years | 0 (0.0%) | 0 (0.0%) |
| 16 and 17 Years | 23 (100.0%) | 0 (0.0%) |
| 18 to 24 Years | 44 (100.0%) | 0 (0.0%) |
| 25 to 34 Years | 0 (0.0%) | 6 (100.0%) |
| 35 to 44 Years | 6 (9.0%) | 7 (100.0%) |
| 45 to 54 Years | 22 (100.0%) | 58 (100.0%) |
| 55 to 64 Years | 147 (96.7%) | 98 (92.4%) |
| 65 to 74 Years | 102 (100.0%) | 215 (96.4%) |
| 75 Years and over | 62 (89.9%) | 38 (64.4%) |
| Total | 434 (85.6%) | 426 (92.0%) |
Income Below Poverty Among Married-Couple Families in St George Island
The poverty statistics for married-couple families in St George Island show that 1.7% or 5 of the total 291 families live below the poverty line. Families with no children have the highest poverty rate of 1.8%, comprising of 5 families. On the other hand, families with 1 or 2 children have the lowest poverty rate of 0.0%, which includes 0 families.
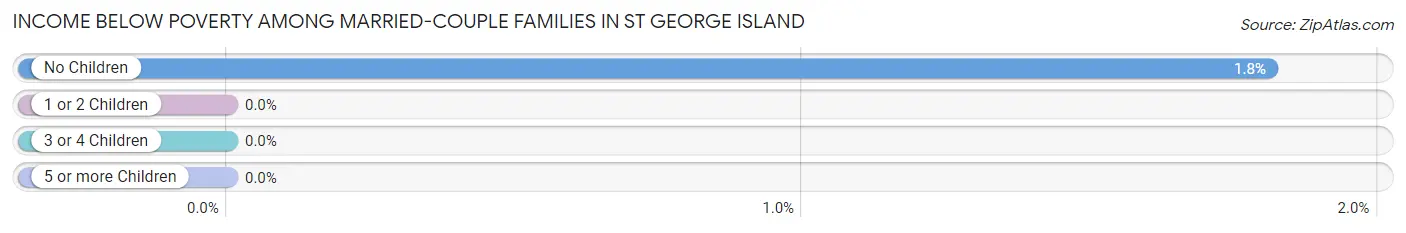
| Children | Above Poverty | Below Poverty |
| No Children | 271 (98.2%) | 5 (1.8%) |
| 1 or 2 Children | 15 (100.0%) | 0 (0.0%) |
| 3 or 4 Children | 0 (0.0%) | 0 (0.0%) |
| 5 or more Children | 0 (0.0%) | 0 (0.0%) |
| Total | 286 (98.3%) | 5 (1.7%) |
Income Below Poverty Among Single-Parent Households in St George Island
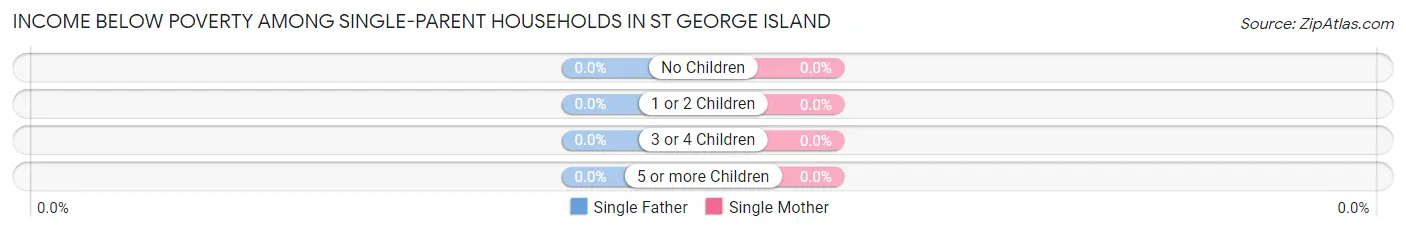
| Children | Single Father | Single Mother |
| No Children | 0 (0.0%) | 0 (0.0%) |
| 1 or 2 Children | 0 (0.0%) | 0 (0.0%) |
| 3 or 4 Children | 0 (0.0%) | 0 (0.0%) |
| 5 or more Children | 0 (0.0%) | 0 (0.0%) |
| Total | 0 (0.0%) | 0 (0.0%) |
Income Below Poverty Among Married-Couple vs Single-Parent Households in St George Island
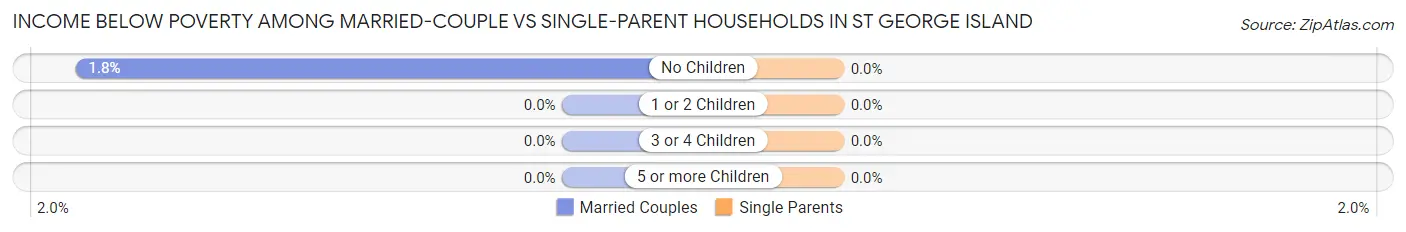
| Children | Married-Couple Families | Single-Parent Households |
| No Children | 5 (1.8%) | 0 (0.0%) |
| 1 or 2 Children | 0 (0.0%) | 0 (0.0%) |
| 3 or 4 Children | 0 (0.0%) | 0 (0.0%) |
| 5 or more Children | 0 (0.0%) | 0 (0.0%) |
| Total | 5 (1.7%) | 0 (0.0%) |
Employment Characteristics in St George Island
Employment by Class of Employer in St George Island
Among the 422 employed individuals in St George Island, private company employees (198 | 46.9%), self-employed (incorporated) (120 | 28.4%), and state government employees (37 | 8.8%) make up the most common classes of employment.
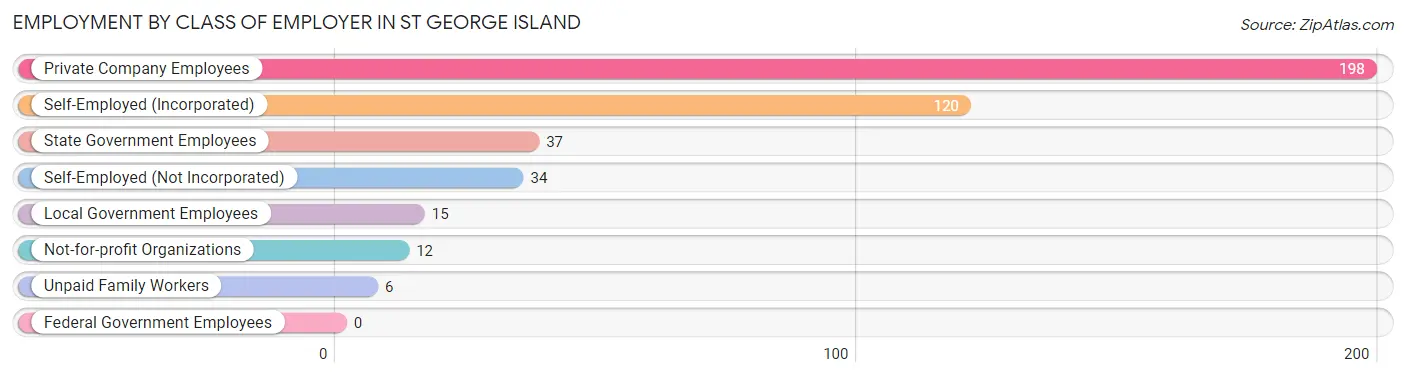
| Employer Class | # Employees | % Employees |
| Private Company Employees | 198 | 46.9% |
| Self-Employed (Incorporated) | 120 | 28.4% |
| Self-Employed (Not Incorporated) | 34 | 8.1% |
| Not-for-profit Organizations | 12 | 2.8% |
| Local Government Employees | 15 | 3.5% |
| State Government Employees | 37 | 8.8% |
| Federal Government Employees | 0 | 0.0% |
| Unpaid Family Workers | 6 | 1.4% |
| Total | 422 | 100.0% |
Employment Status by Age in St George Island
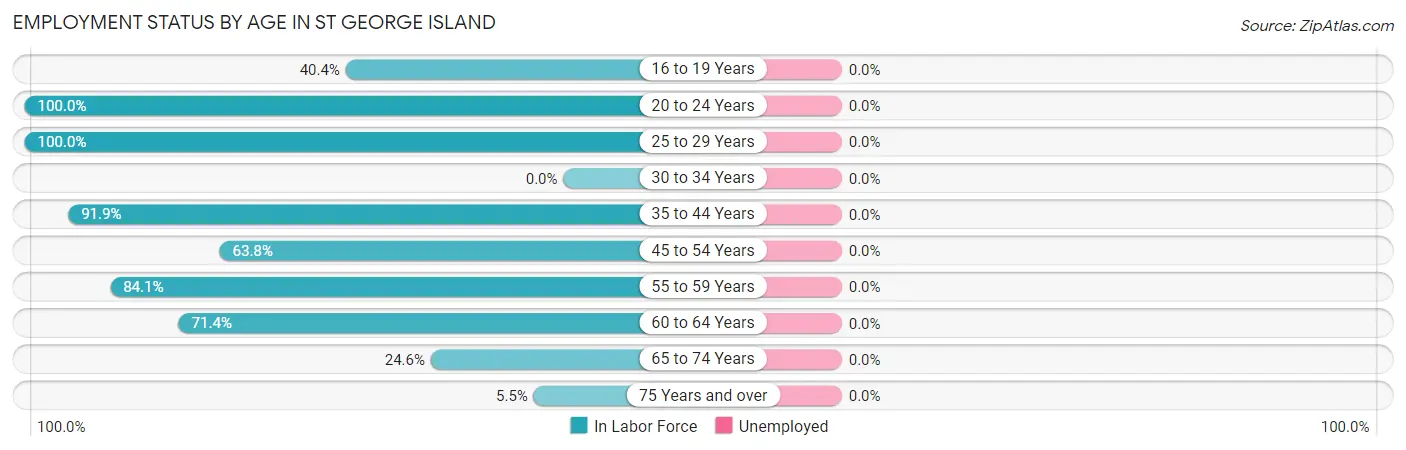
| Age Bracket | In Labor Force | Unemployed |
| 16 to 19 Years | 23 (40.4%) | 0 (0.0%) |
| 20 to 24 Years | 10 (100.0%) | 0 (0.0%) |
| 25 to 29 Years | 6 (100.0%) | 0 (0.0%) |
| 30 to 34 Years | 0 (0.0%) | 0 (0.0%) |
| 35 to 44 Years | 68 (91.9%) | 0 (0.0%) |
| 45 to 54 Years | 51 (63.8%) | 0 (0.0%) |
| 55 to 59 Years | 58 (84.1%) | 0 (0.0%) |
| 60 to 64 Years | 135 (71.4%) | 0 (0.0%) |
| 65 to 74 Years | 80 (24.6%) | 0 (0.0%) |
| 75 Years and over | 7 (5.5%) | 0 (0.0%) |
| Total | 438 (46.7%) | 0 (0.0%) |
Employment Status by Educational Attainment in St George Island
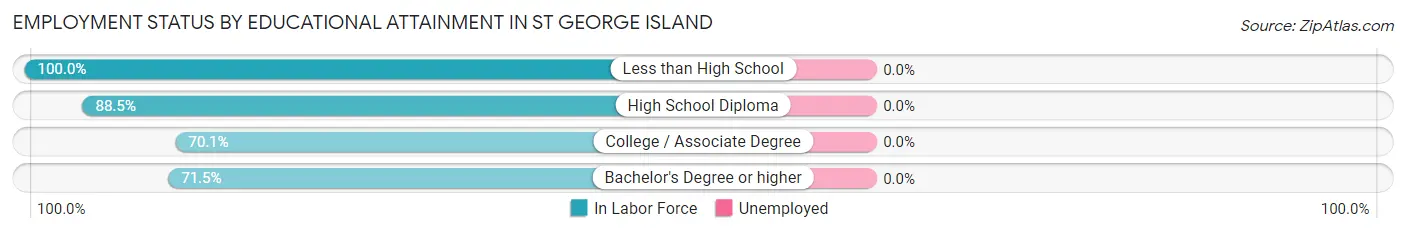
| Educational Attainment | In Labor Force | Unemployed |
| Less than High School | 4 (100.0%) | 0 (0.0%) |
| High School Diploma | 100 (88.5%) | 0 (0.0%) |
| College / Associate Degree | 61 (70.1%) | 0 (0.0%) |
| Bachelor's Degree or higher | 153 (71.5%) | 0 (0.0%) |
| Total | 318 (76.1%) | 0 (0.0%) |
Employment Occupations by Sex in St George Island
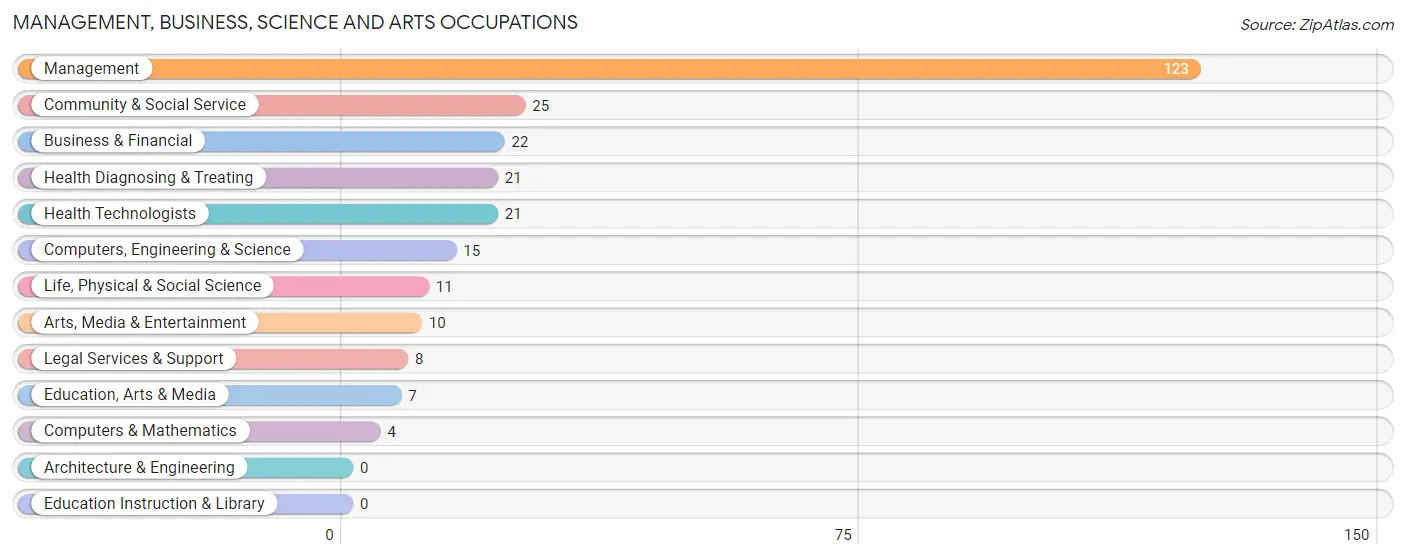
Management, Business, Science and Arts Occupations
The most common Management, Business, Science and Arts occupations in St George Island are Management (123 | 28.1%), Community & Social Service (25 | 5.7%), Business & Financial (22 | 5.0%), Health Diagnosing & Treating (21 | 4.8%), and Health Technologists (21 | 4.8%).
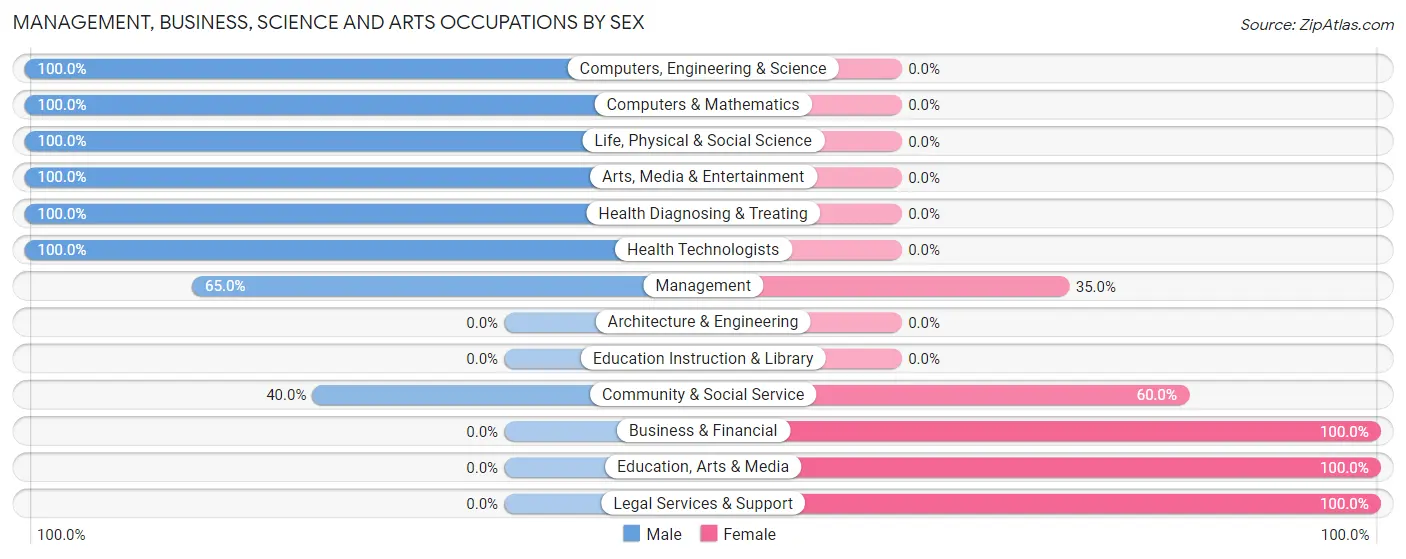
Management, Business, Science and Arts Occupations by Sex
Within the Management, Business, Science and Arts occupations in St George Island, the most male-oriented occupations are Computers, Engineering & Science (100.0%), Computers & Mathematics (100.0%), and Life, Physical & Social Science (100.0%), while the most female-oriented occupations are Business & Financial (100.0%), Education, Arts & Media (100.0%), and Legal Services & Support (100.0%).
| Occupation | Male | Female |
| Management | 80 (65.0%) | 43 (35.0%) |
| Business & Financial | 0 (0.0%) | 22 (100.0%) |
| Computers, Engineering & Science | 15 (100.0%) | 0 (0.0%) |
| Computers & Mathematics | 4 (100.0%) | 0 (0.0%) |
| Architecture & Engineering | 0 (0.0%) | 0 (0.0%) |
| Life, Physical & Social Science | 11 (100.0%) | 0 (0.0%) |
| Community & Social Service | 10 (40.0%) | 15 (60.0%) |
| Education, Arts & Media | 0 (0.0%) | 7 (100.0%) |
| Legal Services & Support | 0 (0.0%) | 8 (100.0%) |
| Education Instruction & Library | 0 (0.0%) | 0 (0.0%) |
| Arts, Media & Entertainment | 10 (100.0%) | 0 (0.0%) |
| Health Diagnosing & Treating | 21 (100.0%) | 0 (0.0%) |
| Health Technologists | 21 (100.0%) | 0 (0.0%) |
| Total (Category) | 126 (61.2%) | 80 (38.8%) |
| Total (Overall) | 288 (65.7%) | 150 (34.3%) |
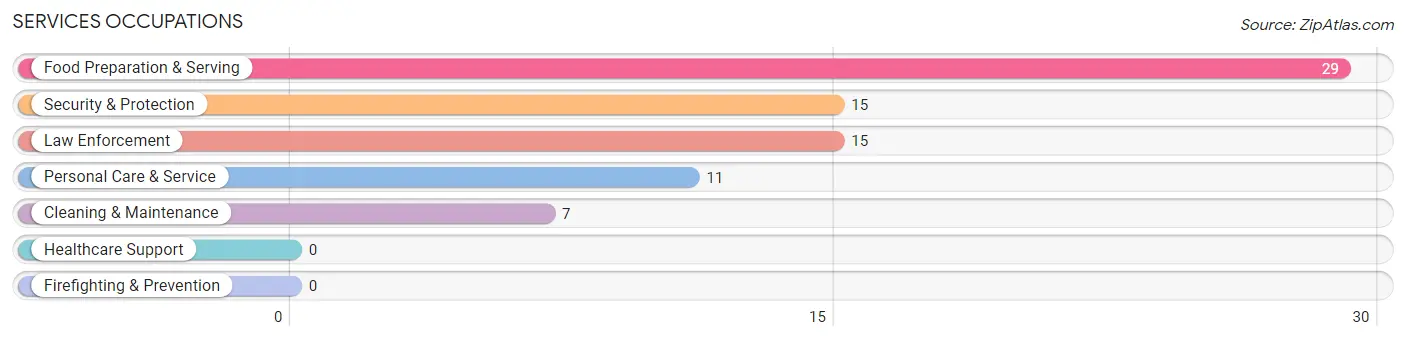
Services Occupations
The most common Services occupations in St George Island are Food Preparation & Serving (29 | 6.6%), Security & Protection (15 | 3.4%), Law Enforcement (15 | 3.4%), Personal Care & Service (11 | 2.5%), and Cleaning & Maintenance (7 | 1.6%).
Services Occupations by Sex
Within the Services occupations in St George Island, the most male-oriented occupations are Cleaning & Maintenance (100.0%), Food Preparation & Serving (79.3%), and Security & Protection (73.3%), while the most female-oriented occupations are Personal Care & Service (100.0%), Security & Protection (26.7%), and Law Enforcement (26.7%).

| Occupation | Male | Female |
| Healthcare Support | 0 (0.0%) | 0 (0.0%) |
| Security & Protection | 11 (73.3%) | 4 (26.7%) |
| Firefighting & Prevention | 0 (0.0%) | 0 (0.0%) |
| Law Enforcement | 11 (73.3%) | 4 (26.7%) |
| Food Preparation & Serving | 23 (79.3%) | 6 (20.7%) |
| Cleaning & Maintenance | 7 (100.0%) | 0 (0.0%) |
| Personal Care & Service | 0 (0.0%) | 11 (100.0%) |
| Total (Category) | 41 (66.1%) | 21 (33.9%) |
| Total (Overall) | 288 (65.7%) | 150 (34.3%) |
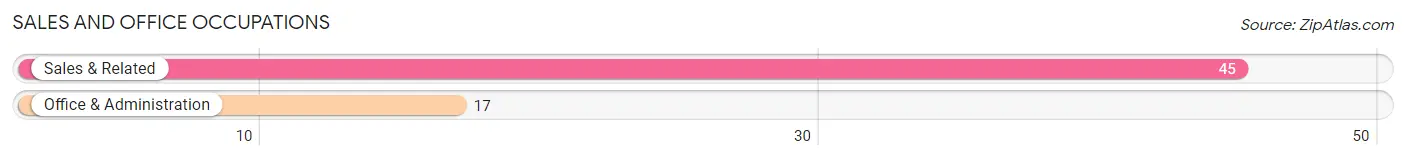
Sales and Office Occupations
The most common Sales and Office occupations in St George Island are Sales & Related (45 | 10.3%), and Office & Administration (17 | 3.9%).
Sales and Office Occupations by Sex
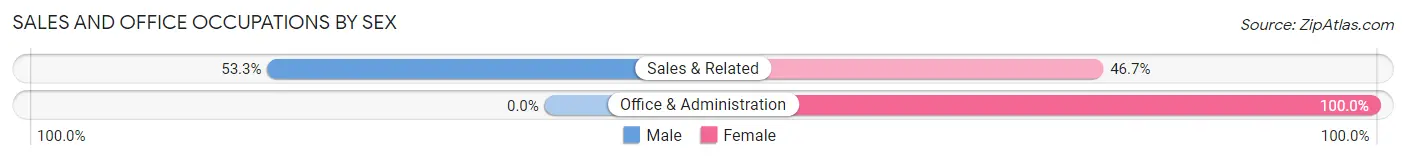
| Occupation | Male | Female |
| Sales & Related | 24 (53.3%) | 21 (46.7%) |
| Office & Administration | 0 (0.0%) | 17 (100.0%) |
| Total (Category) | 24 (38.7%) | 38 (61.3%) |
| Total (Overall) | 288 (65.7%) | 150 (34.3%) |
Natural Resources, Construction and Maintenance Occupations
The most common Natural Resources, Construction and Maintenance occupations in St George Island are Construction & Extraction (67 | 15.3%), and Installation, Maintenance & Repair (35 | 8.0%).
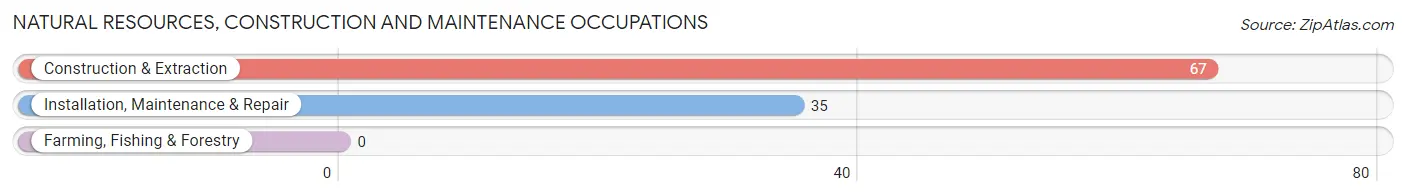
Natural Resources, Construction and Maintenance Occupations by Sex
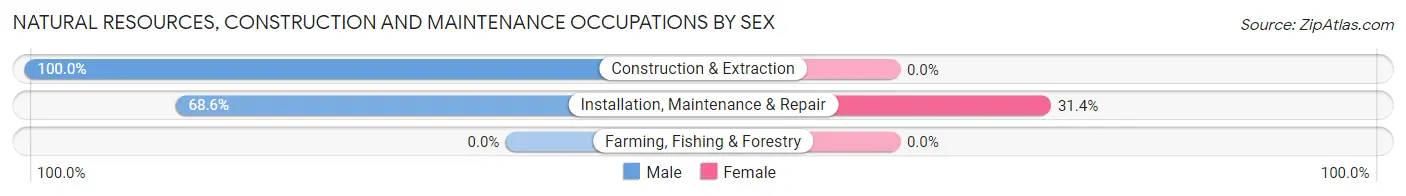
| Occupation | Male | Female |
| Farming, Fishing & Forestry | 0 (0.0%) | 0 (0.0%) |
| Construction & Extraction | 67 (100.0%) | 0 (0.0%) |
| Installation, Maintenance & Repair | 24 (68.6%) | 11 (31.4%) |
| Total (Category) | 91 (89.2%) | 11 (10.8%) |
| Total (Overall) | 288 (65.7%) | 150 (34.3%) |
Production, Transportation and Moving Occupations
The most common Production, Transportation and Moving occupations in St George Island are , and Transportation (6 | 1.4%).
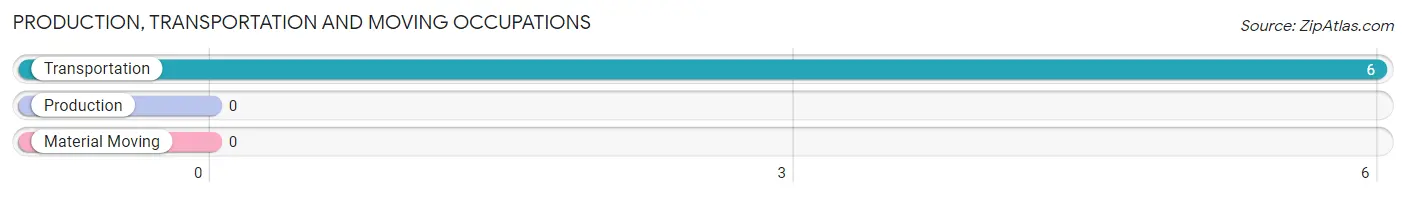
Production, Transportation and Moving Occupations by Sex
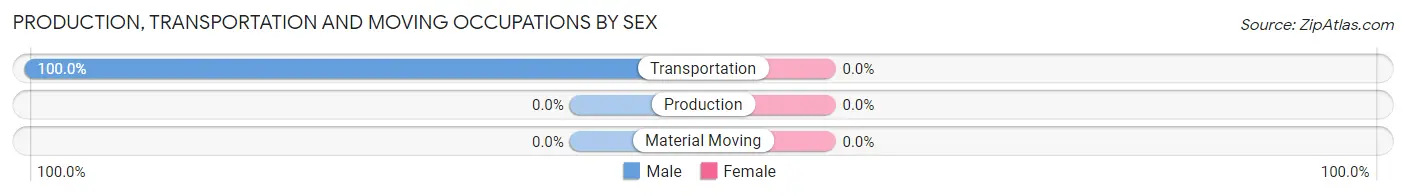
| Occupation | Male | Female |
| Production | 0 (0.0%) | 0 (0.0%) |
| Transportation | 6 (100.0%) | 0 (0.0%) |
| Material Moving | 0 (0.0%) | 0 (0.0%) |
| Total (Category) | 6 (100.0%) | 0 (0.0%) |
| Total (Overall) | 288 (65.7%) | 150 (34.3%) |
Employment Industries by Sex in St George Island
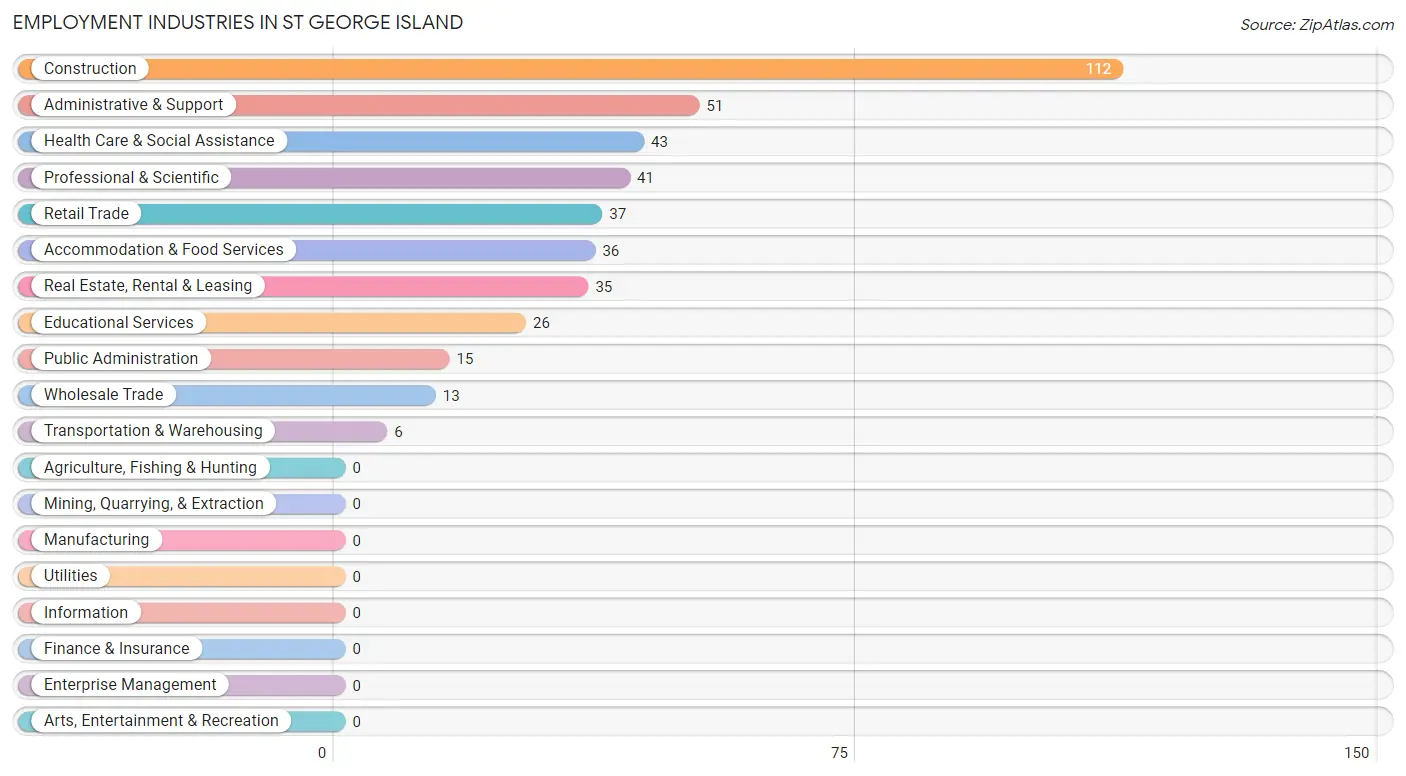
Employment Industries in St George Island
The major employment industries in St George Island include Construction (112 | 25.6%), Administrative & Support (51 | 11.6%), Health Care & Social Assistance (43 | 9.8%), Professional & Scientific (41 | 9.4%), and Retail Trade (37 | 8.5%).
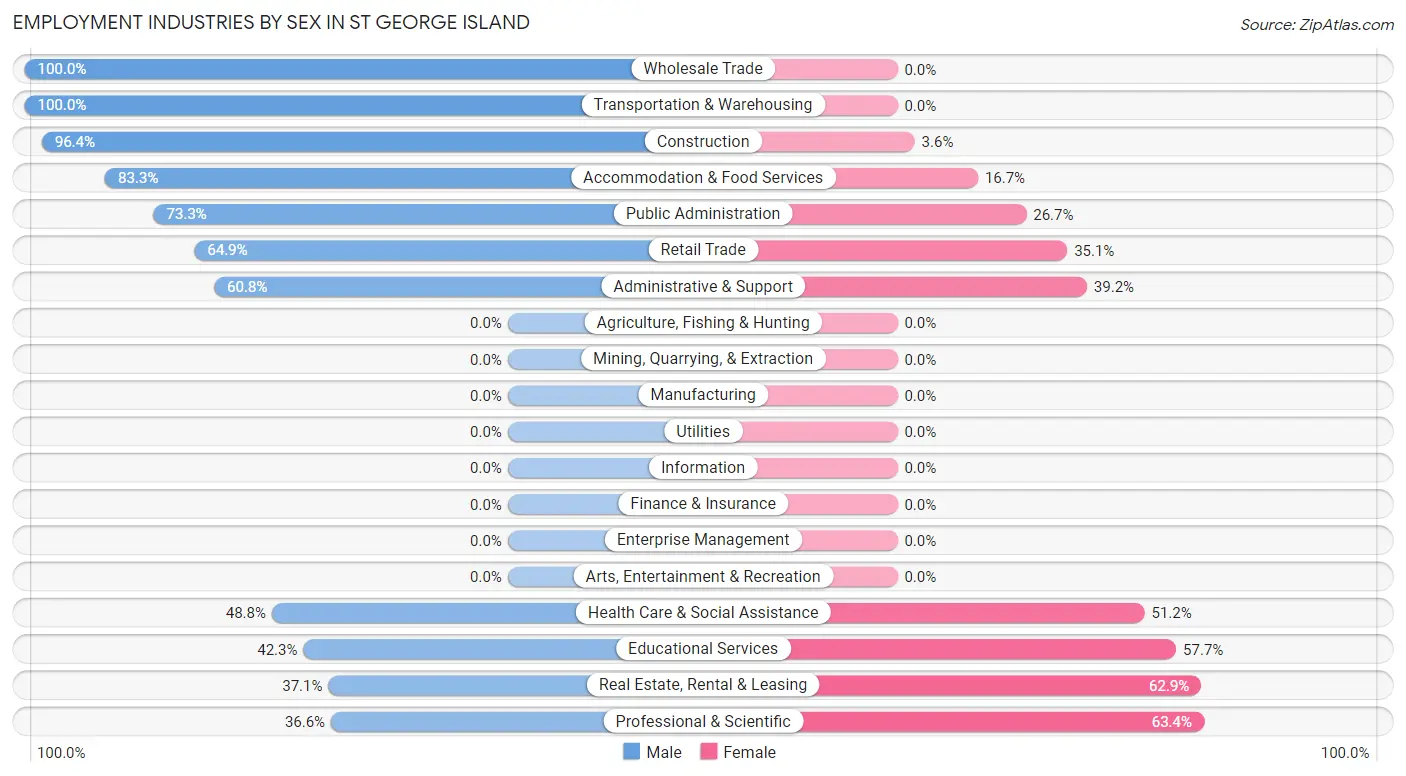
Employment Industries by Sex in St George Island
The St George Island industries that see more men than women are Wholesale Trade (100.0%), Transportation & Warehousing (100.0%), and Construction (96.4%), whereas the industries that tend to have a higher number of women are Professional & Scientific (63.4%), Real Estate, Rental & Leasing (62.9%), and Educational Services (57.7%).
| Industry | Male | Female |
| Agriculture, Fishing & Hunting | 0 (0.0%) | 0 (0.0%) |
| Mining, Quarrying, & Extraction | 0 (0.0%) | 0 (0.0%) |
| Construction | 108 (96.4%) | 4 (3.6%) |
| Manufacturing | 0 (0.0%) | 0 (0.0%) |
| Wholesale Trade | 13 (100.0%) | 0 (0.0%) |
| Retail Trade | 24 (64.9%) | 13 (35.1%) |
| Transportation & Warehousing | 6 (100.0%) | 0 (0.0%) |
| Utilities | 0 (0.0%) | 0 (0.0%) |
| Information | 0 (0.0%) | 0 (0.0%) |
| Finance & Insurance | 0 (0.0%) | 0 (0.0%) |
| Real Estate, Rental & Leasing | 13 (37.1%) | 22 (62.9%) |
| Professional & Scientific | 15 (36.6%) | 26 (63.4%) |
| Enterprise Management | 0 (0.0%) | 0 (0.0%) |
| Administrative & Support | 31 (60.8%) | 20 (39.2%) |
| Educational Services | 11 (42.3%) | 15 (57.7%) |
| Health Care & Social Assistance | 21 (48.8%) | 22 (51.2%) |
| Arts, Entertainment & Recreation | 0 (0.0%) | 0 (0.0%) |
| Accommodation & Food Services | 30 (83.3%) | 6 (16.7%) |
| Public Administration | 11 (73.3%) | 4 (26.7%) |
| Total | 288 (65.7%) | 150 (34.3%) |
Education in St George Island
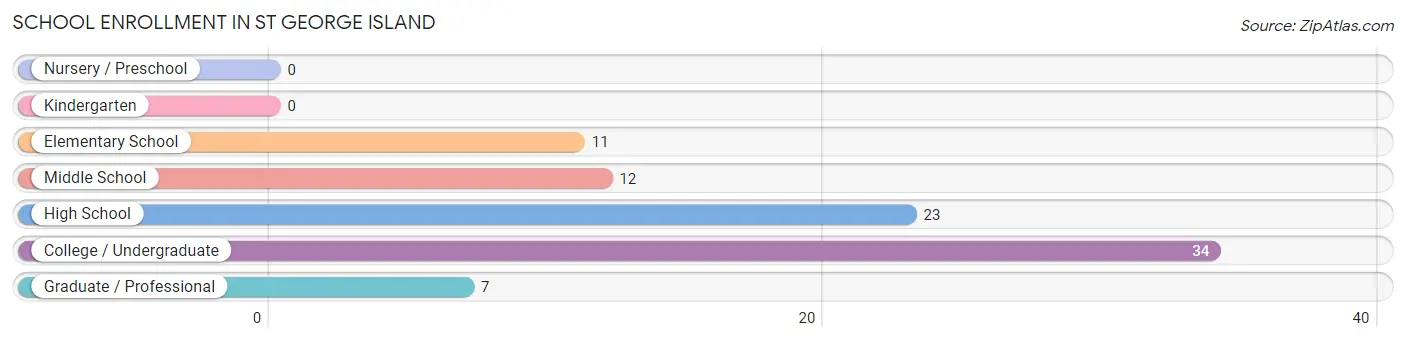
School Enrollment in St George Island
The most common levels of schooling among the 87 students in St George Island are college / undergraduate (34 | 39.1%), high school (23 | 26.4%), and middle school (12 | 13.8%).
| School Level | # Students | % Students |
| Nursery / Preschool | 0 | 0.0% |
| Kindergarten | 0 | 0.0% |
| Elementary School | 11 | 12.6% |
| Middle School | 12 | 13.8% |
| High School | 23 | 26.4% |
| College / Undergraduate | 34 | 39.1% |
| Graduate / Professional | 7 | 8.1% |
| Total | 87 | 100.0% |
School Enrollment by Age by Funding Source in St George Island
Out of a total of 87 students who are enrolled in schools in St George Island, 19 (21.8%) attend a private institution, while the remaining 68 (78.2%) are enrolled in public schools. The age group of 10 to 14 year olds has the highest likelihood of being enrolled in private schools, with 12 (100.0% in the age bracket) enrolled. Conversely, the age group of 5 to 9 year old has the lowest likelihood of being enrolled in a private school, with 11 (100.0% in the age bracket) attending a public institution.
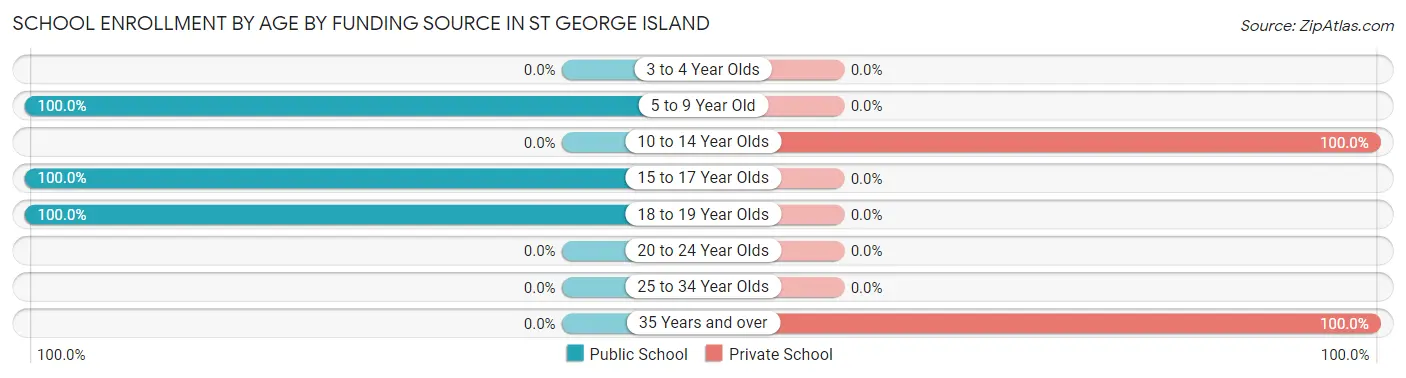
| Age Bracket | Public School | Private School |
| 3 to 4 Year Olds | 0 (0.0%) | 0 (0.0%) |
| 5 to 9 Year Old | 11 (100.0%) | 0 (0.0%) |
| 10 to 14 Year Olds | 0 (0.0%) | 12 (100.0%) |
| 15 to 17 Year Olds | 23 (100.0%) | 0 (0.0%) |
| 18 to 19 Year Olds | 34 (100.0%) | 0 (0.0%) |
| 20 to 24 Year Olds | 0 (0.0%) | 0 (0.0%) |
| 25 to 34 Year Olds | 0 (0.0%) | 0 (0.0%) |
| 35 Years and over | 0 (0.0%) | 7 (100.0%) |
| Total | 68 (78.2%) | 19 (21.8%) |
Educational Attainment by Field of Study in St George Island
Business (106 | 21.2%), education (101 | 20.2%), science & technology (38 | 7.6%), engineering (35 | 7.0%), and psychology (33 | 6.6%) are the most common fields of study among 501 individuals in St George Island who have obtained a bachelor's degree or higher.
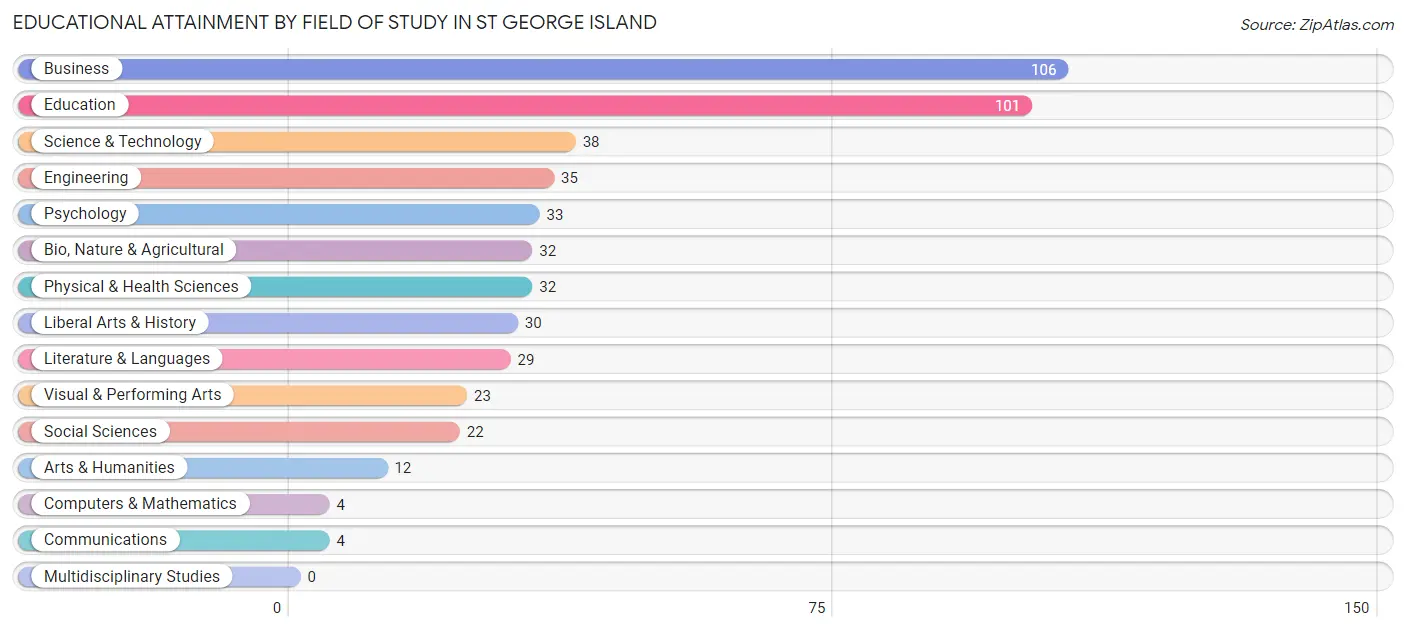
| Field of Study | # Graduates | % Graduates |
| Computers & Mathematics | 4 | 0.8% |
| Bio, Nature & Agricultural | 32 | 6.4% |
| Physical & Health Sciences | 32 | 6.4% |
| Psychology | 33 | 6.6% |
| Social Sciences | 22 | 4.4% |
| Engineering | 35 | 7.0% |
| Multidisciplinary Studies | 0 | 0.0% |
| Science & Technology | 38 | 7.6% |
| Business | 106 | 21.2% |
| Education | 101 | 20.2% |
| Literature & Languages | 29 | 5.8% |
| Liberal Arts & History | 30 | 6.0% |
| Visual & Performing Arts | 23 | 4.6% |
| Communications | 4 | 0.8% |
| Arts & Humanities | 12 | 2.4% |
| Total | 501 | 100.0% |
Transportation & Commute in St George Island
Vehicle Availability by Sex in St George Island
The most prevalent vehicle ownership categories in St George Island are males with 2 vehicles (113, accounting for 40.6%) and females with 2 vehicles (84, making up 78.5%).
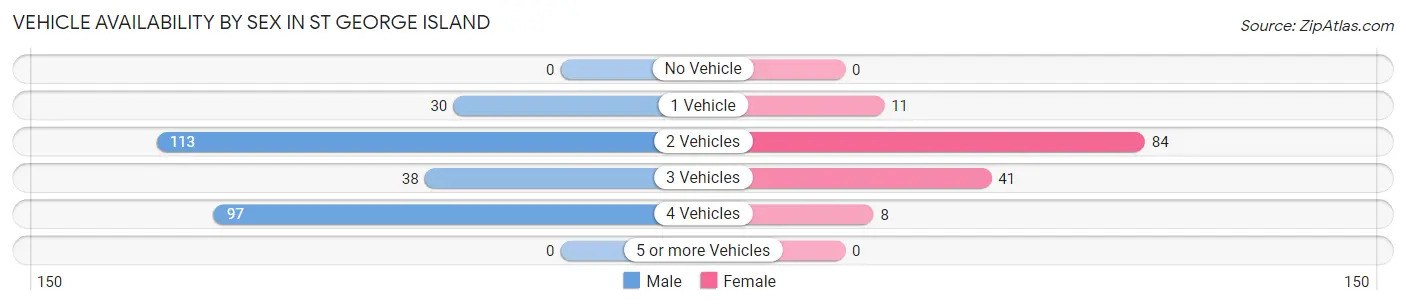
| Vehicles Available | Male | Female |
| No Vehicle | 0 (0.0%) | 0 (0.0%) |
| 1 Vehicle | 30 (10.8%) | 11 (7.6%) |
| 2 Vehicles | 113 (40.6%) | 84 (58.3%) |
| 3 Vehicles | 38 (13.7%) | 41 (28.5%) |
| 4 Vehicles | 97 (34.9%) | 8 (5.6%) |
| 5 or more Vehicles | 0 (0.0%) | 0 (0.0%) |
| Total | 278 (100.0%) | 144 (100.0%) |
Commute Time in St George Island
The most frequently occuring commute durations in St George Island are 5 to 9 minutes (99 commuters, 27.2%), 10 to 14 minutes (67 commuters, 18.4%), and 20 to 24 minutes (56 commuters, 15.4%).
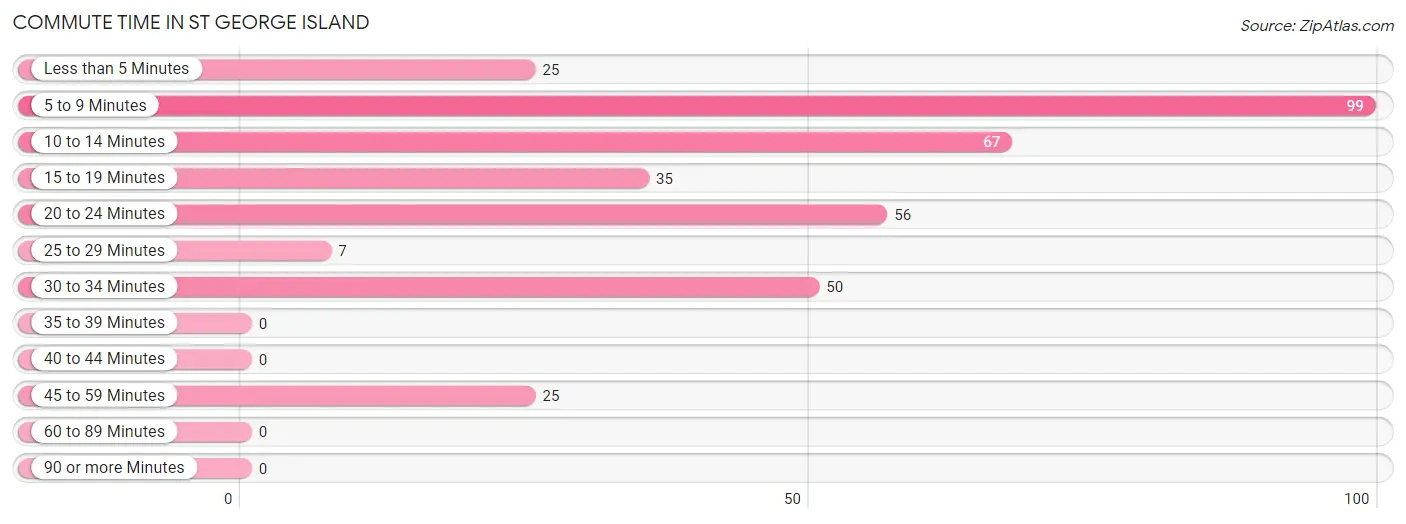
| Commute Time | # Commuters | % Commuters |
| Less than 5 Minutes | 25 | 6.9% |
| 5 to 9 Minutes | 99 | 27.2% |
| 10 to 14 Minutes | 67 | 18.4% |
| 15 to 19 Minutes | 35 | 9.6% |
| 20 to 24 Minutes | 56 | 15.4% |
| 25 to 29 Minutes | 7 | 1.9% |
| 30 to 34 Minutes | 50 | 13.7% |
| 35 to 39 Minutes | 0 | 0.0% |
| 40 to 44 Minutes | 0 | 0.0% |
| 45 to 59 Minutes | 25 | 6.9% |
| 60 to 89 Minutes | 0 | 0.0% |
| 90 or more Minutes | 0 | 0.0% |
Commute Time by Sex in St George Island
The most common commute times in St George Island are 5 to 9 minutes (73 commuters, 27.3%) for males and 30 to 34 minutes (35 commuters, 36.1%) for females.
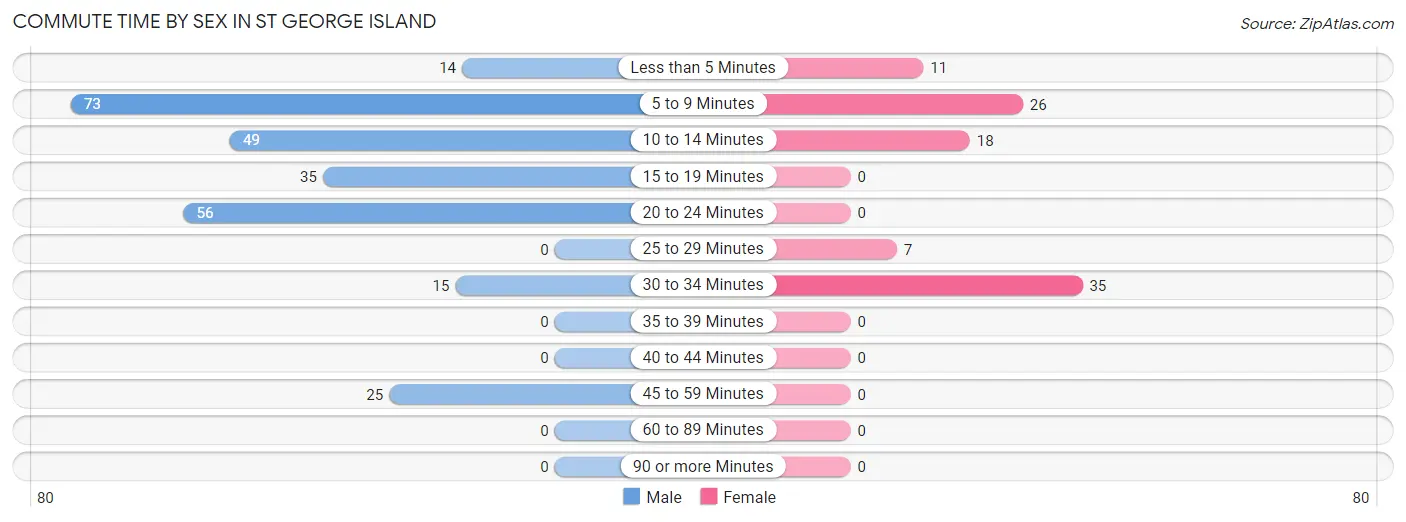
| Commute Time | Male | Female |
| Less than 5 Minutes | 14 (5.2%) | 11 (11.3%) |
| 5 to 9 Minutes | 73 (27.3%) | 26 (26.8%) |
| 10 to 14 Minutes | 49 (18.3%) | 18 (18.6%) |
| 15 to 19 Minutes | 35 (13.1%) | 0 (0.0%) |
| 20 to 24 Minutes | 56 (21.0%) | 0 (0.0%) |
| 25 to 29 Minutes | 0 (0.0%) | 7 (7.2%) |
| 30 to 34 Minutes | 15 (5.6%) | 35 (36.1%) |
| 35 to 39 Minutes | 0 (0.0%) | 0 (0.0%) |
| 40 to 44 Minutes | 0 (0.0%) | 0 (0.0%) |
| 45 to 59 Minutes | 25 (9.4%) | 0 (0.0%) |
| 60 to 89 Minutes | 0 (0.0%) | 0 (0.0%) |
| 90 or more Minutes | 0 (0.0%) | 0 (0.0%) |
Time of Departure to Work by Sex in St George Island
The most frequent times of departure to work in St George Island are 8:00 AM to 8:29 AM (85, 31.8%) for males and 10:00 AM to 10:59 AM (25, 25.8%) for females.
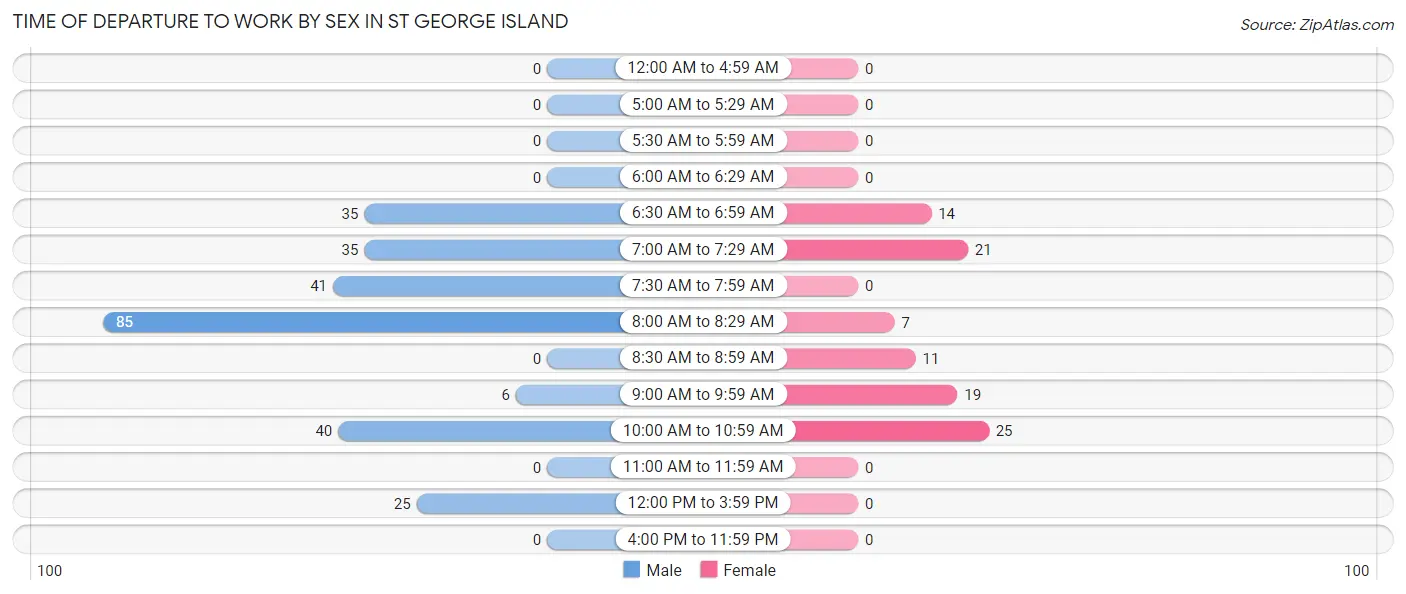
| Time of Departure | Male | Female |
| 12:00 AM to 4:59 AM | 0 (0.0%) | 0 (0.0%) |
| 5:00 AM to 5:29 AM | 0 (0.0%) | 0 (0.0%) |
| 5:30 AM to 5:59 AM | 0 (0.0%) | 0 (0.0%) |
| 6:00 AM to 6:29 AM | 0 (0.0%) | 0 (0.0%) |
| 6:30 AM to 6:59 AM | 35 (13.1%) | 14 (14.4%) |
| 7:00 AM to 7:29 AM | 35 (13.1%) | 21 (21.6%) |
| 7:30 AM to 7:59 AM | 41 (15.4%) | 0 (0.0%) |
| 8:00 AM to 8:29 AM | 85 (31.8%) | 7 (7.2%) |
| 8:30 AM to 8:59 AM | 0 (0.0%) | 11 (11.3%) |
| 9:00 AM to 9:59 AM | 6 (2.2%) | 19 (19.6%) |
| 10:00 AM to 10:59 AM | 40 (15.0%) | 25 (25.8%) |
| 11:00 AM to 11:59 AM | 0 (0.0%) | 0 (0.0%) |
| 12:00 PM to 3:59 PM | 25 (9.4%) | 0 (0.0%) |
| 4:00 PM to 11:59 PM | 0 (0.0%) | 0 (0.0%) |
| Total | 267 (100.0%) | 97 (100.0%) |
Housing Occupancy in St George Island
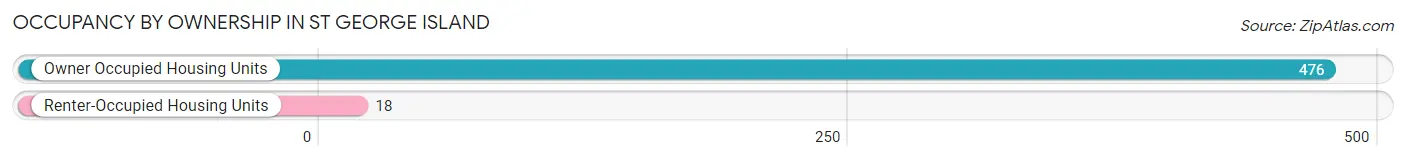
Occupancy by Ownership in St George Island
Of the total 494 dwellings in St George Island, owner-occupied units account for 476 (96.4%), while renter-occupied units make up 18 (3.6%).
| Occupancy | # Housing Units | % Housing Units |
| Owner Occupied Housing Units | 476 | 96.4% |
| Renter-Occupied Housing Units | 18 | 3.6% |
| Total Occupied Housing Units | 494 | 100.0% |
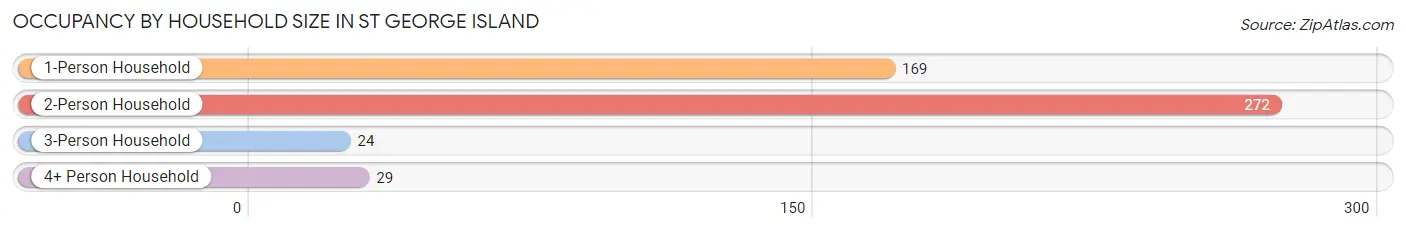
Occupancy by Household Size in St George Island
| Household Size | # Housing Units | % Housing Units |
| 1-Person Household | 169 | 34.2% |
| 2-Person Household | 272 | 55.1% |
| 3-Person Household | 24 | 4.9% |
| 4+ Person Household | 29 | 5.9% |
| Total Housing Units | 494 | 100.0% |
Occupancy by Ownership by Household Size in St George Island
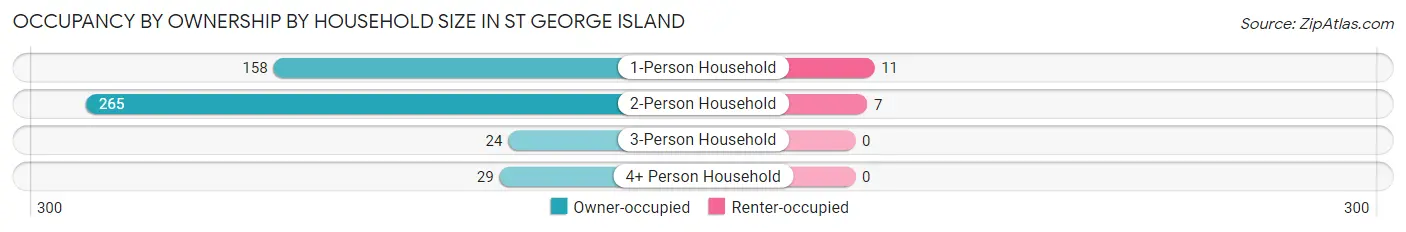
| Household Size | Owner-occupied | Renter-occupied |
| 1-Person Household | 158 (93.5%) | 11 (6.5%) |
| 2-Person Household | 265 (97.4%) | 7 (2.6%) |
| 3-Person Household | 24 (100.0%) | 0 (0.0%) |
| 4+ Person Household | 29 (100.0%) | 0 (0.0%) |
| Total Housing Units | 476 (96.4%) | 18 (3.6%) |
Occupancy by Educational Attainment in St George Island
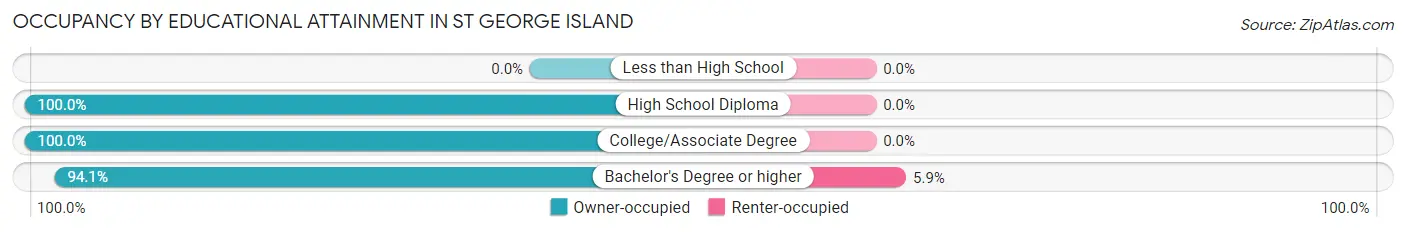
| Household Size | Owner-occupied | Renter-occupied |
| Less than High School | 0 (0.0%) | 0 (0.0%) |
| High School Diploma | 43 (100.0%) | 0 (0.0%) |
| College/Associate Degree | 148 (100.0%) | 0 (0.0%) |
| Bachelor's Degree or higher | 285 (94.1%) | 18 (5.9%) |
Occupancy by Age of Householder in St George Island
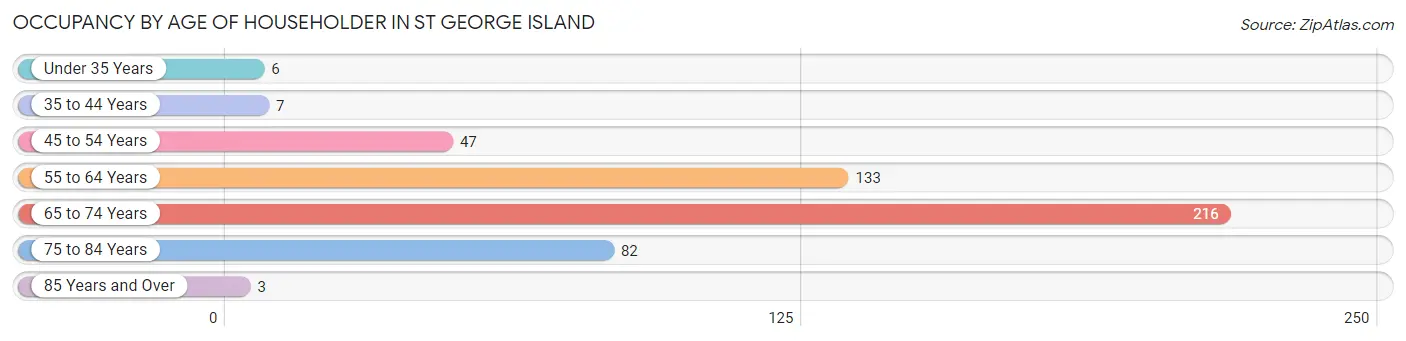
| Age Bracket | # Households | % Households |
| Under 35 Years | 6 | 1.2% |
| 35 to 44 Years | 7 | 1.4% |
| 45 to 54 Years | 47 | 9.5% |
| 55 to 64 Years | 133 | 26.9% |
| 65 to 74 Years | 216 | 43.7% |
| 75 to 84 Years | 82 | 16.6% |
| 85 Years and Over | 3 | 0.6% |
| Total | 494 | 100.0% |
Housing Finances in St George Island
Median Income by Occupancy in St George Island
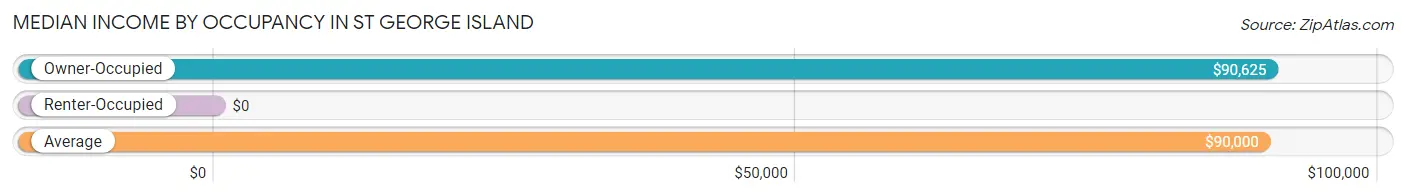
| Occupancy Type | # Households | Median Income |
| Owner-Occupied | 476 (96.4%) | $90,625 |
| Renter-Occupied | 18 (3.6%) | $0 |
| Average | 494 (100.0%) | $90,000 |
Occupancy by Householder Income Bracket in St George Island
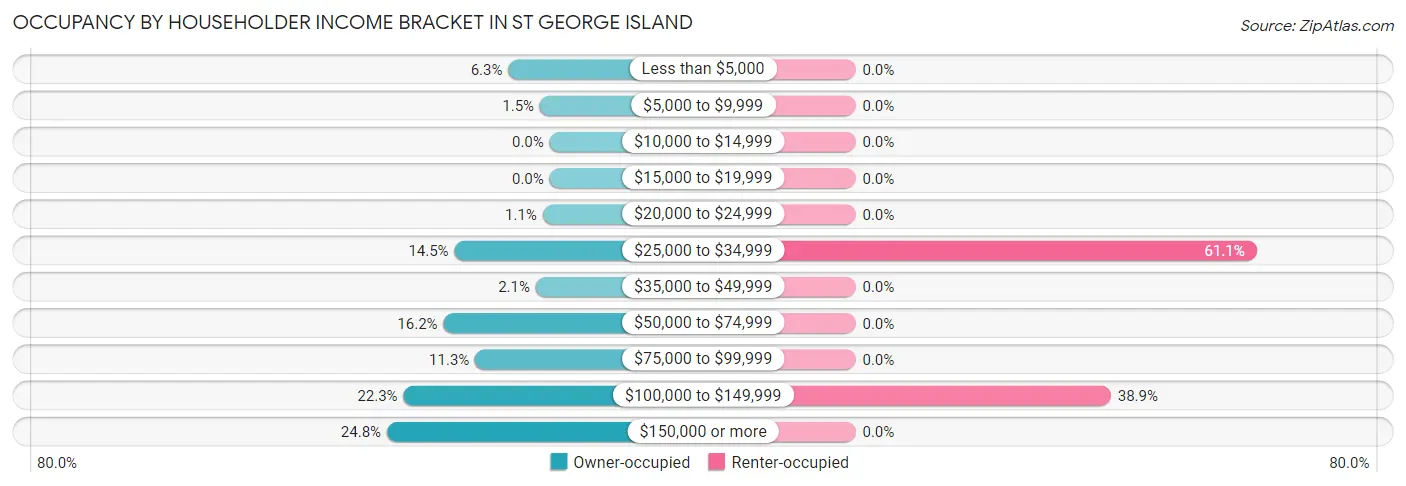
| Income Bracket | Owner-occupied | Renter-occupied |
| Less than $5,000 | 30 (6.3%) | 0 (0.0%) |
| $5,000 to $9,999 | 7 (1.5%) | 0 (0.0%) |
| $10,000 to $14,999 | 0 (0.0%) | 0 (0.0%) |
| $15,000 to $19,999 | 0 (0.0%) | 0 (0.0%) |
| $20,000 to $24,999 | 5 (1.1%) | 0 (0.0%) |
| $25,000 to $34,999 | 69 (14.5%) | 11 (61.1%) |
| $35,000 to $49,999 | 10 (2.1%) | 0 (0.0%) |
| $50,000 to $74,999 | 77 (16.2%) | 0 (0.0%) |
| $75,000 to $99,999 | 54 (11.3%) | 0 (0.0%) |
| $100,000 to $149,999 | 106 (22.3%) | 7 (38.9%) |
| $150,000 or more | 118 (24.8%) | 0 (0.0%) |
| Total | 476 (100.0%) | 18 (100.0%) |
Monthly Housing Cost Tiers in St George Island
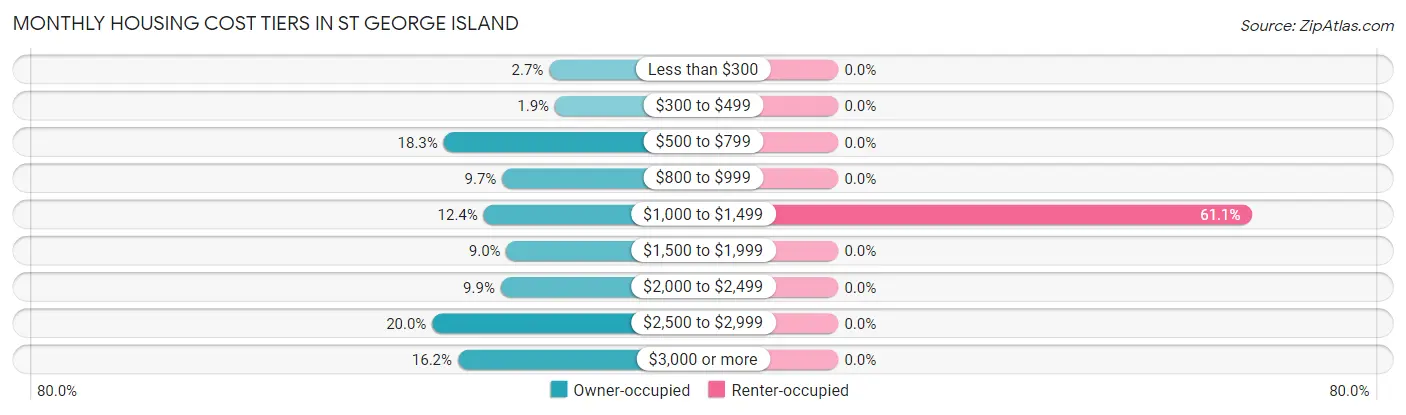
| Monthly Cost | Owner-occupied | Renter-occupied |
| Less than $300 | 13 (2.7%) | 0 (0.0%) |
| $300 to $499 | 9 (1.9%) | 0 (0.0%) |
| $500 to $799 | 87 (18.3%) | 0 (0.0%) |
| $800 to $999 | 46 (9.7%) | 0 (0.0%) |
| $1,000 to $1,499 | 59 (12.4%) | 11 (61.1%) |
| $1,500 to $1,999 | 43 (9.0%) | 0 (0.0%) |
| $2,000 to $2,499 | 47 (9.9%) | 0 (0.0%) |
| $2,500 to $2,999 | 95 (20.0%) | 0 (0.0%) |
| $3,000 or more | 77 (16.2%) | 0 (0.0%) |
| Total | 476 (100.0%) | 18 (100.0%) |
Physical Housing Characteristics in St George Island
Housing Structures in St George Island
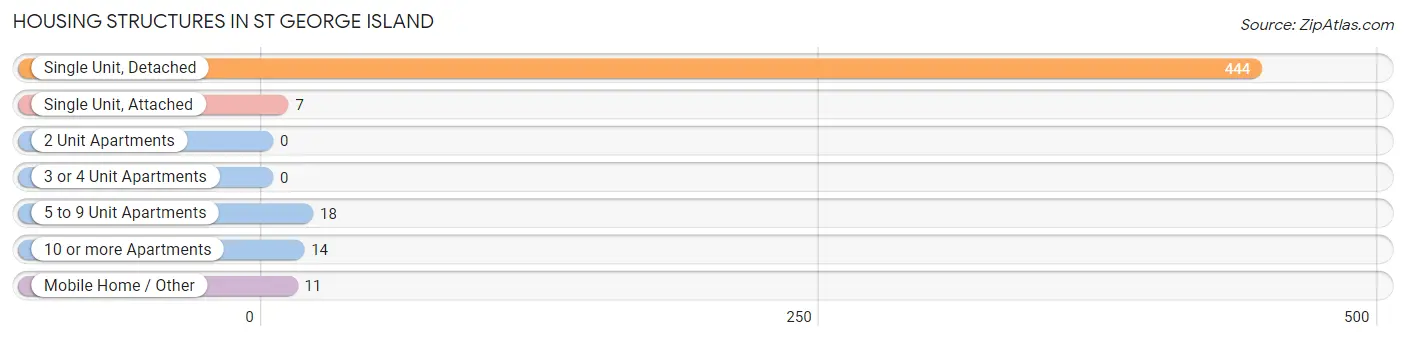
| Structure Type | # Housing Units | % Housing Units |
| Single Unit, Detached | 444 | 89.9% |
| Single Unit, Attached | 7 | 1.4% |
| 2 Unit Apartments | 0 | 0.0% |
| 3 or 4 Unit Apartments | 0 | 0.0% |
| 5 to 9 Unit Apartments | 18 | 3.6% |
| 10 or more Apartments | 14 | 2.8% |
| Mobile Home / Other | 11 | 2.2% |
| Total | 494 | 100.0% |
Housing Structures by Occupancy in St George Island
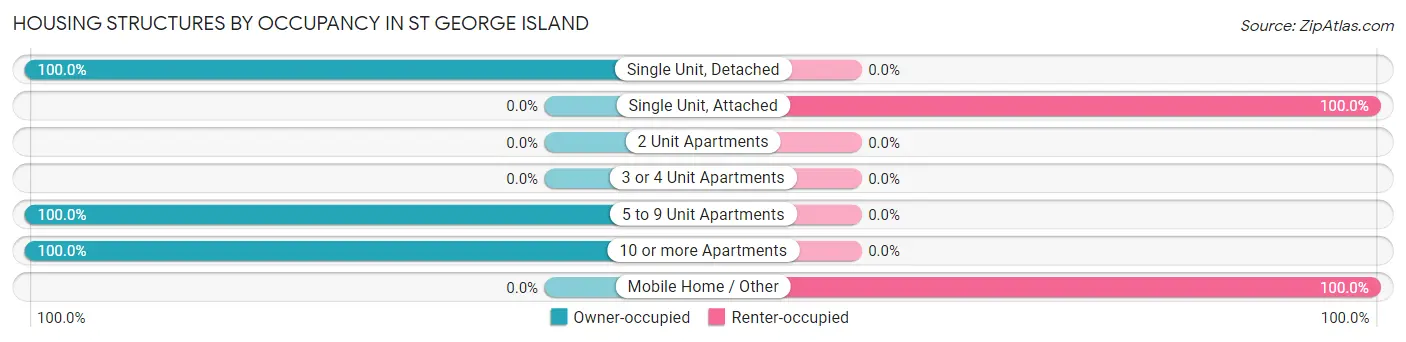
| Structure Type | Owner-occupied | Renter-occupied |
| Single Unit, Detached | 444 (100.0%) | 0 (0.0%) |
| Single Unit, Attached | 0 (0.0%) | 7 (100.0%) |
| 2 Unit Apartments | 0 (0.0%) | 0 (0.0%) |
| 3 or 4 Unit Apartments | 0 (0.0%) | 0 (0.0%) |
| 5 to 9 Unit Apartments | 18 (100.0%) | 0 (0.0%) |
| 10 or more Apartments | 14 (100.0%) | 0 (0.0%) |
| Mobile Home / Other | 0 (0.0%) | 11 (100.0%) |
| Total | 476 (96.4%) | 18 (3.6%) |
Housing Structures by Number of Rooms in St George Island
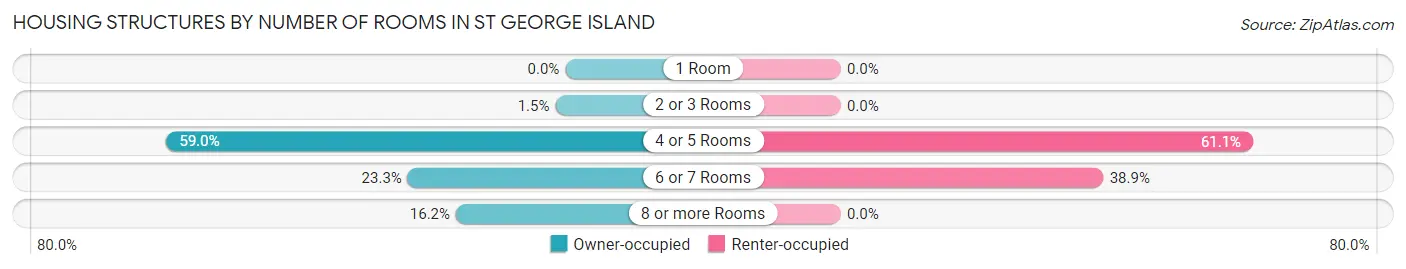
| Number of Rooms | Owner-occupied | Renter-occupied |
| 1 Room | 0 (0.0%) | 0 (0.0%) |
| 2 or 3 Rooms | 7 (1.5%) | 0 (0.0%) |
| 4 or 5 Rooms | 281 (59.0%) | 11 (61.1%) |
| 6 or 7 Rooms | 111 (23.3%) | 7 (38.9%) |
| 8 or more Rooms | 77 (16.2%) | 0 (0.0%) |
| Total | 476 (100.0%) | 18 (100.0%) |
Housing Structure by Heating Type in St George Island
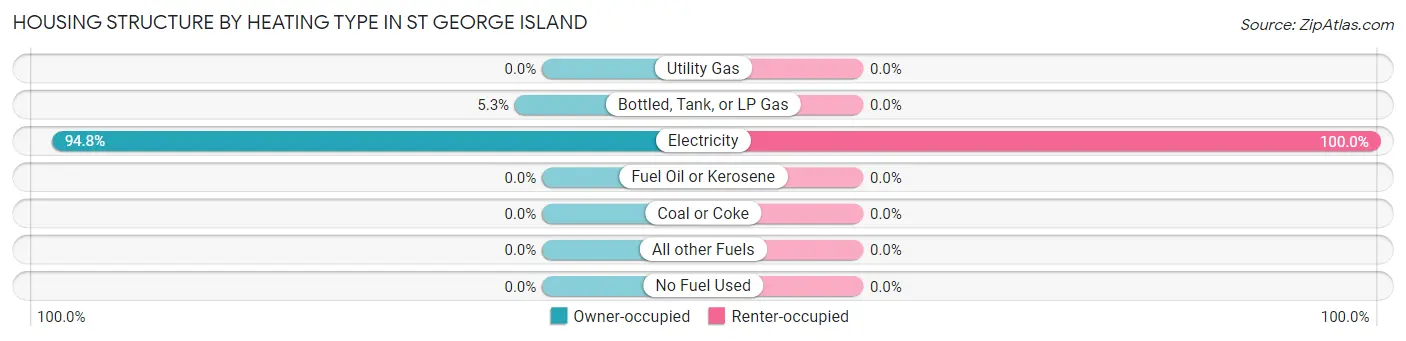
| Heating Type | Owner-occupied | Renter-occupied |
| Utility Gas | 0 (0.0%) | 0 (0.0%) |
| Bottled, Tank, or LP Gas | 25 (5.2%) | 0 (0.0%) |
| Electricity | 451 (94.8%) | 18 (100.0%) |
| Fuel Oil or Kerosene | 0 (0.0%) | 0 (0.0%) |
| Coal or Coke | 0 (0.0%) | 0 (0.0%) |
| All other Fuels | 0 (0.0%) | 0 (0.0%) |
| No Fuel Used | 0 (0.0%) | 0 (0.0%) |
| Total | 476 (100.0%) | 18 (100.0%) |
Household Vehicle Usage in St George Island
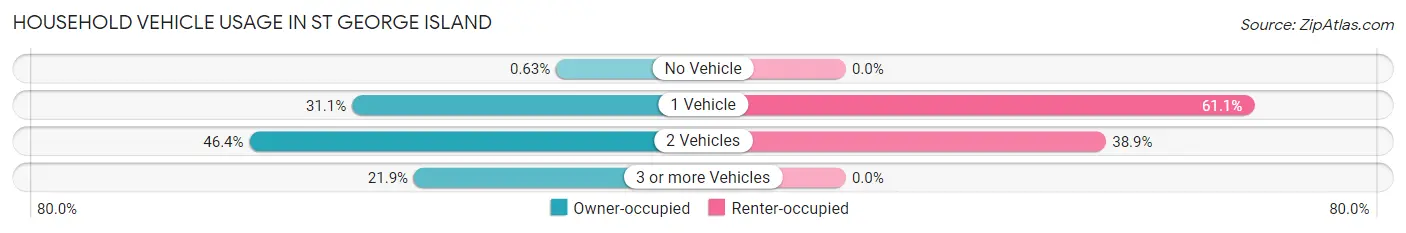
| Vehicles per Household | Owner-occupied | Renter-occupied |
| No Vehicle | 3 (0.6%) | 0 (0.0%) |
| 1 Vehicle | 148 (31.1%) | 11 (61.1%) |
| 2 Vehicles | 221 (46.4%) | 7 (38.9%) |
| 3 or more Vehicles | 104 (21.8%) | 0 (0.0%) |
| Total | 476 (100.0%) | 18 (100.0%) |
Real Estate & Mortgages in St George Island
Real Estate and Mortgage Overview in St George Island
| Characteristic | Without Mortgage | With Mortgage |
| Housing Units | 290 | 186 |
| Median Property Value | $609,400 | $536,700 |
| Median Household Income | $71,250 | $62 |
| Monthly Housing Costs | $895 | $77 |
| Real Estate Taxes | $3,679 | $0 |
Property Value by Mortgage Status in St George Island
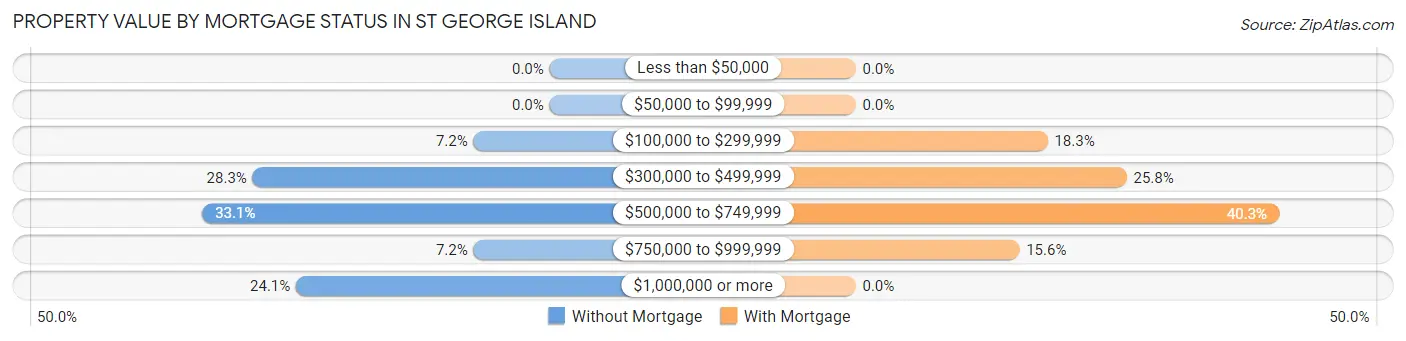
| Property Value | Without Mortgage | With Mortgage |
| Less than $50,000 | 0 (0.0%) | 0 (0.0%) |
| $50,000 to $99,999 | 0 (0.0%) | 0 (0.0%) |
| $100,000 to $299,999 | 21 (7.2%) | 34 (18.3%) |
| $300,000 to $499,999 | 82 (28.3%) | 48 (25.8%) |
| $500,000 to $749,999 | 96 (33.1%) | 75 (40.3%) |
| $750,000 to $999,999 | 21 (7.2%) | 29 (15.6%) |
| $1,000,000 or more | 70 (24.1%) | 0 (0.0%) |
| Total | 290 (100.0%) | 186 (100.0%) |
Household Income by Mortgage Status in St George Island
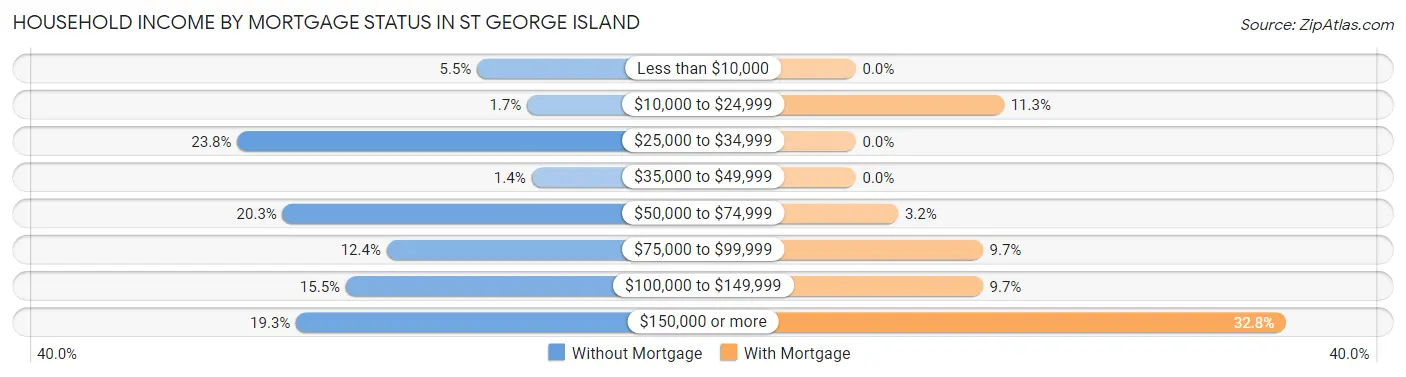
| Household Income | Without Mortgage | With Mortgage |
| Less than $10,000 | 16 (5.5%) | 0 (0.0%) |
| $10,000 to $24,999 | 5 (1.7%) | 21 (11.3%) |
| $25,000 to $34,999 | 69 (23.8%) | 0 (0.0%) |
| $35,000 to $49,999 | 4 (1.4%) | 0 (0.0%) |
| $50,000 to $74,999 | 59 (20.3%) | 6 (3.2%) |
| $75,000 to $99,999 | 36 (12.4%) | 18 (9.7%) |
| $100,000 to $149,999 | 45 (15.5%) | 18 (9.7%) |
| $150,000 or more | 56 (19.3%) | 61 (32.8%) |
| Total | 290 (100.0%) | 186 (100.0%) |
Property Value to Household Income Ratio in St George Island
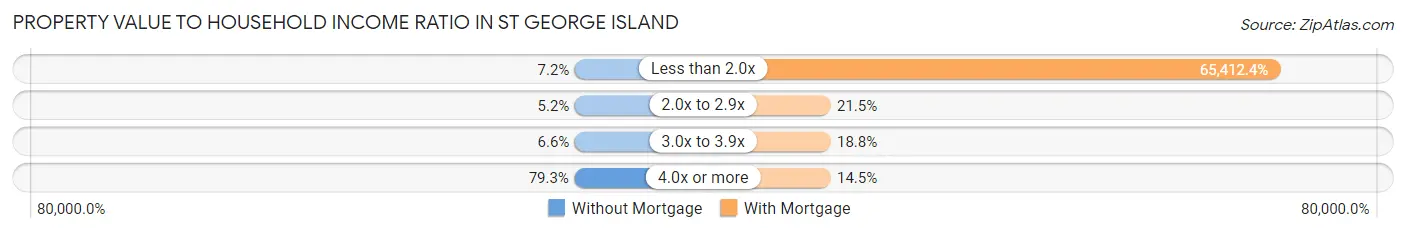
| Value-to-Income Ratio | Without Mortgage | With Mortgage |
| Less than 2.0x | 21 (7.2%) | 121,667 (65,412.4%) |
| 2.0x to 2.9x | 15 (5.2%) | 40 (21.5%) |
| 3.0x to 3.9x | 19 (6.6%) | 35 (18.8%) |
| 4.0x or more | 230 (79.3%) | 27 (14.5%) |
| Total | 290 (100.0%) | 186 (100.0%) |
Real Estate Taxes by Mortgage Status in St George Island
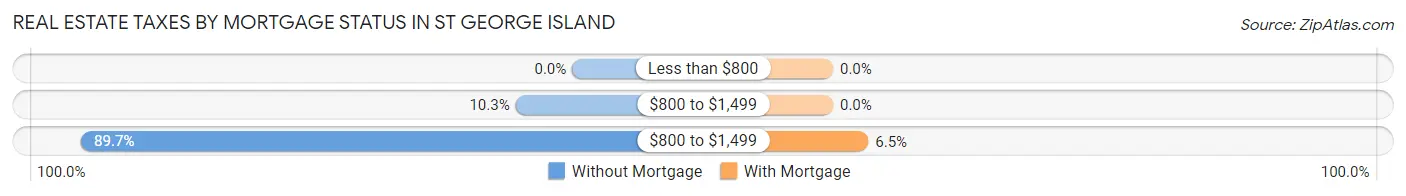
| Property Taxes | Without Mortgage | With Mortgage |
| Less than $800 | 0 (0.0%) | 0 (0.0%) |
| $800 to $1,499 | 30 (10.3%) | 0 (0.0%) |
| $800 to $1,499 | 260 (89.7%) | 12 (6.5%) |
| Total | 290 (100.0%) | 186 (100.0%) |
Health & Disability in St George Island
Health Insurance Coverage by Age in St George Island
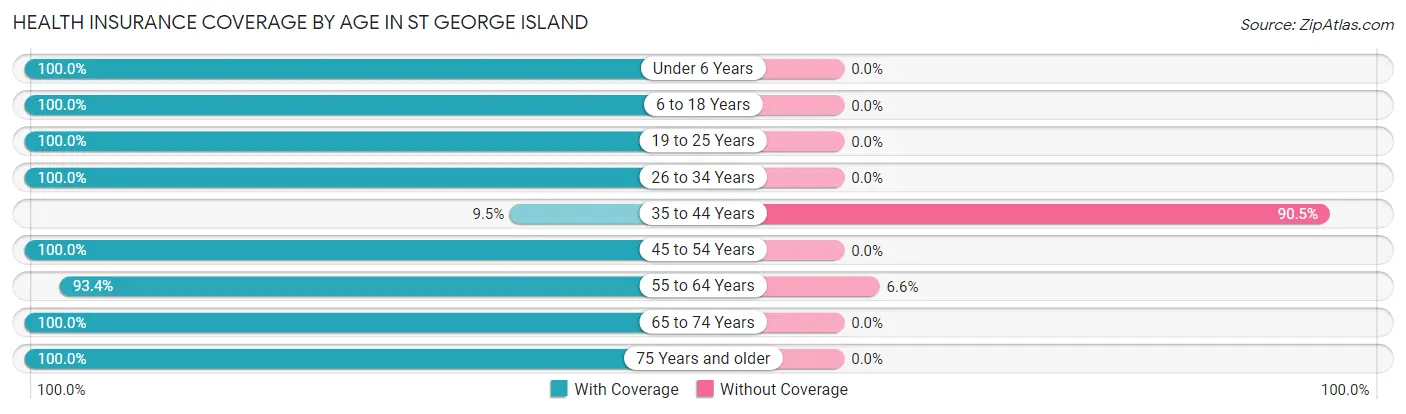
| Age Bracket | With Coverage | Without Coverage |
| Under 6 Years | 9 (100.0%) | 0 (0.0%) |
| 6 to 18 Years | 80 (100.0%) | 0 (0.0%) |
| 19 to 25 Years | 10 (100.0%) | 0 (0.0%) |
| 26 to 34 Years | 6 (100.0%) | 0 (0.0%) |
| 35 to 44 Years | 7 (9.5%) | 67 (90.5%) |
| 45 to 54 Years | 80 (100.0%) | 0 (0.0%) |
| 55 to 64 Years | 241 (93.4%) | 17 (6.6%) |
| 65 to 74 Years | 325 (100.0%) | 0 (0.0%) |
| 75 Years and older | 128 (100.0%) | 0 (0.0%) |
| Total | 886 (91.3%) | 84 (8.7%) |
Health Insurance Coverage by Citizenship Status in St George Island
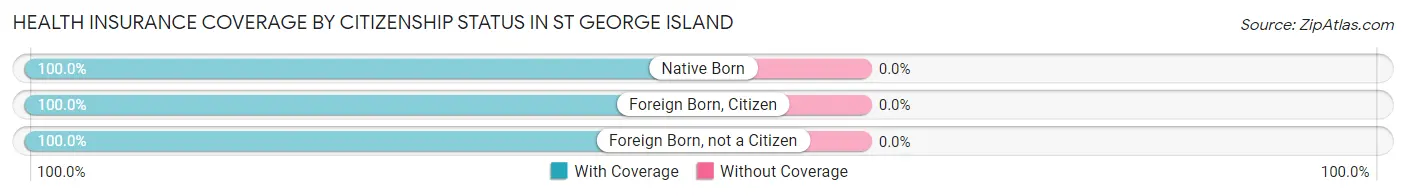
| Citizenship Status | With Coverage | Without Coverage |
| Native Born | 9 (100.0%) | 0 (0.0%) |
| Foreign Born, Citizen | 80 (100.0%) | 0 (0.0%) |
| Foreign Born, not a Citizen | 10 (100.0%) | 0 (0.0%) |
Health Insurance Coverage by Household Income in St George Island
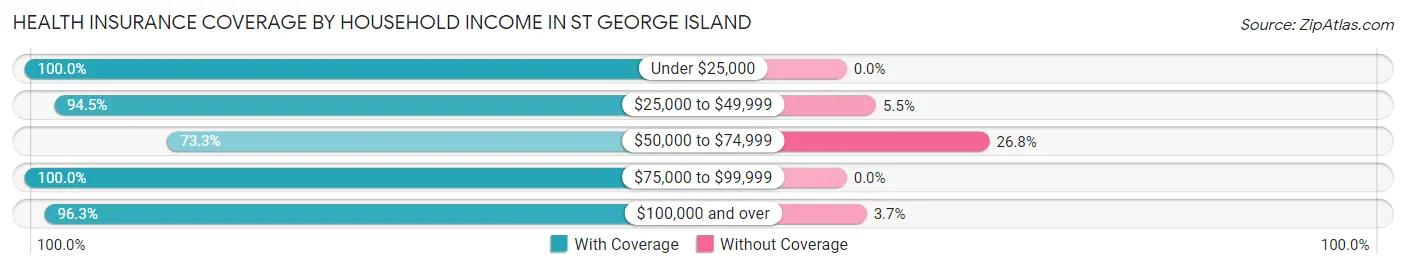
| Household Income | With Coverage | Without Coverage |
| Under $25,000 | 54 (100.0%) | 0 (0.0%) |
| $25,000 to $49,999 | 103 (94.5%) | 6 (5.5%) |
| $50,000 to $74,999 | 167 (73.3%) | 61 (26.8%) |
| $75,000 to $99,999 | 123 (100.0%) | 0 (0.0%) |
| $100,000 and over | 439 (96.3%) | 17 (3.7%) |
Public vs Private Health Insurance Coverage by Age in St George Island
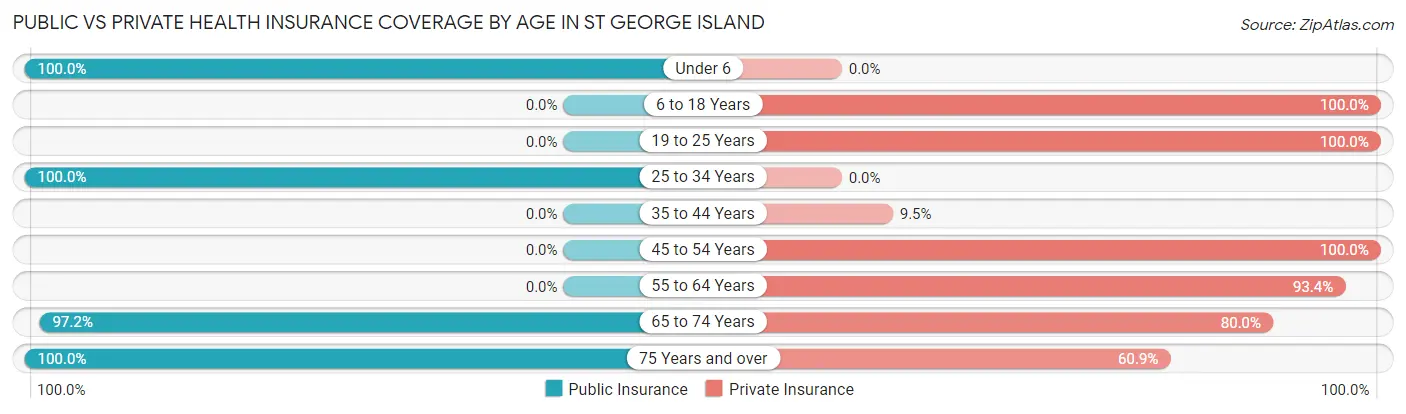
| Age Bracket | Public Insurance | Private Insurance |
| Under 6 | 9 (100.0%) | 0 (0.0%) |
| 6 to 18 Years | 0 (0.0%) | 80 (100.0%) |
| 19 to 25 Years | 0 (0.0%) | 10 (100.0%) |
| 25 to 34 Years | 6 (100.0%) | 0 (0.0%) |
| 35 to 44 Years | 0 (0.0%) | 7 (9.5%) |
| 45 to 54 Years | 0 (0.0%) | 80 (100.0%) |
| 55 to 64 Years | 0 (0.0%) | 241 (93.4%) |
| 65 to 74 Years | 316 (97.2%) | 260 (80.0%) |
| 75 Years and over | 128 (100.0%) | 78 (60.9%) |
| Total | 459 (47.3%) | 756 (77.9%) |
Disability Status by Sex by Age in St George Island
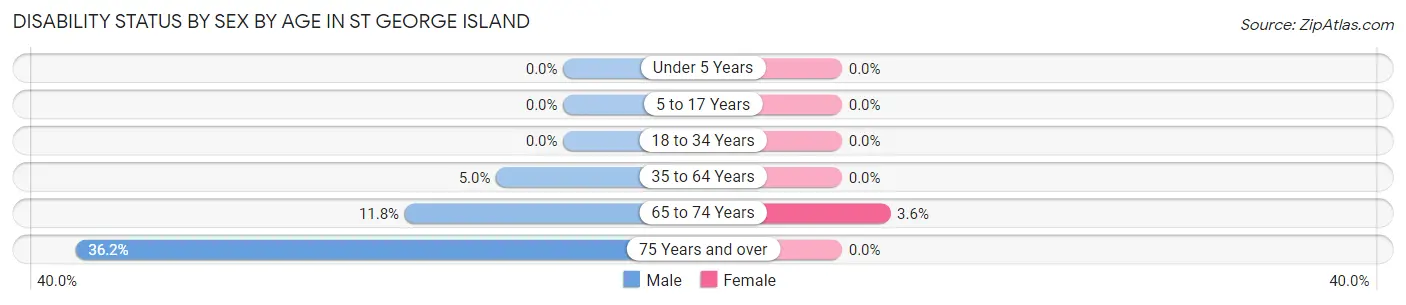
| Age Bracket | Male | Female |
| Under 5 Years | 0 (0.0%) | 0 (0.0%) |
| 5 to 17 Years | 0 (0.0%) | 0 (0.0%) |
| 18 to 34 Years | 0 (0.0%) | 0 (0.0%) |
| 35 to 64 Years | 12 (5.0%) | 0 (0.0%) |
| 65 to 74 Years | 12 (11.8%) | 8 (3.6%) |
| 75 Years and over | 25 (36.2%) | 0 (0.0%) |
Disability Class by Sex by Age in St George Island
Disability Class: Hearing Difficulty
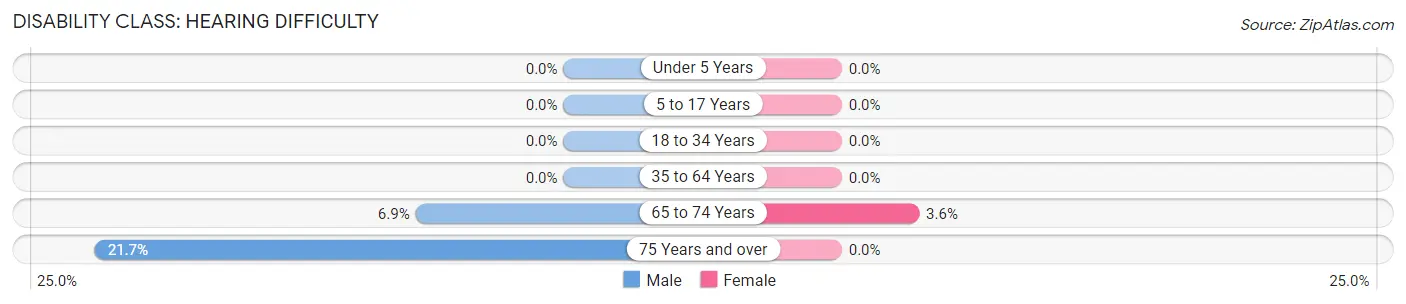
| Age Bracket | Male | Female |
| Under 5 Years | 0 (0.0%) | 0 (0.0%) |
| 5 to 17 Years | 0 (0.0%) | 0 (0.0%) |
| 18 to 34 Years | 0 (0.0%) | 0 (0.0%) |
| 35 to 64 Years | 0 (0.0%) | 0 (0.0%) |
| 65 to 74 Years | 7 (6.9%) | 8 (3.6%) |
| 75 Years and over | 15 (21.7%) | 0 (0.0%) |
Disability Class: Vision Difficulty
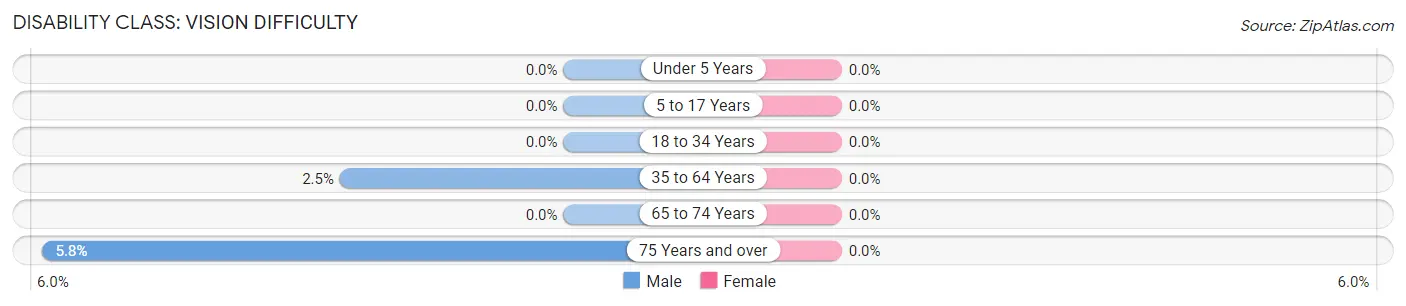
| Age Bracket | Male | Female |
| Under 5 Years | 0 (0.0%) | 0 (0.0%) |
| 5 to 17 Years | 0 (0.0%) | 0 (0.0%) |
| 18 to 34 Years | 0 (0.0%) | 0 (0.0%) |
| 35 to 64 Years | 6 (2.5%) | 0 (0.0%) |
| 65 to 74 Years | 0 (0.0%) | 0 (0.0%) |
| 75 Years and over | 4 (5.8%) | 0 (0.0%) |
Disability Class: Cognitive Difficulty
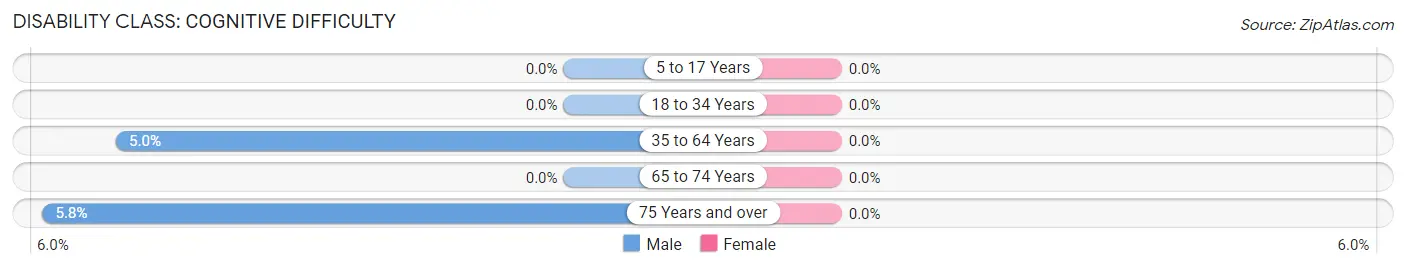
| Age Bracket | Male | Female |
| 5 to 17 Years | 0 (0.0%) | 0 (0.0%) |
| 18 to 34 Years | 0 (0.0%) | 0 (0.0%) |
| 35 to 64 Years | 12 (5.0%) | 0 (0.0%) |
| 65 to 74 Years | 0 (0.0%) | 0 (0.0%) |
| 75 Years and over | 4 (5.8%) | 0 (0.0%) |
Disability Class: Ambulatory Difficulty
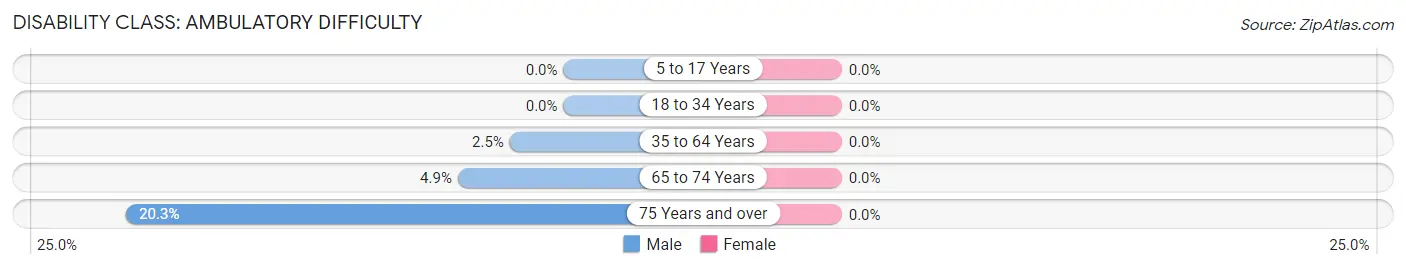
| Age Bracket | Male | Female |
| 5 to 17 Years | 0 (0.0%) | 0 (0.0%) |
| 18 to 34 Years | 0 (0.0%) | 0 (0.0%) |
| 35 to 64 Years | 6 (2.5%) | 0 (0.0%) |
| 65 to 74 Years | 5 (4.9%) | 0 (0.0%) |
| 75 Years and over | 14 (20.3%) | 0 (0.0%) |
Disability Class: Self-Care Difficulty
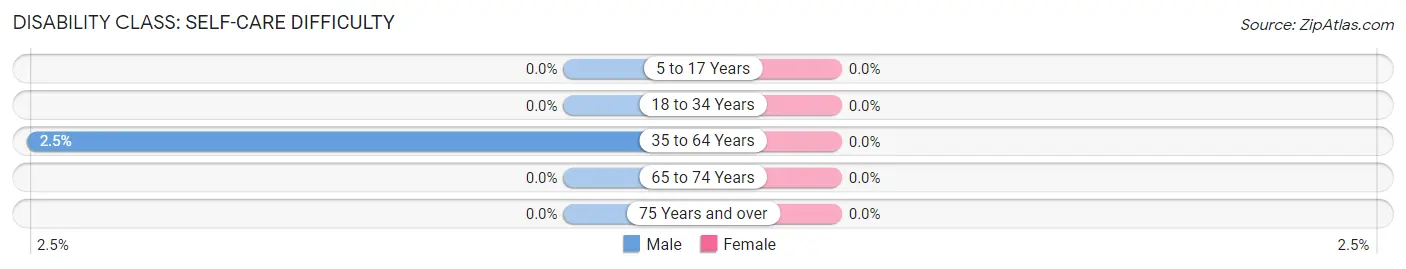
| Age Bracket | Male | Female |
| 5 to 17 Years | 0 (0.0%) | 0 (0.0%) |
| 18 to 34 Years | 0 (0.0%) | 0 (0.0%) |
| 35 to 64 Years | 6 (2.5%) | 0 (0.0%) |
| 65 to 74 Years | 0 (0.0%) | 0 (0.0%) |
| 75 Years and over | 0 (0.0%) | 0 (0.0%) |
Technology Access in St George Island
Computing Device Access in St George Island
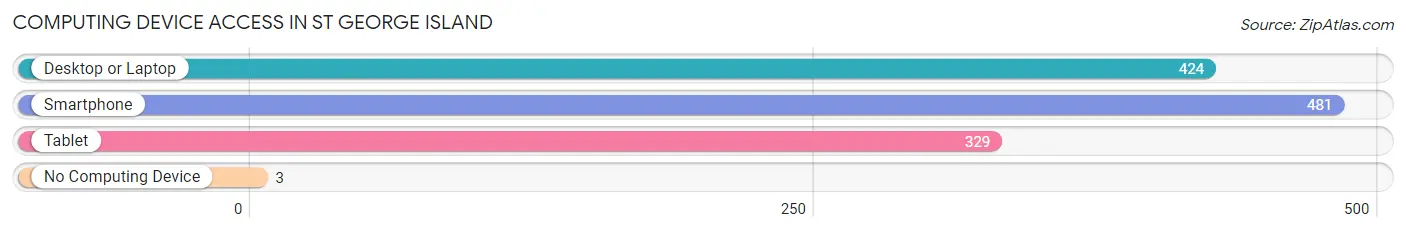
| Device Type | # Households | % Households |
| Desktop or Laptop | 424 | 85.8% |
| Smartphone | 481 | 97.4% |
| Tablet | 329 | 66.6% |
| No Computing Device | 3 | 0.6% |
| Total | 494 | 100.0% |
Internet Access in St George Island
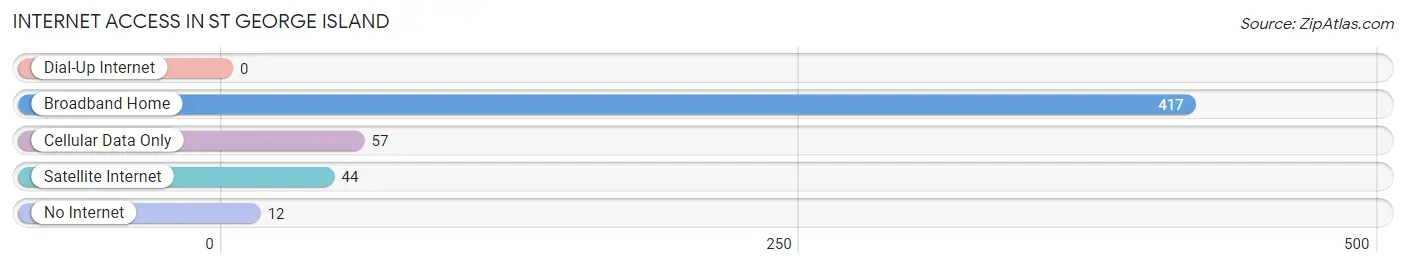
| Internet Type | # Households | % Households |
| Dial-Up Internet | 0 | 0.0% |
| Broadband Home | 417 | 84.4% |
| Cellular Data Only | 57 | 11.5% |
| Satellite Internet | 44 | 8.9% |
| No Internet | 12 | 2.4% |
| Total | 494 | 100.0% |
St George Island Summary
St. George Island is a barrier island located in the Gulf of Mexico off the coast of Florida. It is part of Franklin County, Florida and is located approximately 30 miles south of Apalachicola. The island is approximately 28 miles long and 1.5 miles wide, and is connected to the mainland by a bridge.
History
The history of St. George Island dates back to the early 1700s when the Spanish first explored the area. The island was named after St. George, the patron saint of England, by the British who settled the area in the late 1700s. The island was used as a base for the British Navy during the War of 1812.
In the late 1800s, the island was used as a base for the United States Coast Guard. The island was also used as a base for the United States Navy during World War II.
In the 1950s, the island was developed as a resort destination. The first hotel was built in 1954 and the island quickly became a popular destination for tourists.
Geography
St. George Island is located in the Gulf of Mexico off the coast of Florida. It is part of Franklin County, Florida and is located approximately 30 miles south of Apalachicola. The island is approximately 28 miles long and 1.5 miles wide, and is connected to the mainland by a bridge.
The island is composed of white sand beaches, dunes, and salt marshes. The island is surrounded by the Gulf of Mexico to the south and east, and the Apalachicola Bay to the north and west.
The climate of St. George Island is subtropical, with hot, humid summers and mild winters. The average temperature in the summer is around 85°F and the average temperature in the winter is around 65°F.
Economy
The economy of St. George Island is largely based on tourism. The island is a popular destination for beachgoers, fishermen, and nature lovers. The island is home to several resorts, restaurants, and shops.
The island is also home to several commercial fishing operations. The island is known for its oyster beds, which are harvested for their meat and shells.
Demographics
As of the 2010 census, the population of St. George Island was 1,567. The population is largely white (94.3%) and the median age is 54. The median household income is $50,000 and the median home value is $400,000.
Conclusion
St. George Island is a beautiful barrier island located in the Gulf of Mexico off the coast of Florida. The island has a rich history and is a popular destination for tourists and nature lovers. The economy of the island is largely based on tourism and commercial fishing. The population of the island is largely white and the median age is 54.
Common Questions
What is the Total Population of St George Island?
Total Population of St George Island is 970.
What is the Total Male Population of St George Island?
Total Male Population of St George Island is 507.
What is the Total Female Population of St George Island?
Total Female Population of St George Island is 463.
What is the Ratio of Males per 100 Females in St George Island?
There are 109.50 Males per 100 Females in St George Island.
What is the Ratio of Females per 100 Males in St George Island?
There are 91.32 Females per 100 Males in St George Island.
What is the Median Population Age in St George Island?
Median Population Age in St George Island is 63.9 Years.
What is the Average Family Size in St George Island
Average Family Size in St George Island is 2.3 People.
What is the Average Household Size in St George Island
Average Household Size in St George Island is 2.0 People.
What is Per Capita Income in St George Island?
Per Capita income in St George Island is $66,670.
What is the Median Family Income in St George Island?
Median Family Income in St George Island is $121,324.
What is the Median Household income in St George Island?
Median Household Income in St George Island is $90,000.
What is Inequality or Gini Index in St George Island?
Inequality or Gini Index in St George Island is 0.49.
How Large is the Labor Force in St George Island?
There are 438 People in the Labor Forcein in St George Island.
What is the Percentage of People in the Labor Force in St George Island?
46.7% of People are in the Labor Force in St George Island.