Etowah, TN
Etowah Map
Etowah Overview
3,614
TOTAL POPULATION
1,872
MALE POPULATION
1,742
FEMALE POPULATION
107.46
MALES / 100 FEMALES
93.06
FEMALES / 100 MALES
40.7
MEDIAN AGE
3.2
AVG FAMILY SIZE
2.5
AVG HOUSEHOLD SIZE
$29,007
PER CAPITA INCOME
$57,656
AVG FAMILY INCOME
$42,571
AVG HOUSEHOLD INCOME
56.4%
WAGE / INCOME GAP [ % ]
43.6¢/ $1
WAGE / INCOME GAP [ $ ]
0.55
INEQUALITY / GINI INDEX
1,522
LABOR FORCE [ PEOPLE ]
54.7%
PERCENT IN LABOR FORCE
18.1%
UNEMPLOYMENT RATE
Etowah Zip Codes
Etowah Area Codes
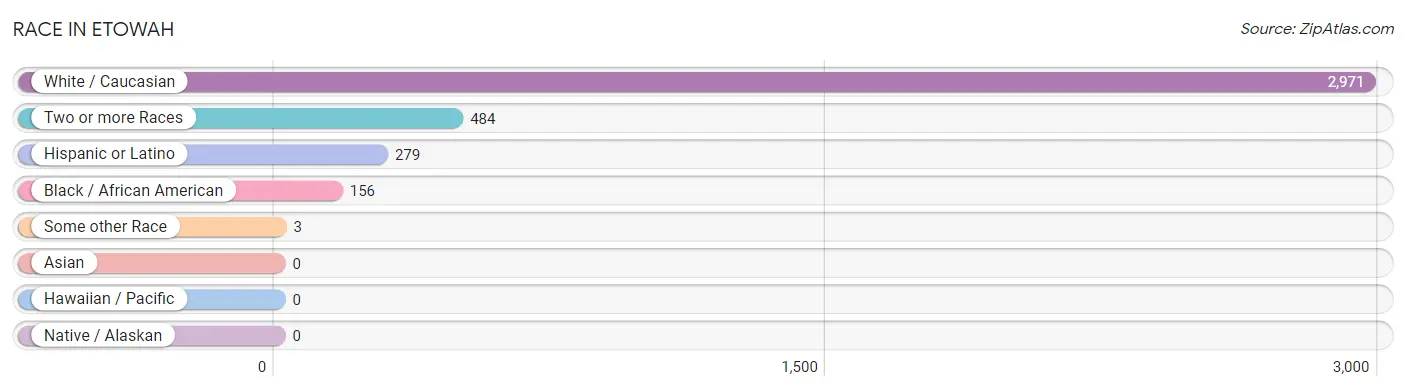
Race in Etowah
The most populous races in Etowah are White / Caucasian (2,971 | 82.2%), Two or more Races (484 | 13.4%), and Hispanic or Latino (279 | 7.7%).
| Race | # Population | % Population |
| Asian | 0 | 0.0% |
| Black / African American | 156 | 4.3% |
| Hawaiian / Pacific | 0 | 0.0% |
| Hispanic or Latino | 279 | 7.7% |
| Native / Alaskan | 0 | 0.0% |
| White / Caucasian | 2,971 | 82.2% |
| Two or more Races | 484 | 13.4% |
| Some other Race | 3 | 0.1% |
| Total | 3,614 | 100.0% |
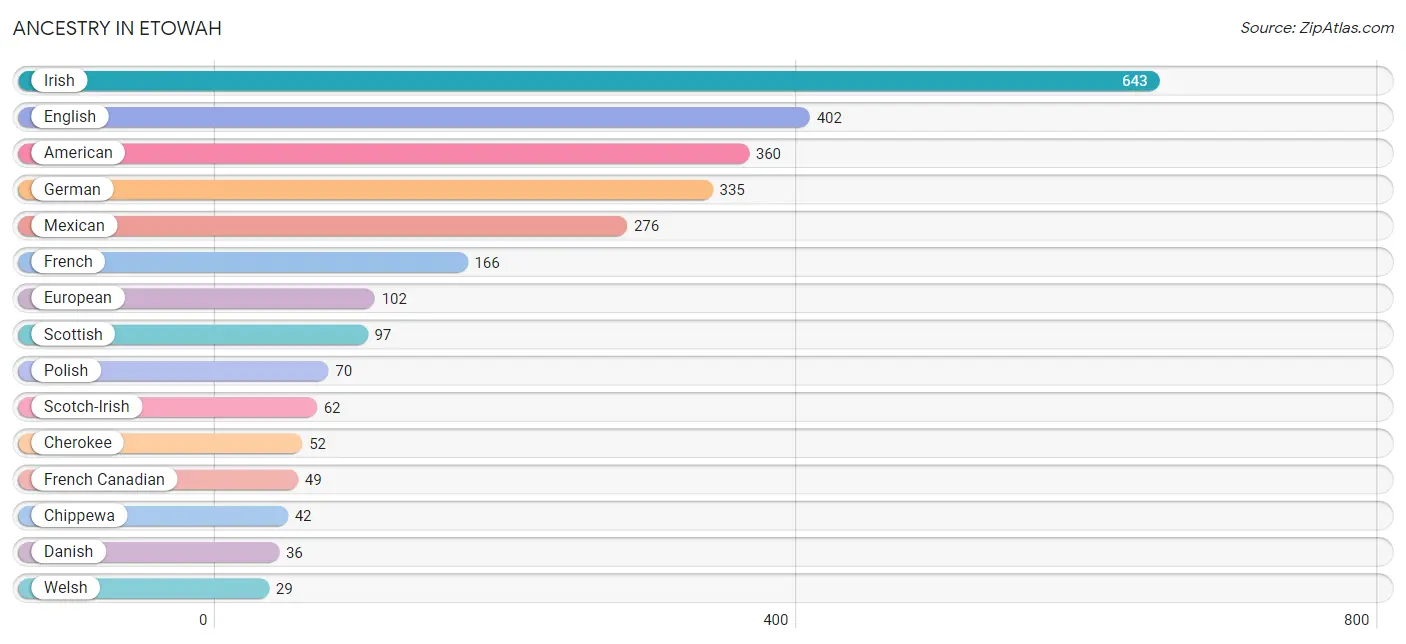
Ancestry in Etowah
The most populous ancestries reported in Etowah are Irish (643 | 17.8%), English (402 | 11.1%), American (360 | 10.0%), German (335 | 9.3%), and Mexican (276 | 7.6%), together accounting for 55.8% of all Etowah residents.
| Ancestry | # Population | % Population |
| American | 360 | 10.0% |
| Arab | 8 | 0.2% |
| British | 13 | 0.4% |
| Cherokee | 52 | 1.4% |
| Chippewa | 42 | 1.2% |
| Danish | 36 | 1.0% |
| English | 402 | 11.1% |
| European | 102 | 2.8% |
| French | 166 | 4.6% |
| French Canadian | 49 | 1.4% |
| German | 335 | 9.3% |
| Irish | 643 | 17.8% |
| Italian | 15 | 0.4% |
| Lebanese | 8 | 0.2% |
| Mexican | 276 | 7.6% |
| Norwegian | 12 | 0.3% |
| Polish | 70 | 1.9% |
| Puerto Rican | 2 | 0.1% |
| Scandinavian | 2 | 0.1% |
| Scotch-Irish | 62 | 1.7% |
| Scottish | 97 | 2.7% |
| Welsh | 29 | 0.8% | View All 22 Rows |
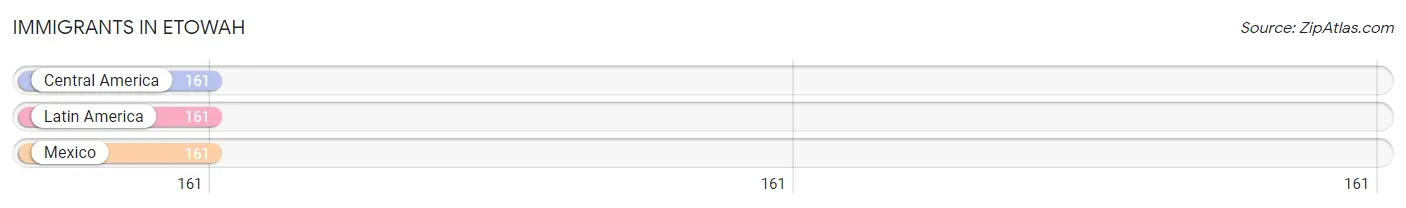
Immigrants in Etowah
The most numerous immigrant groups reported in Etowah came from Central America (161 | 4.4%), Latin America (161 | 4.4%), and Mexico (161 | 4.4%), together accounting for 13.4% of all Etowah residents.
| Immigration Origin | # Population | % Population |
| Central America | 161 | 4.4% |
| Latin America | 161 | 4.4% |
| Mexico | 161 | 4.4% | View All 3 Rows |
Sex and Age in Etowah
Sex and Age in Etowah
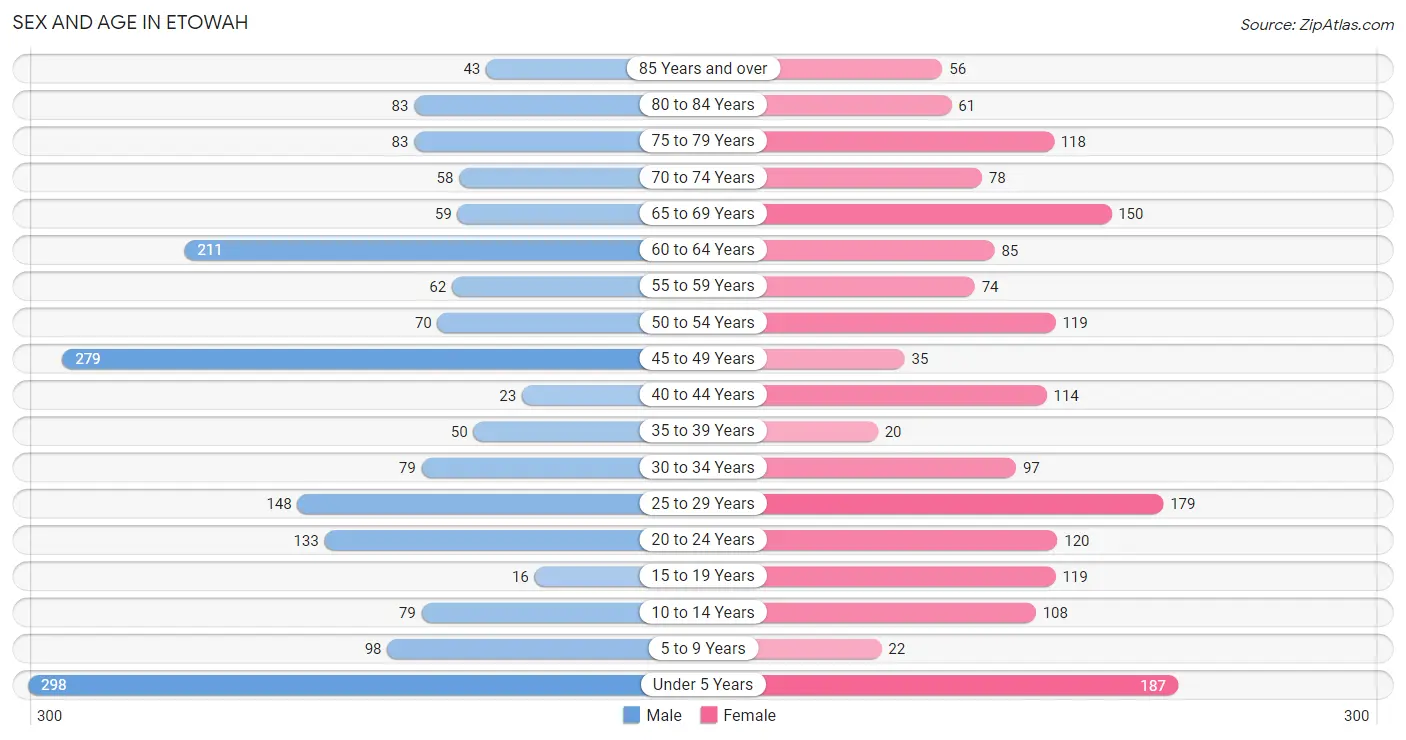
The most populous age groups in Etowah are Under 5 Years (298 | 15.9%) for men and Under 5 Years (187 | 10.7%) for women.
| Age Bracket | Male | Female |
| Under 5 Years | 298 (15.9%) | 187 (10.7%) |
| 5 to 9 Years | 98 (5.2%) | 22 (1.3%) |
| 10 to 14 Years | 79 (4.2%) | 108 (6.2%) |
| 15 to 19 Years | 16 (0.9%) | 119 (6.8%) |
| 20 to 24 Years | 133 (7.1%) | 120 (6.9%) |
| 25 to 29 Years | 148 (7.9%) | 179 (10.3%) |
| 30 to 34 Years | 79 (4.2%) | 97 (5.6%) |
| 35 to 39 Years | 50 (2.7%) | 20 (1.1%) |
| 40 to 44 Years | 23 (1.2%) | 114 (6.5%) |
| 45 to 49 Years | 279 (14.9%) | 35 (2.0%) |
| 50 to 54 Years | 70 (3.7%) | 119 (6.8%) |
| 55 to 59 Years | 62 (3.3%) | 74 (4.3%) |
| 60 to 64 Years | 211 (11.3%) | 85 (4.9%) |
| 65 to 69 Years | 59 (3.2%) | 150 (8.6%) |
| 70 to 74 Years | 58 (3.1%) | 78 (4.5%) |
| 75 to 79 Years | 83 (4.4%) | 118 (6.8%) |
| 80 to 84 Years | 83 (4.4%) | 61 (3.5%) |
| 85 Years and over | 43 (2.3%) | 56 (3.2%) |
| Total | 1,872 (100.0%) | 1,742 (100.0%) |
Families and Households in Etowah
Median Family Size in Etowah
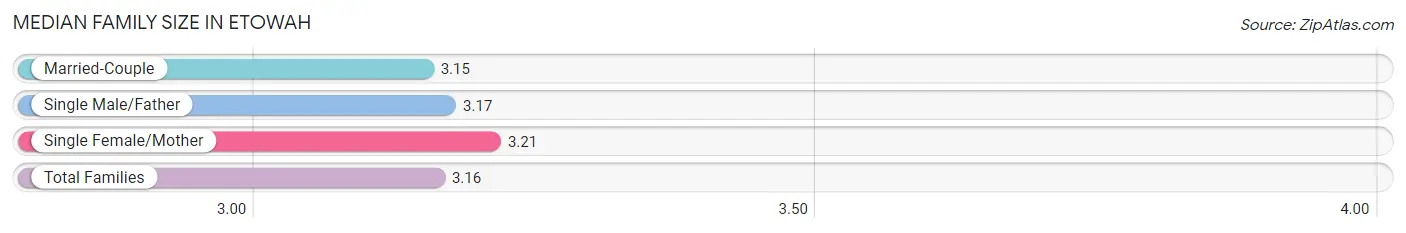
The median family size in Etowah is 3.16 persons per family, with single female/mother families (107 | 12.7%) accounting for the largest median family size of 3.21 persons per family. On the other hand, married-couple families (604 | 71.7%) represent the smallest median family size with 3.15 persons per family.
| Family Type | # Families | Family Size |
| Married-Couple | 604 (71.7%) | 3.15 |
| Single Male/Father | 131 (15.6%) | 3.17 |
| Single Female/Mother | 107 (12.7%) | 3.21 |
| Total Families | 842 (100.0%) | 3.16 |
Median Household Size in Etowah
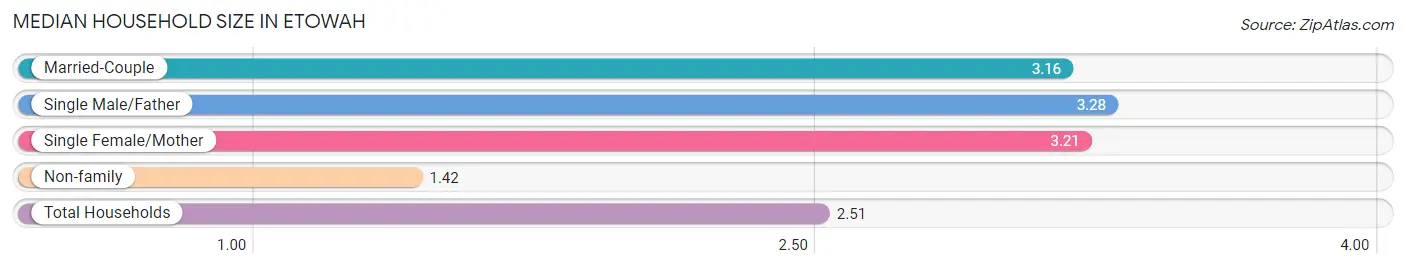
The median household size in Etowah is 2.51 persons per household, with single male/father households (131 | 9.6%) accounting for the largest median household size of 3.28 persons per household. non-family households (517 | 38.0%) represent the smallest median household size with 1.42 persons per household.
| Household Type | # Households | Household Size |
| Married-Couple | 604 (44.4%) | 3.16 |
| Single Male/Father | 131 (9.6%) | 3.28 |
| Single Female/Mother | 107 (7.9%) | 3.21 |
| Non-family | 517 (38.0%) | 1.42 |
| Total Households | 1,359 (100.0%) | 2.51 |
Household Size by Marriage Status in Etowah
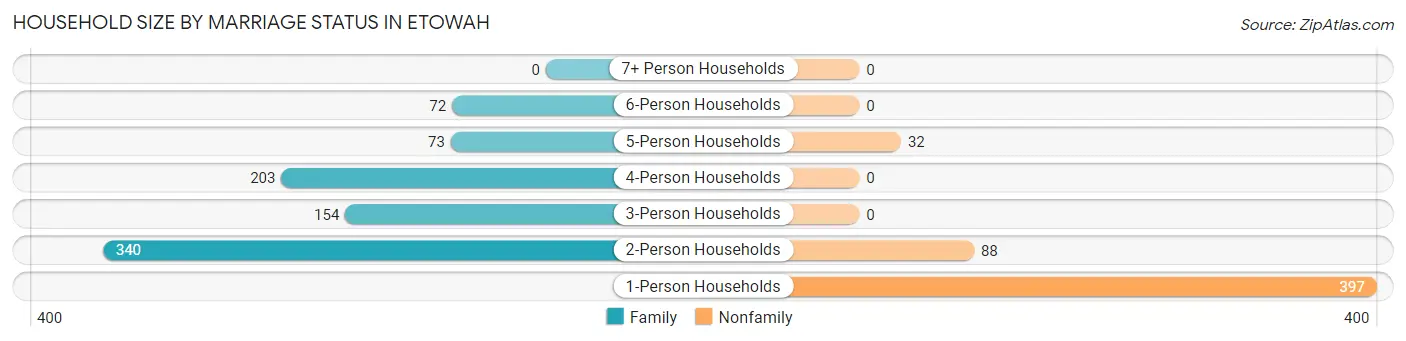
Out of a total of 1,359 households in Etowah, 842 (62.0%) are family households, while 517 (38.0%) are nonfamily households. The most numerous type of family households are 2-person households, comprising 340, and the most common type of nonfamily households are 1-person households, comprising 397.
| Household Size | Family Households | Nonfamily Households |
| 1-Person Households | - | 397 (29.2%) |
| 2-Person Households | 340 (25.0%) | 88 (6.5%) |
| 3-Person Households | 154 (11.3%) | 0 (0.0%) |
| 4-Person Households | 203 (14.9%) | 0 (0.0%) |
| 5-Person Households | 73 (5.4%) | 32 (2.4%) |
| 6-Person Households | 72 (5.3%) | 0 (0.0%) |
| 7+ Person Households | 0 (0.0%) | 0 (0.0%) |
| Total | 842 (62.0%) | 517 (38.0%) |
Female Fertility in Etowah
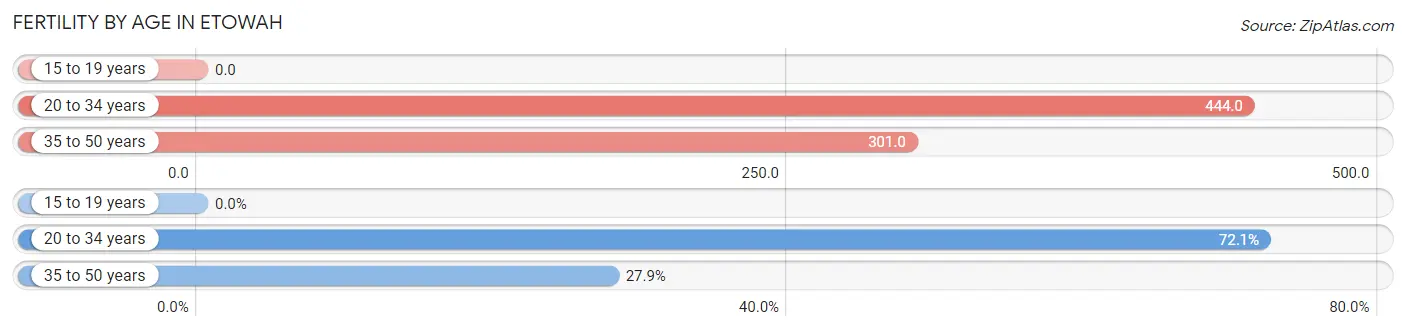
Fertility by Age in Etowah
Average fertility rate in Etowah is 329.0 births per 1,000 women. Women in the age bracket of 20 to 34 years have the highest fertility rate with 444.0 births per 1,000 women. Women in the age bracket of 20 to 34 years acount for 72.1% of all women with births.
| Age Bracket | Women with Births | Births / 1,000 Women |
| 15 to 19 years | 0 (0.0%) | 0.0 |
| 20 to 34 years | 176 (72.1%) | 444.0 |
| 35 to 50 years | 68 (27.9%) | 301.0 |
| Total | 244 (100.0%) | 329.0 |
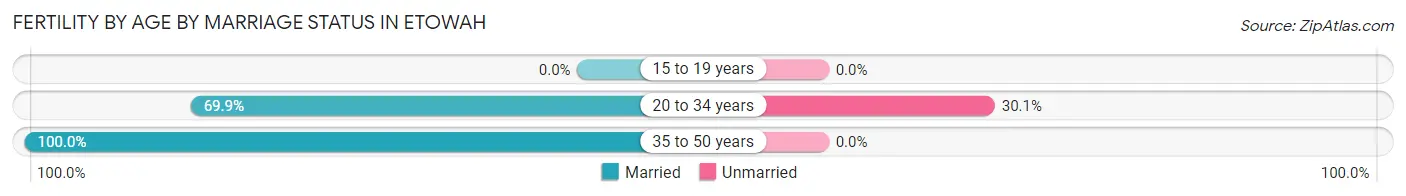
Fertility by Age by Marriage Status in Etowah
78.3% of women with births (244) in Etowah are married. The highest percentage of unmarried women with births falls into 20 to 34 years age bracket with 30.1% of them unmarried at the time of birth, while the lowest percentage of unmarried women with births belong to 35 to 50 years age bracket with 0.0% of them unmarried.
| Age Bracket | Married | Unmarried |
| 15 to 19 years | 0 (0.0%) | 0 (0.0%) |
| 20 to 34 years | 123 (69.9%) | 53 (30.1%) |
| 35 to 50 years | 68 (100.0%) | 0 (0.0%) |
| Total | 191 (78.3%) | 53 (21.7%) |
Fertility by Education in Etowah
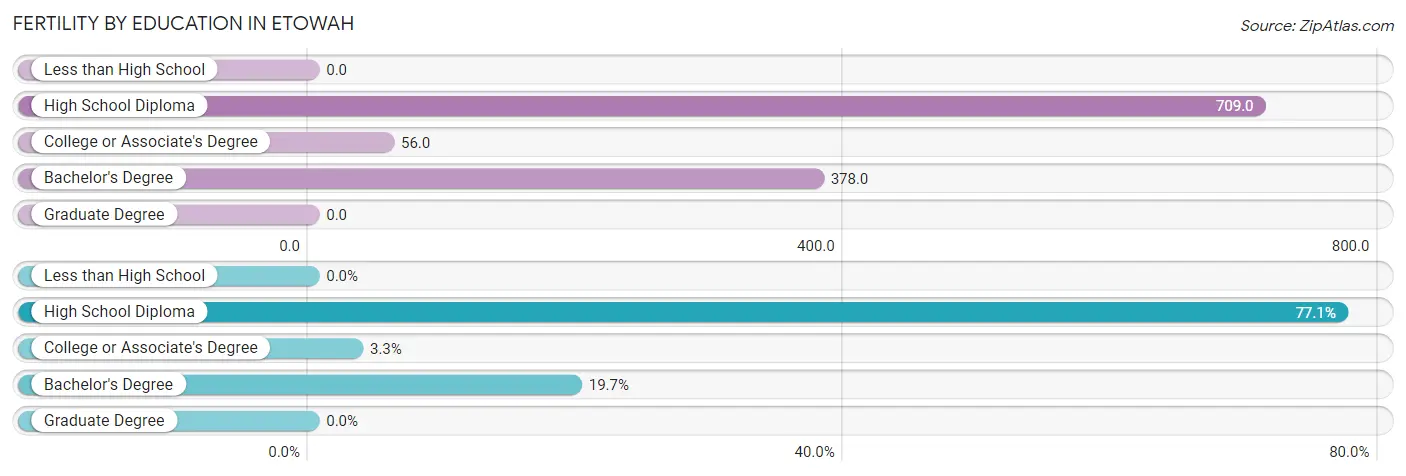
| Educational Attainment | Women with Births | Births / 1,000 Women |
| Less than High School | 0 (0.0%) | 0.0 |
| High School Diploma | 188 (77.0%) | 709.0 |
| College or Associate's Degree | 8 (3.3%) | 56.0 |
| Bachelor's Degree | 48 (19.7%) | 378.0 |
| Graduate Degree | 0 (0.0%) | 0.0 |
| Total | 244 (100.0%) | 329.0 |
Fertility by Education by Marriage Status in Etowah
21.7% of women with births in Etowah are unmarried. Women with the educational attainment of college or associate's degree are most likely to be married with 100.0% of them married at childbirth, while women with the educational attainment of high school diploma are least likely to be married with 28.2% of them unmarried at childbirth.
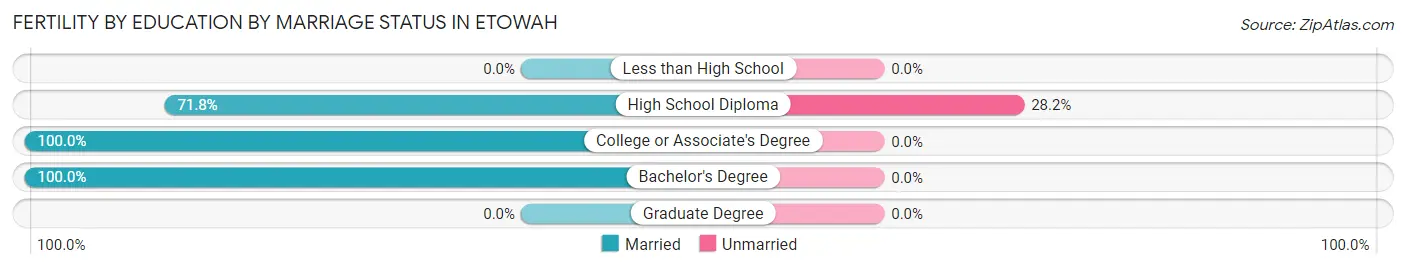
| Educational Attainment | Married | Unmarried |
| Less than High School | 0 (0.0%) | 0 (0.0%) |
| High School Diploma | 135 (71.8%) | 53 (28.2%) |
| College or Associate's Degree | 8 (100.0%) | 0 (0.0%) |
| Bachelor's Degree | 48 (100.0%) | 0 (0.0%) |
| Graduate Degree | 0 (0.0%) | 0 (0.0%) |
| Total | 191 (78.3%) | 53 (21.7%) |
Income in Etowah
Income Overview in Etowah
Per Capita Income in Etowah is $29,007, while median incomes of families and households are $57,656 and $42,571 respectively.
| Characteristic | Number | Measure |
| Per Capita Income | 3,614 | $29,007 |
| Median Family Income | 842 | $57,656 |
| Mean Family Income | 842 | $99,790 |
| Median Household Income | 1,359 | $42,571 |
| Mean Household Income | 1,359 | $74,477 |
| Income Deficit | 842 | $0 |
| Wage / Income Gap (%) | 3,614 | 56.40% |
| Wage / Income Gap ($) | 3,614 | 43.60¢ per $1 |
| Gini / Inequality Index | 3,614 | 0.55 |
Earnings by Sex in Etowah
Average Earnings in Etowah are $31,159, $45,479 for men and $19,831 for women, a difference of 56.4%.
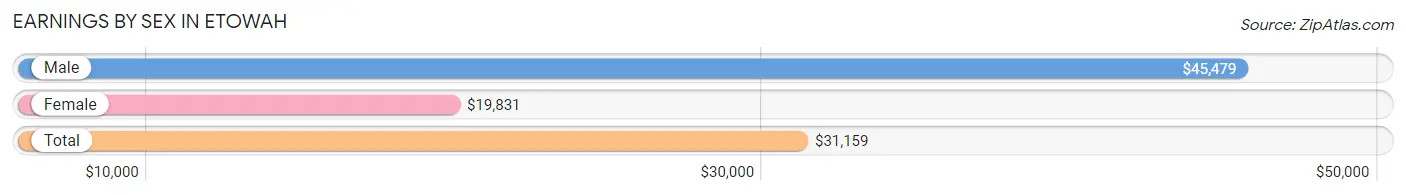
| Sex | Number | Average Earnings |
| Male | 736 (51.9%) | $45,479 |
| Female | 682 (48.1%) | $19,831 |
| Total | 1,418 (100.0%) | $31,159 |
Earnings by Sex by Income Bracket in Etowah
The most common earnings brackets in Etowah are $20,000 to $22,499 for men (159 | 21.6%) and $40,000 to $44,999 for women (120 | 17.6%).
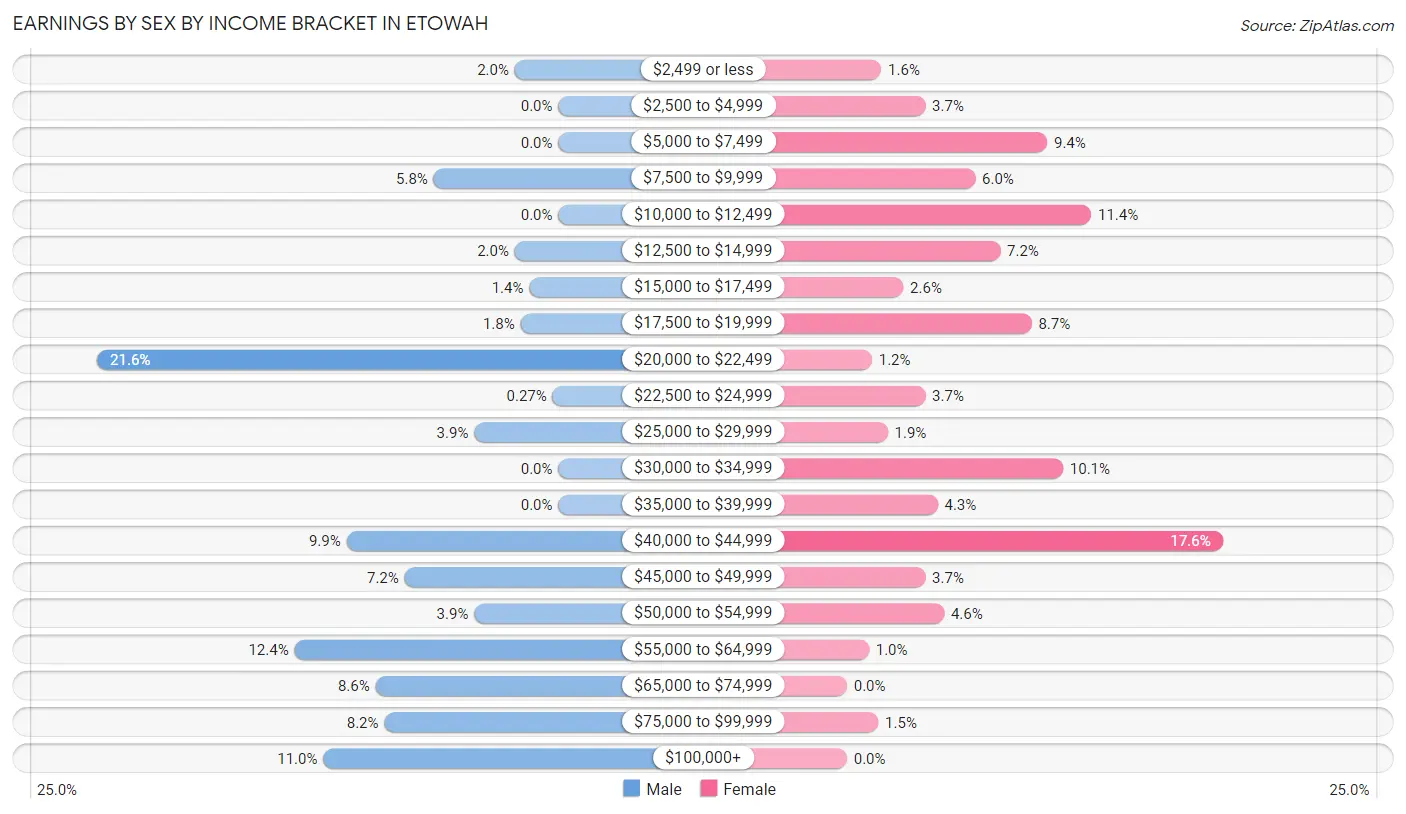
| Income | Male | Female |
| $2,499 or less | 15 (2.0%) | 11 (1.6%) |
| $2,500 to $4,999 | 0 (0.0%) | 25 (3.7%) |
| $5,000 to $7,499 | 0 (0.0%) | 64 (9.4%) |
| $7,500 to $9,999 | 43 (5.8%) | 41 (6.0%) |
| $10,000 to $12,499 | 0 (0.0%) | 78 (11.4%) |
| $12,500 to $14,999 | 15 (2.0%) | 49 (7.2%) |
| $15,000 to $17,499 | 10 (1.4%) | 18 (2.6%) |
| $17,500 to $19,999 | 13 (1.8%) | 59 (8.6%) |
| $20,000 to $22,499 | 159 (21.6%) | 8 (1.2%) |
| $22,500 to $24,999 | 2 (0.3%) | 25 (3.7%) |
| $25,000 to $29,999 | 29 (3.9%) | 13 (1.9%) |
| $30,000 to $34,999 | 0 (0.0%) | 69 (10.1%) |
| $35,000 to $39,999 | 0 (0.0%) | 29 (4.3%) |
| $40,000 to $44,999 | 73 (9.9%) | 120 (17.6%) |
| $45,000 to $49,999 | 53 (7.2%) | 25 (3.7%) |
| $50,000 to $54,999 | 29 (3.9%) | 31 (4.5%) |
| $55,000 to $64,999 | 91 (12.4%) | 7 (1.0%) |
| $65,000 to $74,999 | 63 (8.6%) | 0 (0.0%) |
| $75,000 to $99,999 | 60 (8.2%) | 10 (1.5%) |
| $100,000+ | 81 (11.0%) | 0 (0.0%) |
| Total | 736 (100.0%) | 682 (100.0%) |
Earnings by Sex by Educational Attainment in Etowah
Average earnings in Etowah are $47,340 for men and $24,950 for women, a difference of 47.3%. Men with an educational attainment of high school diploma enjoy the highest average annual earnings of $55,000, while those with high school diploma education earn the least with $55,000. Women with an educational attainment of graduate degree earn the most with the average annual earnings of $56,429, while those with high school diploma education have the smallest earnings of $31,167.
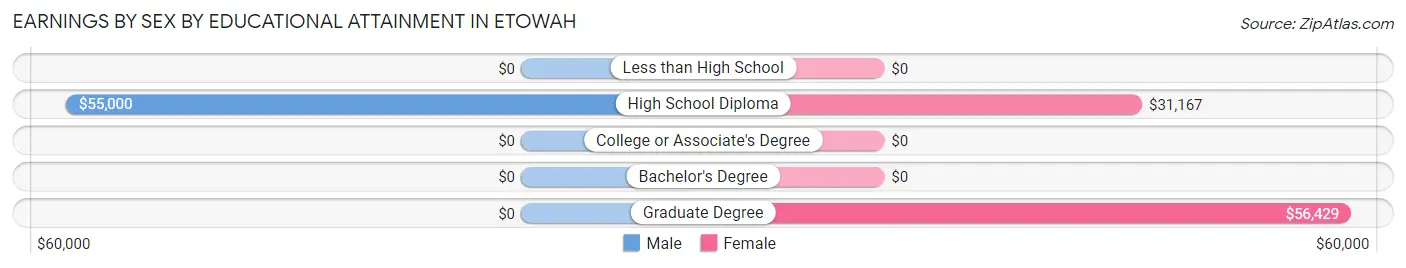
| Educational Attainment | Male Income | Female Income |
| Less than High School | - | - |
| High School Diploma | $55,000 | $31,167 |
| College or Associate's Degree | - | - |
| Bachelor's Degree | - | - |
| Graduate Degree | - | - |
| Total | $47,340 | $24,950 |
Family Income in Etowah
Family Income Brackets in Etowah
According to the Etowah family income data, there are 206 families falling into the $75,000 to $99,999 income range, which is the most common income bracket and makes up 24.5% of all families.
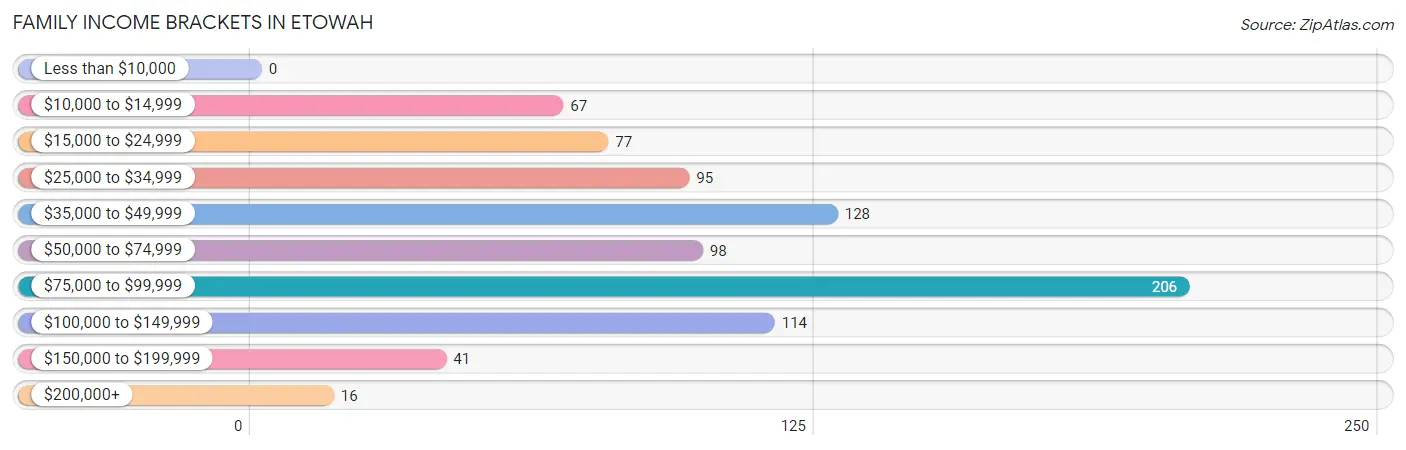
| Income Bracket | # Families | % Families |
| Less than $10,000 | 0 | 0.0% |
| $10,000 to $14,999 | 67 | 8.0% |
| $15,000 to $24,999 | 77 | 9.1% |
| $25,000 to $34,999 | 95 | 11.3% |
| $35,000 to $49,999 | 128 | 15.2% |
| $50,000 to $74,999 | 98 | 11.6% |
| $75,000 to $99,999 | 206 | 24.5% |
| $100,000 to $149,999 | 114 | 13.5% |
| $150,000 to $199,999 | 41 | 4.9% |
| $200,000+ | 16 | 1.9% |
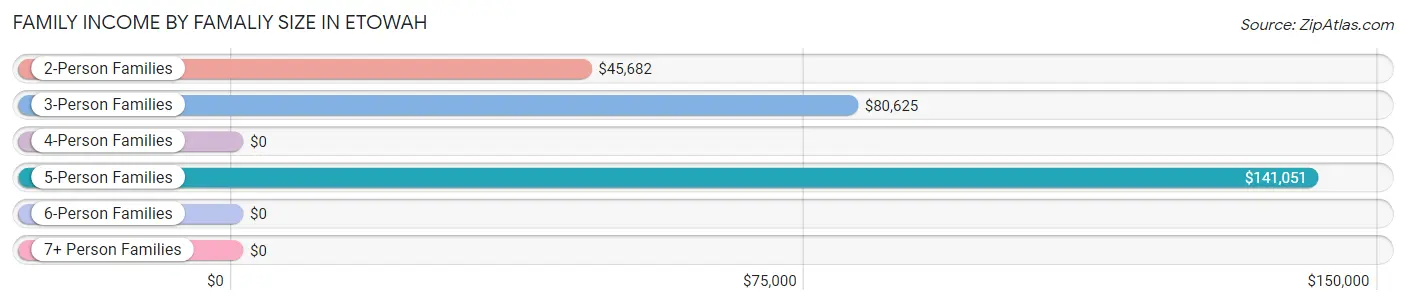
Family Income by Famaliy Size in Etowah
5-person families (80 | 9.5%) account for the highest median family income in Etowah with $141,051 per family, while 5-person families (80 | 9.5%) have the highest median income of $28,210 per family member.
| Income Bracket | # Families | Median Income |
| 2-Person Families | 340 (40.4%) | $45,682 |
| 3-Person Families | 168 (20.0%) | $80,625 |
| 4-Person Families | 189 (22.5%) | $0 |
| 5-Person Families | 80 (9.5%) | $141,051 |
| 6-Person Families | 65 (7.7%) | $0 |
| 7+ Person Families | 0 (0.0%) | $0 |
| Total | 842 (100.0%) | $57,656 |
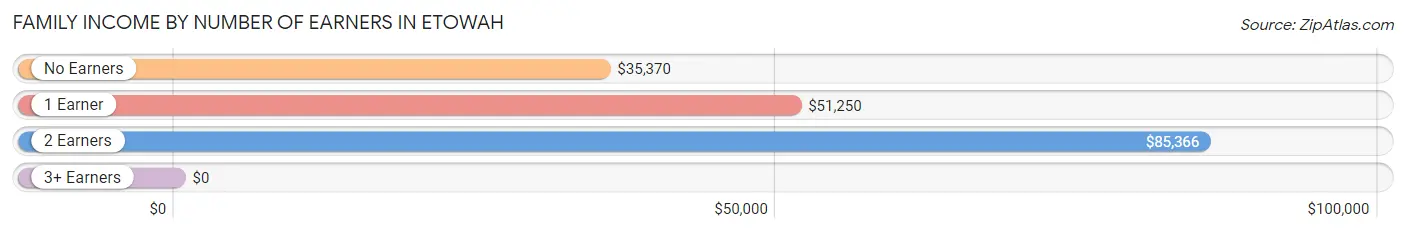
Family Income by Number of Earners in Etowah
| Number of Earners | # Families | Median Income |
| No Earners | 128 (15.2%) | $35,370 |
| 1 Earner | 434 (51.5%) | $51,250 |
| 2 Earners | 276 (32.8%) | $85,366 |
| 3+ Earners | 4 (0.5%) | $0 |
| Total | 842 (100.0%) | $57,656 |
Household Income in Etowah
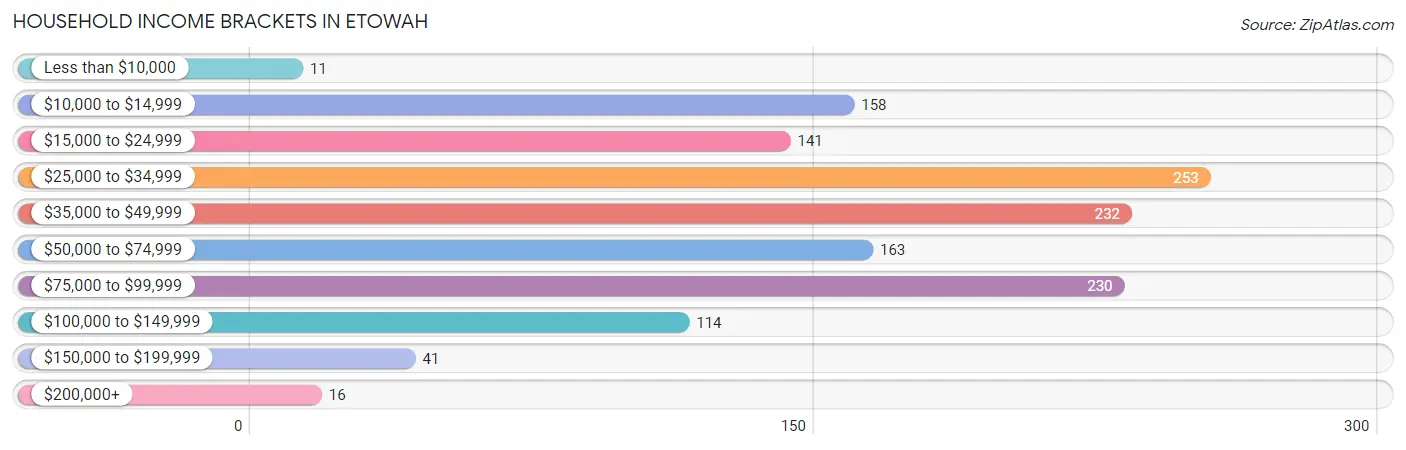
Household Income Brackets in Etowah
With 253 households falling in the category, the $25,000 to $34,999 income range is the most frequent in Etowah, accounting for 18.6% of all households. In contrast, only 11 households (0.8%) fall into the less than $10,000 income bracket, making it the least populous group.
| Income Bracket | # Households | % Households |
| Less than $10,000 | 11 | 0.8% |
| $10,000 to $14,999 | 158 | 11.6% |
| $15,000 to $24,999 | 141 | 10.4% |
| $25,000 to $34,999 | 253 | 18.6% |
| $35,000 to $49,999 | 232 | 17.1% |
| $50,000 to $74,999 | 163 | 12.0% |
| $75,000 to $99,999 | 230 | 16.9% |
| $100,000 to $149,999 | 114 | 8.4% |
| $150,000 to $199,999 | 41 | 3.0% |
| $200,000+ | 16 | 1.2% |
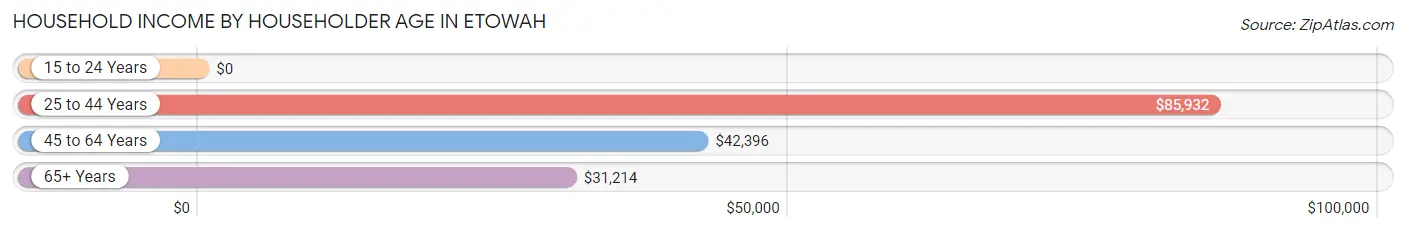
Household Income by Householder Age in Etowah
The median household income in Etowah is $42,571, with the highest median household income of $85,932 found in the 25 to 44 years age bracket for the primary householder. A total of 287 households (21.1%) fall into this category. Meanwhile, the 15 to 24 years age bracket for the primary householder has the lowest median household income of $0, with 110 households (8.1%) in this group.
| Income Bracket | # Households | Median Income |
| 15 to 24 Years | 110 (8.1%) | $0 |
| 25 to 44 Years | 287 (21.1%) | $85,932 |
| 45 to 64 Years | 568 (41.8%) | $42,396 |
| 65+ Years | 394 (29.0%) | $31,214 |
| Total | 1,359 (100.0%) | $42,571 |
Poverty in Etowah
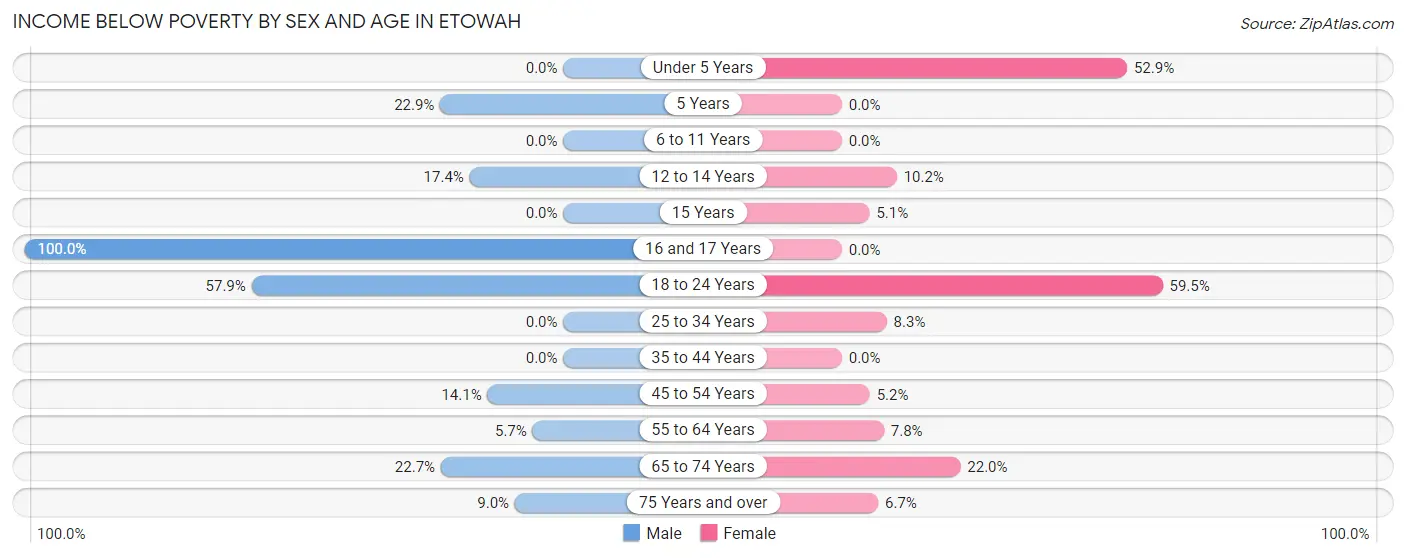
Income Below Poverty by Sex and Age in Etowah
With 11.6% poverty level for males and 17.7% for females among the residents of Etowah, 16 and 17 year old males and 18 to 24 year old females are the most vulnerable to poverty, with 9 males (100.0%) and 78 females (59.5%) in their respective age groups living below the poverty level.
| Age Bracket | Male | Female |
| Under 5 Years | 0 (0.0%) | 99 (52.9%) |
| 5 Years | 8 (22.9%) | 0 (0.0%) |
| 6 to 11 Years | 0 (0.0%) | 0 (0.0%) |
| 12 to 14 Years | 4 (17.4%) | 11 (10.2%) |
| 15 Years | 0 (0.0%) | 2 (5.1%) |
| 16 and 17 Years | 9 (100.0%) | 0 (0.0%) |
| 18 to 24 Years | 81 (57.9%) | 78 (59.5%) |
| 25 to 34 Years | 0 (0.0%) | 23 (8.3%) |
| 35 to 44 Years | 0 (0.0%) | 0 (0.0%) |
| 45 to 54 Years | 49 (14.1%) | 8 (5.2%) |
| 55 to 64 Years | 13 (5.7%) | 11 (7.8%) |
| 65 to 74 Years | 20 (22.7%) | 46 (22.0%) |
| 75 Years and over | 15 (9.0%) | 13 (6.7%) |
| Total | 199 (11.6%) | 291 (17.7%) |
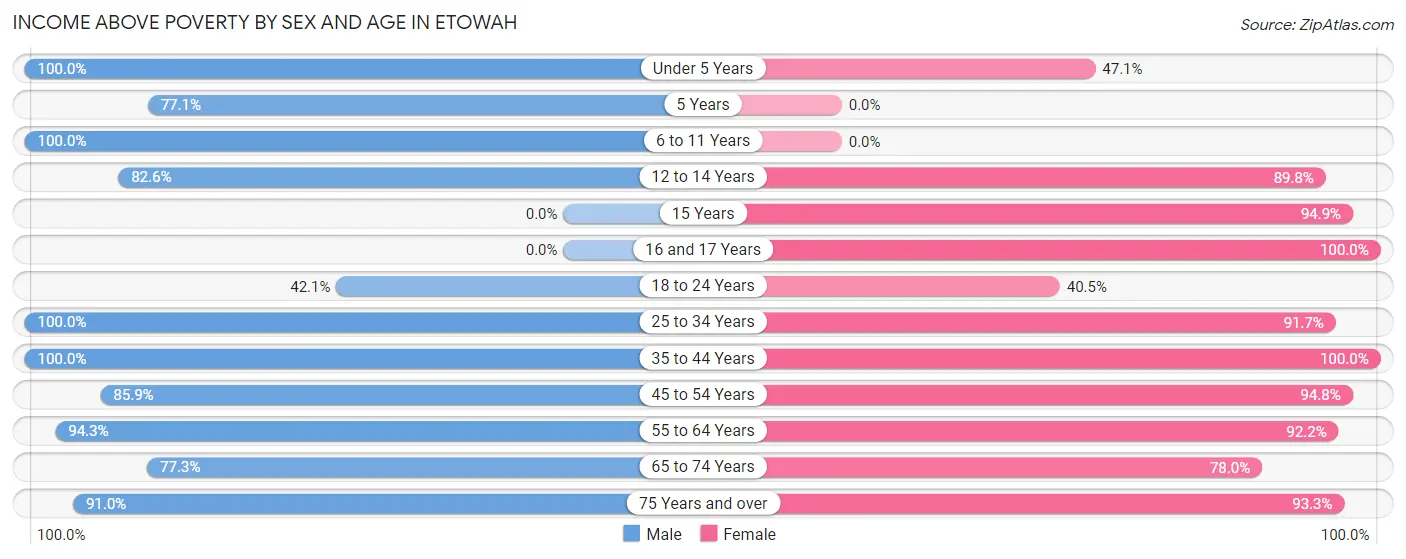
Income Above Poverty by Sex and Age in Etowah
According to the poverty statistics in Etowah, males aged under 5 years and females aged 16 and 17 years are the age groups that are most secure financially, with 100.0% of males and 100.0% of females in these age groups living above the poverty line.
| Age Bracket | Male | Female |
| Under 5 Years | 298 (100.0%) | 88 (47.1%) |
| 5 Years | 27 (77.1%) | 0 (0.0%) |
| 6 to 11 Years | 83 (100.0%) | 0 (0.0%) |
| 12 to 14 Years | 19 (82.6%) | 97 (89.8%) |
| 15 Years | 0 (0.0%) | 37 (94.9%) |
| 16 and 17 Years | 0 (0.0%) | 69 (100.0%) |
| 18 to 24 Years | 59 (42.1%) | 53 (40.5%) |
| 25 to 34 Years | 226 (100.0%) | 253 (91.7%) |
| 35 to 44 Years | 73 (100.0%) | 134 (100.0%) |
| 45 to 54 Years | 299 (85.9%) | 146 (94.8%) |
| 55 to 64 Years | 215 (94.3%) | 130 (92.2%) |
| 65 to 74 Years | 68 (77.3%) | 163 (78.0%) |
| 75 Years and over | 152 (91.0%) | 180 (93.3%) |
| Total | 1,519 (88.4%) | 1,350 (82.3%) |
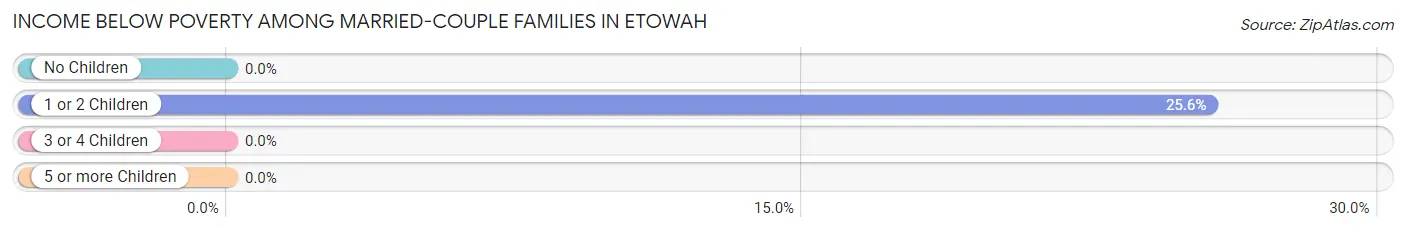
Income Below Poverty Among Married-Couple Families in Etowah
The poverty statistics for married-couple families in Etowah show that 12.6% or 76 of the total 604 families live below the poverty line. Families with 1 or 2 children have the highest poverty rate of 25.6%, comprising of 76 families. On the other hand, families with no children have the lowest poverty rate of 0.0%, which includes 0 families.
| Children | Above Poverty | Below Poverty |
| No Children | 201 (100.0%) | 0 (0.0%) |
| 1 or 2 Children | 221 (74.4%) | 76 (25.6%) |
| 3 or 4 Children | 106 (100.0%) | 0 (0.0%) |
| 5 or more Children | 0 (0.0%) | 0 (0.0%) |
| Total | 528 (87.4%) | 76 (12.6%) |
Income Below Poverty Among Single-Parent Households in Etowah
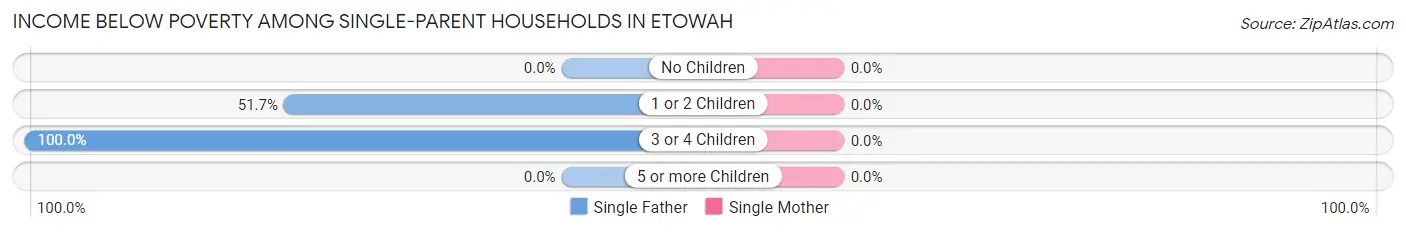
| Children | Single Father | Single Mother |
| No Children | 0 (0.0%) | 0 (0.0%) |
| 1 or 2 Children | 15 (51.7%) | 0 (0.0%) |
| 3 or 4 Children | 4 (100.0%) | 0 (0.0%) |
| 5 or more Children | 0 (0.0%) | 0 (0.0%) |
| Total | 19 (14.5%) | 0 (0.0%) |
Income Below Poverty Among Married-Couple vs Single-Parent Households in Etowah
The poverty data for Etowah shows that 76 of the married-couple family households (12.6%) and 19 of the single-parent households (8.0%) are living below the poverty level. Within the married-couple family households, those with 1 or 2 children have the highest poverty rate, with 76 households (25.6%) falling below the poverty line. Among the single-parent households, those with 1 or 2 children have the highest poverty rate, with 15 household (28.8%) living below poverty.
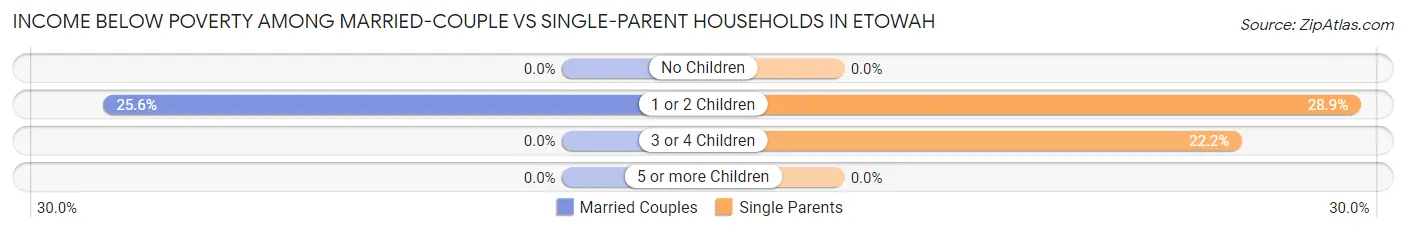
| Children | Married-Couple Families | Single-Parent Households |
| No Children | 0 (0.0%) | 0 (0.0%) |
| 1 or 2 Children | 76 (25.6%) | 15 (28.8%) |
| 3 or 4 Children | 0 (0.0%) | 4 (22.2%) |
| 5 or more Children | 0 (0.0%) | 0 (0.0%) |
| Total | 76 (12.6%) | 19 (8.0%) |
Employment Characteristics in Etowah
Employment by Class of Employer in Etowah
Among the 1,145 employed individuals in Etowah, private company employees (834 | 72.8%), self-employed (not incorporated) (138 | 12.0%), and not-for-profit organizations (87 | 7.6%) make up the most common classes of employment.
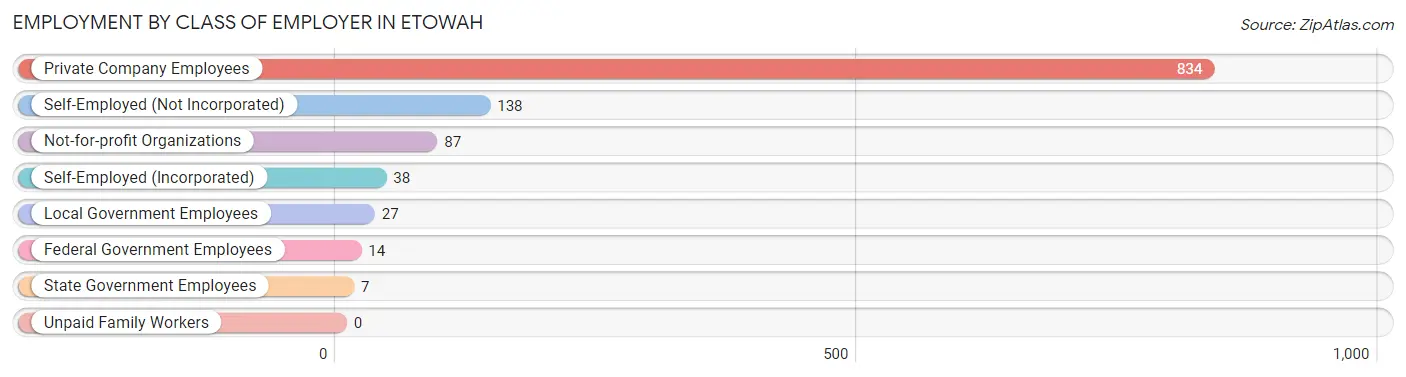
| Employer Class | # Employees | % Employees |
| Private Company Employees | 834 | 72.8% |
| Self-Employed (Incorporated) | 38 | 3.3% |
| Self-Employed (Not Incorporated) | 138 | 12.0% |
| Not-for-profit Organizations | 87 | 7.6% |
| Local Government Employees | 27 | 2.4% |
| State Government Employees | 7 | 0.6% |
| Federal Government Employees | 14 | 1.2% |
| Unpaid Family Workers | 0 | 0.0% |
| Total | 1,145 | 100.0% |
Employment Status by Age in Etowah
According to the labor force statistics for Etowah, out of the total population over 16 years of age (2,783), 54.7% or 1,522 individuals are in the labor force, with 18.1% or 275 of them unemployed. The age group with the highest labor force participation rate is 35 to 44 years, with 92.8% or 192 individuals in the labor force. Within the labor force, the 16 to 19 years age range has the highest percentage of unemployed individuals, with 67.7% or 42 of them being unemployed.
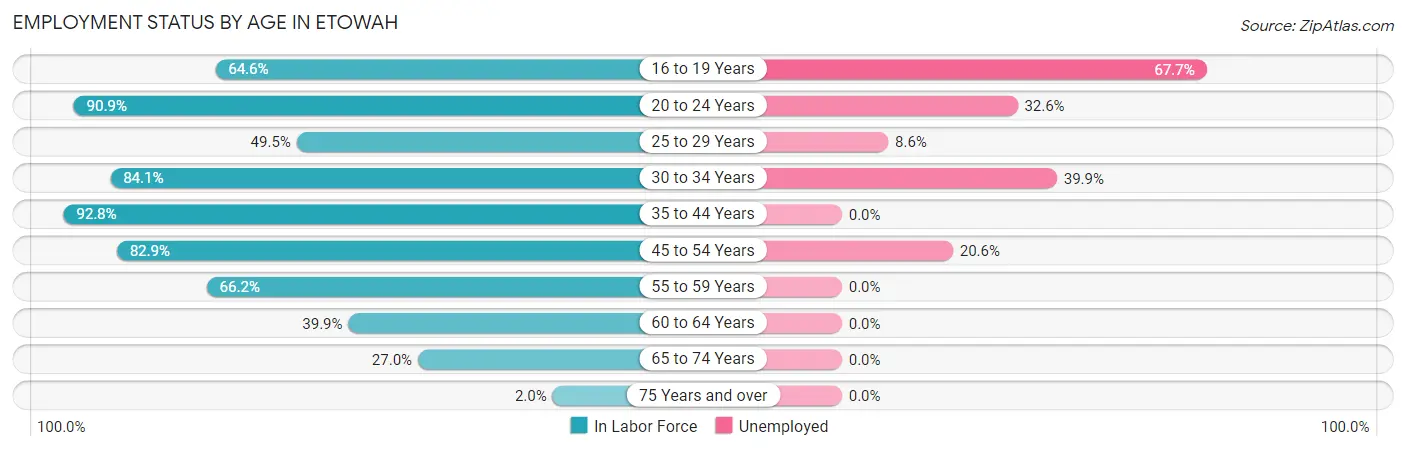
| Age Bracket | In Labor Force | Unemployed |
| 16 to 19 Years | 62 (64.6%) | 42 (67.7%) |
| 20 to 24 Years | 230 (90.9%) | 75 (32.6%) |
| 25 to 29 Years | 162 (49.5%) | 14 (8.6%) |
| 30 to 34 Years | 148 (84.1%) | 59 (39.9%) |
| 35 to 44 Years | 192 (92.8%) | 0 (0.0%) |
| 45 to 54 Years | 417 (82.9%) | 86 (20.6%) |
| 55 to 59 Years | 90 (66.2%) | 0 (0.0%) |
| 60 to 64 Years | 118 (39.9%) | 0 (0.0%) |
| 65 to 74 Years | 93 (27.0%) | 0 (0.0%) |
| 75 Years and over | 9 (2.0%) | 0 (0.0%) |
| Total | 1,522 (54.7%) | 275 (18.1%) |
Employment Status by Educational Attainment in Etowah
According to labor force statistics for Etowah, 68.5% of individuals (1,127) out of the total population between 25 and 64 years of age (1,645) are in the labor force, with 14.1% or 159 of them being unemployed. The group with the highest labor force participation rate are those with the educational attainment of high school diploma, with 80.2% or 660 individuals in the labor force. Within the labor force, individuals with high school diploma education have the highest percentage of unemployment, with 19.8% or 131 of them being unemployed.
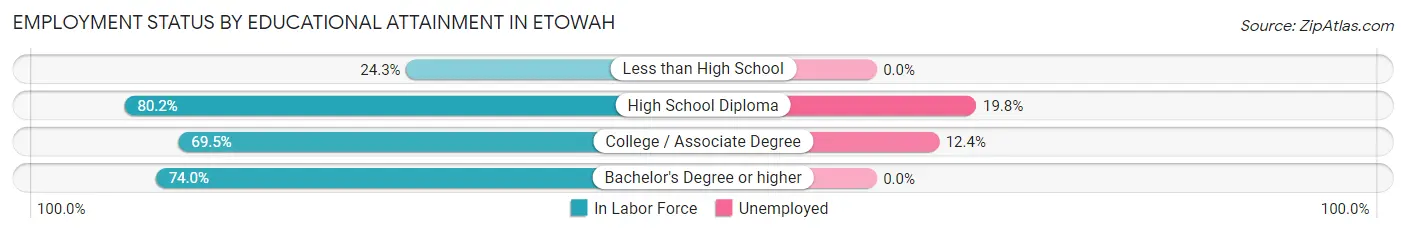
| Educational Attainment | In Labor Force | Unemployed |
| Less than High School | 62 (24.3%) | 0 (0.0%) |
| High School Diploma | 660 (80.2%) | 163 (19.8%) |
| College / Associate Degree | 226 (69.5%) | 40 (12.4%) |
| Bachelor's Degree or higher | 179 (74.0%) | 0 (0.0%) |
| Total | 1,127 (68.5%) | 232 (14.1%) |
Employment Occupations by Sex in Etowah
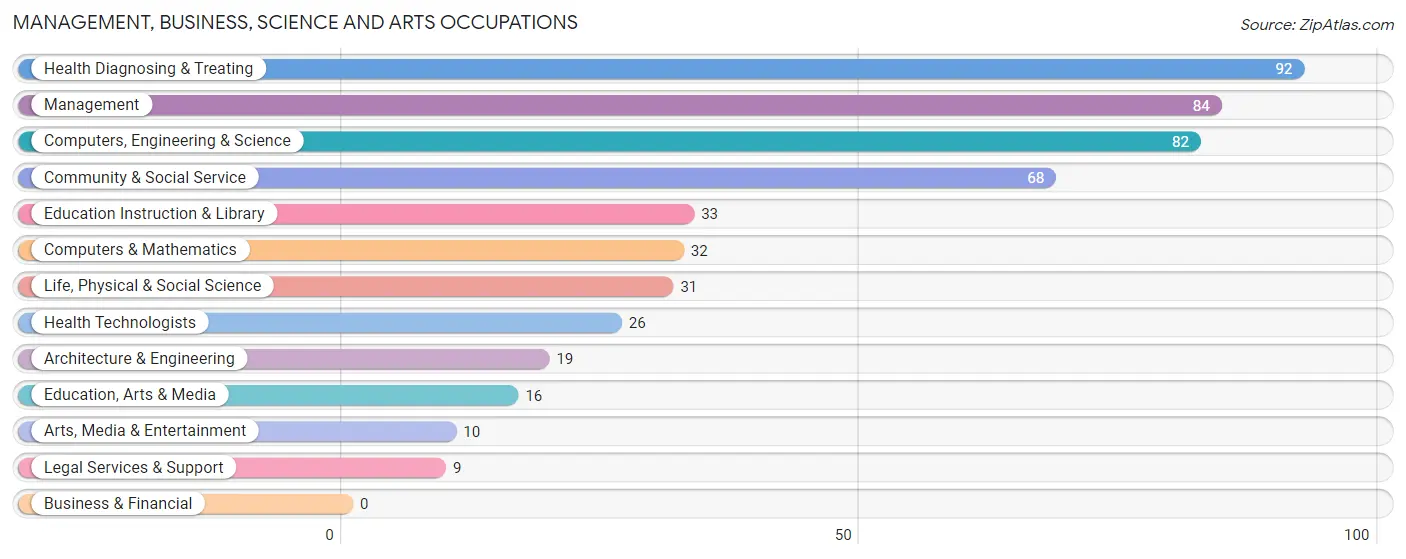
Management, Business, Science and Arts Occupations
The most common Management, Business, Science and Arts occupations in Etowah are Health Diagnosing & Treating (92 | 7.4%), Management (84 | 6.8%), Computers, Engineering & Science (82 | 6.6%), Community & Social Service (68 | 5.5%), and Education Instruction & Library (33 | 2.6%).
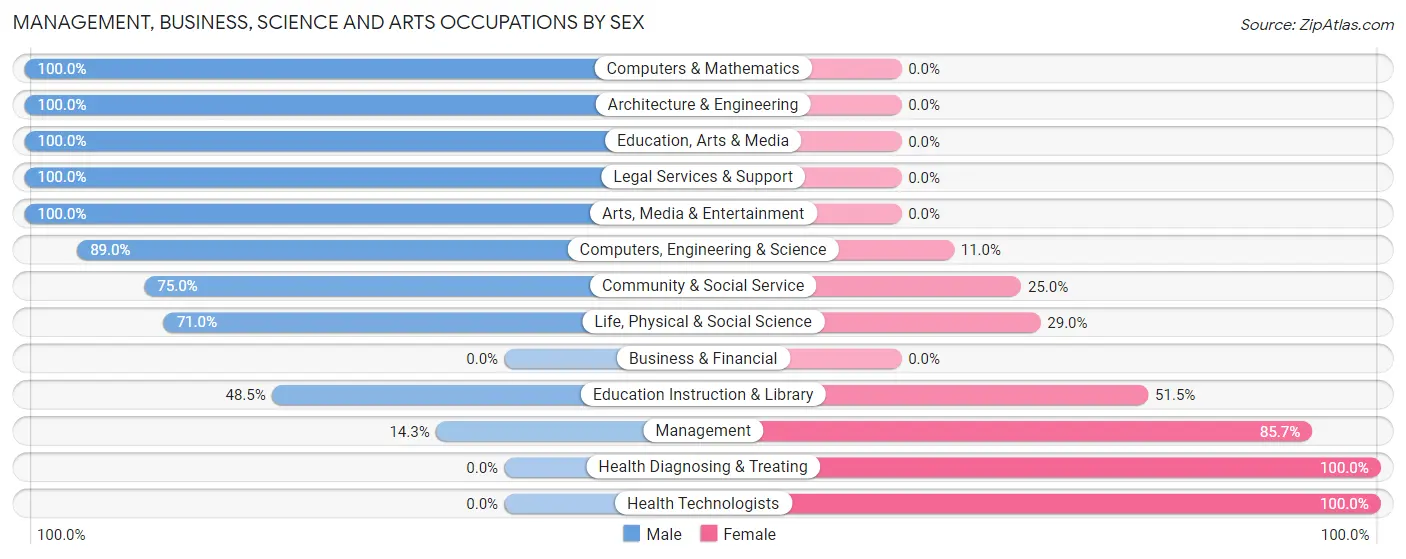
Management, Business, Science and Arts Occupations by Sex
Within the Management, Business, Science and Arts occupations in Etowah, the most male-oriented occupations are Computers & Mathematics (100.0%), Architecture & Engineering (100.0%), and Education, Arts & Media (100.0%), while the most female-oriented occupations are Health Diagnosing & Treating (100.0%), Health Technologists (100.0%), and Management (85.7%).
| Occupation | Male | Female |
| Management | 12 (14.3%) | 72 (85.7%) |
| Business & Financial | 0 (0.0%) | 0 (0.0%) |
| Computers, Engineering & Science | 73 (89.0%) | 9 (11.0%) |
| Computers & Mathematics | 32 (100.0%) | 0 (0.0%) |
| Architecture & Engineering | 19 (100.0%) | 0 (0.0%) |
| Life, Physical & Social Science | 22 (71.0%) | 9 (29.0%) |
| Community & Social Service | 51 (75.0%) | 17 (25.0%) |
| Education, Arts & Media | 16 (100.0%) | 0 (0.0%) |
| Legal Services & Support | 9 (100.0%) | 0 (0.0%) |
| Education Instruction & Library | 16 (48.5%) | 17 (51.5%) |
| Arts, Media & Entertainment | 10 (100.0%) | 0 (0.0%) |
| Health Diagnosing & Treating | 0 (0.0%) | 92 (100.0%) |
| Health Technologists | 0 (0.0%) | 26 (100.0%) |
| Total (Category) | 136 (41.7%) | 190 (58.3%) |
| Total (Overall) | 664 (53.3%) | 581 (46.7%) |
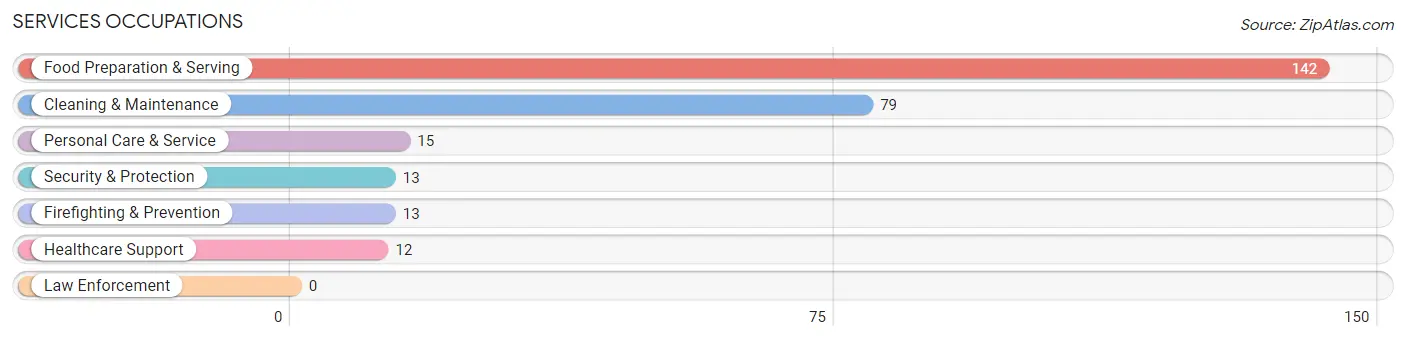
Services Occupations
The most common Services occupations in Etowah are Food Preparation & Serving (142 | 11.4%), Cleaning & Maintenance (79 | 6.4%), Personal Care & Service (15 | 1.2%), Security & Protection (13 | 1.0%), and Firefighting & Prevention (13 | 1.0%).
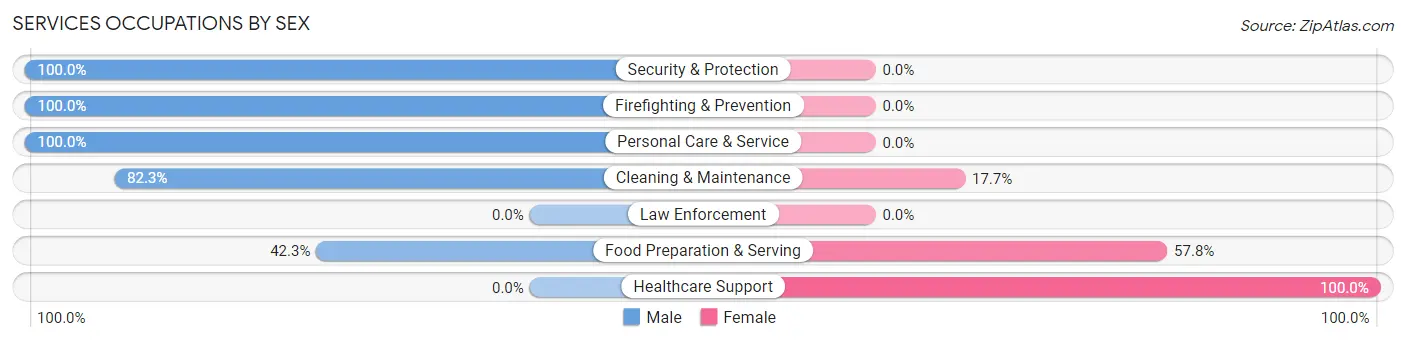
Services Occupations by Sex
Within the Services occupations in Etowah, the most male-oriented occupations are Security & Protection (100.0%), Firefighting & Prevention (100.0%), and Personal Care & Service (100.0%), while the most female-oriented occupations are Healthcare Support (100.0%), Food Preparation & Serving (57.8%), and Cleaning & Maintenance (17.7%).
| Occupation | Male | Female |
| Healthcare Support | 0 (0.0%) | 12 (100.0%) |
| Security & Protection | 13 (100.0%) | 0 (0.0%) |
| Firefighting & Prevention | 13 (100.0%) | 0 (0.0%) |
| Law Enforcement | 0 (0.0%) | 0 (0.0%) |
| Food Preparation & Serving | 60 (42.2%) | 82 (57.8%) |
| Cleaning & Maintenance | 65 (82.3%) | 14 (17.7%) |
| Personal Care & Service | 15 (100.0%) | 0 (0.0%) |
| Total (Category) | 153 (58.6%) | 108 (41.4%) |
| Total (Overall) | 664 (53.3%) | 581 (46.7%) |
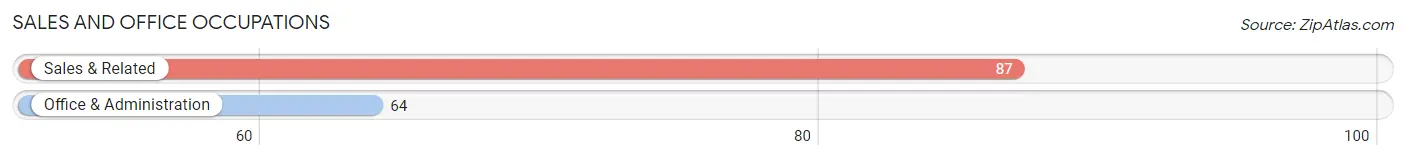
Sales and Office Occupations
The most common Sales and Office occupations in Etowah are Sales & Related (87 | 7.0%), and Office & Administration (64 | 5.1%).
Sales and Office Occupations by Sex
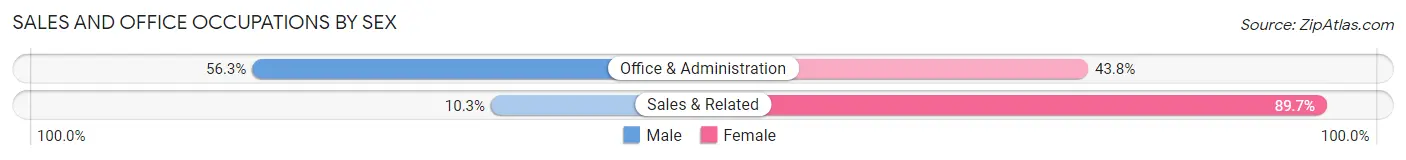
| Occupation | Male | Female |
| Sales & Related | 9 (10.3%) | 78 (89.7%) |
| Office & Administration | 36 (56.2%) | 28 (43.8%) |
| Total (Category) | 45 (29.8%) | 106 (70.2%) |
| Total (Overall) | 664 (53.3%) | 581 (46.7%) |
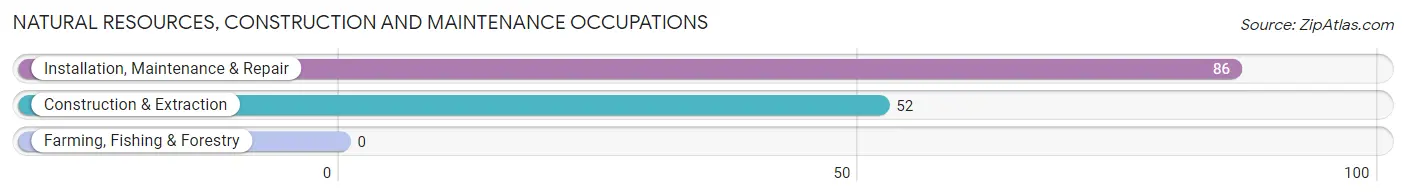
Natural Resources, Construction and Maintenance Occupations
The most common Natural Resources, Construction and Maintenance occupations in Etowah are Installation, Maintenance & Repair (86 | 6.9%), and Construction & Extraction (52 | 4.2%).
Natural Resources, Construction and Maintenance Occupations by Sex
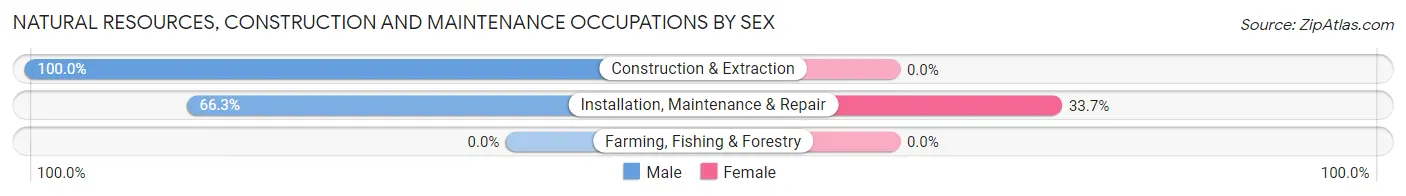
| Occupation | Male | Female |
| Farming, Fishing & Forestry | 0 (0.0%) | 0 (0.0%) |
| Construction & Extraction | 52 (100.0%) | 0 (0.0%) |
| Installation, Maintenance & Repair | 57 (66.3%) | 29 (33.7%) |
| Total (Category) | 109 (79.0%) | 29 (21.0%) |
| Total (Overall) | 664 (53.3%) | 581 (46.7%) |
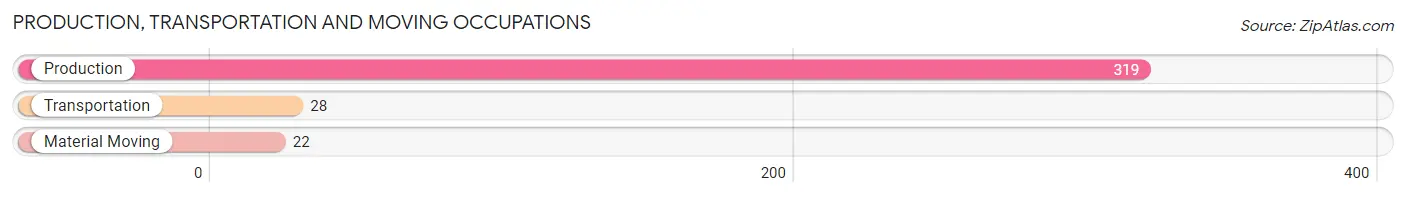
Production, Transportation and Moving Occupations
The most common Production, Transportation and Moving occupations in Etowah are Production (319 | 25.6%), Transportation (28 | 2.2%), and Material Moving (22 | 1.8%).
Production, Transportation and Moving Occupations by Sex
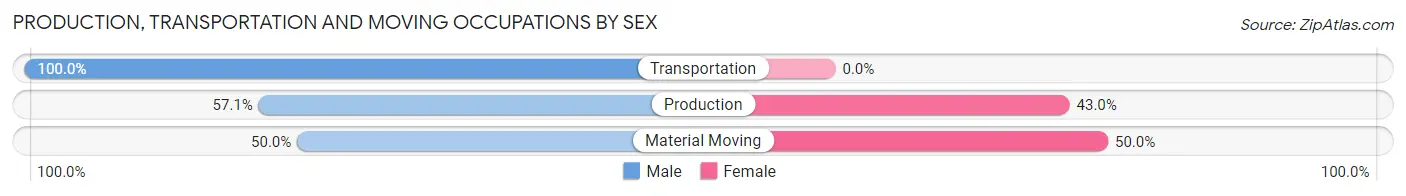
| Occupation | Male | Female |
| Production | 182 (57.1%) | 137 (42.9%) |
| Transportation | 28 (100.0%) | 0 (0.0%) |
| Material Moving | 11 (50.0%) | 11 (50.0%) |
| Total (Category) | 221 (59.9%) | 148 (40.1%) |
| Total (Overall) | 664 (53.3%) | 581 (46.7%) |
Employment Industries by Sex in Etowah
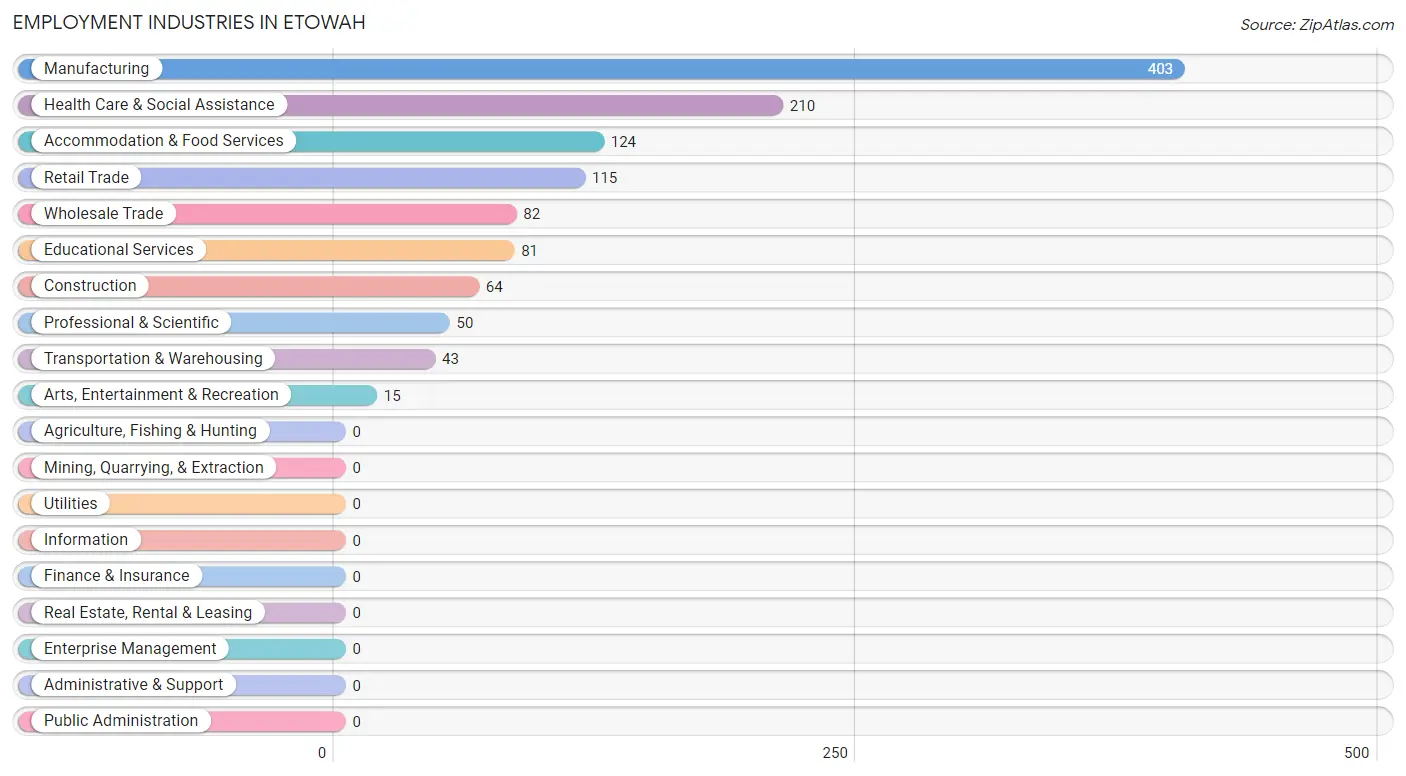
Employment Industries in Etowah
The major employment industries in Etowah include Manufacturing (403 | 32.4%), Health Care & Social Assistance (210 | 16.9%), Accommodation & Food Services (124 | 10.0%), Retail Trade (115 | 9.2%), and Wholesale Trade (82 | 6.6%).
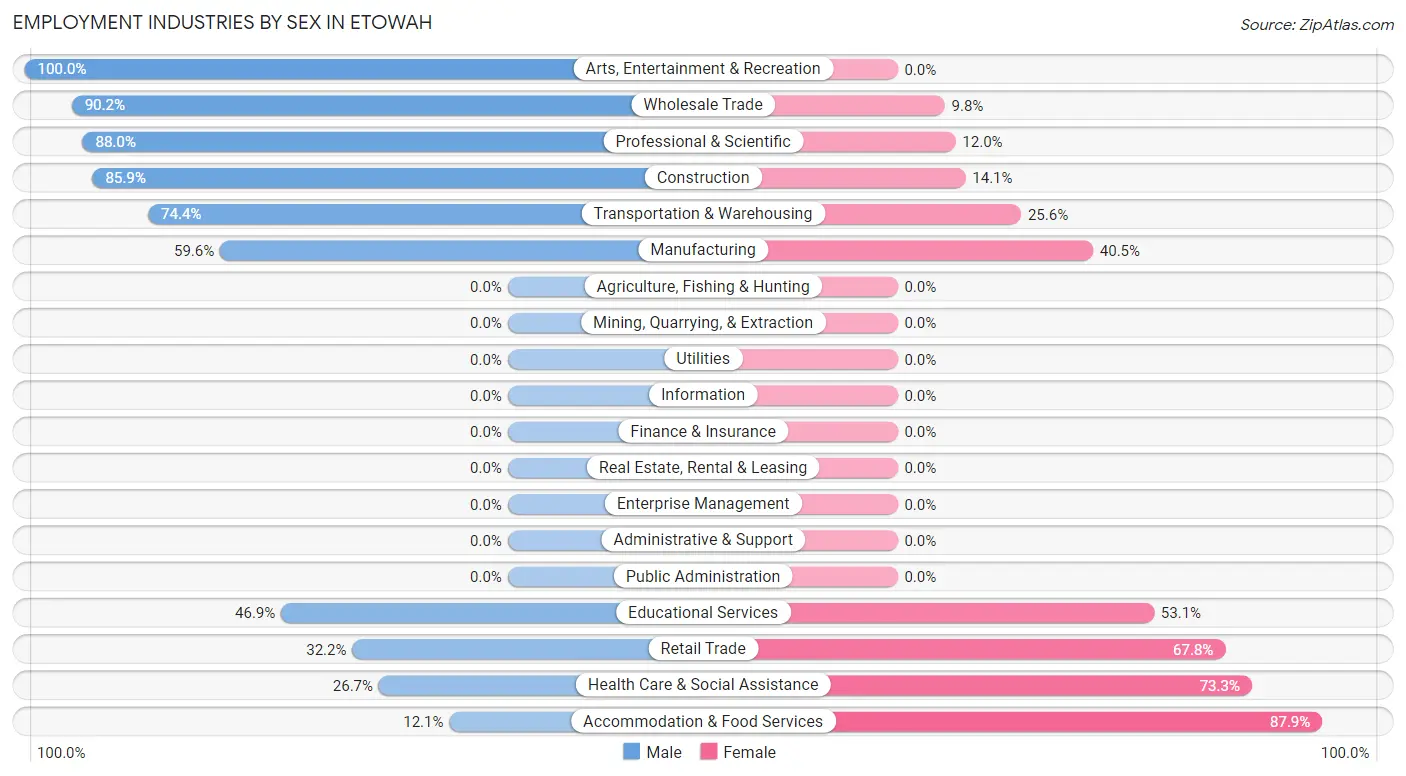
Employment Industries by Sex in Etowah
The Etowah industries that see more men than women are Arts, Entertainment & Recreation (100.0%), Wholesale Trade (90.2%), and Professional & Scientific (88.0%), whereas the industries that tend to have a higher number of women are Accommodation & Food Services (87.9%), Health Care & Social Assistance (73.3%), and Retail Trade (67.8%).
| Industry | Male | Female |
| Agriculture, Fishing & Hunting | 0 (0.0%) | 0 (0.0%) |
| Mining, Quarrying, & Extraction | 0 (0.0%) | 0 (0.0%) |
| Construction | 55 (85.9%) | 9 (14.1%) |
| Manufacturing | 240 (59.6%) | 163 (40.5%) |
| Wholesale Trade | 74 (90.2%) | 8 (9.8%) |
| Retail Trade | 37 (32.2%) | 78 (67.8%) |
| Transportation & Warehousing | 32 (74.4%) | 11 (25.6%) |
| Utilities | 0 (0.0%) | 0 (0.0%) |
| Information | 0 (0.0%) | 0 (0.0%) |
| Finance & Insurance | 0 (0.0%) | 0 (0.0%) |
| Real Estate, Rental & Leasing | 0 (0.0%) | 0 (0.0%) |
| Professional & Scientific | 44 (88.0%) | 6 (12.0%) |
| Enterprise Management | 0 (0.0%) | 0 (0.0%) |
| Administrative & Support | 0 (0.0%) | 0 (0.0%) |
| Educational Services | 38 (46.9%) | 43 (53.1%) |
| Health Care & Social Assistance | 56 (26.7%) | 154 (73.3%) |
| Arts, Entertainment & Recreation | 15 (100.0%) | 0 (0.0%) |
| Accommodation & Food Services | 15 (12.1%) | 109 (87.9%) |
| Public Administration | 0 (0.0%) | 0 (0.0%) |
| Total | 664 (53.3%) | 581 (46.7%) |
Education in Etowah
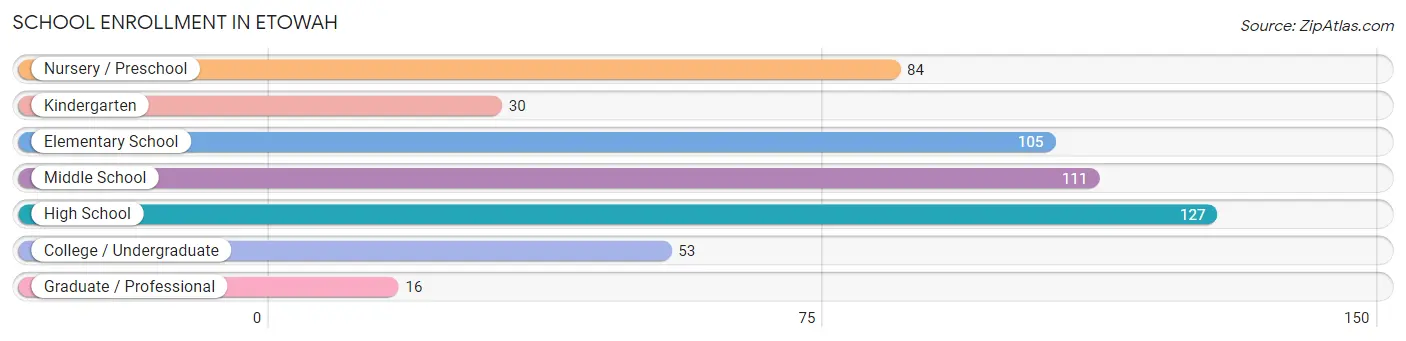
School Enrollment in Etowah
The most common levels of schooling among the 526 students in Etowah are high school (127 | 24.1%), middle school (111 | 21.1%), and elementary school (105 | 20.0%).
| School Level | # Students | % Students |
| Nursery / Preschool | 84 | 16.0% |
| Kindergarten | 30 | 5.7% |
| Elementary School | 105 | 20.0% |
| Middle School | 111 | 21.1% |
| High School | 127 | 24.1% |
| College / Undergraduate | 53 | 10.1% |
| Graduate / Professional | 16 | 3.0% |
| Total | 526 | 100.0% |
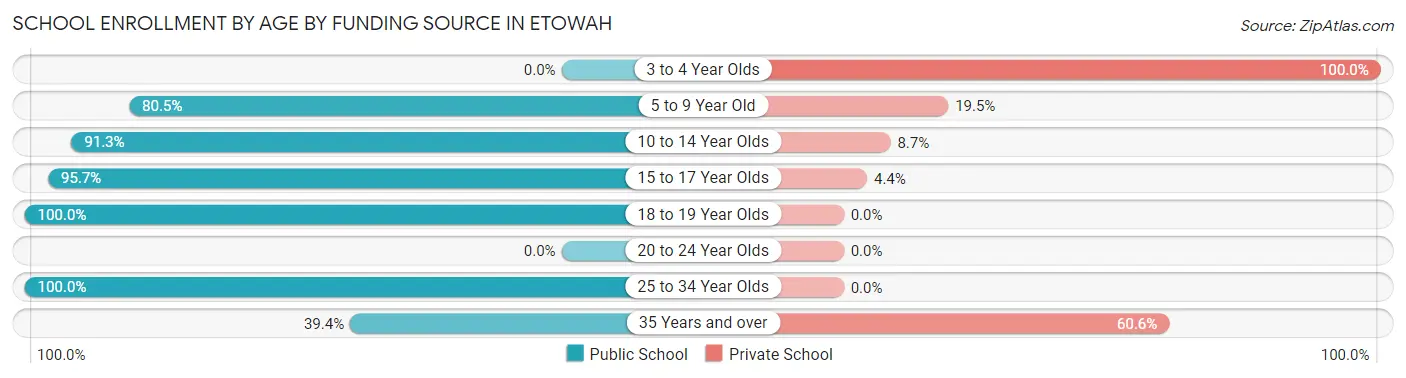
School Enrollment by Age by Funding Source in Etowah
Out of a total of 526 students who are enrolled in schools in Etowah, 119 (22.6%) attend a private institution, while the remaining 407 (77.4%) are enrolled in public schools. The age group of 3 to 4 year olds has the highest likelihood of being enrolled in private schools, with 57 (100.0% in the age bracket) enrolled. Conversely, the age group of 18 to 19 year olds has the lowest likelihood of being enrolled in a private school, with 11 (100.0% in the age bracket) attending a public institution.
| Age Bracket | Public School | Private School |
| 3 to 4 Year Olds | 0 (0.0%) | 57 (100.0%) |
| 5 to 9 Year Old | 91 (80.5%) | 22 (19.5%) |
| 10 to 14 Year Olds | 157 (91.3%) | 15 (8.7%) |
| 15 to 17 Year Olds | 110 (95.7%) | 5 (4.3%) |
| 18 to 19 Year Olds | 11 (100.0%) | 0 (0.0%) |
| 20 to 24 Year Olds | 0 (0.0%) | 0 (0.0%) |
| 25 to 34 Year Olds | 25 (100.0%) | 0 (0.0%) |
| 35 Years and over | 13 (39.4%) | 20 (60.6%) |
| Total | 407 (77.4%) | 119 (22.6%) |
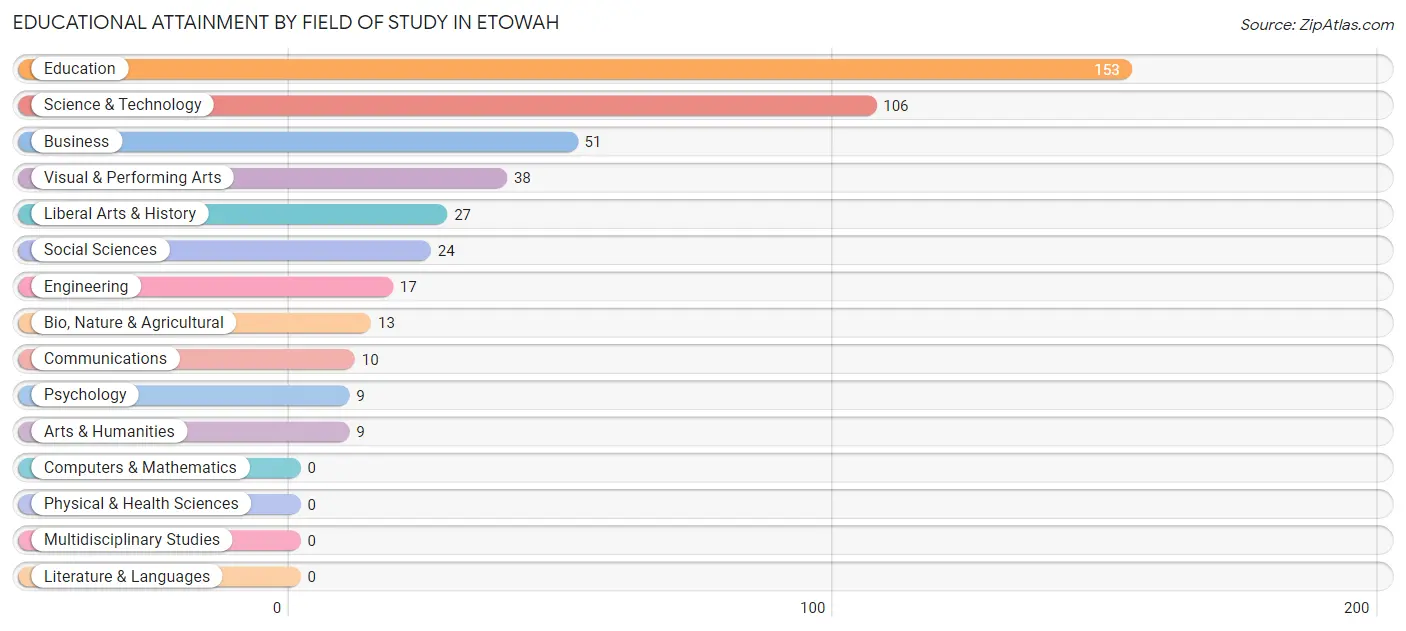
Educational Attainment by Field of Study in Etowah
Education (153 | 33.5%), science & technology (106 | 23.2%), business (51 | 11.2%), visual & performing arts (38 | 8.3%), and liberal arts & history (27 | 5.9%) are the most common fields of study among 457 individuals in Etowah who have obtained a bachelor's degree or higher.
| Field of Study | # Graduates | % Graduates |
| Computers & Mathematics | 0 | 0.0% |
| Bio, Nature & Agricultural | 13 | 2.8% |
| Physical & Health Sciences | 0 | 0.0% |
| Psychology | 9 | 2.0% |
| Social Sciences | 24 | 5.2% |
| Engineering | 17 | 3.7% |
| Multidisciplinary Studies | 0 | 0.0% |
| Science & Technology | 106 | 23.2% |
| Business | 51 | 11.2% |
| Education | 153 | 33.5% |
| Literature & Languages | 0 | 0.0% |
| Liberal Arts & History | 27 | 5.9% |
| Visual & Performing Arts | 38 | 8.3% |
| Communications | 10 | 2.2% |
| Arts & Humanities | 9 | 2.0% |
| Total | 457 | 100.0% |
Transportation & Commute in Etowah
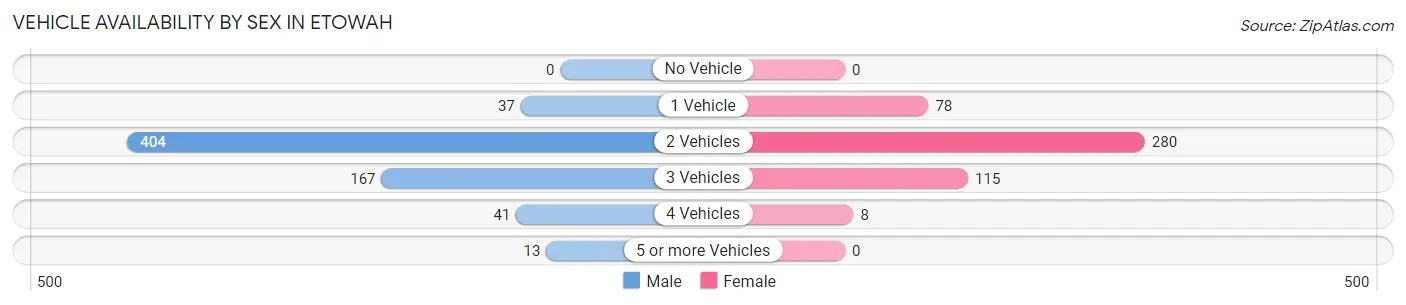
Vehicle Availability by Sex in Etowah
The most prevalent vehicle ownership categories in Etowah are males with 2 vehicles (404, accounting for 61.0%) and females with 2 vehicles (280, making up 84.0%).
| Vehicles Available | Male | Female |
| No Vehicle | 0 (0.0%) | 0 (0.0%) |
| 1 Vehicle | 37 (5.6%) | 78 (16.2%) |
| 2 Vehicles | 404 (61.0%) | 280 (58.2%) |
| 3 Vehicles | 167 (25.2%) | 115 (23.9%) |
| 4 Vehicles | 41 (6.2%) | 8 (1.7%) |
| 5 or more Vehicles | 13 (2.0%) | 0 (0.0%) |
| Total | 662 (100.0%) | 481 (100.0%) |
Commute Time in Etowah
The most frequently occuring commute durations in Etowah are 30 to 34 minutes (170 commuters, 15.7%), 5 to 9 minutes (154 commuters, 14.2%), and 15 to 19 minutes (149 commuters, 13.8%).
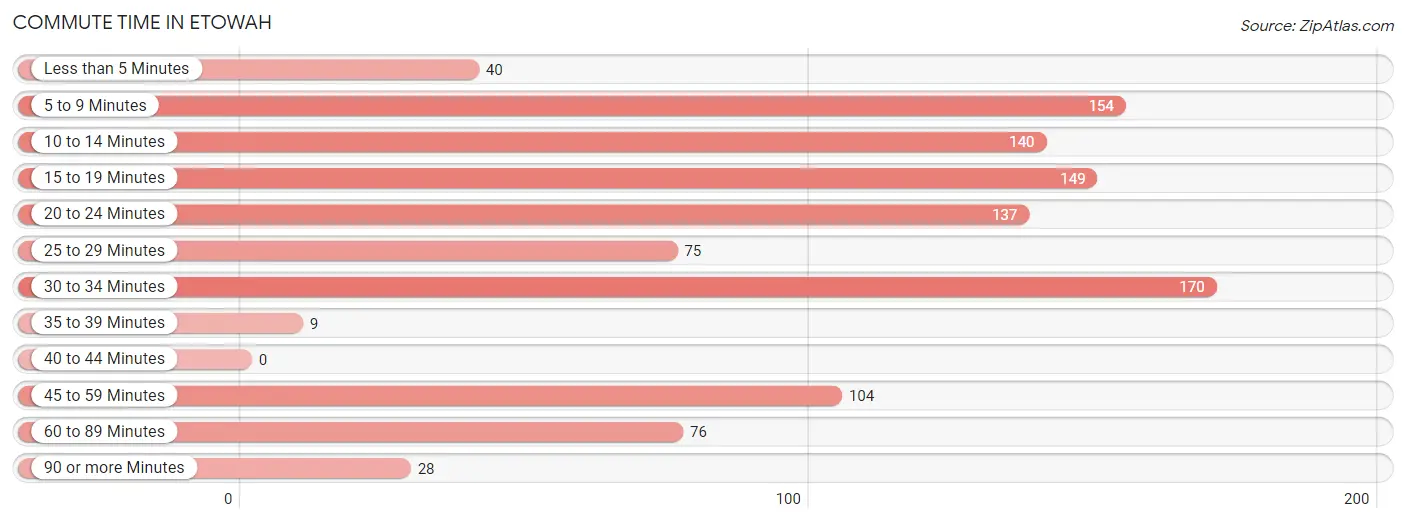
| Commute Time | # Commuters | % Commuters |
| Less than 5 Minutes | 40 | 3.7% |
| 5 to 9 Minutes | 154 | 14.2% |
| 10 to 14 Minutes | 140 | 12.9% |
| 15 to 19 Minutes | 149 | 13.8% |
| 20 to 24 Minutes | 137 | 12.7% |
| 25 to 29 Minutes | 75 | 6.9% |
| 30 to 34 Minutes | 170 | 15.7% |
| 35 to 39 Minutes | 9 | 0.8% |
| 40 to 44 Minutes | 0 | 0.0% |
| 45 to 59 Minutes | 104 | 9.6% |
| 60 to 89 Minutes | 76 | 7.0% |
| 90 or more Minutes | 28 | 2.6% |
Commute Time by Sex in Etowah
The most common commute times in Etowah are 5 to 9 minutes (121 commuters, 19.2%) for males and 10 to 14 minutes (97 commuters, 21.4%) for females.
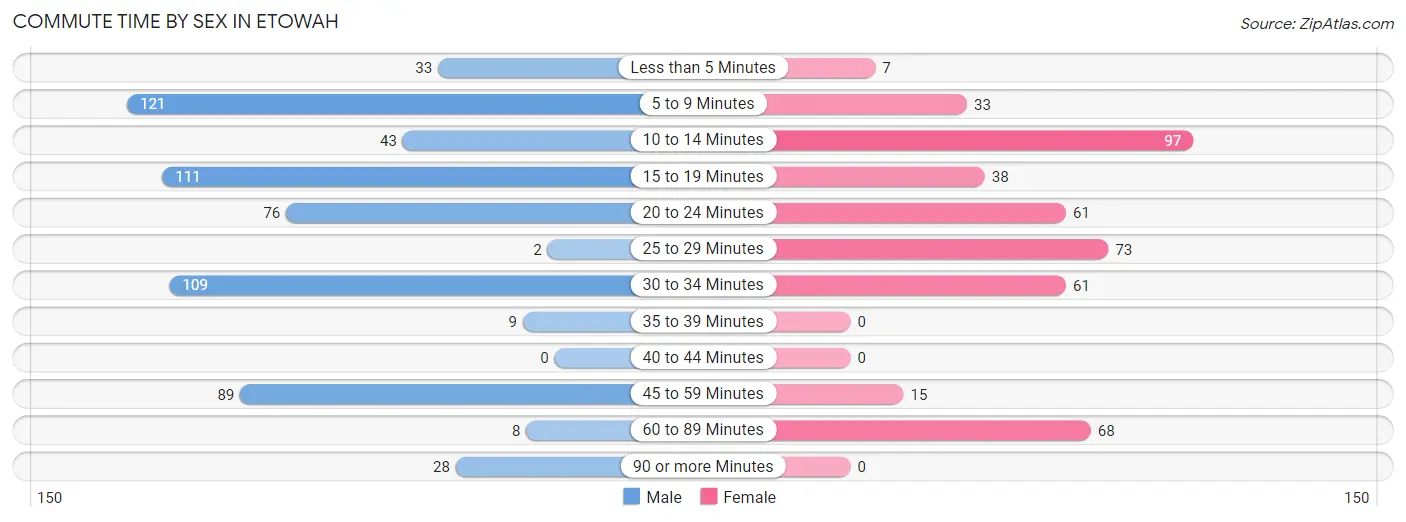
| Commute Time | Male | Female |
| Less than 5 Minutes | 33 (5.2%) | 7 (1.5%) |
| 5 to 9 Minutes | 121 (19.2%) | 33 (7.3%) |
| 10 to 14 Minutes | 43 (6.8%) | 97 (21.4%) |
| 15 to 19 Minutes | 111 (17.6%) | 38 (8.4%) |
| 20 to 24 Minutes | 76 (12.1%) | 61 (13.5%) |
| 25 to 29 Minutes | 2 (0.3%) | 73 (16.1%) |
| 30 to 34 Minutes | 109 (17.3%) | 61 (13.5%) |
| 35 to 39 Minutes | 9 (1.4%) | 0 (0.0%) |
| 40 to 44 Minutes | 0 (0.0%) | 0 (0.0%) |
| 45 to 59 Minutes | 89 (14.1%) | 15 (3.3%) |
| 60 to 89 Minutes | 8 (1.3%) | 68 (15.0%) |
| 90 or more Minutes | 28 (4.4%) | 0 (0.0%) |
Time of Departure to Work by Sex in Etowah
The most frequent times of departure to work in Etowah are 6:00 AM to 6:29 AM (120, 19.1%) for males and 12:00 PM to 3:59 PM (98, 21.6%) for females.
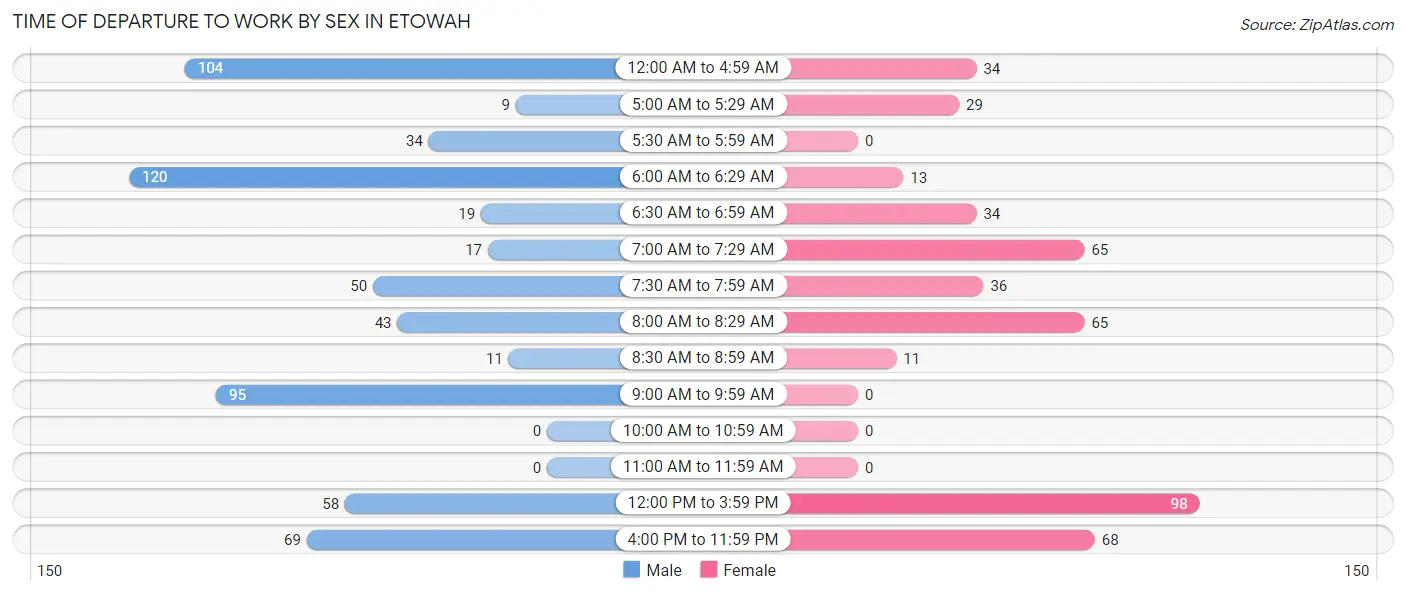
| Time of Departure | Male | Female |
| 12:00 AM to 4:59 AM | 104 (16.5%) | 34 (7.5%) |
| 5:00 AM to 5:29 AM | 9 (1.4%) | 29 (6.4%) |
| 5:30 AM to 5:59 AM | 34 (5.4%) | 0 (0.0%) |
| 6:00 AM to 6:29 AM | 120 (19.1%) | 13 (2.9%) |
| 6:30 AM to 6:59 AM | 19 (3.0%) | 34 (7.5%) |
| 7:00 AM to 7:29 AM | 17 (2.7%) | 65 (14.3%) |
| 7:30 AM to 7:59 AM | 50 (8.0%) | 36 (8.0%) |
| 8:00 AM to 8:29 AM | 43 (6.8%) | 65 (14.3%) |
| 8:30 AM to 8:59 AM | 11 (1.8%) | 11 (2.4%) |
| 9:00 AM to 9:59 AM | 95 (15.1%) | 0 (0.0%) |
| 10:00 AM to 10:59 AM | 0 (0.0%) | 0 (0.0%) |
| 11:00 AM to 11:59 AM | 0 (0.0%) | 0 (0.0%) |
| 12:00 PM to 3:59 PM | 58 (9.2%) | 98 (21.6%) |
| 4:00 PM to 11:59 PM | 69 (11.0%) | 68 (15.0%) |
| Total | 629 (100.0%) | 453 (100.0%) |
Housing Occupancy in Etowah
Occupancy by Ownership in Etowah
Of the total 1,359 dwellings in Etowah, owner-occupied units account for 889 (65.4%), while renter-occupied units make up 470 (34.6%).
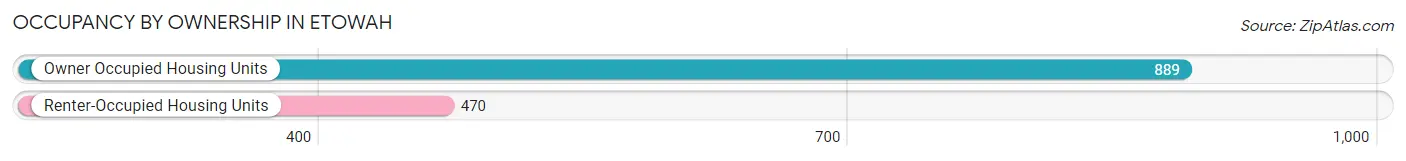
| Occupancy | # Housing Units | % Housing Units |
| Owner Occupied Housing Units | 889 | 65.4% |
| Renter-Occupied Housing Units | 470 | 34.6% |
| Total Occupied Housing Units | 1,359 | 100.0% |
Occupancy by Household Size in Etowah
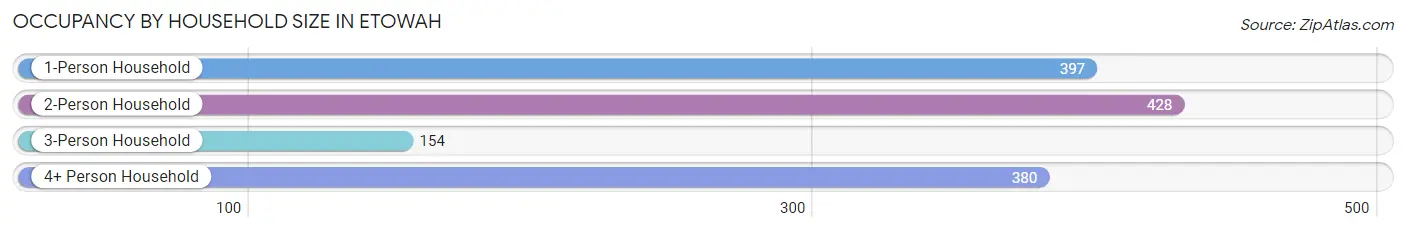
| Household Size | # Housing Units | % Housing Units |
| 1-Person Household | 397 | 29.2% |
| 2-Person Household | 428 | 31.5% |
| 3-Person Household | 154 | 11.3% |
| 4+ Person Household | 380 | 28.0% |
| Total Housing Units | 1,359 | 100.0% |
Occupancy by Ownership by Household Size in Etowah
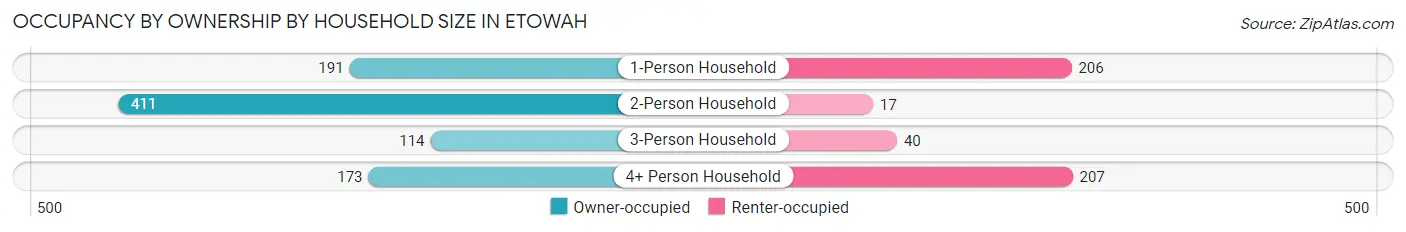
| Household Size | Owner-occupied | Renter-occupied |
| 1-Person Household | 191 (48.1%) | 206 (51.9%) |
| 2-Person Household | 411 (96.0%) | 17 (4.0%) |
| 3-Person Household | 114 (74.0%) | 40 (26.0%) |
| 4+ Person Household | 173 (45.5%) | 207 (54.5%) |
| Total Housing Units | 889 (65.4%) | 470 (34.6%) |
Occupancy by Educational Attainment in Etowah
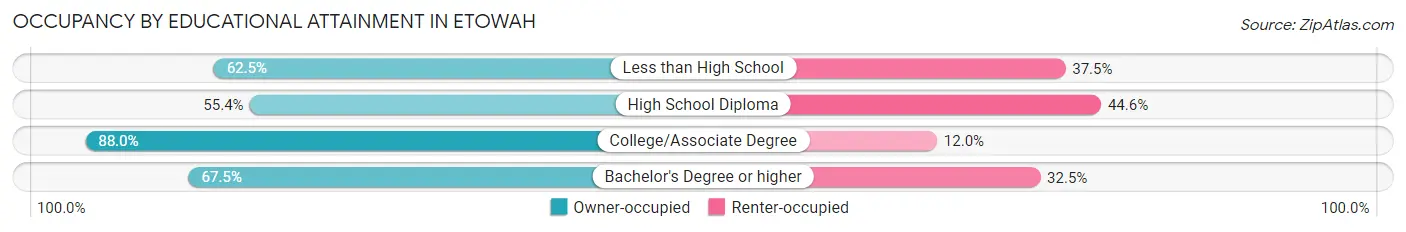
| Household Size | Owner-occupied | Renter-occupied |
| Less than High School | 110 (62.5%) | 66 (37.5%) |
| High School Diploma | 347 (55.4%) | 279 (44.6%) |
| College/Associate Degree | 241 (88.0%) | 33 (12.0%) |
| Bachelor's Degree or higher | 191 (67.5%) | 92 (32.5%) |
Occupancy by Age of Householder in Etowah
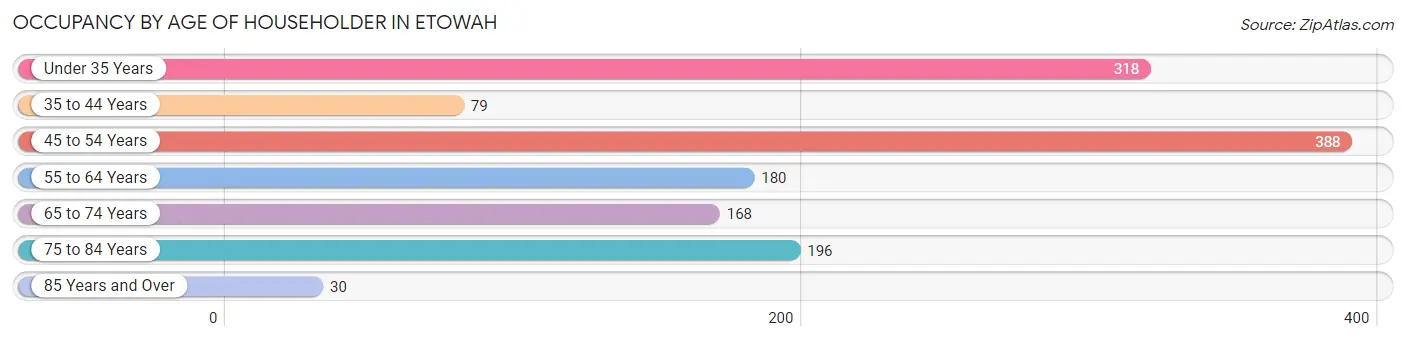
| Age Bracket | # Households | % Households |
| Under 35 Years | 318 | 23.4% |
| 35 to 44 Years | 79 | 5.8% |
| 45 to 54 Years | 388 | 28.5% |
| 55 to 64 Years | 180 | 13.3% |
| 65 to 74 Years | 168 | 12.4% |
| 75 to 84 Years | 196 | 14.4% |
| 85 Years and Over | 30 | 2.2% |
| Total | 1,359 | 100.0% |
Housing Finances in Etowah
Median Income by Occupancy in Etowah
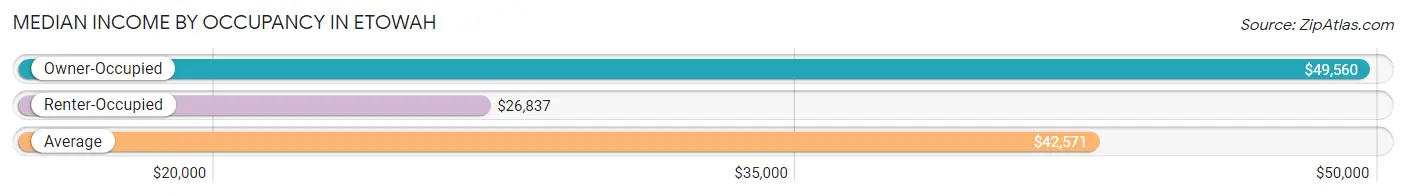
| Occupancy Type | # Households | Median Income |
| Owner-Occupied | 889 (65.4%) | $49,560 |
| Renter-Occupied | 470 (34.6%) | $26,837 |
| Average | 1,359 (100.0%) | $42,571 |
Occupancy by Householder Income Bracket in Etowah
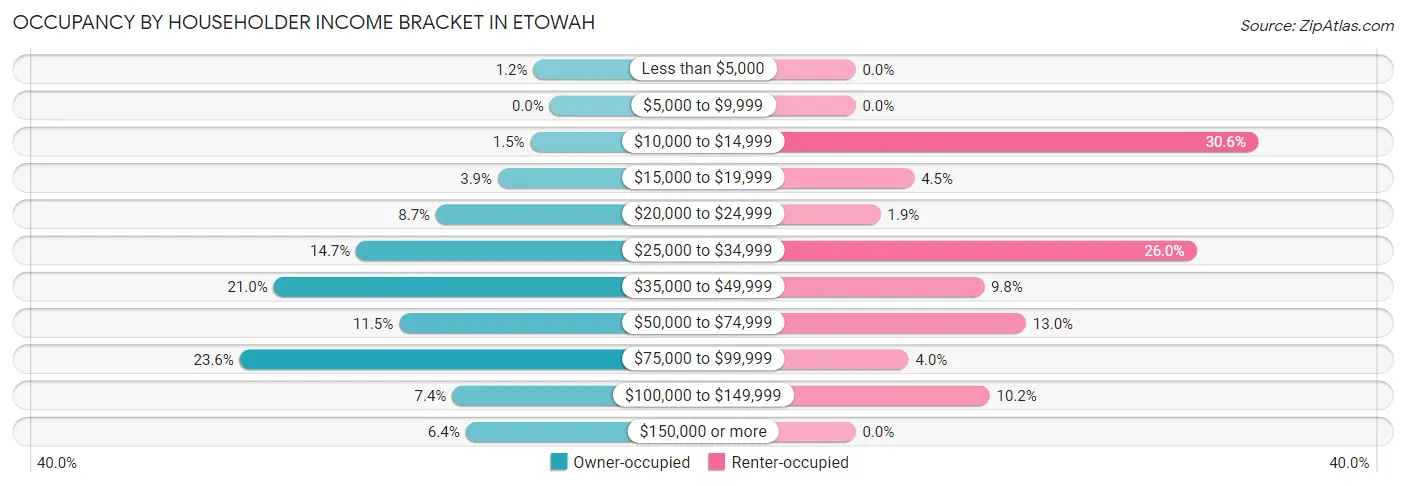
| Income Bracket | Owner-occupied | Renter-occupied |
| Less than $5,000 | 11 (1.2%) | 0 (0.0%) |
| $5,000 to $9,999 | 0 (0.0%) | 0 (0.0%) |
| $10,000 to $14,999 | 13 (1.5%) | 144 (30.6%) |
| $15,000 to $19,999 | 35 (3.9%) | 21 (4.5%) |
| $20,000 to $24,999 | 77 (8.7%) | 9 (1.9%) |
| $25,000 to $34,999 | 131 (14.7%) | 122 (26.0%) |
| $35,000 to $49,999 | 187 (21.0%) | 46 (9.8%) |
| $50,000 to $74,999 | 102 (11.5%) | 61 (13.0%) |
| $75,000 to $99,999 | 210 (23.6%) | 19 (4.0%) |
| $100,000 to $149,999 | 66 (7.4%) | 48 (10.2%) |
| $150,000 or more | 57 (6.4%) | 0 (0.0%) |
| Total | 889 (100.0%) | 470 (100.0%) |
Monthly Housing Cost Tiers in Etowah
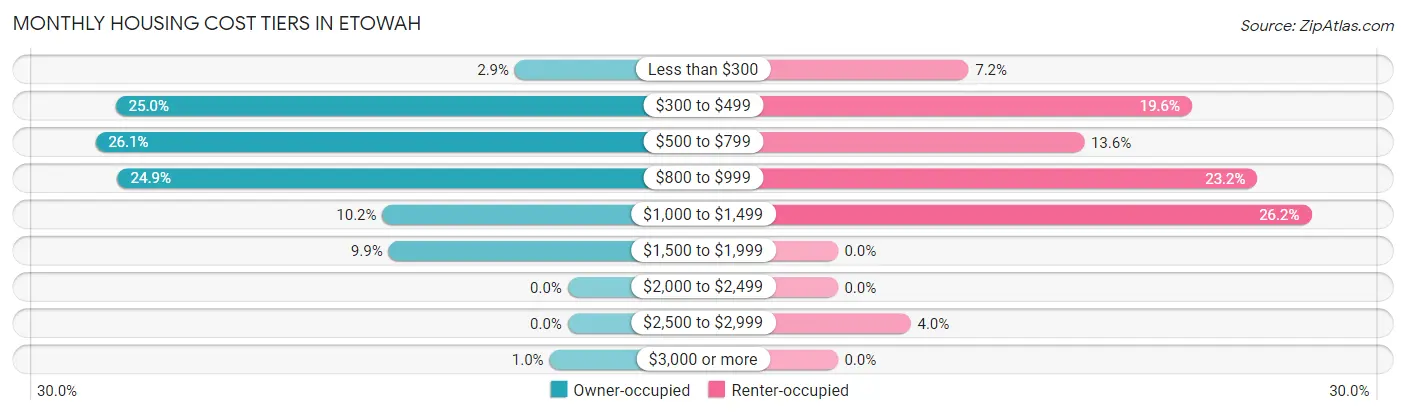
| Monthly Cost | Owner-occupied | Renter-occupied |
| Less than $300 | 26 (2.9%) | 34 (7.2%) |
| $300 to $499 | 222 (25.0%) | 92 (19.6%) |
| $500 to $799 | 232 (26.1%) | 64 (13.6%) |
| $800 to $999 | 221 (24.9%) | 109 (23.2%) |
| $1,000 to $1,499 | 91 (10.2%) | 123 (26.2%) |
| $1,500 to $1,999 | 88 (9.9%) | 0 (0.0%) |
| $2,000 to $2,499 | 0 (0.0%) | 0 (0.0%) |
| $2,500 to $2,999 | 0 (0.0%) | 19 (4.0%) |
| $3,000 or more | 9 (1.0%) | 0 (0.0%) |
| Total | 889 (100.0%) | 470 (100.0%) |
Physical Housing Characteristics in Etowah
Housing Structures in Etowah
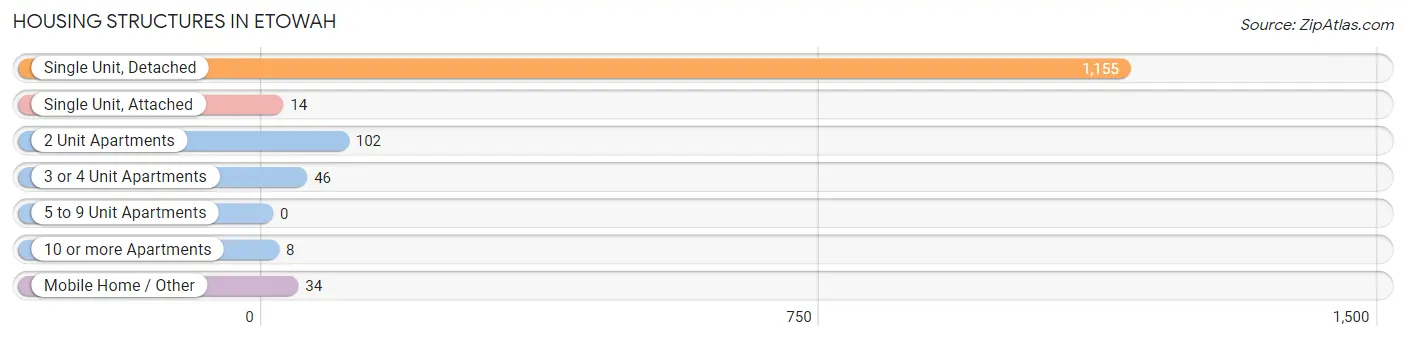
| Structure Type | # Housing Units | % Housing Units |
| Single Unit, Detached | 1,155 | 85.0% |
| Single Unit, Attached | 14 | 1.0% |
| 2 Unit Apartments | 102 | 7.5% |
| 3 or 4 Unit Apartments | 46 | 3.4% |
| 5 to 9 Unit Apartments | 0 | 0.0% |
| 10 or more Apartments | 8 | 0.6% |
| Mobile Home / Other | 34 | 2.5% |
| Total | 1,359 | 100.0% |
Housing Structures by Occupancy in Etowah
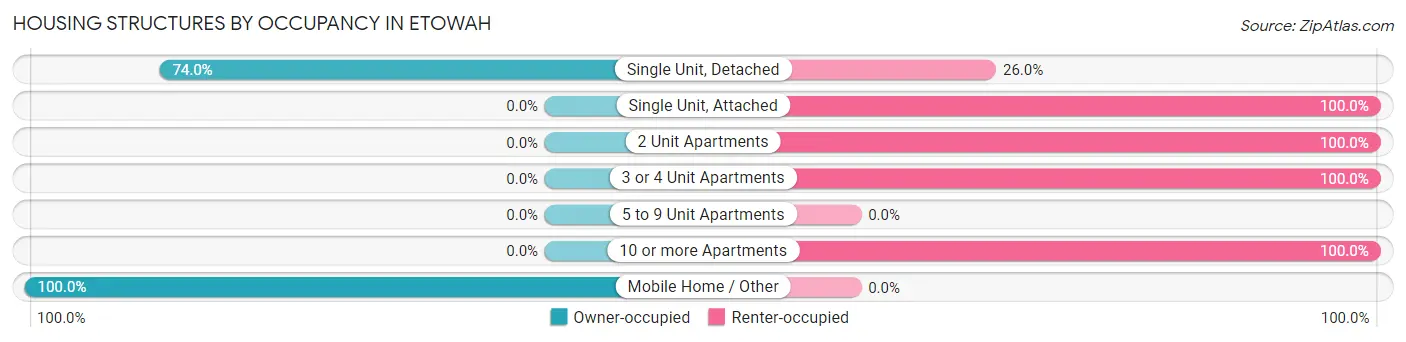
| Structure Type | Owner-occupied | Renter-occupied |
| Single Unit, Detached | 855 (74.0%) | 300 (26.0%) |
| Single Unit, Attached | 0 (0.0%) | 14 (100.0%) |
| 2 Unit Apartments | 0 (0.0%) | 102 (100.0%) |
| 3 or 4 Unit Apartments | 0 (0.0%) | 46 (100.0%) |
| 5 to 9 Unit Apartments | 0 (0.0%) | 0 (0.0%) |
| 10 or more Apartments | 0 (0.0%) | 8 (100.0%) |
| Mobile Home / Other | 34 (100.0%) | 0 (0.0%) |
| Total | 889 (65.4%) | 470 (34.6%) |
Housing Structures by Number of Rooms in Etowah
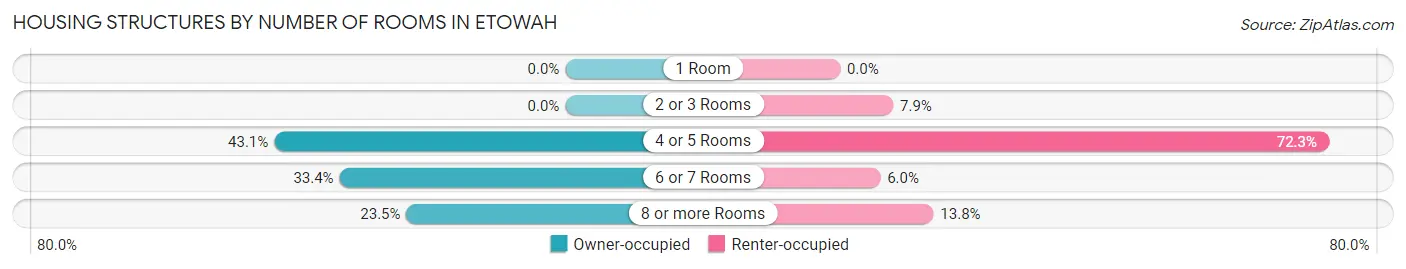
| Number of Rooms | Owner-occupied | Renter-occupied |
| 1 Room | 0 (0.0%) | 0 (0.0%) |
| 2 or 3 Rooms | 0 (0.0%) | 37 (7.9%) |
| 4 or 5 Rooms | 383 (43.1%) | 340 (72.3%) |
| 6 or 7 Rooms | 297 (33.4%) | 28 (6.0%) |
| 8 or more Rooms | 209 (23.5%) | 65 (13.8%) |
| Total | 889 (100.0%) | 470 (100.0%) |
Housing Structure by Heating Type in Etowah
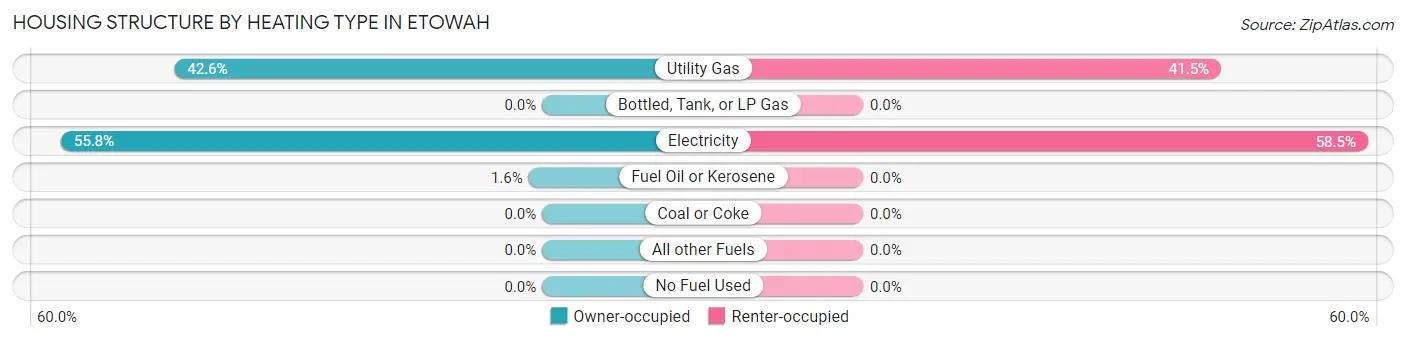
| Heating Type | Owner-occupied | Renter-occupied |
| Utility Gas | 379 (42.6%) | 195 (41.5%) |
| Bottled, Tank, or LP Gas | 0 (0.0%) | 0 (0.0%) |
| Electricity | 496 (55.8%) | 275 (58.5%) |
| Fuel Oil or Kerosene | 14 (1.6%) | 0 (0.0%) |
| Coal or Coke | 0 (0.0%) | 0 (0.0%) |
| All other Fuels | 0 (0.0%) | 0 (0.0%) |
| No Fuel Used | 0 (0.0%) | 0 (0.0%) |
| Total | 889 (100.0%) | 470 (100.0%) |
Household Vehicle Usage in Etowah
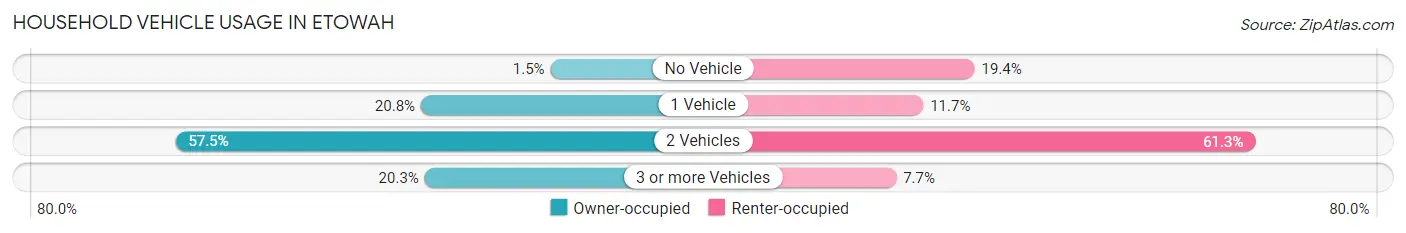
| Vehicles per Household | Owner-occupied | Renter-occupied |
| No Vehicle | 13 (1.5%) | 91 (19.4%) |
| 1 Vehicle | 185 (20.8%) | 55 (11.7%) |
| 2 Vehicles | 511 (57.5%) | 288 (61.3%) |
| 3 or more Vehicles | 180 (20.3%) | 36 (7.7%) |
| Total | 889 (100.0%) | 470 (100.0%) |
Real Estate & Mortgages in Etowah
Real Estate and Mortgage Overview in Etowah
| Characteristic | Without Mortgage | With Mortgage |
| Housing Units | 355 | 534 |
| Median Property Value | $158,900 | $114,100 |
| Median Household Income | $54,050 | $50 |
| Monthly Housing Costs | $449 | $9 |
| Real Estate Taxes | $692 | $14 |
Property Value by Mortgage Status in Etowah
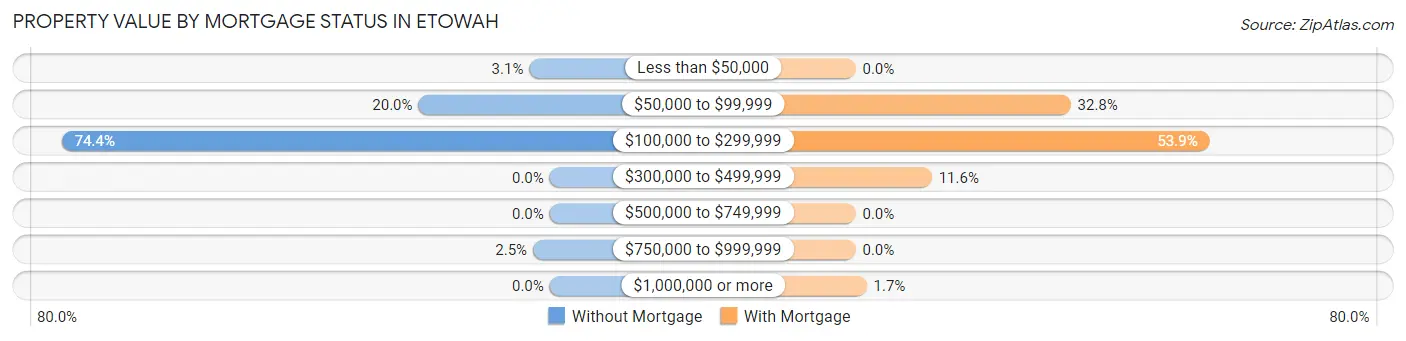
| Property Value | Without Mortgage | With Mortgage |
| Less than $50,000 | 11 (3.1%) | 0 (0.0%) |
| $50,000 to $99,999 | 71 (20.0%) | 175 (32.8%) |
| $100,000 to $299,999 | 264 (74.4%) | 288 (53.9%) |
| $300,000 to $499,999 | 0 (0.0%) | 62 (11.6%) |
| $500,000 to $749,999 | 0 (0.0%) | 0 (0.0%) |
| $750,000 to $999,999 | 9 (2.5%) | 0 (0.0%) |
| $1,000,000 or more | 0 (0.0%) | 9 (1.7%) |
| Total | 355 (100.0%) | 534 (100.0%) |
Household Income by Mortgage Status in Etowah
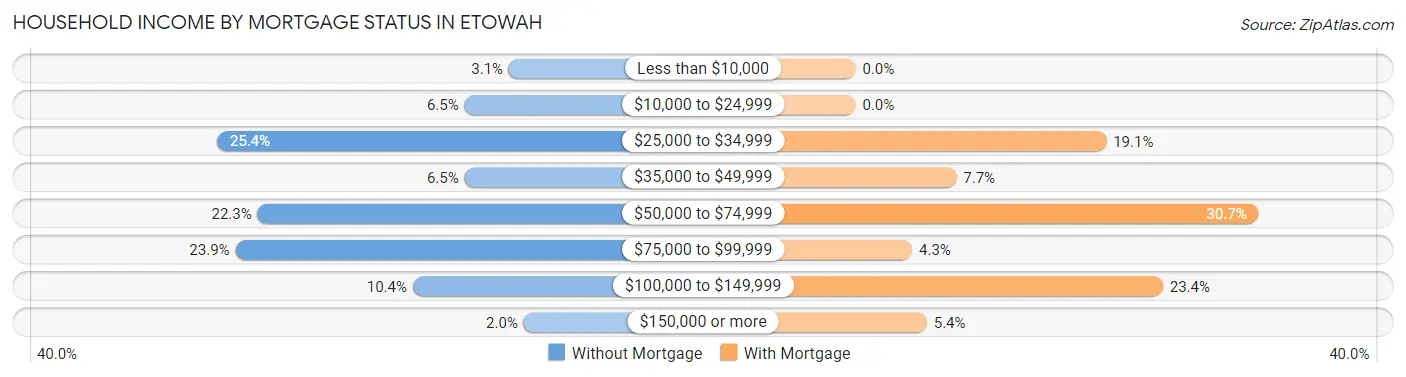
| Household Income | Without Mortgage | With Mortgage |
| Less than $10,000 | 11 (3.1%) | 0 (0.0%) |
| $10,000 to $24,999 | 23 (6.5%) | 0 (0.0%) |
| $25,000 to $34,999 | 90 (25.4%) | 102 (19.1%) |
| $35,000 to $49,999 | 23 (6.5%) | 41 (7.7%) |
| $50,000 to $74,999 | 79 (22.3%) | 164 (30.7%) |
| $75,000 to $99,999 | 85 (23.9%) | 23 (4.3%) |
| $100,000 to $149,999 | 37 (10.4%) | 125 (23.4%) |
| $150,000 or more | 7 (2.0%) | 29 (5.4%) |
| Total | 355 (100.0%) | 534 (100.0%) |
Property Value to Household Income Ratio in Etowah
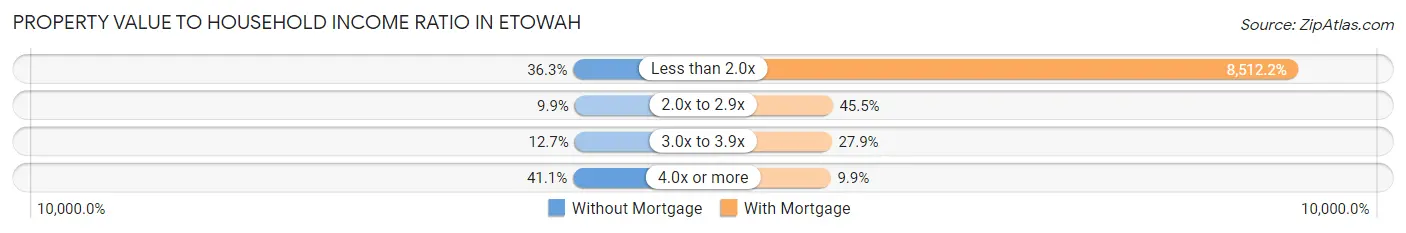
| Value-to-Income Ratio | Without Mortgage | With Mortgage |
| Less than 2.0x | 129 (36.3%) | 45,455 (8,512.2%) |
| 2.0x to 2.9x | 35 (9.9%) | 243 (45.5%) |
| 3.0x to 3.9x | 45 (12.7%) | 149 (27.9%) |
| 4.0x or more | 146 (41.1%) | 53 (9.9%) |
| Total | 355 (100.0%) | 534 (100.0%) |
Real Estate Taxes by Mortgage Status in Etowah
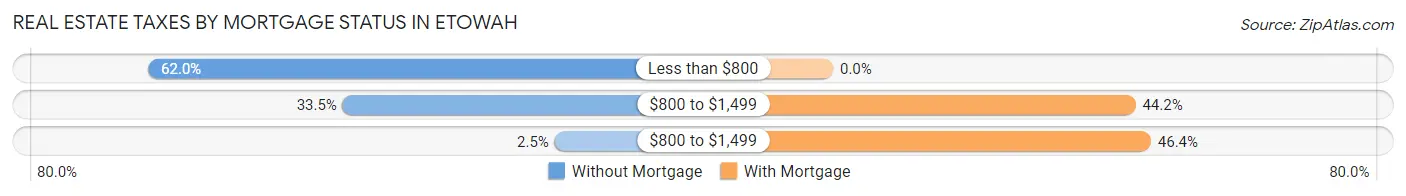
| Property Taxes | Without Mortgage | With Mortgage |
| Less than $800 | 220 (62.0%) | 0 (0.0%) |
| $800 to $1,499 | 119 (33.5%) | 236 (44.2%) |
| $800 to $1,499 | 9 (2.5%) | 248 (46.4%) |
| Total | 355 (100.0%) | 534 (100.0%) |
Health & Disability in Etowah
Health Insurance Coverage by Age in Etowah
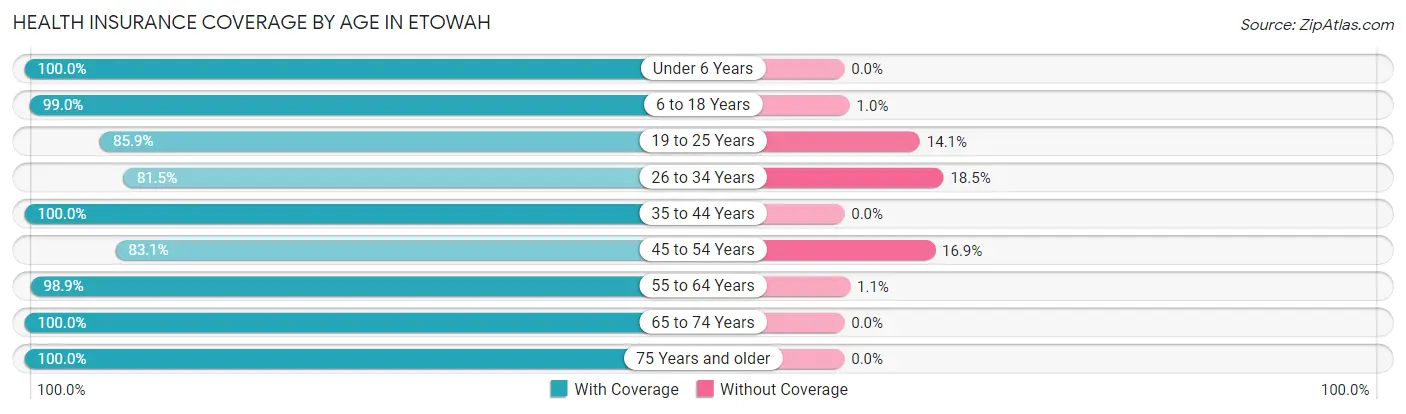
| Age Bracket | With Coverage | Without Coverage |
| Under 6 Years | 520 (100.0%) | 0 (0.0%) |
| 6 to 18 Years | 396 (99.0%) | 4 (1.0%) |
| 19 to 25 Years | 311 (85.9%) | 51 (14.1%) |
| 26 to 34 Years | 326 (81.5%) | 74 (18.5%) |
| 35 to 44 Years | 207 (100.0%) | 0 (0.0%) |
| 45 to 54 Years | 417 (83.1%) | 85 (16.9%) |
| 55 to 64 Years | 365 (98.9%) | 4 (1.1%) |
| 65 to 74 Years | 297 (100.0%) | 0 (0.0%) |
| 75 Years and older | 360 (100.0%) | 0 (0.0%) |
| Total | 3,199 (93.6%) | 218 (6.4%) |
Health Insurance Coverage by Citizenship Status in Etowah
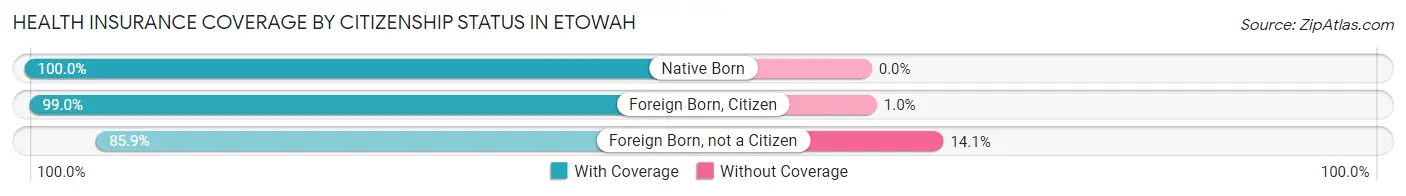
| Citizenship Status | With Coverage | Without Coverage |
| Native Born | 520 (100.0%) | 0 (0.0%) |
| Foreign Born, Citizen | 396 (99.0%) | 4 (1.0%) |
| Foreign Born, not a Citizen | 311 (85.9%) | 51 (14.1%) |
Health Insurance Coverage by Household Income in Etowah
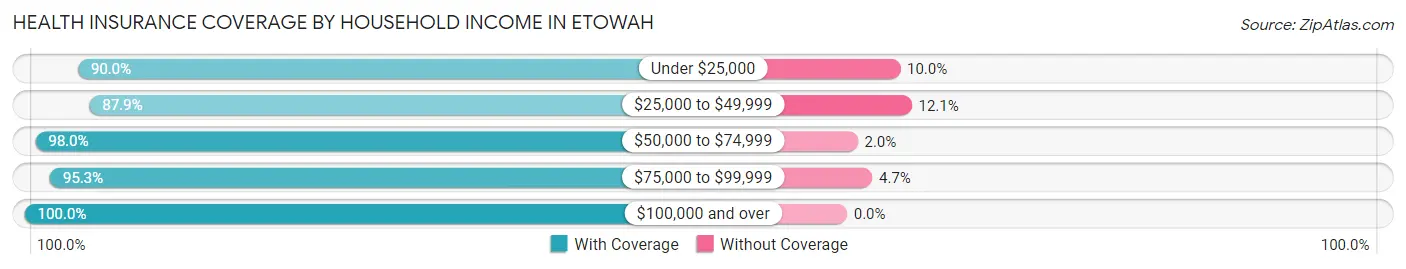
| Household Income | With Coverage | Without Coverage |
| Under $25,000 | 533 (90.0%) | 59 (10.0%) |
| $25,000 to $49,999 | 826 (87.9%) | 114 (12.1%) |
| $50,000 to $74,999 | 439 (98.0%) | 9 (2.0%) |
| $75,000 to $99,999 | 723 (95.3%) | 36 (4.7%) |
| $100,000 and over | 674 (100.0%) | 0 (0.0%) |
Public vs Private Health Insurance Coverage by Age in Etowah
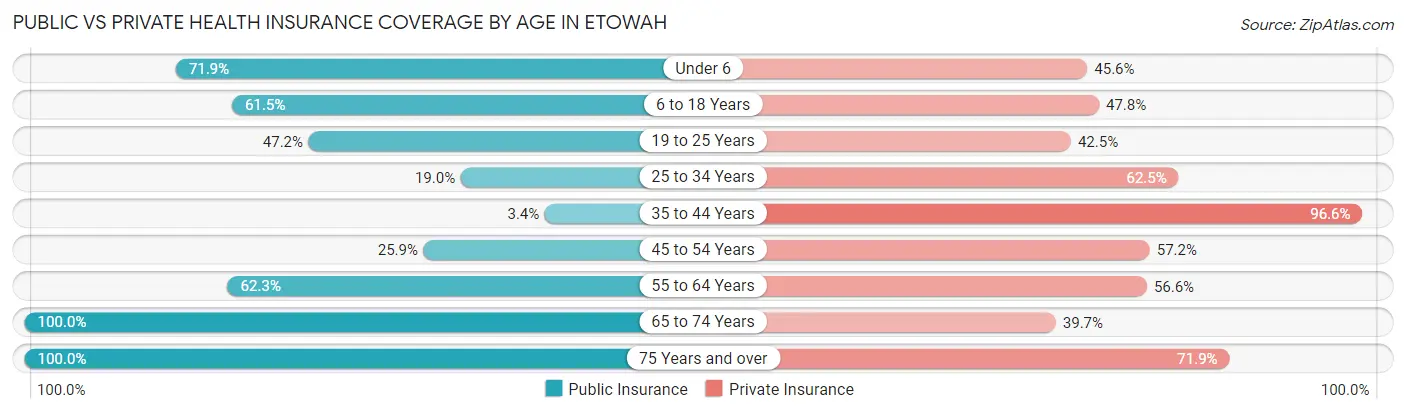
| Age Bracket | Public Insurance | Private Insurance |
| Under 6 | 374 (71.9%) | 237 (45.6%) |
| 6 to 18 Years | 246 (61.5%) | 191 (47.7%) |
| 19 to 25 Years | 171 (47.2%) | 154 (42.5%) |
| 25 to 34 Years | 76 (19.0%) | 250 (62.5%) |
| 35 to 44 Years | 7 (3.4%) | 200 (96.6%) |
| 45 to 54 Years | 130 (25.9%) | 287 (57.2%) |
| 55 to 64 Years | 230 (62.3%) | 209 (56.6%) |
| 65 to 74 Years | 297 (100.0%) | 118 (39.7%) |
| 75 Years and over | 360 (100.0%) | 259 (71.9%) |
| Total | 1,891 (55.3%) | 1,905 (55.7%) |
Disability Status by Sex by Age in Etowah
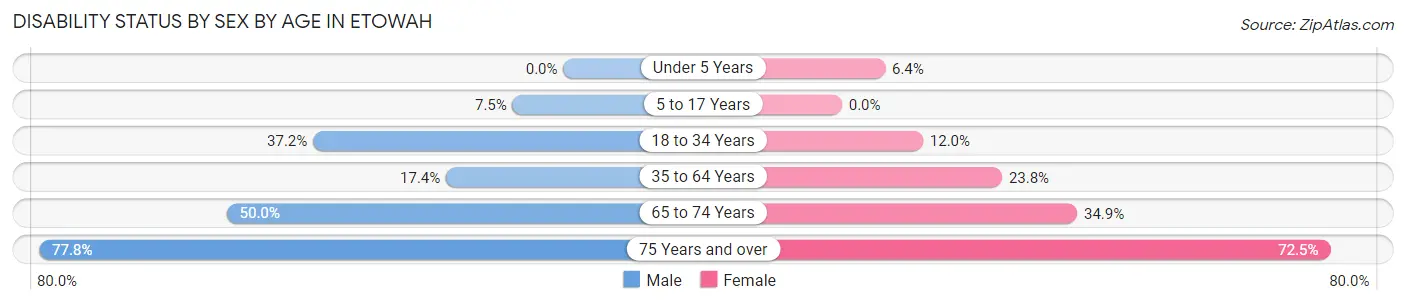
| Age Bracket | Male | Female |
| Under 5 Years | 0 (0.0%) | 12 (6.4%) |
| 5 to 17 Years | 14 (7.5%) | 0 (0.0%) |
| 18 to 34 Years | 136 (37.2%) | 49 (12.0%) |
| 35 to 64 Years | 113 (17.4%) | 102 (23.8%) |
| 65 to 74 Years | 44 (50.0%) | 73 (34.9%) |
| 75 Years and over | 130 (77.8%) | 140 (72.5%) |
Disability Class by Sex by Age in Etowah
Disability Class: Hearing Difficulty
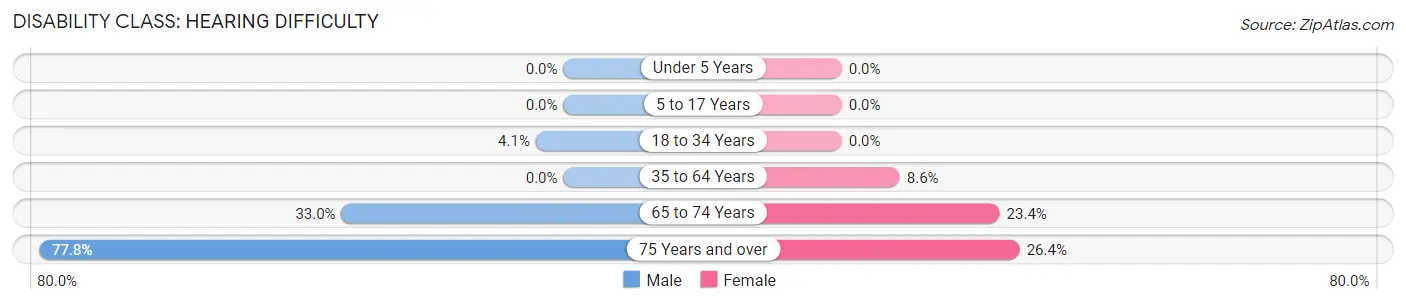
| Age Bracket | Male | Female |
| Under 5 Years | 0 (0.0%) | 0 (0.0%) |
| 5 to 17 Years | 0 (0.0%) | 0 (0.0%) |
| 18 to 34 Years | 15 (4.1%) | 0 (0.0%) |
| 35 to 64 Years | 0 (0.0%) | 37 (8.6%) |
| 65 to 74 Years | 29 (33.0%) | 49 (23.4%) |
| 75 Years and over | 130 (77.8%) | 51 (26.4%) |
Disability Class: Vision Difficulty
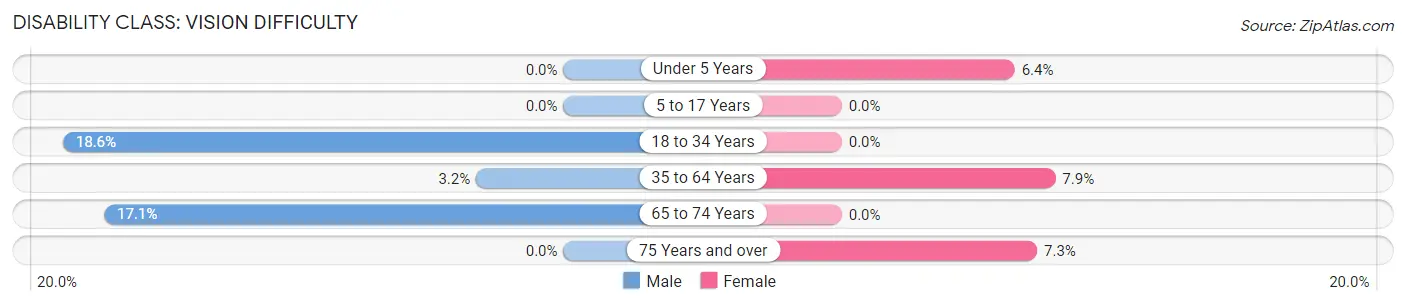
| Age Bracket | Male | Female |
| Under 5 Years | 0 (0.0%) | 12 (6.4%) |
| 5 to 17 Years | 0 (0.0%) | 0 (0.0%) |
| 18 to 34 Years | 68 (18.6%) | 0 (0.0%) |
| 35 to 64 Years | 21 (3.2%) | 34 (7.9%) |
| 65 to 74 Years | 15 (17.1%) | 0 (0.0%) |
| 75 Years and over | 0 (0.0%) | 14 (7.2%) |
Disability Class: Cognitive Difficulty
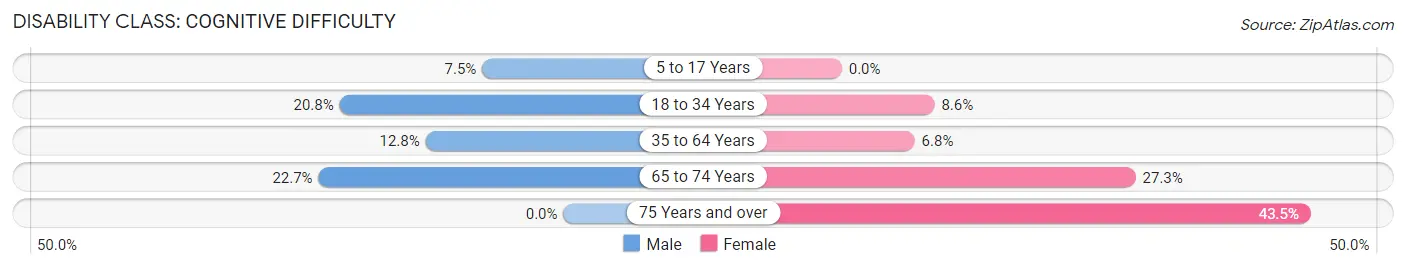
| Age Bracket | Male | Female |
| 5 to 17 Years | 14 (7.5%) | 0 (0.0%) |
| 18 to 34 Years | 76 (20.8%) | 35 (8.6%) |
| 35 to 64 Years | 83 (12.8%) | 29 (6.8%) |
| 65 to 74 Years | 20 (22.7%) | 57 (27.3%) |
| 75 Years and over | 0 (0.0%) | 84 (43.5%) |
Disability Class: Ambulatory Difficulty
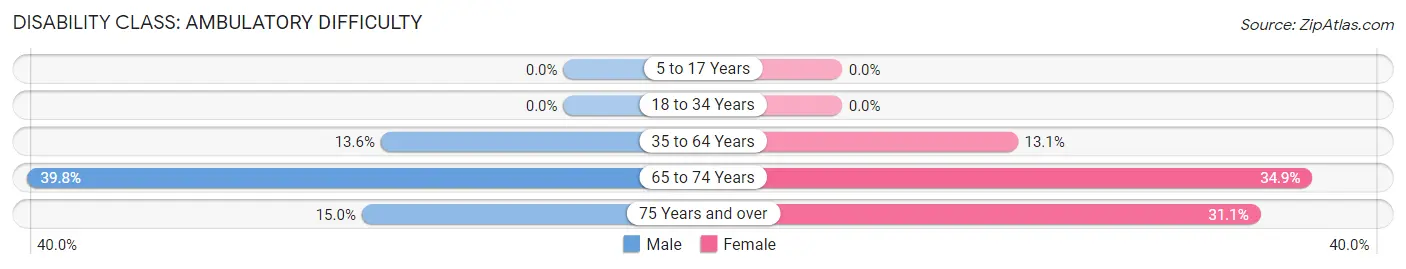
| Age Bracket | Male | Female |
| 5 to 17 Years | 0 (0.0%) | 0 (0.0%) |
| 18 to 34 Years | 0 (0.0%) | 0 (0.0%) |
| 35 to 64 Years | 88 (13.6%) | 56 (13.1%) |
| 65 to 74 Years | 35 (39.8%) | 73 (34.9%) |
| 75 Years and over | 25 (15.0%) | 60 (31.1%) |
Disability Class: Self-Care Difficulty
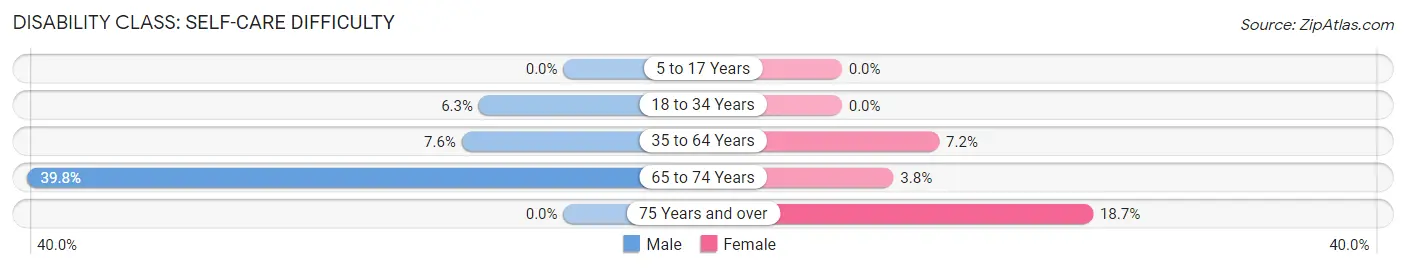
| Age Bracket | Male | Female |
| 5 to 17 Years | 0 (0.0%) | 0 (0.0%) |
| 18 to 34 Years | 23 (6.3%) | 0 (0.0%) |
| 35 to 64 Years | 49 (7.5%) | 31 (7.2%) |
| 65 to 74 Years | 35 (39.8%) | 8 (3.8%) |
| 75 Years and over | 0 (0.0%) | 36 (18.6%) |
Technology Access in Etowah
Computing Device Access in Etowah
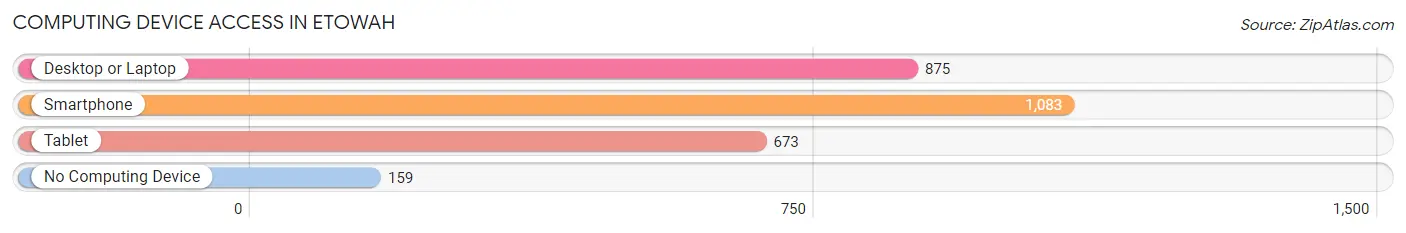
| Device Type | # Households | % Households |
| Desktop or Laptop | 875 | 64.4% |
| Smartphone | 1,083 | 79.7% |
| Tablet | 673 | 49.5% |
| No Computing Device | 159 | 11.7% |
| Total | 1,359 | 100.0% |
Internet Access in Etowah
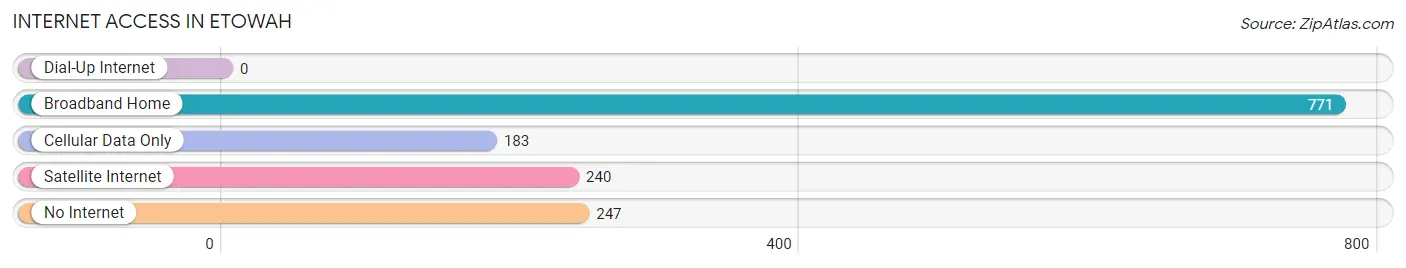
| Internet Type | # Households | % Households |
| Dial-Up Internet | 0 | 0.0% |
| Broadband Home | 771 | 56.7% |
| Cellular Data Only | 183 | 13.5% |
| Satellite Internet | 240 | 17.7% |
| No Internet | 247 | 18.2% |
| Total | 1,359 | 100.0% |
Etowah Summary
Etowah is a small town located in McMinn County, Tennessee. It is situated in the foothills of the Appalachian Mountains, approximately 25 miles northeast of Chattanooga. The town was founded in 1820 and has a population of approximately 1,500 people.
History
Etowah was founded in 1820 by a group of settlers from North Carolina. The town was named after the Cherokee word for “town” or “village”. The town was originally a farming community, but it soon became a center for the production of iron and steel. The Etowah Iron Works was established in 1845 and was the first iron works in the state of Tennessee. The iron works produced a variety of products, including railroad tracks, bridges, and other iron products.
The town was also home to a number of other industries, including a cotton mill, a flour mill, and a sawmill. The town was also home to a number of churches, including the First Baptist Church, which was founded in 1845.
Geography
Etowah is located in the foothills of the Appalachian Mountains, approximately 25 miles northeast of Chattanooga. The town is situated on the banks of the Hiwassee River, which flows through the town. The town is surrounded by rolling hills and is home to a number of parks and recreational areas.
Economy
The economy of Etowah is largely based on agriculture and manufacturing. The town is home to a number of farms, which produce a variety of crops, including corn, soybeans, and wheat. The town is also home to a number of manufacturing companies, including a steel mill, a paper mill, and a furniture factory.
Demographics
As of the 2010 census, the population of Etowah was 1,500 people. The town is predominantly white, with approximately 95% of the population being white. The median household income in the town is $35,000, and the median age is 40 years old.
Conclusion
Etowah is a small town located in McMinn County, Tennessee. It was founded in 1820 and has a population of approximately 1,500 people. The town is situated in the foothills of the Appalachian Mountains and is home to a number of industries, including a steel mill, a paper mill, and a furniture factory. The economy of Etowah is largely based on agriculture and manufacturing, and the town is predominantly white, with approximately 95% of the population being white.
Common Questions
What is the Total Population of Etowah?
Total Population of Etowah is 3,614.
What is the Total Male Population of Etowah?
Total Male Population of Etowah is 1,872.
What is the Total Female Population of Etowah?
Total Female Population of Etowah is 1,742.
What is the Ratio of Males per 100 Females in Etowah?
There are 107.46 Males per 100 Females in Etowah.
What is the Ratio of Females per 100 Males in Etowah?
There are 93.06 Females per 100 Males in Etowah.
What is the Median Population Age in Etowah?
Median Population Age in Etowah is 40.7 Years.
What is the Average Family Size in Etowah
Average Family Size in Etowah is 3.2 People.
What is the Average Household Size in Etowah
Average Household Size in Etowah is 2.5 People.
What is Per Capita Income in Etowah?
Per Capita income in Etowah is $29,007.
What is the Median Family Income in Etowah?
Median Family Income in Etowah is $57,656.
What is the Median Household income in Etowah?
Median Household Income in Etowah is $42,571.
What is Income or Wage Gap in Etowah?
Income or Wage Gap in Etowah is 56.4%.
Women in Etowah earn 43.6 cents for every dollar earned by a man.
What is Inequality or Gini Index in Etowah?
Inequality or Gini Index in Etowah is 0.55.
How Large is the Labor Force in Etowah?
There are 1,522 People in the Labor Forcein in Etowah.
What is the Percentage of People in the Labor Force in Etowah?
54.7% of People are in the Labor Force in Etowah.
What is the Unemployment Rate in Etowah?
Unemployment Rate in Etowah is 18.1%.