Smithton borough, PA
Smithton borough Overview
405
TOTAL POPULATION
202
MALE POPULATION
203
FEMALE POPULATION
99.51
MALES / 100 FEMALES
100.50
FEMALES / 100 MALES
36.9
MEDIAN AGE
3.2
AVG FAMILY SIZE
2.7
AVG HOUSEHOLD SIZE
$28,071
PER CAPITA INCOME
$60,000
AVG FAMILY INCOME
$49,821
AVG HOUSEHOLD INCOME
0.48
INEQUALITY / GINI INDEX
160
LABOR FORCE [ PEOPLE ]
53.5%
PERCENT IN LABOR FORCE
11.3%
UNEMPLOYMENT RATE
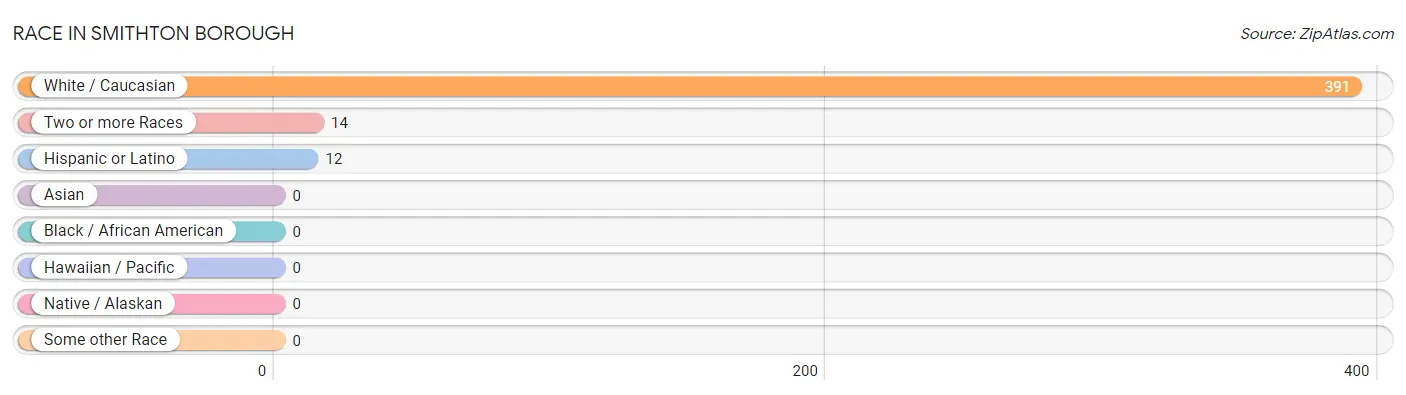
Race in Smithton borough
The most populous races in Smithton borough are White / Caucasian (391 | 96.5%), Two or more Races (14 | 3.5%), and Hispanic or Latino (12 | 3.0%).
| Race | # Population | % Population |
| Asian | 0 | 0.0% |
| Black / African American | 0 | 0.0% |
| Hawaiian / Pacific | 0 | 0.0% |
| Hispanic or Latino | 12 | 3.0% |
| Native / Alaskan | 0 | 0.0% |
| White / Caucasian | 391 | 96.5% |
| Two or more Races | 14 | 3.5% |
| Some other Race | 0 | 0.0% |
| Total | 405 | 100.0% |
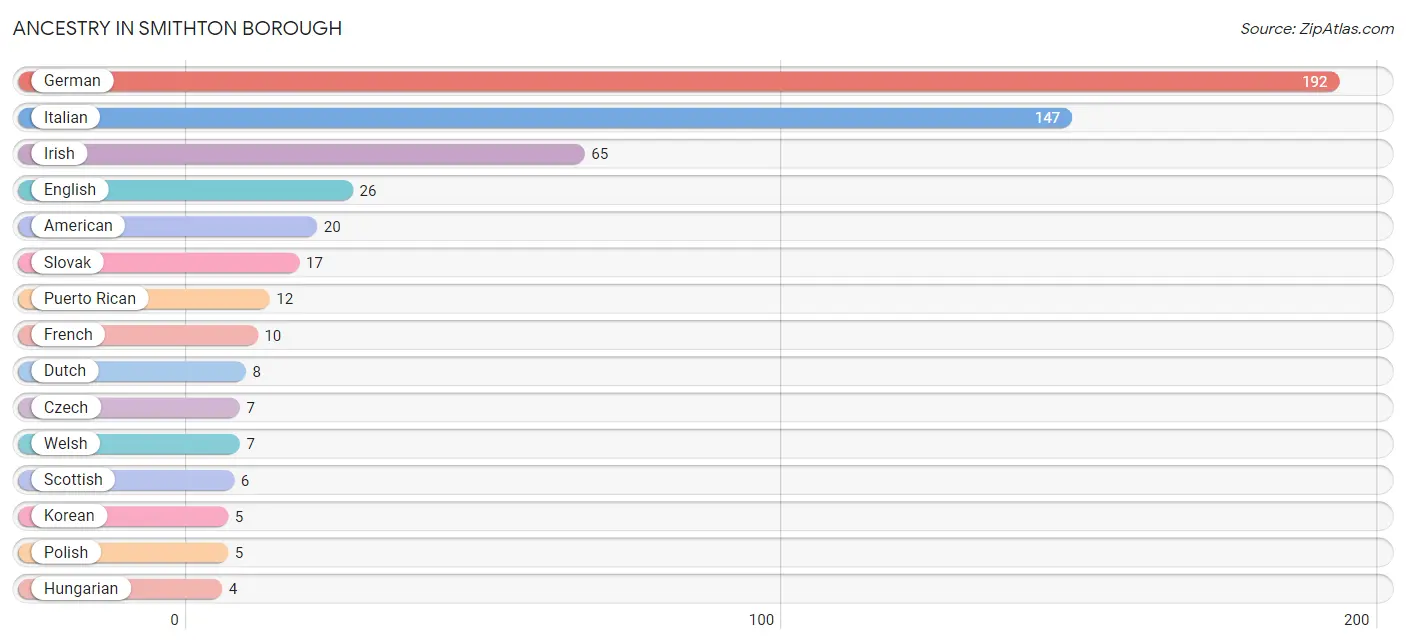
Ancestry in Smithton borough
The most populous ancestries reported in Smithton borough are German (192 | 47.4%), Italian (147 | 36.3%), Irish (65 | 16.1%), English (26 | 6.4%), and American (20 | 4.9%), together accounting for 111.1% of all Smithton borough residents.
| Ancestry | # Population | % Population |
| American | 20 | 4.9% |
| Czech | 7 | 1.7% |
| Dutch | 8 | 2.0% |
| English | 26 | 6.4% |
| European | 3 | 0.7% |
| French | 10 | 2.5% |
| German | 192 | 47.4% |
| Hungarian | 4 | 1.0% |
| Irish | 65 | 16.1% |
| Italian | 147 | 36.3% |
| Korean | 5 | 1.2% |
| Polish | 5 | 1.2% |
| Puerto Rican | 12 | 3.0% |
| Scottish | 6 | 1.5% |
| Slovak | 17 | 4.2% |
| Swedish | 3 | 0.7% |
| Welsh | 7 | 1.7% | View All 17 Rows |
Immigrants in Smithton borough

| Immigration Origin | # Population | % Population | View All 0 Rows |
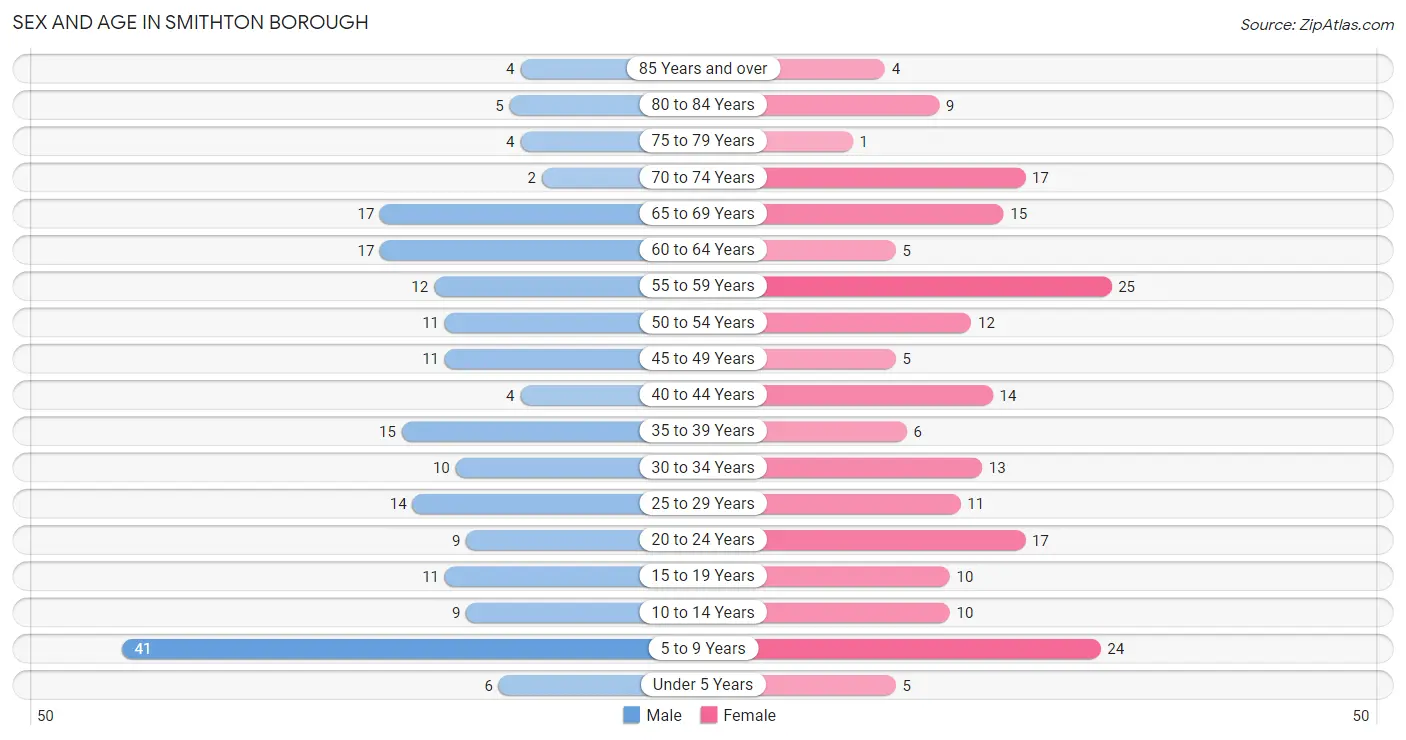
Sex and Age in Smithton borough
Sex and Age in Smithton borough
The most populous age groups in Smithton borough are 5 to 9 Years (41 | 20.3%) for men and 55 to 59 Years (25 | 12.3%) for women.
| Age Bracket | Male | Female |
| Under 5 Years | 6 (3.0%) | 5 (2.5%) |
| 5 to 9 Years | 41 (20.3%) | 24 (11.8%) |
| 10 to 14 Years | 9 (4.5%) | 10 (4.9%) |
| 15 to 19 Years | 11 (5.4%) | 10 (4.9%) |
| 20 to 24 Years | 9 (4.5%) | 17 (8.4%) |
| 25 to 29 Years | 14 (6.9%) | 11 (5.4%) |
| 30 to 34 Years | 10 (5.0%) | 13 (6.4%) |
| 35 to 39 Years | 15 (7.4%) | 6 (3.0%) |
| 40 to 44 Years | 4 (2.0%) | 14 (6.9%) |
| 45 to 49 Years | 11 (5.4%) | 5 (2.5%) |
| 50 to 54 Years | 11 (5.4%) | 12 (5.9%) |
| 55 to 59 Years | 12 (5.9%) | 25 (12.3%) |
| 60 to 64 Years | 17 (8.4%) | 5 (2.5%) |
| 65 to 69 Years | 17 (8.4%) | 15 (7.4%) |
| 70 to 74 Years | 2 (1.0%) | 17 (8.4%) |
| 75 to 79 Years | 4 (2.0%) | 1 (0.5%) |
| 80 to 84 Years | 5 (2.5%) | 9 (4.4%) |
| 85 Years and over | 4 (2.0%) | 4 (2.0%) |
| Total | 202 (100.0%) | 203 (100.0%) |
Families and Households in Smithton borough
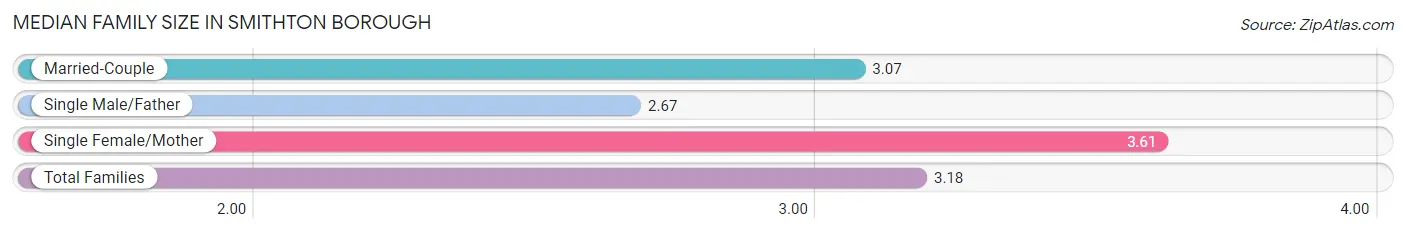
Median Family Size in Smithton borough
The median family size in Smithton borough is 3.18 persons per family, with single female/mother families (31 | 29.8%) accounting for the largest median family size of 3.61 persons per family. On the other hand, single male/father families (12 | 11.5%) represent the smallest median family size with 2.67 persons per family.
| Family Type | # Families | Family Size |
| Married-Couple | 61 (58.7%) | 3.07 |
| Single Male/Father | 12 (11.5%) | 2.67 |
| Single Female/Mother | 31 (29.8%) | 3.61 |
| Total Families | 104 (100.0%) | 3.18 |
Median Household Size in Smithton borough
The median household size in Smithton borough is 2.68 persons per household, with single female/mother households (31 | 20.5%) accounting for the largest median household size of 4.23 persons per household. non-family households (47 | 31.1%) represent the smallest median household size with 1.09 persons per household.
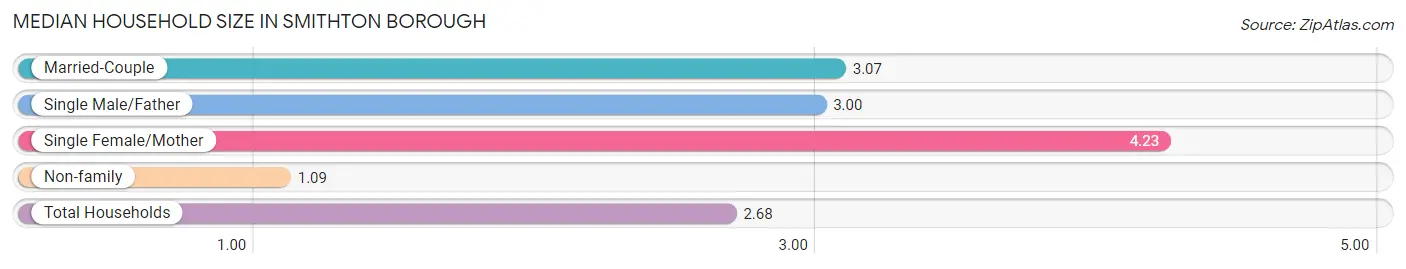
| Household Type | # Households | Household Size |
| Married-Couple | 61 (40.4%) | 3.07 |
| Single Male/Father | 12 (8.0%) | 3.00 |
| Single Female/Mother | 31 (20.5%) | 4.23 |
| Non-family | 47 (31.1%) | 1.09 |
| Total Households | 151 (100.0%) | 2.68 |
Household Size by Marriage Status in Smithton borough
Out of a total of 151 households in Smithton borough, 104 (68.9%) are family households, while 47 (31.1%) are nonfamily households. The most numerous type of family households are 2-person households, comprising 38, and the most common type of nonfamily households are 1-person households, comprising 41.
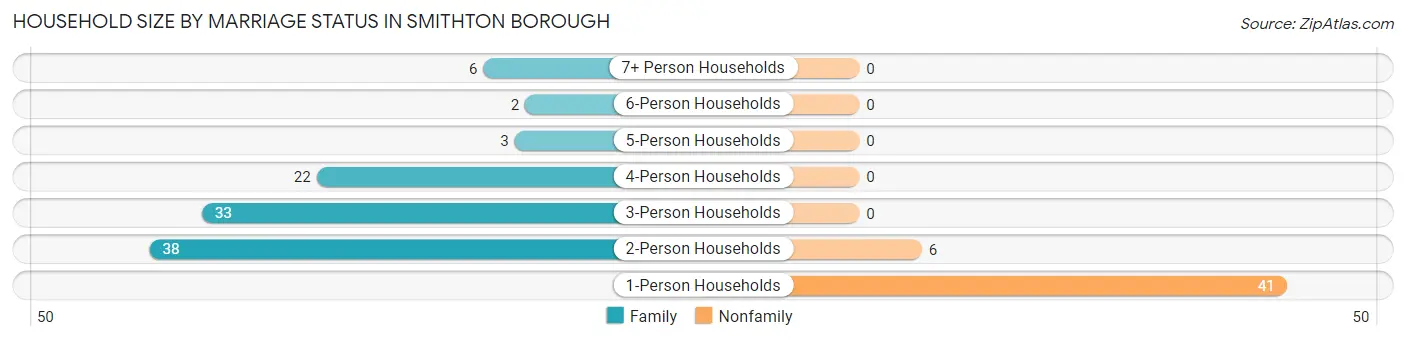
| Household Size | Family Households | Nonfamily Households |
| 1-Person Households | - | 41 (27.2%) |
| 2-Person Households | 38 (25.2%) | 6 (4.0%) |
| 3-Person Households | 33 (21.8%) | 0 (0.0%) |
| 4-Person Households | 22 (14.6%) | 0 (0.0%) |
| 5-Person Households | 3 (2.0%) | 0 (0.0%) |
| 6-Person Households | 2 (1.3%) | 0 (0.0%) |
| 7+ Person Households | 6 (4.0%) | 0 (0.0%) |
| Total | 104 (68.9%) | 47 (31.1%) |
Female Fertility in Smithton borough
Fertility by Age in Smithton borough
Average fertility rate in Smithton borough is 53.0 births per 1,000 women. Women in the age bracket of 20 to 34 years have the highest fertility rate with 98.0 births per 1,000 women. Women in the age bracket of 20 to 34 years acount for 100.0% of all women with births.
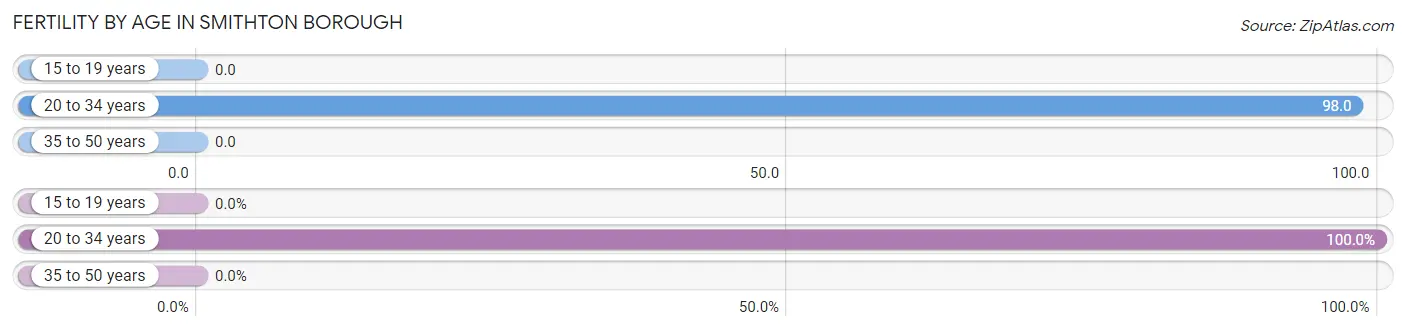
| Age Bracket | Women with Births | Births / 1,000 Women |
| 15 to 19 years | 0 (0.0%) | 0.0 |
| 20 to 34 years | 4 (100.0%) | 98.0 |
| 35 to 50 years | 0 (0.0%) | 0.0 |
| Total | 4 (100.0%) | 53.0 |
Fertility by Age by Marriage Status in Smithton borough
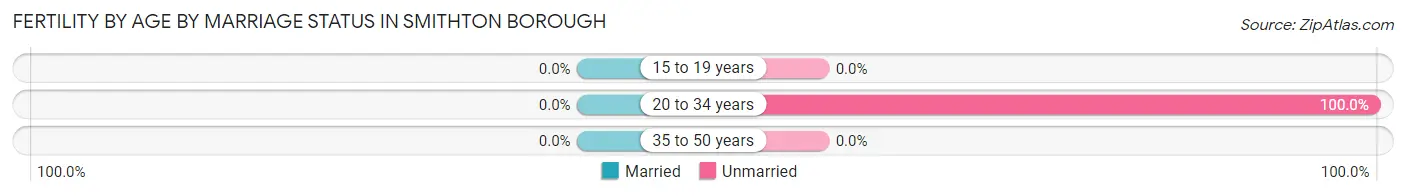
| Age Bracket | Married | Unmarried |
| 15 to 19 years | 0 (0.0%) | 0 (0.0%) |
| 20 to 34 years | 0 (0.0%) | 4 (100.0%) |
| 35 to 50 years | 0 (0.0%) | 0 (0.0%) |
| Total | 0 (0.0%) | 4 (100.0%) |
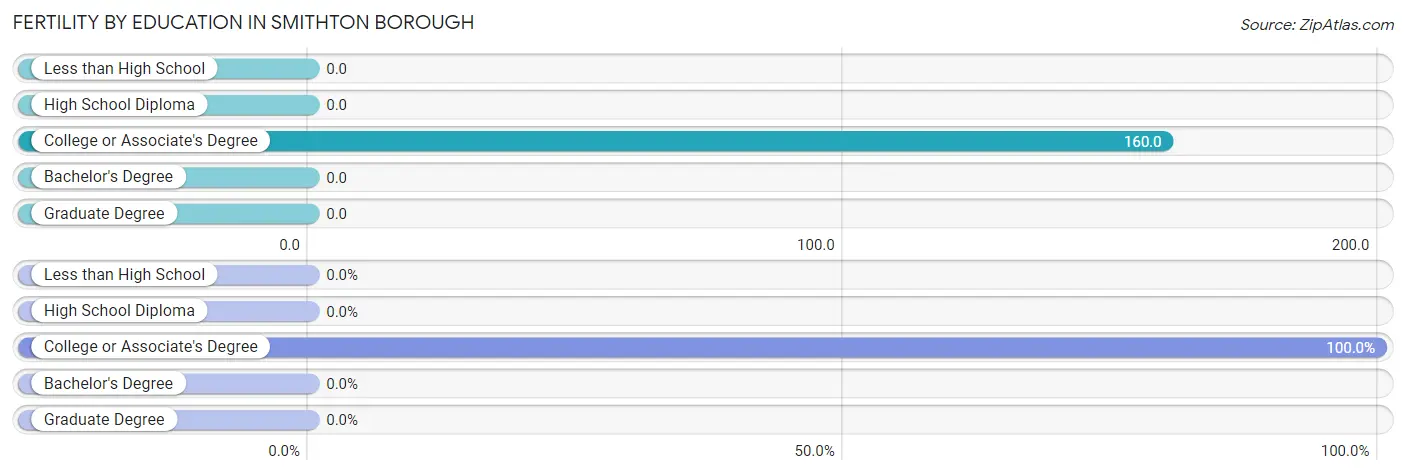
Fertility by Education in Smithton borough
| Educational Attainment | Women with Births | Births / 1,000 Women |
| Less than High School | 0 (0.0%) | 0.0 |
| High School Diploma | 0 (0.0%) | 0.0 |
| College or Associate's Degree | 4 (100.0%) | 160.0 |
| Bachelor's Degree | 0 (0.0%) | 0.0 |
| Graduate Degree | 0 (0.0%) | 0.0 |
| Total | 4 (100.0%) | 53.0 |
Fertility by Education by Marriage Status in Smithton borough
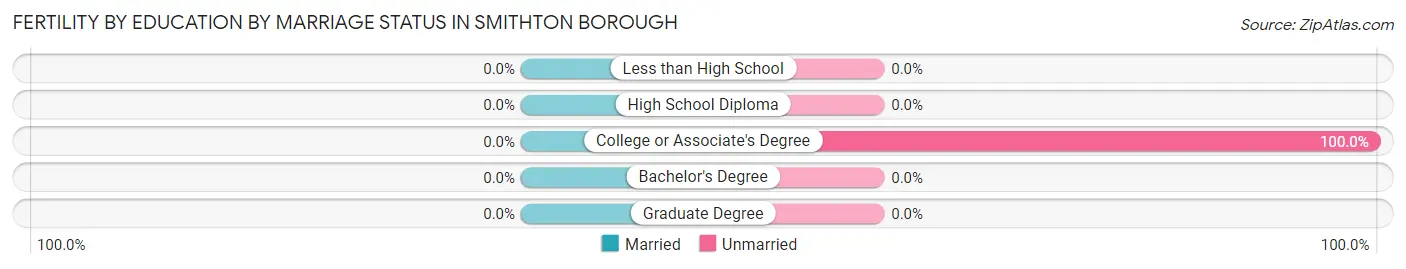
| Educational Attainment | Married | Unmarried |
| Less than High School | 0 (0.0%) | 0 (0.0%) |
| High School Diploma | 0 (0.0%) | 0 (0.0%) |
| College or Associate's Degree | 0 (0.0%) | 4 (100.0%) |
| Bachelor's Degree | 0 (0.0%) | 0 (0.0%) |
| Graduate Degree | 0 (0.0%) | 0 (0.0%) |
| Total | 0 (0.0%) | 4 (100.0%) |
Income in Smithton borough
Income Overview in Smithton borough
Per Capita Income in Smithton borough is $28,071, while median incomes of families and households are $60,000 and $49,821 respectively.
| Characteristic | Number | Measure |
| Per Capita Income | 405 | $28,071 |
| Median Family Income | 104 | $60,000 |
| Mean Family Income | 104 | $77,535 |
| Median Household Income | 151 | $49,821 |
| Mean Household Income | 151 | $71,168 |
| Income Deficit | 104 | $0 |
| Wage / Income Gap (%) | 405 | 0.00% |
| Wage / Income Gap ($) | 405 | 100.00¢ per $1 |
| Gini / Inequality Index | 405 | 0.48 |
Earnings by Sex in Smithton borough
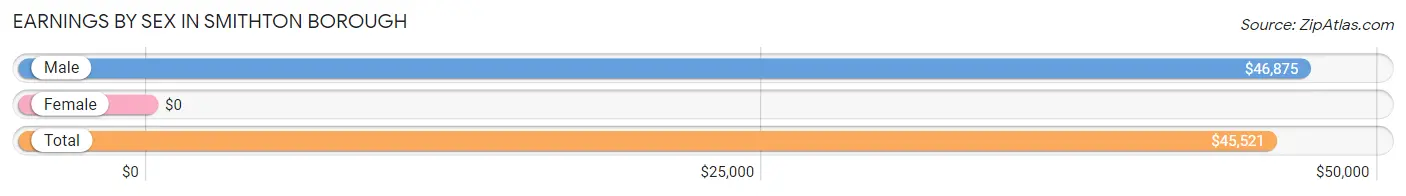
| Sex | Number | Average Earnings |
| Male | 66 (41.5%) | $46,875 |
| Female | 93 (58.5%) | $0 |
| Total | 159 (100.0%) | $45,521 |
Earnings by Sex by Income Bracket in Smithton borough
The most common earnings brackets in Smithton borough are $45,000 to $49,999 for men (12 | 18.2%) and $100,000+ for women (15 | 16.1%).
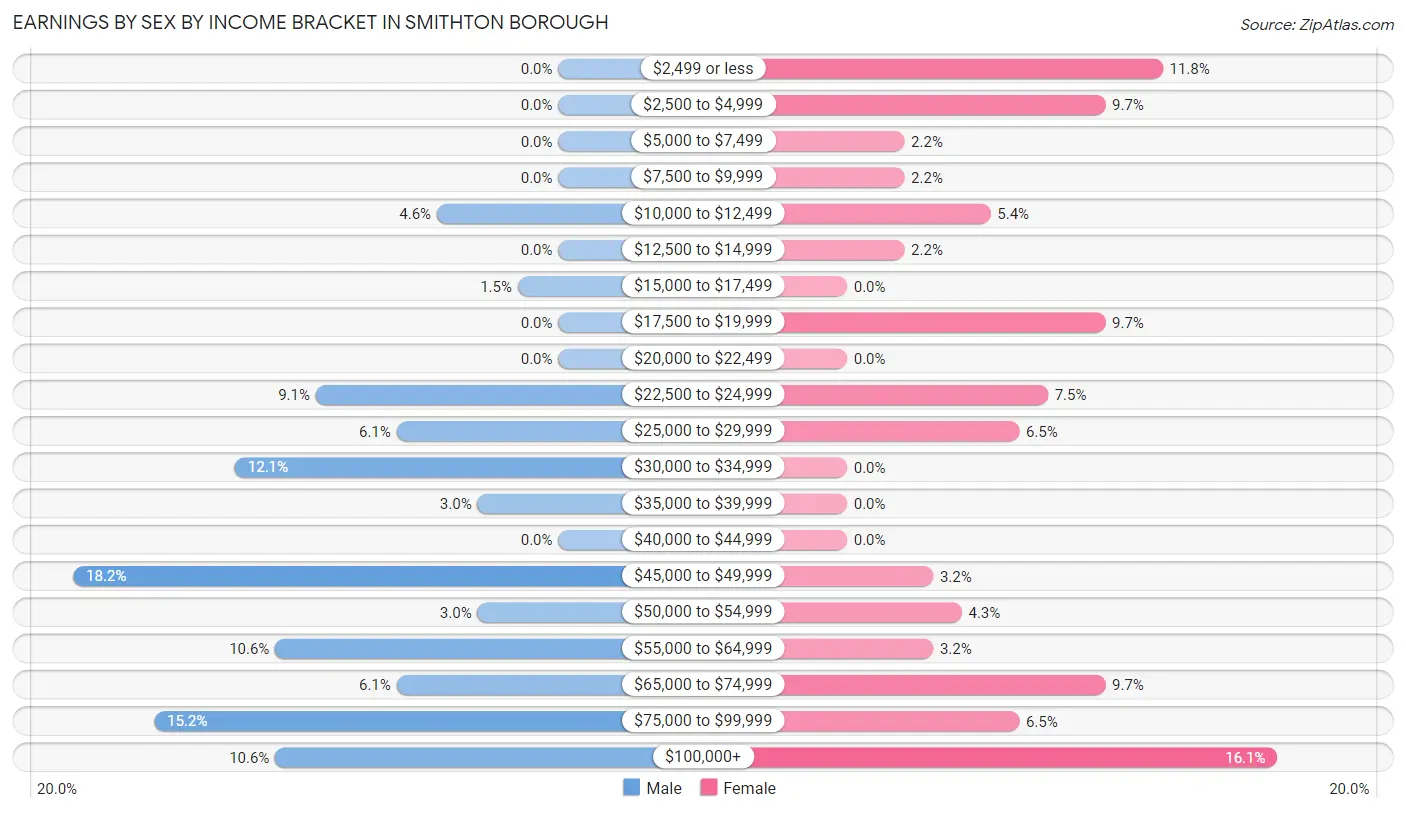
| Income | Male | Female |
| $2,499 or less | 0 (0.0%) | 11 (11.8%) |
| $2,500 to $4,999 | 0 (0.0%) | 9 (9.7%) |
| $5,000 to $7,499 | 0 (0.0%) | 2 (2.1%) |
| $7,500 to $9,999 | 0 (0.0%) | 2 (2.1%) |
| $10,000 to $12,499 | 3 (4.5%) | 5 (5.4%) |
| $12,500 to $14,999 | 0 (0.0%) | 2 (2.1%) |
| $15,000 to $17,499 | 1 (1.5%) | 0 (0.0%) |
| $17,500 to $19,999 | 0 (0.0%) | 9 (9.7%) |
| $20,000 to $22,499 | 0 (0.0%) | 0 (0.0%) |
| $22,500 to $24,999 | 6 (9.1%) | 7 (7.5%) |
| $25,000 to $29,999 | 4 (6.1%) | 6 (6.5%) |
| $30,000 to $34,999 | 8 (12.1%) | 0 (0.0%) |
| $35,000 to $39,999 | 2 (3.0%) | 0 (0.0%) |
| $40,000 to $44,999 | 0 (0.0%) | 0 (0.0%) |
| $45,000 to $49,999 | 12 (18.2%) | 3 (3.2%) |
| $50,000 to $54,999 | 2 (3.0%) | 4 (4.3%) |
| $55,000 to $64,999 | 7 (10.6%) | 3 (3.2%) |
| $65,000 to $74,999 | 4 (6.1%) | 9 (9.7%) |
| $75,000 to $99,999 | 10 (15.1%) | 6 (6.5%) |
| $100,000+ | 7 (10.6%) | 15 (16.1%) |
| Total | 66 (100.0%) | 93 (100.0%) |
Earnings by Sex by Educational Attainment in Smithton borough
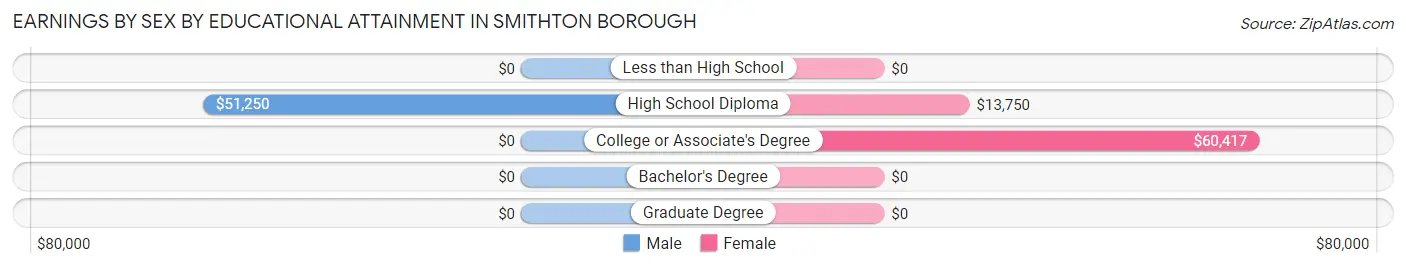
| Educational Attainment | Male Income | Female Income |
| Less than High School | - | - |
| High School Diploma | $51,250 | $13,750 |
| College or Associate's Degree | - | - |
| Bachelor's Degree | - | - |
| Graduate Degree | - | - |
| Total | $51,875 | $0 |
Family Income in Smithton borough
Family Income Brackets in Smithton borough
According to the Smithton borough family income data, there are 23 families falling into the $150,000 to $199,999 income range, which is the most common income bracket and makes up 22.1% of all families.
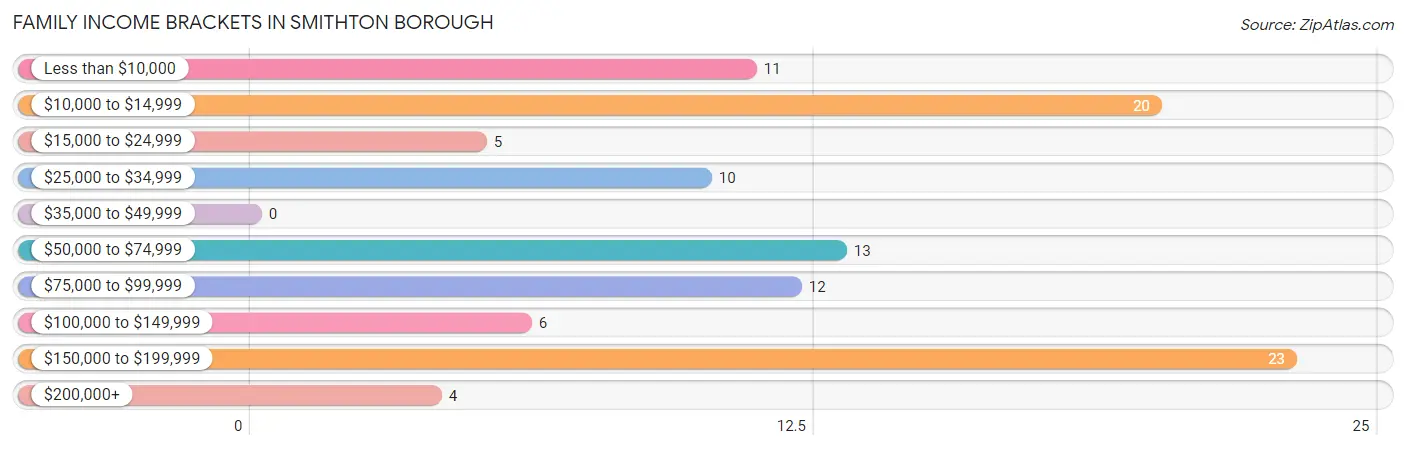
| Income Bracket | # Families | % Families |
| Less than $10,000 | 11 | 10.6% |
| $10,000 to $14,999 | 20 | 19.2% |
| $15,000 to $24,999 | 5 | 4.8% |
| $25,000 to $34,999 | 10 | 9.6% |
| $35,000 to $49,999 | 0 | 0.0% |
| $50,000 to $74,999 | 13 | 12.5% |
| $75,000 to $99,999 | 12 | 11.5% |
| $100,000 to $149,999 | 6 | 5.8% |
| $150,000 to $199,999 | 23 | 22.1% |
| $200,000+ | 4 | 3.8% |
Family Income by Famaliy Size in Smithton borough
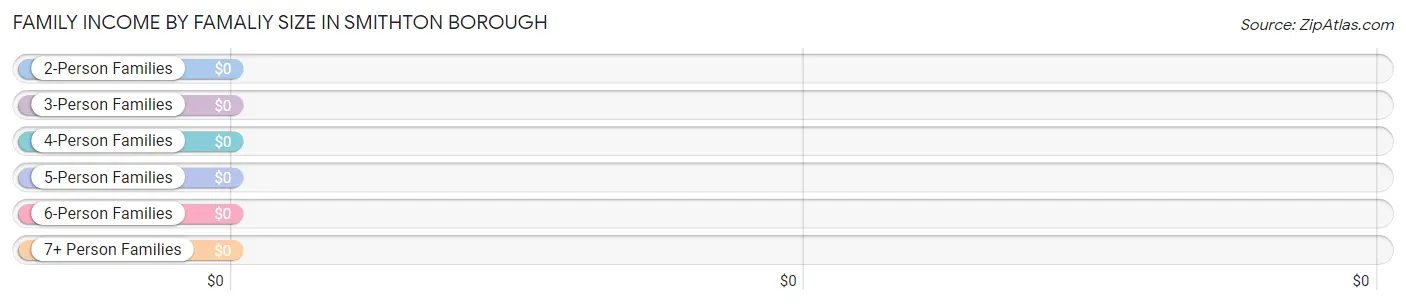
| Income Bracket | # Families | Median Income |
| 2-Person Families | 49 (47.1%) | $0 |
| 3-Person Families | 27 (26.0%) | $0 |
| 4-Person Families | 17 (16.4%) | $0 |
| 5-Person Families | 3 (2.9%) | $0 |
| 6-Person Families | 8 (7.7%) | $0 |
| 7+ Person Families | 0 (0.0%) | $0 |
| Total | 104 (100.0%) | $60,000 |
Family Income by Number of Earners in Smithton borough
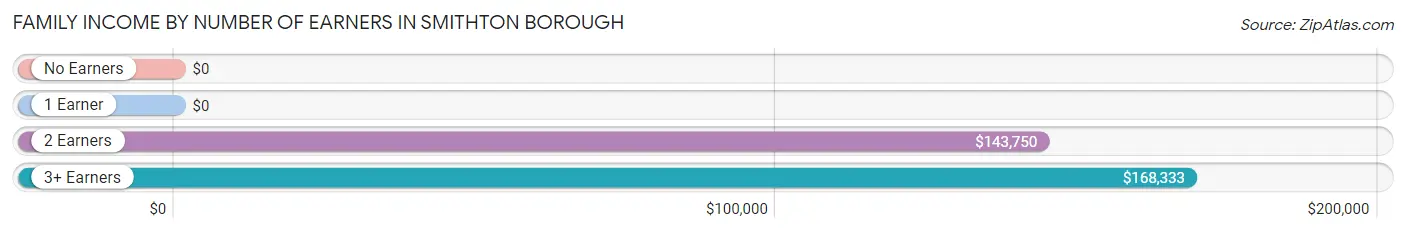
| Number of Earners | # Families | Median Income |
| No Earners | 26 (25.0%) | $0 |
| 1 Earner | 52 (50.0%) | $0 |
| 2 Earners | 14 (13.5%) | $143,750 |
| 3+ Earners | 12 (11.5%) | $168,333 |
| Total | 104 (100.0%) | $60,000 |
Household Income in Smithton borough
Household Income Brackets in Smithton borough
With 27 households falling in the category, the $50,000 to $74,999 income range is the most frequent in Smithton borough, accounting for 17.9% of all households. In contrast, only 6 households (4.0%) fall into the $100,000 to $149,999 income bracket, making it the least populous group.
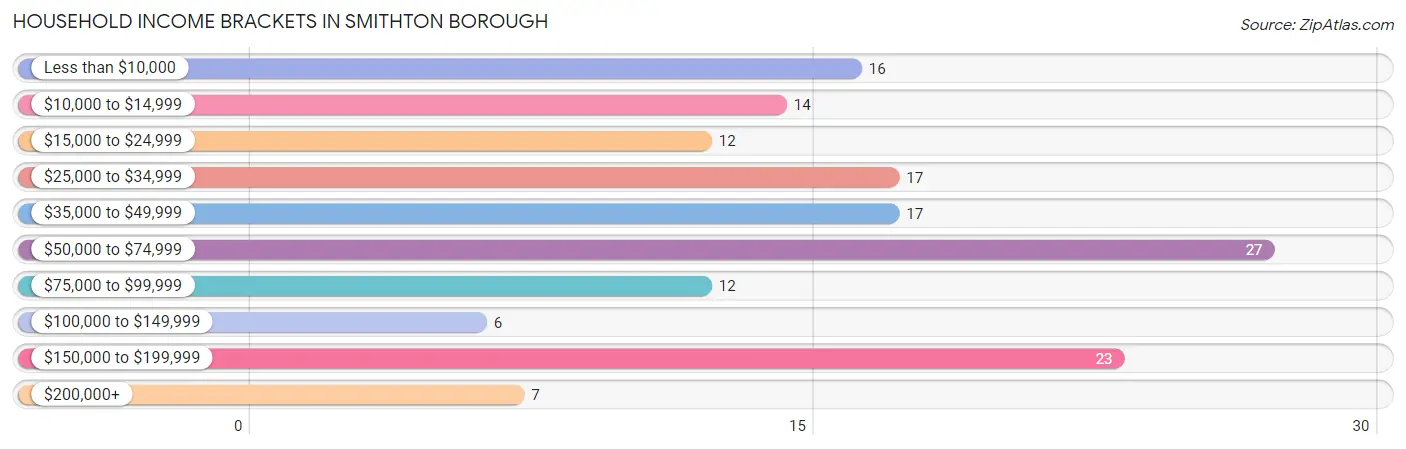
| Income Bracket | # Households | % Households |
| Less than $10,000 | 16 | 10.6% |
| $10,000 to $14,999 | 14 | 9.3% |
| $15,000 to $24,999 | 12 | 7.9% |
| $25,000 to $34,999 | 17 | 11.3% |
| $35,000 to $49,999 | 17 | 11.3% |
| $50,000 to $74,999 | 27 | 17.9% |
| $75,000 to $99,999 | 12 | 7.9% |
| $100,000 to $149,999 | 6 | 4.0% |
| $150,000 to $199,999 | 23 | 15.2% |
| $200,000+ | 7 | 4.6% |
Household Income by Householder Age in Smithton borough
The median household income in Smithton borough is $49,821, with the highest median household income of $46,250 found in the 25 to 44 years age bracket for the primary householder. A total of 46 households (30.5%) fall into this category. Meanwhile, the 15 to 24 years age bracket for the primary householder has the lowest median household income of $0, with 2 households (1.3%) in this group.
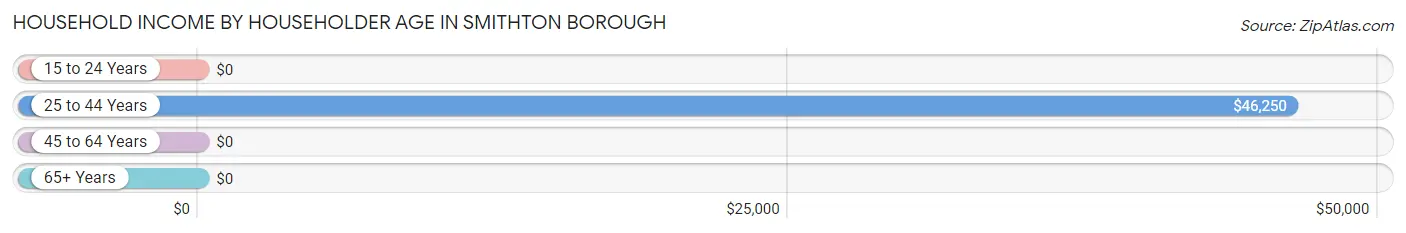
| Income Bracket | # Households | Median Income |
| 15 to 24 Years | 2 (1.3%) | $0 |
| 25 to 44 Years | 46 (30.5%) | $46,250 |
| 45 to 64 Years | 52 (34.4%) | $0 |
| 65+ Years | 51 (33.8%) | $0 |
| Total | 151 (100.0%) | $49,821 |
Poverty in Smithton borough
Income Below Poverty by Sex and Age in Smithton borough
With 46.5% poverty level for males and 32.0% for females among the residents of Smithton borough, 12 to 14 year old males and 12 to 14 year old females are the most vulnerable to poverty, with 3 males (100.0%) and 10 females (100.0%) in their respective age groups living below the poverty level.
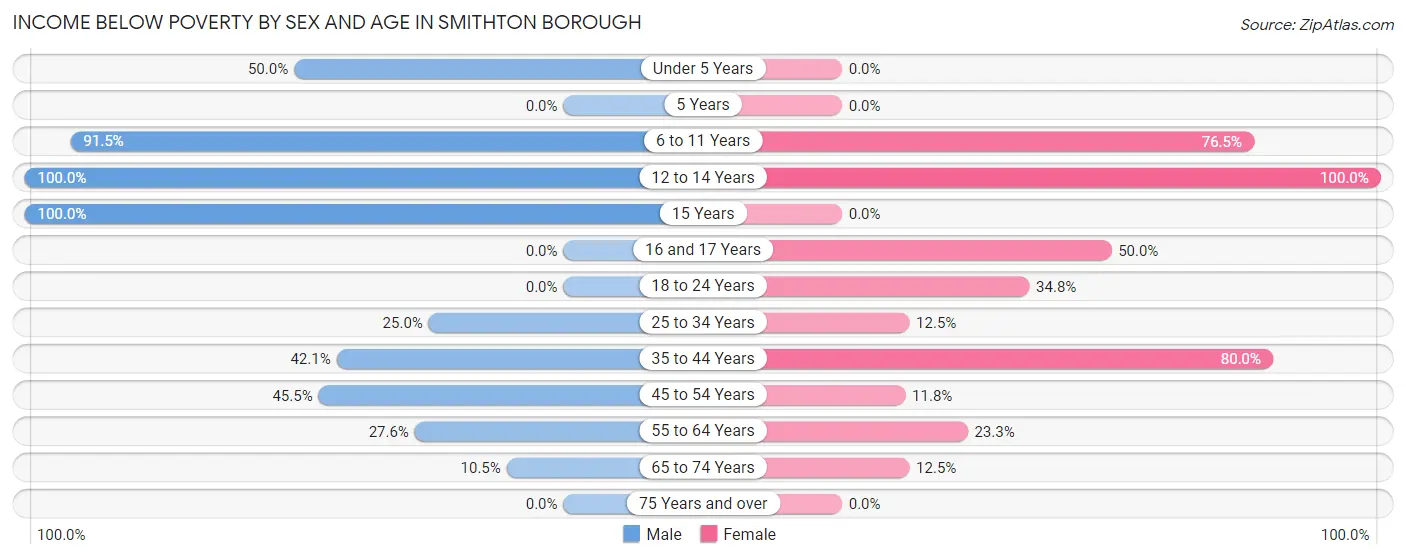
| Age Bracket | Male | Female |
| Under 5 Years | 3 (50.0%) | 0 (0.0%) |
| 5 Years | 0 (0.0%) | 0 (0.0%) |
| 6 to 11 Years | 43 (91.5%) | 13 (76.5%) |
| 12 to 14 Years | 3 (100.0%) | 10 (100.0%) |
| 15 Years | 11 (100.0%) | 0 (0.0%) |
| 16 and 17 Years | 0 (0.0%) | 2 (50.0%) |
| 18 to 24 Years | 0 (0.0%) | 8 (34.8%) |
| 25 to 34 Years | 6 (25.0%) | 3 (12.5%) |
| 35 to 44 Years | 8 (42.1%) | 16 (80.0%) |
| 45 to 54 Years | 10 (45.5%) | 2 (11.8%) |
| 55 to 64 Years | 8 (27.6%) | 7 (23.3%) |
| 65 to 74 Years | 2 (10.5%) | 4 (12.5%) |
| 75 Years and over | 0 (0.0%) | 0 (0.0%) |
| Total | 94 (46.5%) | 65 (32.0%) |
Income Above Poverty by Sex and Age in Smithton borough
According to the poverty statistics in Smithton borough, males aged 18 to 24 years and females aged under 5 years are the age groups that are most secure financially, with 100.0% of males and 100.0% of females in these age groups living above the poverty line.
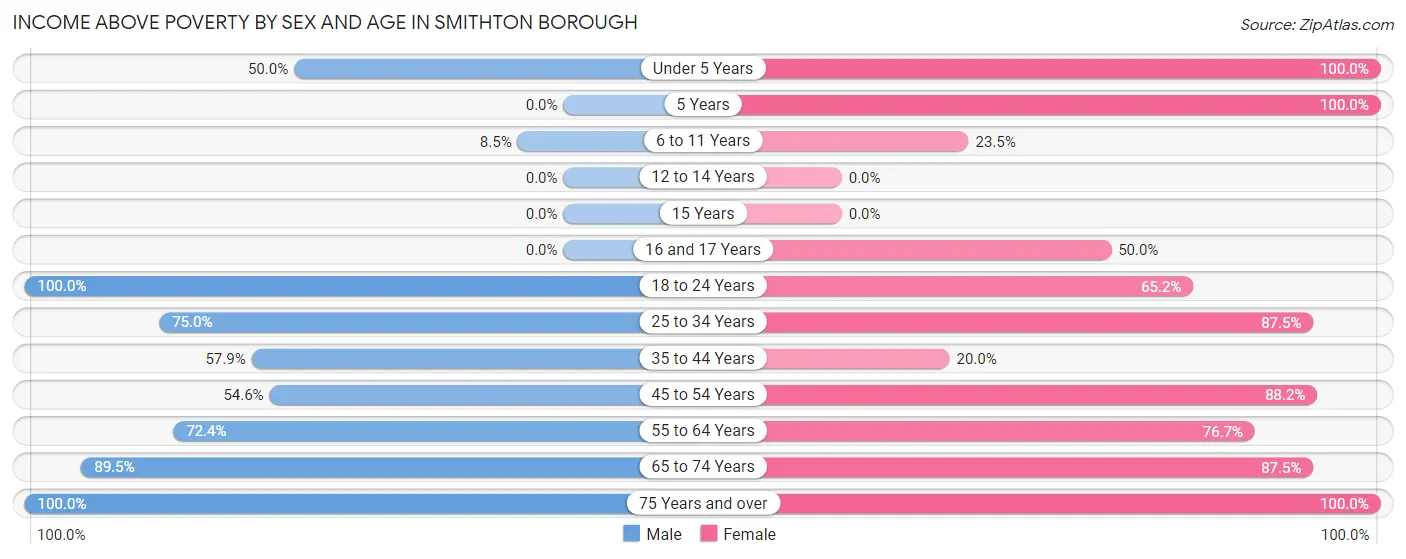
| Age Bracket | Male | Female |
| Under 5 Years | 3 (50.0%) | 5 (100.0%) |
| 5 Years | 0 (0.0%) | 7 (100.0%) |
| 6 to 11 Years | 4 (8.5%) | 4 (23.5%) |
| 12 to 14 Years | 0 (0.0%) | 0 (0.0%) |
| 15 Years | 0 (0.0%) | 0 (0.0%) |
| 16 and 17 Years | 0 (0.0%) | 2 (50.0%) |
| 18 to 24 Years | 9 (100.0%) | 15 (65.2%) |
| 25 to 34 Years | 18 (75.0%) | 21 (87.5%) |
| 35 to 44 Years | 11 (57.9%) | 4 (20.0%) |
| 45 to 54 Years | 12 (54.5%) | 15 (88.2%) |
| 55 to 64 Years | 21 (72.4%) | 23 (76.7%) |
| 65 to 74 Years | 17 (89.5%) | 28 (87.5%) |
| 75 Years and over | 13 (100.0%) | 14 (100.0%) |
| Total | 108 (53.5%) | 138 (68.0%) |
Income Below Poverty Among Married-Couple Families in Smithton borough
The poverty statistics for married-couple families in Smithton borough show that 14.7% or 9 of the total 61 families live below the poverty line. Families with 3 or 4 children have the highest poverty rate of 100.0%, comprising of 2 families. On the other hand, families with no children have the lowest poverty rate of 0.0%, which includes 0 families.
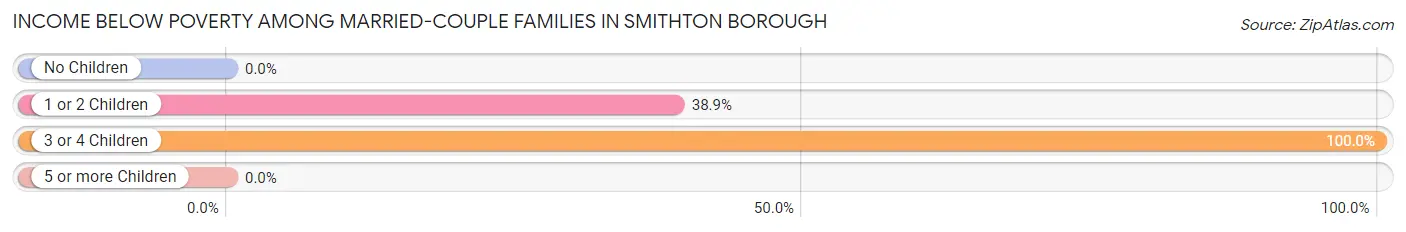
| Children | Above Poverty | Below Poverty |
| No Children | 41 (100.0%) | 0 (0.0%) |
| 1 or 2 Children | 11 (61.1%) | 7 (38.9%) |
| 3 or 4 Children | 0 (0.0%) | 2 (100.0%) |
| 5 or more Children | 0 (0.0%) | 0 (0.0%) |
| Total | 52 (85.3%) | 9 (14.7%) |
Income Below Poverty Among Single-Parent Households in Smithton borough
According to the poverty data in Smithton borough, 66.7% or 8 single-father households and 61.3% or 19 single-mother households are living below the poverty line. Among single-father households, those with 1 or 2 children have the highest poverty rate, with 8 households (100.0%) experiencing poverty. Likewise, among single-mother households, those with 1 or 2 children have the highest poverty rate, with 10 households (100.0%) falling below the poverty line.
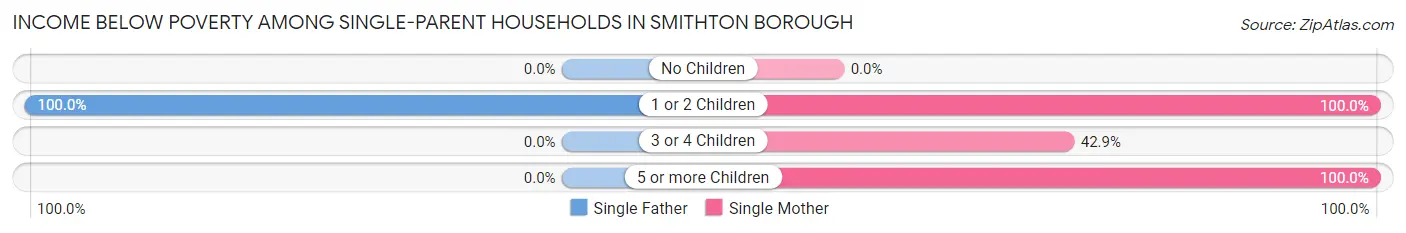
| Children | Single Father | Single Mother |
| No Children | 0 (0.0%) | 0 (0.0%) |
| 1 or 2 Children | 8 (100.0%) | 10 (100.0%) |
| 3 or 4 Children | 0 (0.0%) | 3 (42.9%) |
| 5 or more Children | 0 (0.0%) | 6 (100.0%) |
| Total | 8 (66.7%) | 19 (61.3%) |
Income Below Poverty Among Married-Couple vs Single-Parent Households in Smithton borough
The poverty data for Smithton borough shows that 9 of the married-couple family households (14.7%) and 27 of the single-parent households (62.8%) are living below the poverty level. Within the married-couple family households, those with 3 or 4 children have the highest poverty rate, with 2 households (100.0%) falling below the poverty line. Among the single-parent households, those with 1 or 2 children have the highest poverty rate, with 18 household (100.0%) living below poverty.
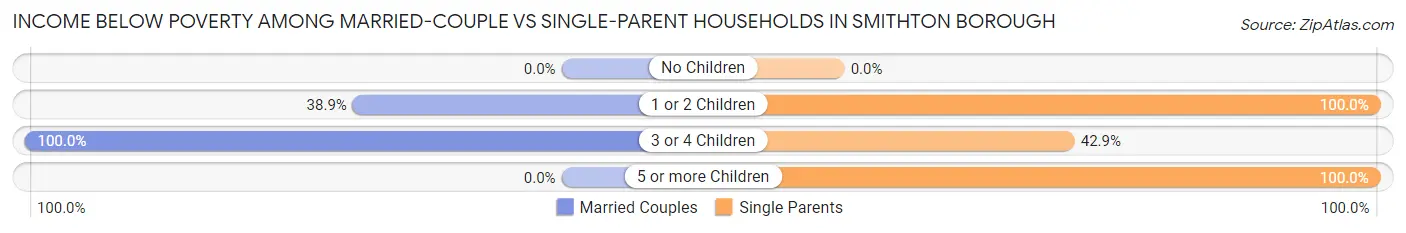
| Children | Married-Couple Families | Single-Parent Households |
| No Children | 0 (0.0%) | 0 (0.0%) |
| 1 or 2 Children | 7 (38.9%) | 18 (100.0%) |
| 3 or 4 Children | 2 (100.0%) | 3 (42.9%) |
| 5 or more Children | 0 (0.0%) | 6 (100.0%) |
| Total | 9 (14.7%) | 27 (62.8%) |
Employment Characteristics in Smithton borough
Employment by Class of Employer in Smithton borough
Among the 132 employed individuals in Smithton borough, private company employees (103 | 78.0%), self-employed (incorporated) (15 | 11.4%), and not-for-profit organizations (9 | 6.8%) make up the most common classes of employment.
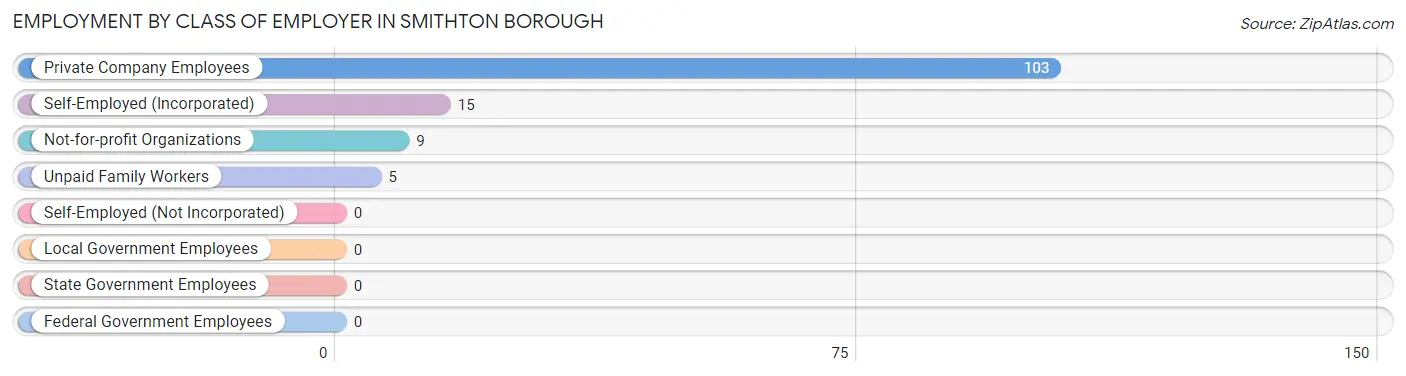
| Employer Class | # Employees | % Employees |
| Private Company Employees | 103 | 78.0% |
| Self-Employed (Incorporated) | 15 | 11.4% |
| Self-Employed (Not Incorporated) | 0 | 0.0% |
| Not-for-profit Organizations | 9 | 6.8% |
| Local Government Employees | 0 | 0.0% |
| State Government Employees | 0 | 0.0% |
| Federal Government Employees | 0 | 0.0% |
| Unpaid Family Workers | 5 | 3.8% |
| Total | 132 | 100.0% |
Employment Status by Age in Smithton borough
According to the labor force statistics for Smithton borough, out of the total population over 16 years of age (299), 53.5% or 160 individuals are in the labor force, with 11.3% or 18 of them unemployed. The age group with the highest labor force participation rate is 25 to 29 years, with 92.0% or 23 individuals in the labor force. Within the labor force, the 25 to 29 years age range has the highest percentage of unemployed individuals, with 30.4% or 7 of them being unemployed.
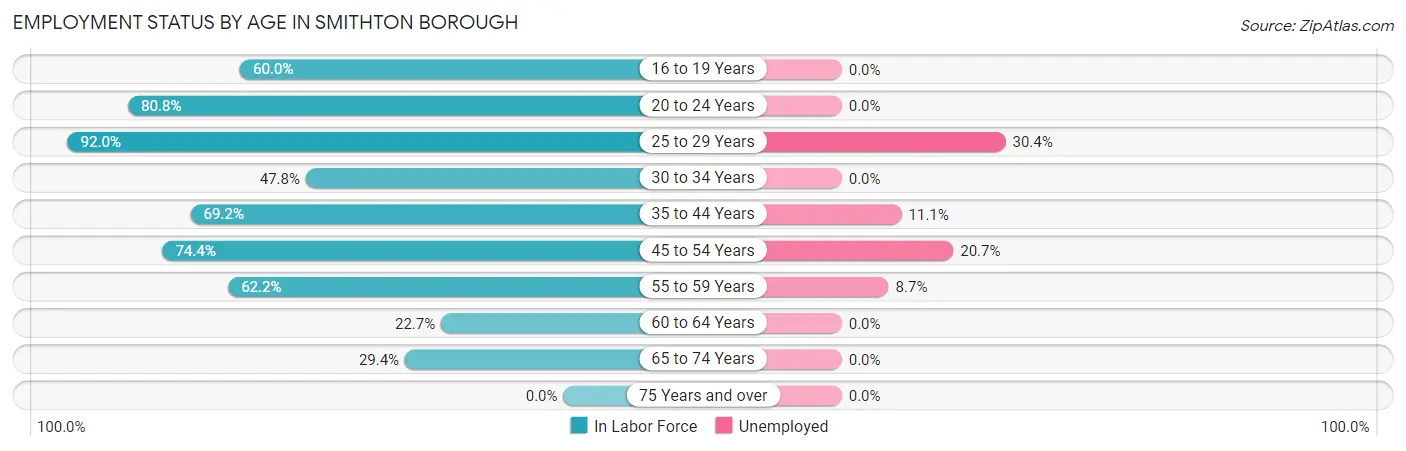
| Age Bracket | In Labor Force | Unemployed |
| 16 to 19 Years | 6 (60.0%) | 0 (0.0%) |
| 20 to 24 Years | 21 (80.8%) | 0 (0.0%) |
| 25 to 29 Years | 23 (92.0%) | 7 (30.4%) |
| 30 to 34 Years | 11 (47.8%) | 0 (0.0%) |
| 35 to 44 Years | 27 (69.2%) | 3 (11.1%) |
| 45 to 54 Years | 29 (74.4%) | 6 (20.7%) |
| 55 to 59 Years | 23 (62.2%) | 2 (8.7%) |
| 60 to 64 Years | 5 (22.7%) | 0 (0.0%) |
| 65 to 74 Years | 15 (29.4%) | 0 (0.0%) |
| 75 Years and over | 0 (0.0%) | 0 (0.0%) |
| Total | 160 (53.5%) | 18 (11.3%) |
Employment Status by Educational Attainment in Smithton borough
According to labor force statistics for Smithton borough, 63.8% of individuals (118) out of the total population between 25 and 64 years of age (185) are in the labor force, with 15.3% or 18 of them being unemployed. The group with the highest labor force participation rate are those with the educational attainment of college / associate degree, with 75.5% or 40 individuals in the labor force. Within the labor force, individuals with college / associate degree education have the highest percentage of unemployment, with 25.0% or 10 of them being unemployed.
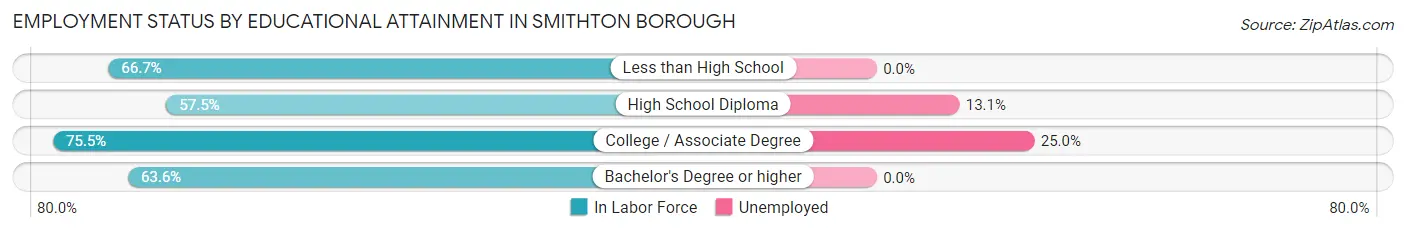
| Educational Attainment | In Labor Force | Unemployed |
| Less than High School | 10 (66.7%) | 0 (0.0%) |
| High School Diploma | 61 (57.5%) | 14 (13.1%) |
| College / Associate Degree | 40 (75.5%) | 13 (25.0%) |
| Bachelor's Degree or higher | 7 (63.6%) | 0 (0.0%) |
| Total | 118 (63.8%) | 28 (15.3%) |
Employment Occupations by Sex in Smithton borough
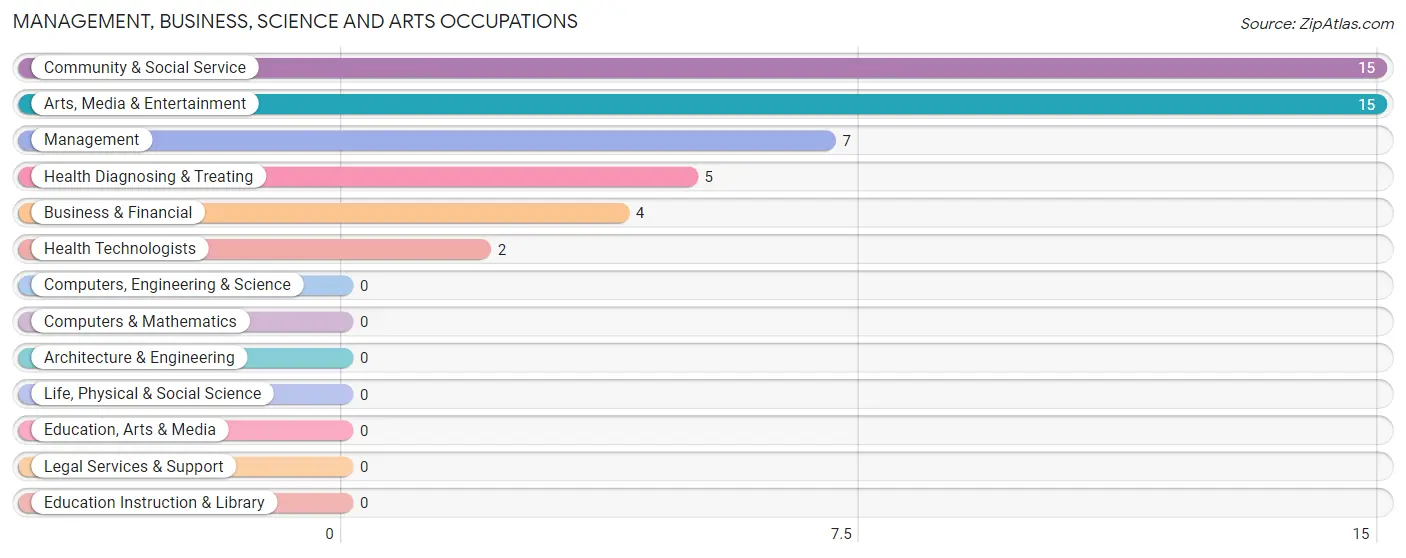
Management, Business, Science and Arts Occupations
The most common Management, Business, Science and Arts occupations in Smithton borough are Community & Social Service (15 | 10.6%), Arts, Media & Entertainment (15 | 10.6%), Management (7 | 4.9%), Health Diagnosing & Treating (5 | 3.5%), and Business & Financial (4 | 2.8%).
Management, Business, Science and Arts Occupations by Sex
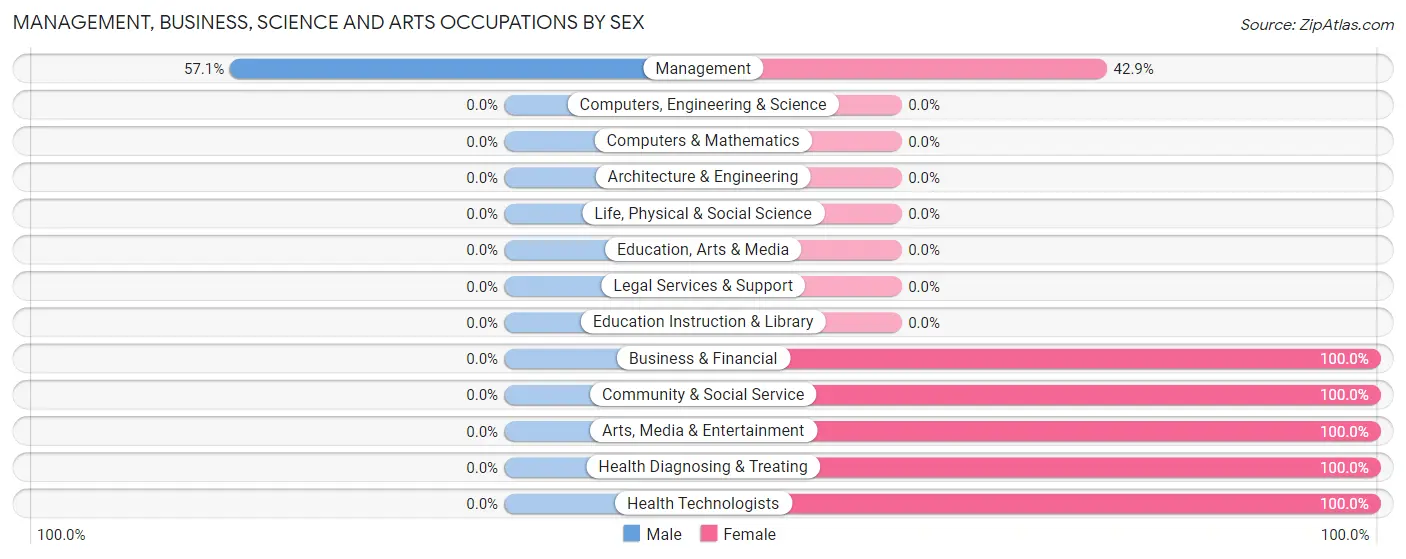
| Occupation | Male | Female |
| Management | 4 (57.1%) | 3 (42.9%) |
| Business & Financial | 0 (0.0%) | 4 (100.0%) |
| Computers, Engineering & Science | 0 (0.0%) | 0 (0.0%) |
| Computers & Mathematics | 0 (0.0%) | 0 (0.0%) |
| Architecture & Engineering | 0 (0.0%) | 0 (0.0%) |
| Life, Physical & Social Science | 0 (0.0%) | 0 (0.0%) |
| Community & Social Service | 0 (0.0%) | 15 (100.0%) |
| Education, Arts & Media | 0 (0.0%) | 0 (0.0%) |
| Legal Services & Support | 0 (0.0%) | 0 (0.0%) |
| Education Instruction & Library | 0 (0.0%) | 0 (0.0%) |
| Arts, Media & Entertainment | 0 (0.0%) | 15 (100.0%) |
| Health Diagnosing & Treating | 0 (0.0%) | 5 (100.0%) |
| Health Technologists | 0 (0.0%) | 2 (100.0%) |
| Total (Category) | 4 (12.9%) | 27 (87.1%) |
| Total (Overall) | 64 (45.1%) | 78 (54.9%) |
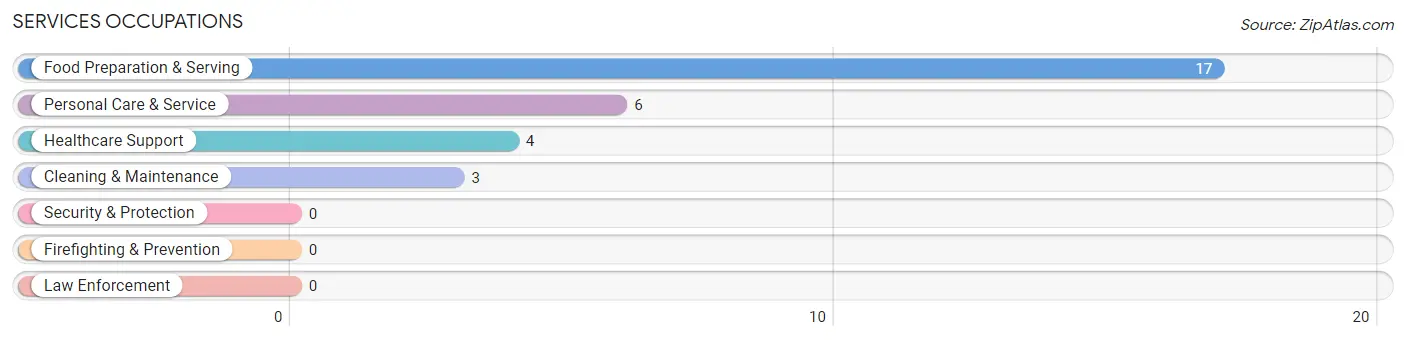
Services Occupations
The most common Services occupations in Smithton borough are Food Preparation & Serving (17 | 12.0%), Personal Care & Service (6 | 4.2%), Healthcare Support (4 | 2.8%), and Cleaning & Maintenance (3 | 2.1%).
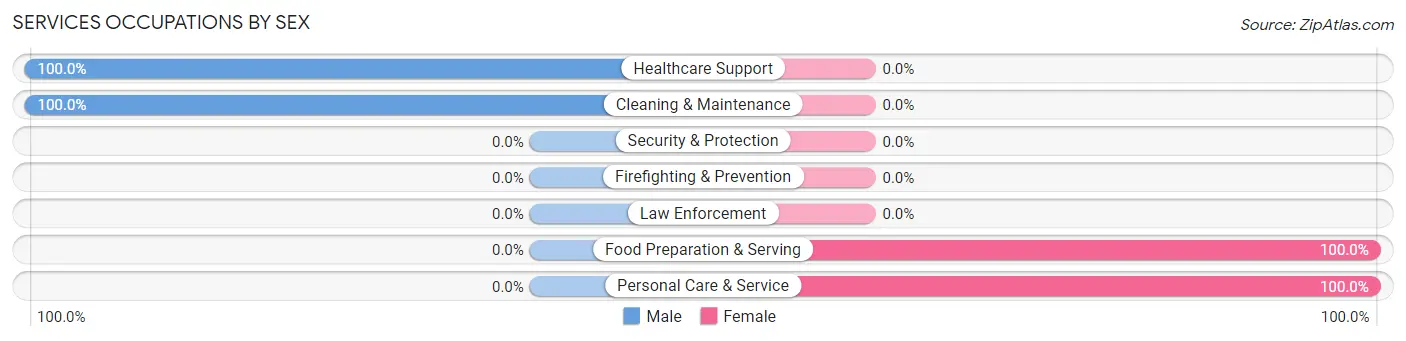
Services Occupations by Sex
Within the Services occupations in Smithton borough, the most male-oriented occupations are Healthcare Support (100.0%), and Cleaning & Maintenance (100.0%), while the most female-oriented occupations are Food Preparation & Serving (100.0%), and Personal Care & Service (100.0%).
| Occupation | Male | Female |
| Healthcare Support | 4 (100.0%) | 0 (0.0%) |
| Security & Protection | 0 (0.0%) | 0 (0.0%) |
| Firefighting & Prevention | 0 (0.0%) | 0 (0.0%) |
| Law Enforcement | 0 (0.0%) | 0 (0.0%) |
| Food Preparation & Serving | 0 (0.0%) | 17 (100.0%) |
| Cleaning & Maintenance | 3 (100.0%) | 0 (0.0%) |
| Personal Care & Service | 0 (0.0%) | 6 (100.0%) |
| Total (Category) | 7 (23.3%) | 23 (76.7%) |
| Total (Overall) | 64 (45.1%) | 78 (54.9%) |
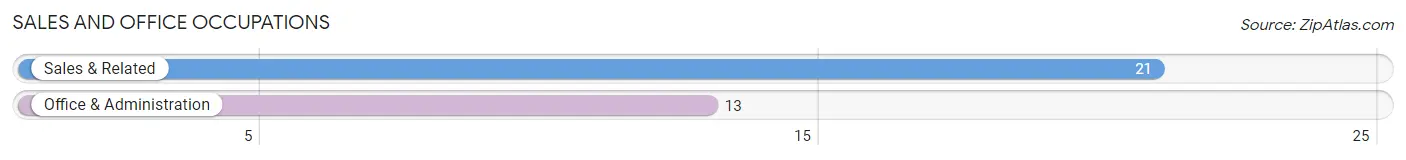
Sales and Office Occupations
The most common Sales and Office occupations in Smithton borough are Sales & Related (21 | 14.8%), and Office & Administration (13 | 9.1%).
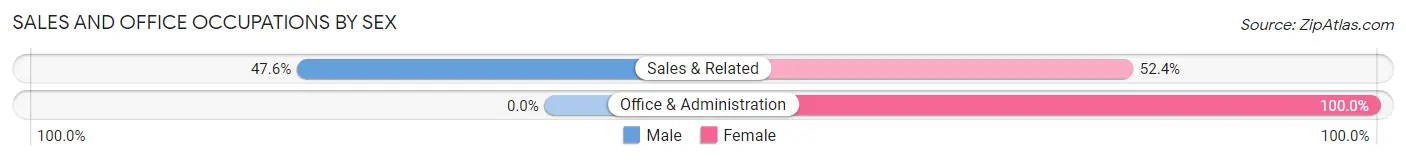
Sales and Office Occupations by Sex
| Occupation | Male | Female |
| Sales & Related | 10 (47.6%) | 11 (52.4%) |
| Office & Administration | 0 (0.0%) | 13 (100.0%) |
| Total (Category) | 10 (29.4%) | 24 (70.6%) |
| Total (Overall) | 64 (45.1%) | 78 (54.9%) |
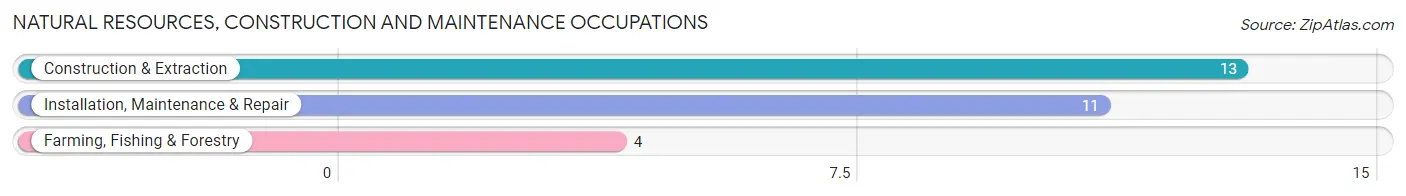
Natural Resources, Construction and Maintenance Occupations
The most common Natural Resources, Construction and Maintenance occupations in Smithton borough are Construction & Extraction (13 | 9.1%), Installation, Maintenance & Repair (11 | 7.7%), and Farming, Fishing & Forestry (4 | 2.8%).
Natural Resources, Construction and Maintenance Occupations by Sex
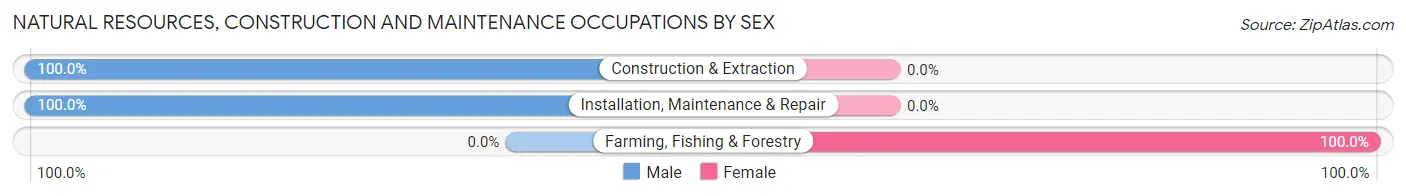
| Occupation | Male | Female |
| Farming, Fishing & Forestry | 0 (0.0%) | 4 (100.0%) |
| Construction & Extraction | 13 (100.0%) | 0 (0.0%) |
| Installation, Maintenance & Repair | 11 (100.0%) | 0 (0.0%) |
| Total (Category) | 24 (85.7%) | 4 (14.3%) |
| Total (Overall) | 64 (45.1%) | 78 (54.9%) |
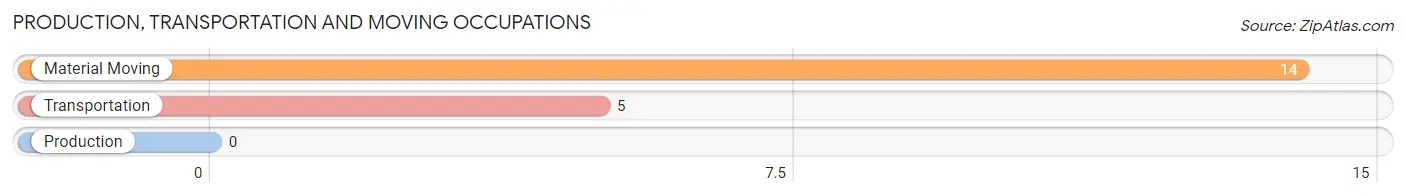
Production, Transportation and Moving Occupations
The most common Production, Transportation and Moving occupations in Smithton borough are Material Moving (14 | 9.9%), and Transportation (5 | 3.5%).
Production, Transportation and Moving Occupations by Sex
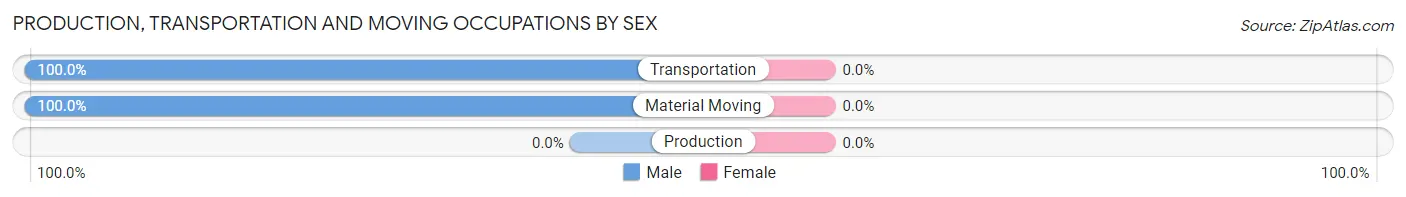
| Occupation | Male | Female |
| Production | 0 (0.0%) | 0 (0.0%) |
| Transportation | 5 (100.0%) | 0 (0.0%) |
| Material Moving | 14 (100.0%) | 0 (0.0%) |
| Total (Category) | 19 (100.0%) | 0 (0.0%) |
| Total (Overall) | 64 (45.1%) | 78 (54.9%) |
Employment Industries by Sex in Smithton borough
Employment Industries in Smithton borough
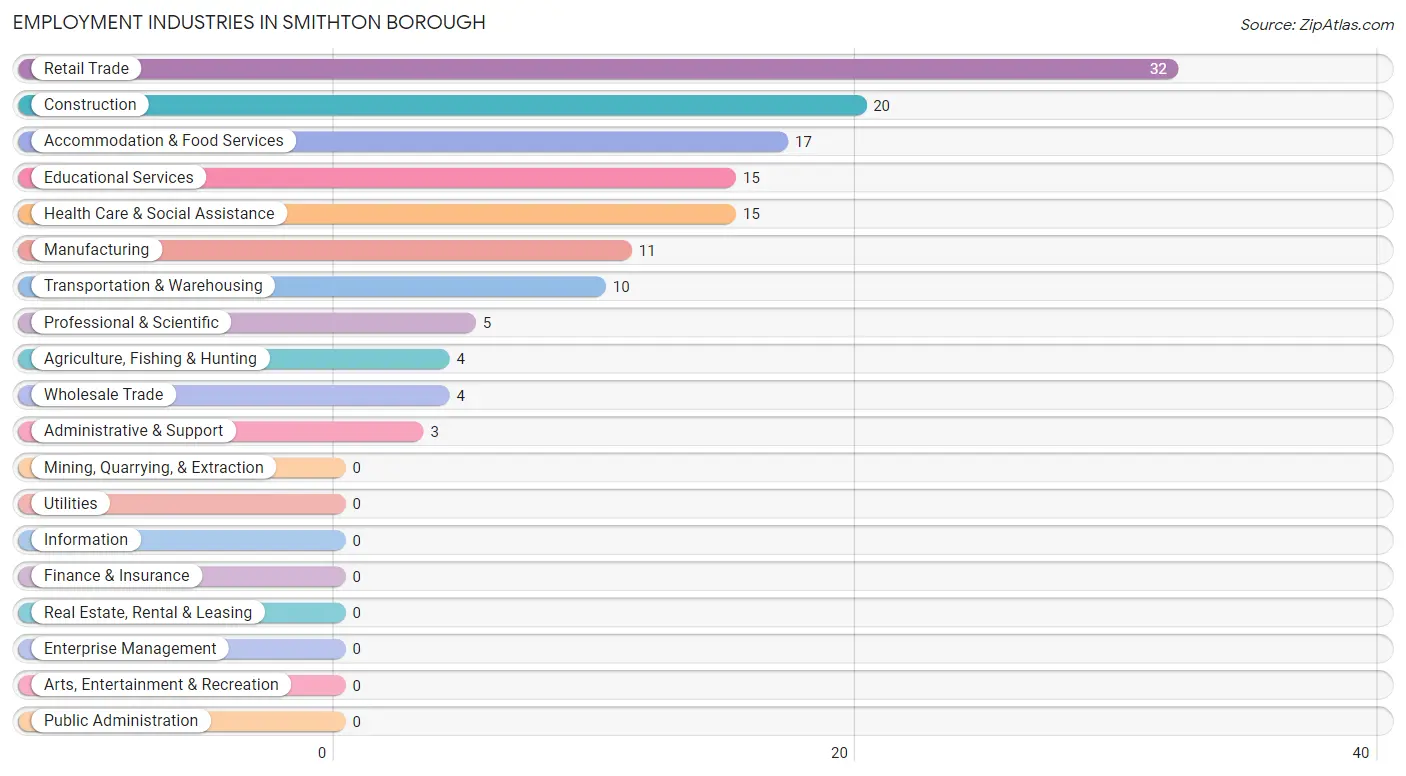
The major employment industries in Smithton borough include Retail Trade (32 | 22.5%), Construction (20 | 14.1%), Accommodation & Food Services (17 | 12.0%), Educational Services (15 | 10.6%), and Health Care & Social Assistance (15 | 10.6%).
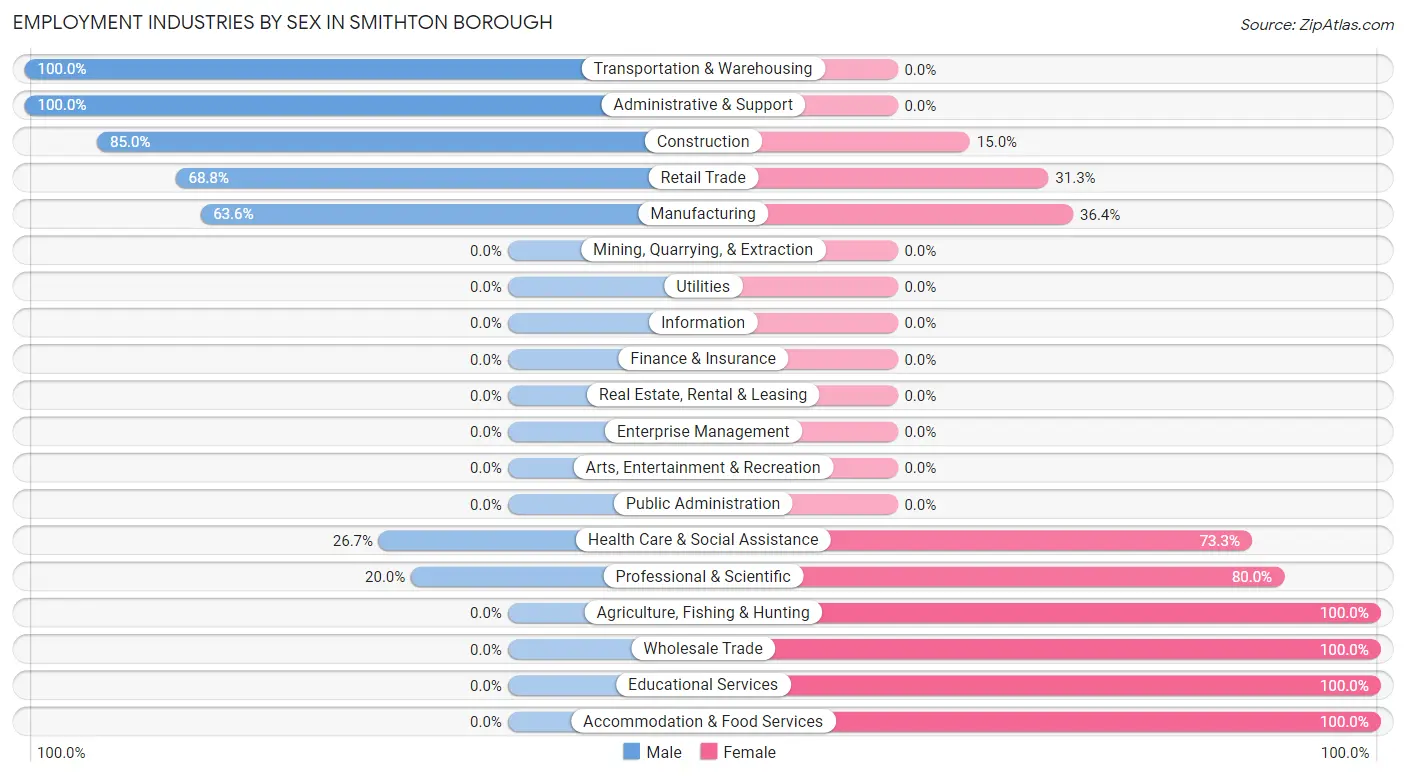
Employment Industries by Sex in Smithton borough
The Smithton borough industries that see more men than women are Transportation & Warehousing (100.0%), Administrative & Support (100.0%), and Construction (85.0%), whereas the industries that tend to have a higher number of women are Agriculture, Fishing & Hunting (100.0%), Wholesale Trade (100.0%), and Educational Services (100.0%).
| Industry | Male | Female |
| Agriculture, Fishing & Hunting | 0 (0.0%) | 4 (100.0%) |
| Mining, Quarrying, & Extraction | 0 (0.0%) | 0 (0.0%) |
| Construction | 17 (85.0%) | 3 (15.0%) |
| Manufacturing | 7 (63.6%) | 4 (36.4%) |
| Wholesale Trade | 0 (0.0%) | 4 (100.0%) |
| Retail Trade | 22 (68.8%) | 10 (31.2%) |
| Transportation & Warehousing | 10 (100.0%) | 0 (0.0%) |
| Utilities | 0 (0.0%) | 0 (0.0%) |
| Information | 0 (0.0%) | 0 (0.0%) |
| Finance & Insurance | 0 (0.0%) | 0 (0.0%) |
| Real Estate, Rental & Leasing | 0 (0.0%) | 0 (0.0%) |
| Professional & Scientific | 1 (20.0%) | 4 (80.0%) |
| Enterprise Management | 0 (0.0%) | 0 (0.0%) |
| Administrative & Support | 3 (100.0%) | 0 (0.0%) |
| Educational Services | 0 (0.0%) | 15 (100.0%) |
| Health Care & Social Assistance | 4 (26.7%) | 11 (73.3%) |
| Arts, Entertainment & Recreation | 0 (0.0%) | 0 (0.0%) |
| Accommodation & Food Services | 0 (0.0%) | 17 (100.0%) |
| Public Administration | 0 (0.0%) | 0 (0.0%) |
| Total | 64 (45.1%) | 78 (54.9%) |
Education in Smithton borough
School Enrollment in Smithton borough
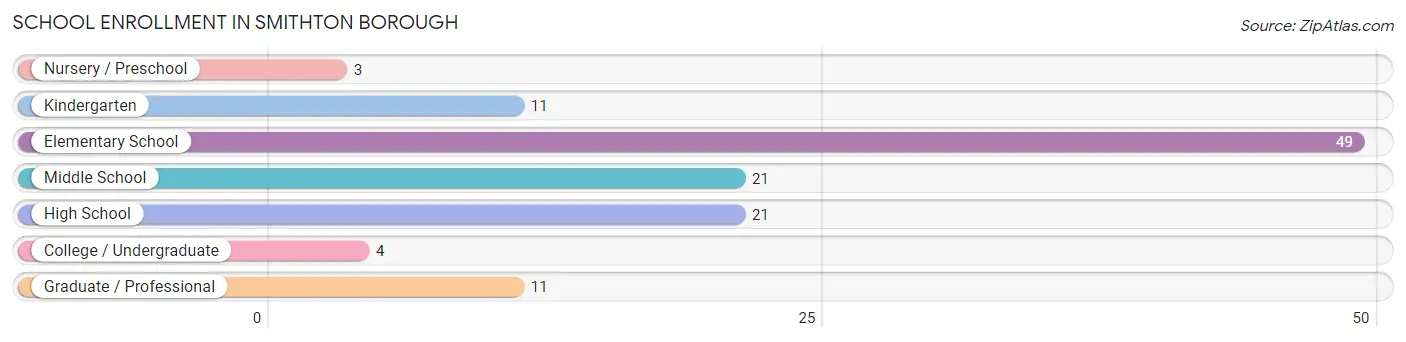
The most common levels of schooling among the 120 students in Smithton borough are elementary school (49 | 40.8%), middle school (21 | 17.5%), and high school (21 | 17.5%).
| School Level | # Students | % Students |
| Nursery / Preschool | 3 | 2.5% |
| Kindergarten | 11 | 9.2% |
| Elementary School | 49 | 40.8% |
| Middle School | 21 | 17.5% |
| High School | 21 | 17.5% |
| College / Undergraduate | 4 | 3.3% |
| Graduate / Professional | 11 | 9.2% |
| Total | 120 | 100.0% |
School Enrollment by Age by Funding Source in Smithton borough
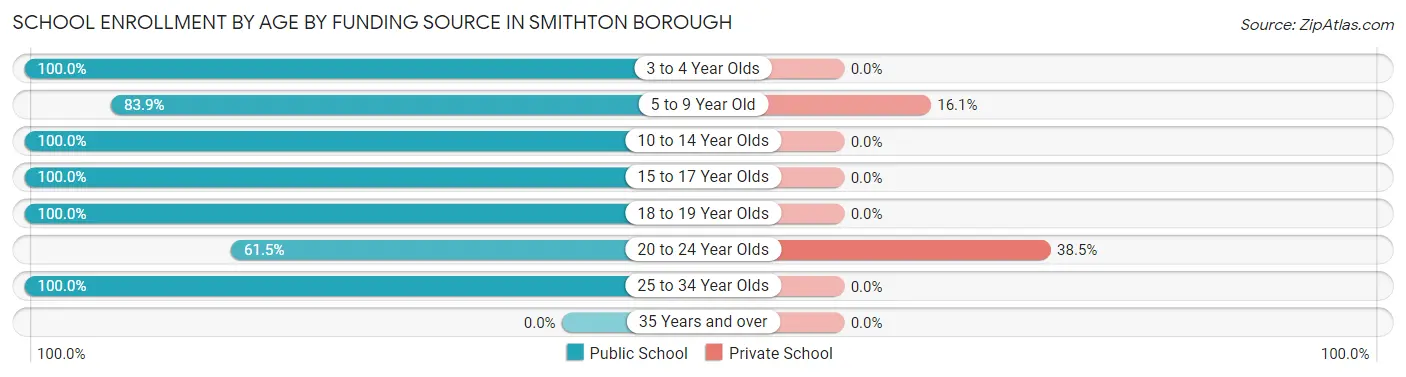
Out of a total of 120 students who are enrolled in schools in Smithton borough, 15 (12.5%) attend a private institution, while the remaining 105 (87.5%) are enrolled in public schools. The age group of 20 to 24 year olds has the highest likelihood of being enrolled in private schools, with 5 (38.5% in the age bracket) enrolled. Conversely, the age group of 3 to 4 year olds has the lowest likelihood of being enrolled in a private school, with 3 (100.0% in the age bracket) attending a public institution.
| Age Bracket | Public School | Private School |
| 3 to 4 Year Olds | 3 (100.0%) | 0 (0.0%) |
| 5 to 9 Year Old | 52 (83.9%) | 10 (16.1%) |
| 10 to 14 Year Olds | 19 (100.0%) | 0 (0.0%) |
| 15 to 17 Year Olds | 15 (100.0%) | 0 (0.0%) |
| 18 to 19 Year Olds | 6 (100.0%) | 0 (0.0%) |
| 20 to 24 Year Olds | 8 (61.5%) | 5 (38.5%) |
| 25 to 34 Year Olds | 2 (100.0%) | 0 (0.0%) |
| 35 Years and over | 0 (0.0%) | 0 (0.0%) |
| Total | 105 (87.5%) | 15 (12.5%) |
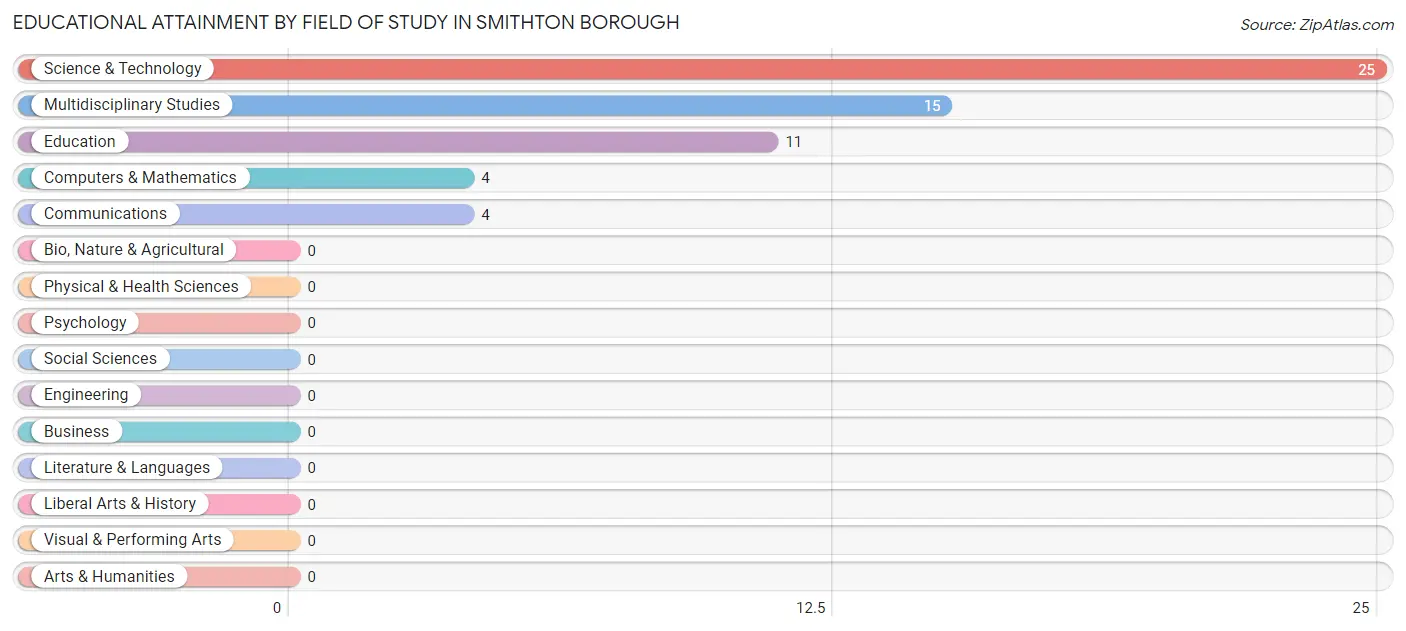
Educational Attainment by Field of Study in Smithton borough
Science & technology (25 | 42.4%), multidisciplinary studies (15 | 25.4%), education (11 | 18.6%), computers & mathematics (4 | 6.8%), and communications (4 | 6.8%) are the most common fields of study among 59 individuals in Smithton borough who have obtained a bachelor's degree or higher.
| Field of Study | # Graduates | % Graduates |
| Computers & Mathematics | 4 | 6.8% |
| Bio, Nature & Agricultural | 0 | 0.0% |
| Physical & Health Sciences | 0 | 0.0% |
| Psychology | 0 | 0.0% |
| Social Sciences | 0 | 0.0% |
| Engineering | 0 | 0.0% |
| Multidisciplinary Studies | 15 | 25.4% |
| Science & Technology | 25 | 42.4% |
| Business | 0 | 0.0% |
| Education | 11 | 18.6% |
| Literature & Languages | 0 | 0.0% |
| Liberal Arts & History | 0 | 0.0% |
| Visual & Performing Arts | 0 | 0.0% |
| Communications | 4 | 6.8% |
| Arts & Humanities | 0 | 0.0% |
| Total | 59 | 100.0% |
Transportation & Commute in Smithton borough
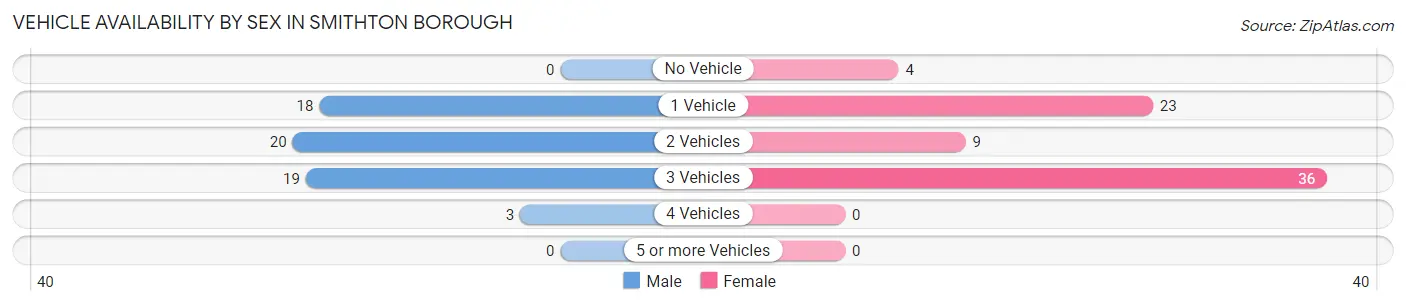
Vehicle Availability by Sex in Smithton borough
The most prevalent vehicle ownership categories in Smithton borough are males with 2 vehicles (20, accounting for 33.3%) and females with 2 vehicles (9, making up 27.8%).
| Vehicles Available | Male | Female |
| No Vehicle | 0 (0.0%) | 4 (5.6%) |
| 1 Vehicle | 18 (30.0%) | 23 (31.9%) |
| 2 Vehicles | 20 (33.3%) | 9 (12.5%) |
| 3 Vehicles | 19 (31.7%) | 36 (50.0%) |
| 4 Vehicles | 3 (5.0%) | 0 (0.0%) |
| 5 or more Vehicles | 0 (0.0%) | 0 (0.0%) |
| Total | 60 (100.0%) | 72 (100.0%) |
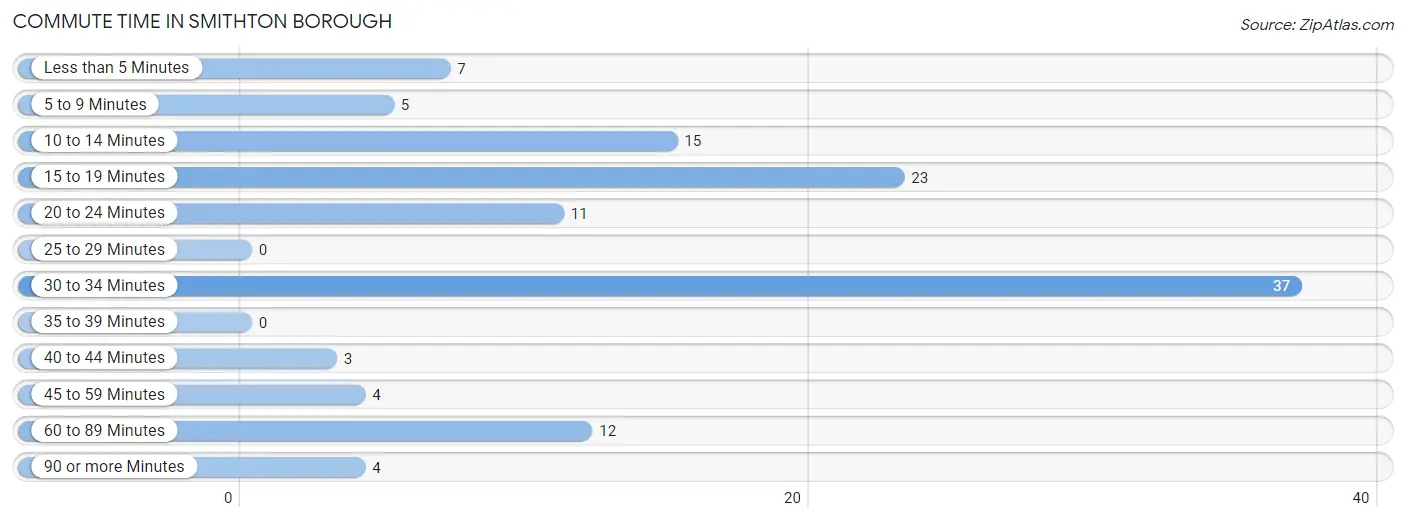
Commute Time in Smithton borough
The most frequently occuring commute durations in Smithton borough are 30 to 34 minutes (37 commuters, 30.6%), 15 to 19 minutes (23 commuters, 19.0%), and 10 to 14 minutes (15 commuters, 12.4%).
| Commute Time | # Commuters | % Commuters |
| Less than 5 Minutes | 7 | 5.8% |
| 5 to 9 Minutes | 5 | 4.1% |
| 10 to 14 Minutes | 15 | 12.4% |
| 15 to 19 Minutes | 23 | 19.0% |
| 20 to 24 Minutes | 11 | 9.1% |
| 25 to 29 Minutes | 0 | 0.0% |
| 30 to 34 Minutes | 37 | 30.6% |
| 35 to 39 Minutes | 0 | 0.0% |
| 40 to 44 Minutes | 3 | 2.5% |
| 45 to 59 Minutes | 4 | 3.3% |
| 60 to 89 Minutes | 12 | 9.9% |
| 90 or more Minutes | 4 | 3.3% |
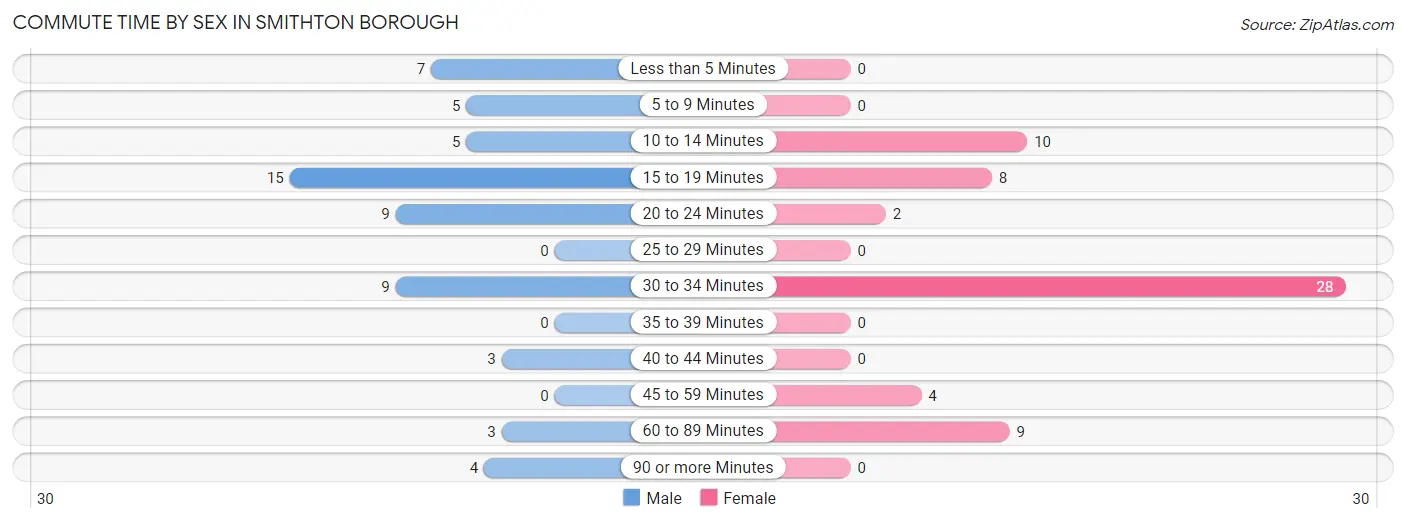
Commute Time by Sex in Smithton borough
The most common commute times in Smithton borough are 15 to 19 minutes (15 commuters, 25.0%) for males and 30 to 34 minutes (28 commuters, 45.9%) for females.
| Commute Time | Male | Female |
| Less than 5 Minutes | 7 (11.7%) | 0 (0.0%) |
| 5 to 9 Minutes | 5 (8.3%) | 0 (0.0%) |
| 10 to 14 Minutes | 5 (8.3%) | 10 (16.4%) |
| 15 to 19 Minutes | 15 (25.0%) | 8 (13.1%) |
| 20 to 24 Minutes | 9 (15.0%) | 2 (3.3%) |
| 25 to 29 Minutes | 0 (0.0%) | 0 (0.0%) |
| 30 to 34 Minutes | 9 (15.0%) | 28 (45.9%) |
| 35 to 39 Minutes | 0 (0.0%) | 0 (0.0%) |
| 40 to 44 Minutes | 3 (5.0%) | 0 (0.0%) |
| 45 to 59 Minutes | 0 (0.0%) | 4 (6.6%) |
| 60 to 89 Minutes | 3 (5.0%) | 9 (14.7%) |
| 90 or more Minutes | 4 (6.7%) | 0 (0.0%) |
Time of Departure to Work by Sex in Smithton borough
The most frequent times of departure to work in Smithton borough are 12:00 AM to 4:59 AM (12, 20.0%) for males and 8:00 AM to 8:29 AM (17, 27.9%) for females.
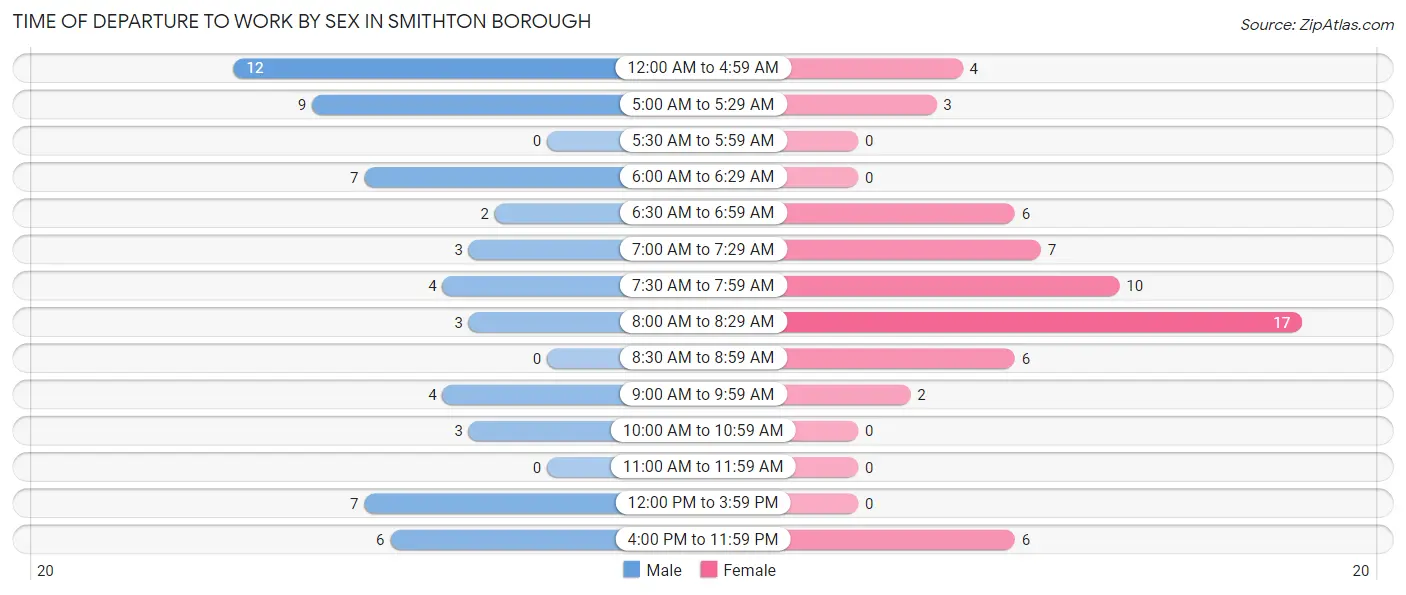
| Time of Departure | Male | Female |
| 12:00 AM to 4:59 AM | 12 (20.0%) | 4 (6.6%) |
| 5:00 AM to 5:29 AM | 9 (15.0%) | 3 (4.9%) |
| 5:30 AM to 5:59 AM | 0 (0.0%) | 0 (0.0%) |
| 6:00 AM to 6:29 AM | 7 (11.7%) | 0 (0.0%) |
| 6:30 AM to 6:59 AM | 2 (3.3%) | 6 (9.8%) |
| 7:00 AM to 7:29 AM | 3 (5.0%) | 7 (11.5%) |
| 7:30 AM to 7:59 AM | 4 (6.7%) | 10 (16.4%) |
| 8:00 AM to 8:29 AM | 3 (5.0%) | 17 (27.9%) |
| 8:30 AM to 8:59 AM | 0 (0.0%) | 6 (9.8%) |
| 9:00 AM to 9:59 AM | 4 (6.7%) | 2 (3.3%) |
| 10:00 AM to 10:59 AM | 3 (5.0%) | 0 (0.0%) |
| 11:00 AM to 11:59 AM | 0 (0.0%) | 0 (0.0%) |
| 12:00 PM to 3:59 PM | 7 (11.7%) | 0 (0.0%) |
| 4:00 PM to 11:59 PM | 6 (10.0%) | 6 (9.8%) |
| Total | 60 (100.0%) | 61 (100.0%) |
Housing Occupancy in Smithton borough
Occupancy by Ownership in Smithton borough
Of the total 151 dwellings in Smithton borough, owner-occupied units account for 114 (75.5%), while renter-occupied units make up 37 (24.5%).
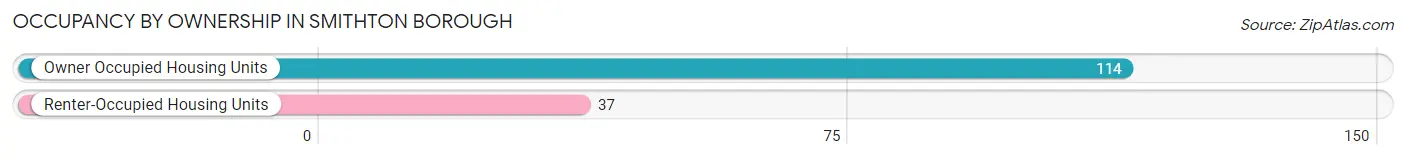
| Occupancy | # Housing Units | % Housing Units |
| Owner Occupied Housing Units | 114 | 75.5% |
| Renter-Occupied Housing Units | 37 | 24.5% |
| Total Occupied Housing Units | 151 | 100.0% |
Occupancy by Household Size in Smithton borough
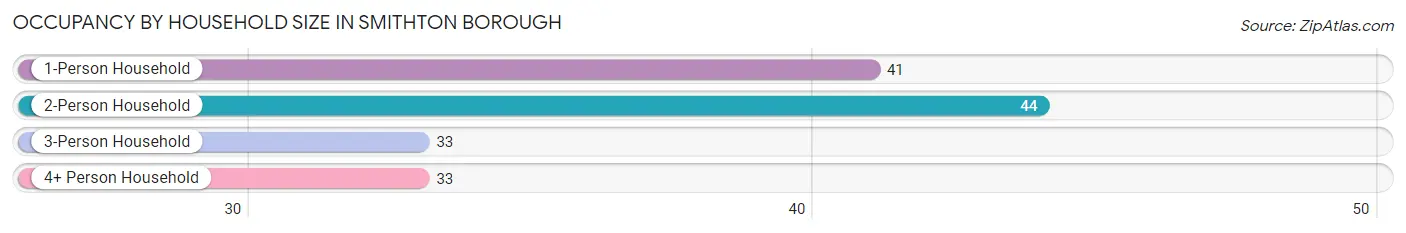
| Household Size | # Housing Units | % Housing Units |
| 1-Person Household | 41 | 27.2% |
| 2-Person Household | 44 | 29.1% |
| 3-Person Household | 33 | 21.8% |
| 4+ Person Household | 33 | 21.8% |
| Total Housing Units | 151 | 100.0% |
Occupancy by Ownership by Household Size in Smithton borough
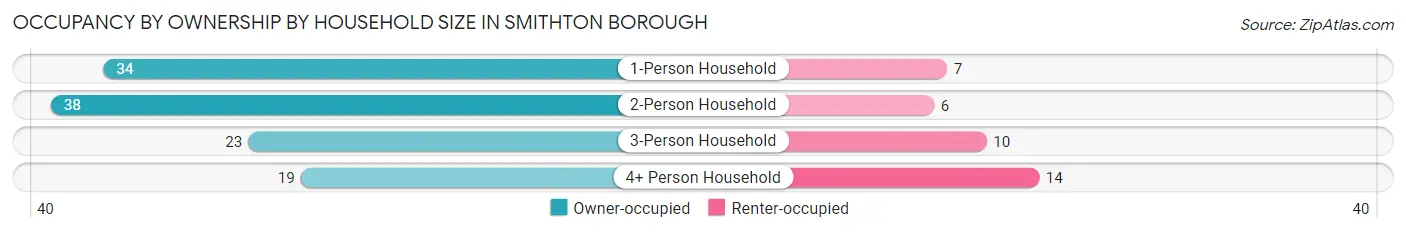
| Household Size | Owner-occupied | Renter-occupied |
| 1-Person Household | 34 (82.9%) | 7 (17.1%) |
| 2-Person Household | 38 (86.4%) | 6 (13.6%) |
| 3-Person Household | 23 (69.7%) | 10 (30.3%) |
| 4+ Person Household | 19 (57.6%) | 14 (42.4%) |
| Total Housing Units | 114 (75.5%) | 37 (24.5%) |
Occupancy by Educational Attainment in Smithton borough
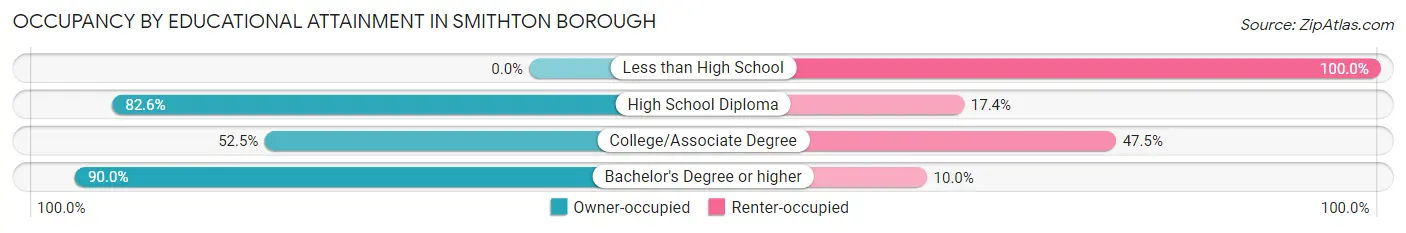
| Household Size | Owner-occupied | Renter-occupied |
| Less than High School | 0 (0.0%) | 2 (100.0%) |
| High School Diploma | 57 (82.6%) | 12 (17.4%) |
| College/Associate Degree | 21 (52.5%) | 19 (47.5%) |
| Bachelor's Degree or higher | 36 (90.0%) | 4 (10.0%) |
Occupancy by Age of Householder in Smithton borough
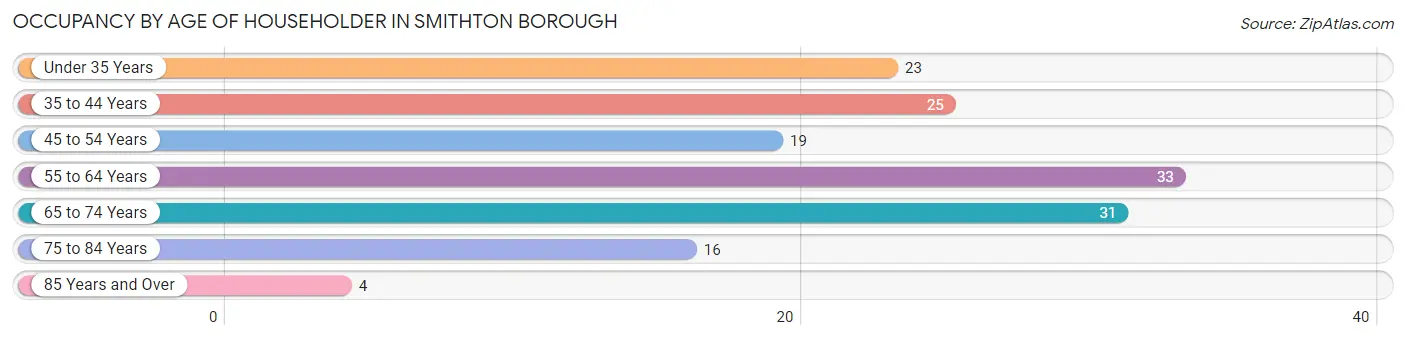
| Age Bracket | # Households | % Households |
| Under 35 Years | 23 | 15.2% |
| 35 to 44 Years | 25 | 16.6% |
| 45 to 54 Years | 19 | 12.6% |
| 55 to 64 Years | 33 | 21.8% |
| 65 to 74 Years | 31 | 20.5% |
| 75 to 84 Years | 16 | 10.6% |
| 85 Years and Over | 4 | 2.6% |
| Total | 151 | 100.0% |
Housing Finances in Smithton borough
Median Income by Occupancy in Smithton borough
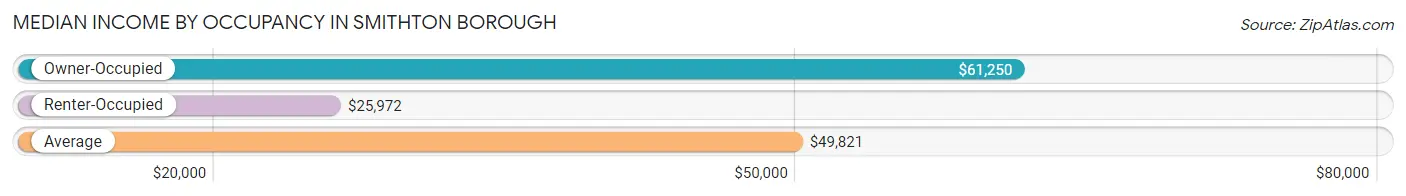
| Occupancy Type | # Households | Median Income |
| Owner-Occupied | 114 (75.5%) | $61,250 |
| Renter-Occupied | 37 (24.5%) | $25,972 |
| Average | 151 (100.0%) | $49,821 |
Occupancy by Householder Income Bracket in Smithton borough
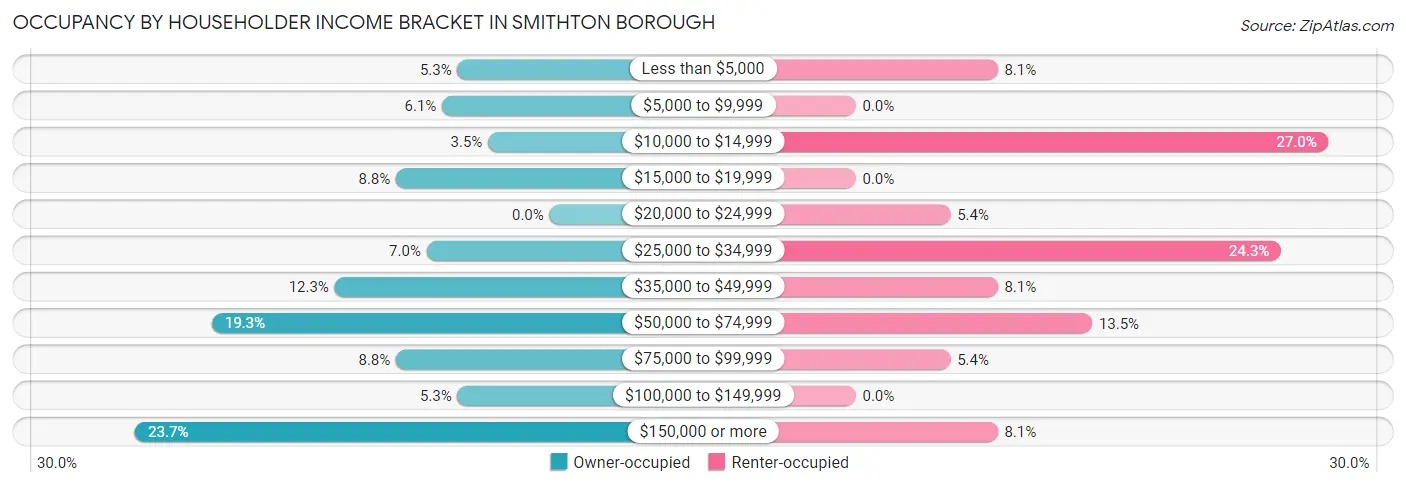
| Income Bracket | Owner-occupied | Renter-occupied |
| Less than $5,000 | 6 (5.3%) | 3 (8.1%) |
| $5,000 to $9,999 | 7 (6.1%) | 0 (0.0%) |
| $10,000 to $14,999 | 4 (3.5%) | 10 (27.0%) |
| $15,000 to $19,999 | 10 (8.8%) | 0 (0.0%) |
| $20,000 to $24,999 | 0 (0.0%) | 2 (5.4%) |
| $25,000 to $34,999 | 8 (7.0%) | 9 (24.3%) |
| $35,000 to $49,999 | 14 (12.3%) | 3 (8.1%) |
| $50,000 to $74,999 | 22 (19.3%) | 5 (13.5%) |
| $75,000 to $99,999 | 10 (8.8%) | 2 (5.4%) |
| $100,000 to $149,999 | 6 (5.3%) | 0 (0.0%) |
| $150,000 or more | 27 (23.7%) | 3 (8.1%) |
| Total | 114 (100.0%) | 37 (100.0%) |
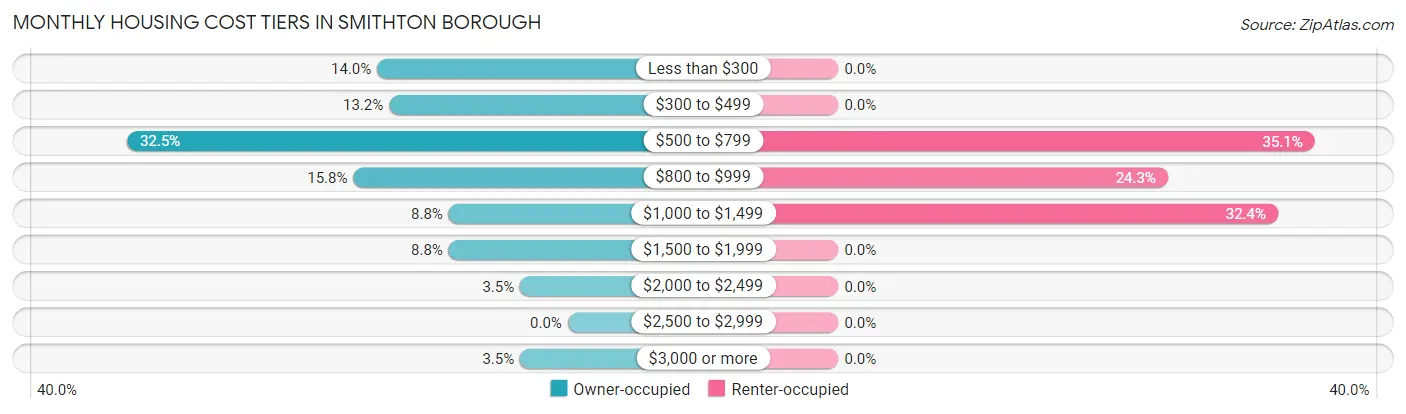
Monthly Housing Cost Tiers in Smithton borough
| Monthly Cost | Owner-occupied | Renter-occupied |
| Less than $300 | 16 (14.0%) | 0 (0.0%) |
| $300 to $499 | 15 (13.2%) | 0 (0.0%) |
| $500 to $799 | 37 (32.5%) | 13 (35.1%) |
| $800 to $999 | 18 (15.8%) | 9 (24.3%) |
| $1,000 to $1,499 | 10 (8.8%) | 12 (32.4%) |
| $1,500 to $1,999 | 10 (8.8%) | 0 (0.0%) |
| $2,000 to $2,499 | 4 (3.5%) | 0 (0.0%) |
| $2,500 to $2,999 | 0 (0.0%) | 0 (0.0%) |
| $3,000 or more | 4 (3.5%) | 0 (0.0%) |
| Total | 114 (100.0%) | 37 (100.0%) |
Physical Housing Characteristics in Smithton borough
Housing Structures in Smithton borough
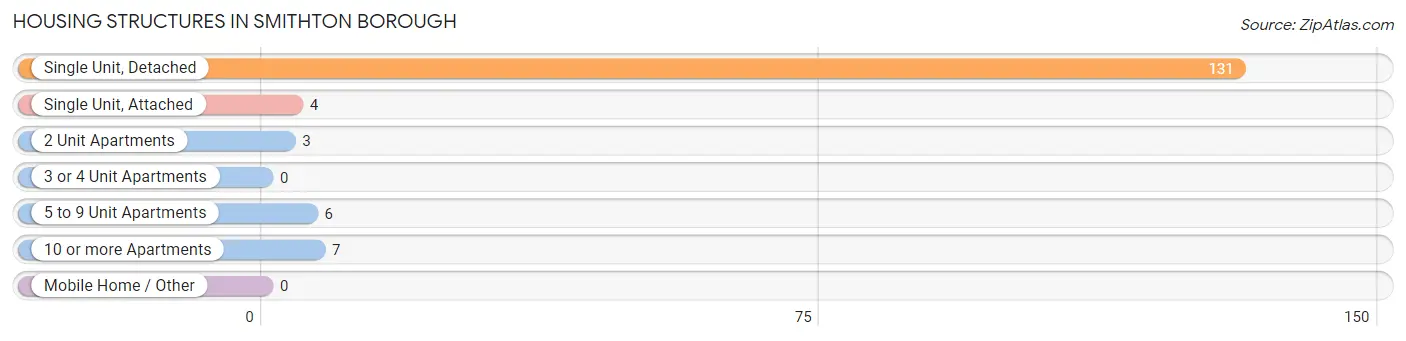
| Structure Type | # Housing Units | % Housing Units |
| Single Unit, Detached | 131 | 86.8% |
| Single Unit, Attached | 4 | 2.6% |
| 2 Unit Apartments | 3 | 2.0% |
| 3 or 4 Unit Apartments | 0 | 0.0% |
| 5 to 9 Unit Apartments | 6 | 4.0% |
| 10 or more Apartments | 7 | 4.6% |
| Mobile Home / Other | 0 | 0.0% |
| Total | 151 | 100.0% |
Housing Structures by Occupancy in Smithton borough
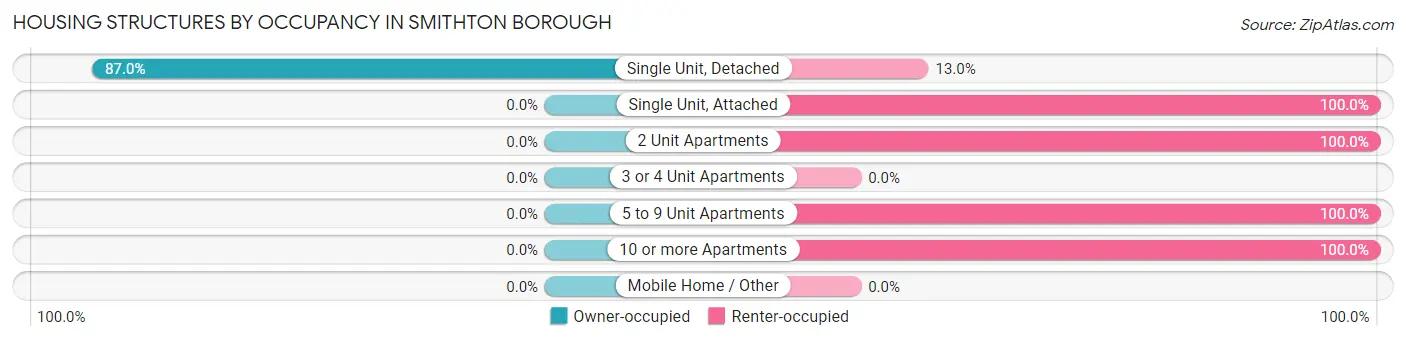
| Structure Type | Owner-occupied | Renter-occupied |
| Single Unit, Detached | 114 (87.0%) | 17 (13.0%) |
| Single Unit, Attached | 0 (0.0%) | 4 (100.0%) |
| 2 Unit Apartments | 0 (0.0%) | 3 (100.0%) |
| 3 or 4 Unit Apartments | 0 (0.0%) | 0 (0.0%) |
| 5 to 9 Unit Apartments | 0 (0.0%) | 6 (100.0%) |
| 10 or more Apartments | 0 (0.0%) | 7 (100.0%) |
| Mobile Home / Other | 0 (0.0%) | 0 (0.0%) |
| Total | 114 (75.5%) | 37 (24.5%) |
Housing Structures by Number of Rooms in Smithton borough
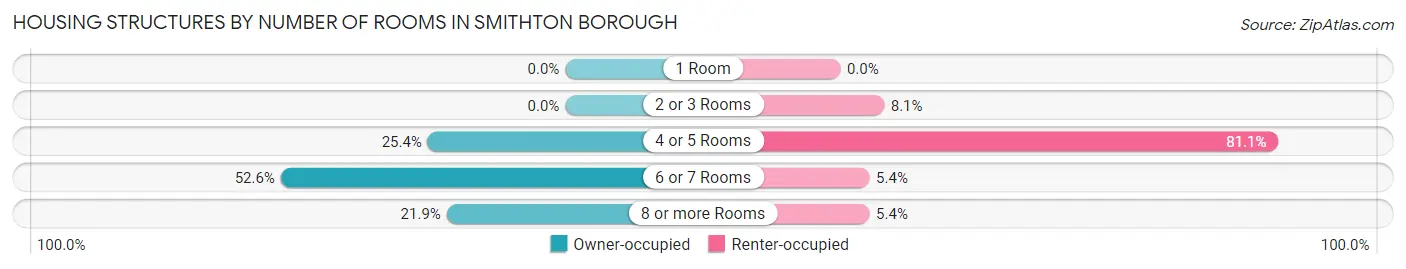
| Number of Rooms | Owner-occupied | Renter-occupied |
| 1 Room | 0 (0.0%) | 0 (0.0%) |
| 2 or 3 Rooms | 0 (0.0%) | 3 (8.1%) |
| 4 or 5 Rooms | 29 (25.4%) | 30 (81.1%) |
| 6 or 7 Rooms | 60 (52.6%) | 2 (5.4%) |
| 8 or more Rooms | 25 (21.9%) | 2 (5.4%) |
| Total | 114 (100.0%) | 37 (100.0%) |
Housing Structure by Heating Type in Smithton borough
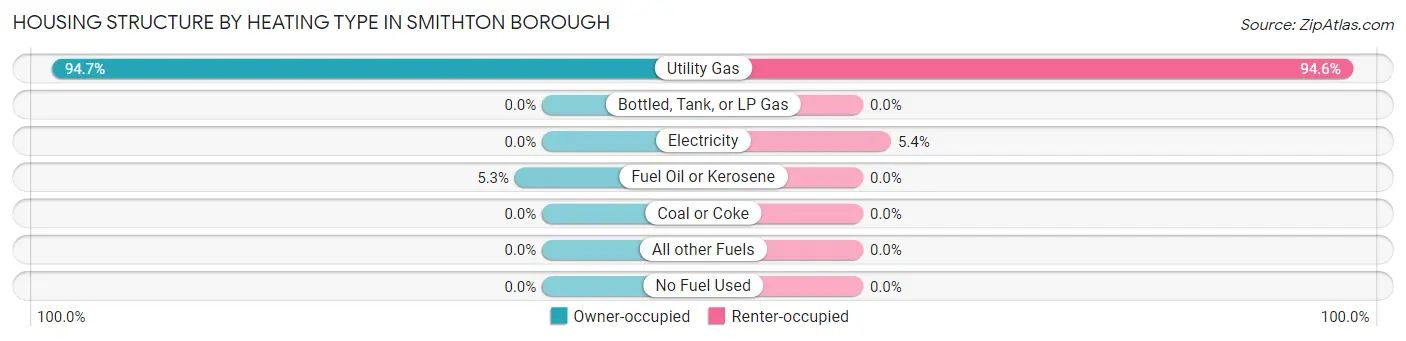
| Heating Type | Owner-occupied | Renter-occupied |
| Utility Gas | 108 (94.7%) | 35 (94.6%) |
| Bottled, Tank, or LP Gas | 0 (0.0%) | 0 (0.0%) |
| Electricity | 0 (0.0%) | 2 (5.4%) |
| Fuel Oil or Kerosene | 6 (5.3%) | 0 (0.0%) |
| Coal or Coke | 0 (0.0%) | 0 (0.0%) |
| All other Fuels | 0 (0.0%) | 0 (0.0%) |
| No Fuel Used | 0 (0.0%) | 0 (0.0%) |
| Total | 114 (100.0%) | 37 (100.0%) |
Household Vehicle Usage in Smithton borough
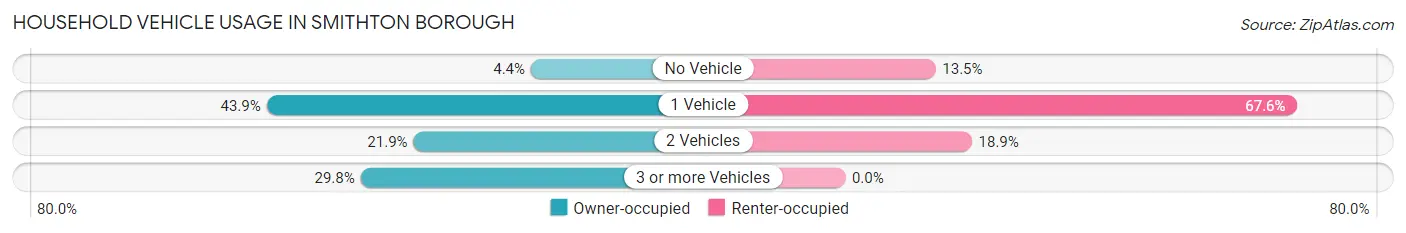
| Vehicles per Household | Owner-occupied | Renter-occupied |
| No Vehicle | 5 (4.4%) | 5 (13.5%) |
| 1 Vehicle | 50 (43.9%) | 25 (67.6%) |
| 2 Vehicles | 25 (21.9%) | 7 (18.9%) |
| 3 or more Vehicles | 34 (29.8%) | 0 (0.0%) |
| Total | 114 (100.0%) | 37 (100.0%) |
Real Estate & Mortgages in Smithton borough
Real Estate and Mortgage Overview in Smithton borough
| Characteristic | Without Mortgage | With Mortgage |
| Housing Units | 42 | 72 |
| Median Property Value | $90,000 | $101,300 |
| Median Household Income | - | - |
| Monthly Housing Costs | $392 | $4 |
| Real Estate Taxes | $1,341 | $0 |
Property Value by Mortgage Status in Smithton borough
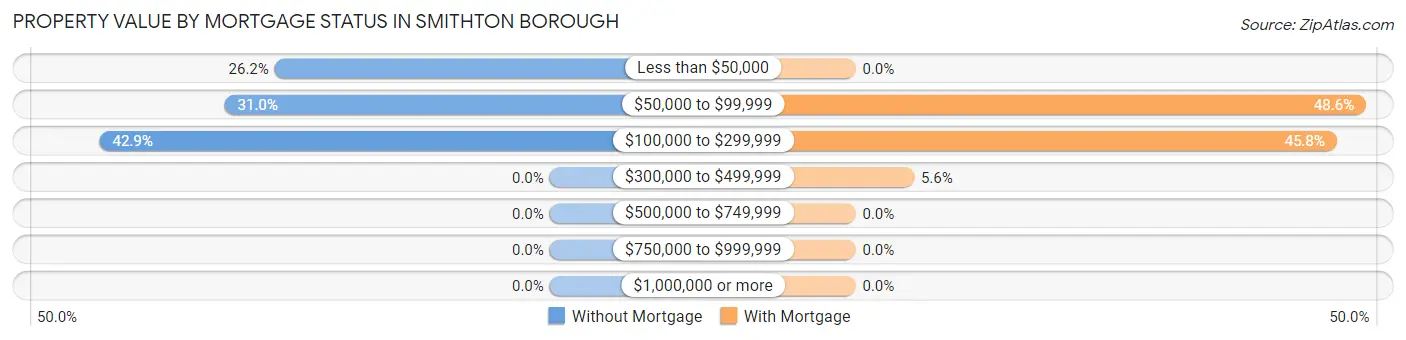
| Property Value | Without Mortgage | With Mortgage |
| Less than $50,000 | 11 (26.2%) | 0 (0.0%) |
| $50,000 to $99,999 | 13 (30.9%) | 35 (48.6%) |
| $100,000 to $299,999 | 18 (42.9%) | 33 (45.8%) |
| $300,000 to $499,999 | 0 (0.0%) | 4 (5.6%) |
| $500,000 to $749,999 | 0 (0.0%) | 0 (0.0%) |
| $750,000 to $999,999 | 0 (0.0%) | 0 (0.0%) |
| $1,000,000 or more | 0 (0.0%) | 0 (0.0%) |
| Total | 42 (100.0%) | 72 (100.0%) |
Household Income by Mortgage Status in Smithton borough
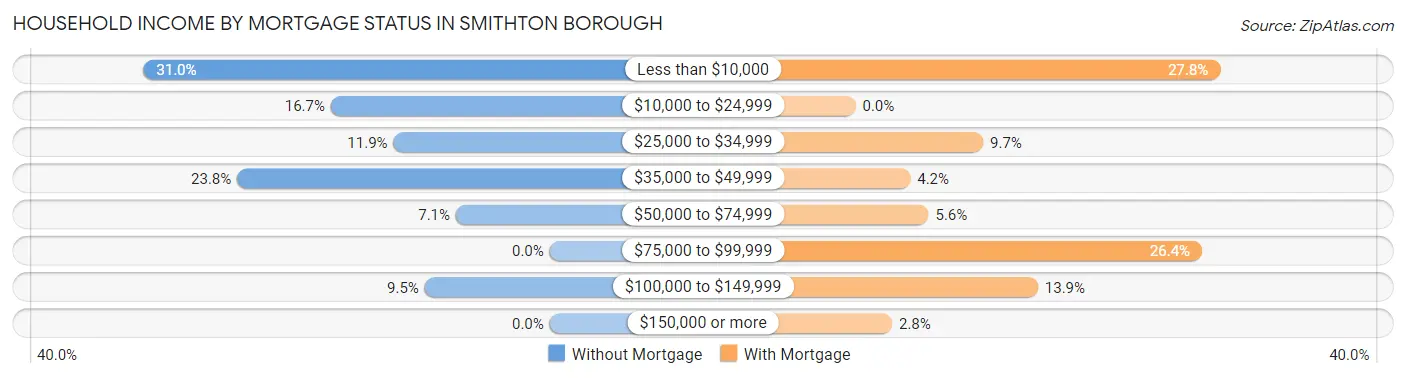
| Household Income | Without Mortgage | With Mortgage |
| Less than $10,000 | 13 (30.9%) | 20 (27.8%) |
| $10,000 to $24,999 | 7 (16.7%) | 0 (0.0%) |
| $25,000 to $34,999 | 5 (11.9%) | 7 (9.7%) |
| $35,000 to $49,999 | 10 (23.8%) | 3 (4.2%) |
| $50,000 to $74,999 | 3 (7.1%) | 4 (5.6%) |
| $75,000 to $99,999 | 0 (0.0%) | 19 (26.4%) |
| $100,000 to $149,999 | 4 (9.5%) | 10 (13.9%) |
| $150,000 or more | 0 (0.0%) | 2 (2.8%) |
| Total | 42 (100.0%) | 72 (100.0%) |
Property Value to Household Income Ratio in Smithton borough
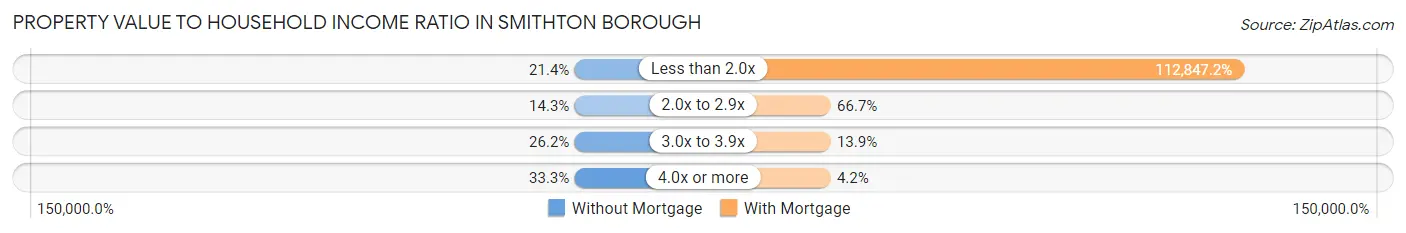
| Value-to-Income Ratio | Without Mortgage | With Mortgage |
| Less than 2.0x | 9 (21.4%) | 81,250 (112,847.2%) |
| 2.0x to 2.9x | 6 (14.3%) | 48 (66.7%) |
| 3.0x to 3.9x | 11 (26.2%) | 10 (13.9%) |
| 4.0x or more | 14 (33.3%) | 3 (4.2%) |
| Total | 42 (100.0%) | 72 (100.0%) |
Real Estate Taxes by Mortgage Status in Smithton borough
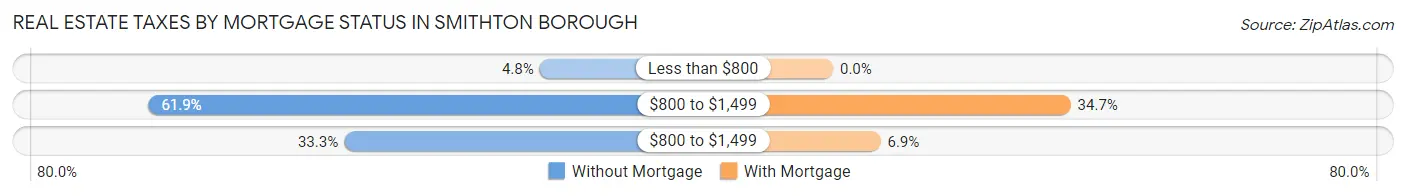
| Property Taxes | Without Mortgage | With Mortgage |
| Less than $800 | 2 (4.8%) | 0 (0.0%) |
| $800 to $1,499 | 26 (61.9%) | 25 (34.7%) |
| $800 to $1,499 | 14 (33.3%) | 5 (6.9%) |
| Total | 42 (100.0%) | 72 (100.0%) |
Health & Disability in Smithton borough
Health Insurance Coverage by Age in Smithton borough
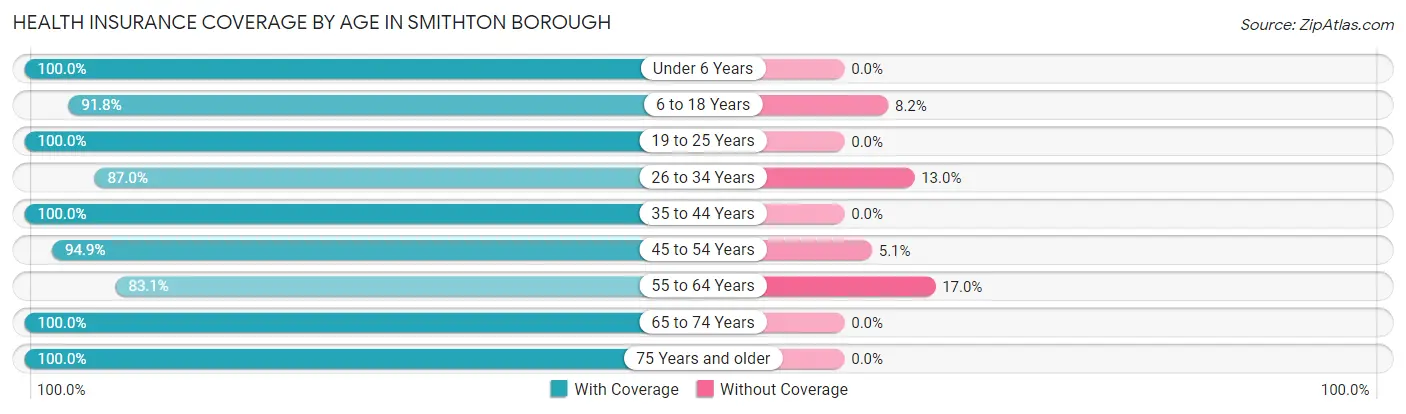
| Age Bracket | With Coverage | Without Coverage |
| Under 6 Years | 18 (100.0%) | 0 (0.0%) |
| 6 to 18 Years | 90 (91.8%) | 8 (8.2%) |
| 19 to 25 Years | 28 (100.0%) | 0 (0.0%) |
| 26 to 34 Years | 40 (87.0%) | 6 (13.0%) |
| 35 to 44 Years | 39 (100.0%) | 0 (0.0%) |
| 45 to 54 Years | 37 (94.9%) | 2 (5.1%) |
| 55 to 64 Years | 49 (83.1%) | 10 (17.0%) |
| 65 to 74 Years | 51 (100.0%) | 0 (0.0%) |
| 75 Years and older | 27 (100.0%) | 0 (0.0%) |
| Total | 379 (93.6%) | 26 (6.4%) |
Health Insurance Coverage by Citizenship Status in Smithton borough
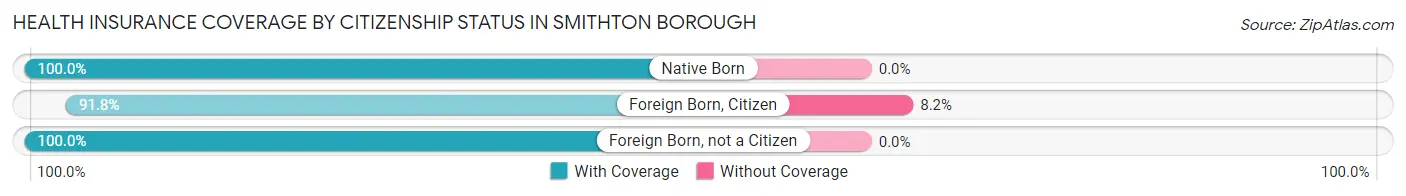
| Citizenship Status | With Coverage | Without Coverage |
| Native Born | 18 (100.0%) | 0 (0.0%) |
| Foreign Born, Citizen | 90 (91.8%) | 8 (8.2%) |
| Foreign Born, not a Citizen | 28 (100.0%) | 0 (0.0%) |
Health Insurance Coverage by Household Income in Smithton borough
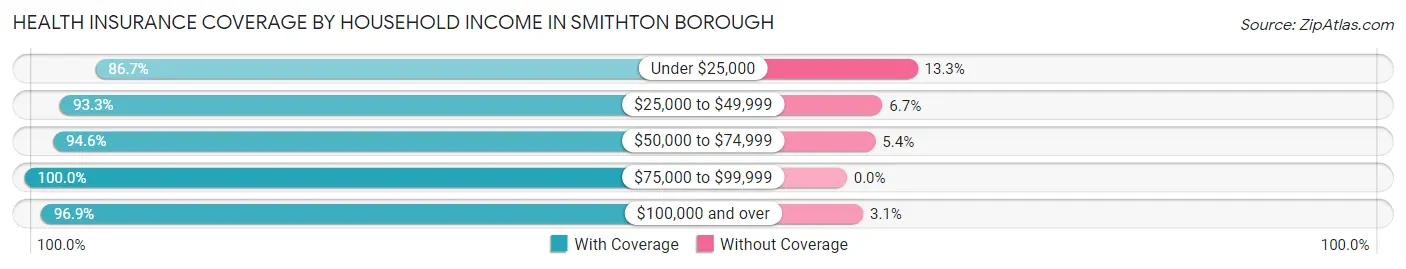
| Household Income | With Coverage | Without Coverage |
| Under $25,000 | 85 (86.7%) | 13 (13.3%) |
| $25,000 to $49,999 | 56 (93.3%) | 4 (6.7%) |
| $50,000 to $74,999 | 106 (94.6%) | 6 (5.4%) |
| $75,000 to $99,999 | 37 (100.0%) | 0 (0.0%) |
| $100,000 and over | 95 (96.9%) | 3 (3.1%) |
Public vs Private Health Insurance Coverage by Age in Smithton borough
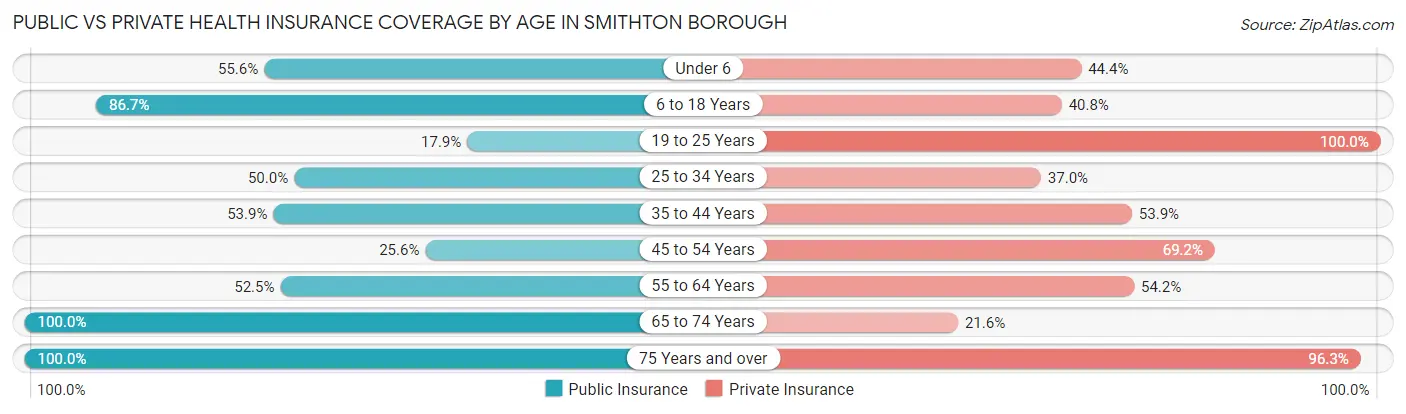
| Age Bracket | Public Insurance | Private Insurance |
| Under 6 | 10 (55.6%) | 8 (44.4%) |
| 6 to 18 Years | 85 (86.7%) | 40 (40.8%) |
| 19 to 25 Years | 5 (17.9%) | 28 (100.0%) |
| 25 to 34 Years | 23 (50.0%) | 17 (37.0%) |
| 35 to 44 Years | 21 (53.8%) | 21 (53.8%) |
| 45 to 54 Years | 10 (25.6%) | 27 (69.2%) |
| 55 to 64 Years | 31 (52.5%) | 32 (54.2%) |
| 65 to 74 Years | 51 (100.0%) | 11 (21.6%) |
| 75 Years and over | 27 (100.0%) | 26 (96.3%) |
| Total | 263 (64.9%) | 210 (51.8%) |
Disability Status by Sex by Age in Smithton borough
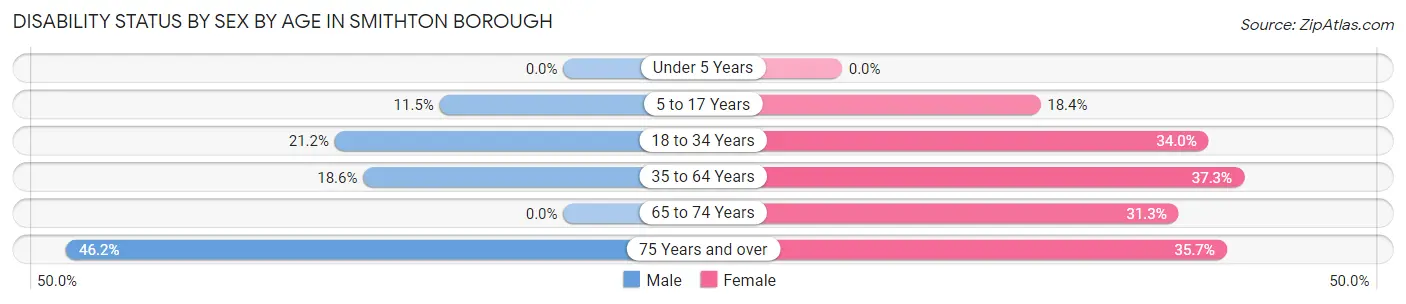
| Age Bracket | Male | Female |
| Under 5 Years | 0 (0.0%) | 0 (0.0%) |
| 5 to 17 Years | 7 (11.5%) | 7 (18.4%) |
| 18 to 34 Years | 7 (21.2%) | 16 (34.0%) |
| 35 to 64 Years | 13 (18.6%) | 25 (37.3%) |
| 65 to 74 Years | 0 (0.0%) | 10 (31.2%) |
| 75 Years and over | 6 (46.2%) | 5 (35.7%) |
Disability Class by Sex by Age in Smithton borough
Disability Class: Hearing Difficulty
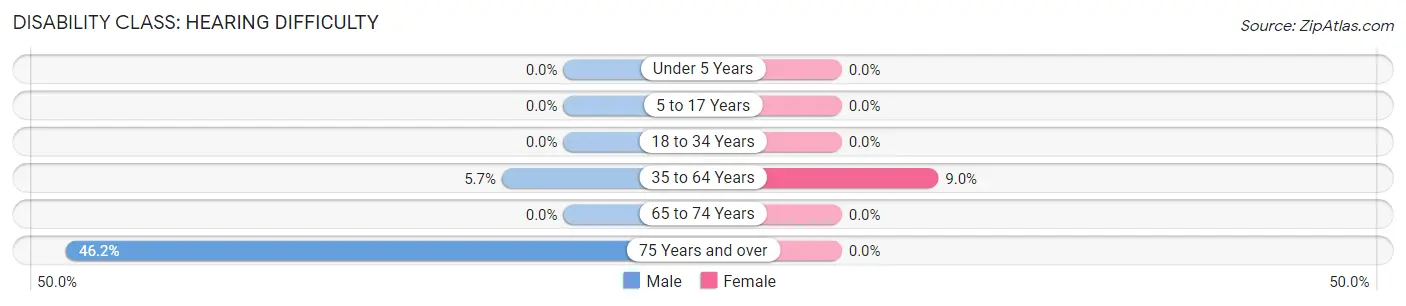
| Age Bracket | Male | Female |
| Under 5 Years | 0 (0.0%) | 0 (0.0%) |
| 5 to 17 Years | 0 (0.0%) | 0 (0.0%) |
| 18 to 34 Years | 0 (0.0%) | 0 (0.0%) |
| 35 to 64 Years | 4 (5.7%) | 6 (9.0%) |
| 65 to 74 Years | 0 (0.0%) | 0 (0.0%) |
| 75 Years and over | 6 (46.2%) | 0 (0.0%) |
Disability Class: Vision Difficulty
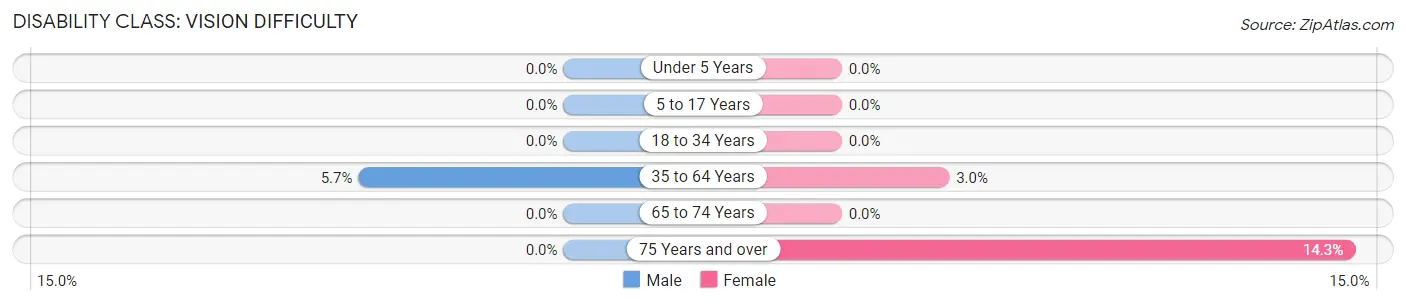
| Age Bracket | Male | Female |
| Under 5 Years | 0 (0.0%) | 0 (0.0%) |
| 5 to 17 Years | 0 (0.0%) | 0 (0.0%) |
| 18 to 34 Years | 0 (0.0%) | 0 (0.0%) |
| 35 to 64 Years | 4 (5.7%) | 2 (3.0%) |
| 65 to 74 Years | 0 (0.0%) | 0 (0.0%) |
| 75 Years and over | 0 (0.0%) | 2 (14.3%) |
Disability Class: Cognitive Difficulty
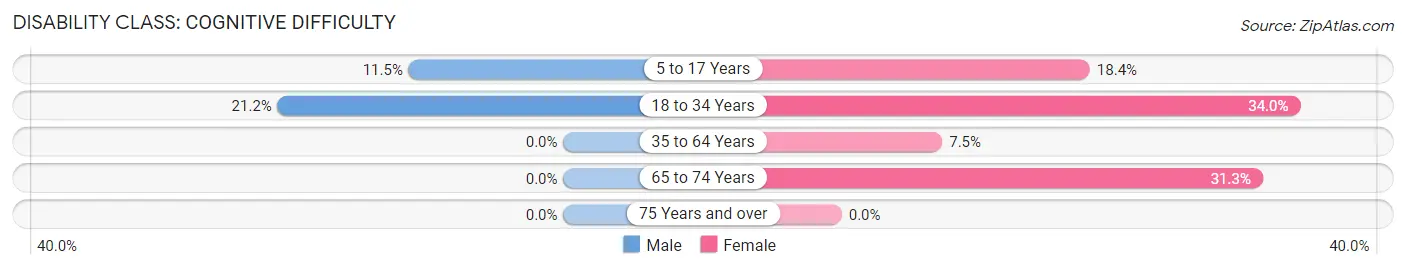
| Age Bracket | Male | Female |
| 5 to 17 Years | 7 (11.5%) | 7 (18.4%) |
| 18 to 34 Years | 7 (21.2%) | 16 (34.0%) |
| 35 to 64 Years | 0 (0.0%) | 5 (7.5%) |
| 65 to 74 Years | 0 (0.0%) | 10 (31.2%) |
| 75 Years and over | 0 (0.0%) | 0 (0.0%) |
Disability Class: Ambulatory Difficulty
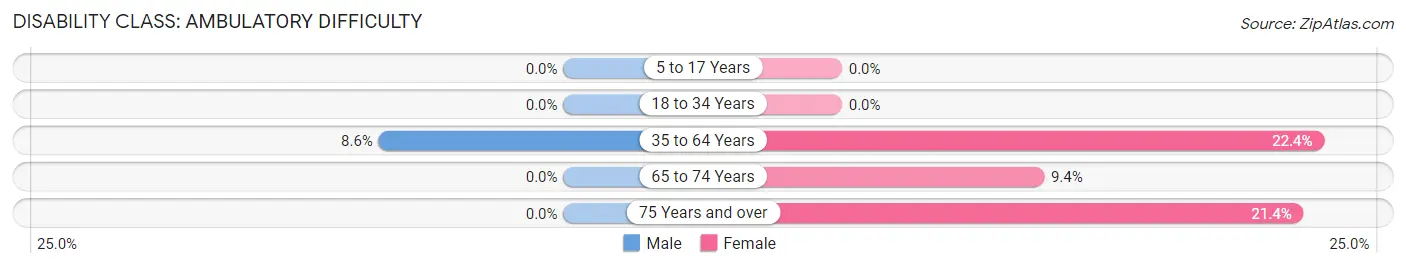
| Age Bracket | Male | Female |
| 5 to 17 Years | 0 (0.0%) | 0 (0.0%) |
| 18 to 34 Years | 0 (0.0%) | 0 (0.0%) |
| 35 to 64 Years | 6 (8.6%) | 15 (22.4%) |
| 65 to 74 Years | 0 (0.0%) | 3 (9.4%) |
| 75 Years and over | 0 (0.0%) | 3 (21.4%) |
Disability Class: Self-Care Difficulty
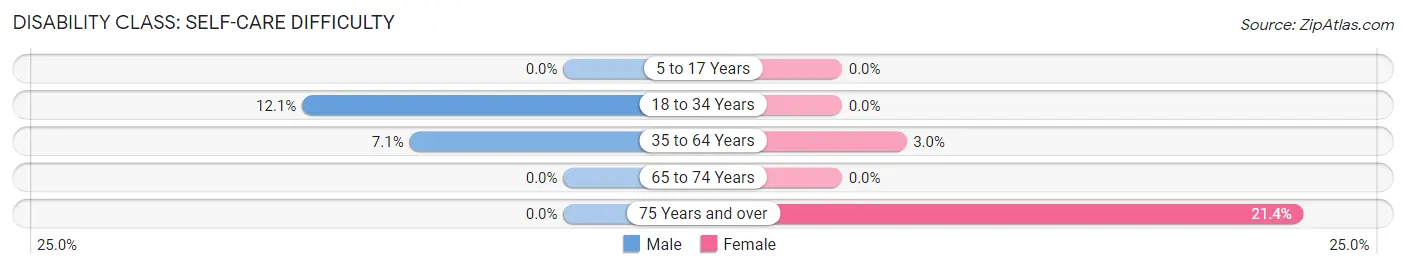
| Age Bracket | Male | Female |
| 5 to 17 Years | 0 (0.0%) | 0 (0.0%) |
| 18 to 34 Years | 4 (12.1%) | 0 (0.0%) |
| 35 to 64 Years | 5 (7.1%) | 2 (3.0%) |
| 65 to 74 Years | 0 (0.0%) | 0 (0.0%) |
| 75 Years and over | 0 (0.0%) | 3 (21.4%) |
Technology Access in Smithton borough
Computing Device Access in Smithton borough
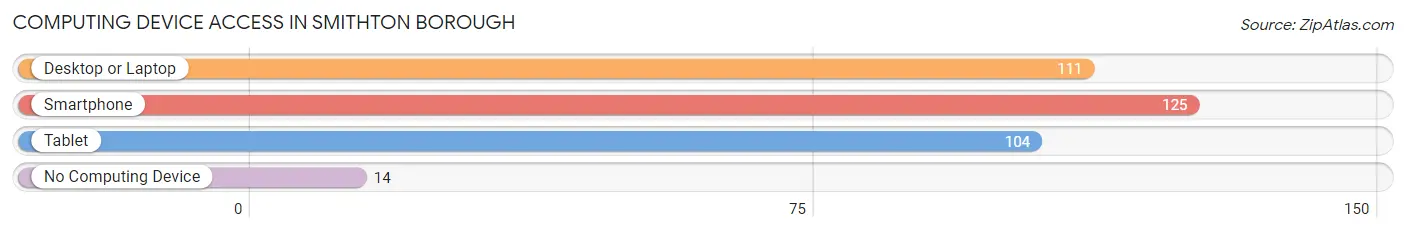
| Device Type | # Households | % Households |
| Desktop or Laptop | 111 | 73.5% |
| Smartphone | 125 | 82.8% |
| Tablet | 104 | 68.9% |
| No Computing Device | 14 | 9.3% |
| Total | 151 | 100.0% |
Internet Access in Smithton borough
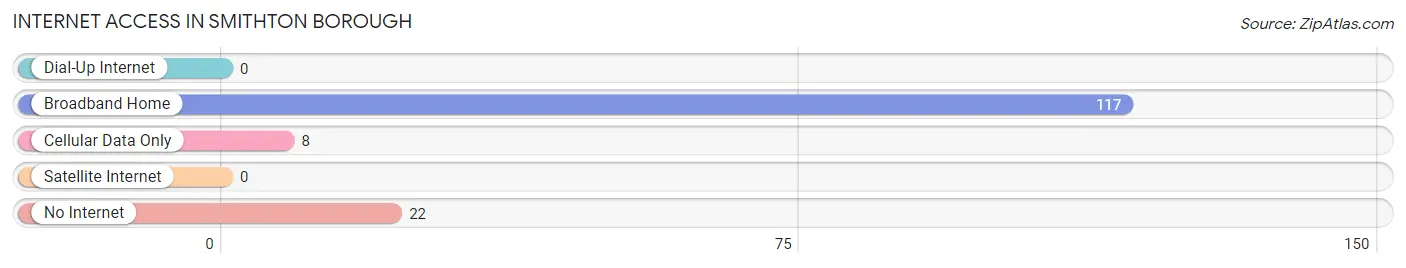
| Internet Type | # Households | % Households |
| Dial-Up Internet | 0 | 0.0% |
| Broadband Home | 117 | 77.5% |
| Cellular Data Only | 8 | 5.3% |
| Satellite Internet | 0 | 0.0% |
| No Internet | 22 | 14.6% |
| Total | 151 | 100.0% |
Smithton borough Summary
Smithton Borough is a small borough located in Westmoreland County, Pennsylvania. It is situated in the foothills of the Allegheny Mountains, approximately 30 miles southeast of Pittsburgh. The borough is home to a population of approximately 1,500 people, and is part of the Greater Pittsburgh Metropolitan Area.
History
Smithton Borough was founded in 1872 by a group of settlers from the nearby town of Smithfield. The settlers were looking for a place to call home and found the area to be ideal for farming and other agricultural activities. The town was named after the Smith family, who were among the first settlers.
The town grew slowly but steadily over the years, and by the early 1900s, it had become a thriving community. The town was home to several businesses, including a general store, a blacksmith shop, a sawmill, and a gristmill. The town also had a post office, a school, and a church.
In the late 1800s, the town was connected to the rest of the region by the Pennsylvania Railroad. This allowed for increased trade and commerce, and the town began to grow even more. By the early 1900s, Smithton had become a popular destination for tourists, and the town was known for its beautiful scenery and outdoor activities.
Geography
Smithton Borough is located in Westmoreland County, Pennsylvania. It is situated in the foothills of the Allegheny Mountains, approximately 30 miles southeast of Pittsburgh. The borough is bordered by the towns of Smithfield, Derry, and Donegal.
The borough is situated on a plateau, with an elevation of approximately 1,000 feet. The terrain is mostly flat, with some rolling hills. The climate is temperate, with hot summers and cold winters.
Economy
The economy of Smithton Borough is largely based on agriculture and tourism. The town is home to several farms, which produce a variety of crops, including corn, wheat, and hay. The town is also home to several wineries, which produce a variety of wines.
Tourism is also an important part of the local economy. The town is home to several attractions, including the Smithton Historical Museum, the Smithton Nature Center, and the Smithton Country Club. The town also hosts several festivals and events throughout the year, including the Smithton Summer Festival and the Smithton Fall Festival.
Demographics
As of the 2010 census, the population of Smithton Borough was 1,521. The racial makeup of the borough was 97.3% White, 0.7% African American, 0.2% Native American, 0.3% Asian, 0.1% Pacific Islander, 0.4% from other races, and 1.0% from two or more races. Hispanic or Latino of any race were 1.2% of the population.
The median household income in Smithton Borough was $45,938, and the median family income was $51,938. The per capita income was $20,938. About 8.3% of families and 10.2% of the population were below the poverty line, including 14.2% of those under age 18 and 6.2% of those age 65 or over.
Conclusion
Smithton Borough is a small borough located in Westmoreland County, Pennsylvania. It is situated in the foothills of the Allegheny Mountains, approximately 30 miles southeast of Pittsburgh. The borough is home to a population of approximately 1,500 people, and is part of the Greater Pittsburgh Metropolitan Area. The economy of Smithton Borough is largely based on agriculture and tourism, and the town is home to several attractions, including the Smithton Historical Museum, the Smithton Nature Center, and the Smithton Country Club. The racial makeup of the borough is predominantly White, with a small percentage of African American, Native American, Asian, and Pacific Islander residents. The median household income in Smithton Borough is $45,938, and the per capita income is $20,938.
Common Questions
What is the Total Population of Smithton borough?
Total Population of Smithton borough is 405.
What is the Total Male Population of Smithton borough?
Total Male Population of Smithton borough is 202.
What is the Total Female Population of Smithton borough?
Total Female Population of Smithton borough is 203.
What is the Ratio of Males per 100 Females in Smithton borough?
There are 99.51 Males per 100 Females in Smithton borough.
What is the Ratio of Females per 100 Males in Smithton borough?
There are 100.50 Females per 100 Males in Smithton borough.
What is the Median Population Age in Smithton borough?
Median Population Age in Smithton borough is 36.9 Years.
What is the Average Family Size in Smithton borough
Average Family Size in Smithton borough is 3.2 People.
What is the Average Household Size in Smithton borough
Average Household Size in Smithton borough is 2.7 People.
What is Per Capita Income in Smithton borough?
Per Capita income in Smithton borough is $28,071.
What is the Median Family Income in Smithton borough?
Median Family Income in Smithton borough is $60,000.
What is the Median Household income in Smithton borough?
Median Household Income in Smithton borough is $49,821.
What is Inequality or Gini Index in Smithton borough?
Inequality or Gini Index in Smithton borough is 0.48.
How Large is the Labor Force in Smithton borough?
There are 160 People in the Labor Forcein in Smithton borough.
What is the Percentage of People in the Labor Force in Smithton borough?
53.5% of People are in the Labor Force in Smithton borough.
What is the Unemployment Rate in Smithton borough?
Unemployment Rate in Smithton borough is 11.3%.