Venango borough, PA
Venango borough Overview
221
TOTAL POPULATION
114
MALE POPULATION
107
FEMALE POPULATION
106.54
MALES / 100 FEMALES
93.86
FEMALES / 100 MALES
39.7
MEDIAN AGE
2.9
AVG FAMILY SIZE
2.2
AVG HOUSEHOLD SIZE
$30,089
PER CAPITA INCOME
$63,929
AVG FAMILY INCOME
$64,643
AVG HOUSEHOLD INCOME
35.6%
WAGE / INCOME GAP [ % ]
64.4¢/ $1
WAGE / INCOME GAP [ $ ]
0.30
INEQUALITY / GINI INDEX
125
LABOR FORCE [ PEOPLE ]
67.6%
PERCENT IN LABOR FORCE
9.6%
UNEMPLOYMENT RATE
Race in Venango borough
The most populous races in Venango borough are White / Caucasian (208 | 94.1%), Two or more Races (12 | 5.4%), and Hispanic or Latino (2 | 0.9%).
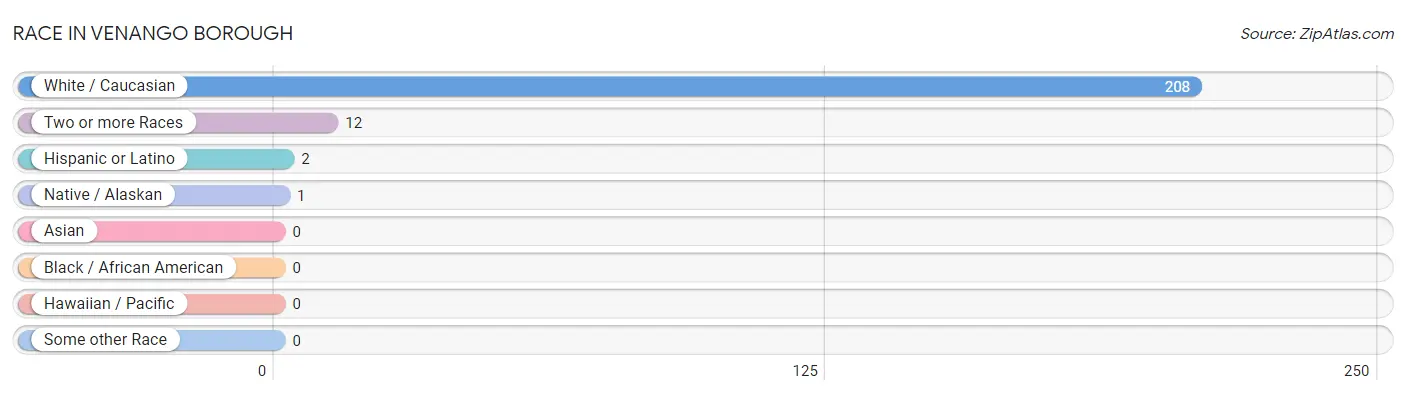
| Race | # Population | % Population |
| Asian | 0 | 0.0% |
| Black / African American | 0 | 0.0% |
| Hawaiian / Pacific | 0 | 0.0% |
| Hispanic or Latino | 2 | 0.9% |
| Native / Alaskan | 1 | 0.4% |
| White / Caucasian | 208 | 94.1% |
| Two or more Races | 12 | 5.4% |
| Some other Race | 0 | 0.0% |
| Total | 221 | 100.0% |
Ancestry in Venango borough
The most populous ancestries reported in Venango borough are German (99 | 44.8%), Polish (56 | 25.3%), Irish (34 | 15.4%), English (28 | 12.7%), and European (15 | 6.8%), together accounting for 105.0% of all Venango borough residents.
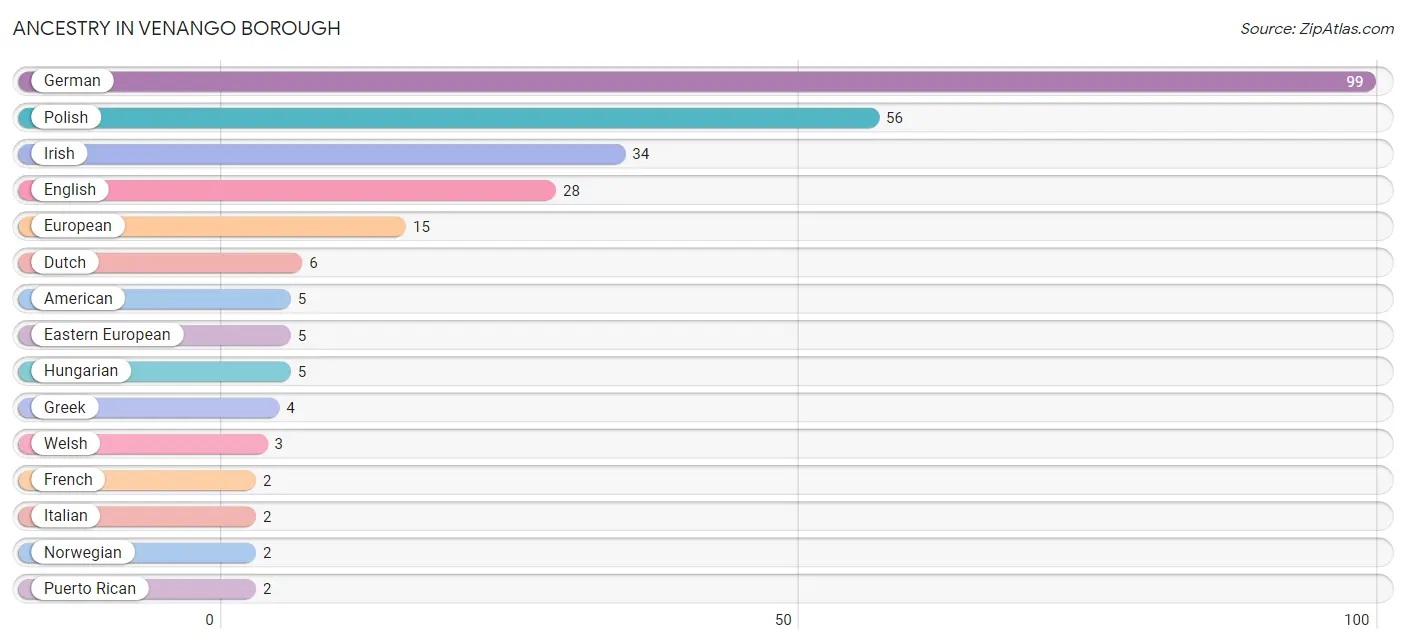
| Ancestry | # Population | % Population |
| American | 5 | 2.3% |
| Austrian | 1 | 0.4% |
| Dutch | 6 | 2.7% |
| Eastern European | 5 | 2.3% |
| English | 28 | 12.7% |
| European | 15 | 6.8% |
| French | 2 | 0.9% |
| French Canadian | 1 | 0.4% |
| German | 99 | 44.8% |
| Greek | 4 | 1.8% |
| Hungarian | 5 | 2.3% |
| Irish | 34 | 15.4% |
| Italian | 2 | 0.9% |
| Lumbee | 1 | 0.4% |
| Norwegian | 2 | 0.9% |
| Polish | 56 | 25.3% |
| Puerto Rican | 2 | 0.9% |
| Russian | 2 | 0.9% |
| Scottish | 1 | 0.4% |
| Swedish | 1 | 0.4% |
| Welsh | 3 | 1.4% | View All 21 Rows |
Immigrants in Venango borough

| Immigration Origin | # Population | % Population | View All 0 Rows |
Sex and Age in Venango borough
Sex and Age in Venango borough
The most populous age groups in Venango borough are 5 to 9 Years (15 | 13.2%) for men and 30 to 34 Years (19 | 17.8%) for women.
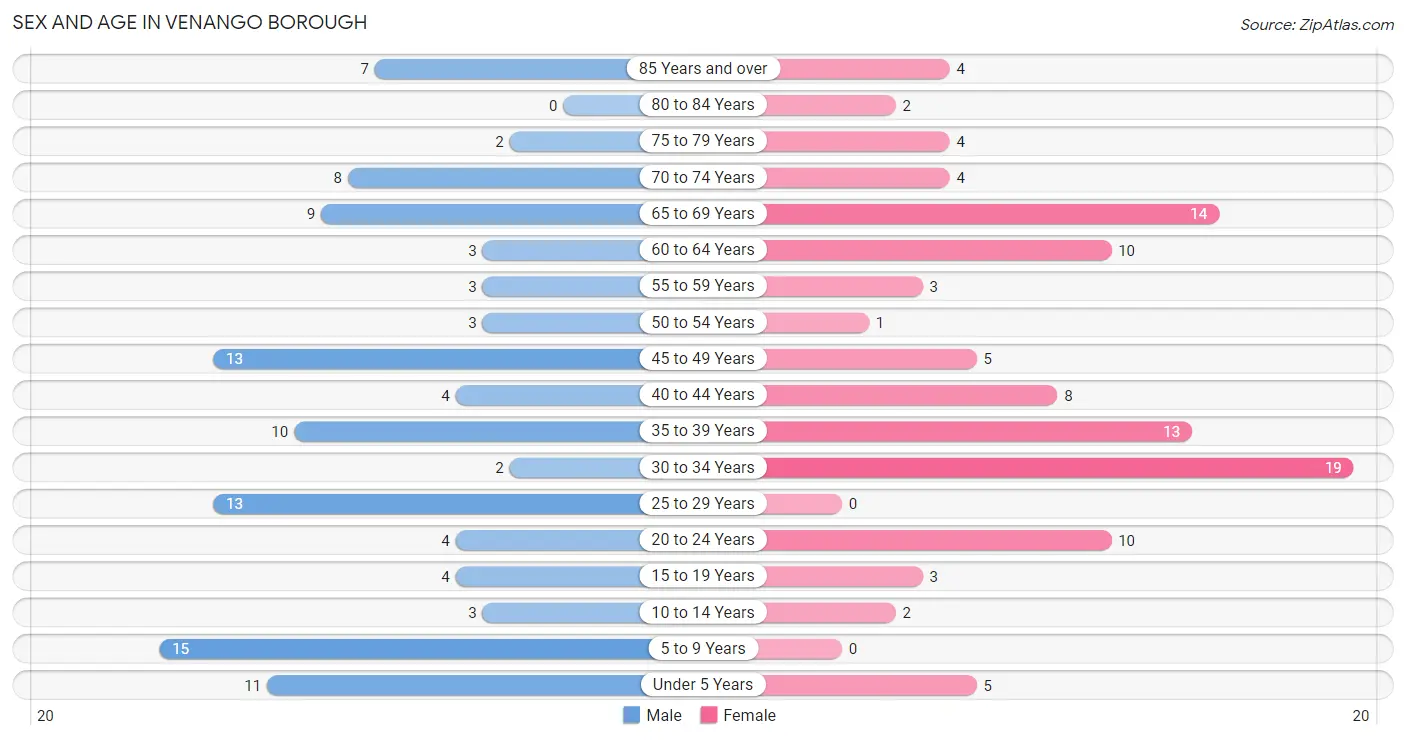
| Age Bracket | Male | Female |
| Under 5 Years | 11 (9.7%) | 5 (4.7%) |
| 5 to 9 Years | 15 (13.2%) | 0 (0.0%) |
| 10 to 14 Years | 3 (2.6%) | 2 (1.9%) |
| 15 to 19 Years | 4 (3.5%) | 3 (2.8%) |
| 20 to 24 Years | 4 (3.5%) | 10 (9.3%) |
| 25 to 29 Years | 13 (11.4%) | 0 (0.0%) |
| 30 to 34 Years | 2 (1.8%) | 19 (17.8%) |
| 35 to 39 Years | 10 (8.8%) | 13 (12.1%) |
| 40 to 44 Years | 4 (3.5%) | 8 (7.5%) |
| 45 to 49 Years | 13 (11.4%) | 5 (4.7%) |
| 50 to 54 Years | 3 (2.6%) | 1 (0.9%) |
| 55 to 59 Years | 3 (2.6%) | 3 (2.8%) |
| 60 to 64 Years | 3 (2.6%) | 10 (9.3%) |
| 65 to 69 Years | 9 (7.9%) | 14 (13.1%) |
| 70 to 74 Years | 8 (7.0%) | 4 (3.7%) |
| 75 to 79 Years | 2 (1.8%) | 4 (3.7%) |
| 80 to 84 Years | 0 (0.0%) | 2 (1.9%) |
| 85 Years and over | 7 (6.1%) | 4 (3.7%) |
| Total | 114 (100.0%) | 107 (100.0%) |
Families and Households in Venango borough
Median Family Size in Venango borough
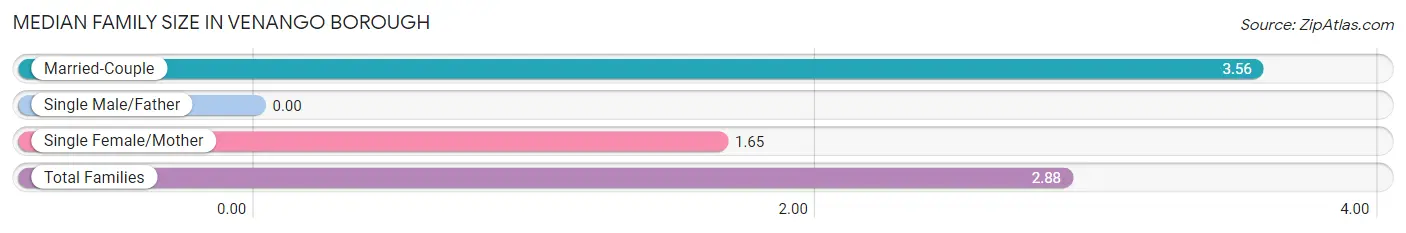
| Family Type | # Families | Family Size |
| Married-Couple | 36 (64.3%) | 3.56 |
| Single Male/Father | 0 (0.0%) | - |
| Single Female/Mother | 20 (35.7%) | 1.65 |
| Total Families | 56 (100.0%) | 2.88 |
Median Household Size in Venango borough
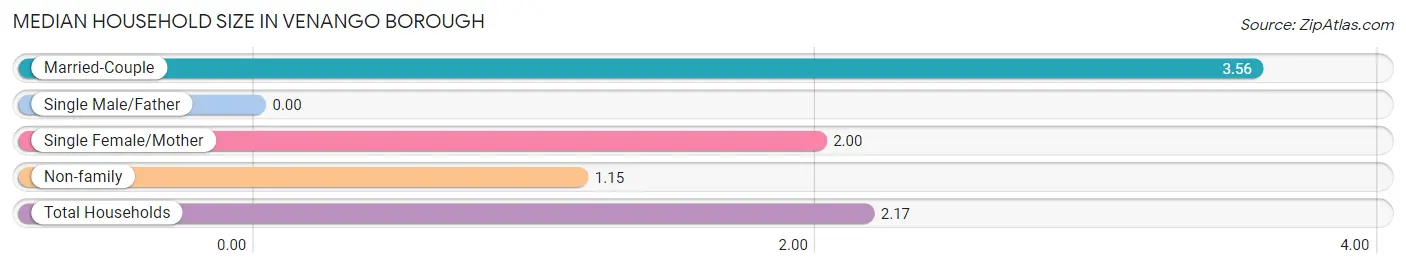
| Household Type | # Households | Household Size |
| Married-Couple | 36 (35.3%) | 3.56 |
| Single Male/Father | 0 (0.0%) | - |
| Single Female/Mother | 20 (19.6%) | 2.00 |
| Non-family | 46 (45.1%) | 1.15 |
| Total Households | 102 (100.0%) | 2.17 |
Household Size by Marriage Status in Venango borough
Out of a total of 102 households in Venango borough, 56 (54.9%) are family households, while 46 (45.1%) are nonfamily households. The most numerous type of family households are 3-person households, comprising 29, and the most common type of nonfamily households are 1-person households, comprising 40.
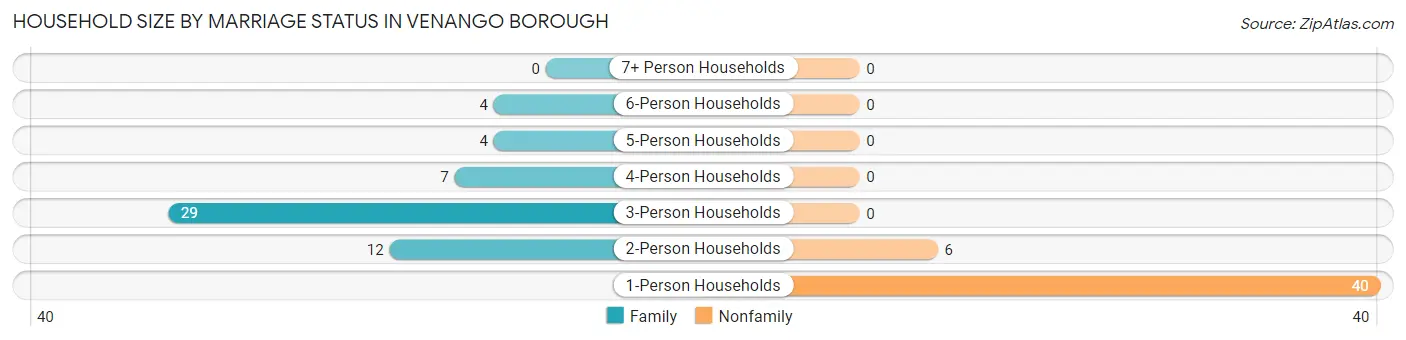
| Household Size | Family Households | Nonfamily Households |
| 1-Person Households | - | 40 (39.2%) |
| 2-Person Households | 12 (11.8%) | 6 (5.9%) |
| 3-Person Households | 29 (28.4%) | 0 (0.0%) |
| 4-Person Households | 7 (6.9%) | 0 (0.0%) |
| 5-Person Households | 4 (3.9%) | 0 (0.0%) |
| 6-Person Households | 4 (3.9%) | 0 (0.0%) |
| 7+ Person Households | 0 (0.0%) | 0 (0.0%) |
| Total | 56 (54.9%) | 46 (45.1%) |
Female Fertility in Venango borough
Fertility by Age in Venango borough
| Age Bracket | Women with Births | Births / 1,000 Women |
| 15 to 19 years | 0 (0.0%) | 0.0 |
| 20 to 34 years | 0 (0.0%) | 0.0 |
| 35 to 50 years | 0 (0.0%) | 0.0 |
| Total | 0 (0.0%) | 0.0 |
Fertility by Age by Marriage Status in Venango borough
| Age Bracket | Married | Unmarried |
| 15 to 19 years | 0 (0.0%) | 0 (0.0%) |
| 20 to 34 years | 0 (0.0%) | 0 (0.0%) |
| 35 to 50 years | 0 (0.0%) | 0 (0.0%) |
| Total | 0 (0.0%) | 0 (0.0%) |
Fertility by Education in Venango borough
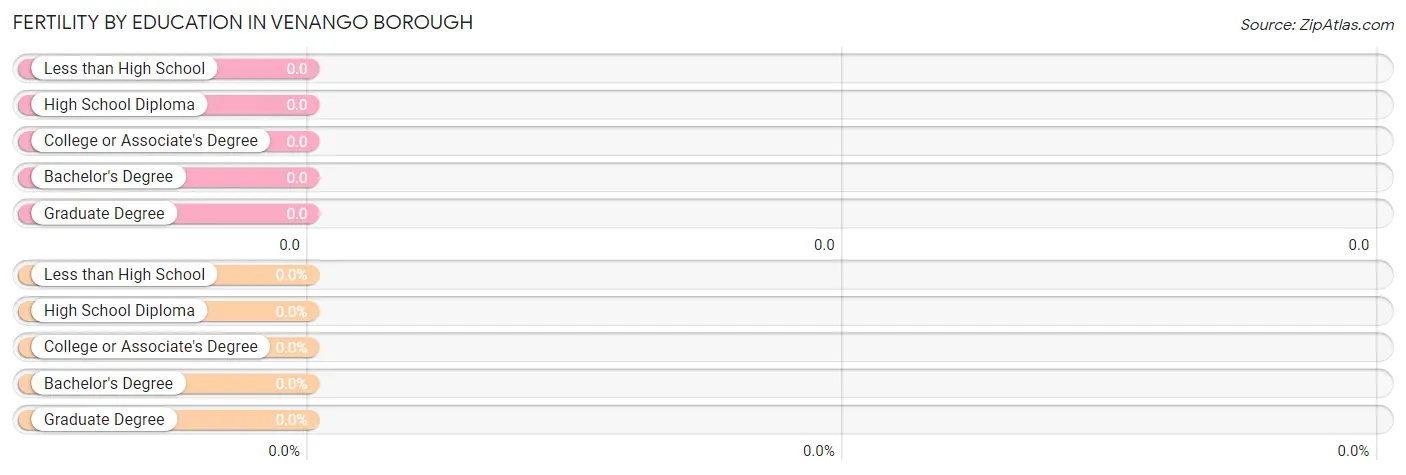
| Educational Attainment | Women with Births | Births / 1,000 Women |
| Less than High School | 0 (0.0%) | 0.0 |
| High School Diploma | 0 (0.0%) | 0.0 |
| College or Associate's Degree | 0 (0.0%) | 0.0 |
| Bachelor's Degree | 0 (0.0%) | 0.0 |
| Graduate Degree | 0 (0.0%) | 0.0 |
| Total | 0 (0.0%) | 0.0 |
Fertility by Education by Marriage Status in Venango borough
| Educational Attainment | Married | Unmarried |
| Less than High School | 0 (0.0%) | 0 (0.0%) |
| High School Diploma | 0 (0.0%) | 0 (0.0%) |
| College or Associate's Degree | 0 (0.0%) | 0 (0.0%) |
| Bachelor's Degree | 0 (0.0%) | 0 (0.0%) |
| Graduate Degree | 0 (0.0%) | 0 (0.0%) |
| Total | 0 (0.0%) | 0 (0.0%) |
Income in Venango borough
Income Overview in Venango borough
Per Capita Income in Venango borough is $30,089, while median incomes of families and households are $63,929 and $64,643 respectively.
| Characteristic | Number | Measure |
| Per Capita Income | 221 | $30,089 |
| Median Family Income | 56 | $63,929 |
| Mean Family Income | 56 | $75,266 |
| Median Household Income | 102 | $64,643 |
| Mean Household Income | 102 | $65,898 |
| Income Deficit | 56 | $0 |
| Wage / Income Gap (%) | 221 | 35.57% |
| Wage / Income Gap ($) | 221 | 64.43¢ per $1 |
| Gini / Inequality Index | 221 | 0.30 |
Earnings by Sex in Venango borough
Average Earnings in Venango borough are $36,979, $45,917 for men and $29,583 for women, a difference of 35.6%.
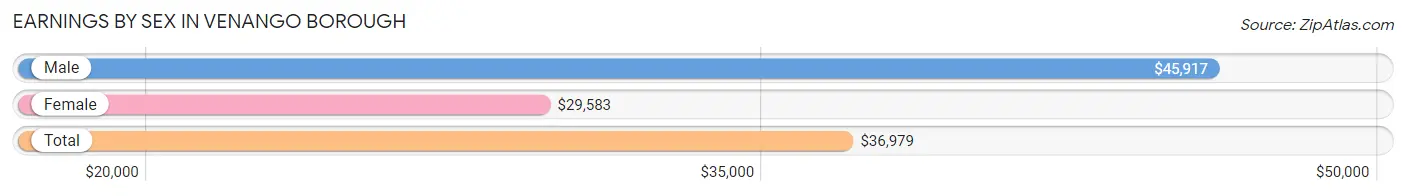
| Sex | Number | Average Earnings |
| Male | 61 (48.8%) | $45,917 |
| Female | 64 (51.2%) | $29,583 |
| Total | 125 (100.0%) | $36,979 |
Earnings by Sex by Income Bracket in Venango borough
The most common earnings brackets in Venango borough are $45,000 to $49,999 for men (21 | 34.4%) and $40,000 to $44,999 for women (18 | 28.1%).
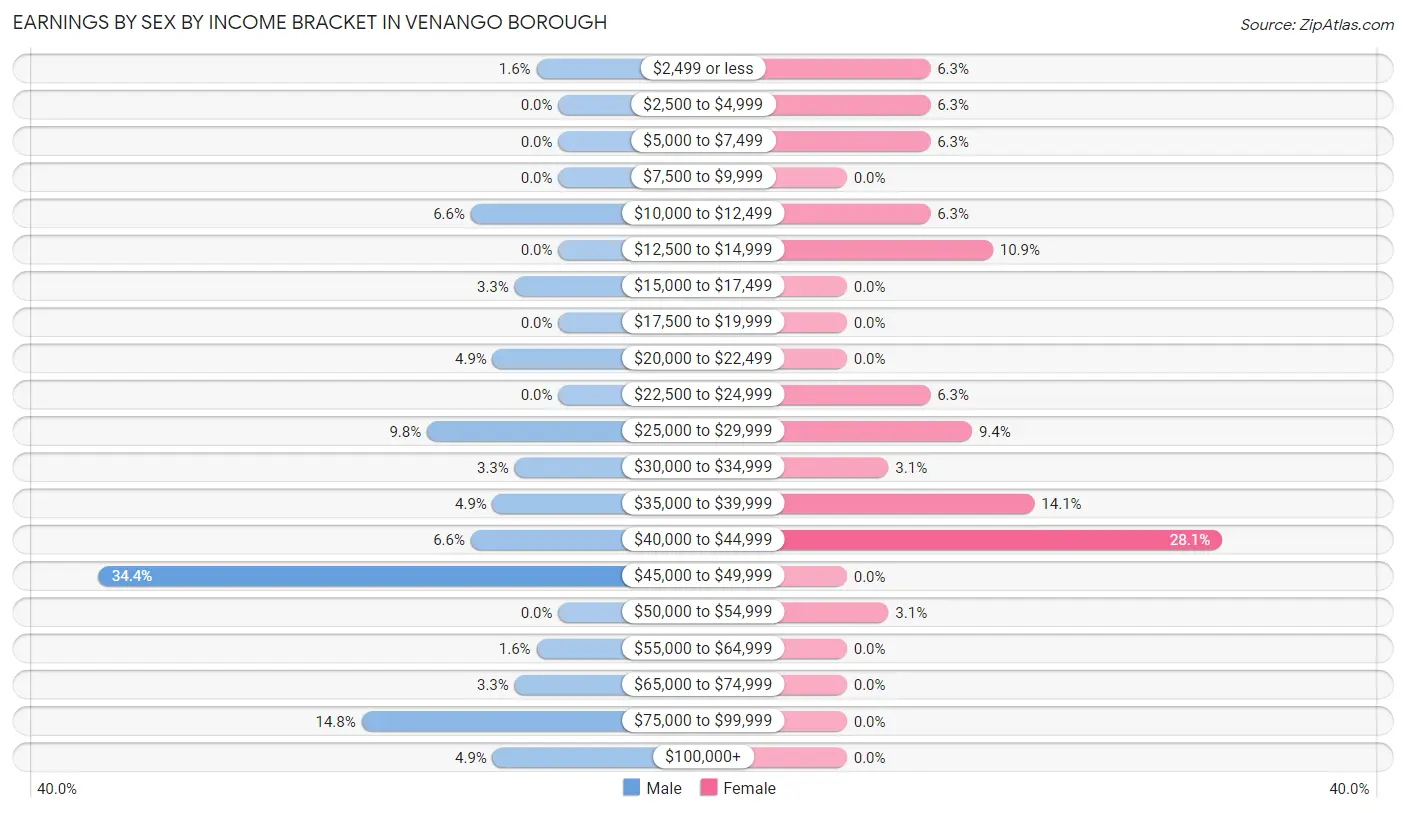
| Income | Male | Female |
| $2,499 or less | 1 (1.6%) | 4 (6.2%) |
| $2,500 to $4,999 | 0 (0.0%) | 4 (6.2%) |
| $5,000 to $7,499 | 0 (0.0%) | 4 (6.2%) |
| $7,500 to $9,999 | 0 (0.0%) | 0 (0.0%) |
| $10,000 to $12,499 | 4 (6.6%) | 4 (6.2%) |
| $12,500 to $14,999 | 0 (0.0%) | 7 (10.9%) |
| $15,000 to $17,499 | 2 (3.3%) | 0 (0.0%) |
| $17,500 to $19,999 | 0 (0.0%) | 0 (0.0%) |
| $20,000 to $22,499 | 3 (4.9%) | 0 (0.0%) |
| $22,500 to $24,999 | 0 (0.0%) | 4 (6.2%) |
| $25,000 to $29,999 | 6 (9.8%) | 6 (9.4%) |
| $30,000 to $34,999 | 2 (3.3%) | 2 (3.1%) |
| $35,000 to $39,999 | 3 (4.9%) | 9 (14.1%) |
| $40,000 to $44,999 | 4 (6.6%) | 18 (28.1%) |
| $45,000 to $49,999 | 21 (34.4%) | 0 (0.0%) |
| $50,000 to $54,999 | 0 (0.0%) | 2 (3.1%) |
| $55,000 to $64,999 | 1 (1.6%) | 0 (0.0%) |
| $65,000 to $74,999 | 2 (3.3%) | 0 (0.0%) |
| $75,000 to $99,999 | 9 (14.7%) | 0 (0.0%) |
| $100,000+ | 3 (4.9%) | 0 (0.0%) |
| Total | 61 (100.0%) | 64 (100.0%) |
Earnings by Sex by Educational Attainment in Venango borough
Average earnings in Venango borough are $46,250 for men and $30,000 for women, a difference of 35.1%. Men with an educational attainment of bachelor's degree enjoy the highest average annual earnings of $68,750, while those with high school diploma education earn the least with $36,250. Women with an educational attainment of bachelor's degree earn the most with the average annual earnings of $41,042, while those with graduate degree education have the smallest earnings of $13,250.
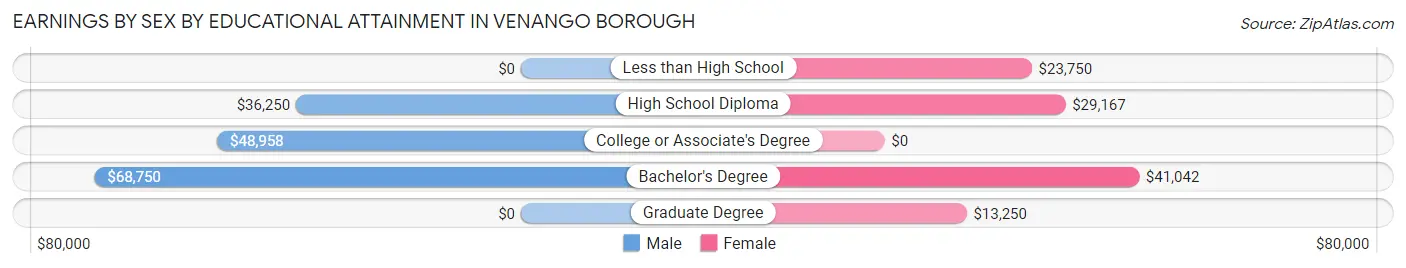
| Educational Attainment | Male Income | Female Income |
| Less than High School | - | - |
| High School Diploma | $36,250 | $29,167 |
| College or Associate's Degree | $48,958 | $0 |
| Bachelor's Degree | $68,750 | $41,042 |
| Graduate Degree | - | - |
| Total | $46,250 | $30,000 |
Family Income in Venango borough
Family Income Brackets in Venango borough
According to the Venango borough family income data, there are 20 families falling into the $35,000 to $49,999 income range, which is the most common income bracket and makes up 35.7% of all families.
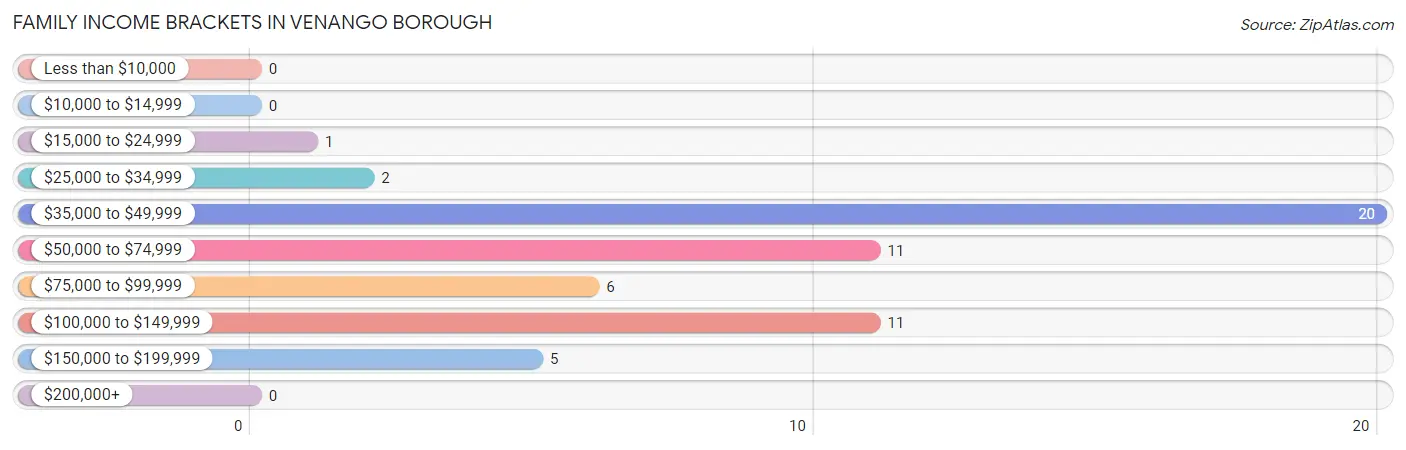
| Income Bracket | # Families | % Families |
| Less than $10,000 | 0 | 0.0% |
| $10,000 to $14,999 | 0 | 0.0% |
| $15,000 to $24,999 | 1 | 1.8% |
| $25,000 to $34,999 | 2 | 3.6% |
| $35,000 to $49,999 | 20 | 35.7% |
| $50,000 to $74,999 | 11 | 19.6% |
| $75,000 to $99,999 | 6 | 10.7% |
| $100,000 to $149,999 | 11 | 19.6% |
| $150,000 to $199,999 | 5 | 8.9% |
| $200,000+ | 0 | 0.0% |
Family Income by Famaliy Size in Venango borough
3-person families (10 | 17.9%) account for the highest median family income in Venango borough with $135,000 per family, while 3-person families (10 | 17.9%) have the highest median income of $45,000 per family member.
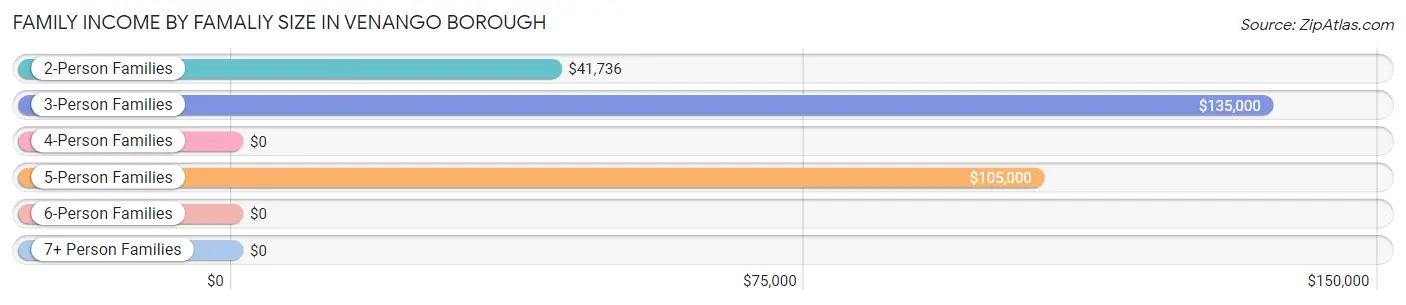
| Income Bracket | # Families | Median Income |
| 2-Person Families | 31 (55.4%) | $41,736 |
| 3-Person Families | 10 (17.9%) | $135,000 |
| 4-Person Families | 7 (12.5%) | $0 |
| 5-Person Families | 4 (7.1%) | $105,000 |
| 6-Person Families | 4 (7.1%) | $0 |
| 7+ Person Families | 0 (0.0%) | $0 |
| Total | 56 (100.0%) | $63,929 |
Family Income by Number of Earners in Venango borough
The median family income in Venango borough is $63,929, with families comprising 3+ earners (6) having the highest median family income of $107,500, while families with 1 earner (23) have the lowest median family income of $41,319, accounting for 10.7% and 41.1% of families, respectively.
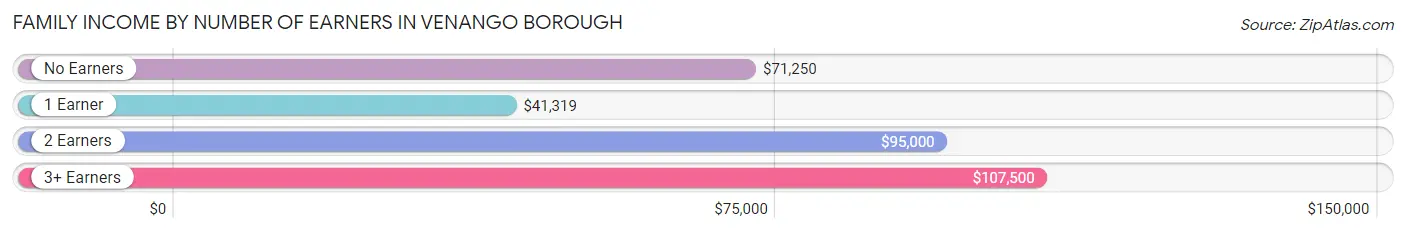
| Number of Earners | # Families | Median Income |
| No Earners | 7 (12.5%) | $71,250 |
| 1 Earner | 23 (41.1%) | $41,319 |
| 2 Earners | 20 (35.7%) | $95,000 |
| 3+ Earners | 6 (10.7%) | $107,500 |
| Total | 56 (100.0%) | $63,929 |
Household Income in Venango borough
Household Income Brackets in Venango borough
With 33 households falling in the category, the $50,000 to $74,999 income range is the most frequent in Venango borough, accounting for 32.4% of all households.
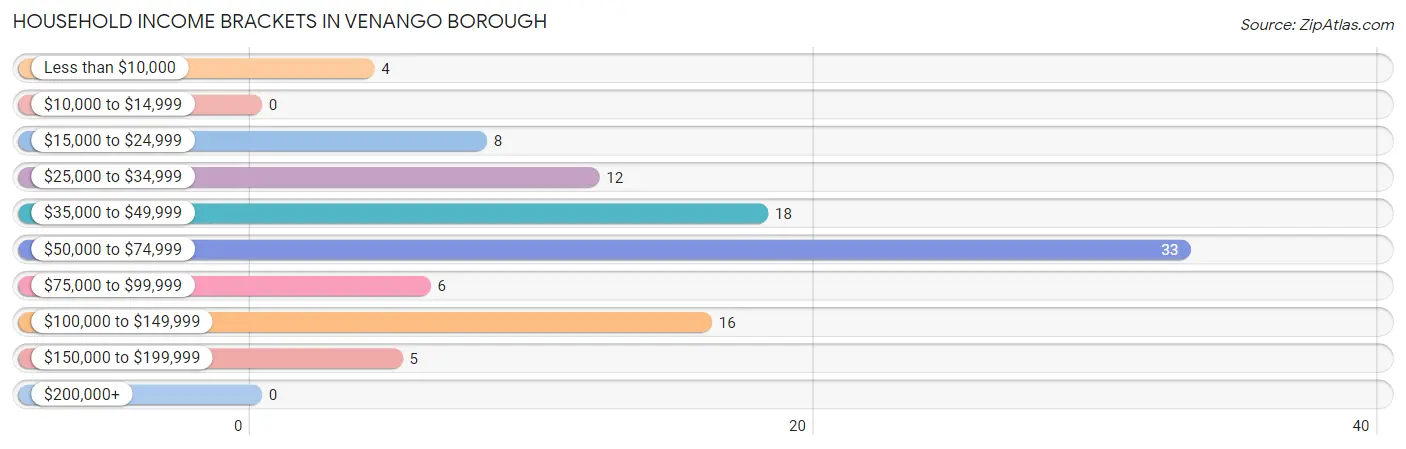
| Income Bracket | # Households | % Households |
| Less than $10,000 | 4 | 3.9% |
| $10,000 to $14,999 | 0 | 0.0% |
| $15,000 to $24,999 | 8 | 7.8% |
| $25,000 to $34,999 | 12 | 11.8% |
| $35,000 to $49,999 | 18 | 17.6% |
| $50,000 to $74,999 | 33 | 32.4% |
| $75,000 to $99,999 | 6 | 5.9% |
| $100,000 to $149,999 | 16 | 15.7% |
| $150,000 to $199,999 | 5 | 4.9% |
| $200,000+ | 0 | 0.0% |
Household Income by Householder Age in Venango borough
The median household income in Venango borough is $64,643, with the highest median household income of $68,819 found in the 25 to 44 years age bracket for the primary householder. A total of 39 households (38.2%) fall into this category.
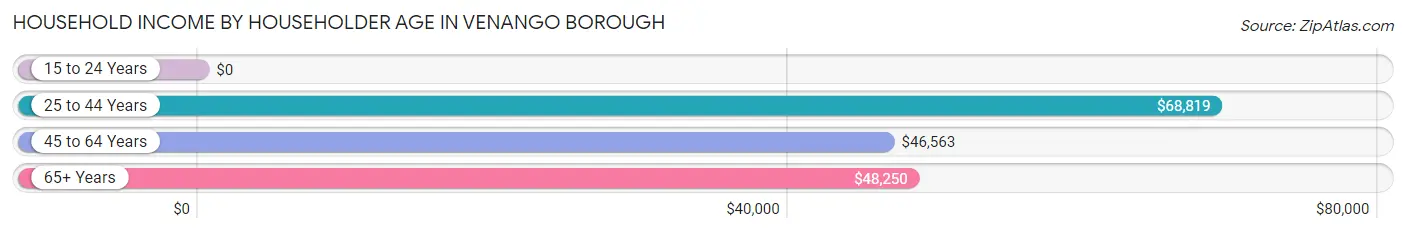
| Income Bracket | # Households | Median Income |
| 15 to 24 Years | 0 (0.0%) | $0 |
| 25 to 44 Years | 39 (38.2%) | $68,819 |
| 45 to 64 Years | 30 (29.4%) | $46,563 |
| 65+ Years | 33 (32.4%) | $48,250 |
| Total | 102 (100.0%) | $64,643 |
Poverty in Venango borough
Income Below Poverty by Sex and Age in Venango borough
With 5.3% poverty level for males and 3.7% for females among the residents of Venango borough, 75 year old and over males and 45 to 54 year old females are the most vulnerable to poverty, with 3 males (33.3%) and 1 females (16.7%) in their respective age groups living below the poverty level.
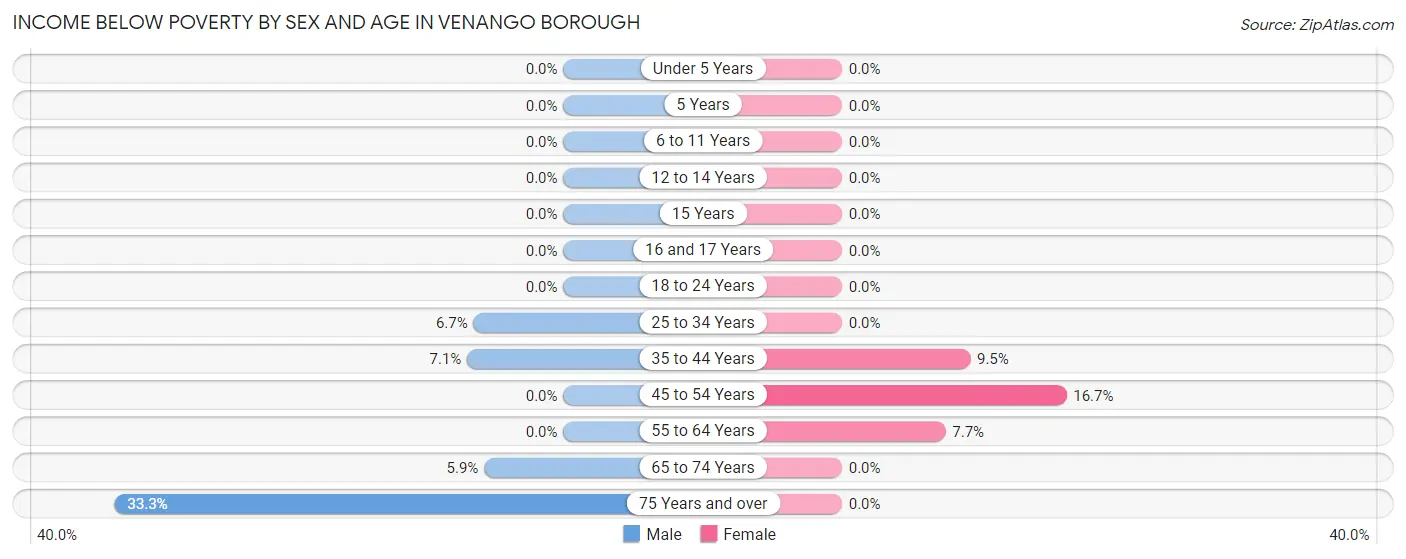
| Age Bracket | Male | Female |
| Under 5 Years | 0 (0.0%) | 0 (0.0%) |
| 5 Years | 0 (0.0%) | 0 (0.0%) |
| 6 to 11 Years | 0 (0.0%) | 0 (0.0%) |
| 12 to 14 Years | 0 (0.0%) | 0 (0.0%) |
| 15 Years | 0 (0.0%) | 0 (0.0%) |
| 16 and 17 Years | 0 (0.0%) | 0 (0.0%) |
| 18 to 24 Years | 0 (0.0%) | 0 (0.0%) |
| 25 to 34 Years | 1 (6.7%) | 0 (0.0%) |
| 35 to 44 Years | 1 (7.1%) | 2 (9.5%) |
| 45 to 54 Years | 0 (0.0%) | 1 (16.7%) |
| 55 to 64 Years | 0 (0.0%) | 1 (7.7%) |
| 65 to 74 Years | 1 (5.9%) | 0 (0.0%) |
| 75 Years and over | 3 (33.3%) | 0 (0.0%) |
| Total | 6 (5.3%) | 4 (3.7%) |
Income Above Poverty by Sex and Age in Venango borough
According to the poverty statistics in Venango borough, males aged under 5 years and females aged under 5 years are the age groups that are most secure financially, with 100.0% of males and 100.0% of females in these age groups living above the poverty line.
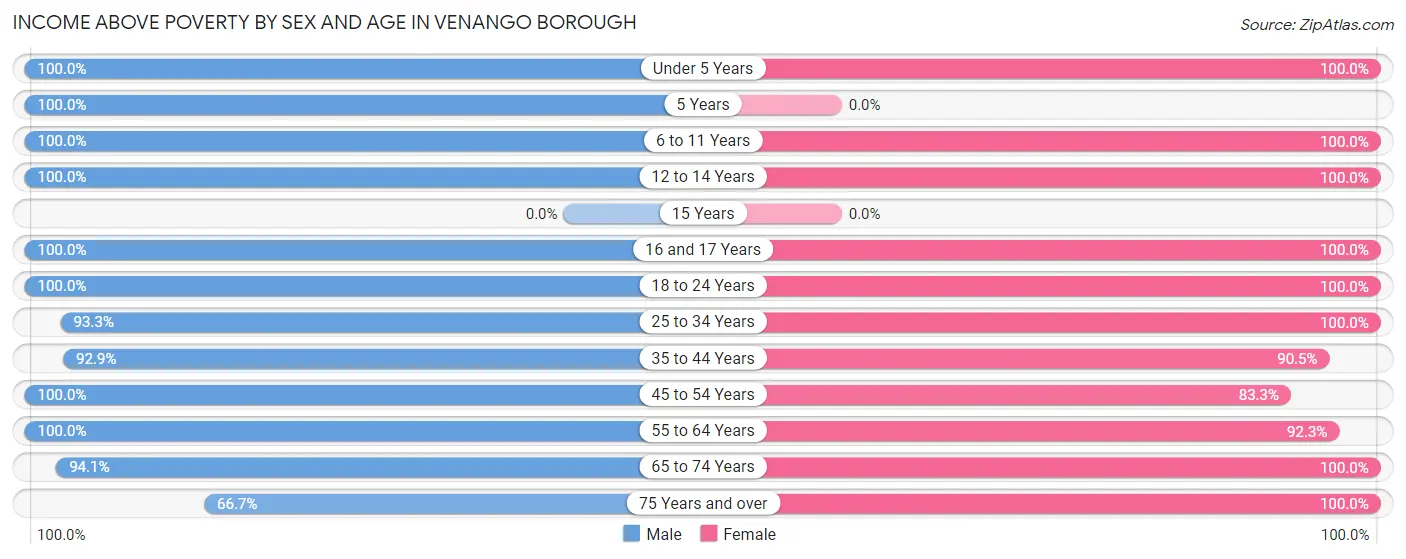
| Age Bracket | Male | Female |
| Under 5 Years | 11 (100.0%) | 5 (100.0%) |
| 5 Years | 2 (100.0%) | 0 (0.0%) |
| 6 to 11 Years | 15 (100.0%) | 1 (100.0%) |
| 12 to 14 Years | 1 (100.0%) | 1 (100.0%) |
| 15 Years | 0 (0.0%) | 0 (0.0%) |
| 16 and 17 Years | 2 (100.0%) | 1 (100.0%) |
| 18 to 24 Years | 6 (100.0%) | 12 (100.0%) |
| 25 to 34 Years | 14 (93.3%) | 19 (100.0%) |
| 35 to 44 Years | 13 (92.9%) | 19 (90.5%) |
| 45 to 54 Years | 16 (100.0%) | 5 (83.3%) |
| 55 to 64 Years | 6 (100.0%) | 12 (92.3%) |
| 65 to 74 Years | 16 (94.1%) | 18 (100.0%) |
| 75 Years and over | 6 (66.7%) | 10 (100.0%) |
| Total | 108 (94.7%) | 103 (96.3%) |
Income Below Poverty Among Married-Couple Families in Venango borough
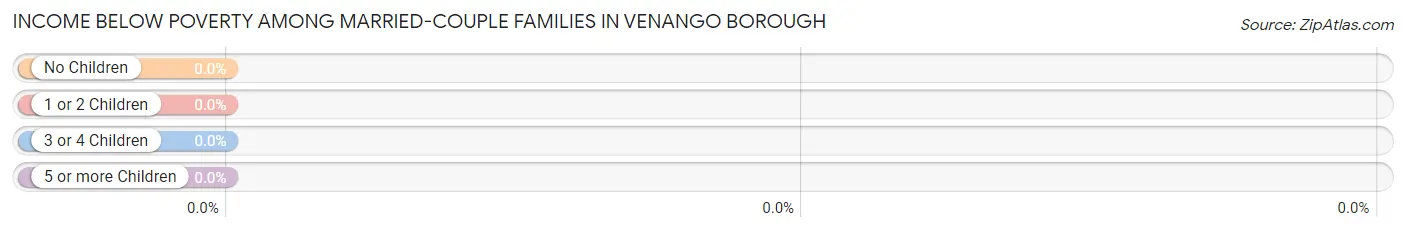
| Children | Above Poverty | Below Poverty |
| No Children | 19 (100.0%) | 0 (0.0%) |
| 1 or 2 Children | 15 (100.0%) | 0 (0.0%) |
| 3 or 4 Children | 2 (100.0%) | 0 (0.0%) |
| 5 or more Children | 0 (0.0%) | 0 (0.0%) |
| Total | 36 (100.0%) | 0 (0.0%) |
Income Below Poverty Among Single-Parent Households in Venango borough
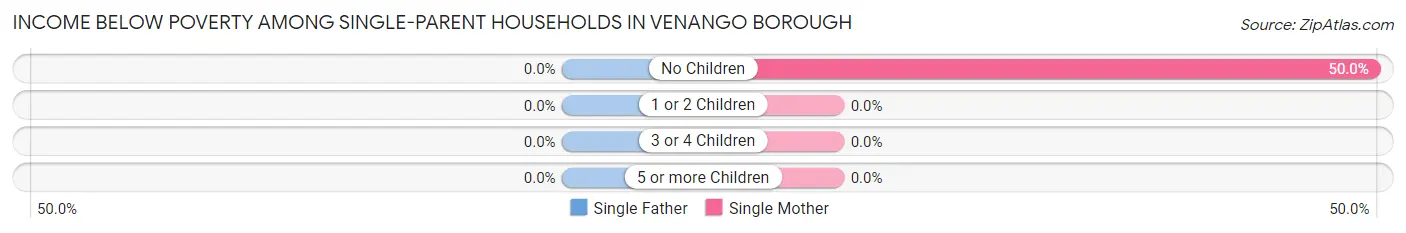
| Children | Single Father | Single Mother |
| No Children | 0 (0.0%) | 1 (50.0%) |
| 1 or 2 Children | 0 (0.0%) | 0 (0.0%) |
| 3 or 4 Children | 0 (0.0%) | 0 (0.0%) |
| 5 or more Children | 0 (0.0%) | 0 (0.0%) |
| Total | 0 (0.0%) | 1 (5.0%) |
Income Below Poverty Among Married-Couple vs Single-Parent Households in Venango borough
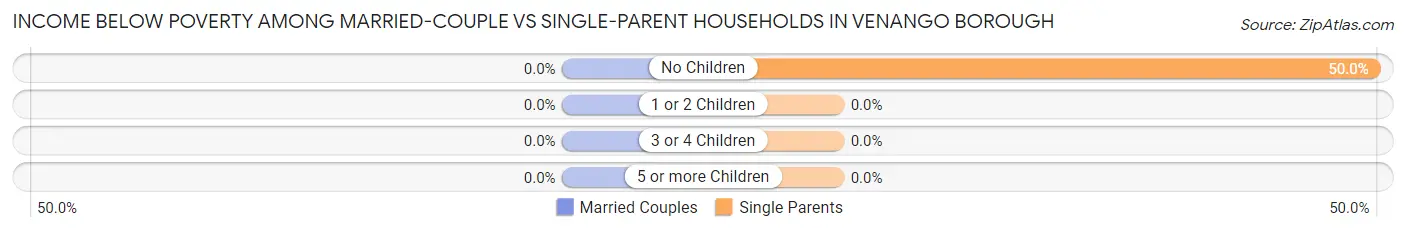
| Children | Married-Couple Families | Single-Parent Households |
| No Children | 0 (0.0%) | 1 (50.0%) |
| 1 or 2 Children | 0 (0.0%) | 0 (0.0%) |
| 3 or 4 Children | 0 (0.0%) | 0 (0.0%) |
| 5 or more Children | 0 (0.0%) | 0 (0.0%) |
| Total | 0 (0.0%) | 1 (5.0%) |
Employment Characteristics in Venango borough
Employment by Class of Employer in Venango borough
Among the 113 employed individuals in Venango borough, private company employees (73 | 64.6%), not-for-profit organizations (19 | 16.8%), and state government employees (9 | 8.0%) make up the most common classes of employment.
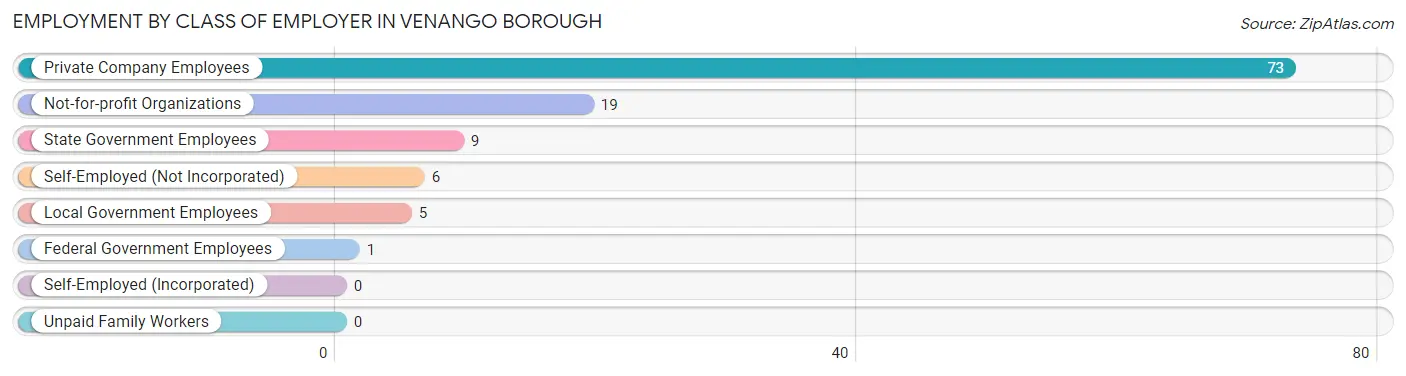
| Employer Class | # Employees | % Employees |
| Private Company Employees | 73 | 64.6% |
| Self-Employed (Incorporated) | 0 | 0.0% |
| Self-Employed (Not Incorporated) | 6 | 5.3% |
| Not-for-profit Organizations | 19 | 16.8% |
| Local Government Employees | 5 | 4.4% |
| State Government Employees | 9 | 8.0% |
| Federal Government Employees | 1 | 0.9% |
| Unpaid Family Workers | 0 | 0.0% |
| Total | 113 | 100.0% |
Employment Status by Age in Venango borough
According to the labor force statistics for Venango borough, out of the total population over 16 years of age (185), 67.6% or 125 individuals are in the labor force, with 9.6% or 12 of them unemployed. The age group with the highest labor force participation rate is 20 to 24 years, with 100.0% or 14 individuals in the labor force. Within the labor force, the 65 to 74 years age range has the highest percentage of unemployed individuals, with 62.5% or 5 of them being unemployed.
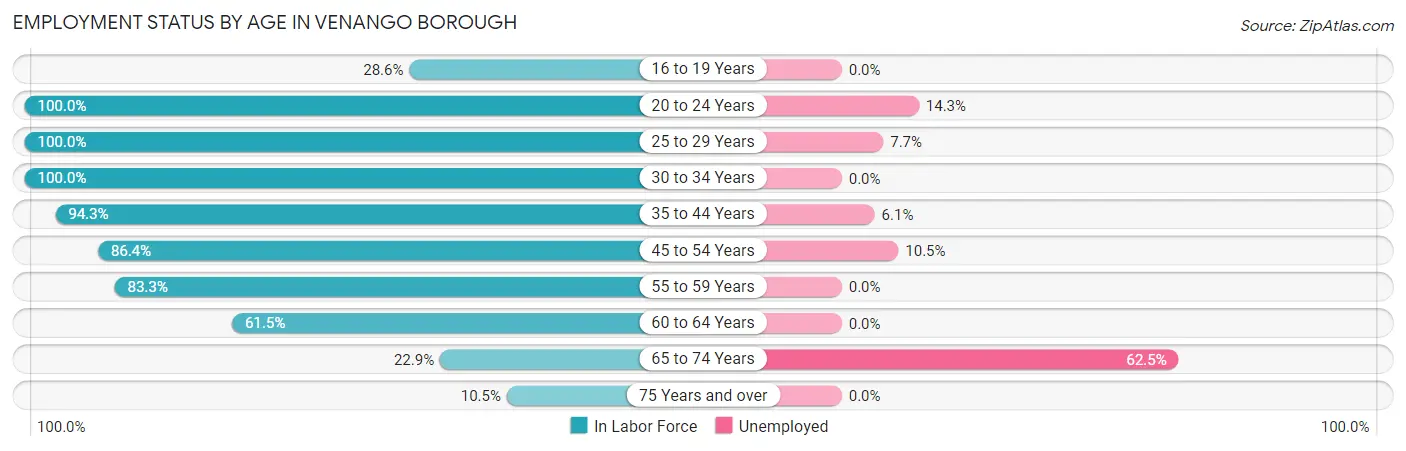
| Age Bracket | In Labor Force | Unemployed |
| 16 to 19 Years | 2 (28.6%) | 0 (0.0%) |
| 20 to 24 Years | 14 (100.0%) | 2 (14.3%) |
| 25 to 29 Years | 13 (100.0%) | 1 (7.7%) |
| 30 to 34 Years | 21 (100.0%) | 0 (0.0%) |
| 35 to 44 Years | 33 (94.3%) | 2 (6.1%) |
| 45 to 54 Years | 19 (86.4%) | 2 (10.5%) |
| 55 to 59 Years | 5 (83.3%) | 0 (0.0%) |
| 60 to 64 Years | 8 (61.5%) | 0 (0.0%) |
| 65 to 74 Years | 8 (22.9%) | 5 (62.5%) |
| 75 Years and over | 2 (10.5%) | 0 (0.0%) |
| Total | 125 (67.6%) | 12 (9.6%) |
Employment Status by Educational Attainment in Venango borough
According to labor force statistics for Venango borough, 90.0% of individuals (99) out of the total population between 25 and 64 years of age (110) are in the labor force, with 5.1% or 5 of them being unemployed. The group with the highest labor force participation rate are those with the educational attainment of college / associate degree, with 94.1% or 16 individuals in the labor force. Within the labor force, individuals with less than high school education have the highest percentage of unemployment, with 12.5% or 2 of them being unemployed.
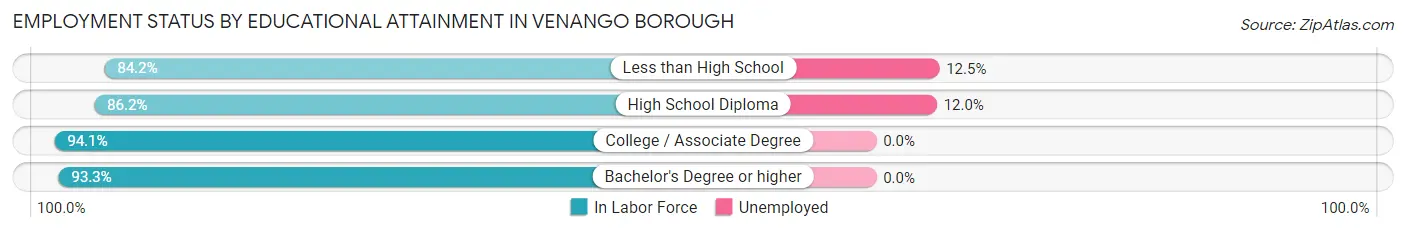
| Educational Attainment | In Labor Force | Unemployed |
| Less than High School | 16 (84.2%) | 2 (12.5%) |
| High School Diploma | 25 (86.2%) | 3 (12.0%) |
| College / Associate Degree | 16 (94.1%) | 0 (0.0%) |
| Bachelor's Degree or higher | 42 (93.3%) | 0 (0.0%) |
| Total | 99 (90.0%) | 6 (5.1%) |
Employment Occupations by Sex in Venango borough
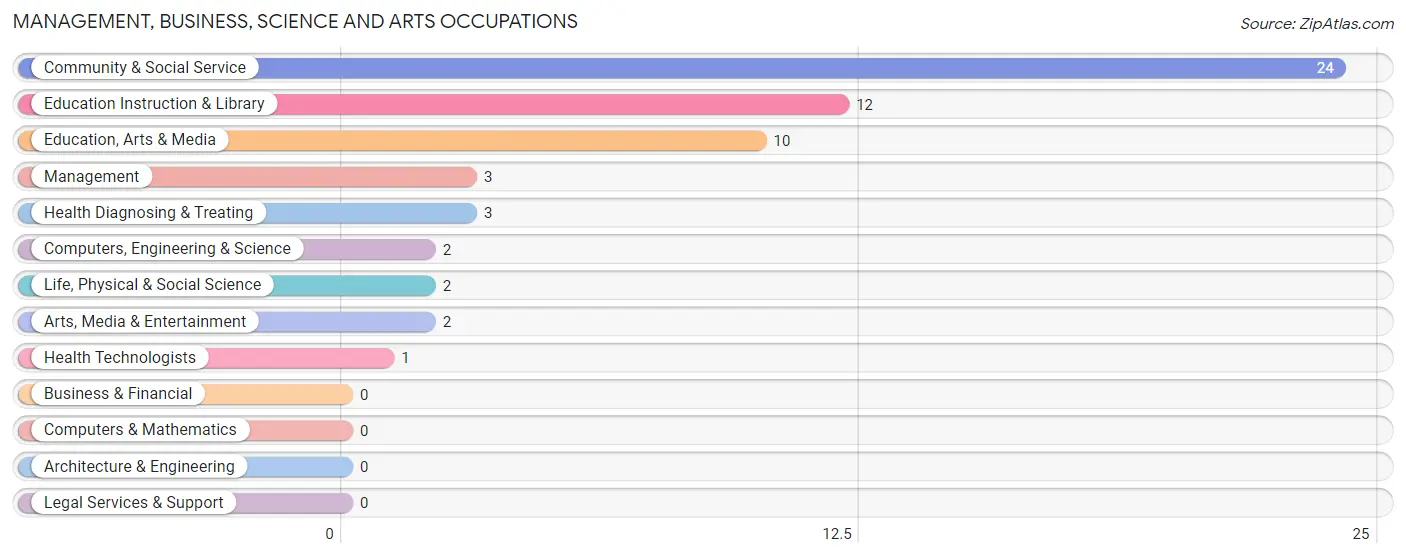
Management, Business, Science and Arts Occupations
The most common Management, Business, Science and Arts occupations in Venango borough are Community & Social Service (24 | 21.2%), Education Instruction & Library (12 | 10.6%), Education, Arts & Media (10 | 8.8%), Management (3 | 2.6%), and Health Diagnosing & Treating (3 | 2.6%).
Management, Business, Science and Arts Occupations by Sex
Within the Management, Business, Science and Arts occupations in Venango borough, the most male-oriented occupations are Computers, Engineering & Science (100.0%), Life, Physical & Social Science (100.0%), and Education, Arts & Media (100.0%), while the most female-oriented occupations are Education Instruction & Library (75.0%), Management (66.7%), and Health Diagnosing & Treating (66.7%).
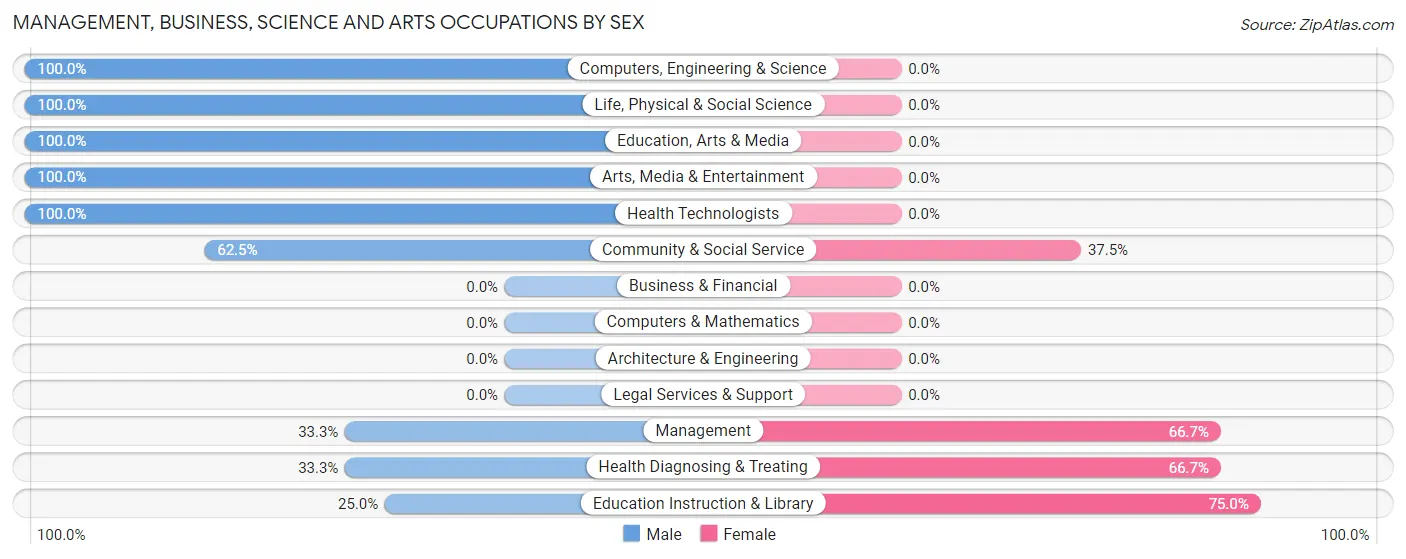
| Occupation | Male | Female |
| Management | 1 (33.3%) | 2 (66.7%) |
| Business & Financial | 0 (0.0%) | 0 (0.0%) |
| Computers, Engineering & Science | 2 (100.0%) | 0 (0.0%) |
| Computers & Mathematics | 0 (0.0%) | 0 (0.0%) |
| Architecture & Engineering | 0 (0.0%) | 0 (0.0%) |
| Life, Physical & Social Science | 2 (100.0%) | 0 (0.0%) |
| Community & Social Service | 15 (62.5%) | 9 (37.5%) |
| Education, Arts & Media | 10 (100.0%) | 0 (0.0%) |
| Legal Services & Support | 0 (0.0%) | 0 (0.0%) |
| Education Instruction & Library | 3 (25.0%) | 9 (75.0%) |
| Arts, Media & Entertainment | 2 (100.0%) | 0 (0.0%) |
| Health Diagnosing & Treating | 1 (33.3%) | 2 (66.7%) |
| Health Technologists | 1 (100.0%) | 0 (0.0%) |
| Total (Category) | 19 (59.4%) | 13 (40.6%) |
| Total (Overall) | 51 (45.1%) | 62 (54.9%) |
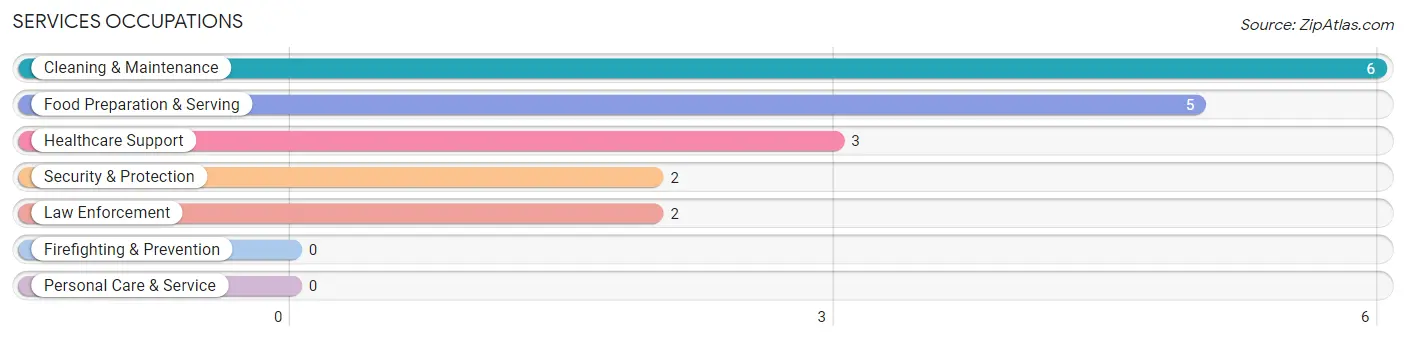
Services Occupations
The most common Services occupations in Venango borough are Cleaning & Maintenance (6 | 5.3%), Food Preparation & Serving (5 | 4.4%), Healthcare Support (3 | 2.6%), Security & Protection (2 | 1.8%), and Law Enforcement (2 | 1.8%).
Services Occupations by Sex
Within the Services occupations in Venango borough, the most male-oriented occupations are Security & Protection (100.0%), Law Enforcement (100.0%), and Cleaning & Maintenance (100.0%), while the most female-oriented occupations are Healthcare Support (100.0%), and Food Preparation & Serving (100.0%).
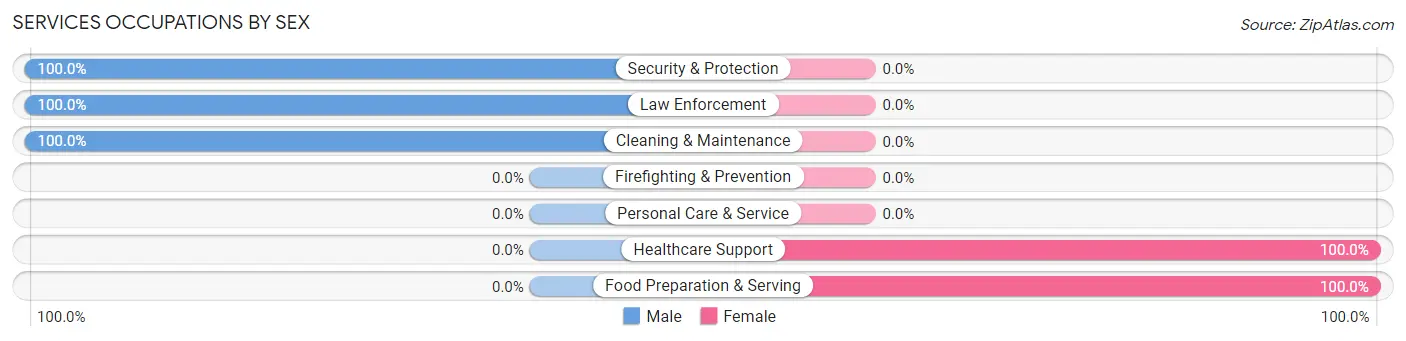
| Occupation | Male | Female |
| Healthcare Support | 0 (0.0%) | 3 (100.0%) |
| Security & Protection | 2 (100.0%) | 0 (0.0%) |
| Firefighting & Prevention | 0 (0.0%) | 0 (0.0%) |
| Law Enforcement | 2 (100.0%) | 0 (0.0%) |
| Food Preparation & Serving | 0 (0.0%) | 5 (100.0%) |
| Cleaning & Maintenance | 6 (100.0%) | 0 (0.0%) |
| Personal Care & Service | 0 (0.0%) | 0 (0.0%) |
| Total (Category) | 8 (50.0%) | 8 (50.0%) |
| Total (Overall) | 51 (45.1%) | 62 (54.9%) |
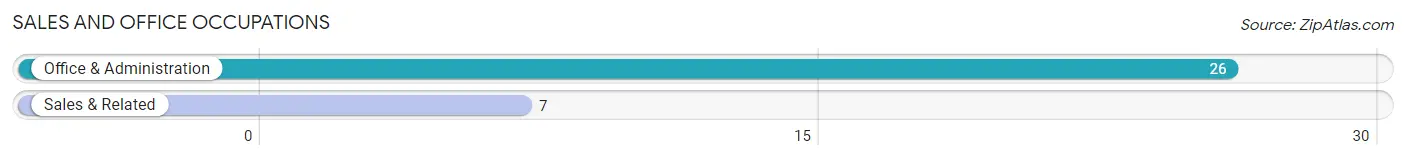
Sales and Office Occupations
The most common Sales and Office occupations in Venango borough are Office & Administration (26 | 23.0%), and Sales & Related (7 | 6.2%).
Sales and Office Occupations by Sex
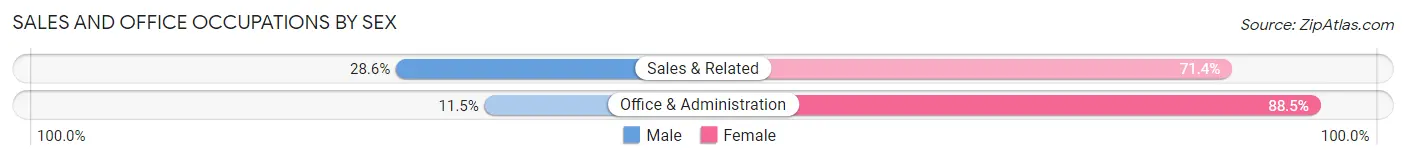
| Occupation | Male | Female |
| Sales & Related | 2 (28.6%) | 5 (71.4%) |
| Office & Administration | 3 (11.5%) | 23 (88.5%) |
| Total (Category) | 5 (15.1%) | 28 (84.9%) |
| Total (Overall) | 51 (45.1%) | 62 (54.9%) |
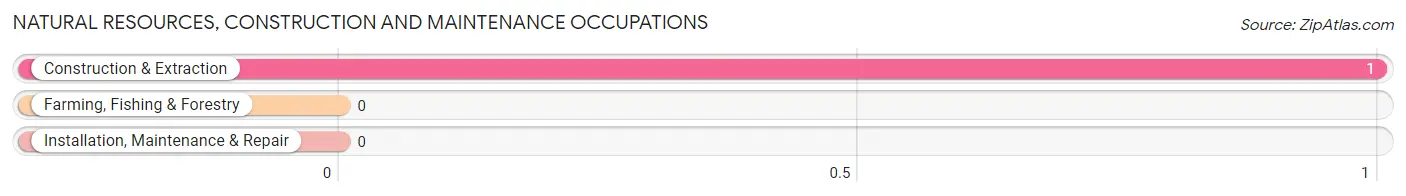
Natural Resources, Construction and Maintenance Occupations
The most common Natural Resources, Construction and Maintenance occupations in Venango borough are , and Construction & Extraction (1 | 0.9%).
Natural Resources, Construction and Maintenance Occupations by Sex
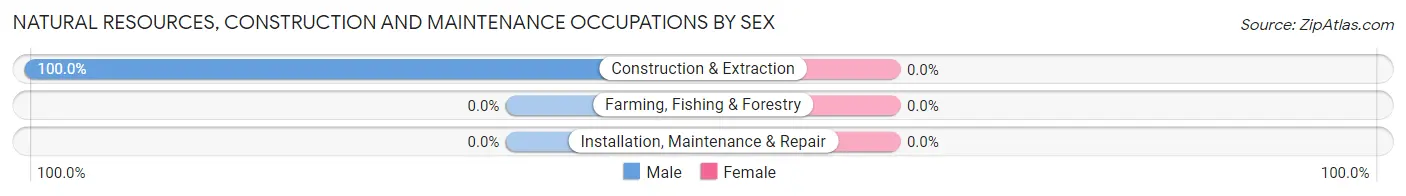
| Occupation | Male | Female |
| Farming, Fishing & Forestry | 0 (0.0%) | 0 (0.0%) |
| Construction & Extraction | 1 (100.0%) | 0 (0.0%) |
| Installation, Maintenance & Repair | 0 (0.0%) | 0 (0.0%) |
| Total (Category) | 1 (100.0%) | 0 (0.0%) |
| Total (Overall) | 51 (45.1%) | 62 (54.9%) |
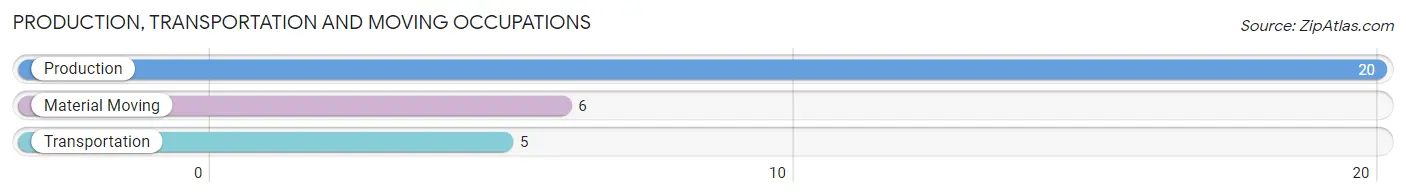
Production, Transportation and Moving Occupations
The most common Production, Transportation and Moving occupations in Venango borough are Production (20 | 17.7%), Material Moving (6 | 5.3%), and Transportation (5 | 4.4%).
Production, Transportation and Moving Occupations by Sex
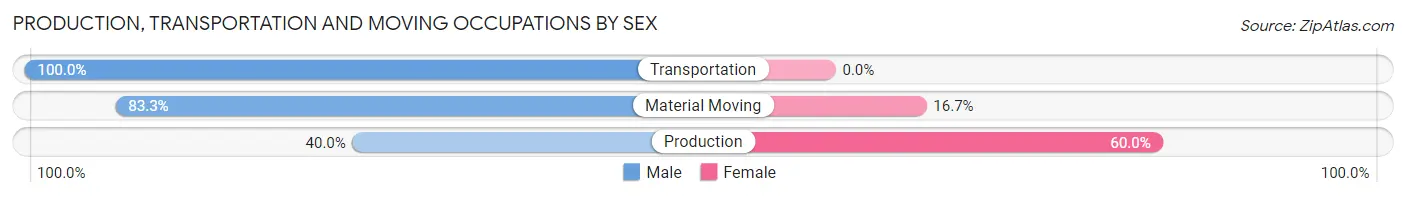
| Occupation | Male | Female |
| Production | 8 (40.0%) | 12 (60.0%) |
| Transportation | 5 (100.0%) | 0 (0.0%) |
| Material Moving | 5 (83.3%) | 1 (16.7%) |
| Total (Category) | 18 (58.1%) | 13 (41.9%) |
| Total (Overall) | 51 (45.1%) | 62 (54.9%) |
Employment Industries by Sex in Venango borough
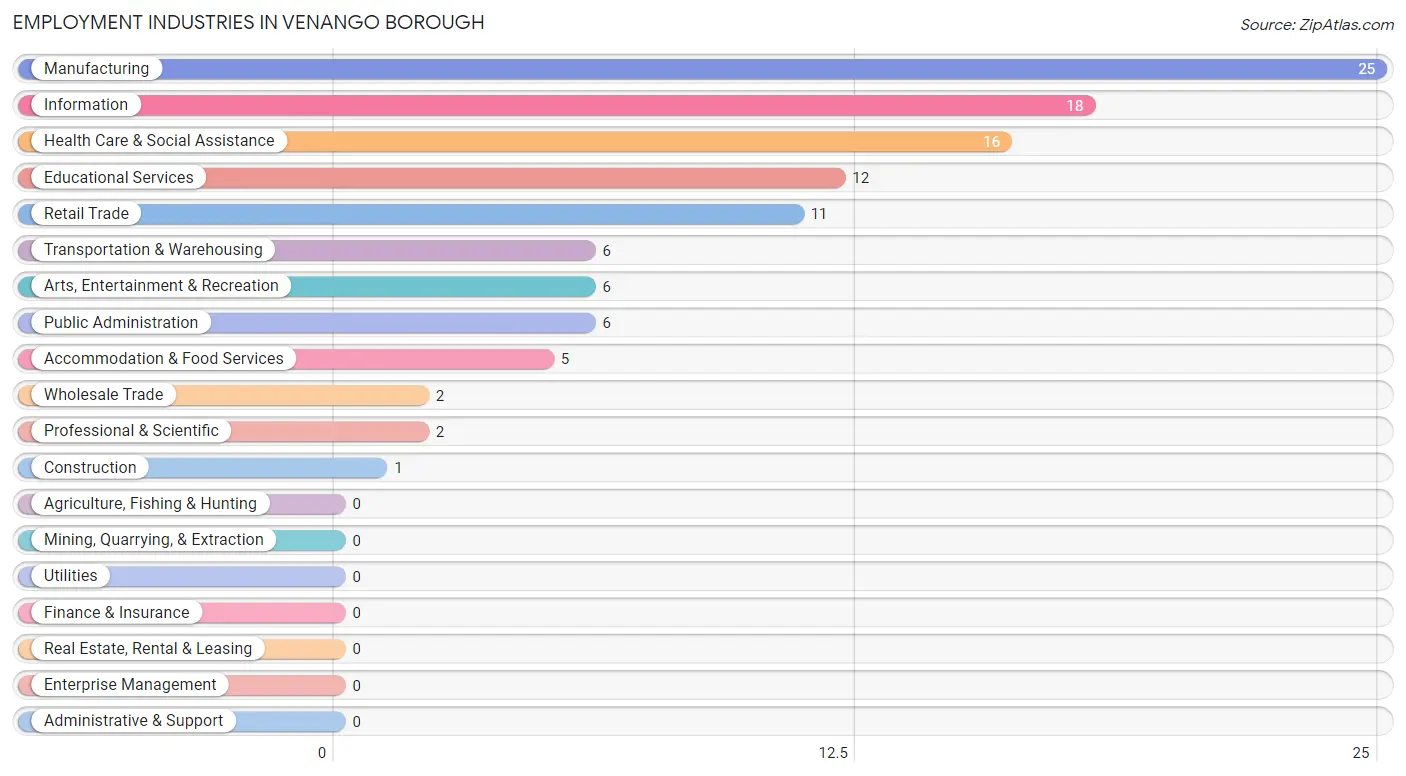
Employment Industries in Venango borough
The major employment industries in Venango borough include Manufacturing (25 | 22.1%), Information (18 | 15.9%), Health Care & Social Assistance (16 | 14.2%), Educational Services (12 | 10.6%), and Retail Trade (11 | 9.7%).
Employment Industries by Sex in Venango borough
The Venango borough industries that see more men than women are Construction (100.0%), Wholesale Trade (100.0%), and Transportation & Warehousing (100.0%), whereas the industries that tend to have a higher number of women are Information (100.0%), Accommodation & Food Services (100.0%), and Educational Services (75.0%).
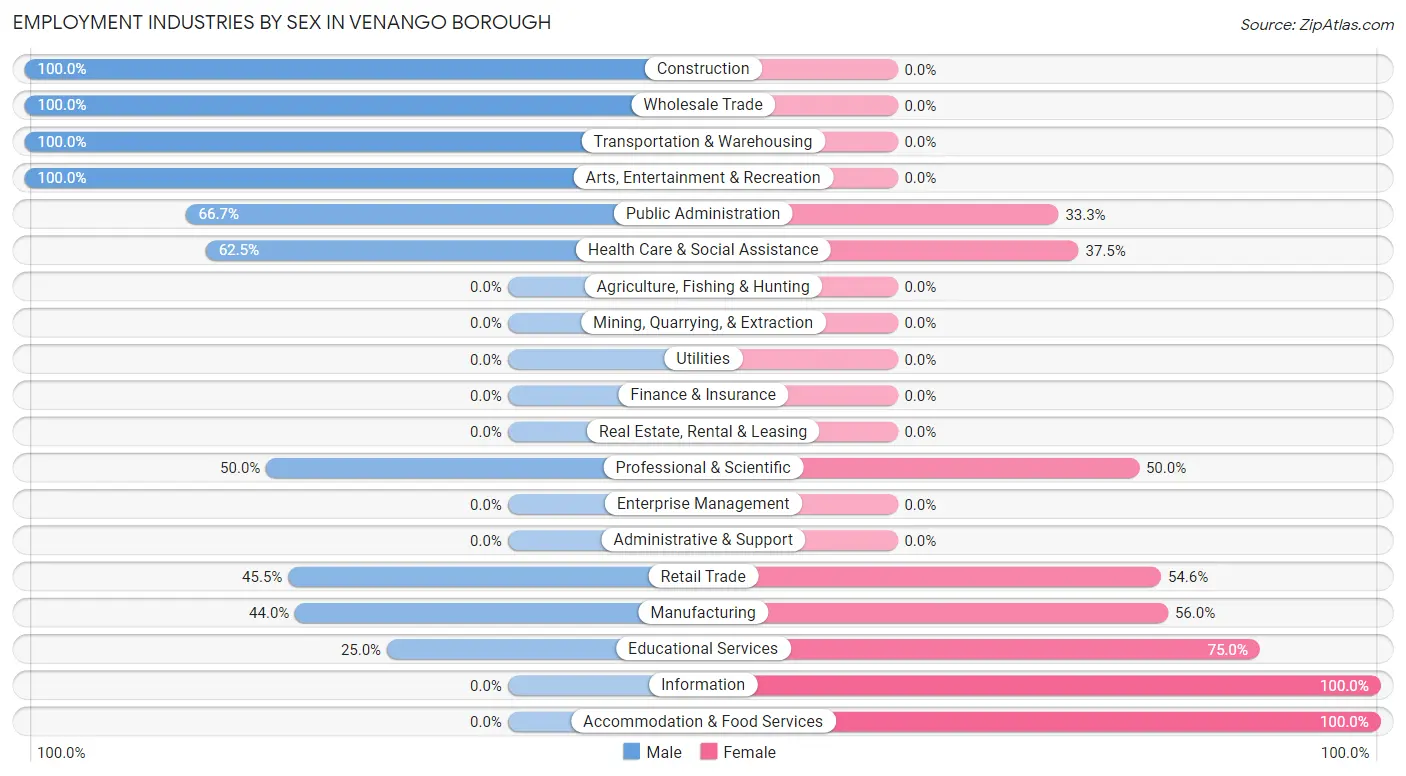
| Industry | Male | Female |
| Agriculture, Fishing & Hunting | 0 (0.0%) | 0 (0.0%) |
| Mining, Quarrying, & Extraction | 0 (0.0%) | 0 (0.0%) |
| Construction | 1 (100.0%) | 0 (0.0%) |
| Manufacturing | 11 (44.0%) | 14 (56.0%) |
| Wholesale Trade | 2 (100.0%) | 0 (0.0%) |
| Retail Trade | 5 (45.5%) | 6 (54.5%) |
| Transportation & Warehousing | 6 (100.0%) | 0 (0.0%) |
| Utilities | 0 (0.0%) | 0 (0.0%) |
| Information | 0 (0.0%) | 18 (100.0%) |
| Finance & Insurance | 0 (0.0%) | 0 (0.0%) |
| Real Estate, Rental & Leasing | 0 (0.0%) | 0 (0.0%) |
| Professional & Scientific | 1 (50.0%) | 1 (50.0%) |
| Enterprise Management | 0 (0.0%) | 0 (0.0%) |
| Administrative & Support | 0 (0.0%) | 0 (0.0%) |
| Educational Services | 3 (25.0%) | 9 (75.0%) |
| Health Care & Social Assistance | 10 (62.5%) | 6 (37.5%) |
| Arts, Entertainment & Recreation | 6 (100.0%) | 0 (0.0%) |
| Accommodation & Food Services | 0 (0.0%) | 5 (100.0%) |
| Public Administration | 4 (66.7%) | 2 (33.3%) |
| Total | 51 (45.1%) | 62 (54.9%) |
Education in Venango borough
School Enrollment in Venango borough
The most common levels of schooling among the 50 students in Venango borough are college / undergraduate (15 | 30.0%), elementary school (13 | 26.0%), and graduate / professional (10 | 20.0%).
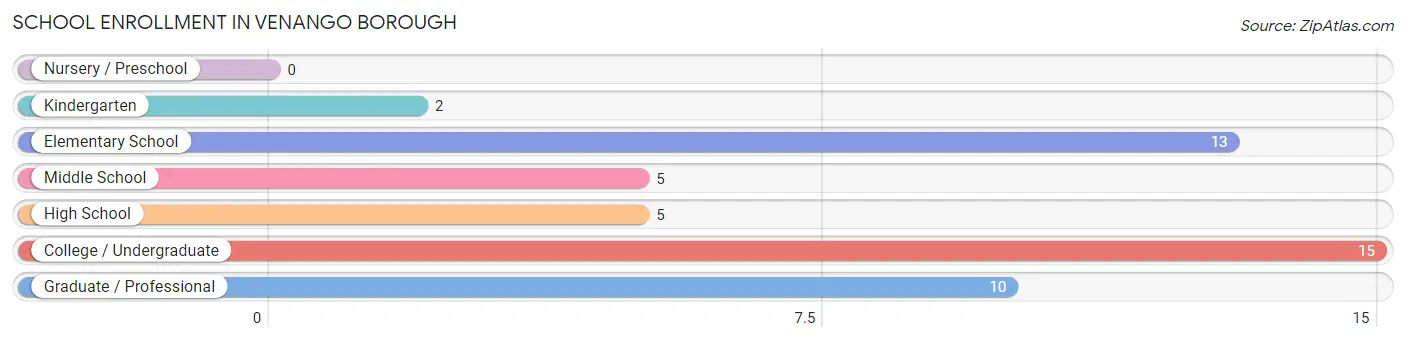
| School Level | # Students | % Students |
| Nursery / Preschool | 0 | 0.0% |
| Kindergarten | 2 | 4.0% |
| Elementary School | 13 | 26.0% |
| Middle School | 5 | 10.0% |
| High School | 5 | 10.0% |
| College / Undergraduate | 15 | 30.0% |
| Graduate / Professional | 10 | 20.0% |
| Total | 50 | 100.0% |
School Enrollment by Age by Funding Source in Venango borough
Out of a total of 50 students who are enrolled in schools in Venango borough, 19 (38.0%) attend a private institution, while the remaining 31 (62.0%) are enrolled in public schools. The age group of 5 to 9 year old has the highest likelihood of being enrolled in private schools, with 12 (80.0% in the age bracket) enrolled. Conversely, the age group of 10 to 14 year olds has the lowest likelihood of being enrolled in a private school, with 5 (100.0% in the age bracket) attending a public institution.
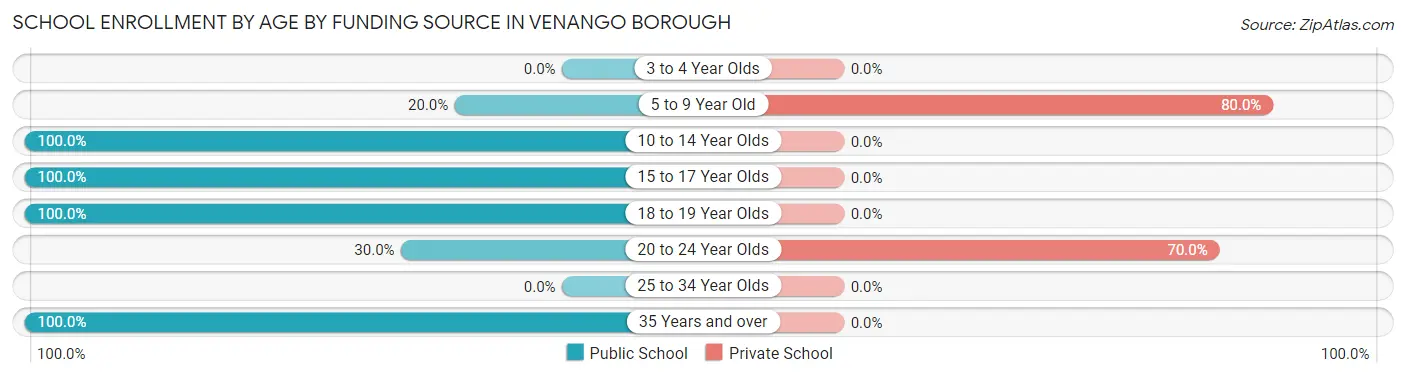
| Age Bracket | Public School | Private School |
| 3 to 4 Year Olds | 0 (0.0%) | 0 (0.0%) |
| 5 to 9 Year Old | 3 (20.0%) | 12 (80.0%) |
| 10 to 14 Year Olds | 5 (100.0%) | 0 (0.0%) |
| 15 to 17 Year Olds | 3 (100.0%) | 0 (0.0%) |
| 18 to 19 Year Olds | 3 (100.0%) | 0 (0.0%) |
| 20 to 24 Year Olds | 3 (30.0%) | 7 (70.0%) |
| 25 to 34 Year Olds | 0 (0.0%) | 0 (0.0%) |
| 35 Years and over | 14 (100.0%) | 0 (0.0%) |
| Total | 31 (62.0%) | 19 (38.0%) |
Educational Attainment by Field of Study in Venango borough
Psychology (23 | 37.7%), science & technology (7 | 11.5%), computers & mathematics (5 | 8.2%), education (5 | 8.2%), and liberal arts & history (5 | 8.2%) are the most common fields of study among 61 individuals in Venango borough who have obtained a bachelor's degree or higher.
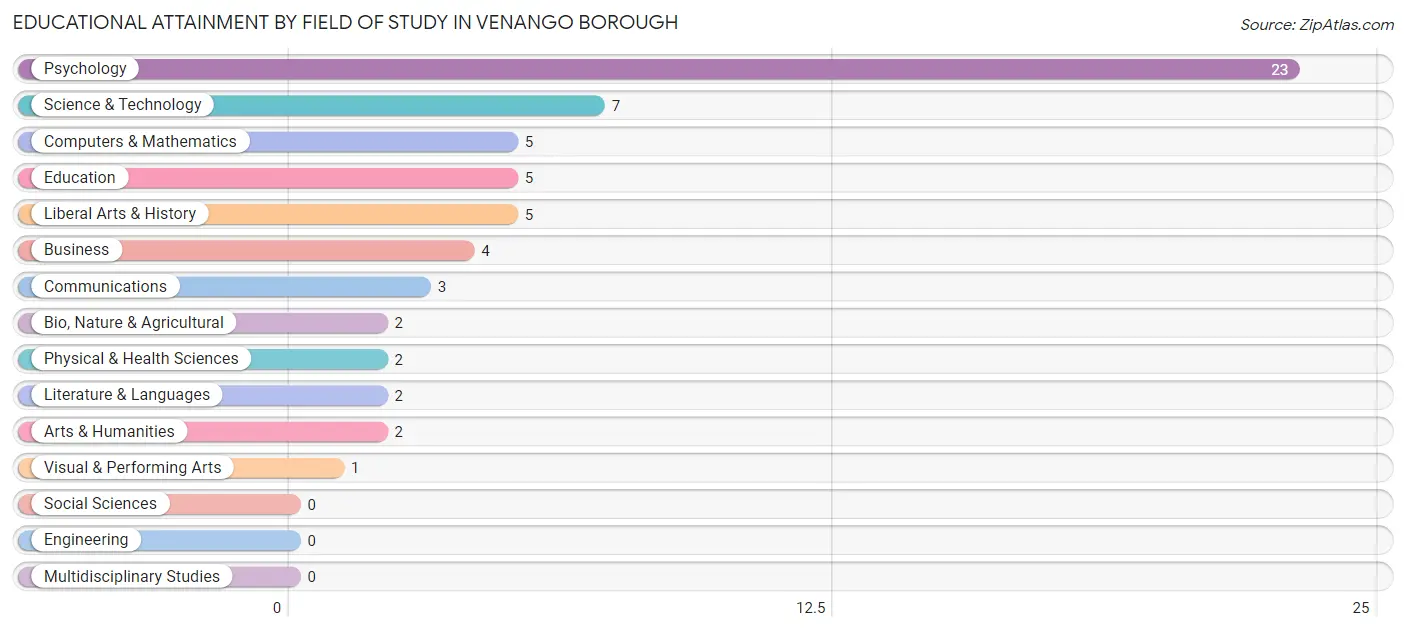
| Field of Study | # Graduates | % Graduates |
| Computers & Mathematics | 5 | 8.2% |
| Bio, Nature & Agricultural | 2 | 3.3% |
| Physical & Health Sciences | 2 | 3.3% |
| Psychology | 23 | 37.7% |
| Social Sciences | 0 | 0.0% |
| Engineering | 0 | 0.0% |
| Multidisciplinary Studies | 0 | 0.0% |
| Science & Technology | 7 | 11.5% |
| Business | 4 | 6.6% |
| Education | 5 | 8.2% |
| Literature & Languages | 2 | 3.3% |
| Liberal Arts & History | 5 | 8.2% |
| Visual & Performing Arts | 1 | 1.6% |
| Communications | 3 | 4.9% |
| Arts & Humanities | 2 | 3.3% |
| Total | 61 | 100.0% |
Transportation & Commute in Venango borough
Vehicle Availability by Sex in Venango borough
The most prevalent vehicle ownership categories in Venango borough are males with 2 vehicles (26, accounting for 51.0%) and females with 2 vehicles (43, making up 41.9%).
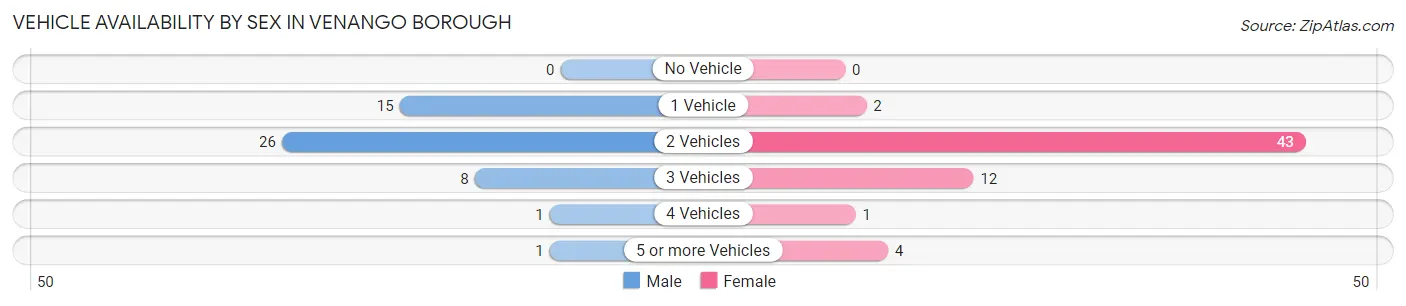
| Vehicles Available | Male | Female |
| No Vehicle | 0 (0.0%) | 0 (0.0%) |
| 1 Vehicle | 15 (29.4%) | 2 (3.2%) |
| 2 Vehicles | 26 (51.0%) | 43 (69.4%) |
| 3 Vehicles | 8 (15.7%) | 12 (19.4%) |
| 4 Vehicles | 1 (2.0%) | 1 (1.6%) |
| 5 or more Vehicles | 1 (2.0%) | 4 (6.5%) |
| Total | 51 (100.0%) | 62 (100.0%) |
Commute Time in Venango borough
The most frequently occuring commute durations in Venango borough are 20 to 24 minutes (29 commuters, 27.1%), 15 to 19 minutes (21 commuters, 19.6%), and 10 to 14 minutes (18 commuters, 16.8%).
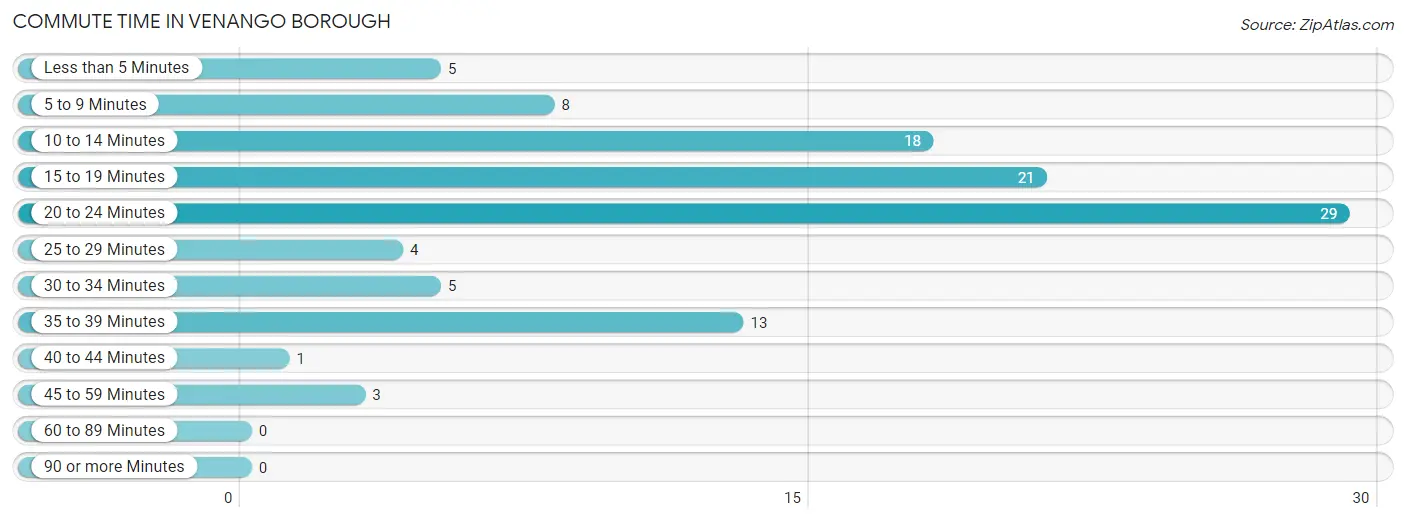
| Commute Time | # Commuters | % Commuters |
| Less than 5 Minutes | 5 | 4.7% |
| 5 to 9 Minutes | 8 | 7.5% |
| 10 to 14 Minutes | 18 | 16.8% |
| 15 to 19 Minutes | 21 | 19.6% |
| 20 to 24 Minutes | 29 | 27.1% |
| 25 to 29 Minutes | 4 | 3.7% |
| 30 to 34 Minutes | 5 | 4.7% |
| 35 to 39 Minutes | 13 | 12.1% |
| 40 to 44 Minutes | 1 | 0.9% |
| 45 to 59 Minutes | 3 | 2.8% |
| 60 to 89 Minutes | 0 | 0.0% |
| 90 or more Minutes | 0 | 0.0% |
Commute Time by Sex in Venango borough
The most common commute times in Venango borough are 20 to 24 minutes (16 commuters, 32.7%) for males and 15 to 19 minutes (18 commuters, 31.0%) for females.
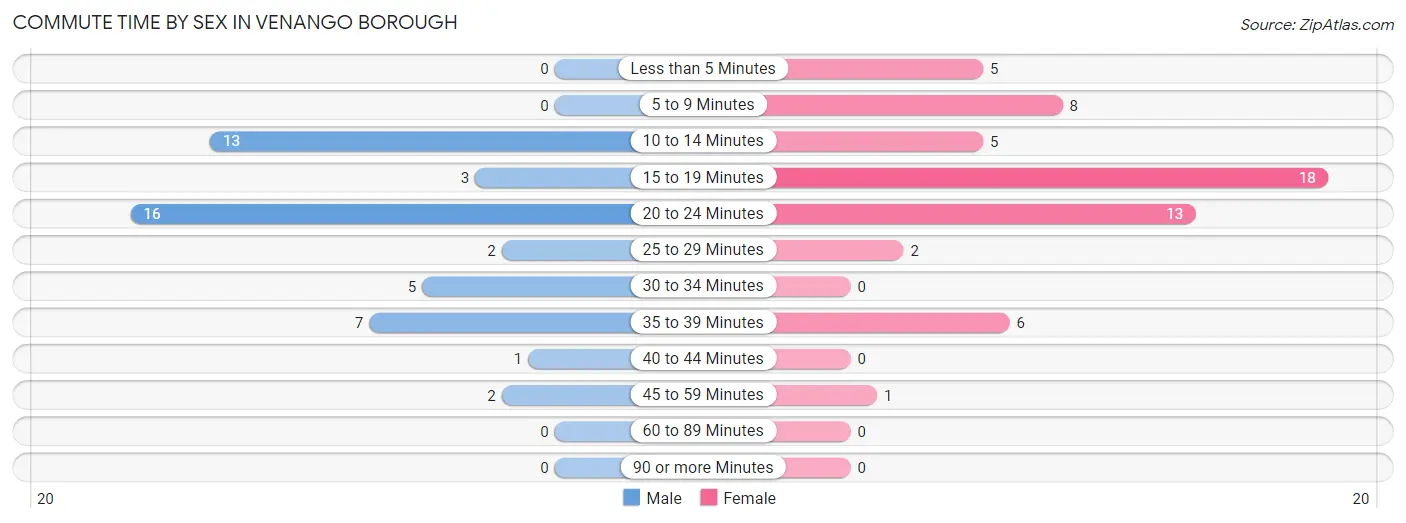
| Commute Time | Male | Female |
| Less than 5 Minutes | 0 (0.0%) | 5 (8.6%) |
| 5 to 9 Minutes | 0 (0.0%) | 8 (13.8%) |
| 10 to 14 Minutes | 13 (26.5%) | 5 (8.6%) |
| 15 to 19 Minutes | 3 (6.1%) | 18 (31.0%) |
| 20 to 24 Minutes | 16 (32.7%) | 13 (22.4%) |
| 25 to 29 Minutes | 2 (4.1%) | 2 (3.5%) |
| 30 to 34 Minutes | 5 (10.2%) | 0 (0.0%) |
| 35 to 39 Minutes | 7 (14.3%) | 6 (10.3%) |
| 40 to 44 Minutes | 1 (2.0%) | 0 (0.0%) |
| 45 to 59 Minutes | 2 (4.1%) | 1 (1.7%) |
| 60 to 89 Minutes | 0 (0.0%) | 0 (0.0%) |
| 90 or more Minutes | 0 (0.0%) | 0 (0.0%) |
Time of Departure to Work by Sex in Venango borough
The most frequent times of departure to work in Venango borough are 7:30 AM to 7:59 AM (13, 26.5%) for males and 8:30 AM to 8:59 AM (18, 31.0%) for females.
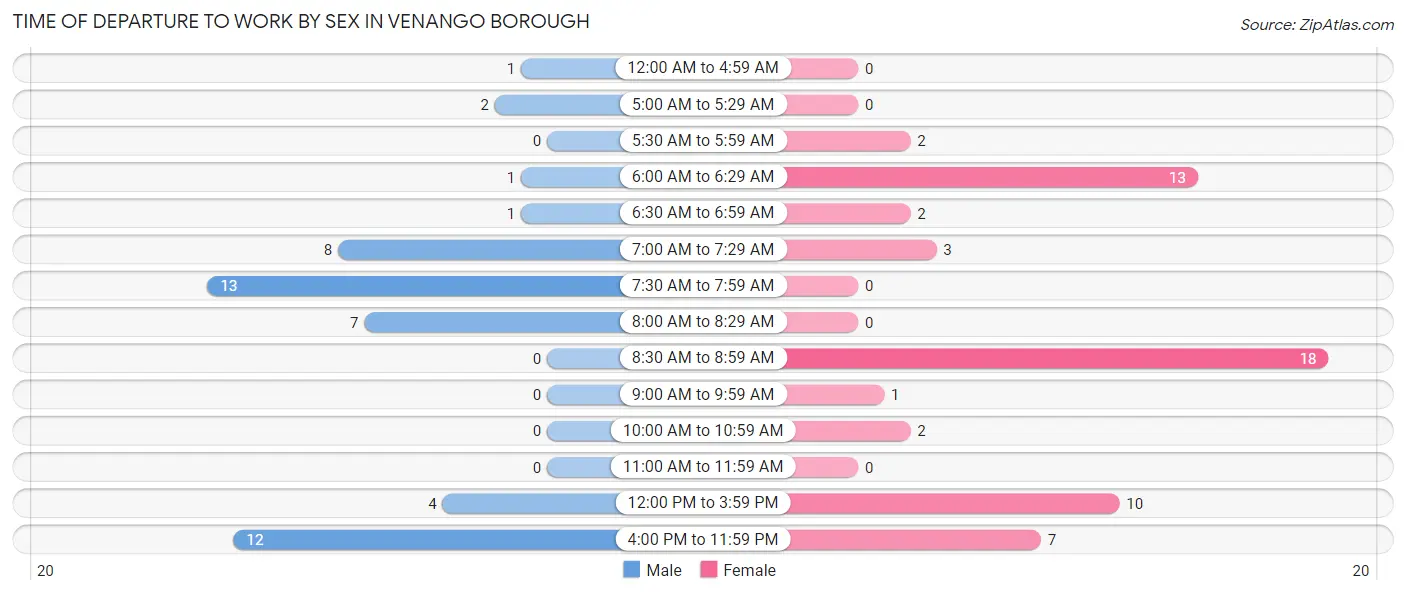
| Time of Departure | Male | Female |
| 12:00 AM to 4:59 AM | 1 (2.0%) | 0 (0.0%) |
| 5:00 AM to 5:29 AM | 2 (4.1%) | 0 (0.0%) |
| 5:30 AM to 5:59 AM | 0 (0.0%) | 2 (3.5%) |
| 6:00 AM to 6:29 AM | 1 (2.0%) | 13 (22.4%) |
| 6:30 AM to 6:59 AM | 1 (2.0%) | 2 (3.5%) |
| 7:00 AM to 7:29 AM | 8 (16.3%) | 3 (5.2%) |
| 7:30 AM to 7:59 AM | 13 (26.5%) | 0 (0.0%) |
| 8:00 AM to 8:29 AM | 7 (14.3%) | 0 (0.0%) |
| 8:30 AM to 8:59 AM | 0 (0.0%) | 18 (31.0%) |
| 9:00 AM to 9:59 AM | 0 (0.0%) | 1 (1.7%) |
| 10:00 AM to 10:59 AM | 0 (0.0%) | 2 (3.5%) |
| 11:00 AM to 11:59 AM | 0 (0.0%) | 0 (0.0%) |
| 12:00 PM to 3:59 PM | 4 (8.2%) | 10 (17.2%) |
| 4:00 PM to 11:59 PM | 12 (24.5%) | 7 (12.1%) |
| Total | 49 (100.0%) | 58 (100.0%) |
Housing Occupancy in Venango borough
Occupancy by Ownership in Venango borough
Of the total 102 dwellings in Venango borough, owner-occupied units account for 76 (74.5%), while renter-occupied units make up 26 (25.5%).
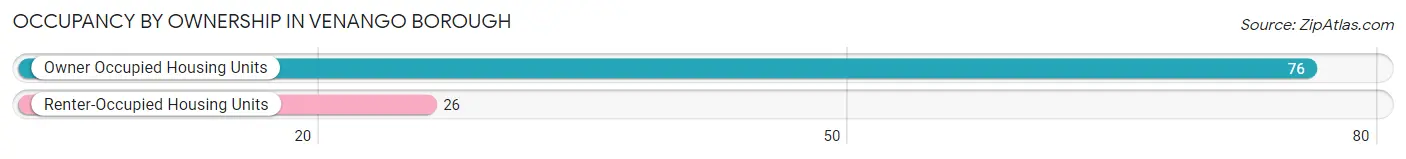
| Occupancy | # Housing Units | % Housing Units |
| Owner Occupied Housing Units | 76 | 74.5% |
| Renter-Occupied Housing Units | 26 | 25.5% |
| Total Occupied Housing Units | 102 | 100.0% |
Occupancy by Household Size in Venango borough
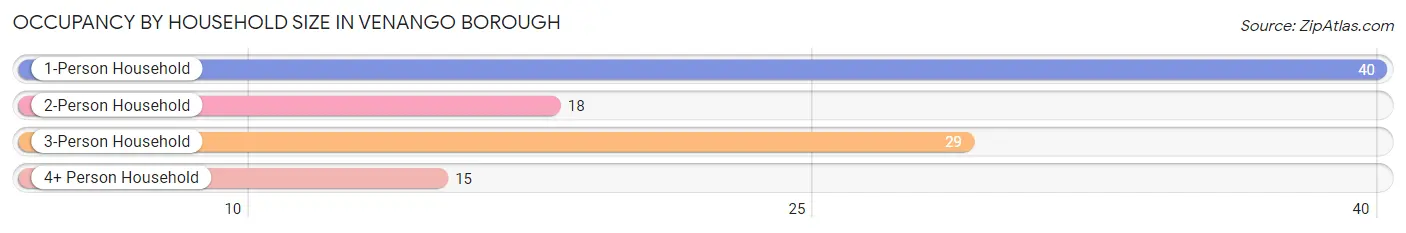
| Household Size | # Housing Units | % Housing Units |
| 1-Person Household | 40 | 39.2% |
| 2-Person Household | 18 | 17.6% |
| 3-Person Household | 29 | 28.4% |
| 4+ Person Household | 15 | 14.7% |
| Total Housing Units | 102 | 100.0% |
Occupancy by Ownership by Household Size in Venango borough
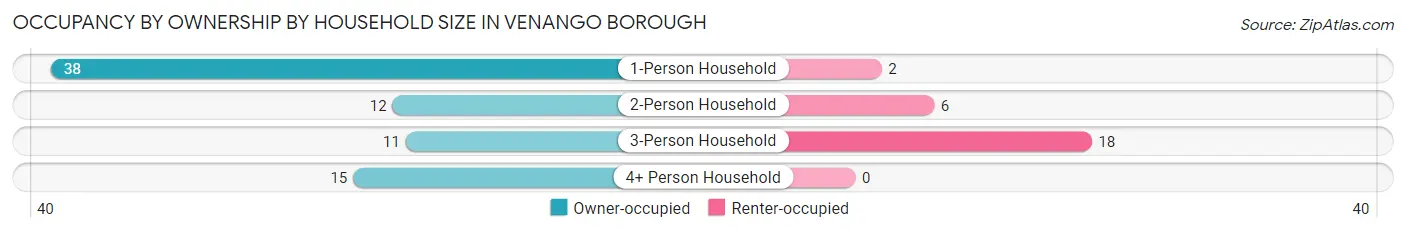
| Household Size | Owner-occupied | Renter-occupied |
| 1-Person Household | 38 (95.0%) | 2 (5.0%) |
| 2-Person Household | 12 (66.7%) | 6 (33.3%) |
| 3-Person Household | 11 (37.9%) | 18 (62.1%) |
| 4+ Person Household | 15 (100.0%) | 0 (0.0%) |
| Total Housing Units | 76 (74.5%) | 26 (25.5%) |
Occupancy by Educational Attainment in Venango borough
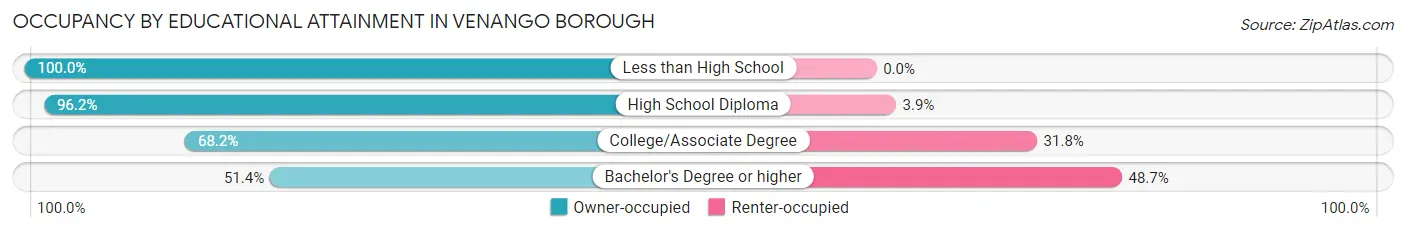
| Household Size | Owner-occupied | Renter-occupied |
| Less than High School | 17 (100.0%) | 0 (0.0%) |
| High School Diploma | 25 (96.2%) | 1 (3.8%) |
| College/Associate Degree | 15 (68.2%) | 7 (31.8%) |
| Bachelor's Degree or higher | 19 (51.3%) | 18 (48.6%) |
Occupancy by Age of Householder in Venango borough
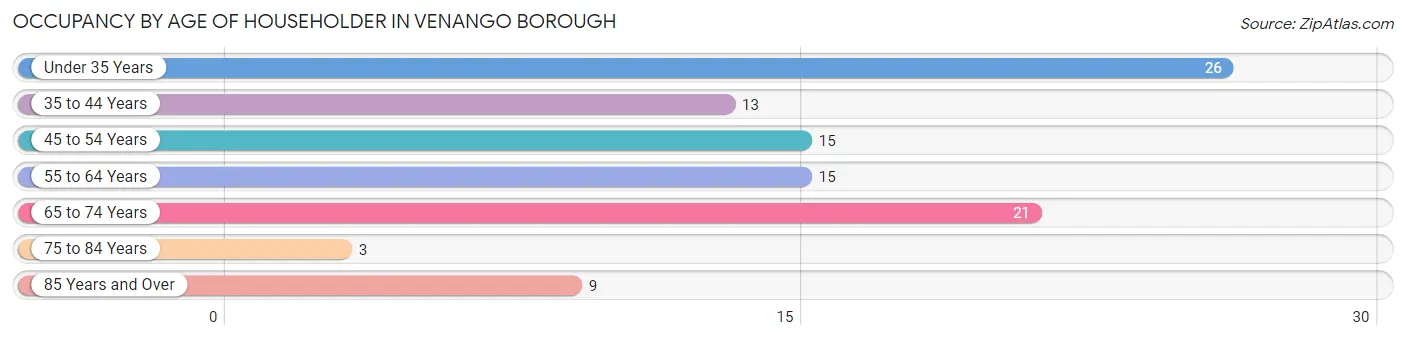
| Age Bracket | # Households | % Households |
| Under 35 Years | 26 | 25.5% |
| 35 to 44 Years | 13 | 12.8% |
| 45 to 54 Years | 15 | 14.7% |
| 55 to 64 Years | 15 | 14.7% |
| 65 to 74 Years | 21 | 20.6% |
| 75 to 84 Years | 3 | 2.9% |
| 85 Years and Over | 9 | 8.8% |
| Total | 102 | 100.0% |
Housing Finances in Venango borough
Median Income by Occupancy in Venango borough
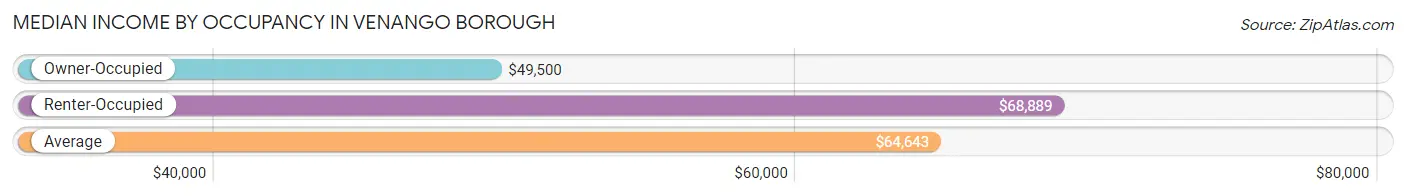
| Occupancy Type | # Households | Median Income |
| Owner-Occupied | 76 (74.5%) | $49,500 |
| Renter-Occupied | 26 (25.5%) | $68,889 |
| Average | 102 (100.0%) | $64,643 |
Occupancy by Householder Income Bracket in Venango borough
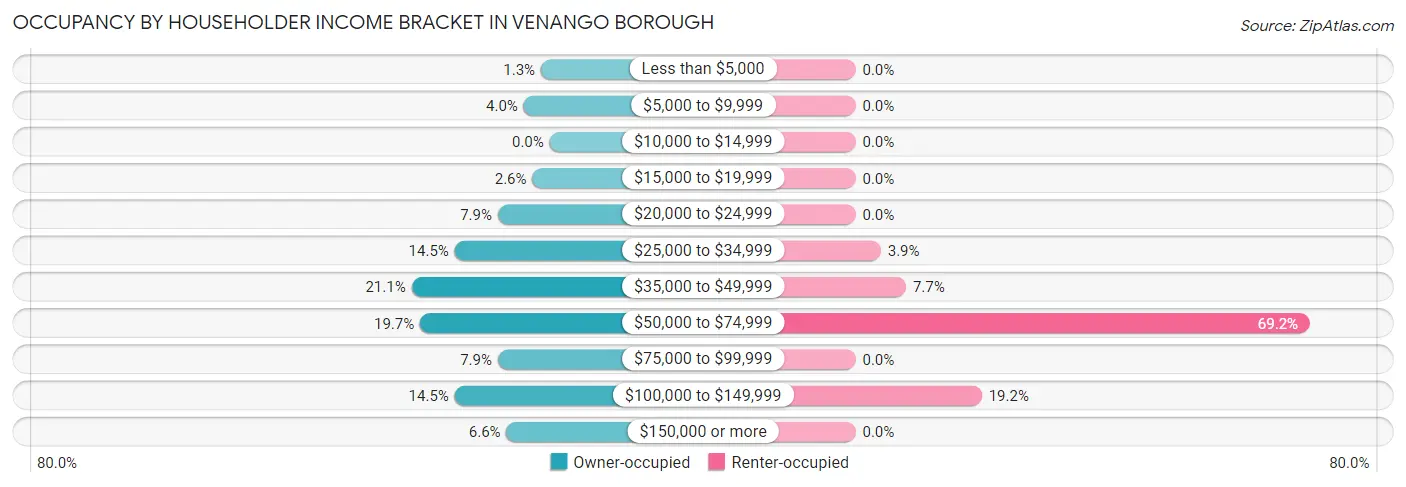
| Income Bracket | Owner-occupied | Renter-occupied |
| Less than $5,000 | 1 (1.3%) | 0 (0.0%) |
| $5,000 to $9,999 | 3 (4.0%) | 0 (0.0%) |
| $10,000 to $14,999 | 0 (0.0%) | 0 (0.0%) |
| $15,000 to $19,999 | 2 (2.6%) | 0 (0.0%) |
| $20,000 to $24,999 | 6 (7.9%) | 0 (0.0%) |
| $25,000 to $34,999 | 11 (14.5%) | 1 (3.8%) |
| $35,000 to $49,999 | 16 (21.0%) | 2 (7.7%) |
| $50,000 to $74,999 | 15 (19.7%) | 18 (69.2%) |
| $75,000 to $99,999 | 6 (7.9%) | 0 (0.0%) |
| $100,000 to $149,999 | 11 (14.5%) | 5 (19.2%) |
| $150,000 or more | 5 (6.6%) | 0 (0.0%) |
| Total | 76 (100.0%) | 26 (100.0%) |
Monthly Housing Cost Tiers in Venango borough
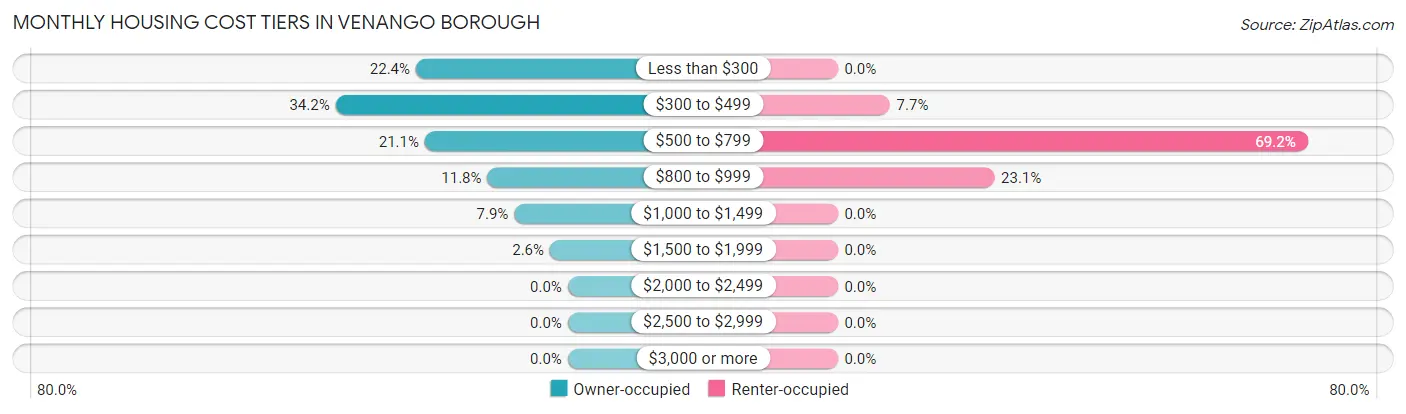
| Monthly Cost | Owner-occupied | Renter-occupied |
| Less than $300 | 17 (22.4%) | 0 (0.0%) |
| $300 to $499 | 26 (34.2%) | 2 (7.7%) |
| $500 to $799 | 16 (21.0%) | 18 (69.2%) |
| $800 to $999 | 9 (11.8%) | 6 (23.1%) |
| $1,000 to $1,499 | 6 (7.9%) | 0 (0.0%) |
| $1,500 to $1,999 | 2 (2.6%) | 0 (0.0%) |
| $2,000 to $2,499 | 0 (0.0%) | 0 (0.0%) |
| $2,500 to $2,999 | 0 (0.0%) | 0 (0.0%) |
| $3,000 or more | 0 (0.0%) | 0 (0.0%) |
| Total | 76 (100.0%) | 26 (100.0%) |
Physical Housing Characteristics in Venango borough
Housing Structures in Venango borough
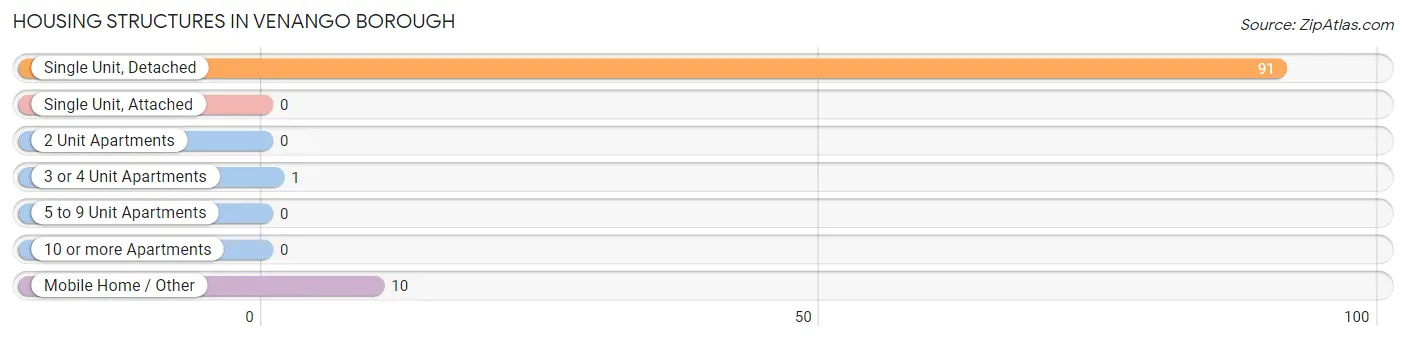
| Structure Type | # Housing Units | % Housing Units |
| Single Unit, Detached | 91 | 89.2% |
| Single Unit, Attached | 0 | 0.0% |
| 2 Unit Apartments | 0 | 0.0% |
| 3 or 4 Unit Apartments | 1 | 1.0% |
| 5 to 9 Unit Apartments | 0 | 0.0% |
| 10 or more Apartments | 0 | 0.0% |
| Mobile Home / Other | 10 | 9.8% |
| Total | 102 | 100.0% |
Housing Structures by Occupancy in Venango borough
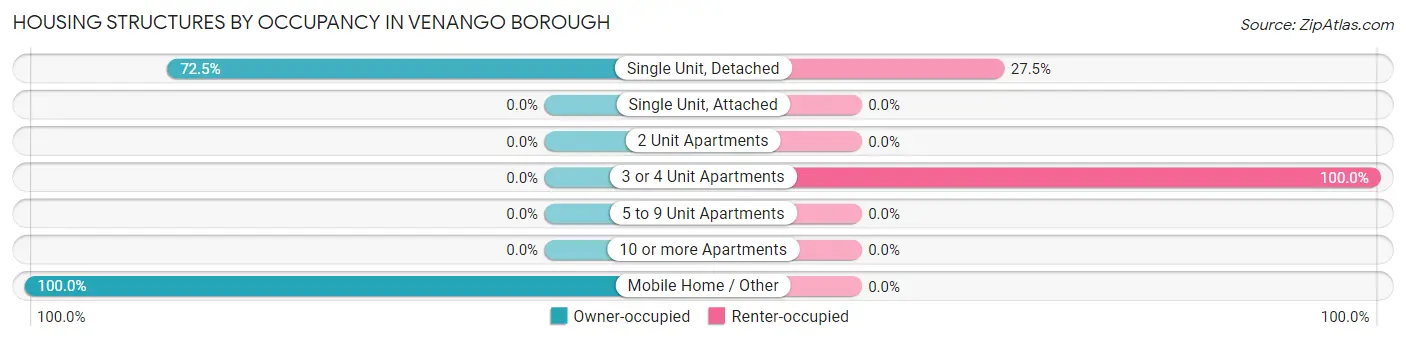
| Structure Type | Owner-occupied | Renter-occupied |
| Single Unit, Detached | 66 (72.5%) | 25 (27.5%) |
| Single Unit, Attached | 0 (0.0%) | 0 (0.0%) |
| 2 Unit Apartments | 0 (0.0%) | 0 (0.0%) |
| 3 or 4 Unit Apartments | 0 (0.0%) | 1 (100.0%) |
| 5 to 9 Unit Apartments | 0 (0.0%) | 0 (0.0%) |
| 10 or more Apartments | 0 (0.0%) | 0 (0.0%) |
| Mobile Home / Other | 10 (100.0%) | 0 (0.0%) |
| Total | 76 (74.5%) | 26 (25.5%) |
Housing Structures by Number of Rooms in Venango borough
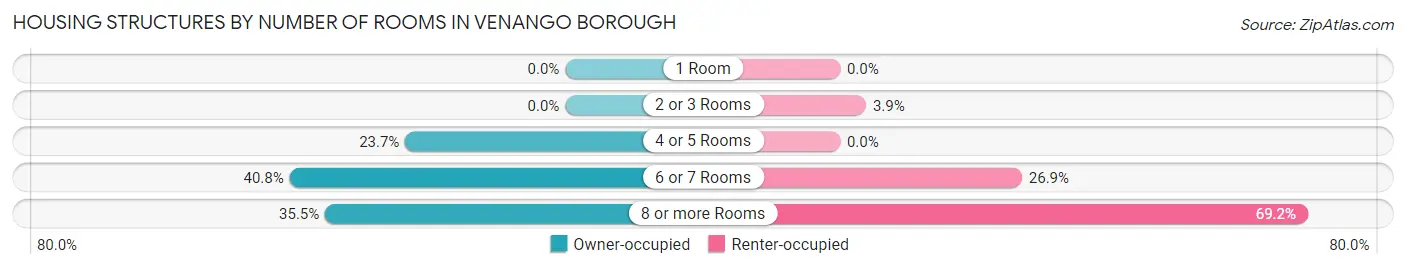
| Number of Rooms | Owner-occupied | Renter-occupied |
| 1 Room | 0 (0.0%) | 0 (0.0%) |
| 2 or 3 Rooms | 0 (0.0%) | 1 (3.8%) |
| 4 or 5 Rooms | 18 (23.7%) | 0 (0.0%) |
| 6 or 7 Rooms | 31 (40.8%) | 7 (26.9%) |
| 8 or more Rooms | 27 (35.5%) | 18 (69.2%) |
| Total | 76 (100.0%) | 26 (100.0%) |
Housing Structure by Heating Type in Venango borough
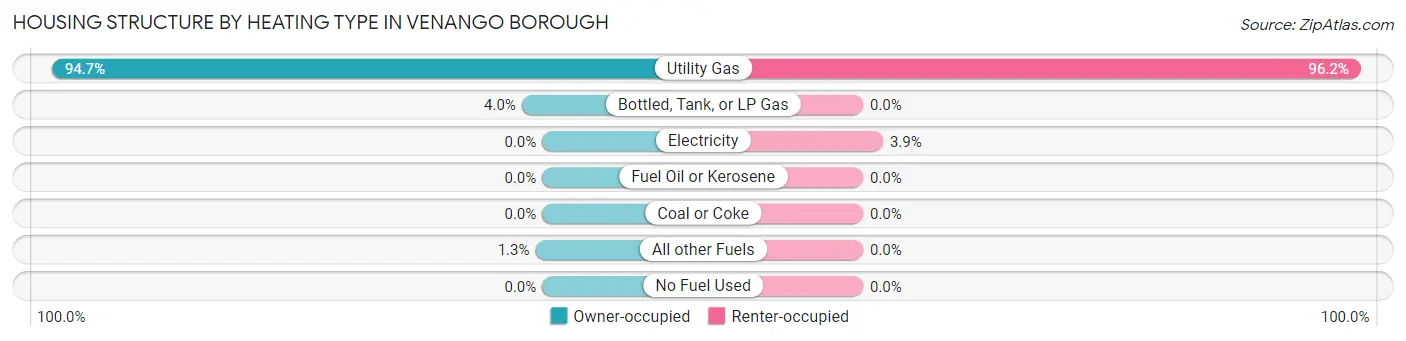
| Heating Type | Owner-occupied | Renter-occupied |
| Utility Gas | 72 (94.7%) | 25 (96.2%) |
| Bottled, Tank, or LP Gas | 3 (4.0%) | 0 (0.0%) |
| Electricity | 0 (0.0%) | 1 (3.8%) |
| Fuel Oil or Kerosene | 0 (0.0%) | 0 (0.0%) |
| Coal or Coke | 0 (0.0%) | 0 (0.0%) |
| All other Fuels | 1 (1.3%) | 0 (0.0%) |
| No Fuel Used | 0 (0.0%) | 0 (0.0%) |
| Total | 76 (100.0%) | 26 (100.0%) |
Household Vehicle Usage in Venango borough
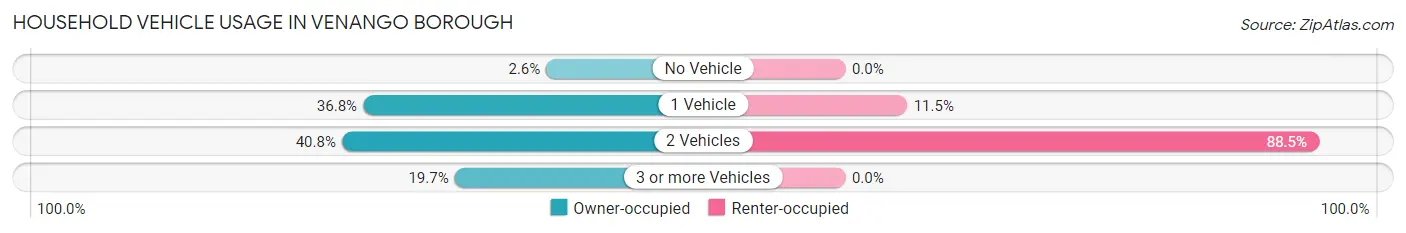
| Vehicles per Household | Owner-occupied | Renter-occupied |
| No Vehicle | 2 (2.6%) | 0 (0.0%) |
| 1 Vehicle | 28 (36.8%) | 3 (11.5%) |
| 2 Vehicles | 31 (40.8%) | 23 (88.5%) |
| 3 or more Vehicles | 15 (19.7%) | 0 (0.0%) |
| Total | 76 (100.0%) | 26 (100.0%) |
Real Estate & Mortgages in Venango borough
Real Estate and Mortgage Overview in Venango borough
| Characteristic | Without Mortgage | With Mortgage |
| Housing Units | 59 | 17 |
| Median Property Value | $109,800 | $95,000 |
| Median Household Income | $46,719 | $0 |
| Monthly Housing Costs | $410 | $0 |
| Real Estate Taxes | $1,345 | $0 |
Property Value by Mortgage Status in Venango borough
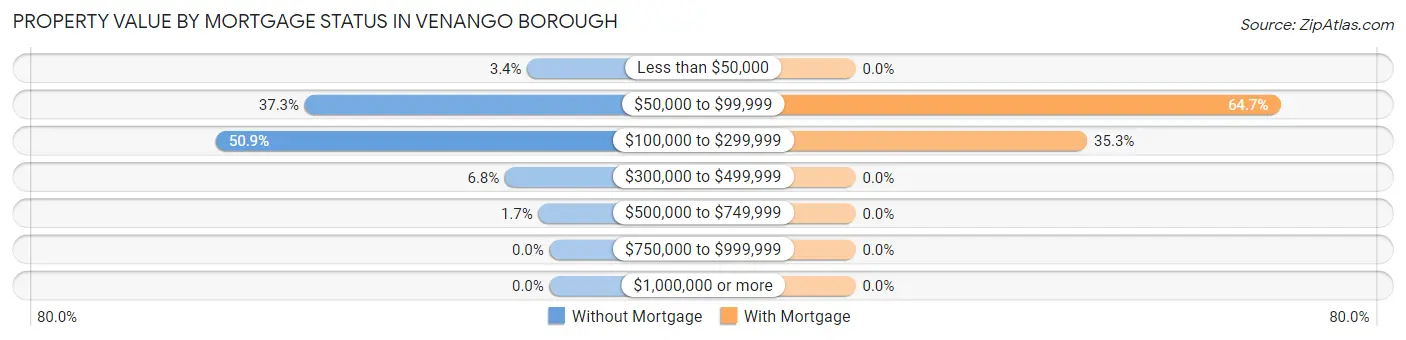
| Property Value | Without Mortgage | With Mortgage |
| Less than $50,000 | 2 (3.4%) | 0 (0.0%) |
| $50,000 to $99,999 | 22 (37.3%) | 11 (64.7%) |
| $100,000 to $299,999 | 30 (50.8%) | 6 (35.3%) |
| $300,000 to $499,999 | 4 (6.8%) | 0 (0.0%) |
| $500,000 to $749,999 | 1 (1.7%) | 0 (0.0%) |
| $750,000 to $999,999 | 0 (0.0%) | 0 (0.0%) |
| $1,000,000 or more | 0 (0.0%) | 0 (0.0%) |
| Total | 59 (100.0%) | 17 (100.0%) |
Household Income by Mortgage Status in Venango borough
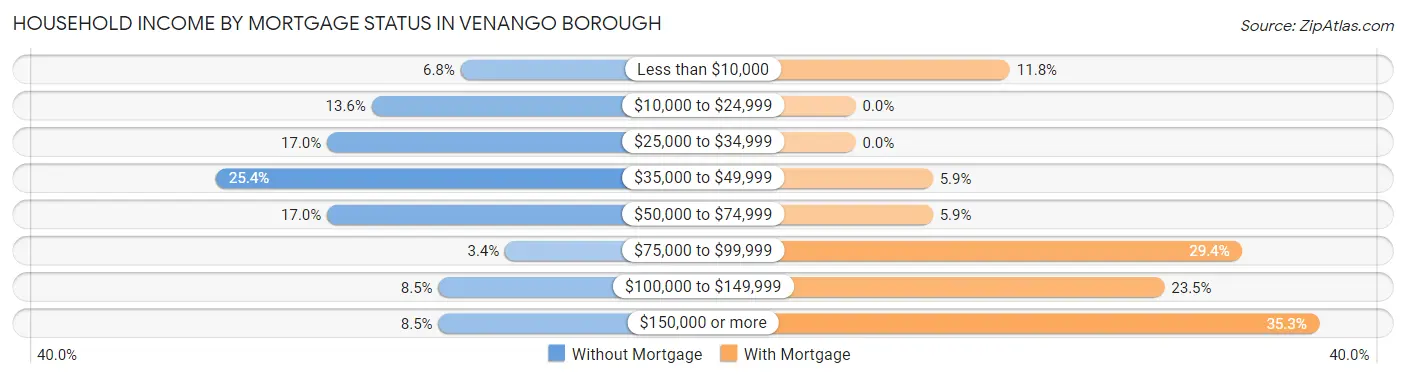
| Household Income | Without Mortgage | With Mortgage |
| Less than $10,000 | 4 (6.8%) | 2 (11.8%) |
| $10,000 to $24,999 | 8 (13.6%) | 0 (0.0%) |
| $25,000 to $34,999 | 10 (17.0%) | 0 (0.0%) |
| $35,000 to $49,999 | 15 (25.4%) | 1 (5.9%) |
| $50,000 to $74,999 | 10 (17.0%) | 1 (5.9%) |
| $75,000 to $99,999 | 2 (3.4%) | 5 (29.4%) |
| $100,000 to $149,999 | 5 (8.5%) | 4 (23.5%) |
| $150,000 or more | 5 (8.5%) | 6 (35.3%) |
| Total | 59 (100.0%) | 17 (100.0%) |
Property Value to Household Income Ratio in Venango borough
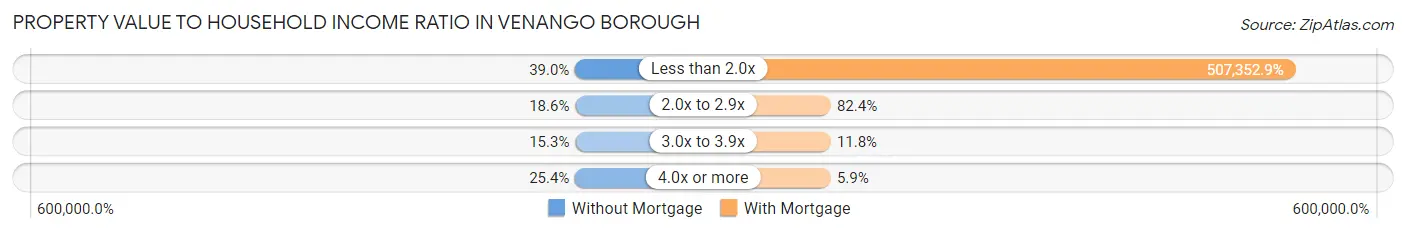
| Value-to-Income Ratio | Without Mortgage | With Mortgage |
| Less than 2.0x | 23 (39.0%) | 86,250 (507,352.9%) |
| 2.0x to 2.9x | 11 (18.6%) | 14 (82.4%) |
| 3.0x to 3.9x | 9 (15.2%) | 2 (11.8%) |
| 4.0x or more | 15 (25.4%) | 1 (5.9%) |
| Total | 59 (100.0%) | 17 (100.0%) |
Real Estate Taxes by Mortgage Status in Venango borough
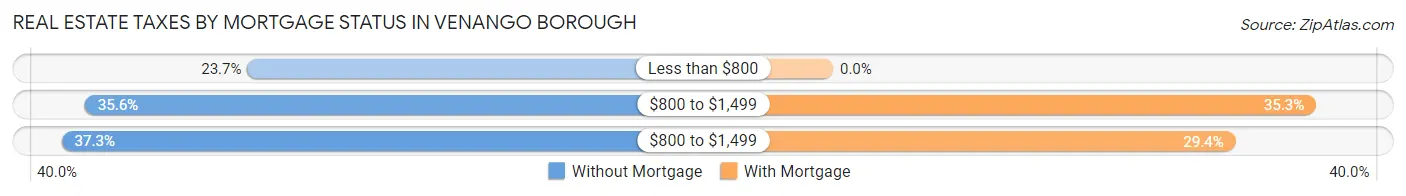
| Property Taxes | Without Mortgage | With Mortgage |
| Less than $800 | 14 (23.7%) | 0 (0.0%) |
| $800 to $1,499 | 21 (35.6%) | 6 (35.3%) |
| $800 to $1,499 | 22 (37.3%) | 5 (29.4%) |
| Total | 59 (100.0%) | 17 (100.0%) |
Health & Disability in Venango borough
Health Insurance Coverage by Age in Venango borough
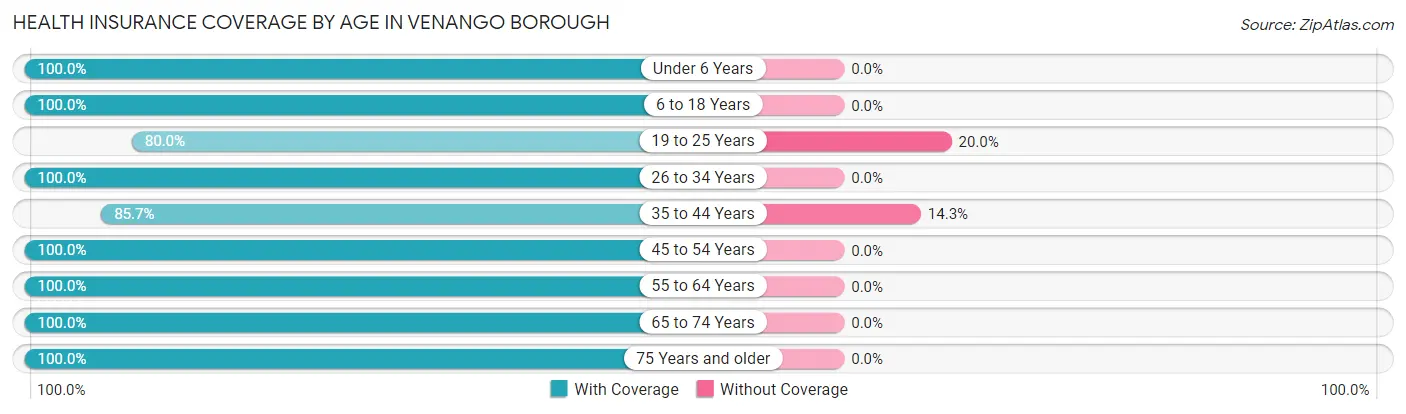
| Age Bracket | With Coverage | Without Coverage |
| Under 6 Years | 18 (100.0%) | 0 (0.0%) |
| 6 to 18 Years | 24 (100.0%) | 0 (0.0%) |
| 19 to 25 Years | 16 (80.0%) | 4 (20.0%) |
| 26 to 34 Years | 29 (100.0%) | 0 (0.0%) |
| 35 to 44 Years | 30 (85.7%) | 5 (14.3%) |
| 45 to 54 Years | 22 (100.0%) | 0 (0.0%) |
| 55 to 64 Years | 19 (100.0%) | 0 (0.0%) |
| 65 to 74 Years | 35 (100.0%) | 0 (0.0%) |
| 75 Years and older | 19 (100.0%) | 0 (0.0%) |
| Total | 212 (95.9%) | 9 (4.1%) |
Health Insurance Coverage by Citizenship Status in Venango borough
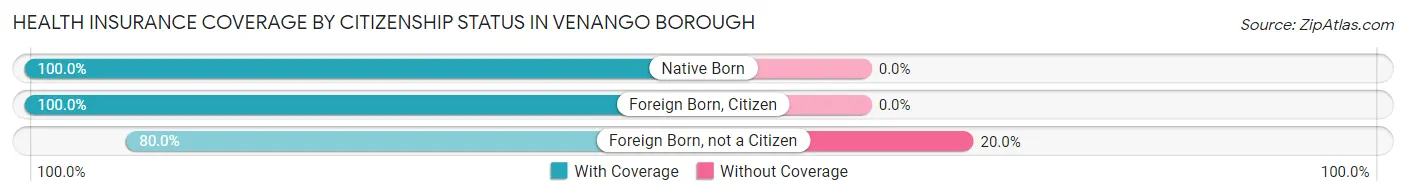
| Citizenship Status | With Coverage | Without Coverage |
| Native Born | 18 (100.0%) | 0 (0.0%) |
| Foreign Born, Citizen | 24 (100.0%) | 0 (0.0%) |
| Foreign Born, not a Citizen | 16 (80.0%) | 4 (20.0%) |
Health Insurance Coverage by Household Income in Venango borough
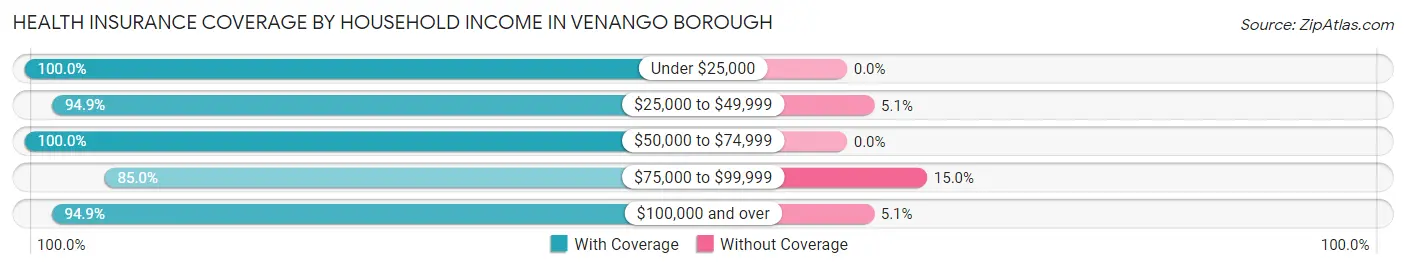
| Household Income | With Coverage | Without Coverage |
| Under $25,000 | 12 (100.0%) | 0 (0.0%) |
| $25,000 to $49,999 | 37 (94.9%) | 2 (5.1%) |
| $50,000 to $74,999 | 71 (100.0%) | 0 (0.0%) |
| $75,000 to $99,999 | 17 (85.0%) | 3 (15.0%) |
| $100,000 and over | 75 (94.9%) | 4 (5.1%) |
Public vs Private Health Insurance Coverage by Age in Venango borough
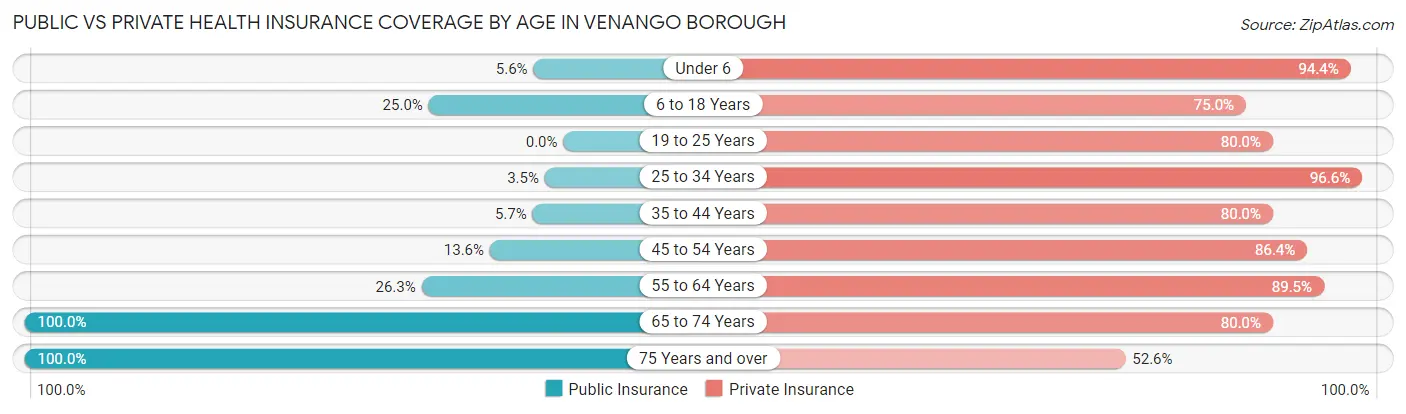
| Age Bracket | Public Insurance | Private Insurance |
| Under 6 | 1 (5.6%) | 17 (94.4%) |
| 6 to 18 Years | 6 (25.0%) | 18 (75.0%) |
| 19 to 25 Years | 0 (0.0%) | 16 (80.0%) |
| 25 to 34 Years | 1 (3.5%) | 28 (96.6%) |
| 35 to 44 Years | 2 (5.7%) | 28 (80.0%) |
| 45 to 54 Years | 3 (13.6%) | 19 (86.4%) |
| 55 to 64 Years | 5 (26.3%) | 17 (89.5%) |
| 65 to 74 Years | 35 (100.0%) | 28 (80.0%) |
| 75 Years and over | 19 (100.0%) | 10 (52.6%) |
| Total | 72 (32.6%) | 181 (81.9%) |
Disability Status by Sex by Age in Venango borough
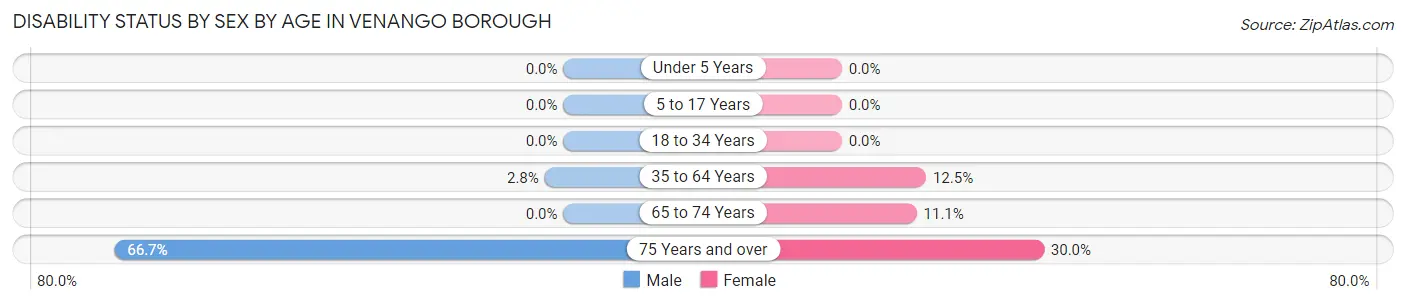
| Age Bracket | Male | Female |
| Under 5 Years | 0 (0.0%) | 0 (0.0%) |
| 5 to 17 Years | 0 (0.0%) | 0 (0.0%) |
| 18 to 34 Years | 0 (0.0%) | 0 (0.0%) |
| 35 to 64 Years | 1 (2.8%) | 5 (12.5%) |
| 65 to 74 Years | 0 (0.0%) | 2 (11.1%) |
| 75 Years and over | 6 (66.7%) | 3 (30.0%) |
Disability Class by Sex by Age in Venango borough
Disability Class: Hearing Difficulty
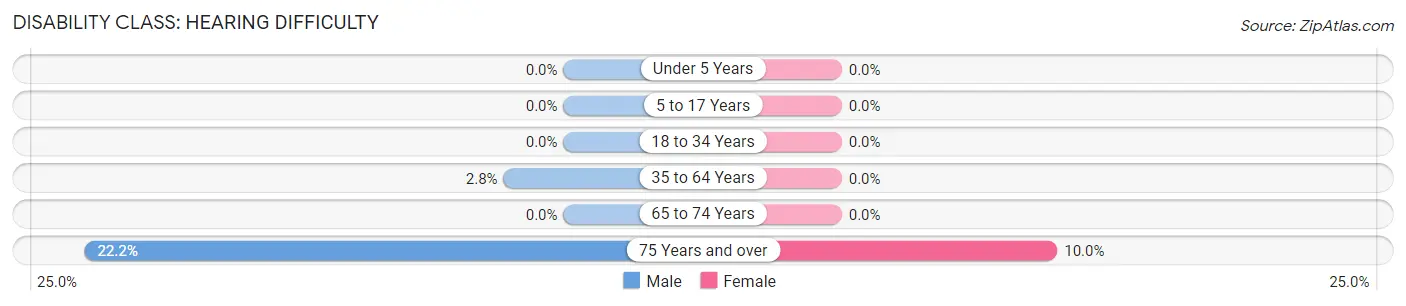
| Age Bracket | Male | Female |
| Under 5 Years | 0 (0.0%) | 0 (0.0%) |
| 5 to 17 Years | 0 (0.0%) | 0 (0.0%) |
| 18 to 34 Years | 0 (0.0%) | 0 (0.0%) |
| 35 to 64 Years | 1 (2.8%) | 0 (0.0%) |
| 65 to 74 Years | 0 (0.0%) | 0 (0.0%) |
| 75 Years and over | 2 (22.2%) | 1 (10.0%) |
Disability Class: Vision Difficulty
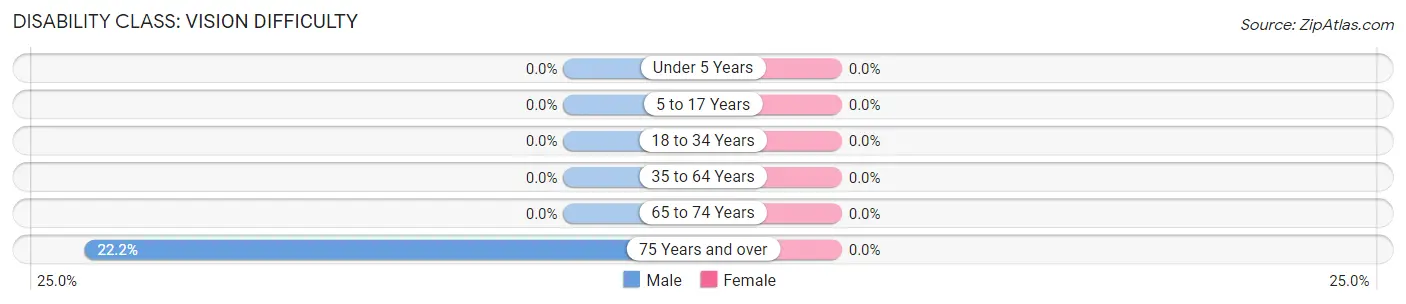
| Age Bracket | Male | Female |
| Under 5 Years | 0 (0.0%) | 0 (0.0%) |
| 5 to 17 Years | 0 (0.0%) | 0 (0.0%) |
| 18 to 34 Years | 0 (0.0%) | 0 (0.0%) |
| 35 to 64 Years | 0 (0.0%) | 0 (0.0%) |
| 65 to 74 Years | 0 (0.0%) | 0 (0.0%) |
| 75 Years and over | 2 (22.2%) | 0 (0.0%) |
Disability Class: Cognitive Difficulty

| Age Bracket | Male | Female |
| 5 to 17 Years | 0 (0.0%) | 0 (0.0%) |
| 18 to 34 Years | 0 (0.0%) | 0 (0.0%) |
| 35 to 64 Years | 0 (0.0%) | 0 (0.0%) |
| 65 to 74 Years | 0 (0.0%) | 0 (0.0%) |
| 75 Years and over | 2 (22.2%) | 0 (0.0%) |
Disability Class: Ambulatory Difficulty
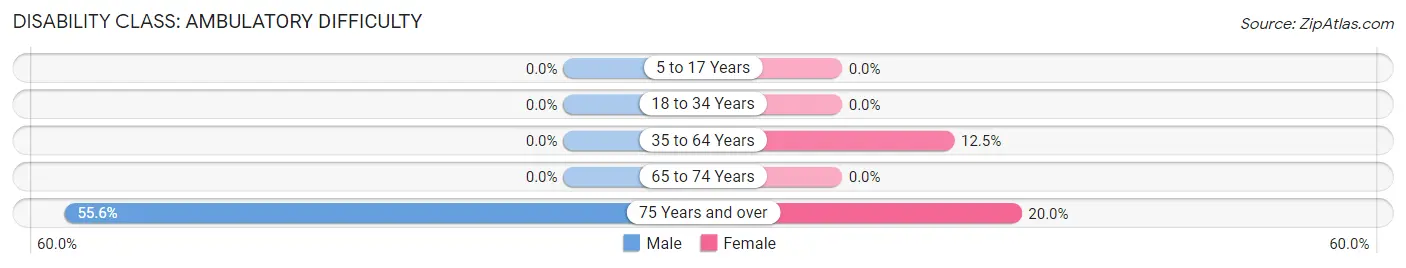
| Age Bracket | Male | Female |
| 5 to 17 Years | 0 (0.0%) | 0 (0.0%) |
| 18 to 34 Years | 0 (0.0%) | 0 (0.0%) |
| 35 to 64 Years | 0 (0.0%) | 5 (12.5%) |
| 65 to 74 Years | 0 (0.0%) | 0 (0.0%) |
| 75 Years and over | 5 (55.6%) | 2 (20.0%) |
Disability Class: Self-Care Difficulty
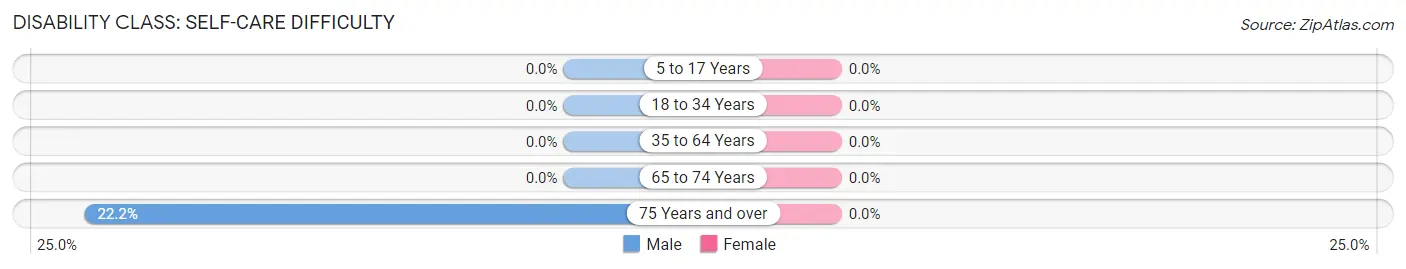
| Age Bracket | Male | Female |
| 5 to 17 Years | 0 (0.0%) | 0 (0.0%) |
| 18 to 34 Years | 0 (0.0%) | 0 (0.0%) |
| 35 to 64 Years | 0 (0.0%) | 0 (0.0%) |
| 65 to 74 Years | 0 (0.0%) | 0 (0.0%) |
| 75 Years and over | 2 (22.2%) | 0 (0.0%) |
Technology Access in Venango borough
Computing Device Access in Venango borough
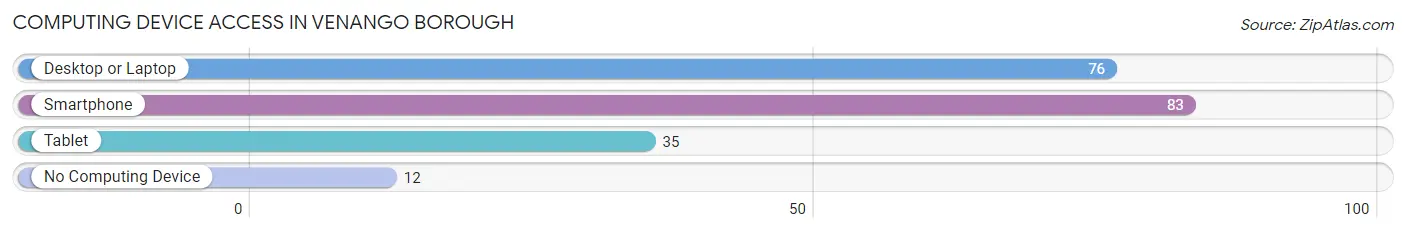
| Device Type | # Households | % Households |
| Desktop or Laptop | 76 | 74.5% |
| Smartphone | 83 | 81.4% |
| Tablet | 35 | 34.3% |
| No Computing Device | 12 | 11.8% |
| Total | 102 | 100.0% |
Internet Access in Venango borough
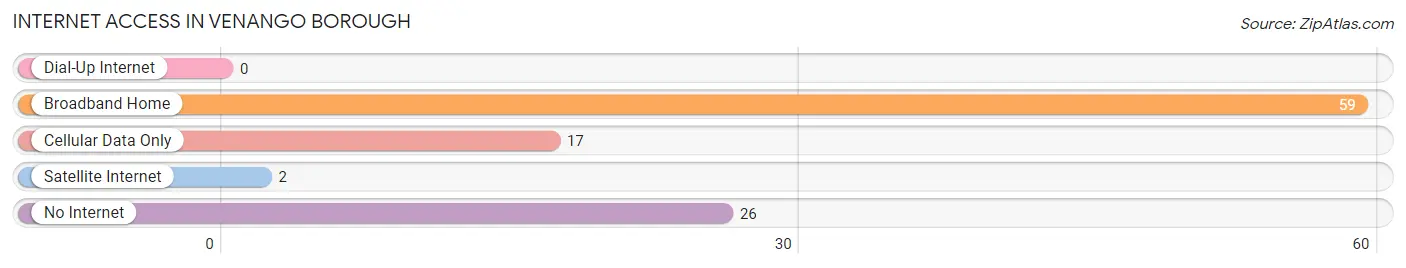
| Internet Type | # Households | % Households |
| Dial-Up Internet | 0 | 0.0% |
| Broadband Home | 59 | 57.8% |
| Cellular Data Only | 17 | 16.7% |
| Satellite Internet | 2 | 2.0% |
| No Internet | 26 | 25.5% |
| Total | 102 | 100.0% |
Venango borough Summary
Introduction
Venango Borough is a small borough located in Venango County, Pennsylvania. It is situated in the northwestern part of the state, approximately 60 miles north of Pittsburgh. The borough is home to a population of approximately 1,500 people and is part of the Oil City, PA Metropolitan Statistical Area. Venango Borough is a small, rural community with a rich history and a vibrant economy.
History
Venango Borough was founded in 1832 and was originally known as “Venango City”. The name was changed to “Venango Borough” in 1854. The borough was originally part of Franklin Township, which was established in 1805. The area was first settled by European settlers in the late 1700s and early 1800s. The first settlers were mostly of German and Irish descent.
The borough was an important center of the oil industry in the late 1800s and early 1900s. The first oil well in the area was drilled in 1859 and the area quickly became a major producer of oil and natural gas. The oil industry was a major source of employment and economic growth for the borough.
The borough was also an important center of the lumber industry in the late 1800s and early 1900s. The lumber industry was a major source of employment and economic growth for the borough.
Geography
Venango Borough is located in Venango County, Pennsylvania. It is situated in the northwestern part of the state, approximately 60 miles north of Pittsburgh. The borough is located in the Allegheny Plateau region of Pennsylvania. The borough is bordered by the Allegheny River to the north and the Clarion River to the south.
The borough has a total area of 1.2 square miles, all of which is land. The borough is located at an elevation of 1,068 feet above sea level. The borough has a humid continental climate, with cold winters and warm summers.
Economy
The economy of Venango Borough is largely based on the oil and gas industry. The borough is home to several oil and gas companies, including Chevron, Shell, and ExxonMobil. The borough is also home to several manufacturing companies, including a paper mill and a steel mill.
The borough is also home to several retail stores, restaurants, and other businesses. The borough is home to several banks, including First National Bank and Citizens Bank. The borough is also home to several medical facilities, including a hospital and several clinics.
Demographics
As of the 2010 census, the population of Venango Borough was 1,521. The racial makeup of the borough was 97.3% White, 0.7% African American, 0.2% Native American, 0.2% Asian, 0.1% Pacific Islander, 0.3% from other races, and 1.3% from two or more races. Hispanic or Latino of any race were 1.2% of the population.
The median household income in Venango Borough was $37,917, and the median family income was $45,938. The per capita income for the borough was $19,945. About 11.3% of families and 14.2% of the population were below the poverty line, including 19.2% of those under age 18 and 8.2% of those age 65 or over.
Conclusion
Venango Borough is a small borough located in Venango County, Pennsylvania. It is situated in the northwestern part of the state, approximately 60 miles north of Pittsburgh. The borough is home to a population of approximately 1,500 people and is part of the Oil City, PA Metropolitan Statistical Area. Venango Borough is a small, rural community with a rich history and a vibrant economy. The economy of the borough is largely based on the oil and gas industry, as well as manufacturing and retail. The borough has a diverse population, with a median household income of $37,917 and a median family income of $45,938.
Common Questions
What is the Total Population of Venango borough?
Total Population of Venango borough is 221.
What is the Total Male Population of Venango borough?
Total Male Population of Venango borough is 114.
What is the Total Female Population of Venango borough?
Total Female Population of Venango borough is 107.
What is the Ratio of Males per 100 Females in Venango borough?
There are 106.54 Males per 100 Females in Venango borough.
What is the Ratio of Females per 100 Males in Venango borough?
There are 93.86 Females per 100 Males in Venango borough.
What is the Median Population Age in Venango borough?
Median Population Age in Venango borough is 39.7 Years.
What is the Average Family Size in Venango borough
Average Family Size in Venango borough is 2.9 People.
What is the Average Household Size in Venango borough
Average Household Size in Venango borough is 2.2 People.
What is Per Capita Income in Venango borough?
Per Capita income in Venango borough is $30,089.
What is the Median Family Income in Venango borough?
Median Family Income in Venango borough is $63,929.
What is the Median Household income in Venango borough?
Median Household Income in Venango borough is $64,643.
What is Income or Wage Gap in Venango borough?
Income or Wage Gap in Venango borough is 35.6%.
Women in Venango borough earn 64.4 cents for every dollar earned by a man.
What is Inequality or Gini Index in Venango borough?
Inequality or Gini Index in Venango borough is 0.30.
How Large is the Labor Force in Venango borough?
There are 125 People in the Labor Forcein in Venango borough.
What is the Percentage of People in the Labor Force in Venango borough?
67.6% of People are in the Labor Force in Venango borough.
What is the Unemployment Rate in Venango borough?
Unemployment Rate in Venango borough is 9.6%.