Arnold, PA
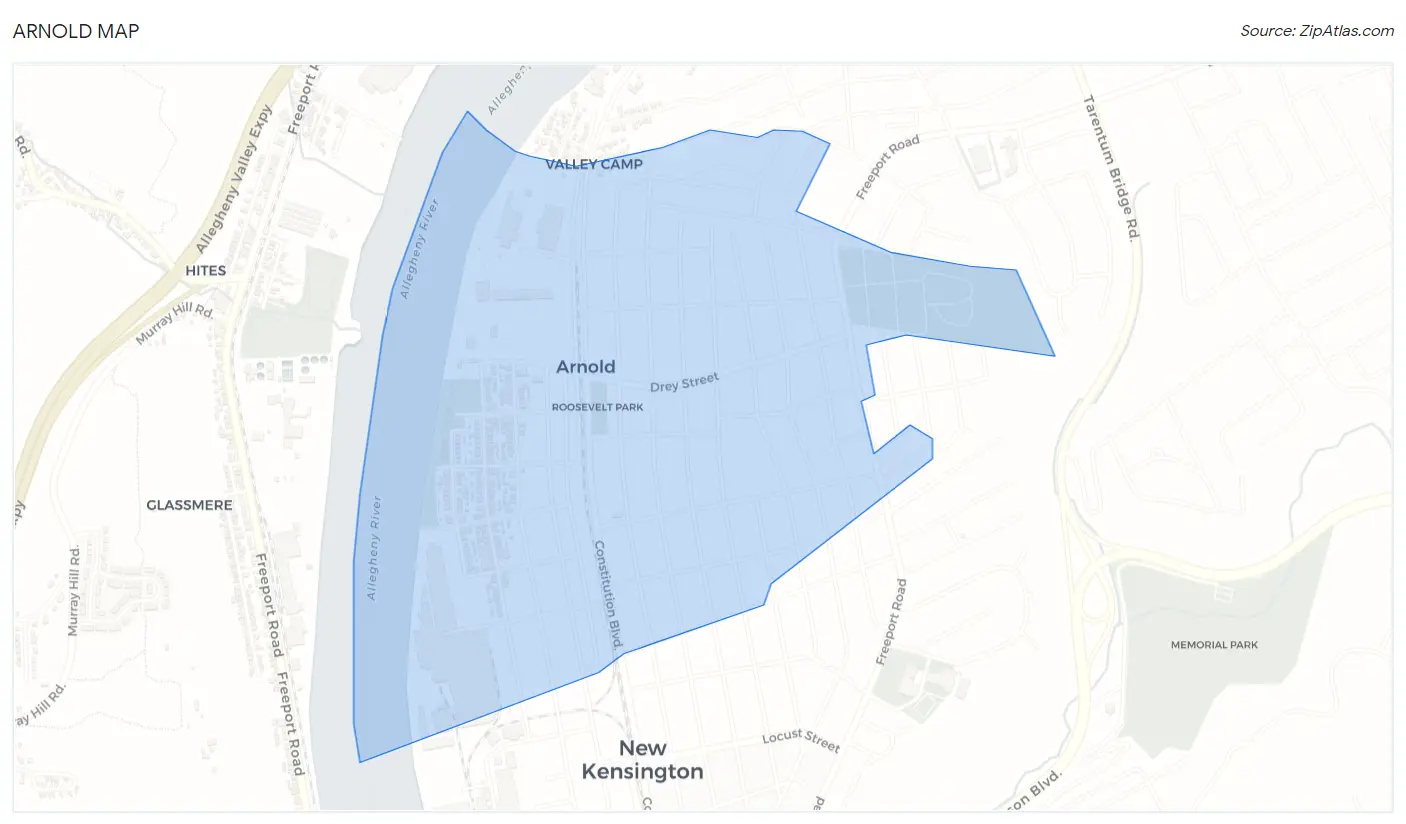
Arnold Map
Arnold Overview
4,778
TOTAL POPULATION
2,338
MALE POPULATION
2,440
FEMALE POPULATION
95.82
MALES / 100 FEMALES
104.36
FEMALES / 100 MALES
42.3
MEDIAN AGE
2.9
AVG FAMILY SIZE
2.2
AVG HOUSEHOLD SIZE
$24,363
PER CAPITA INCOME
$63,458
AVG FAMILY INCOME
$38,150
AVG HOUSEHOLD INCOME
7.4%
WAGE / INCOME GAP [ % ]
92.6¢/ $1
WAGE / INCOME GAP [ $ ]
0.46
INEQUALITY / GINI INDEX
2,282
LABOR FORCE [ PEOPLE ]
57.5%
PERCENT IN LABOR FORCE
13.9%
UNEMPLOYMENT RATE
Arnold Area Codes
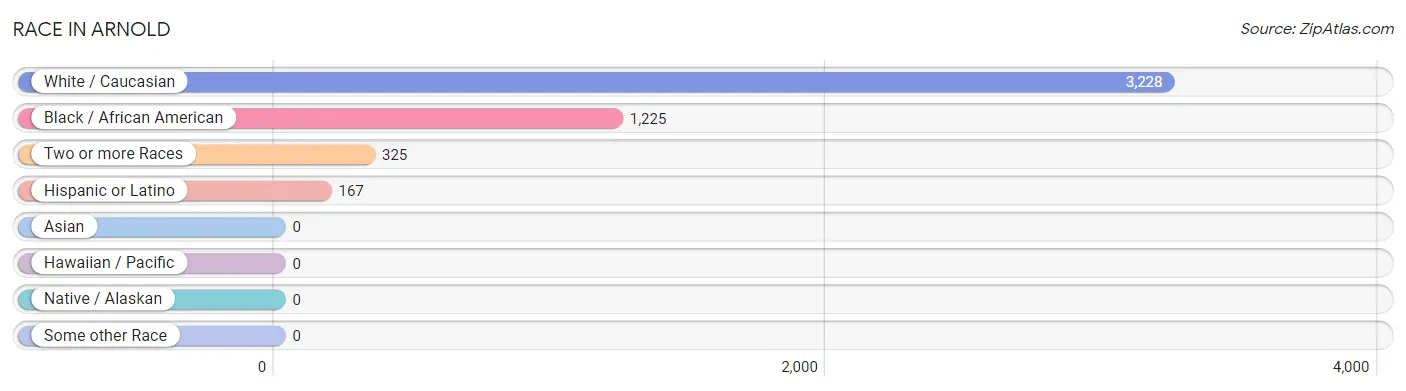
Race in Arnold
The most populous races in Arnold are White / Caucasian (3,228 | 67.6%), Black / African American (1,225 | 25.6%), and Two or more Races (325 | 6.8%).
| Race | # Population | % Population |
| Asian | 0 | 0.0% |
| Black / African American | 1,225 | 25.6% |
| Hawaiian / Pacific | 0 | 0.0% |
| Hispanic or Latino | 167 | 3.5% |
| Native / Alaskan | 0 | 0.0% |
| White / Caucasian | 3,228 | 67.6% |
| Two or more Races | 325 | 6.8% |
| Some other Race | 0 | 0.0% |
| Total | 4,778 | 100.0% |
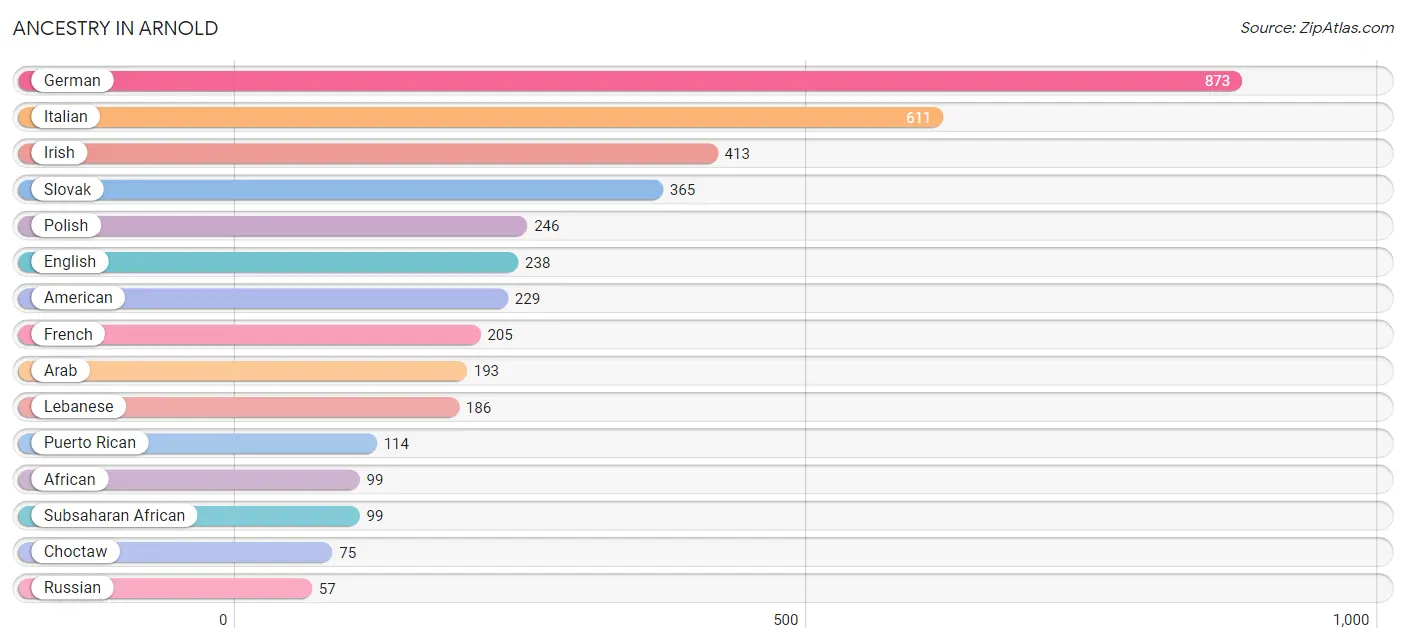
Ancestry in Arnold
The most populous ancestries reported in Arnold are German (873 | 18.3%), Italian (611 | 12.8%), Irish (413 | 8.6%), Slovak (365 | 7.6%), and Polish (246 | 5.1%), together accounting for 52.5% of all Arnold residents.
| Ancestry | # Population | % Population |
| African | 99 | 2.1% |
| American | 229 | 4.8% |
| Arab | 193 | 4.0% |
| Argentinean | 9 | 0.2% |
| Austrian | 12 | 0.3% |
| Barbadian | 8 | 0.2% |
| Bhutanese | 14 | 0.3% |
| Blackfeet | 6 | 0.1% |
| Brazilian | 16 | 0.3% |
| Choctaw | 75 | 1.6% |
| Czech | 11 | 0.2% |
| Dutch | 26 | 0.5% |
| Eastern European | 9 | 0.2% |
| English | 238 | 5.0% |
| European | 17 | 0.4% |
| French | 205 | 4.3% |
| German | 873 | 18.3% |
| Greek | 7 | 0.2% |
| Hungarian | 34 | 0.7% |
| Irish | 413 | 8.6% |
| Iroquois | 1 | 0.0% |
| Italian | 611 | 12.8% |
| Jamaican | 8 | 0.2% |
| Lebanese | 186 | 3.9% |
| Mexican | 4 | 0.1% |
| Navajo | 27 | 0.6% |
| Norwegian | 14 | 0.3% |
| Polish | 246 | 5.1% |
| Puerto Rican | 114 | 2.4% |
| Russian | 57 | 1.2% |
| Scotch-Irish | 43 | 0.9% |
| Scottish | 25 | 0.5% |
| Serbian | 20 | 0.4% |
| Slavic | 37 | 0.8% |
| Slovak | 365 | 7.6% |
| South American | 9 | 0.2% |
| Spanish | 40 | 0.8% |
| Subsaharan African | 99 | 2.1% |
| Swedish | 5 | 0.1% |
| Swiss | 11 | 0.2% |
| Syrian | 7 | 0.2% |
| Ukrainian | 25 | 0.5% |
| Welsh | 3 | 0.1% | View All 43 Rows |
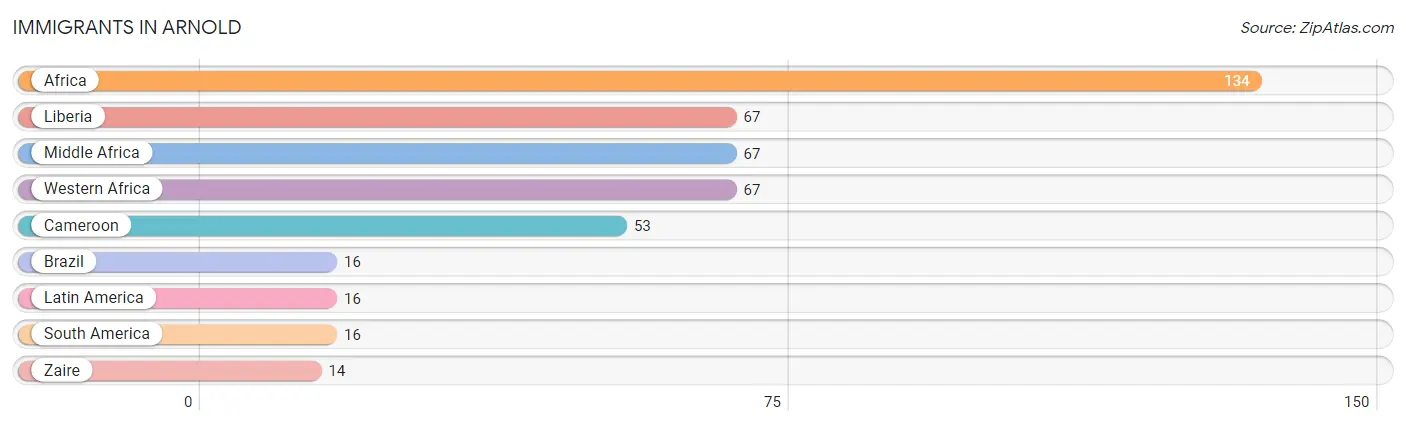
Immigrants in Arnold
The most numerous immigrant groups reported in Arnold came from Africa (134 | 2.8%), Liberia (67 | 1.4%), Middle Africa (67 | 1.4%), Western Africa (67 | 1.4%), and Cameroon (53 | 1.1%), together accounting for 8.1% of all Arnold residents.
| Immigration Origin | # Population | % Population |
| Africa | 134 | 2.8% |
| Brazil | 16 | 0.3% |
| Cameroon | 53 | 1.1% |
| Latin America | 16 | 0.3% |
| Liberia | 67 | 1.4% |
| Middle Africa | 67 | 1.4% |
| South America | 16 | 0.3% |
| Western Africa | 67 | 1.4% |
| Zaire | 14 | 0.3% | View All 9 Rows |
Sex and Age in Arnold
Sex and Age in Arnold
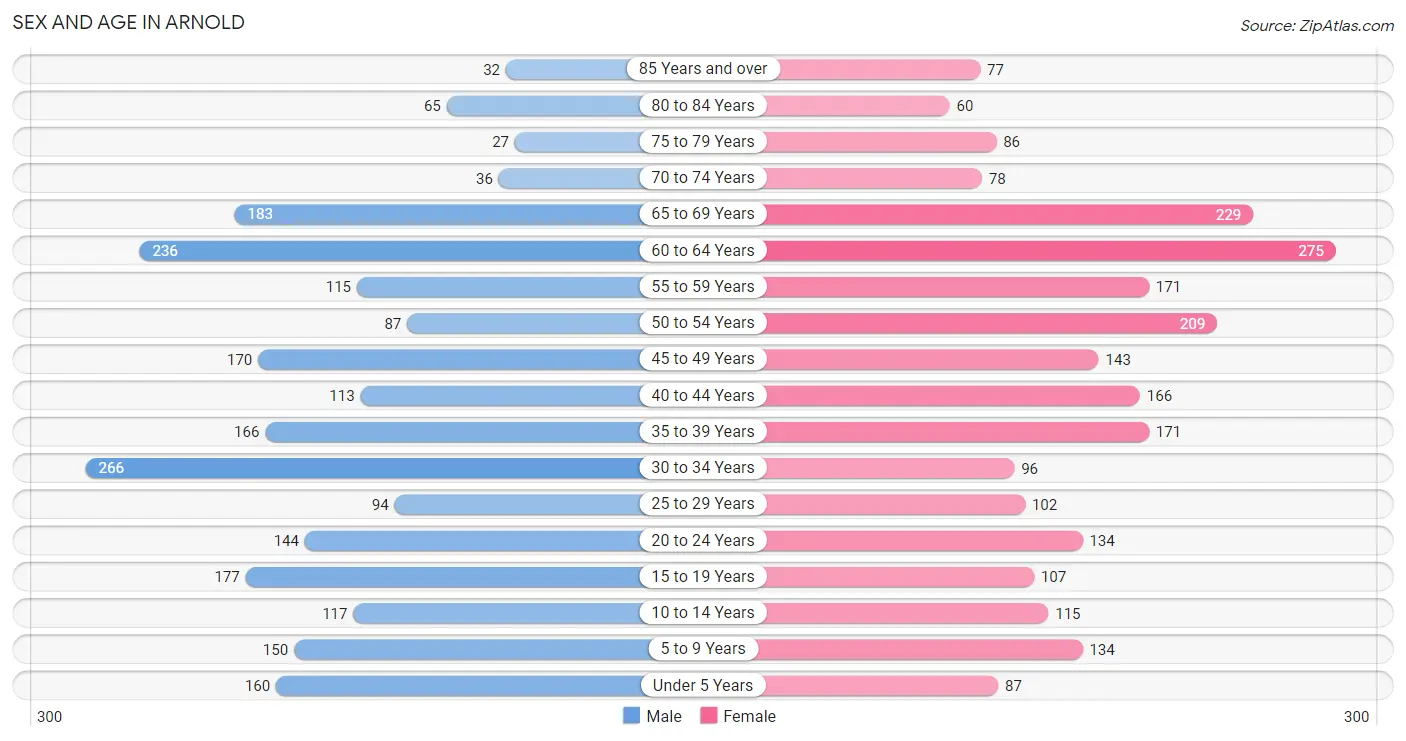
The most populous age groups in Arnold are 30 to 34 Years (266 | 11.4%) for men and 60 to 64 Years (275 | 11.3%) for women.
| Age Bracket | Male | Female |
| Under 5 Years | 160 (6.8%) | 87 (3.6%) |
| 5 to 9 Years | 150 (6.4%) | 134 (5.5%) |
| 10 to 14 Years | 117 (5.0%) | 115 (4.7%) |
| 15 to 19 Years | 177 (7.6%) | 107 (4.4%) |
| 20 to 24 Years | 144 (6.2%) | 134 (5.5%) |
| 25 to 29 Years | 94 (4.0%) | 102 (4.2%) |
| 30 to 34 Years | 266 (11.4%) | 96 (3.9%) |
| 35 to 39 Years | 166 (7.1%) | 171 (7.0%) |
| 40 to 44 Years | 113 (4.8%) | 166 (6.8%) |
| 45 to 49 Years | 170 (7.3%) | 143 (5.9%) |
| 50 to 54 Years | 87 (3.7%) | 209 (8.6%) |
| 55 to 59 Years | 115 (4.9%) | 171 (7.0%) |
| 60 to 64 Years | 236 (10.1%) | 275 (11.3%) |
| 65 to 69 Years | 183 (7.8%) | 229 (9.4%) |
| 70 to 74 Years | 36 (1.5%) | 78 (3.2%) |
| 75 to 79 Years | 27 (1.1%) | 86 (3.5%) |
| 80 to 84 Years | 65 (2.8%) | 60 (2.5%) |
| 85 Years and over | 32 (1.4%) | 77 (3.2%) |
| Total | 2,338 (100.0%) | 2,440 (100.0%) |
Families and Households in Arnold
Median Family Size in Arnold
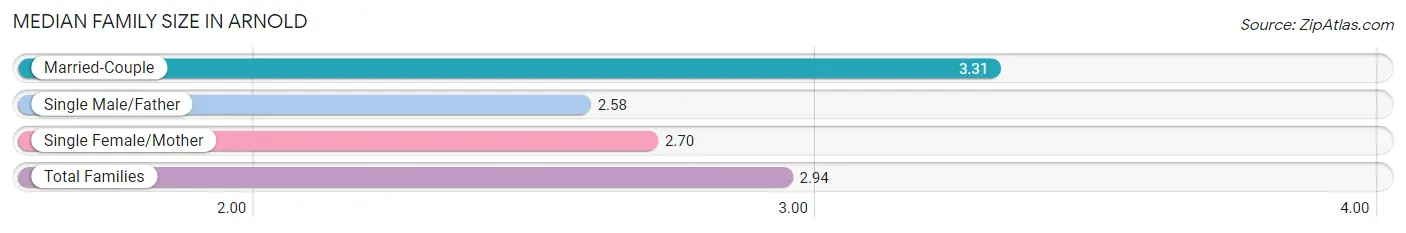
The median family size in Arnold is 2.94 persons per family, with married-couple families (484 | 42.9%) accounting for the largest median family size of 3.31 persons per family. On the other hand, single male/father families (174 | 15.4%) represent the smallest median family size with 2.58 persons per family.
| Family Type | # Families | Family Size |
| Married-Couple | 484 (42.9%) | 3.31 |
| Single Male/Father | 174 (15.4%) | 2.58 |
| Single Female/Mother | 469 (41.6%) | 2.70 |
| Total Families | 1,127 (100.0%) | 2.94 |
Median Household Size in Arnold
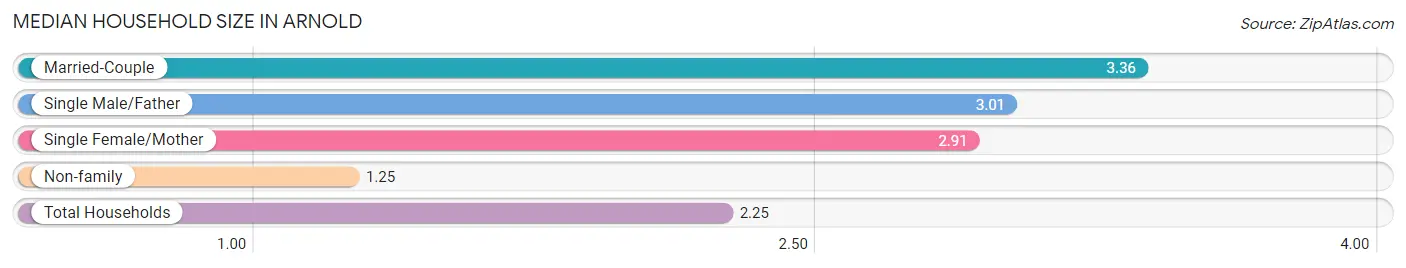
The median household size in Arnold is 2.25 persons per household, with married-couple households (484 | 23.0%) accounting for the largest median household size of 3.36 persons per household. non-family households (980 | 46.5%) represent the smallest median household size with 1.25 persons per household.
| Household Type | # Households | Household Size |
| Married-Couple | 484 (23.0%) | 3.36 |
| Single Male/Father | 174 (8.3%) | 3.01 |
| Single Female/Mother | 469 (22.3%) | 2.91 |
| Non-family | 980 (46.5%) | 1.25 |
| Total Households | 2,107 (100.0%) | 2.25 |
Household Size by Marriage Status in Arnold
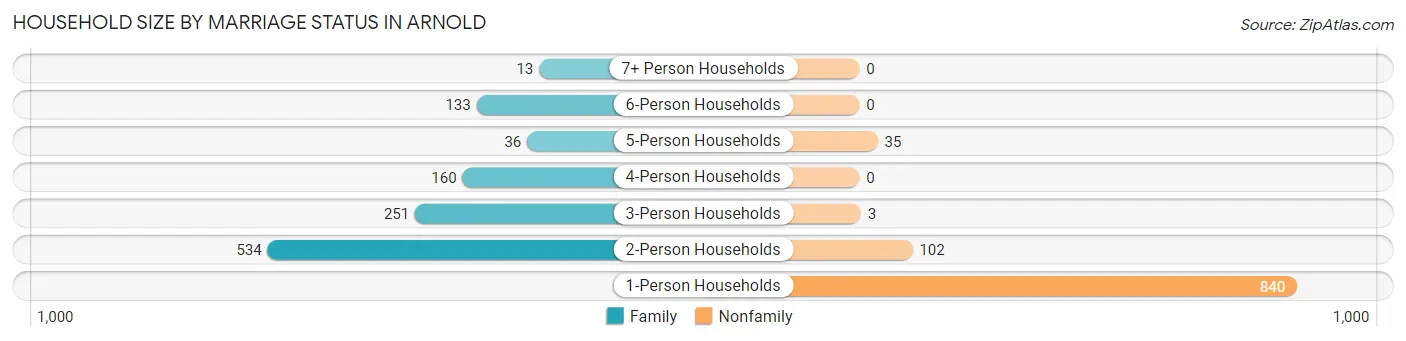
Out of a total of 2,107 households in Arnold, 1,127 (53.5%) are family households, while 980 (46.5%) are nonfamily households. The most numerous type of family households are 2-person households, comprising 534, and the most common type of nonfamily households are 1-person households, comprising 840.
| Household Size | Family Households | Nonfamily Households |
| 1-Person Households | - | 840 (39.9%) |
| 2-Person Households | 534 (25.3%) | 102 (4.8%) |
| 3-Person Households | 251 (11.9%) | 3 (0.1%) |
| 4-Person Households | 160 (7.6%) | 0 (0.0%) |
| 5-Person Households | 36 (1.7%) | 35 (1.7%) |
| 6-Person Households | 133 (6.3%) | 0 (0.0%) |
| 7+ Person Households | 13 (0.6%) | 0 (0.0%) |
| Total | 1,127 (53.5%) | 980 (46.5%) |
Female Fertility in Arnold
Fertility by Age in Arnold
Average fertility rate in Arnold is 86.0 births per 1,000 women. Women in the age bracket of 20 to 34 years have the highest fertility rate with 127.0 births per 1,000 women. Women in the age bracket of 20 to 34 years acount for 50.6% of all women with births.
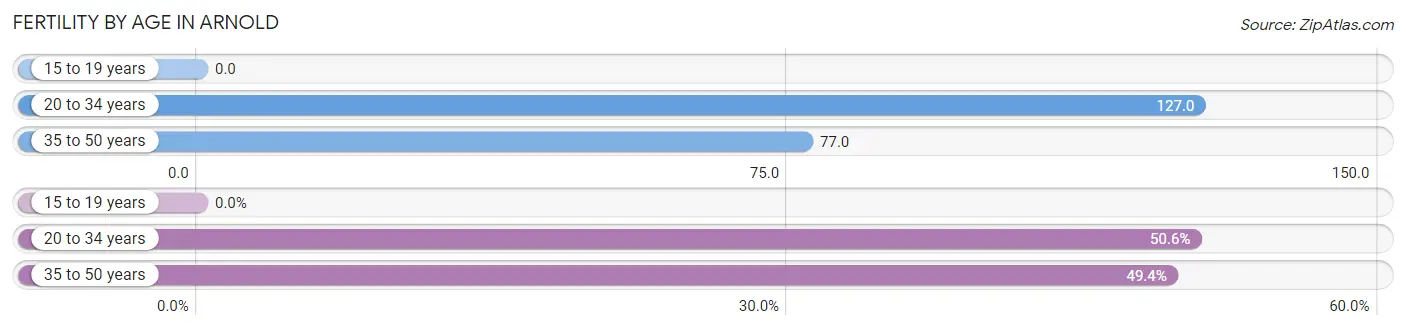
| Age Bracket | Women with Births | Births / 1,000 Women |
| 15 to 19 years | 0 (0.0%) | 0.0 |
| 20 to 34 years | 42 (50.6%) | 127.0 |
| 35 to 50 years | 41 (49.4%) | 77.0 |
| Total | 83 (100.0%) | 86.0 |
Fertility by Age by Marriage Status in Arnold
43.4% of women with births (83) in Arnold are married. The highest percentage of unmarried women with births falls into 20 to 34 years age bracket with 100.0% of them unmarried at the time of birth, while the lowest percentage of unmarried women with births belong to 35 to 50 years age bracket with 12.2% of them unmarried.
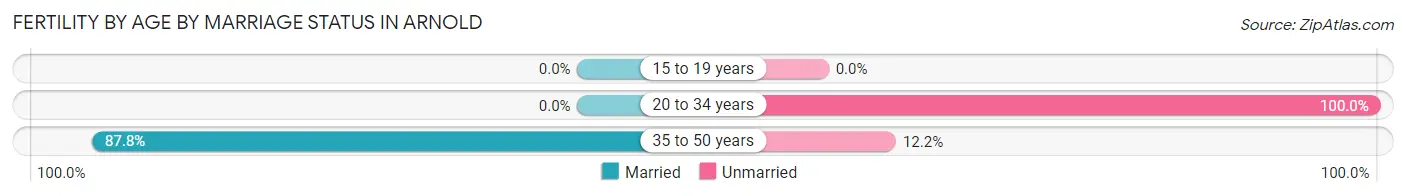
| Age Bracket | Married | Unmarried |
| 15 to 19 years | 0 (0.0%) | 0 (0.0%) |
| 20 to 34 years | 0 (0.0%) | 42 (100.0%) |
| 35 to 50 years | 36 (87.8%) | 5 (12.2%) |
| Total | 36 (43.4%) | 47 (56.6%) |
Fertility by Education in Arnold
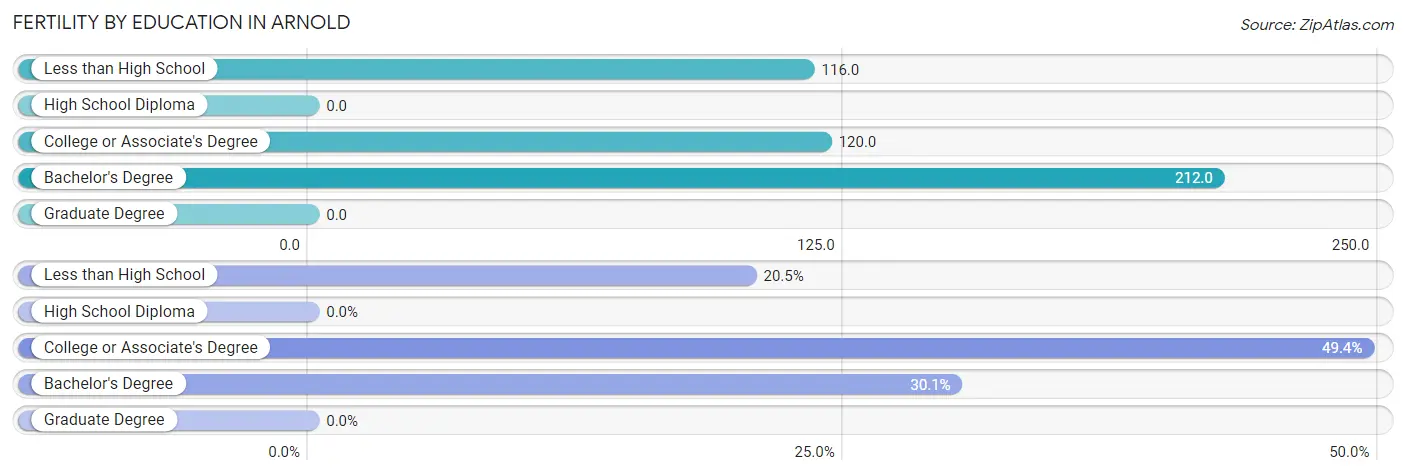
| Educational Attainment | Women with Births | Births / 1,000 Women |
| Less than High School | 17 (20.5%) | 116.0 |
| High School Diploma | 0 (0.0%) | 0.0 |
| College or Associate's Degree | 41 (49.4%) | 120.0 |
| Bachelor's Degree | 25 (30.1%) | 212.0 |
| Graduate Degree | 0 (0.0%) | 0.0 |
| Total | 83 (100.0%) | 86.0 |
Fertility by Education by Marriage Status in Arnold
56.6% of women with births in Arnold are unmarried. Women with the educational attainment of college or associate's degree are most likely to be married with 87.8% of them married at childbirth, while women with the educational attainment of less than high school are least likely to be married with 100.0% of them unmarried at childbirth.
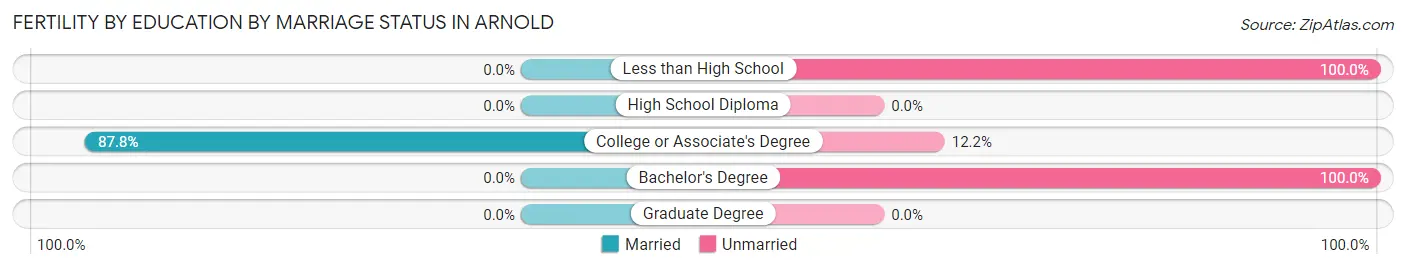
| Educational Attainment | Married | Unmarried |
| Less than High School | 0 (0.0%) | 17 (100.0%) |
| High School Diploma | 0 (0.0%) | 0 (0.0%) |
| College or Associate's Degree | 36 (87.8%) | 5 (12.2%) |
| Bachelor's Degree | 0 (0.0%) | 25 (100.0%) |
| Graduate Degree | 0 (0.0%) | 0 (0.0%) |
| Total | 36 (43.4%) | 47 (56.6%) |
Income in Arnold
Income Overview in Arnold
Per Capita Income in Arnold is $24,363, while median incomes of families and households are $63,458 and $38,150 respectively.
| Characteristic | Number | Measure |
| Per Capita Income | 4,778 | $24,363 |
| Median Family Income | 1,127 | $63,458 |
| Mean Family Income | 1,127 | $67,725 |
| Median Household Income | 2,107 | $38,150 |
| Mean Household Income | 2,107 | $53,534 |
| Income Deficit | 1,127 | $0 |
| Wage / Income Gap (%) | 4,778 | 7.36% |
| Wage / Income Gap ($) | 4,778 | 92.64¢ per $1 |
| Gini / Inequality Index | 4,778 | 0.46 |
Earnings by Sex in Arnold
Average Earnings in Arnold are $30,645, $29,133 for men and $31,449 for women, a difference of 7.4%.
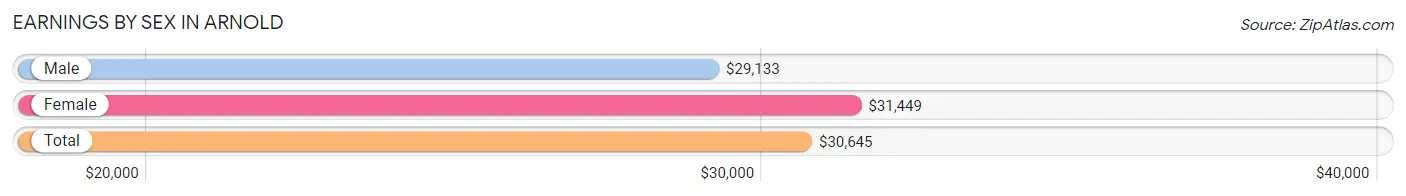
| Sex | Number | Average Earnings |
| Male | 975 (42.9%) | $29,133 |
| Female | 1,298 (57.1%) | $31,449 |
| Total | 2,273 (100.0%) | $30,645 |
Earnings by Sex by Income Bracket in Arnold
The most common earnings brackets in Arnold are $25,000 to $29,999 for men (111 | 11.4%) and $45,000 to $49,999 for women (200 | 15.4%).
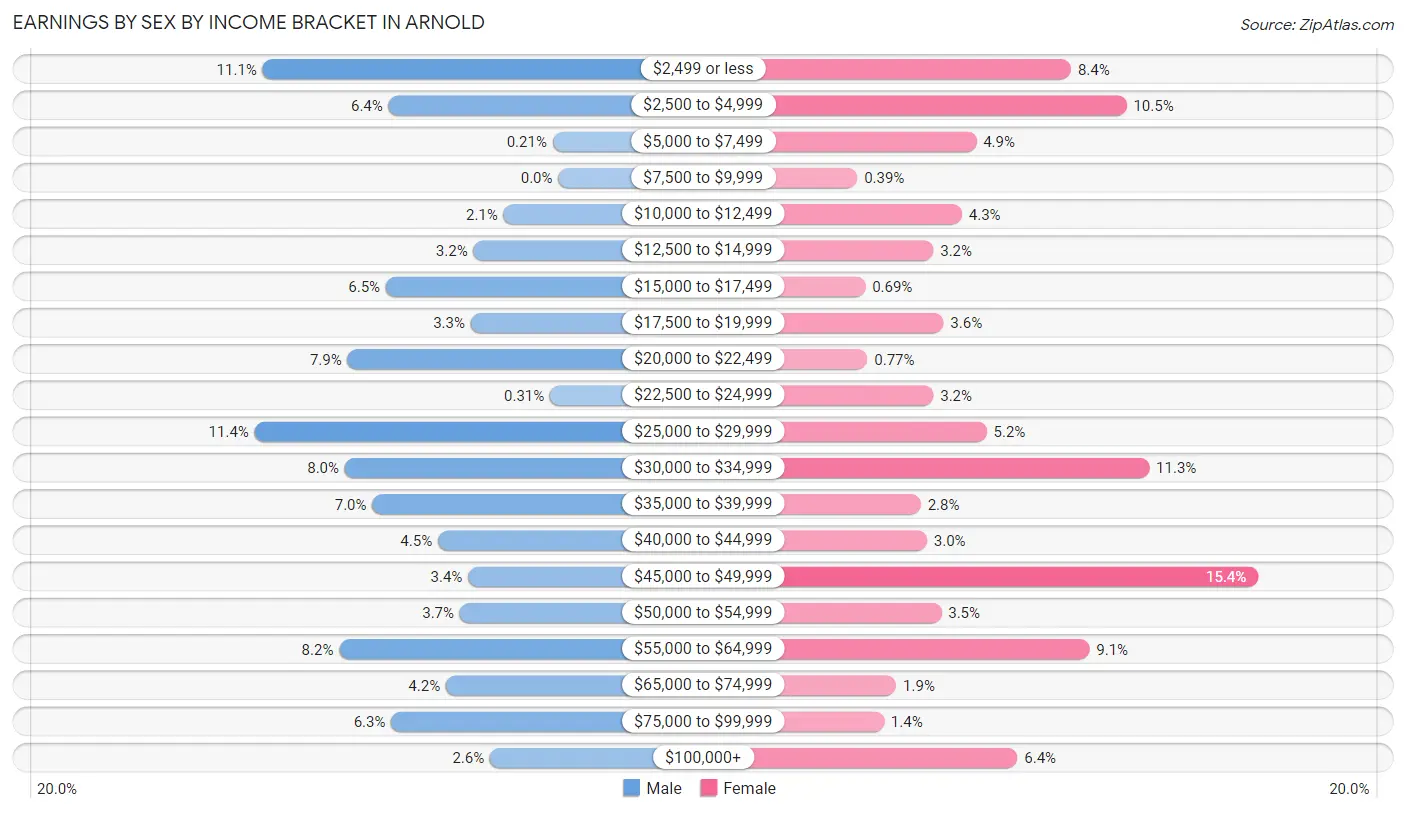
| Income | Male | Female |
| $2,499 or less | 108 (11.1%) | 109 (8.4%) |
| $2,500 to $4,999 | 62 (6.4%) | 136 (10.5%) |
| $5,000 to $7,499 | 2 (0.2%) | 63 (4.9%) |
| $7,500 to $9,999 | 0 (0.0%) | 5 (0.4%) |
| $10,000 to $12,499 | 20 (2.1%) | 56 (4.3%) |
| $12,500 to $14,999 | 31 (3.2%) | 42 (3.2%) |
| $15,000 to $17,499 | 63 (6.5%) | 9 (0.7%) |
| $17,500 to $19,999 | 32 (3.3%) | 47 (3.6%) |
| $20,000 to $22,499 | 77 (7.9%) | 10 (0.8%) |
| $22,500 to $24,999 | 3 (0.3%) | 42 (3.2%) |
| $25,000 to $29,999 | 111 (11.4%) | 68 (5.2%) |
| $30,000 to $34,999 | 78 (8.0%) | 147 (11.3%) |
| $35,000 to $39,999 | 68 (7.0%) | 36 (2.8%) |
| $40,000 to $44,999 | 44 (4.5%) | 39 (3.0%) |
| $45,000 to $49,999 | 33 (3.4%) | 200 (15.4%) |
| $50,000 to $54,999 | 36 (3.7%) | 46 (3.5%) |
| $55,000 to $64,999 | 80 (8.2%) | 118 (9.1%) |
| $65,000 to $74,999 | 41 (4.2%) | 24 (1.8%) |
| $75,000 to $99,999 | 61 (6.3%) | 18 (1.4%) |
| $100,000+ | 25 (2.6%) | 83 (6.4%) |
| Total | 975 (100.0%) | 1,298 (100.0%) |
Earnings by Sex by Educational Attainment in Arnold
Average earnings in Arnold are $32,375 for men and $33,531 for women, a difference of 3.5%. Men with an educational attainment of bachelor's degree enjoy the highest average annual earnings of $41,488, while those with graduate degree education earn the least with $2,499. Women with an educational attainment of bachelor's degree earn the most with the average annual earnings of $47,209, while those with college or associate's degree education have the smallest earnings of $29,884.
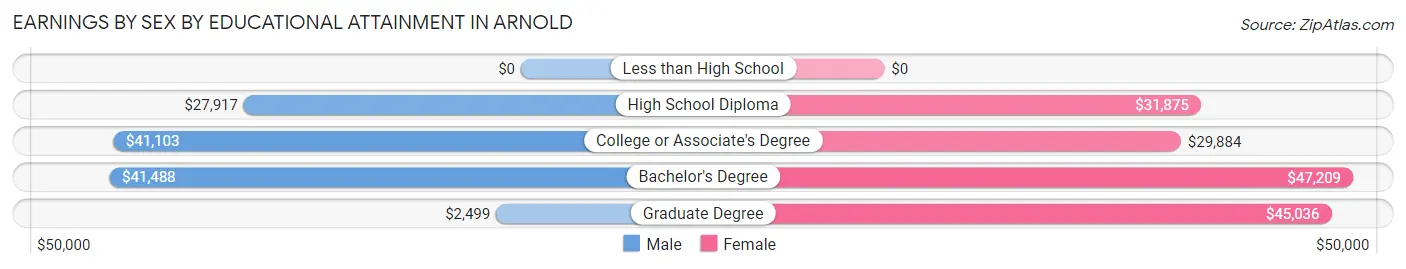
| Educational Attainment | Male Income | Female Income |
| Less than High School | - | - |
| High School Diploma | $27,917 | $31,875 |
| College or Associate's Degree | $41,103 | $29,884 |
| Bachelor's Degree | $41,488 | $47,209 |
| Graduate Degree | $2,499 | $45,036 |
| Total | $32,375 | $33,531 |
Family Income in Arnold
Family Income Brackets in Arnold
According to the Arnold family income data, there are 316 families falling into the $50,000 to $74,999 income range, which is the most common income bracket and makes up 28.0% of all families. Conversely, the $200,000+ income bracket is the least frequent group with only 2 families (0.2%) belonging to this category.
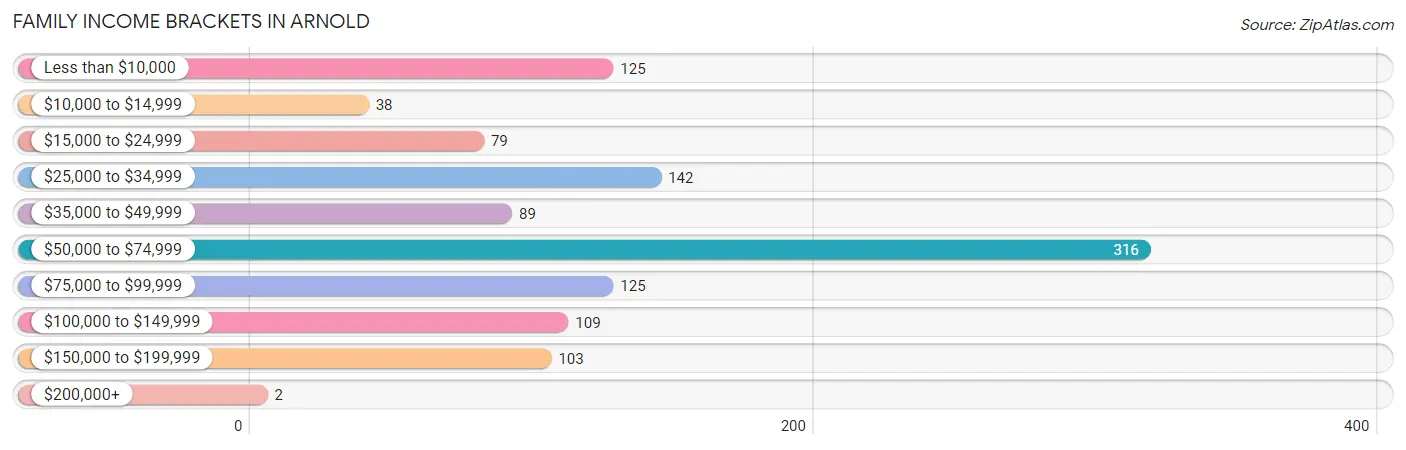
| Income Bracket | # Families | % Families |
| Less than $10,000 | 125 | 11.1% |
| $10,000 to $14,999 | 38 | 3.4% |
| $15,000 to $24,999 | 79 | 7.0% |
| $25,000 to $34,999 | 142 | 12.6% |
| $35,000 to $49,999 | 89 | 7.9% |
| $50,000 to $74,999 | 316 | 28.0% |
| $75,000 to $99,999 | 125 | 11.1% |
| $100,000 to $149,999 | 109 | 9.7% |
| $150,000 to $199,999 | 103 | 9.1% |
| $200,000+ | 2 | 0.2% |
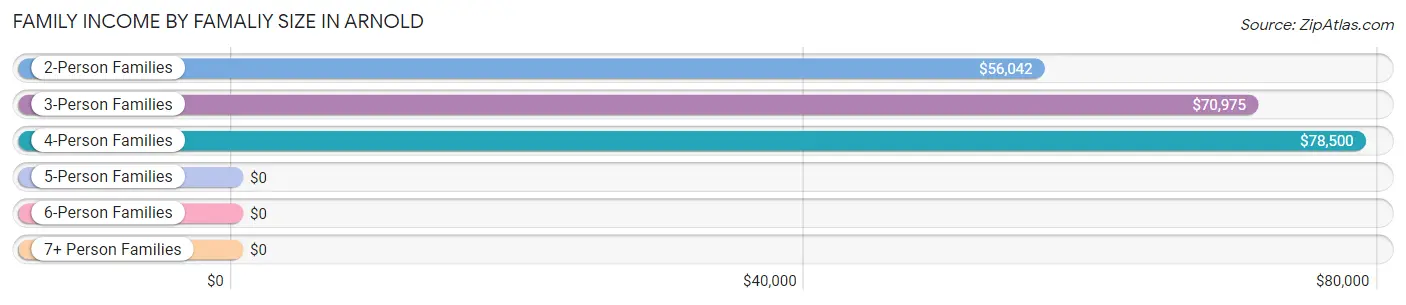
Family Income by Famaliy Size in Arnold
4-person families (104 | 9.2%) account for the highest median family income in Arnold with $78,500 per family, while 2-person families (567 | 50.3%) have the highest median income of $28,021 per family member.
| Income Bracket | # Families | Median Income |
| 2-Person Families | 567 (50.3%) | $56,042 |
| 3-Person Families | 298 (26.4%) | $70,975 |
| 4-Person Families | 104 (9.2%) | $78,500 |
| 5-Person Families | 72 (6.4%) | $0 |
| 6-Person Families | 73 (6.5%) | $0 |
| 7+ Person Families | 13 (1.1%) | $0 |
| Total | 1,127 (100.0%) | $63,458 |
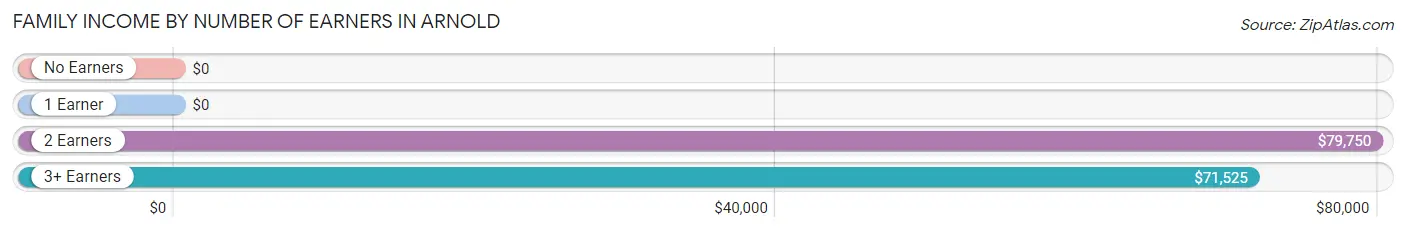
Family Income by Number of Earners in Arnold
| Number of Earners | # Families | Median Income |
| No Earners | 197 (17.5%) | $0 |
| 1 Earner | 431 (38.2%) | $0 |
| 2 Earners | 328 (29.1%) | $79,750 |
| 3+ Earners | 171 (15.2%) | $71,525 |
| Total | 1,127 (100.0%) | $63,458 |
Household Income in Arnold
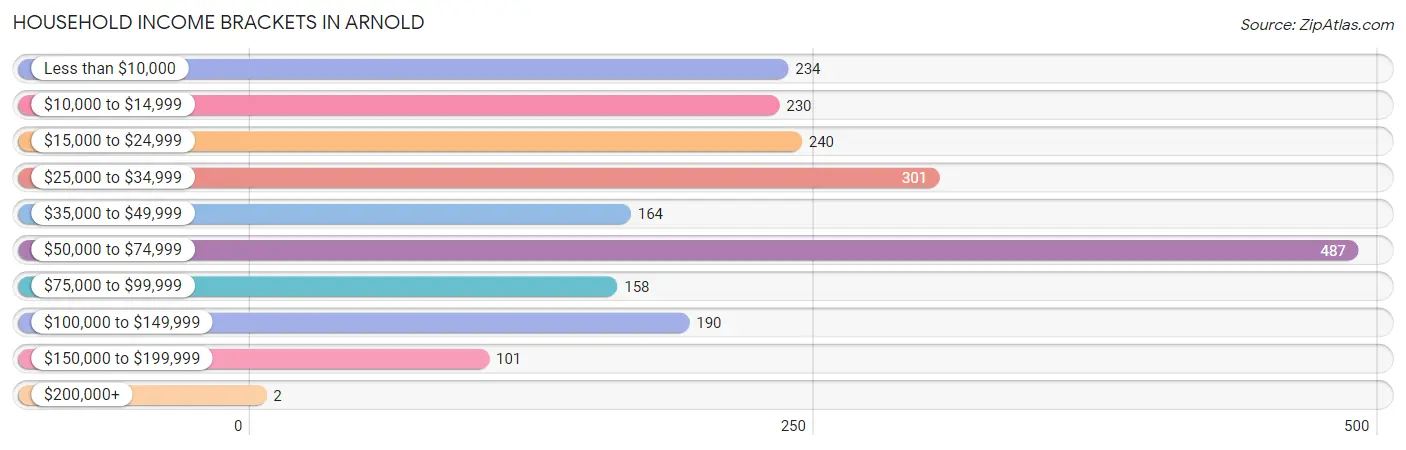
Household Income Brackets in Arnold
With 487 households falling in the category, the $50,000 to $74,999 income range is the most frequent in Arnold, accounting for 23.1% of all households. In contrast, only 2 households (0.1%) fall into the $200,000+ income bracket, making it the least populous group.
| Income Bracket | # Households | % Households |
| Less than $10,000 | 234 | 11.1% |
| $10,000 to $14,999 | 230 | 10.9% |
| $15,000 to $24,999 | 240 | 11.4% |
| $25,000 to $34,999 | 301 | 14.3% |
| $35,000 to $49,999 | 164 | 7.8% |
| $50,000 to $74,999 | 487 | 23.1% |
| $75,000 to $99,999 | 158 | 7.5% |
| $100,000 to $149,999 | 190 | 9.0% |
| $150,000 to $199,999 | 101 | 4.8% |
| $200,000+ | 2 | 0.1% |
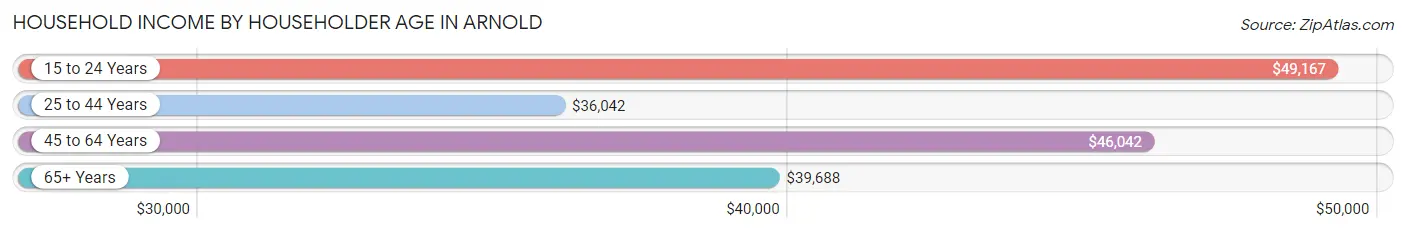
Household Income by Householder Age in Arnold
The median household income in Arnold is $38,150, with the highest median household income of $49,167 found in the 15 to 24 years age bracket for the primary householder. A total of 22 households (1.0%) fall into this category. Meanwhile, the 25 to 44 years age bracket for the primary householder has the lowest median household income of $36,042, with 491 households (23.3%) in this group.
| Income Bracket | # Households | Median Income |
| 15 to 24 Years | 22 (1.0%) | $49,167 |
| 25 to 44 Years | 491 (23.3%) | $36,042 |
| 45 to 64 Years | 999 (47.4%) | $46,042 |
| 65+ Years | 595 (28.2%) | $39,688 |
| Total | 2,107 (100.0%) | $38,150 |
Poverty in Arnold
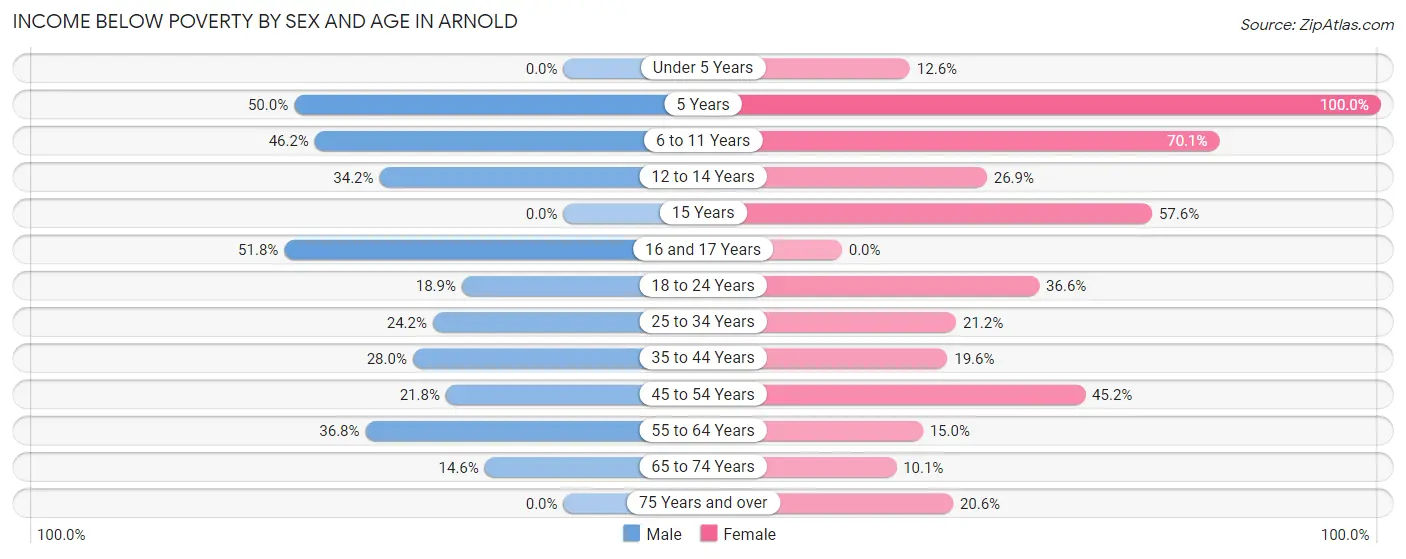
Income Below Poverty by Sex and Age in Arnold
With 25.3% poverty level for males and 27.2% for females among the residents of Arnold, 16 and 17 year old males and 5 year old females are the most vulnerable to poverty, with 57 males (51.8%) and 39 females (100.0%) in their respective age groups living below the poverty level.
| Age Bracket | Male | Female |
| Under 5 Years | 0 (0.0%) | 11 (12.6%) |
| 5 Years | 15 (50.0%) | 39 (100.0%) |
| 6 to 11 Years | 54 (46.2%) | 103 (70.1%) |
| 12 to 14 Years | 14 (34.2%) | 14 (26.9%) |
| 15 Years | 0 (0.0%) | 19 (57.6%) |
| 16 and 17 Years | 57 (51.8%) | 0 (0.0%) |
| 18 to 24 Years | 36 (18.9%) | 63 (36.6%) |
| 25 to 34 Years | 86 (24.2%) | 42 (21.2%) |
| 35 to 44 Years | 78 (28.0%) | 66 (19.6%) |
| 45 to 54 Years | 55 (21.8%) | 159 (45.2%) |
| 55 to 64 Years | 129 (36.7%) | 67 (15.0%) |
| 65 to 74 Years | 32 (14.6%) | 31 (10.1%) |
| 75 Years and over | 0 (0.0%) | 46 (20.6%) |
| Total | 556 (25.3%) | 660 (27.2%) |
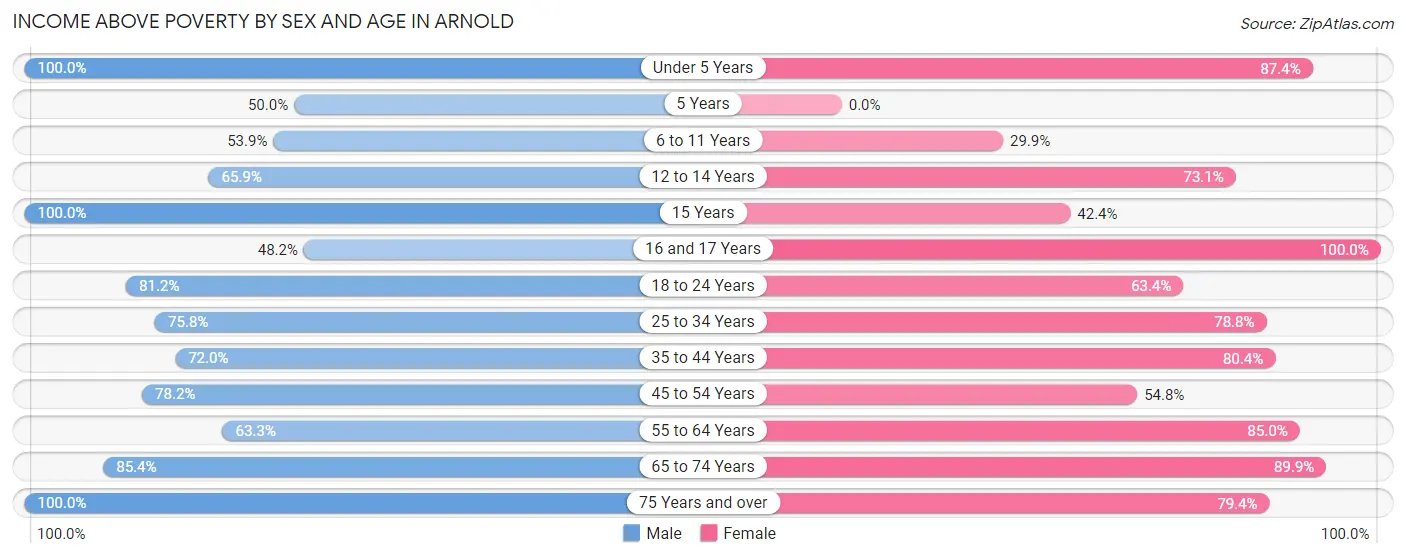
Income Above Poverty by Sex and Age in Arnold
According to the poverty statistics in Arnold, males aged under 5 years and females aged 16 and 17 years are the age groups that are most secure financially, with 100.0% of males and 100.0% of females in these age groups living above the poverty line.
| Age Bracket | Male | Female |
| Under 5 Years | 115 (100.0%) | 76 (87.4%) |
| 5 Years | 15 (50.0%) | 0 (0.0%) |
| 6 to 11 Years | 63 (53.8%) | 44 (29.9%) |
| 12 to 14 Years | 27 (65.8%) | 38 (73.1%) |
| 15 Years | 14 (100.0%) | 14 (42.4%) |
| 16 and 17 Years | 53 (48.2%) | 36 (100.0%) |
| 18 to 24 Years | 155 (81.1%) | 109 (63.4%) |
| 25 to 34 Years | 269 (75.8%) | 156 (78.8%) |
| 35 to 44 Years | 201 (72.0%) | 271 (80.4%) |
| 45 to 54 Years | 197 (78.2%) | 193 (54.8%) |
| 55 to 64 Years | 222 (63.2%) | 379 (85.0%) |
| 65 to 74 Years | 187 (85.4%) | 276 (89.9%) |
| 75 Years and over | 124 (100.0%) | 177 (79.4%) |
| Total | 1,642 (74.7%) | 1,769 (72.8%) |
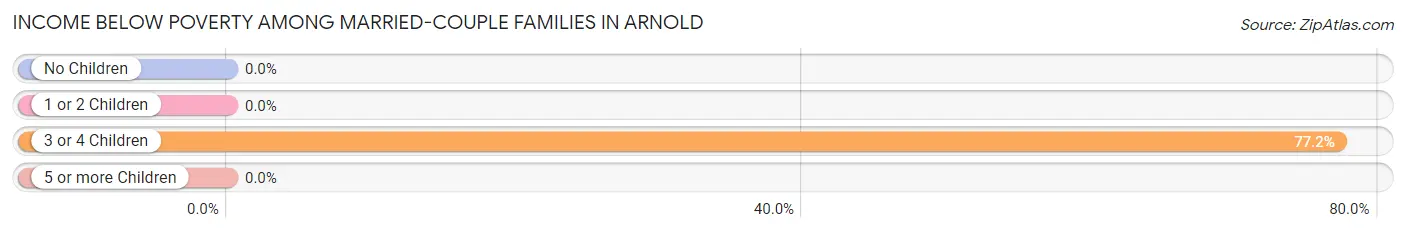
Income Below Poverty Among Married-Couple Families in Arnold
The poverty statistics for married-couple families in Arnold show that 9.1% or 44 of the total 484 families live below the poverty line. Families with 3 or 4 children have the highest poverty rate of 77.2%, comprising of 44 families. On the other hand, families with no children have the lowest poverty rate of 0.0%, which includes 0 families.
| Children | Above Poverty | Below Poverty |
| No Children | 322 (100.0%) | 0 (0.0%) |
| 1 or 2 Children | 105 (100.0%) | 0 (0.0%) |
| 3 or 4 Children | 13 (22.8%) | 44 (77.2%) |
| 5 or more Children | 0 (0.0%) | 0 (0.0%) |
| Total | 440 (90.9%) | 44 (9.1%) |
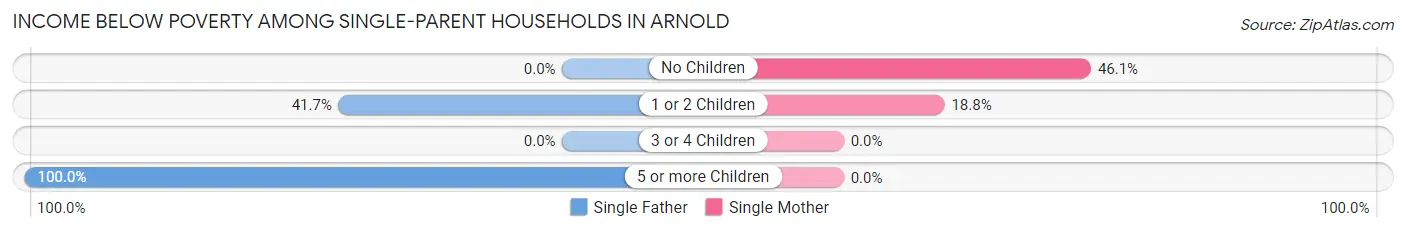
Income Below Poverty Among Single-Parent Households in Arnold
According to the poverty data in Arnold, 28.2% or 49 single-father households and 32.8% or 154 single-mother households are living below the poverty line. Among single-father households, those with 5 or more children have the highest poverty rate, with 19 households (100.0%) experiencing poverty. Likewise, among single-mother households, those with no children have the highest poverty rate, with 117 households (46.1%) falling below the poverty line.
| Children | Single Father | Single Mother |
| No Children | 0 (0.0%) | 117 (46.1%) |
| 1 or 2 Children | 30 (41.7%) | 37 (18.8%) |
| 3 or 4 Children | 0 (0.0%) | 0 (0.0%) |
| 5 or more Children | 19 (100.0%) | 0 (0.0%) |
| Total | 49 (28.2%) | 154 (32.8%) |
Income Below Poverty Among Married-Couple vs Single-Parent Households in Arnold
The poverty data for Arnold shows that 44 of the married-couple family households (9.1%) and 203 of the single-parent households (31.6%) are living below the poverty level. Within the married-couple family households, those with 3 or 4 children have the highest poverty rate, with 44 households (77.2%) falling below the poverty line. Among the single-parent households, those with 5 or more children have the highest poverty rate, with 19 household (100.0%) living below poverty.
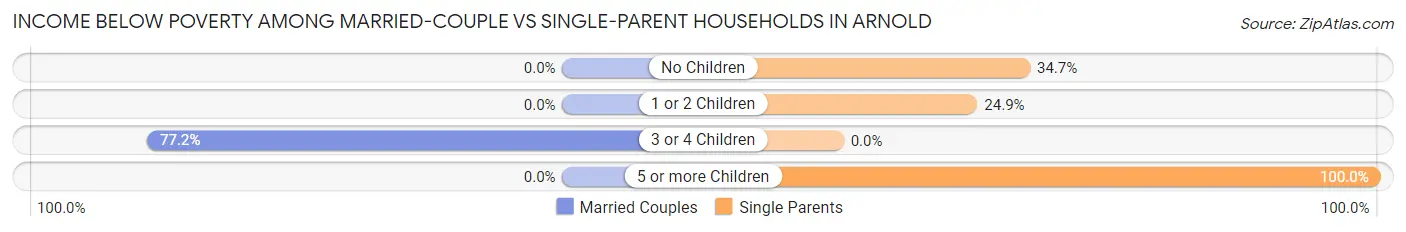
| Children | Married-Couple Families | Single-Parent Households |
| No Children | 0 (0.0%) | 117 (34.7%) |
| 1 or 2 Children | 0 (0.0%) | 67 (24.9%) |
| 3 or 4 Children | 44 (77.2%) | 0 (0.0%) |
| 5 or more Children | 0 (0.0%) | 19 (100.0%) |
| Total | 44 (9.1%) | 203 (31.6%) |
Employment Characteristics in Arnold
Employment by Class of Employer in Arnold
Among the 1,939 employed individuals in Arnold, private company employees (1,396 | 72.0%), not-for-profit organizations (346 | 17.8%), and local government employees (53 | 2.7%) make up the most common classes of employment.
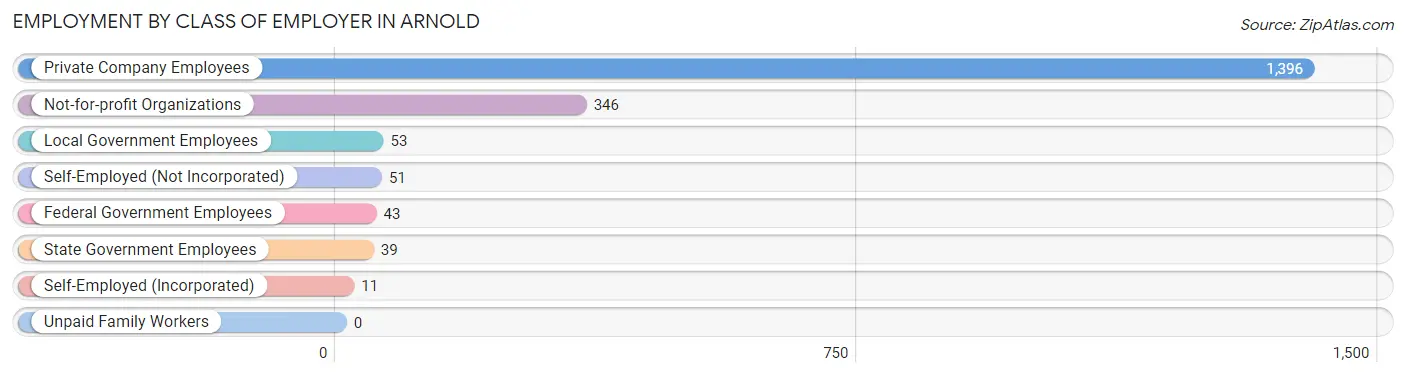
| Employer Class | # Employees | % Employees |
| Private Company Employees | 1,396 | 72.0% |
| Self-Employed (Incorporated) | 11 | 0.6% |
| Self-Employed (Not Incorporated) | 51 | 2.6% |
| Not-for-profit Organizations | 346 | 17.8% |
| Local Government Employees | 53 | 2.7% |
| State Government Employees | 39 | 2.0% |
| Federal Government Employees | 43 | 2.2% |
| Unpaid Family Workers | 0 | 0.0% |
| Total | 1,939 | 100.0% |
Employment Status by Age in Arnold
According to the labor force statistics for Arnold, out of the total population over 16 years of age (3,968), 57.5% or 2,282 individuals are in the labor force, with 13.9% or 317 of them unemployed. The age group with the highest labor force participation rate is 25 to 29 years, with 88.8% or 174 individuals in the labor force. Within the labor force, the 16 to 19 years age range has the highest percentage of unemployed individuals, with 38.6% or 39 of them being unemployed.
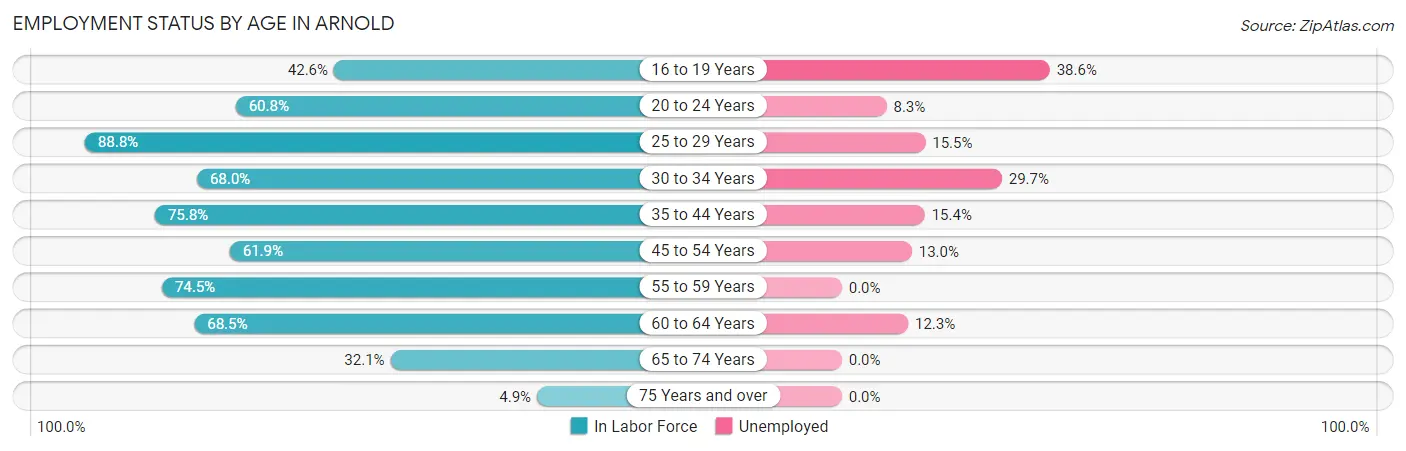
| Age Bracket | In Labor Force | Unemployed |
| 16 to 19 Years | 101 (42.6%) | 39 (38.6%) |
| 20 to 24 Years | 169 (60.8%) | 14 (8.3%) |
| 25 to 29 Years | 174 (88.8%) | 27 (15.5%) |
| 30 to 34 Years | 246 (68.0%) | 73 (29.7%) |
| 35 to 44 Years | 467 (75.8%) | 72 (15.4%) |
| 45 to 54 Years | 377 (61.9%) | 49 (13.0%) |
| 55 to 59 Years | 213 (74.5%) | 0 (0.0%) |
| 60 to 64 Years | 350 (68.5%) | 43 (12.3%) |
| 65 to 74 Years | 169 (32.1%) | 0 (0.0%) |
| 75 Years and over | 17 (4.9%) | 0 (0.0%) |
| Total | 2,282 (57.5%) | 317 (13.9%) |
Employment Status by Educational Attainment in Arnold
According to labor force statistics for Arnold, 70.8% of individuals (1,827) out of the total population between 25 and 64 years of age (2,580) are in the labor force, with 14.4% or 263 of them being unemployed. The group with the highest labor force participation rate are those with the educational attainment of bachelor's degree or higher, with 80.5% or 364 individuals in the labor force. Within the labor force, individuals with high school diploma education have the highest percentage of unemployment, with 26.4% or 205 of them being unemployed.
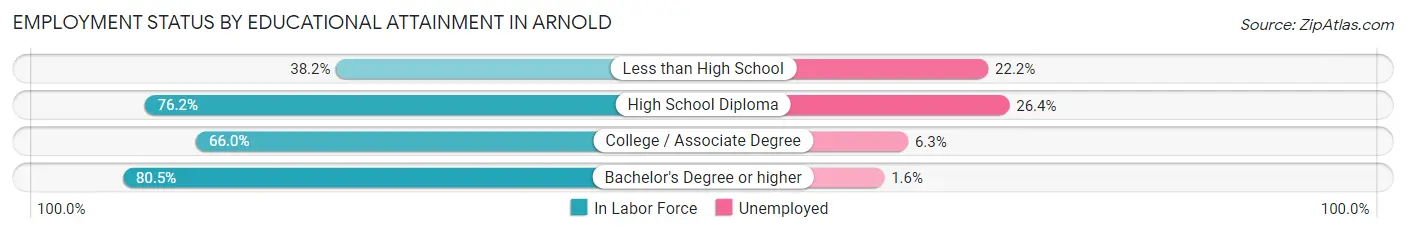
| Educational Attainment | In Labor Force | Unemployed |
| Less than High School | 63 (38.2%) | 37 (22.2%) |
| High School Diploma | 776 (76.2%) | 269 (26.4%) |
| College / Associate Degree | 624 (66.0%) | 60 (6.3%) |
| Bachelor's Degree or higher | 364 (80.5%) | 7 (1.6%) |
| Total | 1,827 (70.8%) | 372 (14.4%) |
Employment Occupations by Sex in Arnold
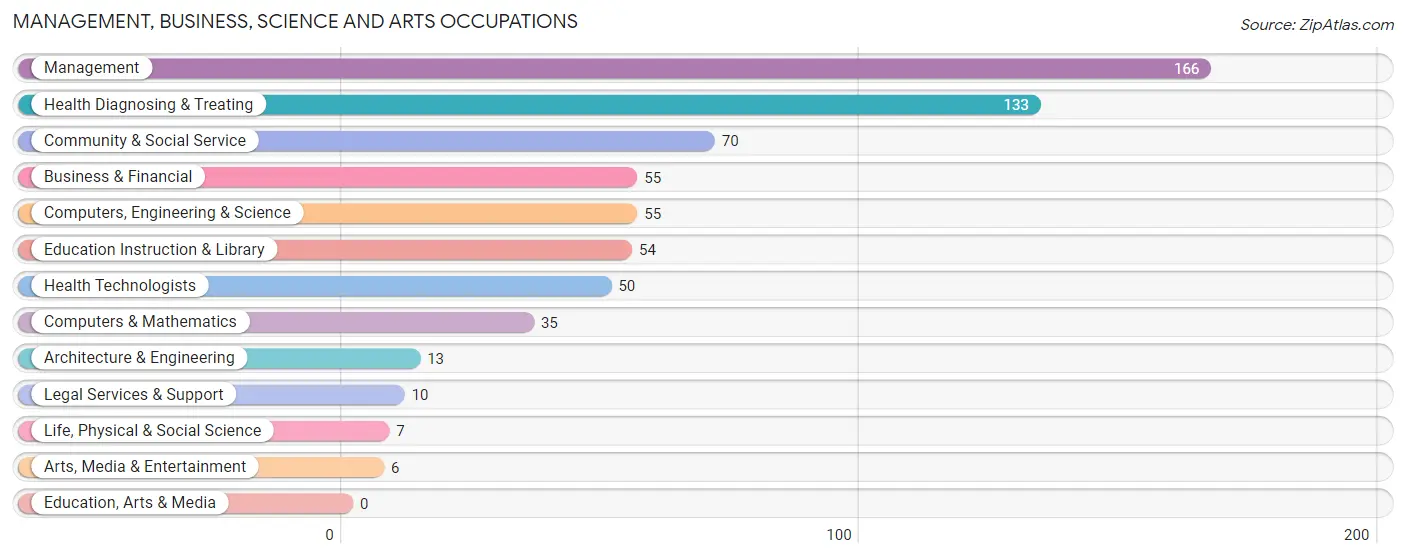
Management, Business, Science and Arts Occupations
The most common Management, Business, Science and Arts occupations in Arnold are Management (166 | 8.4%), Health Diagnosing & Treating (133 | 6.8%), Community & Social Service (70 | 3.6%), Business & Financial (55 | 2.8%), and Computers, Engineering & Science (55 | 2.8%).
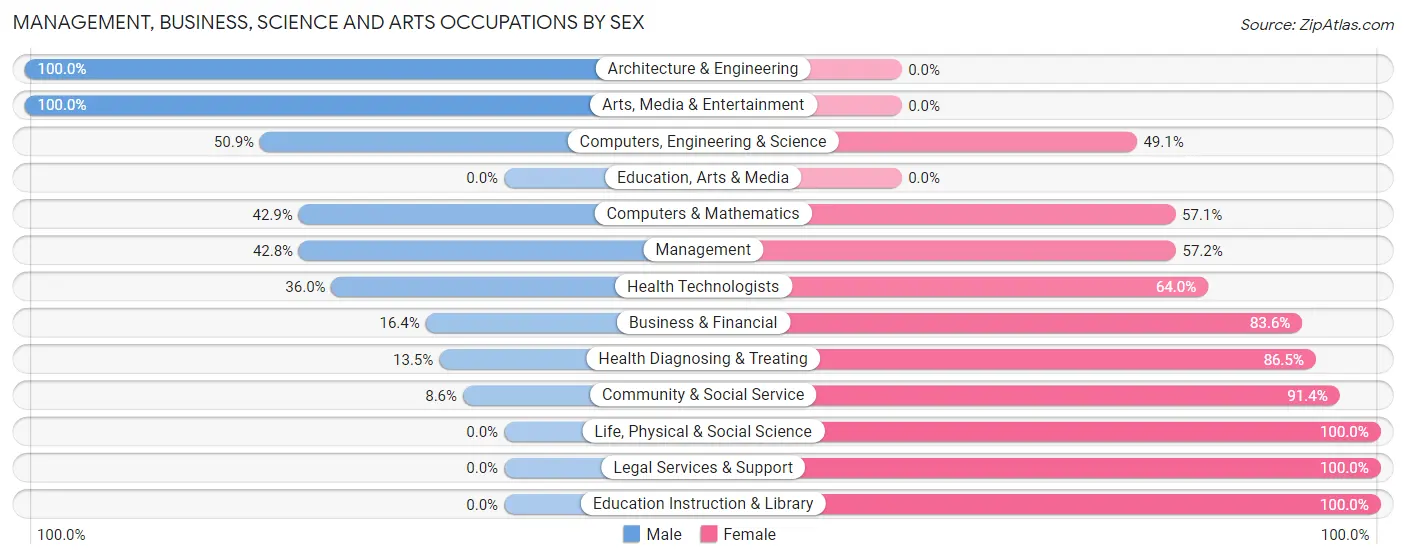
Management, Business, Science and Arts Occupations by Sex
Within the Management, Business, Science and Arts occupations in Arnold, the most male-oriented occupations are Architecture & Engineering (100.0%), Arts, Media & Entertainment (100.0%), and Computers, Engineering & Science (50.9%), while the most female-oriented occupations are Life, Physical & Social Science (100.0%), Legal Services & Support (100.0%), and Education Instruction & Library (100.0%).
| Occupation | Male | Female |
| Management | 71 (42.8%) | 95 (57.2%) |
| Business & Financial | 9 (16.4%) | 46 (83.6%) |
| Computers, Engineering & Science | 28 (50.9%) | 27 (49.1%) |
| Computers & Mathematics | 15 (42.9%) | 20 (57.1%) |
| Architecture & Engineering | 13 (100.0%) | 0 (0.0%) |
| Life, Physical & Social Science | 0 (0.0%) | 7 (100.0%) |
| Community & Social Service | 6 (8.6%) | 64 (91.4%) |
| Education, Arts & Media | 0 (0.0%) | 0 (0.0%) |
| Legal Services & Support | 0 (0.0%) | 10 (100.0%) |
| Education Instruction & Library | 0 (0.0%) | 54 (100.0%) |
| Arts, Media & Entertainment | 6 (100.0%) | 0 (0.0%) |
| Health Diagnosing & Treating | 18 (13.5%) | 115 (86.5%) |
| Health Technologists | 18 (36.0%) | 32 (64.0%) |
| Total (Category) | 132 (27.6%) | 347 (72.4%) |
| Total (Overall) | 799 (40.6%) | 1,167 (59.4%) |
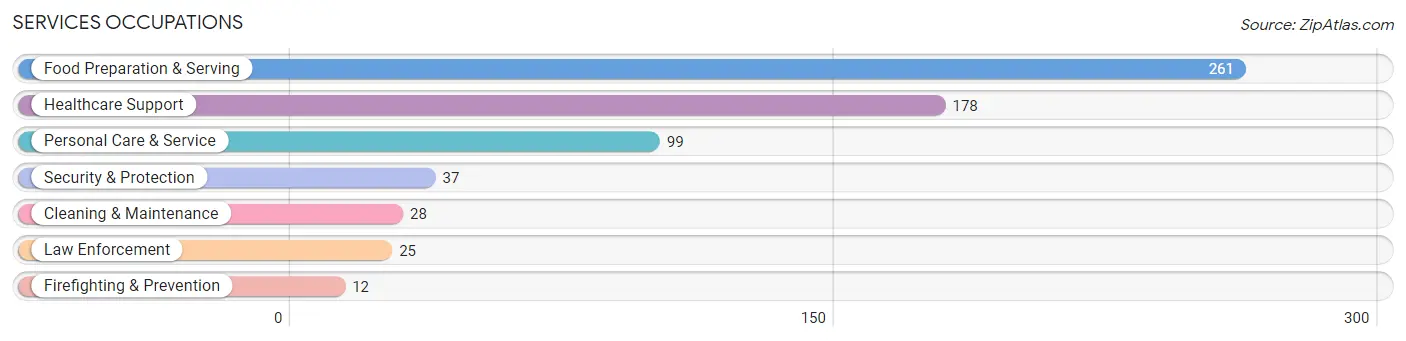
Services Occupations
The most common Services occupations in Arnold are Food Preparation & Serving (261 | 13.3%), Healthcare Support (178 | 9.0%), Personal Care & Service (99 | 5.0%), Security & Protection (37 | 1.9%), and Cleaning & Maintenance (28 | 1.4%).
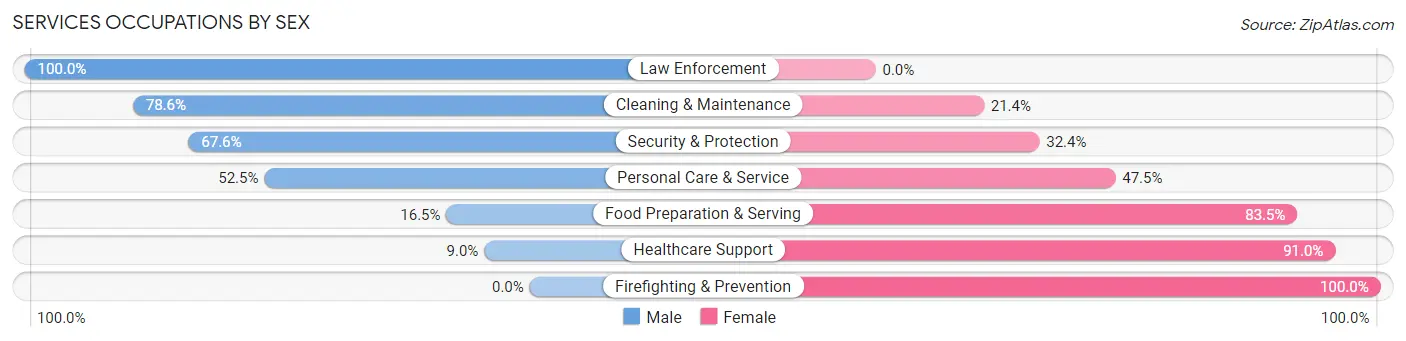
Services Occupations by Sex
Within the Services occupations in Arnold, the most male-oriented occupations are Law Enforcement (100.0%), Cleaning & Maintenance (78.6%), and Security & Protection (67.6%), while the most female-oriented occupations are Firefighting & Prevention (100.0%), Healthcare Support (91.0%), and Food Preparation & Serving (83.5%).
| Occupation | Male | Female |
| Healthcare Support | 16 (9.0%) | 162 (91.0%) |
| Security & Protection | 25 (67.6%) | 12 (32.4%) |
| Firefighting & Prevention | 0 (0.0%) | 12 (100.0%) |
| Law Enforcement | 25 (100.0%) | 0 (0.0%) |
| Food Preparation & Serving | 43 (16.5%) | 218 (83.5%) |
| Cleaning & Maintenance | 22 (78.6%) | 6 (21.4%) |
| Personal Care & Service | 52 (52.5%) | 47 (47.5%) |
| Total (Category) | 158 (26.2%) | 445 (73.8%) |
| Total (Overall) | 799 (40.6%) | 1,167 (59.4%) |
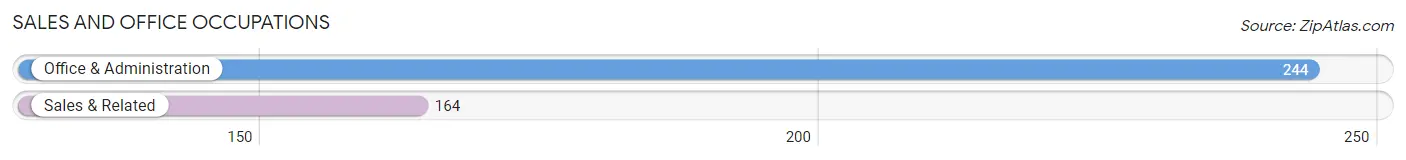
Sales and Office Occupations
The most common Sales and Office occupations in Arnold are Office & Administration (244 | 12.4%), and Sales & Related (164 | 8.3%).
Sales and Office Occupations by Sex
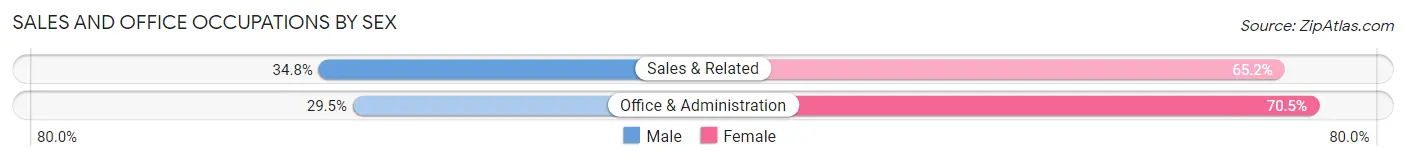
| Occupation | Male | Female |
| Sales & Related | 57 (34.8%) | 107 (65.2%) |
| Office & Administration | 72 (29.5%) | 172 (70.5%) |
| Total (Category) | 129 (31.6%) | 279 (68.4%) |
| Total (Overall) | 799 (40.6%) | 1,167 (59.4%) |
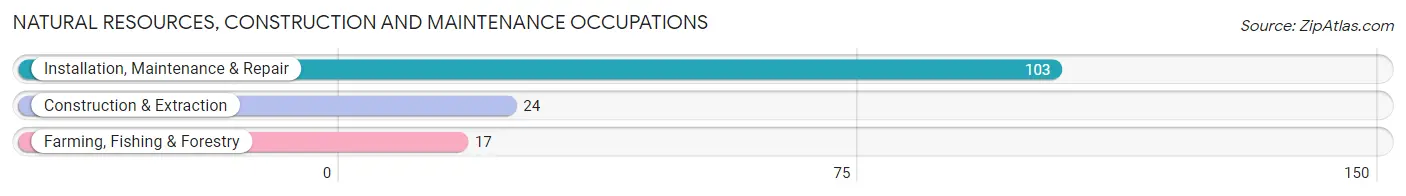
Natural Resources, Construction and Maintenance Occupations
The most common Natural Resources, Construction and Maintenance occupations in Arnold are Installation, Maintenance & Repair (103 | 5.2%), Construction & Extraction (24 | 1.2%), and Farming, Fishing & Forestry (17 | 0.9%).
Natural Resources, Construction and Maintenance Occupations by Sex
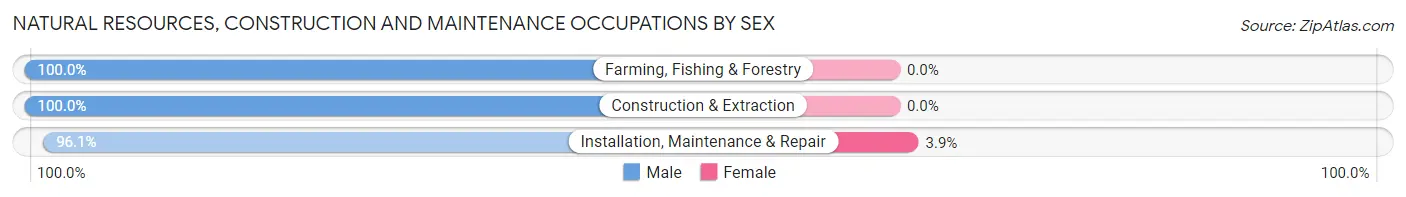
| Occupation | Male | Female |
| Farming, Fishing & Forestry | 17 (100.0%) | 0 (0.0%) |
| Construction & Extraction | 24 (100.0%) | 0 (0.0%) |
| Installation, Maintenance & Repair | 99 (96.1%) | 4 (3.9%) |
| Total (Category) | 140 (97.2%) | 4 (2.8%) |
| Total (Overall) | 799 (40.6%) | 1,167 (59.4%) |
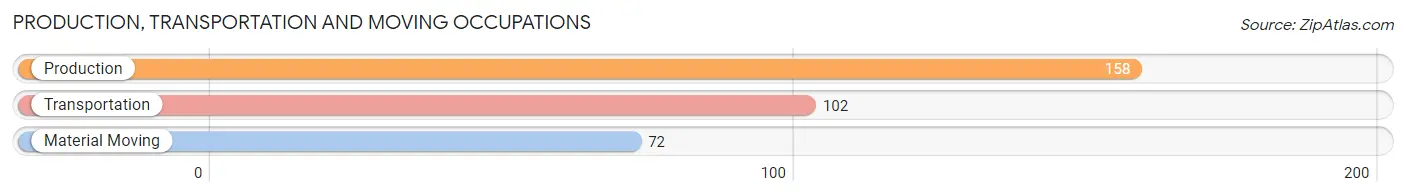
Production, Transportation and Moving Occupations
The most common Production, Transportation and Moving occupations in Arnold are Production (158 | 8.0%), Transportation (102 | 5.2%), and Material Moving (72 | 3.7%).
Production, Transportation and Moving Occupations by Sex
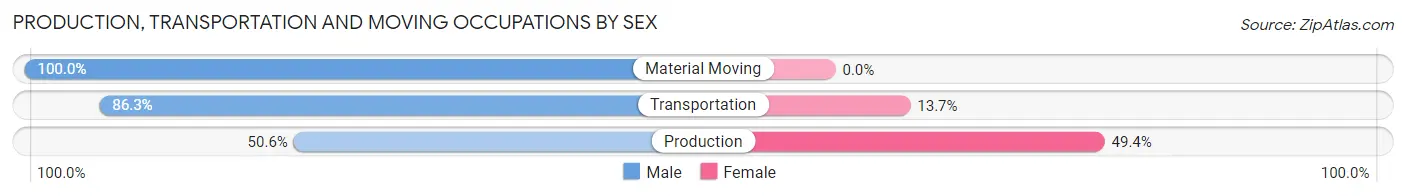
| Occupation | Male | Female |
| Production | 80 (50.6%) | 78 (49.4%) |
| Transportation | 88 (86.3%) | 14 (13.7%) |
| Material Moving | 72 (100.0%) | 0 (0.0%) |
| Total (Category) | 240 (72.3%) | 92 (27.7%) |
| Total (Overall) | 799 (40.6%) | 1,167 (59.4%) |
Employment Industries by Sex in Arnold
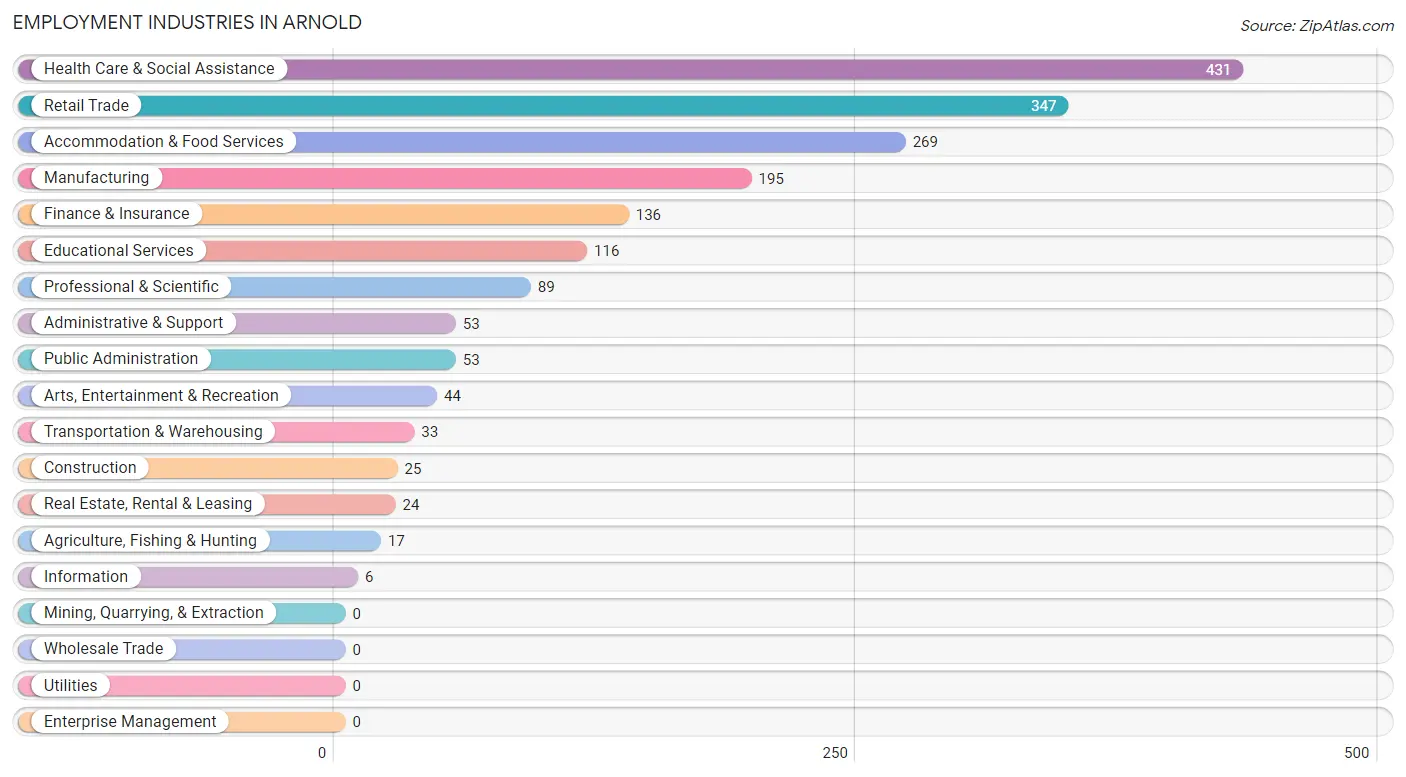
Employment Industries in Arnold
The major employment industries in Arnold include Health Care & Social Assistance (431 | 21.9%), Retail Trade (347 | 17.6%), Accommodation & Food Services (269 | 13.7%), Manufacturing (195 | 9.9%), and Finance & Insurance (136 | 6.9%).
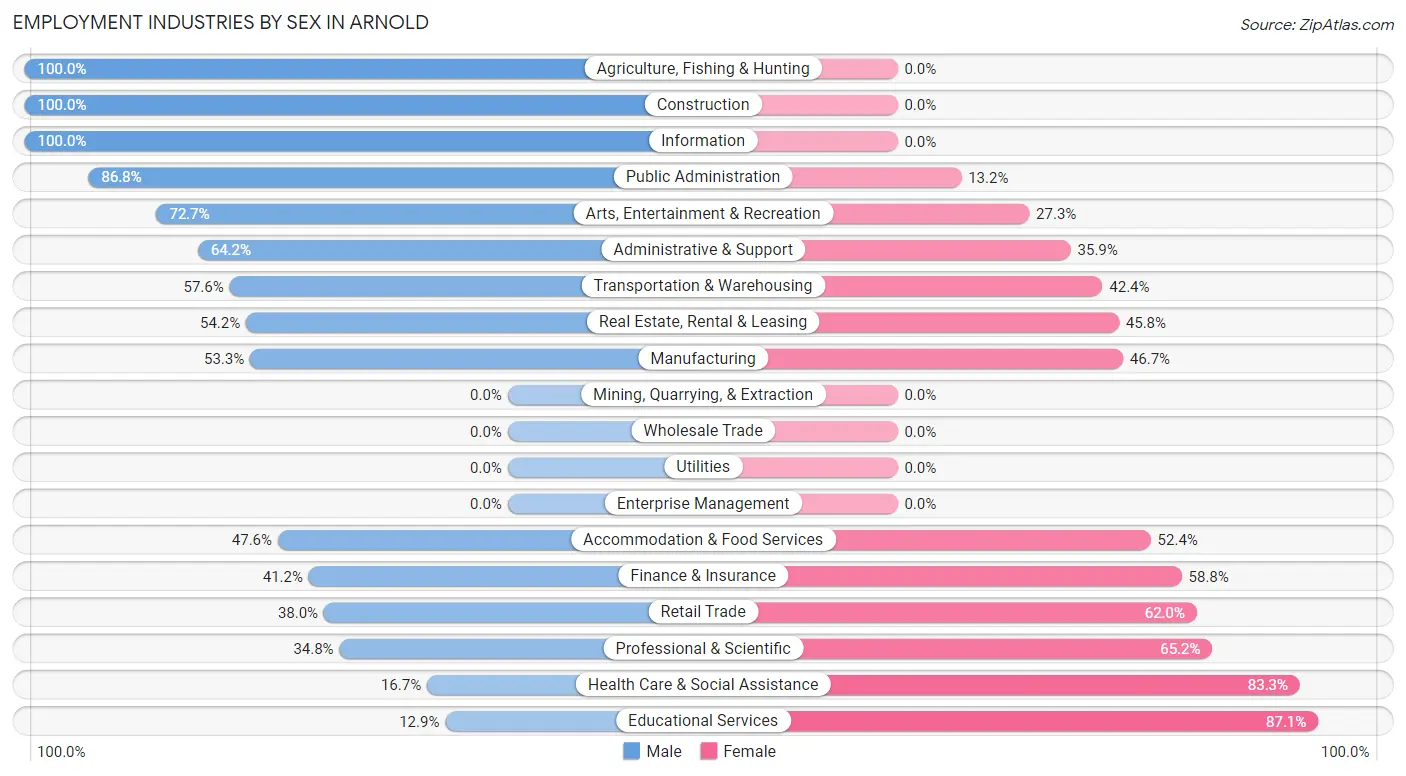
Employment Industries by Sex in Arnold
The Arnold industries that see more men than women are Agriculture, Fishing & Hunting (100.0%), Construction (100.0%), and Information (100.0%), whereas the industries that tend to have a higher number of women are Educational Services (87.1%), Health Care & Social Assistance (83.3%), and Professional & Scientific (65.2%).
| Industry | Male | Female |
| Agriculture, Fishing & Hunting | 17 (100.0%) | 0 (0.0%) |
| Mining, Quarrying, & Extraction | 0 (0.0%) | 0 (0.0%) |
| Construction | 25 (100.0%) | 0 (0.0%) |
| Manufacturing | 104 (53.3%) | 91 (46.7%) |
| Wholesale Trade | 0 (0.0%) | 0 (0.0%) |
| Retail Trade | 132 (38.0%) | 215 (62.0%) |
| Transportation & Warehousing | 19 (57.6%) | 14 (42.4%) |
| Utilities | 0 (0.0%) | 0 (0.0%) |
| Information | 6 (100.0%) | 0 (0.0%) |
| Finance & Insurance | 56 (41.2%) | 80 (58.8%) |
| Real Estate, Rental & Leasing | 13 (54.2%) | 11 (45.8%) |
| Professional & Scientific | 31 (34.8%) | 58 (65.2%) |
| Enterprise Management | 0 (0.0%) | 0 (0.0%) |
| Administrative & Support | 34 (64.1%) | 19 (35.8%) |
| Educational Services | 15 (12.9%) | 101 (87.1%) |
| Health Care & Social Assistance | 72 (16.7%) | 359 (83.3%) |
| Arts, Entertainment & Recreation | 32 (72.7%) | 12 (27.3%) |
| Accommodation & Food Services | 128 (47.6%) | 141 (52.4%) |
| Public Administration | 46 (86.8%) | 7 (13.2%) |
| Total | 799 (40.6%) | 1,167 (59.4%) |
Education in Arnold
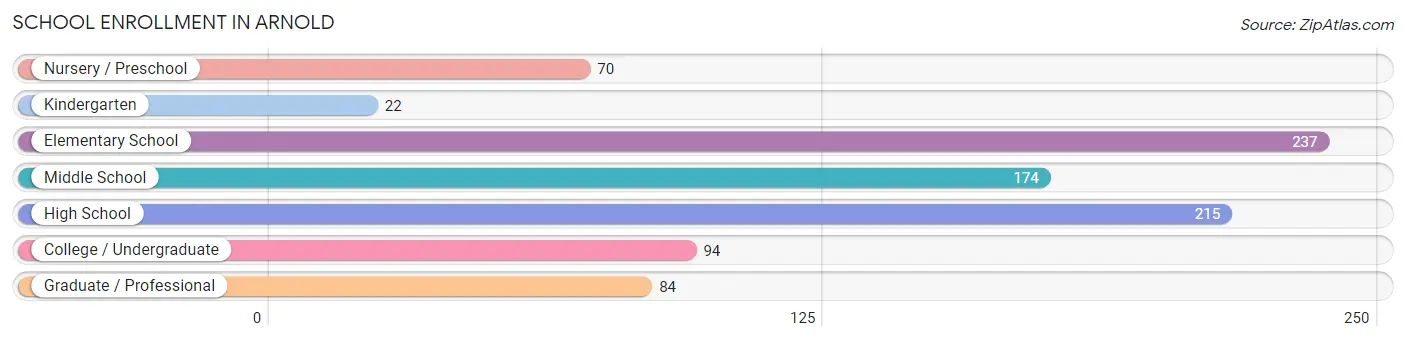
School Enrollment in Arnold
The most common levels of schooling among the 896 students in Arnold are elementary school (237 | 26.5%), high school (215 | 24.0%), and middle school (174 | 19.4%).
| School Level | # Students | % Students |
| Nursery / Preschool | 70 | 7.8% |
| Kindergarten | 22 | 2.5% |
| Elementary School | 237 | 26.5% |
| Middle School | 174 | 19.4% |
| High School | 215 | 24.0% |
| College / Undergraduate | 94 | 10.5% |
| Graduate / Professional | 84 | 9.4% |
| Total | 896 | 100.0% |
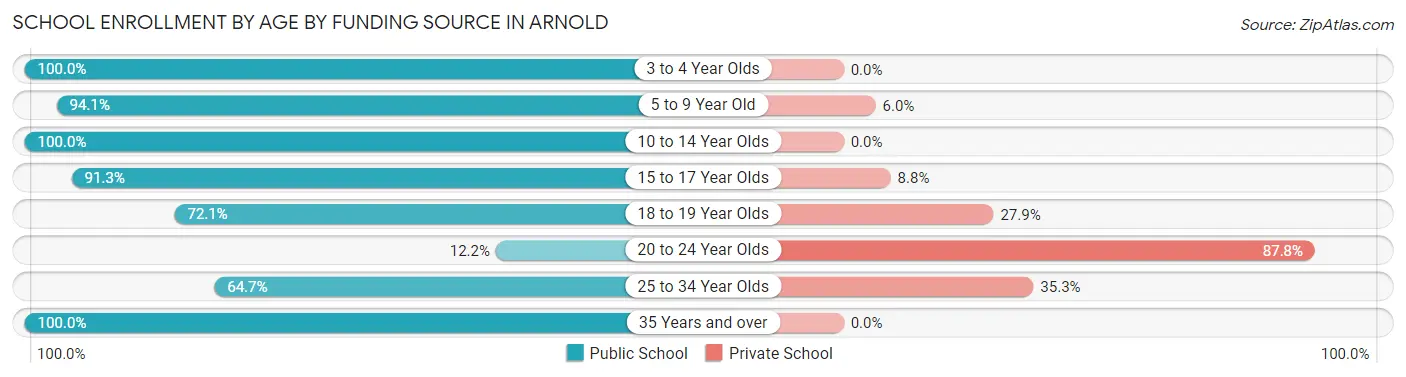
School Enrollment by Age by Funding Source in Arnold
Out of a total of 896 students who are enrolled in schools in Arnold, 125 (14.0%) attend a private institution, while the remaining 771 (86.0%) are enrolled in public schools. The age group of 20 to 24 year olds has the highest likelihood of being enrolled in private schools, with 43 (87.8% in the age bracket) enrolled. Conversely, the age group of 3 to 4 year olds has the lowest likelihood of being enrolled in a private school, with 31 (100.0% in the age bracket) attending a public institution.
| Age Bracket | Public School | Private School |
| 3 to 4 Year Olds | 31 (100.0%) | 0 (0.0%) |
| 5 to 9 Year Old | 237 (94.1%) | 15 (5.9%) |
| 10 to 14 Year Olds | 232 (100.0%) | 0 (0.0%) |
| 15 to 17 Year Olds | 146 (91.2%) | 14 (8.7%) |
| 18 to 19 Year Olds | 31 (72.1%) | 12 (27.9%) |
| 20 to 24 Year Olds | 6 (12.2%) | 43 (87.8%) |
| 25 to 34 Year Olds | 75 (64.7%) | 41 (35.3%) |
| 35 Years and over | 13 (100.0%) | 0 (0.0%) |
| Total | 771 (86.0%) | 125 (14.0%) |
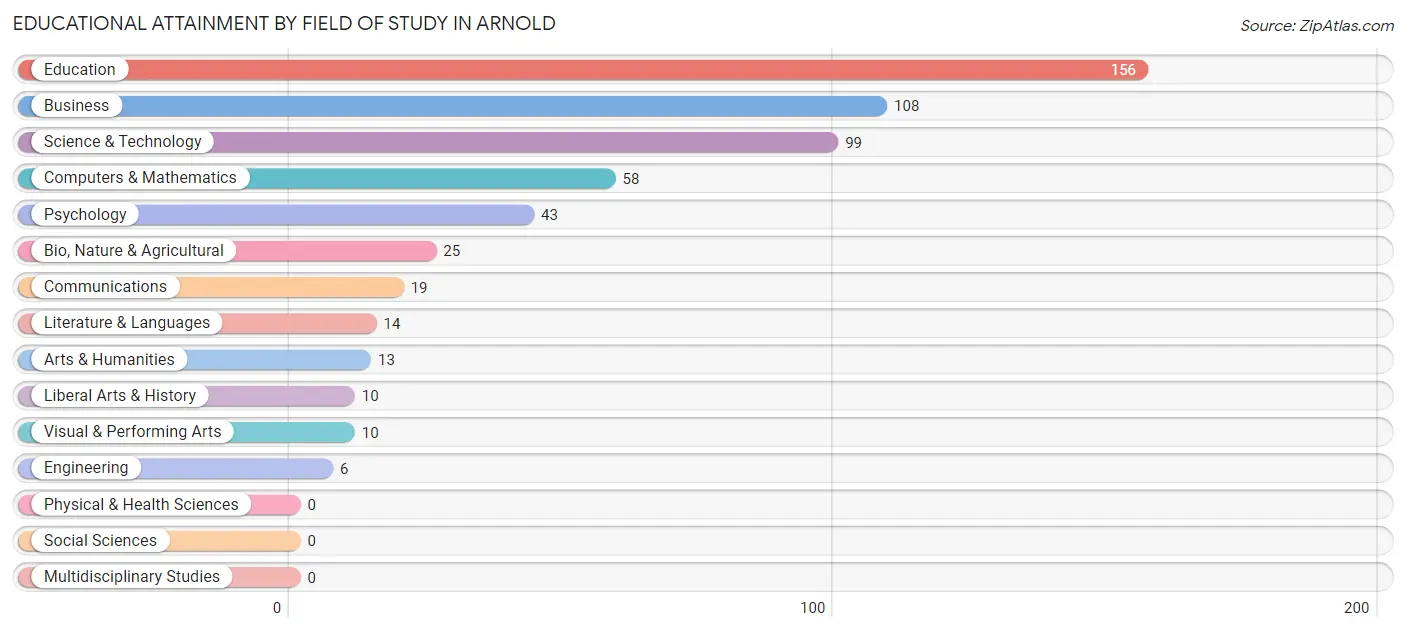
Educational Attainment by Field of Study in Arnold
Education (156 | 27.8%), business (108 | 19.3%), science & technology (99 | 17.6%), computers & mathematics (58 | 10.3%), and psychology (43 | 7.7%) are the most common fields of study among 561 individuals in Arnold who have obtained a bachelor's degree or higher.
| Field of Study | # Graduates | % Graduates |
| Computers & Mathematics | 58 | 10.3% |
| Bio, Nature & Agricultural | 25 | 4.5% |
| Physical & Health Sciences | 0 | 0.0% |
| Psychology | 43 | 7.7% |
| Social Sciences | 0 | 0.0% |
| Engineering | 6 | 1.1% |
| Multidisciplinary Studies | 0 | 0.0% |
| Science & Technology | 99 | 17.6% |
| Business | 108 | 19.3% |
| Education | 156 | 27.8% |
| Literature & Languages | 14 | 2.5% |
| Liberal Arts & History | 10 | 1.8% |
| Visual & Performing Arts | 10 | 1.8% |
| Communications | 19 | 3.4% |
| Arts & Humanities | 13 | 2.3% |
| Total | 561 | 100.0% |
Transportation & Commute in Arnold
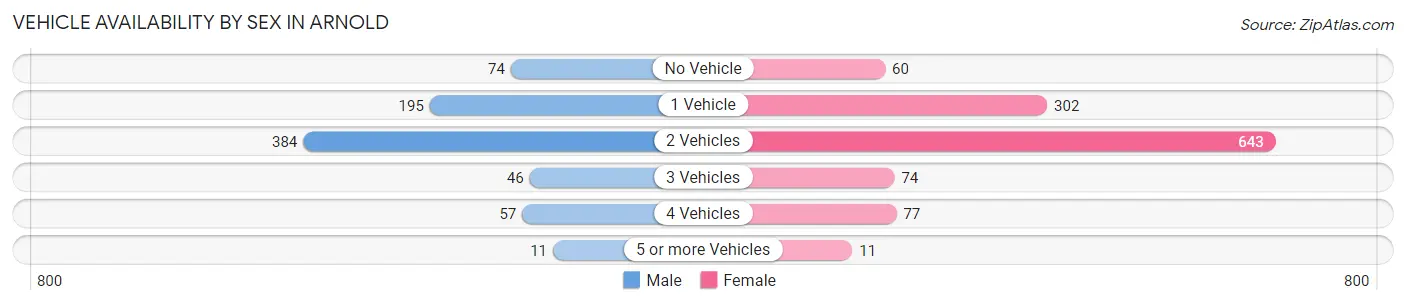
Vehicle Availability by Sex in Arnold
The most prevalent vehicle ownership categories in Arnold are males with 2 vehicles (384, accounting for 50.1%) and females with 2 vehicles (643, making up 32.9%).
| Vehicles Available | Male | Female |
| No Vehicle | 74 (9.7%) | 60 (5.1%) |
| 1 Vehicle | 195 (25.4%) | 302 (25.9%) |
| 2 Vehicles | 384 (50.1%) | 643 (55.1%) |
| 3 Vehicles | 46 (6.0%) | 74 (6.3%) |
| 4 Vehicles | 57 (7.4%) | 77 (6.6%) |
| 5 or more Vehicles | 11 (1.4%) | 11 (0.9%) |
| Total | 767 (100.0%) | 1,167 (100.0%) |
Commute Time in Arnold
The most frequently occuring commute durations in Arnold are 15 to 19 minutes (374 commuters, 21.1%), 20 to 24 minutes (284 commuters, 16.0%), and 5 to 9 minutes (248 commuters, 14.0%).
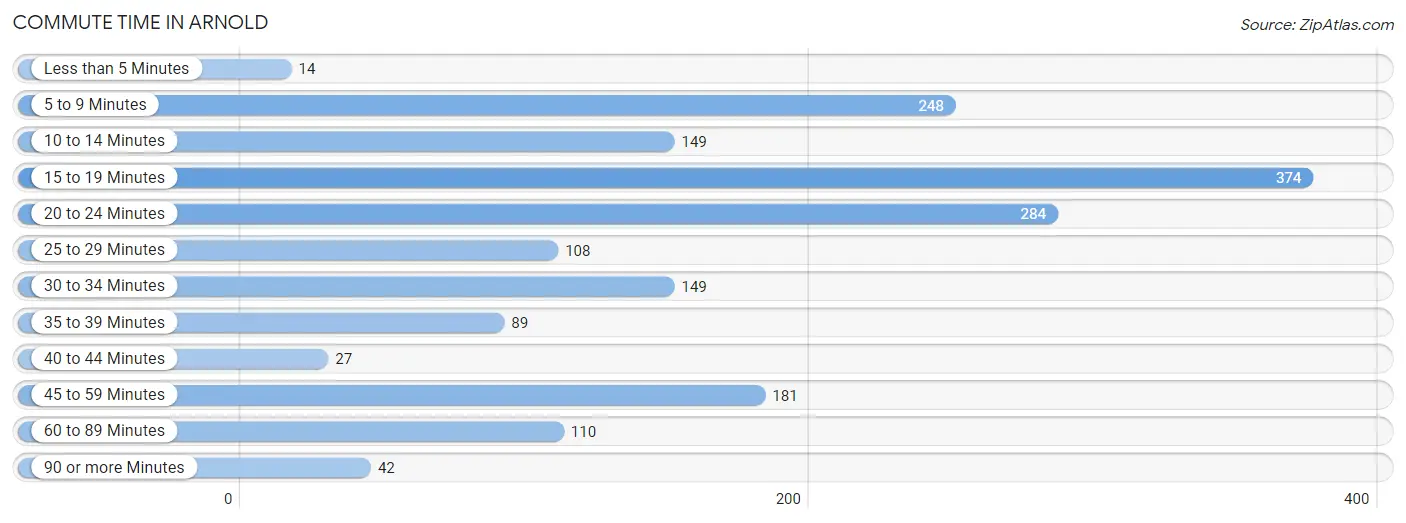
| Commute Time | # Commuters | % Commuters |
| Less than 5 Minutes | 14 | 0.8% |
| 5 to 9 Minutes | 248 | 14.0% |
| 10 to 14 Minutes | 149 | 8.4% |
| 15 to 19 Minutes | 374 | 21.1% |
| 20 to 24 Minutes | 284 | 16.0% |
| 25 to 29 Minutes | 108 | 6.1% |
| 30 to 34 Minutes | 149 | 8.4% |
| 35 to 39 Minutes | 89 | 5.0% |
| 40 to 44 Minutes | 27 | 1.5% |
| 45 to 59 Minutes | 181 | 10.2% |
| 60 to 89 Minutes | 110 | 6.2% |
| 90 or more Minutes | 42 | 2.4% |
Commute Time by Sex in Arnold
The most common commute times in Arnold are 5 to 9 minutes (143 commuters, 21.4%) for males and 15 to 19 minutes (244 commuters, 22.0%) for females.
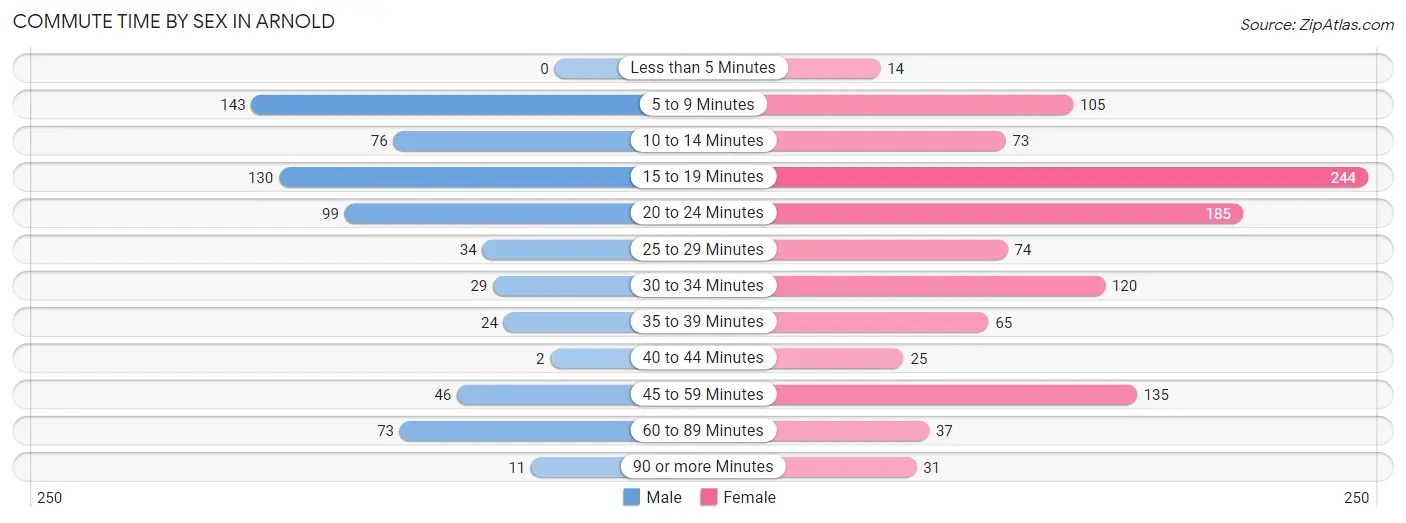
| Commute Time | Male | Female |
| Less than 5 Minutes | 0 (0.0%) | 14 (1.3%) |
| 5 to 9 Minutes | 143 (21.4%) | 105 (9.5%) |
| 10 to 14 Minutes | 76 (11.4%) | 73 (6.6%) |
| 15 to 19 Minutes | 130 (19.5%) | 244 (22.0%) |
| 20 to 24 Minutes | 99 (14.8%) | 185 (16.7%) |
| 25 to 29 Minutes | 34 (5.1%) | 74 (6.7%) |
| 30 to 34 Minutes | 29 (4.3%) | 120 (10.8%) |
| 35 to 39 Minutes | 24 (3.6%) | 65 (5.9%) |
| 40 to 44 Minutes | 2 (0.3%) | 25 (2.3%) |
| 45 to 59 Minutes | 46 (6.9%) | 135 (12.2%) |
| 60 to 89 Minutes | 73 (10.9%) | 37 (3.3%) |
| 90 or more Minutes | 11 (1.7%) | 31 (2.8%) |
Time of Departure to Work by Sex in Arnold
The most frequent times of departure to work in Arnold are 6:30 AM to 6:59 AM (155, 23.2%) for males and 7:00 AM to 7:29 AM (464, 41.9%) for females.
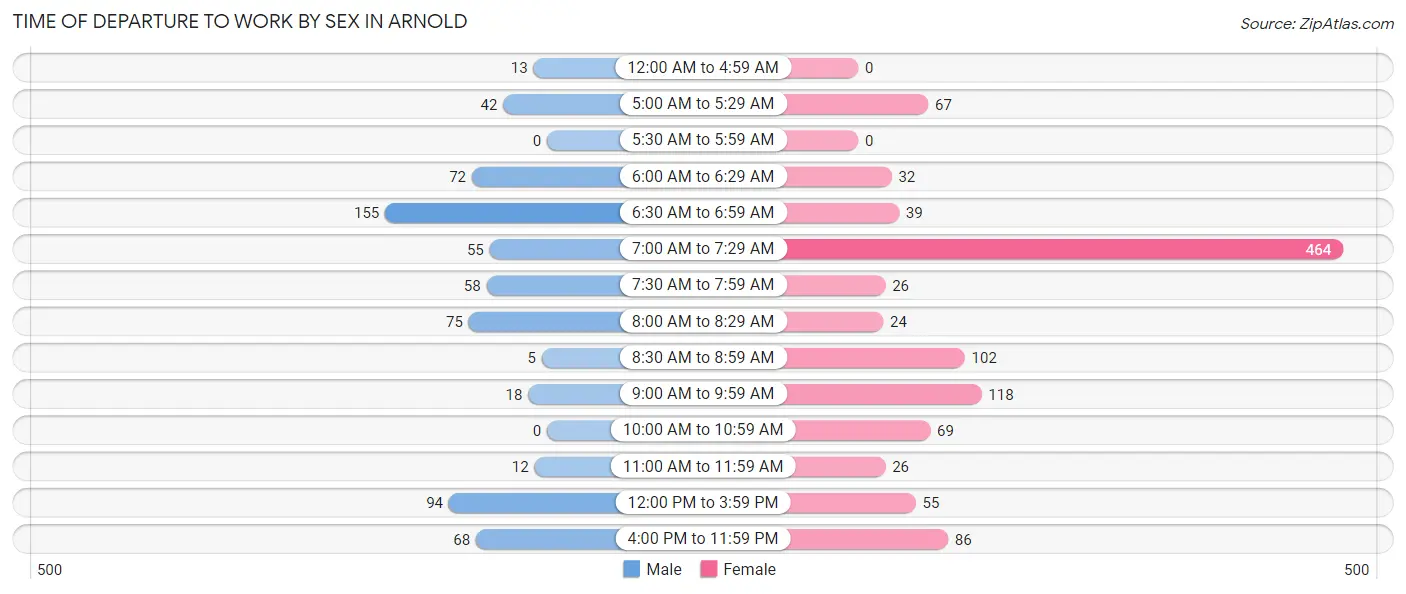
| Time of Departure | Male | Female |
| 12:00 AM to 4:59 AM | 13 (1.9%) | 0 (0.0%) |
| 5:00 AM to 5:29 AM | 42 (6.3%) | 67 (6.0%) |
| 5:30 AM to 5:59 AM | 0 (0.0%) | 0 (0.0%) |
| 6:00 AM to 6:29 AM | 72 (10.8%) | 32 (2.9%) |
| 6:30 AM to 6:59 AM | 155 (23.2%) | 39 (3.5%) |
| 7:00 AM to 7:29 AM | 55 (8.3%) | 464 (41.9%) |
| 7:30 AM to 7:59 AM | 58 (8.7%) | 26 (2.4%) |
| 8:00 AM to 8:29 AM | 75 (11.2%) | 24 (2.2%) |
| 8:30 AM to 8:59 AM | 5 (0.7%) | 102 (9.2%) |
| 9:00 AM to 9:59 AM | 18 (2.7%) | 118 (10.6%) |
| 10:00 AM to 10:59 AM | 0 (0.0%) | 69 (6.2%) |
| 11:00 AM to 11:59 AM | 12 (1.8%) | 26 (2.4%) |
| 12:00 PM to 3:59 PM | 94 (14.1%) | 55 (5.0%) |
| 4:00 PM to 11:59 PM | 68 (10.2%) | 86 (7.8%) |
| Total | 667 (100.0%) | 1,108 (100.0%) |
Housing Occupancy in Arnold
Occupancy by Ownership in Arnold
Of the total 2,107 dwellings in Arnold, owner-occupied units account for 1,207 (57.3%), while renter-occupied units make up 900 (42.7%).
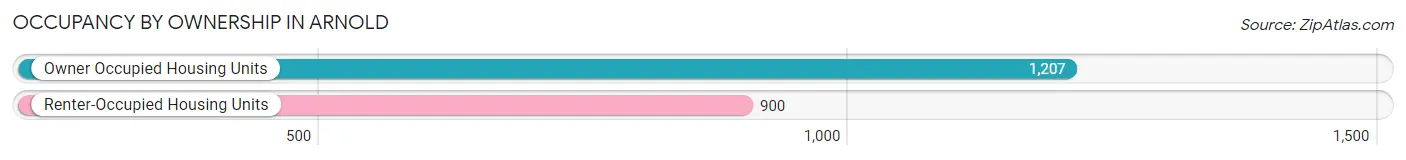
| Occupancy | # Housing Units | % Housing Units |
| Owner Occupied Housing Units | 1,207 | 57.3% |
| Renter-Occupied Housing Units | 900 | 42.7% |
| Total Occupied Housing Units | 2,107 | 100.0% |
Occupancy by Household Size in Arnold
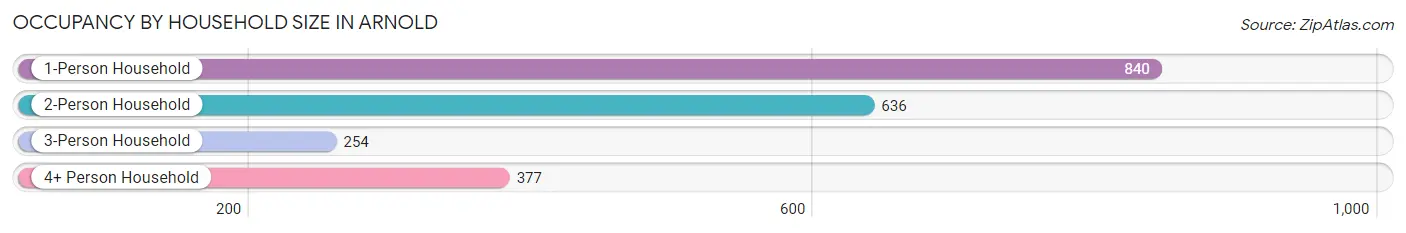
| Household Size | # Housing Units | % Housing Units |
| 1-Person Household | 840 | 39.9% |
| 2-Person Household | 636 | 30.2% |
| 3-Person Household | 254 | 12.1% |
| 4+ Person Household | 377 | 17.9% |
| Total Housing Units | 2,107 | 100.0% |
Occupancy by Ownership by Household Size in Arnold
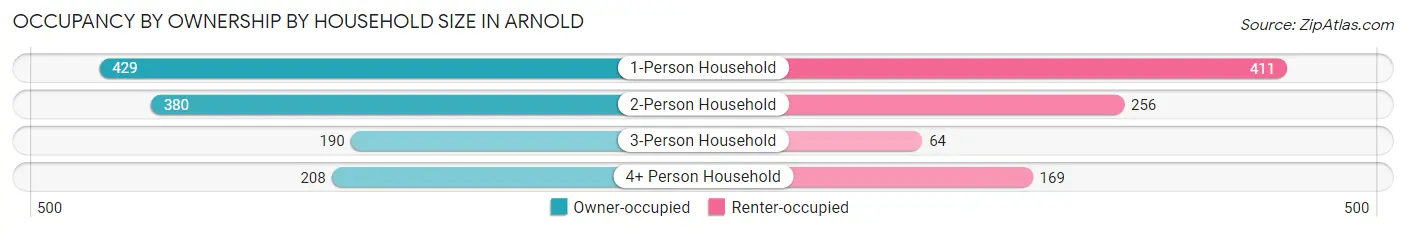
| Household Size | Owner-occupied | Renter-occupied |
| 1-Person Household | 429 (51.1%) | 411 (48.9%) |
| 2-Person Household | 380 (59.8%) | 256 (40.3%) |
| 3-Person Household | 190 (74.8%) | 64 (25.2%) |
| 4+ Person Household | 208 (55.2%) | 169 (44.8%) |
| Total Housing Units | 1,207 (57.3%) | 900 (42.7%) |
Occupancy by Educational Attainment in Arnold
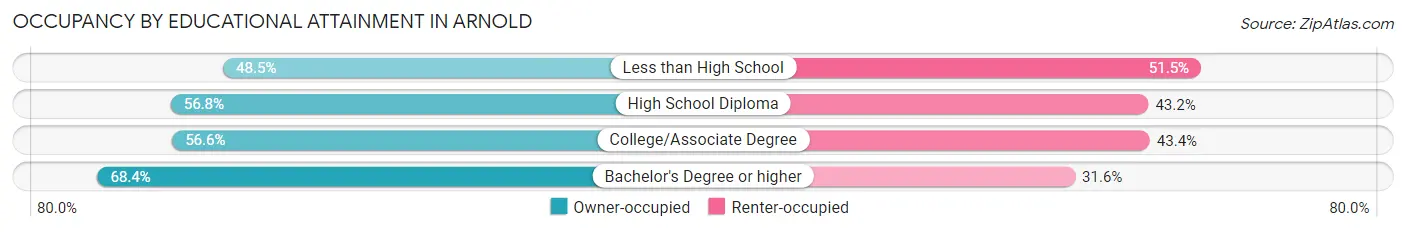
| Household Size | Owner-occupied | Renter-occupied |
| Less than High School | 97 (48.5%) | 103 (51.5%) |
| High School Diploma | 530 (56.8%) | 403 (43.2%) |
| College/Associate Degree | 413 (56.6%) | 317 (43.4%) |
| Bachelor's Degree or higher | 167 (68.4%) | 77 (31.6%) |
Occupancy by Age of Householder in Arnold
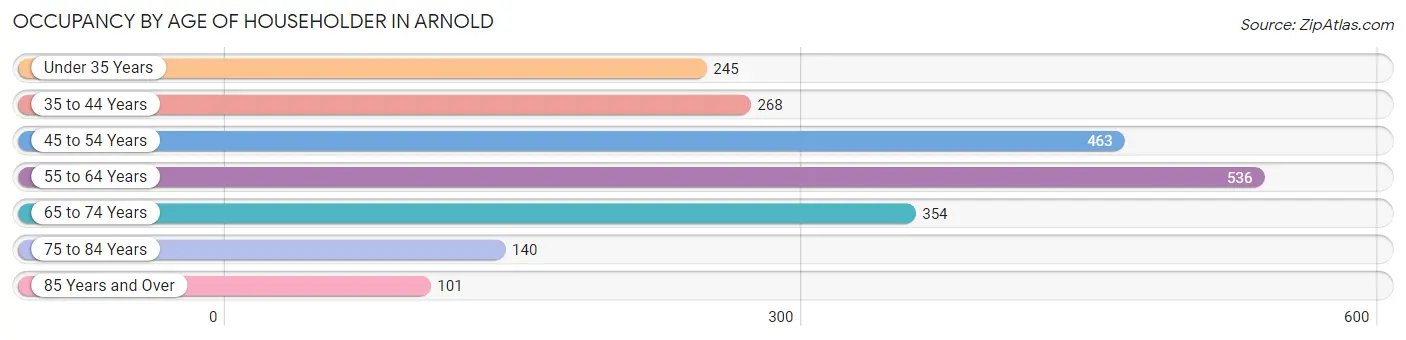
| Age Bracket | # Households | % Households |
| Under 35 Years | 245 | 11.6% |
| 35 to 44 Years | 268 | 12.7% |
| 45 to 54 Years | 463 | 22.0% |
| 55 to 64 Years | 536 | 25.4% |
| 65 to 74 Years | 354 | 16.8% |
| 75 to 84 Years | 140 | 6.6% |
| 85 Years and Over | 101 | 4.8% |
| Total | 2,107 | 100.0% |
Housing Finances in Arnold
Median Income by Occupancy in Arnold
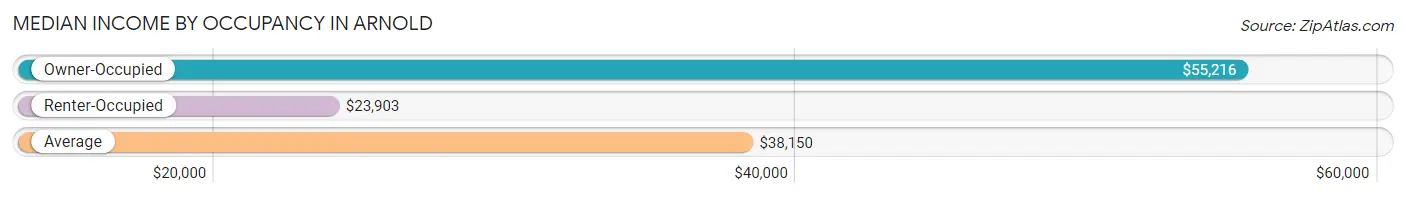
| Occupancy Type | # Households | Median Income |
| Owner-Occupied | 1,207 (57.3%) | $55,216 |
| Renter-Occupied | 900 (42.7%) | $23,903 |
| Average | 2,107 (100.0%) | $38,150 |
Occupancy by Householder Income Bracket in Arnold
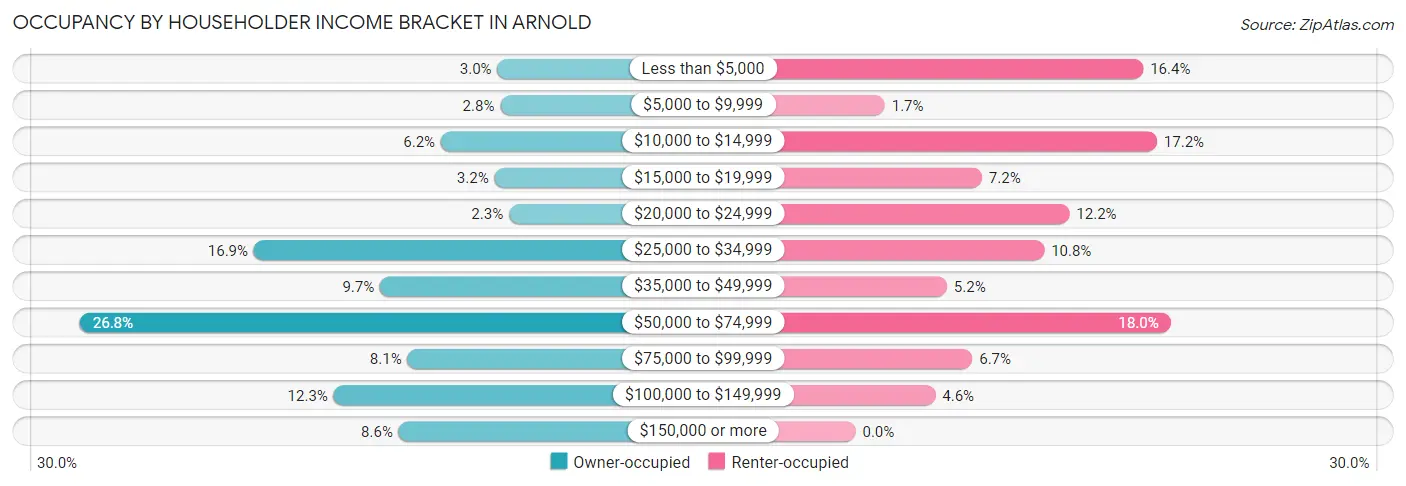
| Income Bracket | Owner-occupied | Renter-occupied |
| Less than $5,000 | 36 (3.0%) | 148 (16.4%) |
| $5,000 to $9,999 | 34 (2.8%) | 15 (1.7%) |
| $10,000 to $14,999 | 75 (6.2%) | 155 (17.2%) |
| $15,000 to $19,999 | 38 (3.2%) | 65 (7.2%) |
| $20,000 to $24,999 | 28 (2.3%) | 110 (12.2%) |
| $25,000 to $34,999 | 204 (16.9%) | 97 (10.8%) |
| $35,000 to $49,999 | 117 (9.7%) | 47 (5.2%) |
| $50,000 to $74,999 | 324 (26.8%) | 162 (18.0%) |
| $75,000 to $99,999 | 98 (8.1%) | 60 (6.7%) |
| $100,000 to $149,999 | 149 (12.3%) | 41 (4.6%) |
| $150,000 or more | 104 (8.6%) | 0 (0.0%) |
| Total | 1,207 (100.0%) | 900 (100.0%) |
Monthly Housing Cost Tiers in Arnold
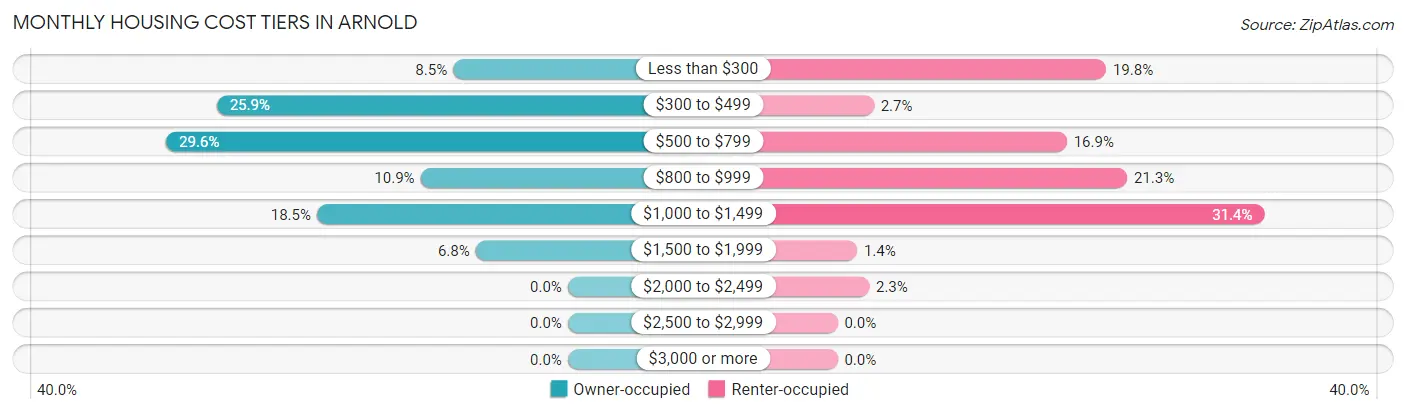
| Monthly Cost | Owner-occupied | Renter-occupied |
| Less than $300 | 102 (8.5%) | 178 (19.8%) |
| $300 to $499 | 312 (25.9%) | 24 (2.7%) |
| $500 to $799 | 357 (29.6%) | 152 (16.9%) |
| $800 to $999 | 131 (10.8%) | 192 (21.3%) |
| $1,000 to $1,499 | 223 (18.5%) | 283 (31.4%) |
| $1,500 to $1,999 | 82 (6.8%) | 13 (1.4%) |
| $2,000 to $2,499 | 0 (0.0%) | 21 (2.3%) |
| $2,500 to $2,999 | 0 (0.0%) | 0 (0.0%) |
| $3,000 or more | 0 (0.0%) | 0 (0.0%) |
| Total | 1,207 (100.0%) | 900 (100.0%) |
Physical Housing Characteristics in Arnold
Housing Structures in Arnold
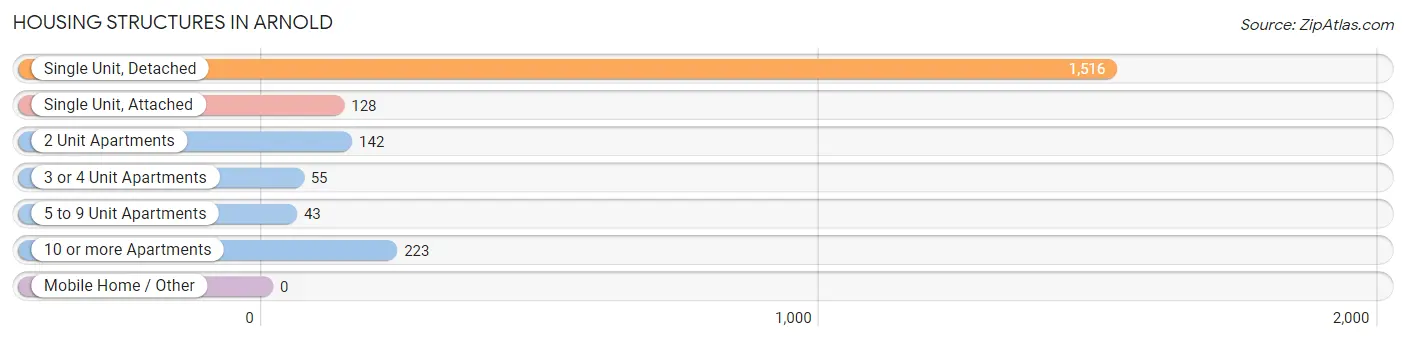
| Structure Type | # Housing Units | % Housing Units |
| Single Unit, Detached | 1,516 | 72.0% |
| Single Unit, Attached | 128 | 6.1% |
| 2 Unit Apartments | 142 | 6.7% |
| 3 or 4 Unit Apartments | 55 | 2.6% |
| 5 to 9 Unit Apartments | 43 | 2.0% |
| 10 or more Apartments | 223 | 10.6% |
| Mobile Home / Other | 0 | 0.0% |
| Total | 2,107 | 100.0% |
Housing Structures by Occupancy in Arnold
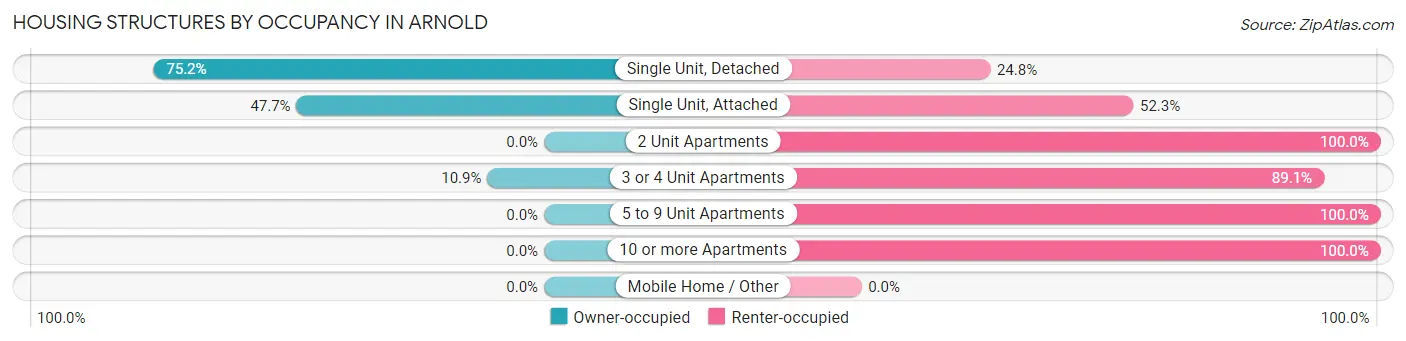
| Structure Type | Owner-occupied | Renter-occupied |
| Single Unit, Detached | 1,140 (75.2%) | 376 (24.8%) |
| Single Unit, Attached | 61 (47.7%) | 67 (52.3%) |
| 2 Unit Apartments | 0 (0.0%) | 142 (100.0%) |
| 3 or 4 Unit Apartments | 6 (10.9%) | 49 (89.1%) |
| 5 to 9 Unit Apartments | 0 (0.0%) | 43 (100.0%) |
| 10 or more Apartments | 0 (0.0%) | 223 (100.0%) |
| Mobile Home / Other | 0 (0.0%) | 0 (0.0%) |
| Total | 1,207 (57.3%) | 900 (42.7%) |
Housing Structures by Number of Rooms in Arnold
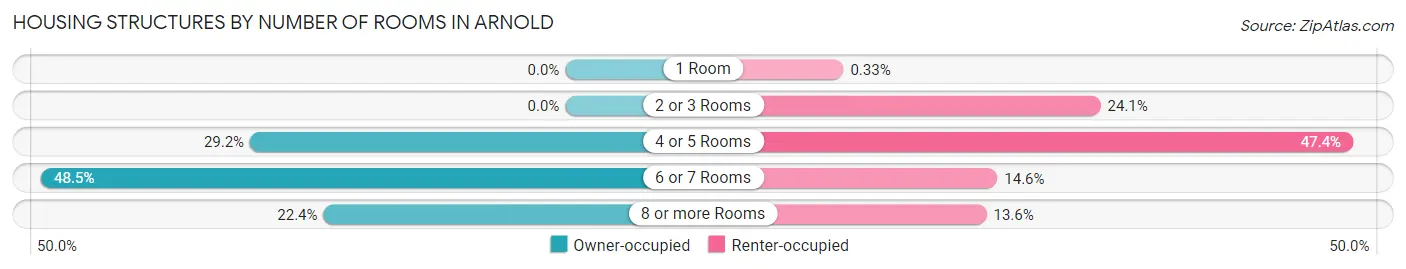
| Number of Rooms | Owner-occupied | Renter-occupied |
| 1 Room | 0 (0.0%) | 3 (0.3%) |
| 2 or 3 Rooms | 0 (0.0%) | 217 (24.1%) |
| 4 or 5 Rooms | 352 (29.2%) | 427 (47.4%) |
| 6 or 7 Rooms | 585 (48.5%) | 131 (14.6%) |
| 8 or more Rooms | 270 (22.4%) | 122 (13.6%) |
| Total | 1,207 (100.0%) | 900 (100.0%) |
Housing Structure by Heating Type in Arnold
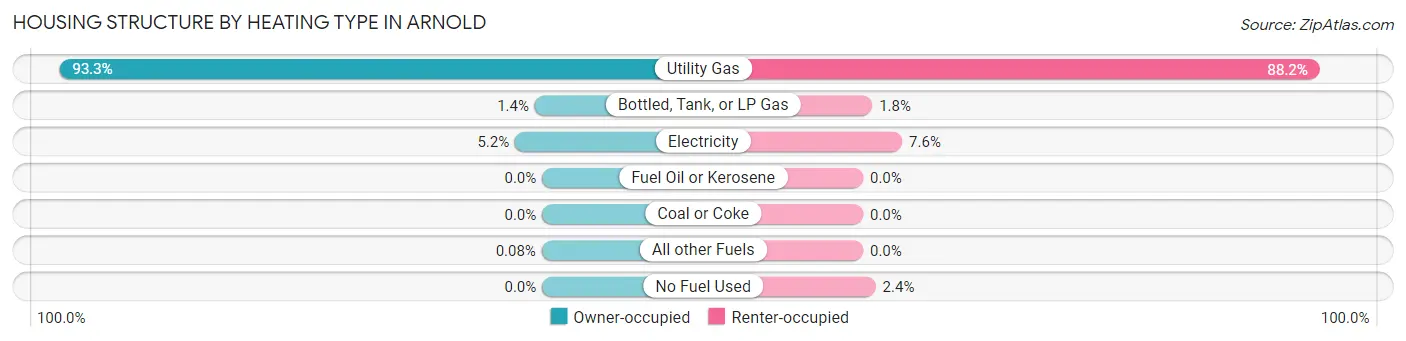
| Heating Type | Owner-occupied | Renter-occupied |
| Utility Gas | 1,126 (93.3%) | 794 (88.2%) |
| Bottled, Tank, or LP Gas | 17 (1.4%) | 16 (1.8%) |
| Electricity | 63 (5.2%) | 68 (7.6%) |
| Fuel Oil or Kerosene | 0 (0.0%) | 0 (0.0%) |
| Coal or Coke | 0 (0.0%) | 0 (0.0%) |
| All other Fuels | 1 (0.1%) | 0 (0.0%) |
| No Fuel Used | 0 (0.0%) | 22 (2.4%) |
| Total | 1,207 (100.0%) | 900 (100.0%) |
Household Vehicle Usage in Arnold
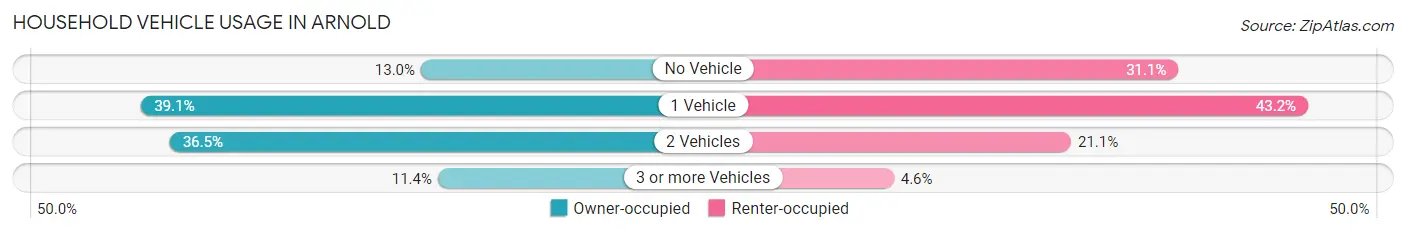
| Vehicles per Household | Owner-occupied | Renter-occupied |
| No Vehicle | 157 (13.0%) | 280 (31.1%) |
| 1 Vehicle | 472 (39.1%) | 389 (43.2%) |
| 2 Vehicles | 440 (36.4%) | 190 (21.1%) |
| 3 or more Vehicles | 138 (11.4%) | 41 (4.6%) |
| Total | 1,207 (100.0%) | 900 (100.0%) |
Real Estate & Mortgages in Arnold
Real Estate and Mortgage Overview in Arnold
| Characteristic | Without Mortgage | With Mortgage |
| Housing Units | 609 | 598 |
| Median Property Value | $75,700 | $68,700 |
| Median Household Income | $50,375 | $24 |
| Monthly Housing Costs | $447 | $0 |
| Real Estate Taxes | $1,741 | $46 |
Property Value by Mortgage Status in Arnold
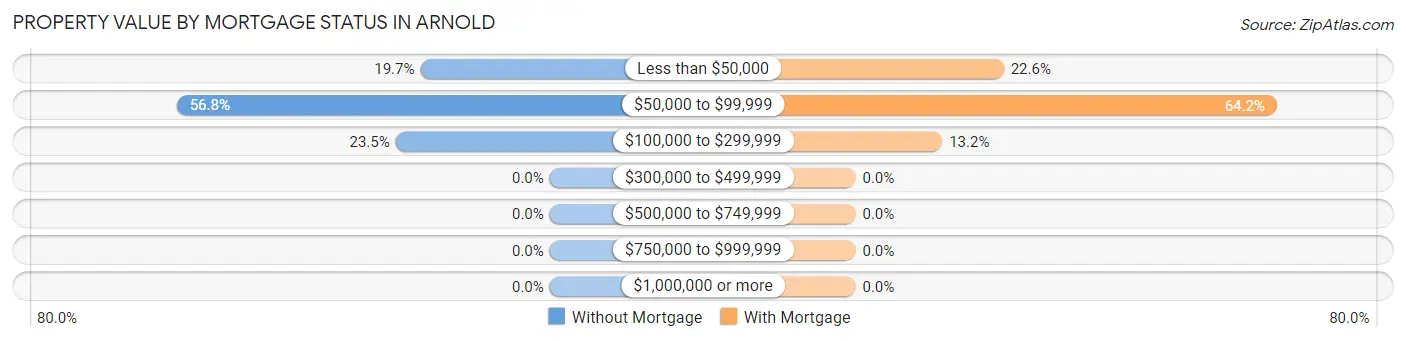
| Property Value | Without Mortgage | With Mortgage |
| Less than $50,000 | 120 (19.7%) | 135 (22.6%) |
| $50,000 to $99,999 | 346 (56.8%) | 384 (64.2%) |
| $100,000 to $299,999 | 143 (23.5%) | 79 (13.2%) |
| $300,000 to $499,999 | 0 (0.0%) | 0 (0.0%) |
| $500,000 to $749,999 | 0 (0.0%) | 0 (0.0%) |
| $750,000 to $999,999 | 0 (0.0%) | 0 (0.0%) |
| $1,000,000 or more | 0 (0.0%) | 0 (0.0%) |
| Total | 609 (100.0%) | 598 (100.0%) |
Household Income by Mortgage Status in Arnold
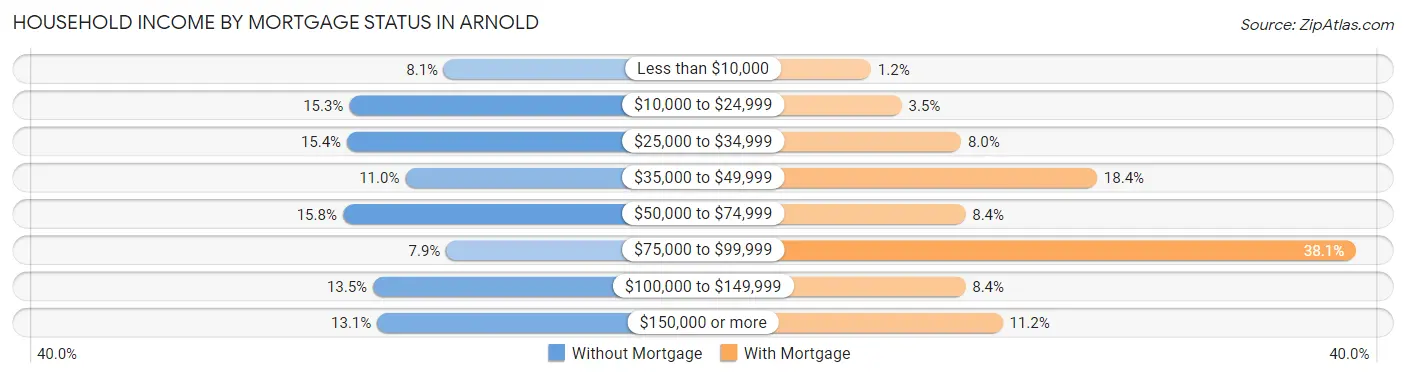
| Household Income | Without Mortgage | With Mortgage |
| Less than $10,000 | 49 (8.1%) | 7 (1.2%) |
| $10,000 to $24,999 | 93 (15.3%) | 21 (3.5%) |
| $25,000 to $34,999 | 94 (15.4%) | 48 (8.0%) |
| $35,000 to $49,999 | 67 (11.0%) | 110 (18.4%) |
| $50,000 to $74,999 | 96 (15.8%) | 50 (8.4%) |
| $75,000 to $99,999 | 48 (7.9%) | 228 (38.1%) |
| $100,000 to $149,999 | 82 (13.5%) | 50 (8.4%) |
| $150,000 or more | 80 (13.1%) | 67 (11.2%) |
| Total | 609 (100.0%) | 598 (100.0%) |
Property Value to Household Income Ratio in Arnold
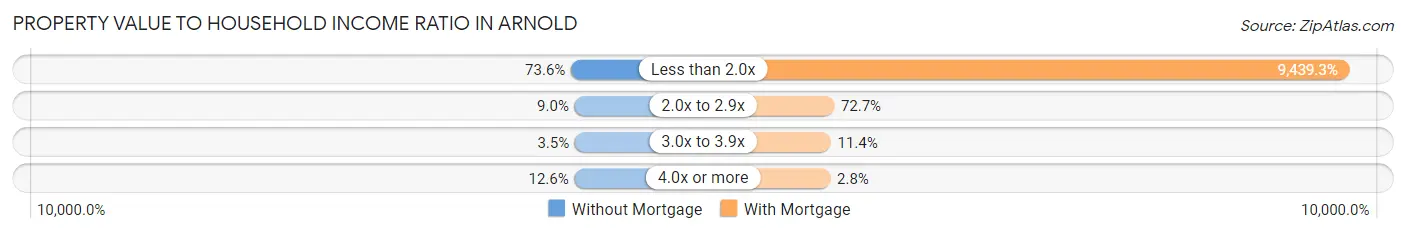
| Value-to-Income Ratio | Without Mortgage | With Mortgage |
| Less than 2.0x | 448 (73.6%) | 56,447 (9,439.3%) |
| 2.0x to 2.9x | 55 (9.0%) | 435 (72.7%) |
| 3.0x to 3.9x | 21 (3.5%) | 68 (11.4%) |
| 4.0x or more | 77 (12.6%) | 17 (2.8%) |
| Total | 609 (100.0%) | 598 (100.0%) |
Real Estate Taxes by Mortgage Status in Arnold
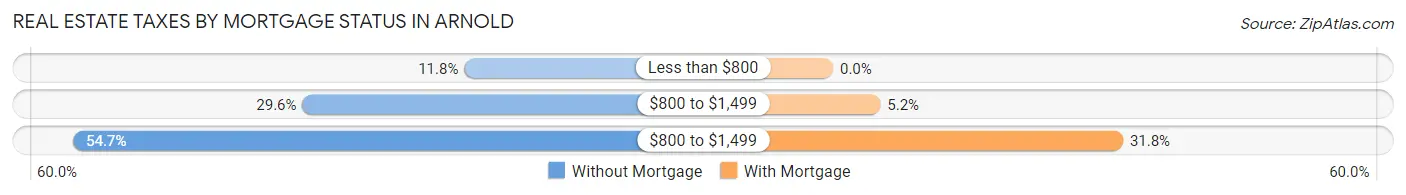
| Property Taxes | Without Mortgage | With Mortgage |
| Less than $800 | 72 (11.8%) | 0 (0.0%) |
| $800 to $1,499 | 180 (29.6%) | 31 (5.2%) |
| $800 to $1,499 | 333 (54.7%) | 190 (31.8%) |
| Total | 609 (100.0%) | 598 (100.0%) |
Health & Disability in Arnold
Health Insurance Coverage by Age in Arnold
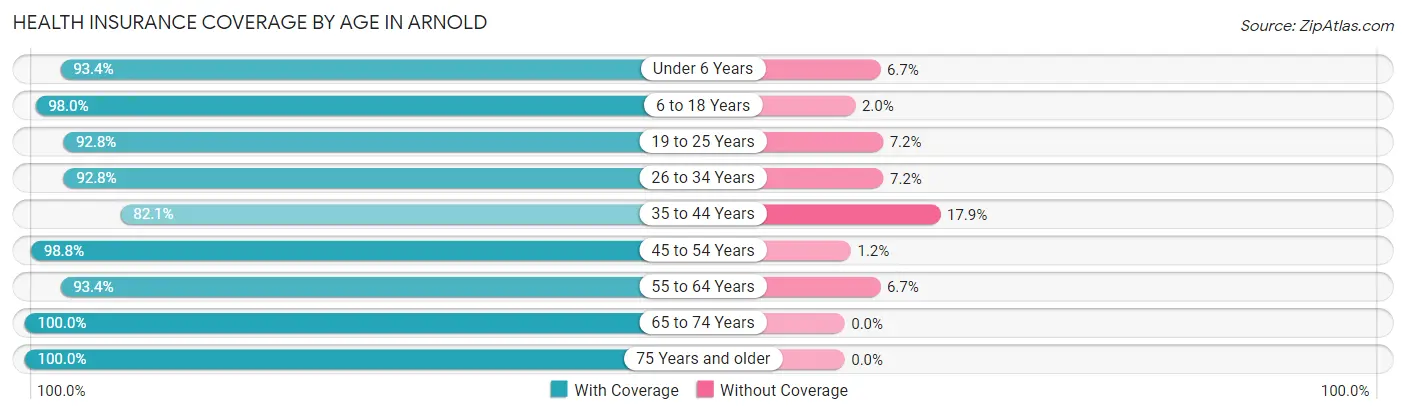
| Age Bracket | With Coverage | Without Coverage |
| Under 6 Years | 295 (93.3%) | 21 (6.7%) |
| 6 to 18 Years | 641 (98.0%) | 13 (2.0%) |
| 19 to 25 Years | 324 (92.8%) | 25 (7.2%) |
| 26 to 34 Years | 513 (92.8%) | 40 (7.2%) |
| 35 to 44 Years | 506 (82.1%) | 110 (17.9%) |
| 45 to 54 Years | 597 (98.8%) | 7 (1.2%) |
| 55 to 64 Years | 744 (93.3%) | 53 (6.7%) |
| 65 to 74 Years | 526 (100.0%) | 0 (0.0%) |
| 75 Years and older | 347 (100.0%) | 0 (0.0%) |
| Total | 4,493 (94.4%) | 269 (5.7%) |
Health Insurance Coverage by Citizenship Status in Arnold
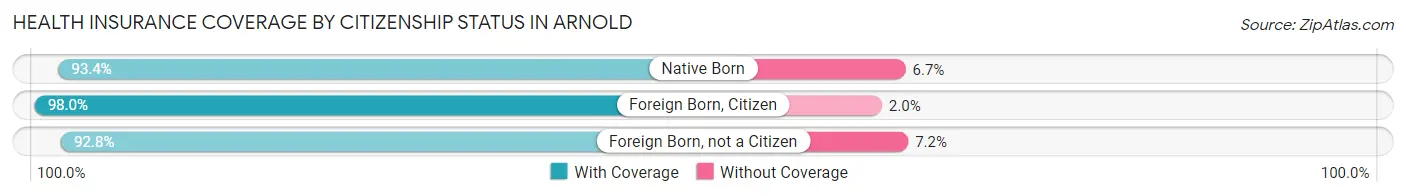
| Citizenship Status | With Coverage | Without Coverage |
| Native Born | 295 (93.3%) | 21 (6.7%) |
| Foreign Born, Citizen | 641 (98.0%) | 13 (2.0%) |
| Foreign Born, not a Citizen | 324 (92.8%) | 25 (7.2%) |
Health Insurance Coverage by Household Income in Arnold
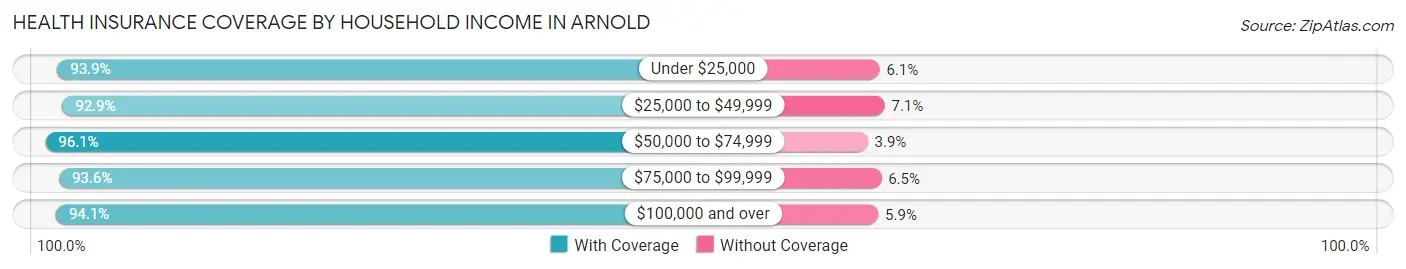
| Household Income | With Coverage | Without Coverage |
| Under $25,000 | 1,115 (93.9%) | 73 (6.1%) |
| $25,000 to $49,999 | 854 (92.9%) | 65 (7.1%) |
| $50,000 to $74,999 | 1,259 (96.1%) | 51 (3.9%) |
| $75,000 to $99,999 | 348 (93.5%) | 24 (6.5%) |
| $100,000 and over | 897 (94.1%) | 56 (5.9%) |
Public vs Private Health Insurance Coverage by Age in Arnold
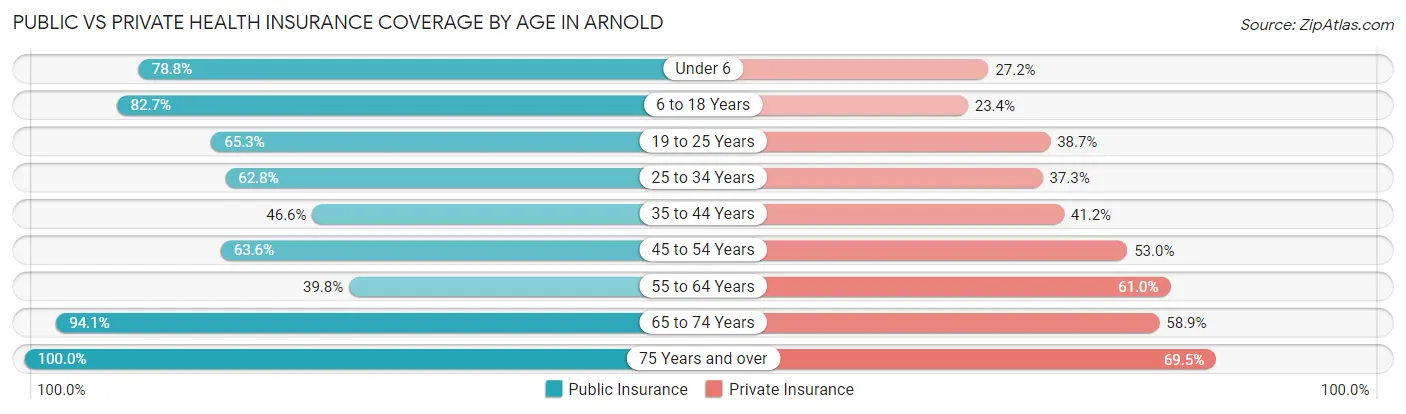
| Age Bracket | Public Insurance | Private Insurance |
| Under 6 | 249 (78.8%) | 86 (27.2%) |
| 6 to 18 Years | 541 (82.7%) | 153 (23.4%) |
| 19 to 25 Years | 228 (65.3%) | 135 (38.7%) |
| 25 to 34 Years | 347 (62.7%) | 206 (37.2%) |
| 35 to 44 Years | 287 (46.6%) | 254 (41.2%) |
| 45 to 54 Years | 384 (63.6%) | 320 (53.0%) |
| 55 to 64 Years | 317 (39.8%) | 486 (61.0%) |
| 65 to 74 Years | 495 (94.1%) | 310 (58.9%) |
| 75 Years and over | 347 (100.0%) | 241 (69.5%) |
| Total | 3,195 (67.1%) | 2,191 (46.0%) |
Disability Status by Sex by Age in Arnold
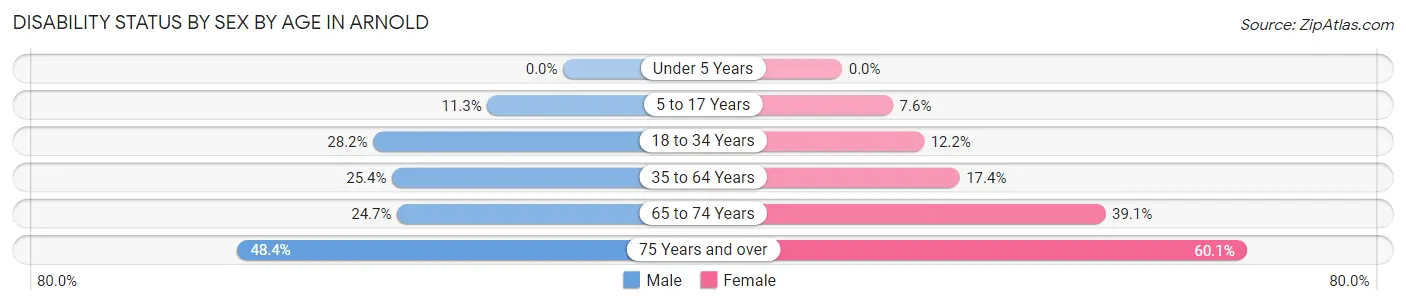
| Age Bracket | Male | Female |
| Under 5 Years | 0 (0.0%) | 0 (0.0%) |
| 5 to 17 Years | 44 (11.3%) | 24 (7.5%) |
| 18 to 34 Years | 154 (28.2%) | 45 (12.2%) |
| 35 to 64 Years | 224 (25.4%) | 198 (17.4%) |
| 65 to 74 Years | 54 (24.7%) | 120 (39.1%) |
| 75 Years and over | 60 (48.4%) | 134 (60.1%) |
Disability Class by Sex by Age in Arnold
Disability Class: Hearing Difficulty
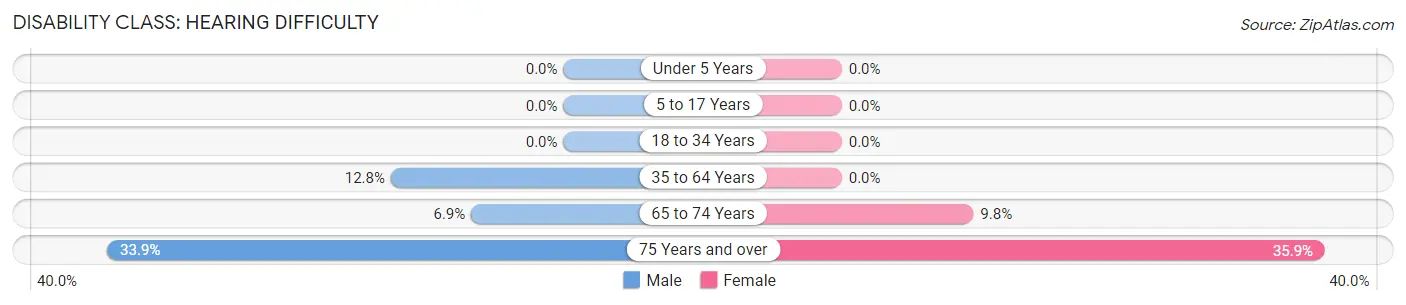
| Age Bracket | Male | Female |
| Under 5 Years | 0 (0.0%) | 0 (0.0%) |
| 5 to 17 Years | 0 (0.0%) | 0 (0.0%) |
| 18 to 34 Years | 0 (0.0%) | 0 (0.0%) |
| 35 to 64 Years | 113 (12.8%) | 0 (0.0%) |
| 65 to 74 Years | 15 (6.9%) | 30 (9.8%) |
| 75 Years and over | 42 (33.9%) | 80 (35.9%) |
Disability Class: Vision Difficulty
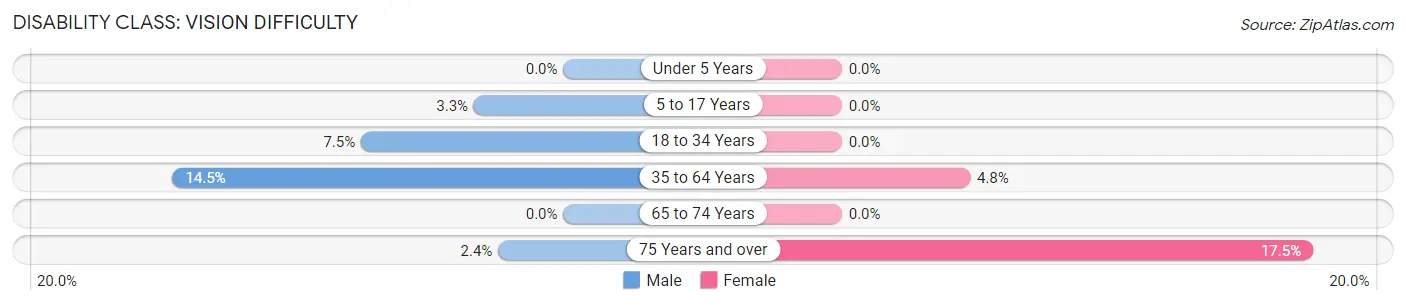
| Age Bracket | Male | Female |
| Under 5 Years | 0 (0.0%) | 0 (0.0%) |
| 5 to 17 Years | 13 (3.3%) | 0 (0.0%) |
| 18 to 34 Years | 41 (7.5%) | 0 (0.0%) |
| 35 to 64 Years | 128 (14.5%) | 54 (4.8%) |
| 65 to 74 Years | 0 (0.0%) | 0 (0.0%) |
| 75 Years and over | 3 (2.4%) | 39 (17.5%) |
Disability Class: Cognitive Difficulty
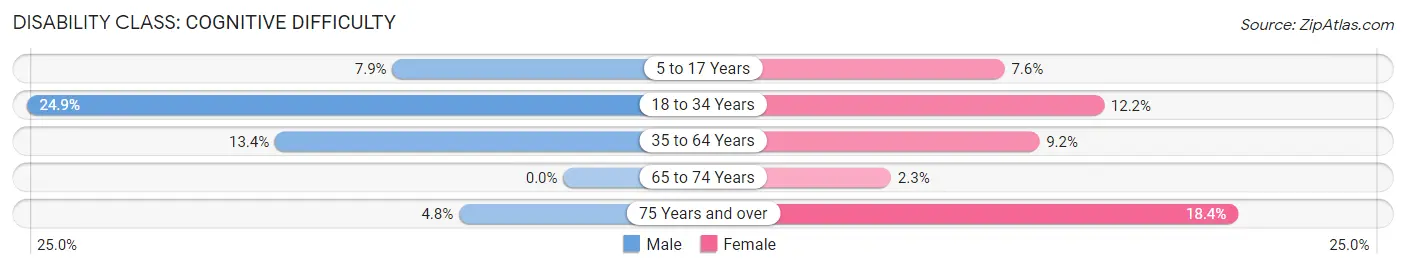
| Age Bracket | Male | Female |
| 5 to 17 Years | 31 (7.9%) | 24 (7.5%) |
| 18 to 34 Years | 136 (24.9%) | 45 (12.2%) |
| 35 to 64 Years | 118 (13.4%) | 104 (9.2%) |
| 65 to 74 Years | 0 (0.0%) | 7 (2.3%) |
| 75 Years and over | 6 (4.8%) | 41 (18.4%) |
Disability Class: Ambulatory Difficulty
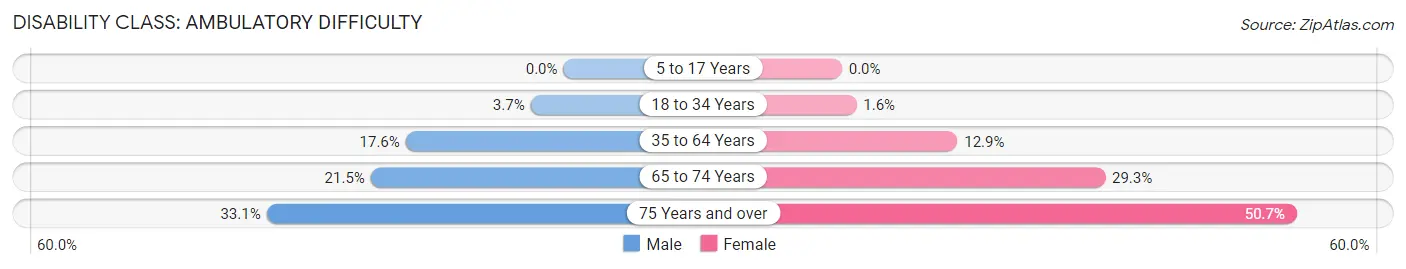
| Age Bracket | Male | Female |
| 5 to 17 Years | 0 (0.0%) | 0 (0.0%) |
| 18 to 34 Years | 20 (3.7%) | 6 (1.6%) |
| 35 to 64 Years | 155 (17.6%) | 146 (12.9%) |
| 65 to 74 Years | 47 (21.5%) | 90 (29.3%) |
| 75 Years and over | 41 (33.1%) | 113 (50.7%) |
Disability Class: Self-Care Difficulty
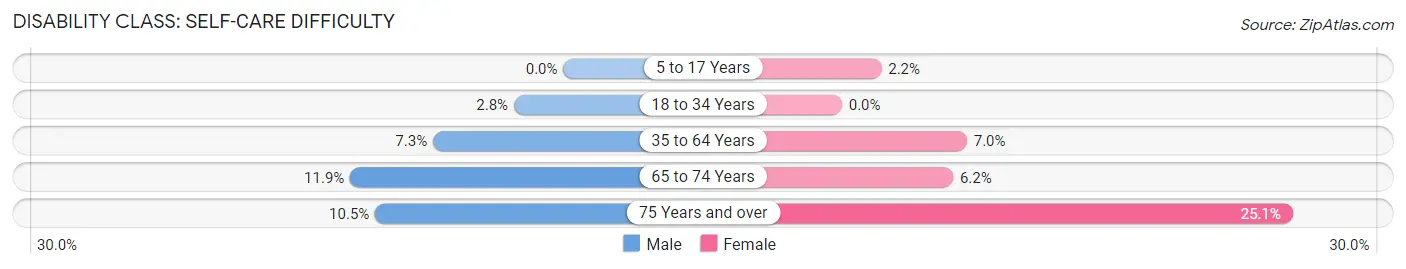
| Age Bracket | Male | Female |
| 5 to 17 Years | 0 (0.0%) | 7 (2.2%) |
| 18 to 34 Years | 15 (2.8%) | 0 (0.0%) |
| 35 to 64 Years | 64 (7.3%) | 79 (7.0%) |
| 65 to 74 Years | 26 (11.9%) | 19 (6.2%) |
| 75 Years and over | 13 (10.5%) | 56 (25.1%) |
Technology Access in Arnold
Computing Device Access in Arnold
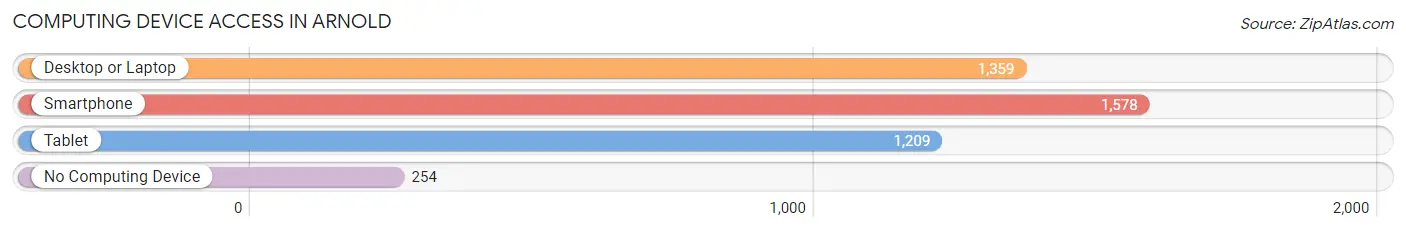
| Device Type | # Households | % Households |
| Desktop or Laptop | 1,359 | 64.5% |
| Smartphone | 1,578 | 74.9% |
| Tablet | 1,209 | 57.4% |
| No Computing Device | 254 | 12.1% |
| Total | 2,107 | 100.0% |
Internet Access in Arnold
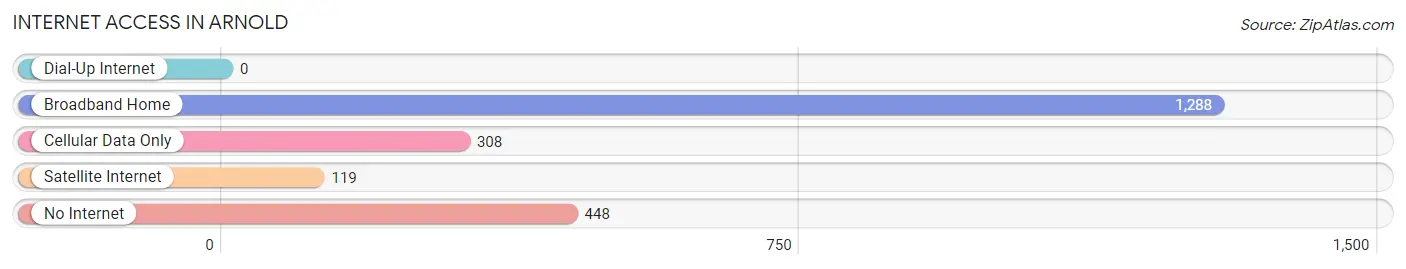
| Internet Type | # Households | % Households |
| Dial-Up Internet | 0 | 0.0% |
| Broadband Home | 1,288 | 61.1% |
| Cellular Data Only | 308 | 14.6% |
| Satellite Internet | 119 | 5.7% |
| No Internet | 448 | 21.3% |
| Total | 2,107 | 100.0% |
Arnold Summary
Arnold, Pennsylvania is a borough located in Westmoreland County, Pennsylvania. It is situated in the Allegheny Valley, approximately 25 miles east of Pittsburgh. The population of Arnold was 6,092 at the 2010 census.
History
Arnold was founded in 1852 by John Arnold, a German immigrant who had come to the United States in 1848. He purchased a tract of land in the Allegheny Valley and began to develop the area. Arnold named the town after himself and it was incorporated as a borough in 1872.
The town grew rapidly in the late 19th century, becoming a center for the coal and coke industry. The town was also home to several glass factories, which produced bottles and jars for the local industry.
Geography
Arnold is located at 40°22'45" North, 79°37'45" West (40.379167, -79.629167). According to the United States Census Bureau, the borough has a total area of 1.2 square miles, all of it land.
Economy
Arnold is a small town with a limited economy. The main industries in the area are retail, health care, and manufacturing. The town is home to several small businesses, including a grocery store, a hardware store, and a few restaurants.
The town is also home to several large employers, including the Arnold Palmer Regional Airport, which is located just outside of town. The airport is a major employer in the area, providing jobs for over 1,000 people.
Demographics
As of the 2010 census, there were 6,092 people, 2,541 households, and 1,541 families residing in the borough. The population density was 5,072.2 people per square mile. The racial makeup of the borough was 94.2% White, 2.7% African American, 0.2% Native American, 0.7% Asian, 0.1% Pacific Islander, 0.7% from other races, and 1.4% from two or more races. Hispanic or Latino of any race were 1.7% of the population.
The median income for a household in the borough was $35,938, and the median income for a family was $45,938. Males had a median income of $35,938 versus $25,938 for females. The per capita income for the borough was $18,938. About 8.2% of families and 10.2% of the population were below the poverty line, including 14.2% of those under age 18 and 8.2% of those age 65 or over.
Common Questions
What is the Total Population of Arnold?
Total Population of Arnold is 4,778.
What is the Total Male Population of Arnold?
Total Male Population of Arnold is 2,338.
What is the Total Female Population of Arnold?
Total Female Population of Arnold is 2,440.
What is the Ratio of Males per 100 Females in Arnold?
There are 95.82 Males per 100 Females in Arnold.
What is the Ratio of Females per 100 Males in Arnold?
There are 104.36 Females per 100 Males in Arnold.
What is the Median Population Age in Arnold?
Median Population Age in Arnold is 42.3 Years.
What is the Average Family Size in Arnold
Average Family Size in Arnold is 2.9 People.
What is the Average Household Size in Arnold
Average Household Size in Arnold is 2.2 People.
What is Per Capita Income in Arnold?
Per Capita income in Arnold is $24,363.
What is the Median Family Income in Arnold?
Median Family Income in Arnold is $63,458.
What is the Median Household income in Arnold?
Median Household Income in Arnold is $38,150.
What is Income or Wage Gap in Arnold?
Income or Wage Gap in Arnold is 7.4%.
Women in Arnold earn 92.6 cents for every dollar earned by a man.
What is Inequality or Gini Index in Arnold?
Inequality or Gini Index in Arnold is 0.46.
How Large is the Labor Force in Arnold?
There are 2,282 People in the Labor Forcein in Arnold.
What is the Percentage of People in the Labor Force in Arnold?
57.5% of People are in the Labor Force in Arnold.
What is the Unemployment Rate in Arnold?
Unemployment Rate in Arnold is 13.9%.