Connoquenessing borough, PA
Connoquenessing borough Overview
647
TOTAL POPULATION
324
MALE POPULATION
323
FEMALE POPULATION
100.31
MALES / 100 FEMALES
99.69
FEMALES / 100 MALES
37.5
MEDIAN AGE
2.9
AVG FAMILY SIZE
2.6
AVG HOUSEHOLD SIZE
$40,477
PER CAPITA INCOME
$96,250
AVG FAMILY INCOME
$79,911
AVG HOUSEHOLD INCOME
50.0%
WAGE / INCOME GAP [ % ]
50.0¢/ $1
WAGE / INCOME GAP [ $ ]
0.40
INEQUALITY / GINI INDEX
270
LABOR FORCE [ PEOPLE ]
58.8%
PERCENT IN LABOR FORCE
2.2%
UNEMPLOYMENT RATE
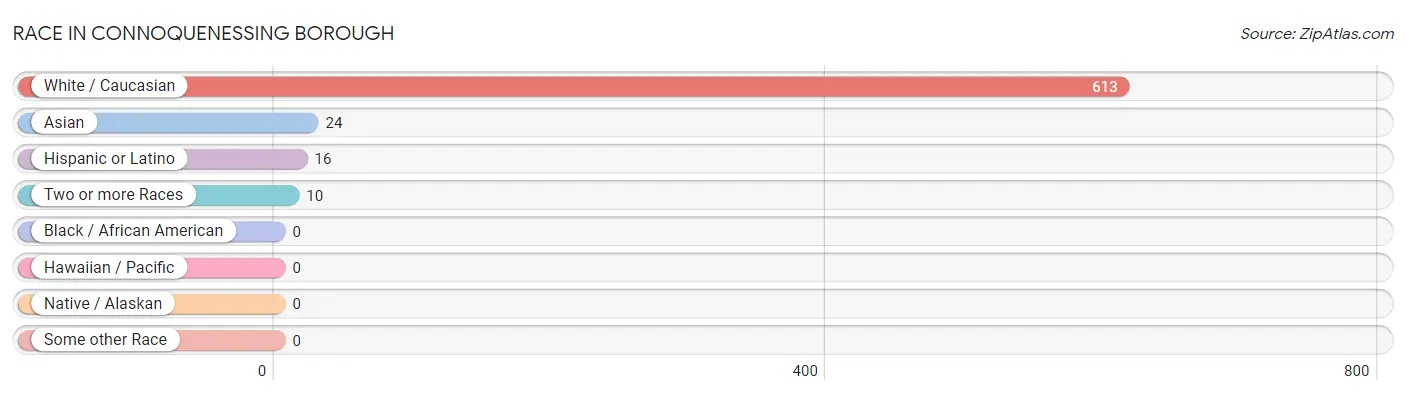
Race in Connoquenessing borough
The most populous races in Connoquenessing borough are White / Caucasian (613 | 94.7%), Asian (24 | 3.7%), and Hispanic or Latino (16 | 2.5%).
| Race | # Population | % Population |
| Asian | 24 | 3.7% |
| Black / African American | 0 | 0.0% |
| Hawaiian / Pacific | 0 | 0.0% |
| Hispanic or Latino | 16 | 2.5% |
| Native / Alaskan | 0 | 0.0% |
| White / Caucasian | 613 | 94.7% |
| Two or more Races | 10 | 1.5% |
| Some other Race | 0 | 0.0% |
| Total | 647 | 100.0% |
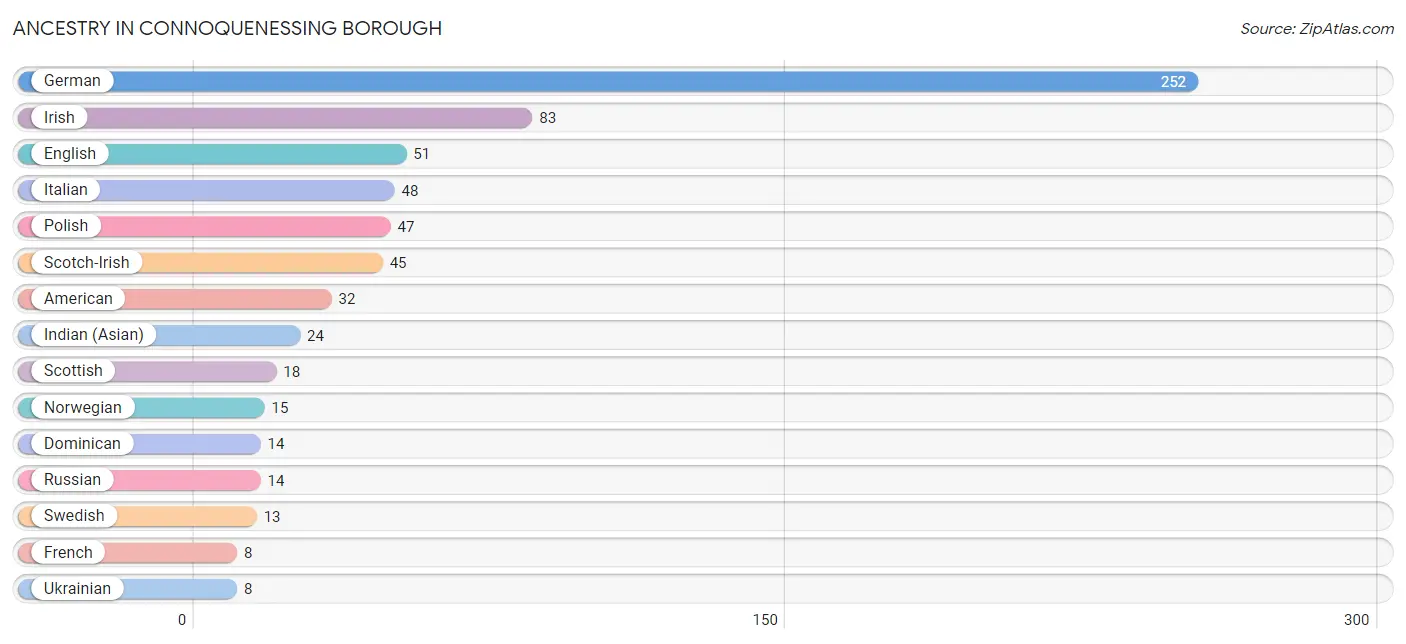
Ancestry in Connoquenessing borough
The most populous ancestries reported in Connoquenessing borough are German (252 | 39.0%), Irish (83 | 12.8%), English (51 | 7.9%), Italian (48 | 7.4%), and Polish (47 | 7.3%), together accounting for 74.3% of all Connoquenessing borough residents.
| Ancestry | # Population | % Population |
| American | 32 | 5.0% |
| Austrian | 2 | 0.3% |
| Cherokee | 1 | 0.2% |
| Croatian | 3 | 0.5% |
| Danish | 3 | 0.5% |
| Dominican | 14 | 2.2% |
| Dutch | 4 | 0.6% |
| Eastern European | 1 | 0.2% |
| English | 51 | 7.9% |
| French | 8 | 1.2% |
| German | 252 | 39.0% |
| Hungarian | 2 | 0.3% |
| Indian (Asian) | 24 | 3.7% |
| Irish | 83 | 12.8% |
| Italian | 48 | 7.4% |
| Korean | 2 | 0.3% |
| Mexican | 2 | 0.3% |
| Norwegian | 15 | 2.3% |
| Polish | 47 | 7.3% |
| Russian | 14 | 2.2% |
| Scotch-Irish | 45 | 7.0% |
| Scottish | 18 | 2.8% |
| Serbian | 1 | 0.2% |
| Slovak | 6 | 0.9% |
| Swedish | 13 | 2.0% |
| Ukrainian | 8 | 1.2% |
| Welsh | 6 | 0.9% | View All 27 Rows |
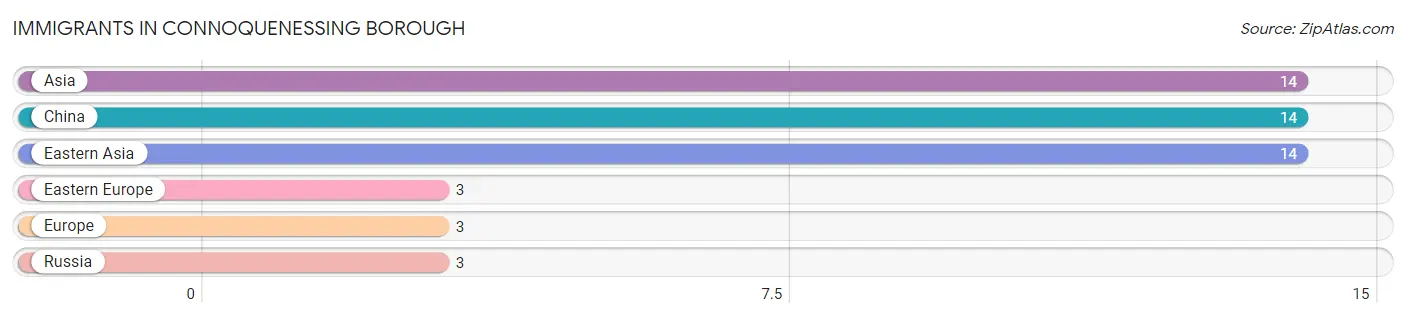
Immigrants in Connoquenessing borough
The most numerous immigrant groups reported in Connoquenessing borough came from Asia (14 | 2.2%), China (14 | 2.2%), Eastern Asia (14 | 2.2%), Eastern Europe (3 | 0.5%), and Europe (3 | 0.5%), together accounting for 7.4% of all Connoquenessing borough residents.
| Immigration Origin | # Population | % Population |
| Asia | 14 | 2.2% |
| China | 14 | 2.2% |
| Eastern Asia | 14 | 2.2% |
| Eastern Europe | 3 | 0.5% |
| Europe | 3 | 0.5% |
| Russia | 3 | 0.5% | View All 6 Rows |
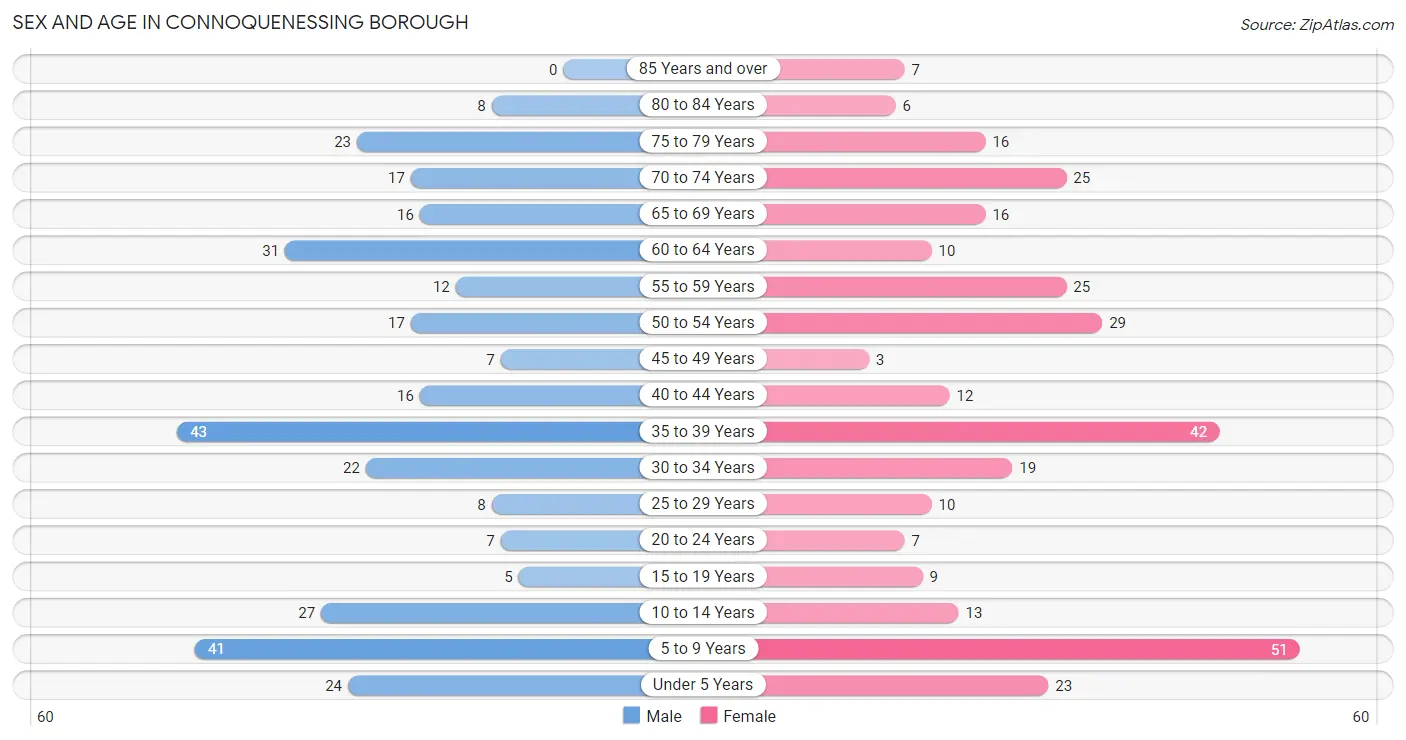
Sex and Age in Connoquenessing borough
Sex and Age in Connoquenessing borough
The most populous age groups in Connoquenessing borough are 35 to 39 Years (43 | 13.3%) for men and 5 to 9 Years (51 | 15.8%) for women.
| Age Bracket | Male | Female |
| Under 5 Years | 24 (7.4%) | 23 (7.1%) |
| 5 to 9 Years | 41 (12.7%) | 51 (15.8%) |
| 10 to 14 Years | 27 (8.3%) | 13 (4.0%) |
| 15 to 19 Years | 5 (1.5%) | 9 (2.8%) |
| 20 to 24 Years | 7 (2.2%) | 7 (2.2%) |
| 25 to 29 Years | 8 (2.5%) | 10 (3.1%) |
| 30 to 34 Years | 22 (6.8%) | 19 (5.9%) |
| 35 to 39 Years | 43 (13.3%) | 42 (13.0%) |
| 40 to 44 Years | 16 (4.9%) | 12 (3.7%) |
| 45 to 49 Years | 7 (2.2%) | 3 (0.9%) |
| 50 to 54 Years | 17 (5.2%) | 29 (9.0%) |
| 55 to 59 Years | 12 (3.7%) | 25 (7.7%) |
| 60 to 64 Years | 31 (9.6%) | 10 (3.1%) |
| 65 to 69 Years | 16 (4.9%) | 16 (5.0%) |
| 70 to 74 Years | 17 (5.2%) | 25 (7.7%) |
| 75 to 79 Years | 23 (7.1%) | 16 (5.0%) |
| 80 to 84 Years | 8 (2.5%) | 6 (1.9%) |
| 85 Years and over | 0 (0.0%) | 7 (2.2%) |
| Total | 324 (100.0%) | 323 (100.0%) |
Families and Households in Connoquenessing borough
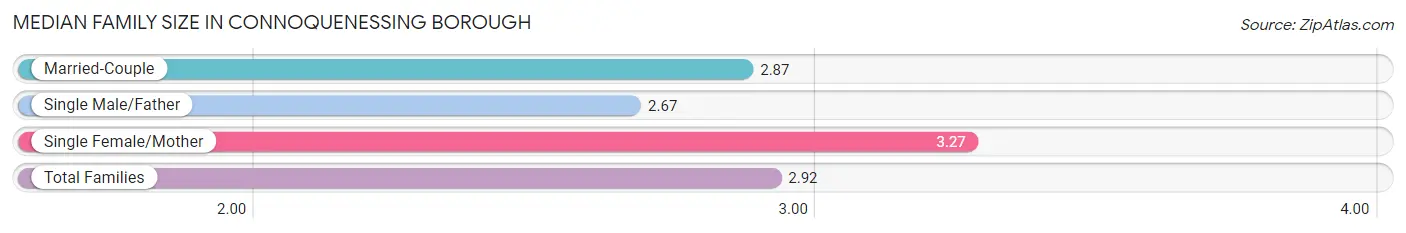
Median Family Size in Connoquenessing borough
The median family size in Connoquenessing borough is 2.92 persons per family, with single female/mother families (30 | 14.8%) accounting for the largest median family size of 3.27 persons per family. On the other hand, single male/father families (9 | 4.5%) represent the smallest median family size with 2.67 persons per family.
| Family Type | # Families | Family Size |
| Married-Couple | 163 (80.7%) | 2.87 |
| Single Male/Father | 9 (4.5%) | 2.67 |
| Single Female/Mother | 30 (14.8%) | 3.27 |
| Total Families | 202 (100.0%) | 2.92 |
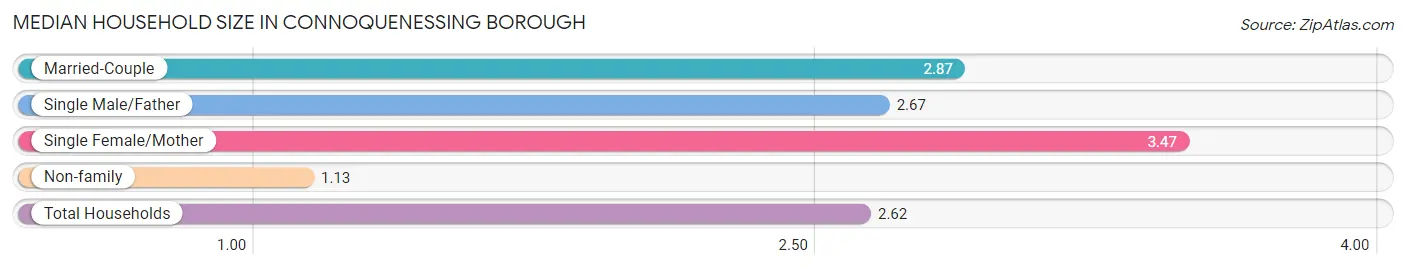
Median Household Size in Connoquenessing borough
The median household size in Connoquenessing borough is 2.62 persons per household, with single female/mother households (30 | 12.1%) accounting for the largest median household size of 3.47 persons per household. non-family households (45 | 18.2%) represent the smallest median household size with 1.13 persons per household.
| Household Type | # Households | Household Size |
| Married-Couple | 163 (66.0%) | 2.87 |
| Single Male/Father | 9 (3.6%) | 2.67 |
| Single Female/Mother | 30 (12.1%) | 3.47 |
| Non-family | 45 (18.2%) | 1.13 |
| Total Households | 247 (100.0%) | 2.62 |
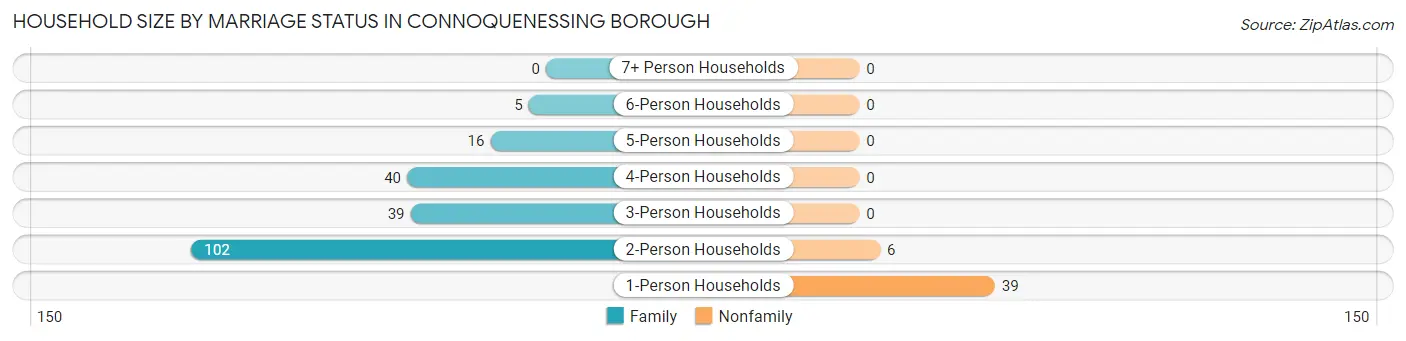
Household Size by Marriage Status in Connoquenessing borough
Out of a total of 247 households in Connoquenessing borough, 202 (81.8%) are family households, while 45 (18.2%) are nonfamily households. The most numerous type of family households are 2-person households, comprising 102, and the most common type of nonfamily households are 1-person households, comprising 39.
| Household Size | Family Households | Nonfamily Households |
| 1-Person Households | - | 39 (15.8%) |
| 2-Person Households | 102 (41.3%) | 6 (2.4%) |
| 3-Person Households | 39 (15.8%) | 0 (0.0%) |
| 4-Person Households | 40 (16.2%) | 0 (0.0%) |
| 5-Person Households | 16 (6.5%) | 0 (0.0%) |
| 6-Person Households | 5 (2.0%) | 0 (0.0%) |
| 7+ Person Households | 0 (0.0%) | 0 (0.0%) |
| Total | 202 (81.8%) | 45 (18.2%) |
Female Fertility in Connoquenessing borough
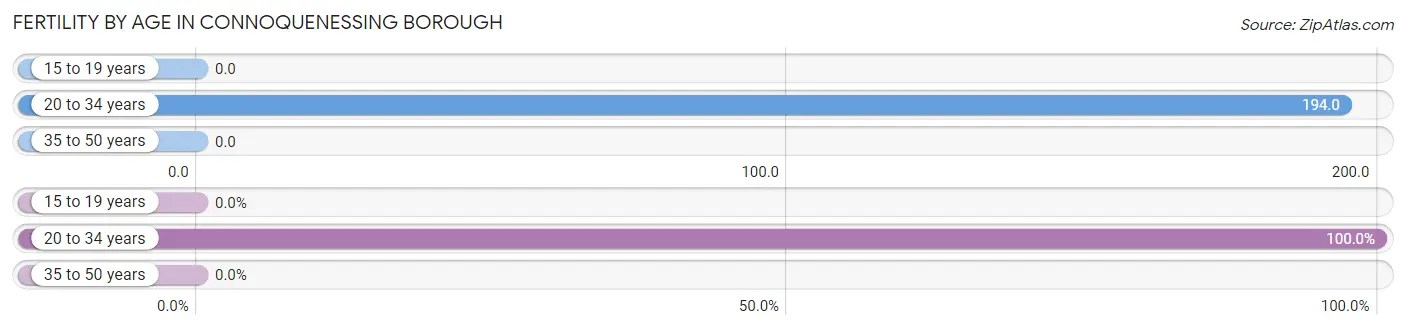
Fertility by Age in Connoquenessing borough
Average fertility rate in Connoquenessing borough is 68.0 births per 1,000 women. Women in the age bracket of 20 to 34 years have the highest fertility rate with 194.0 births per 1,000 women. Women in the age bracket of 20 to 34 years acount for 100.0% of all women with births.
| Age Bracket | Women with Births | Births / 1,000 Women |
| 15 to 19 years | 0 (0.0%) | 0.0 |
| 20 to 34 years | 7 (100.0%) | 194.0 |
| 35 to 50 years | 0 (0.0%) | 0.0 |
| Total | 7 (100.0%) | 68.0 |
Fertility by Age by Marriage Status in Connoquenessing borough
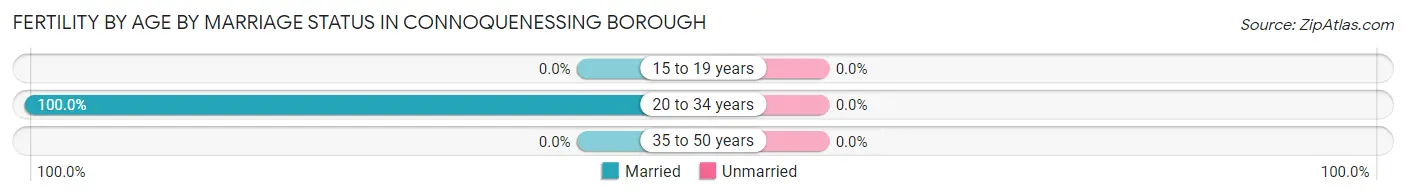
| Age Bracket | Married | Unmarried |
| 15 to 19 years | 0 (0.0%) | 0 (0.0%) |
| 20 to 34 years | 7 (100.0%) | 0 (0.0%) |
| 35 to 50 years | 0 (0.0%) | 0 (0.0%) |
| Total | 7 (100.0%) | 0 (0.0%) |
Fertility by Education in Connoquenessing borough
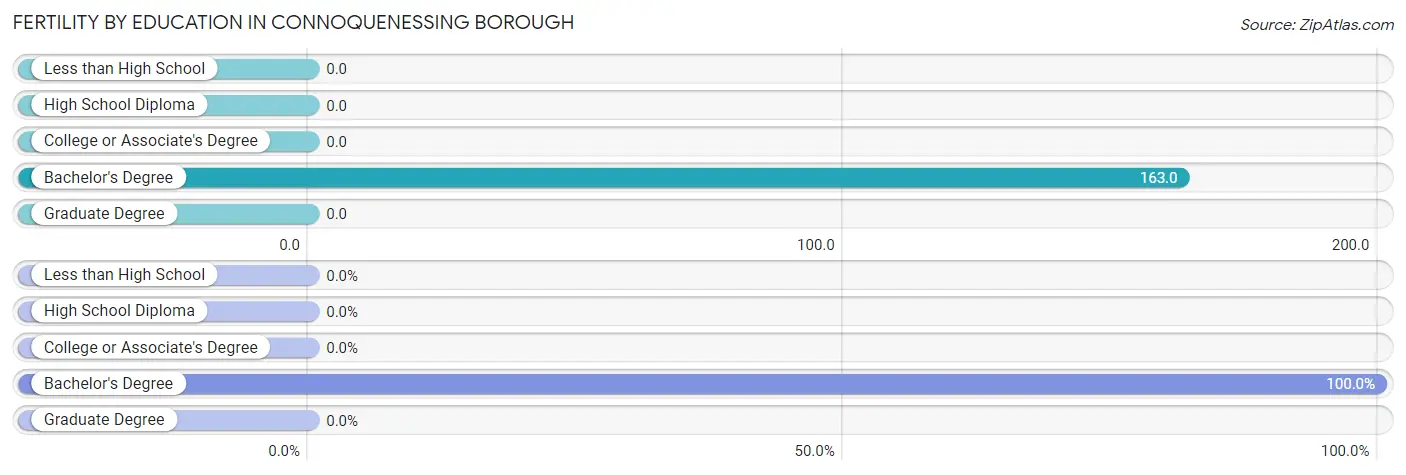
| Educational Attainment | Women with Births | Births / 1,000 Women |
| Less than High School | 0 (0.0%) | 0.0 |
| High School Diploma | 0 (0.0%) | 0.0 |
| College or Associate's Degree | 0 (0.0%) | 0.0 |
| Bachelor's Degree | 7 (100.0%) | 163.0 |
| Graduate Degree | 0 (0.0%) | 0.0 |
| Total | 7 (100.0%) | 68.0 |
Fertility by Education by Marriage Status in Connoquenessing borough
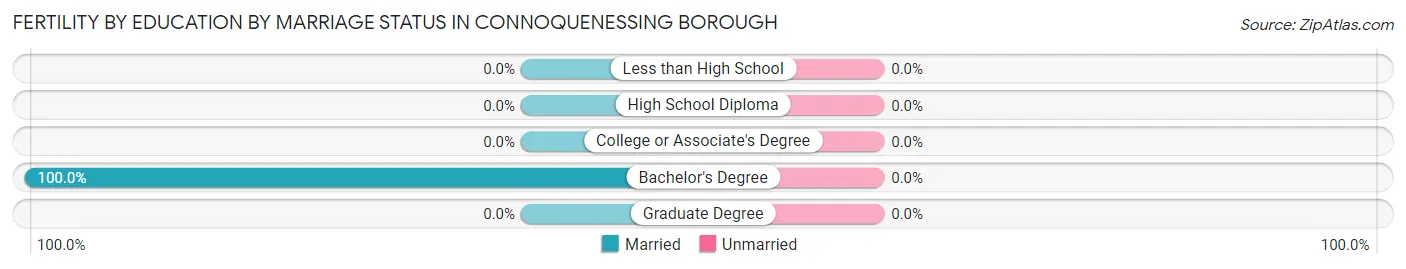
| Educational Attainment | Married | Unmarried |
| Less than High School | 0 (0.0%) | 0 (0.0%) |
| High School Diploma | 0 (0.0%) | 0 (0.0%) |
| College or Associate's Degree | 0 (0.0%) | 0 (0.0%) |
| Bachelor's Degree | 7 (100.0%) | 0 (0.0%) |
| Graduate Degree | 0 (0.0%) | 0 (0.0%) |
| Total | 7 (100.0%) | 0 (0.0%) |
Income in Connoquenessing borough
Income Overview in Connoquenessing borough
Per Capita Income in Connoquenessing borough is $40,477, while median incomes of families and households are $96,250 and $79,911 respectively.
| Characteristic | Number | Measure |
| Per Capita Income | 647 | $40,477 |
| Median Family Income | 202 | $96,250 |
| Mean Family Income | 202 | $107,802 |
| Median Household Income | 247 | $79,911 |
| Mean Household Income | 247 | $105,041 |
| Income Deficit | 202 | $0 |
| Wage / Income Gap (%) | 647 | 50.00% |
| Wage / Income Gap ($) | 647 | 50.00¢ per $1 |
| Gini / Inequality Index | 647 | 0.40 |
Earnings by Sex in Connoquenessing borough
Average Earnings in Connoquenessing borough are $57,381, $82,500 for men and $41,250 for women, a difference of 50.0%.
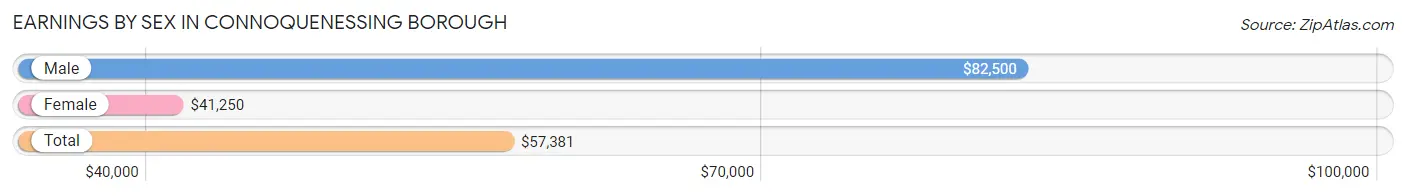
| Sex | Number | Average Earnings |
| Male | 160 (53.3%) | $82,500 |
| Female | 140 (46.7%) | $41,250 |
| Total | 300 (100.0%) | $57,381 |
Earnings by Sex by Income Bracket in Connoquenessing borough
The most common earnings brackets in Connoquenessing borough are $100,000+ for men (54 | 33.8%) and $100,000+ for women (25 | 17.9%).
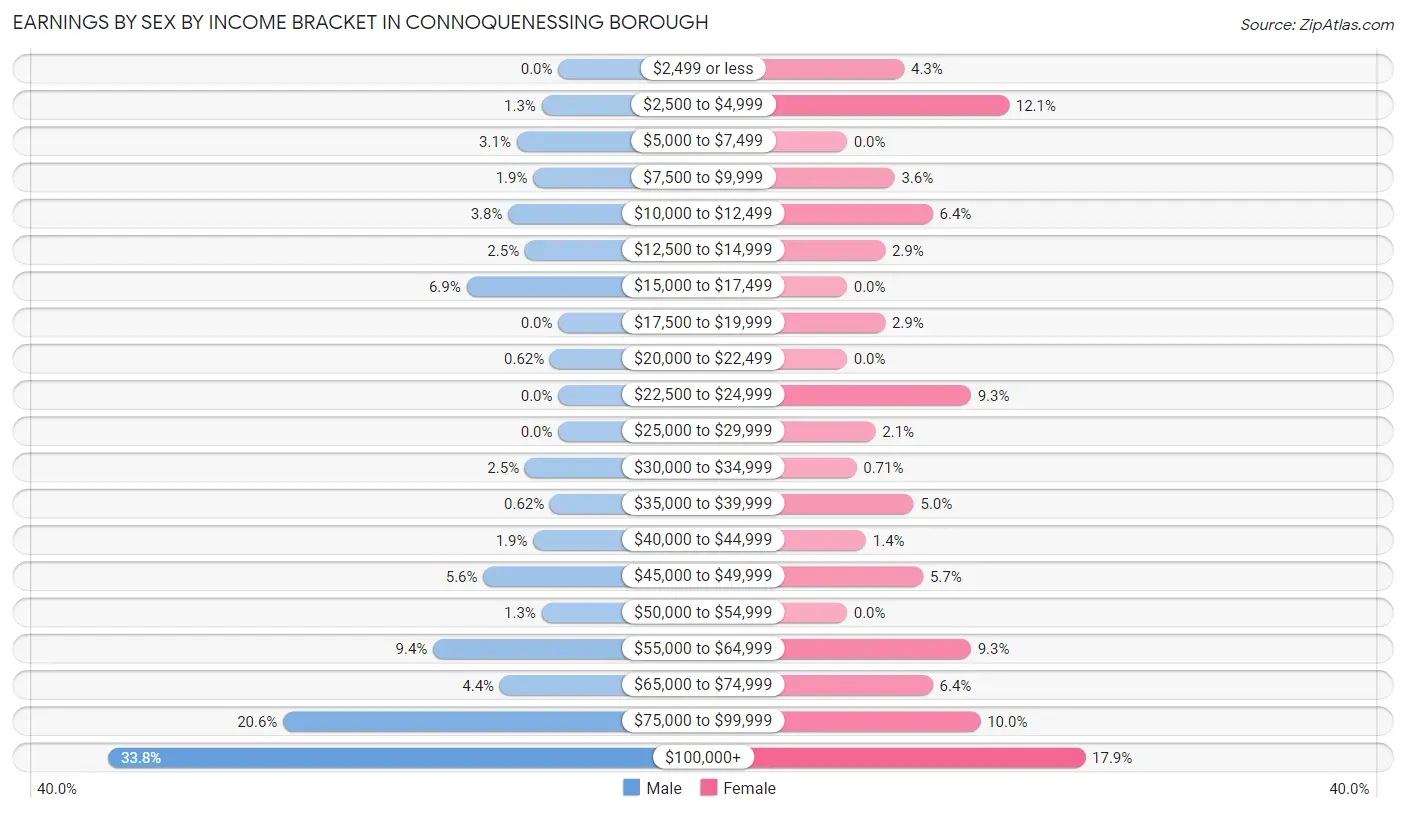
| Income | Male | Female |
| $2,499 or less | 0 (0.0%) | 6 (4.3%) |
| $2,500 to $4,999 | 2 (1.3%) | 17 (12.1%) |
| $5,000 to $7,499 | 5 (3.1%) | 0 (0.0%) |
| $7,500 to $9,999 | 3 (1.9%) | 5 (3.6%) |
| $10,000 to $12,499 | 6 (3.7%) | 9 (6.4%) |
| $12,500 to $14,999 | 4 (2.5%) | 4 (2.9%) |
| $15,000 to $17,499 | 11 (6.9%) | 0 (0.0%) |
| $17,500 to $19,999 | 0 (0.0%) | 4 (2.9%) |
| $20,000 to $22,499 | 1 (0.6%) | 0 (0.0%) |
| $22,500 to $24,999 | 0 (0.0%) | 13 (9.3%) |
| $25,000 to $29,999 | 0 (0.0%) | 3 (2.1%) |
| $30,000 to $34,999 | 4 (2.5%) | 1 (0.7%) |
| $35,000 to $39,999 | 1 (0.6%) | 7 (5.0%) |
| $40,000 to $44,999 | 3 (1.9%) | 2 (1.4%) |
| $45,000 to $49,999 | 9 (5.6%) | 8 (5.7%) |
| $50,000 to $54,999 | 2 (1.3%) | 0 (0.0%) |
| $55,000 to $64,999 | 15 (9.4%) | 13 (9.3%) |
| $65,000 to $74,999 | 7 (4.4%) | 9 (6.4%) |
| $75,000 to $99,999 | 33 (20.6%) | 14 (10.0%) |
| $100,000+ | 54 (33.8%) | 25 (17.9%) |
| Total | 160 (100.0%) | 140 (100.0%) |
Earnings by Sex by Educational Attainment in Connoquenessing borough
Average earnings in Connoquenessing borough are $83,281 for men and $48,281 for women, a difference of 42.0%. Men with an educational attainment of bachelor's degree enjoy the highest average annual earnings of $101,161, while those with high school diploma education earn the least with $48,542. Women with an educational attainment of bachelor's degree earn the most with the average annual earnings of $52,500, while those with graduate degree education have the smallest earnings of $32,500.
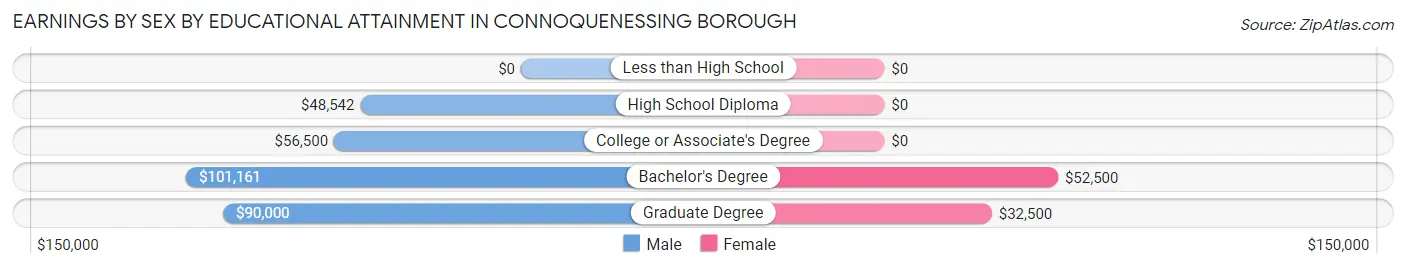
| Educational Attainment | Male Income | Female Income |
| Less than High School | - | - |
| High School Diploma | $48,542 | $0 |
| College or Associate's Degree | $56,500 | $0 |
| Bachelor's Degree | $101,161 | $52,500 |
| Graduate Degree | $90,000 | $32,500 |
| Total | $83,281 | $48,281 |
Family Income in Connoquenessing borough
Family Income Brackets in Connoquenessing borough
According to the Connoquenessing borough family income data, there are 40 families falling into the $100,000 to $149,999 income range, which is the most common income bracket and makes up 19.8% of all families. Conversely, the less than $10,000 income bracket is the least frequent group with only 4 families (2.0%) belonging to this category.
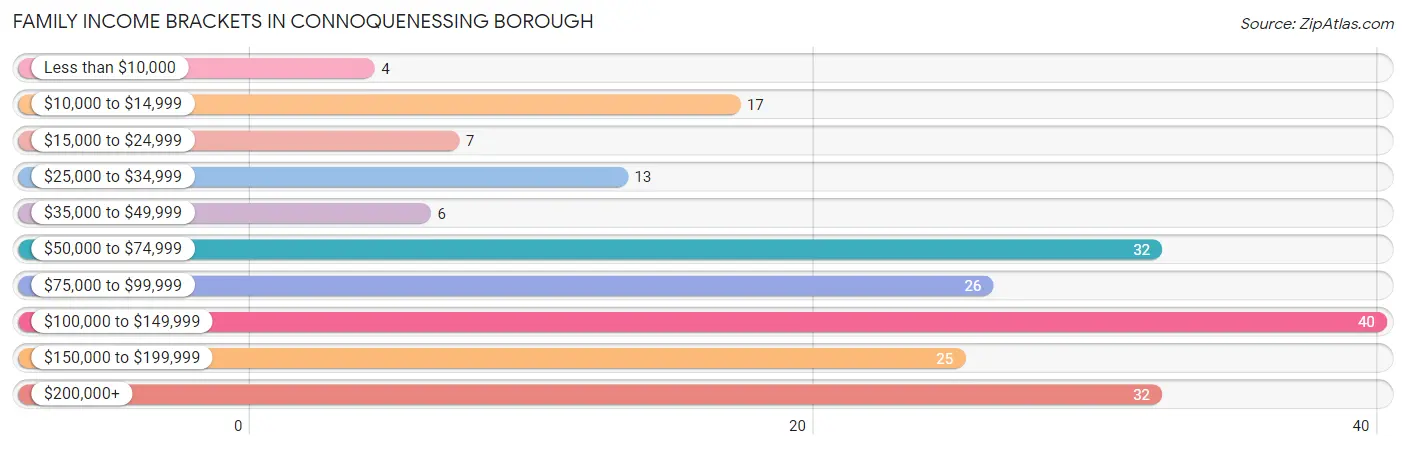
| Income Bracket | # Families | % Families |
| Less than $10,000 | 4 | 2.0% |
| $10,000 to $14,999 | 17 | 8.4% |
| $15,000 to $24,999 | 7 | 3.5% |
| $25,000 to $34,999 | 13 | 6.4% |
| $35,000 to $49,999 | 6 | 3.0% |
| $50,000 to $74,999 | 32 | 15.8% |
| $75,000 to $99,999 | 26 | 12.9% |
| $100,000 to $149,999 | 40 | 19.8% |
| $150,000 to $199,999 | 25 | 12.4% |
| $200,000+ | 32 | 15.8% |
Family Income by Famaliy Size in Connoquenessing borough
4-person families (40 | 19.8%) account for the highest median family income in Connoquenessing borough with $134,167 per family, while 2-person families (103 | 51.0%) have the highest median income of $51,875 per family member.
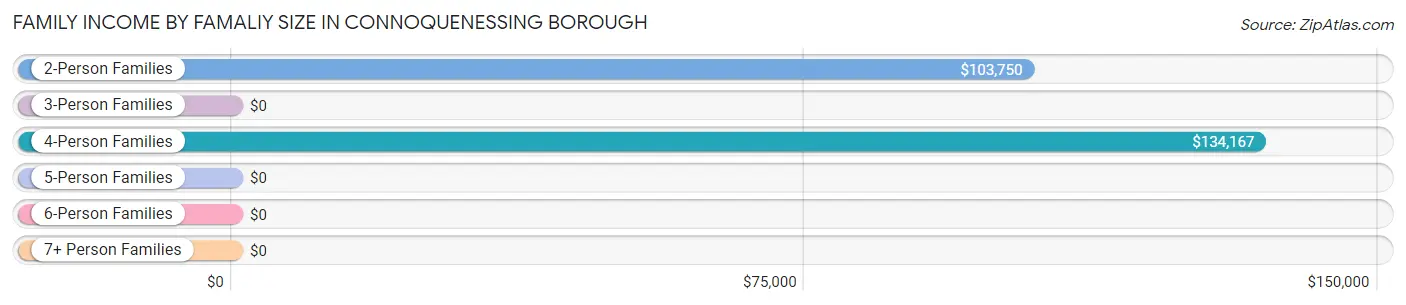
| Income Bracket | # Families | Median Income |
| 2-Person Families | 103 (51.0%) | $103,750 |
| 3-Person Families | 39 (19.3%) | $0 |
| 4-Person Families | 40 (19.8%) | $134,167 |
| 5-Person Families | 15 (7.4%) | $0 |
| 6-Person Families | 5 (2.5%) | $0 |
| 7+ Person Families | 0 (0.0%) | $0 |
| Total | 202 (100.0%) | $96,250 |
Family Income by Number of Earners in Connoquenessing borough
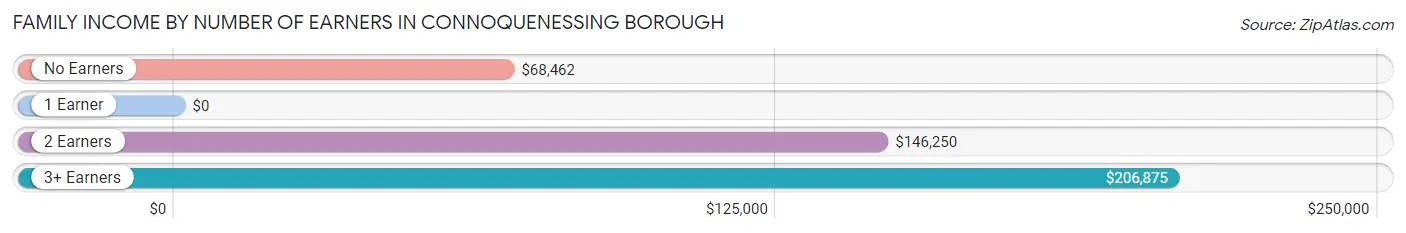
| Number of Earners | # Families | Median Income |
| No Earners | 40 (19.8%) | $68,462 |
| 1 Earner | 64 (31.7%) | $0 |
| 2 Earners | 91 (45.1%) | $146,250 |
| 3+ Earners | 7 (3.5%) | $206,875 |
| Total | 202 (100.0%) | $96,250 |
Household Income in Connoquenessing borough
Household Income Brackets in Connoquenessing borough
With 53 households falling in the category, the $100,000 to $149,999 income range is the most frequent in Connoquenessing borough, accounting for 21.5% of all households. In contrast, only 4 households (1.6%) fall into the less than $10,000 income bracket, making it the least populous group.
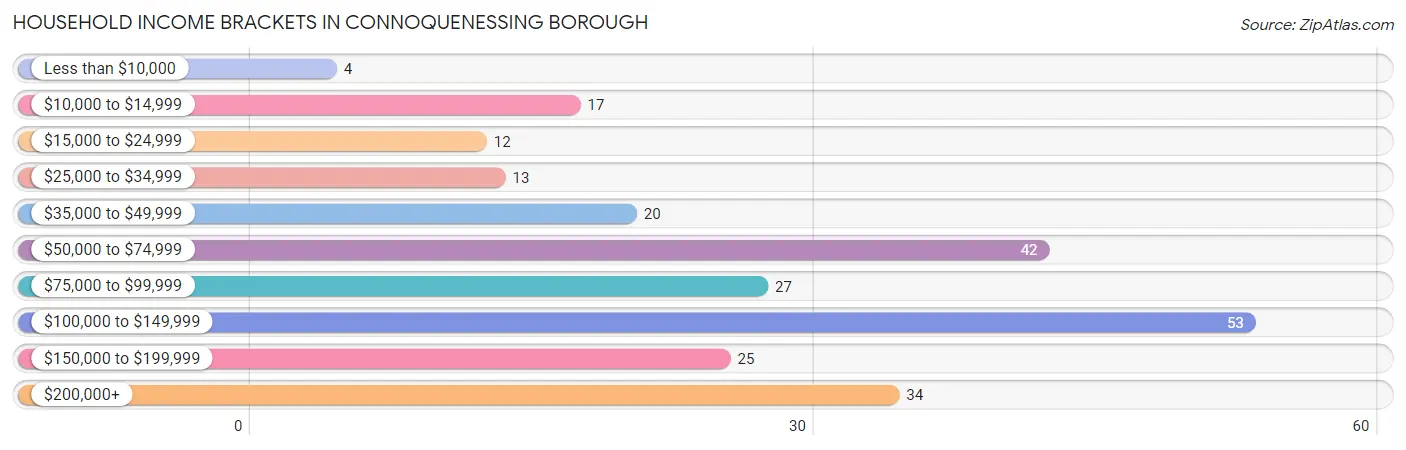
| Income Bracket | # Households | % Households |
| Less than $10,000 | 4 | 1.6% |
| $10,000 to $14,999 | 17 | 6.9% |
| $15,000 to $24,999 | 12 | 4.9% |
| $25,000 to $34,999 | 13 | 5.3% |
| $35,000 to $49,999 | 20 | 8.1% |
| $50,000 to $74,999 | 42 | 17.0% |
| $75,000 to $99,999 | 27 | 10.9% |
| $100,000 to $149,999 | 53 | 21.5% |
| $150,000 to $199,999 | 25 | 10.1% |
| $200,000+ | 34 | 13.8% |
Household Income by Householder Age in Connoquenessing borough
The median household income in Connoquenessing borough is $79,911, with the highest median household income of $150,417 found in the 45 to 64 years age bracket for the primary householder. A total of 73 households (29.5%) fall into this category.
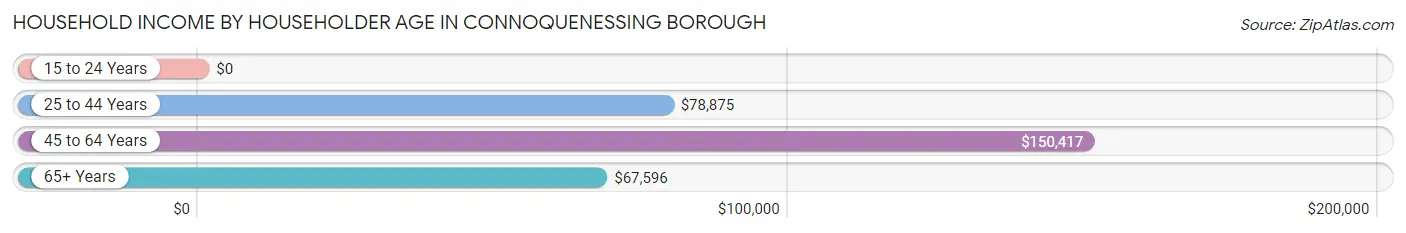
| Income Bracket | # Households | Median Income |
| 15 to 24 Years | 0 (0.0%) | $0 |
| 25 to 44 Years | 105 (42.5%) | $78,875 |
| 45 to 64 Years | 73 (29.5%) | $150,417 |
| 65+ Years | 69 (27.9%) | $67,596 |
| Total | 247 (100.0%) | $79,911 |
Poverty in Connoquenessing borough
Income Below Poverty by Sex and Age in Connoquenessing borough
With 20.1% poverty level for males and 20.7% for females among the residents of Connoquenessing borough, 15 year old males and 15 year old females are the most vulnerable to poverty, with 5 males (100.0%) and 4 females (100.0%) in their respective age groups living below the poverty level.
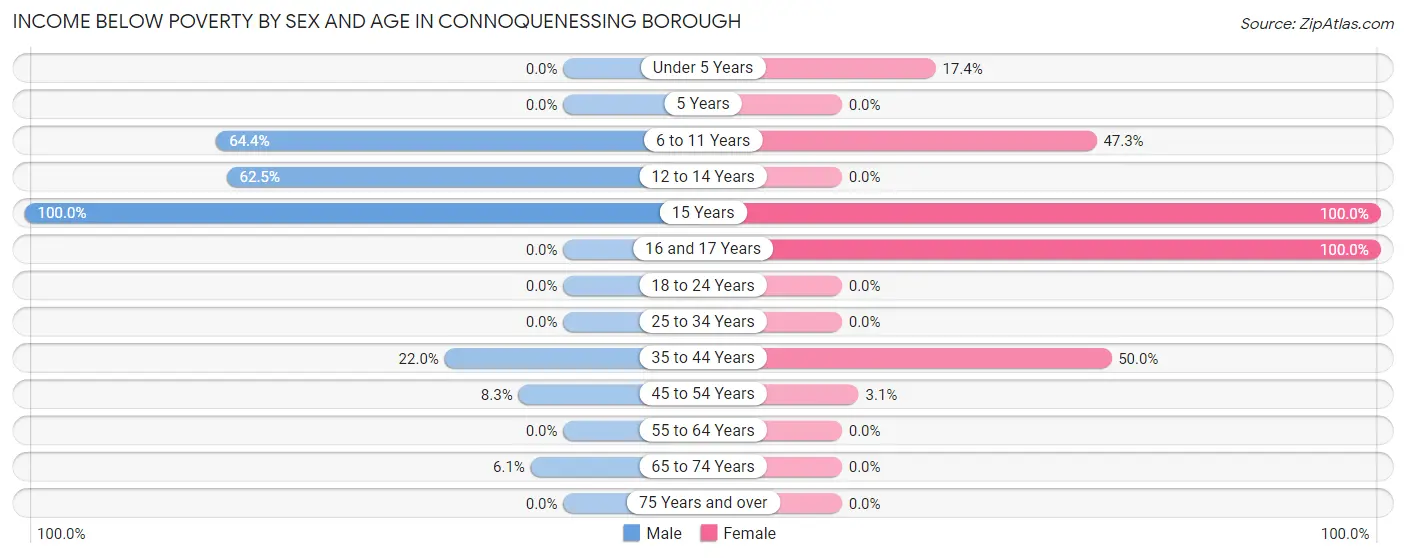
| Age Bracket | Male | Female |
| Under 5 Years | 0 (0.0%) | 4 (17.4%) |
| 5 Years | 0 (0.0%) | 0 (0.0%) |
| 6 to 11 Years | 38 (64.4%) | 26 (47.3%) |
| 12 to 14 Years | 5 (62.5%) | 0 (0.0%) |
| 15 Years | 5 (100.0%) | 4 (100.0%) |
| 16 and 17 Years | 0 (0.0%) | 5 (100.0%) |
| 18 to 24 Years | 0 (0.0%) | 0 (0.0%) |
| 25 to 34 Years | 0 (0.0%) | 0 (0.0%) |
| 35 to 44 Years | 13 (22.0%) | 27 (50.0%) |
| 45 to 54 Years | 2 (8.3%) | 1 (3.1%) |
| 55 to 64 Years | 0 (0.0%) | 0 (0.0%) |
| 65 to 74 Years | 2 (6.1%) | 0 (0.0%) |
| 75 Years and over | 0 (0.0%) | 0 (0.0%) |
| Total | 65 (20.1%) | 67 (20.7%) |
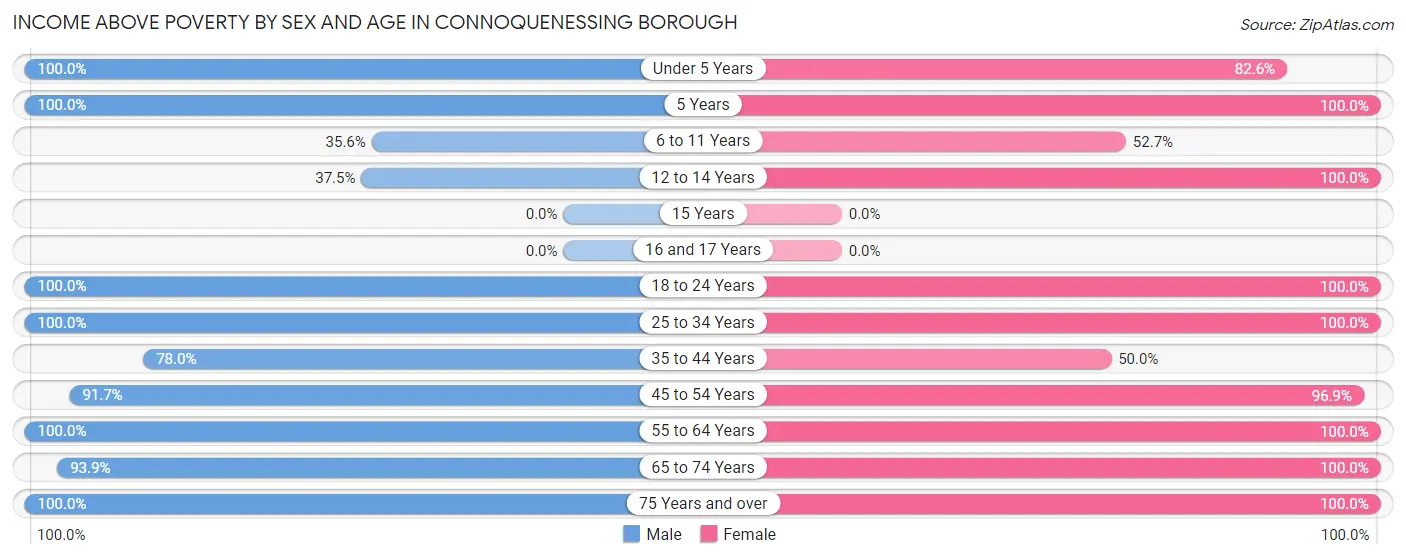
Income Above Poverty by Sex and Age in Connoquenessing borough
According to the poverty statistics in Connoquenessing borough, males aged under 5 years and females aged 5 years are the age groups that are most secure financially, with 100.0% of males and 100.0% of females in these age groups living above the poverty line.
| Age Bracket | Male | Female |
| Under 5 Years | 24 (100.0%) | 19 (82.6%) |
| 5 Years | 1 (100.0%) | 7 (100.0%) |
| 6 to 11 Years | 21 (35.6%) | 29 (52.7%) |
| 12 to 14 Years | 3 (37.5%) | 2 (100.0%) |
| 15 Years | 0 (0.0%) | 0 (0.0%) |
| 16 and 17 Years | 0 (0.0%) | 0 (0.0%) |
| 18 to 24 Years | 7 (100.0%) | 7 (100.0%) |
| 25 to 34 Years | 30 (100.0%) | 29 (100.0%) |
| 35 to 44 Years | 46 (78.0%) | 27 (50.0%) |
| 45 to 54 Years | 22 (91.7%) | 31 (96.9%) |
| 55 to 64 Years | 43 (100.0%) | 35 (100.0%) |
| 65 to 74 Years | 31 (93.9%) | 41 (100.0%) |
| 75 Years and over | 31 (100.0%) | 29 (100.0%) |
| Total | 259 (79.9%) | 256 (79.3%) |
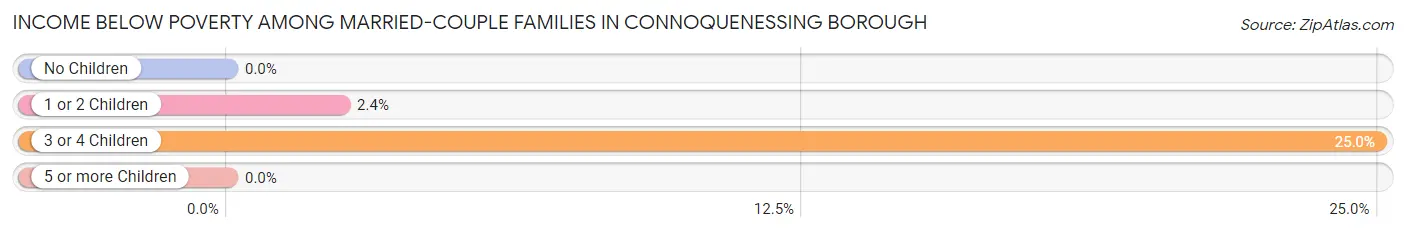
Income Below Poverty Among Married-Couple Families in Connoquenessing borough
The poverty statistics for married-couple families in Connoquenessing borough show that 3.7% or 6 of the total 163 families live below the poverty line. Families with 3 or 4 children have the highest poverty rate of 25.0%, comprising of 5 families. On the other hand, families with no children have the lowest poverty rate of 0.0%, which includes 0 families.
| Children | Above Poverty | Below Poverty |
| No Children | 102 (100.0%) | 0 (0.0%) |
| 1 or 2 Children | 40 (97.6%) | 1 (2.4%) |
| 3 or 4 Children | 15 (75.0%) | 5 (25.0%) |
| 5 or more Children | 0 (0.0%) | 0 (0.0%) |
| Total | 157 (96.3%) | 6 (3.7%) |
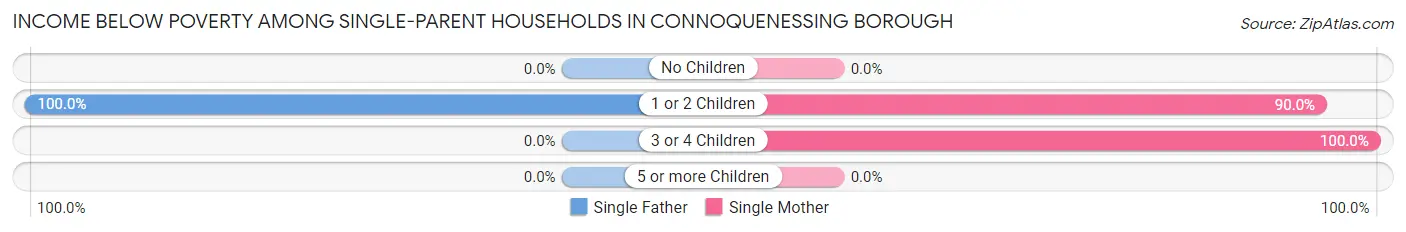
Income Below Poverty Among Single-Parent Households in Connoquenessing borough
According to the poverty data in Connoquenessing borough, 55.6% or 5 single-father households and 73.3% or 22 single-mother households are living below the poverty line. Among single-father households, those with 1 or 2 children have the highest poverty rate, with 5 households (100.0%) experiencing poverty. Likewise, among single-mother households, those with 3 or 4 children have the highest poverty rate, with 4 households (100.0%) falling below the poverty line.
| Children | Single Father | Single Mother |
| No Children | 0 (0.0%) | 0 (0.0%) |
| 1 or 2 Children | 5 (100.0%) | 18 (90.0%) |
| 3 or 4 Children | 0 (0.0%) | 4 (100.0%) |
| 5 or more Children | 0 (0.0%) | 0 (0.0%) |
| Total | 5 (55.6%) | 22 (73.3%) |
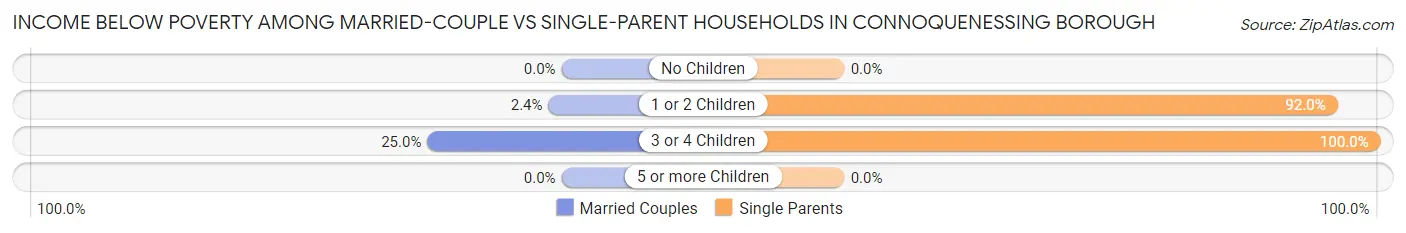
Income Below Poverty Among Married-Couple vs Single-Parent Households in Connoquenessing borough
The poverty data for Connoquenessing borough shows that 6 of the married-couple family households (3.7%) and 27 of the single-parent households (69.2%) are living below the poverty level. Within the married-couple family households, those with 3 or 4 children have the highest poverty rate, with 5 households (25.0%) falling below the poverty line. Among the single-parent households, those with 3 or 4 children have the highest poverty rate, with 4 household (100.0%) living below poverty.
| Children | Married-Couple Families | Single-Parent Households |
| No Children | 0 (0.0%) | 0 (0.0%) |
| 1 or 2 Children | 1 (2.4%) | 23 (92.0%) |
| 3 or 4 Children | 5 (25.0%) | 4 (100.0%) |
| 5 or more Children | 0 (0.0%) | 0 (0.0%) |
| Total | 6 (3.7%) | 27 (69.2%) |
Employment Characteristics in Connoquenessing borough
Employment by Class of Employer in Connoquenessing borough
Among the 264 employed individuals in Connoquenessing borough, private company employees (192 | 72.7%), not-for-profit organizations (32 | 12.1%), and federal government employees (13 | 4.9%) make up the most common classes of employment.
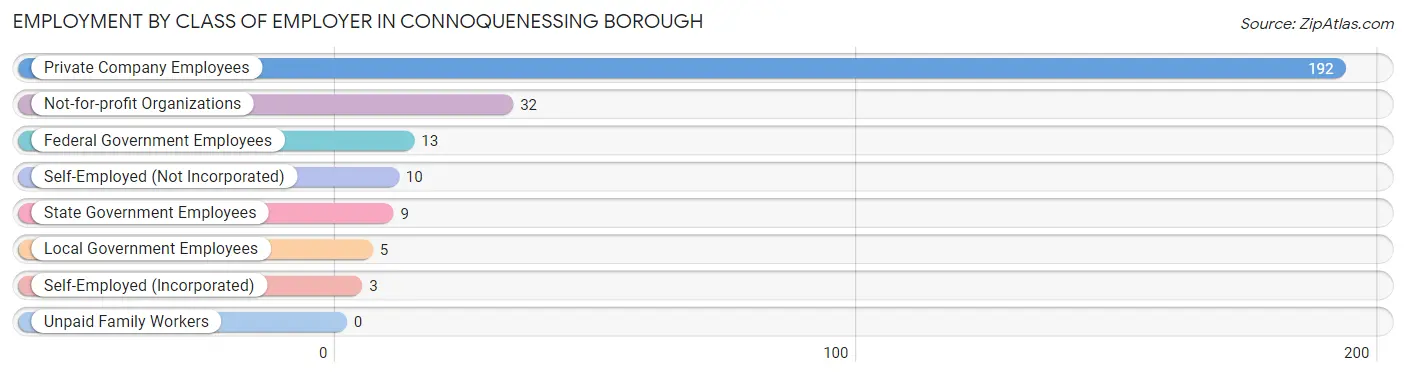
| Employer Class | # Employees | % Employees |
| Private Company Employees | 192 | 72.7% |
| Self-Employed (Incorporated) | 3 | 1.1% |
| Self-Employed (Not Incorporated) | 10 | 3.8% |
| Not-for-profit Organizations | 32 | 12.1% |
| Local Government Employees | 5 | 1.9% |
| State Government Employees | 9 | 3.4% |
| Federal Government Employees | 13 | 4.9% |
| Unpaid Family Workers | 0 | 0.0% |
| Total | 264 | 100.0% |
Employment Status by Age in Connoquenessing borough
According to the labor force statistics for Connoquenessing borough, out of the total population over 16 years of age (459), 58.8% or 270 individuals are in the labor force, with 2.2% or 6 of them unemployed. The age group with the highest labor force participation rate is 25 to 29 years, with 100.0% or 18 individuals in the labor force. Within the labor force, the 60 to 64 years age range has the highest percentage of unemployed individuals, with 15.0% or 3 of them being unemployed.
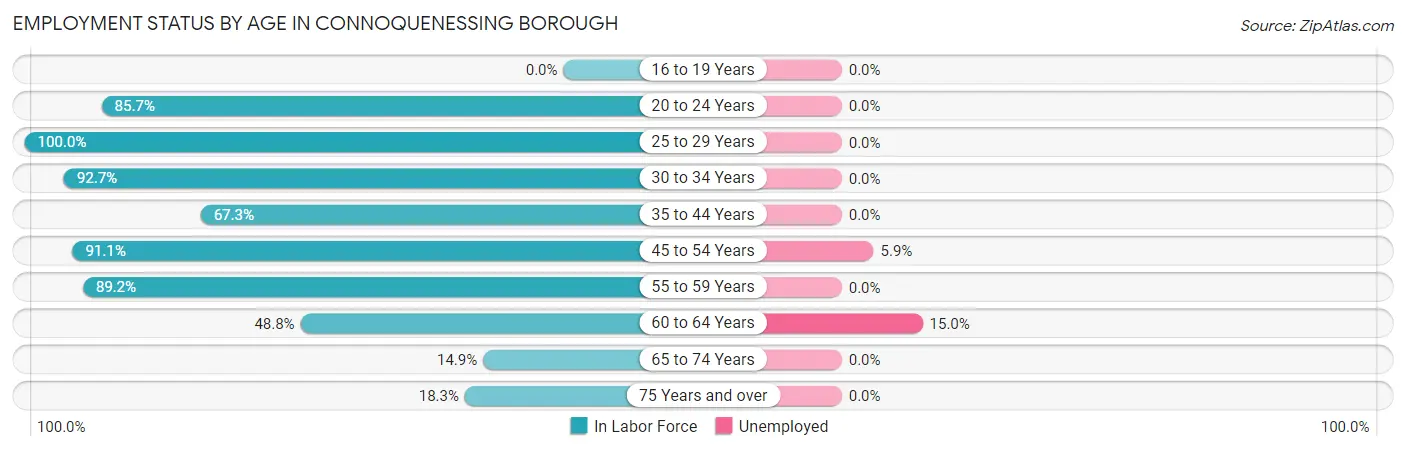
| Age Bracket | In Labor Force | Unemployed |
| 16 to 19 Years | 0 (0.0%) | 0 (0.0%) |
| 20 to 24 Years | 12 (85.7%) | 0 (0.0%) |
| 25 to 29 Years | 18 (100.0%) | 0 (0.0%) |
| 30 to 34 Years | 38 (92.7%) | 0 (0.0%) |
| 35 to 44 Years | 76 (67.3%) | 0 (0.0%) |
| 45 to 54 Years | 51 (91.1%) | 3 (5.9%) |
| 55 to 59 Years | 33 (89.2%) | 0 (0.0%) |
| 60 to 64 Years | 20 (48.8%) | 3 (15.0%) |
| 65 to 74 Years | 11 (14.9%) | 0 (0.0%) |
| 75 Years and over | 11 (18.3%) | 0 (0.0%) |
| Total | 270 (58.8%) | 6 (2.2%) |
Employment Status by Educational Attainment in Connoquenessing borough
According to labor force statistics for Connoquenessing borough, 77.1% of individuals (236) out of the total population between 25 and 64 years of age (306) are in the labor force, with 2.5% or 6 of them being unemployed. The group with the highest labor force participation rate are those with the educational attainment of college / associate degree, with 90.0% or 90 individuals in the labor force. Within the labor force, individuals with high school diploma education have the highest percentage of unemployment, with 8.3% or 3 of them being unemployed.
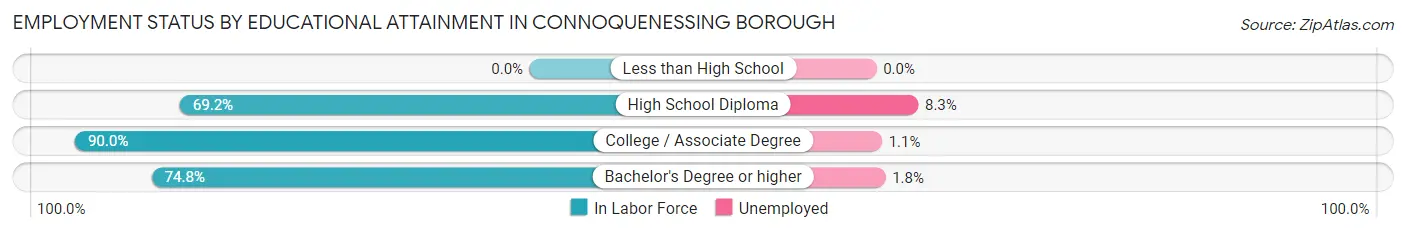
| Educational Attainment | In Labor Force | Unemployed |
| Less than High School | 0 (0.0%) | 0 (0.0%) |
| High School Diploma | 36 (69.2%) | 4 (8.3%) |
| College / Associate Degree | 90 (90.0%) | 1 (1.1%) |
| Bachelor's Degree or higher | 110 (74.8%) | 3 (1.8%) |
| Total | 236 (77.1%) | 8 (2.5%) |
Employment Occupations by Sex in Connoquenessing borough
Management, Business, Science and Arts Occupations
The most common Management, Business, Science and Arts occupations in Connoquenessing borough are Business & Financial (33 | 12.5%), Computers, Engineering & Science (33 | 12.5%), Management (23 | 8.7%), Community & Social Service (19 | 7.2%), and Computers & Mathematics (16 | 6.1%).
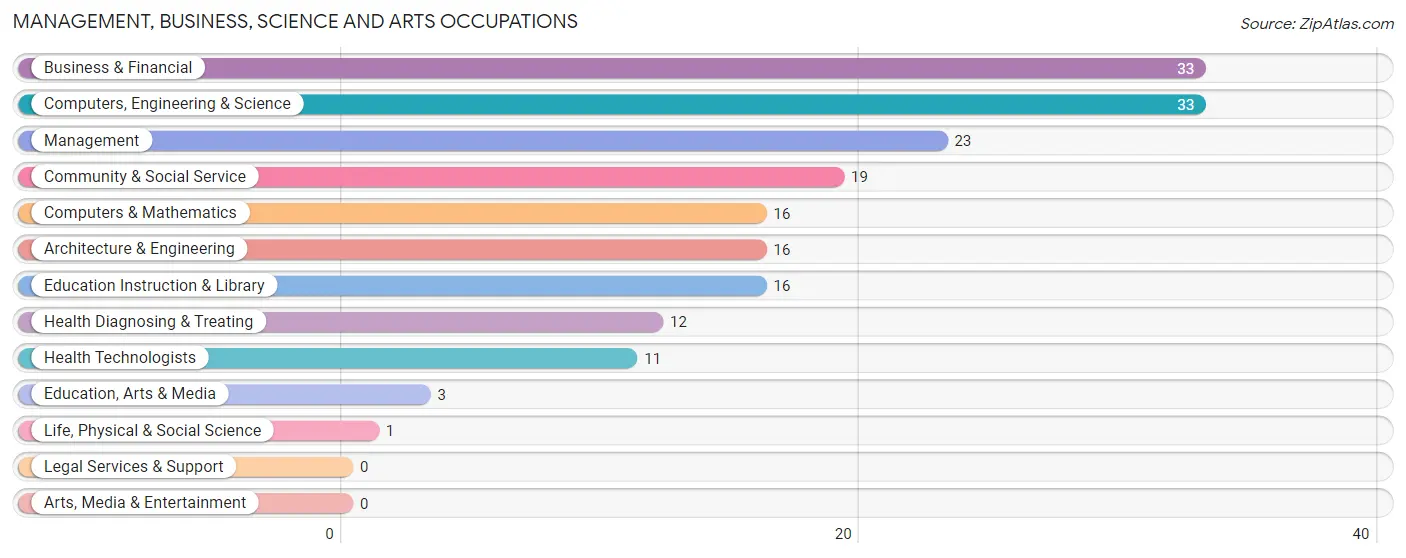
Management, Business, Science and Arts Occupations by Sex
Within the Management, Business, Science and Arts occupations in Connoquenessing borough, the most male-oriented occupations are Architecture & Engineering (100.0%), Education, Arts & Media (100.0%), and Computers, Engineering & Science (78.8%), while the most female-oriented occupations are Life, Physical & Social Science (100.0%), Education Instruction & Library (100.0%), and Health Diagnosing & Treating (100.0%).
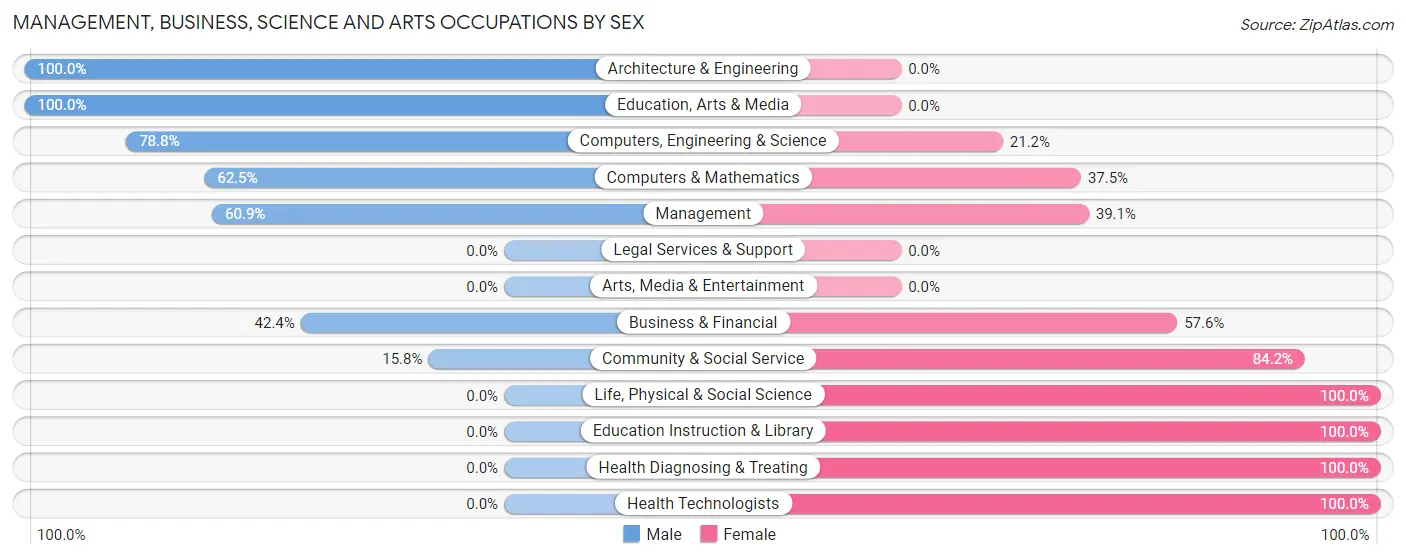
| Occupation | Male | Female |
| Management | 14 (60.9%) | 9 (39.1%) |
| Business & Financial | 14 (42.4%) | 19 (57.6%) |
| Computers, Engineering & Science | 26 (78.8%) | 7 (21.2%) |
| Computers & Mathematics | 10 (62.5%) | 6 (37.5%) |
| Architecture & Engineering | 16 (100.0%) | 0 (0.0%) |
| Life, Physical & Social Science | 0 (0.0%) | 1 (100.0%) |
| Community & Social Service | 3 (15.8%) | 16 (84.2%) |
| Education, Arts & Media | 3 (100.0%) | 0 (0.0%) |
| Legal Services & Support | 0 (0.0%) | 0 (0.0%) |
| Education Instruction & Library | 0 (0.0%) | 16 (100.0%) |
| Arts, Media & Entertainment | 0 (0.0%) | 0 (0.0%) |
| Health Diagnosing & Treating | 0 (0.0%) | 12 (100.0%) |
| Health Technologists | 0 (0.0%) | 11 (100.0%) |
| Total (Category) | 57 (47.5%) | 63 (52.5%) |
| Total (Overall) | 145 (54.9%) | 119 (45.1%) |
Services Occupations
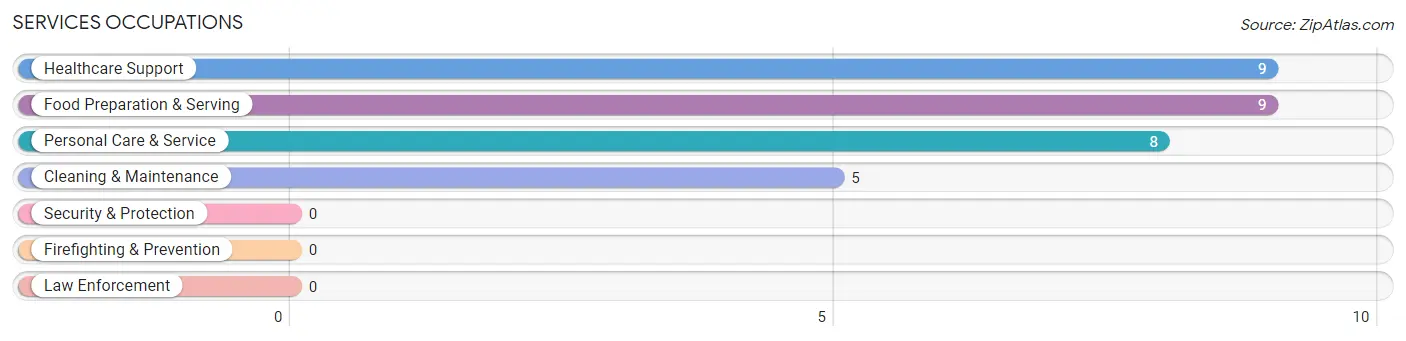
The most common Services occupations in Connoquenessing borough are Healthcare Support (9 | 3.4%), Food Preparation & Serving (9 | 3.4%), Personal Care & Service (8 | 3.0%), and Cleaning & Maintenance (5 | 1.9%).
Services Occupations by Sex
Within the Services occupations in Connoquenessing borough, the most male-oriented occupations are Cleaning & Maintenance (80.0%), and Healthcare Support (55.6%), while the most female-oriented occupations are Food Preparation & Serving (100.0%), Personal Care & Service (100.0%), and Healthcare Support (44.4%).
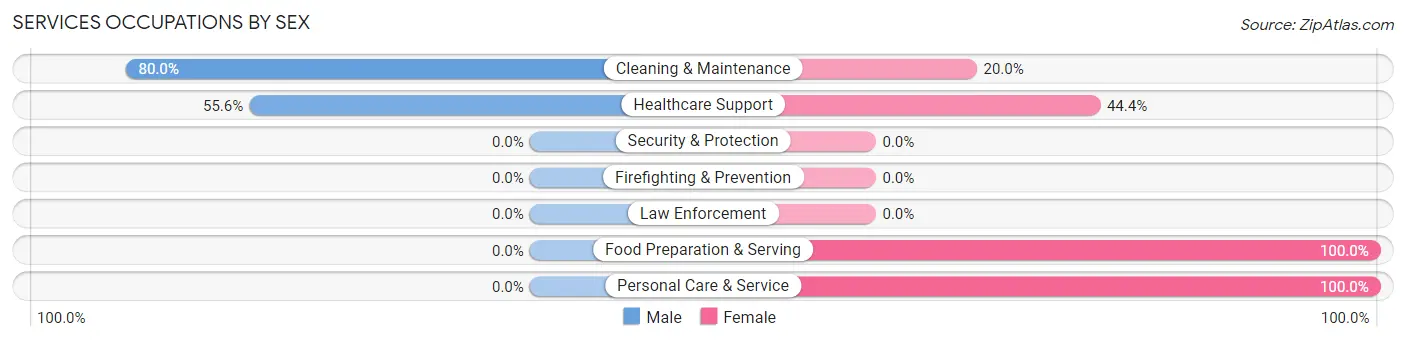
| Occupation | Male | Female |
| Healthcare Support | 5 (55.6%) | 4 (44.4%) |
| Security & Protection | 0 (0.0%) | 0 (0.0%) |
| Firefighting & Prevention | 0 (0.0%) | 0 (0.0%) |
| Law Enforcement | 0 (0.0%) | 0 (0.0%) |
| Food Preparation & Serving | 0 (0.0%) | 9 (100.0%) |
| Cleaning & Maintenance | 4 (80.0%) | 1 (20.0%) |
| Personal Care & Service | 0 (0.0%) | 8 (100.0%) |
| Total (Category) | 9 (29.0%) | 22 (71.0%) |
| Total (Overall) | 145 (54.9%) | 119 (45.1%) |
Sales and Office Occupations
The most common Sales and Office occupations in Connoquenessing borough are Office & Administration (31 | 11.7%), and Sales & Related (24 | 9.1%).
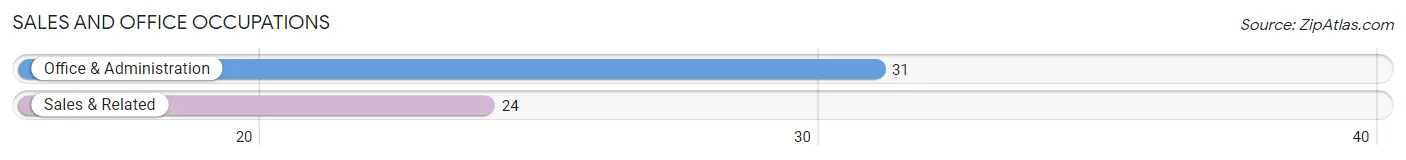
Sales and Office Occupations by Sex
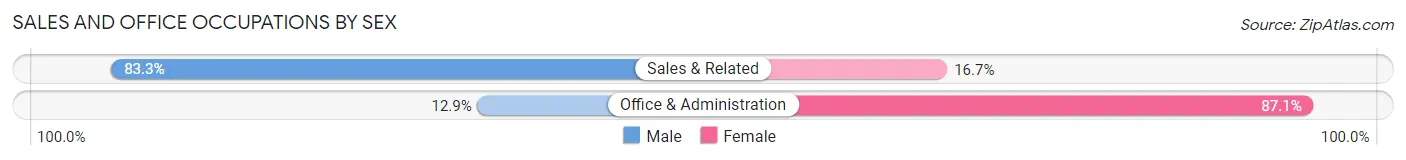
| Occupation | Male | Female |
| Sales & Related | 20 (83.3%) | 4 (16.7%) |
| Office & Administration | 4 (12.9%) | 27 (87.1%) |
| Total (Category) | 24 (43.6%) | 31 (56.4%) |
| Total (Overall) | 145 (54.9%) | 119 (45.1%) |
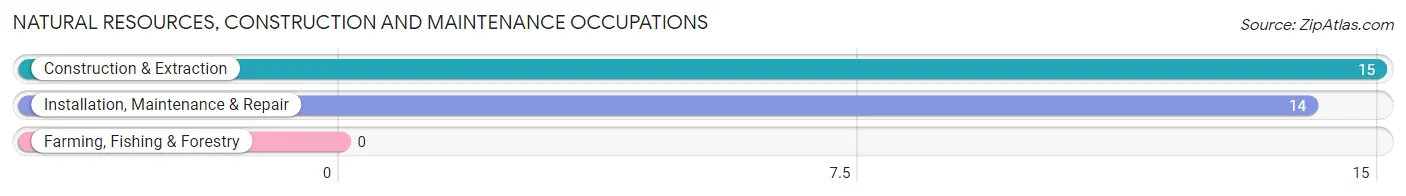
Natural Resources, Construction and Maintenance Occupations
The most common Natural Resources, Construction and Maintenance occupations in Connoquenessing borough are Construction & Extraction (15 | 5.7%), and Installation, Maintenance & Repair (14 | 5.3%).
Natural Resources, Construction and Maintenance Occupations by Sex
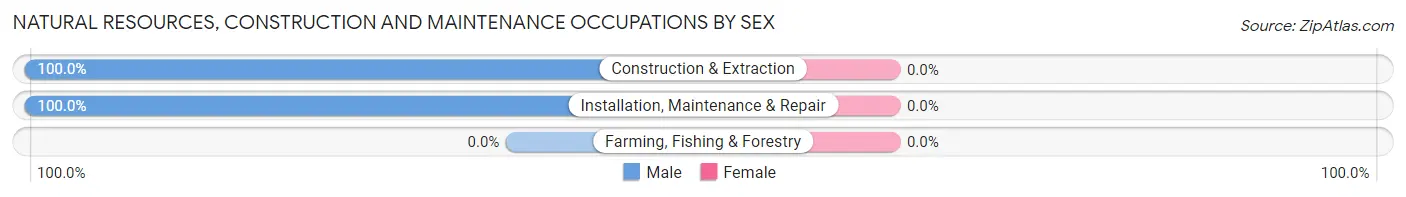
| Occupation | Male | Female |
| Farming, Fishing & Forestry | 0 (0.0%) | 0 (0.0%) |
| Construction & Extraction | 15 (100.0%) | 0 (0.0%) |
| Installation, Maintenance & Repair | 14 (100.0%) | 0 (0.0%) |
| Total (Category) | 29 (100.0%) | 0 (0.0%) |
| Total (Overall) | 145 (54.9%) | 119 (45.1%) |
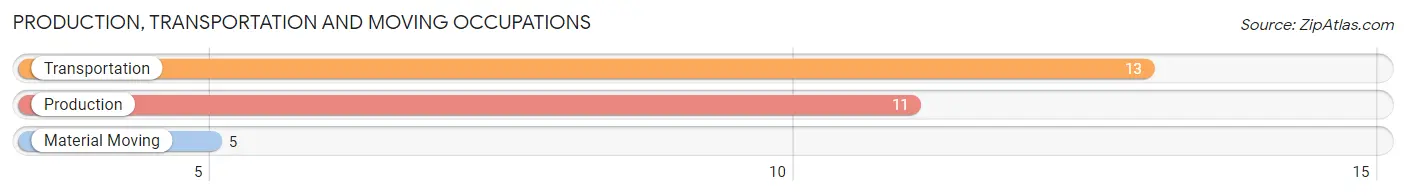
Production, Transportation and Moving Occupations
The most common Production, Transportation and Moving occupations in Connoquenessing borough are Transportation (13 | 4.9%), Production (11 | 4.2%), and Material Moving (5 | 1.9%).
Production, Transportation and Moving Occupations by Sex
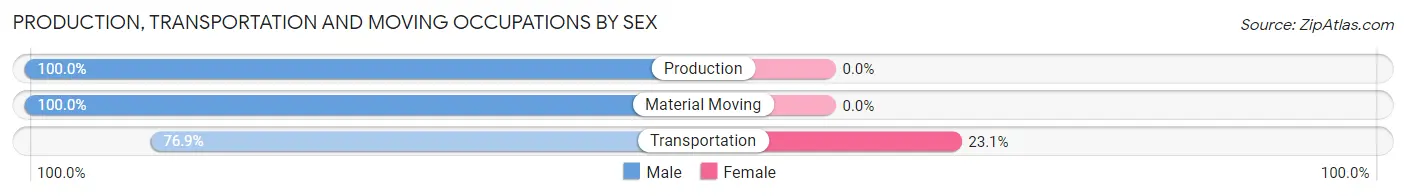
| Occupation | Male | Female |
| Production | 11 (100.0%) | 0 (0.0%) |
| Transportation | 10 (76.9%) | 3 (23.1%) |
| Material Moving | 5 (100.0%) | 0 (0.0%) |
| Total (Category) | 26 (89.7%) | 3 (10.3%) |
| Total (Overall) | 145 (54.9%) | 119 (45.1%) |
Employment Industries by Sex in Connoquenessing borough
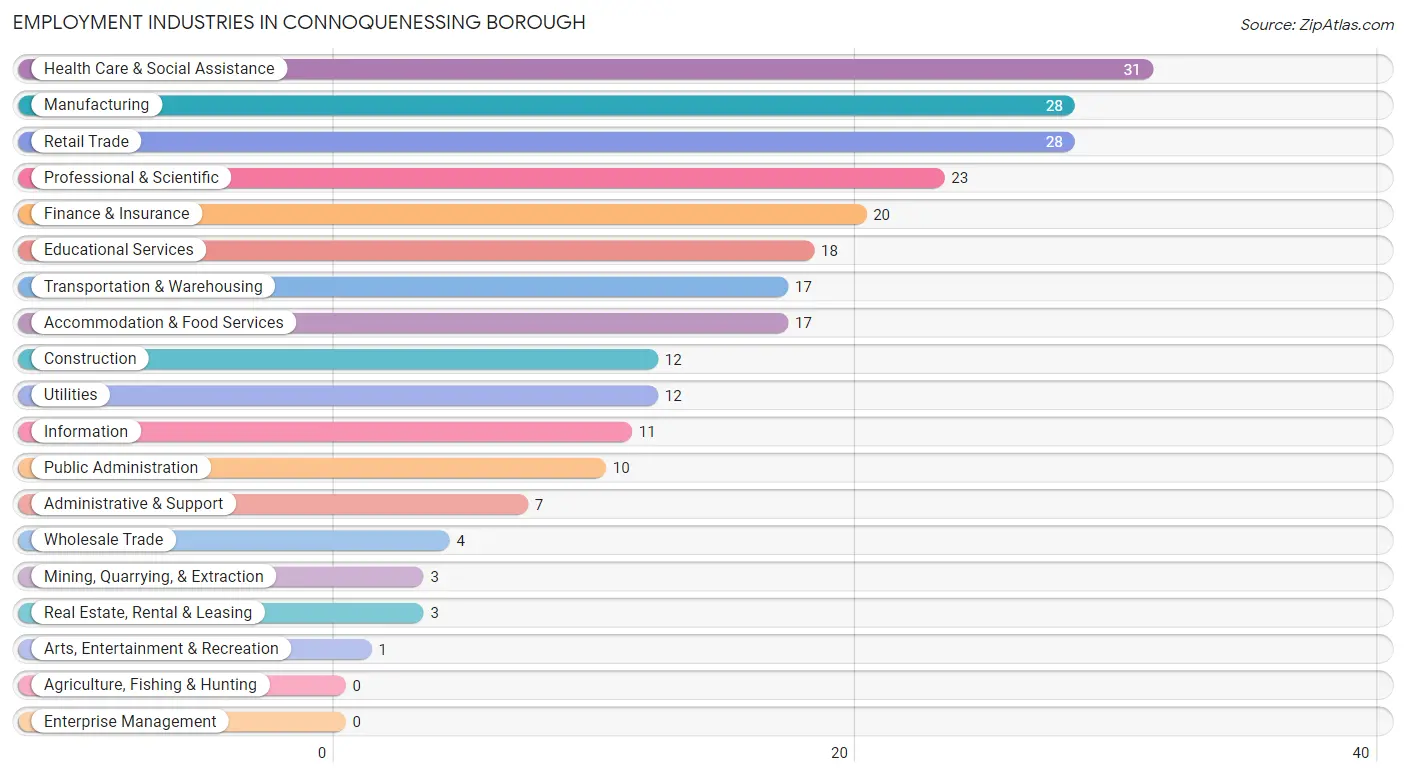
Employment Industries in Connoquenessing borough
The major employment industries in Connoquenessing borough include Health Care & Social Assistance (31 | 11.7%), Manufacturing (28 | 10.6%), Retail Trade (28 | 10.6%), Professional & Scientific (23 | 8.7%), and Finance & Insurance (20 | 7.6%).
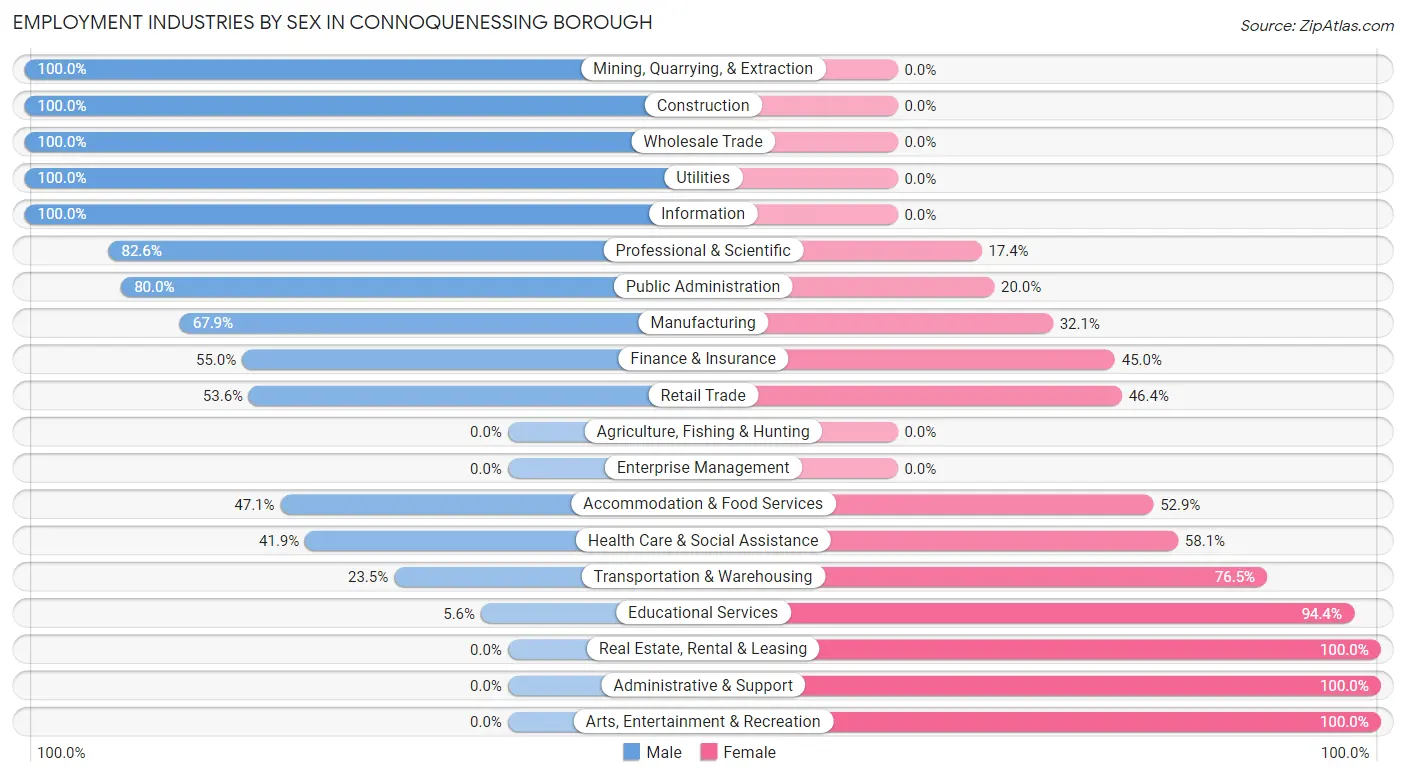
Employment Industries by Sex in Connoquenessing borough
The Connoquenessing borough industries that see more men than women are Mining, Quarrying, & Extraction (100.0%), Construction (100.0%), and Wholesale Trade (100.0%), whereas the industries that tend to have a higher number of women are Real Estate, Rental & Leasing (100.0%), Administrative & Support (100.0%), and Arts, Entertainment & Recreation (100.0%).
| Industry | Male | Female |
| Agriculture, Fishing & Hunting | 0 (0.0%) | 0 (0.0%) |
| Mining, Quarrying, & Extraction | 3 (100.0%) | 0 (0.0%) |
| Construction | 12 (100.0%) | 0 (0.0%) |
| Manufacturing | 19 (67.9%) | 9 (32.1%) |
| Wholesale Trade | 4 (100.0%) | 0 (0.0%) |
| Retail Trade | 15 (53.6%) | 13 (46.4%) |
| Transportation & Warehousing | 4 (23.5%) | 13 (76.5%) |
| Utilities | 12 (100.0%) | 0 (0.0%) |
| Information | 11 (100.0%) | 0 (0.0%) |
| Finance & Insurance | 11 (55.0%) | 9 (45.0%) |
| Real Estate, Rental & Leasing | 0 (0.0%) | 3 (100.0%) |
| Professional & Scientific | 19 (82.6%) | 4 (17.4%) |
| Enterprise Management | 0 (0.0%) | 0 (0.0%) |
| Administrative & Support | 0 (0.0%) | 7 (100.0%) |
| Educational Services | 1 (5.6%) | 17 (94.4%) |
| Health Care & Social Assistance | 13 (41.9%) | 18 (58.1%) |
| Arts, Entertainment & Recreation | 0 (0.0%) | 1 (100.0%) |
| Accommodation & Food Services | 8 (47.1%) | 9 (52.9%) |
| Public Administration | 8 (80.0%) | 2 (20.0%) |
| Total | 145 (54.9%) | 119 (45.1%) |
Education in Connoquenessing borough
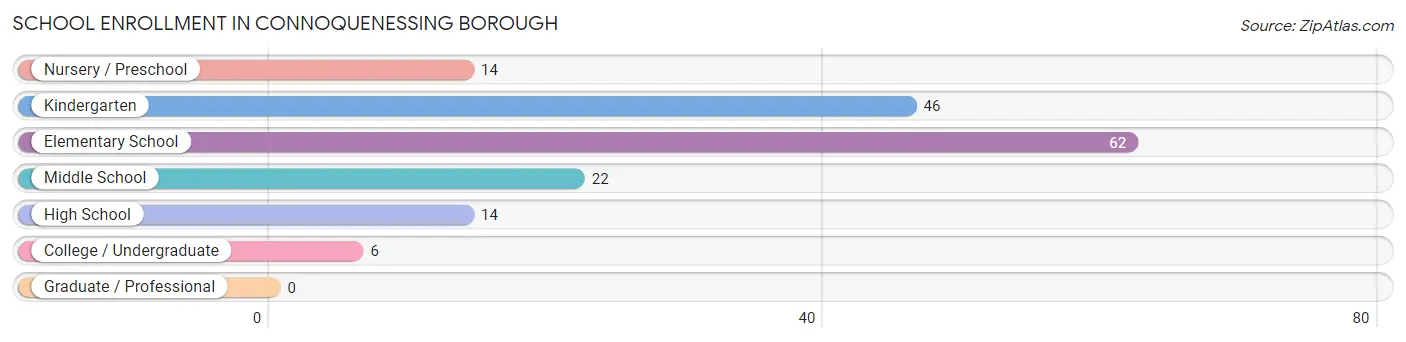
School Enrollment in Connoquenessing borough
The most common levels of schooling among the 164 students in Connoquenessing borough are elementary school (62 | 37.8%), kindergarten (46 | 28.1%), and middle school (22 | 13.4%).
| School Level | # Students | % Students |
| Nursery / Preschool | 14 | 8.5% |
| Kindergarten | 46 | 28.1% |
| Elementary School | 62 | 37.8% |
| Middle School | 22 | 13.4% |
| High School | 14 | 8.5% |
| College / Undergraduate | 6 | 3.7% |
| Graduate / Professional | 0 | 0.0% |
| Total | 164 | 100.0% |
School Enrollment by Age by Funding Source in Connoquenessing borough
Out of a total of 164 students who are enrolled in schools in Connoquenessing borough, 34 (20.7%) attend a private institution, while the remaining 130 (79.3%) are enrolled in public schools. The age group of 3 to 4 year olds has the highest likelihood of being enrolled in private schools, with 7 (53.8% in the age bracket) enrolled. Conversely, the age group of 15 to 17 year olds has the lowest likelihood of being enrolled in a private school, with 14 (100.0% in the age bracket) attending a public institution.
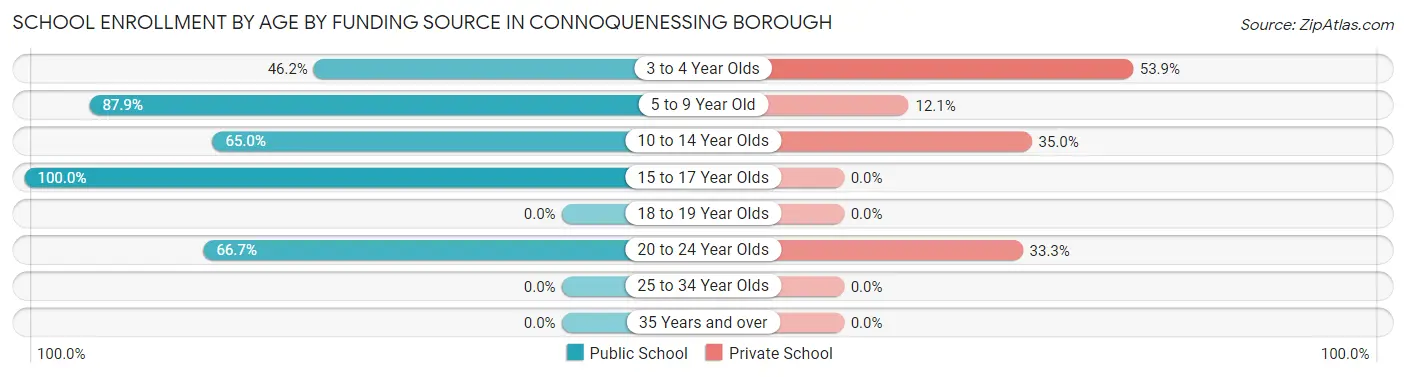
| Age Bracket | Public School | Private School |
| 3 to 4 Year Olds | 6 (46.2%) | 7 (53.8%) |
| 5 to 9 Year Old | 80 (87.9%) | 11 (12.1%) |
| 10 to 14 Year Olds | 26 (65.0%) | 14 (35.0%) |
| 15 to 17 Year Olds | 14 (100.0%) | 0 (0.0%) |
| 18 to 19 Year Olds | 0 (0.0%) | 0 (0.0%) |
| 20 to 24 Year Olds | 4 (66.7%) | 2 (33.3%) |
| 25 to 34 Year Olds | 0 (0.0%) | 0 (0.0%) |
| 35 Years and over | 0 (0.0%) | 0 (0.0%) |
| Total | 130 (79.3%) | 34 (20.7%) |
Educational Attainment by Field of Study in Connoquenessing borough
Science & technology (36 | 20.0%), business (29 | 16.1%), engineering (24 | 13.3%), computers & mathematics (22 | 12.2%), and education (20 | 11.1%) are the most common fields of study among 180 individuals in Connoquenessing borough who have obtained a bachelor's degree or higher.
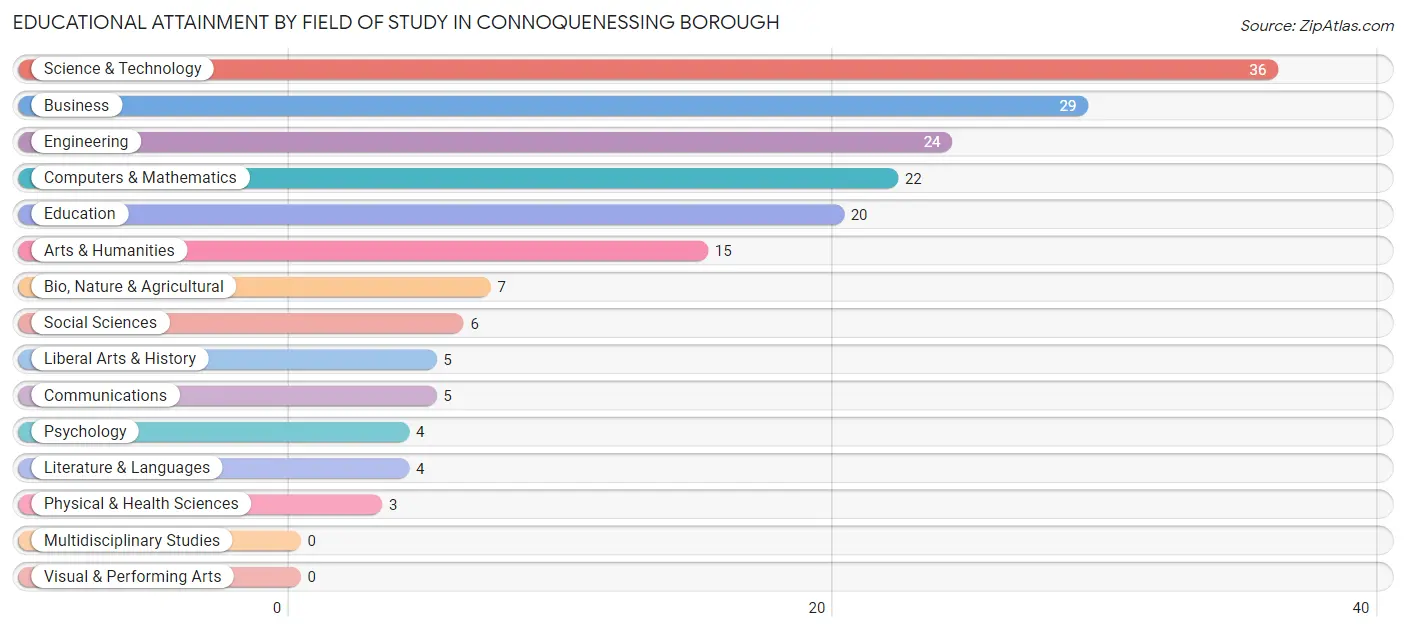
| Field of Study | # Graduates | % Graduates |
| Computers & Mathematics | 22 | 12.2% |
| Bio, Nature & Agricultural | 7 | 3.9% |
| Physical & Health Sciences | 3 | 1.7% |
| Psychology | 4 | 2.2% |
| Social Sciences | 6 | 3.3% |
| Engineering | 24 | 13.3% |
| Multidisciplinary Studies | 0 | 0.0% |
| Science & Technology | 36 | 20.0% |
| Business | 29 | 16.1% |
| Education | 20 | 11.1% |
| Literature & Languages | 4 | 2.2% |
| Liberal Arts & History | 5 | 2.8% |
| Visual & Performing Arts | 0 | 0.0% |
| Communications | 5 | 2.8% |
| Arts & Humanities | 15 | 8.3% |
| Total | 180 | 100.0% |
Transportation & Commute in Connoquenessing borough
Vehicle Availability by Sex in Connoquenessing borough
The most prevalent vehicle ownership categories in Connoquenessing borough are males with 2 vehicles (73, accounting for 50.3%) and females with 2 vehicles (71, making up 61.3%).
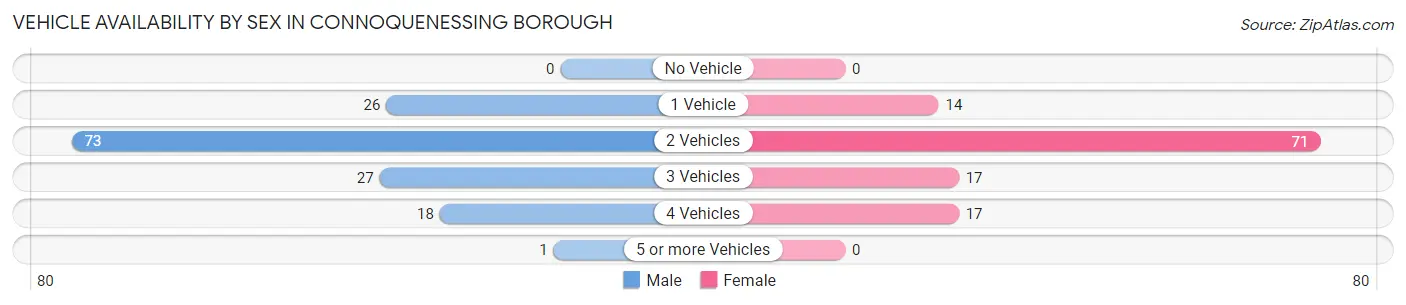
| Vehicles Available | Male | Female |
| No Vehicle | 0 (0.0%) | 0 (0.0%) |
| 1 Vehicle | 26 (17.9%) | 14 (11.8%) |
| 2 Vehicles | 73 (50.3%) | 71 (59.7%) |
| 3 Vehicles | 27 (18.6%) | 17 (14.3%) |
| 4 Vehicles | 18 (12.4%) | 17 (14.3%) |
| 5 or more Vehicles | 1 (0.7%) | 0 (0.0%) |
| Total | 145 (100.0%) | 119 (100.0%) |
Commute Time in Connoquenessing borough
The most frequently occuring commute durations in Connoquenessing borough are 15 to 19 minutes (63 commuters, 28.1%), 30 to 34 minutes (32 commuters, 14.3%), and 45 to 59 minutes (25 commuters, 11.2%).
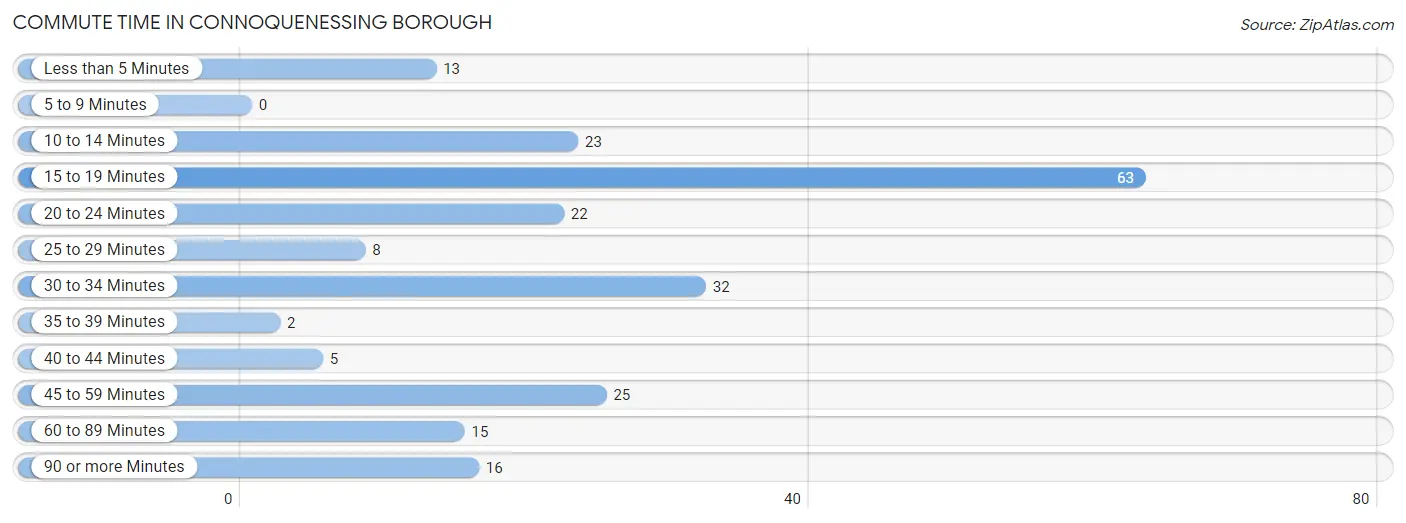
| Commute Time | # Commuters | % Commuters |
| Less than 5 Minutes | 13 | 5.8% |
| 5 to 9 Minutes | 0 | 0.0% |
| 10 to 14 Minutes | 23 | 10.3% |
| 15 to 19 Minutes | 63 | 28.1% |
| 20 to 24 Minutes | 22 | 9.8% |
| 25 to 29 Minutes | 8 | 3.6% |
| 30 to 34 Minutes | 32 | 14.3% |
| 35 to 39 Minutes | 2 | 0.9% |
| 40 to 44 Minutes | 5 | 2.2% |
| 45 to 59 Minutes | 25 | 11.2% |
| 60 to 89 Minutes | 15 | 6.7% |
| 90 or more Minutes | 16 | 7.1% |
Commute Time by Sex in Connoquenessing borough
The most common commute times in Connoquenessing borough are 15 to 19 minutes (31 commuters, 25.2%) for males and 15 to 19 minutes (32 commuters, 31.7%) for females.
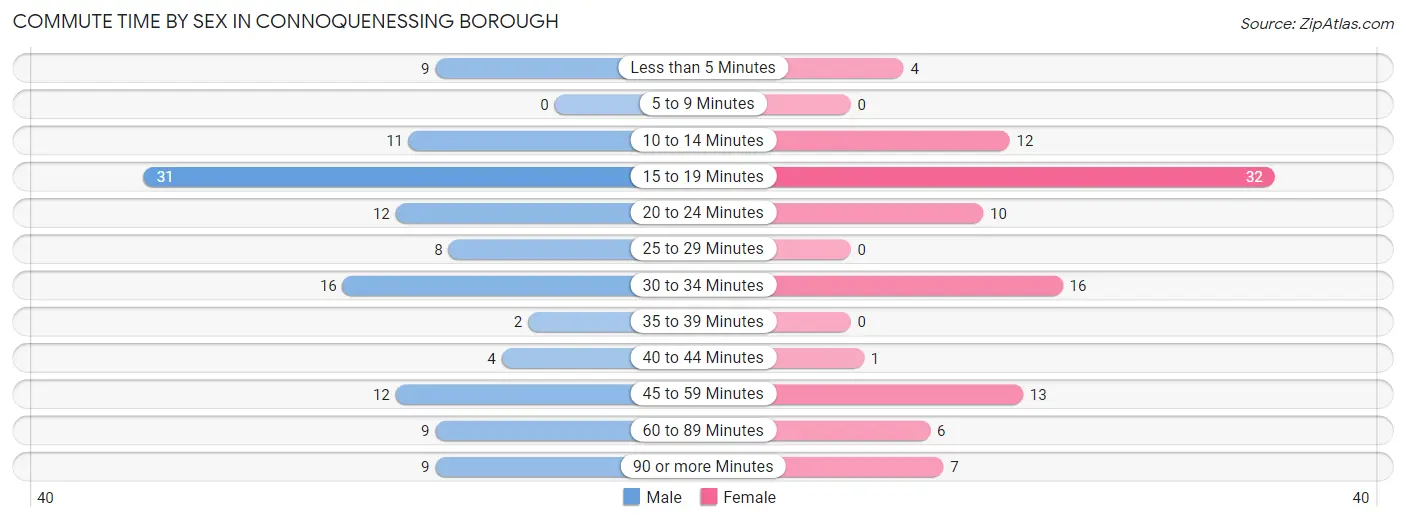
| Commute Time | Male | Female |
| Less than 5 Minutes | 9 (7.3%) | 4 (4.0%) |
| 5 to 9 Minutes | 0 (0.0%) | 0 (0.0%) |
| 10 to 14 Minutes | 11 (8.9%) | 12 (11.9%) |
| 15 to 19 Minutes | 31 (25.2%) | 32 (31.7%) |
| 20 to 24 Minutes | 12 (9.8%) | 10 (9.9%) |
| 25 to 29 Minutes | 8 (6.5%) | 0 (0.0%) |
| 30 to 34 Minutes | 16 (13.0%) | 16 (15.8%) |
| 35 to 39 Minutes | 2 (1.6%) | 0 (0.0%) |
| 40 to 44 Minutes | 4 (3.3%) | 1 (1.0%) |
| 45 to 59 Minutes | 12 (9.8%) | 13 (12.9%) |
| 60 to 89 Minutes | 9 (7.3%) | 6 (5.9%) |
| 90 or more Minutes | 9 (7.3%) | 7 (6.9%) |
Time of Departure to Work by Sex in Connoquenessing borough
The most frequent times of departure to work in Connoquenessing borough are 8:00 AM to 8:29 AM (24, 19.5%) for males and 7:30 AM to 7:59 AM (42, 41.6%) for females.
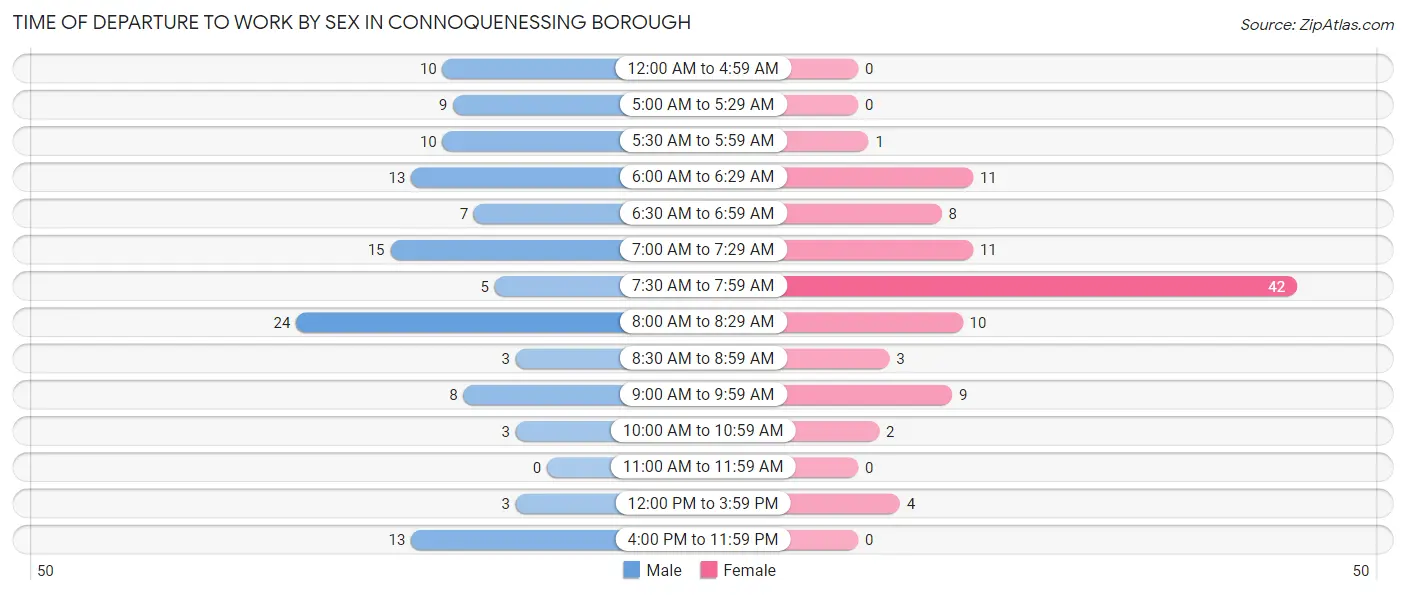
| Time of Departure | Male | Female |
| 12:00 AM to 4:59 AM | 10 (8.1%) | 0 (0.0%) |
| 5:00 AM to 5:29 AM | 9 (7.3%) | 0 (0.0%) |
| 5:30 AM to 5:59 AM | 10 (8.1%) | 1 (1.0%) |
| 6:00 AM to 6:29 AM | 13 (10.6%) | 11 (10.9%) |
| 6:30 AM to 6:59 AM | 7 (5.7%) | 8 (7.9%) |
| 7:00 AM to 7:29 AM | 15 (12.2%) | 11 (10.9%) |
| 7:30 AM to 7:59 AM | 5 (4.1%) | 42 (41.6%) |
| 8:00 AM to 8:29 AM | 24 (19.5%) | 10 (9.9%) |
| 8:30 AM to 8:59 AM | 3 (2.4%) | 3 (3.0%) |
| 9:00 AM to 9:59 AM | 8 (6.5%) | 9 (8.9%) |
| 10:00 AM to 10:59 AM | 3 (2.4%) | 2 (2.0%) |
| 11:00 AM to 11:59 AM | 0 (0.0%) | 0 (0.0%) |
| 12:00 PM to 3:59 PM | 3 (2.4%) | 4 (4.0%) |
| 4:00 PM to 11:59 PM | 13 (10.6%) | 0 (0.0%) |
| Total | 123 (100.0%) | 101 (100.0%) |
Housing Occupancy in Connoquenessing borough
Occupancy by Ownership in Connoquenessing borough
Of the total 247 dwellings in Connoquenessing borough, owner-occupied units account for 197 (79.8%), while renter-occupied units make up 50 (20.2%).
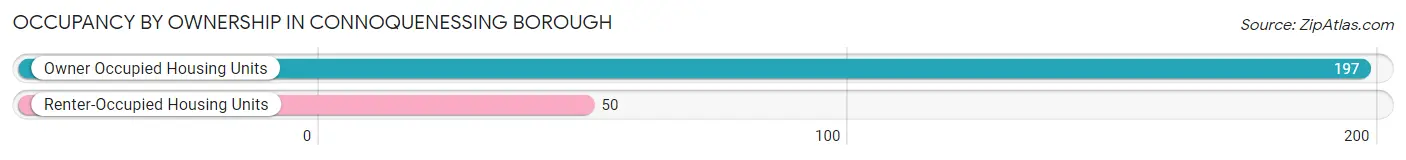
| Occupancy | # Housing Units | % Housing Units |
| Owner Occupied Housing Units | 197 | 79.8% |
| Renter-Occupied Housing Units | 50 | 20.2% |
| Total Occupied Housing Units | 247 | 100.0% |
Occupancy by Household Size in Connoquenessing borough
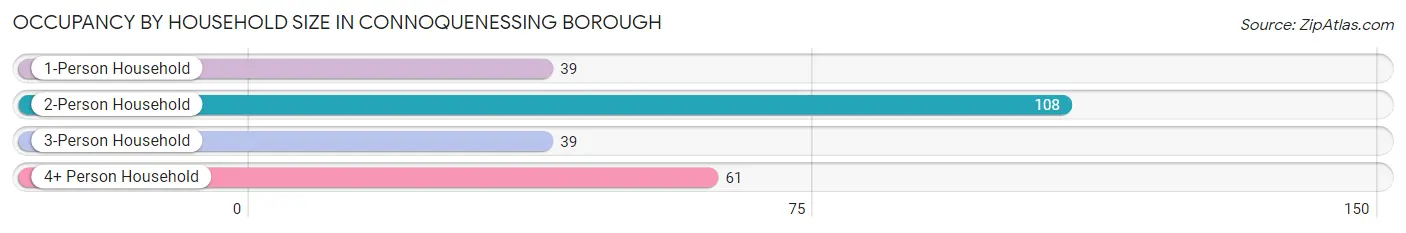
| Household Size | # Housing Units | % Housing Units |
| 1-Person Household | 39 | 15.8% |
| 2-Person Household | 108 | 43.7% |
| 3-Person Household | 39 | 15.8% |
| 4+ Person Household | 61 | 24.7% |
| Total Housing Units | 247 | 100.0% |
Occupancy by Ownership by Household Size in Connoquenessing borough
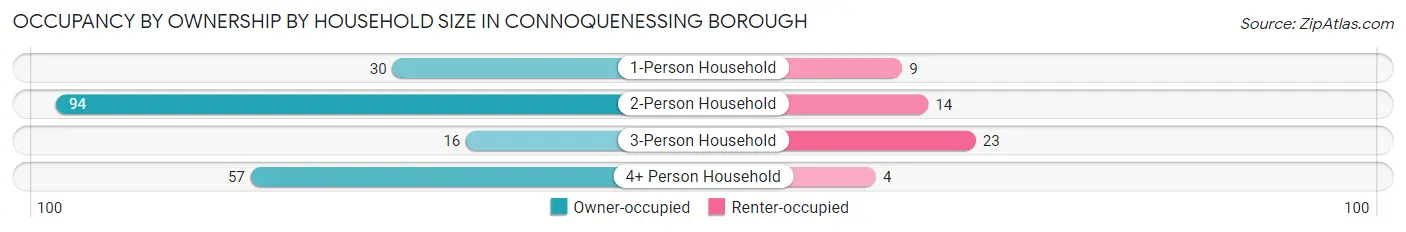
| Household Size | Owner-occupied | Renter-occupied |
| 1-Person Household | 30 (76.9%) | 9 (23.1%) |
| 2-Person Household | 94 (87.0%) | 14 (13.0%) |
| 3-Person Household | 16 (41.0%) | 23 (59.0%) |
| 4+ Person Household | 57 (93.4%) | 4 (6.6%) |
| Total Housing Units | 197 (79.8%) | 50 (20.2%) |
Occupancy by Educational Attainment in Connoquenessing borough
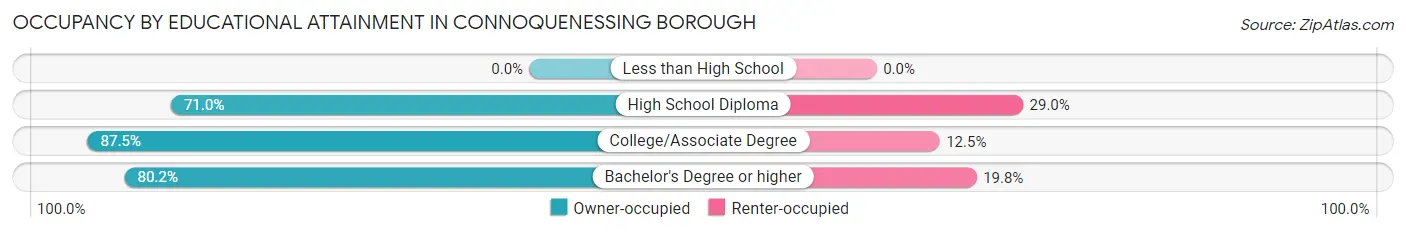
| Household Size | Owner-occupied | Renter-occupied |
| Less than High School | 0 (0.0%) | 0 (0.0%) |
| High School Diploma | 44 (71.0%) | 18 (29.0%) |
| College/Associate Degree | 56 (87.5%) | 8 (12.5%) |
| Bachelor's Degree or higher | 97 (80.2%) | 24 (19.8%) |
Occupancy by Age of Householder in Connoquenessing borough
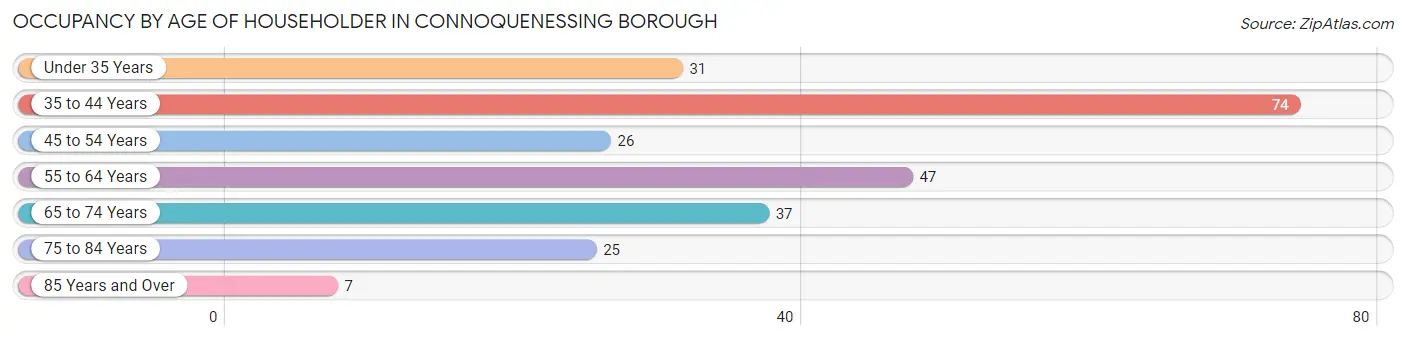
| Age Bracket | # Households | % Households |
| Under 35 Years | 31 | 12.6% |
| 35 to 44 Years | 74 | 30.0% |
| 45 to 54 Years | 26 | 10.5% |
| 55 to 64 Years | 47 | 19.0% |
| 65 to 74 Years | 37 | 15.0% |
| 75 to 84 Years | 25 | 10.1% |
| 85 Years and Over | 7 | 2.8% |
| Total | 247 | 100.0% |
Housing Finances in Connoquenessing borough
Median Income by Occupancy in Connoquenessing borough
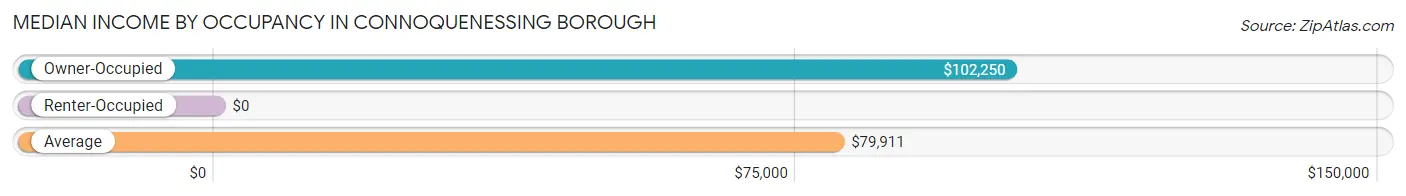
| Occupancy Type | # Households | Median Income |
| Owner-Occupied | 197 (79.8%) | $102,250 |
| Renter-Occupied | 50 (20.2%) | $0 |
| Average | 247 (100.0%) | $79,911 |
Occupancy by Householder Income Bracket in Connoquenessing borough
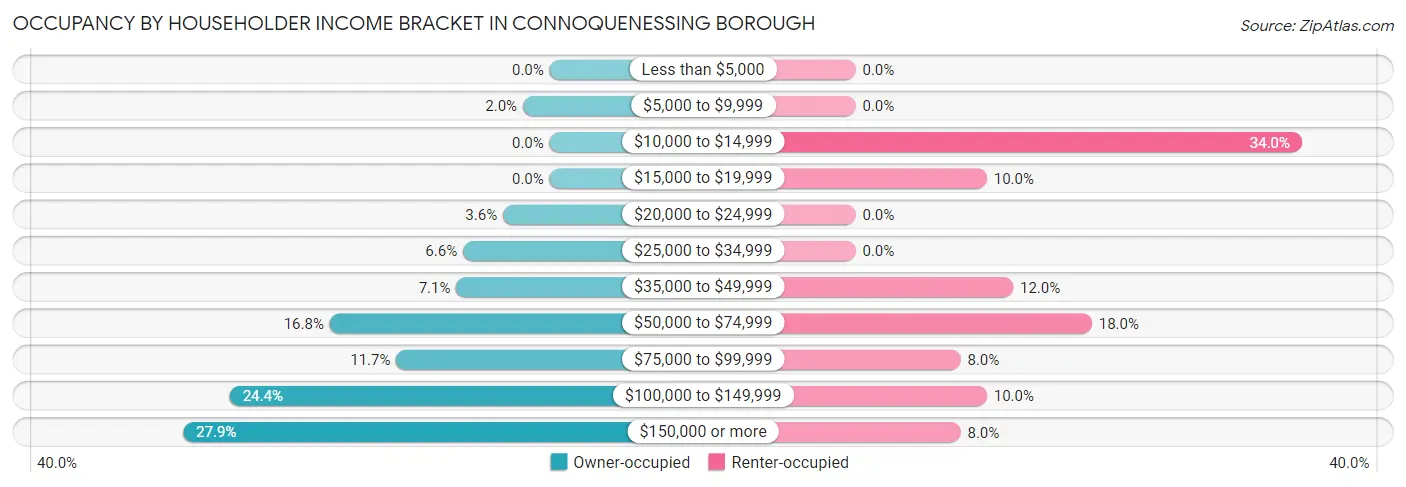
| Income Bracket | Owner-occupied | Renter-occupied |
| Less than $5,000 | 0 (0.0%) | 0 (0.0%) |
| $5,000 to $9,999 | 4 (2.0%) | 0 (0.0%) |
| $10,000 to $14,999 | 0 (0.0%) | 17 (34.0%) |
| $15,000 to $19,999 | 0 (0.0%) | 5 (10.0%) |
| $20,000 to $24,999 | 7 (3.5%) | 0 (0.0%) |
| $25,000 to $34,999 | 13 (6.6%) | 0 (0.0%) |
| $35,000 to $49,999 | 14 (7.1%) | 6 (12.0%) |
| $50,000 to $74,999 | 33 (16.8%) | 9 (18.0%) |
| $75,000 to $99,999 | 23 (11.7%) | 4 (8.0%) |
| $100,000 to $149,999 | 48 (24.4%) | 5 (10.0%) |
| $150,000 or more | 55 (27.9%) | 4 (8.0%) |
| Total | 197 (100.0%) | 50 (100.0%) |
Monthly Housing Cost Tiers in Connoquenessing borough
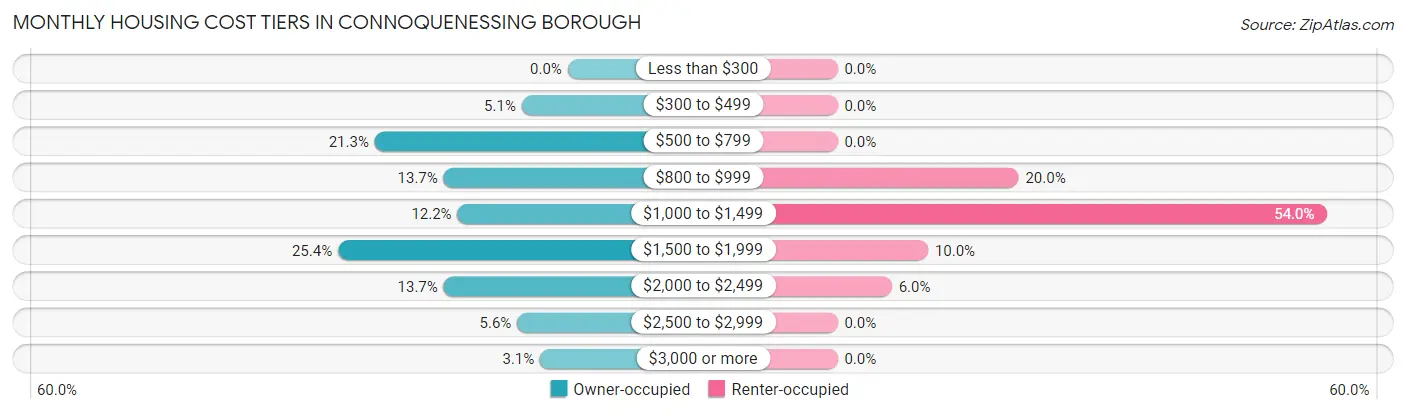
| Monthly Cost | Owner-occupied | Renter-occupied |
| Less than $300 | 0 (0.0%) | 0 (0.0%) |
| $300 to $499 | 10 (5.1%) | 0 (0.0%) |
| $500 to $799 | 42 (21.3%) | 0 (0.0%) |
| $800 to $999 | 27 (13.7%) | 10 (20.0%) |
| $1,000 to $1,499 | 24 (12.2%) | 27 (54.0%) |
| $1,500 to $1,999 | 50 (25.4%) | 5 (10.0%) |
| $2,000 to $2,499 | 27 (13.7%) | 3 (6.0%) |
| $2,500 to $2,999 | 11 (5.6%) | 0 (0.0%) |
| $3,000 or more | 6 (3.0%) | 0 (0.0%) |
| Total | 197 (100.0%) | 50 (100.0%) |
Physical Housing Characteristics in Connoquenessing borough
Housing Structures in Connoquenessing borough
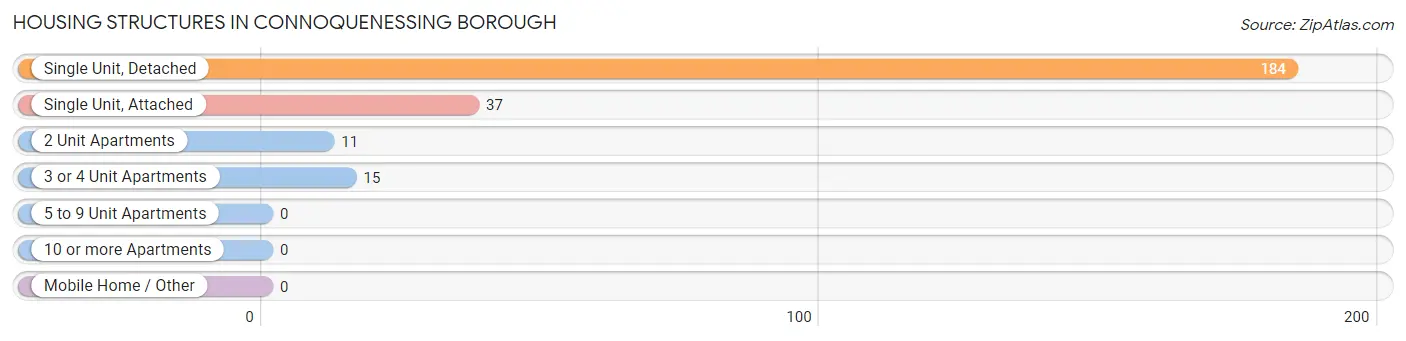
| Structure Type | # Housing Units | % Housing Units |
| Single Unit, Detached | 184 | 74.5% |
| Single Unit, Attached | 37 | 15.0% |
| 2 Unit Apartments | 11 | 4.4% |
| 3 or 4 Unit Apartments | 15 | 6.1% |
| 5 to 9 Unit Apartments | 0 | 0.0% |
| 10 or more Apartments | 0 | 0.0% |
| Mobile Home / Other | 0 | 0.0% |
| Total | 247 | 100.0% |
Housing Structures by Occupancy in Connoquenessing borough
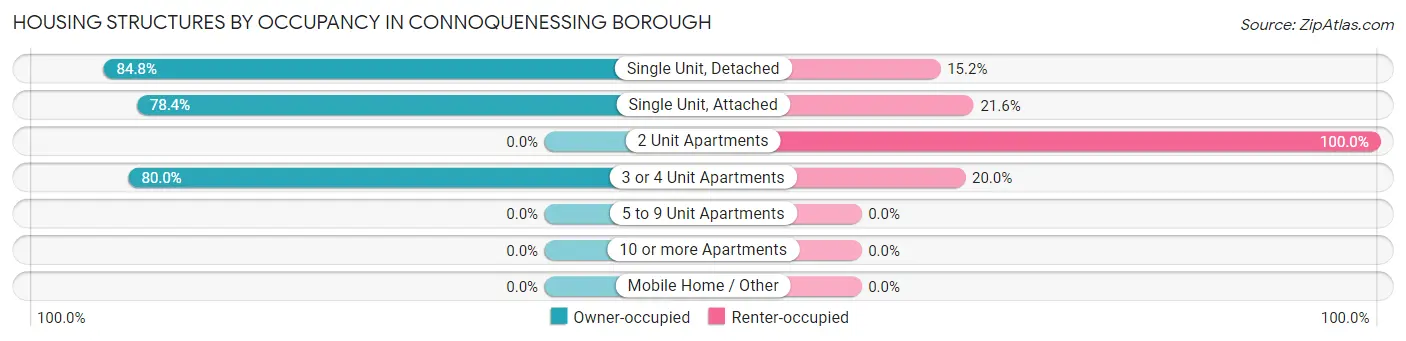
| Structure Type | Owner-occupied | Renter-occupied |
| Single Unit, Detached | 156 (84.8%) | 28 (15.2%) |
| Single Unit, Attached | 29 (78.4%) | 8 (21.6%) |
| 2 Unit Apartments | 0 (0.0%) | 11 (100.0%) |
| 3 or 4 Unit Apartments | 12 (80.0%) | 3 (20.0%) |
| 5 to 9 Unit Apartments | 0 (0.0%) | 0 (0.0%) |
| 10 or more Apartments | 0 (0.0%) | 0 (0.0%) |
| Mobile Home / Other | 0 (0.0%) | 0 (0.0%) |
| Total | 197 (79.8%) | 50 (20.2%) |
Housing Structures by Number of Rooms in Connoquenessing borough
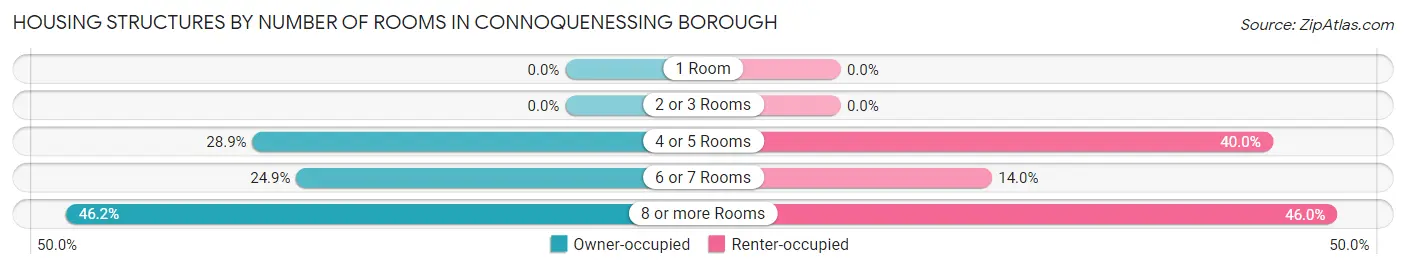
| Number of Rooms | Owner-occupied | Renter-occupied |
| 1 Room | 0 (0.0%) | 0 (0.0%) |
| 2 or 3 Rooms | 0 (0.0%) | 0 (0.0%) |
| 4 or 5 Rooms | 57 (28.9%) | 20 (40.0%) |
| 6 or 7 Rooms | 49 (24.9%) | 7 (14.0%) |
| 8 or more Rooms | 91 (46.2%) | 23 (46.0%) |
| Total | 197 (100.0%) | 50 (100.0%) |
Housing Structure by Heating Type in Connoquenessing borough
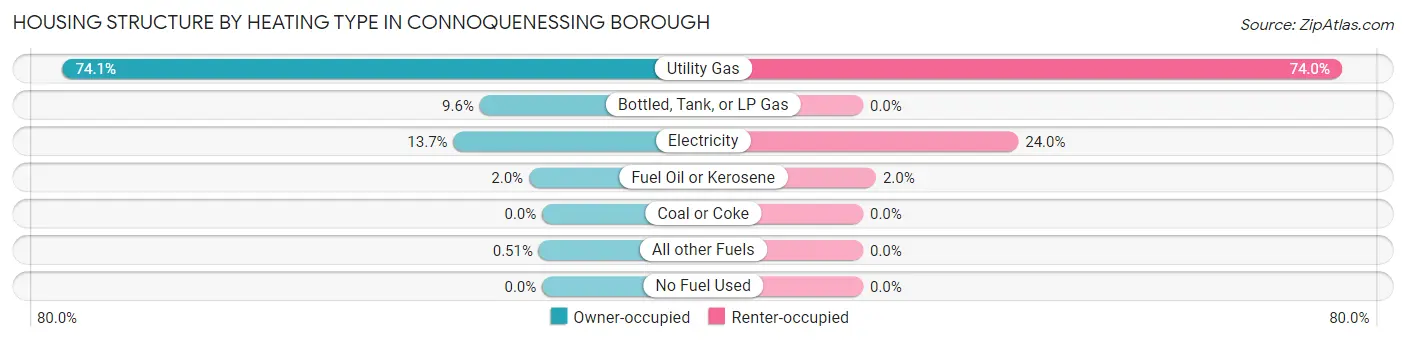
| Heating Type | Owner-occupied | Renter-occupied |
| Utility Gas | 146 (74.1%) | 37 (74.0%) |
| Bottled, Tank, or LP Gas | 19 (9.6%) | 0 (0.0%) |
| Electricity | 27 (13.7%) | 12 (24.0%) |
| Fuel Oil or Kerosene | 4 (2.0%) | 1 (2.0%) |
| Coal or Coke | 0 (0.0%) | 0 (0.0%) |
| All other Fuels | 1 (0.5%) | 0 (0.0%) |
| No Fuel Used | 0 (0.0%) | 0 (0.0%) |
| Total | 197 (100.0%) | 50 (100.0%) |
Household Vehicle Usage in Connoquenessing borough
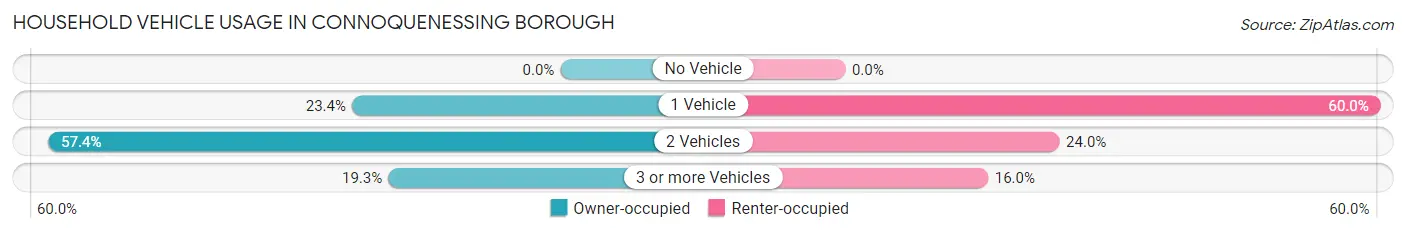
| Vehicles per Household | Owner-occupied | Renter-occupied |
| No Vehicle | 0 (0.0%) | 0 (0.0%) |
| 1 Vehicle | 46 (23.4%) | 30 (60.0%) |
| 2 Vehicles | 113 (57.4%) | 12 (24.0%) |
| 3 or more Vehicles | 38 (19.3%) | 8 (16.0%) |
| Total | 197 (100.0%) | 50 (100.0%) |
Real Estate & Mortgages in Connoquenessing borough
Real Estate and Mortgage Overview in Connoquenessing borough
| Characteristic | Without Mortgage | With Mortgage |
| Housing Units | 56 | 141 |
| Median Property Value | $283,300 | $310,800 |
| Median Household Income | - | - |
| Monthly Housing Costs | $650 | $6 |
| Real Estate Taxes | $3,192 | $2 |
Property Value by Mortgage Status in Connoquenessing borough
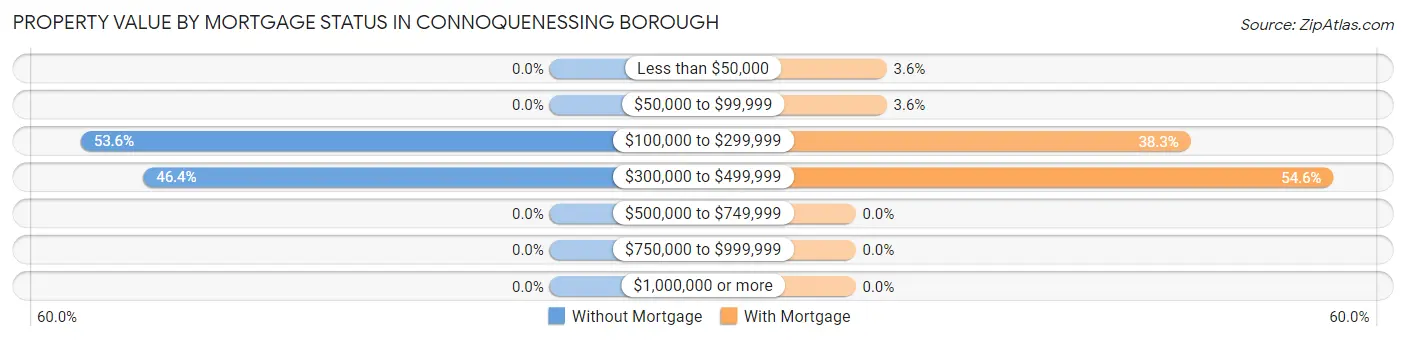
| Property Value | Without Mortgage | With Mortgage |
| Less than $50,000 | 0 (0.0%) | 5 (3.5%) |
| $50,000 to $99,999 | 0 (0.0%) | 5 (3.5%) |
| $100,000 to $299,999 | 30 (53.6%) | 54 (38.3%) |
| $300,000 to $499,999 | 26 (46.4%) | 77 (54.6%) |
| $500,000 to $749,999 | 0 (0.0%) | 0 (0.0%) |
| $750,000 to $999,999 | 0 (0.0%) | 0 (0.0%) |
| $1,000,000 or more | 0 (0.0%) | 0 (0.0%) |
| Total | 56 (100.0%) | 141 (100.0%) |
Household Income by Mortgage Status in Connoquenessing borough
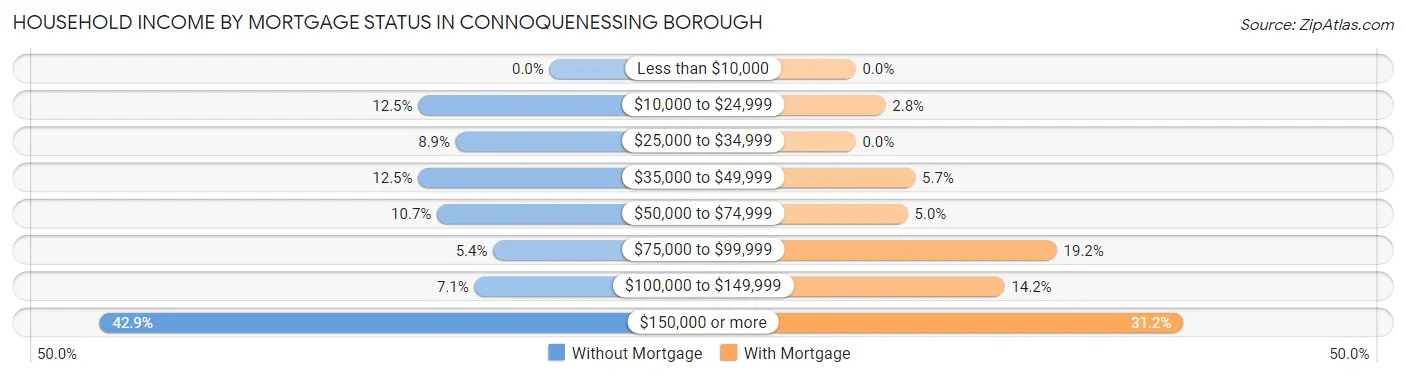
| Household Income | Without Mortgage | With Mortgage |
| Less than $10,000 | 0 (0.0%) | 0 (0.0%) |
| $10,000 to $24,999 | 7 (12.5%) | 4 (2.8%) |
| $25,000 to $34,999 | 5 (8.9%) | 0 (0.0%) |
| $35,000 to $49,999 | 7 (12.5%) | 8 (5.7%) |
| $50,000 to $74,999 | 6 (10.7%) | 7 (5.0%) |
| $75,000 to $99,999 | 3 (5.4%) | 27 (19.2%) |
| $100,000 to $149,999 | 4 (7.1%) | 20 (14.2%) |
| $150,000 or more | 24 (42.9%) | 44 (31.2%) |
| Total | 56 (100.0%) | 141 (100.0%) |
Property Value to Household Income Ratio in Connoquenessing borough
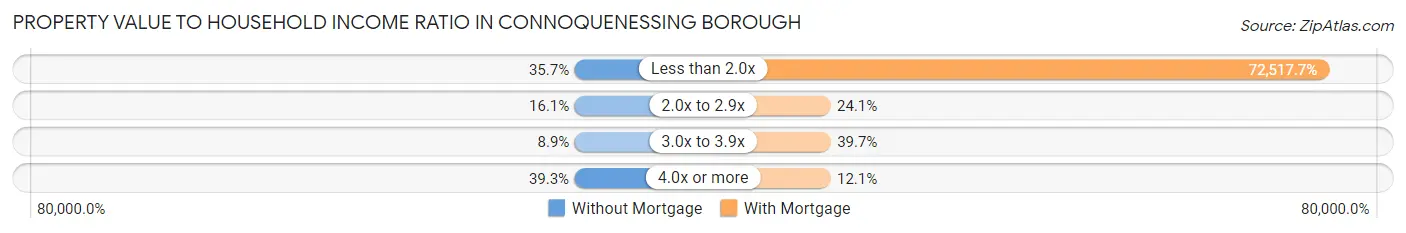
| Value-to-Income Ratio | Without Mortgage | With Mortgage |
| Less than 2.0x | 20 (35.7%) | 102,250 (72,517.7%) |
| 2.0x to 2.9x | 9 (16.1%) | 34 (24.1%) |
| 3.0x to 3.9x | 5 (8.9%) | 56 (39.7%) |
| 4.0x or more | 22 (39.3%) | 17 (12.1%) |
| Total | 56 (100.0%) | 141 (100.0%) |
Real Estate Taxes by Mortgage Status in Connoquenessing borough
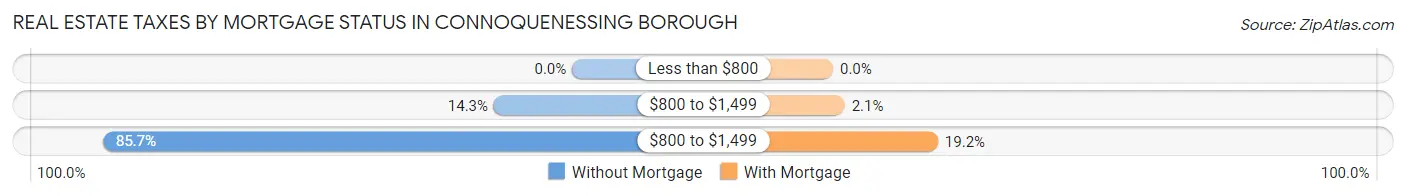
| Property Taxes | Without Mortgage | With Mortgage |
| Less than $800 | 0 (0.0%) | 0 (0.0%) |
| $800 to $1,499 | 8 (14.3%) | 3 (2.1%) |
| $800 to $1,499 | 48 (85.7%) | 27 (19.2%) |
| Total | 56 (100.0%) | 141 (100.0%) |
Health & Disability in Connoquenessing borough
Health Insurance Coverage by Age in Connoquenessing borough
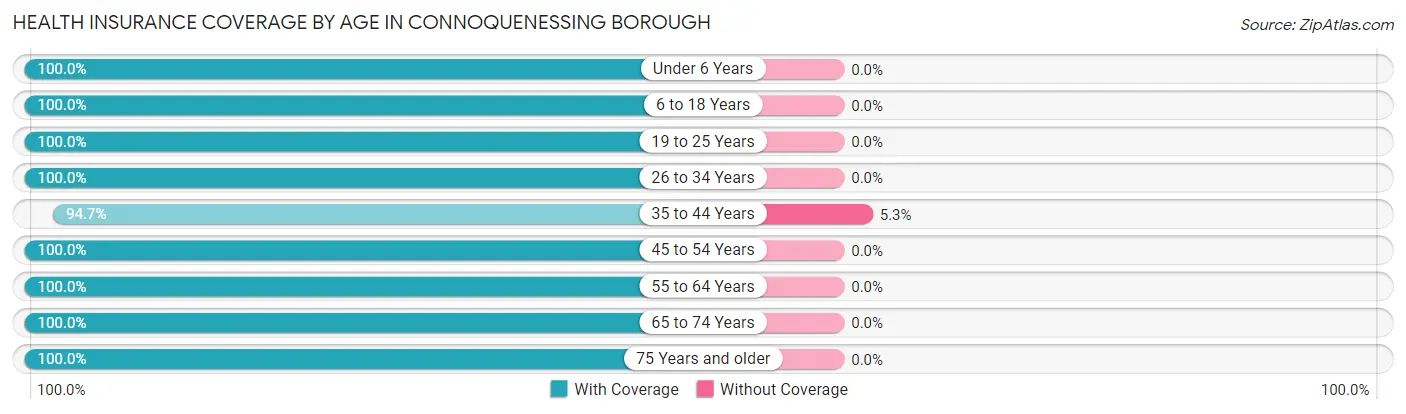
| Age Bracket | With Coverage | Without Coverage |
| Under 6 Years | 55 (100.0%) | 0 (0.0%) |
| 6 to 18 Years | 138 (100.0%) | 0 (0.0%) |
| 19 to 25 Years | 21 (100.0%) | 0 (0.0%) |
| 26 to 34 Years | 52 (100.0%) | 0 (0.0%) |
| 35 to 44 Years | 107 (94.7%) | 6 (5.3%) |
| 45 to 54 Years | 56 (100.0%) | 0 (0.0%) |
| 55 to 64 Years | 78 (100.0%) | 0 (0.0%) |
| 65 to 74 Years | 74 (100.0%) | 0 (0.0%) |
| 75 Years and older | 60 (100.0%) | 0 (0.0%) |
| Total | 641 (99.1%) | 6 (0.9%) |
Health Insurance Coverage by Citizenship Status in Connoquenessing borough
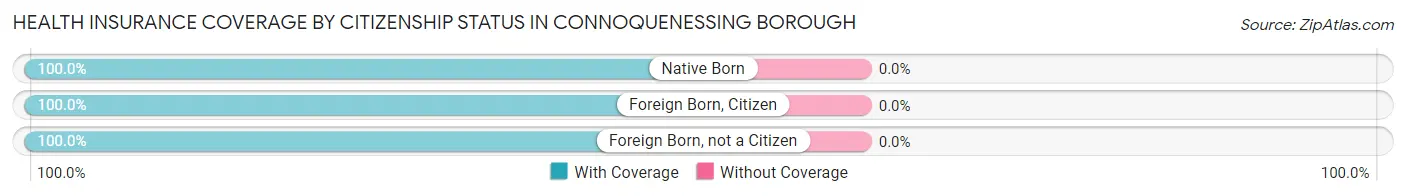
| Citizenship Status | With Coverage | Without Coverage |
| Native Born | 55 (100.0%) | 0 (0.0%) |
| Foreign Born, Citizen | 138 (100.0%) | 0 (0.0%) |
| Foreign Born, not a Citizen | 21 (100.0%) | 0 (0.0%) |
Health Insurance Coverage by Household Income in Connoquenessing borough
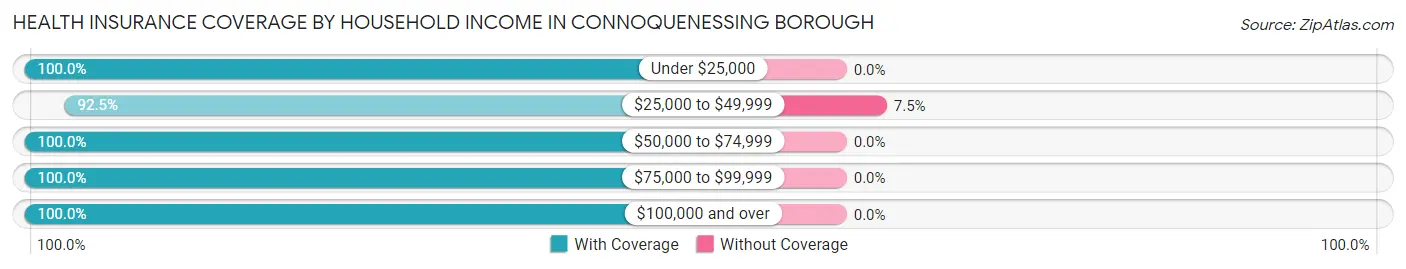
| Household Income | With Coverage | Without Coverage |
| Under $25,000 | 100 (100.0%) | 0 (0.0%) |
| $25,000 to $49,999 | 74 (92.5%) | 6 (7.5%) |
| $50,000 to $74,999 | 91 (100.0%) | 0 (0.0%) |
| $75,000 to $99,999 | 87 (100.0%) | 0 (0.0%) |
| $100,000 and over | 289 (100.0%) | 0 (0.0%) |
Public vs Private Health Insurance Coverage by Age in Connoquenessing borough
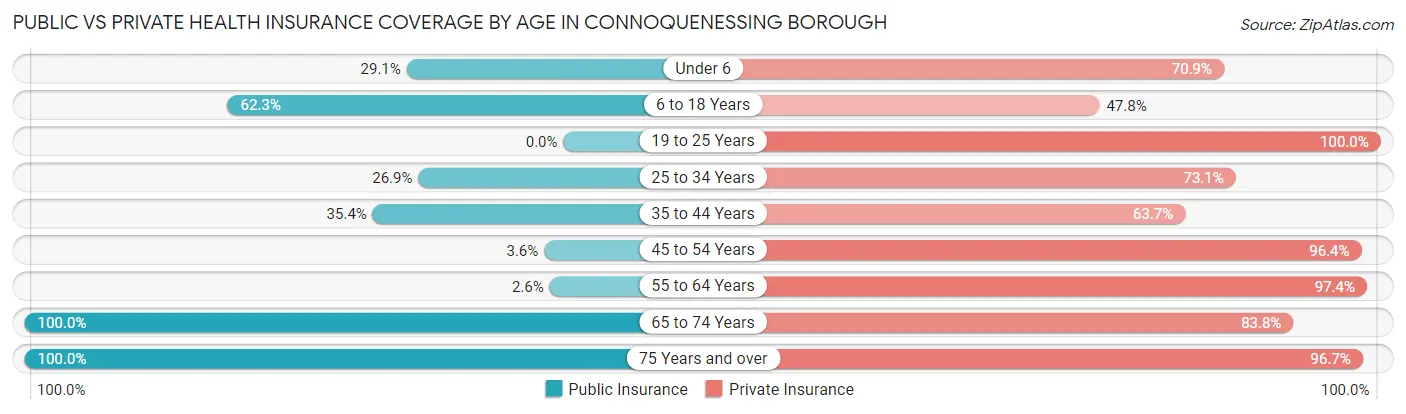
| Age Bracket | Public Insurance | Private Insurance |
| Under 6 | 16 (29.1%) | 39 (70.9%) |
| 6 to 18 Years | 86 (62.3%) | 66 (47.8%) |
| 19 to 25 Years | 0 (0.0%) | 21 (100.0%) |
| 25 to 34 Years | 14 (26.9%) | 38 (73.1%) |
| 35 to 44 Years | 40 (35.4%) | 72 (63.7%) |
| 45 to 54 Years | 2 (3.6%) | 54 (96.4%) |
| 55 to 64 Years | 2 (2.6%) | 76 (97.4%) |
| 65 to 74 Years | 74 (100.0%) | 62 (83.8%) |
| 75 Years and over | 60 (100.0%) | 58 (96.7%) |
| Total | 294 (45.4%) | 486 (75.1%) |
Disability Status by Sex by Age in Connoquenessing borough
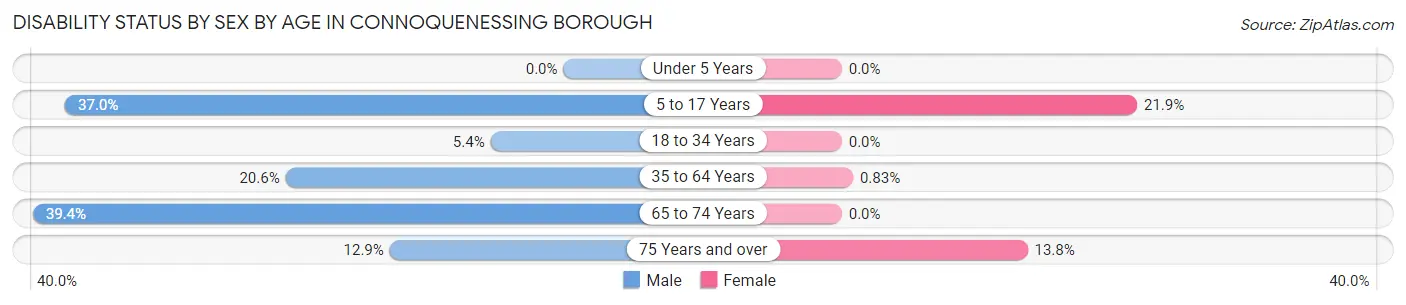
| Age Bracket | Male | Female |
| Under 5 Years | 0 (0.0%) | 0 (0.0%) |
| 5 to 17 Years | 27 (37.0%) | 16 (21.9%) |
| 18 to 34 Years | 2 (5.4%) | 0 (0.0%) |
| 35 to 64 Years | 26 (20.6%) | 1 (0.8%) |
| 65 to 74 Years | 13 (39.4%) | 0 (0.0%) |
| 75 Years and over | 4 (12.9%) | 4 (13.8%) |
Disability Class by Sex by Age in Connoquenessing borough
Disability Class: Hearing Difficulty
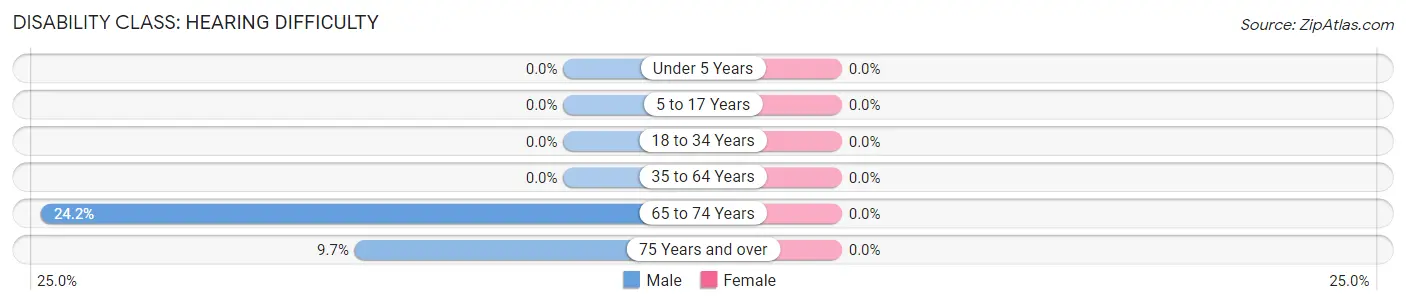
| Age Bracket | Male | Female |
| Under 5 Years | 0 (0.0%) | 0 (0.0%) |
| 5 to 17 Years | 0 (0.0%) | 0 (0.0%) |
| 18 to 34 Years | 0 (0.0%) | 0 (0.0%) |
| 35 to 64 Years | 0 (0.0%) | 0 (0.0%) |
| 65 to 74 Years | 8 (24.2%) | 0 (0.0%) |
| 75 Years and over | 3 (9.7%) | 0 (0.0%) |
Disability Class: Vision Difficulty
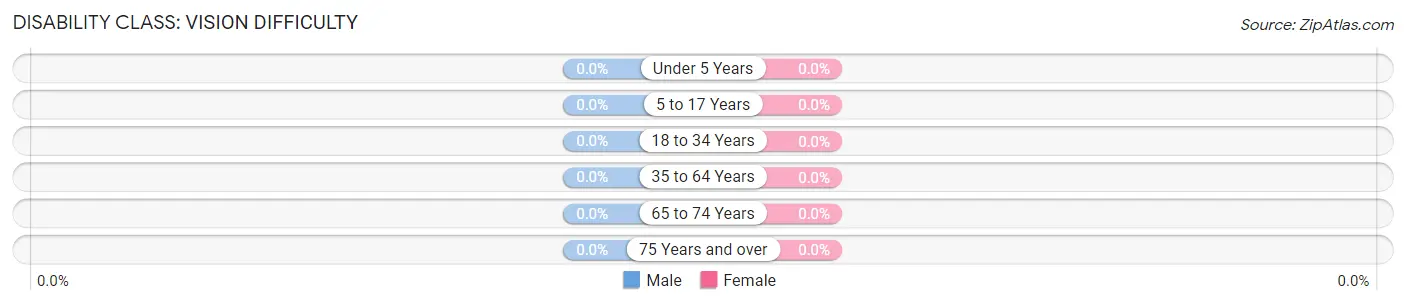
| Age Bracket | Male | Female |
| Under 5 Years | 0 (0.0%) | 0 (0.0%) |
| 5 to 17 Years | 0 (0.0%) | 0 (0.0%) |
| 18 to 34 Years | 0 (0.0%) | 0 (0.0%) |
| 35 to 64 Years | 0 (0.0%) | 0 (0.0%) |
| 65 to 74 Years | 0 (0.0%) | 0 (0.0%) |
| 75 Years and over | 0 (0.0%) | 0 (0.0%) |
Disability Class: Cognitive Difficulty
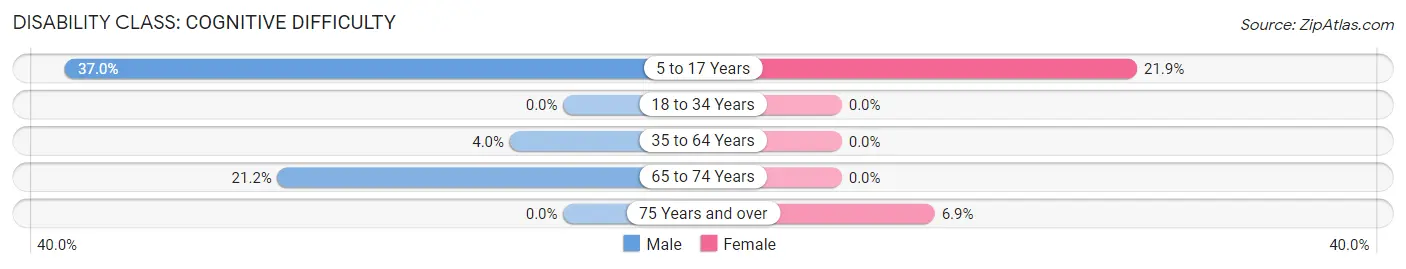
| Age Bracket | Male | Female |
| 5 to 17 Years | 27 (37.0%) | 16 (21.9%) |
| 18 to 34 Years | 0 (0.0%) | 0 (0.0%) |
| 35 to 64 Years | 5 (4.0%) | 0 (0.0%) |
| 65 to 74 Years | 7 (21.2%) | 0 (0.0%) |
| 75 Years and over | 0 (0.0%) | 2 (6.9%) |
Disability Class: Ambulatory Difficulty
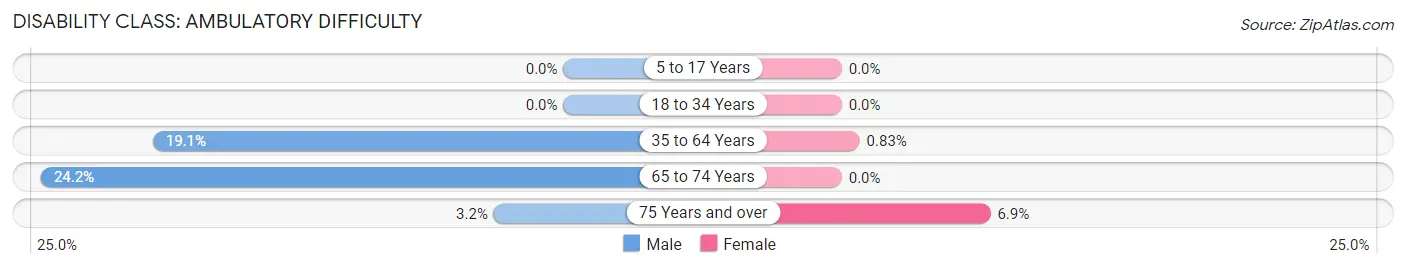
| Age Bracket | Male | Female |
| 5 to 17 Years | 0 (0.0%) | 0 (0.0%) |
| 18 to 34 Years | 0 (0.0%) | 0 (0.0%) |
| 35 to 64 Years | 24 (19.1%) | 1 (0.8%) |
| 65 to 74 Years | 8 (24.2%) | 0 (0.0%) |
| 75 Years and over | 1 (3.2%) | 2 (6.9%) |
Disability Class: Self-Care Difficulty
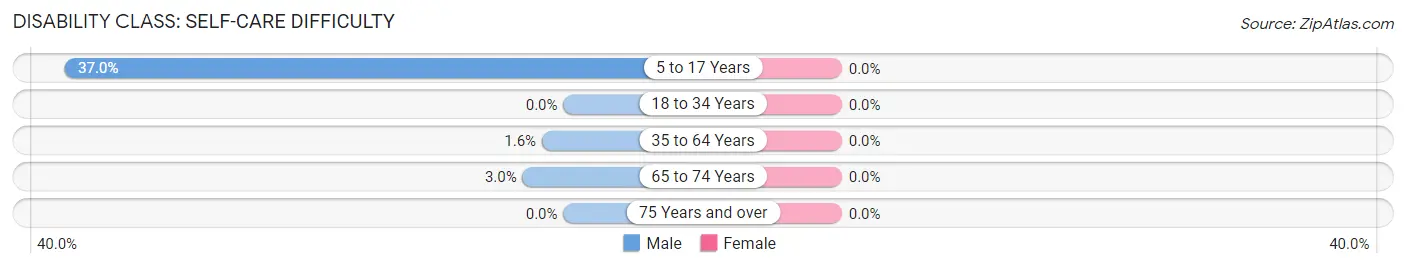
| Age Bracket | Male | Female |
| 5 to 17 Years | 27 (37.0%) | 0 (0.0%) |
| 18 to 34 Years | 0 (0.0%) | 0 (0.0%) |
| 35 to 64 Years | 2 (1.6%) | 0 (0.0%) |
| 65 to 74 Years | 1 (3.0%) | 0 (0.0%) |
| 75 Years and over | 0 (0.0%) | 0 (0.0%) |
Technology Access in Connoquenessing borough
Computing Device Access in Connoquenessing borough
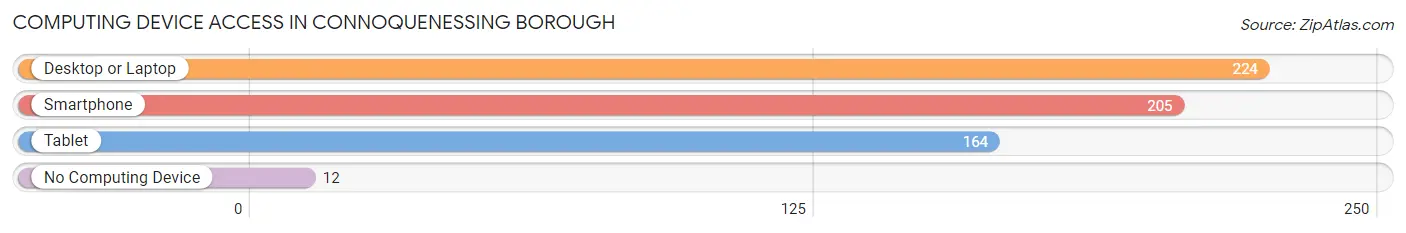
| Device Type | # Households | % Households |
| Desktop or Laptop | 224 | 90.7% |
| Smartphone | 205 | 83.0% |
| Tablet | 164 | 66.4% |
| No Computing Device | 12 | 4.9% |
| Total | 247 | 100.0% |
Internet Access in Connoquenessing borough
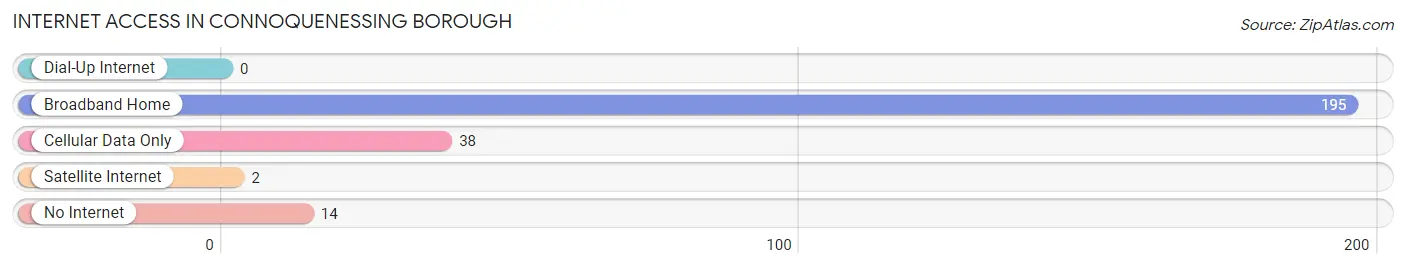
| Internet Type | # Households | % Households |
| Dial-Up Internet | 0 | 0.0% |
| Broadband Home | 195 | 78.9% |
| Cellular Data Only | 38 | 15.4% |
| Satellite Internet | 2 | 0.8% |
| No Internet | 14 | 5.7% |
| Total | 247 | 100.0% |
Connoquenessing borough Summary
Connoquenessing Borough is a small borough located in Butler County, Pennsylvania. It is situated in the western part of the state, about 25 miles north of Pittsburgh. The borough is home to approximately 1,400 people and covers an area of 0.6 square miles.
History
The area that is now Connoquenessing Borough was first settled in the late 1700s by a group of Scots-Irish immigrants. The town was originally known as “Connoquenessing”, which is derived from the Native American term for “long river”. The town was officially incorporated in 1845 and was named after the Connoquenessing Creek, which runs through the area.
In the late 1800s, the town was a thriving agricultural community. The main crops grown in the area were wheat, corn, and oats. The town also had several mills, including a grist mill, a saw mill, and a woolen mill.
In the early 1900s, the town began to experience a decline in population as many of the residents moved away to larger cities in search of better job opportunities. The town’s population continued to decline until the 1950s, when the population began to slowly increase again.
Geography
Connoquenessing Borough is located in western Pennsylvania, about 25 miles north of Pittsburgh. The borough is situated in the foothills of the Allegheny Mountains and is surrounded by rolling hills and farmland. The borough is located along the Connoquenessing Creek, which runs through the area.
The borough has a total area of 0.6 square miles, all of which is land. The borough is located in a humid continental climate zone, with hot summers and cold winters. The average annual temperature is around 50 degrees Fahrenheit.
Economy
The economy of Connoquenessing Borough is largely based on agriculture. The main crops grown in the area are wheat, corn, and oats. The town also has several small businesses, including a grocery store, a hardware store, and a few restaurants.
The borough also has a few light manufacturing businesses, including a plastics factory and a metal fabrication plant. The town also has a few small service businesses, such as a gas station and a car repair shop.
Demographics
As of the 2010 census, the population of Connoquenessing Borough was 1,400. The racial makeup of the borough was 97.4% White, 0.7% African American, 0.3% Native American, 0.3% Asian, and 1.3% from other races.
The median household income in the borough was $41,250, and the median family income was $50,000. The per capita income was $20,000. About 8.3% of the population was below the poverty line.
Conclusion
Connoquenessing Borough is a small borough located in Butler County, Pennsylvania. It is situated in the western part of the state, about 25 miles north of Pittsburgh. The borough is home to approximately 1,400 people and covers an area of 0.6 square miles. The economy of the borough is largely based on agriculture, with wheat, corn, and oats being the main crops grown in the area. The borough also has several small businesses, including a grocery store, a hardware store, and a few restaurants. The population of the borough is predominantly White, with a median household income of $41,250 and a median family income of $50,000.
Common Questions
What is the Total Population of Connoquenessing borough?
Total Population of Connoquenessing borough is 647.
What is the Total Male Population of Connoquenessing borough?
Total Male Population of Connoquenessing borough is 324.
What is the Total Female Population of Connoquenessing borough?
Total Female Population of Connoquenessing borough is 323.
What is the Ratio of Males per 100 Females in Connoquenessing borough?
There are 100.31 Males per 100 Females in Connoquenessing borough.
What is the Ratio of Females per 100 Males in Connoquenessing borough?
There are 99.69 Females per 100 Males in Connoquenessing borough.
What is the Median Population Age in Connoquenessing borough?
Median Population Age in Connoquenessing borough is 37.5 Years.
What is the Average Family Size in Connoquenessing borough
Average Family Size in Connoquenessing borough is 2.9 People.
What is the Average Household Size in Connoquenessing borough
Average Household Size in Connoquenessing borough is 2.6 People.
What is Per Capita Income in Connoquenessing borough?
Per Capita income in Connoquenessing borough is $40,477.
What is the Median Family Income in Connoquenessing borough?
Median Family Income in Connoquenessing borough is $96,250.
What is the Median Household income in Connoquenessing borough?
Median Household Income in Connoquenessing borough is $79,911.
What is Income or Wage Gap in Connoquenessing borough?
Income or Wage Gap in Connoquenessing borough is 50.0%.
Women in Connoquenessing borough earn 50.0 cents for every dollar earned by a man.
What is Inequality or Gini Index in Connoquenessing borough?
Inequality or Gini Index in Connoquenessing borough is 0.40.
How Large is the Labor Force in Connoquenessing borough?
There are 270 People in the Labor Forcein in Connoquenessing borough.
What is the Percentage of People in the Labor Force in Connoquenessing borough?
58.8% of People are in the Labor Force in Connoquenessing borough.
What is the Unemployment Rate in Connoquenessing borough?
Unemployment Rate in Connoquenessing borough is 2.2%.