Village Shires, PA
Village Shires Map
Village Shires Overview
3,201
TOTAL POPULATION
1,537
MALE POPULATION
1,664
FEMALE POPULATION
92.37
MALES / 100 FEMALES
108.26
FEMALES / 100 MALES
53.4
MEDIAN AGE
3.0
AVG FAMILY SIZE
2.3
AVG HOUSEHOLD SIZE
$54,664
PER CAPITA INCOME
$149,821
AVG FAMILY INCOME
$106,034
AVG HOUSEHOLD INCOME
26.3%
WAGE / INCOME GAP [ % ]
73.7¢/ $1
WAGE / INCOME GAP [ $ ]
0.42
INEQUALITY / GINI INDEX
1,603
LABOR FORCE [ PEOPLE ]
58.0%
PERCENT IN LABOR FORCE
1.6%
UNEMPLOYMENT RATE
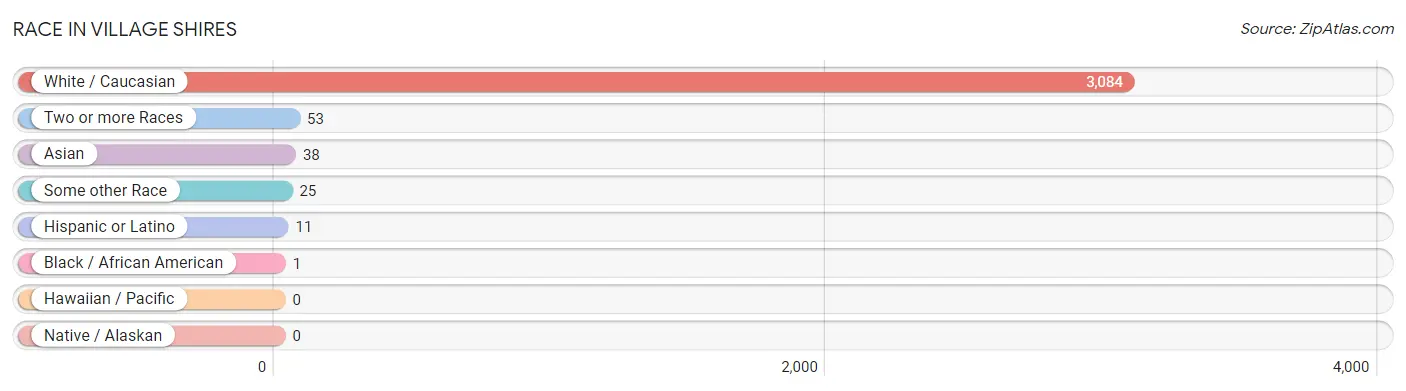
Race in Village Shires
The most populous races in Village Shires are White / Caucasian (3,084 | 96.3%), Two or more Races (53 | 1.7%), and Asian (38 | 1.2%).
| Race | # Population | % Population |
| Asian | 38 | 1.2% |
| Black / African American | 1 | 0.0% |
| Hawaiian / Pacific | 0 | 0.0% |
| Hispanic or Latino | 11 | 0.3% |
| Native / Alaskan | 0 | 0.0% |
| White / Caucasian | 3,084 | 96.3% |
| Two or more Races | 53 | 1.7% |
| Some other Race | 25 | 0.8% |
| Total | 3,201 | 100.0% |
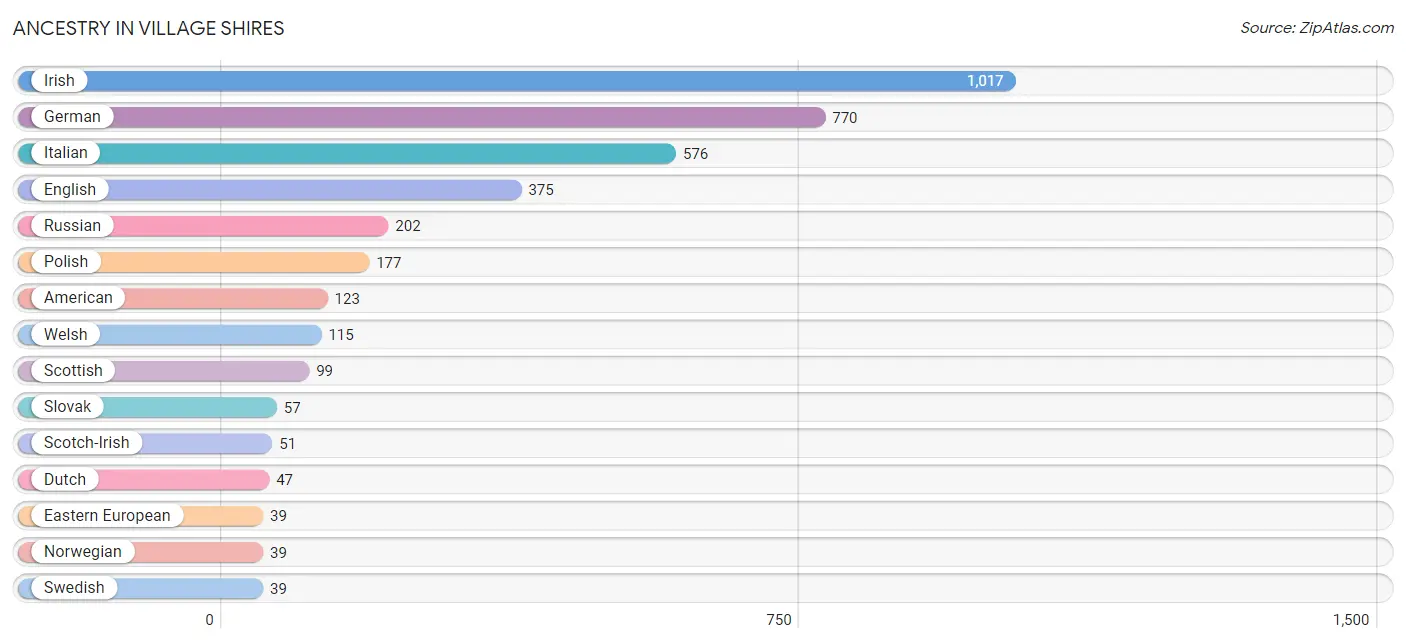
Ancestry in Village Shires
The most populous ancestries reported in Village Shires are Irish (1,017 | 31.8%), German (770 | 24.0%), Italian (576 | 18.0%), English (375 | 11.7%), and Russian (202 | 6.3%), together accounting for 91.8% of all Village Shires residents.
| Ancestry | # Population | % Population |
| African | 1 | 0.0% |
| American | 123 | 3.8% |
| Austrian | 30 | 0.9% |
| British | 15 | 0.5% |
| Burmese | 28 | 0.9% |
| Canadian | 5 | 0.2% |
| Croatian | 22 | 0.7% |
| Czech | 8 | 0.3% |
| Czechoslovakian | 9 | 0.3% |
| Dutch | 47 | 1.5% |
| Eastern European | 39 | 1.2% |
| English | 375 | 11.7% |
| European | 28 | 0.9% |
| French | 32 | 1.0% |
| German | 770 | 24.0% |
| Greek | 7 | 0.2% |
| Hungarian | 16 | 0.5% |
| Indian (Asian) | 10 | 0.3% |
| Irish | 1,017 | 31.8% |
| Italian | 576 | 18.0% |
| Lithuanian | 2 | 0.1% |
| Norwegian | 39 | 1.2% |
| Pennsylvania German | 9 | 0.3% |
| Polish | 177 | 5.5% |
| Portuguese | 7 | 0.2% |
| Puerto Rican | 11 | 0.3% |
| Russian | 202 | 6.3% |
| Scotch-Irish | 51 | 1.6% |
| Scottish | 99 | 3.1% |
| Serbian | 11 | 0.3% |
| Slovak | 57 | 1.8% |
| Slovene | 22 | 0.7% |
| Sri Lankan | 17 | 0.5% |
| Subsaharan African | 1 | 0.0% |
| Swedish | 39 | 1.2% |
| Swiss | 6 | 0.2% |
| Ukrainian | 34 | 1.1% |
| Welsh | 115 | 3.6% | View All 38 Rows |
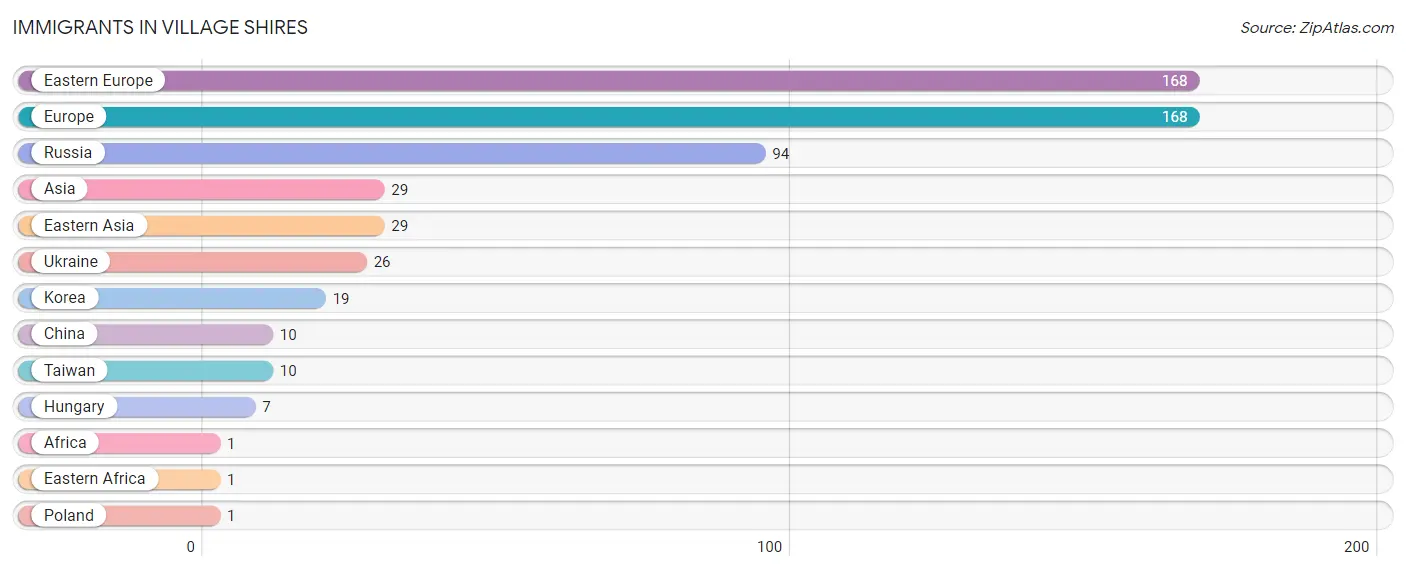
Immigrants in Village Shires
The most numerous immigrant groups reported in Village Shires came from Eastern Europe (168 | 5.2%), Europe (168 | 5.2%), Russia (94 | 2.9%), Asia (29 | 0.9%), and Eastern Asia (29 | 0.9%), together accounting for 15.3% of all Village Shires residents.
| Immigration Origin | # Population | % Population |
| Africa | 1 | 0.0% |
| Asia | 29 | 0.9% |
| China | 10 | 0.3% |
| Eastern Africa | 1 | 0.0% |
| Eastern Asia | 29 | 0.9% |
| Eastern Europe | 168 | 5.2% |
| Europe | 168 | 5.2% |
| Hungary | 7 | 0.2% |
| Korea | 19 | 0.6% |
| Poland | 1 | 0.0% |
| Russia | 94 | 2.9% |
| Taiwan | 10 | 0.3% |
| Ukraine | 26 | 0.8% | View All 13 Rows |
Sex and Age in Village Shires
Sex and Age in Village Shires
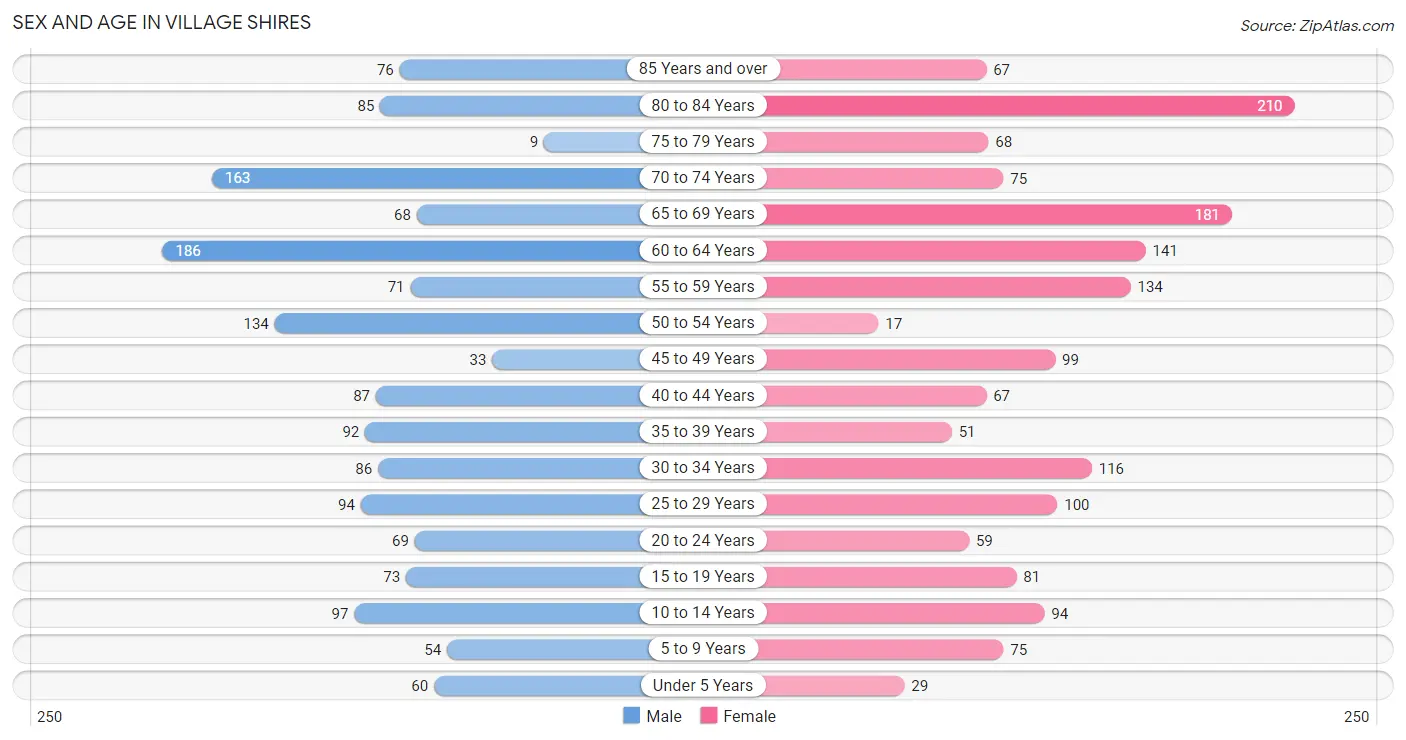
The most populous age groups in Village Shires are 60 to 64 Years (186 | 12.1%) for men and 80 to 84 Years (210 | 12.6%) for women.
| Age Bracket | Male | Female |
| Under 5 Years | 60 (3.9%) | 29 (1.7%) |
| 5 to 9 Years | 54 (3.5%) | 75 (4.5%) |
| 10 to 14 Years | 97 (6.3%) | 94 (5.7%) |
| 15 to 19 Years | 73 (4.8%) | 81 (4.9%) |
| 20 to 24 Years | 69 (4.5%) | 59 (3.5%) |
| 25 to 29 Years | 94 (6.1%) | 100 (6.0%) |
| 30 to 34 Years | 86 (5.6%) | 116 (7.0%) |
| 35 to 39 Years | 92 (6.0%) | 51 (3.1%) |
| 40 to 44 Years | 87 (5.7%) | 67 (4.0%) |
| 45 to 49 Years | 33 (2.1%) | 99 (5.9%) |
| 50 to 54 Years | 134 (8.7%) | 17 (1.0%) |
| 55 to 59 Years | 71 (4.6%) | 134 (8.1%) |
| 60 to 64 Years | 186 (12.1%) | 141 (8.5%) |
| 65 to 69 Years | 68 (4.4%) | 181 (10.9%) |
| 70 to 74 Years | 163 (10.6%) | 75 (4.5%) |
| 75 to 79 Years | 9 (0.6%) | 68 (4.1%) |
| 80 to 84 Years | 85 (5.5%) | 210 (12.6%) |
| 85 Years and over | 76 (4.9%) | 67 (4.0%) |
| Total | 1,537 (100.0%) | 1,664 (100.0%) |
Families and Households in Village Shires
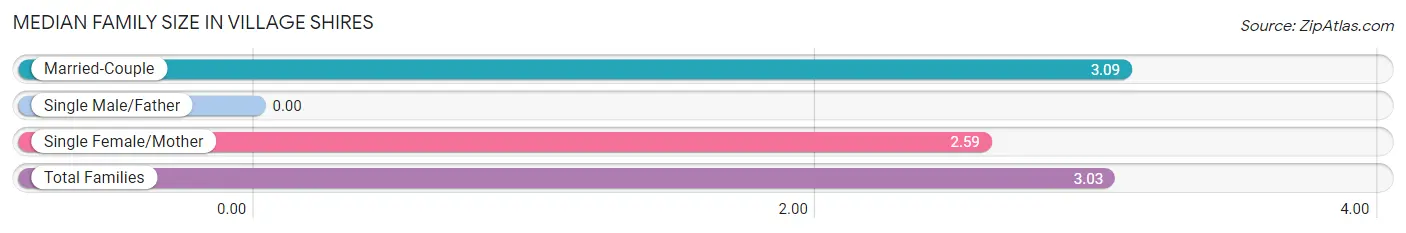
Median Family Size in Village Shires
| Family Type | # Families | Family Size |
| Married-Couple | 703 (88.5%) | 3.09 |
| Single Male/Father | 0 (0.0%) | - |
| Single Female/Mother | 91 (11.5%) | 2.59 |
| Total Families | 794 (100.0%) | 3.03 |
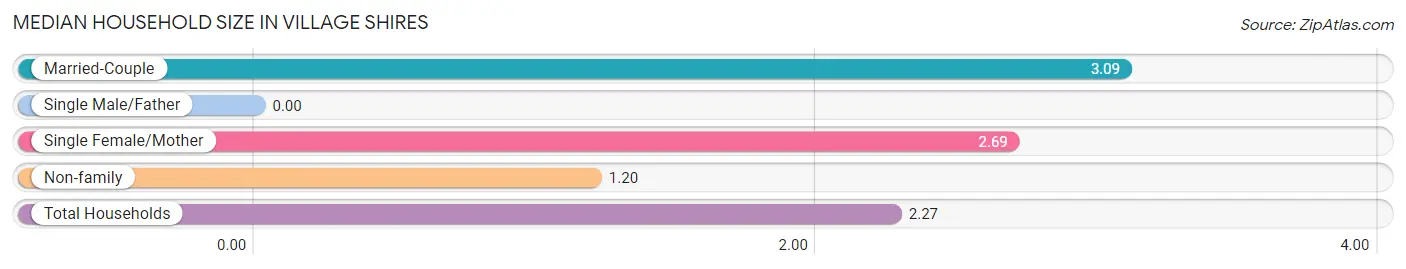
Median Household Size in Village Shires
| Household Type | # Households | Household Size |
| Married-Couple | 703 (51.6%) | 3.09 |
| Single Male/Father | 0 (0.0%) | - |
| Single Female/Mother | 91 (6.7%) | 2.69 |
| Non-family | 567 (41.7%) | 1.20 |
| Total Households | 1,361 (100.0%) | 2.27 |
Household Size by Marriage Status in Village Shires
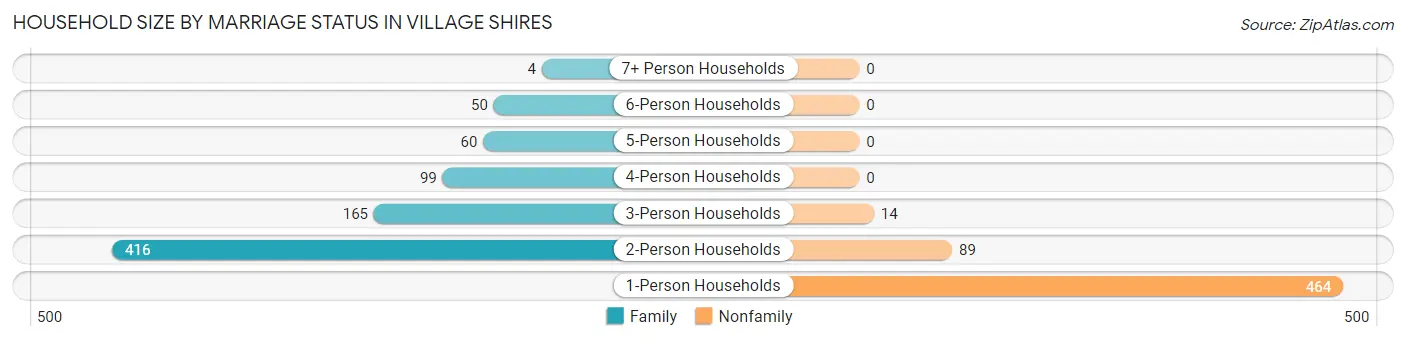
Out of a total of 1,361 households in Village Shires, 794 (58.3%) are family households, while 567 (41.7%) are nonfamily households. The most numerous type of family households are 2-person households, comprising 416, and the most common type of nonfamily households are 1-person households, comprising 464.
| Household Size | Family Households | Nonfamily Households |
| 1-Person Households | - | 464 (34.1%) |
| 2-Person Households | 416 (30.6%) | 89 (6.5%) |
| 3-Person Households | 165 (12.1%) | 14 (1.0%) |
| 4-Person Households | 99 (7.3%) | 0 (0.0%) |
| 5-Person Households | 60 (4.4%) | 0 (0.0%) |
| 6-Person Households | 50 (3.7%) | 0 (0.0%) |
| 7+ Person Households | 4 (0.3%) | 0 (0.0%) |
| Total | 794 (58.3%) | 567 (41.7%) |
Female Fertility in Village Shires
Fertility by Age in Village Shires
Average fertility rate in Village Shires is 54.0 births per 1,000 women. Women in the age bracket of 20 to 34 years have the highest fertility rate with 76.0 births per 1,000 women. Women in the age bracket of 20 to 34 years acount for 67.7% of all women with births.
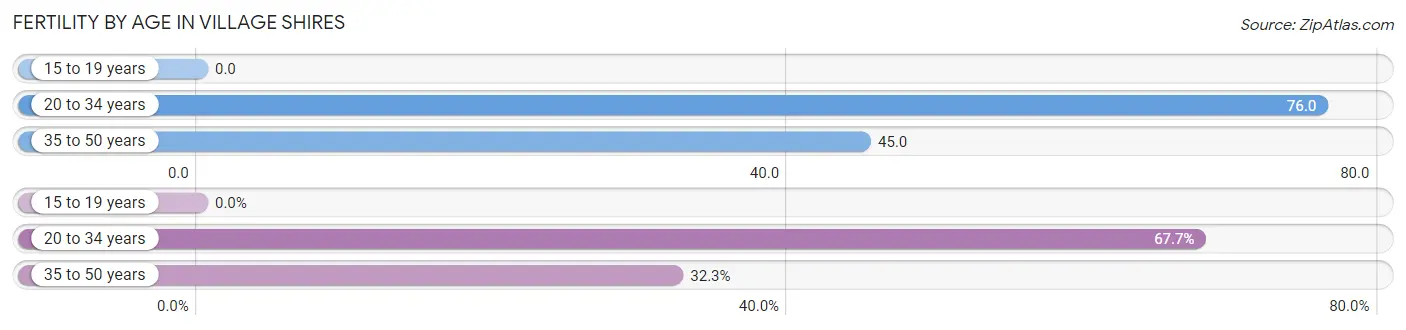
| Age Bracket | Women with Births | Births / 1,000 Women |
| 15 to 19 years | 0 (0.0%) | 0.0 |
| 20 to 34 years | 21 (67.7%) | 76.0 |
| 35 to 50 years | 10 (32.3%) | 45.0 |
| Total | 31 (100.0%) | 54.0 |
Fertility by Age by Marriage Status in Village Shires
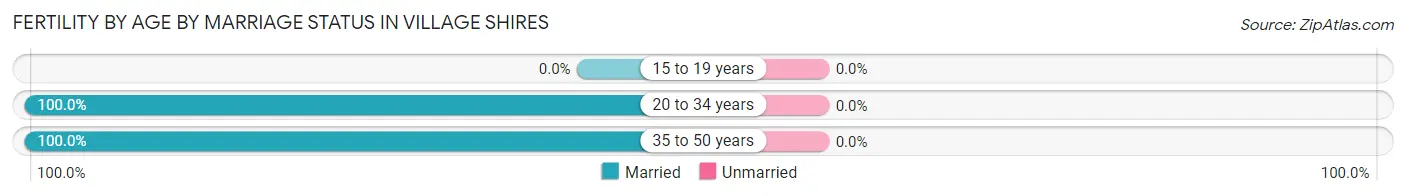
| Age Bracket | Married | Unmarried |
| 15 to 19 years | 0 (0.0%) | 0 (0.0%) |
| 20 to 34 years | 21 (100.0%) | 0 (0.0%) |
| 35 to 50 years | 10 (100.0%) | 0 (0.0%) |
| Total | 31 (100.0%) | 0 (0.0%) |
Fertility by Education in Village Shires
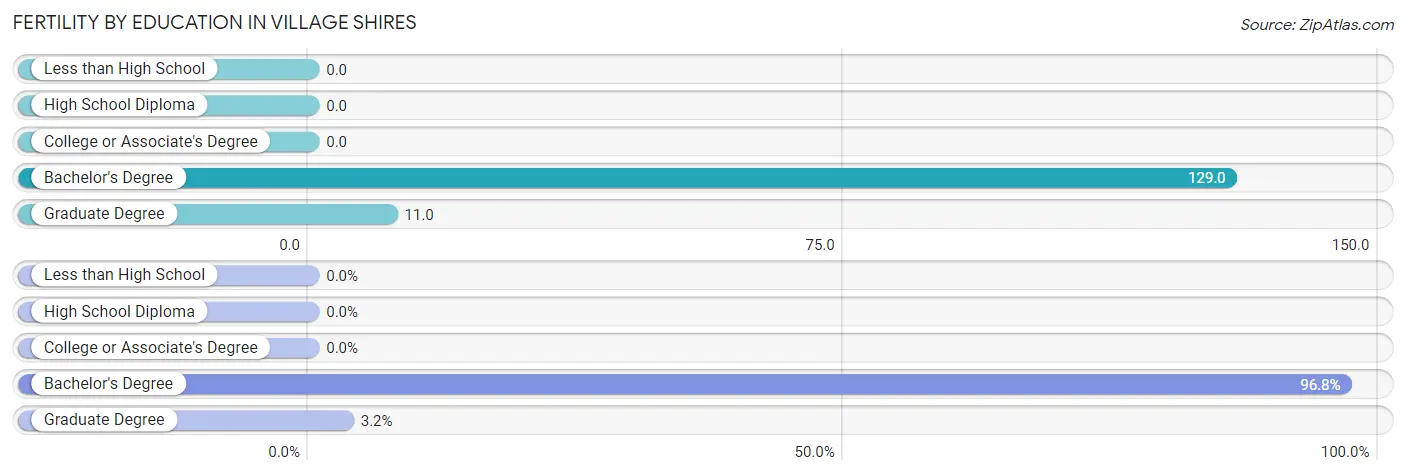
| Educational Attainment | Women with Births | Births / 1,000 Women |
| Less than High School | 0 (0.0%) | 0.0 |
| High School Diploma | 0 (0.0%) | 0.0 |
| College or Associate's Degree | 0 (0.0%) | 0.0 |
| Bachelor's Degree | 30 (96.8%) | 129.0 |
| Graduate Degree | 1 (3.2%) | 11.0 |
| Total | 31 (100.0%) | 54.0 |
Fertility by Education by Marriage Status in Village Shires
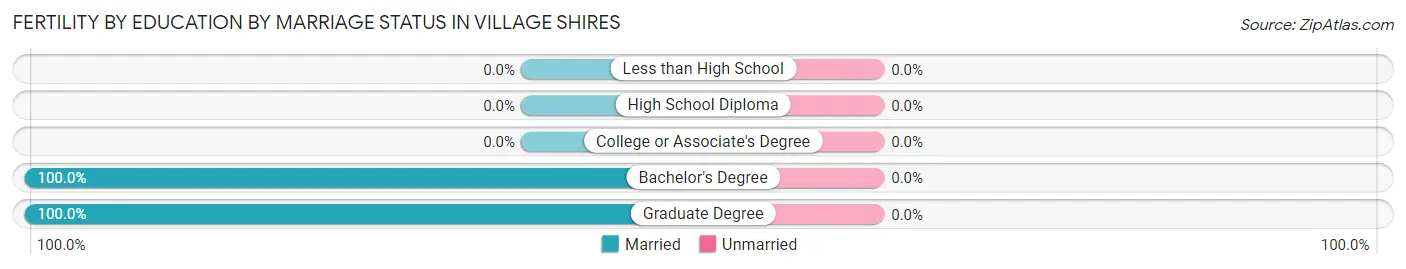
| Educational Attainment | Married | Unmarried |
| Less than High School | 0 (0.0%) | 0 (0.0%) |
| High School Diploma | 0 (0.0%) | 0 (0.0%) |
| College or Associate's Degree | 0 (0.0%) | 0 (0.0%) |
| Bachelor's Degree | 30 (100.0%) | 0 (0.0%) |
| Graduate Degree | 1 (100.0%) | 0 (0.0%) |
| Total | 31 (100.0%) | 0 (0.0%) |
Income in Village Shires
Income Overview in Village Shires
Per Capita Income in Village Shires is $54,664, while median incomes of families and households are $149,821 and $106,034 respectively.
| Characteristic | Number | Measure |
| Per Capita Income | 3,201 | $54,664 |
| Median Family Income | 794 | $149,821 |
| Mean Family Income | 794 | $161,039 |
| Median Household Income | 1,361 | $106,034 |
| Mean Household Income | 1,361 | $126,311 |
| Income Deficit | 794 | $0 |
| Wage / Income Gap (%) | 3,201 | 26.32% |
| Wage / Income Gap ($) | 3,201 | 73.68¢ per $1 |
| Gini / Inequality Index | 3,201 | 0.42 |
Earnings by Sex in Village Shires
Average Earnings in Village Shires are $59,132, $71,250 for men and $52,500 for women, a difference of 26.3%.
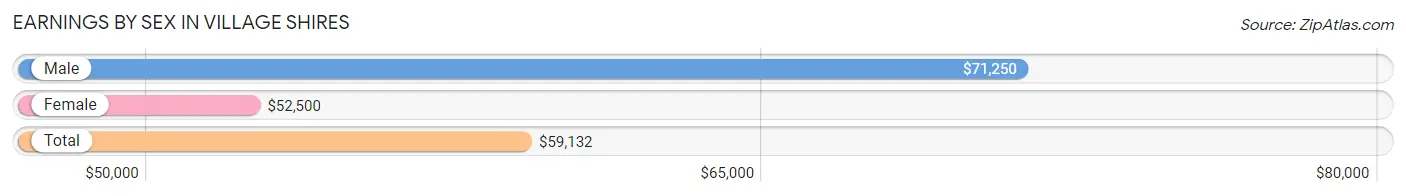
| Sex | Number | Average Earnings |
| Male | 872 (52.5%) | $71,250 |
| Female | 788 (47.5%) | $52,500 |
| Total | 1,660 (100.0%) | $59,132 |
Earnings by Sex by Income Bracket in Village Shires
The most common earnings brackets in Village Shires are $100,000+ for men (254 | 29.1%) and $100,000+ for women (169 | 21.4%).
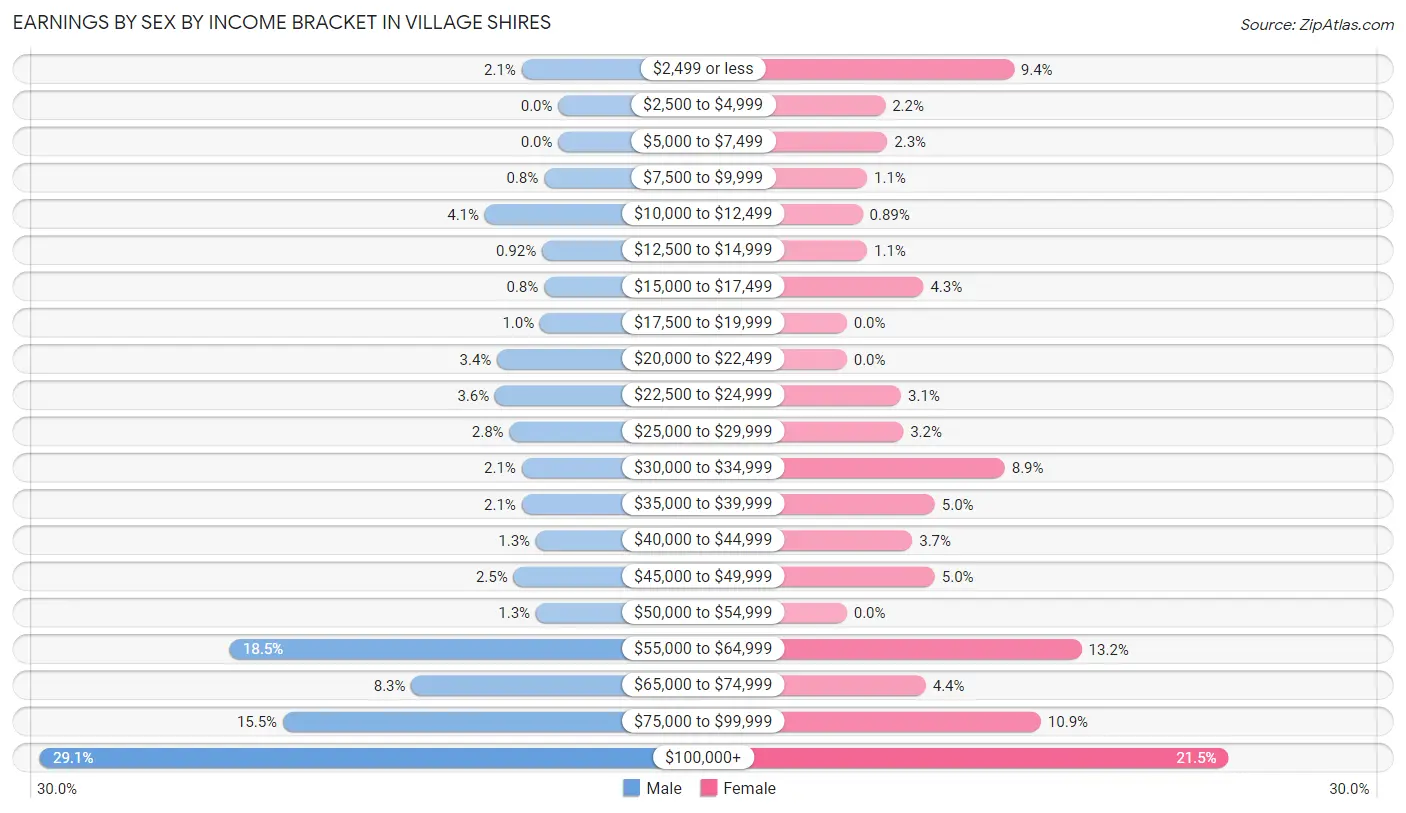
| Income | Male | Female |
| $2,499 or less | 18 (2.1%) | 74 (9.4%) |
| $2,500 to $4,999 | 0 (0.0%) | 17 (2.2%) |
| $5,000 to $7,499 | 0 (0.0%) | 18 (2.3%) |
| $7,500 to $9,999 | 7 (0.8%) | 9 (1.1%) |
| $10,000 to $12,499 | 36 (4.1%) | 7 (0.9%) |
| $12,500 to $14,999 | 8 (0.9%) | 9 (1.1%) |
| $15,000 to $17,499 | 7 (0.8%) | 34 (4.3%) |
| $17,500 to $19,999 | 9 (1.0%) | 0 (0.0%) |
| $20,000 to $22,499 | 30 (3.4%) | 0 (0.0%) |
| $22,500 to $24,999 | 31 (3.6%) | 24 (3.0%) |
| $25,000 to $29,999 | 24 (2.8%) | 25 (3.2%) |
| $30,000 to $34,999 | 18 (2.1%) | 70 (8.9%) |
| $35,000 to $39,999 | 18 (2.1%) | 39 (5.0%) |
| $40,000 to $44,999 | 11 (1.3%) | 29 (3.7%) |
| $45,000 to $49,999 | 22 (2.5%) | 39 (5.0%) |
| $50,000 to $54,999 | 11 (1.3%) | 0 (0.0%) |
| $55,000 to $64,999 | 161 (18.5%) | 104 (13.2%) |
| $65,000 to $74,999 | 72 (8.3%) | 35 (4.4%) |
| $75,000 to $99,999 | 135 (15.5%) | 86 (10.9%) |
| $100,000+ | 254 (29.1%) | 169 (21.4%) |
| Total | 872 (100.0%) | 788 (100.0%) |
Earnings by Sex by Educational Attainment in Village Shires
Average earnings in Village Shires are $75,000 for men and $56,232 for women, a difference of 25.0%. Men with an educational attainment of graduate degree enjoy the highest average annual earnings of $137,500, while those with college or associate's degree education earn the least with $56,071. Women with an educational attainment of graduate degree earn the most with the average annual earnings of $77,396, while those with high school diploma education have the smallest earnings of $33,935.
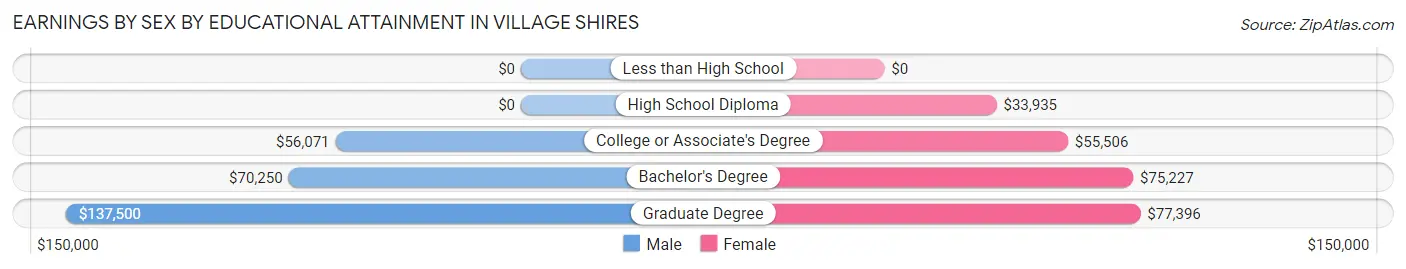
| Educational Attainment | Male Income | Female Income |
| Less than High School | - | - |
| High School Diploma | - | - |
| College or Associate's Degree | $56,071 | $55,506 |
| Bachelor's Degree | $70,250 | $75,227 |
| Graduate Degree | $137,500 | $77,396 |
| Total | $75,000 | $56,232 |
Family Income in Village Shires
Family Income Brackets in Village Shires
According to the Village Shires family income data, there are 207 families falling into the $200,000+ income range, which is the most common income bracket and makes up 26.1% of all families.
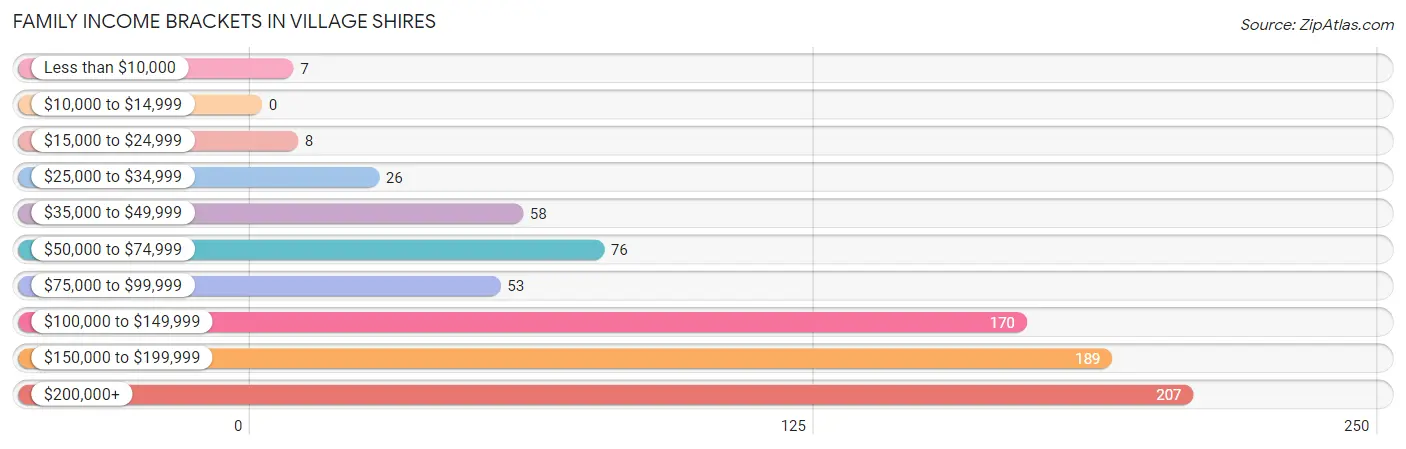
| Income Bracket | # Families | % Families |
| Less than $10,000 | 7 | 0.9% |
| $10,000 to $14,999 | 0 | 0.0% |
| $15,000 to $24,999 | 8 | 1.0% |
| $25,000 to $34,999 | 26 | 3.3% |
| $35,000 to $49,999 | 58 | 7.3% |
| $50,000 to $74,999 | 76 | 9.6% |
| $75,000 to $99,999 | 53 | 6.7% |
| $100,000 to $149,999 | 170 | 21.4% |
| $150,000 to $199,999 | 189 | 23.8% |
| $200,000+ | 207 | 26.1% |
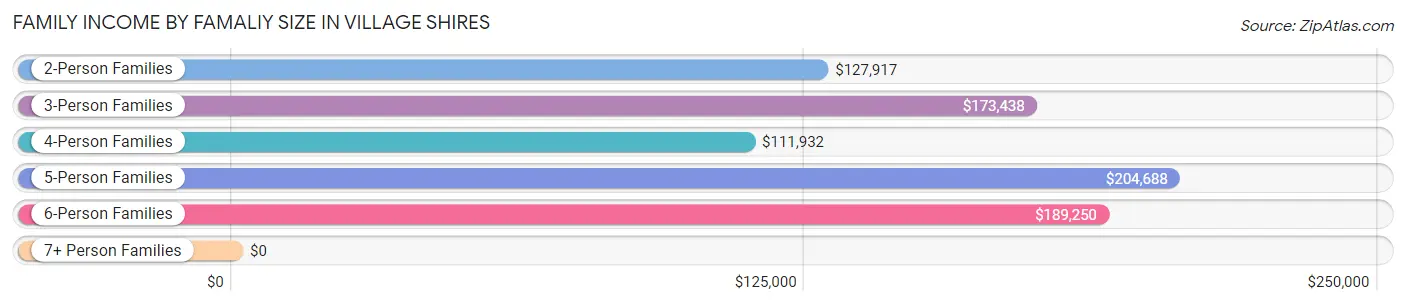
Family Income by Famaliy Size in Village Shires
5-person families (60 | 7.6%) account for the highest median family income in Village Shires with $204,688 per family, while 2-person families (425 | 53.5%) have the highest median income of $63,958 per family member.
| Income Bracket | # Families | Median Income |
| 2-Person Families | 425 (53.5%) | $127,917 |
| 3-Person Families | 156 (19.7%) | $173,438 |
| 4-Person Families | 99 (12.5%) | $111,932 |
| 5-Person Families | 60 (7.6%) | $204,688 |
| 6-Person Families | 50 (6.3%) | $189,250 |
| 7+ Person Families | 4 (0.5%) | $0 |
| Total | 794 (100.0%) | $149,821 |
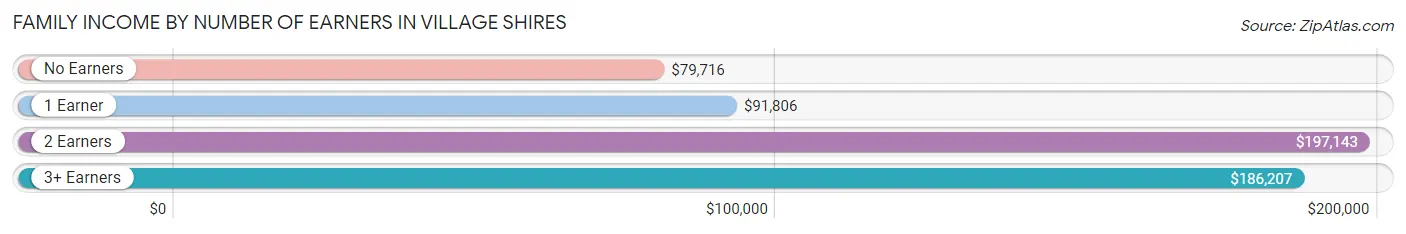
Family Income by Number of Earners in Village Shires
The median family income in Village Shires is $149,821, with families comprising 2 earners (324) having the highest median family income of $197,143, while families with no earners (181) have the lowest median family income of $79,716, accounting for 40.8% and 22.8% of families, respectively.
| Number of Earners | # Families | Median Income |
| No Earners | 181 (22.8%) | $79,716 |
| 1 Earner | 161 (20.3%) | $91,806 |
| 2 Earners | 324 (40.8%) | $197,143 |
| 3+ Earners | 128 (16.1%) | $186,207 |
| Total | 794 (100.0%) | $149,821 |
Household Income in Village Shires
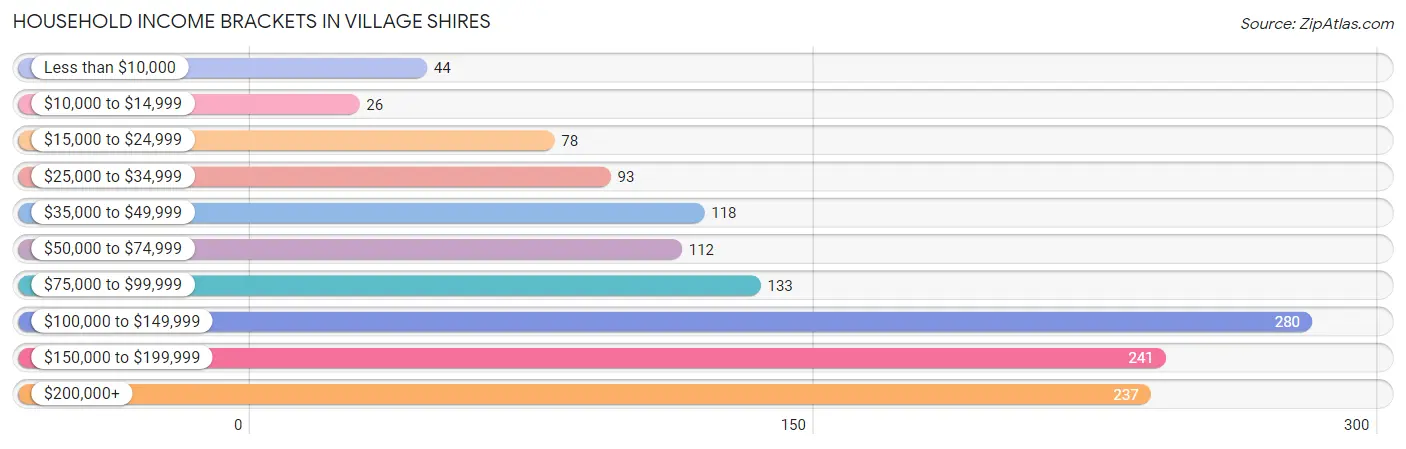
Household Income Brackets in Village Shires
With 280 households falling in the category, the $100,000 to $149,999 income range is the most frequent in Village Shires, accounting for 20.6% of all households. In contrast, only 26 households (1.9%) fall into the $10,000 to $14,999 income bracket, making it the least populous group.
| Income Bracket | # Households | % Households |
| Less than $10,000 | 44 | 3.2% |
| $10,000 to $14,999 | 26 | 1.9% |
| $15,000 to $24,999 | 78 | 5.7% |
| $25,000 to $34,999 | 93 | 6.8% |
| $35,000 to $49,999 | 118 | 8.7% |
| $50,000 to $74,999 | 112 | 8.2% |
| $75,000 to $99,999 | 133 | 9.8% |
| $100,000 to $149,999 | 280 | 20.6% |
| $150,000 to $199,999 | 241 | 17.7% |
| $200,000+ | 237 | 17.4% |
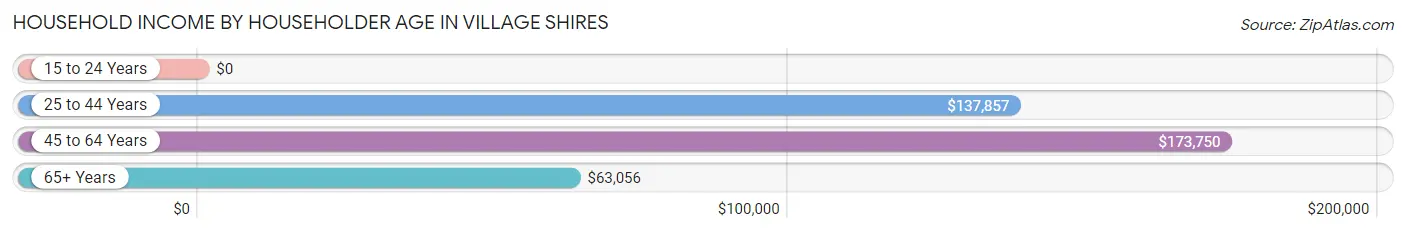
Household Income by Householder Age in Village Shires
The median household income in Village Shires is $106,034, with the highest median household income of $173,750 found in the 45 to 64 years age bracket for the primary householder. A total of 442 households (32.5%) fall into this category. Meanwhile, the 15 to 24 years age bracket for the primary householder has the lowest median household income of $0, with 13 households (1.0%) in this group.
| Income Bracket | # Households | Median Income |
| 15 to 24 Years | 13 (1.0%) | $0 |
| 25 to 44 Years | 288 (21.2%) | $137,857 |
| 45 to 64 Years | 442 (32.5%) | $173,750 |
| 65+ Years | 618 (45.4%) | $63,056 |
| Total | 1,361 (100.0%) | $106,034 |
Poverty in Village Shires
Income Below Poverty by Sex and Age in Village Shires
With 4.1% poverty level for males and 2.4% for females among the residents of Village Shires, 12 to 14 year old males and 35 to 44 year old females are the most vulnerable to poverty, with 7 males (21.2%) and 15 females (12.7%) in their respective age groups living below the poverty level.
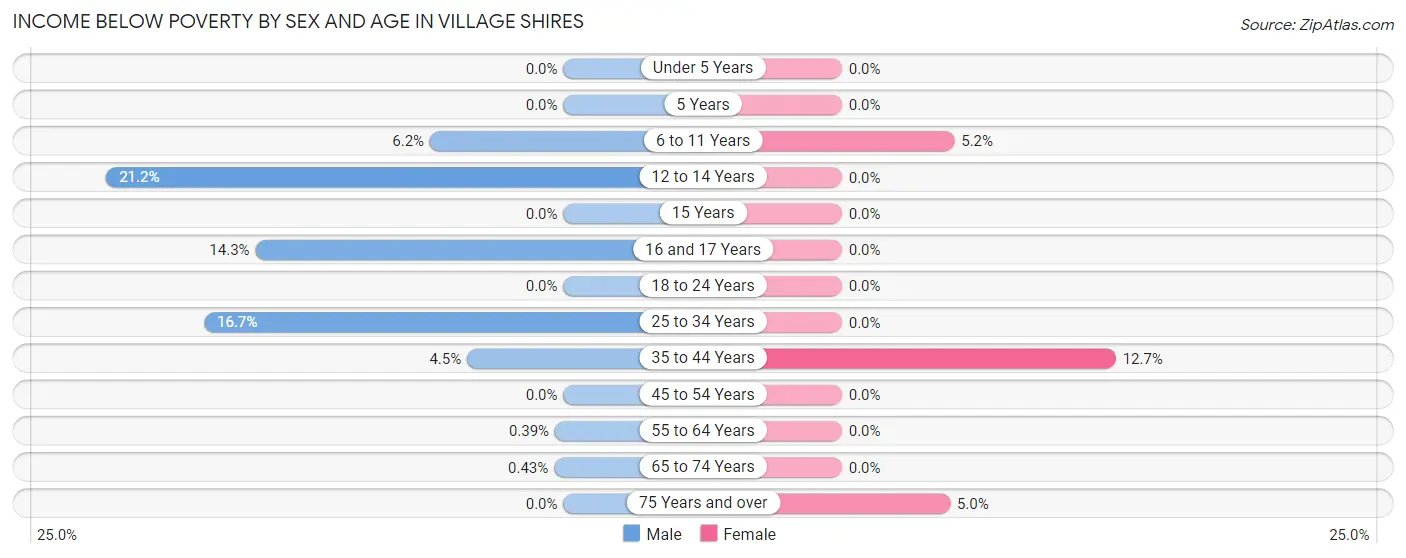
| Age Bracket | Male | Female |
| Under 5 Years | 0 (0.0%) | 0 (0.0%) |
| 5 Years | 0 (0.0%) | 0 (0.0%) |
| 6 to 11 Years | 6 (6.2%) | 7 (5.2%) |
| 12 to 14 Years | 7 (21.2%) | 0 (0.0%) |
| 15 Years | 0 (0.0%) | 0 (0.0%) |
| 16 and 17 Years | 7 (14.3%) | 0 (0.0%) |
| 18 to 24 Years | 0 (0.0%) | 0 (0.0%) |
| 25 to 34 Years | 30 (16.7%) | 0 (0.0%) |
| 35 to 44 Years | 8 (4.5%) | 15 (12.7%) |
| 45 to 54 Years | 0 (0.0%) | 0 (0.0%) |
| 55 to 64 Years | 1 (0.4%) | 0 (0.0%) |
| 65 to 74 Years | 1 (0.4%) | 0 (0.0%) |
| 75 Years and over | 0 (0.0%) | 16 (5.0%) |
| Total | 60 (4.1%) | 38 (2.4%) |
Income Above Poverty by Sex and Age in Village Shires
According to the poverty statistics in Village Shires, males aged under 5 years and females aged under 5 years are the age groups that are most secure financially, with 100.0% of males and 100.0% of females in these age groups living above the poverty line.
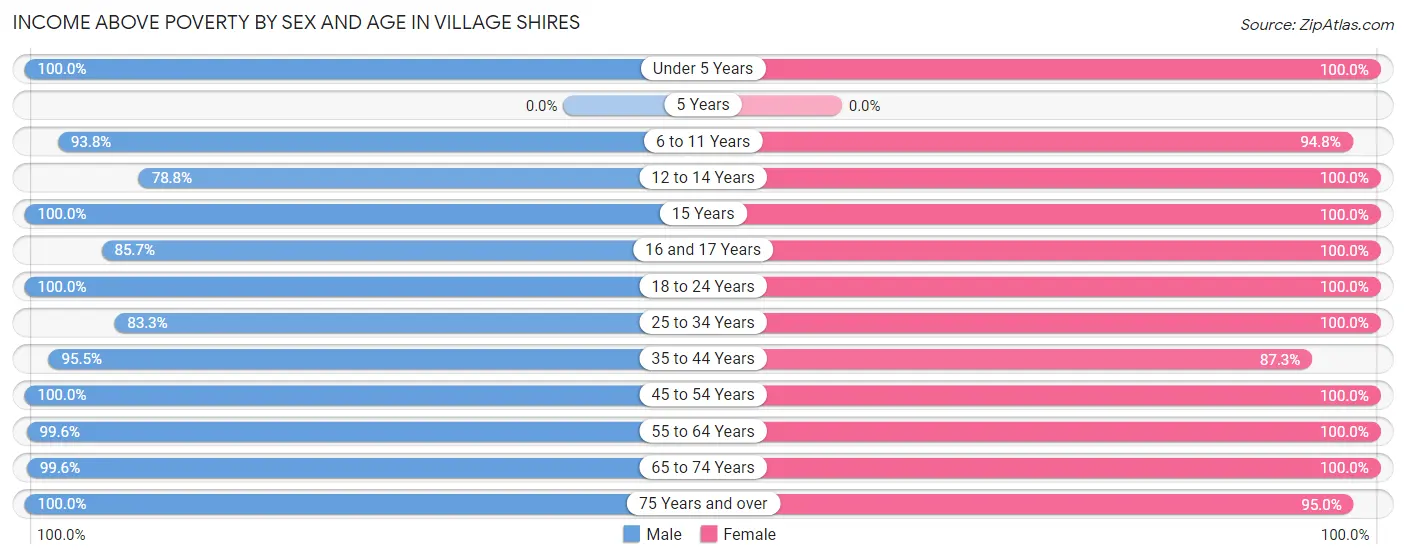
| Age Bracket | Male | Female |
| Under 5 Years | 60 (100.0%) | 29 (100.0%) |
| 5 Years | 0 (0.0%) | 0 (0.0%) |
| 6 to 11 Years | 91 (93.8%) | 127 (94.8%) |
| 12 to 14 Years | 26 (78.8%) | 35 (100.0%) |
| 15 Years | 14 (100.0%) | 14 (100.0%) |
| 16 and 17 Years | 42 (85.7%) | 14 (100.0%) |
| 18 to 24 Years | 79 (100.0%) | 112 (100.0%) |
| 25 to 34 Years | 150 (83.3%) | 216 (100.0%) |
| 35 to 44 Years | 171 (95.5%) | 103 (87.3%) |
| 45 to 54 Years | 167 (100.0%) | 112 (100.0%) |
| 55 to 64 Years | 256 (99.6%) | 258 (100.0%) |
| 65 to 74 Years | 230 (99.6%) | 251 (100.0%) |
| 75 Years and over | 122 (100.0%) | 303 (95.0%) |
| Total | 1,408 (95.9%) | 1,574 (97.6%) |
Income Below Poverty Among Married-Couple Families in Village Shires
The poverty statistics for married-couple families in Village Shires show that 1.1% or 8 of the total 703 families live below the poverty line. Families with 3 or 4 children have the highest poverty rate of 11.3%, comprising of 8 families. On the other hand, families with no children have the lowest poverty rate of 0.0%, which includes 0 families.
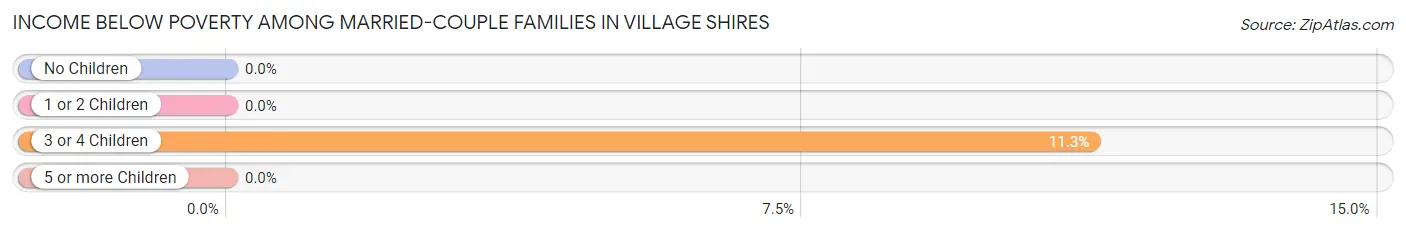
| Children | Above Poverty | Below Poverty |
| No Children | 473 (100.0%) | 0 (0.0%) |
| 1 or 2 Children | 159 (100.0%) | 0 (0.0%) |
| 3 or 4 Children | 63 (88.7%) | 8 (11.3%) |
| 5 or more Children | 0 (0.0%) | 0 (0.0%) |
| Total | 695 (98.9%) | 8 (1.1%) |
Income Below Poverty Among Single-Parent Households in Village Shires
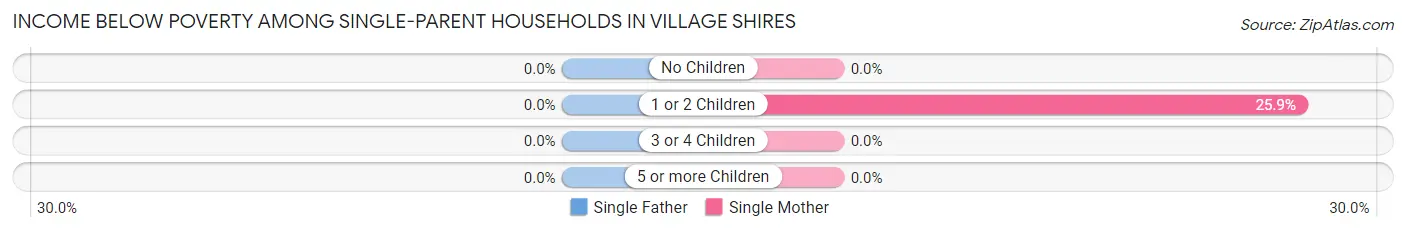
| Children | Single Father | Single Mother |
| No Children | 0 (0.0%) | 0 (0.0%) |
| 1 or 2 Children | 0 (0.0%) | 7 (25.9%) |
| 3 or 4 Children | 0 (0.0%) | 0 (0.0%) |
| 5 or more Children | 0 (0.0%) | 0 (0.0%) |
| Total | 0 (0.0%) | 7 (7.7%) |
Income Below Poverty Among Married-Couple vs Single-Parent Households in Village Shires
The poverty data for Village Shires shows that 8 of the married-couple family households (1.1%) and 7 of the single-parent households (7.7%) are living below the poverty level. Within the married-couple family households, those with 3 or 4 children have the highest poverty rate, with 8 households (11.3%) falling below the poverty line. Among the single-parent households, those with 1 or 2 children have the highest poverty rate, with 7 household (25.9%) living below poverty.
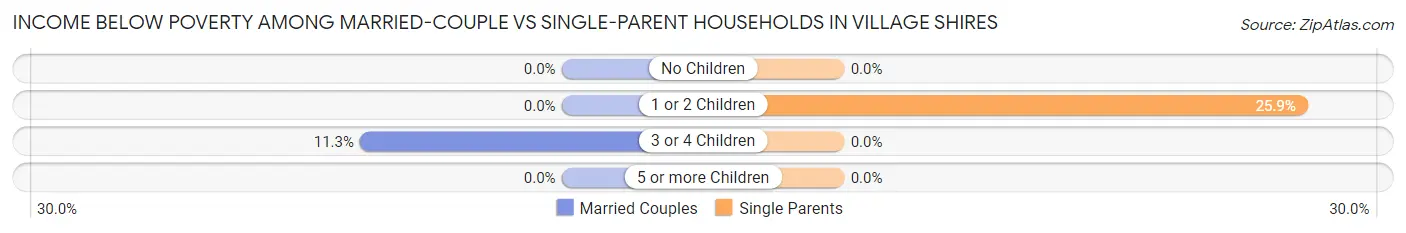
| Children | Married-Couple Families | Single-Parent Households |
| No Children | 0 (0.0%) | 0 (0.0%) |
| 1 or 2 Children | 0 (0.0%) | 7 (25.9%) |
| 3 or 4 Children | 8 (11.3%) | 0 (0.0%) |
| 5 or more Children | 0 (0.0%) | 0 (0.0%) |
| Total | 8 (1.1%) | 7 (7.7%) |
Employment Characteristics in Village Shires
Employment by Class of Employer in Village Shires
Among the 1,562 employed individuals in Village Shires, private company employees (1,067 | 68.3%), not-for-profit organizations (208 | 13.3%), and self-employed (not incorporated) (94 | 6.0%) make up the most common classes of employment.

| Employer Class | # Employees | % Employees |
| Private Company Employees | 1,067 | 68.3% |
| Self-Employed (Incorporated) | 50 | 3.2% |
| Self-Employed (Not Incorporated) | 94 | 6.0% |
| Not-for-profit Organizations | 208 | 13.3% |
| Local Government Employees | 54 | 3.5% |
| State Government Employees | 59 | 3.8% |
| Federal Government Employees | 30 | 1.9% |
| Unpaid Family Workers | 0 | 0.0% |
| Total | 1,562 | 100.0% |
Employment Status by Age in Village Shires
According to the labor force statistics for Village Shires, out of the total population over 16 years of age (2,764), 58.0% or 1,603 individuals are in the labor force, with 1.6% or 26 of them unemployed. The age group with the highest labor force participation rate is 25 to 29 years, with 91.2% or 177 individuals in the labor force. Within the labor force, the 75 years and over age range has the highest percentage of unemployed individuals, with 58.8% or 10 of them being unemployed.
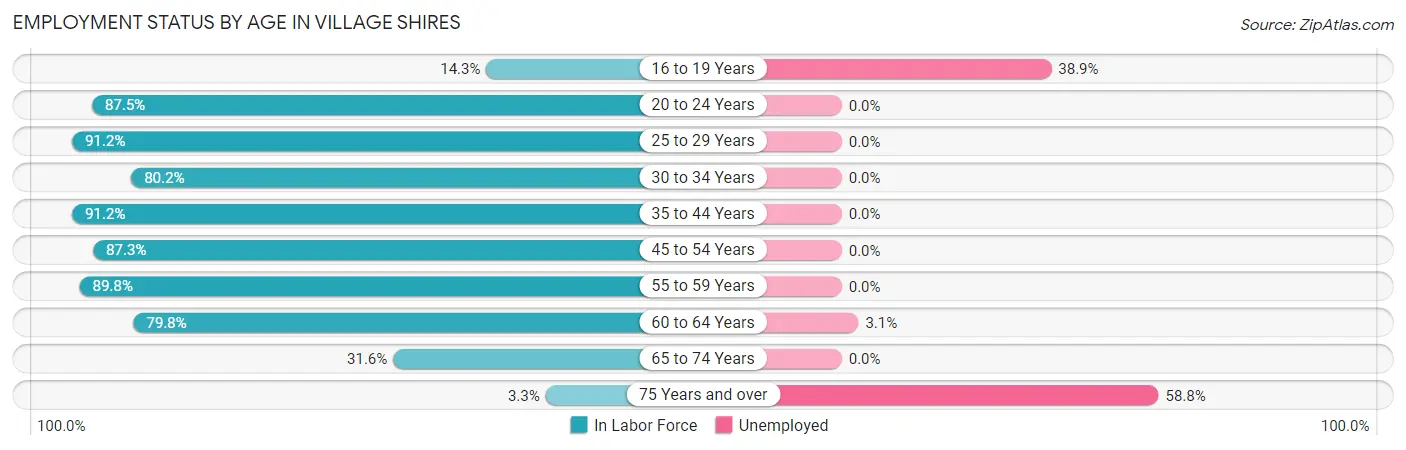
| Age Bracket | In Labor Force | Unemployed |
| 16 to 19 Years | 18 (14.3%) | 7 (38.9%) |
| 20 to 24 Years | 112 (87.5%) | 0 (0.0%) |
| 25 to 29 Years | 177 (91.2%) | 0 (0.0%) |
| 30 to 34 Years | 162 (80.2%) | 0 (0.0%) |
| 35 to 44 Years | 271 (91.2%) | 0 (0.0%) |
| 45 to 54 Years | 247 (87.3%) | 0 (0.0%) |
| 55 to 59 Years | 184 (89.8%) | 0 (0.0%) |
| 60 to 64 Years | 261 (79.8%) | 8 (3.1%) |
| 65 to 74 Years | 154 (31.6%) | 0 (0.0%) |
| 75 Years and over | 17 (3.3%) | 10 (58.8%) |
| Total | 1,603 (58.0%) | 26 (1.6%) |
Employment Status by Educational Attainment in Village Shires
According to labor force statistics for Village Shires, 86.3% of individuals (1,301) out of the total population between 25 and 64 years of age (1,508) are in the labor force, with 0.6% or 8 of them being unemployed. The group with the highest labor force participation rate are those with the educational attainment of bachelor's degree or higher, with 96.3% or 842 individuals in the labor force. Within the labor force, individuals with college / associate degree education have the highest percentage of unemployment, with 3.1% or 8 of them being unemployed.
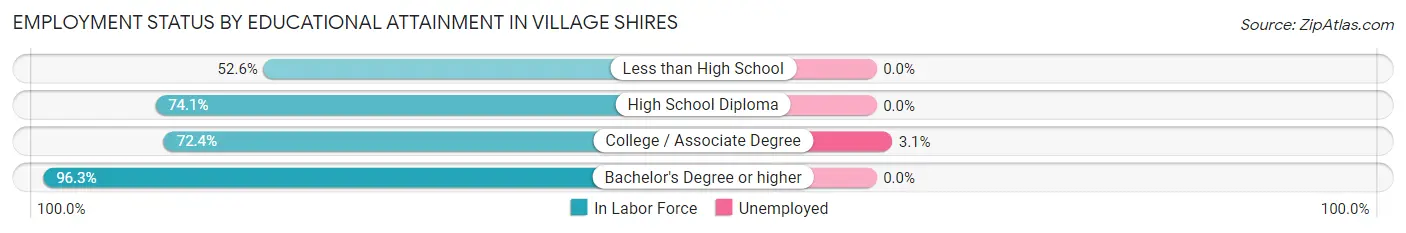
| Educational Attainment | In Labor Force | Unemployed |
| Less than High School | 10 (52.6%) | 0 (0.0%) |
| High School Diploma | 195 (74.1%) | 0 (0.0%) |
| College / Associate Degree | 255 (72.4%) | 11 (3.1%) |
| Bachelor's Degree or higher | 842 (96.3%) | 0 (0.0%) |
| Total | 1,301 (86.3%) | 9 (0.6%) |
Employment Occupations by Sex in Village Shires
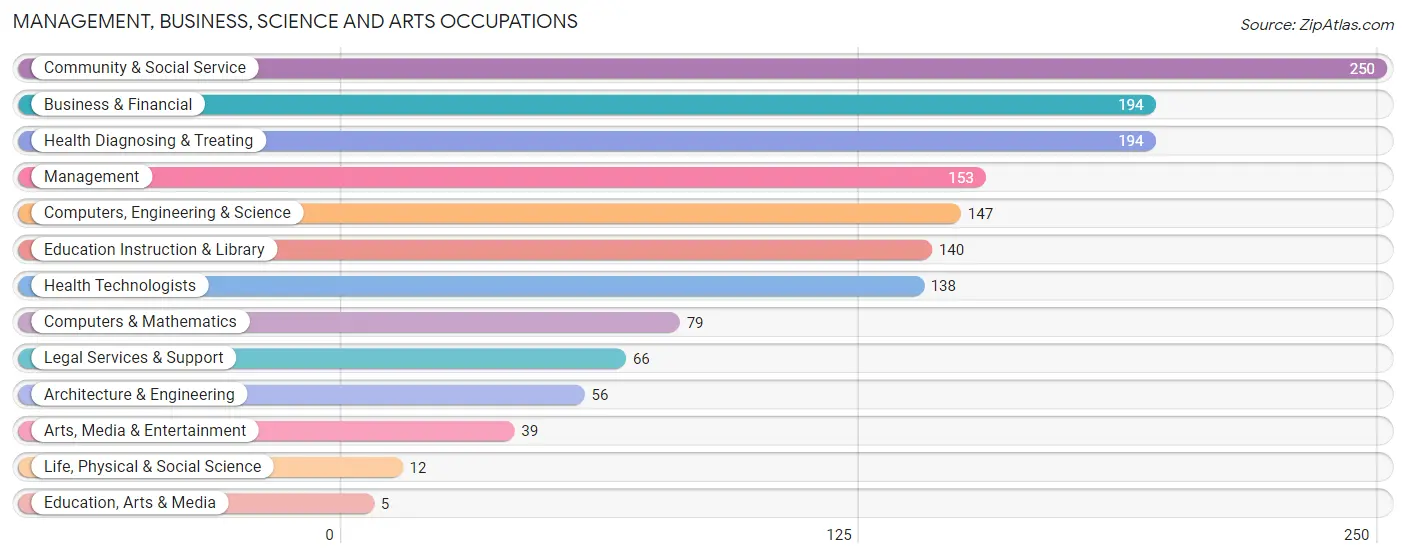
Management, Business, Science and Arts Occupations
The most common Management, Business, Science and Arts occupations in Village Shires are Community & Social Service (250 | 15.8%), Business & Financial (194 | 12.3%), Health Diagnosing & Treating (194 | 12.3%), Management (153 | 9.7%), and Computers, Engineering & Science (147 | 9.3%).
Management, Business, Science and Arts Occupations by Sex
Within the Management, Business, Science and Arts occupations in Village Shires, the most male-oriented occupations are Management (90.2%), Computers & Mathematics (82.3%), and Architecture & Engineering (78.6%), while the most female-oriented occupations are Life, Physical & Social Science (100.0%), Education, Arts & Media (100.0%), and Health Technologists (100.0%).
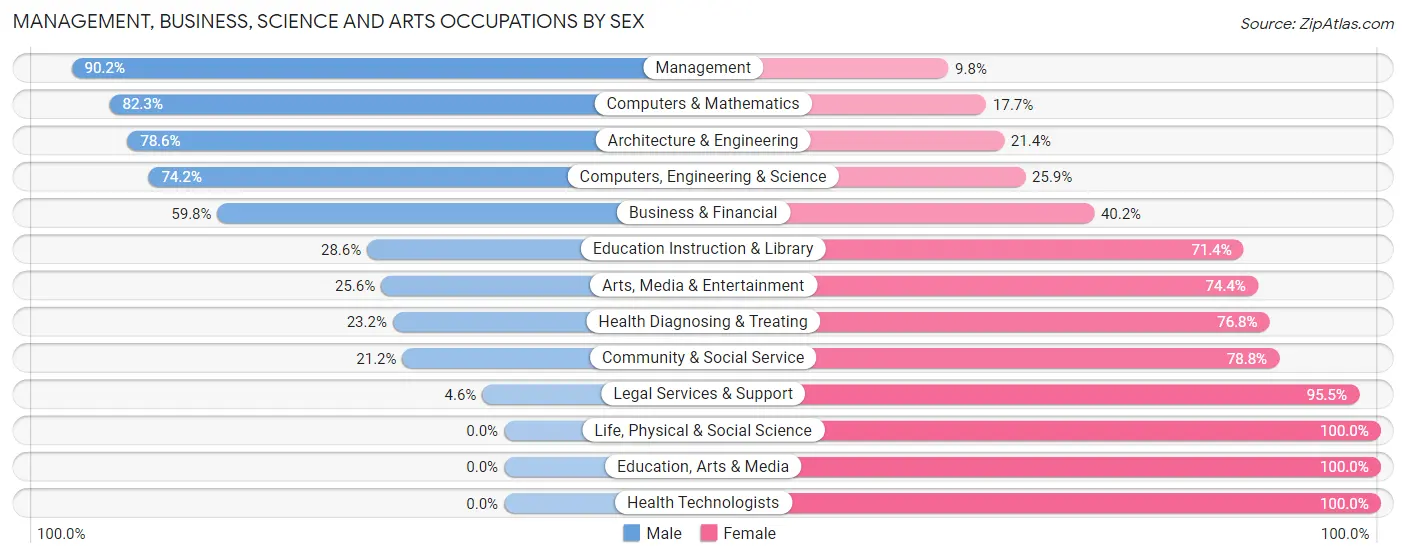
| Occupation | Male | Female |
| Management | 138 (90.2%) | 15 (9.8%) |
| Business & Financial | 116 (59.8%) | 78 (40.2%) |
| Computers, Engineering & Science | 109 (74.2%) | 38 (25.9%) |
| Computers & Mathematics | 65 (82.3%) | 14 (17.7%) |
| Architecture & Engineering | 44 (78.6%) | 12 (21.4%) |
| Life, Physical & Social Science | 0 (0.0%) | 12 (100.0%) |
| Community & Social Service | 53 (21.2%) | 197 (78.8%) |
| Education, Arts & Media | 0 (0.0%) | 5 (100.0%) |
| Legal Services & Support | 3 (4.5%) | 63 (95.5%) |
| Education Instruction & Library | 40 (28.6%) | 100 (71.4%) |
| Arts, Media & Entertainment | 10 (25.6%) | 29 (74.4%) |
| Health Diagnosing & Treating | 45 (23.2%) | 149 (76.8%) |
| Health Technologists | 0 (0.0%) | 138 (100.0%) |
| Total (Category) | 461 (49.1%) | 477 (50.8%) |
| Total (Overall) | 811 (51.4%) | 767 (48.6%) |
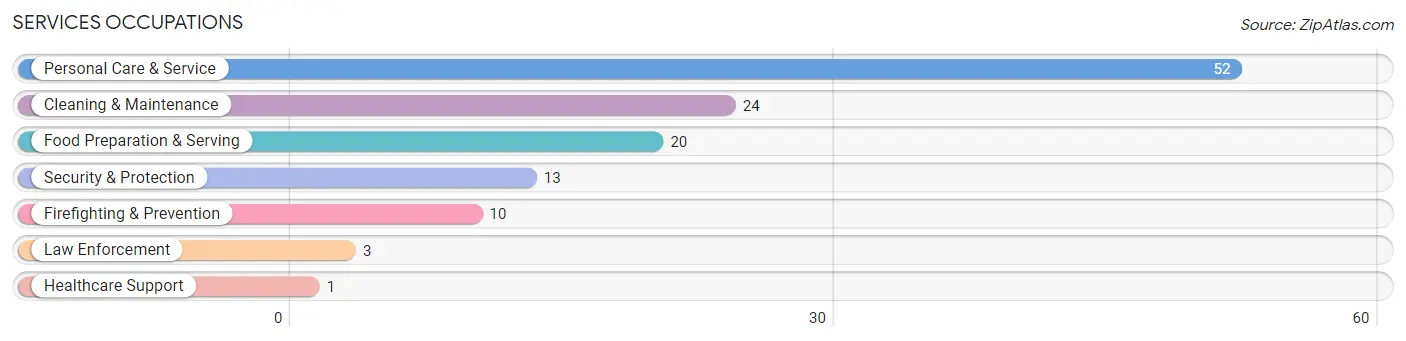
Services Occupations
The most common Services occupations in Village Shires are Personal Care & Service (52 | 3.3%), Cleaning & Maintenance (24 | 1.5%), Food Preparation & Serving (20 | 1.3%), Security & Protection (13 | 0.8%), and Firefighting & Prevention (10 | 0.6%).
Services Occupations by Sex
Within the Services occupations in Village Shires, the most male-oriented occupations are Security & Protection (100.0%), Firefighting & Prevention (100.0%), and Law Enforcement (100.0%), while the most female-oriented occupations are Healthcare Support (100.0%), Personal Care & Service (82.7%), and Cleaning & Maintenance (66.7%).
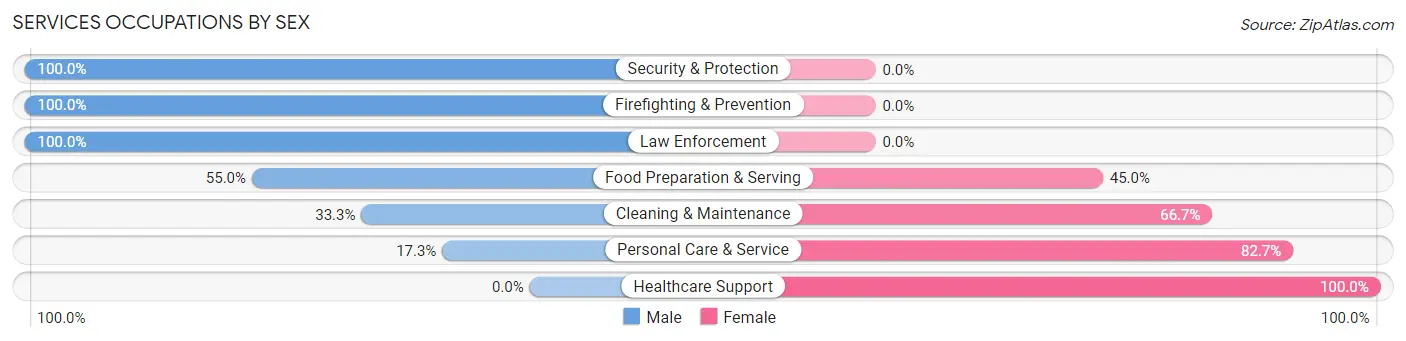
| Occupation | Male | Female |
| Healthcare Support | 0 (0.0%) | 1 (100.0%) |
| Security & Protection | 13 (100.0%) | 0 (0.0%) |
| Firefighting & Prevention | 10 (100.0%) | 0 (0.0%) |
| Law Enforcement | 3 (100.0%) | 0 (0.0%) |
| Food Preparation & Serving | 11 (55.0%) | 9 (45.0%) |
| Cleaning & Maintenance | 8 (33.3%) | 16 (66.7%) |
| Personal Care & Service | 9 (17.3%) | 43 (82.7%) |
| Total (Category) | 41 (37.3%) | 69 (62.7%) |
| Total (Overall) | 811 (51.4%) | 767 (48.6%) |
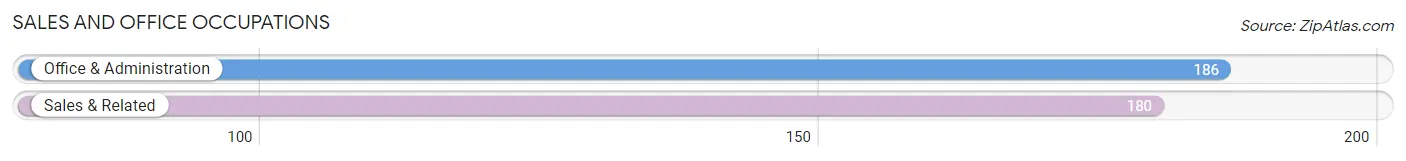
Sales and Office Occupations
The most common Sales and Office occupations in Village Shires are Office & Administration (186 | 11.8%), and Sales & Related (180 | 11.4%).
Sales and Office Occupations by Sex
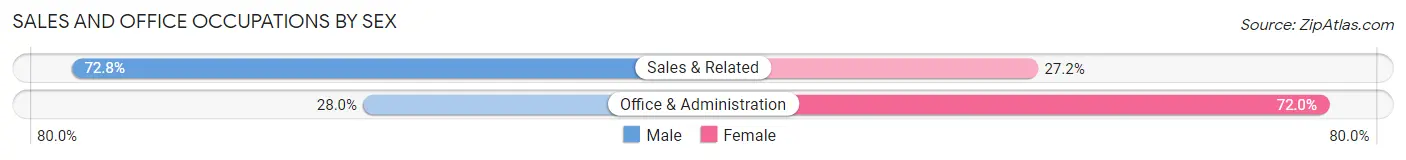
| Occupation | Male | Female |
| Sales & Related | 131 (72.8%) | 49 (27.2%) |
| Office & Administration | 52 (28.0%) | 134 (72.0%) |
| Total (Category) | 183 (50.0%) | 183 (50.0%) |
| Total (Overall) | 811 (51.4%) | 767 (48.6%) |
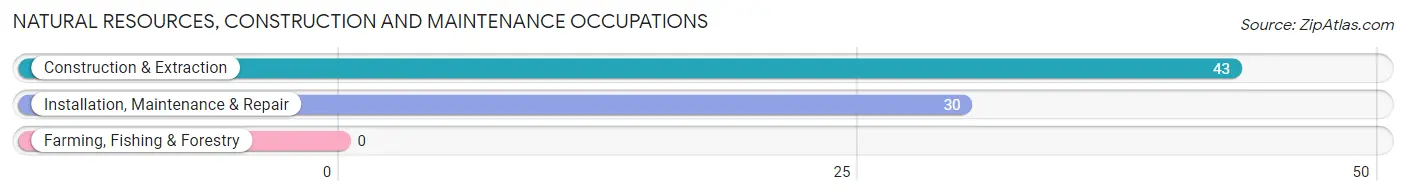
Natural Resources, Construction and Maintenance Occupations
The most common Natural Resources, Construction and Maintenance occupations in Village Shires are Construction & Extraction (43 | 2.7%), and Installation, Maintenance & Repair (30 | 1.9%).
Natural Resources, Construction and Maintenance Occupations by Sex
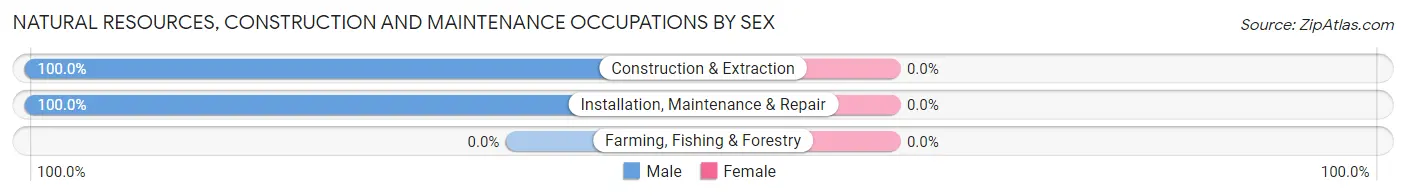
| Occupation | Male | Female |
| Farming, Fishing & Forestry | 0 (0.0%) | 0 (0.0%) |
| Construction & Extraction | 43 (100.0%) | 0 (0.0%) |
| Installation, Maintenance & Repair | 30 (100.0%) | 0 (0.0%) |
| Total (Category) | 73 (100.0%) | 0 (0.0%) |
| Total (Overall) | 811 (51.4%) | 767 (48.6%) |
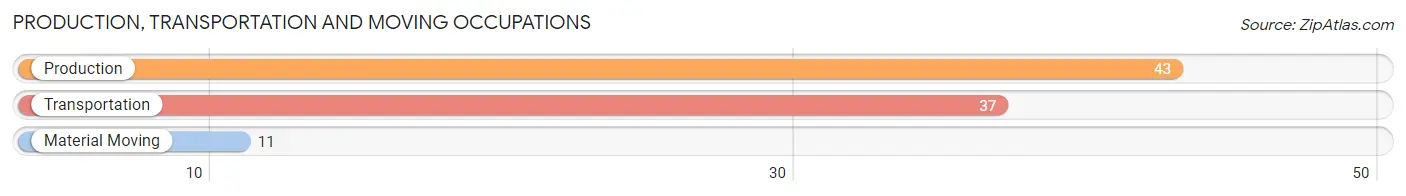
Production, Transportation and Moving Occupations
The most common Production, Transportation and Moving occupations in Village Shires are Production (43 | 2.7%), Transportation (37 | 2.3%), and Material Moving (11 | 0.7%).
Production, Transportation and Moving Occupations by Sex
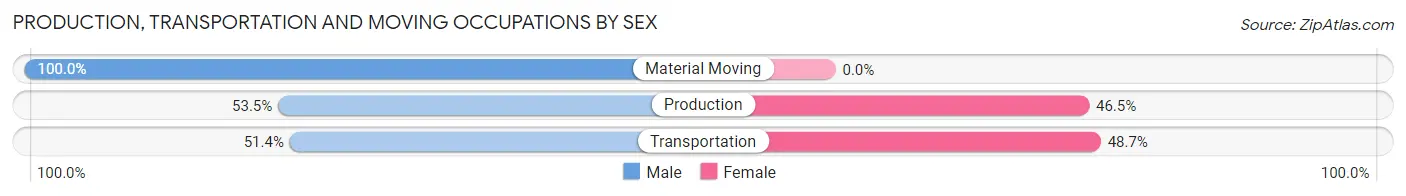
| Occupation | Male | Female |
| Production | 23 (53.5%) | 20 (46.5%) |
| Transportation | 19 (51.3%) | 18 (48.6%) |
| Material Moving | 11 (100.0%) | 0 (0.0%) |
| Total (Category) | 53 (58.2%) | 38 (41.8%) |
| Total (Overall) | 811 (51.4%) | 767 (48.6%) |
Employment Industries by Sex in Village Shires
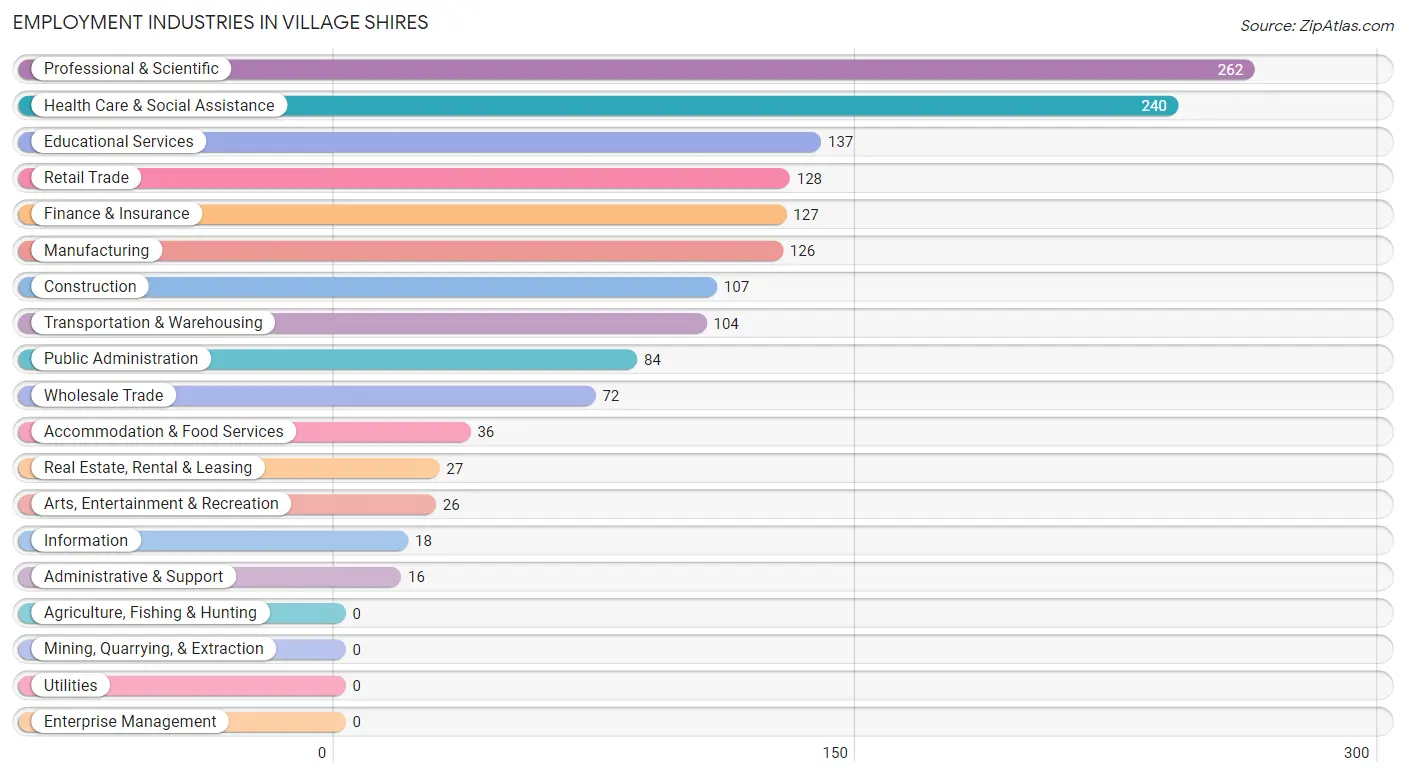
Employment Industries in Village Shires
The major employment industries in Village Shires include Professional & Scientific (262 | 16.6%), Health Care & Social Assistance (240 | 15.2%), Educational Services (137 | 8.7%), Retail Trade (128 | 8.1%), and Finance & Insurance (127 | 8.1%).
Employment Industries by Sex in Village Shires
The Village Shires industries that see more men than women are Construction (100.0%), Information (100.0%), and Accommodation & Food Services (100.0%), whereas the industries that tend to have a higher number of women are Administrative & Support (100.0%), Arts, Entertainment & Recreation (100.0%), and Health Care & Social Assistance (79.2%).
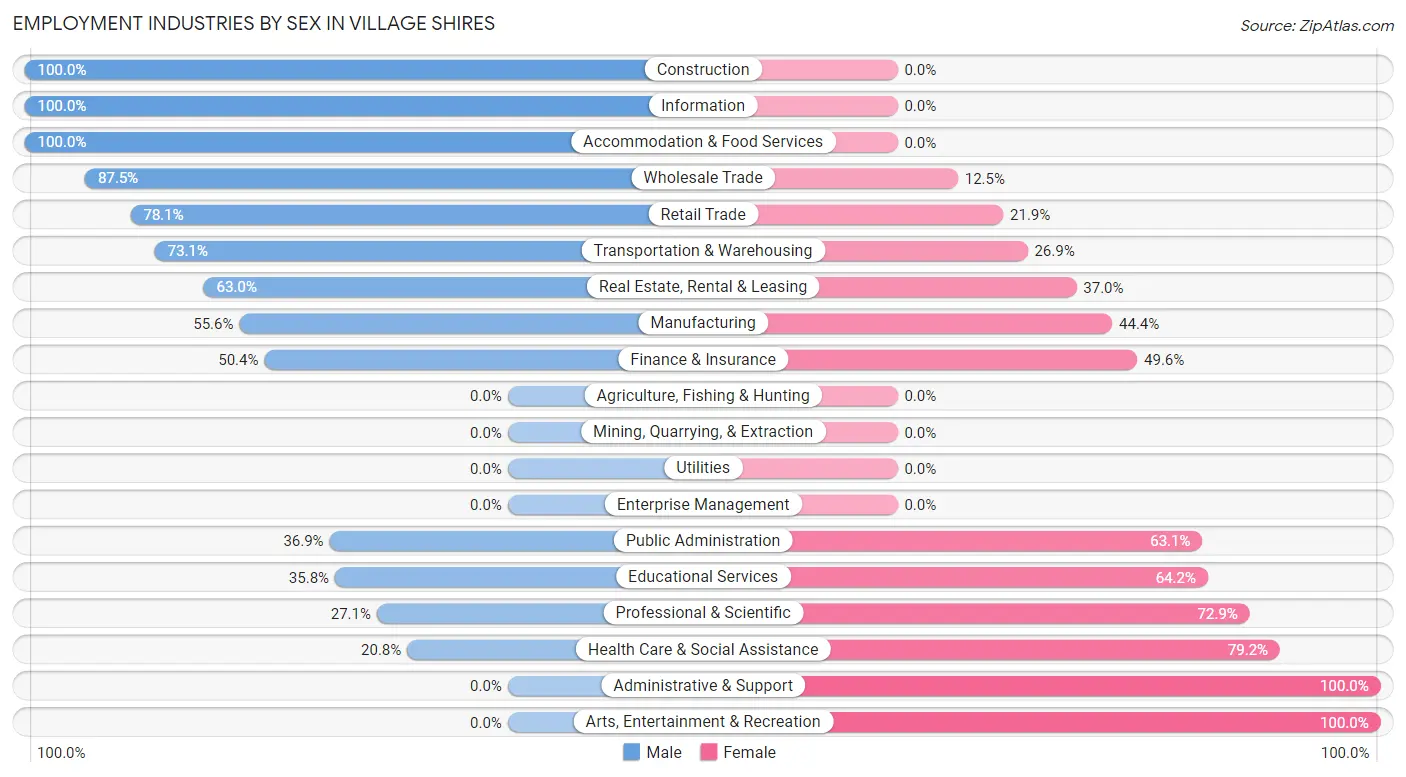
| Industry | Male | Female |
| Agriculture, Fishing & Hunting | 0 (0.0%) | 0 (0.0%) |
| Mining, Quarrying, & Extraction | 0 (0.0%) | 0 (0.0%) |
| Construction | 107 (100.0%) | 0 (0.0%) |
| Manufacturing | 70 (55.6%) | 56 (44.4%) |
| Wholesale Trade | 63 (87.5%) | 9 (12.5%) |
| Retail Trade | 100 (78.1%) | 28 (21.9%) |
| Transportation & Warehousing | 76 (73.1%) | 28 (26.9%) |
| Utilities | 0 (0.0%) | 0 (0.0%) |
| Information | 18 (100.0%) | 0 (0.0%) |
| Finance & Insurance | 64 (50.4%) | 63 (49.6%) |
| Real Estate, Rental & Leasing | 17 (63.0%) | 10 (37.0%) |
| Professional & Scientific | 71 (27.1%) | 191 (72.9%) |
| Enterprise Management | 0 (0.0%) | 0 (0.0%) |
| Administrative & Support | 0 (0.0%) | 16 (100.0%) |
| Educational Services | 49 (35.8%) | 88 (64.2%) |
| Health Care & Social Assistance | 50 (20.8%) | 190 (79.2%) |
| Arts, Entertainment & Recreation | 0 (0.0%) | 26 (100.0%) |
| Accommodation & Food Services | 36 (100.0%) | 0 (0.0%) |
| Public Administration | 31 (36.9%) | 53 (63.1%) |
| Total | 811 (51.4%) | 767 (48.6%) |
Education in Village Shires
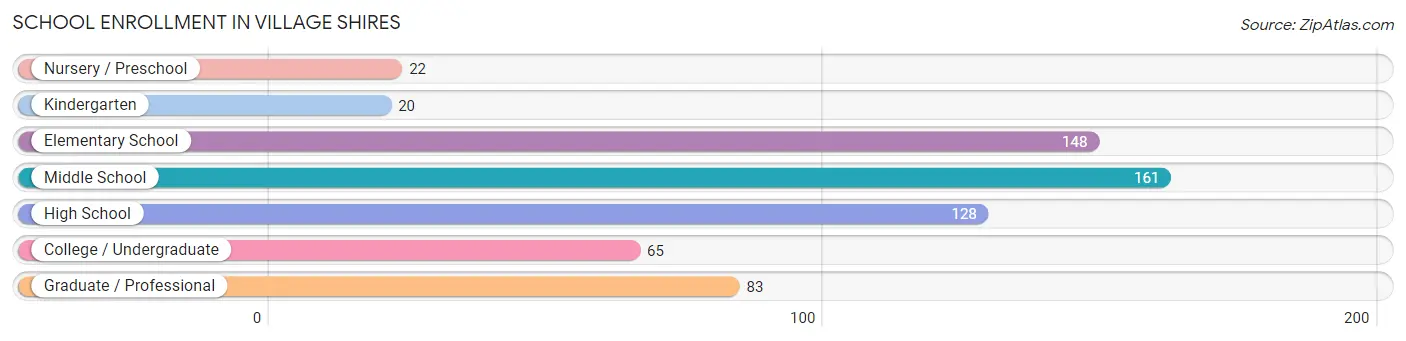
School Enrollment in Village Shires
The most common levels of schooling among the 627 students in Village Shires are middle school (161 | 25.7%), elementary school (148 | 23.6%), and high school (128 | 20.4%).
| School Level | # Students | % Students |
| Nursery / Preschool | 22 | 3.5% |
| Kindergarten | 20 | 3.2% |
| Elementary School | 148 | 23.6% |
| Middle School | 161 | 25.7% |
| High School | 128 | 20.4% |
| College / Undergraduate | 65 | 10.4% |
| Graduate / Professional | 83 | 13.2% |
| Total | 627 | 100.0% |
School Enrollment by Age by Funding Source in Village Shires
Out of a total of 627 students who are enrolled in schools in Village Shires, 90 (14.4%) attend a private institution, while the remaining 537 (85.6%) are enrolled in public schools. The age group of 35 years and over has the highest likelihood of being enrolled in private schools, with 37 (63.8% in the age bracket) enrolled. Conversely, the age group of 10 to 14 year olds has the lowest likelihood of being enrolled in a private school, with 191 (100.0% in the age bracket) attending a public institution.
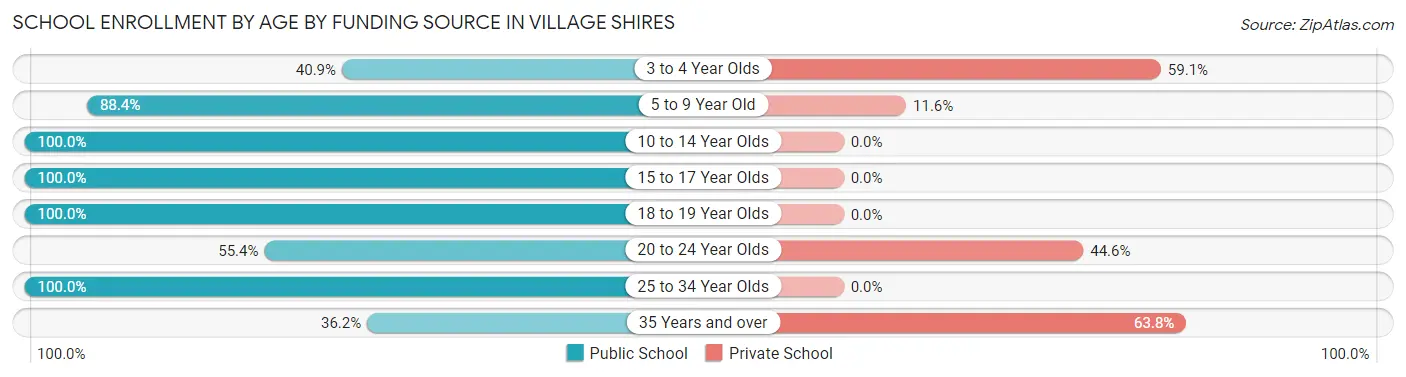
| Age Bracket | Public School | Private School |
| 3 to 4 Year Olds | 9 (40.9%) | 13 (59.1%) |
| 5 to 9 Year Old | 114 (88.4%) | 15 (11.6%) |
| 10 to 14 Year Olds | 191 (100.0%) | 0 (0.0%) |
| 15 to 17 Year Olds | 91 (100.0%) | 0 (0.0%) |
| 18 to 19 Year Olds | 63 (100.0%) | 0 (0.0%) |
| 20 to 24 Year Olds | 31 (55.4%) | 25 (44.6%) |
| 25 to 34 Year Olds | 17 (100.0%) | 0 (0.0%) |
| 35 Years and over | 21 (36.2%) | 37 (63.8%) |
| Total | 537 (85.6%) | 90 (14.4%) |
Educational Attainment by Field of Study in Village Shires
Business (368 | 27.5%), education (187 | 14.0%), engineering (119 | 8.9%), bio, nature & agricultural (99 | 7.4%), and science & technology (96 | 7.2%) are the most common fields of study among 1,338 individuals in Village Shires who have obtained a bachelor's degree or higher.
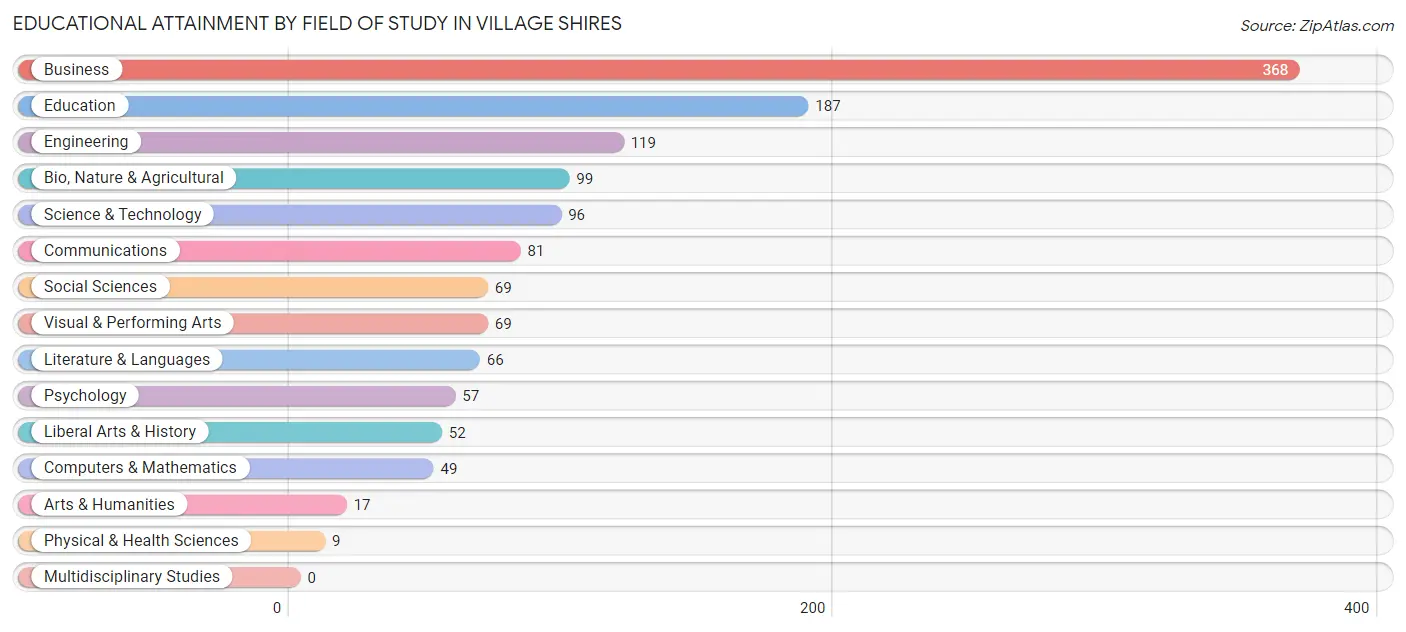
| Field of Study | # Graduates | % Graduates |
| Computers & Mathematics | 49 | 3.7% |
| Bio, Nature & Agricultural | 99 | 7.4% |
| Physical & Health Sciences | 9 | 0.7% |
| Psychology | 57 | 4.3% |
| Social Sciences | 69 | 5.2% |
| Engineering | 119 | 8.9% |
| Multidisciplinary Studies | 0 | 0.0% |
| Science & Technology | 96 | 7.2% |
| Business | 368 | 27.5% |
| Education | 187 | 14.0% |
| Literature & Languages | 66 | 4.9% |
| Liberal Arts & History | 52 | 3.9% |
| Visual & Performing Arts | 69 | 5.2% |
| Communications | 81 | 6.0% |
| Arts & Humanities | 17 | 1.3% |
| Total | 1,338 | 100.0% |
Transportation & Commute in Village Shires
Vehicle Availability by Sex in Village Shires
The most prevalent vehicle ownership categories in Village Shires are males with 2 vehicles (368, accounting for 45.9%) and females with 2 vehicles (367, making up 48.5%).
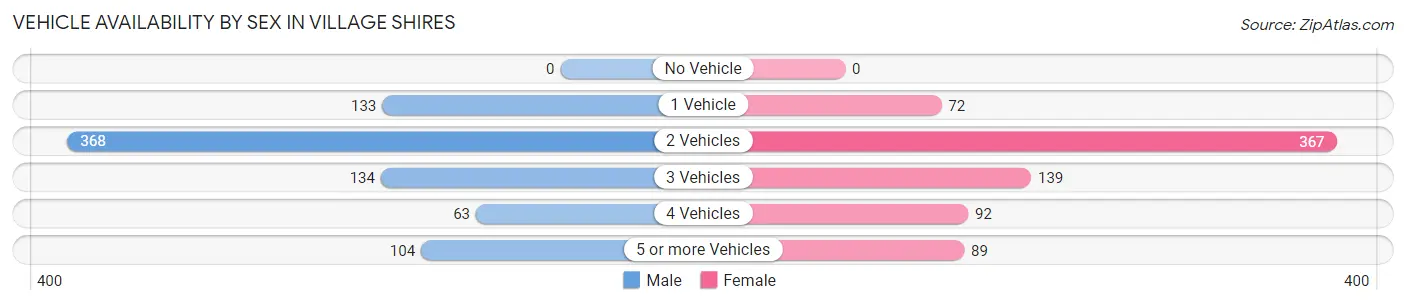
| Vehicles Available | Male | Female |
| No Vehicle | 0 (0.0%) | 0 (0.0%) |
| 1 Vehicle | 133 (16.6%) | 72 (9.5%) |
| 2 Vehicles | 368 (45.9%) | 367 (48.3%) |
| 3 Vehicles | 134 (16.7%) | 139 (18.3%) |
| 4 Vehicles | 63 (7.9%) | 92 (12.1%) |
| 5 or more Vehicles | 104 (13.0%) | 89 (11.7%) |
| Total | 802 (100.0%) | 759 (100.0%) |
Commute Time in Village Shires
The most frequently occuring commute durations in Village Shires are 60 to 89 minutes (227 commuters, 18.2%), 30 to 34 minutes (164 commuters, 13.1%), and 10 to 14 minutes (149 commuters, 11.9%).
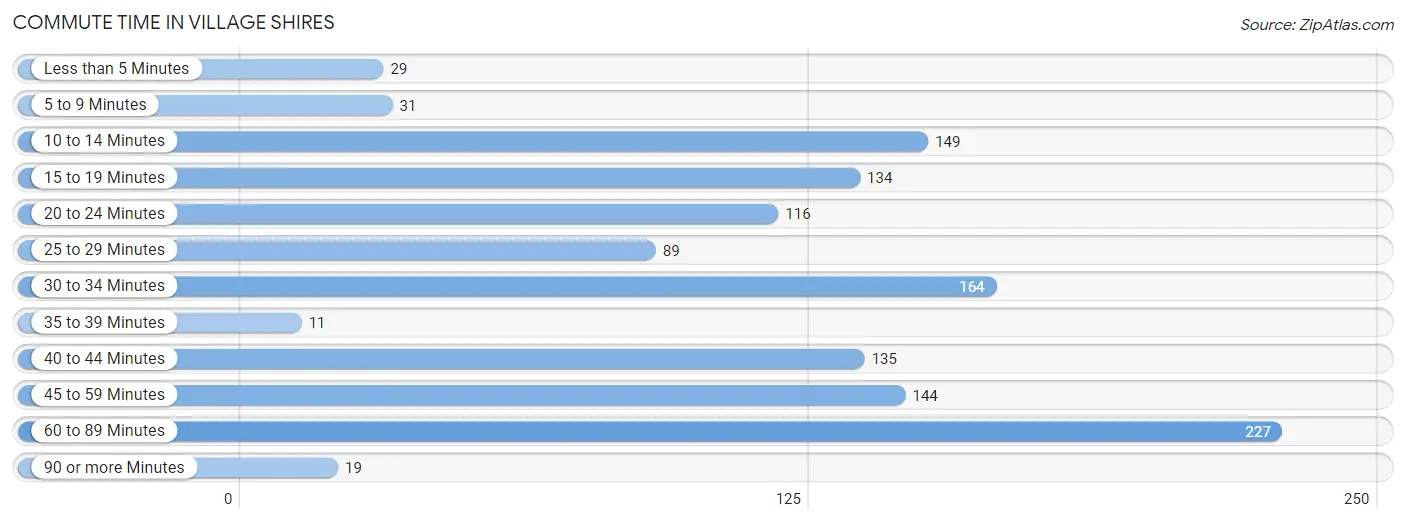
| Commute Time | # Commuters | % Commuters |
| Less than 5 Minutes | 29 | 2.3% |
| 5 to 9 Minutes | 31 | 2.5% |
| 10 to 14 Minutes | 149 | 11.9% |
| 15 to 19 Minutes | 134 | 10.7% |
| 20 to 24 Minutes | 116 | 9.3% |
| 25 to 29 Minutes | 89 | 7.1% |
| 30 to 34 Minutes | 164 | 13.1% |
| 35 to 39 Minutes | 11 | 0.9% |
| 40 to 44 Minutes | 135 | 10.8% |
| 45 to 59 Minutes | 144 | 11.5% |
| 60 to 89 Minutes | 227 | 18.2% |
| 90 or more Minutes | 19 | 1.5% |
Commute Time by Sex in Village Shires
The most common commute times in Village Shires are 60 to 89 minutes (207 commuters, 31.0%) for males and 10 to 14 minutes (120 commuters, 20.6%) for females.
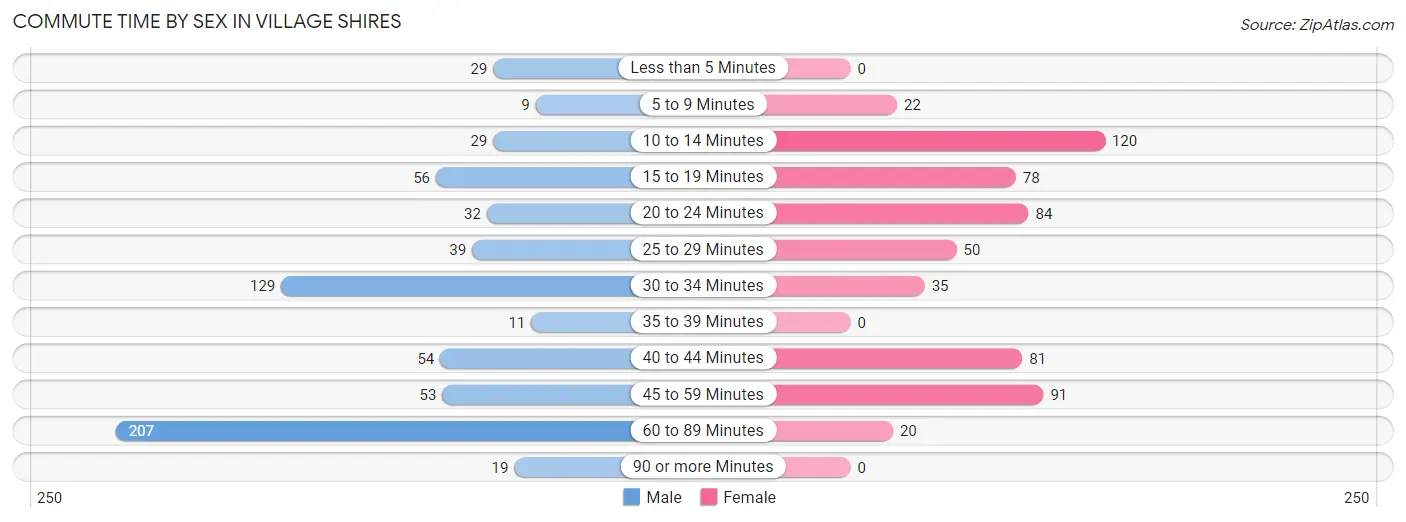
| Commute Time | Male | Female |
| Less than 5 Minutes | 29 (4.3%) | 0 (0.0%) |
| 5 to 9 Minutes | 9 (1.3%) | 22 (3.8%) |
| 10 to 14 Minutes | 29 (4.3%) | 120 (20.6%) |
| 15 to 19 Minutes | 56 (8.4%) | 78 (13.4%) |
| 20 to 24 Minutes | 32 (4.8%) | 84 (14.5%) |
| 25 to 29 Minutes | 39 (5.9%) | 50 (8.6%) |
| 30 to 34 Minutes | 129 (19.3%) | 35 (6.0%) |
| 35 to 39 Minutes | 11 (1.7%) | 0 (0.0%) |
| 40 to 44 Minutes | 54 (8.1%) | 81 (13.9%) |
| 45 to 59 Minutes | 53 (8.0%) | 91 (15.7%) |
| 60 to 89 Minutes | 207 (31.0%) | 20 (3.4%) |
| 90 or more Minutes | 19 (2.9%) | 0 (0.0%) |
Time of Departure to Work by Sex in Village Shires
The most frequent times of departure to work in Village Shires are 7:30 AM to 7:59 AM (183, 27.4%) for males and 9:00 AM to 9:59 AM (139, 23.9%) for females.
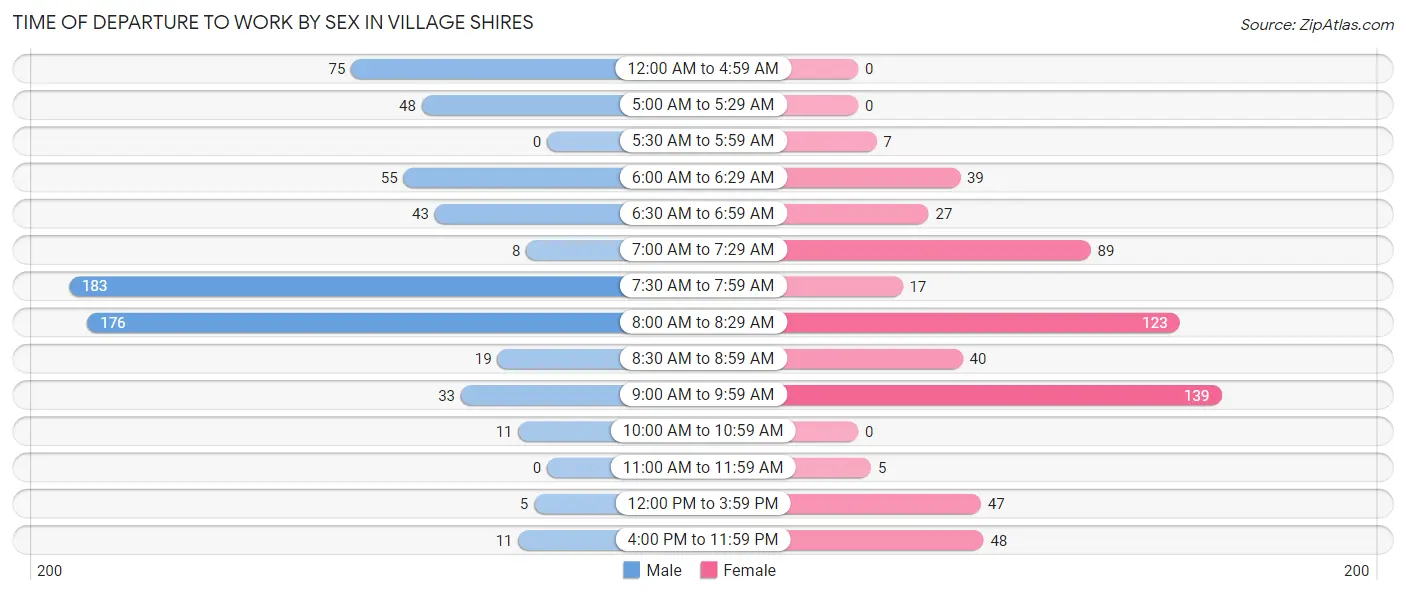
| Time of Departure | Male | Female |
| 12:00 AM to 4:59 AM | 75 (11.2%) | 0 (0.0%) |
| 5:00 AM to 5:29 AM | 48 (7.2%) | 0 (0.0%) |
| 5:30 AM to 5:59 AM | 0 (0.0%) | 7 (1.2%) |
| 6:00 AM to 6:29 AM | 55 (8.3%) | 39 (6.7%) |
| 6:30 AM to 6:59 AM | 43 (6.5%) | 27 (4.6%) |
| 7:00 AM to 7:29 AM | 8 (1.2%) | 89 (15.3%) |
| 7:30 AM to 7:59 AM | 183 (27.4%) | 17 (2.9%) |
| 8:00 AM to 8:29 AM | 176 (26.4%) | 123 (21.2%) |
| 8:30 AM to 8:59 AM | 19 (2.9%) | 40 (6.9%) |
| 9:00 AM to 9:59 AM | 33 (5.0%) | 139 (23.9%) |
| 10:00 AM to 10:59 AM | 11 (1.7%) | 0 (0.0%) |
| 11:00 AM to 11:59 AM | 0 (0.0%) | 5 (0.9%) |
| 12:00 PM to 3:59 PM | 5 (0.7%) | 47 (8.1%) |
| 4:00 PM to 11:59 PM | 11 (1.7%) | 48 (8.3%) |
| Total | 667 (100.0%) | 581 (100.0%) |
Housing Occupancy in Village Shires
Occupancy by Ownership in Village Shires
Of the total 1,361 dwellings in Village Shires, owner-occupied units account for 1,011 (74.3%), while renter-occupied units make up 350 (25.7%).
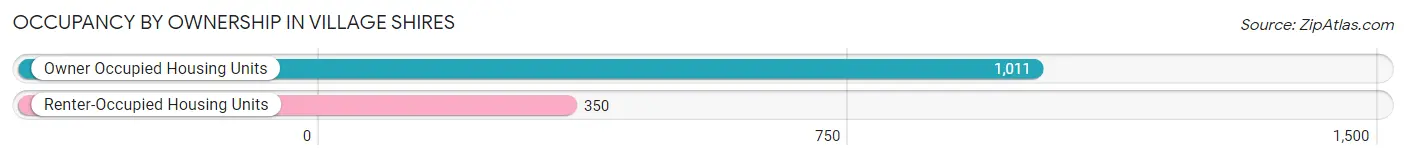
| Occupancy | # Housing Units | % Housing Units |
| Owner Occupied Housing Units | 1,011 | 74.3% |
| Renter-Occupied Housing Units | 350 | 25.7% |
| Total Occupied Housing Units | 1,361 | 100.0% |
Occupancy by Household Size in Village Shires
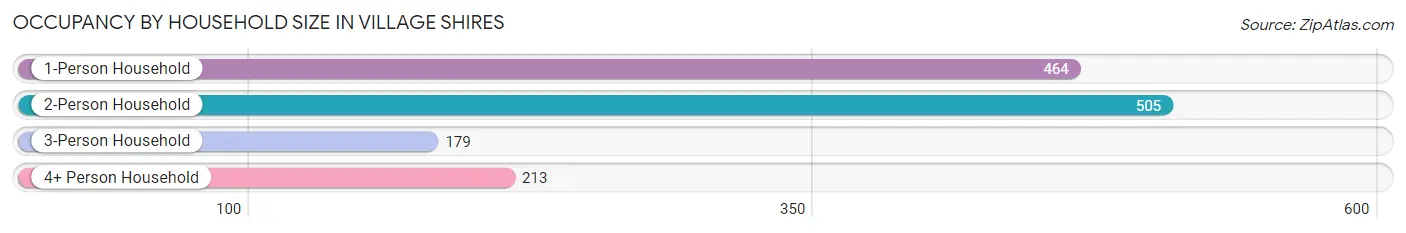
| Household Size | # Housing Units | % Housing Units |
| 1-Person Household | 464 | 34.1% |
| 2-Person Household | 505 | 37.1% |
| 3-Person Household | 179 | 13.2% |
| 4+ Person Household | 213 | 15.7% |
| Total Housing Units | 1,361 | 100.0% |
Occupancy by Ownership by Household Size in Village Shires
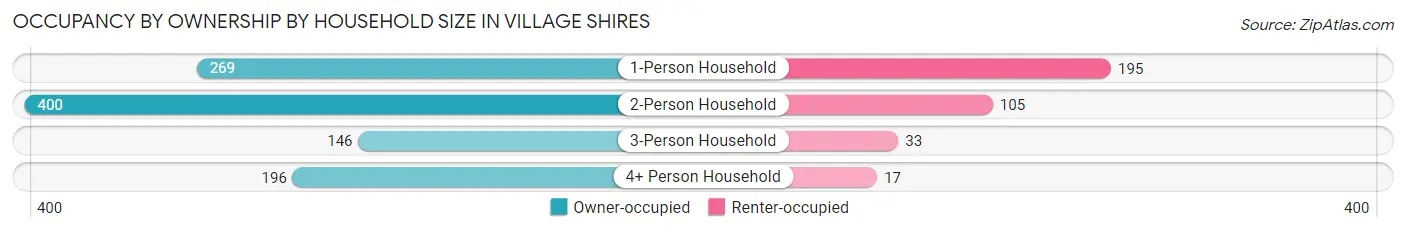
| Household Size | Owner-occupied | Renter-occupied |
| 1-Person Household | 269 (58.0%) | 195 (42.0%) |
| 2-Person Household | 400 (79.2%) | 105 (20.8%) |
| 3-Person Household | 146 (81.6%) | 33 (18.4%) |
| 4+ Person Household | 196 (92.0%) | 17 (8.0%) |
| Total Housing Units | 1,011 (74.3%) | 350 (25.7%) |
Occupancy by Educational Attainment in Village Shires
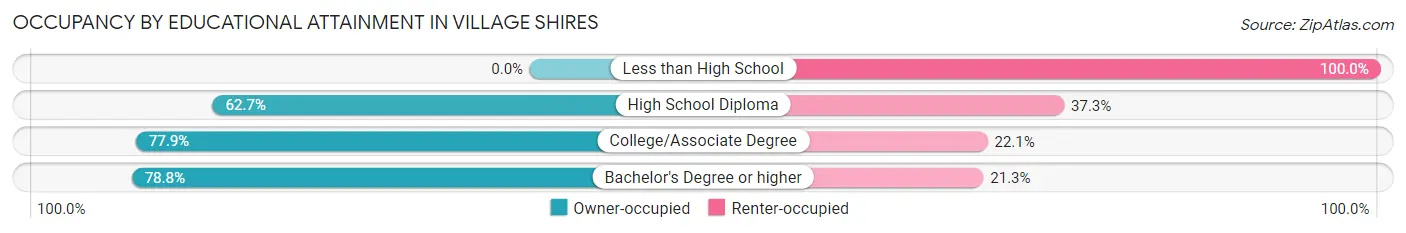
| Household Size | Owner-occupied | Renter-occupied |
| Less than High School | 0 (0.0%) | 10 (100.0%) |
| High School Diploma | 197 (62.7%) | 117 (37.3%) |
| College/Associate Degree | 247 (77.9%) | 70 (22.1%) |
| Bachelor's Degree or higher | 567 (78.7%) | 153 (21.2%) |
Occupancy by Age of Householder in Village Shires
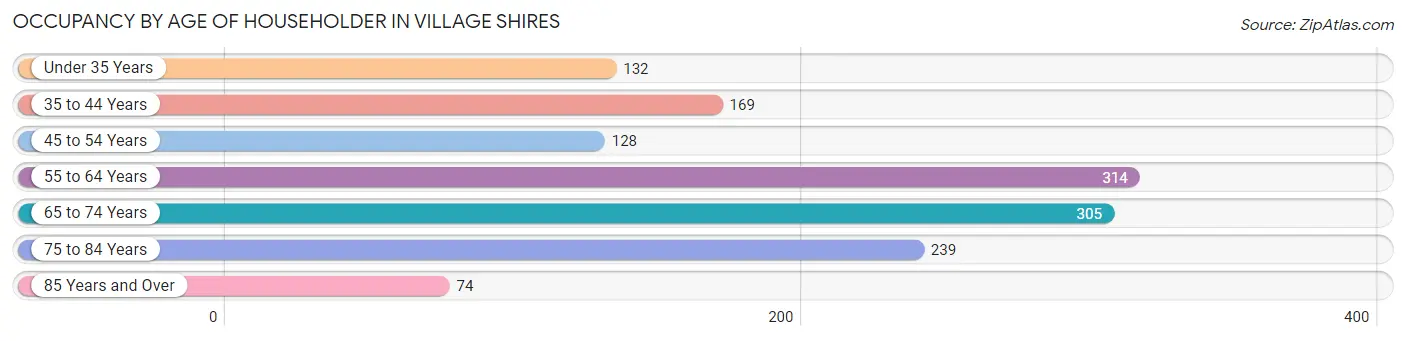
| Age Bracket | # Households | % Households |
| Under 35 Years | 132 | 9.7% |
| 35 to 44 Years | 169 | 12.4% |
| 45 to 54 Years | 128 | 9.4% |
| 55 to 64 Years | 314 | 23.1% |
| 65 to 74 Years | 305 | 22.4% |
| 75 to 84 Years | 239 | 17.6% |
| 85 Years and Over | 74 | 5.4% |
| Total | 1,361 | 100.0% |
Housing Finances in Village Shires
Median Income by Occupancy in Village Shires
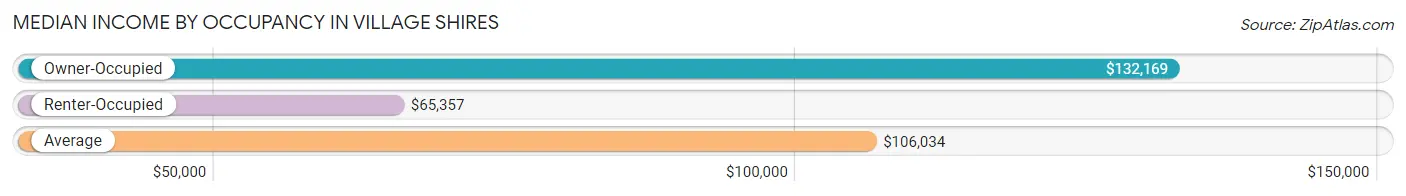
| Occupancy Type | # Households | Median Income |
| Owner-Occupied | 1,011 (74.3%) | $132,169 |
| Renter-Occupied | 350 (25.7%) | $65,357 |
| Average | 1,361 (100.0%) | $106,034 |
Occupancy by Householder Income Bracket in Village Shires
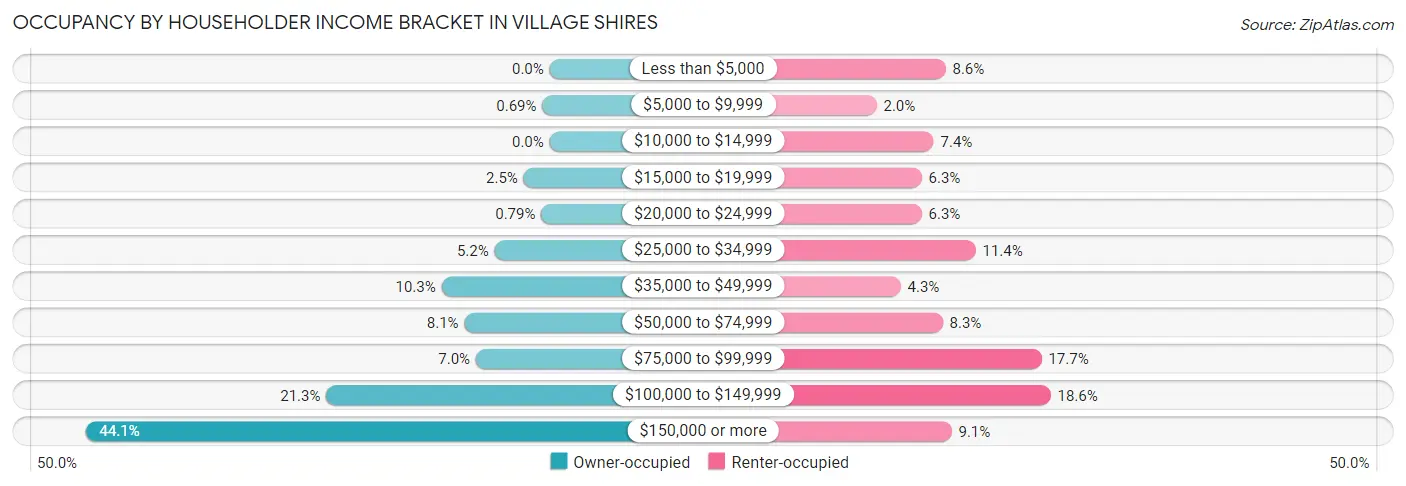
| Income Bracket | Owner-occupied | Renter-occupied |
| Less than $5,000 | 0 (0.0%) | 30 (8.6%) |
| $5,000 to $9,999 | 7 (0.7%) | 7 (2.0%) |
| $10,000 to $14,999 | 0 (0.0%) | 26 (7.4%) |
| $15,000 to $19,999 | 25 (2.5%) | 22 (6.3%) |
| $20,000 to $24,999 | 8 (0.8%) | 22 (6.3%) |
| $25,000 to $34,999 | 53 (5.2%) | 40 (11.4%) |
| $35,000 to $49,999 | 104 (10.3%) | 15 (4.3%) |
| $50,000 to $74,999 | 82 (8.1%) | 29 (8.3%) |
| $75,000 to $99,999 | 71 (7.0%) | 62 (17.7%) |
| $100,000 to $149,999 | 215 (21.3%) | 65 (18.6%) |
| $150,000 or more | 446 (44.1%) | 32 (9.1%) |
| Total | 1,011 (100.0%) | 350 (100.0%) |
Monthly Housing Cost Tiers in Village Shires
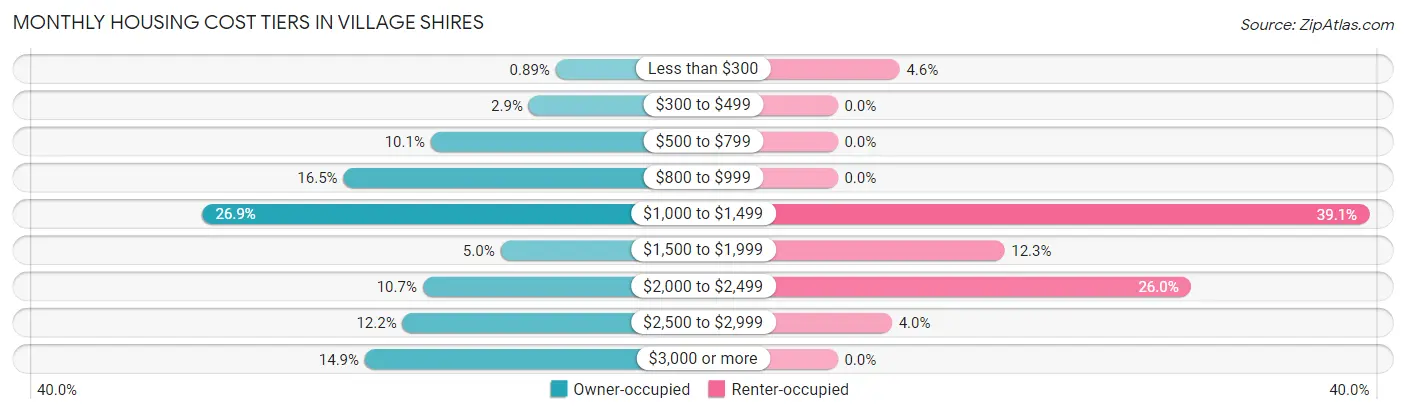
| Monthly Cost | Owner-occupied | Renter-occupied |
| Less than $300 | 9 (0.9%) | 16 (4.6%) |
| $300 to $499 | 29 (2.9%) | 0 (0.0%) |
| $500 to $799 | 102 (10.1%) | 0 (0.0%) |
| $800 to $999 | 167 (16.5%) | 0 (0.0%) |
| $1,000 to $1,499 | 272 (26.9%) | 137 (39.1%) |
| $1,500 to $1,999 | 50 (5.0%) | 43 (12.3%) |
| $2,000 to $2,499 | 108 (10.7%) | 91 (26.0%) |
| $2,500 to $2,999 | 123 (12.2%) | 14 (4.0%) |
| $3,000 or more | 151 (14.9%) | 0 (0.0%) |
| Total | 1,011 (100.0%) | 350 (100.0%) |
Physical Housing Characteristics in Village Shires
Housing Structures in Village Shires
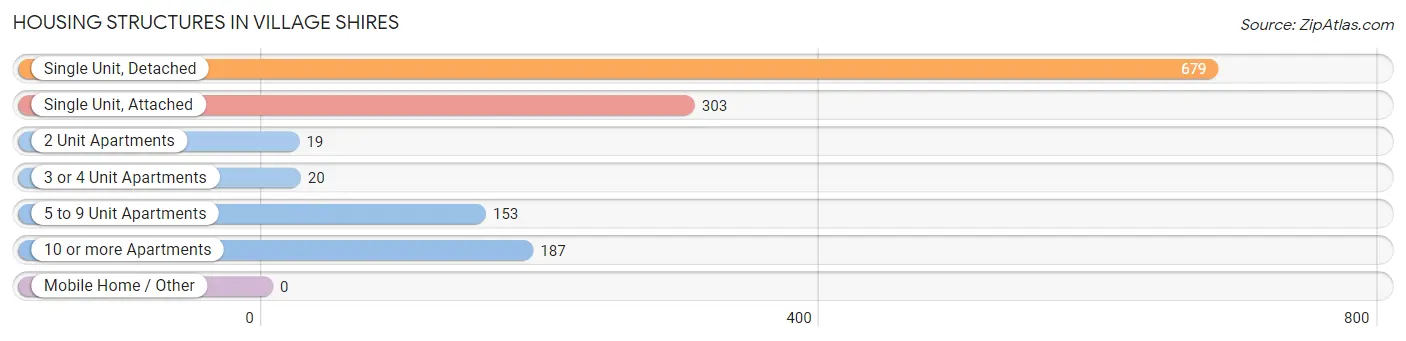
| Structure Type | # Housing Units | % Housing Units |
| Single Unit, Detached | 679 | 49.9% |
| Single Unit, Attached | 303 | 22.3% |
| 2 Unit Apartments | 19 | 1.4% |
| 3 or 4 Unit Apartments | 20 | 1.5% |
| 5 to 9 Unit Apartments | 153 | 11.2% |
| 10 or more Apartments | 187 | 13.7% |
| Mobile Home / Other | 0 | 0.0% |
| Total | 1,361 | 100.0% |
Housing Structures by Occupancy in Village Shires
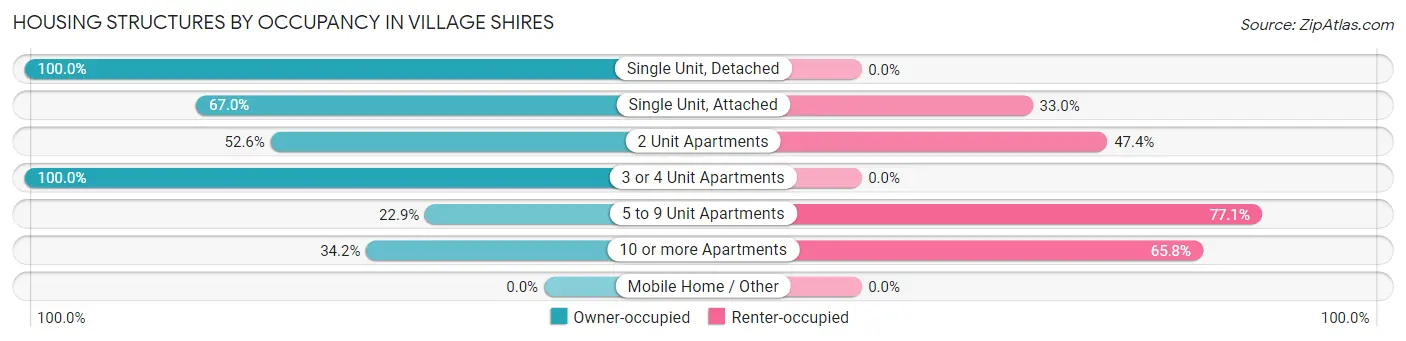
| Structure Type | Owner-occupied | Renter-occupied |
| Single Unit, Detached | 679 (100.0%) | 0 (0.0%) |
| Single Unit, Attached | 203 (67.0%) | 100 (33.0%) |
| 2 Unit Apartments | 10 (52.6%) | 9 (47.4%) |
| 3 or 4 Unit Apartments | 20 (100.0%) | 0 (0.0%) |
| 5 to 9 Unit Apartments | 35 (22.9%) | 118 (77.1%) |
| 10 or more Apartments | 64 (34.2%) | 123 (65.8%) |
| Mobile Home / Other | 0 (0.0%) | 0 (0.0%) |
| Total | 1,011 (74.3%) | 350 (25.7%) |
Housing Structures by Number of Rooms in Village Shires
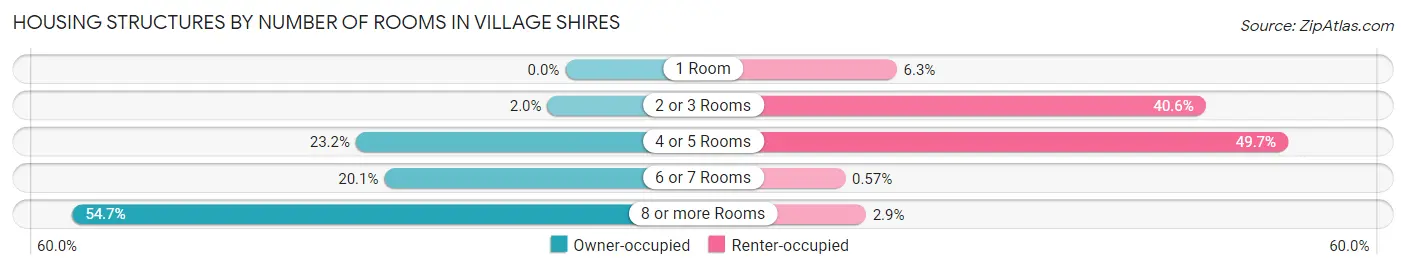
| Number of Rooms | Owner-occupied | Renter-occupied |
| 1 Room | 0 (0.0%) | 22 (6.3%) |
| 2 or 3 Rooms | 20 (2.0%) | 142 (40.6%) |
| 4 or 5 Rooms | 235 (23.2%) | 174 (49.7%) |
| 6 or 7 Rooms | 203 (20.1%) | 2 (0.6%) |
| 8 or more Rooms | 553 (54.7%) | 10 (2.9%) |
| Total | 1,011 (100.0%) | 350 (100.0%) |
Housing Structure by Heating Type in Village Shires
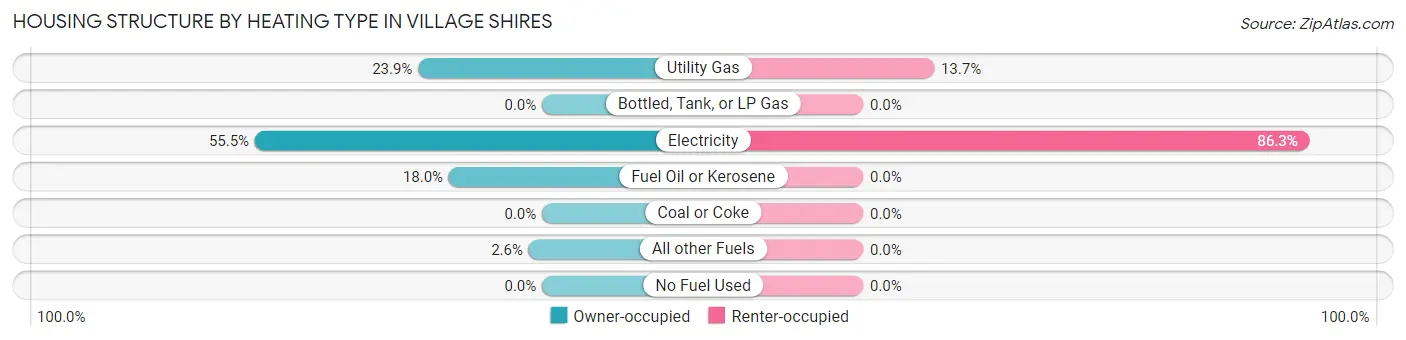
| Heating Type | Owner-occupied | Renter-occupied |
| Utility Gas | 242 (23.9%) | 48 (13.7%) |
| Bottled, Tank, or LP Gas | 0 (0.0%) | 0 (0.0%) |
| Electricity | 561 (55.5%) | 302 (86.3%) |
| Fuel Oil or Kerosene | 182 (18.0%) | 0 (0.0%) |
| Coal or Coke | 0 (0.0%) | 0 (0.0%) |
| All other Fuels | 26 (2.6%) | 0 (0.0%) |
| No Fuel Used | 0 (0.0%) | 0 (0.0%) |
| Total | 1,011 (100.0%) | 350 (100.0%) |
Household Vehicle Usage in Village Shires
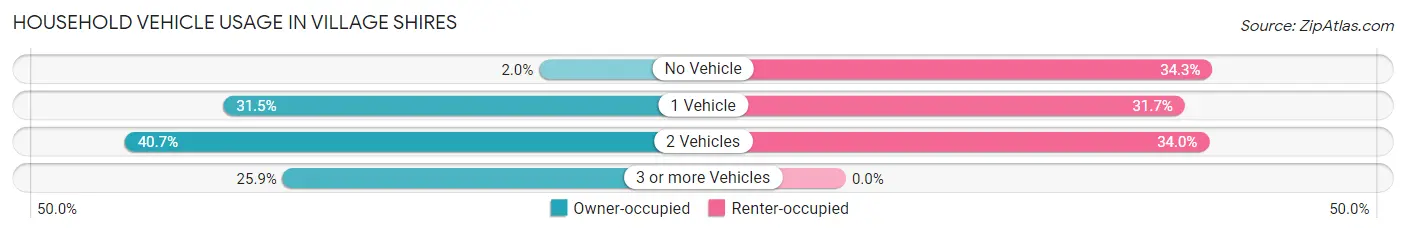
| Vehicles per Household | Owner-occupied | Renter-occupied |
| No Vehicle | 20 (2.0%) | 120 (34.3%) |
| 1 Vehicle | 318 (31.5%) | 111 (31.7%) |
| 2 Vehicles | 411 (40.6%) | 119 (34.0%) |
| 3 or more Vehicles | 262 (25.9%) | 0 (0.0%) |
| Total | 1,011 (100.0%) | 350 (100.0%) |
Real Estate & Mortgages in Village Shires
Real Estate and Mortgage Overview in Village Shires
| Characteristic | Without Mortgage | With Mortgage |
| Housing Units | 474 | 537 |
| Median Property Value | $371,300 | $508,000 |
| Median Household Income | $121,053 | $237 |
| Monthly Housing Costs | $951 | $151 |
| Real Estate Taxes | $5,620 | $0 |
Property Value by Mortgage Status in Village Shires
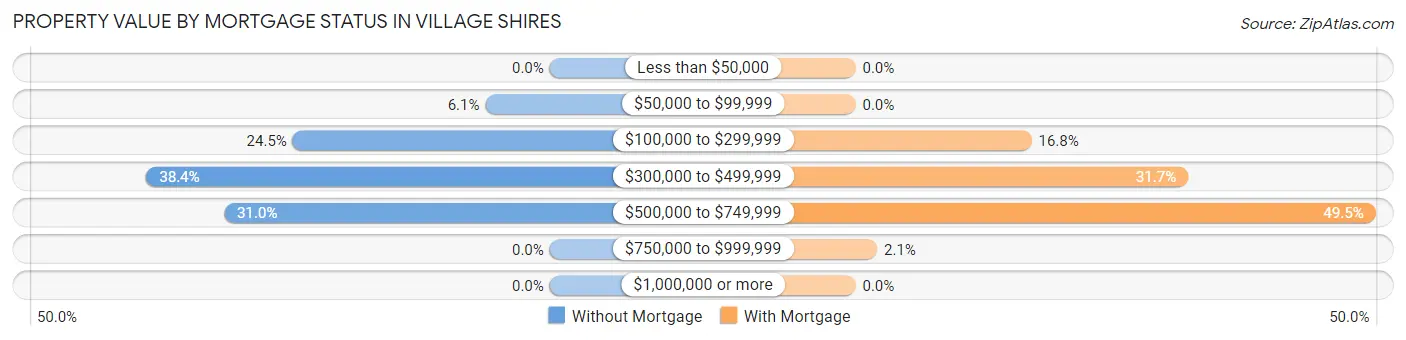
| Property Value | Without Mortgage | With Mortgage |
| Less than $50,000 | 0 (0.0%) | 0 (0.0%) |
| $50,000 to $99,999 | 29 (6.1%) | 0 (0.0%) |
| $100,000 to $299,999 | 116 (24.5%) | 90 (16.8%) |
| $300,000 to $499,999 | 182 (38.4%) | 170 (31.7%) |
| $500,000 to $749,999 | 147 (31.0%) | 266 (49.5%) |
| $750,000 to $999,999 | 0 (0.0%) | 11 (2.1%) |
| $1,000,000 or more | 0 (0.0%) | 0 (0.0%) |
| Total | 474 (100.0%) | 537 (100.0%) |
Household Income by Mortgage Status in Village Shires
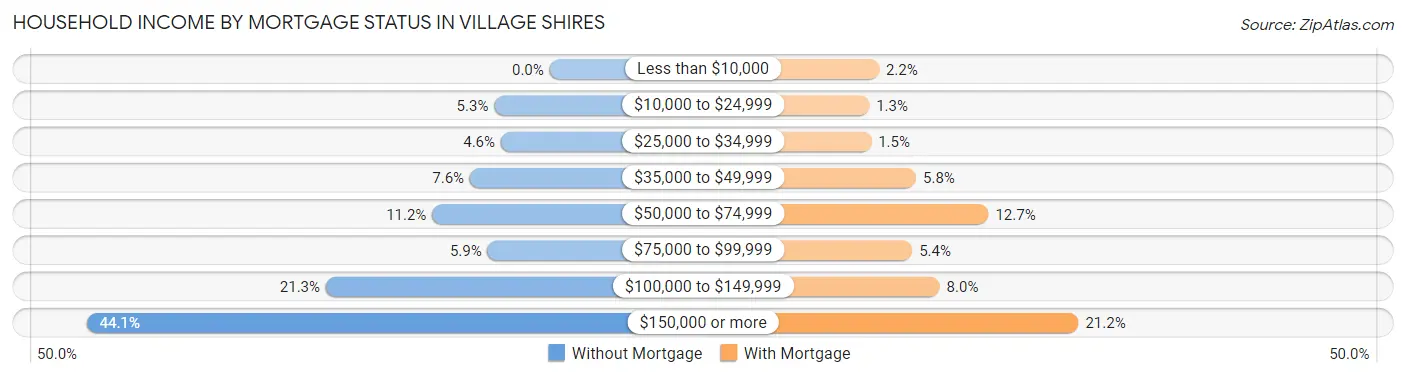
| Household Income | Without Mortgage | With Mortgage |
| Less than $10,000 | 0 (0.0%) | 12 (2.2%) |
| $10,000 to $24,999 | 25 (5.3%) | 7 (1.3%) |
| $25,000 to $34,999 | 22 (4.6%) | 8 (1.5%) |
| $35,000 to $49,999 | 36 (7.6%) | 31 (5.8%) |
| $50,000 to $74,999 | 53 (11.2%) | 68 (12.7%) |
| $75,000 to $99,999 | 28 (5.9%) | 29 (5.4%) |
| $100,000 to $149,999 | 101 (21.3%) | 43 (8.0%) |
| $150,000 or more | 209 (44.1%) | 114 (21.2%) |
| Total | 474 (100.0%) | 537 (100.0%) |
Property Value to Household Income Ratio in Village Shires
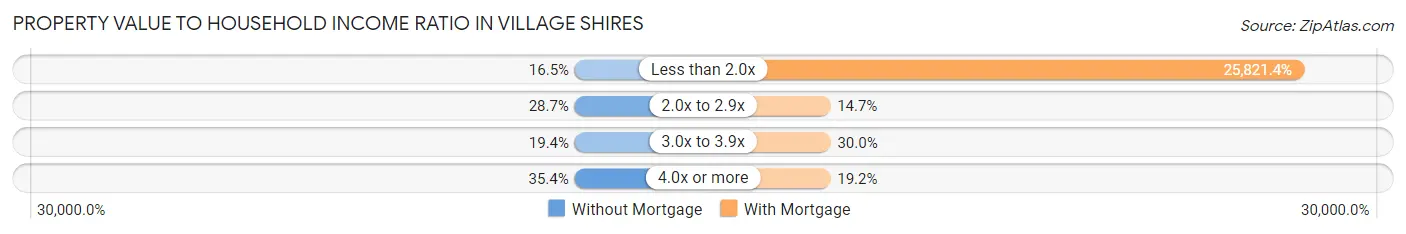
| Value-to-Income Ratio | Without Mortgage | With Mortgage |
| Less than 2.0x | 78 (16.5%) | 138,661 (25,821.4%) |
| 2.0x to 2.9x | 136 (28.7%) | 79 (14.7%) |
| 3.0x to 3.9x | 92 (19.4%) | 161 (30.0%) |
| 4.0x or more | 168 (35.4%) | 103 (19.2%) |
| Total | 474 (100.0%) | 537 (100.0%) |
Real Estate Taxes by Mortgage Status in Village Shires
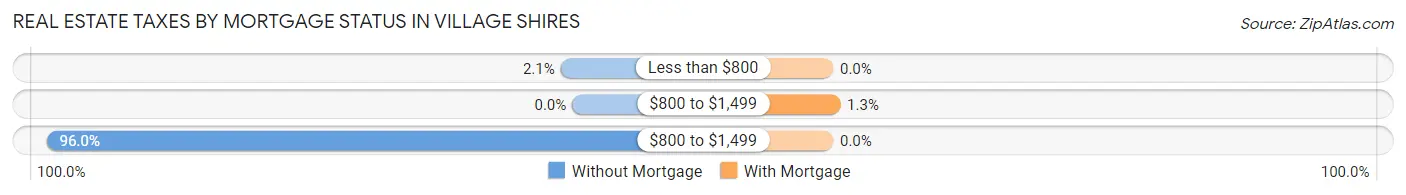
| Property Taxes | Without Mortgage | With Mortgage |
| Less than $800 | 10 (2.1%) | 0 (0.0%) |
| $800 to $1,499 | 0 (0.0%) | 7 (1.3%) |
| $800 to $1,499 | 455 (96.0%) | 0 (0.0%) |
| Total | 474 (100.0%) | 537 (100.0%) |
Health & Disability in Village Shires
Health Insurance Coverage by Age in Village Shires
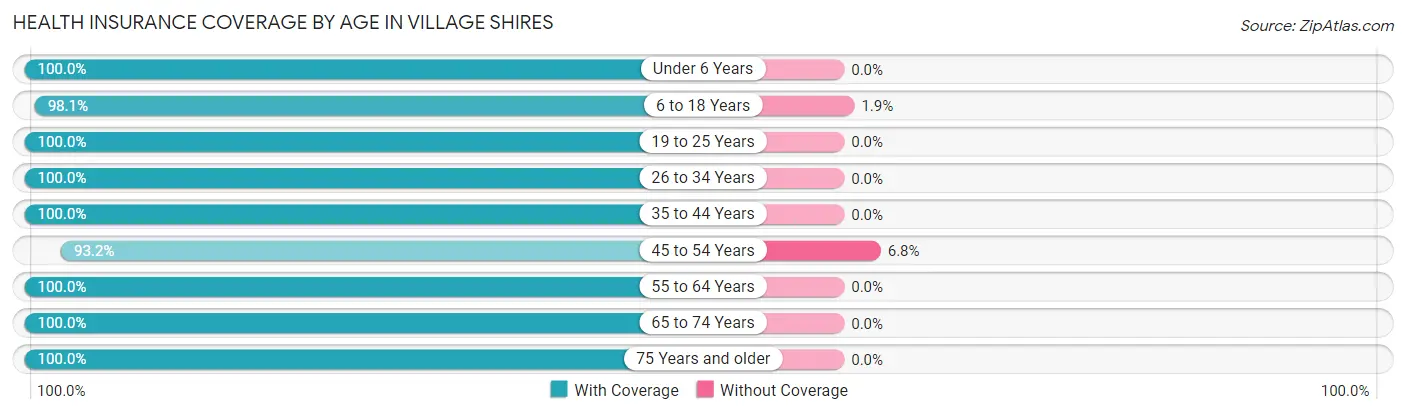
| Age Bracket | With Coverage | Without Coverage |
| Under 6 Years | 89 (100.0%) | 0 (0.0%) |
| 6 to 18 Years | 465 (98.1%) | 9 (1.9%) |
| 19 to 25 Years | 178 (100.0%) | 0 (0.0%) |
| 26 to 34 Years | 346 (100.0%) | 0 (0.0%) |
| 35 to 44 Years | 297 (100.0%) | 0 (0.0%) |
| 45 to 54 Years | 260 (93.2%) | 19 (6.8%) |
| 55 to 64 Years | 515 (100.0%) | 0 (0.0%) |
| 65 to 74 Years | 482 (100.0%) | 0 (0.0%) |
| 75 Years and older | 441 (100.0%) | 0 (0.0%) |
| Total | 3,073 (99.1%) | 28 (0.9%) |
Health Insurance Coverage by Citizenship Status in Village Shires
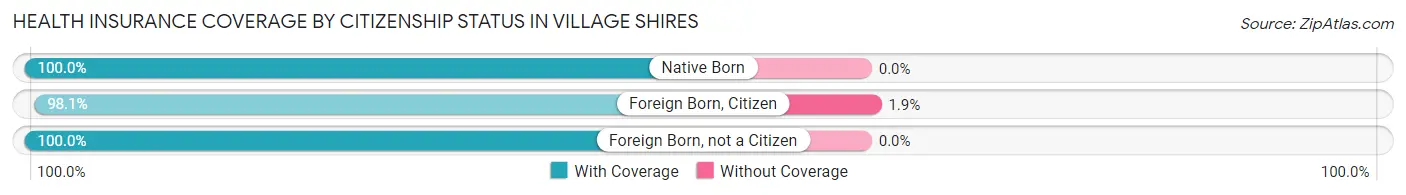
| Citizenship Status | With Coverage | Without Coverage |
| Native Born | 89 (100.0%) | 0 (0.0%) |
| Foreign Born, Citizen | 465 (98.1%) | 9 (1.9%) |
| Foreign Born, not a Citizen | 178 (100.0%) | 0 (0.0%) |
Health Insurance Coverage by Household Income in Village Shires
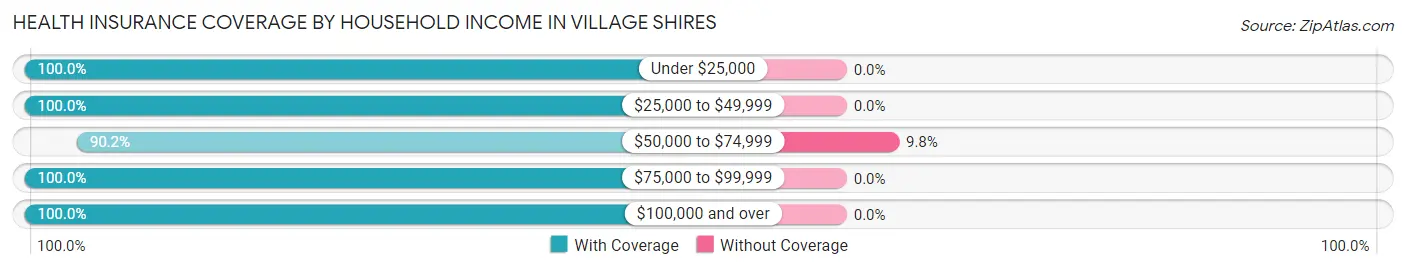
| Household Income | With Coverage | Without Coverage |
| Under $25,000 | 181 (100.0%) | 0 (0.0%) |
| $25,000 to $49,999 | 300 (100.0%) | 0 (0.0%) |
| $50,000 to $74,999 | 258 (90.2%) | 28 (9.8%) |
| $75,000 to $99,999 | 236 (100.0%) | 0 (0.0%) |
| $100,000 and over | 2,093 (100.0%) | 0 (0.0%) |
Public vs Private Health Insurance Coverage by Age in Village Shires
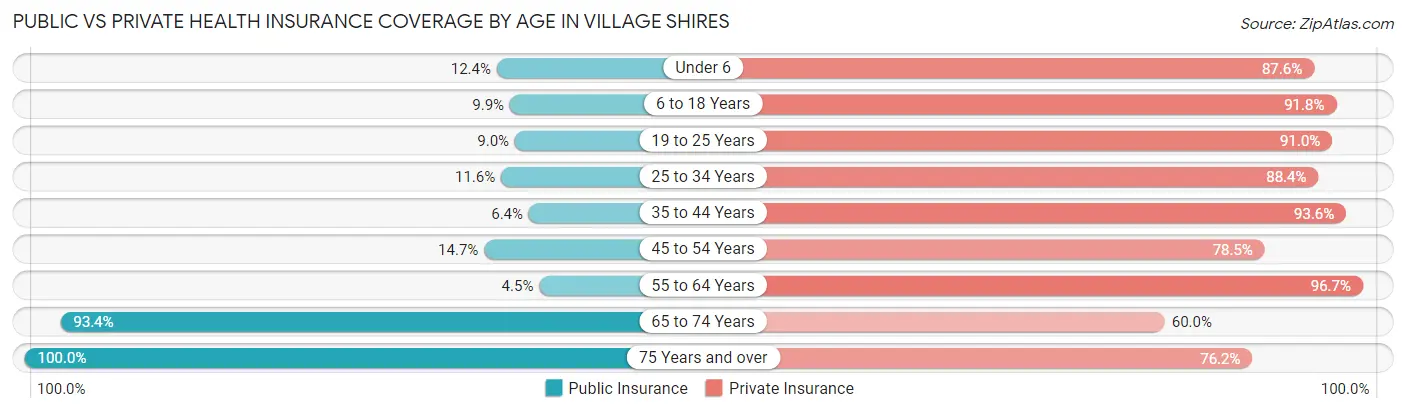
| Age Bracket | Public Insurance | Private Insurance |
| Under 6 | 11 (12.4%) | 78 (87.6%) |
| 6 to 18 Years | 47 (9.9%) | 435 (91.8%) |
| 19 to 25 Years | 16 (9.0%) | 162 (91.0%) |
| 25 to 34 Years | 40 (11.6%) | 306 (88.4%) |
| 35 to 44 Years | 19 (6.4%) | 278 (93.6%) |
| 45 to 54 Years | 41 (14.7%) | 219 (78.5%) |
| 55 to 64 Years | 23 (4.5%) | 498 (96.7%) |
| 65 to 74 Years | 450 (93.4%) | 289 (60.0%) |
| 75 Years and over | 441 (100.0%) | 336 (76.2%) |
| Total | 1,088 (35.1%) | 2,601 (83.9%) |
Disability Status by Sex by Age in Village Shires
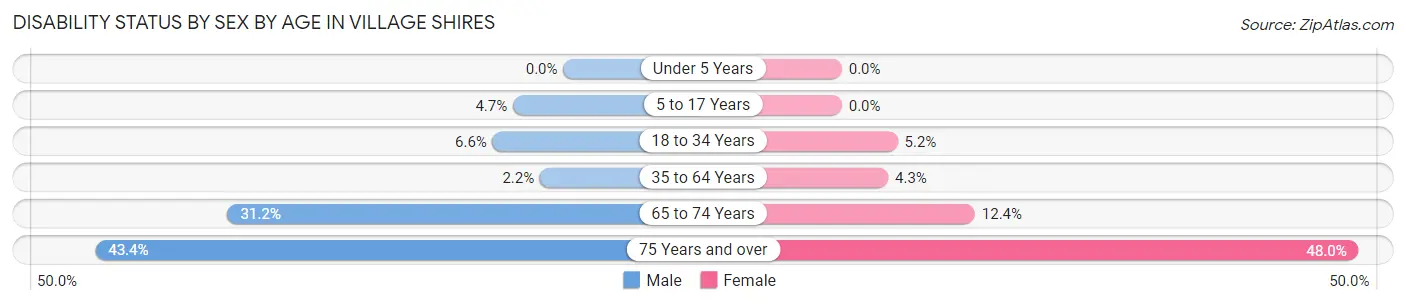
| Age Bracket | Male | Female |
| Under 5 Years | 0 (0.0%) | 0 (0.0%) |
| 5 to 17 Years | 10 (4.7%) | 0 (0.0%) |
| 18 to 34 Years | 17 (6.6%) | 17 (5.2%) |
| 35 to 64 Years | 13 (2.2%) | 21 (4.3%) |
| 65 to 74 Years | 72 (31.2%) | 31 (12.3%) |
| 75 Years and over | 53 (43.4%) | 153 (48.0%) |
Disability Class by Sex by Age in Village Shires
Disability Class: Hearing Difficulty

| Age Bracket | Male | Female |
| Under 5 Years | 0 (0.0%) | 0 (0.0%) |
| 5 to 17 Years | 0 (0.0%) | 0 (0.0%) |
| 18 to 34 Years | 0 (0.0%) | 17 (5.2%) |
| 35 to 64 Years | 0 (0.0%) | 12 (2.5%) |
| 65 to 74 Years | 43 (18.6%) | 9 (3.6%) |
| 75 Years and over | 53 (43.4%) | 68 (21.3%) |
Disability Class: Vision Difficulty
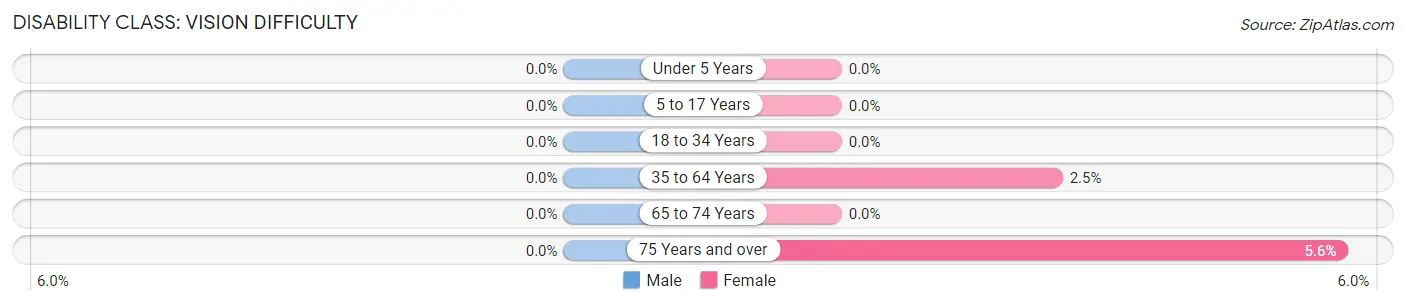
| Age Bracket | Male | Female |
| Under 5 Years | 0 (0.0%) | 0 (0.0%) |
| 5 to 17 Years | 0 (0.0%) | 0 (0.0%) |
| 18 to 34 Years | 0 (0.0%) | 0 (0.0%) |
| 35 to 64 Years | 0 (0.0%) | 12 (2.5%) |
| 65 to 74 Years | 0 (0.0%) | 0 (0.0%) |
| 75 Years and over | 0 (0.0%) | 18 (5.6%) |
Disability Class: Cognitive Difficulty
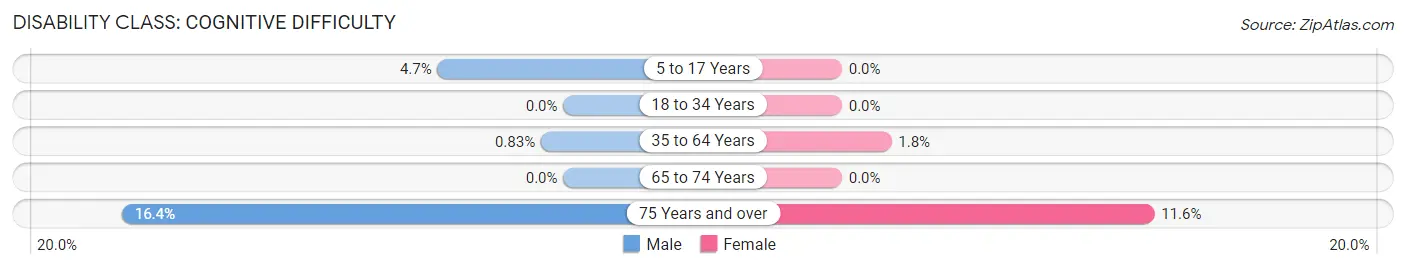
| Age Bracket | Male | Female |
| 5 to 17 Years | 10 (4.7%) | 0 (0.0%) |
| 18 to 34 Years | 0 (0.0%) | 0 (0.0%) |
| 35 to 64 Years | 5 (0.8%) | 9 (1.8%) |
| 65 to 74 Years | 0 (0.0%) | 0 (0.0%) |
| 75 Years and over | 20 (16.4%) | 37 (11.6%) |
Disability Class: Ambulatory Difficulty
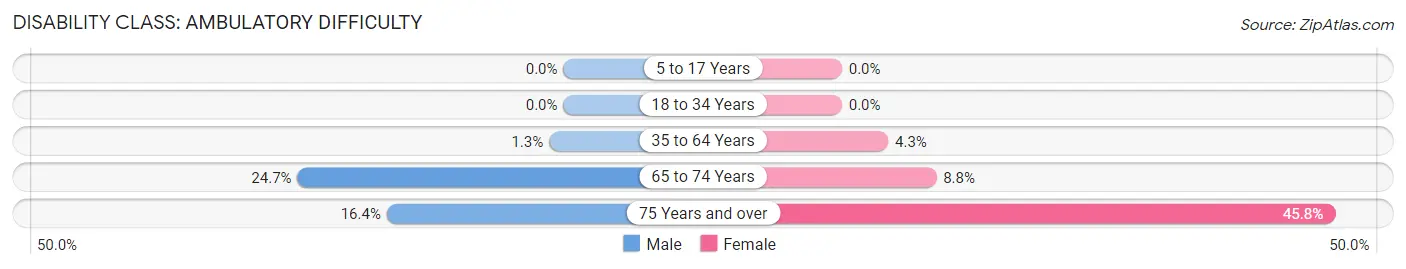
| Age Bracket | Male | Female |
| 5 to 17 Years | 0 (0.0%) | 0 (0.0%) |
| 18 to 34 Years | 0 (0.0%) | 0 (0.0%) |
| 35 to 64 Years | 8 (1.3%) | 21 (4.3%) |
| 65 to 74 Years | 57 (24.7%) | 22 (8.8%) |
| 75 Years and over | 20 (16.4%) | 146 (45.8%) |
Disability Class: Self-Care Difficulty
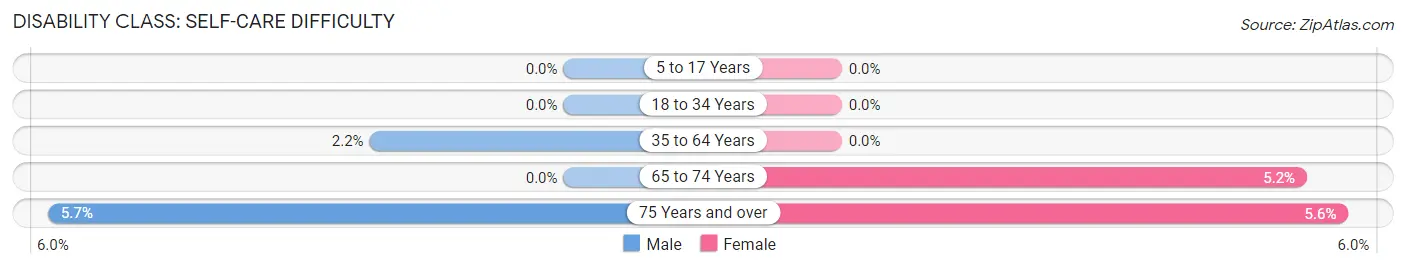
| Age Bracket | Male | Female |
| 5 to 17 Years | 0 (0.0%) | 0 (0.0%) |
| 18 to 34 Years | 0 (0.0%) | 0 (0.0%) |
| 35 to 64 Years | 13 (2.2%) | 0 (0.0%) |
| 65 to 74 Years | 0 (0.0%) | 13 (5.2%) |
| 75 Years and over | 7 (5.7%) | 18 (5.6%) |
Technology Access in Village Shires
Computing Device Access in Village Shires
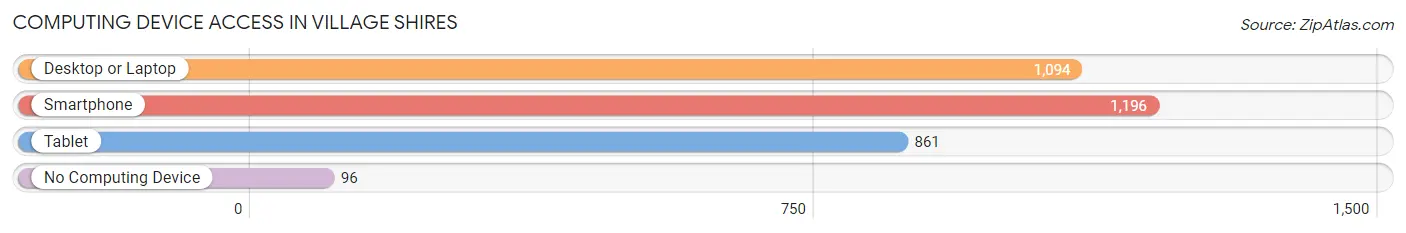
| Device Type | # Households | % Households |
| Desktop or Laptop | 1,094 | 80.4% |
| Smartphone | 1,196 | 87.9% |
| Tablet | 861 | 63.3% |
| No Computing Device | 96 | 7.0% |
| Total | 1,361 | 100.0% |
Internet Access in Village Shires
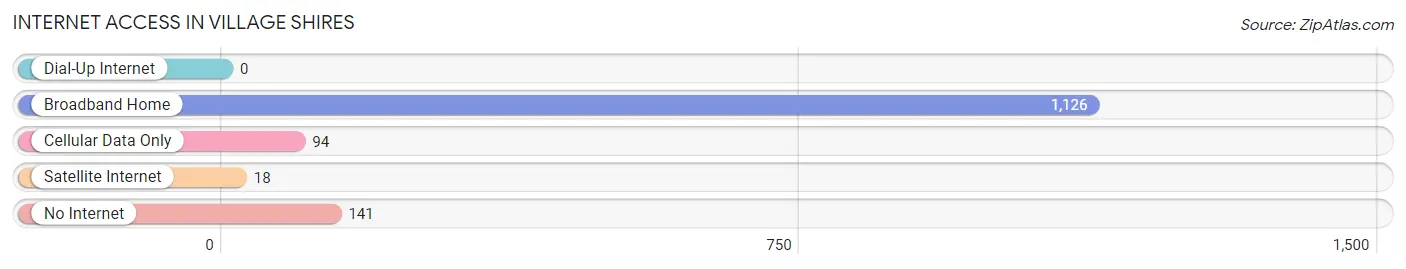
| Internet Type | # Households | % Households |
| Dial-Up Internet | 0 | 0.0% |
| Broadband Home | 1,126 | 82.7% |
| Cellular Data Only | 94 | 6.9% |
| Satellite Internet | 18 | 1.3% |
| No Internet | 141 | 10.4% |
| Total | 1,361 | 100.0% |
Village Shires Summary
Village Shires is a small, unincorporated community located in Bucks County, Pennsylvania. It is situated in the heart of Bucks County, just north of Philadelphia. The community is home to approximately 1,000 people and is known for its rural charm and small-town atmosphere.
Geography
Village Shires is located in the heart of Bucks County, Pennsylvania. It is situated in the northern part of the county, just north of Philadelphia. The community is bordered by the townships of Warrington, Doylestown, and New Britain. The area is characterized by rolling hills, wooded areas, and farmland. The community is located in the Delaware Valley, which is known for its rich agricultural heritage.
The climate in Village Shires is typical of the mid-Atlantic region. Summers are hot and humid, while winters are cold and snowy. The average annual temperature is around 50 degrees Fahrenheit. The area receives an average of 40 inches of precipitation per year.
Economy
The economy of Village Shires is largely based on agriculture. The area is home to several farms, which produce a variety of crops, including corn, soybeans, and hay. The community is also home to several small businesses, including a grocery store, a hardware store, and a few restaurants.
The area is also home to several large employers, including the Bucks County government, the Doylestown Hospital, and the Bucks County Community College. The community is also home to several small businesses, including a few retail stores, a few restaurants, and a few professional services.
Demographics
As of the 2010 census, the population of Village Shires was 1,000. The population is predominantly white, with a small percentage of African Americans and Hispanics. The median age of the population is 44. The median household income is $60,000, and the median home value is $250,000.
The area is home to several churches, including the Village Shires United Methodist Church, the Village Shires Presbyterian Church, and the Village Shires Baptist Church. The community is also home to several schools, including the Village Shires Elementary School, the Village Shires Middle School, and the Village Shires High School.
Conclusion
Village Shires is a small, unincorporated community located in Bucks County, Pennsylvania. It is situated in the heart of Bucks County, just north of Philadelphia. The community is home to approximately 1,000 people and is known for its rural charm and small-town atmosphere. The economy of Village Shires is largely based on agriculture, and the area is home to several large employers. The population is predominantly white, with a small percentage of African Americans and Hispanics. The area is home to several churches and schools, and the median household income is $60,000.
Common Questions
What is the Total Population of Village Shires?
Total Population of Village Shires is 3,201.
What is the Total Male Population of Village Shires?
Total Male Population of Village Shires is 1,537.
What is the Total Female Population of Village Shires?
Total Female Population of Village Shires is 1,664.
What is the Ratio of Males per 100 Females in Village Shires?
There are 92.37 Males per 100 Females in Village Shires.
What is the Ratio of Females per 100 Males in Village Shires?
There are 108.26 Females per 100 Males in Village Shires.
What is the Median Population Age in Village Shires?
Median Population Age in Village Shires is 53.4 Years.
What is the Average Family Size in Village Shires
Average Family Size in Village Shires is 3.0 People.
What is the Average Household Size in Village Shires
Average Household Size in Village Shires is 2.3 People.
What is Per Capita Income in Village Shires?
Per Capita income in Village Shires is $54,664.
What is the Median Family Income in Village Shires?
Median Family Income in Village Shires is $149,821.
What is the Median Household income in Village Shires?
Median Household Income in Village Shires is $106,034.
What is Income or Wage Gap in Village Shires?
Income or Wage Gap in Village Shires is 26.3%.
Women in Village Shires earn 73.7 cents for every dollar earned by a man.
What is Inequality or Gini Index in Village Shires?
Inequality or Gini Index in Village Shires is 0.42.
How Large is the Labor Force in Village Shires?
There are 1,603 People in the Labor Forcein in Village Shires.
What is the Percentage of People in the Labor Force in Village Shires?
58.0% of People are in the Labor Force in Village Shires.
What is the Unemployment Rate in Village Shires?
Unemployment Rate in Village Shires is 1.6%.