Seneca, OR
Seneca Map
Seneca Overview
167
TOTAL POPULATION
73
MALE POPULATION
94
FEMALE POPULATION
77.66
MALES / 100 FEMALES
128.77
FEMALES / 100 MALES
54.6
MEDIAN AGE
2.6
AVG FAMILY SIZE
1.8
AVG HOUSEHOLD SIZE
$32,130
PER CAPITA INCOME
$82,596
AVG FAMILY INCOME
$66,250
AVG HOUSEHOLD INCOME
5.2%
WAGE / INCOME GAP [ % ]
94.8¢/ $1
WAGE / INCOME GAP [ $ ]
0.37
INEQUALITY / GINI INDEX
87
LABOR FORCE [ PEOPLE ]
58.8%
PERCENT IN LABOR FORCE
Seneca Zip Codes
Seneca Area Codes
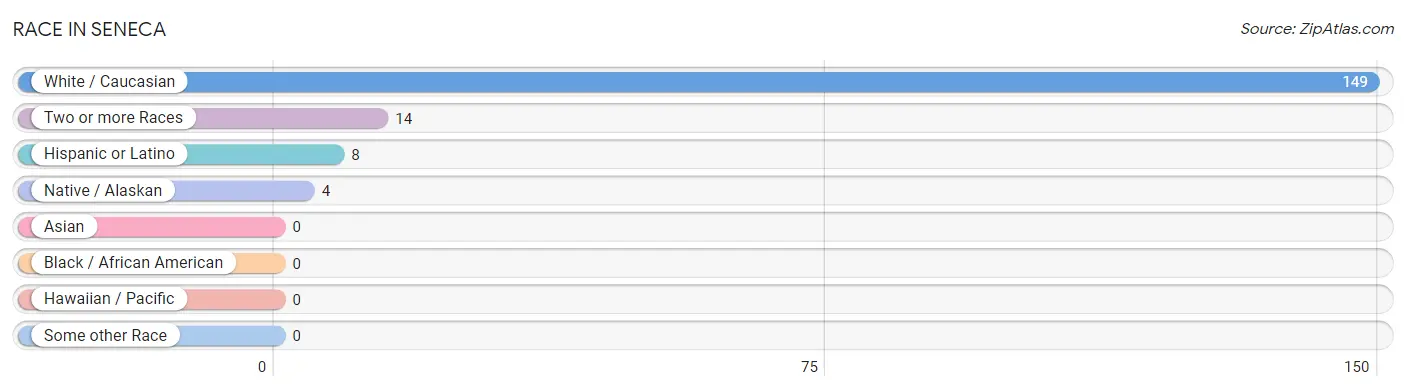
Race in Seneca
The most populous races in Seneca are White / Caucasian (149 | 89.2%), Two or more Races (14 | 8.4%), and Hispanic or Latino (8 | 4.8%).
| Race | # Population | % Population |
| Asian | 0 | 0.0% |
| Black / African American | 0 | 0.0% |
| Hawaiian / Pacific | 0 | 0.0% |
| Hispanic or Latino | 8 | 4.8% |
| Native / Alaskan | 4 | 2.4% |
| White / Caucasian | 149 | 89.2% |
| Two or more Races | 14 | 8.4% |
| Some other Race | 0 | 0.0% |
| Total | 167 | 100.0% |
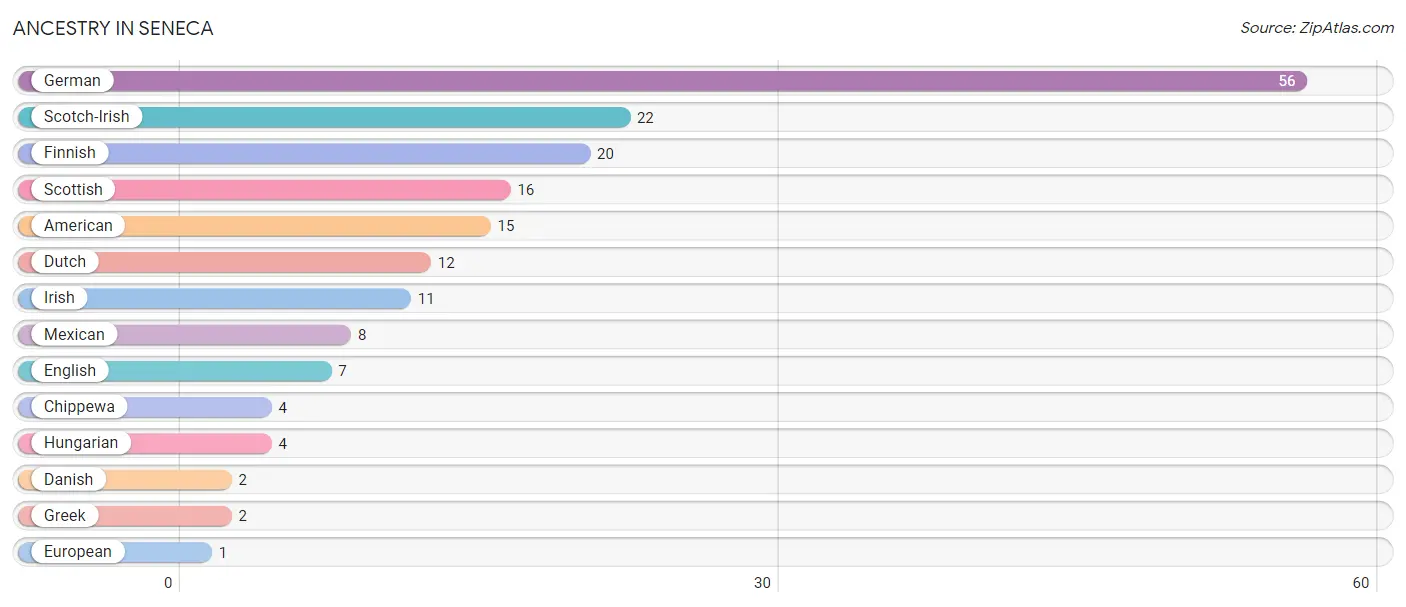
Ancestry in Seneca
The most populous ancestries reported in Seneca are German (56 | 33.5%), Scotch-Irish (22 | 13.2%), Finnish (20 | 12.0%), Scottish (16 | 9.6%), and American (15 | 9.0%), together accounting for 77.2% of all Seneca residents.
| Ancestry | # Population | % Population |
| American | 15 | 9.0% |
| Chippewa | 4 | 2.4% |
| Danish | 2 | 1.2% |
| Dutch | 12 | 7.2% |
| English | 7 | 4.2% |
| European | 1 | 0.6% |
| Finnish | 20 | 12.0% |
| German | 56 | 33.5% |
| Greek | 2 | 1.2% |
| Hungarian | 4 | 2.4% |
| Irish | 11 | 6.6% |
| Mexican | 8 | 4.8% |
| Scotch-Irish | 22 | 13.2% |
| Scottish | 16 | 9.6% | View All 14 Rows |
Immigrants in Seneca

| Immigration Origin | # Population | % Population | View All 0 Rows |
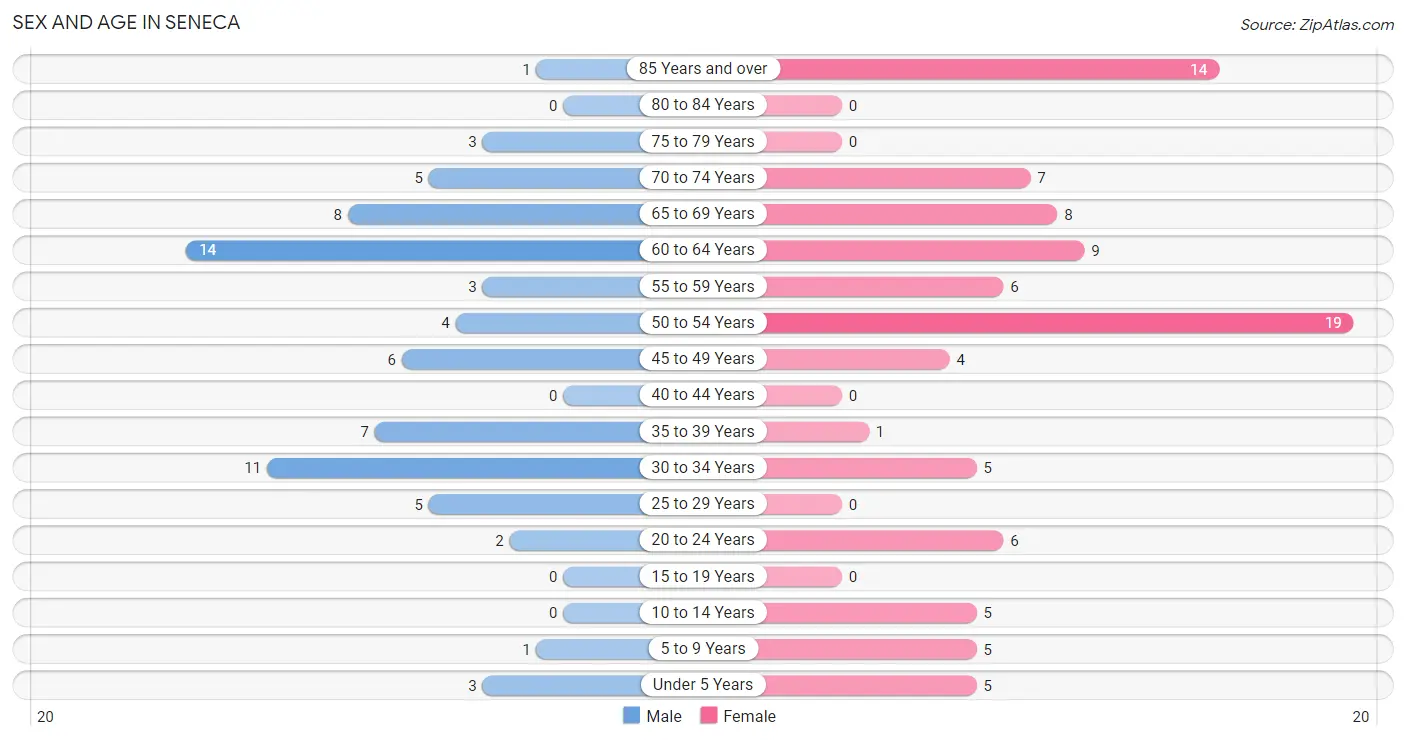
Sex and Age in Seneca
Sex and Age in Seneca
The most populous age groups in Seneca are 60 to 64 Years (14 | 19.2%) for men and 50 to 54 Years (19 | 20.2%) for women.
| Age Bracket | Male | Female |
| Under 5 Years | 3 (4.1%) | 5 (5.3%) |
| 5 to 9 Years | 1 (1.4%) | 5 (5.3%) |
| 10 to 14 Years | 0 (0.0%) | 5 (5.3%) |
| 15 to 19 Years | 0 (0.0%) | 0 (0.0%) |
| 20 to 24 Years | 2 (2.7%) | 6 (6.4%) |
| 25 to 29 Years | 5 (6.9%) | 0 (0.0%) |
| 30 to 34 Years | 11 (15.1%) | 5 (5.3%) |
| 35 to 39 Years | 7 (9.6%) | 1 (1.1%) |
| 40 to 44 Years | 0 (0.0%) | 0 (0.0%) |
| 45 to 49 Years | 6 (8.2%) | 4 (4.3%) |
| 50 to 54 Years | 4 (5.5%) | 19 (20.2%) |
| 55 to 59 Years | 3 (4.1%) | 6 (6.4%) |
| 60 to 64 Years | 14 (19.2%) | 9 (9.6%) |
| 65 to 69 Years | 8 (11.0%) | 8 (8.5%) |
| 70 to 74 Years | 5 (6.9%) | 7 (7.4%) |
| 75 to 79 Years | 3 (4.1%) | 0 (0.0%) |
| 80 to 84 Years | 0 (0.0%) | 0 (0.0%) |
| 85 Years and over | 1 (1.4%) | 14 (14.9%) |
| Total | 73 (100.0%) | 94 (100.0%) |
Families and Households in Seneca
Median Family Size in Seneca
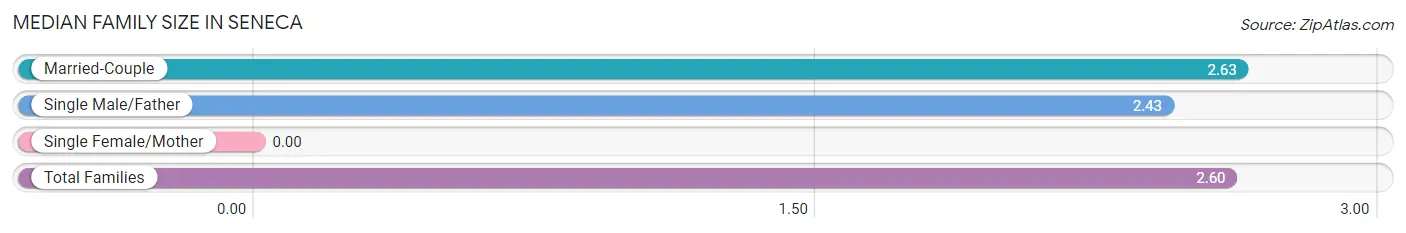
| Family Type | # Families | Family Size |
| Married-Couple | 38 (84.4%) | 2.63 |
| Single Male/Father | 7 (15.6%) | 2.43 |
| Single Female/Mother | 0 (0.0%) | - |
| Total Families | 45 (100.0%) | 2.60 |
Median Household Size in Seneca
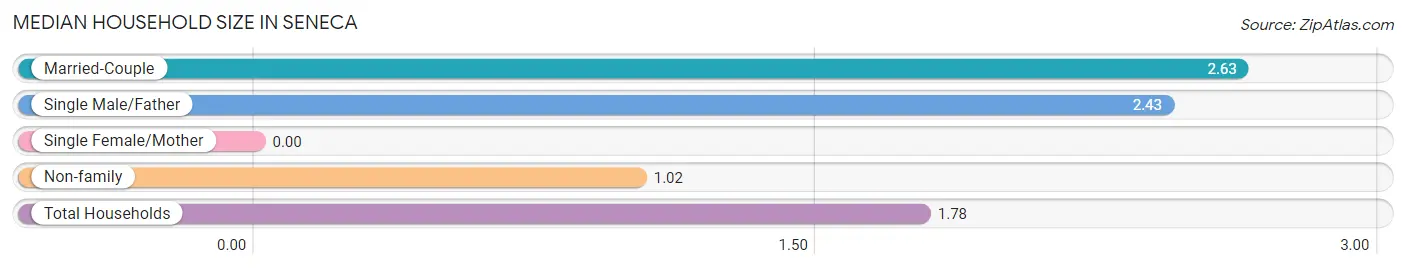
| Household Type | # Households | Household Size |
| Married-Couple | 38 (40.4%) | 2.63 |
| Single Male/Father | 7 (7.4%) | 2.43 |
| Single Female/Mother | 0 (0.0%) | - |
| Non-family | 49 (52.1%) | 1.02 |
| Total Households | 94 (100.0%) | 1.78 |
Household Size by Marriage Status in Seneca
Out of a total of 94 households in Seneca, 45 (47.9%) are family households, while 49 (52.1%) are nonfamily households. The most numerous type of family households are 3-person households, comprising 28, and the most common type of nonfamily households are 1-person households, comprising 48.
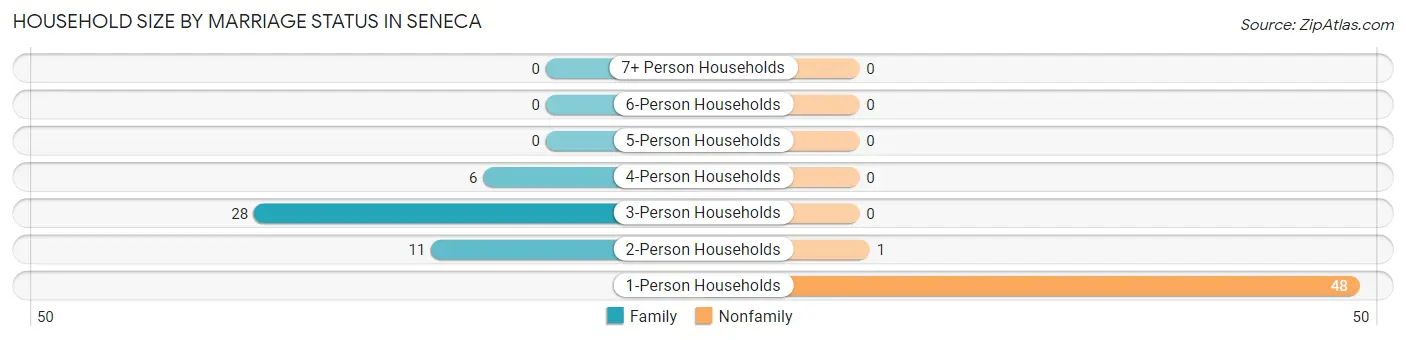
| Household Size | Family Households | Nonfamily Households |
| 1-Person Households | - | 48 (51.1%) |
| 2-Person Households | 11 (11.7%) | 1 (1.1%) |
| 3-Person Households | 28 (29.8%) | 0 (0.0%) |
| 4-Person Households | 6 (6.4%) | 0 (0.0%) |
| 5-Person Households | 0 (0.0%) | 0 (0.0%) |
| 6-Person Households | 0 (0.0%) | 0 (0.0%) |
| 7+ Person Households | 0 (0.0%) | 0 (0.0%) |
| Total | 45 (47.9%) | 49 (52.1%) |
Female Fertility in Seneca
Fertility by Age in Seneca
Average fertility rate in Seneca is 188.0 births per 1,000 women. Women in the age bracket of 20 to 34 years have the highest fertility rate with 273.0 births per 1,000 women. Women in the age bracket of 20 to 34 years acount for 100.0% of all women with births.
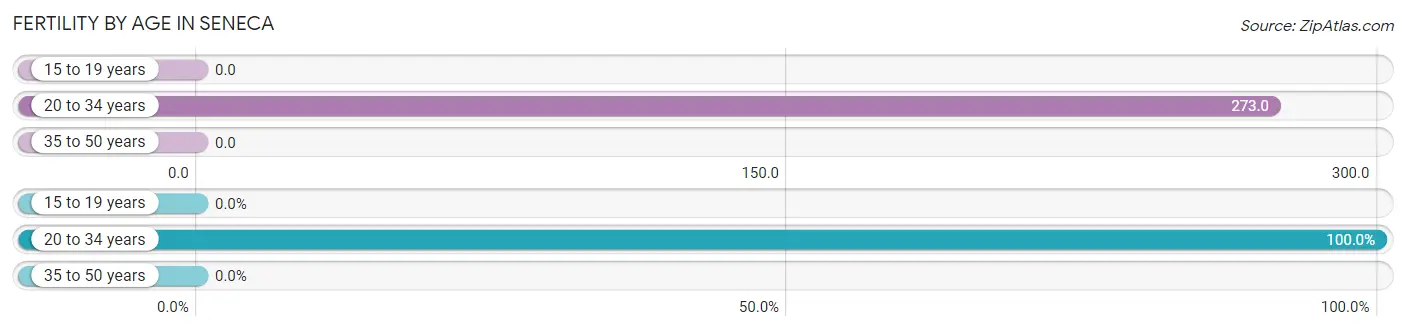
| Age Bracket | Women with Births | Births / 1,000 Women |
| 15 to 19 years | 0 (0.0%) | 0.0 |
| 20 to 34 years | 3 (100.0%) | 273.0 |
| 35 to 50 years | 0 (0.0%) | 0.0 |
| Total | 3 (100.0%) | 188.0 |
Fertility by Age by Marriage Status in Seneca
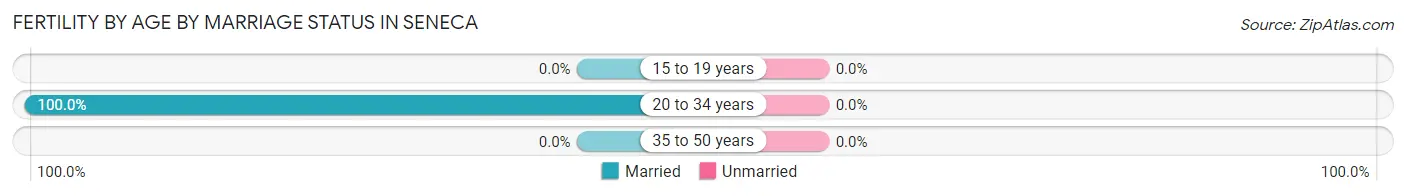
| Age Bracket | Married | Unmarried |
| 15 to 19 years | 0 (0.0%) | 0 (0.0%) |
| 20 to 34 years | 3 (100.0%) | 0 (0.0%) |
| 35 to 50 years | 0 (0.0%) | 0 (0.0%) |
| Total | 3 (100.0%) | 0 (0.0%) |
Fertility by Education in Seneca
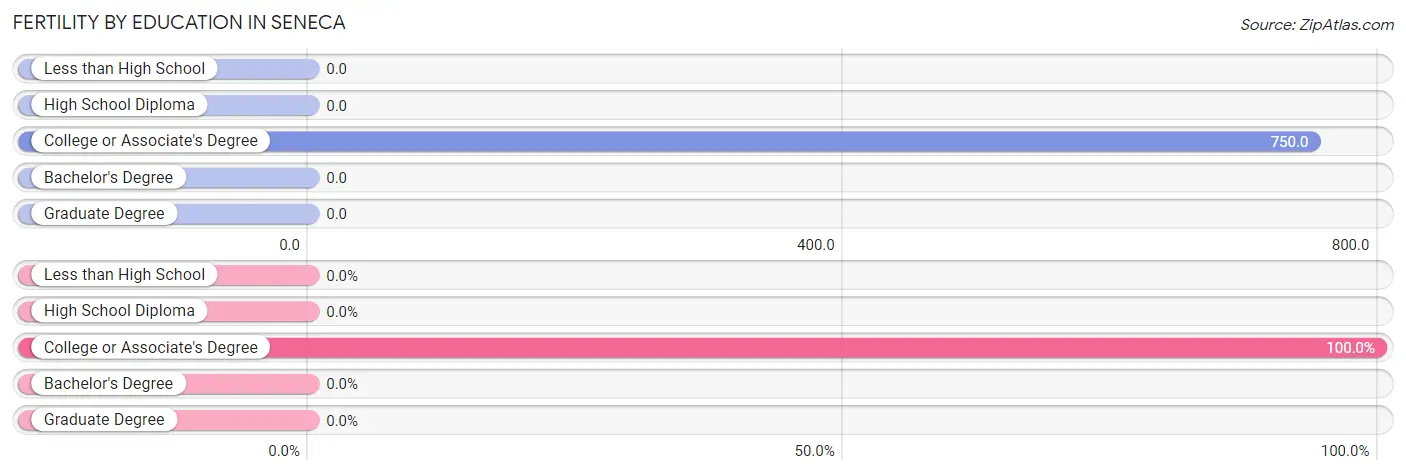
| Educational Attainment | Women with Births | Births / 1,000 Women |
| Less than High School | 0 (0.0%) | 0.0 |
| High School Diploma | 0 (0.0%) | 0.0 |
| College or Associate's Degree | 3 (100.0%) | 750.0 |
| Bachelor's Degree | 0 (0.0%) | 0.0 |
| Graduate Degree | 0 (0.0%) | 0.0 |
| Total | 3 (100.0%) | 188.0 |
Fertility by Education by Marriage Status in Seneca
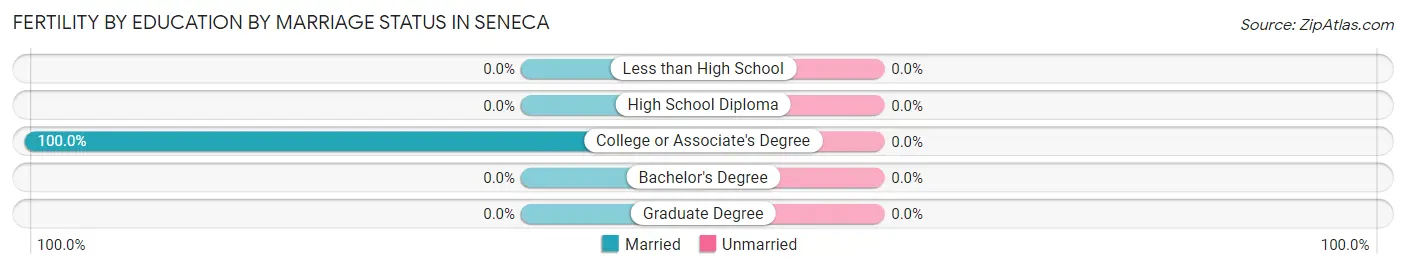
| Educational Attainment | Married | Unmarried |
| Less than High School | 0 (0.0%) | 0 (0.0%) |
| High School Diploma | 0 (0.0%) | 0 (0.0%) |
| College or Associate's Degree | 3 (100.0%) | 0 (0.0%) |
| Bachelor's Degree | 0 (0.0%) | 0 (0.0%) |
| Graduate Degree | 0 (0.0%) | 0 (0.0%) |
| Total | 3 (100.0%) | 0 (0.0%) |
Income in Seneca
Income Overview in Seneca
Per Capita Income in Seneca is $32,130, while median incomes of families and households are $82,596 and $66,250 respectively.
| Characteristic | Number | Measure |
| Per Capita Income | 167 | $32,130 |
| Median Family Income | 45 | $82,596 |
| Mean Family Income | 45 | $82,516 |
| Median Household Income | 94 | $66,250 |
| Mean Household Income | 94 | $62,387 |
| Income Deficit | 45 | $0 |
| Wage / Income Gap (%) | 167 | 5.25% |
| Wage / Income Gap ($) | 167 | 94.75¢ per $1 |
| Gini / Inequality Index | 167 | 0.37 |
Earnings by Sex in Seneca
Average Earnings in Seneca are $35,833, $36,146 for men and $34,250 for women, a difference of 5.2%.
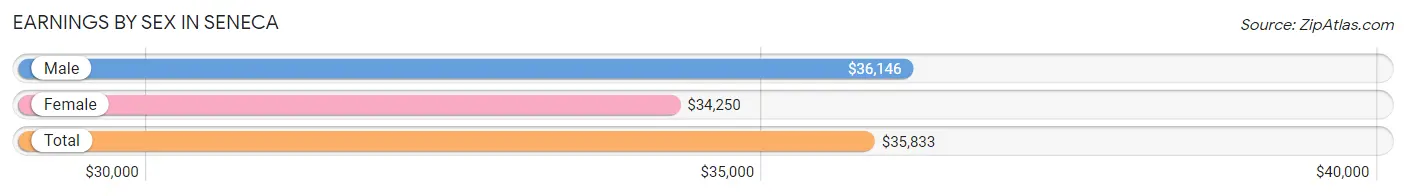
| Sex | Number | Average Earnings |
| Male | 51 (54.3%) | $36,146 |
| Female | 43 (45.7%) | $34,250 |
| Total | 94 (100.0%) | $35,833 |
Earnings by Sex by Income Bracket in Seneca
The most common earnings brackets in Seneca are $35,000 to $39,999 for men (12 | 23.5%) and $15,000 to $17,499 for women (13 | 30.2%).
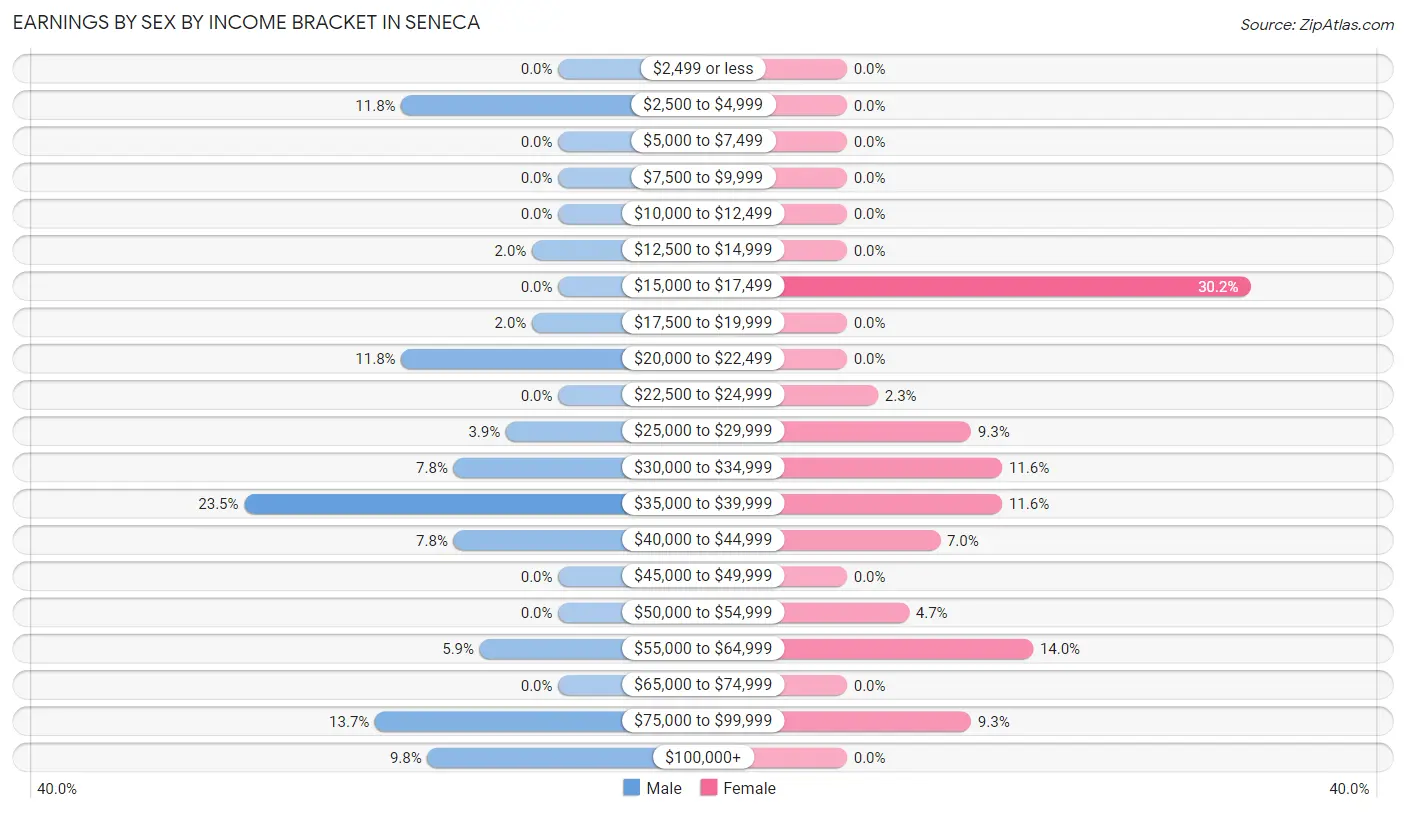
| Income | Male | Female |
| $2,499 or less | 0 (0.0%) | 0 (0.0%) |
| $2,500 to $4,999 | 6 (11.8%) | 0 (0.0%) |
| $5,000 to $7,499 | 0 (0.0%) | 0 (0.0%) |
| $7,500 to $9,999 | 0 (0.0%) | 0 (0.0%) |
| $10,000 to $12,499 | 0 (0.0%) | 0 (0.0%) |
| $12,500 to $14,999 | 1 (2.0%) | 0 (0.0%) |
| $15,000 to $17,499 | 0 (0.0%) | 13 (30.2%) |
| $17,500 to $19,999 | 1 (2.0%) | 0 (0.0%) |
| $20,000 to $22,499 | 6 (11.8%) | 0 (0.0%) |
| $22,500 to $24,999 | 0 (0.0%) | 1 (2.3%) |
| $25,000 to $29,999 | 2 (3.9%) | 4 (9.3%) |
| $30,000 to $34,999 | 4 (7.8%) | 5 (11.6%) |
| $35,000 to $39,999 | 12 (23.5%) | 5 (11.6%) |
| $40,000 to $44,999 | 4 (7.8%) | 3 (7.0%) |
| $45,000 to $49,999 | 0 (0.0%) | 0 (0.0%) |
| $50,000 to $54,999 | 0 (0.0%) | 2 (4.6%) |
| $55,000 to $64,999 | 3 (5.9%) | 6 (14.0%) |
| $65,000 to $74,999 | 0 (0.0%) | 0 (0.0%) |
| $75,000 to $99,999 | 7 (13.7%) | 4 (9.3%) |
| $100,000+ | 5 (9.8%) | 0 (0.0%) |
| Total | 51 (100.0%) | 43 (100.0%) |
Earnings by Sex by Educational Attainment in Seneca
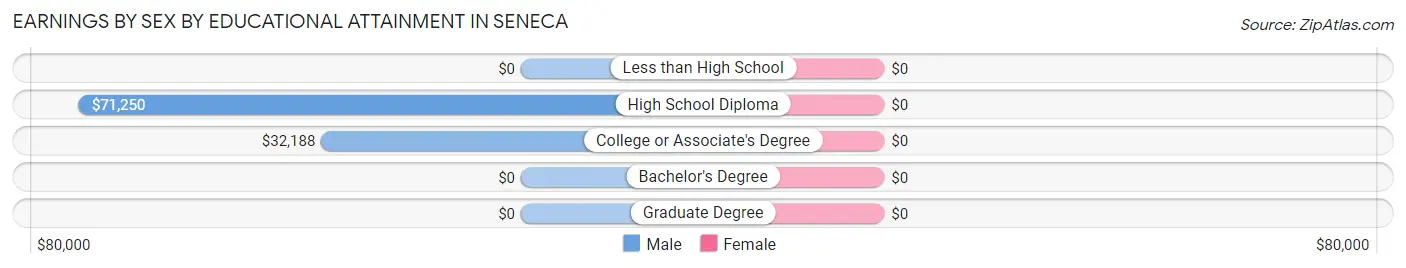
| Educational Attainment | Male Income | Female Income |
| Less than High School | - | - |
| High School Diploma | $71,250 | $0 |
| College or Associate's Degree | $32,188 | $0 |
| Bachelor's Degree | - | - |
| Graduate Degree | - | - |
| Total | $36,146 | $33,000 |
Family Income in Seneca
Family Income Brackets in Seneca
According to the Seneca family income data, there are 26 families falling into the $75,000 to $99,999 income range, which is the most common income bracket and makes up 57.8% of all families.
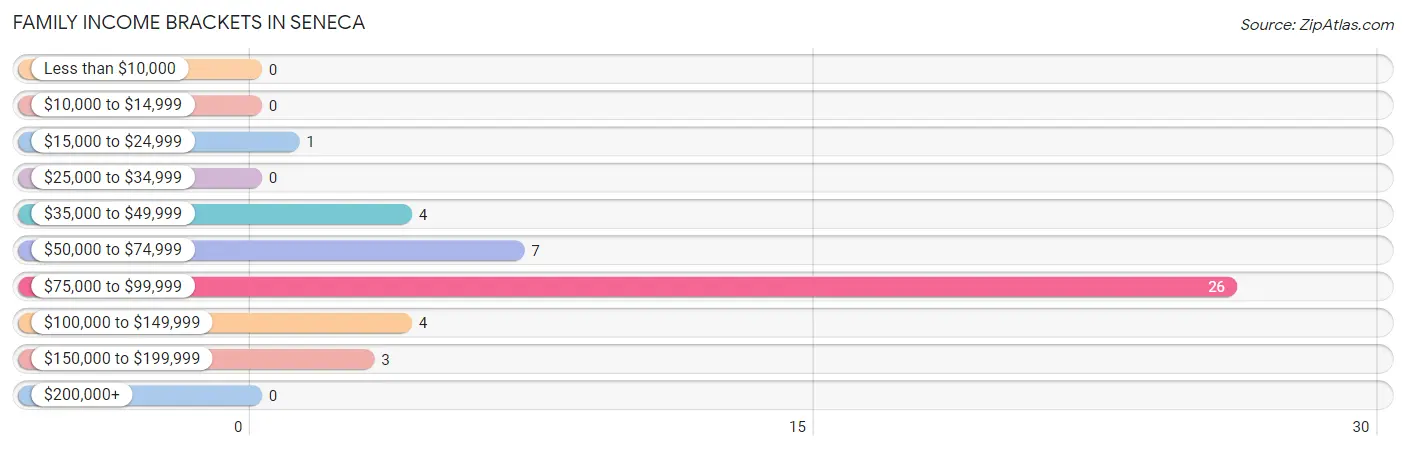
| Income Bracket | # Families | % Families |
| Less than $10,000 | 0 | 0.0% |
| $10,000 to $14,999 | 0 | 0.0% |
| $15,000 to $24,999 | 1 | 2.2% |
| $25,000 to $34,999 | 0 | 0.0% |
| $35,000 to $49,999 | 4 | 8.9% |
| $50,000 to $74,999 | 7 | 15.6% |
| $75,000 to $99,999 | 26 | 57.8% |
| $100,000 to $149,999 | 4 | 8.9% |
| $150,000 to $199,999 | 3 | 6.7% |
| $200,000+ | 0 | 0.0% |
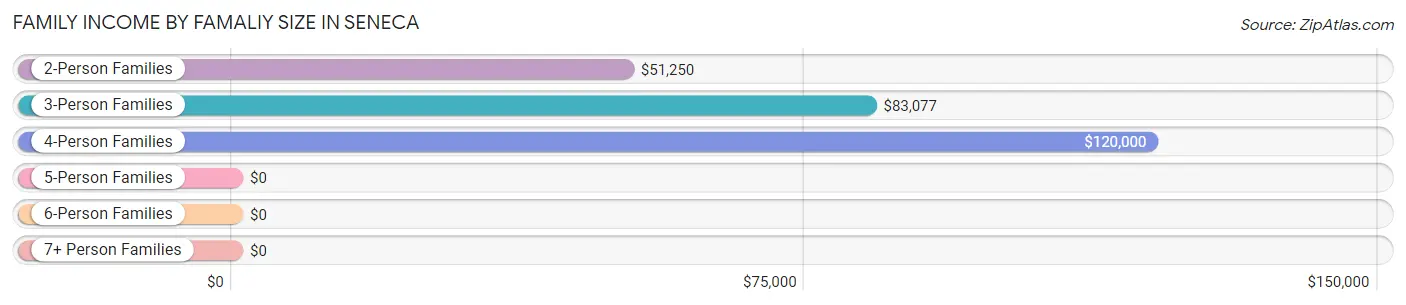
Family Income by Famaliy Size in Seneca
4-person families (6 | 13.3%) account for the highest median family income in Seneca with $120,000 per family, while 4-person families (6 | 13.3%) have the highest median income of $30,000 per family member.
| Income Bracket | # Families | Median Income |
| 2-Person Families | 11 (24.4%) | $51,250 |
| 3-Person Families | 28 (62.2%) | $83,077 |
| 4-Person Families | 6 (13.3%) | $120,000 |
| 5-Person Families | 0 (0.0%) | $0 |
| 6-Person Families | 0 (0.0%) | $0 |
| 7+ Person Families | 0 (0.0%) | $0 |
| Total | 45 (100.0%) | $82,596 |
Family Income by Number of Earners in Seneca
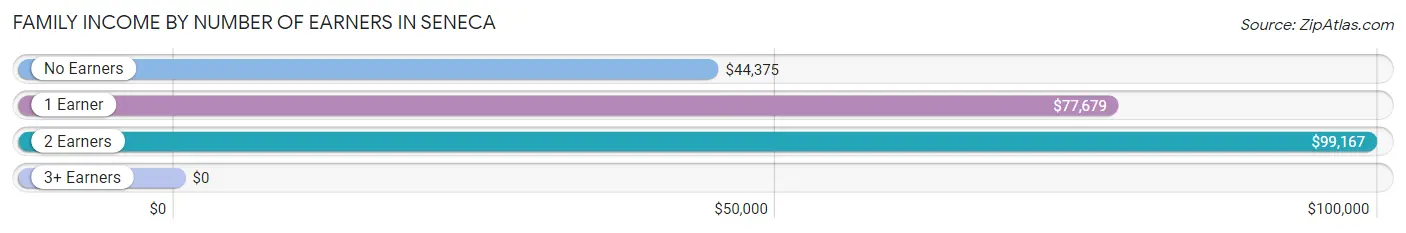
| Number of Earners | # Families | Median Income |
| No Earners | 7 (15.6%) | $44,375 |
| 1 Earner | 13 (28.9%) | $77,679 |
| 2 Earners | 8 (17.8%) | $99,167 |
| 3+ Earners | 17 (37.8%) | $0 |
| Total | 45 (100.0%) | $82,596 |
Household Income in Seneca
Household Income Brackets in Seneca
With 32 households falling in the category, the $75,000 to $99,999 income range is the most frequent in Seneca, accounting for 34.0% of all households.
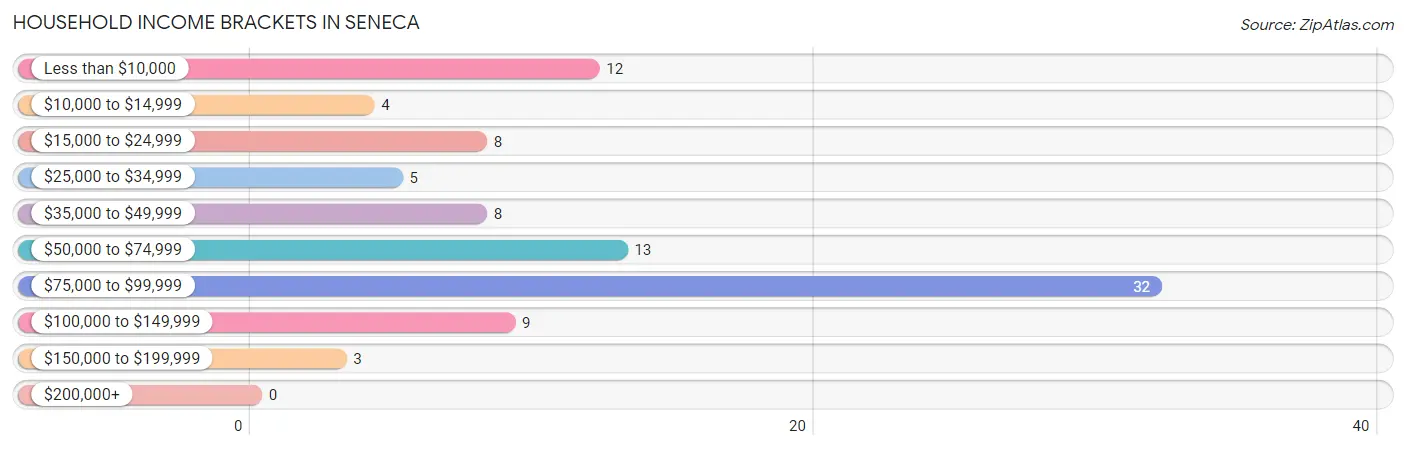
| Income Bracket | # Households | % Households |
| Less than $10,000 | 12 | 12.8% |
| $10,000 to $14,999 | 4 | 4.3% |
| $15,000 to $24,999 | 8 | 8.5% |
| $25,000 to $34,999 | 5 | 5.3% |
| $35,000 to $49,999 | 8 | 8.5% |
| $50,000 to $74,999 | 13 | 13.8% |
| $75,000 to $99,999 | 32 | 34.0% |
| $100,000 to $149,999 | 9 | 9.6% |
| $150,000 to $199,999 | 3 | 3.2% |
| $200,000+ | 0 | 0.0% |
Household Income by Householder Age in Seneca
The median household income in Seneca is $66,250, with the highest median household income of $67,083 found in the 45 to 64 years age bracket for the primary householder. A total of 48 households (51.1%) fall into this category. Meanwhile, the 15 to 24 years age bracket for the primary householder has the lowest median household income of $0, with 6 households (6.4%) in this group.
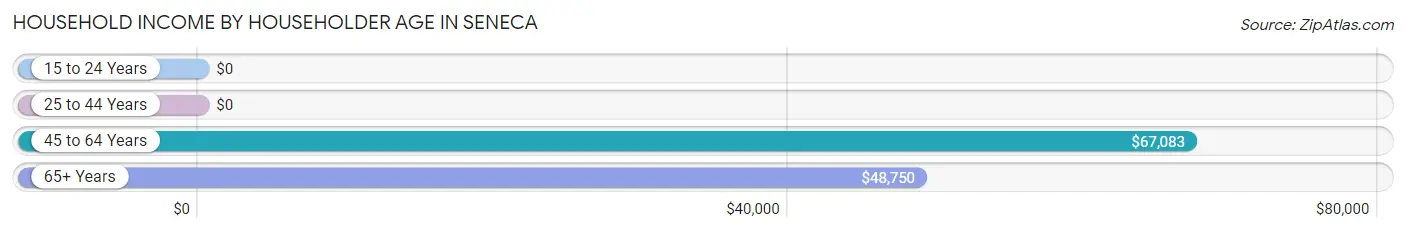
| Income Bracket | # Households | Median Income |
| 15 to 24 Years | 6 (6.4%) | $0 |
| 25 to 44 Years | 12 (12.8%) | $0 |
| 45 to 64 Years | 48 (51.1%) | $67,083 |
| 65+ Years | 28 (29.8%) | $48,750 |
| Total | 94 (100.0%) | $66,250 |
Poverty in Seneca
Income Below Poverty by Sex and Age in Seneca
With 11.0% poverty level for males and 12.8% for females among the residents of Seneca, 45 to 54 year old males and 65 to 74 year old females are the most vulnerable to poverty, with 6 males (60.0%) and 6 females (40.0%) in their respective age groups living below the poverty level.
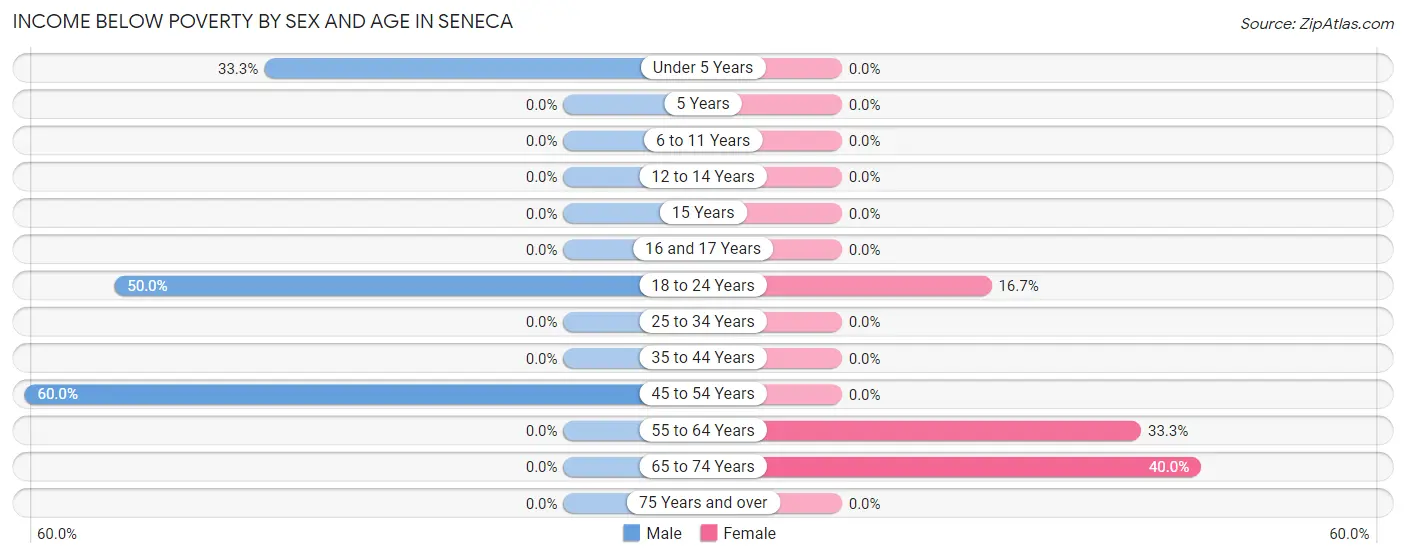
| Age Bracket | Male | Female |
| Under 5 Years | 1 (33.3%) | 0 (0.0%) |
| 5 Years | 0 (0.0%) | 0 (0.0%) |
| 6 to 11 Years | 0 (0.0%) | 0 (0.0%) |
| 12 to 14 Years | 0 (0.0%) | 0 (0.0%) |
| 15 Years | 0 (0.0%) | 0 (0.0%) |
| 16 and 17 Years | 0 (0.0%) | 0 (0.0%) |
| 18 to 24 Years | 1 (50.0%) | 1 (16.7%) |
| 25 to 34 Years | 0 (0.0%) | 0 (0.0%) |
| 35 to 44 Years | 0 (0.0%) | 0 (0.0%) |
| 45 to 54 Years | 6 (60.0%) | 0 (0.0%) |
| 55 to 64 Years | 0 (0.0%) | 5 (33.3%) |
| 65 to 74 Years | 0 (0.0%) | 6 (40.0%) |
| 75 Years and over | 0 (0.0%) | 0 (0.0%) |
| Total | 8 (11.0%) | 12 (12.8%) |
Income Above Poverty by Sex and Age in Seneca
According to the poverty statistics in Seneca, males aged 6 to 11 years and females aged under 5 years are the age groups that are most secure financially, with 100.0% of males and 100.0% of females in these age groups living above the poverty line.
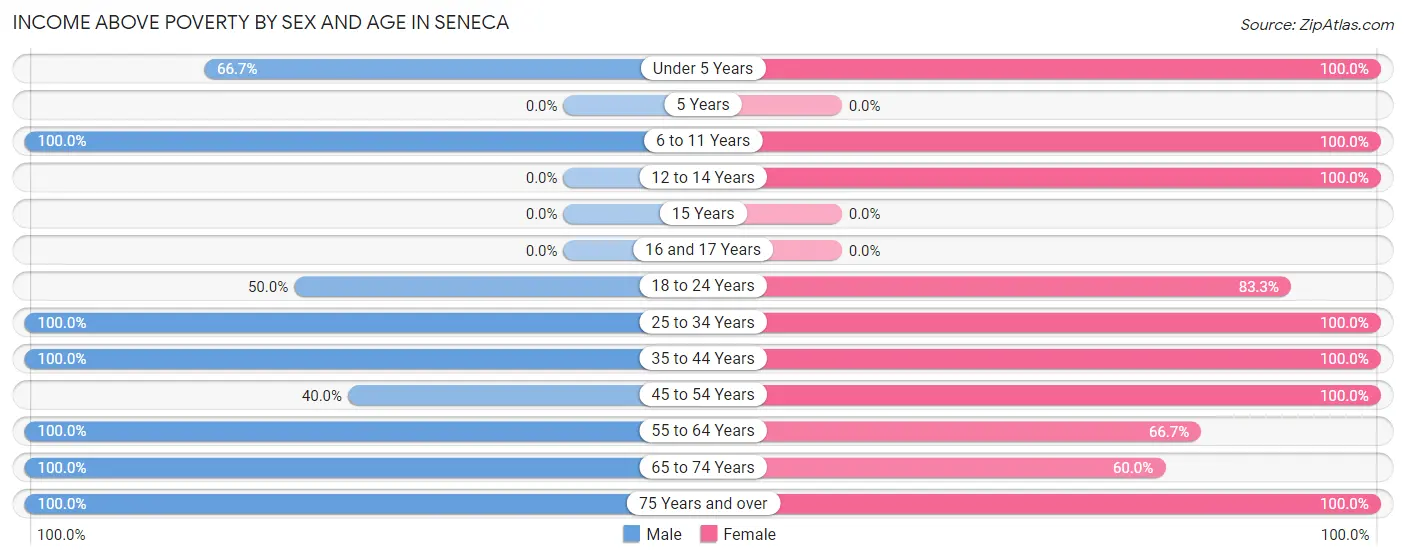
| Age Bracket | Male | Female |
| Under 5 Years | 2 (66.7%) | 5 (100.0%) |
| 5 Years | 0 (0.0%) | 0 (0.0%) |
| 6 to 11 Years | 1 (100.0%) | 5 (100.0%) |
| 12 to 14 Years | 0 (0.0%) | 5 (100.0%) |
| 15 Years | 0 (0.0%) | 0 (0.0%) |
| 16 and 17 Years | 0 (0.0%) | 0 (0.0%) |
| 18 to 24 Years | 1 (50.0%) | 5 (83.3%) |
| 25 to 34 Years | 16 (100.0%) | 5 (100.0%) |
| 35 to 44 Years | 7 (100.0%) | 1 (100.0%) |
| 45 to 54 Years | 4 (40.0%) | 23 (100.0%) |
| 55 to 64 Years | 17 (100.0%) | 10 (66.7%) |
| 65 to 74 Years | 13 (100.0%) | 9 (60.0%) |
| 75 Years and over | 4 (100.0%) | 14 (100.0%) |
| Total | 65 (89.0%) | 82 (87.2%) |
Income Below Poverty Among Married-Couple Families in Seneca
The poverty statistics for married-couple families in Seneca show that 2.6% or 1 of the total 38 families live below the poverty line. Families with 1 or 2 children have the highest poverty rate of 25.0%, comprising of 1 families. On the other hand, families with no children have the lowest poverty rate of 0.0%, which includes 0 families.
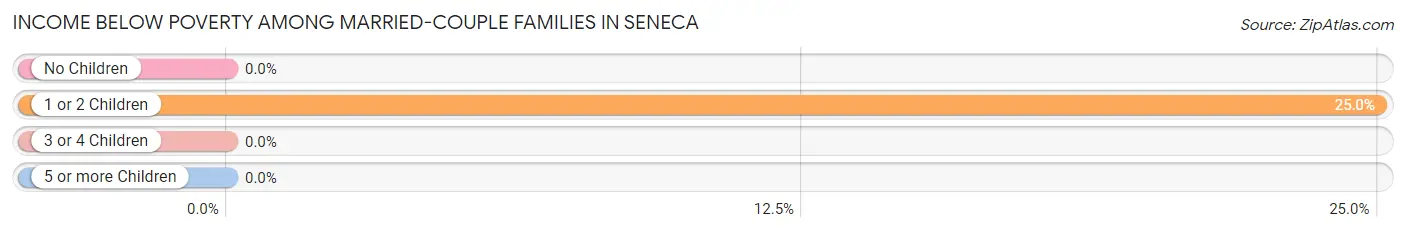
| Children | Above Poverty | Below Poverty |
| No Children | 34 (100.0%) | 0 (0.0%) |
| 1 or 2 Children | 3 (75.0%) | 1 (25.0%) |
| 3 or 4 Children | 0 (0.0%) | 0 (0.0%) |
| 5 or more Children | 0 (0.0%) | 0 (0.0%) |
| Total | 37 (97.4%) | 1 (2.6%) |
Income Below Poverty Among Single-Parent Households in Seneca
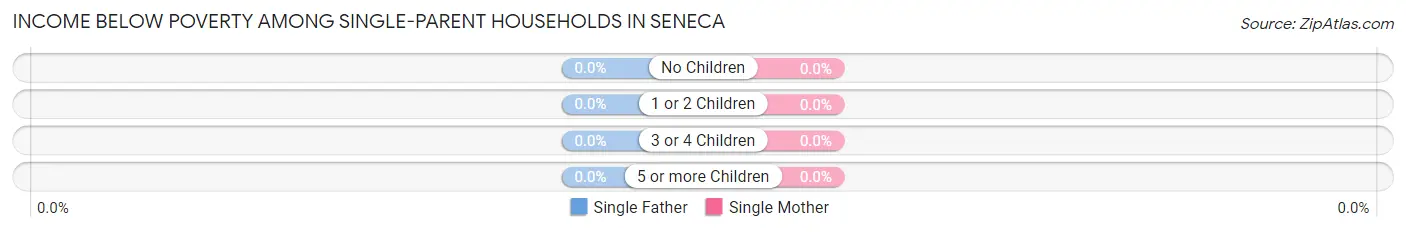
| Children | Single Father | Single Mother |
| No Children | 0 (0.0%) | 0 (0.0%) |
| 1 or 2 Children | 0 (0.0%) | 0 (0.0%) |
| 3 or 4 Children | 0 (0.0%) | 0 (0.0%) |
| 5 or more Children | 0 (0.0%) | 0 (0.0%) |
| Total | 0 (0.0%) | 0 (0.0%) |
Income Below Poverty Among Married-Couple vs Single-Parent Households in Seneca
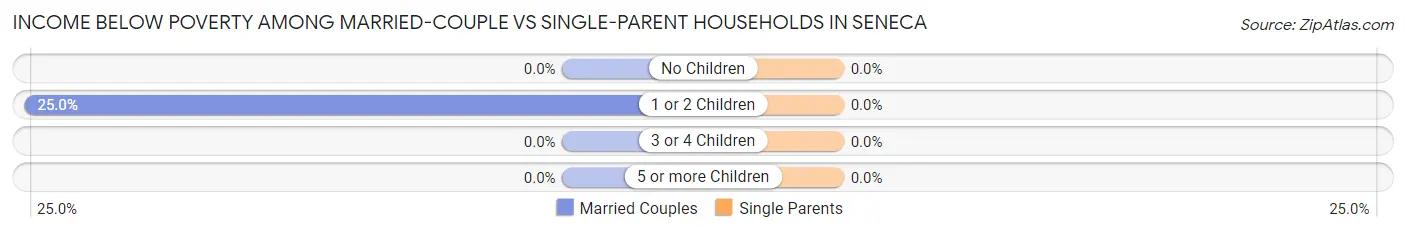
| Children | Married-Couple Families | Single-Parent Households |
| No Children | 0 (0.0%) | 0 (0.0%) |
| 1 or 2 Children | 1 (25.0%) | 0 (0.0%) |
| 3 or 4 Children | 0 (0.0%) | 0 (0.0%) |
| 5 or more Children | 0 (0.0%) | 0 (0.0%) |
| Total | 1 (2.6%) | 0 (0.0%) |
Employment Characteristics in Seneca
Employment by Class of Employer in Seneca
Among the 85 employed individuals in Seneca, private company employees (28 | 32.9%), local government employees (26 | 30.6%), and self-employed (incorporated) (13 | 15.3%) make up the most common classes of employment.
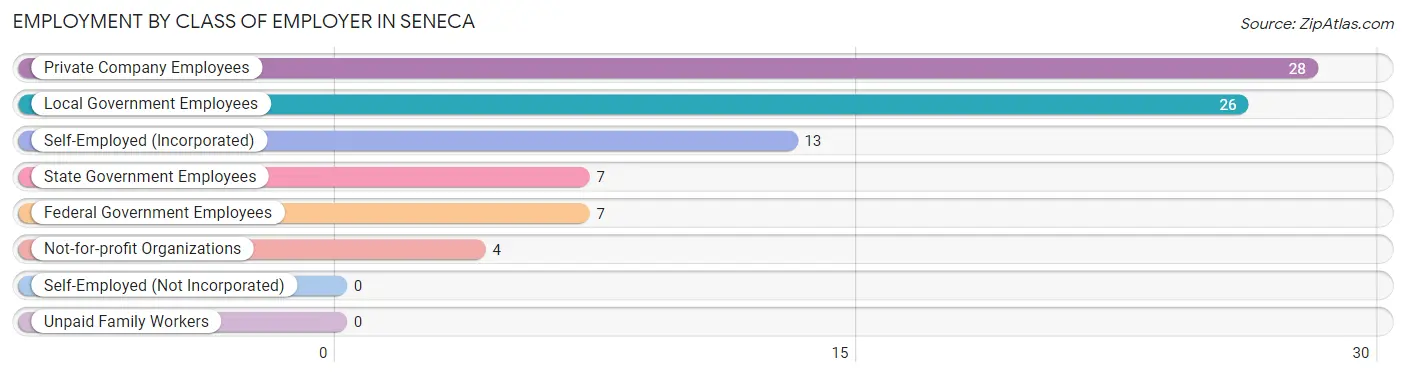
| Employer Class | # Employees | % Employees |
| Private Company Employees | 28 | 32.9% |
| Self-Employed (Incorporated) | 13 | 15.3% |
| Self-Employed (Not Incorporated) | 0 | 0.0% |
| Not-for-profit Organizations | 4 | 4.7% |
| Local Government Employees | 26 | 30.6% |
| State Government Employees | 7 | 8.2% |
| Federal Government Employees | 7 | 8.2% |
| Unpaid Family Workers | 0 | 0.0% |
| Total | 85 | 100.0% |
Employment Status by Age in Seneca
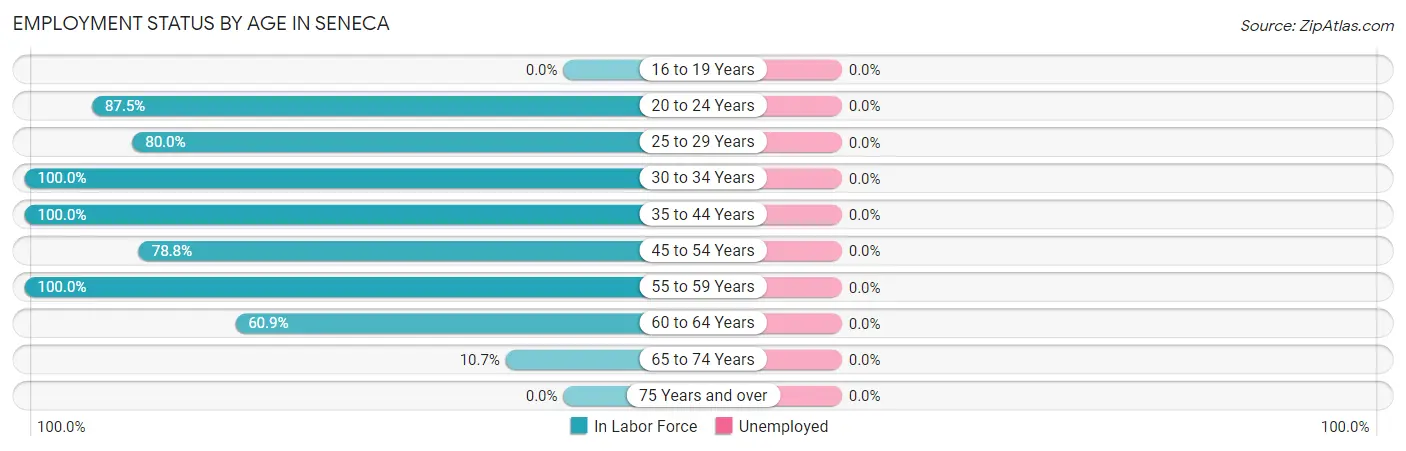
| Age Bracket | In Labor Force | Unemployed |
| 16 to 19 Years | 0 (0.0%) | 0 (0.0%) |
| 20 to 24 Years | 7 (87.5%) | 0 (0.0%) |
| 25 to 29 Years | 4 (80.0%) | 0 (0.0%) |
| 30 to 34 Years | 16 (100.0%) | 0 (0.0%) |
| 35 to 44 Years | 8 (100.0%) | 0 (0.0%) |
| 45 to 54 Years | 26 (78.8%) | 0 (0.0%) |
| 55 to 59 Years | 9 (100.0%) | 0 (0.0%) |
| 60 to 64 Years | 14 (60.9%) | 0 (0.0%) |
| 65 to 74 Years | 3 (10.7%) | 0 (0.0%) |
| 75 Years and over | 0 (0.0%) | 0 (0.0%) |
| Total | 87 (58.8%) | 0 (0.0%) |
Employment Status by Educational Attainment in Seneca
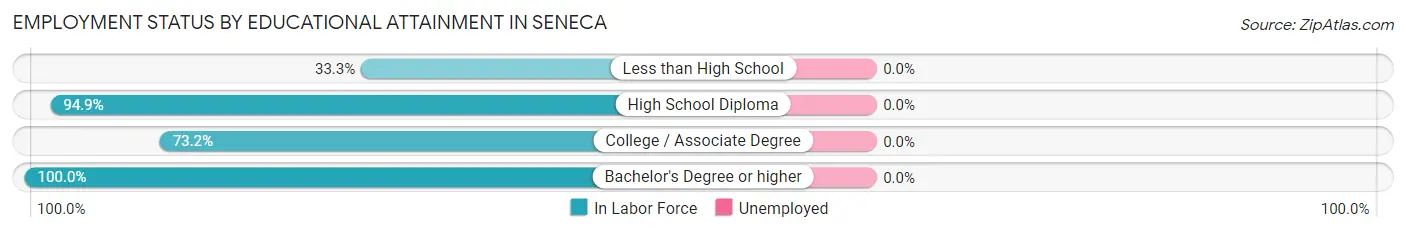
| Educational Attainment | In Labor Force | Unemployed |
| Less than High School | 2 (33.3%) | 0 (0.0%) |
| High School Diploma | 37 (94.9%) | 0 (0.0%) |
| College / Associate Degree | 30 (73.2%) | 0 (0.0%) |
| Bachelor's Degree or higher | 8 (100.0%) | 0 (0.0%) |
| Total | 77 (81.9%) | 0 (0.0%) |
Employment Occupations by Sex in Seneca
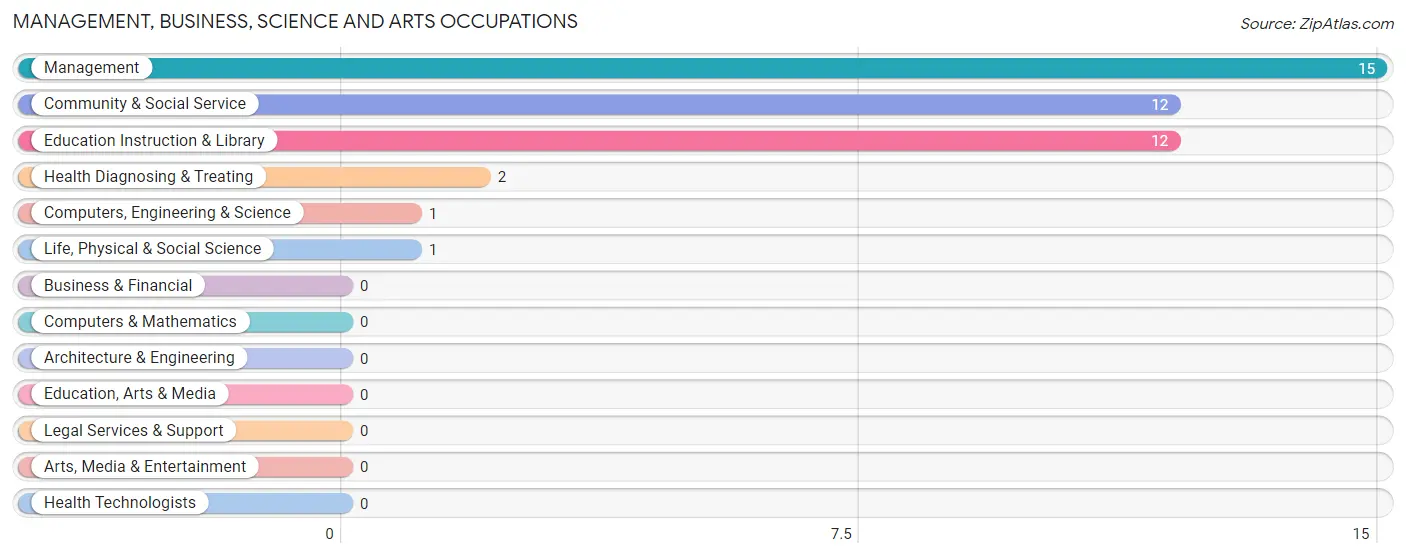
Management, Business, Science and Arts Occupations
The most common Management, Business, Science and Arts occupations in Seneca are Management (15 | 17.2%), Community & Social Service (12 | 13.8%), Education Instruction & Library (12 | 13.8%), Health Diagnosing & Treating (2 | 2.3%), and Computers, Engineering & Science (1 | 1.1%).
Management, Business, Science and Arts Occupations by Sex
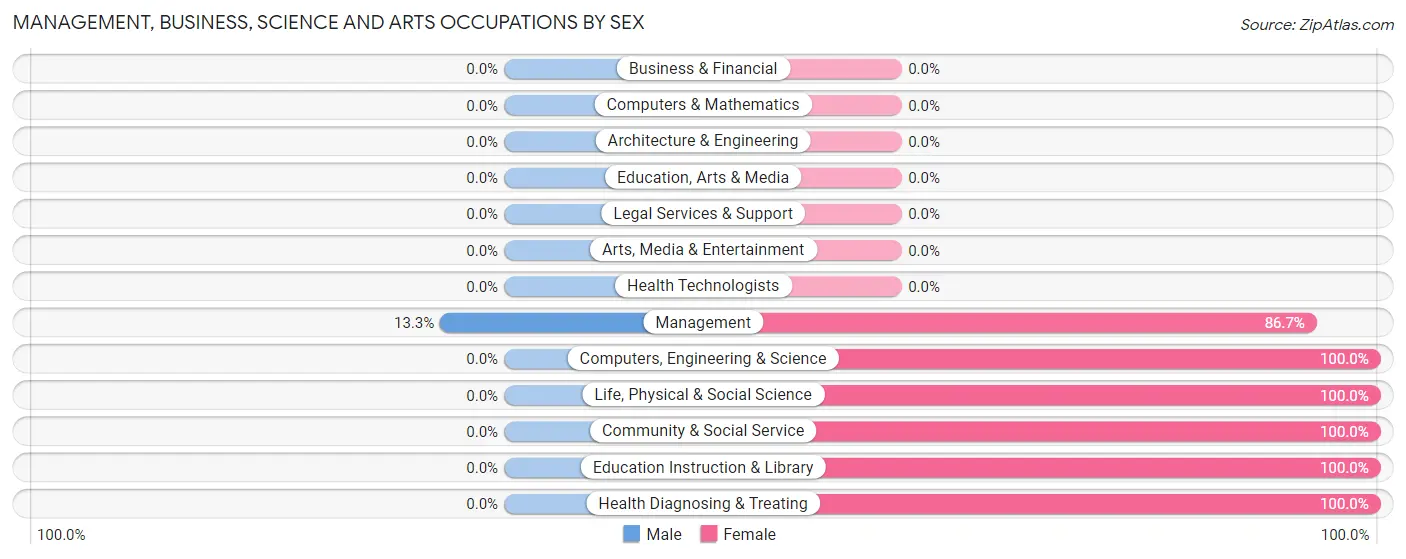
| Occupation | Male | Female |
| Management | 2 (13.3%) | 13 (86.7%) |
| Business & Financial | 0 (0.0%) | 0 (0.0%) |
| Computers, Engineering & Science | 0 (0.0%) | 1 (100.0%) |
| Computers & Mathematics | 0 (0.0%) | 0 (0.0%) |
| Architecture & Engineering | 0 (0.0%) | 0 (0.0%) |
| Life, Physical & Social Science | 0 (0.0%) | 1 (100.0%) |
| Community & Social Service | 0 (0.0%) | 12 (100.0%) |
| Education, Arts & Media | 0 (0.0%) | 0 (0.0%) |
| Legal Services & Support | 0 (0.0%) | 0 (0.0%) |
| Education Instruction & Library | 0 (0.0%) | 12 (100.0%) |
| Arts, Media & Entertainment | 0 (0.0%) | 0 (0.0%) |
| Health Diagnosing & Treating | 0 (0.0%) | 2 (100.0%) |
| Health Technologists | 0 (0.0%) | 0 (0.0%) |
| Total (Category) | 2 (6.7%) | 28 (93.3%) |
| Total (Overall) | 44 (50.6%) | 43 (49.4%) |
Services Occupations
The most common Services occupations in Seneca are Cleaning & Maintenance (29 | 33.3%), Security & Protection (6 | 6.9%), and Firefighting & Prevention (6 | 6.9%).
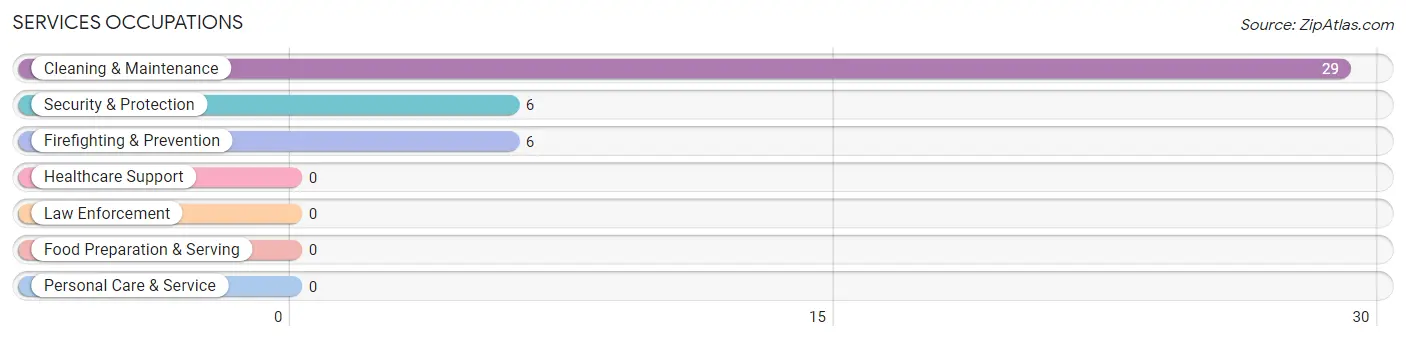
Services Occupations by Sex
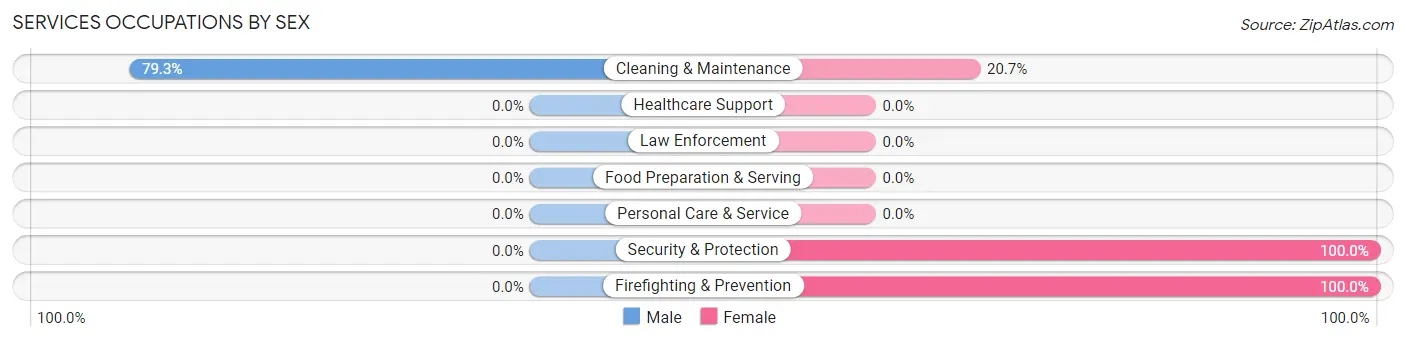
| Occupation | Male | Female |
| Healthcare Support | 0 (0.0%) | 0 (0.0%) |
| Security & Protection | 0 (0.0%) | 6 (100.0%) |
| Firefighting & Prevention | 0 (0.0%) | 6 (100.0%) |
| Law Enforcement | 0 (0.0%) | 0 (0.0%) |
| Food Preparation & Serving | 0 (0.0%) | 0 (0.0%) |
| Cleaning & Maintenance | 23 (79.3%) | 6 (20.7%) |
| Personal Care & Service | 0 (0.0%) | 0 (0.0%) |
| Total (Category) | 23 (65.7%) | 12 (34.3%) |
| Total (Overall) | 44 (50.6%) | 43 (49.4%) |
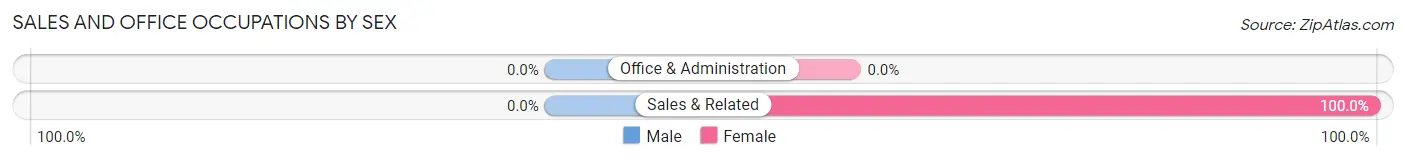
Sales and Office Occupations
The most common Sales and Office occupations in Seneca are , and Sales & Related (2 | 2.3%).
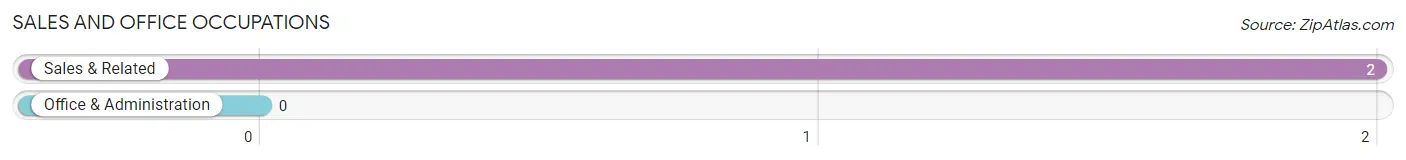
Sales and Office Occupations by Sex
| Occupation | Male | Female |
| Sales & Related | 0 (0.0%) | 2 (100.0%) |
| Office & Administration | 0 (0.0%) | 0 (0.0%) |
| Total (Category) | 0 (0.0%) | 2 (100.0%) |
| Total (Overall) | 44 (50.6%) | 43 (49.4%) |
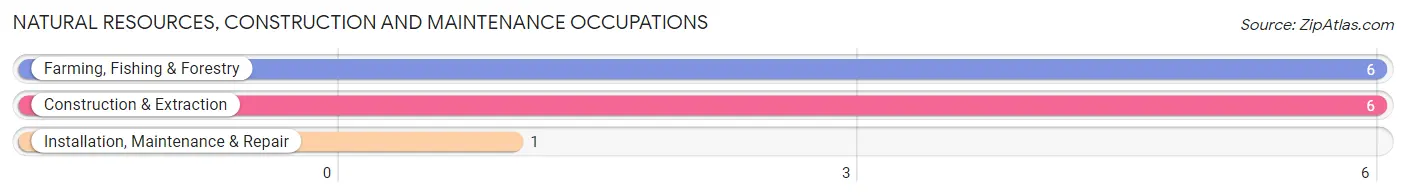
Natural Resources, Construction and Maintenance Occupations
The most common Natural Resources, Construction and Maintenance occupations in Seneca are Farming, Fishing & Forestry (6 | 6.9%), Construction & Extraction (6 | 6.9%), and Installation, Maintenance & Repair (1 | 1.1%).
Natural Resources, Construction and Maintenance Occupations by Sex
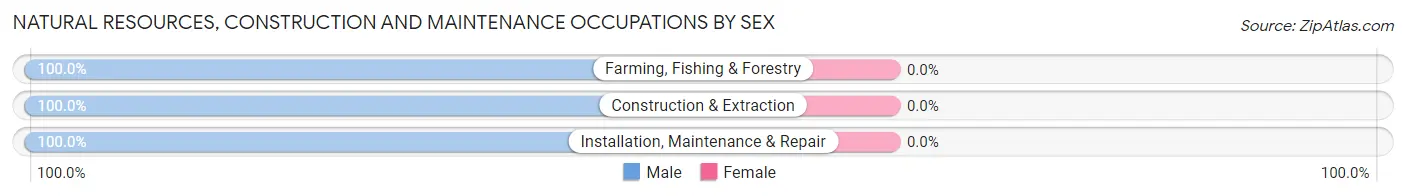
| Occupation | Male | Female |
| Farming, Fishing & Forestry | 6 (100.0%) | 0 (0.0%) |
| Construction & Extraction | 6 (100.0%) | 0 (0.0%) |
| Installation, Maintenance & Repair | 1 (100.0%) | 0 (0.0%) |
| Total (Category) | 13 (100.0%) | 0 (0.0%) |
| Total (Overall) | 44 (50.6%) | 43 (49.4%) |
Production, Transportation and Moving Occupations
The most common Production, Transportation and Moving occupations in Seneca are Material Moving (4 | 4.6%), and Production (3 | 3.5%).
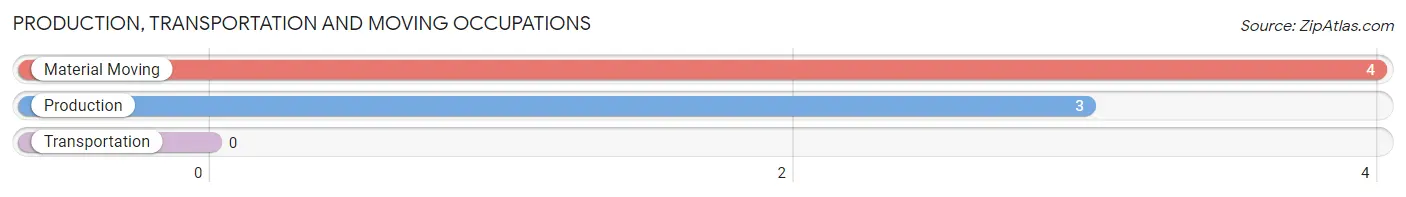
Production, Transportation and Moving Occupations by Sex
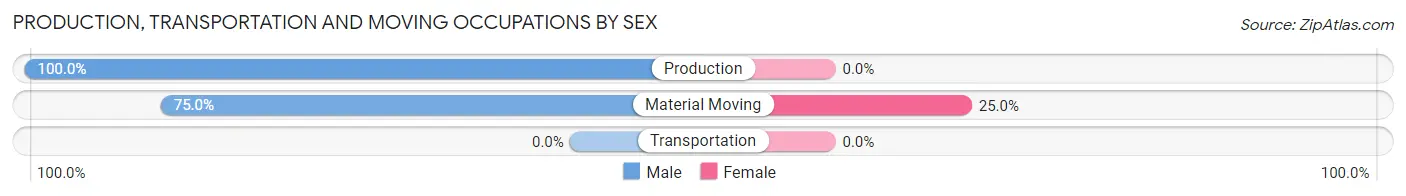
| Occupation | Male | Female |
| Production | 3 (100.0%) | 0 (0.0%) |
| Transportation | 0 (0.0%) | 0 (0.0%) |
| Material Moving | 3 (75.0%) | 1 (25.0%) |
| Total (Category) | 6 (85.7%) | 1 (14.3%) |
| Total (Overall) | 44 (50.6%) | 43 (49.4%) |
Employment Industries by Sex in Seneca
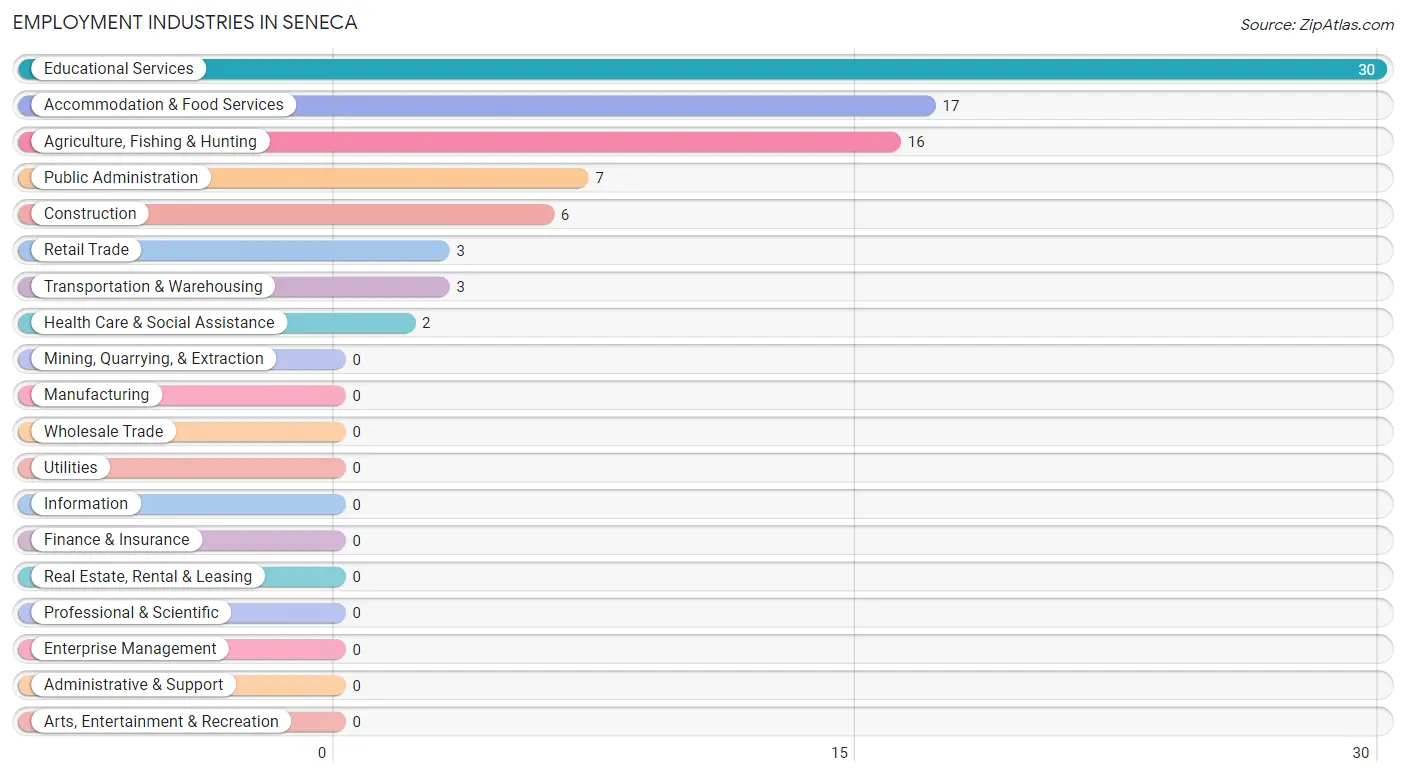
Employment Industries in Seneca
The major employment industries in Seneca include Educational Services (30 | 34.5%), Accommodation & Food Services (17 | 19.5%), Agriculture, Fishing & Hunting (16 | 18.4%), Public Administration (7 | 8.1%), and Construction (6 | 6.9%).
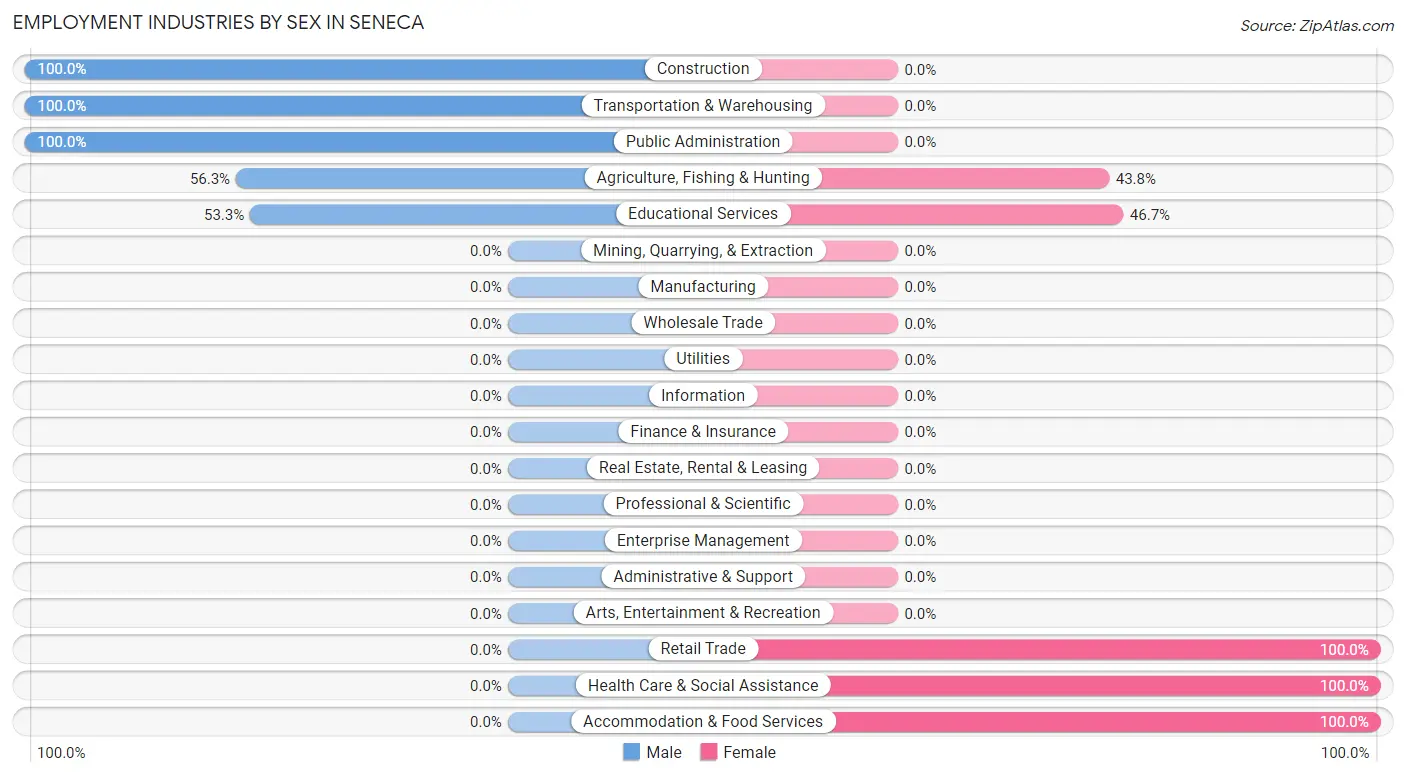
Employment Industries by Sex in Seneca
The Seneca industries that see more men than women are Construction (100.0%), Transportation & Warehousing (100.0%), and Public Administration (100.0%), whereas the industries that tend to have a higher number of women are Retail Trade (100.0%), Health Care & Social Assistance (100.0%), and Accommodation & Food Services (100.0%).
| Industry | Male | Female |
| Agriculture, Fishing & Hunting | 9 (56.2%) | 7 (43.8%) |
| Mining, Quarrying, & Extraction | 0 (0.0%) | 0 (0.0%) |
| Construction | 6 (100.0%) | 0 (0.0%) |
| Manufacturing | 0 (0.0%) | 0 (0.0%) |
| Wholesale Trade | 0 (0.0%) | 0 (0.0%) |
| Retail Trade | 0 (0.0%) | 3 (100.0%) |
| Transportation & Warehousing | 3 (100.0%) | 0 (0.0%) |
| Utilities | 0 (0.0%) | 0 (0.0%) |
| Information | 0 (0.0%) | 0 (0.0%) |
| Finance & Insurance | 0 (0.0%) | 0 (0.0%) |
| Real Estate, Rental & Leasing | 0 (0.0%) | 0 (0.0%) |
| Professional & Scientific | 0 (0.0%) | 0 (0.0%) |
| Enterprise Management | 0 (0.0%) | 0 (0.0%) |
| Administrative & Support | 0 (0.0%) | 0 (0.0%) |
| Educational Services | 16 (53.3%) | 14 (46.7%) |
| Health Care & Social Assistance | 0 (0.0%) | 2 (100.0%) |
| Arts, Entertainment & Recreation | 0 (0.0%) | 0 (0.0%) |
| Accommodation & Food Services | 0 (0.0%) | 17 (100.0%) |
| Public Administration | 7 (100.0%) | 0 (0.0%) |
| Total | 44 (50.6%) | 43 (49.4%) |
Education in Seneca
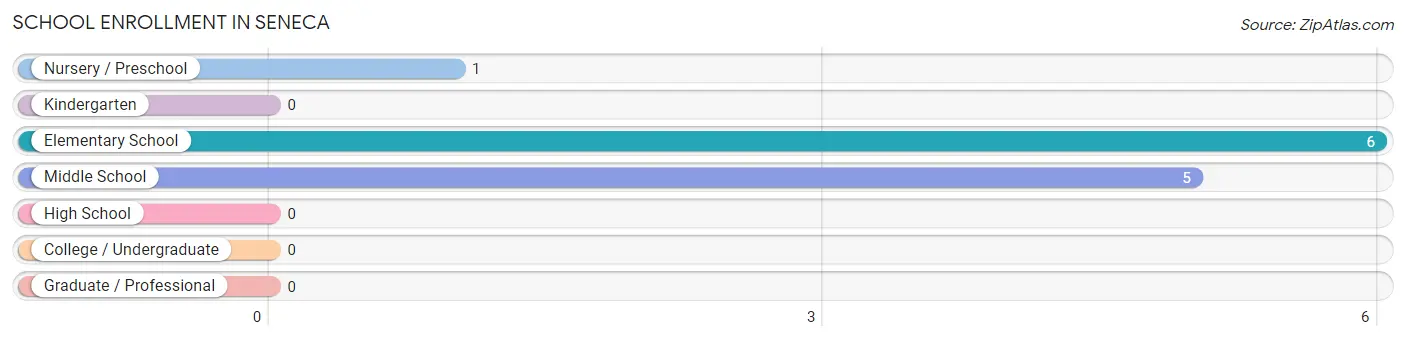
School Enrollment in Seneca
The most common levels of schooling among the 12 students in Seneca are elementary school (6 | 50.0%), middle school (5 | 41.7%), and nursery / preschool (1 | 8.3%).
| School Level | # Students | % Students |
| Nursery / Preschool | 1 | 8.3% |
| Kindergarten | 0 | 0.0% |
| Elementary School | 6 | 50.0% |
| Middle School | 5 | 41.7% |
| High School | 0 | 0.0% |
| College / Undergraduate | 0 | 0.0% |
| Graduate / Professional | 0 | 0.0% |
| Total | 12 | 100.0% |
School Enrollment by Age by Funding Source in Seneca
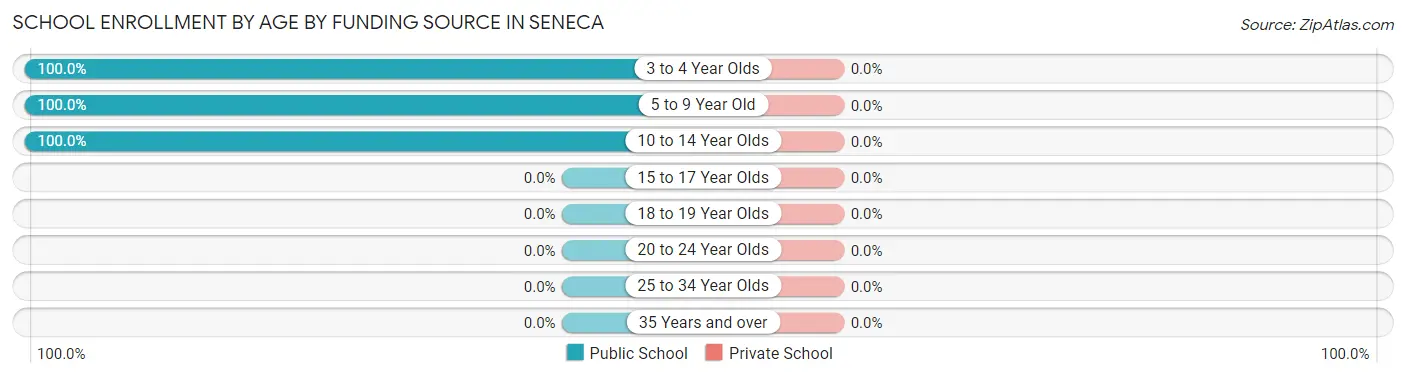
| Age Bracket | Public School | Private School |
| 3 to 4 Year Olds | 1 (100.0%) | 0 (0.0%) |
| 5 to 9 Year Old | 6 (100.0%) | 0 (0.0%) |
| 10 to 14 Year Olds | 5 (100.0%) | 0 (0.0%) |
| 15 to 17 Year Olds | 0 (0.0%) | 0 (0.0%) |
| 18 to 19 Year Olds | 0 (0.0%) | 0 (0.0%) |
| 20 to 24 Year Olds | 0 (0.0%) | 0 (0.0%) |
| 25 to 34 Year Olds | 0 (0.0%) | 0 (0.0%) |
| 35 Years and over | 0 (0.0%) | 0 (0.0%) |
| Total | 12 (100.0%) | 0 (0.0%) |
Educational Attainment by Field of Study in Seneca
Bio, nature & agricultural (5 | 29.4%), physical & health sciences (4 | 23.5%), science & technology (4 | 23.5%), and business (4 | 23.5%) are the most common fields of study among 17 individuals in Seneca who have obtained a bachelor's degree or higher.
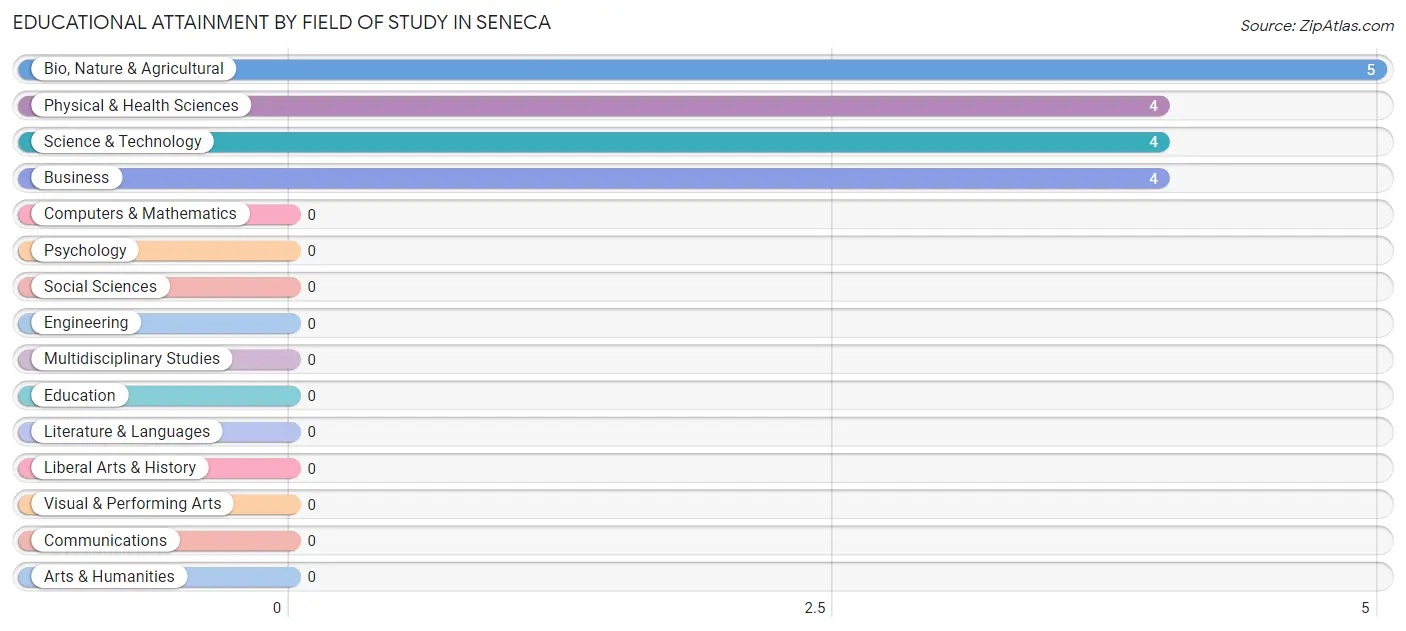
| Field of Study | # Graduates | % Graduates |
| Computers & Mathematics | 0 | 0.0% |
| Bio, Nature & Agricultural | 5 | 29.4% |
| Physical & Health Sciences | 4 | 23.5% |
| Psychology | 0 | 0.0% |
| Social Sciences | 0 | 0.0% |
| Engineering | 0 | 0.0% |
| Multidisciplinary Studies | 0 | 0.0% |
| Science & Technology | 4 | 23.5% |
| Business | 4 | 23.5% |
| Education | 0 | 0.0% |
| Literature & Languages | 0 | 0.0% |
| Liberal Arts & History | 0 | 0.0% |
| Visual & Performing Arts | 0 | 0.0% |
| Communications | 0 | 0.0% |
| Arts & Humanities | 0 | 0.0% |
| Total | 17 | 100.0% |
Transportation & Commute in Seneca
Vehicle Availability by Sex in Seneca
The most prevalent vehicle ownership categories in Seneca are males with 4 vehicles (24, accounting for 54.5%) and females with 4 vehicles (14, making up 58.5%).
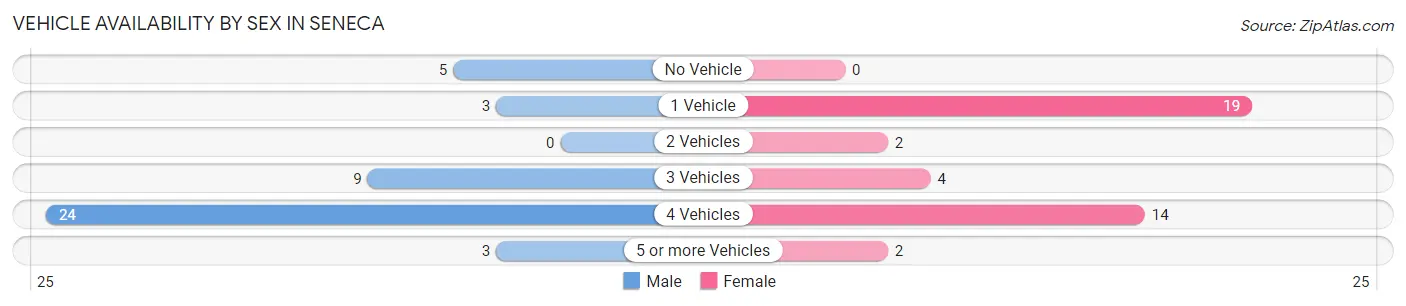
| Vehicles Available | Male | Female |
| No Vehicle | 5 (11.4%) | 0 (0.0%) |
| 1 Vehicle | 3 (6.8%) | 19 (46.3%) |
| 2 Vehicles | 0 (0.0%) | 2 (4.9%) |
| 3 Vehicles | 9 (20.4%) | 4 (9.8%) |
| 4 Vehicles | 24 (54.5%) | 14 (34.2%) |
| 5 or more Vehicles | 3 (6.8%) | 2 (4.9%) |
| Total | 44 (100.0%) | 41 (100.0%) |
Commute Time in Seneca
The most frequently occuring commute durations in Seneca are less than 5 minutes (26 commuters, 30.6%), 30 to 34 minutes (17 commuters, 20.0%), and 10 to 14 minutes (10 commuters, 11.8%).
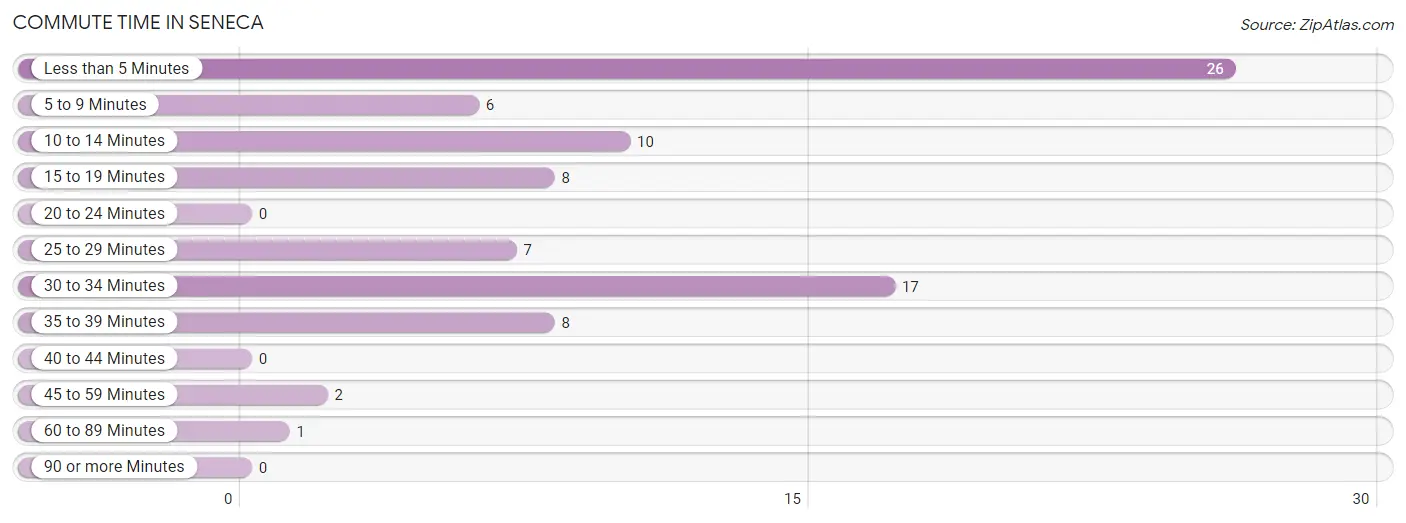
| Commute Time | # Commuters | % Commuters |
| Less than 5 Minutes | 26 | 30.6% |
| 5 to 9 Minutes | 6 | 7.1% |
| 10 to 14 Minutes | 10 | 11.8% |
| 15 to 19 Minutes | 8 | 9.4% |
| 20 to 24 Minutes | 0 | 0.0% |
| 25 to 29 Minutes | 7 | 8.2% |
| 30 to 34 Minutes | 17 | 20.0% |
| 35 to 39 Minutes | 8 | 9.4% |
| 40 to 44 Minutes | 0 | 0.0% |
| 45 to 59 Minutes | 2 | 2.4% |
| 60 to 89 Minutes | 1 | 1.2% |
| 90 or more Minutes | 0 | 0.0% |
Commute Time by Sex in Seneca
The most common commute times in Seneca are less than 5 minutes (12 commuters, 27.3%) for males and less than 5 minutes (14 commuters, 34.2%) for females.
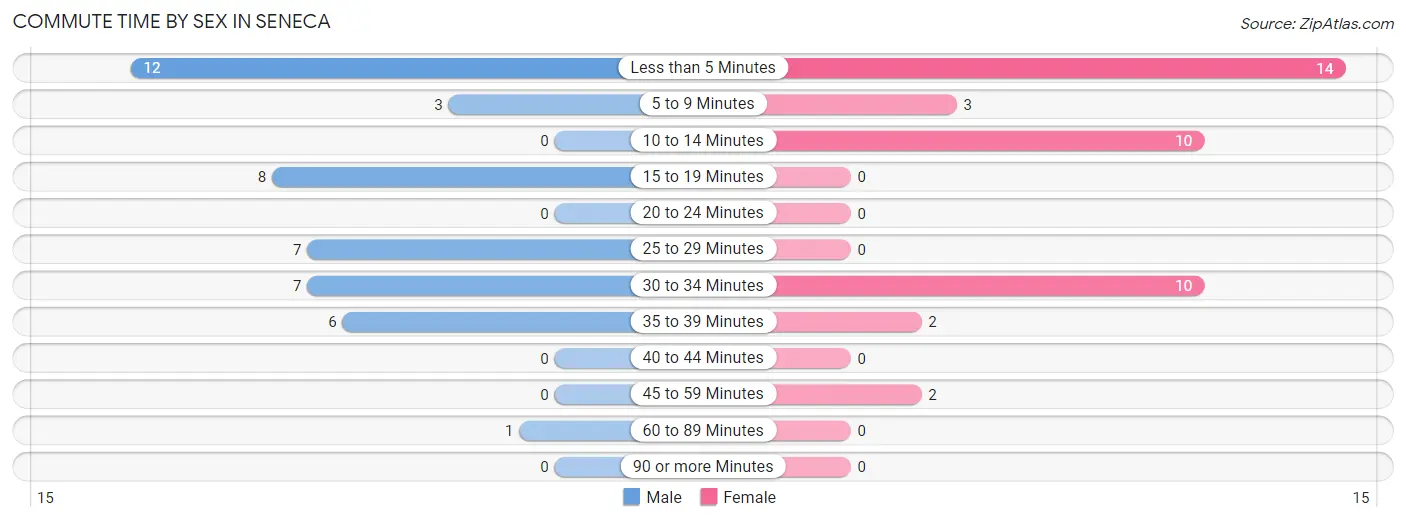
| Commute Time | Male | Female |
| Less than 5 Minutes | 12 (27.3%) | 14 (34.2%) |
| 5 to 9 Minutes | 3 (6.8%) | 3 (7.3%) |
| 10 to 14 Minutes | 0 (0.0%) | 10 (24.4%) |
| 15 to 19 Minutes | 8 (18.2%) | 0 (0.0%) |
| 20 to 24 Minutes | 0 (0.0%) | 0 (0.0%) |
| 25 to 29 Minutes | 7 (15.9%) | 0 (0.0%) |
| 30 to 34 Minutes | 7 (15.9%) | 10 (24.4%) |
| 35 to 39 Minutes | 6 (13.6%) | 2 (4.9%) |
| 40 to 44 Minutes | 0 (0.0%) | 0 (0.0%) |
| 45 to 59 Minutes | 0 (0.0%) | 2 (4.9%) |
| 60 to 89 Minutes | 1 (2.3%) | 0 (0.0%) |
| 90 or more Minutes | 0 (0.0%) | 0 (0.0%) |
Time of Departure to Work by Sex in Seneca
The most frequent times of departure to work in Seneca are 7:00 AM to 7:29 AM (16, 36.4%) for males and 9:00 AM to 9:59 AM (18, 43.9%) for females.
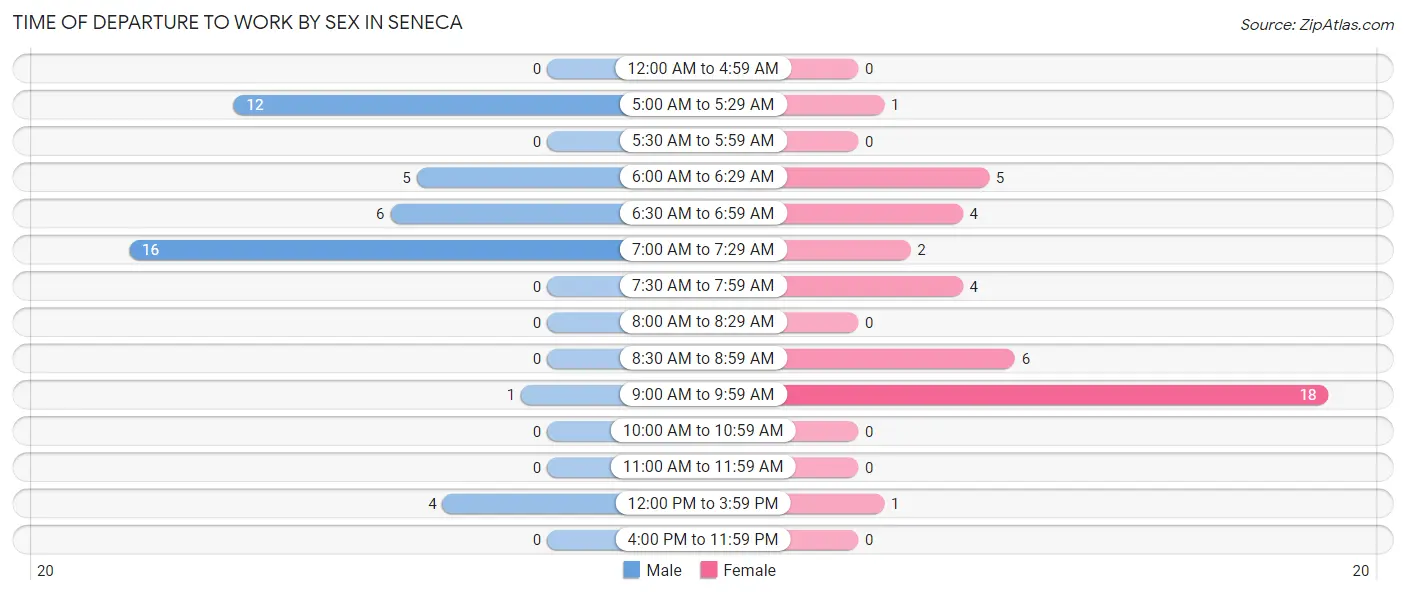
| Time of Departure | Male | Female |
| 12:00 AM to 4:59 AM | 0 (0.0%) | 0 (0.0%) |
| 5:00 AM to 5:29 AM | 12 (27.3%) | 1 (2.4%) |
| 5:30 AM to 5:59 AM | 0 (0.0%) | 0 (0.0%) |
| 6:00 AM to 6:29 AM | 5 (11.4%) | 5 (12.2%) |
| 6:30 AM to 6:59 AM | 6 (13.6%) | 4 (9.8%) |
| 7:00 AM to 7:29 AM | 16 (36.4%) | 2 (4.9%) |
| 7:30 AM to 7:59 AM | 0 (0.0%) | 4 (9.8%) |
| 8:00 AM to 8:29 AM | 0 (0.0%) | 0 (0.0%) |
| 8:30 AM to 8:59 AM | 0 (0.0%) | 6 (14.6%) |
| 9:00 AM to 9:59 AM | 1 (2.3%) | 18 (43.9%) |
| 10:00 AM to 10:59 AM | 0 (0.0%) | 0 (0.0%) |
| 11:00 AM to 11:59 AM | 0 (0.0%) | 0 (0.0%) |
| 12:00 PM to 3:59 PM | 4 (9.1%) | 1 (2.4%) |
| 4:00 PM to 11:59 PM | 0 (0.0%) | 0 (0.0%) |
| Total | 44 (100.0%) | 41 (100.0%) |
Housing Occupancy in Seneca
Occupancy by Ownership in Seneca
Of the total 94 dwellings in Seneca, owner-occupied units account for 73 (77.7%), while renter-occupied units make up 21 (22.3%).
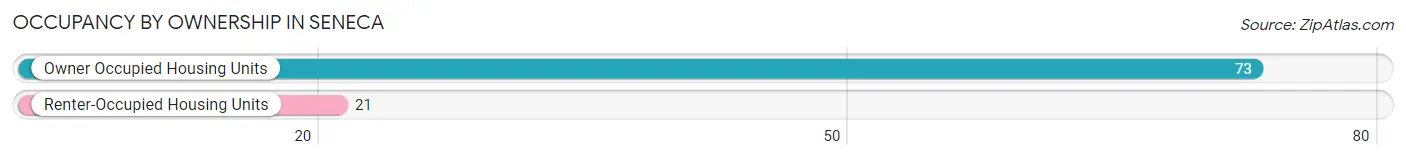
| Occupancy | # Housing Units | % Housing Units |
| Owner Occupied Housing Units | 73 | 77.7% |
| Renter-Occupied Housing Units | 21 | 22.3% |
| Total Occupied Housing Units | 94 | 100.0% |
Occupancy by Household Size in Seneca
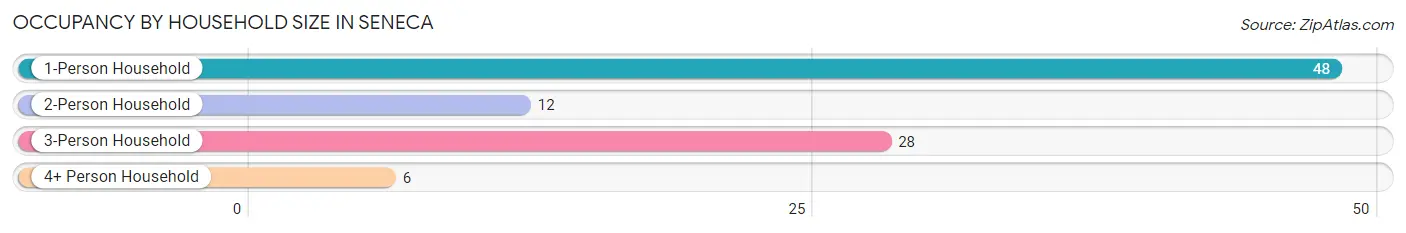
| Household Size | # Housing Units | % Housing Units |
| 1-Person Household | 48 | 51.1% |
| 2-Person Household | 12 | 12.8% |
| 3-Person Household | 28 | 29.8% |
| 4+ Person Household | 6 | 6.4% |
| Total Housing Units | 94 | 100.0% |
Occupancy by Ownership by Household Size in Seneca
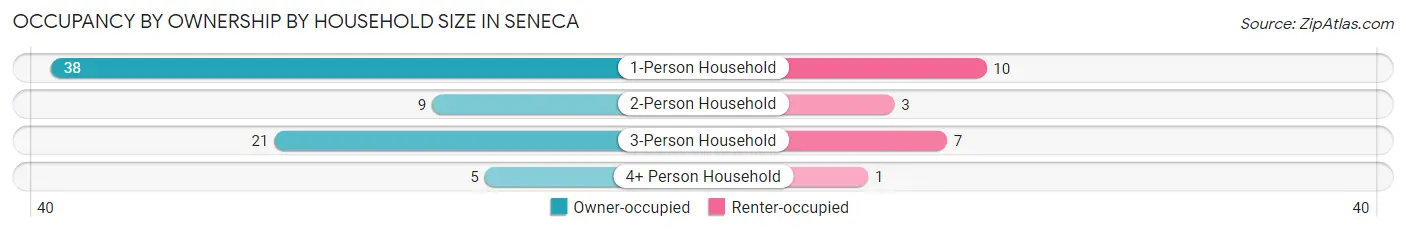
| Household Size | Owner-occupied | Renter-occupied |
| 1-Person Household | 38 (79.2%) | 10 (20.8%) |
| 2-Person Household | 9 (75.0%) | 3 (25.0%) |
| 3-Person Household | 21 (75.0%) | 7 (25.0%) |
| 4+ Person Household | 5 (83.3%) | 1 (16.7%) |
| Total Housing Units | 73 (77.7%) | 21 (22.3%) |
Occupancy by Educational Attainment in Seneca
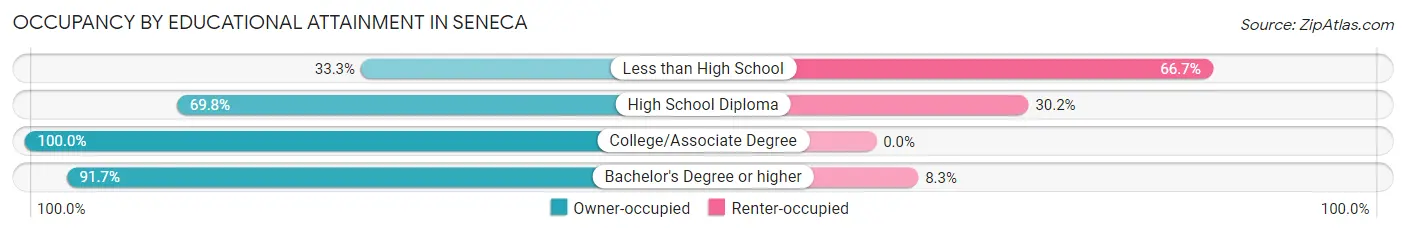
| Household Size | Owner-occupied | Renter-occupied |
| Less than High School | 2 (33.3%) | 4 (66.7%) |
| High School Diploma | 37 (69.8%) | 16 (30.2%) |
| College/Associate Degree | 23 (100.0%) | 0 (0.0%) |
| Bachelor's Degree or higher | 11 (91.7%) | 1 (8.3%) |
Occupancy by Age of Householder in Seneca
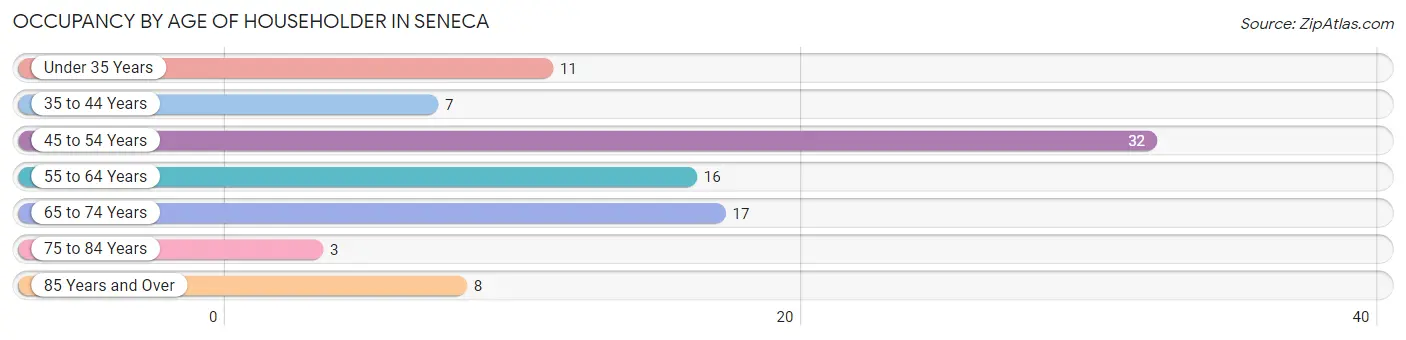
| Age Bracket | # Households | % Households |
| Under 35 Years | 11 | 11.7% |
| 35 to 44 Years | 7 | 7.4% |
| 45 to 54 Years | 32 | 34.0% |
| 55 to 64 Years | 16 | 17.0% |
| 65 to 74 Years | 17 | 18.1% |
| 75 to 84 Years | 3 | 3.2% |
| 85 Years and Over | 8 | 8.5% |
| Total | 94 | 100.0% |
Housing Finances in Seneca
Median Income by Occupancy in Seneca
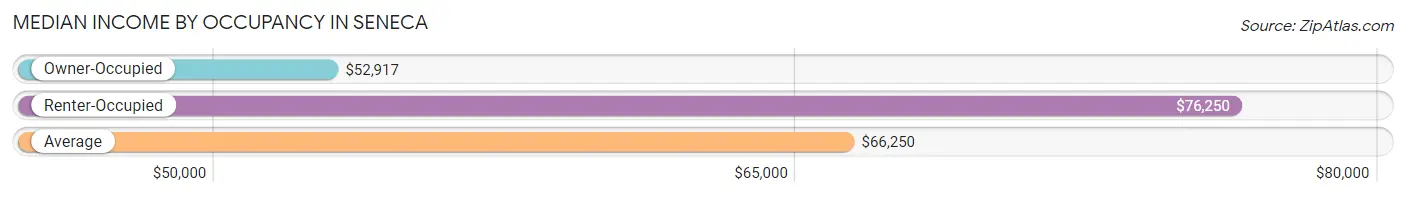
| Occupancy Type | # Households | Median Income |
| Owner-Occupied | 73 (77.7%) | $52,917 |
| Renter-Occupied | 21 (22.3%) | $76,250 |
| Average | 94 (100.0%) | $66,250 |
Occupancy by Householder Income Bracket in Seneca
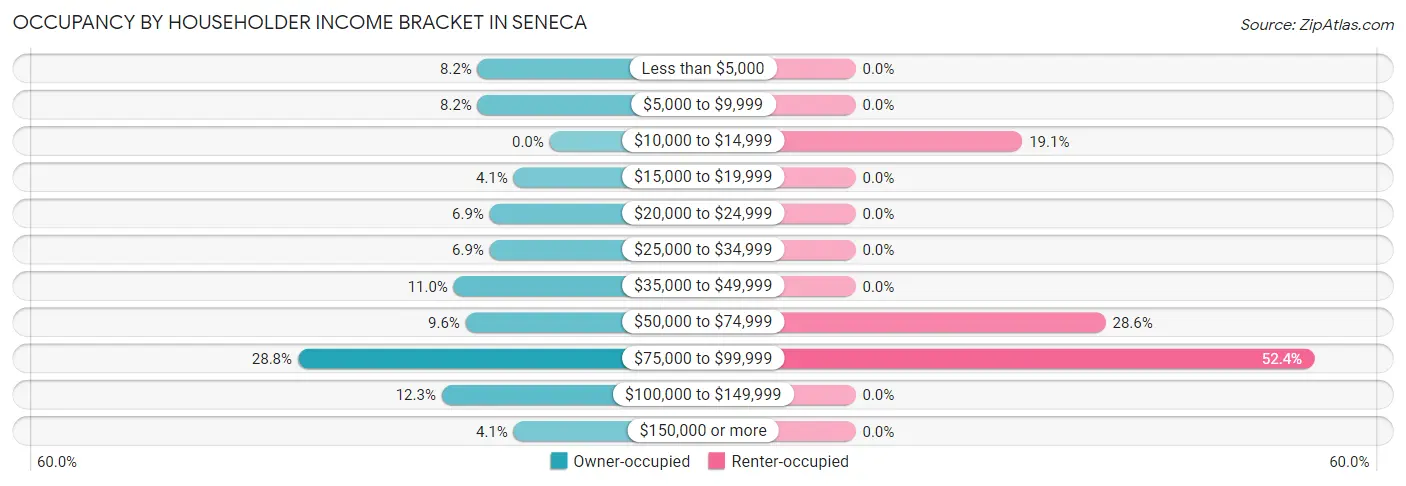
| Income Bracket | Owner-occupied | Renter-occupied |
| Less than $5,000 | 6 (8.2%) | 0 (0.0%) |
| $5,000 to $9,999 | 6 (8.2%) | 0 (0.0%) |
| $10,000 to $14,999 | 0 (0.0%) | 4 (19.1%) |
| $15,000 to $19,999 | 3 (4.1%) | 0 (0.0%) |
| $20,000 to $24,999 | 5 (6.9%) | 0 (0.0%) |
| $25,000 to $34,999 | 5 (6.9%) | 0 (0.0%) |
| $35,000 to $49,999 | 8 (11.0%) | 0 (0.0%) |
| $50,000 to $74,999 | 7 (9.6%) | 6 (28.6%) |
| $75,000 to $99,999 | 21 (28.8%) | 11 (52.4%) |
| $100,000 to $149,999 | 9 (12.3%) | 0 (0.0%) |
| $150,000 or more | 3 (4.1%) | 0 (0.0%) |
| Total | 73 (100.0%) | 21 (100.0%) |
Monthly Housing Cost Tiers in Seneca
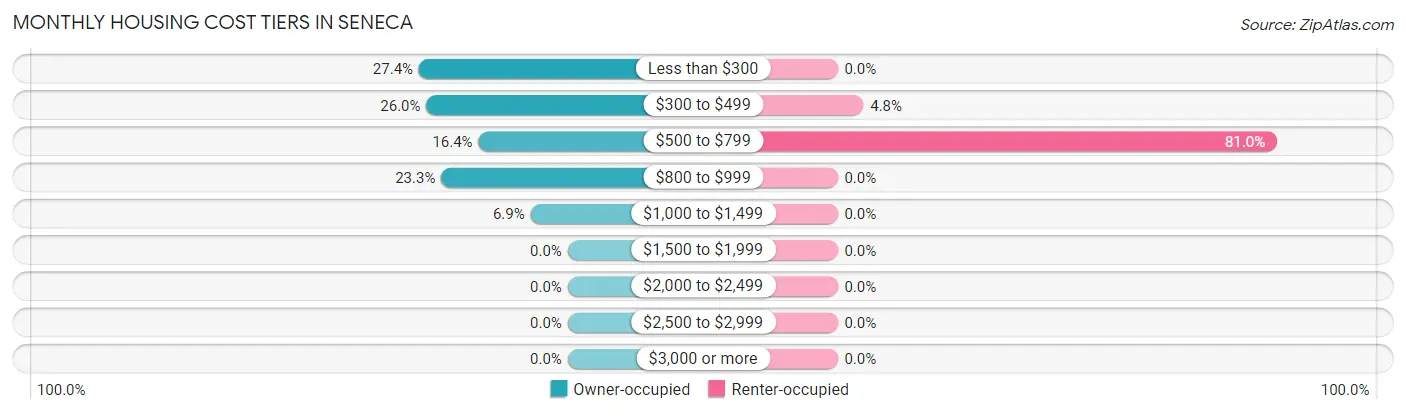
| Monthly Cost | Owner-occupied | Renter-occupied |
| Less than $300 | 20 (27.4%) | 0 (0.0%) |
| $300 to $499 | 19 (26.0%) | 1 (4.8%) |
| $500 to $799 | 12 (16.4%) | 17 (80.9%) |
| $800 to $999 | 17 (23.3%) | 0 (0.0%) |
| $1,000 to $1,499 | 5 (6.9%) | 0 (0.0%) |
| $1,500 to $1,999 | 0 (0.0%) | 0 (0.0%) |
| $2,000 to $2,499 | 0 (0.0%) | 0 (0.0%) |
| $2,500 to $2,999 | 0 (0.0%) | 0 (0.0%) |
| $3,000 or more | 0 (0.0%) | 0 (0.0%) |
| Total | 73 (100.0%) | 21 (100.0%) |
Physical Housing Characteristics in Seneca
Housing Structures in Seneca
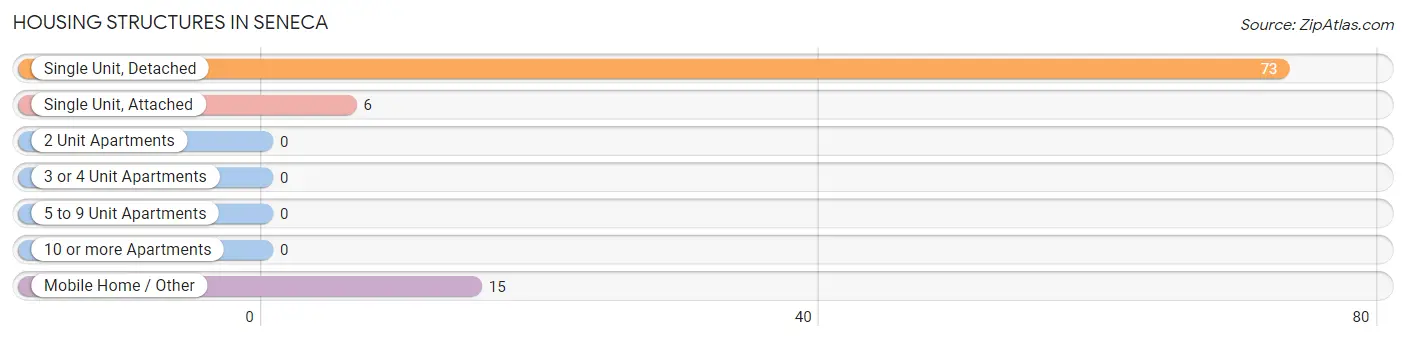
| Structure Type | # Housing Units | % Housing Units |
| Single Unit, Detached | 73 | 77.7% |
| Single Unit, Attached | 6 | 6.4% |
| 2 Unit Apartments | 0 | 0.0% |
| 3 or 4 Unit Apartments | 0 | 0.0% |
| 5 to 9 Unit Apartments | 0 | 0.0% |
| 10 or more Apartments | 0 | 0.0% |
| Mobile Home / Other | 15 | 16.0% |
| Total | 94 | 100.0% |
Housing Structures by Occupancy in Seneca
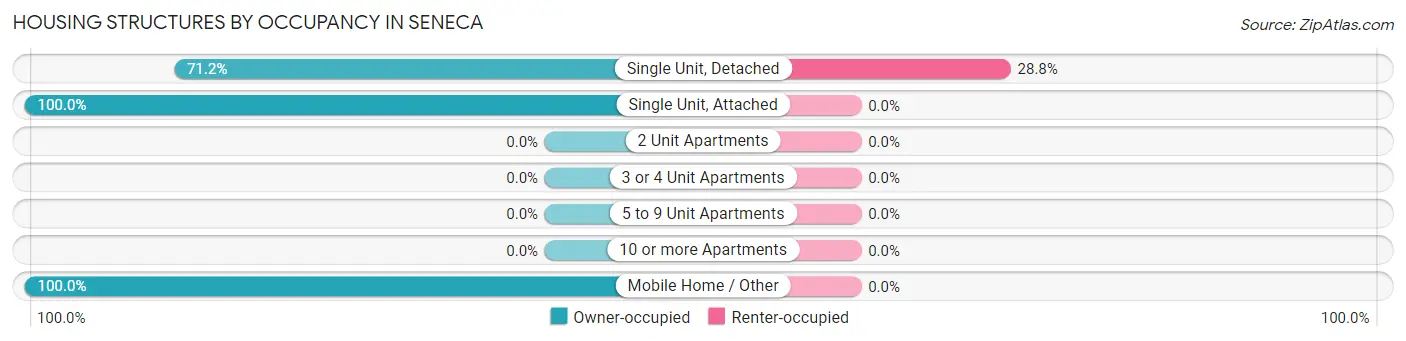
| Structure Type | Owner-occupied | Renter-occupied |
| Single Unit, Detached | 52 (71.2%) | 21 (28.8%) |
| Single Unit, Attached | 6 (100.0%) | 0 (0.0%) |
| 2 Unit Apartments | 0 (0.0%) | 0 (0.0%) |
| 3 or 4 Unit Apartments | 0 (0.0%) | 0 (0.0%) |
| 5 to 9 Unit Apartments | 0 (0.0%) | 0 (0.0%) |
| 10 or more Apartments | 0 (0.0%) | 0 (0.0%) |
| Mobile Home / Other | 15 (100.0%) | 0 (0.0%) |
| Total | 73 (77.7%) | 21 (22.3%) |
Housing Structures by Number of Rooms in Seneca
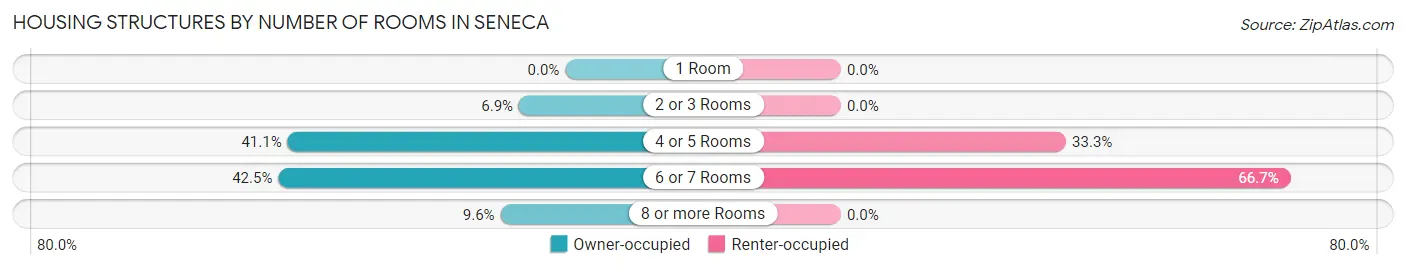
| Number of Rooms | Owner-occupied | Renter-occupied |
| 1 Room | 0 (0.0%) | 0 (0.0%) |
| 2 or 3 Rooms | 5 (6.9%) | 0 (0.0%) |
| 4 or 5 Rooms | 30 (41.1%) | 7 (33.3%) |
| 6 or 7 Rooms | 31 (42.5%) | 14 (66.7%) |
| 8 or more Rooms | 7 (9.6%) | 0 (0.0%) |
| Total | 73 (100.0%) | 21 (100.0%) |
Housing Structure by Heating Type in Seneca
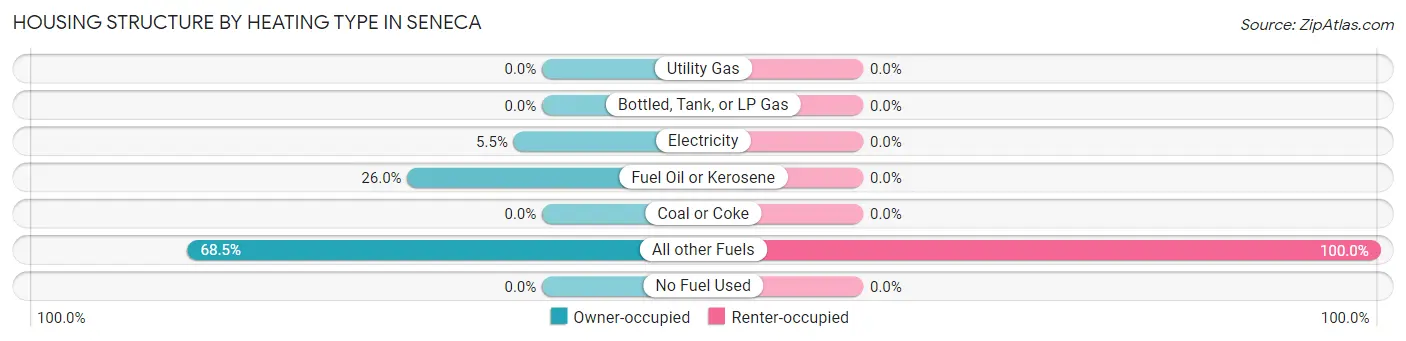
| Heating Type | Owner-occupied | Renter-occupied |
| Utility Gas | 0 (0.0%) | 0 (0.0%) |
| Bottled, Tank, or LP Gas | 0 (0.0%) | 0 (0.0%) |
| Electricity | 4 (5.5%) | 0 (0.0%) |
| Fuel Oil or Kerosene | 19 (26.0%) | 0 (0.0%) |
| Coal or Coke | 0 (0.0%) | 0 (0.0%) |
| All other Fuels | 50 (68.5%) | 21 (100.0%) |
| No Fuel Used | 0 (0.0%) | 0 (0.0%) |
| Total | 73 (100.0%) | 21 (100.0%) |
Household Vehicle Usage in Seneca
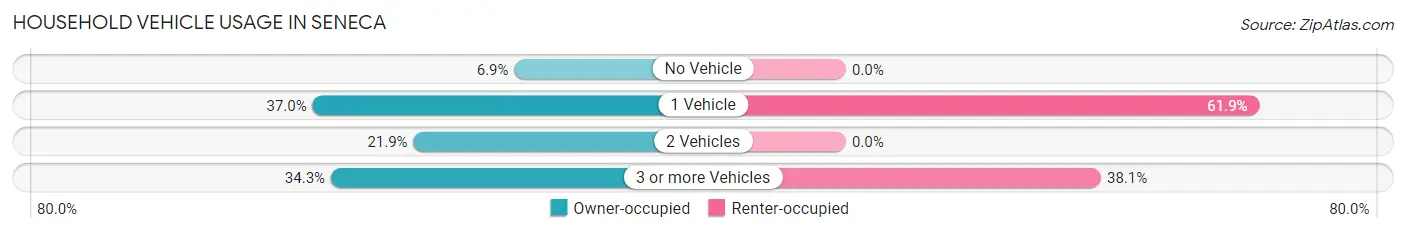
| Vehicles per Household | Owner-occupied | Renter-occupied |
| No Vehicle | 5 (6.9%) | 0 (0.0%) |
| 1 Vehicle | 27 (37.0%) | 13 (61.9%) |
| 2 Vehicles | 16 (21.9%) | 0 (0.0%) |
| 3 or more Vehicles | 25 (34.3%) | 8 (38.1%) |
| Total | 73 (100.0%) | 21 (100.0%) |
Real Estate & Mortgages in Seneca
Real Estate and Mortgage Overview in Seneca
| Characteristic | Without Mortgage | With Mortgage |
| Housing Units | 50 | 23 |
| Median Property Value | $77,500 | $96,500 |
| Median Household Income | $37,500 | $0 |
| Monthly Housing Costs | $319 | $0 |
| Real Estate Taxes | $669 | $0 |
Property Value by Mortgage Status in Seneca
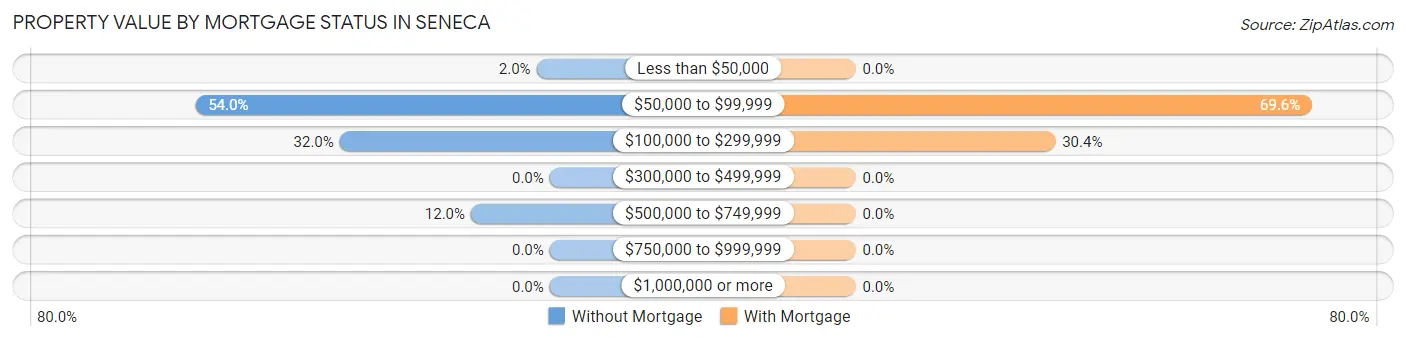
| Property Value | Without Mortgage | With Mortgage |
| Less than $50,000 | 1 (2.0%) | 0 (0.0%) |
| $50,000 to $99,999 | 27 (54.0%) | 16 (69.6%) |
| $100,000 to $299,999 | 16 (32.0%) | 7 (30.4%) |
| $300,000 to $499,999 | 0 (0.0%) | 0 (0.0%) |
| $500,000 to $749,999 | 6 (12.0%) | 0 (0.0%) |
| $750,000 to $999,999 | 0 (0.0%) | 0 (0.0%) |
| $1,000,000 or more | 0 (0.0%) | 0 (0.0%) |
| Total | 50 (100.0%) | 23 (100.0%) |
Household Income by Mortgage Status in Seneca
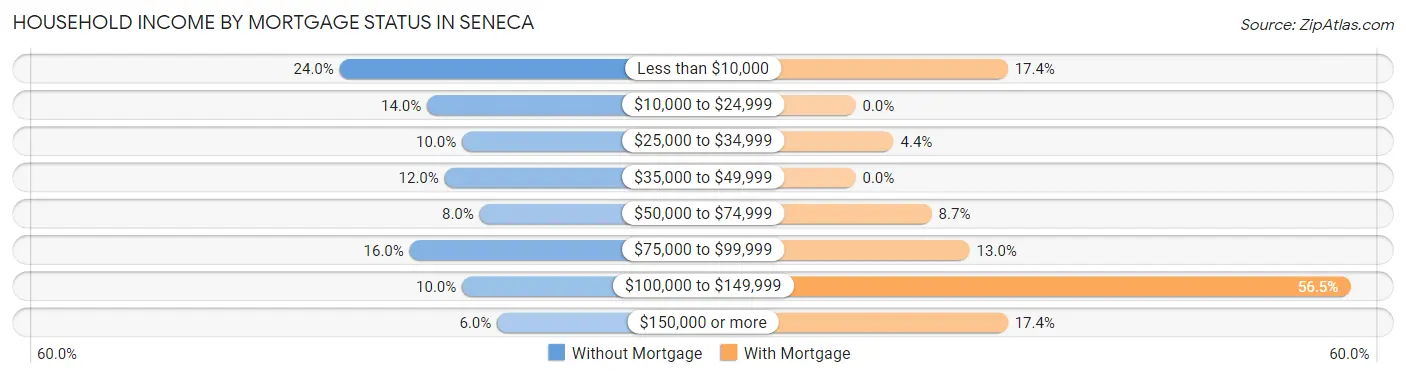
| Household Income | Without Mortgage | With Mortgage |
| Less than $10,000 | 12 (24.0%) | 4 (17.4%) |
| $10,000 to $24,999 | 7 (14.0%) | 0 (0.0%) |
| $25,000 to $34,999 | 5 (10.0%) | 1 (4.3%) |
| $35,000 to $49,999 | 6 (12.0%) | 0 (0.0%) |
| $50,000 to $74,999 | 4 (8.0%) | 2 (8.7%) |
| $75,000 to $99,999 | 8 (16.0%) | 3 (13.0%) |
| $100,000 to $149,999 | 5 (10.0%) | 13 (56.5%) |
| $150,000 or more | 3 (6.0%) | 4 (17.4%) |
| Total | 50 (100.0%) | 23 (100.0%) |
Property Value to Household Income Ratio in Seneca
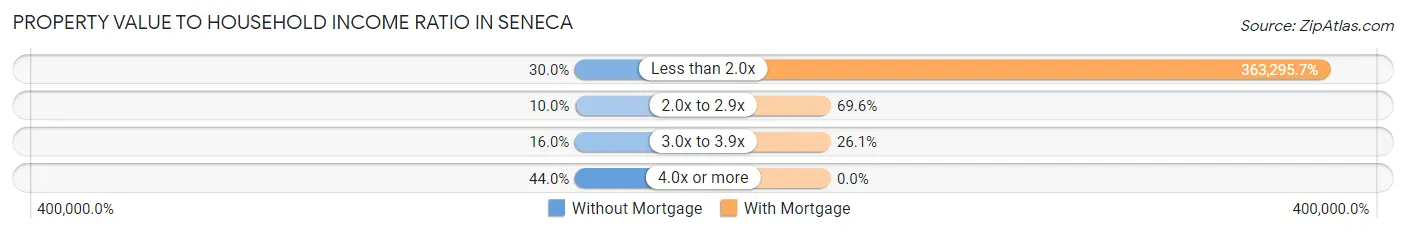
| Value-to-Income Ratio | Without Mortgage | With Mortgage |
| Less than 2.0x | 15 (30.0%) | 83,558 (363,295.6%) |
| 2.0x to 2.9x | 5 (10.0%) | 16 (69.6%) |
| 3.0x to 3.9x | 8 (16.0%) | 6 (26.1%) |
| 4.0x or more | 22 (44.0%) | 0 (0.0%) |
| Total | 50 (100.0%) | 23 (100.0%) |
Real Estate Taxes by Mortgage Status in Seneca
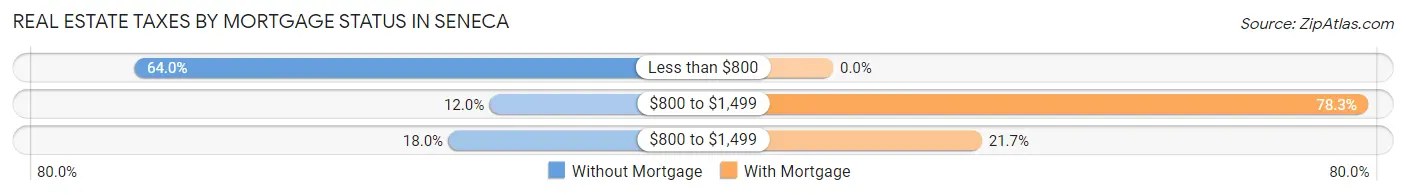
| Property Taxes | Without Mortgage | With Mortgage |
| Less than $800 | 32 (64.0%) | 0 (0.0%) |
| $800 to $1,499 | 6 (12.0%) | 18 (78.3%) |
| $800 to $1,499 | 9 (18.0%) | 5 (21.7%) |
| Total | 50 (100.0%) | 23 (100.0%) |
Health & Disability in Seneca
Health Insurance Coverage by Age in Seneca
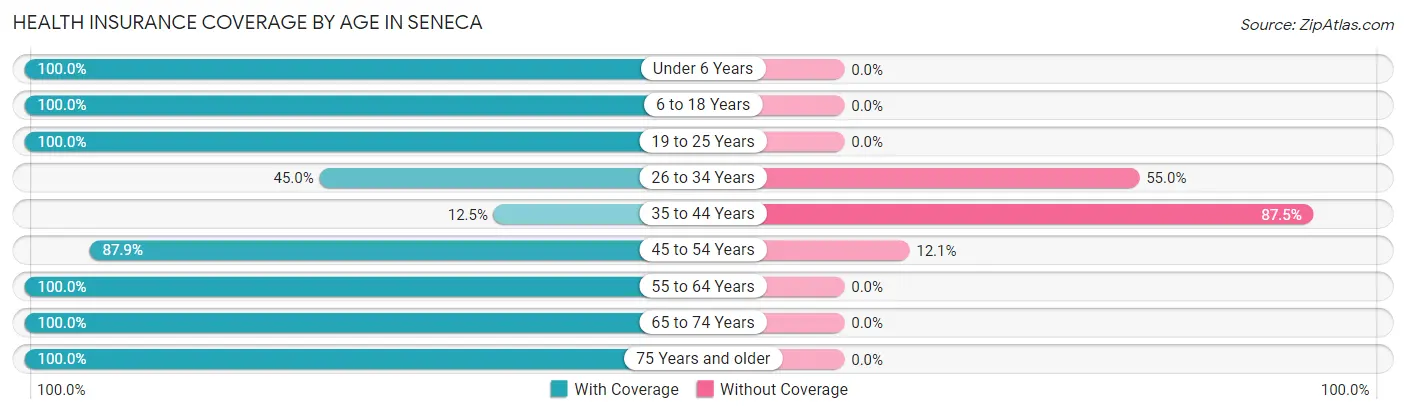
| Age Bracket | With Coverage | Without Coverage |
| Under 6 Years | 8 (100.0%) | 0 (0.0%) |
| 6 to 18 Years | 11 (100.0%) | 0 (0.0%) |
| 19 to 25 Years | 9 (100.0%) | 0 (0.0%) |
| 26 to 34 Years | 9 (45.0%) | 11 (55.0%) |
| 35 to 44 Years | 1 (12.5%) | 7 (87.5%) |
| 45 to 54 Years | 29 (87.9%) | 4 (12.1%) |
| 55 to 64 Years | 32 (100.0%) | 0 (0.0%) |
| 65 to 74 Years | 28 (100.0%) | 0 (0.0%) |
| 75 Years and older | 18 (100.0%) | 0 (0.0%) |
| Total | 145 (86.8%) | 22 (13.2%) |
Health Insurance Coverage by Citizenship Status in Seneca
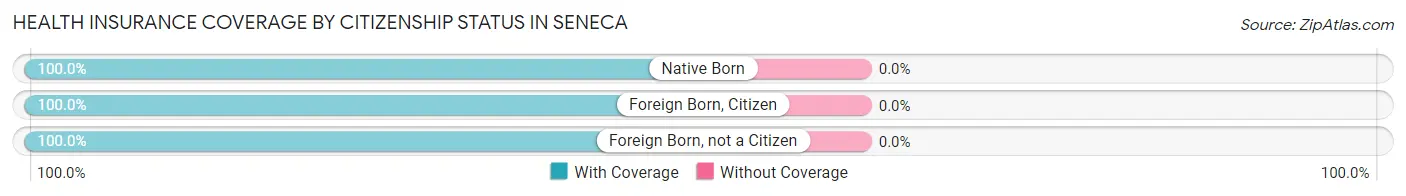
| Citizenship Status | With Coverage | Without Coverage |
| Native Born | 8 (100.0%) | 0 (0.0%) |
| Foreign Born, Citizen | 11 (100.0%) | 0 (0.0%) |
| Foreign Born, not a Citizen | 9 (100.0%) | 0 (0.0%) |
Health Insurance Coverage by Household Income in Seneca

| Household Income | With Coverage | Without Coverage |
| Under $25,000 | 26 (100.0%) | 0 (0.0%) |
| $25,000 to $49,999 | 17 (80.9%) | 4 (19.1%) |
| $50,000 to $74,999 | 23 (100.0%) | 0 (0.0%) |
| $75,000 to $99,999 | 66 (90.4%) | 7 (9.6%) |
| $100,000 and over | 13 (54.2%) | 11 (45.8%) |
Public vs Private Health Insurance Coverage by Age in Seneca
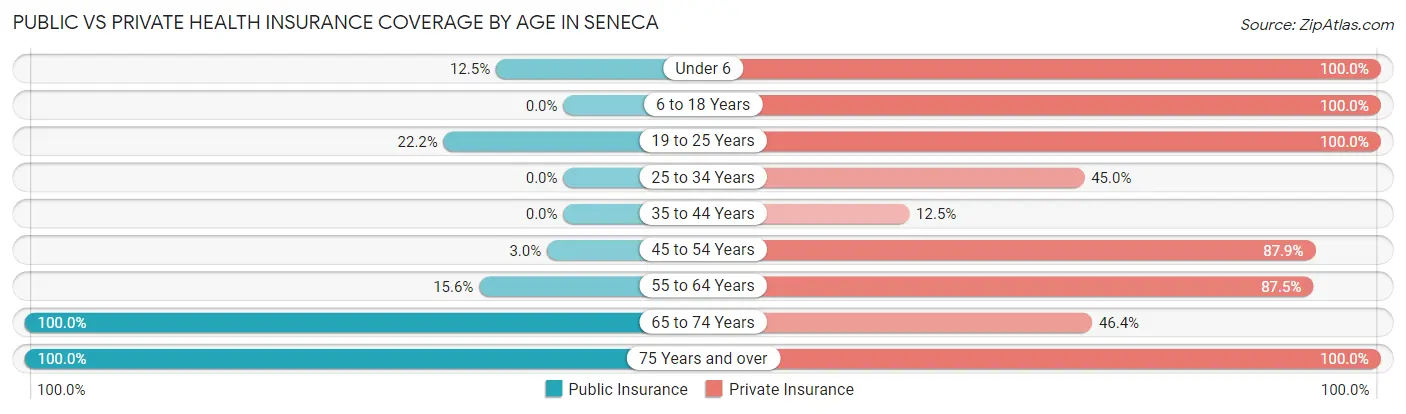
| Age Bracket | Public Insurance | Private Insurance |
| Under 6 | 1 (12.5%) | 8 (100.0%) |
| 6 to 18 Years | 0 (0.0%) | 11 (100.0%) |
| 19 to 25 Years | 2 (22.2%) | 9 (100.0%) |
| 25 to 34 Years | 0 (0.0%) | 9 (45.0%) |
| 35 to 44 Years | 0 (0.0%) | 1 (12.5%) |
| 45 to 54 Years | 1 (3.0%) | 29 (87.9%) |
| 55 to 64 Years | 5 (15.6%) | 28 (87.5%) |
| 65 to 74 Years | 28 (100.0%) | 13 (46.4%) |
| 75 Years and over | 18 (100.0%) | 18 (100.0%) |
| Total | 55 (32.9%) | 126 (75.4%) |
Disability Status by Sex by Age in Seneca
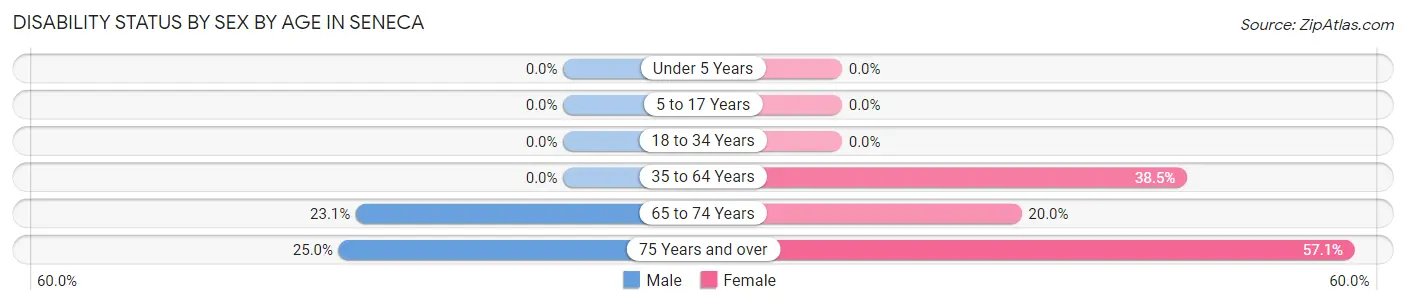
| Age Bracket | Male | Female |
| Under 5 Years | 0 (0.0%) | 0 (0.0%) |
| 5 to 17 Years | 0 (0.0%) | 0 (0.0%) |
| 18 to 34 Years | 0 (0.0%) | 0 (0.0%) |
| 35 to 64 Years | 0 (0.0%) | 15 (38.5%) |
| 65 to 74 Years | 3 (23.1%) | 3 (20.0%) |
| 75 Years and over | 1 (25.0%) | 8 (57.1%) |
Disability Class by Sex by Age in Seneca
Disability Class: Hearing Difficulty
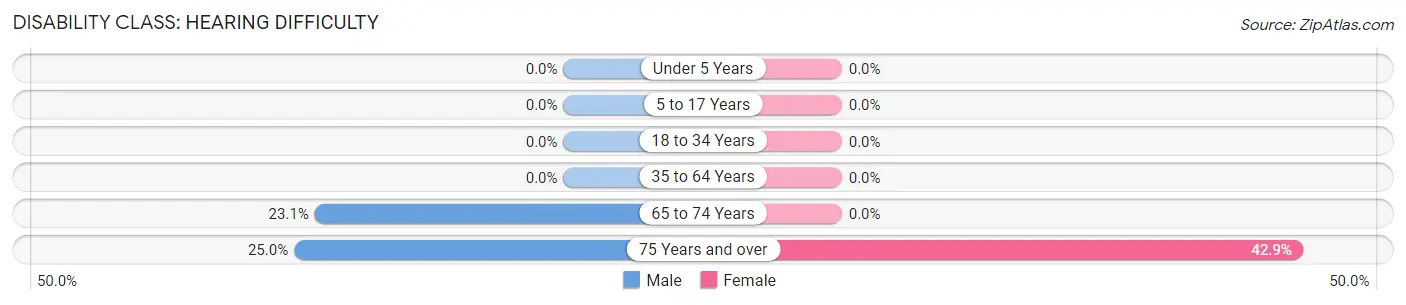
| Age Bracket | Male | Female |
| Under 5 Years | 0 (0.0%) | 0 (0.0%) |
| 5 to 17 Years | 0 (0.0%) | 0 (0.0%) |
| 18 to 34 Years | 0 (0.0%) | 0 (0.0%) |
| 35 to 64 Years | 0 (0.0%) | 0 (0.0%) |
| 65 to 74 Years | 3 (23.1%) | 0 (0.0%) |
| 75 Years and over | 1 (25.0%) | 6 (42.9%) |
Disability Class: Vision Difficulty
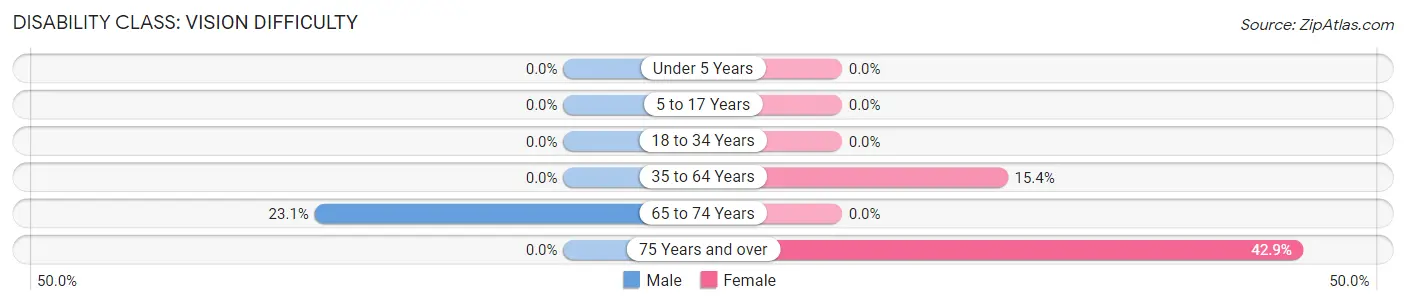
| Age Bracket | Male | Female |
| Under 5 Years | 0 (0.0%) | 0 (0.0%) |
| 5 to 17 Years | 0 (0.0%) | 0 (0.0%) |
| 18 to 34 Years | 0 (0.0%) | 0 (0.0%) |
| 35 to 64 Years | 0 (0.0%) | 6 (15.4%) |
| 65 to 74 Years | 3 (23.1%) | 0 (0.0%) |
| 75 Years and over | 0 (0.0%) | 6 (42.9%) |
Disability Class: Cognitive Difficulty
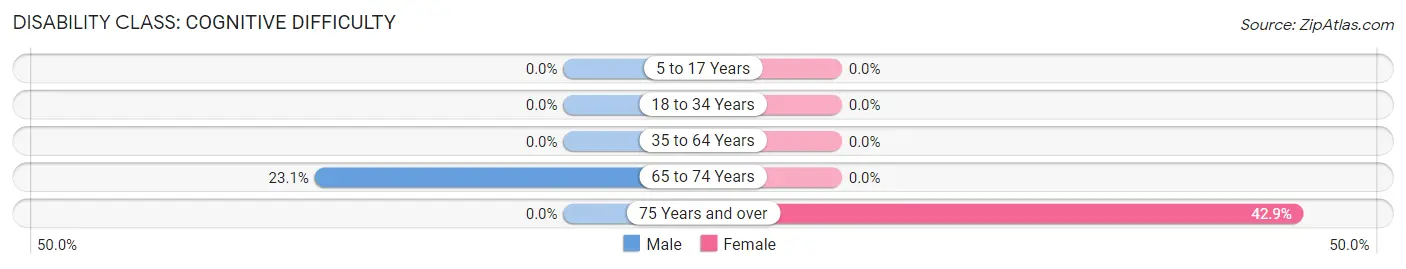
| Age Bracket | Male | Female |
| 5 to 17 Years | 0 (0.0%) | 0 (0.0%) |
| 18 to 34 Years | 0 (0.0%) | 0 (0.0%) |
| 35 to 64 Years | 0 (0.0%) | 0 (0.0%) |
| 65 to 74 Years | 3 (23.1%) | 0 (0.0%) |
| 75 Years and over | 0 (0.0%) | 6 (42.9%) |
Disability Class: Ambulatory Difficulty
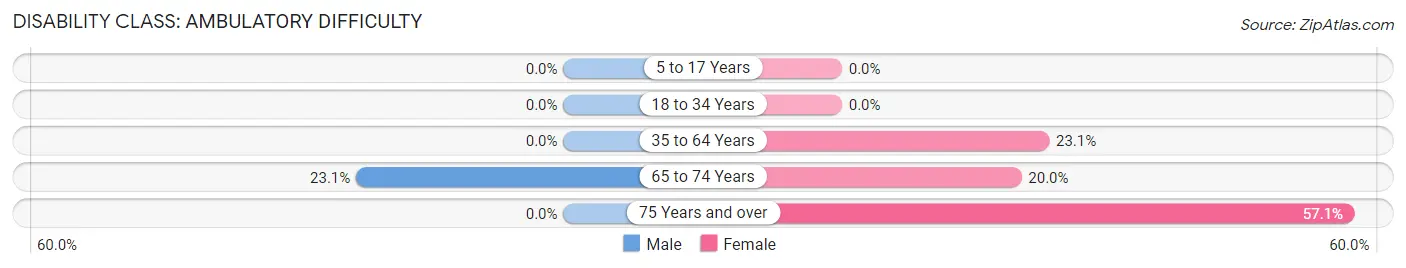
| Age Bracket | Male | Female |
| 5 to 17 Years | 0 (0.0%) | 0 (0.0%) |
| 18 to 34 Years | 0 (0.0%) | 0 (0.0%) |
| 35 to 64 Years | 0 (0.0%) | 9 (23.1%) |
| 65 to 74 Years | 3 (23.1%) | 3 (20.0%) |
| 75 Years and over | 0 (0.0%) | 8 (57.1%) |
Disability Class: Self-Care Difficulty

| Age Bracket | Male | Female |
| 5 to 17 Years | 0 (0.0%) | 0 (0.0%) |
| 18 to 34 Years | 0 (0.0%) | 0 (0.0%) |
| 35 to 64 Years | 0 (0.0%) | 1 (2.6%) |
| 65 to 74 Years | 3 (23.1%) | 0 (0.0%) |
| 75 Years and over | 0 (0.0%) | 6 (42.9%) |
Technology Access in Seneca
Computing Device Access in Seneca
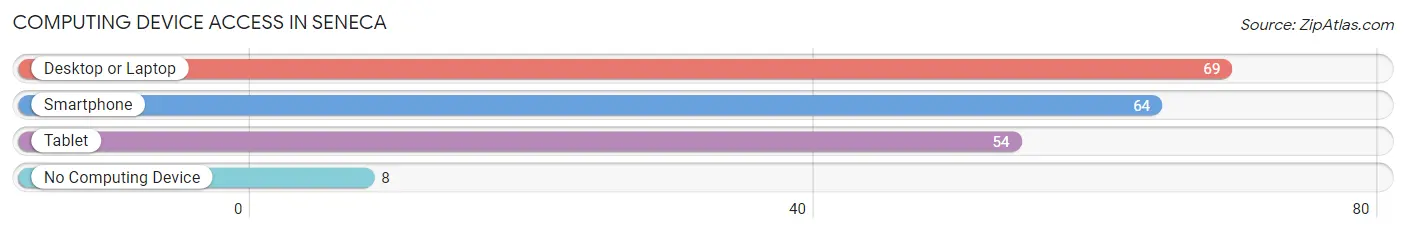
| Device Type | # Households | % Households |
| Desktop or Laptop | 69 | 73.4% |
| Smartphone | 64 | 68.1% |
| Tablet | 54 | 57.5% |
| No Computing Device | 8 | 8.5% |
| Total | 94 | 100.0% |
Internet Access in Seneca
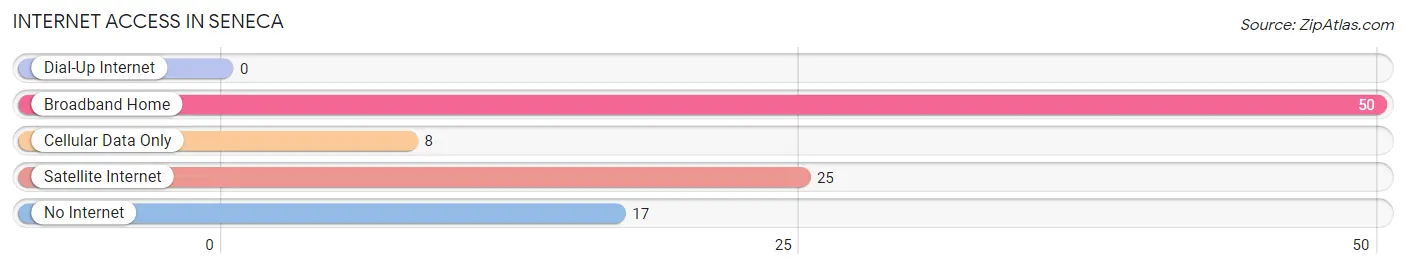
| Internet Type | # Households | % Households |
| Dial-Up Internet | 0 | 0.0% |
| Broadband Home | 50 | 53.2% |
| Cellular Data Only | 8 | 8.5% |
| Satellite Internet | 25 | 26.6% |
| No Internet | 17 | 18.1% |
| Total | 94 | 100.0% |
Seneca Summary
Seneca, Oregon is a small city located in the northeastern corner of the state, in the Blue Mountains region. It is situated in the Umatilla County, and is part of the Pendleton-Hermiston Micropolitan Statistical Area. The city has a population of 1,845 people, according to the 2010 census.
History
The area that is now Seneca was first settled in the late 1800s by homesteaders. The city was officially incorporated in 1910, and was named after the nearby Seneca Indian Reservation. The city was originally a logging and farming community, and the economy was largely based on these industries.
In the early 1900s, the city was home to a number of sawmills and lumber mills, as well as a number of other businesses. The city was also home to a number of churches, schools, and other civic organizations.
In the 1950s, the city began to experience a decline in its economy, as the logging industry began to decline. This led to a decrease in population, and the city began to experience a period of stagnation.
In the late 1970s, the city began to experience a resurgence, as the economy began to diversify. The city began to attract new businesses, and the population began to grow again.
Geography
Seneca is located in the northeastern corner of Oregon, in the Blue Mountains region. The city is situated in the Umatilla County, and is part of the Pendleton-Hermiston Micropolitan Statistical Area.
The city is located at an elevation of 1,845 feet, and is situated on the banks of the Umatilla River. The city is surrounded by rolling hills and mountains, and is located near the Umatilla National Forest.
The climate in Seneca is semi-arid, with hot summers and cold winters. The average annual temperature is around 50 degrees Fahrenheit, and the average annual precipitation is around 12 inches.
Economy
The economy of Seneca is largely based on agriculture and tourism. The city is home to a number of farms, and the surrounding area is known for its production of wheat, barley, and other grains.
The city is also home to a number of businesses, including a number of restaurants, retail stores, and other services. The city is also home to a number of manufacturing companies, including a number of wood products companies.
The city is also home to a number of tourist attractions, including the Umatilla National Forest, the Pendleton Round-Up, and the Pendleton Woolen Mills. The city is also home to a number of festivals and events, including the Seneca Summer Festival and the Seneca Fall Festival.
Demographics
According to the 2010 census, the population of Seneca was 1,845 people. The population is largely white, with a small percentage of African Americans, Native Americans, and other races. The median age of the population is 39.7 years, and the median household income is $37,941.
The city is home to a number of churches, including the First Baptist Church, the Church of Jesus Christ of Latter-day Saints, and the United Methodist Church. The city is also home to a number of schools, including the Seneca Elementary School, the Seneca Middle School, and the Seneca High School.
Conclusion
Seneca, Oregon is a small city located in the northeastern corner of the state, in the Blue Mountains region. The city has a population of 1,845 people, according to the 2010 census. The economy of Seneca is largely based on agriculture and tourism, and the city is home to a number of businesses, churches, and schools. The city is also home to a number of tourist attractions, including the Umatilla National Forest, the Pendleton Round-Up, and the Pendleton Woolen Mills.
Common Questions
What is the Total Population of Seneca?
Total Population of Seneca is 167.
What is the Total Male Population of Seneca?
Total Male Population of Seneca is 73.
What is the Total Female Population of Seneca?
Total Female Population of Seneca is 94.
What is the Ratio of Males per 100 Females in Seneca?
There are 77.66 Males per 100 Females in Seneca.
What is the Ratio of Females per 100 Males in Seneca?
There are 128.77 Females per 100 Males in Seneca.
What is the Median Population Age in Seneca?
Median Population Age in Seneca is 54.6 Years.
What is the Average Family Size in Seneca
Average Family Size in Seneca is 2.6 People.
What is the Average Household Size in Seneca
Average Household Size in Seneca is 1.8 People.
What is Per Capita Income in Seneca?
Per Capita income in Seneca is $32,130.
What is the Median Family Income in Seneca?
Median Family Income in Seneca is $82,596.
What is the Median Household income in Seneca?
Median Household Income in Seneca is $66,250.
What is Income or Wage Gap in Seneca?
Income or Wage Gap in Seneca is 5.2%.
Women in Seneca earn 94.8 cents for every dollar earned by a man.
What is Inequality or Gini Index in Seneca?
Inequality or Gini Index in Seneca is 0.37.
How Large is the Labor Force in Seneca?
There are 87 People in the Labor Forcein in Seneca.
What is the Percentage of People in the Labor Force in Seneca?
58.8% of People are in the Labor Force in Seneca.