Odell, OR
Odell Map
Odell Overview
3,003
TOTAL POPULATION
1,440
MALE POPULATION
1,563
FEMALE POPULATION
92.13
MALES / 100 FEMALES
108.54
FEMALES / 100 MALES
26.8
MEDIAN AGE
4.3
AVG FAMILY SIZE
3.9
AVG HOUSEHOLD SIZE
$23,596
PER CAPITA INCOME
$84,241
AVG FAMILY INCOME
$82,768
AVG HOUSEHOLD INCOME
13.4%
WAGE / INCOME GAP [ % ]
86.6¢/ $1
WAGE / INCOME GAP [ $ ]
0.33
INEQUALITY / GINI INDEX
1,584
LABOR FORCE [ PEOPLE ]
78.2%
PERCENT IN LABOR FORCE
4.8%
UNEMPLOYMENT RATE
Odell Area Codes
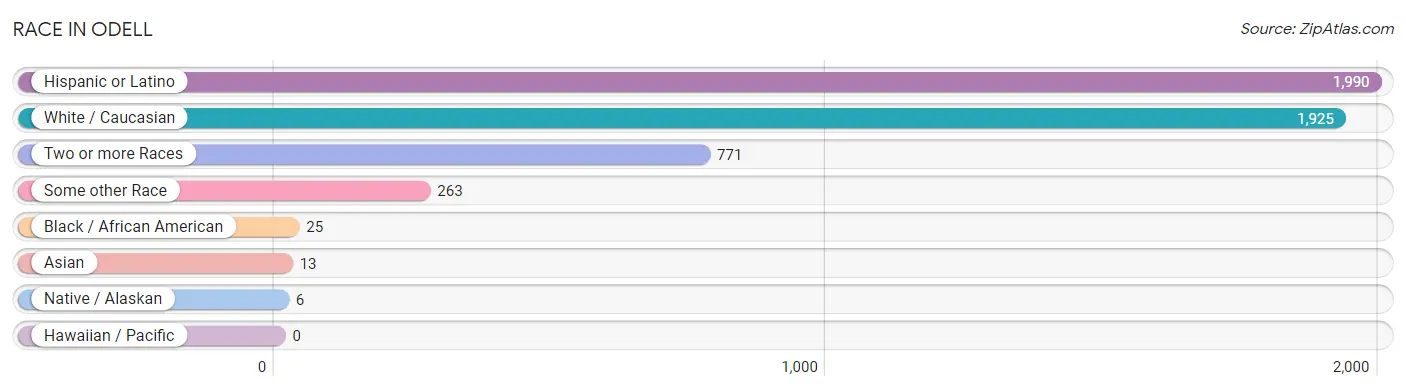
Race in Odell
The most populous races in Odell are Hispanic or Latino (1,990 | 66.3%), White / Caucasian (1,925 | 64.1%), and Two or more Races (771 | 25.7%).
| Race | # Population | % Population |
| Asian | 13 | 0.4% |
| Black / African American | 25 | 0.8% |
| Hawaiian / Pacific | 0 | 0.0% |
| Hispanic or Latino | 1,990 | 66.3% |
| Native / Alaskan | 6 | 0.2% |
| White / Caucasian | 1,925 | 64.1% |
| Two or more Races | 771 | 25.7% |
| Some other Race | 263 | 8.8% |
| Total | 3,003 | 100.0% |
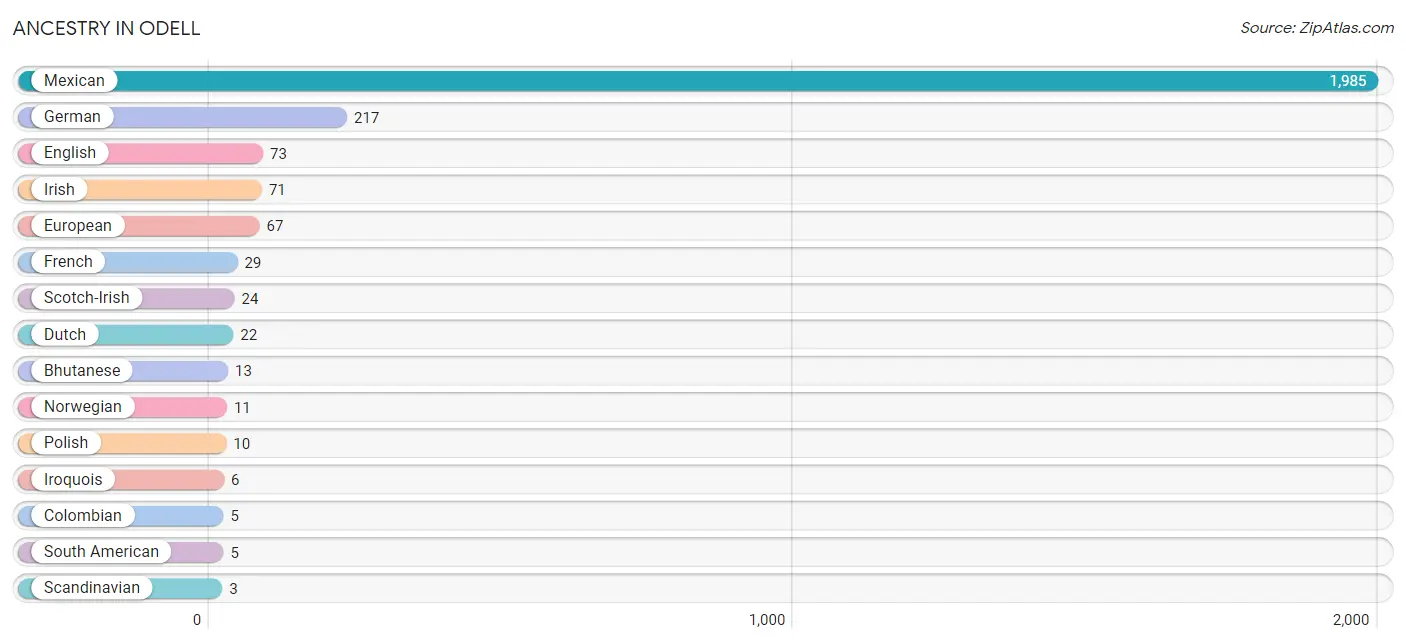
Ancestry in Odell
The most populous ancestries reported in Odell are Mexican (1,985 | 66.1%), German (217 | 7.2%), English (73 | 2.4%), Irish (71 | 2.4%), and European (67 | 2.2%), together accounting for 80.3% of all Odell residents.
| Ancestry | # Population | % Population |
| Bhutanese | 13 | 0.4% |
| Colombian | 5 | 0.2% |
| Dutch | 22 | 0.7% |
| English | 73 | 2.4% |
| European | 67 | 2.2% |
| French | 29 | 1.0% |
| German | 217 | 7.2% |
| Irish | 71 | 2.4% |
| Iroquois | 6 | 0.2% |
| Mexican | 1,985 | 66.1% |
| Norwegian | 11 | 0.4% |
| Polish | 10 | 0.3% |
| Scandinavian | 3 | 0.1% |
| Scotch-Irish | 24 | 0.8% |
| South American | 5 | 0.2% | View All 15 Rows |
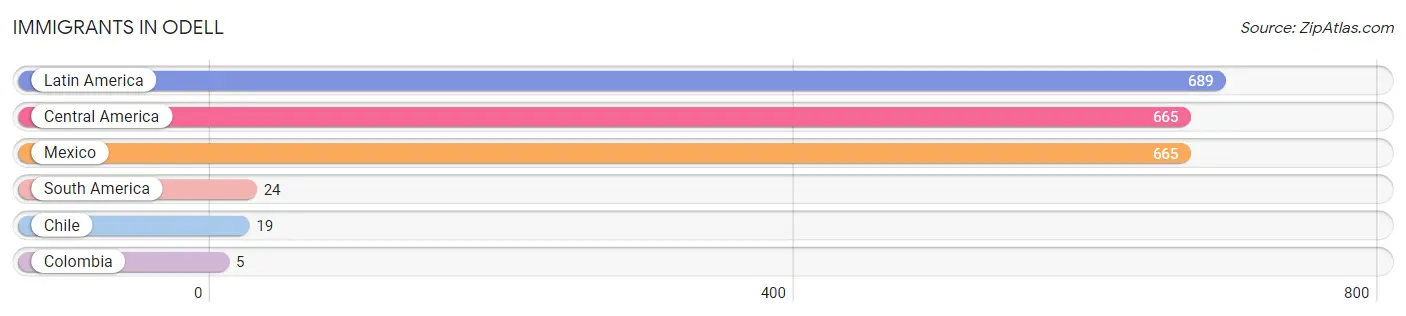
Immigrants in Odell
The most numerous immigrant groups reported in Odell came from Latin America (689 | 22.9%), Central America (665 | 22.1%), Mexico (665 | 22.1%), South America (24 | 0.8%), and Chile (19 | 0.6%), together accounting for 68.6% of all Odell residents.
| Immigration Origin | # Population | % Population |
| Central America | 665 | 22.1% |
| Chile | 19 | 0.6% |
| Colombia | 5 | 0.2% |
| Latin America | 689 | 22.9% |
| Mexico | 665 | 22.1% |
| South America | 24 | 0.8% | View All 6 Rows |
Sex and Age in Odell
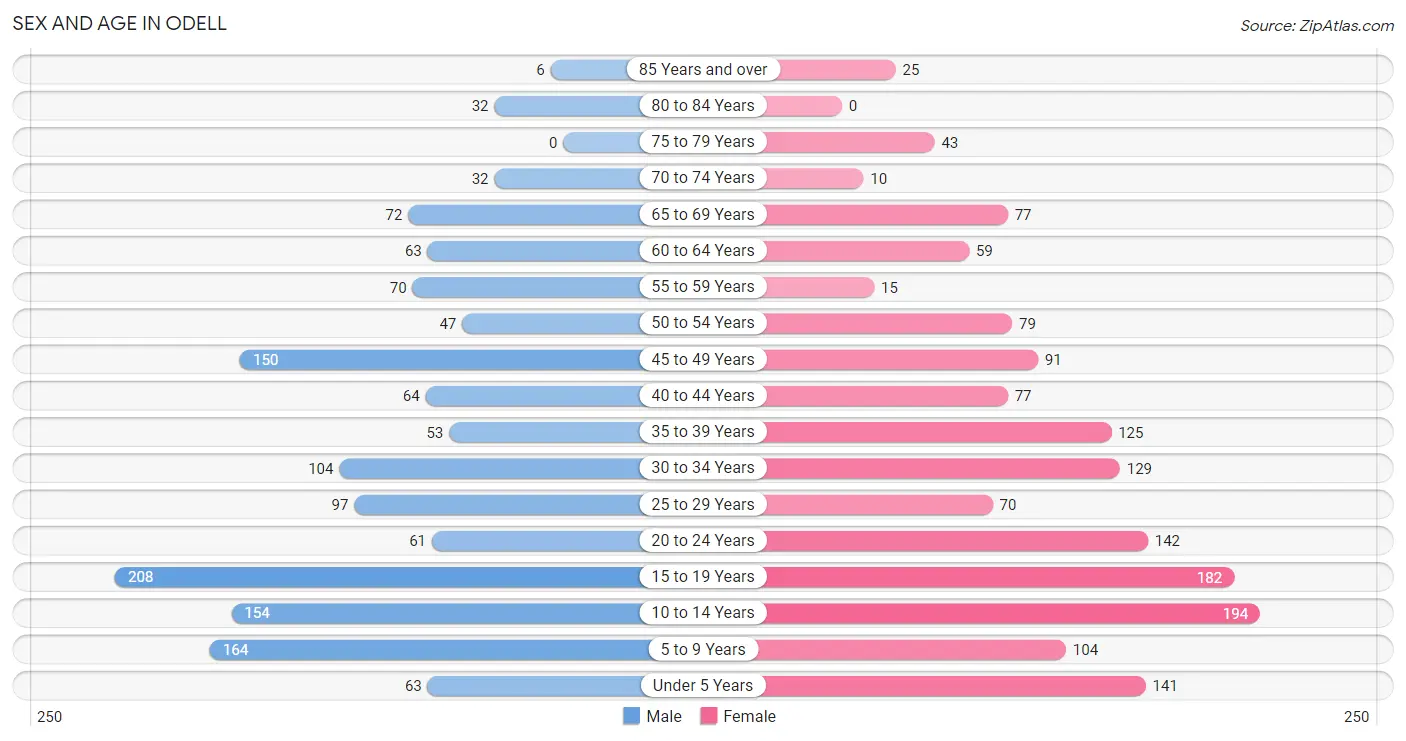
Sex and Age in Odell
The most populous age groups in Odell are 15 to 19 Years (208 | 14.4%) for men and 10 to 14 Years (194 | 12.4%) for women.
| Age Bracket | Male | Female |
| Under 5 Years | 63 (4.4%) | 141 (9.0%) |
| 5 to 9 Years | 164 (11.4%) | 104 (6.7%) |
| 10 to 14 Years | 154 (10.7%) | 194 (12.4%) |
| 15 to 19 Years | 208 (14.4%) | 182 (11.6%) |
| 20 to 24 Years | 61 (4.2%) | 142 (9.1%) |
| 25 to 29 Years | 97 (6.7%) | 70 (4.5%) |
| 30 to 34 Years | 104 (7.2%) | 129 (8.3%) |
| 35 to 39 Years | 53 (3.7%) | 125 (8.0%) |
| 40 to 44 Years | 64 (4.4%) | 77 (4.9%) |
| 45 to 49 Years | 150 (10.4%) | 91 (5.8%) |
| 50 to 54 Years | 47 (3.3%) | 79 (5.1%) |
| 55 to 59 Years | 70 (4.9%) | 15 (1.0%) |
| 60 to 64 Years | 63 (4.4%) | 59 (3.8%) |
| 65 to 69 Years | 72 (5.0%) | 77 (4.9%) |
| 70 to 74 Years | 32 (2.2%) | 10 (0.6%) |
| 75 to 79 Years | 0 (0.0%) | 43 (2.8%) |
| 80 to 84 Years | 32 (2.2%) | 0 (0.0%) |
| 85 Years and over | 6 (0.4%) | 25 (1.6%) |
| Total | 1,440 (100.0%) | 1,563 (100.0%) |
Families and Households in Odell
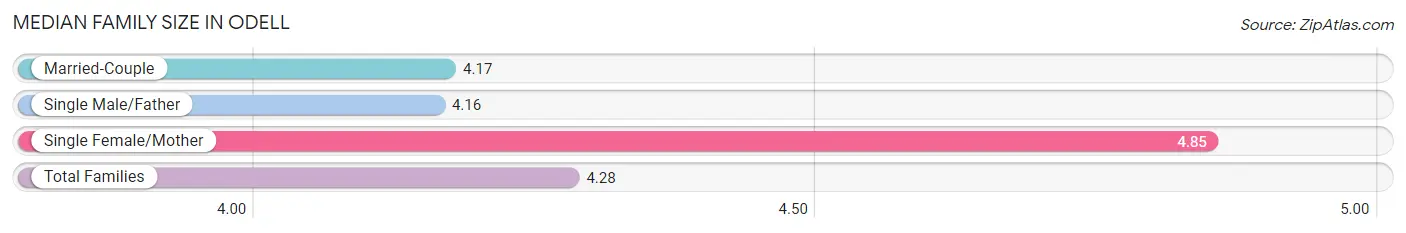
Median Family Size in Odell
The median family size in Odell is 4.28 persons per family, with single female/mother families (105 | 16.0%) accounting for the largest median family size of 4.85 persons per family. On the other hand, single male/father families (19 | 2.9%) represent the smallest median family size with 4.16 persons per family.
| Family Type | # Families | Family Size |
| Married-Couple | 532 (81.1%) | 4.17 |
| Single Male/Father | 19 (2.9%) | 4.16 |
| Single Female/Mother | 105 (16.0%) | 4.85 |
| Total Families | 656 (100.0%) | 4.28 |
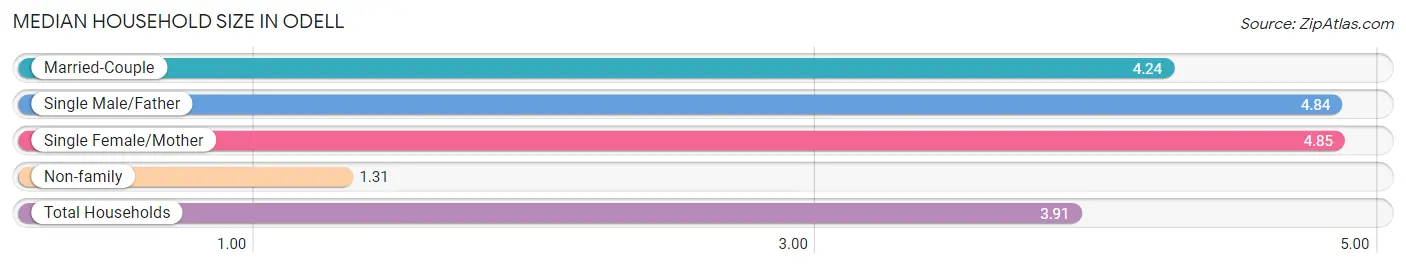
Median Household Size in Odell
The median household size in Odell is 3.91 persons per household, with single female/mother households (105 | 13.7%) accounting for the largest median household size of 4.85 persons per household. non-family households (112 | 14.6%) represent the smallest median household size with 1.31 persons per household.
| Household Type | # Households | Household Size |
| Married-Couple | 532 (69.3%) | 4.24 |
| Single Male/Father | 19 (2.5%) | 4.84 |
| Single Female/Mother | 105 (13.7%) | 4.85 |
| Non-family | 112 (14.6%) | 1.31 |
| Total Households | 768 (100.0%) | 3.91 |
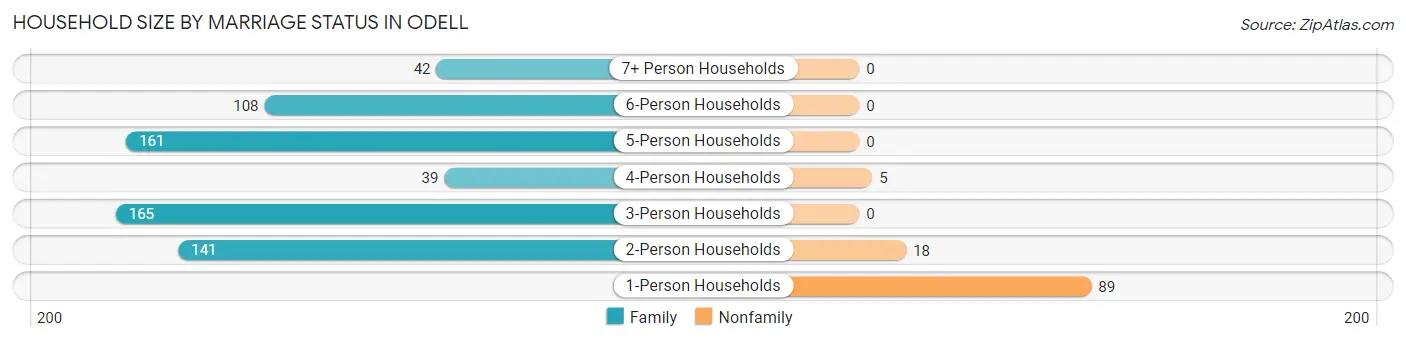
Household Size by Marriage Status in Odell
Out of a total of 768 households in Odell, 656 (85.4%) are family households, while 112 (14.6%) are nonfamily households. The most numerous type of family households are 3-person households, comprising 165, and the most common type of nonfamily households are 1-person households, comprising 89.
| Household Size | Family Households | Nonfamily Households |
| 1-Person Households | - | 89 (11.6%) |
| 2-Person Households | 141 (18.4%) | 18 (2.3%) |
| 3-Person Households | 165 (21.5%) | 0 (0.0%) |
| 4-Person Households | 39 (5.1%) | 5 (0.6%) |
| 5-Person Households | 161 (21.0%) | 0 (0.0%) |
| 6-Person Households | 108 (14.1%) | 0 (0.0%) |
| 7+ Person Households | 42 (5.5%) | 0 (0.0%) |
| Total | 656 (85.4%) | 112 (14.6%) |
Female Fertility in Odell
Fertility by Age in Odell
Average fertility rate in Odell is 90.0 births per 1,000 women. Women in the age bracket of 20 to 34 years have the highest fertility rate with 132.0 births per 1,000 women. Women in the age bracket of 20 to 34 years acount for 58.4% of all women with births.
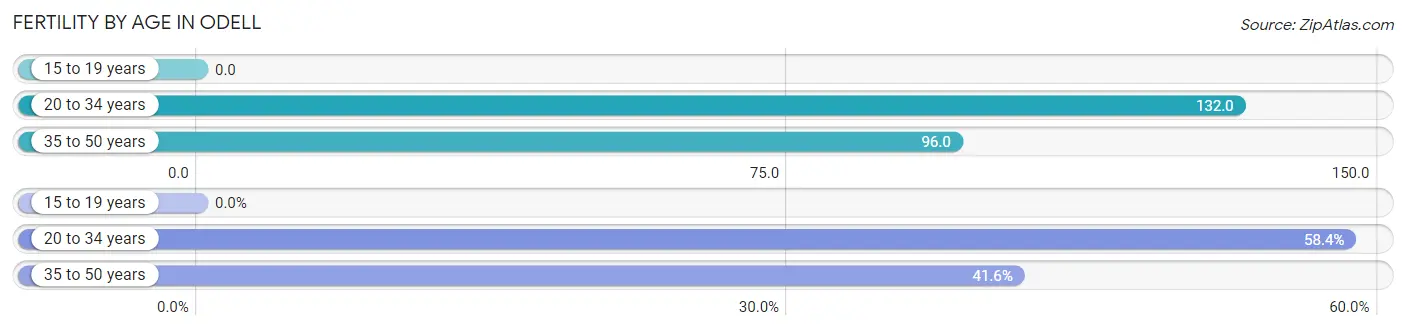
| Age Bracket | Women with Births | Births / 1,000 Women |
| 15 to 19 years | 0 (0.0%) | 0.0 |
| 20 to 34 years | 45 (58.4%) | 132.0 |
| 35 to 50 years | 32 (41.6%) | 96.0 |
| Total | 77 (100.0%) | 90.0 |
Fertility by Age by Marriage Status in Odell
93.5% of women with births (77) in Odell are married. The highest percentage of unmarried women with births falls into 20 to 34 years age bracket with 11.1% of them unmarried at the time of birth, while the lowest percentage of unmarried women with births belong to 35 to 50 years age bracket with 0.0% of them unmarried.
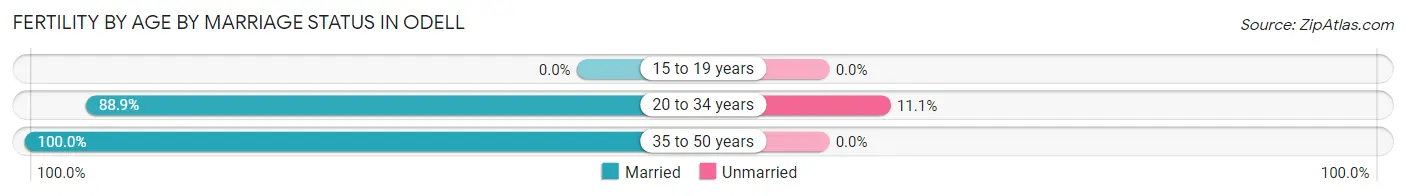
| Age Bracket | Married | Unmarried |
| 15 to 19 years | 0 (0.0%) | 0 (0.0%) |
| 20 to 34 years | 40 (88.9%) | 5 (11.1%) |
| 35 to 50 years | 32 (100.0%) | 0 (0.0%) |
| Total | 72 (93.5%) | 5 (6.5%) |
Fertility by Education in Odell
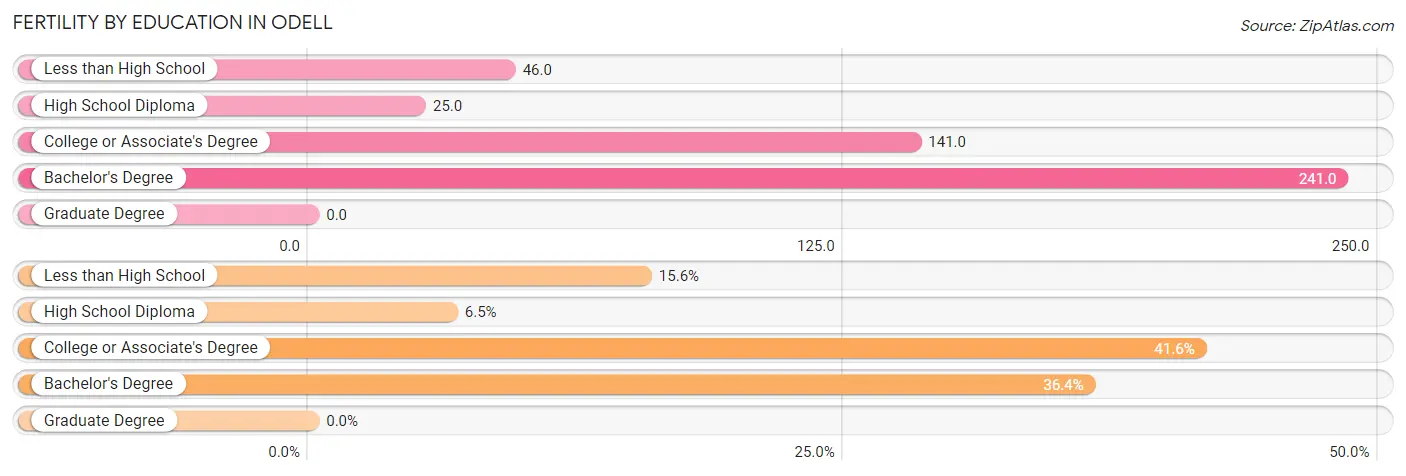
| Educational Attainment | Women with Births | Births / 1,000 Women |
| Less than High School | 12 (15.6%) | 46.0 |
| High School Diploma | 5 (6.5%) | 25.0 |
| College or Associate's Degree | 32 (41.6%) | 141.0 |
| Bachelor's Degree | 28 (36.4%) | 241.0 |
| Graduate Degree | 0 (0.0%) | 0.0 |
| Total | 77 (100.0%) | 90.0 |
Fertility by Education by Marriage Status in Odell
6.5% of women with births in Odell are unmarried. Women with the educational attainment of less than high school are most likely to be married with 100.0% of them married at childbirth, while women with the educational attainment of high school diploma are least likely to be married with 100.0% of them unmarried at childbirth.
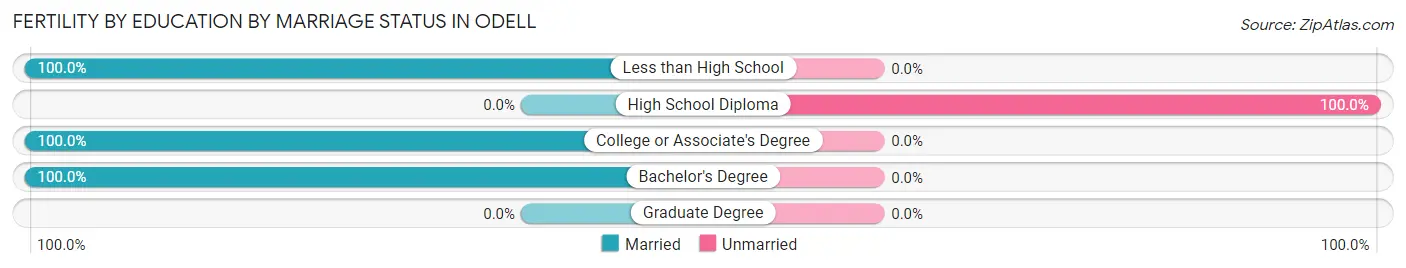
| Educational Attainment | Married | Unmarried |
| Less than High School | 12 (100.0%) | 0 (0.0%) |
| High School Diploma | 0 (0.0%) | 5 (100.0%) |
| College or Associate's Degree | 32 (100.0%) | 0 (0.0%) |
| Bachelor's Degree | 28 (100.0%) | 0 (0.0%) |
| Graduate Degree | 0 (0.0%) | 0 (0.0%) |
| Total | 72 (93.5%) | 5 (6.5%) |
Income in Odell
Income Overview in Odell
Per Capita Income in Odell is $23,596, while median incomes of families and households are $84,241 and $82,768 respectively.
| Characteristic | Number | Measure |
| Per Capita Income | 3,003 | $23,596 |
| Median Family Income | 656 | $84,241 |
| Mean Family Income | 656 | $103,462 |
| Median Household Income | 768 | $82,768 |
| Mean Household Income | 768 | $100,571 |
| Income Deficit | 656 | $0 |
| Wage / Income Gap (%) | 3,003 | 13.41% |
| Wage / Income Gap ($) | 3,003 | 86.59¢ per $1 |
| Gini / Inequality Index | 3,003 | 0.33 |
Earnings by Sex in Odell
Average Earnings in Odell are $31,830, $33,490 for men and $29,000 for women, a difference of 13.4%.
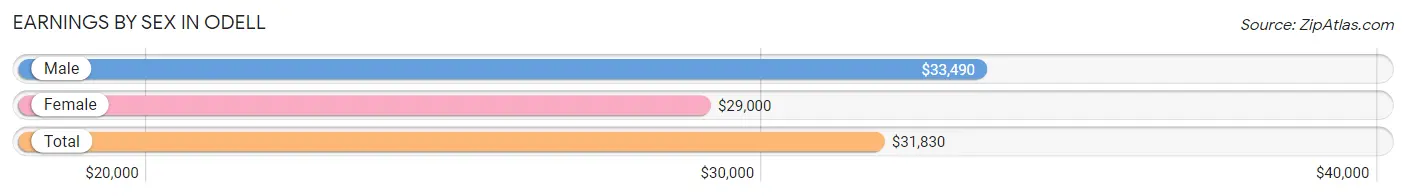
| Sex | Number | Average Earnings |
| Male | 898 (55.3%) | $33,490 |
| Female | 726 (44.7%) | $29,000 |
| Total | 1,624 (100.0%) | $31,830 |
Earnings by Sex by Income Bracket in Odell
The most common earnings brackets in Odell are $30,000 to $34,999 for men (124 | 13.8%) and $25,000 to $29,999 for women (160 | 22.0%).
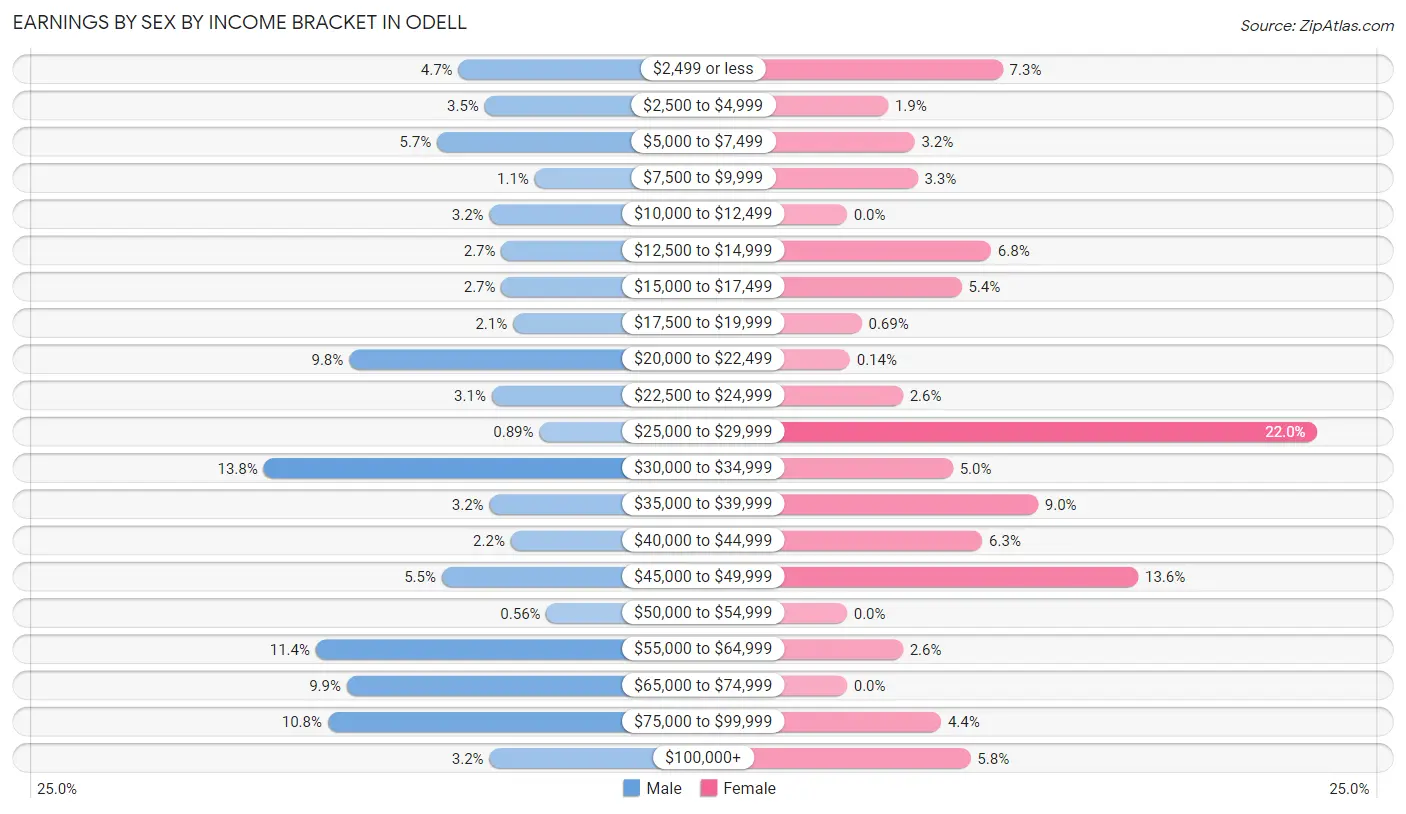
| Income | Male | Female |
| $2,499 or less | 42 (4.7%) | 53 (7.3%) |
| $2,500 to $4,999 | 31 (3.5%) | 14 (1.9%) |
| $5,000 to $7,499 | 51 (5.7%) | 23 (3.2%) |
| $7,500 to $9,999 | 10 (1.1%) | 24 (3.3%) |
| $10,000 to $12,499 | 29 (3.2%) | 0 (0.0%) |
| $12,500 to $14,999 | 24 (2.7%) | 49 (6.8%) |
| $15,000 to $17,499 | 24 (2.7%) | 39 (5.4%) |
| $17,500 to $19,999 | 19 (2.1%) | 5 (0.7%) |
| $20,000 to $22,499 | 88 (9.8%) | 1 (0.1%) |
| $22,500 to $24,999 | 28 (3.1%) | 19 (2.6%) |
| $25,000 to $29,999 | 8 (0.9%) | 160 (22.0%) |
| $30,000 to $34,999 | 124 (13.8%) | 36 (5.0%) |
| $35,000 to $39,999 | 29 (3.2%) | 65 (8.9%) |
| $40,000 to $44,999 | 20 (2.2%) | 46 (6.3%) |
| $45,000 to $49,999 | 49 (5.5%) | 99 (13.6%) |
| $50,000 to $54,999 | 5 (0.6%) | 0 (0.0%) |
| $55,000 to $64,999 | 102 (11.4%) | 19 (2.6%) |
| $65,000 to $74,999 | 89 (9.9%) | 0 (0.0%) |
| $75,000 to $99,999 | 97 (10.8%) | 32 (4.4%) |
| $100,000+ | 29 (3.2%) | 42 (5.8%) |
| Total | 898 (100.0%) | 726 (100.0%) |
Earnings by Sex by Educational Attainment in Odell
Average earnings in Odell are $46,276 for men and $38,066 for women, a difference of 17.7%. Men with an educational attainment of bachelor's degree enjoy the highest average annual earnings of $69,118, while those with high school diploma education earn the least with $31,806. Women with an educational attainment of college or associate's degree earn the most with the average annual earnings of $48,250, while those with less than high school education have the smallest earnings of $27,093.
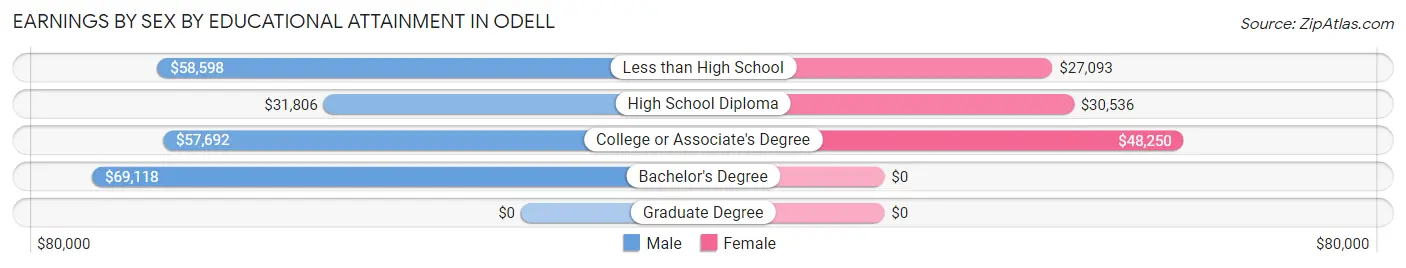
| Educational Attainment | Male Income | Female Income |
| Less than High School | $58,598 | $27,093 |
| High School Diploma | $31,806 | $30,536 |
| College or Associate's Degree | $57,692 | $48,250 |
| Bachelor's Degree | $69,118 | $0 |
| Graduate Degree | - | - |
| Total | $46,276 | $38,066 |
Family Income in Odell
Family Income Brackets in Odell
According to the Odell family income data, there are 165 families falling into the $100,000 to $149,999 income range, which is the most common income bracket and makes up 25.2% of all families.
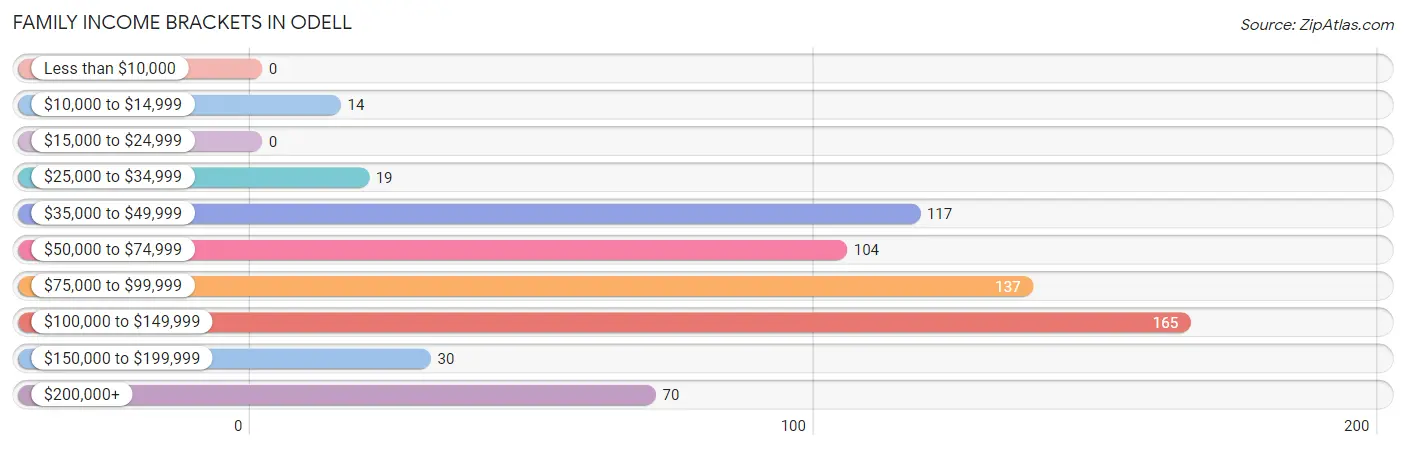
| Income Bracket | # Families | % Families |
| Less than $10,000 | 0 | 0.0% |
| $10,000 to $14,999 | 14 | 2.1% |
| $15,000 to $24,999 | 0 | 0.0% |
| $25,000 to $34,999 | 19 | 2.9% |
| $35,000 to $49,999 | 117 | 17.8% |
| $50,000 to $74,999 | 104 | 15.9% |
| $75,000 to $99,999 | 137 | 20.9% |
| $100,000 to $149,999 | 165 | 25.2% |
| $150,000 to $199,999 | 30 | 4.6% |
| $200,000+ | 70 | 10.7% |
Family Income by Famaliy Size in Odell
7+ person families (42 | 6.4%) account for the highest median family income in Odell with $121,176 per family, while 3-person families (177 | 27.0%) have the highest median income of $33,136 per family member.
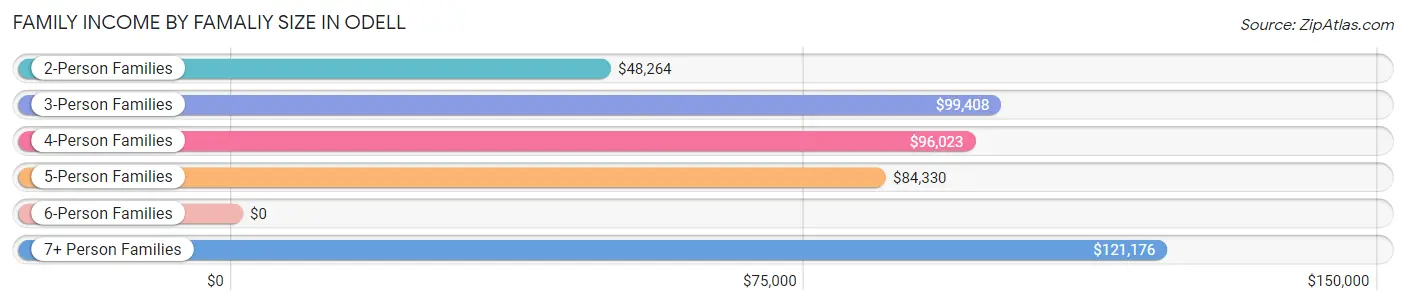
| Income Bracket | # Families | Median Income |
| 2-Person Families | 141 (21.5%) | $48,264 |
| 3-Person Families | 177 (27.0%) | $99,408 |
| 4-Person Families | 39 (5.9%) | $96,023 |
| 5-Person Families | 180 (27.4%) | $84,330 |
| 6-Person Families | 77 (11.7%) | $0 |
| 7+ Person Families | 42 (6.4%) | $121,176 |
| Total | 656 (100.0%) | $84,241 |
Family Income by Number of Earners in Odell
The median family income in Odell is $84,241, with families comprising 3+ earners (245) having the highest median family income of $128,558, while families with 1 earner (68) have the lowest median family income of $45,208, accounting for 37.3% and 10.4% of families, respectively.
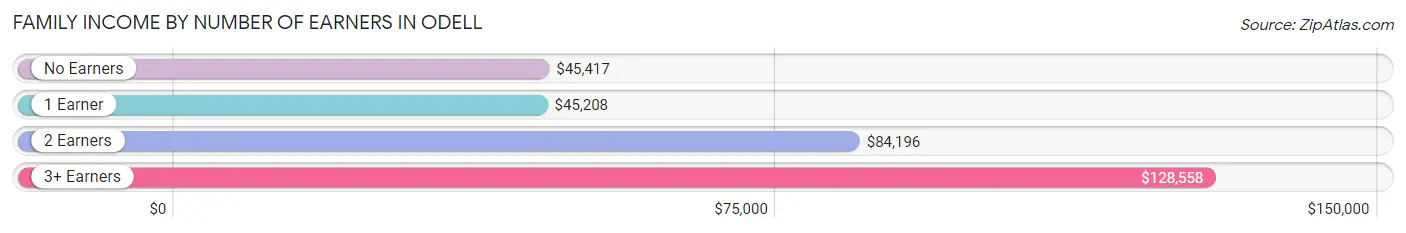
| Number of Earners | # Families | Median Income |
| No Earners | 47 (7.2%) | $45,417 |
| 1 Earner | 68 (10.4%) | $45,208 |
| 2 Earners | 296 (45.1%) | $84,196 |
| 3+ Earners | 245 (37.3%) | $128,558 |
| Total | 656 (100.0%) | $84,241 |
Household Income in Odell
Household Income Brackets in Odell
With 203 households falling in the category, the $75,000 to $99,999 income range is the most frequent in Odell, accounting for 26.4% of all households.
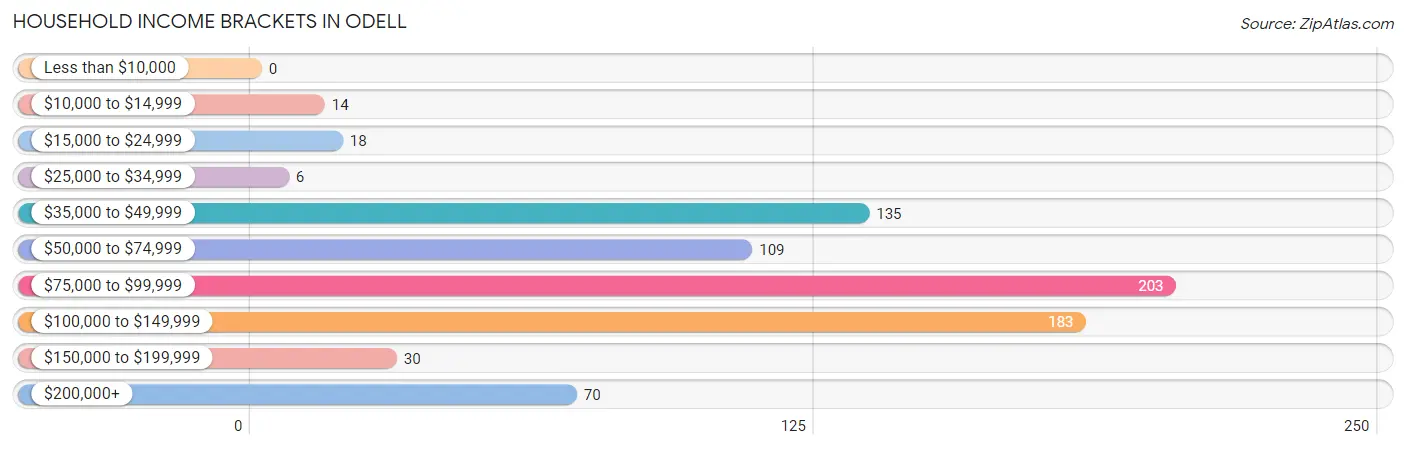
| Income Bracket | # Households | % Households |
| Less than $10,000 | 0 | 0.0% |
| $10,000 to $14,999 | 14 | 1.8% |
| $15,000 to $24,999 | 18 | 2.3% |
| $25,000 to $34,999 | 6 | 0.8% |
| $35,000 to $49,999 | 135 | 17.6% |
| $50,000 to $74,999 | 109 | 14.2% |
| $75,000 to $99,999 | 203 | 26.4% |
| $100,000 to $149,999 | 183 | 23.8% |
| $150,000 to $199,999 | 30 | 3.9% |
| $200,000+ | 70 | 9.1% |
Household Income by Householder Age in Odell
The median household income in Odell is $82,768, with the highest median household income of $140,194 found in the 25 to 44 years age bracket for the primary householder. A total of 281 households (36.6%) fall into this category. Meanwhile, the 15 to 24 years age bracket for the primary householder has the lowest median household income of $0, with 13 households (1.7%) in this group.
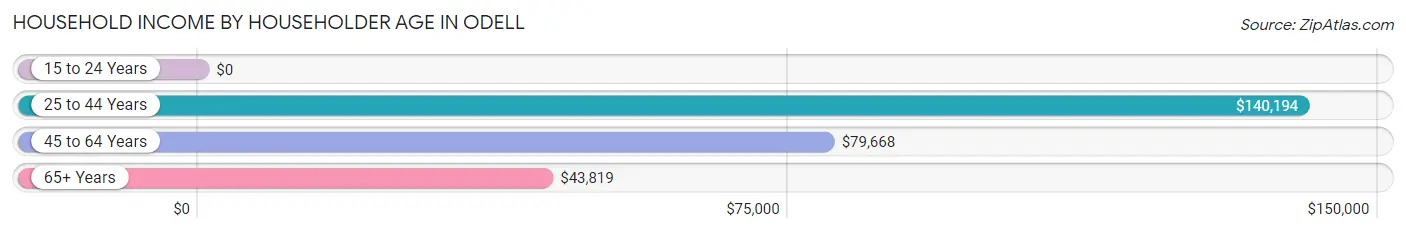
| Income Bracket | # Households | Median Income |
| 15 to 24 Years | 13 (1.7%) | $0 |
| 25 to 44 Years | 281 (36.6%) | $140,194 |
| 45 to 64 Years | 319 (41.5%) | $79,668 |
| 65+ Years | 155 (20.2%) | $43,819 |
| Total | 768 (100.0%) | $82,768 |
Poverty in Odell
Income Below Poverty by Sex and Age in Odell
With 3.7% poverty level for males and 5.8% for females among the residents of Odell, 75 year old and over males and 75 year old and over females are the most vulnerable to poverty, with 25 males (65.8%) and 14 females (20.6%) in their respective age groups living below the poverty level.
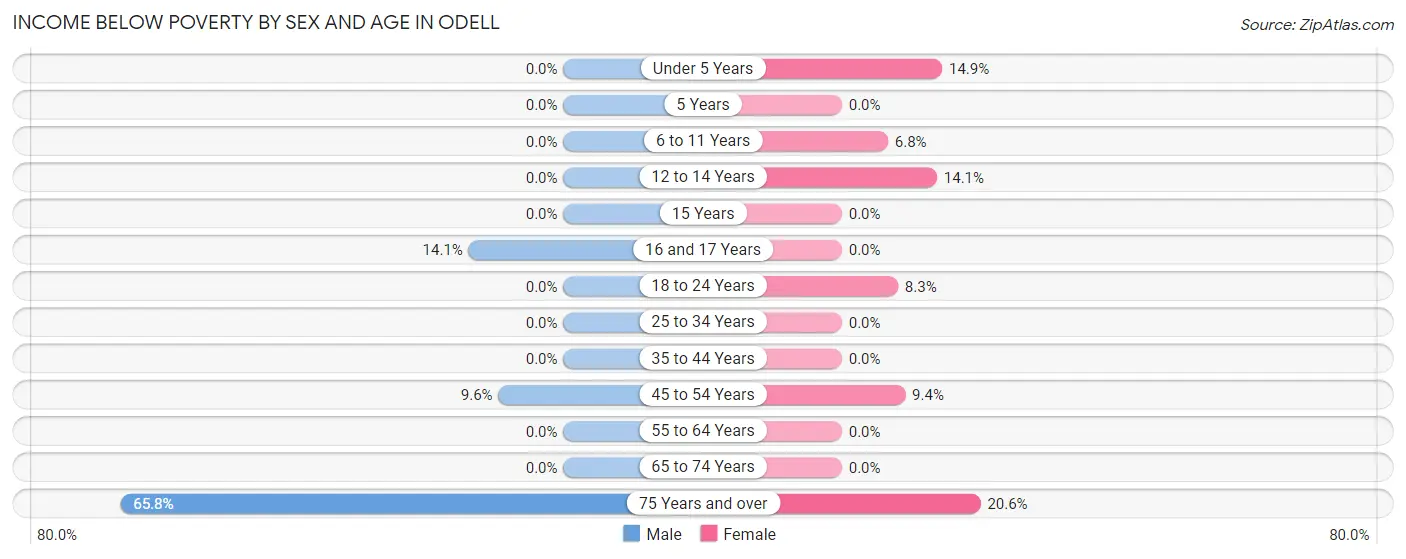
| Age Bracket | Male | Female |
| Under 5 Years | 0 (0.0%) | 21 (14.9%) |
| 5 Years | 0 (0.0%) | 0 (0.0%) |
| 6 to 11 Years | 0 (0.0%) | 13 (6.8%) |
| 12 to 14 Years | 0 (0.0%) | 12 (14.1%) |
| 15 Years | 0 (0.0%) | 0 (0.0%) |
| 16 and 17 Years | 9 (14.1%) | 0 (0.0%) |
| 18 to 24 Years | 0 (0.0%) | 14 (8.3%) |
| 25 to 34 Years | 0 (0.0%) | 0 (0.0%) |
| 35 to 44 Years | 0 (0.0%) | 0 (0.0%) |
| 45 to 54 Years | 19 (9.6%) | 16 (9.4%) |
| 55 to 64 Years | 0 (0.0%) | 0 (0.0%) |
| 65 to 74 Years | 0 (0.0%) | 0 (0.0%) |
| 75 Years and over | 25 (65.8%) | 14 (20.6%) |
| Total | 53 (3.7%) | 90 (5.8%) |
Income Above Poverty by Sex and Age in Odell
According to the poverty statistics in Odell, males aged under 5 years and females aged 5 years are the age groups that are most secure financially, with 100.0% of males and 100.0% of females in these age groups living above the poverty line.
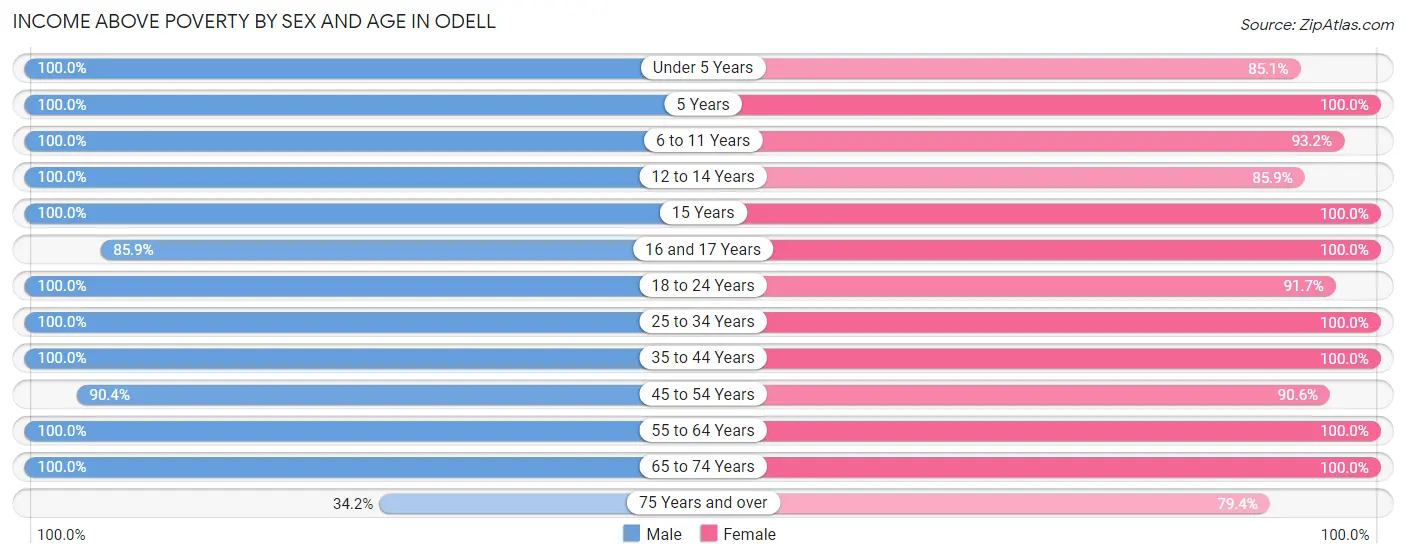
| Age Bracket | Male | Female |
| Under 5 Years | 57 (100.0%) | 120 (85.1%) |
| 5 Years | 16 (100.0%) | 23 (100.0%) |
| 6 to 11 Years | 231 (100.0%) | 177 (93.2%) |
| 12 to 14 Years | 71 (100.0%) | 73 (85.9%) |
| 15 Years | 22 (100.0%) | 135 (100.0%) |
| 16 and 17 Years | 55 (85.9%) | 21 (100.0%) |
| 18 to 24 Years | 183 (100.0%) | 154 (91.7%) |
| 25 to 34 Years | 201 (100.0%) | 199 (100.0%) |
| 35 to 44 Years | 117 (100.0%) | 202 (100.0%) |
| 45 to 54 Years | 178 (90.4%) | 154 (90.6%) |
| 55 to 64 Years | 133 (100.0%) | 74 (100.0%) |
| 65 to 74 Years | 104 (100.0%) | 87 (100.0%) |
| 75 Years and over | 13 (34.2%) | 54 (79.4%) |
| Total | 1,381 (96.3%) | 1,473 (94.2%) |
Income Below Poverty Among Married-Couple Families in Odell
The poverty statistics for married-couple families in Odell show that 2.6% or 14 of the total 532 families live below the poverty line. Families with no children have the highest poverty rate of 8.0%, comprising of 14 families. On the other hand, families with 1 or 2 children have the lowest poverty rate of 0.0%, which includes 0 families.
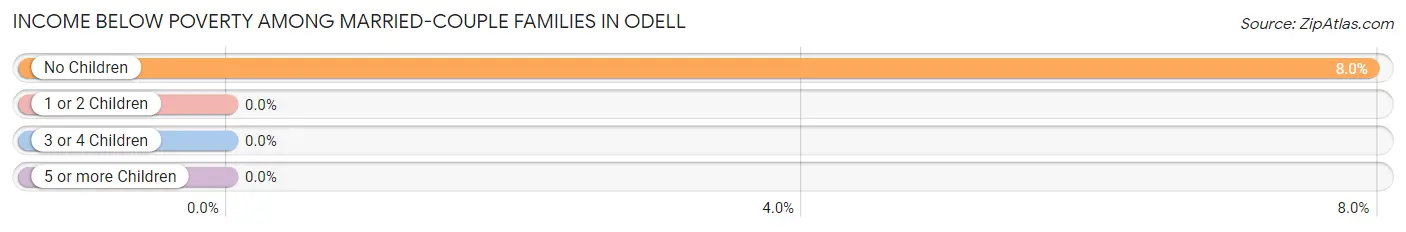
| Children | Above Poverty | Below Poverty |
| No Children | 162 (92.0%) | 14 (8.0%) |
| 1 or 2 Children | 213 (100.0%) | 0 (0.0%) |
| 3 or 4 Children | 131 (100.0%) | 0 (0.0%) |
| 5 or more Children | 12 (100.0%) | 0 (0.0%) |
| Total | 518 (97.4%) | 14 (2.6%) |
Income Below Poverty Among Single-Parent Households in Odell
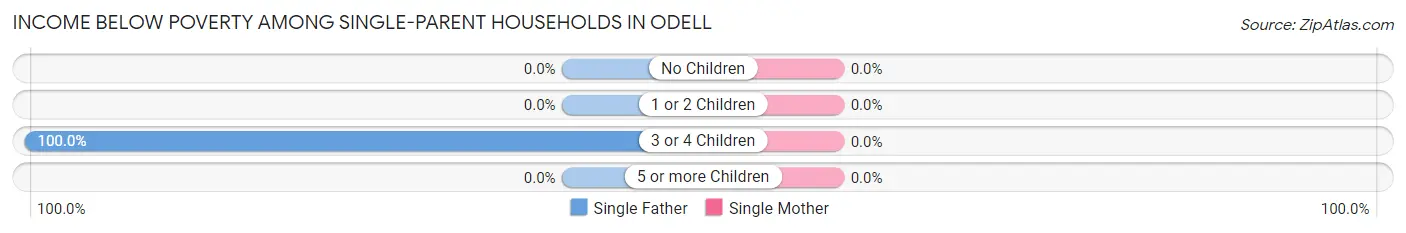
| Children | Single Father | Single Mother |
| No Children | 0 (0.0%) | 0 (0.0%) |
| 1 or 2 Children | 0 (0.0%) | 0 (0.0%) |
| 3 or 4 Children | 19 (100.0%) | 0 (0.0%) |
| 5 or more Children | 0 (0.0%) | 0 (0.0%) |
| Total | 19 (100.0%) | 0 (0.0%) |
Income Below Poverty Among Married-Couple vs Single-Parent Households in Odell
The poverty data for Odell shows that 14 of the married-couple family households (2.6%) and 19 of the single-parent households (15.3%) are living below the poverty level. Within the married-couple family households, those with no children have the highest poverty rate, with 14 households (8.0%) falling below the poverty line. Among the single-parent households, those with 3 or 4 children have the highest poverty rate, with 19 household (100.0%) living below poverty.
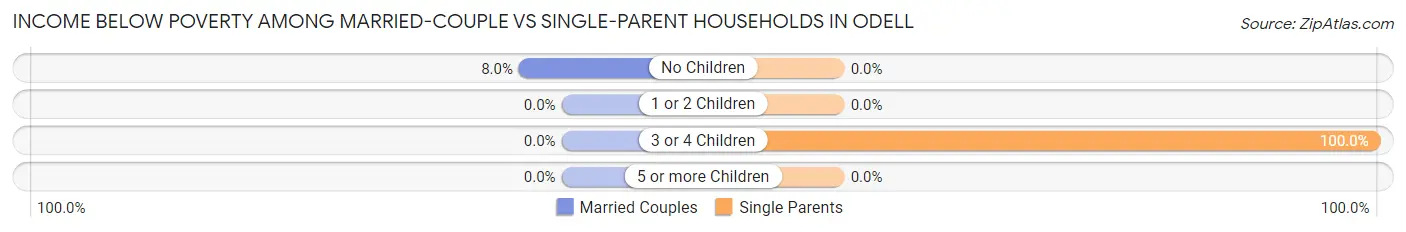
| Children | Married-Couple Families | Single-Parent Households |
| No Children | 14 (8.0%) | 0 (0.0%) |
| 1 or 2 Children | 0 (0.0%) | 0 (0.0%) |
| 3 or 4 Children | 0 (0.0%) | 19 (100.0%) |
| 5 or more Children | 0 (0.0%) | 0 (0.0%) |
| Total | 14 (2.6%) | 19 (15.3%) |
Employment Characteristics in Odell
Employment by Class of Employer in Odell
Among the 1,497 employed individuals in Odell, private company employees (950 | 63.5%), not-for-profit organizations (183 | 12.2%), and state government employees (154 | 10.3%) make up the most common classes of employment.
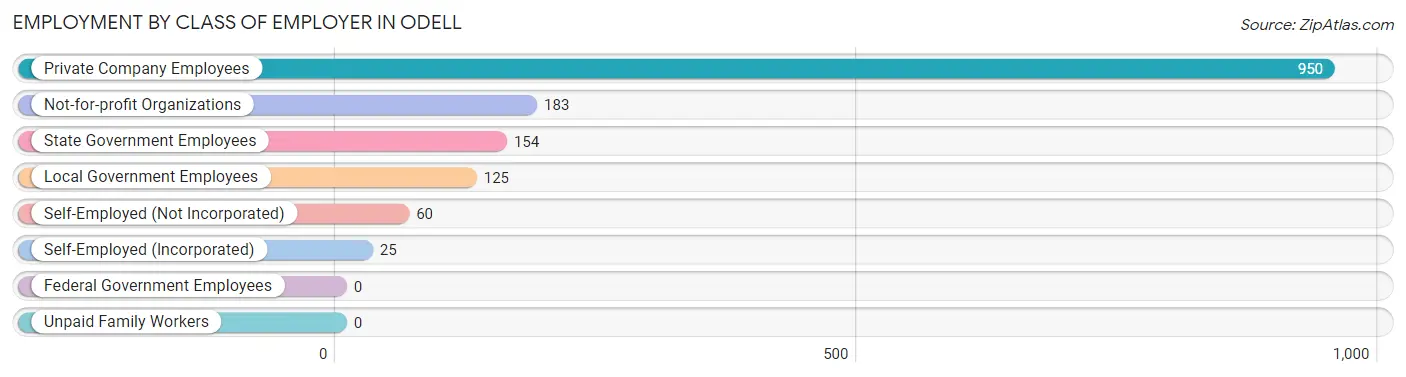
| Employer Class | # Employees | % Employees |
| Private Company Employees | 950 | 63.5% |
| Self-Employed (Incorporated) | 25 | 1.7% |
| Self-Employed (Not Incorporated) | 60 | 4.0% |
| Not-for-profit Organizations | 183 | 12.2% |
| Local Government Employees | 125 | 8.4% |
| State Government Employees | 154 | 10.3% |
| Federal Government Employees | 0 | 0.0% |
| Unpaid Family Workers | 0 | 0.0% |
| Total | 1,497 | 100.0% |
Employment Status by Age in Odell
According to the labor force statistics for Odell, out of the total population over 16 years of age (2,026), 78.2% or 1,584 individuals are in the labor force, with 4.8% or 76 of them unemployed. The age group with the highest labor force participation rate is 25 to 29 years, with 100.0% or 167 individuals in the labor force. Within the labor force, the 16 to 19 years age range has the highest percentage of unemployed individuals, with 24.7% or 44 of them being unemployed.
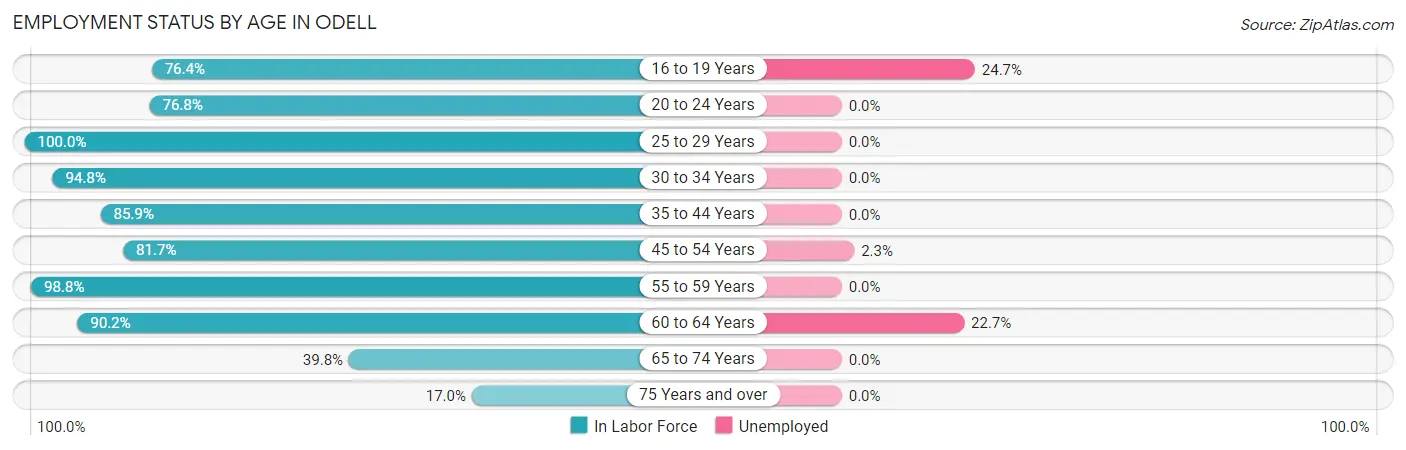
| Age Bracket | In Labor Force | Unemployed |
| 16 to 19 Years | 178 (76.4%) | 44 (24.7%) |
| 20 to 24 Years | 156 (76.8%) | 0 (0.0%) |
| 25 to 29 Years | 167 (100.0%) | 0 (0.0%) |
| 30 to 34 Years | 221 (94.8%) | 0 (0.0%) |
| 35 to 44 Years | 274 (85.9%) | 0 (0.0%) |
| 45 to 54 Years | 300 (81.7%) | 7 (2.3%) |
| 55 to 59 Years | 84 (98.8%) | 0 (0.0%) |
| 60 to 64 Years | 110 (90.2%) | 25 (22.7%) |
| 65 to 74 Years | 76 (39.8%) | 0 (0.0%) |
| 75 Years and over | 18 (17.0%) | 0 (0.0%) |
| Total | 1,584 (78.2%) | 76 (4.8%) |
Employment Status by Educational Attainment in Odell
According to labor force statistics for Odell, 89.4% of individuals (1,156) out of the total population between 25 and 64 years of age (1,293) are in the labor force, with 2.8% or 32 of them being unemployed. The group with the highest labor force participation rate are those with the educational attainment of bachelor's degree or higher, with 100.0% or 306 individuals in the labor force. Within the labor force, individuals with less than high school education have the highest percentage of unemployment, with 10.5% or 24 of them being unemployed.
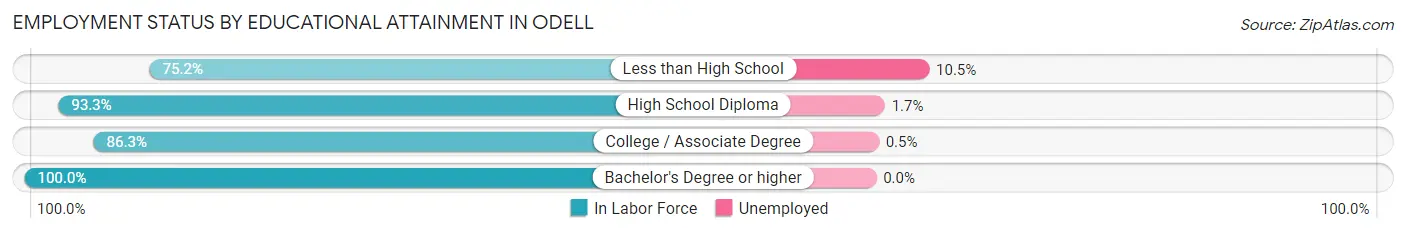
| Educational Attainment | In Labor Force | Unemployed |
| Less than High School | 228 (75.2%) | 32 (10.5%) |
| High School Diploma | 420 (93.3%) | 8 (1.7%) |
| College / Associate Degree | 202 (86.3%) | 1 (0.5%) |
| Bachelor's Degree or higher | 306 (100.0%) | 0 (0.0%) |
| Total | 1,156 (89.4%) | 36 (2.8%) |
Employment Occupations by Sex in Odell
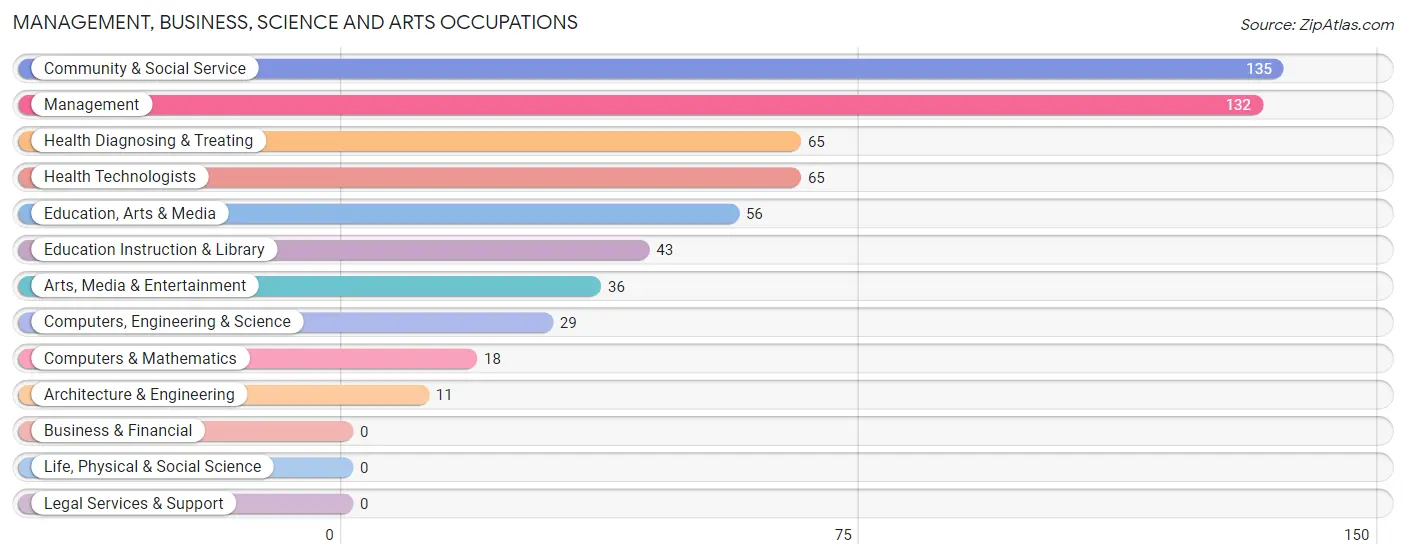
Management, Business, Science and Arts Occupations
The most common Management, Business, Science and Arts occupations in Odell are Community & Social Service (135 | 8.9%), Management (132 | 8.7%), Health Diagnosing & Treating (65 | 4.3%), Health Technologists (65 | 4.3%), and Education, Arts & Media (56 | 3.7%).
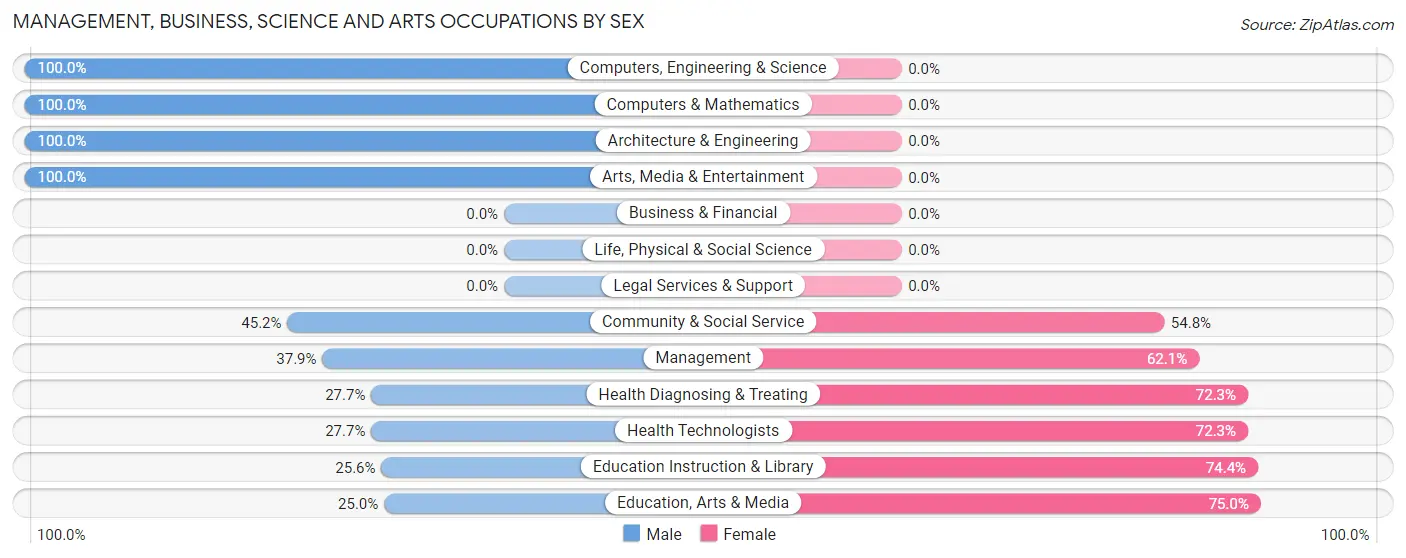
Management, Business, Science and Arts Occupations by Sex
Within the Management, Business, Science and Arts occupations in Odell, the most male-oriented occupations are Computers, Engineering & Science (100.0%), Computers & Mathematics (100.0%), and Architecture & Engineering (100.0%), while the most female-oriented occupations are Education, Arts & Media (75.0%), Education Instruction & Library (74.4%), and Health Diagnosing & Treating (72.3%).
| Occupation | Male | Female |
| Management | 50 (37.9%) | 82 (62.1%) |
| Business & Financial | 0 (0.0%) | 0 (0.0%) |
| Computers, Engineering & Science | 29 (100.0%) | 0 (0.0%) |
| Computers & Mathematics | 18 (100.0%) | 0 (0.0%) |
| Architecture & Engineering | 11 (100.0%) | 0 (0.0%) |
| Life, Physical & Social Science | 0 (0.0%) | 0 (0.0%) |
| Community & Social Service | 61 (45.2%) | 74 (54.8%) |
| Education, Arts & Media | 14 (25.0%) | 42 (75.0%) |
| Legal Services & Support | 0 (0.0%) | 0 (0.0%) |
| Education Instruction & Library | 11 (25.6%) | 32 (74.4%) |
| Arts, Media & Entertainment | 36 (100.0%) | 0 (0.0%) |
| Health Diagnosing & Treating | 18 (27.7%) | 47 (72.3%) |
| Health Technologists | 18 (27.7%) | 47 (72.3%) |
| Total (Category) | 158 (43.8%) | 203 (56.2%) |
| Total (Overall) | 861 (57.1%) | 647 (42.9%) |
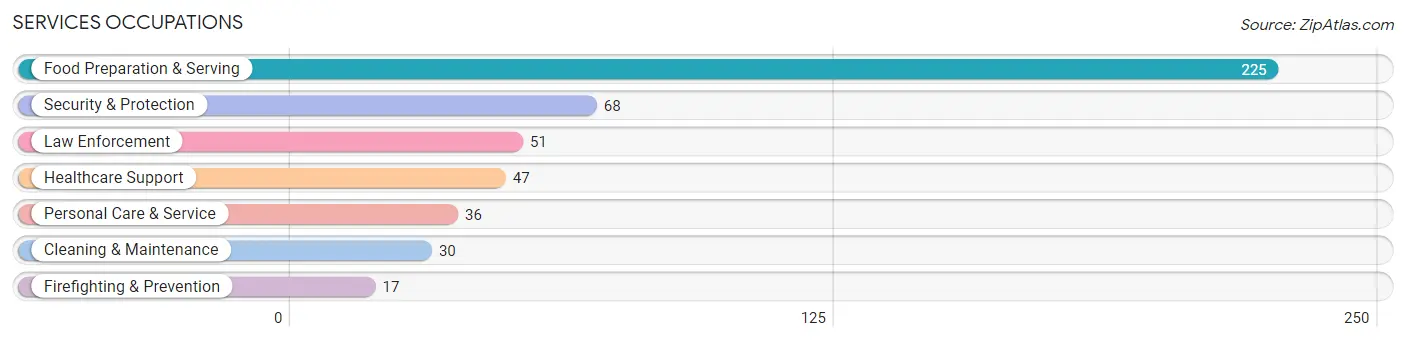
Services Occupations
The most common Services occupations in Odell are Food Preparation & Serving (225 | 14.9%), Security & Protection (68 | 4.5%), Law Enforcement (51 | 3.4%), Healthcare Support (47 | 3.1%), and Personal Care & Service (36 | 2.4%).
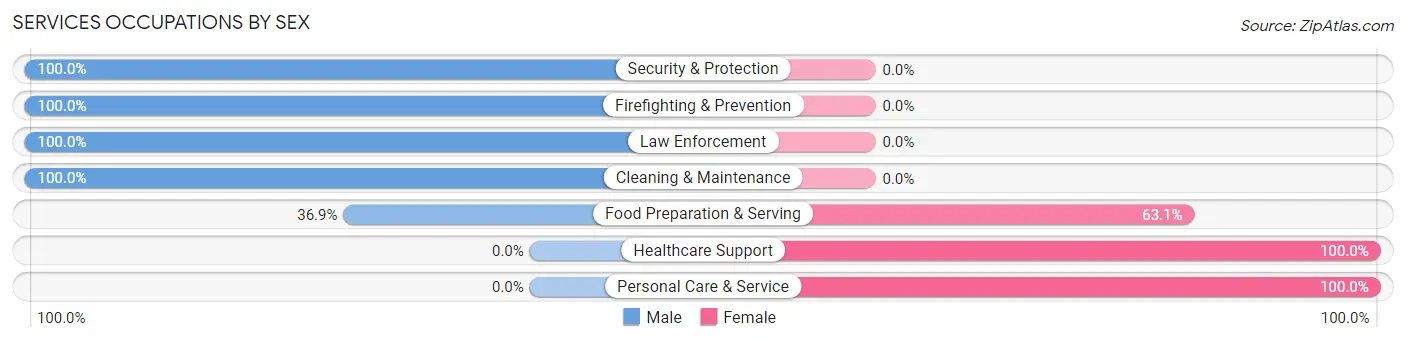
Services Occupations by Sex
Within the Services occupations in Odell, the most male-oriented occupations are Security & Protection (100.0%), Firefighting & Prevention (100.0%), and Law Enforcement (100.0%), while the most female-oriented occupations are Healthcare Support (100.0%), Personal Care & Service (100.0%), and Food Preparation & Serving (63.1%).
| Occupation | Male | Female |
| Healthcare Support | 0 (0.0%) | 47 (100.0%) |
| Security & Protection | 68 (100.0%) | 0 (0.0%) |
| Firefighting & Prevention | 17 (100.0%) | 0 (0.0%) |
| Law Enforcement | 51 (100.0%) | 0 (0.0%) |
| Food Preparation & Serving | 83 (36.9%) | 142 (63.1%) |
| Cleaning & Maintenance | 30 (100.0%) | 0 (0.0%) |
| Personal Care & Service | 0 (0.0%) | 36 (100.0%) |
| Total (Category) | 181 (44.6%) | 225 (55.4%) |
| Total (Overall) | 861 (57.1%) | 647 (42.9%) |
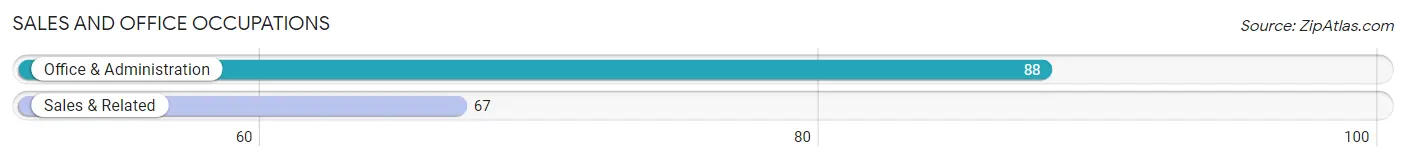
Sales and Office Occupations
The most common Sales and Office occupations in Odell are Office & Administration (88 | 5.8%), and Sales & Related (67 | 4.4%).
Sales and Office Occupations by Sex
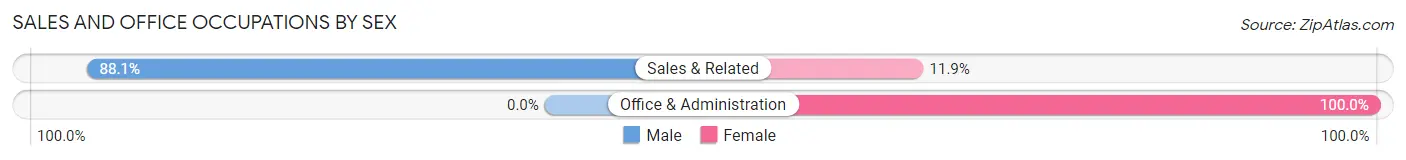
| Occupation | Male | Female |
| Sales & Related | 59 (88.1%) | 8 (11.9%) |
| Office & Administration | 0 (0.0%) | 88 (100.0%) |
| Total (Category) | 59 (38.1%) | 96 (61.9%) |
| Total (Overall) | 861 (57.1%) | 647 (42.9%) |
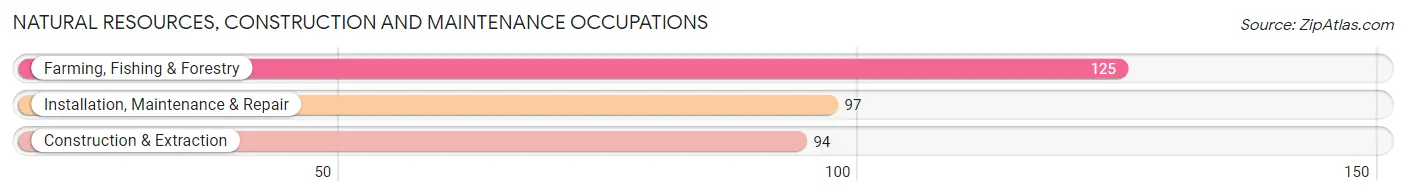
Natural Resources, Construction and Maintenance Occupations
The most common Natural Resources, Construction and Maintenance occupations in Odell are Farming, Fishing & Forestry (125 | 8.3%), Installation, Maintenance & Repair (97 | 6.4%), and Construction & Extraction (94 | 6.2%).
Natural Resources, Construction and Maintenance Occupations by Sex
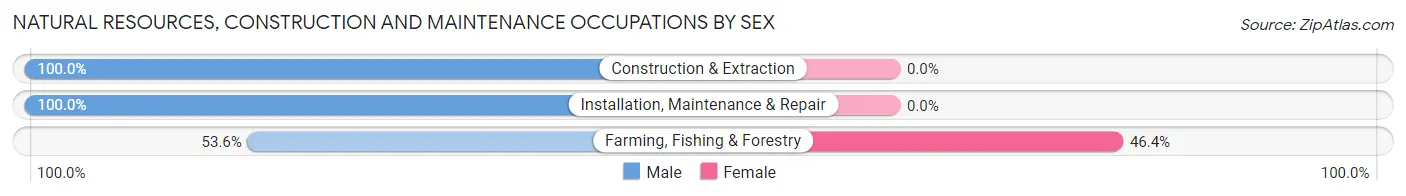
| Occupation | Male | Female |
| Farming, Fishing & Forestry | 67 (53.6%) | 58 (46.4%) |
| Construction & Extraction | 94 (100.0%) | 0 (0.0%) |
| Installation, Maintenance & Repair | 97 (100.0%) | 0 (0.0%) |
| Total (Category) | 258 (81.7%) | 58 (18.3%) |
| Total (Overall) | 861 (57.1%) | 647 (42.9%) |
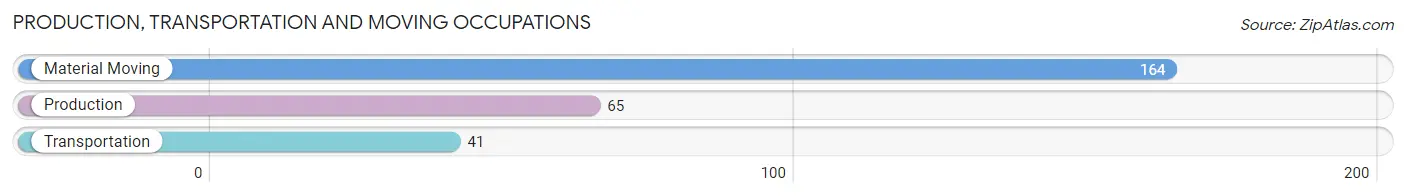
Production, Transportation and Moving Occupations
The most common Production, Transportation and Moving occupations in Odell are Material Moving (164 | 10.9%), Production (65 | 4.3%), and Transportation (41 | 2.7%).
Production, Transportation and Moving Occupations by Sex
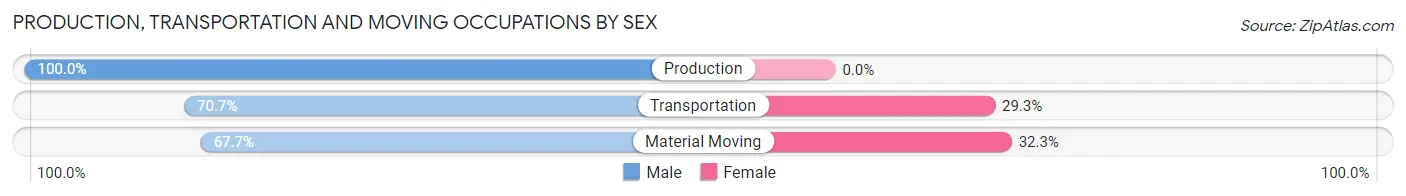
| Occupation | Male | Female |
| Production | 65 (100.0%) | 0 (0.0%) |
| Transportation | 29 (70.7%) | 12 (29.3%) |
| Material Moving | 111 (67.7%) | 53 (32.3%) |
| Total (Category) | 205 (75.9%) | 65 (24.1%) |
| Total (Overall) | 861 (57.1%) | 647 (42.9%) |
Employment Industries by Sex in Odell
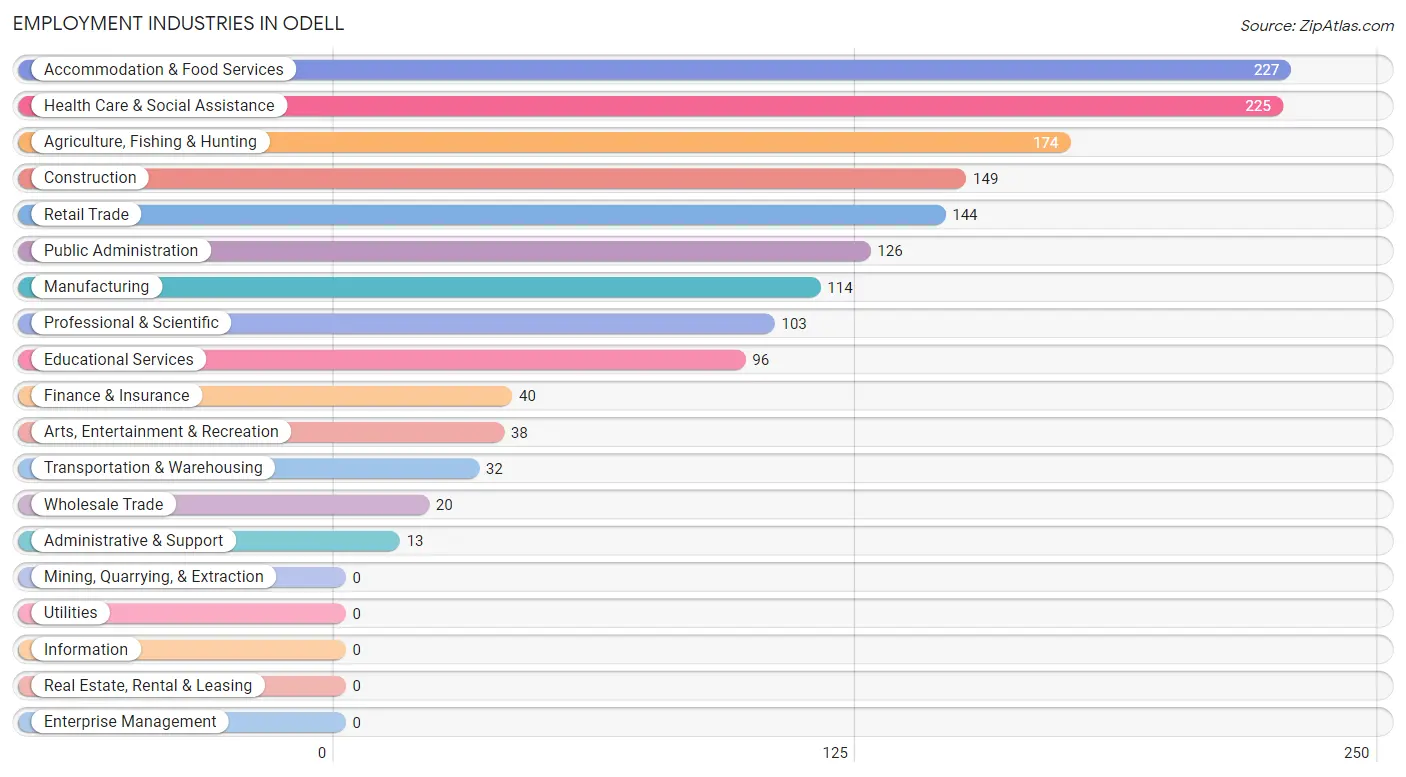
Employment Industries in Odell
The major employment industries in Odell include Accommodation & Food Services (227 | 15.0%), Health Care & Social Assistance (225 | 14.9%), Agriculture, Fishing & Hunting (174 | 11.5%), Construction (149 | 9.9%), and Retail Trade (144 | 9.6%).
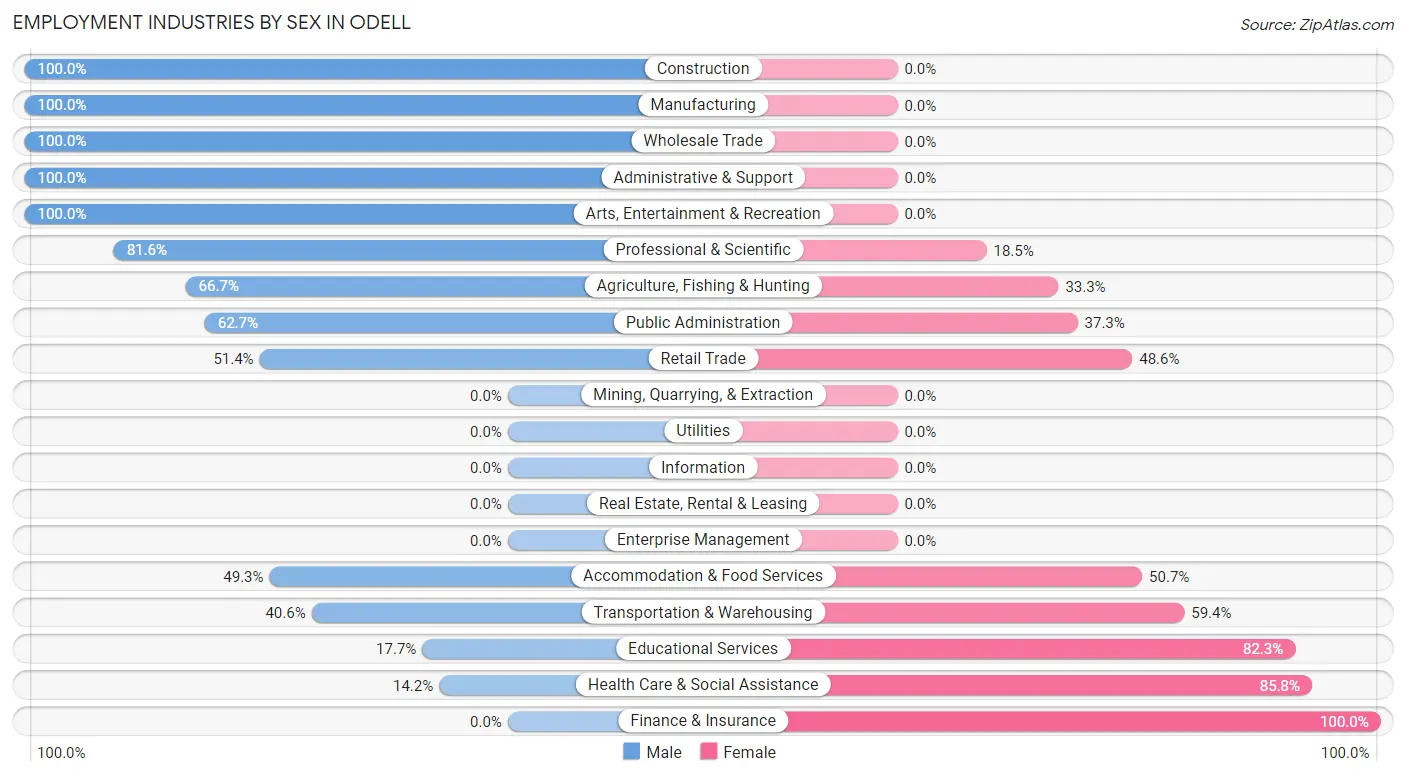
Employment Industries by Sex in Odell
The Odell industries that see more men than women are Construction (100.0%), Manufacturing (100.0%), and Wholesale Trade (100.0%), whereas the industries that tend to have a higher number of women are Finance & Insurance (100.0%), Health Care & Social Assistance (85.8%), and Educational Services (82.3%).
| Industry | Male | Female |
| Agriculture, Fishing & Hunting | 116 (66.7%) | 58 (33.3%) |
| Mining, Quarrying, & Extraction | 0 (0.0%) | 0 (0.0%) |
| Construction | 149 (100.0%) | 0 (0.0%) |
| Manufacturing | 114 (100.0%) | 0 (0.0%) |
| Wholesale Trade | 20 (100.0%) | 0 (0.0%) |
| Retail Trade | 74 (51.4%) | 70 (48.6%) |
| Transportation & Warehousing | 13 (40.6%) | 19 (59.4%) |
| Utilities | 0 (0.0%) | 0 (0.0%) |
| Information | 0 (0.0%) | 0 (0.0%) |
| Finance & Insurance | 0 (0.0%) | 40 (100.0%) |
| Real Estate, Rental & Leasing | 0 (0.0%) | 0 (0.0%) |
| Professional & Scientific | 84 (81.6%) | 19 (18.4%) |
| Enterprise Management | 0 (0.0%) | 0 (0.0%) |
| Administrative & Support | 13 (100.0%) | 0 (0.0%) |
| Educational Services | 17 (17.7%) | 79 (82.3%) |
| Health Care & Social Assistance | 32 (14.2%) | 193 (85.8%) |
| Arts, Entertainment & Recreation | 38 (100.0%) | 0 (0.0%) |
| Accommodation & Food Services | 112 (49.3%) | 115 (50.7%) |
| Public Administration | 79 (62.7%) | 47 (37.3%) |
| Total | 861 (57.1%) | 647 (42.9%) |
Education in Odell
School Enrollment in Odell
The most common levels of schooling among the 1,101 students in Odell are high school (338 | 30.7%), middle school (308 | 28.0%), and elementary school (269 | 24.4%).
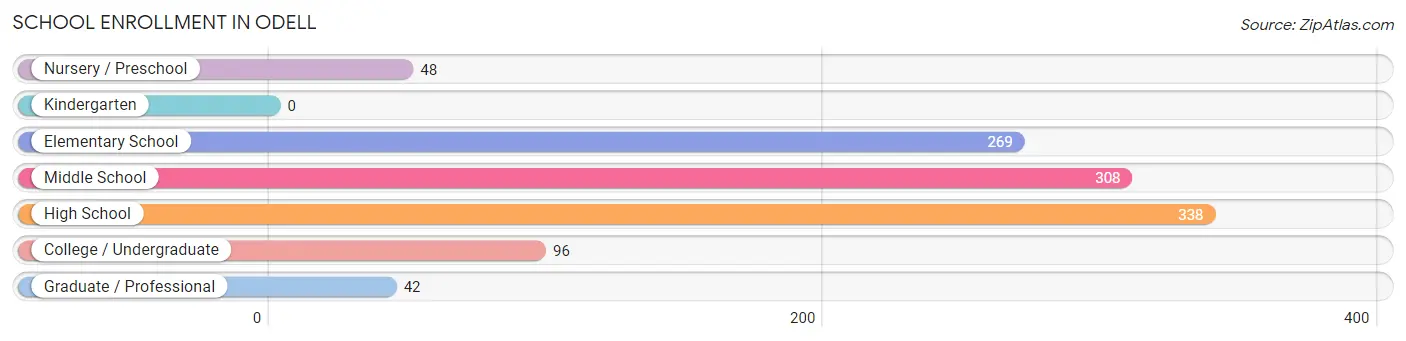
| School Level | # Students | % Students |
| Nursery / Preschool | 48 | 4.4% |
| Kindergarten | 0 | 0.0% |
| Elementary School | 269 | 24.4% |
| Middle School | 308 | 28.0% |
| High School | 338 | 30.7% |
| College / Undergraduate | 96 | 8.7% |
| Graduate / Professional | 42 | 3.8% |
| Total | 1,101 | 100.0% |
School Enrollment by Age by Funding Source in Odell
Out of a total of 1,101 students who are enrolled in schools in Odell, 13 (1.2%) attend a private institution, while the remaining 1,088 (98.8%) are enrolled in public schools. The age group of 25 to 34 year olds has the highest likelihood of being enrolled in private schools, with 13 (23.6% in the age bracket) enrolled. Conversely, the age group of 3 to 4 year olds has the lowest likelihood of being enrolled in a private school, with 21 (100.0% in the age bracket) attending a public institution.
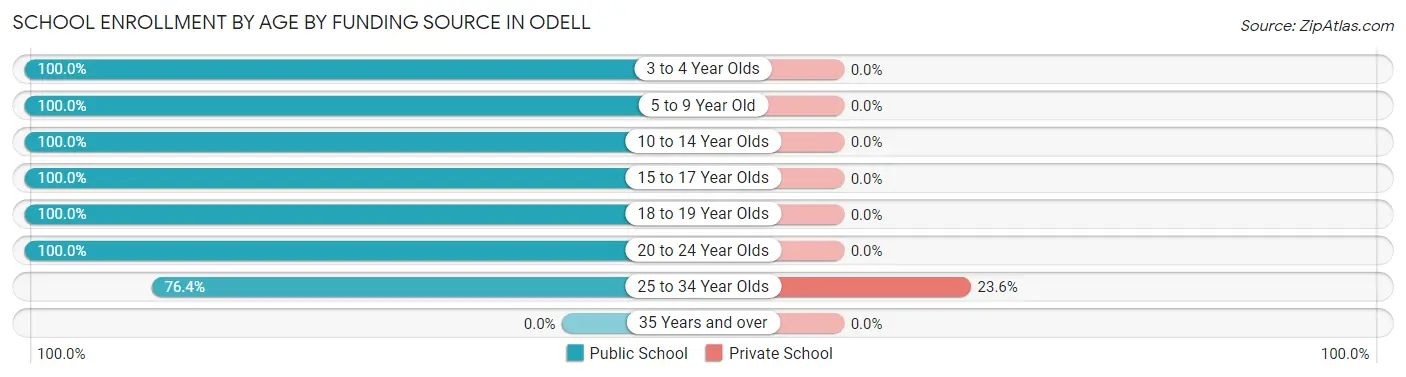
| Age Bracket | Public School | Private School |
| 3 to 4 Year Olds | 21 (100.0%) | 0 (0.0%) |
| 5 to 9 Year Old | 256 (100.0%) | 0 (0.0%) |
| 10 to 14 Year Olds | 348 (100.0%) | 0 (0.0%) |
| 15 to 17 Year Olds | 242 (100.0%) | 0 (0.0%) |
| 18 to 19 Year Olds | 128 (100.0%) | 0 (0.0%) |
| 20 to 24 Year Olds | 51 (100.0%) | 0 (0.0%) |
| 25 to 34 Year Olds | 42 (76.4%) | 13 (23.6%) |
| 35 Years and over | 0 (0.0%) | 0 (0.0%) |
| Total | 1,088 (98.8%) | 13 (1.2%) |
Educational Attainment by Field of Study in Odell
Social sciences (102 | 25.3%), business (89 | 22.0%), science & technology (57 | 14.1%), arts & humanities (42 | 10.4%), and education (36 | 8.9%) are the most common fields of study among 404 individuals in Odell who have obtained a bachelor's degree or higher.
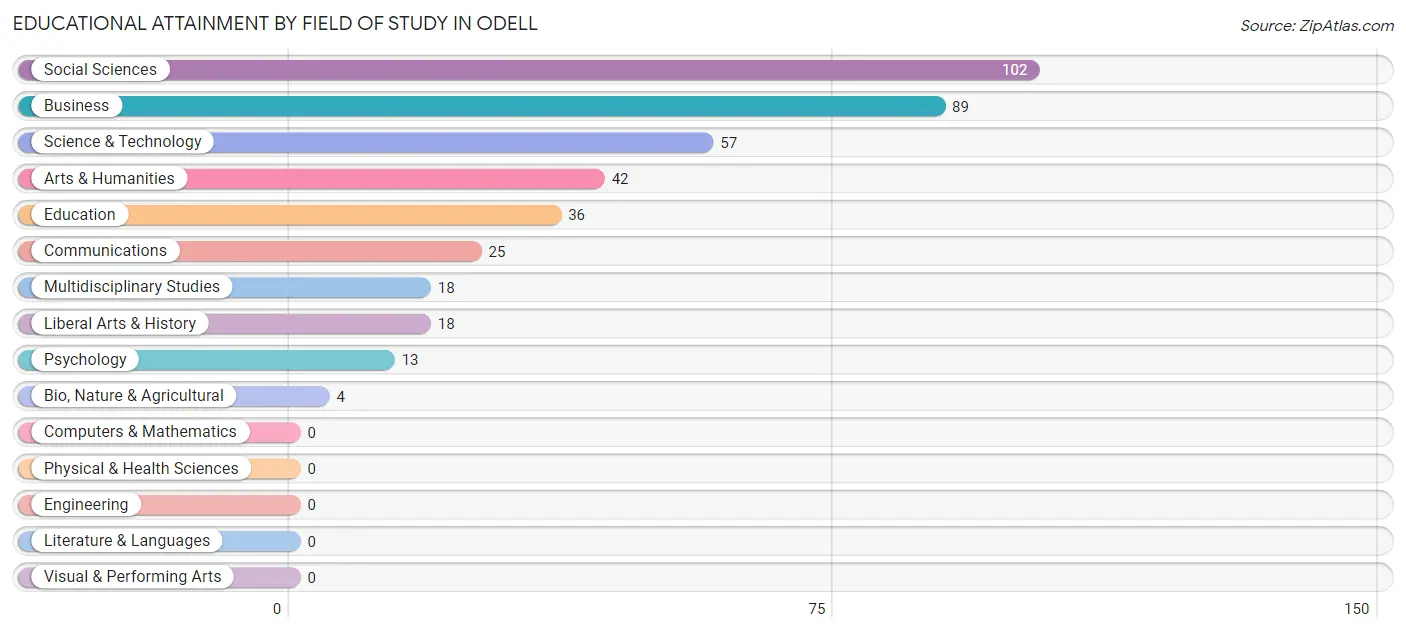
| Field of Study | # Graduates | % Graduates |
| Computers & Mathematics | 0 | 0.0% |
| Bio, Nature & Agricultural | 4 | 1.0% |
| Physical & Health Sciences | 0 | 0.0% |
| Psychology | 13 | 3.2% |
| Social Sciences | 102 | 25.3% |
| Engineering | 0 | 0.0% |
| Multidisciplinary Studies | 18 | 4.5% |
| Science & Technology | 57 | 14.1% |
| Business | 89 | 22.0% |
| Education | 36 | 8.9% |
| Literature & Languages | 0 | 0.0% |
| Liberal Arts & History | 18 | 4.5% |
| Visual & Performing Arts | 0 | 0.0% |
| Communications | 25 | 6.2% |
| Arts & Humanities | 42 | 10.4% |
| Total | 404 | 100.0% |
Transportation & Commute in Odell
Vehicle Availability by Sex in Odell
The most prevalent vehicle ownership categories in Odell are males with 3 vehicles (277, accounting for 32.6%) and females with 3 vehicles (259, making up 42.8%).
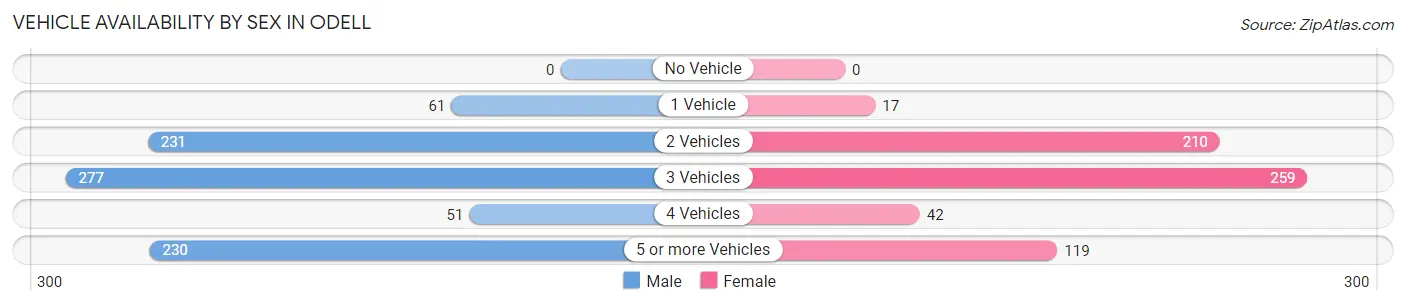
| Vehicles Available | Male | Female |
| No Vehicle | 0 (0.0%) | 0 (0.0%) |
| 1 Vehicle | 61 (7.2%) | 17 (2.6%) |
| 2 Vehicles | 231 (27.2%) | 210 (32.5%) |
| 3 Vehicles | 277 (32.6%) | 259 (40.0%) |
| 4 Vehicles | 51 (6.0%) | 42 (6.5%) |
| 5 or more Vehicles | 230 (27.1%) | 119 (18.4%) |
| Total | 850 (100.0%) | 647 (100.0%) |
Commute Time in Odell
The most frequently occuring commute durations in Odell are 15 to 19 minutes (471 commuters, 32.6%), 10 to 14 minutes (321 commuters, 22.2%), and 5 to 9 minutes (235 commuters, 16.2%).
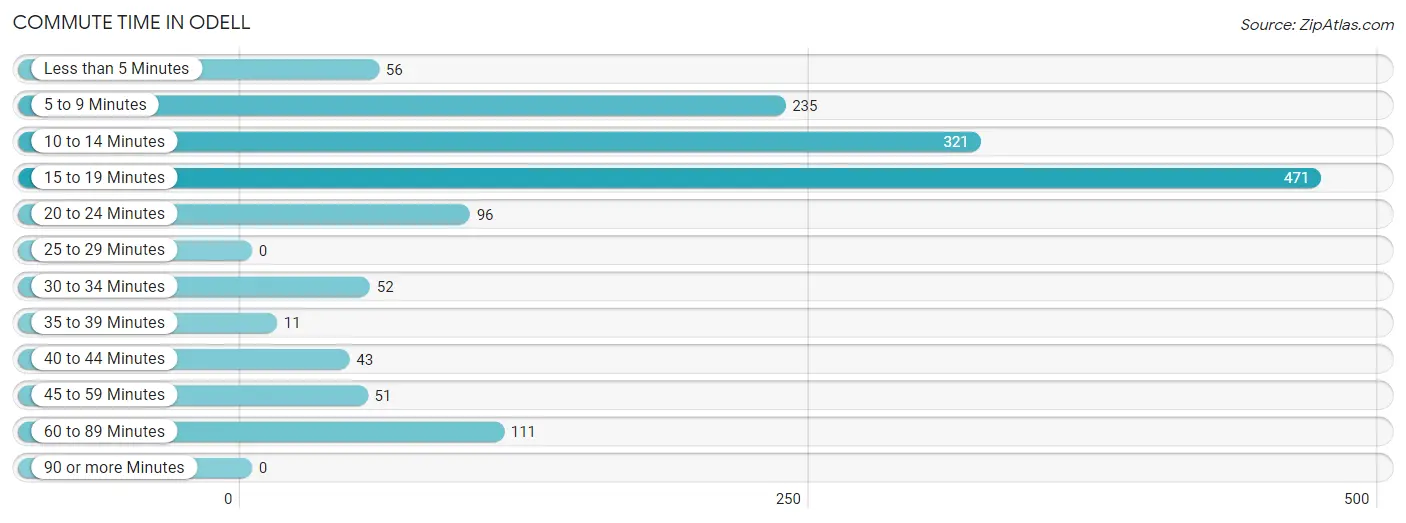
| Commute Time | # Commuters | % Commuters |
| Less than 5 Minutes | 56 | 3.9% |
| 5 to 9 Minutes | 235 | 16.2% |
| 10 to 14 Minutes | 321 | 22.2% |
| 15 to 19 Minutes | 471 | 32.6% |
| 20 to 24 Minutes | 96 | 6.6% |
| 25 to 29 Minutes | 0 | 0.0% |
| 30 to 34 Minutes | 52 | 3.6% |
| 35 to 39 Minutes | 11 | 0.8% |
| 40 to 44 Minutes | 43 | 3.0% |
| 45 to 59 Minutes | 51 | 3.5% |
| 60 to 89 Minutes | 111 | 7.7% |
| 90 or more Minutes | 0 | 0.0% |
Commute Time by Sex in Odell
The most common commute times in Odell are 15 to 19 minutes (332 commuters, 39.9%) for males and 10 to 14 minutes (259 commuters, 42.1%) for females.
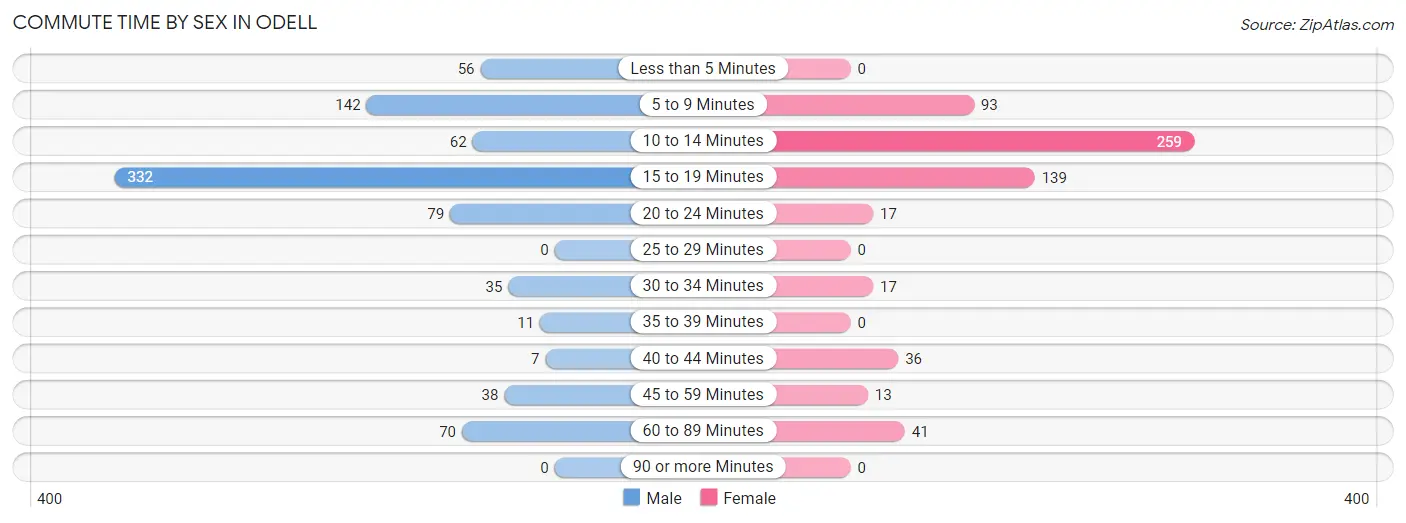
| Commute Time | Male | Female |
| Less than 5 Minutes | 56 (6.7%) | 0 (0.0%) |
| 5 to 9 Minutes | 142 (17.1%) | 93 (15.1%) |
| 10 to 14 Minutes | 62 (7.4%) | 259 (42.1%) |
| 15 to 19 Minutes | 332 (39.9%) | 139 (22.6%) |
| 20 to 24 Minutes | 79 (9.5%) | 17 (2.8%) |
| 25 to 29 Minutes | 0 (0.0%) | 0 (0.0%) |
| 30 to 34 Minutes | 35 (4.2%) | 17 (2.8%) |
| 35 to 39 Minutes | 11 (1.3%) | 0 (0.0%) |
| 40 to 44 Minutes | 7 (0.8%) | 36 (5.9%) |
| 45 to 59 Minutes | 38 (4.6%) | 13 (2.1%) |
| 60 to 89 Minutes | 70 (8.4%) | 41 (6.7%) |
| 90 or more Minutes | 0 (0.0%) | 0 (0.0%) |
Time of Departure to Work by Sex in Odell
The most frequent times of departure to work in Odell are 6:30 AM to 6:59 AM (161, 19.4%) for males and 12:00 PM to 3:59 PM (101, 16.4%) for females.
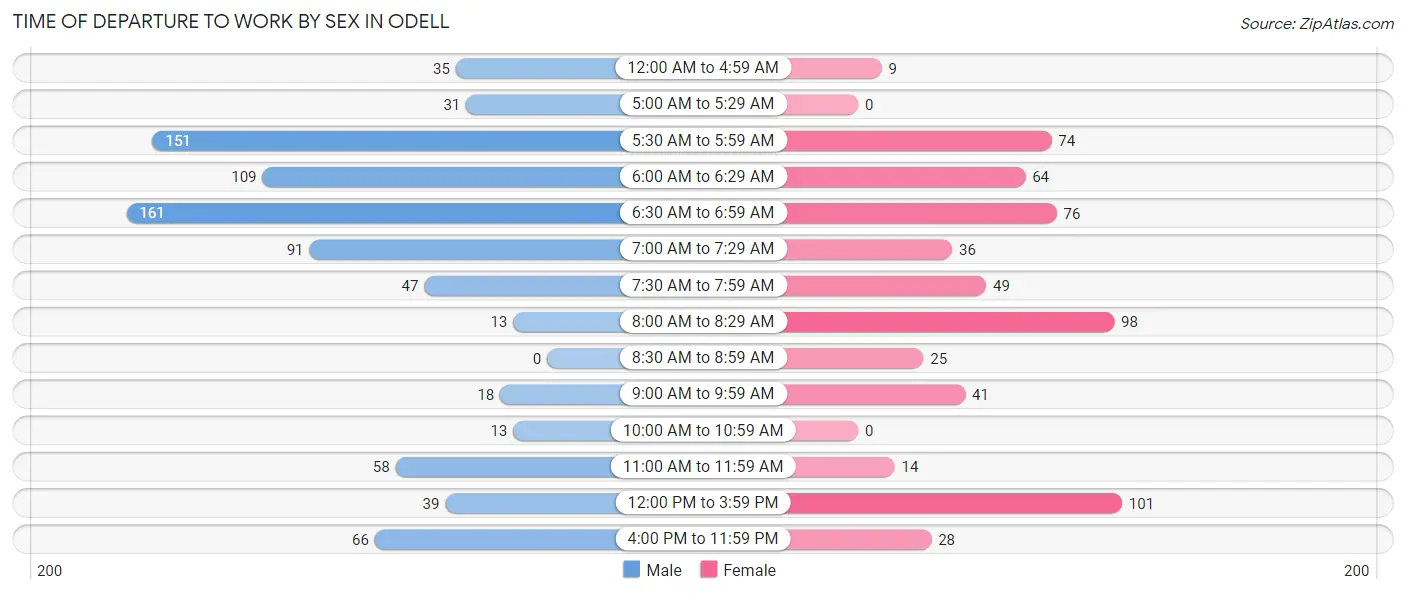
| Time of Departure | Male | Female |
| 12:00 AM to 4:59 AM | 35 (4.2%) | 9 (1.5%) |
| 5:00 AM to 5:29 AM | 31 (3.7%) | 0 (0.0%) |
| 5:30 AM to 5:59 AM | 151 (18.1%) | 74 (12.0%) |
| 6:00 AM to 6:29 AM | 109 (13.1%) | 64 (10.4%) |
| 6:30 AM to 6:59 AM | 161 (19.4%) | 76 (12.4%) |
| 7:00 AM to 7:29 AM | 91 (10.9%) | 36 (5.9%) |
| 7:30 AM to 7:59 AM | 47 (5.7%) | 49 (8.0%) |
| 8:00 AM to 8:29 AM | 13 (1.6%) | 98 (15.9%) |
| 8:30 AM to 8:59 AM | 0 (0.0%) | 25 (4.1%) |
| 9:00 AM to 9:59 AM | 18 (2.2%) | 41 (6.7%) |
| 10:00 AM to 10:59 AM | 13 (1.6%) | 0 (0.0%) |
| 11:00 AM to 11:59 AM | 58 (7.0%) | 14 (2.3%) |
| 12:00 PM to 3:59 PM | 39 (4.7%) | 101 (16.4%) |
| 4:00 PM to 11:59 PM | 66 (7.9%) | 28 (4.5%) |
| Total | 832 (100.0%) | 615 (100.0%) |
Housing Occupancy in Odell
Occupancy by Ownership in Odell
Of the total 768 dwellings in Odell, owner-occupied units account for 714 (93.0%), while renter-occupied units make up 54 (7.0%).
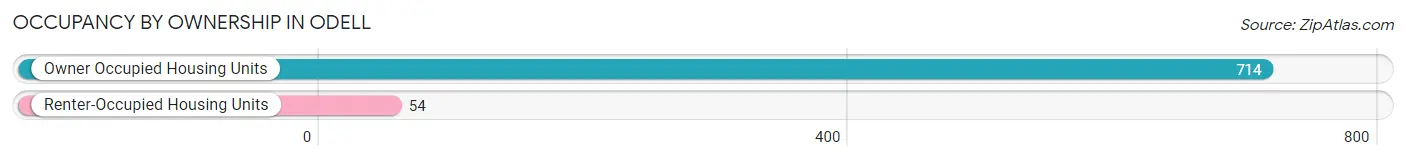
| Occupancy | # Housing Units | % Housing Units |
| Owner Occupied Housing Units | 714 | 93.0% |
| Renter-Occupied Housing Units | 54 | 7.0% |
| Total Occupied Housing Units | 768 | 100.0% |
Occupancy by Household Size in Odell
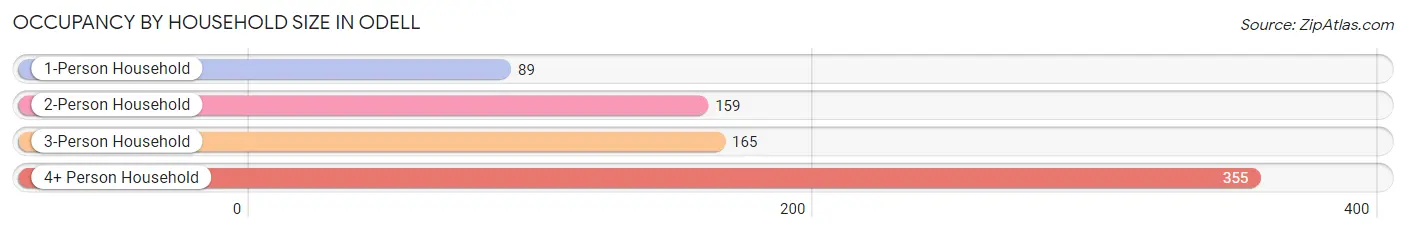
| Household Size | # Housing Units | % Housing Units |
| 1-Person Household | 89 | 11.6% |
| 2-Person Household | 159 | 20.7% |
| 3-Person Household | 165 | 21.5% |
| 4+ Person Household | 355 | 46.2% |
| Total Housing Units | 768 | 100.0% |
Occupancy by Ownership by Household Size in Odell
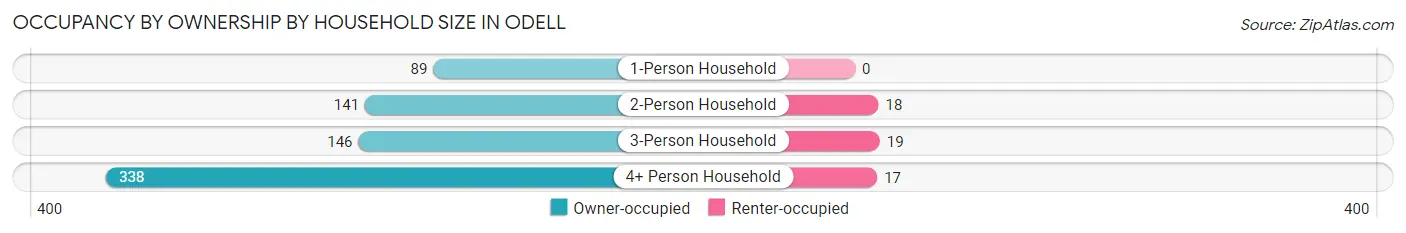
| Household Size | Owner-occupied | Renter-occupied |
| 1-Person Household | 89 (100.0%) | 0 (0.0%) |
| 2-Person Household | 141 (88.7%) | 18 (11.3%) |
| 3-Person Household | 146 (88.5%) | 19 (11.5%) |
| 4+ Person Household | 338 (95.2%) | 17 (4.8%) |
| Total Housing Units | 714 (93.0%) | 54 (7.0%) |
Occupancy by Educational Attainment in Odell
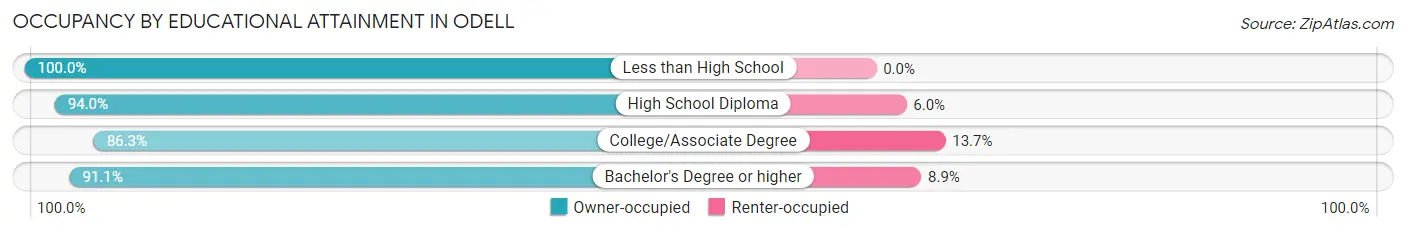
| Household Size | Owner-occupied | Renter-occupied |
| Less than High School | 125 (100.0%) | 0 (0.0%) |
| High School Diploma | 298 (94.0%) | 19 (6.0%) |
| College/Associate Degree | 107 (86.3%) | 17 (13.7%) |
| Bachelor's Degree or higher | 184 (91.1%) | 18 (8.9%) |
Occupancy by Age of Householder in Odell
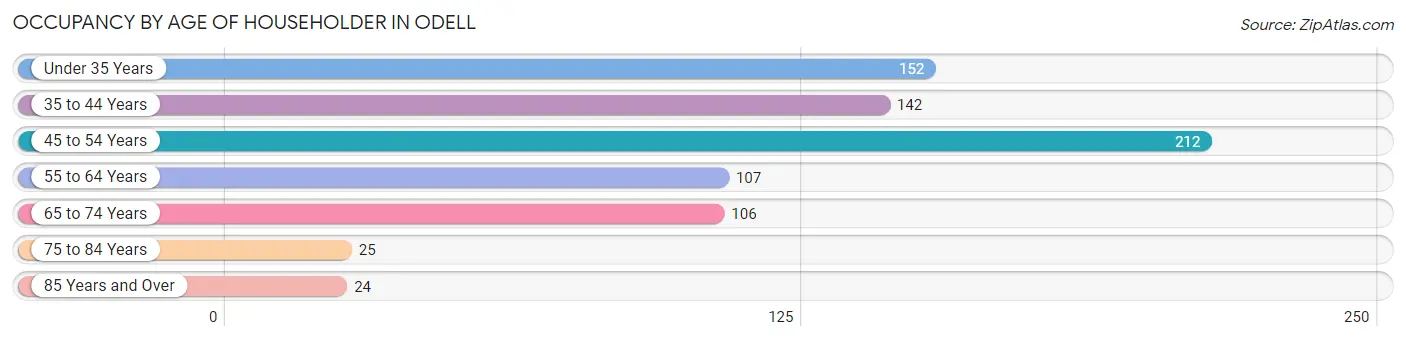
| Age Bracket | # Households | % Households |
| Under 35 Years | 152 | 19.8% |
| 35 to 44 Years | 142 | 18.5% |
| 45 to 54 Years | 212 | 27.6% |
| 55 to 64 Years | 107 | 13.9% |
| 65 to 74 Years | 106 | 13.8% |
| 75 to 84 Years | 25 | 3.3% |
| 85 Years and Over | 24 | 3.1% |
| Total | 768 | 100.0% |
Housing Finances in Odell
Median Income by Occupancy in Odell
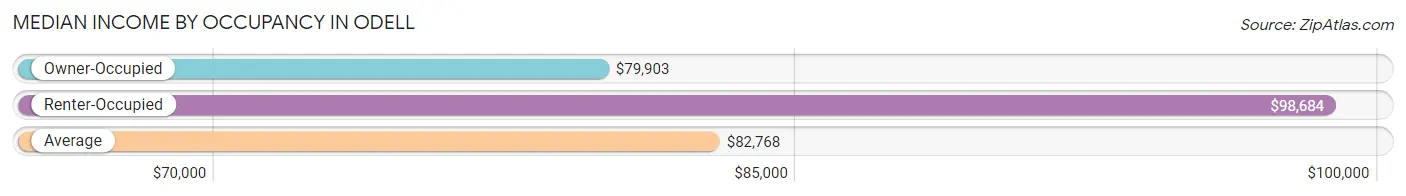
| Occupancy Type | # Households | Median Income |
| Owner-Occupied | 714 (93.0%) | $79,903 |
| Renter-Occupied | 54 (7.0%) | $98,684 |
| Average | 768 (100.0%) | $82,768 |
Occupancy by Householder Income Bracket in Odell
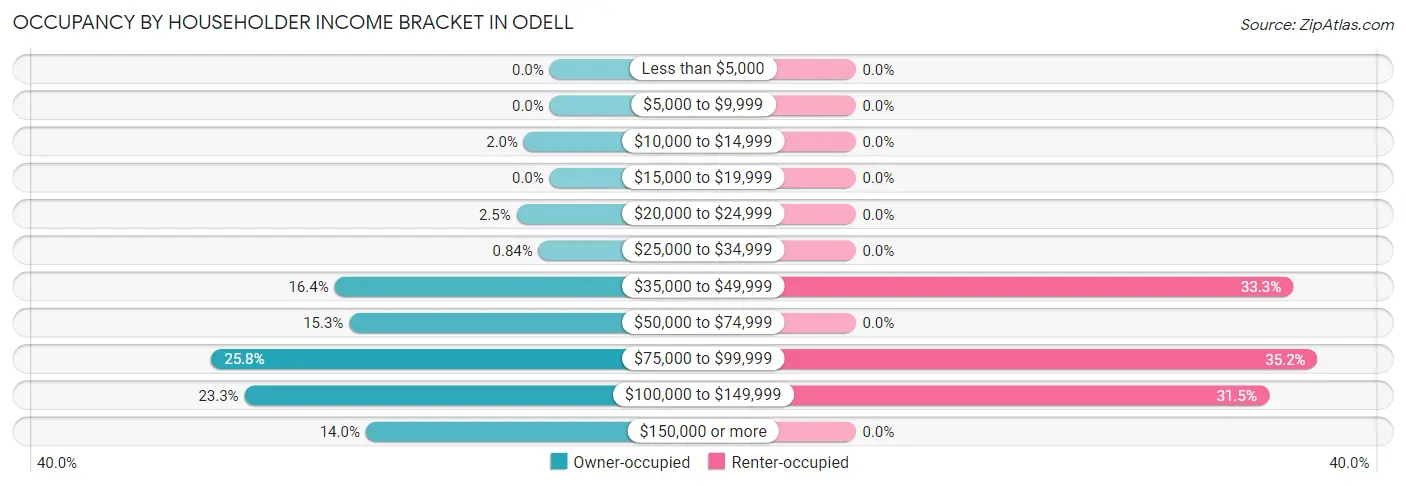
| Income Bracket | Owner-occupied | Renter-occupied |
| Less than $5,000 | 0 (0.0%) | 0 (0.0%) |
| $5,000 to $9,999 | 0 (0.0%) | 0 (0.0%) |
| $10,000 to $14,999 | 14 (2.0%) | 0 (0.0%) |
| $15,000 to $19,999 | 0 (0.0%) | 0 (0.0%) |
| $20,000 to $24,999 | 18 (2.5%) | 0 (0.0%) |
| $25,000 to $34,999 | 6 (0.8%) | 0 (0.0%) |
| $35,000 to $49,999 | 117 (16.4%) | 18 (33.3%) |
| $50,000 to $74,999 | 109 (15.3%) | 0 (0.0%) |
| $75,000 to $99,999 | 184 (25.8%) | 19 (35.2%) |
| $100,000 to $149,999 | 166 (23.3%) | 17 (31.5%) |
| $150,000 or more | 100 (14.0%) | 0 (0.0%) |
| Total | 714 (100.0%) | 54 (100.0%) |
Monthly Housing Cost Tiers in Odell
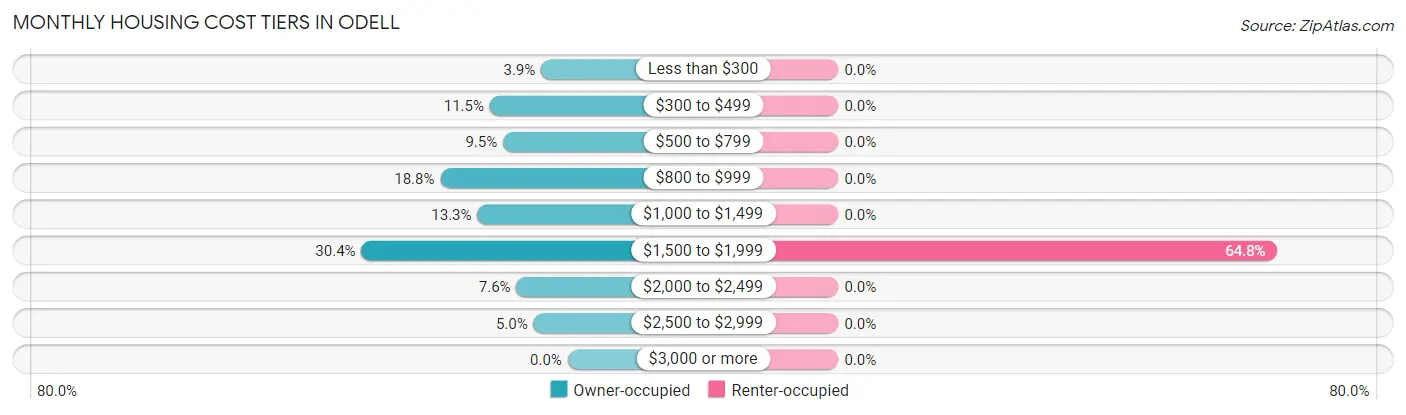
| Monthly Cost | Owner-occupied | Renter-occupied |
| Less than $300 | 28 (3.9%) | 0 (0.0%) |
| $300 to $499 | 82 (11.5%) | 0 (0.0%) |
| $500 to $799 | 68 (9.5%) | 0 (0.0%) |
| $800 to $999 | 134 (18.8%) | 0 (0.0%) |
| $1,000 to $1,499 | 95 (13.3%) | 0 (0.0%) |
| $1,500 to $1,999 | 217 (30.4%) | 35 (64.8%) |
| $2,000 to $2,499 | 54 (7.6%) | 0 (0.0%) |
| $2,500 to $2,999 | 36 (5.0%) | 0 (0.0%) |
| $3,000 or more | 0 (0.0%) | 0 (0.0%) |
| Total | 714 (100.0%) | 54 (100.0%) |
Physical Housing Characteristics in Odell
Housing Structures in Odell
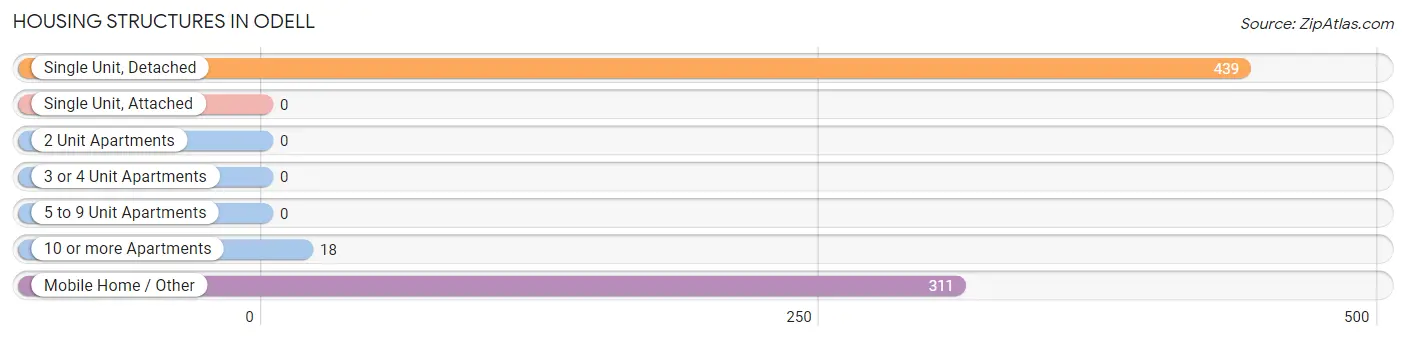
| Structure Type | # Housing Units | % Housing Units |
| Single Unit, Detached | 439 | 57.2% |
| Single Unit, Attached | 0 | 0.0% |
| 2 Unit Apartments | 0 | 0.0% |
| 3 or 4 Unit Apartments | 0 | 0.0% |
| 5 to 9 Unit Apartments | 0 | 0.0% |
| 10 or more Apartments | 18 | 2.3% |
| Mobile Home / Other | 311 | 40.5% |
| Total | 768 | 100.0% |
Housing Structures by Occupancy in Odell
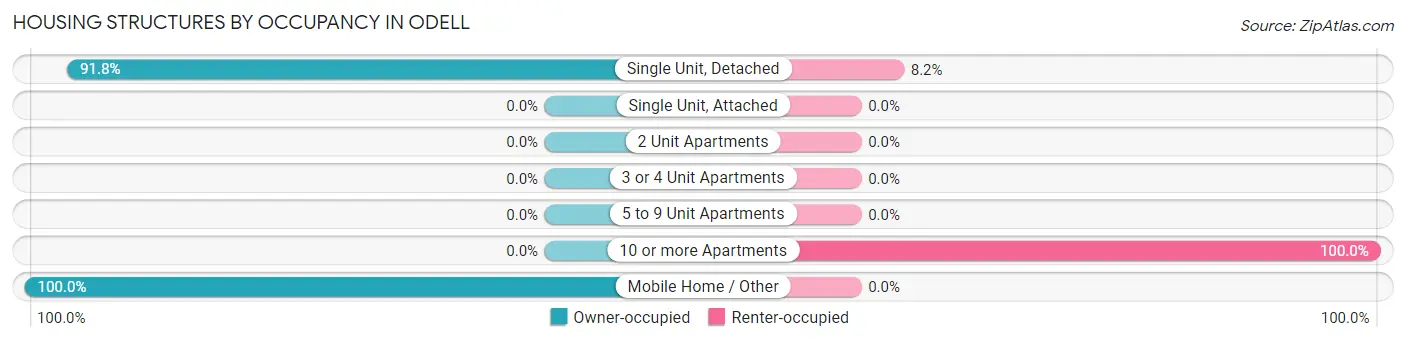
| Structure Type | Owner-occupied | Renter-occupied |
| Single Unit, Detached | 403 (91.8%) | 36 (8.2%) |
| Single Unit, Attached | 0 (0.0%) | 0 (0.0%) |
| 2 Unit Apartments | 0 (0.0%) | 0 (0.0%) |
| 3 or 4 Unit Apartments | 0 (0.0%) | 0 (0.0%) |
| 5 to 9 Unit Apartments | 0 (0.0%) | 0 (0.0%) |
| 10 or more Apartments | 0 (0.0%) | 18 (100.0%) |
| Mobile Home / Other | 311 (100.0%) | 0 (0.0%) |
| Total | 714 (93.0%) | 54 (7.0%) |
Housing Structures by Number of Rooms in Odell
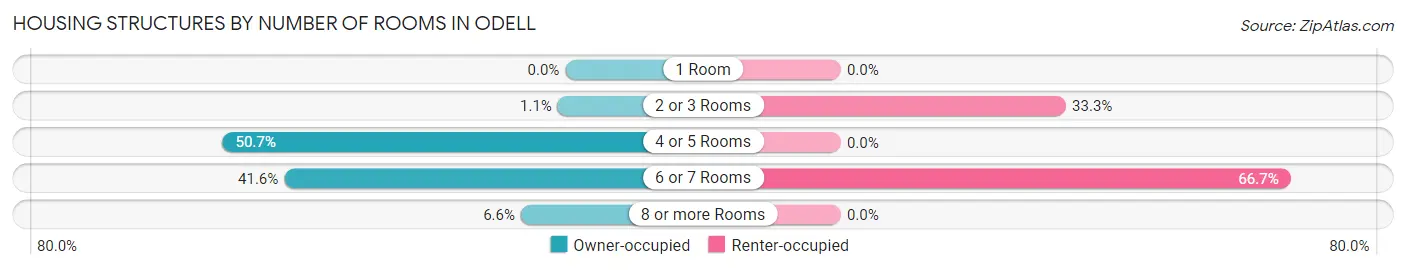
| Number of Rooms | Owner-occupied | Renter-occupied |
| 1 Room | 0 (0.0%) | 0 (0.0%) |
| 2 or 3 Rooms | 8 (1.1%) | 18 (33.3%) |
| 4 or 5 Rooms | 362 (50.7%) | 0 (0.0%) |
| 6 or 7 Rooms | 297 (41.6%) | 36 (66.7%) |
| 8 or more Rooms | 47 (6.6%) | 0 (0.0%) |
| Total | 714 (100.0%) | 54 (100.0%) |
Housing Structure by Heating Type in Odell
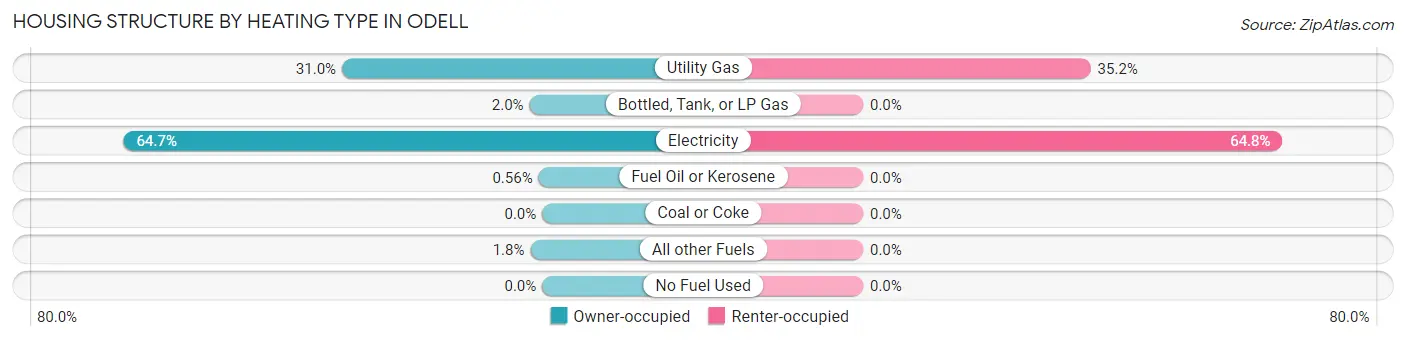
| Heating Type | Owner-occupied | Renter-occupied |
| Utility Gas | 221 (30.9%) | 19 (35.2%) |
| Bottled, Tank, or LP Gas | 14 (2.0%) | 0 (0.0%) |
| Electricity | 462 (64.7%) | 35 (64.8%) |
| Fuel Oil or Kerosene | 4 (0.6%) | 0 (0.0%) |
| Coal or Coke | 0 (0.0%) | 0 (0.0%) |
| All other Fuels | 13 (1.8%) | 0 (0.0%) |
| No Fuel Used | 0 (0.0%) | 0 (0.0%) |
| Total | 714 (100.0%) | 54 (100.0%) |
Household Vehicle Usage in Odell
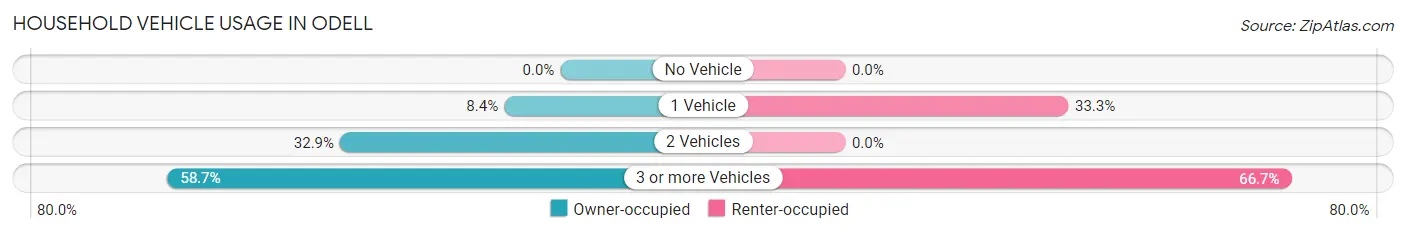
| Vehicles per Household | Owner-occupied | Renter-occupied |
| No Vehicle | 0 (0.0%) | 0 (0.0%) |
| 1 Vehicle | 60 (8.4%) | 18 (33.3%) |
| 2 Vehicles | 235 (32.9%) | 0 (0.0%) |
| 3 or more Vehicles | 419 (58.7%) | 36 (66.7%) |
| Total | 714 (100.0%) | 54 (100.0%) |
Real Estate & Mortgages in Odell
Real Estate and Mortgage Overview in Odell
| Characteristic | Without Mortgage | With Mortgage |
| Housing Units | 323 | 391 |
| Median Property Value | - | - |
| Median Household Income | $78,801 | $49 |
| Monthly Housing Costs | $731 | $0 |
| Real Estate Taxes | $933 | $13 |
Property Value by Mortgage Status in Odell
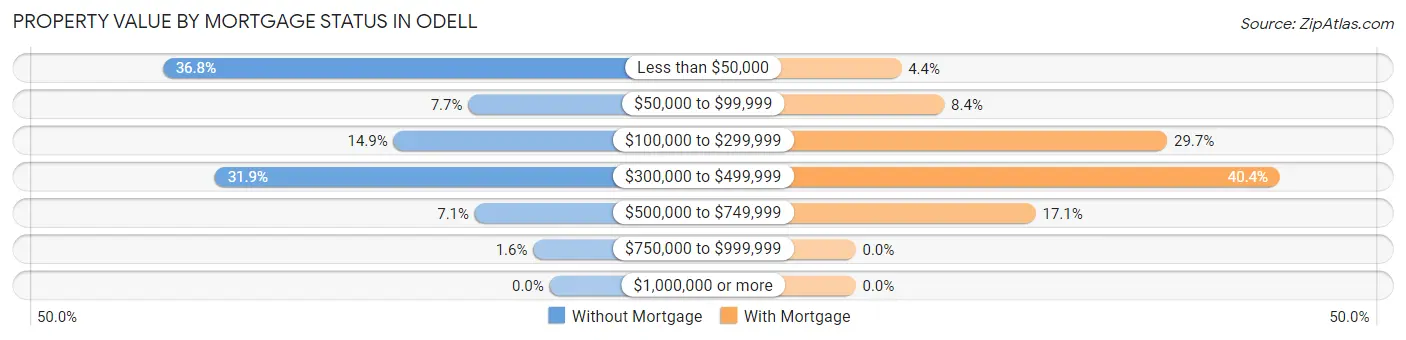
| Property Value | Without Mortgage | With Mortgage |
| Less than $50,000 | 119 (36.8%) | 17 (4.3%) |
| $50,000 to $99,999 | 25 (7.7%) | 33 (8.4%) |
| $100,000 to $299,999 | 48 (14.9%) | 116 (29.7%) |
| $300,000 to $499,999 | 103 (31.9%) | 158 (40.4%) |
| $500,000 to $749,999 | 23 (7.1%) | 67 (17.1%) |
| $750,000 to $999,999 | 5 (1.5%) | 0 (0.0%) |
| $1,000,000 or more | 0 (0.0%) | 0 (0.0%) |
| Total | 323 (100.0%) | 391 (100.0%) |
Household Income by Mortgage Status in Odell
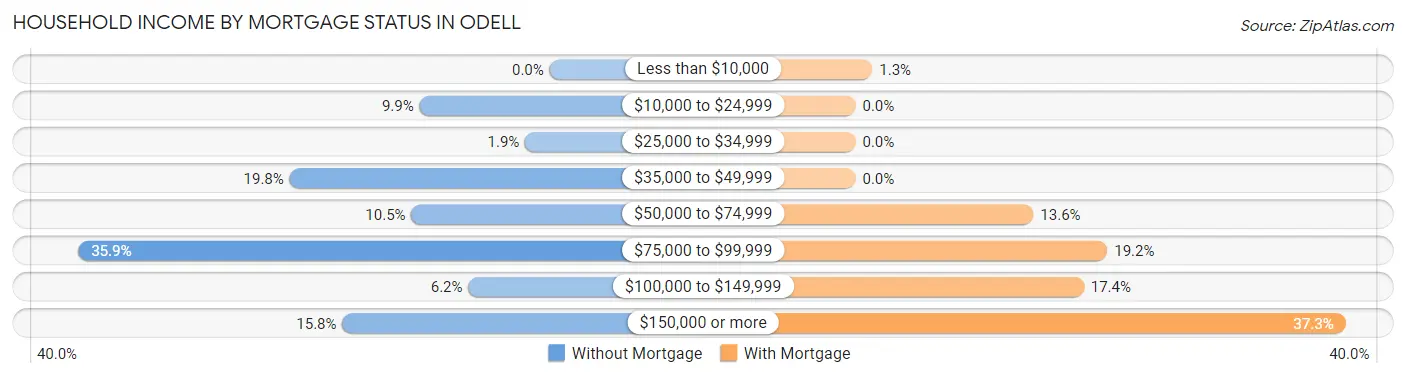
| Household Income | Without Mortgage | With Mortgage |
| Less than $10,000 | 0 (0.0%) | 5 (1.3%) |
| $10,000 to $24,999 | 32 (9.9%) | 0 (0.0%) |
| $25,000 to $34,999 | 6 (1.9%) | 0 (0.0%) |
| $35,000 to $49,999 | 64 (19.8%) | 0 (0.0%) |
| $50,000 to $74,999 | 34 (10.5%) | 53 (13.6%) |
| $75,000 to $99,999 | 116 (35.9%) | 75 (19.2%) |
| $100,000 to $149,999 | 20 (6.2%) | 68 (17.4%) |
| $150,000 or more | 51 (15.8%) | 146 (37.3%) |
| Total | 323 (100.0%) | 391 (100.0%) |
Property Value to Household Income Ratio in Odell
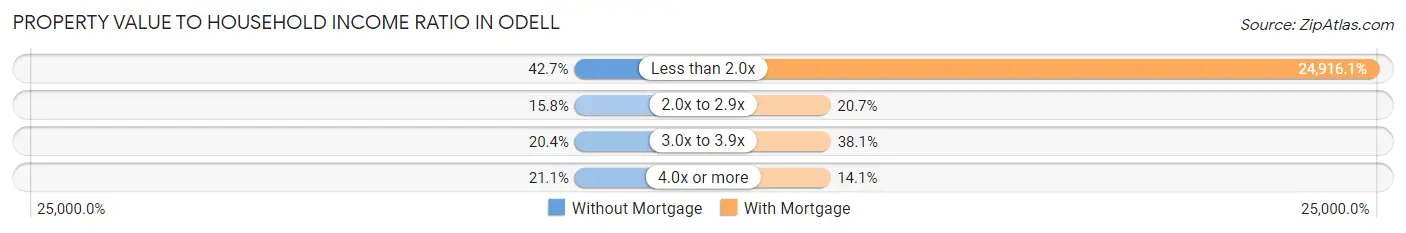
| Value-to-Income Ratio | Without Mortgage | With Mortgage |
| Less than 2.0x | 138 (42.7%) | 97,422 (24,916.1%) |
| 2.0x to 2.9x | 51 (15.8%) | 81 (20.7%) |
| 3.0x to 3.9x | 66 (20.4%) | 149 (38.1%) |
| 4.0x or more | 68 (21.0%) | 55 (14.1%) |
| Total | 323 (100.0%) | 391 (100.0%) |
Real Estate Taxes by Mortgage Status in Odell
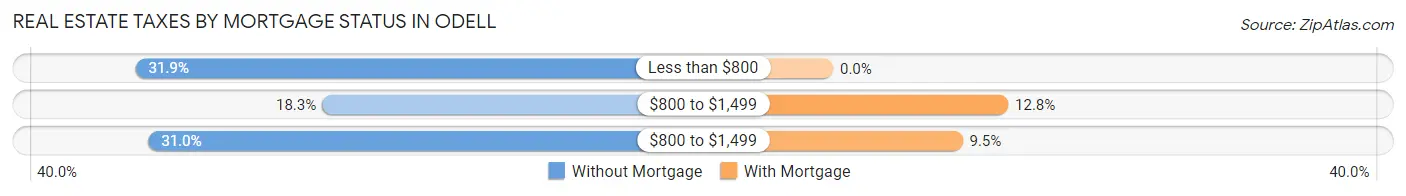
| Property Taxes | Without Mortgage | With Mortgage |
| Less than $800 | 103 (31.9%) | 0 (0.0%) |
| $800 to $1,499 | 59 (18.3%) | 50 (12.8%) |
| $800 to $1,499 | 100 (31.0%) | 37 (9.5%) |
| Total | 323 (100.0%) | 391 (100.0%) |
Health & Disability in Odell
Health Insurance Coverage by Age in Odell
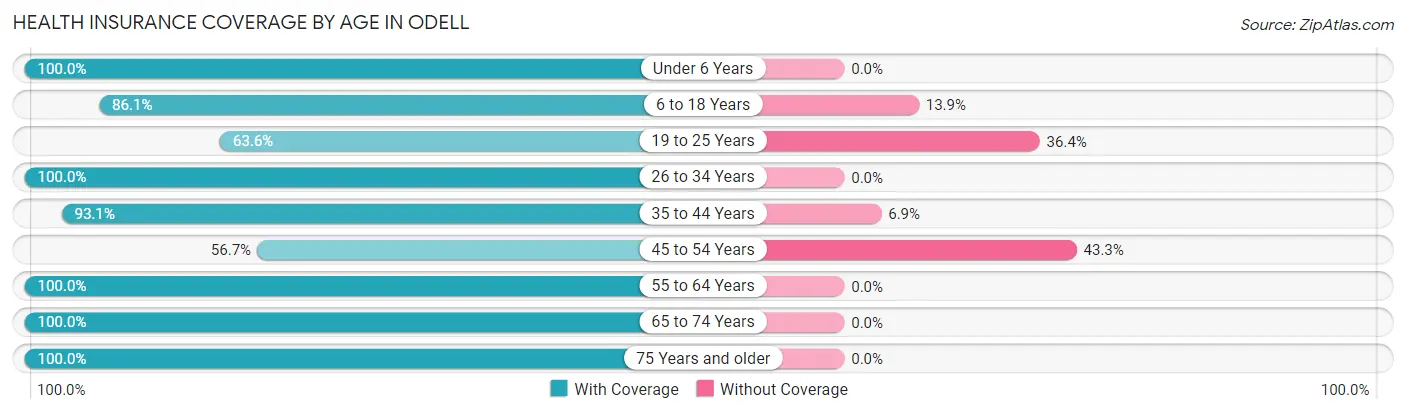
| Age Bracket | With Coverage | Without Coverage |
| Under 6 Years | 243 (100.0%) | 0 (0.0%) |
| 6 to 18 Years | 775 (86.1%) | 125 (13.9%) |
| 19 to 25 Years | 178 (63.6%) | 102 (36.4%) |
| 26 to 34 Years | 390 (100.0%) | 0 (0.0%) |
| 35 to 44 Years | 297 (93.1%) | 22 (6.9%) |
| 45 to 54 Years | 208 (56.7%) | 159 (43.3%) |
| 55 to 64 Years | 207 (100.0%) | 0 (0.0%) |
| 65 to 74 Years | 191 (100.0%) | 0 (0.0%) |
| 75 Years and older | 106 (100.0%) | 0 (0.0%) |
| Total | 2,595 (86.4%) | 408 (13.6%) |
Health Insurance Coverage by Citizenship Status in Odell
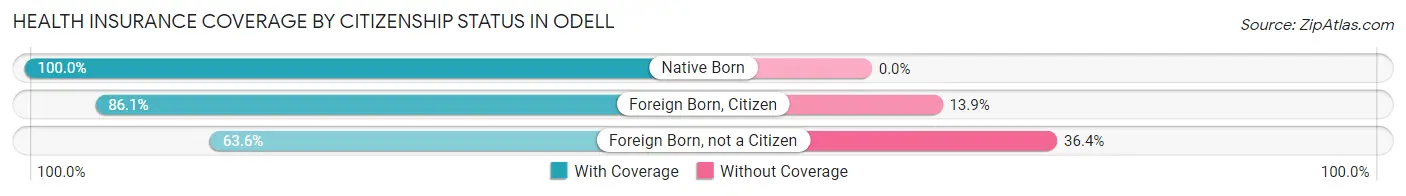
| Citizenship Status | With Coverage | Without Coverage |
| Native Born | 243 (100.0%) | 0 (0.0%) |
| Foreign Born, Citizen | 775 (86.1%) | 125 (13.9%) |
| Foreign Born, not a Citizen | 178 (63.6%) | 102 (36.4%) |
Health Insurance Coverage by Household Income in Odell
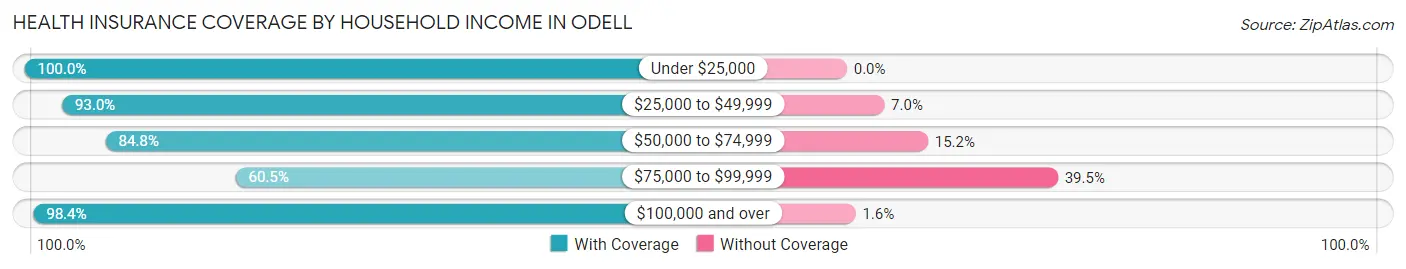
| Household Income | With Coverage | Without Coverage |
| Under $25,000 | 57 (100.0%) | 0 (0.0%) |
| $25,000 to $49,999 | 412 (93.0%) | 31 (7.0%) |
| $50,000 to $74,999 | 509 (84.8%) | 91 (15.2%) |
| $75,000 to $99,999 | 407 (60.5%) | 266 (39.5%) |
| $100,000 and over | 1,210 (98.4%) | 20 (1.6%) |
Public vs Private Health Insurance Coverage by Age in Odell
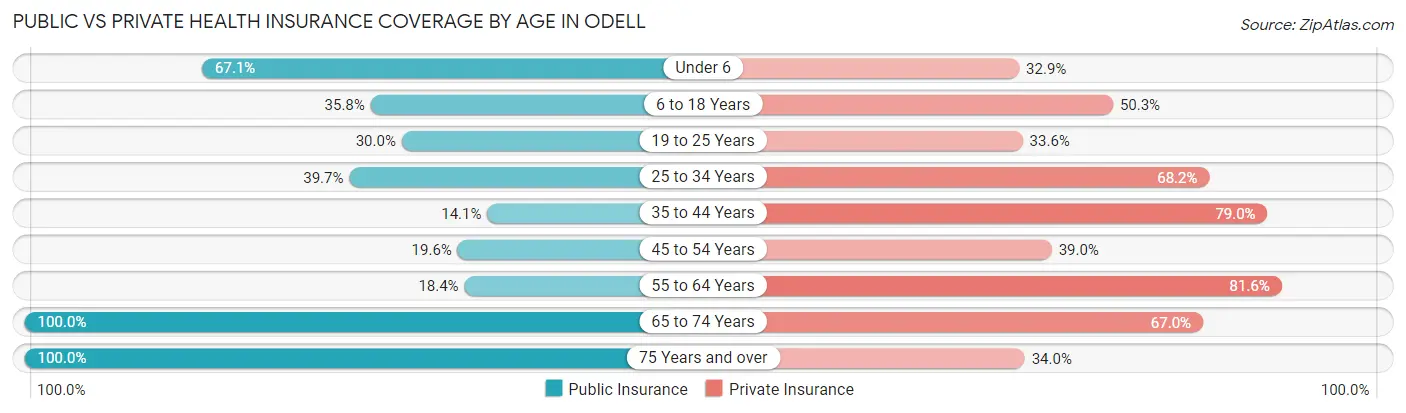
| Age Bracket | Public Insurance | Private Insurance |
| Under 6 | 163 (67.1%) | 80 (32.9%) |
| 6 to 18 Years | 322 (35.8%) | 453 (50.3%) |
| 19 to 25 Years | 84 (30.0%) | 94 (33.6%) |
| 25 to 34 Years | 155 (39.7%) | 266 (68.2%) |
| 35 to 44 Years | 45 (14.1%) | 252 (79.0%) |
| 45 to 54 Years | 72 (19.6%) | 143 (39.0%) |
| 55 to 64 Years | 38 (18.4%) | 169 (81.6%) |
| 65 to 74 Years | 191 (100.0%) | 128 (67.0%) |
| 75 Years and over | 106 (100.0%) | 36 (34.0%) |
| Total | 1,176 (39.2%) | 1,621 (54.0%) |
Disability Status by Sex by Age in Odell
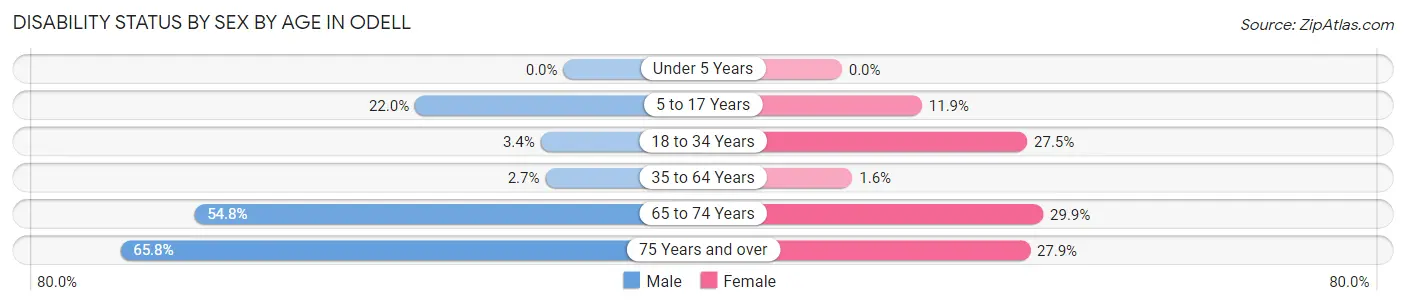
| Age Bracket | Male | Female |
| Under 5 Years | 0 (0.0%) | 0 (0.0%) |
| 5 to 17 Years | 89 (22.0%) | 54 (11.9%) |
| 18 to 34 Years | 13 (3.4%) | 101 (27.5%) |
| 35 to 64 Years | 12 (2.7%) | 7 (1.6%) |
| 65 to 74 Years | 57 (54.8%) | 26 (29.9%) |
| 75 Years and over | 25 (65.8%) | 19 (27.9%) |
Disability Class by Sex by Age in Odell
Disability Class: Hearing Difficulty
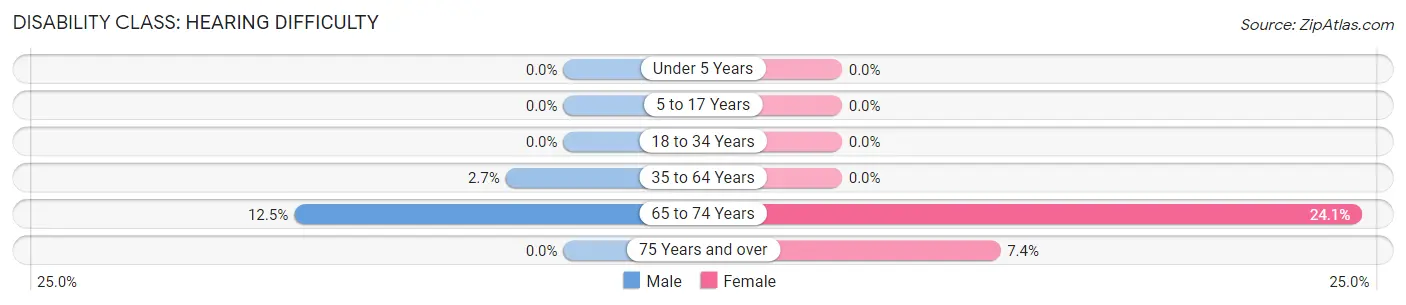
| Age Bracket | Male | Female |
| Under 5 Years | 0 (0.0%) | 0 (0.0%) |
| 5 to 17 Years | 0 (0.0%) | 0 (0.0%) |
| 18 to 34 Years | 0 (0.0%) | 0 (0.0%) |
| 35 to 64 Years | 12 (2.7%) | 0 (0.0%) |
| 65 to 74 Years | 13 (12.5%) | 21 (24.1%) |
| 75 Years and over | 0 (0.0%) | 5 (7.3%) |
Disability Class: Vision Difficulty
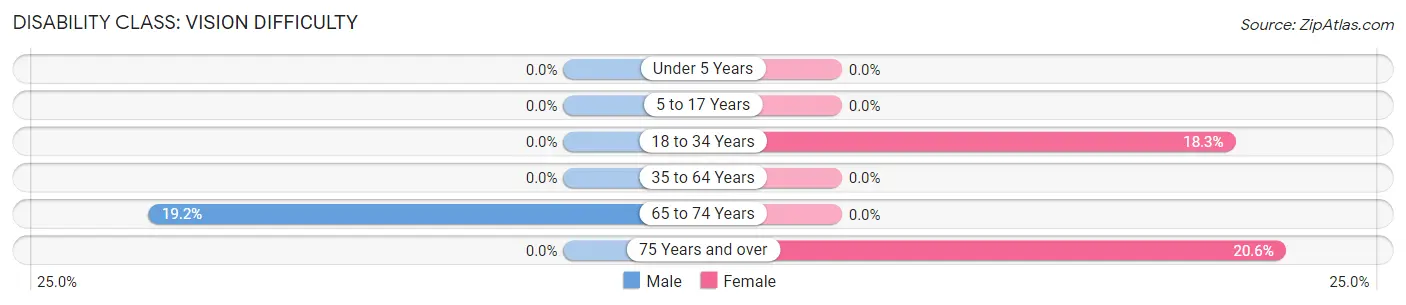
| Age Bracket | Male | Female |
| Under 5 Years | 0 (0.0%) | 0 (0.0%) |
| 5 to 17 Years | 0 (0.0%) | 0 (0.0%) |
| 18 to 34 Years | 0 (0.0%) | 67 (18.3%) |
| 35 to 64 Years | 0 (0.0%) | 0 (0.0%) |
| 65 to 74 Years | 20 (19.2%) | 0 (0.0%) |
| 75 Years and over | 0 (0.0%) | 14 (20.6%) |
Disability Class: Cognitive Difficulty
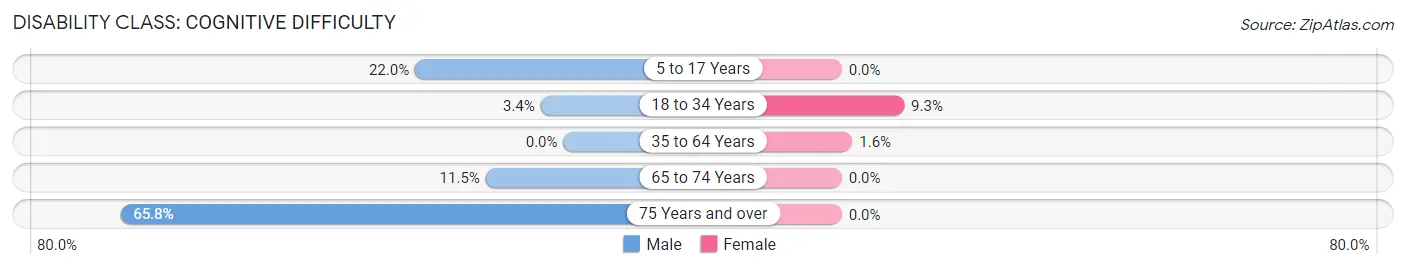
| Age Bracket | Male | Female |
| 5 to 17 Years | 89 (22.0%) | 0 (0.0%) |
| 18 to 34 Years | 13 (3.4%) | 34 (9.3%) |
| 35 to 64 Years | 0 (0.0%) | 7 (1.6%) |
| 65 to 74 Years | 12 (11.5%) | 0 (0.0%) |
| 75 Years and over | 25 (65.8%) | 0 (0.0%) |
Disability Class: Ambulatory Difficulty

| Age Bracket | Male | Female |
| 5 to 17 Years | 0 (0.0%) | 18 (4.0%) |
| 18 to 34 Years | 0 (0.0%) | 34 (9.3%) |
| 35 to 64 Years | 12 (2.7%) | 0 (0.0%) |
| 65 to 74 Years | 24 (23.1%) | 5 (5.8%) |
| 75 Years and over | 25 (65.8%) | 0 (0.0%) |
Disability Class: Self-Care Difficulty
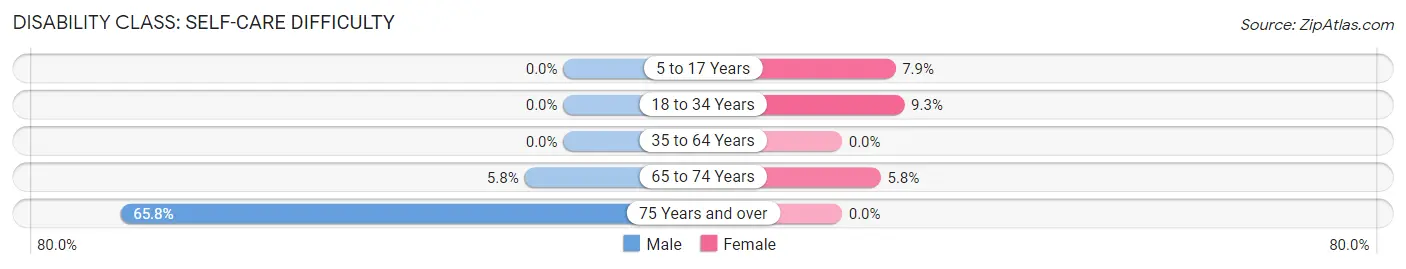
| Age Bracket | Male | Female |
| 5 to 17 Years | 0 (0.0%) | 36 (7.9%) |
| 18 to 34 Years | 0 (0.0%) | 34 (9.3%) |
| 35 to 64 Years | 0 (0.0%) | 0 (0.0%) |
| 65 to 74 Years | 6 (5.8%) | 5 (5.8%) |
| 75 Years and over | 25 (65.8%) | 0 (0.0%) |
Technology Access in Odell
Computing Device Access in Odell
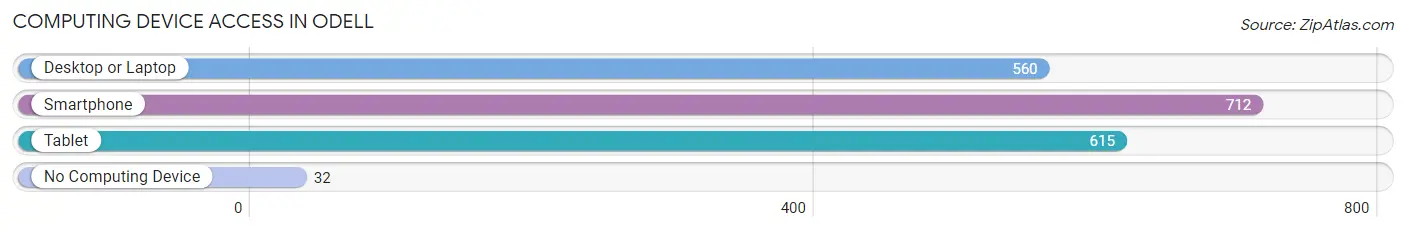
| Device Type | # Households | % Households |
| Desktop or Laptop | 560 | 72.9% |
| Smartphone | 712 | 92.7% |
| Tablet | 615 | 80.1% |
| No Computing Device | 32 | 4.2% |
| Total | 768 | 100.0% |
Internet Access in Odell
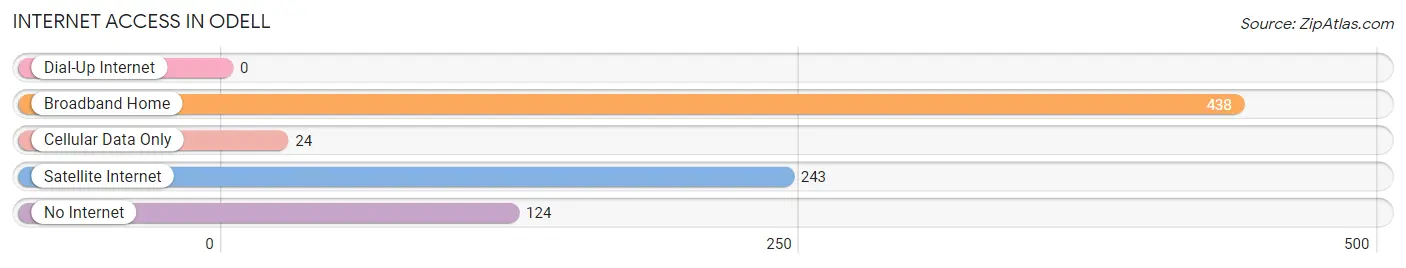
| Internet Type | # Households | % Households |
| Dial-Up Internet | 0 | 0.0% |
| Broadband Home | 438 | 57.0% |
| Cellular Data Only | 24 | 3.1% |
| Satellite Internet | 243 | 31.6% |
| No Internet | 124 | 16.2% |
| Total | 768 | 100.0% |
Odell Summary
Odell, Oregon is a small unincorporated community located in Hood River County, Oregon. It is situated on the south bank of the Columbia River, approximately 10 miles east of Hood River. The population of Odell was estimated to be around 1,000 in 2020.
History
Odell was founded in 1883 by William Odell, a settler from Iowa. He purchased the land from the government and began to develop the area. The town was originally called Odell’s Landing, but the name was changed to Odell in 1887.
The town grew slowly but steadily over the years, and by the early 1900s, it had become a thriving community. It was home to a variety of businesses, including a sawmill, a general store, a hotel, and a post office.
In the 1920s, the town was connected to the outside world by the Columbia River Highway, which ran through the town. This allowed for increased trade and commerce, and the town continued to grow.
In the 1950s, the town was connected to the outside world again, this time by the construction of Interstate 84. This allowed for increased tourism and commerce, and the town continued to grow.
Geography
Odell is located in the Columbia River Gorge, a deep canyon carved by the Columbia River. The town is situated on the south bank of the river, approximately 10 miles east of Hood River. The town is surrounded by rolling hills and mountains, and is located in a temperate rainforest climate.
The town is located in the foothills of the Cascade Mountains, and is home to a variety of wildlife, including deer, elk, and black bears. The area is also home to a variety of birds, including bald eagles, ospreys, and hawks.
Economy
Odell’s economy is largely based on tourism and agriculture. The town is home to a variety of tourist attractions, including the Columbia River Gorge National Scenic Area, the Hood River Valley Fruit Loop, and the Mount Hood National Forest.
The town is also home to a variety of agricultural businesses, including fruit and vegetable farms, wineries, and nurseries. The town is also home to a variety of small businesses, including restaurants, shops, and galleries.
Demographics
As of the 2020 census, the population of Odell was estimated to be around 1,000. The town is predominantly white, with a small Hispanic population. The median household income is around $50,000, and the median home value is around $250,000.
Conclusion
Odell, Oregon is a small unincorporated community located in Hood River County, Oregon. It is situated on the south bank of the Columbia River, approximately 10 miles east of Hood River. The population of Odell was estimated to be around 1,000 in 2020. The town’s economy is largely based on tourism and agriculture, and the town is home to a variety of tourist attractions, agricultural businesses, and small businesses. The town is predominantly white, with a small Hispanic population, and the median household income is around $50,000.
Common Questions
What is the Total Population of Odell?
Total Population of Odell is 3,003.
What is the Total Male Population of Odell?
Total Male Population of Odell is 1,440.
What is the Total Female Population of Odell?
Total Female Population of Odell is 1,563.
What is the Ratio of Males per 100 Females in Odell?
There are 92.13 Males per 100 Females in Odell.
What is the Ratio of Females per 100 Males in Odell?
There are 108.54 Females per 100 Males in Odell.
What is the Median Population Age in Odell?
Median Population Age in Odell is 26.8 Years.
What is the Average Family Size in Odell
Average Family Size in Odell is 4.3 People.
What is the Average Household Size in Odell
Average Household Size in Odell is 3.9 People.
What is Per Capita Income in Odell?
Per Capita income in Odell is $23,596.
What is the Median Family Income in Odell?
Median Family Income in Odell is $84,241.
What is the Median Household income in Odell?
Median Household Income in Odell is $82,768.
What is Income or Wage Gap in Odell?
Income or Wage Gap in Odell is 13.4%.
Women in Odell earn 86.6 cents for every dollar earned by a man.
What is Inequality or Gini Index in Odell?
Inequality or Gini Index in Odell is 0.33.
How Large is the Labor Force in Odell?
There are 1,584 People in the Labor Forcein in Odell.
What is the Percentage of People in the Labor Force in Odell?
78.2% of People are in the Labor Force in Odell.
What is the Unemployment Rate in Odell?
Unemployment Rate in Odell is 4.8%.