Mulberry, OH
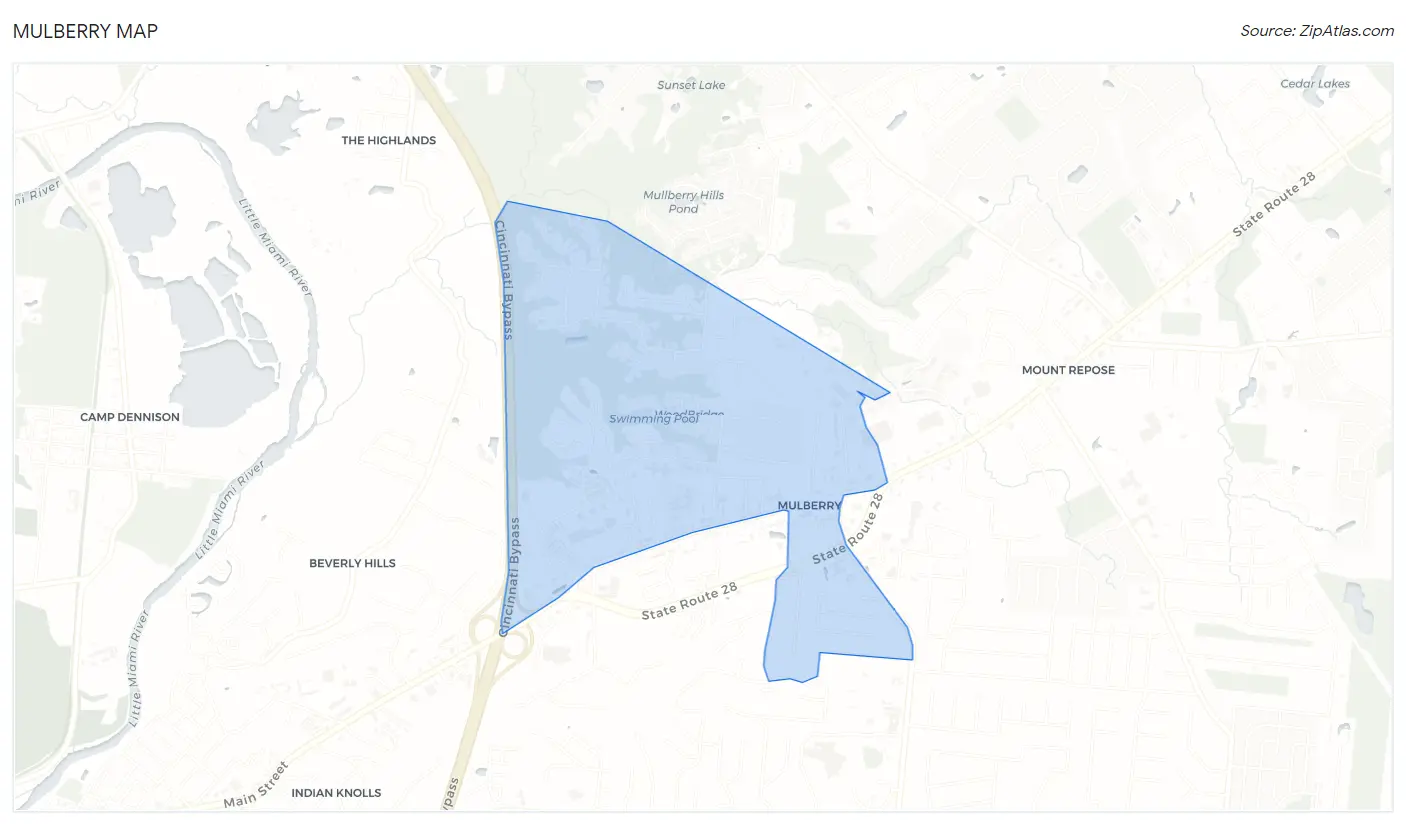
Mulberry Map
Mulberry Overview
4,071
TOTAL POPULATION
1,993
MALE POPULATION
2,078
FEMALE POPULATION
95.91
MALES / 100 FEMALES
104.26
FEMALES / 100 MALES
52.0
MEDIAN AGE
3.0
AVG FAMILY SIZE
2.2
AVG HOUSEHOLD SIZE
$39,526
PER CAPITA INCOME
$87,654
AVG FAMILY INCOME
$67,838
AVG HOUSEHOLD INCOME
7.1%
WAGE / INCOME GAP [ % ]
92.9¢/ $1
WAGE / INCOME GAP [ $ ]
$2,579
FAMILY INCOME DEFICIT
0.44
INEQUALITY / GINI INDEX
1,962
LABOR FORCE [ PEOPLE ]
56.3%
PERCENT IN LABOR FORCE
2.6%
UNEMPLOYMENT RATE
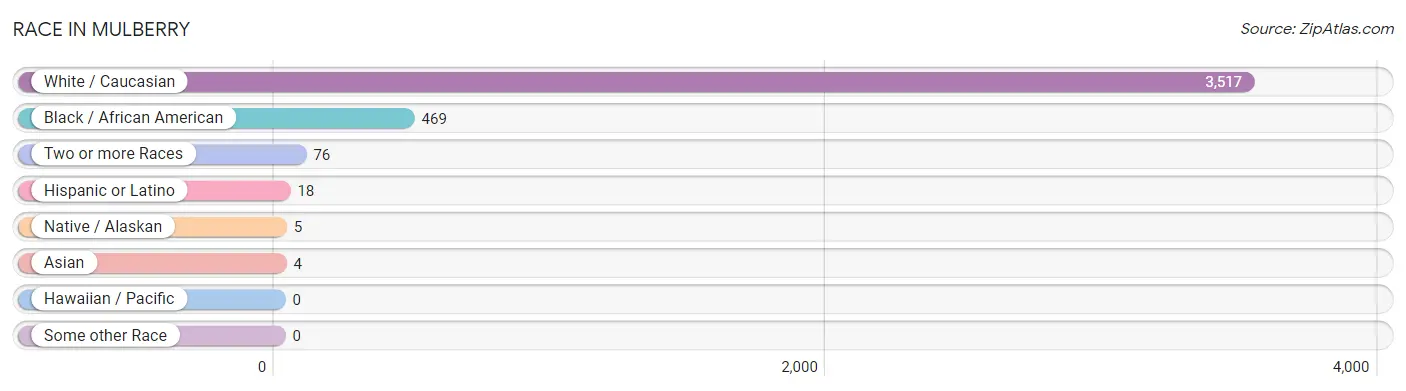
Race in Mulberry
The most populous races in Mulberry are White / Caucasian (3,517 | 86.4%), Black / African American (469 | 11.5%), and Two or more Races (76 | 1.9%).
| Race | # Population | % Population |
| Asian | 4 | 0.1% |
| Black / African American | 469 | 11.5% |
| Hawaiian / Pacific | 0 | 0.0% |
| Hispanic or Latino | 18 | 0.4% |
| Native / Alaskan | 5 | 0.1% |
| White / Caucasian | 3,517 | 86.4% |
| Two or more Races | 76 | 1.9% |
| Some other Race | 0 | 0.0% |
| Total | 4,071 | 100.0% |
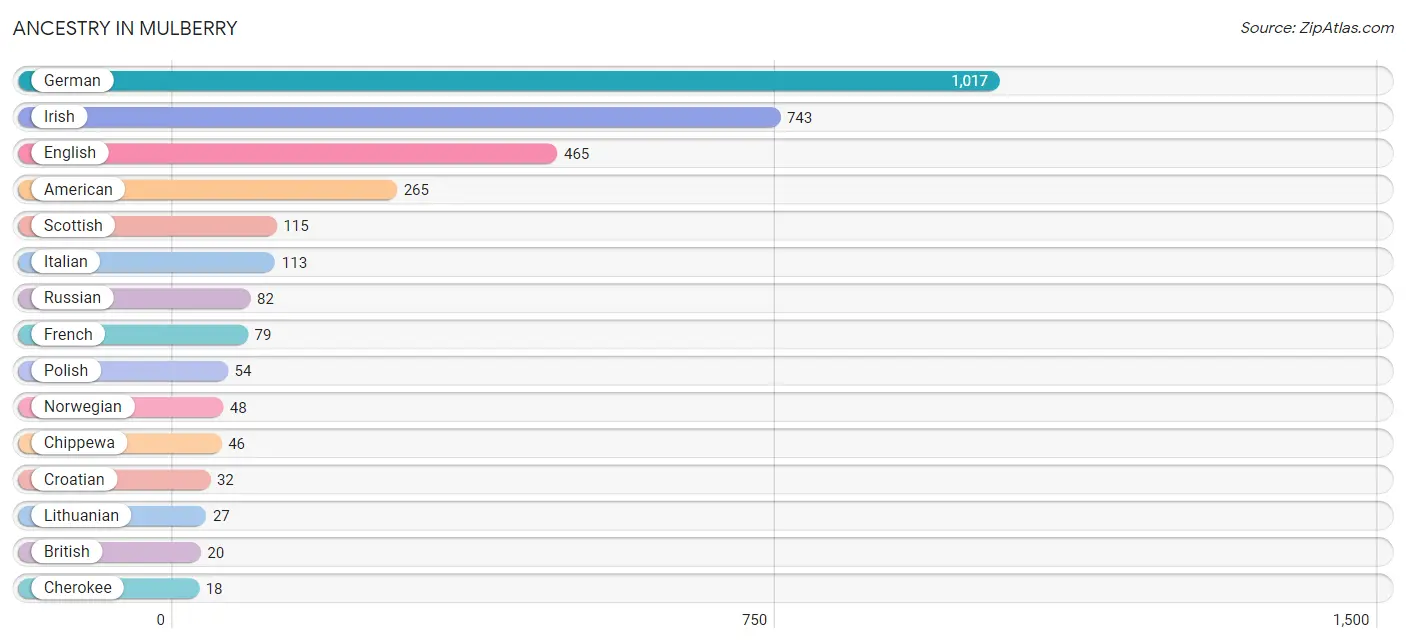
Ancestry in Mulberry
The most populous ancestries reported in Mulberry are German (1,017 | 25.0%), Irish (743 | 18.2%), English (465 | 11.4%), American (265 | 6.5%), and Scottish (115 | 2.8%), together accounting for 64.0% of all Mulberry residents.
| Ancestry | # Population | % Population |
| American | 265 | 6.5% |
| Bhutanese | 4 | 0.1% |
| British | 20 | 0.5% |
| Cherokee | 18 | 0.4% |
| Chippewa | 46 | 1.1% |
| Croatian | 32 | 0.8% |
| Cuban | 11 | 0.3% |
| Czech | 11 | 0.3% |
| Danish | 8 | 0.2% |
| Dutch | 4 | 0.1% |
| Eastern European | 8 | 0.2% |
| English | 465 | 11.4% |
| European | 13 | 0.3% |
| French | 79 | 1.9% |
| German | 1,017 | 25.0% |
| Greek | 7 | 0.2% |
| Hungarian | 12 | 0.3% |
| Irish | 743 | 18.2% |
| Italian | 113 | 2.8% |
| Lithuanian | 27 | 0.7% |
| Mexican | 7 | 0.2% |
| Northern European | 6 | 0.2% |
| Norwegian | 48 | 1.2% |
| Polish | 54 | 1.3% |
| Russian | 82 | 2.0% |
| Scotch-Irish | 6 | 0.2% |
| Scottish | 115 | 2.8% |
| Swiss | 18 | 0.4% |
| Welsh | 12 | 0.3% | View All 29 Rows |
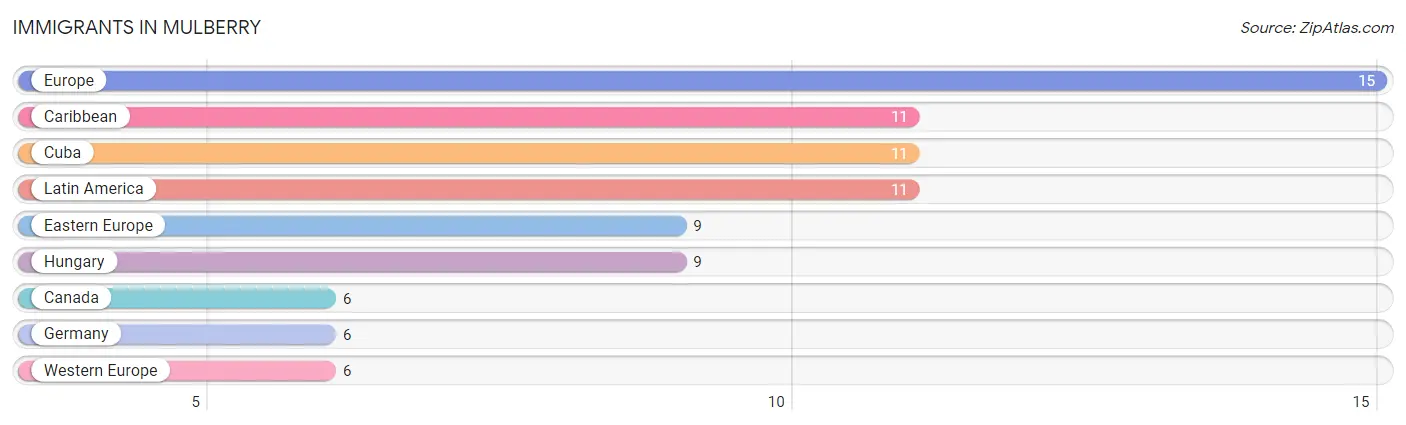
Immigrants in Mulberry
The most numerous immigrant groups reported in Mulberry came from Europe (15 | 0.4%), Caribbean (11 | 0.3%), Cuba (11 | 0.3%), Latin America (11 | 0.3%), and Eastern Europe (9 | 0.2%), together accounting for 1.4% of all Mulberry residents.
| Immigration Origin | # Population | % Population |
| Canada | 6 | 0.2% |
| Caribbean | 11 | 0.3% |
| Cuba | 11 | 0.3% |
| Eastern Europe | 9 | 0.2% |
| Europe | 15 | 0.4% |
| Germany | 6 | 0.2% |
| Hungary | 9 | 0.2% |
| Latin America | 11 | 0.3% |
| Western Europe | 6 | 0.2% | View All 9 Rows |
Sex and Age in Mulberry
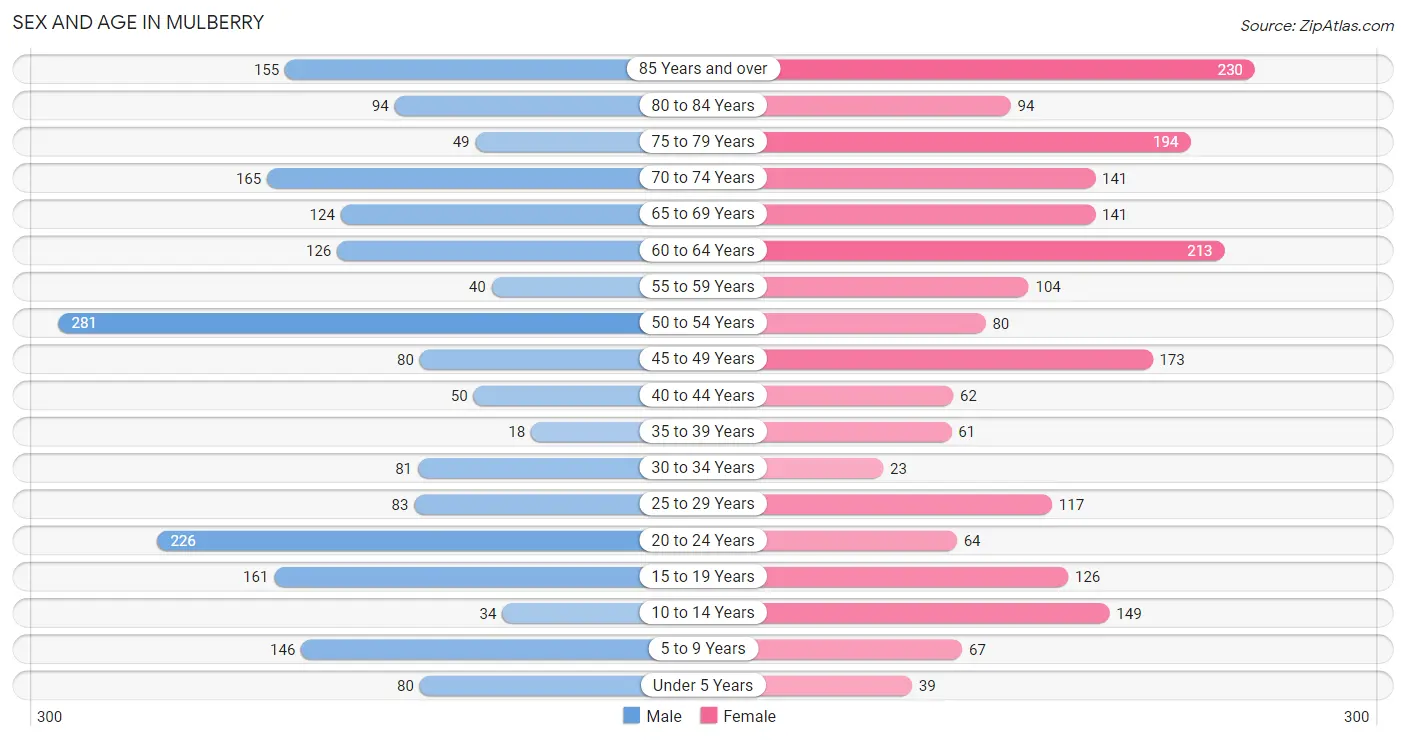
Sex and Age in Mulberry
The most populous age groups in Mulberry are 50 to 54 Years (281 | 14.1%) for men and 85 Years and over (230 | 11.1%) for women.
| Age Bracket | Male | Female |
| Under 5 Years | 80 (4.0%) | 39 (1.9%) |
| 5 to 9 Years | 146 (7.3%) | 67 (3.2%) |
| 10 to 14 Years | 34 (1.7%) | 149 (7.2%) |
| 15 to 19 Years | 161 (8.1%) | 126 (6.1%) |
| 20 to 24 Years | 226 (11.3%) | 64 (3.1%) |
| 25 to 29 Years | 83 (4.2%) | 117 (5.6%) |
| 30 to 34 Years | 81 (4.1%) | 23 (1.1%) |
| 35 to 39 Years | 18 (0.9%) | 61 (2.9%) |
| 40 to 44 Years | 50 (2.5%) | 62 (3.0%) |
| 45 to 49 Years | 80 (4.0%) | 173 (8.3%) |
| 50 to 54 Years | 281 (14.1%) | 80 (3.8%) |
| 55 to 59 Years | 40 (2.0%) | 104 (5.0%) |
| 60 to 64 Years | 126 (6.3%) | 213 (10.2%) |
| 65 to 69 Years | 124 (6.2%) | 141 (6.8%) |
| 70 to 74 Years | 165 (8.3%) | 141 (6.8%) |
| 75 to 79 Years | 49 (2.5%) | 194 (9.3%) |
| 80 to 84 Years | 94 (4.7%) | 94 (4.5%) |
| 85 Years and over | 155 (7.8%) | 230 (11.1%) |
| Total | 1,993 (100.0%) | 2,078 (100.0%) |
Families and Households in Mulberry
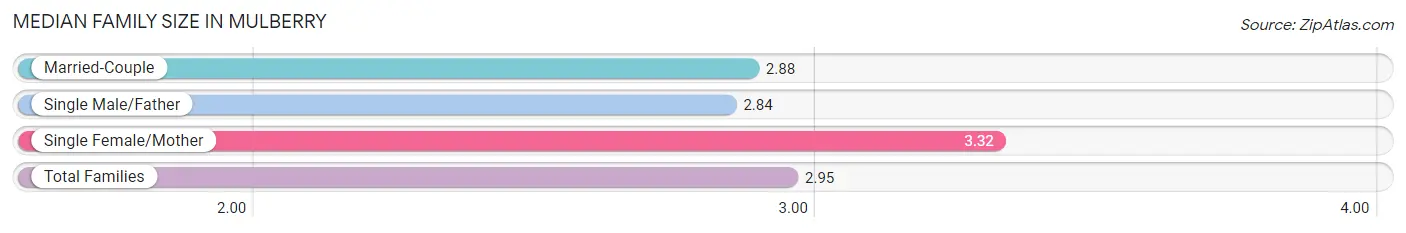
Median Family Size in Mulberry
The median family size in Mulberry is 2.95 persons per family, with single female/mother families (160 | 15.9%) accounting for the largest median family size of 3.32 persons per family. On the other hand, single male/father families (159 | 15.8%) represent the smallest median family size with 2.84 persons per family.
| Family Type | # Families | Family Size |
| Married-Couple | 690 (68.4%) | 2.88 |
| Single Male/Father | 159 (15.8%) | 2.84 |
| Single Female/Mother | 160 (15.9%) | 3.32 |
| Total Families | 1,009 (100.0%) | 2.95 |
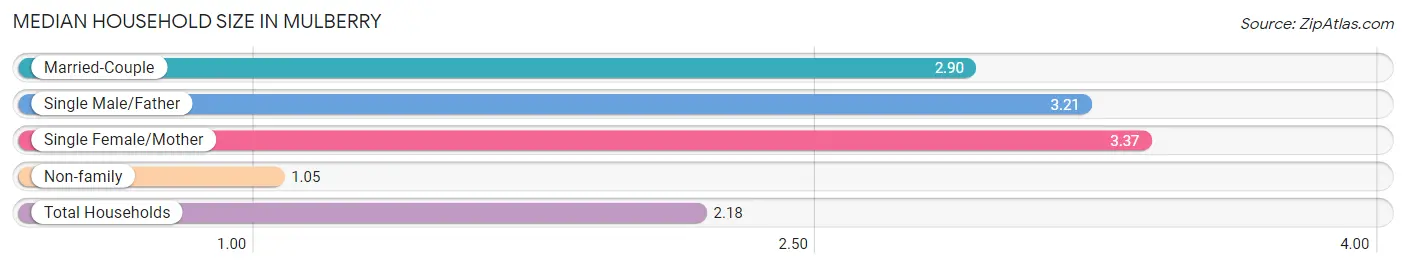
Median Household Size in Mulberry
The median household size in Mulberry is 2.18 persons per household, with single female/mother households (160 | 9.1%) accounting for the largest median household size of 3.37 persons per household. non-family households (747 | 42.5%) represent the smallest median household size with 1.05 persons per household.
| Household Type | # Households | Household Size |
| Married-Couple | 690 (39.3%) | 2.90 |
| Single Male/Father | 159 (9.0%) | 3.21 |
| Single Female/Mother | 160 (9.1%) | 3.37 |
| Non-family | 747 (42.5%) | 1.05 |
| Total Households | 1,756 (100.0%) | 2.18 |
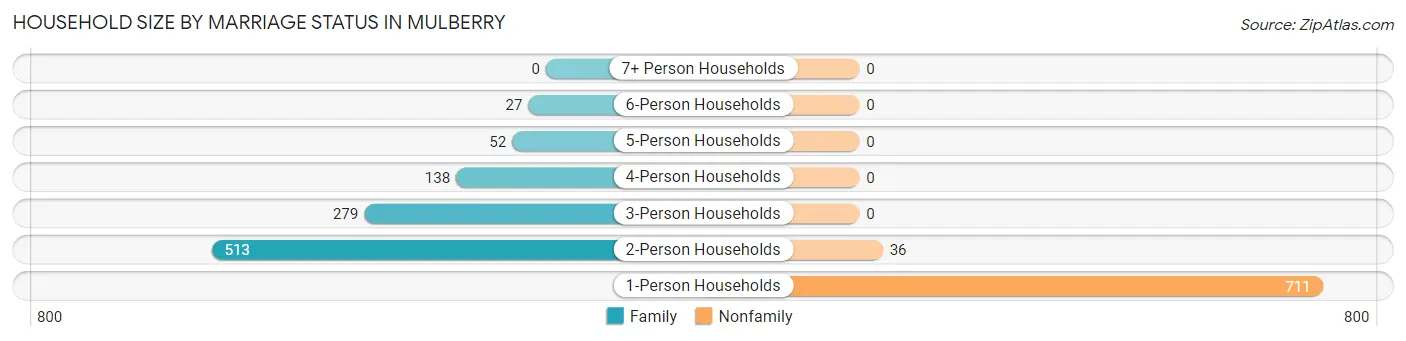
Household Size by Marriage Status in Mulberry
Out of a total of 1,756 households in Mulberry, 1,009 (57.5%) are family households, while 747 (42.5%) are nonfamily households. The most numerous type of family households are 2-person households, comprising 513, and the most common type of nonfamily households are 1-person households, comprising 711.
| Household Size | Family Households | Nonfamily Households |
| 1-Person Households | - | 711 (40.5%) |
| 2-Person Households | 513 (29.2%) | 36 (2.1%) |
| 3-Person Households | 279 (15.9%) | 0 (0.0%) |
| 4-Person Households | 138 (7.9%) | 0 (0.0%) |
| 5-Person Households | 52 (3.0%) | 0 (0.0%) |
| 6-Person Households | 27 (1.5%) | 0 (0.0%) |
| 7+ Person Households | 0 (0.0%) | 0 (0.0%) |
| Total | 1,009 (57.5%) | 747 (42.5%) |
Female Fertility in Mulberry
Fertility by Age in Mulberry
Average fertility rate in Mulberry is 19.0 births per 1,000 women. Women in the age bracket of 20 to 34 years have the highest fertility rate with 59.0 births per 1,000 women. Women in the age bracket of 20 to 34 years acount for 100.0% of all women with births.
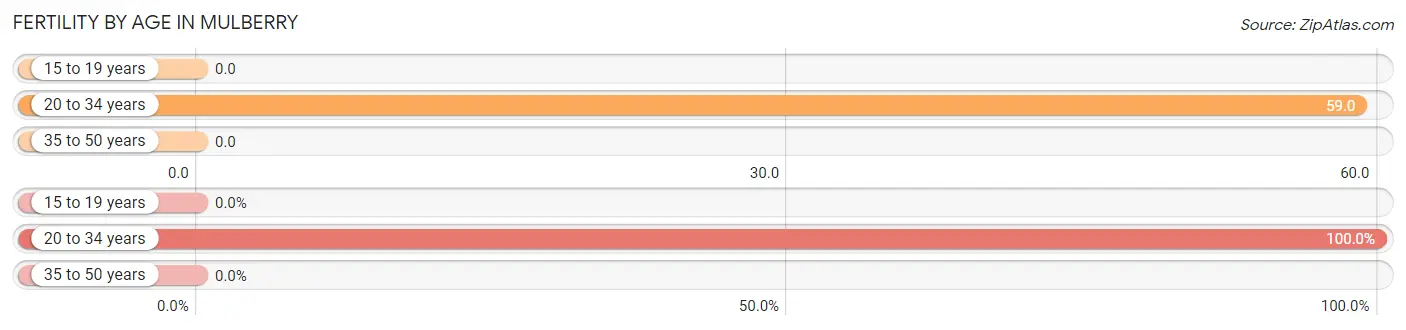
| Age Bracket | Women with Births | Births / 1,000 Women |
| 15 to 19 years | 0 (0.0%) | 0.0 |
| 20 to 34 years | 12 (100.0%) | 59.0 |
| 35 to 50 years | 0 (0.0%) | 0.0 |
| Total | 12 (100.0%) | 19.0 |
Fertility by Age by Marriage Status in Mulberry
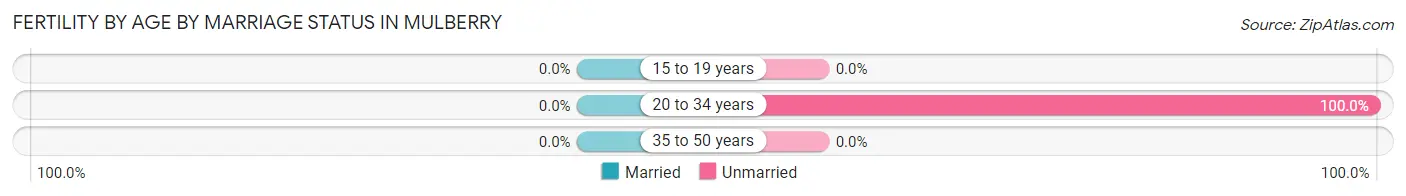
| Age Bracket | Married | Unmarried |
| 15 to 19 years | 0 (0.0%) | 0 (0.0%) |
| 20 to 34 years | 0 (0.0%) | 12 (100.0%) |
| 35 to 50 years | 0 (0.0%) | 0 (0.0%) |
| Total | 0 (0.0%) | 12 (100.0%) |
Fertility by Education in Mulberry
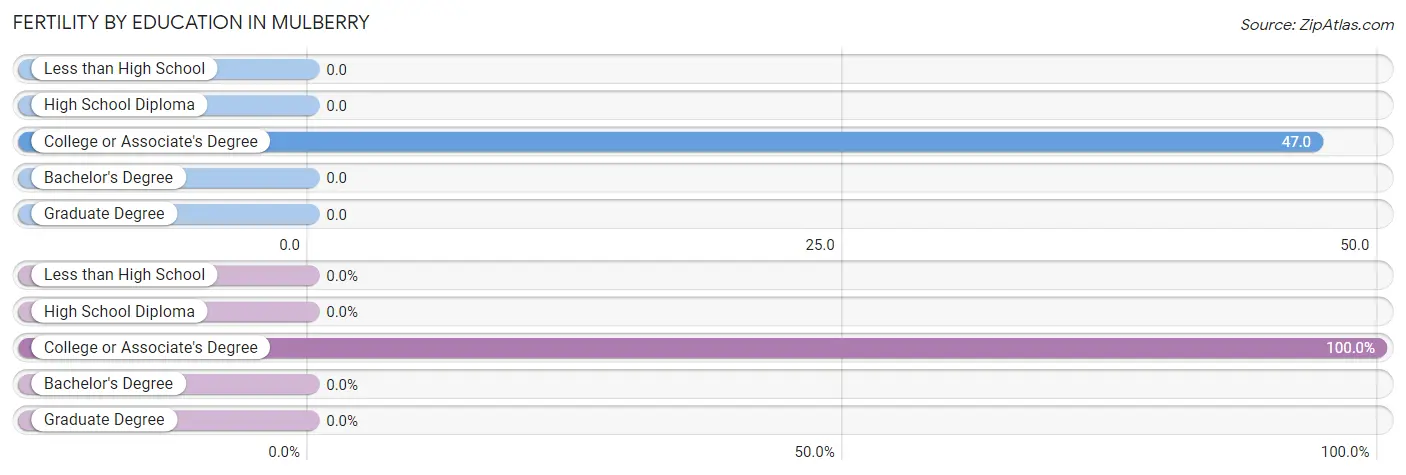
| Educational Attainment | Women with Births | Births / 1,000 Women |
| Less than High School | 0 (0.0%) | 0.0 |
| High School Diploma | 0 (0.0%) | 0.0 |
| College or Associate's Degree | 12 (100.0%) | 47.0 |
| Bachelor's Degree | 0 (0.0%) | 0.0 |
| Graduate Degree | 0 (0.0%) | 0.0 |
| Total | 12 (100.0%) | 19.0 |
Fertility by Education by Marriage Status in Mulberry
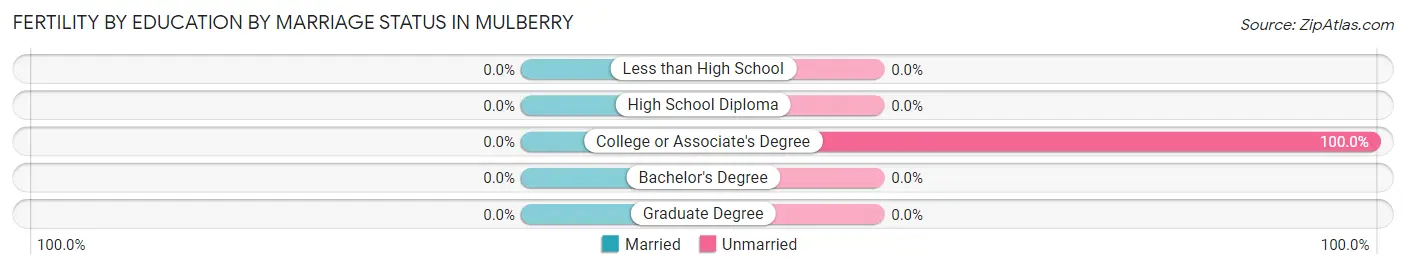
| Educational Attainment | Married | Unmarried |
| Less than High School | 0 (0.0%) | 0 (0.0%) |
| High School Diploma | 0 (0.0%) | 0 (0.0%) |
| College or Associate's Degree | 0 (0.0%) | 12 (100.0%) |
| Bachelor's Degree | 0 (0.0%) | 0 (0.0%) |
| Graduate Degree | 0 (0.0%) | 0 (0.0%) |
| Total | 0 (0.0%) | 12 (100.0%) |
Income in Mulberry
Income Overview in Mulberry
Per Capita Income in Mulberry is $39,526, while median incomes of families and households are $87,654 and $67,838 respectively.
| Characteristic | Number | Measure |
| Per Capita Income | 4,071 | $39,526 |
| Median Family Income | 1,009 | $87,654 |
| Mean Family Income | 1,009 | $111,631 |
| Median Household Income | 1,756 | $67,838 |
| Mean Household Income | 1,756 | $85,028 |
| Income Deficit | 1,009 | $2,579 |
| Wage / Income Gap (%) | 4,071 | 7.06% |
| Wage / Income Gap ($) | 4,071 | 92.94¢ per $1 |
| Gini / Inequality Index | 4,071 | 0.44 |
Earnings by Sex in Mulberry
Average Earnings in Mulberry are $34,440, $32,450 for men and $34,914 for women, a difference of 7.1%.
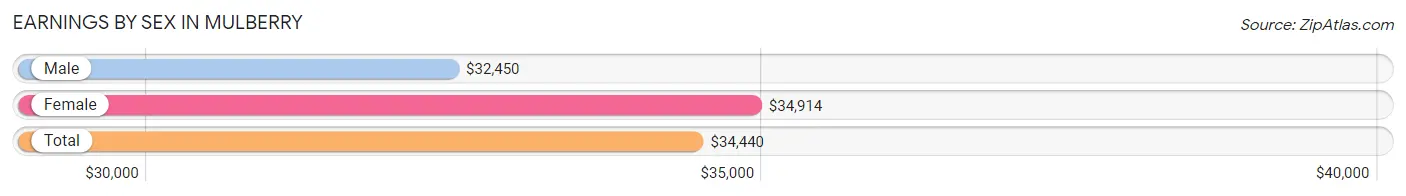
| Sex | Number | Average Earnings |
| Male | 1,134 (55.8%) | $32,450 |
| Female | 899 (44.2%) | $34,914 |
| Total | 2,033 (100.0%) | $34,440 |
Earnings by Sex by Income Bracket in Mulberry
The most common earnings brackets in Mulberry are $2,500 to $4,999 for men (177 | 15.6%) and $100,000+ for women (86 | 9.6%).
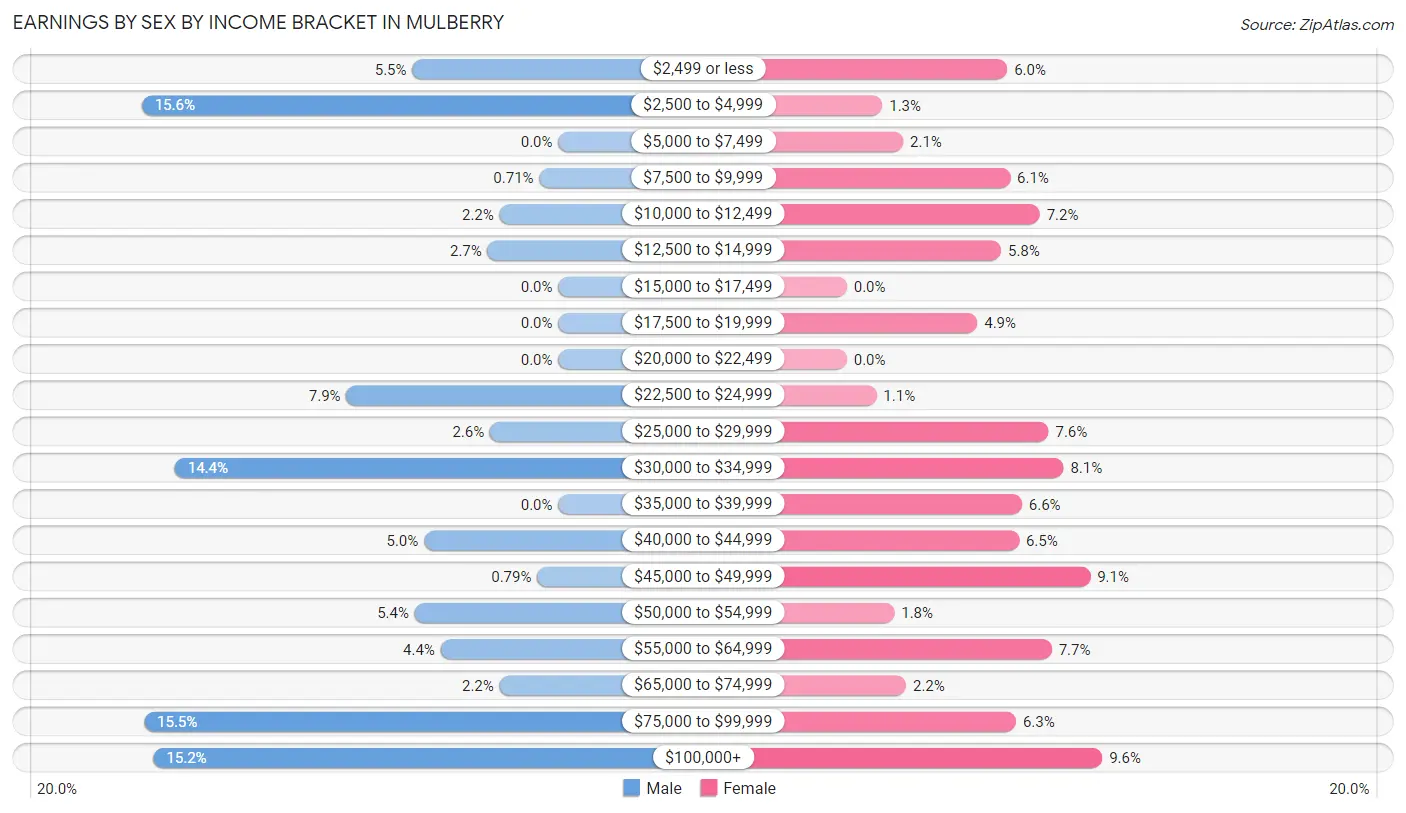
| Income | Male | Female |
| $2,499 or less | 62 (5.5%) | 54 (6.0%) |
| $2,500 to $4,999 | 177 (15.6%) | 12 (1.3%) |
| $5,000 to $7,499 | 0 (0.0%) | 19 (2.1%) |
| $7,500 to $9,999 | 8 (0.7%) | 55 (6.1%) |
| $10,000 to $12,499 | 25 (2.2%) | 65 (7.2%) |
| $12,500 to $14,999 | 30 (2.6%) | 52 (5.8%) |
| $15,000 to $17,499 | 0 (0.0%) | 0 (0.0%) |
| $17,500 to $19,999 | 0 (0.0%) | 44 (4.9%) |
| $20,000 to $22,499 | 0 (0.0%) | 0 (0.0%) |
| $22,500 to $24,999 | 90 (7.9%) | 10 (1.1%) |
| $25,000 to $29,999 | 29 (2.6%) | 68 (7.6%) |
| $30,000 to $34,999 | 163 (14.4%) | 73 (8.1%) |
| $35,000 to $39,999 | 0 (0.0%) | 59 (6.6%) |
| $40,000 to $44,999 | 57 (5.0%) | 58 (6.5%) |
| $45,000 to $49,999 | 9 (0.8%) | 82 (9.1%) |
| $50,000 to $54,999 | 61 (5.4%) | 16 (1.8%) |
| $55,000 to $64,999 | 50 (4.4%) | 69 (7.7%) |
| $65,000 to $74,999 | 25 (2.2%) | 20 (2.2%) |
| $75,000 to $99,999 | 176 (15.5%) | 57 (6.3%) |
| $100,000+ | 172 (15.2%) | 86 (9.6%) |
| Total | 1,134 (100.0%) | 899 (100.0%) |
Earnings by Sex by Educational Attainment in Mulberry
Average earnings in Mulberry are $51,639 for men and $38,558 for women, a difference of 25.3%. Men with an educational attainment of graduate degree enjoy the highest average annual earnings of $86,538, while those with high school diploma education earn the least with $32,101. Women with an educational attainment of graduate degree earn the most with the average annual earnings of $112,773, while those with bachelor's degree education have the smallest earnings of $32,672.
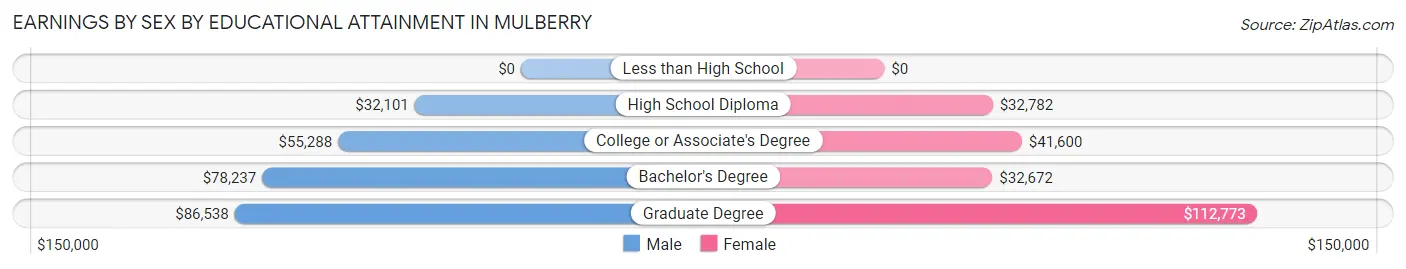
| Educational Attainment | Male Income | Female Income |
| Less than High School | - | - |
| High School Diploma | $32,101 | $32,782 |
| College or Associate's Degree | $55,288 | $41,600 |
| Bachelor's Degree | $78,237 | $32,672 |
| Graduate Degree | $86,538 | $112,773 |
| Total | $51,639 | $38,558 |
Family Income in Mulberry
Family Income Brackets in Mulberry
According to the Mulberry family income data, there are 284 families falling into the $75,000 to $99,999 income range, which is the most common income bracket and makes up 28.1% of all families.
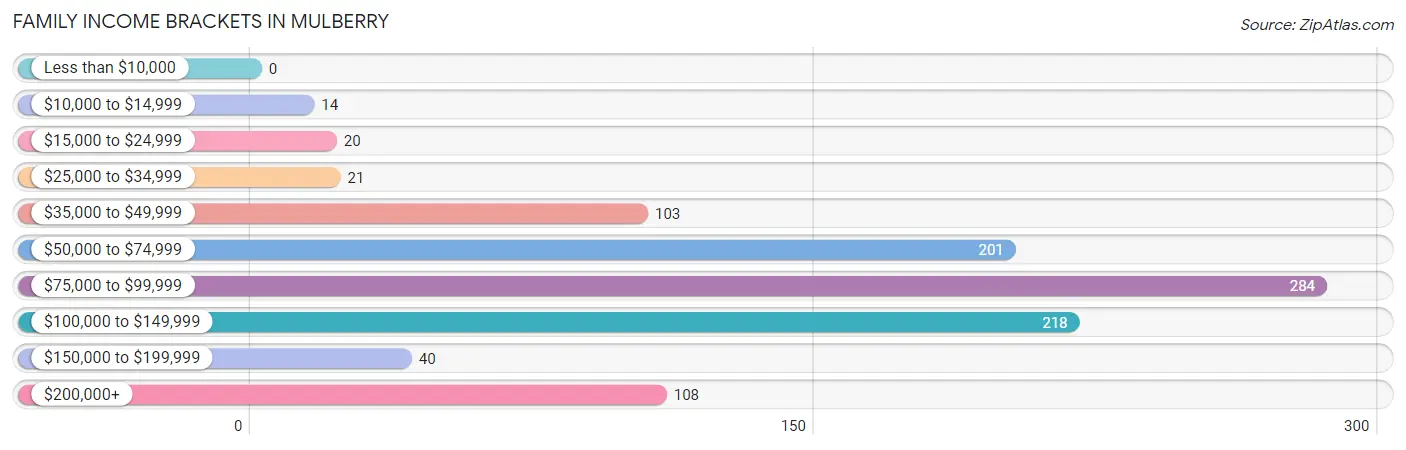
| Income Bracket | # Families | % Families |
| Less than $10,000 | 0 | 0.0% |
| $10,000 to $14,999 | 14 | 1.4% |
| $15,000 to $24,999 | 20 | 2.0% |
| $25,000 to $34,999 | 21 | 2.1% |
| $35,000 to $49,999 | 103 | 10.2% |
| $50,000 to $74,999 | 201 | 19.9% |
| $75,000 to $99,999 | 284 | 28.1% |
| $100,000 to $149,999 | 218 | 21.6% |
| $150,000 to $199,999 | 40 | 4.0% |
| $200,000+ | 108 | 10.7% |
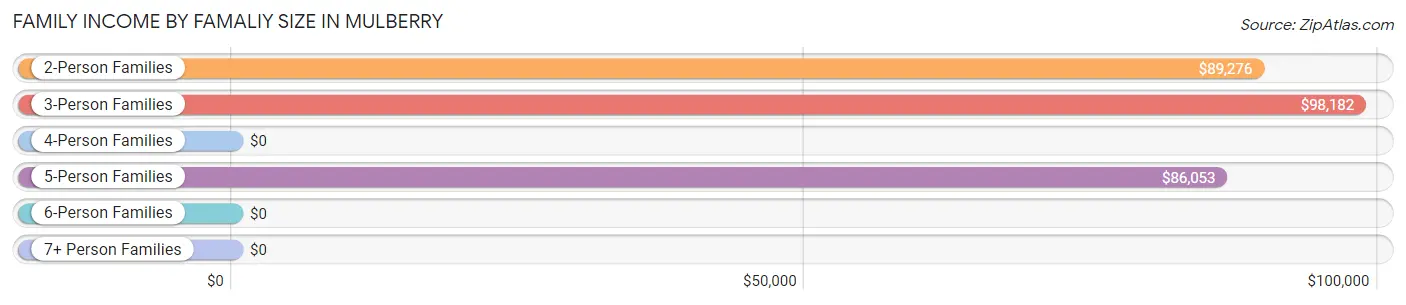
Family Income by Famaliy Size in Mulberry
3-person families (260 | 25.8%) account for the highest median family income in Mulberry with $98,182 per family, while 2-person families (545 | 54.0%) have the highest median income of $44,638 per family member.
| Income Bracket | # Families | Median Income |
| 2-Person Families | 545 (54.0%) | $89,276 |
| 3-Person Families | 260 (25.8%) | $98,182 |
| 4-Person Families | 152 (15.1%) | $0 |
| 5-Person Families | 52 (5.1%) | $86,053 |
| 6-Person Families | 0 (0.0%) | $0 |
| 7+ Person Families | 0 (0.0%) | $0 |
| Total | 1,009 (100.0%) | $87,654 |
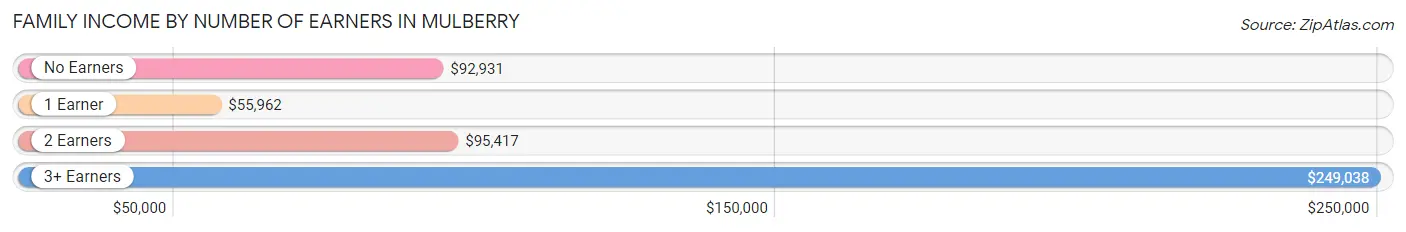
Family Income by Number of Earners in Mulberry
The median family income in Mulberry is $87,654, with families comprising 3+ earners (64) having the highest median family income of $249,038, while families with 1 earner (350) have the lowest median family income of $55,962, accounting for 6.3% and 34.7% of families, respectively.
| Number of Earners | # Families | Median Income |
| No Earners | 134 (13.3%) | $92,931 |
| 1 Earner | 350 (34.7%) | $55,962 |
| 2 Earners | 461 (45.7%) | $95,417 |
| 3+ Earners | 64 (6.3%) | $249,038 |
| Total | 1,009 (100.0%) | $87,654 |
Household Income in Mulberry
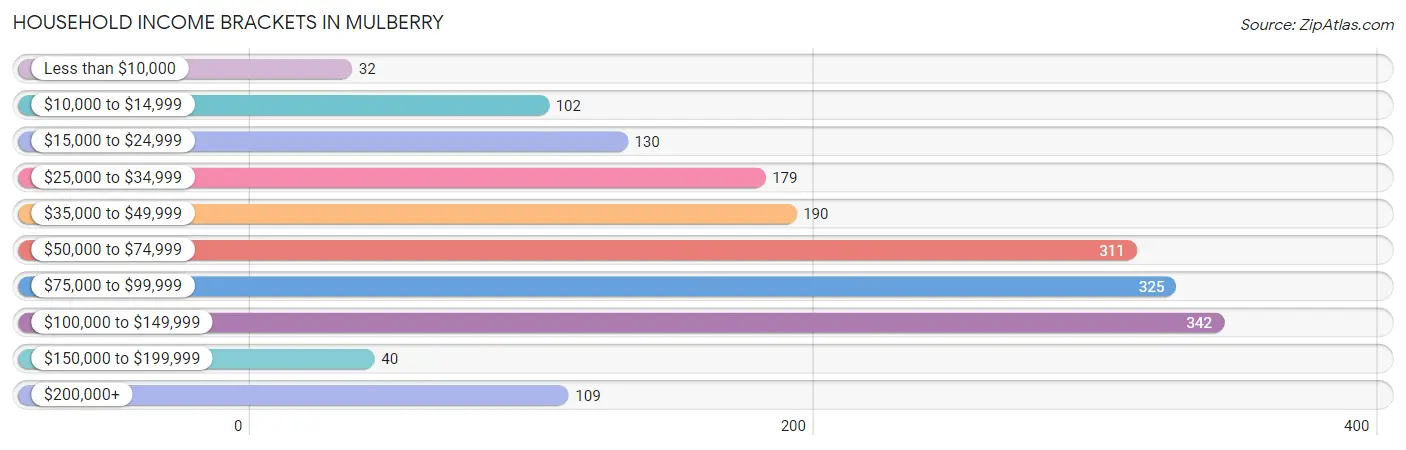
Household Income Brackets in Mulberry
With 342 households falling in the category, the $100,000 to $149,999 income range is the most frequent in Mulberry, accounting for 19.5% of all households. In contrast, only 32 households (1.8%) fall into the less than $10,000 income bracket, making it the least populous group.
| Income Bracket | # Households | % Households |
| Less than $10,000 | 32 | 1.8% |
| $10,000 to $14,999 | 102 | 5.8% |
| $15,000 to $24,999 | 130 | 7.4% |
| $25,000 to $34,999 | 179 | 10.2% |
| $35,000 to $49,999 | 190 | 10.8% |
| $50,000 to $74,999 | 311 | 17.7% |
| $75,000 to $99,999 | 325 | 18.5% |
| $100,000 to $149,999 | 342 | 19.5% |
| $150,000 to $199,999 | 40 | 2.3% |
| $200,000+ | 109 | 6.2% |
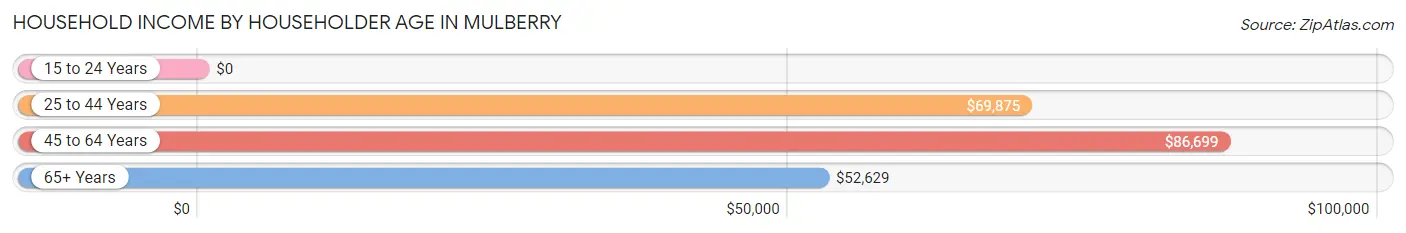
Household Income by Householder Age in Mulberry
The median household income in Mulberry is $67,838, with the highest median household income of $86,699 found in the 45 to 64 years age bracket for the primary householder. A total of 676 households (38.5%) fall into this category. Meanwhile, the 15 to 24 years age bracket for the primary householder has the lowest median household income of $0, with 14 households (0.8%) in this group.
| Income Bracket | # Households | Median Income |
| 15 to 24 Years | 14 (0.8%) | $0 |
| 25 to 44 Years | 295 (16.8%) | $69,875 |
| 45 to 64 Years | 676 (38.5%) | $86,699 |
| 65+ Years | 771 (43.9%) | $52,629 |
| Total | 1,756 (100.0%) | $67,838 |
Poverty in Mulberry
Income Below Poverty by Sex and Age in Mulberry
With 2.2% poverty level for males and 9.2% for females among the residents of Mulberry, 75 year old and over males and 75 year old and over females are the most vulnerable to poverty, with 23 males (8.6%) and 146 females (35.2%) in their respective age groups living below the poverty level.
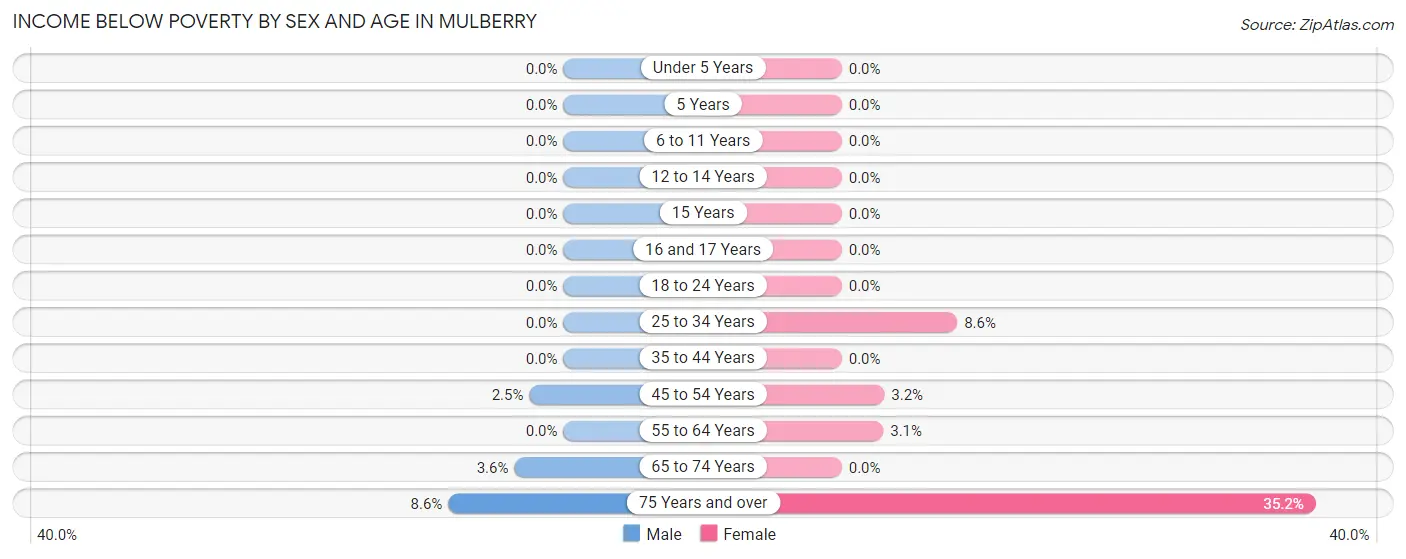
| Age Bracket | Male | Female |
| Under 5 Years | 0 (0.0%) | 0 (0.0%) |
| 5 Years | 0 (0.0%) | 0 (0.0%) |
| 6 to 11 Years | 0 (0.0%) | 0 (0.0%) |
| 12 to 14 Years | 0 (0.0%) | 0 (0.0%) |
| 15 Years | 0 (0.0%) | 0 (0.0%) |
| 16 and 17 Years | 0 (0.0%) | 0 (0.0%) |
| 18 to 24 Years | 0 (0.0%) | 0 (0.0%) |
| 25 to 34 Years | 0 (0.0%) | 12 (8.6%) |
| 35 to 44 Years | 0 (0.0%) | 0 (0.0%) |
| 45 to 54 Years | 9 (2.5%) | 8 (3.2%) |
| 55 to 64 Years | 0 (0.0%) | 9 (3.1%) |
| 65 to 74 Years | 10 (3.6%) | 0 (0.0%) |
| 75 Years and over | 23 (8.6%) | 146 (35.2%) |
| Total | 42 (2.2%) | 175 (9.2%) |
Income Above Poverty by Sex and Age in Mulberry
According to the poverty statistics in Mulberry, males aged under 5 years and females aged under 5 years are the age groups that are most secure financially, with 100.0% of males and 100.0% of females in these age groups living above the poverty line.
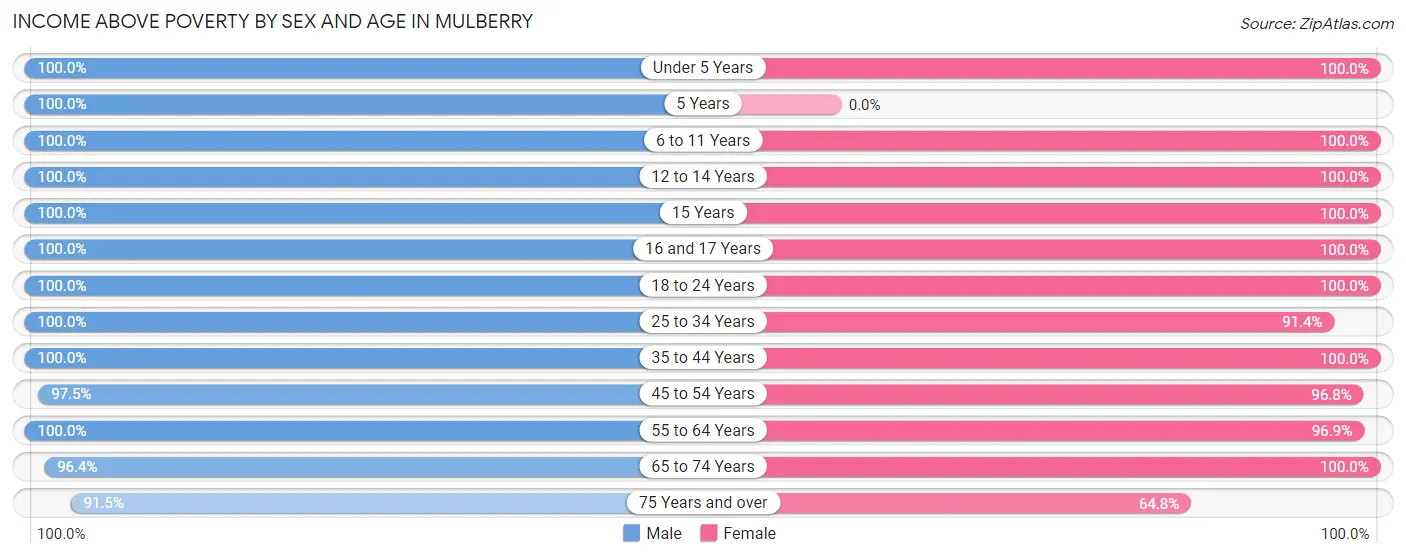
| Age Bracket | Male | Female |
| Under 5 Years | 80 (100.0%) | 39 (100.0%) |
| 5 Years | 41 (100.0%) | 0 (0.0%) |
| 6 to 11 Years | 123 (100.0%) | 145 (100.0%) |
| 12 to 14 Years | 16 (100.0%) | 71 (100.0%) |
| 15 Years | 5 (100.0%) | 66 (100.0%) |
| 16 and 17 Years | 127 (100.0%) | 11 (100.0%) |
| 18 to 24 Years | 255 (100.0%) | 113 (100.0%) |
| 25 to 34 Years | 164 (100.0%) | 128 (91.4%) |
| 35 to 44 Years | 68 (100.0%) | 123 (100.0%) |
| 45 to 54 Years | 347 (97.5%) | 245 (96.8%) |
| 55 to 64 Years | 146 (100.0%) | 283 (96.9%) |
| 65 to 74 Years | 265 (96.4%) | 238 (100.0%) |
| 75 Years and over | 246 (91.4%) | 269 (64.8%) |
| Total | 1,883 (97.8%) | 1,731 (90.8%) |
Income Below Poverty Among Married-Couple Families in Mulberry
The poverty statistics for married-couple families in Mulberry show that 4.9% or 34 of the total 690 families live below the poverty line. Families with no children have the highest poverty rate of 7.1%, comprising of 34 families. On the other hand, families with 1 or 2 children have the lowest poverty rate of 0.0%, which includes 0 families.
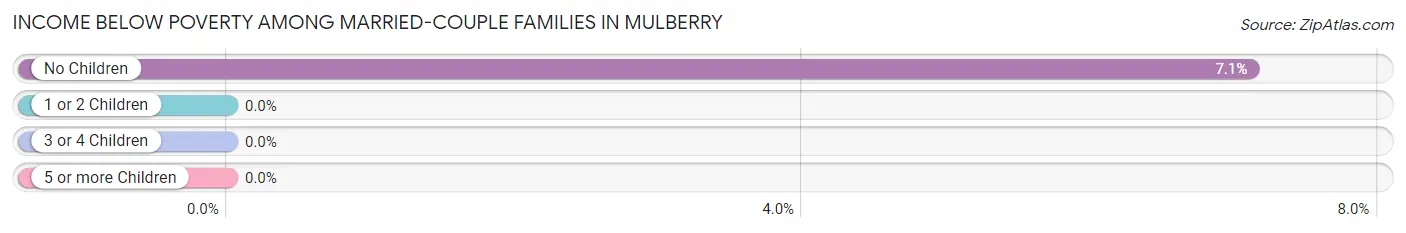
| Children | Above Poverty | Below Poverty |
| No Children | 444 (92.9%) | 34 (7.1%) |
| 1 or 2 Children | 208 (100.0%) | 0 (0.0%) |
| 3 or 4 Children | 4 (100.0%) | 0 (0.0%) |
| 5 or more Children | 0 (0.0%) | 0 (0.0%) |
| Total | 656 (95.1%) | 34 (4.9%) |
Income Below Poverty Among Single-Parent Households in Mulberry
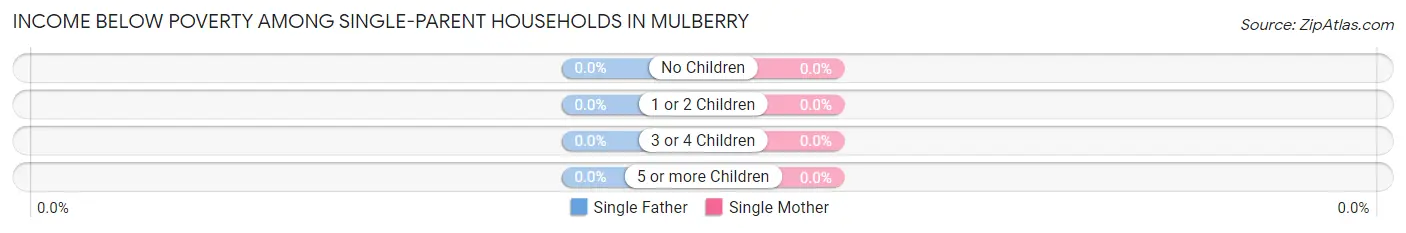
| Children | Single Father | Single Mother |
| No Children | 0 (0.0%) | 0 (0.0%) |
| 1 or 2 Children | 0 (0.0%) | 0 (0.0%) |
| 3 or 4 Children | 0 (0.0%) | 0 (0.0%) |
| 5 or more Children | 0 (0.0%) | 0 (0.0%) |
| Total | 0 (0.0%) | 0 (0.0%) |
Income Below Poverty Among Married-Couple vs Single-Parent Households in Mulberry
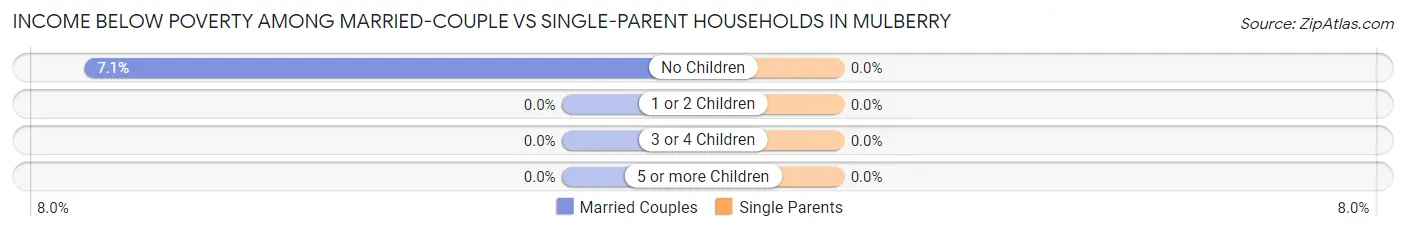
| Children | Married-Couple Families | Single-Parent Households |
| No Children | 34 (7.1%) | 0 (0.0%) |
| 1 or 2 Children | 0 (0.0%) | 0 (0.0%) |
| 3 or 4 Children | 0 (0.0%) | 0 (0.0%) |
| 5 or more Children | 0 (0.0%) | 0 (0.0%) |
| Total | 34 (4.9%) | 0 (0.0%) |
Employment Characteristics in Mulberry
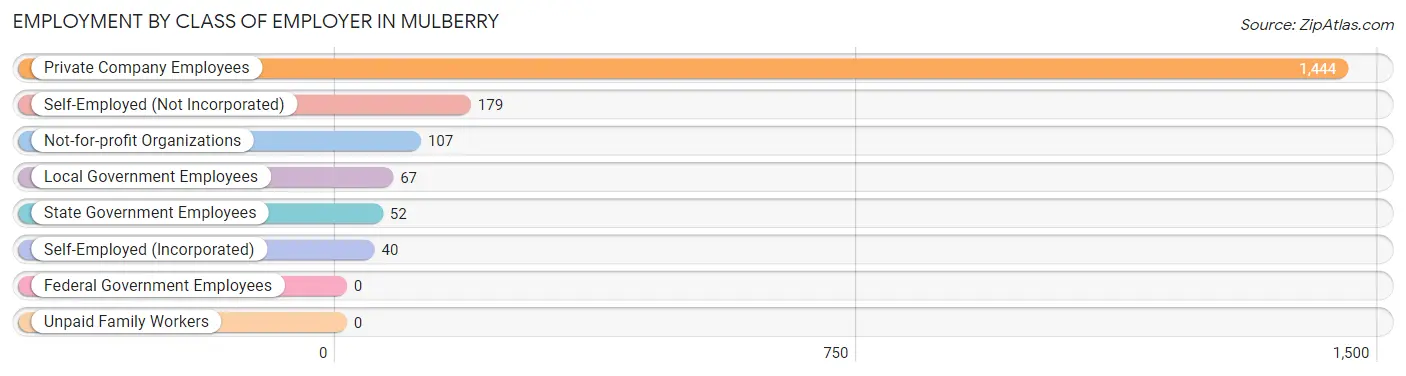
Employment by Class of Employer in Mulberry
Among the 1,889 employed individuals in Mulberry, private company employees (1,444 | 76.4%), self-employed (not incorporated) (179 | 9.5%), and not-for-profit organizations (107 | 5.7%) make up the most common classes of employment.
| Employer Class | # Employees | % Employees |
| Private Company Employees | 1,444 | 76.4% |
| Self-Employed (Incorporated) | 40 | 2.1% |
| Self-Employed (Not Incorporated) | 179 | 9.5% |
| Not-for-profit Organizations | 107 | 5.7% |
| Local Government Employees | 67 | 3.5% |
| State Government Employees | 52 | 2.8% |
| Federal Government Employees | 0 | 0.0% |
| Unpaid Family Workers | 0 | 0.0% |
| Total | 1,889 | 100.0% |
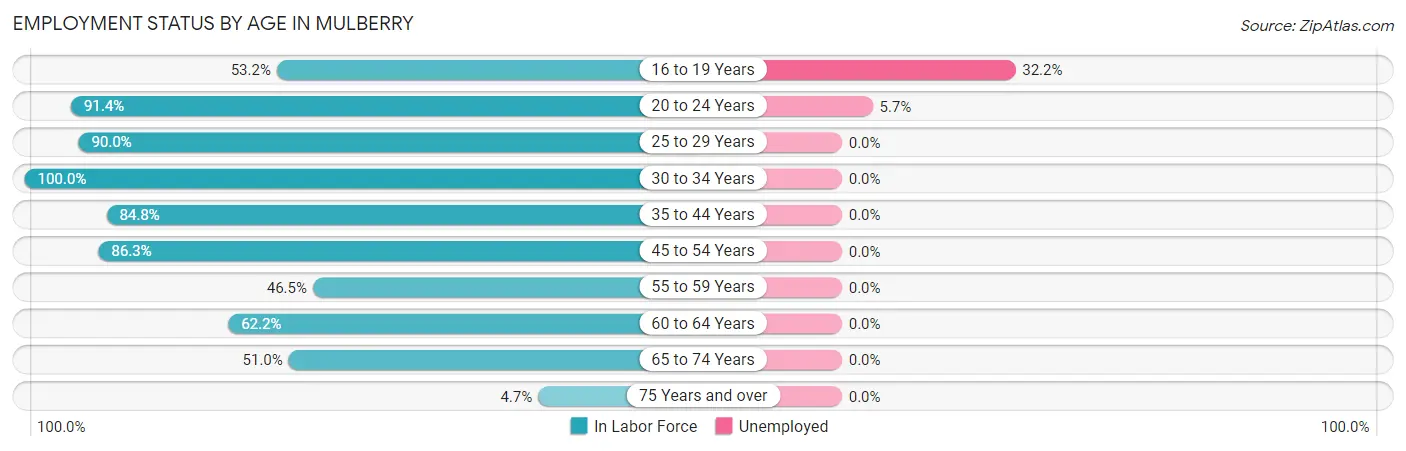
Employment Status by Age in Mulberry
According to the labor force statistics for Mulberry, out of the total population over 16 years of age (3,485), 56.3% or 1,962 individuals are in the labor force, with 2.6% or 51 of them unemployed. The age group with the highest labor force participation rate is 30 to 34 years, with 100.0% or 104 individuals in the labor force. Within the labor force, the 16 to 19 years age range has the highest percentage of unemployed individuals, with 32.2% or 37 of them being unemployed.
| Age Bracket | In Labor Force | Unemployed |
| 16 to 19 Years | 115 (53.2%) | 37 (32.2%) |
| 20 to 24 Years | 265 (91.4%) | 15 (5.7%) |
| 25 to 29 Years | 180 (90.0%) | 0 (0.0%) |
| 30 to 34 Years | 104 (100.0%) | 0 (0.0%) |
| 35 to 44 Years | 162 (84.8%) | 0 (0.0%) |
| 45 to 54 Years | 530 (86.3%) | 0 (0.0%) |
| 55 to 59 Years | 67 (46.5%) | 0 (0.0%) |
| 60 to 64 Years | 211 (62.2%) | 0 (0.0%) |
| 65 to 74 Years | 291 (51.0%) | 0 (0.0%) |
| 75 Years and over | 38 (4.7%) | 0 (0.0%) |
| Total | 1,962 (56.3%) | 51 (2.6%) |
Employment Status by Educational Attainment in Mulberry
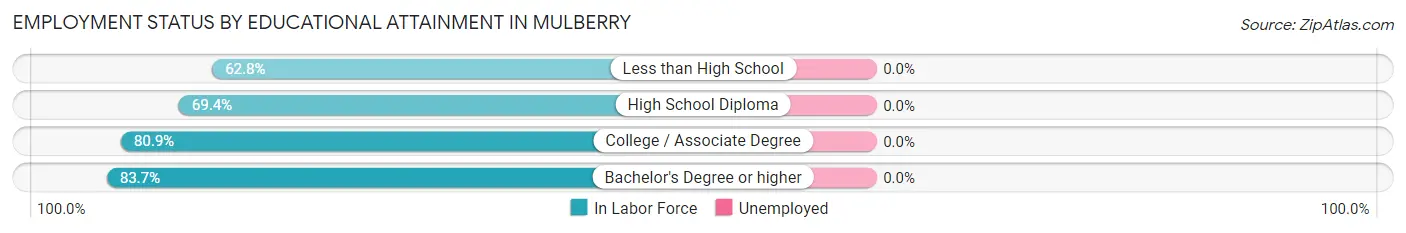
| Educational Attainment | In Labor Force | Unemployed |
| Less than High School | 54 (62.8%) | 0 (0.0%) |
| High School Diploma | 229 (69.4%) | 0 (0.0%) |
| College / Associate Degree | 399 (80.9%) | 0 (0.0%) |
| Bachelor's Degree or higher | 572 (83.7%) | 0 (0.0%) |
| Total | 1,254 (78.8%) | 0 (0.0%) |
Employment Occupations by Sex in Mulberry
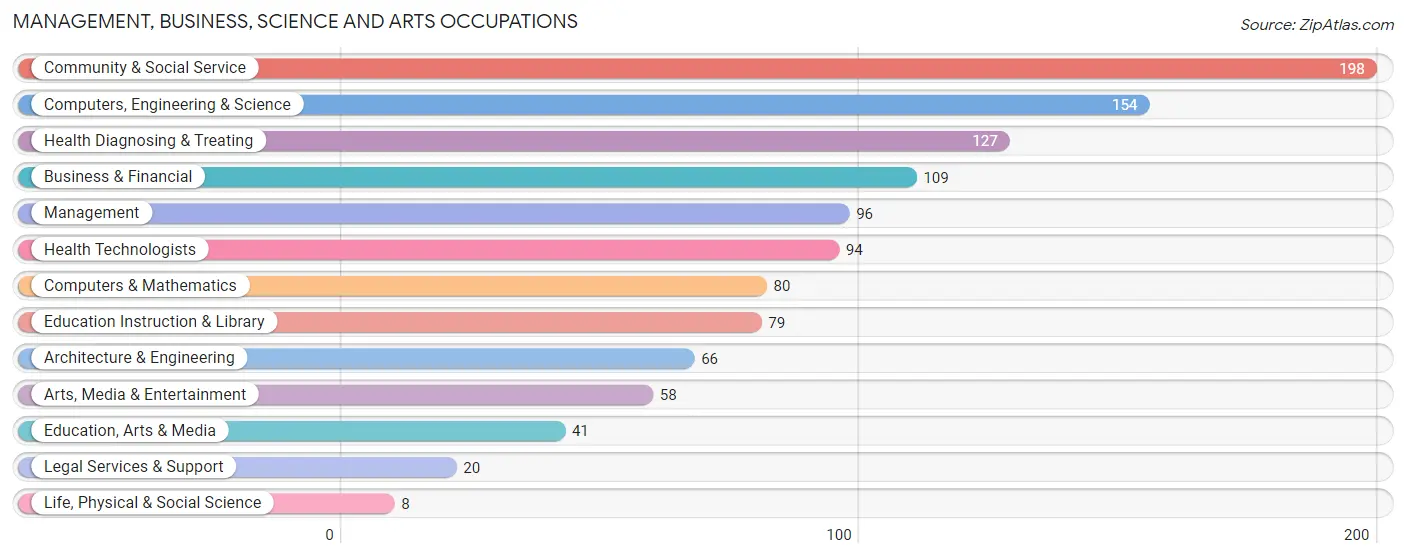
Management, Business, Science and Arts Occupations
The most common Management, Business, Science and Arts occupations in Mulberry are Community & Social Service (198 | 10.4%), Computers, Engineering & Science (154 | 8.1%), Health Diagnosing & Treating (127 | 6.7%), Business & Financial (109 | 5.7%), and Management (96 | 5.0%).
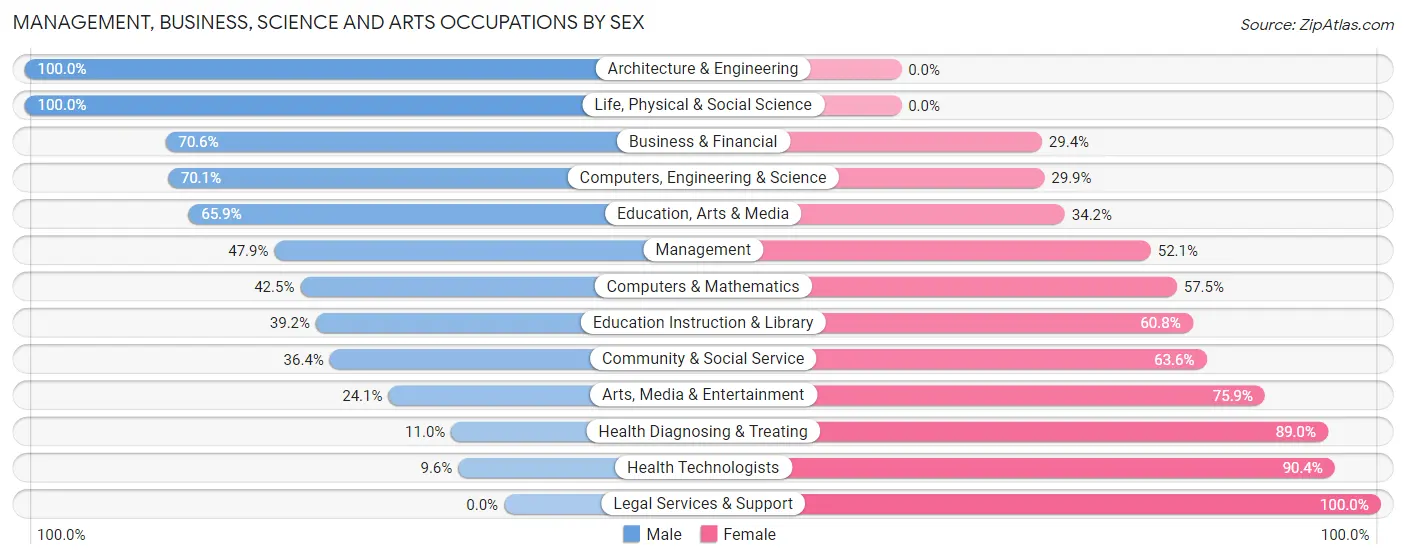
Management, Business, Science and Arts Occupations by Sex
Within the Management, Business, Science and Arts occupations in Mulberry, the most male-oriented occupations are Architecture & Engineering (100.0%), Life, Physical & Social Science (100.0%), and Business & Financial (70.6%), while the most female-oriented occupations are Legal Services & Support (100.0%), Health Technologists (90.4%), and Health Diagnosing & Treating (89.0%).
| Occupation | Male | Female |
| Management | 46 (47.9%) | 50 (52.1%) |
| Business & Financial | 77 (70.6%) | 32 (29.4%) |
| Computers, Engineering & Science | 108 (70.1%) | 46 (29.9%) |
| Computers & Mathematics | 34 (42.5%) | 46 (57.5%) |
| Architecture & Engineering | 66 (100.0%) | 0 (0.0%) |
| Life, Physical & Social Science | 8 (100.0%) | 0 (0.0%) |
| Community & Social Service | 72 (36.4%) | 126 (63.6%) |
| Education, Arts & Media | 27 (65.8%) | 14 (34.2%) |
| Legal Services & Support | 0 (0.0%) | 20 (100.0%) |
| Education Instruction & Library | 31 (39.2%) | 48 (60.8%) |
| Arts, Media & Entertainment | 14 (24.1%) | 44 (75.9%) |
| Health Diagnosing & Treating | 14 (11.0%) | 113 (89.0%) |
| Health Technologists | 9 (9.6%) | 85 (90.4%) |
| Total (Category) | 317 (46.4%) | 367 (53.6%) |
| Total (Overall) | 1,075 (56.2%) | 836 (43.8%) |
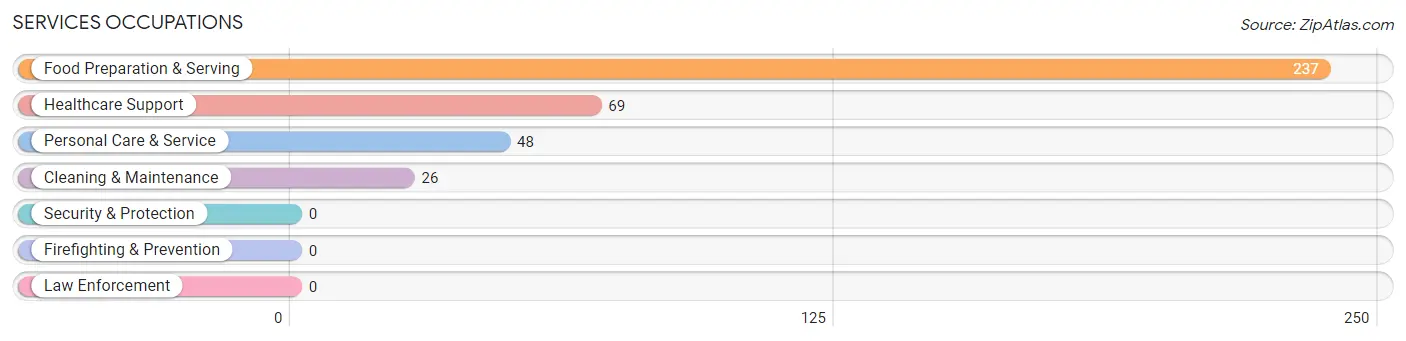
Services Occupations
The most common Services occupations in Mulberry are Food Preparation & Serving (237 | 12.4%), Healthcare Support (69 | 3.6%), Personal Care & Service (48 | 2.5%), and Cleaning & Maintenance (26 | 1.4%).
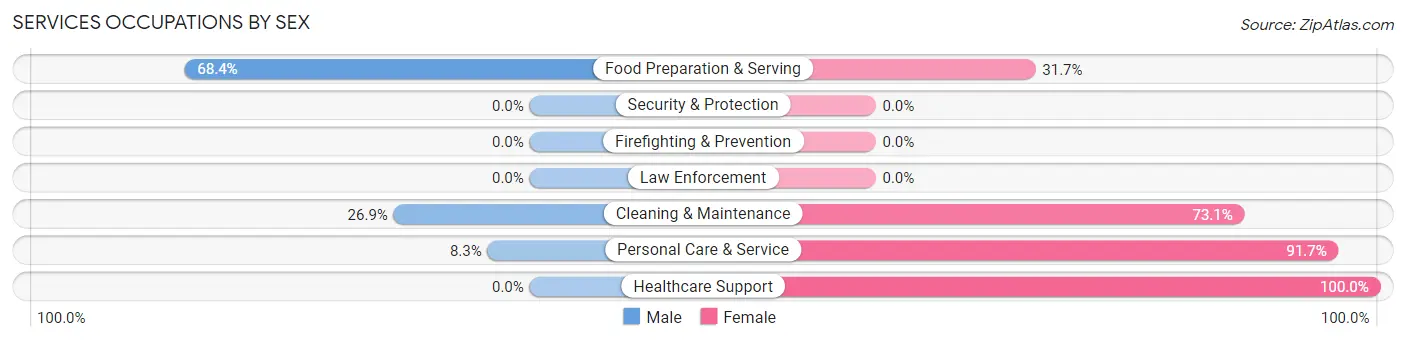
Services Occupations by Sex
Within the Services occupations in Mulberry, the most male-oriented occupations are Food Preparation & Serving (68.3%), Cleaning & Maintenance (26.9%), and Personal Care & Service (8.3%), while the most female-oriented occupations are Healthcare Support (100.0%), Personal Care & Service (91.7%), and Cleaning & Maintenance (73.1%).
| Occupation | Male | Female |
| Healthcare Support | 0 (0.0%) | 69 (100.0%) |
| Security & Protection | 0 (0.0%) | 0 (0.0%) |
| Firefighting & Prevention | 0 (0.0%) | 0 (0.0%) |
| Law Enforcement | 0 (0.0%) | 0 (0.0%) |
| Food Preparation & Serving | 162 (68.3%) | 75 (31.7%) |
| Cleaning & Maintenance | 7 (26.9%) | 19 (73.1%) |
| Personal Care & Service | 4 (8.3%) | 44 (91.7%) |
| Total (Category) | 173 (45.5%) | 207 (54.5%) |
| Total (Overall) | 1,075 (56.2%) | 836 (43.8%) |
Sales and Office Occupations
The most common Sales and Office occupations in Mulberry are Sales & Related (209 | 10.9%), and Office & Administration (171 | 8.9%).

Sales and Office Occupations by Sex

| Occupation | Male | Female |
| Sales & Related | 112 (53.6%) | 97 (46.4%) |
| Office & Administration | 23 (13.5%) | 148 (86.6%) |
| Total (Category) | 135 (35.5%) | 245 (64.5%) |
| Total (Overall) | 1,075 (56.2%) | 836 (43.8%) |
Natural Resources, Construction and Maintenance Occupations
The most common Natural Resources, Construction and Maintenance occupations in Mulberry are Installation, Maintenance & Repair (263 | 13.8%), and Construction & Extraction (63 | 3.3%).
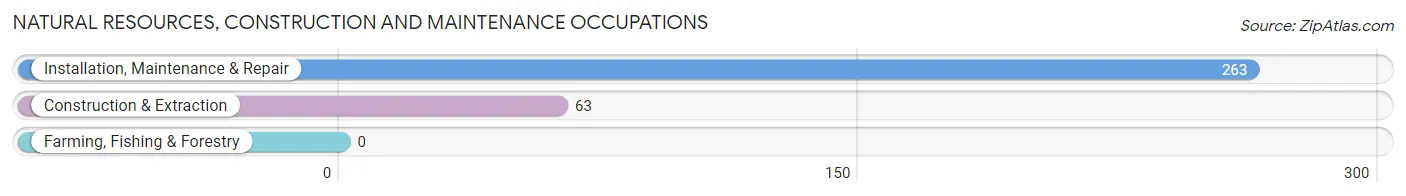
Natural Resources, Construction and Maintenance Occupations by Sex

| Occupation | Male | Female |
| Farming, Fishing & Forestry | 0 (0.0%) | 0 (0.0%) |
| Construction & Extraction | 63 (100.0%) | 0 (0.0%) |
| Installation, Maintenance & Repair | 263 (100.0%) | 0 (0.0%) |
| Total (Category) | 326 (100.0%) | 0 (0.0%) |
| Total (Overall) | 1,075 (56.2%) | 836 (43.8%) |
Production, Transportation and Moving Occupations
The most common Production, Transportation and Moving occupations in Mulberry are Material Moving (81 | 4.2%), Production (40 | 2.1%), and Transportation (20 | 1.1%).
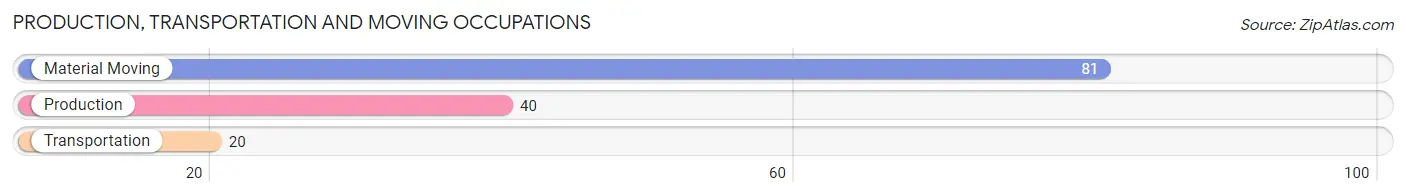
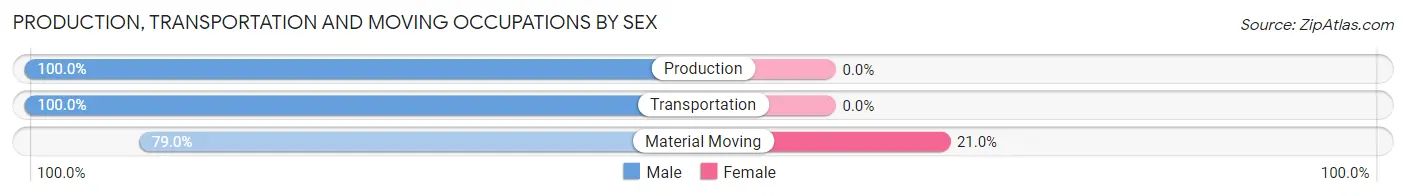
Production, Transportation and Moving Occupations by Sex
| Occupation | Male | Female |
| Production | 40 (100.0%) | 0 (0.0%) |
| Transportation | 20 (100.0%) | 0 (0.0%) |
| Material Moving | 64 (79.0%) | 17 (21.0%) |
| Total (Category) | 124 (87.9%) | 17 (12.1%) |
| Total (Overall) | 1,075 (56.2%) | 836 (43.8%) |
Employment Industries by Sex in Mulberry
Employment Industries in Mulberry
The major employment industries in Mulberry include Manufacturing (326 | 17.1%), Health Care & Social Assistance (250 | 13.1%), Accommodation & Food Services (235 | 12.3%), Retail Trade (220 | 11.5%), and Professional & Scientific (200 | 10.5%).
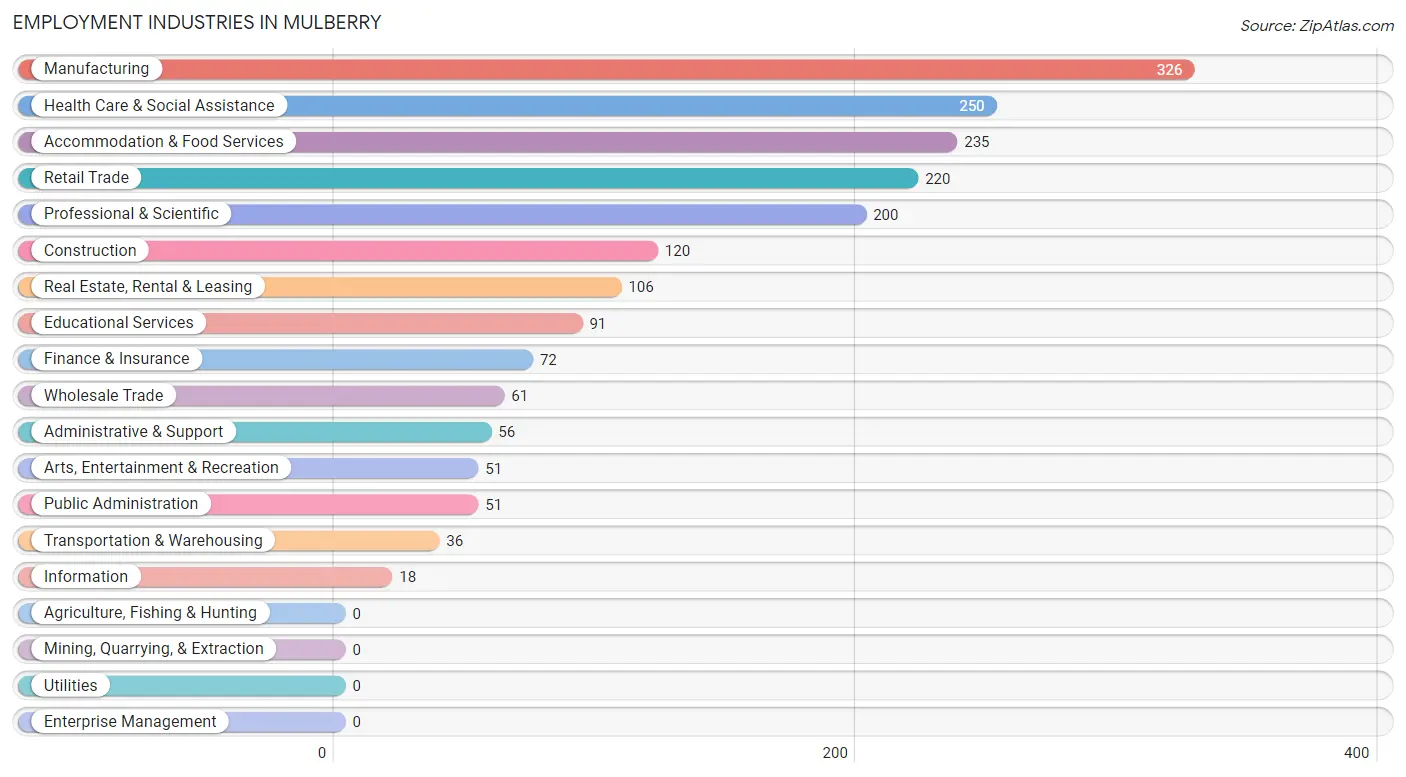
Employment Industries by Sex in Mulberry
The Mulberry industries that see more men than women are Construction (100.0%), Manufacturing (90.8%), and Wholesale Trade (85.3%), whereas the industries that tend to have a higher number of women are Health Care & Social Assistance (98.0%), Arts, Entertainment & Recreation (70.6%), and Educational Services (65.9%).
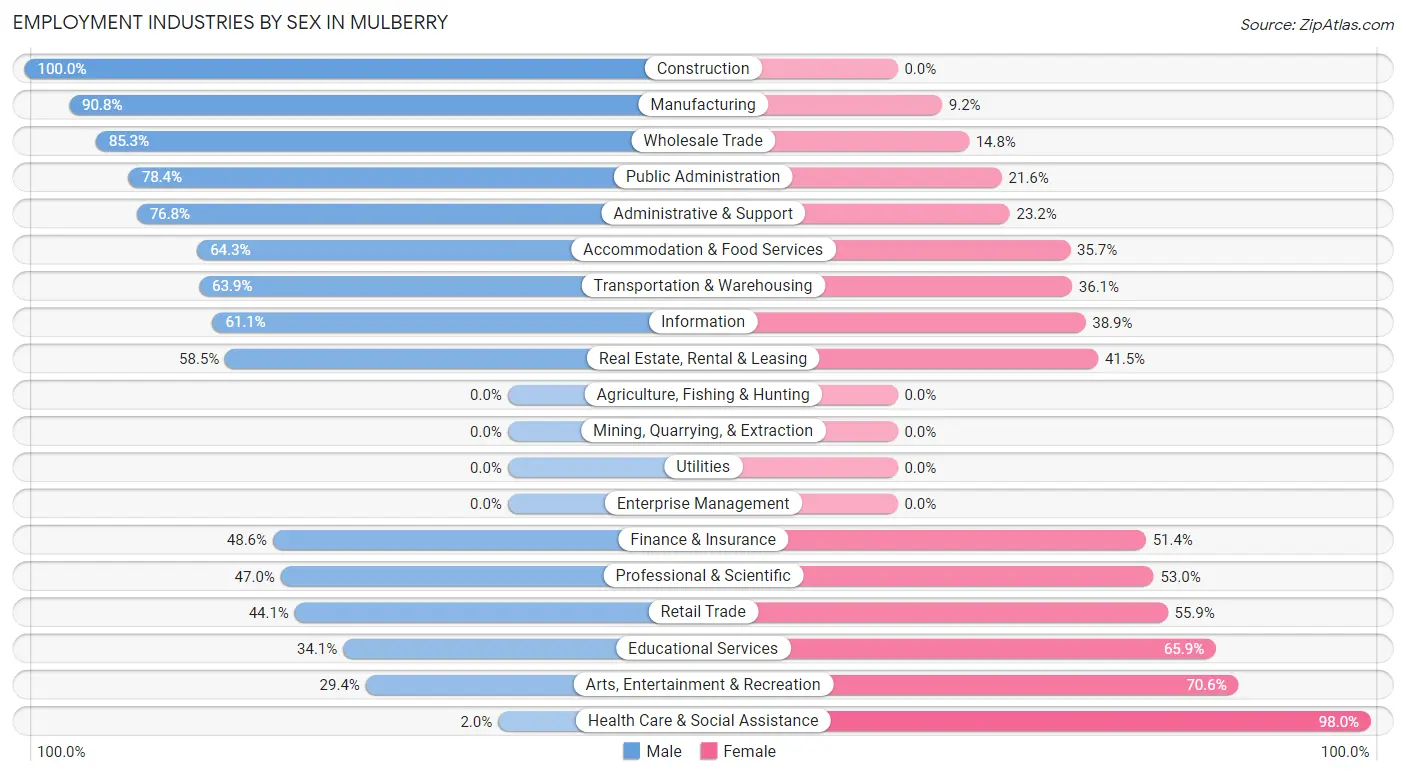
| Industry | Male | Female |
| Agriculture, Fishing & Hunting | 0 (0.0%) | 0 (0.0%) |
| Mining, Quarrying, & Extraction | 0 (0.0%) | 0 (0.0%) |
| Construction | 120 (100.0%) | 0 (0.0%) |
| Manufacturing | 296 (90.8%) | 30 (9.2%) |
| Wholesale Trade | 52 (85.3%) | 9 (14.7%) |
| Retail Trade | 97 (44.1%) | 123 (55.9%) |
| Transportation & Warehousing | 23 (63.9%) | 13 (36.1%) |
| Utilities | 0 (0.0%) | 0 (0.0%) |
| Information | 11 (61.1%) | 7 (38.9%) |
| Finance & Insurance | 35 (48.6%) | 37 (51.4%) |
| Real Estate, Rental & Leasing | 62 (58.5%) | 44 (41.5%) |
| Professional & Scientific | 94 (47.0%) | 106 (53.0%) |
| Enterprise Management | 0 (0.0%) | 0 (0.0%) |
| Administrative & Support | 43 (76.8%) | 13 (23.2%) |
| Educational Services | 31 (34.1%) | 60 (65.9%) |
| Health Care & Social Assistance | 5 (2.0%) | 245 (98.0%) |
| Arts, Entertainment & Recreation | 15 (29.4%) | 36 (70.6%) |
| Accommodation & Food Services | 151 (64.3%) | 84 (35.7%) |
| Public Administration | 40 (78.4%) | 11 (21.6%) |
| Total | 1,075 (56.2%) | 836 (43.8%) |
Education in Mulberry
School Enrollment in Mulberry
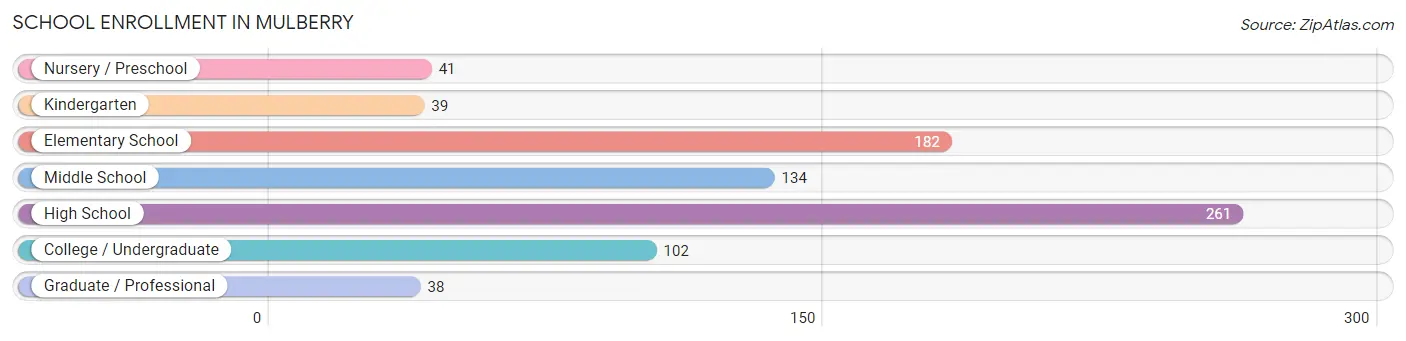
The most common levels of schooling among the 797 students in Mulberry are high school (261 | 32.8%), elementary school (182 | 22.8%), and middle school (134 | 16.8%).
| School Level | # Students | % Students |
| Nursery / Preschool | 41 | 5.1% |
| Kindergarten | 39 | 4.9% |
| Elementary School | 182 | 22.8% |
| Middle School | 134 | 16.8% |
| High School | 261 | 32.8% |
| College / Undergraduate | 102 | 12.8% |
| Graduate / Professional | 38 | 4.8% |
| Total | 797 | 100.0% |
School Enrollment by Age by Funding Source in Mulberry
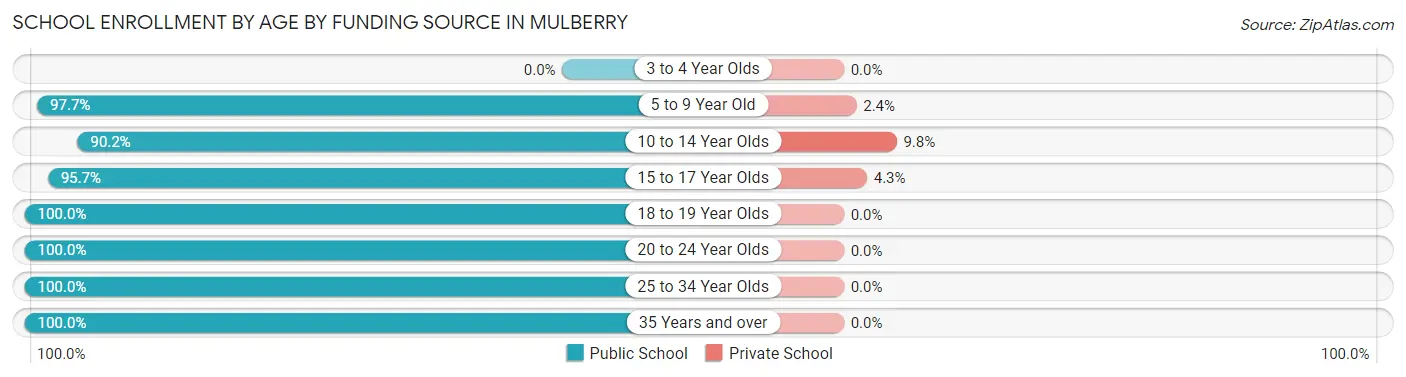
Out of a total of 797 students who are enrolled in schools in Mulberry, 32 (4.0%) attend a private institution, while the remaining 765 (96.0%) are enrolled in public schools. The age group of 10 to 14 year olds has the highest likelihood of being enrolled in private schools, with 18 (9.8% in the age bracket) enrolled. Conversely, the age group of 18 to 19 year olds has the lowest likelihood of being enrolled in a private school, with 49 (100.0% in the age bracket) attending a public institution.
| Age Bracket | Public School | Private School |
| 3 to 4 Year Olds | 0 (0.0%) | 0 (0.0%) |
| 5 to 9 Year Old | 208 (97.7%) | 5 (2.4%) |
| 10 to 14 Year Olds | 165 (90.2%) | 18 (9.8%) |
| 15 to 17 Year Olds | 200 (95.7%) | 9 (4.3%) |
| 18 to 19 Year Olds | 49 (100.0%) | 0 (0.0%) |
| 20 to 24 Year Olds | 43 (100.0%) | 0 (0.0%) |
| 25 to 34 Year Olds | 27 (100.0%) | 0 (0.0%) |
| 35 Years and over | 73 (100.0%) | 0 (0.0%) |
| Total | 765 (96.0%) | 32 (4.0%) |
Educational Attainment by Field of Study in Mulberry
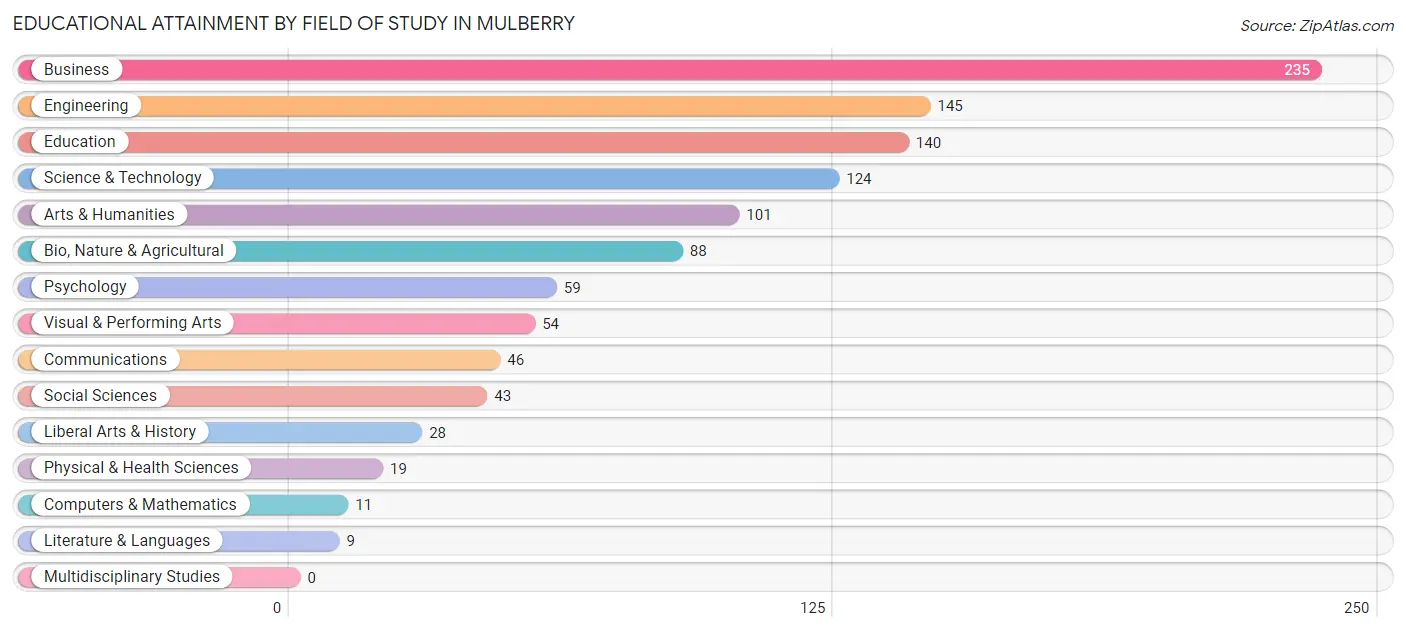
Business (235 | 21.3%), engineering (145 | 13.2%), education (140 | 12.7%), science & technology (124 | 11.3%), and arts & humanities (101 | 9.2%) are the most common fields of study among 1,102 individuals in Mulberry who have obtained a bachelor's degree or higher.
| Field of Study | # Graduates | % Graduates |
| Computers & Mathematics | 11 | 1.0% |
| Bio, Nature & Agricultural | 88 | 8.0% |
| Physical & Health Sciences | 19 | 1.7% |
| Psychology | 59 | 5.3% |
| Social Sciences | 43 | 3.9% |
| Engineering | 145 | 13.2% |
| Multidisciplinary Studies | 0 | 0.0% |
| Science & Technology | 124 | 11.3% |
| Business | 235 | 21.3% |
| Education | 140 | 12.7% |
| Literature & Languages | 9 | 0.8% |
| Liberal Arts & History | 28 | 2.5% |
| Visual & Performing Arts | 54 | 4.9% |
| Communications | 46 | 4.2% |
| Arts & Humanities | 101 | 9.2% |
| Total | 1,102 | 100.0% |
Transportation & Commute in Mulberry
Vehicle Availability by Sex in Mulberry
The most prevalent vehicle ownership categories in Mulberry are males with 2 vehicles (507, accounting for 48.1%) and females with 2 vehicles (363, making up 60.7%).
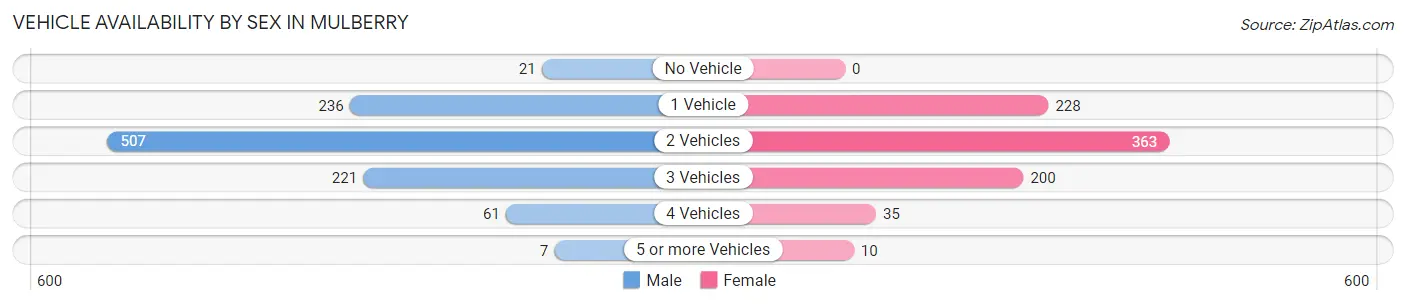
| Vehicles Available | Male | Female |
| No Vehicle | 21 (2.0%) | 0 (0.0%) |
| 1 Vehicle | 236 (22.4%) | 228 (27.3%) |
| 2 Vehicles | 507 (48.1%) | 363 (43.4%) |
| 3 Vehicles | 221 (21.0%) | 200 (23.9%) |
| 4 Vehicles | 61 (5.8%) | 35 (4.2%) |
| 5 or more Vehicles | 7 (0.7%) | 10 (1.2%) |
| Total | 1,053 (100.0%) | 836 (100.0%) |
Commute Time in Mulberry
The most frequently occuring commute durations in Mulberry are 10 to 14 minutes (283 commuters, 16.9%), 30 to 34 minutes (248 commuters, 14.8%), and 20 to 24 minutes (246 commuters, 14.7%).
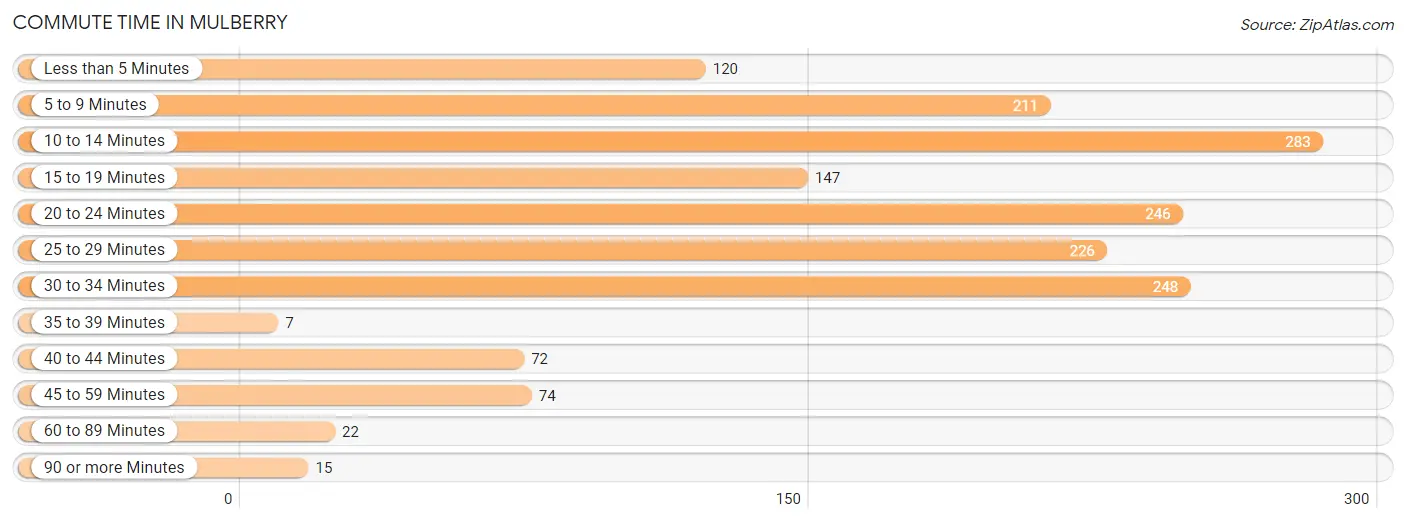
| Commute Time | # Commuters | % Commuters |
| Less than 5 Minutes | 120 | 7.2% |
| 5 to 9 Minutes | 211 | 12.6% |
| 10 to 14 Minutes | 283 | 16.9% |
| 15 to 19 Minutes | 147 | 8.8% |
| 20 to 24 Minutes | 246 | 14.7% |
| 25 to 29 Minutes | 226 | 13.5% |
| 30 to 34 Minutes | 248 | 14.8% |
| 35 to 39 Minutes | 7 | 0.4% |
| 40 to 44 Minutes | 72 | 4.3% |
| 45 to 59 Minutes | 74 | 4.4% |
| 60 to 89 Minutes | 22 | 1.3% |
| 90 or more Minutes | 15 | 0.9% |
Commute Time by Sex in Mulberry
The most common commute times in Mulberry are 10 to 14 minutes (190 commuters, 20.5%) for males and 20 to 24 minutes (182 commuters, 24.5%) for females.
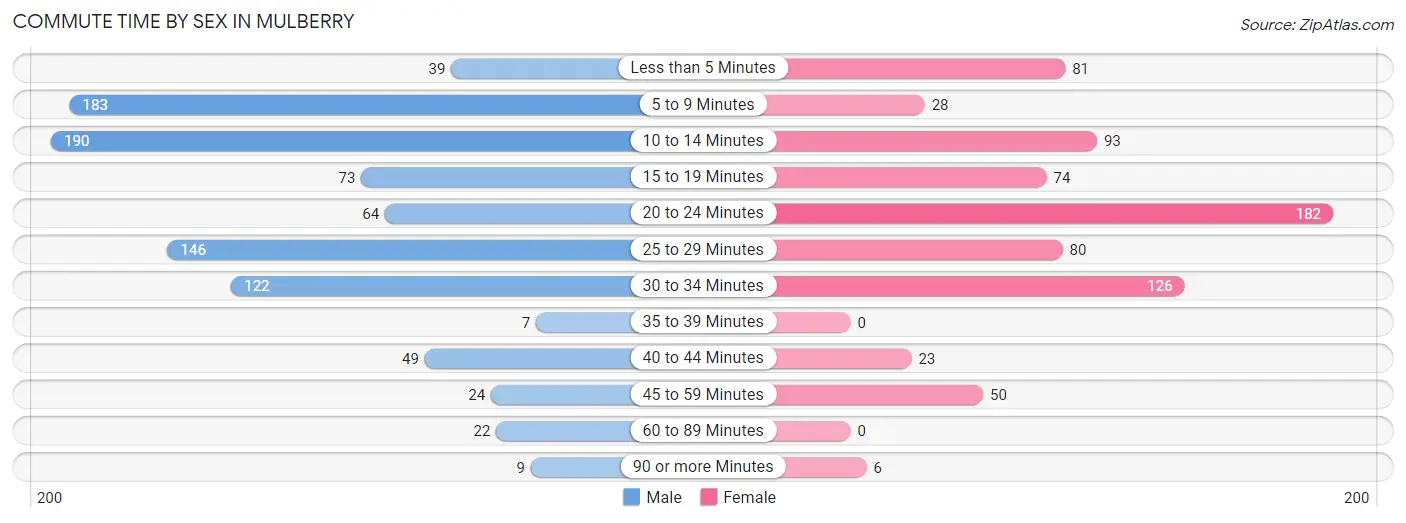
| Commute Time | Male | Female |
| Less than 5 Minutes | 39 (4.2%) | 81 (10.9%) |
| 5 to 9 Minutes | 183 (19.7%) | 28 (3.8%) |
| 10 to 14 Minutes | 190 (20.5%) | 93 (12.5%) |
| 15 to 19 Minutes | 73 (7.9%) | 74 (10.0%) |
| 20 to 24 Minutes | 64 (6.9%) | 182 (24.5%) |
| 25 to 29 Minutes | 146 (15.7%) | 80 (10.8%) |
| 30 to 34 Minutes | 122 (13.2%) | 126 (17.0%) |
| 35 to 39 Minutes | 7 (0.7%) | 0 (0.0%) |
| 40 to 44 Minutes | 49 (5.3%) | 23 (3.1%) |
| 45 to 59 Minutes | 24 (2.6%) | 50 (6.7%) |
| 60 to 89 Minutes | 22 (2.4%) | 0 (0.0%) |
| 90 or more Minutes | 9 (1.0%) | 6 (0.8%) |
Time of Departure to Work by Sex in Mulberry
The most frequent times of departure to work in Mulberry are 7:30 AM to 7:59 AM (189, 20.4%) for males and 7:00 AM to 7:29 AM (116, 15.6%) for females.
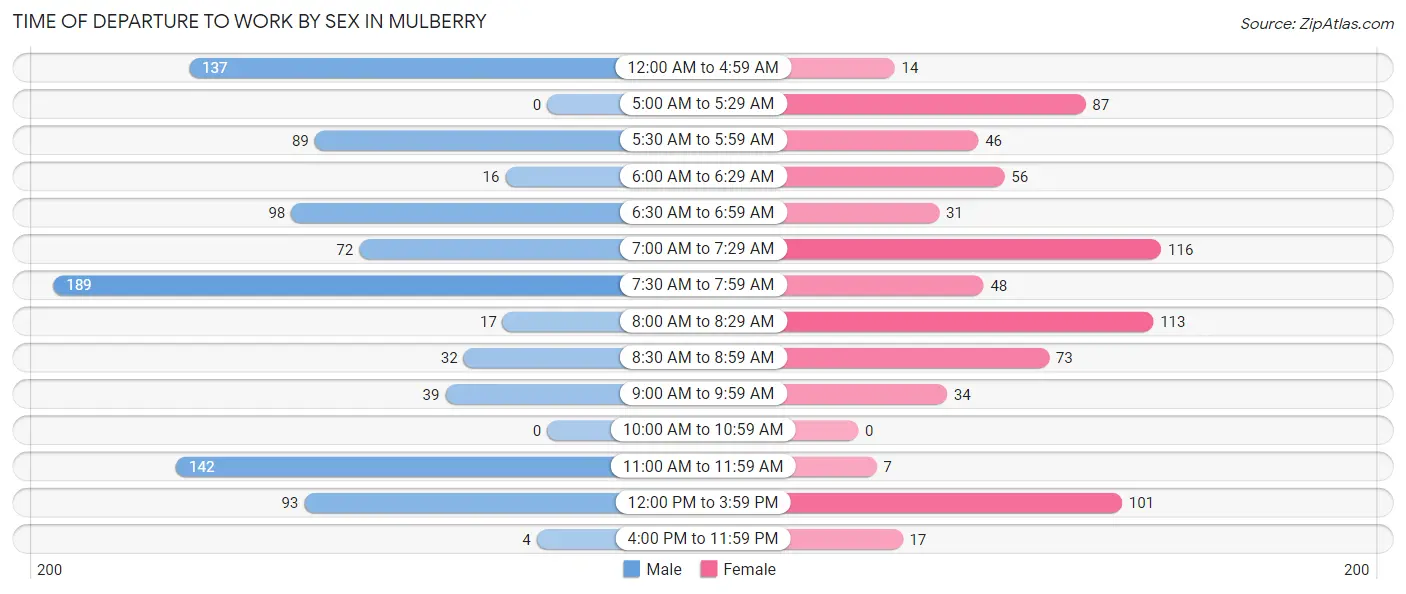
| Time of Departure | Male | Female |
| 12:00 AM to 4:59 AM | 137 (14.8%) | 14 (1.9%) |
| 5:00 AM to 5:29 AM | 0 (0.0%) | 87 (11.7%) |
| 5:30 AM to 5:59 AM | 89 (9.6%) | 46 (6.2%) |
| 6:00 AM to 6:29 AM | 16 (1.7%) | 56 (7.5%) |
| 6:30 AM to 6:59 AM | 98 (10.6%) | 31 (4.2%) |
| 7:00 AM to 7:29 AM | 72 (7.8%) | 116 (15.6%) |
| 7:30 AM to 7:59 AM | 189 (20.4%) | 48 (6.5%) |
| 8:00 AM to 8:29 AM | 17 (1.8%) | 113 (15.2%) |
| 8:30 AM to 8:59 AM | 32 (3.5%) | 73 (9.8%) |
| 9:00 AM to 9:59 AM | 39 (4.2%) | 34 (4.6%) |
| 10:00 AM to 10:59 AM | 0 (0.0%) | 0 (0.0%) |
| 11:00 AM to 11:59 AM | 142 (15.3%) | 7 (0.9%) |
| 12:00 PM to 3:59 PM | 93 (10.0%) | 101 (13.6%) |
| 4:00 PM to 11:59 PM | 4 (0.4%) | 17 (2.3%) |
| Total | 928 (100.0%) | 743 (100.0%) |
Housing Occupancy in Mulberry
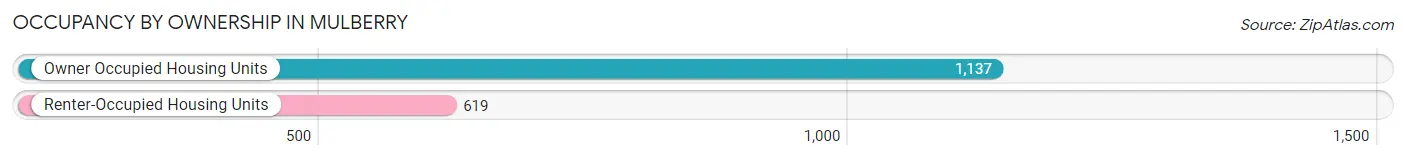
Occupancy by Ownership in Mulberry
Of the total 1,756 dwellings in Mulberry, owner-occupied units account for 1,137 (64.7%), while renter-occupied units make up 619 (35.2%).
| Occupancy | # Housing Units | % Housing Units |
| Owner Occupied Housing Units | 1,137 | 64.7% |
| Renter-Occupied Housing Units | 619 | 35.2% |
| Total Occupied Housing Units | 1,756 | 100.0% |
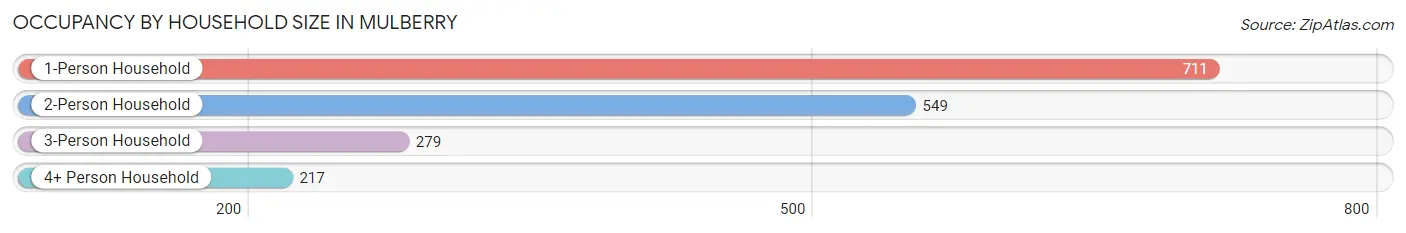
Occupancy by Household Size in Mulberry
| Household Size | # Housing Units | % Housing Units |
| 1-Person Household | 711 | 40.5% |
| 2-Person Household | 549 | 31.3% |
| 3-Person Household | 279 | 15.9% |
| 4+ Person Household | 217 | 12.4% |
| Total Housing Units | 1,756 | 100.0% |
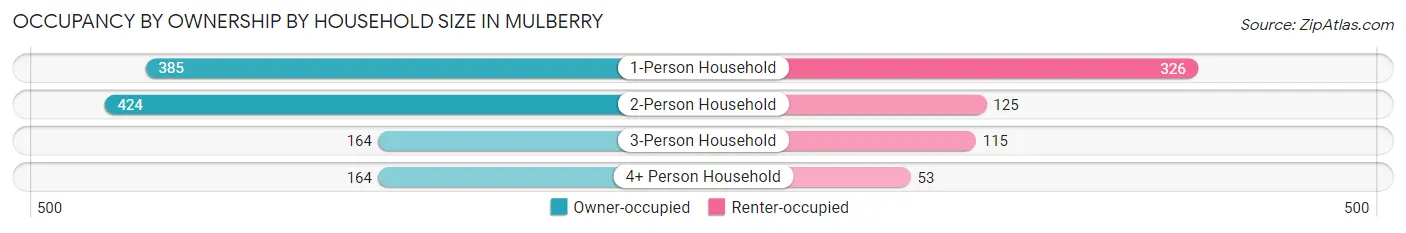
Occupancy by Ownership by Household Size in Mulberry
| Household Size | Owner-occupied | Renter-occupied |
| 1-Person Household | 385 (54.1%) | 326 (45.9%) |
| 2-Person Household | 424 (77.2%) | 125 (22.8%) |
| 3-Person Household | 164 (58.8%) | 115 (41.2%) |
| 4+ Person Household | 164 (75.6%) | 53 (24.4%) |
| Total Housing Units | 1,137 (64.7%) | 619 (35.2%) |
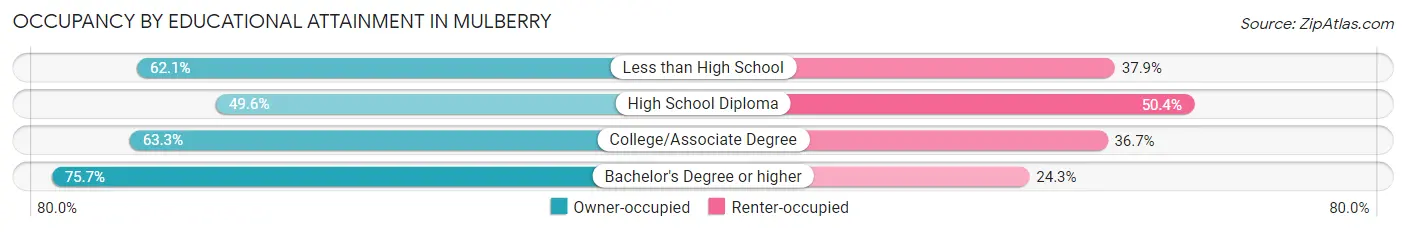
Occupancy by Educational Attainment in Mulberry
| Household Size | Owner-occupied | Renter-occupied |
| Less than High School | 87 (62.1%) | 53 (37.9%) |
| High School Diploma | 208 (49.6%) | 211 (50.4%) |
| College/Associate Degree | 328 (63.3%) | 190 (36.7%) |
| Bachelor's Degree or higher | 514 (75.7%) | 165 (24.3%) |
Occupancy by Age of Householder in Mulberry
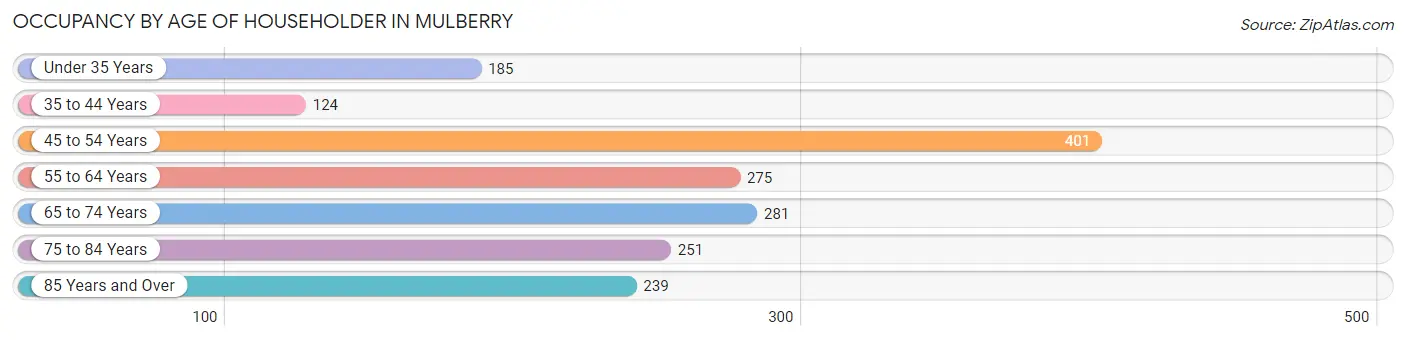
| Age Bracket | # Households | % Households |
| Under 35 Years | 185 | 10.5% |
| 35 to 44 Years | 124 | 7.1% |
| 45 to 54 Years | 401 | 22.8% |
| 55 to 64 Years | 275 | 15.7% |
| 65 to 74 Years | 281 | 16.0% |
| 75 to 84 Years | 251 | 14.3% |
| 85 Years and Over | 239 | 13.6% |
| Total | 1,756 | 100.0% |
Housing Finances in Mulberry
Median Income by Occupancy in Mulberry
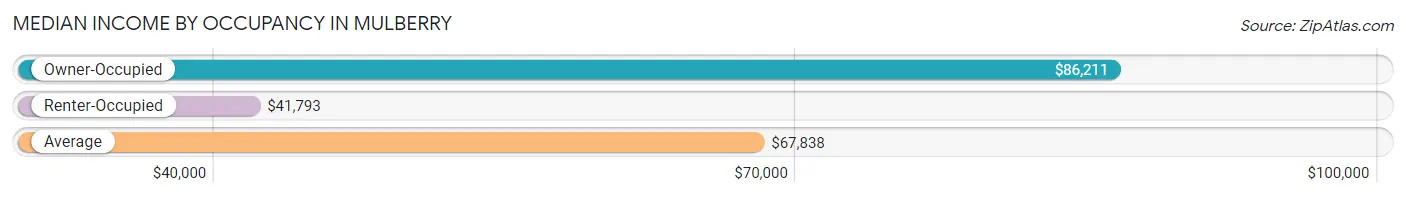
| Occupancy Type | # Households | Median Income |
| Owner-Occupied | 1,137 (64.7%) | $86,211 |
| Renter-Occupied | 619 (35.2%) | $41,793 |
| Average | 1,756 (100.0%) | $67,838 |
Occupancy by Householder Income Bracket in Mulberry
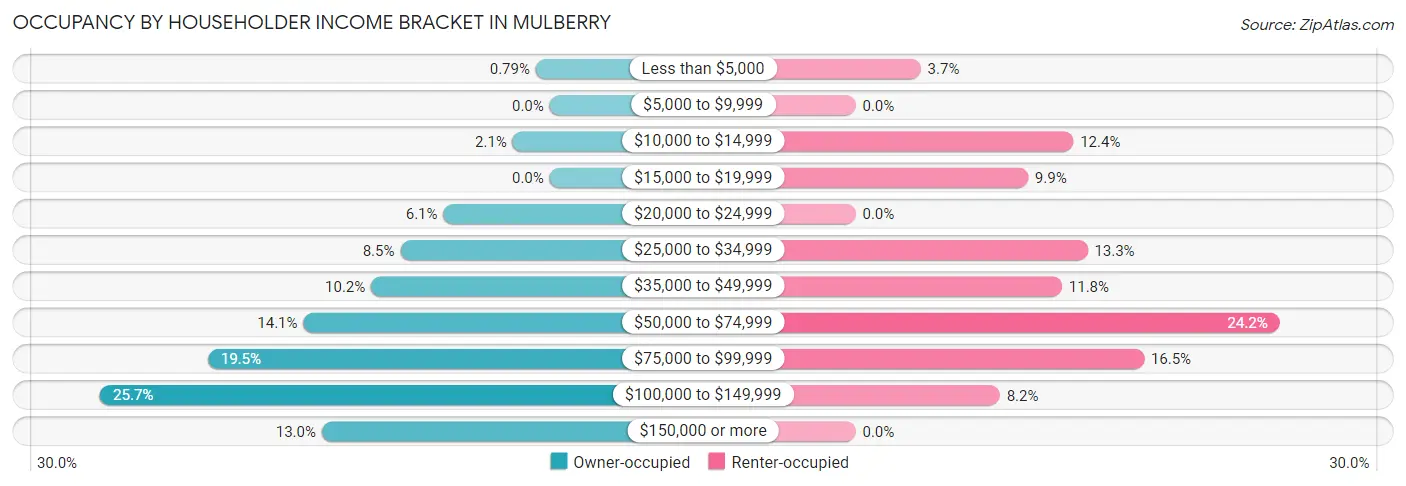
| Income Bracket | Owner-occupied | Renter-occupied |
| Less than $5,000 | 9 (0.8%) | 23 (3.7%) |
| $5,000 to $9,999 | 0 (0.0%) | 0 (0.0%) |
| $10,000 to $14,999 | 24 (2.1%) | 77 (12.4%) |
| $15,000 to $19,999 | 0 (0.0%) | 61 (9.9%) |
| $20,000 to $24,999 | 69 (6.1%) | 0 (0.0%) |
| $25,000 to $34,999 | 97 (8.5%) | 82 (13.3%) |
| $35,000 to $49,999 | 116 (10.2%) | 73 (11.8%) |
| $50,000 to $74,999 | 160 (14.1%) | 150 (24.2%) |
| $75,000 to $99,999 | 222 (19.5%) | 102 (16.5%) |
| $100,000 to $149,999 | 292 (25.7%) | 51 (8.2%) |
| $150,000 or more | 148 (13.0%) | 0 (0.0%) |
| Total | 1,137 (100.0%) | 619 (100.0%) |
Monthly Housing Cost Tiers in Mulberry
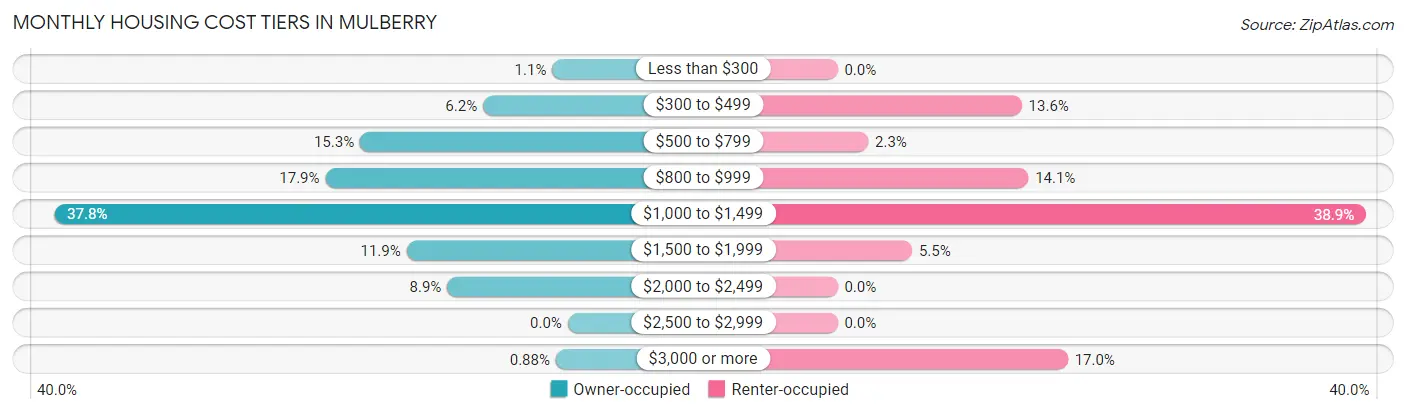
| Monthly Cost | Owner-occupied | Renter-occupied |
| Less than $300 | 13 (1.1%) | 0 (0.0%) |
| $300 to $499 | 71 (6.2%) | 84 (13.6%) |
| $500 to $799 | 174 (15.3%) | 14 (2.3%) |
| $800 to $999 | 203 (17.8%) | 87 (14.1%) |
| $1,000 to $1,499 | 430 (37.8%) | 241 (38.9%) |
| $1,500 to $1,999 | 135 (11.9%) | 34 (5.5%) |
| $2,000 to $2,499 | 101 (8.9%) | 0 (0.0%) |
| $2,500 to $2,999 | 0 (0.0%) | 0 (0.0%) |
| $3,000 or more | 10 (0.9%) | 105 (17.0%) |
| Total | 1,137 (100.0%) | 619 (100.0%) |
Physical Housing Characteristics in Mulberry
Housing Structures in Mulberry
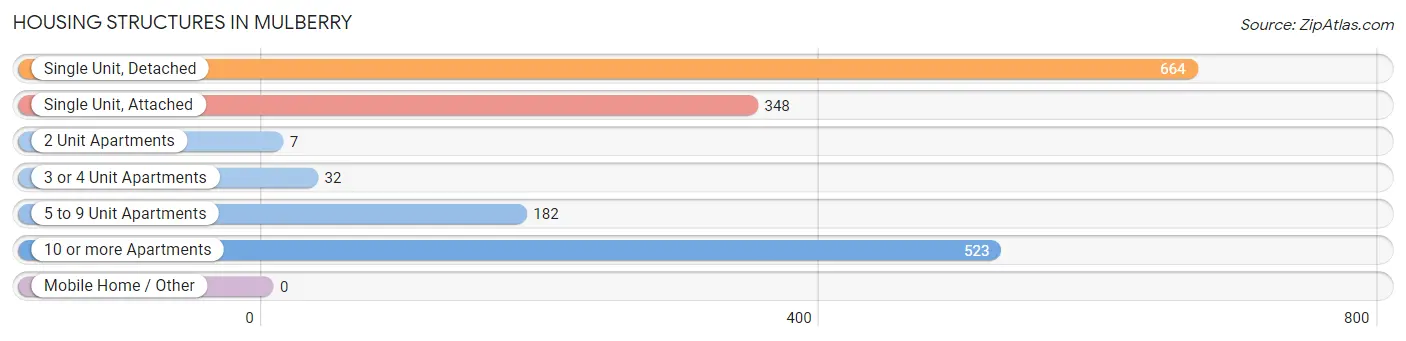
| Structure Type | # Housing Units | % Housing Units |
| Single Unit, Detached | 664 | 37.8% |
| Single Unit, Attached | 348 | 19.8% |
| 2 Unit Apartments | 7 | 0.4% |
| 3 or 4 Unit Apartments | 32 | 1.8% |
| 5 to 9 Unit Apartments | 182 | 10.4% |
| 10 or more Apartments | 523 | 29.8% |
| Mobile Home / Other | 0 | 0.0% |
| Total | 1,756 | 100.0% |
Housing Structures by Occupancy in Mulberry
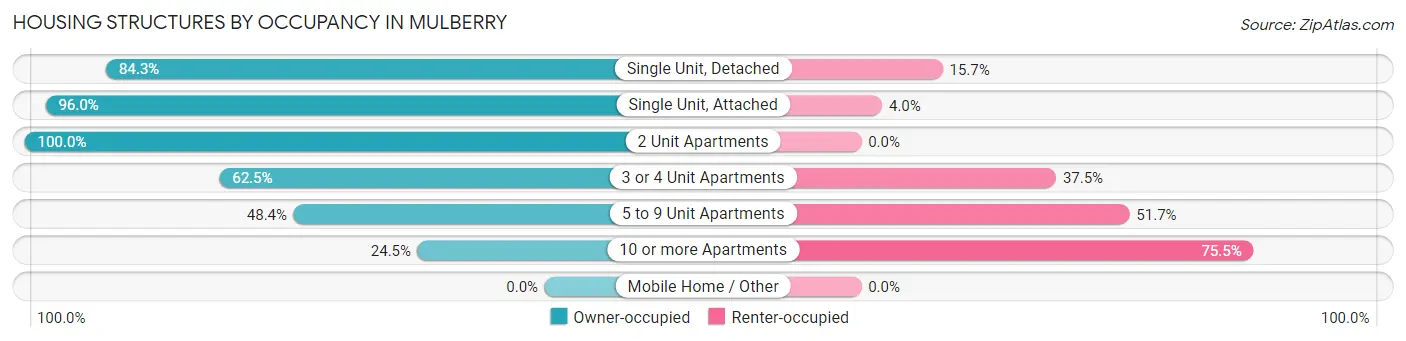
| Structure Type | Owner-occupied | Renter-occupied |
| Single Unit, Detached | 560 (84.3%) | 104 (15.7%) |
| Single Unit, Attached | 334 (96.0%) | 14 (4.0%) |
| 2 Unit Apartments | 7 (100.0%) | 0 (0.0%) |
| 3 or 4 Unit Apartments | 20 (62.5%) | 12 (37.5%) |
| 5 to 9 Unit Apartments | 88 (48.3%) | 94 (51.6%) |
| 10 or more Apartments | 128 (24.5%) | 395 (75.5%) |
| Mobile Home / Other | 0 (0.0%) | 0 (0.0%) |
| Total | 1,137 (64.7%) | 619 (35.2%) |
Housing Structures by Number of Rooms in Mulberry
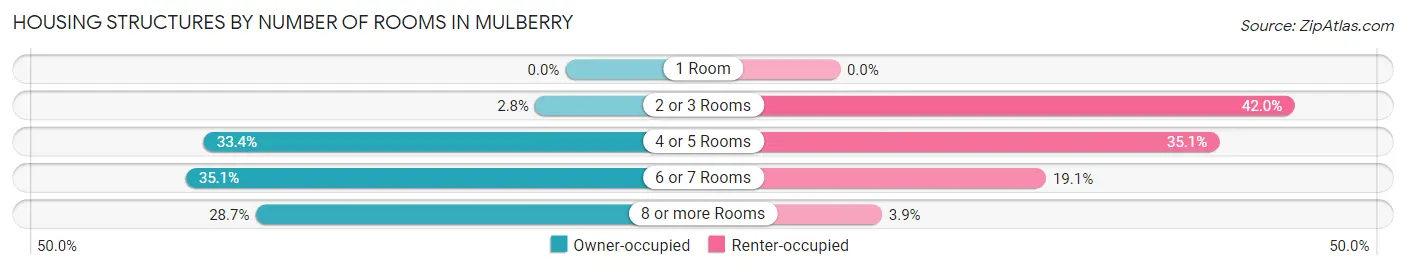
| Number of Rooms | Owner-occupied | Renter-occupied |
| 1 Room | 0 (0.0%) | 0 (0.0%) |
| 2 or 3 Rooms | 32 (2.8%) | 260 (42.0%) |
| 4 or 5 Rooms | 380 (33.4%) | 217 (35.1%) |
| 6 or 7 Rooms | 399 (35.1%) | 118 (19.1%) |
| 8 or more Rooms | 326 (28.7%) | 24 (3.9%) |
| Total | 1,137 (100.0%) | 619 (100.0%) |
Housing Structure by Heating Type in Mulberry
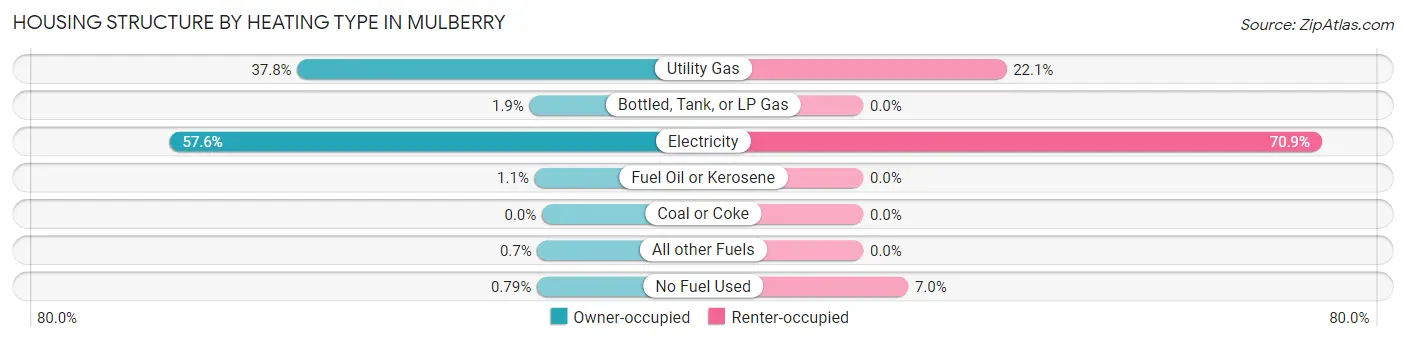
| Heating Type | Owner-occupied | Renter-occupied |
| Utility Gas | 430 (37.8%) | 137 (22.1%) |
| Bottled, Tank, or LP Gas | 22 (1.9%) | 0 (0.0%) |
| Electricity | 655 (57.6%) | 439 (70.9%) |
| Fuel Oil or Kerosene | 13 (1.1%) | 0 (0.0%) |
| Coal or Coke | 0 (0.0%) | 0 (0.0%) |
| All other Fuels | 8 (0.7%) | 0 (0.0%) |
| No Fuel Used | 9 (0.8%) | 43 (7.0%) |
| Total | 1,137 (100.0%) | 619 (100.0%) |
Household Vehicle Usage in Mulberry
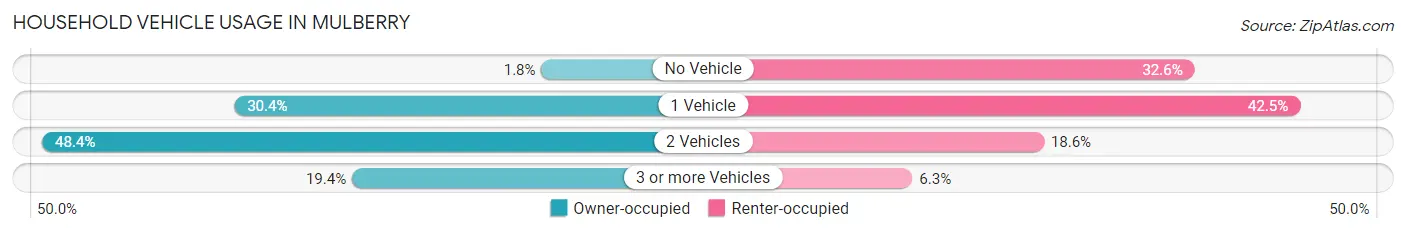
| Vehicles per Household | Owner-occupied | Renter-occupied |
| No Vehicle | 20 (1.8%) | 202 (32.6%) |
| 1 Vehicle | 346 (30.4%) | 263 (42.5%) |
| 2 Vehicles | 550 (48.4%) | 115 (18.6%) |
| 3 or more Vehicles | 221 (19.4%) | 39 (6.3%) |
| Total | 1,137 (100.0%) | 619 (100.0%) |
Real Estate & Mortgages in Mulberry
Real Estate and Mortgage Overview in Mulberry
| Characteristic | Without Mortgage | With Mortgage |
| Housing Units | 345 | 792 |
| Median Property Value | $174,300 | $175,900 |
| Median Household Income | $79,620 | $111 |
| Monthly Housing Costs | $669 | $10 |
| Real Estate Taxes | $3,208 | $9 |
Property Value by Mortgage Status in Mulberry
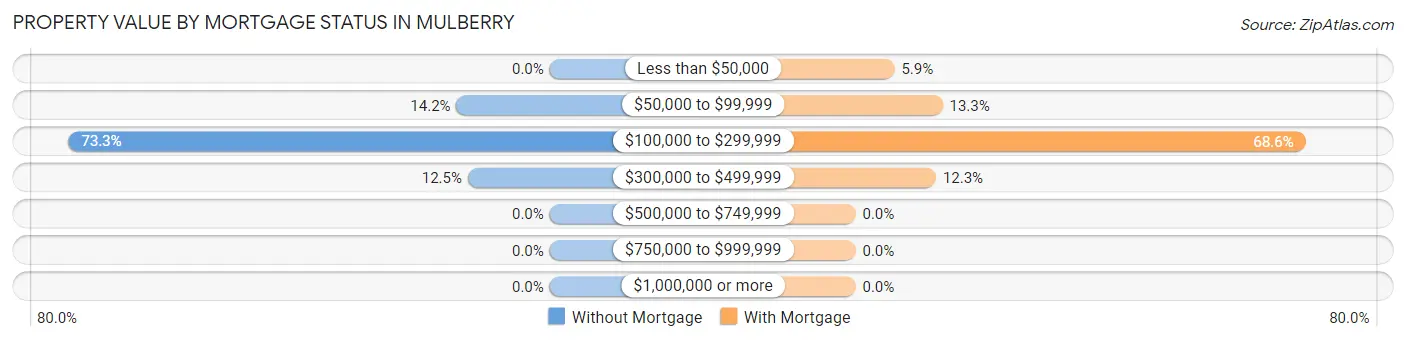
| Property Value | Without Mortgage | With Mortgage |
| Less than $50,000 | 0 (0.0%) | 47 (5.9%) |
| $50,000 to $99,999 | 49 (14.2%) | 105 (13.3%) |
| $100,000 to $299,999 | 253 (73.3%) | 543 (68.6%) |
| $300,000 to $499,999 | 43 (12.5%) | 97 (12.2%) |
| $500,000 to $749,999 | 0 (0.0%) | 0 (0.0%) |
| $750,000 to $999,999 | 0 (0.0%) | 0 (0.0%) |
| $1,000,000 or more | 0 (0.0%) | 0 (0.0%) |
| Total | 345 (100.0%) | 792 (100.0%) |
Household Income by Mortgage Status in Mulberry

| Household Income | Without Mortgage | With Mortgage |
| Less than $10,000 | 9 (2.6%) | 16 (2.0%) |
| $10,000 to $24,999 | 35 (10.1%) | 0 (0.0%) |
| $25,000 to $34,999 | 25 (7.2%) | 58 (7.3%) |
| $35,000 to $49,999 | 56 (16.2%) | 72 (9.1%) |
| $50,000 to $74,999 | 15 (4.3%) | 60 (7.6%) |
| $75,000 to $99,999 | 81 (23.5%) | 145 (18.3%) |
| $100,000 to $149,999 | 87 (25.2%) | 141 (17.8%) |
| $150,000 or more | 37 (10.7%) | 205 (25.9%) |
| Total | 345 (100.0%) | 792 (100.0%) |
Property Value to Household Income Ratio in Mulberry
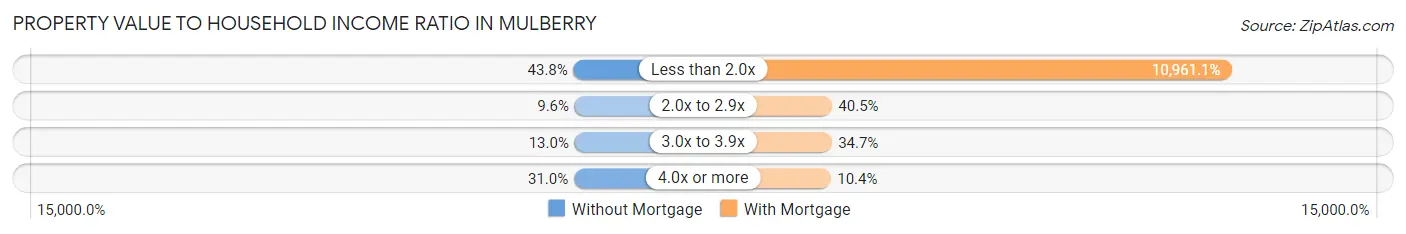
| Value-to-Income Ratio | Without Mortgage | With Mortgage |
| Less than 2.0x | 151 (43.8%) | 86,812 (10,961.1%) |
| 2.0x to 2.9x | 33 (9.6%) | 321 (40.5%) |
| 3.0x to 3.9x | 45 (13.0%) | 275 (34.7%) |
| 4.0x or more | 107 (31.0%) | 82 (10.3%) |
| Total | 345 (100.0%) | 792 (100.0%) |
Real Estate Taxes by Mortgage Status in Mulberry
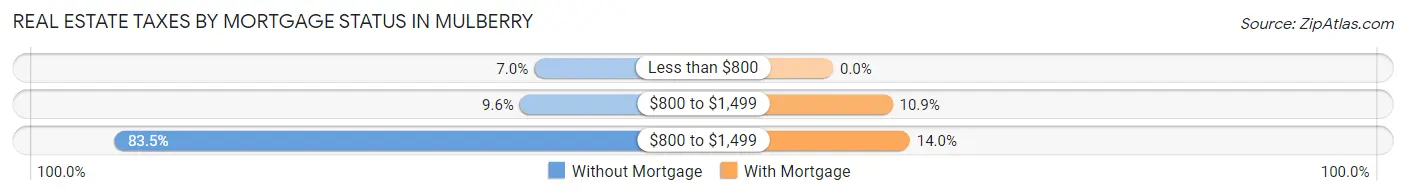
| Property Taxes | Without Mortgage | With Mortgage |
| Less than $800 | 24 (7.0%) | 0 (0.0%) |
| $800 to $1,499 | 33 (9.6%) | 86 (10.9%) |
| $800 to $1,499 | 288 (83.5%) | 111 (14.0%) |
| Total | 345 (100.0%) | 792 (100.0%) |
Health & Disability in Mulberry
Health Insurance Coverage by Age in Mulberry
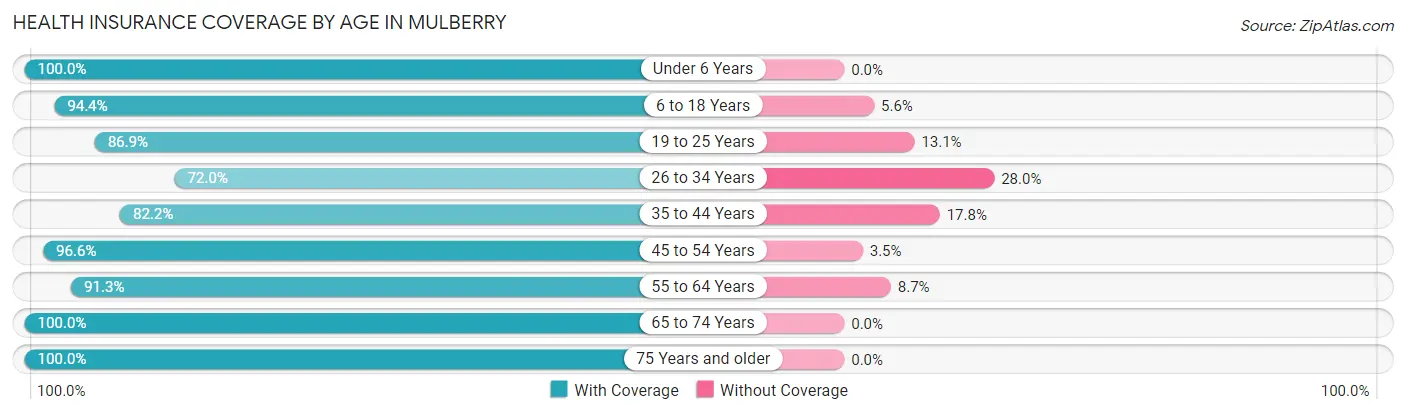
| Age Bracket | With Coverage | Without Coverage |
| Under 6 Years | 160 (100.0%) | 0 (0.0%) |
| 6 to 18 Years | 577 (94.4%) | 34 (5.6%) |
| 19 to 25 Years | 279 (86.9%) | 42 (13.1%) |
| 26 to 34 Years | 219 (72.0%) | 85 (28.0%) |
| 35 to 44 Years | 157 (82.2%) | 34 (17.8%) |
| 45 to 54 Years | 588 (96.6%) | 21 (3.5%) |
| 55 to 64 Years | 400 (91.3%) | 38 (8.7%) |
| 65 to 74 Years | 513 (100.0%) | 0 (0.0%) |
| 75 Years and older | 684 (100.0%) | 0 (0.0%) |
| Total | 3,577 (93.4%) | 254 (6.6%) |
Health Insurance Coverage by Citizenship Status in Mulberry
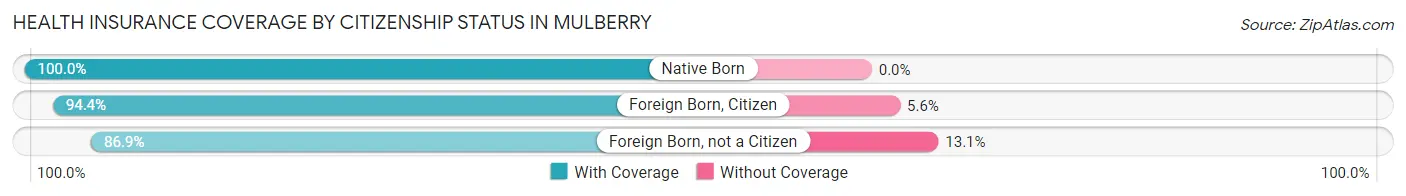
| Citizenship Status | With Coverage | Without Coverage |
| Native Born | 160 (100.0%) | 0 (0.0%) |
| Foreign Born, Citizen | 577 (94.4%) | 34 (5.6%) |
| Foreign Born, not a Citizen | 279 (86.9%) | 42 (13.1%) |
Health Insurance Coverage by Household Income in Mulberry
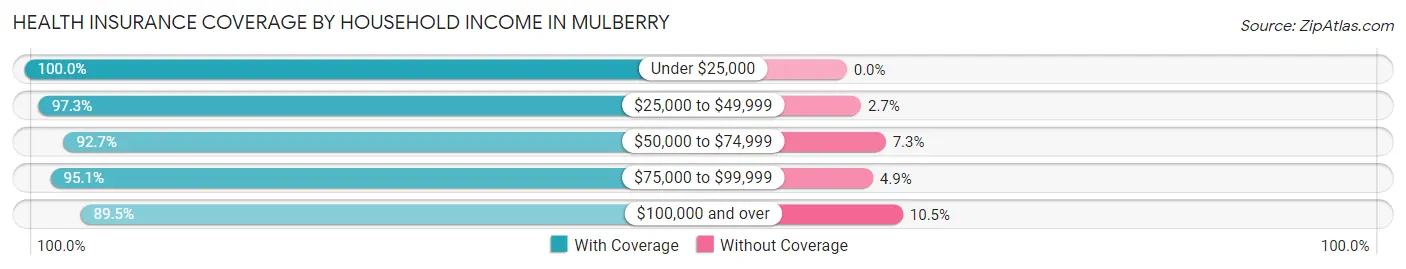
| Household Income | With Coverage | Without Coverage |
| Under $25,000 | 304 (100.0%) | 0 (0.0%) |
| $25,000 to $49,999 | 617 (97.3%) | 17 (2.7%) |
| $50,000 to $74,999 | 673 (92.7%) | 53 (7.3%) |
| $75,000 to $99,999 | 739 (95.1%) | 38 (4.9%) |
| $100,000 and over | 1,244 (89.5%) | 146 (10.5%) |
Public vs Private Health Insurance Coverage by Age in Mulberry
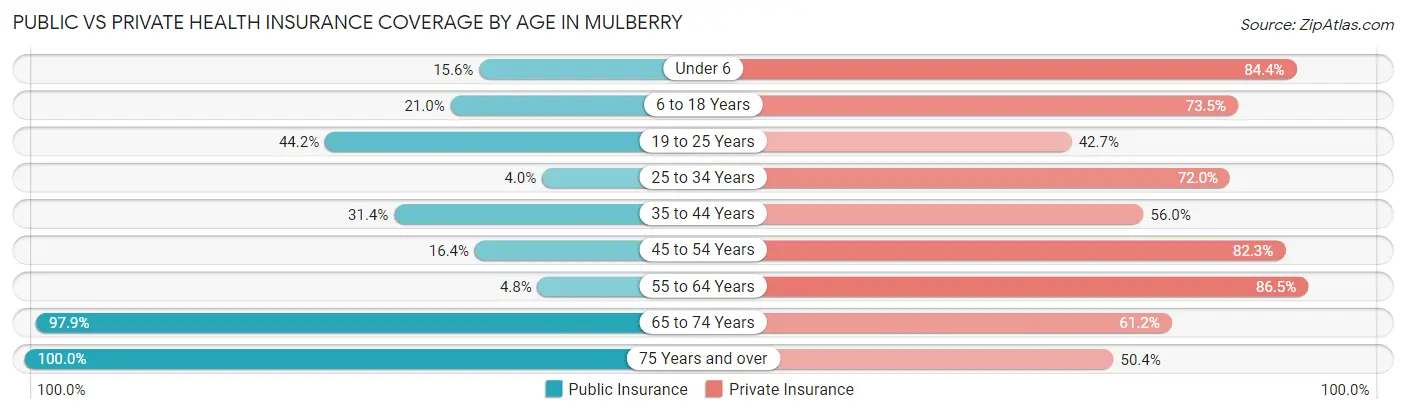
| Age Bracket | Public Insurance | Private Insurance |
| Under 6 | 25 (15.6%) | 135 (84.4%) |
| 6 to 18 Years | 128 (20.9%) | 449 (73.5%) |
| 19 to 25 Years | 142 (44.2%) | 137 (42.7%) |
| 25 to 34 Years | 12 (4.0%) | 219 (72.0%) |
| 35 to 44 Years | 60 (31.4%) | 107 (56.0%) |
| 45 to 54 Years | 100 (16.4%) | 501 (82.3%) |
| 55 to 64 Years | 21 (4.8%) | 379 (86.5%) |
| 65 to 74 Years | 502 (97.9%) | 314 (61.2%) |
| 75 Years and over | 684 (100.0%) | 345 (50.4%) |
| Total | 1,674 (43.7%) | 2,586 (67.5%) |
Disability Status by Sex by Age in Mulberry
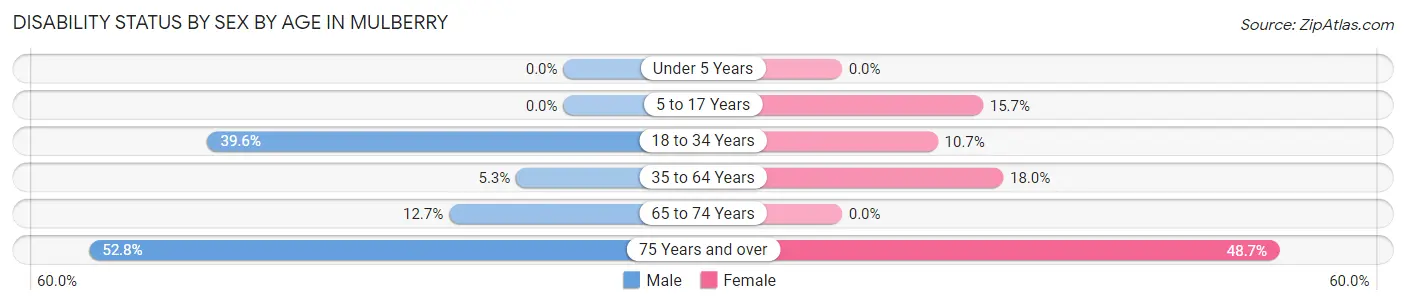
| Age Bracket | Male | Female |
| Under 5 Years | 0 (0.0%) | 0 (0.0%) |
| 5 to 17 Years | 0 (0.0%) | 46 (15.7%) |
| 18 to 34 Years | 166 (39.6%) | 27 (10.7%) |
| 35 to 64 Years | 30 (5.3%) | 120 (18.0%) |
| 65 to 74 Years | 35 (12.7%) | 0 (0.0%) |
| 75 Years and over | 142 (52.8%) | 202 (48.7%) |
Disability Class by Sex by Age in Mulberry
Disability Class: Hearing Difficulty
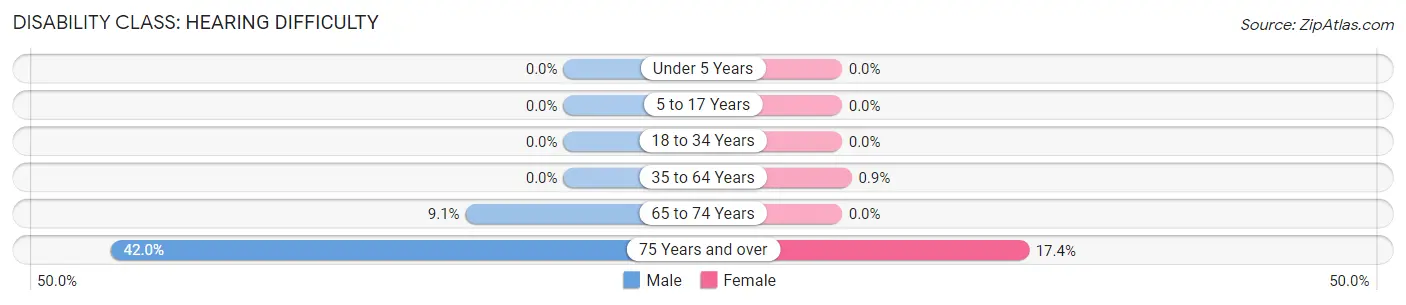
| Age Bracket | Male | Female |
| Under 5 Years | 0 (0.0%) | 0 (0.0%) |
| 5 to 17 Years | 0 (0.0%) | 0 (0.0%) |
| 18 to 34 Years | 0 (0.0%) | 0 (0.0%) |
| 35 to 64 Years | 0 (0.0%) | 6 (0.9%) |
| 65 to 74 Years | 25 (9.1%) | 0 (0.0%) |
| 75 Years and over | 113 (42.0%) | 72 (17.3%) |
Disability Class: Vision Difficulty
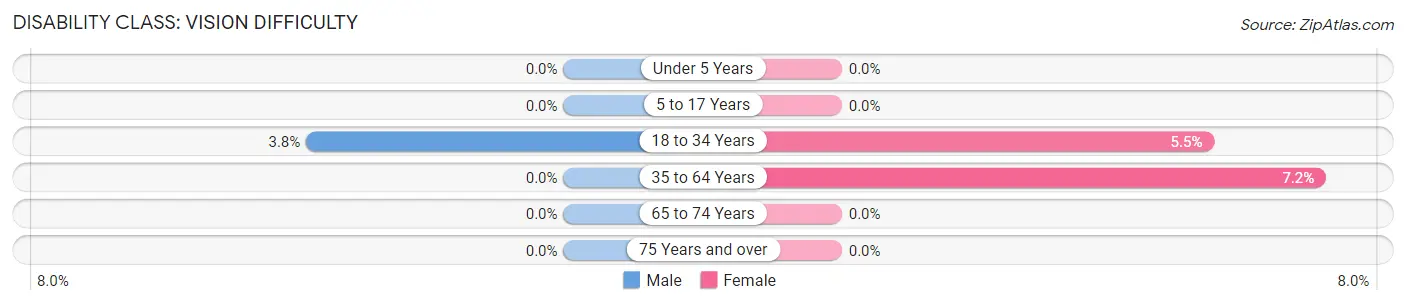
| Age Bracket | Male | Female |
| Under 5 Years | 0 (0.0%) | 0 (0.0%) |
| 5 to 17 Years | 0 (0.0%) | 0 (0.0%) |
| 18 to 34 Years | 16 (3.8%) | 14 (5.5%) |
| 35 to 64 Years | 0 (0.0%) | 48 (7.2%) |
| 65 to 74 Years | 0 (0.0%) | 0 (0.0%) |
| 75 Years and over | 0 (0.0%) | 0 (0.0%) |
Disability Class: Cognitive Difficulty
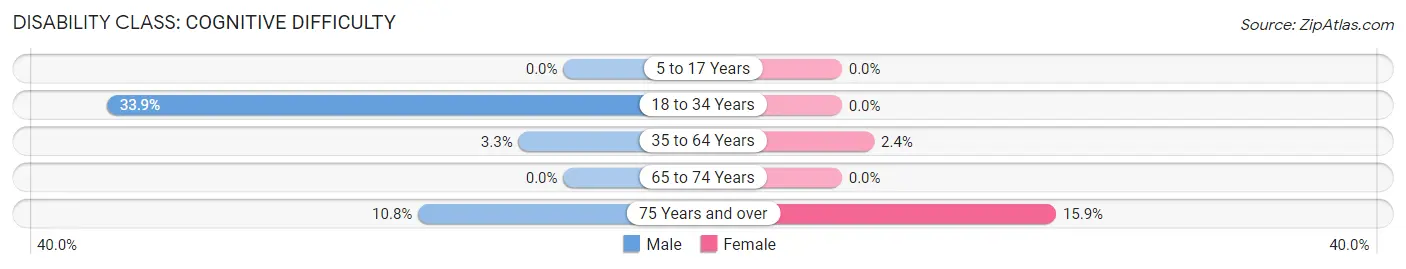
| Age Bracket | Male | Female |
| 5 to 17 Years | 0 (0.0%) | 0 (0.0%) |
| 18 to 34 Years | 142 (33.9%) | 0 (0.0%) |
| 35 to 64 Years | 19 (3.3%) | 16 (2.4%) |
| 65 to 74 Years | 0 (0.0%) | 0 (0.0%) |
| 75 Years and over | 29 (10.8%) | 66 (15.9%) |
Disability Class: Ambulatory Difficulty
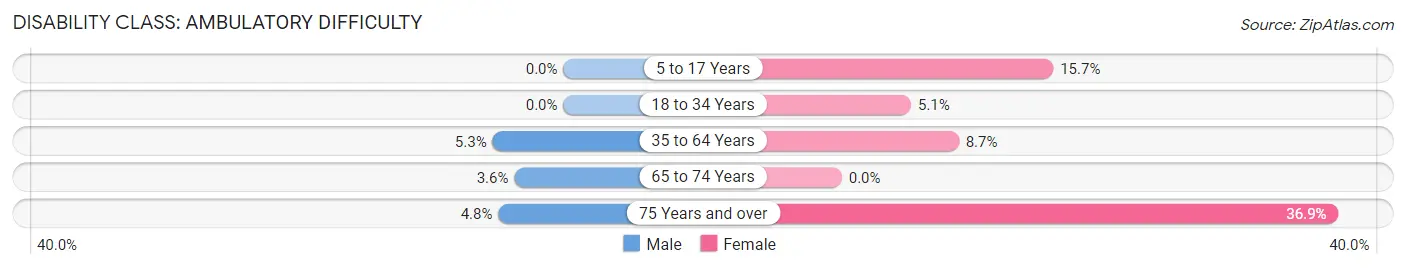
| Age Bracket | Male | Female |
| 5 to 17 Years | 0 (0.0%) | 46 (15.7%) |
| 18 to 34 Years | 0 (0.0%) | 13 (5.1%) |
| 35 to 64 Years | 30 (5.3%) | 58 (8.7%) |
| 65 to 74 Years | 10 (3.6%) | 0 (0.0%) |
| 75 Years and over | 13 (4.8%) | 153 (36.9%) |
Disability Class: Self-Care Difficulty
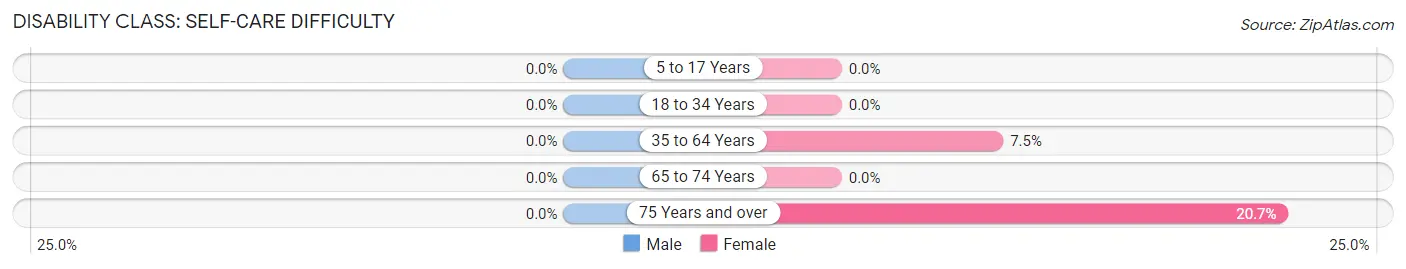
| Age Bracket | Male | Female |
| 5 to 17 Years | 0 (0.0%) | 0 (0.0%) |
| 18 to 34 Years | 0 (0.0%) | 0 (0.0%) |
| 35 to 64 Years | 0 (0.0%) | 50 (7.5%) |
| 65 to 74 Years | 0 (0.0%) | 0 (0.0%) |
| 75 Years and over | 0 (0.0%) | 86 (20.7%) |
Technology Access in Mulberry
Computing Device Access in Mulberry
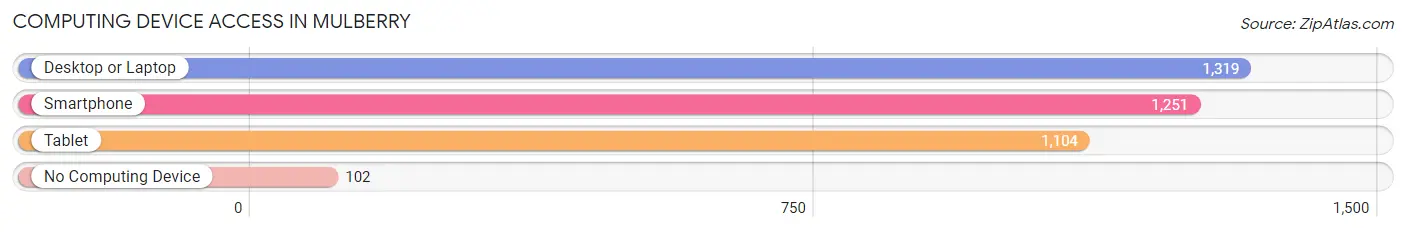
| Device Type | # Households | % Households |
| Desktop or Laptop | 1,319 | 75.1% |
| Smartphone | 1,251 | 71.2% |
| Tablet | 1,104 | 62.9% |
| No Computing Device | 102 | 5.8% |
| Total | 1,756 | 100.0% |
Internet Access in Mulberry
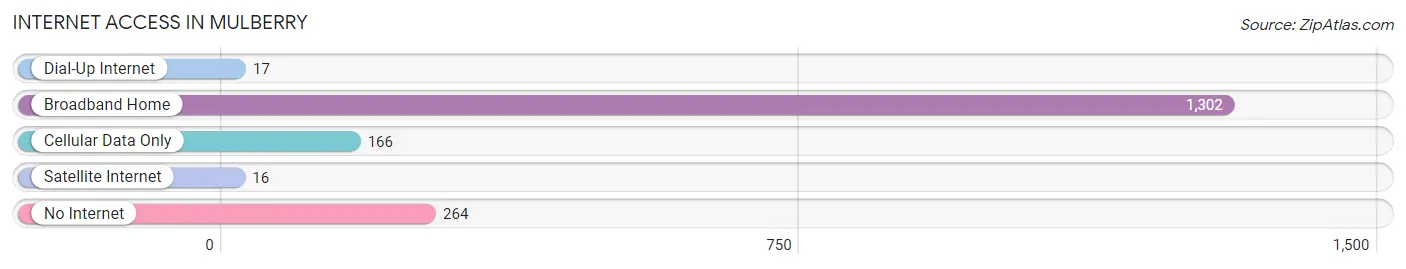
| Internet Type | # Households | % Households |
| Dial-Up Internet | 17 | 1.0% |
| Broadband Home | 1,302 | 74.2% |
| Cellular Data Only | 166 | 9.5% |
| Satellite Internet | 16 | 0.9% |
| No Internet | 264 | 15.0% |
| Total | 1,756 | 100.0% |
Mulberry Summary
Mulberry, Ohio is a small village located in the southeastern corner of Morrow County, Ohio. The village is situated on the banks of the Olentangy River, and is surrounded by rolling hills and farmland. The village was founded in 1837 by a group of settlers from Pennsylvania, and was named after the mulberry trees that grew in abundance in the area.
Geography
Mulberry is located at 40°30'N, 82°59'W (40.50, -82.98). The village has a total area of 0.6 square miles, all of which is land. The village is located in the Appalachian Plateau region of Ohio, and is surrounded by rolling hills and farmland. The Olentangy River runs through the village, and is a popular spot for fishing and canoeing.
Demographics
As of the 2010 census, Mulberry had a population of 545 people. The racial makeup of the village was 97.3% White, 0.2% African American, 0.2% Native American, 0.2% Asian, 0.4% from other races, and 1.5% from two or more races. Hispanic or Latino of any race were 1.1% of the population.
Economy
Mulberry is a small, rural village with a limited economy. The village is home to several small businesses, including a grocery store, a hardware store, a gas station, and a few restaurants. The village also has a post office and a bank. The village is home to several farms, and the surrounding area is known for its production of corn, soybeans, and wheat.
History
Mulberry was founded in 1837 by a group of settlers from Pennsylvania. The village was named after the mulberry trees that grew in abundance in the area. The village was incorporated in 1845, and the first post office was established in 1846.
In the late 19th century, Mulberry was a thriving agricultural community. The village was home to several mills, including a grist mill, a saw mill, and a woolen mill. The village also had a blacksmith shop, a general store, and a hotel.
In the early 20th century, the village began to decline as the railroad bypassed the village and the mills closed. The village was hit hard by the Great Depression, and many of the businesses closed.
Today, Mulberry is a small, rural village with a limited economy. The village is home to several small businesses, and the surrounding area is known for its production of corn, soybeans, and wheat. The village is also home to several churches, and is a popular spot for fishing and canoeing.
Common Questions
What is the Total Population of Mulberry?
Total Population of Mulberry is 4,071.
What is the Total Male Population of Mulberry?
Total Male Population of Mulberry is 1,993.
What is the Total Female Population of Mulberry?
Total Female Population of Mulberry is 2,078.
What is the Ratio of Males per 100 Females in Mulberry?
There are 95.91 Males per 100 Females in Mulberry.
What is the Ratio of Females per 100 Males in Mulberry?
There are 104.26 Females per 100 Males in Mulberry.
What is the Median Population Age in Mulberry?
Median Population Age in Mulberry is 52.0 Years.
What is the Average Family Size in Mulberry
Average Family Size in Mulberry is 3.0 People.
What is the Average Household Size in Mulberry
Average Household Size in Mulberry is 2.2 People.
What is Per Capita Income in Mulberry?
Per Capita income in Mulberry is $39,526.
What is the Median Family Income in Mulberry?
Median Family Income in Mulberry is $87,654.
What is the Median Household income in Mulberry?
Median Household Income in Mulberry is $67,838.
What is Income or Wage Gap in Mulberry?
Income or Wage Gap in Mulberry is 7.1%.
Women in Mulberry earn 92.9 cents for every dollar earned by a man.
What is Family Income Deficit in Mulberry?
Family Income Deficit in Mulberry is $2,579.
Families that are below poverty line in Mulberry earn $2,579 less on average than the poverty threshold level.
What is Inequality or Gini Index in Mulberry?
Inequality or Gini Index in Mulberry is 0.44.
How Large is the Labor Force in Mulberry?
There are 1,962 People in the Labor Forcein in Mulberry.
What is the Percentage of People in the Labor Force in Mulberry?
56.3% of People are in the Labor Force in Mulberry.
What is the Unemployment Rate in Mulberry?
Unemployment Rate in Mulberry is 2.6%.