Sikeston, MO
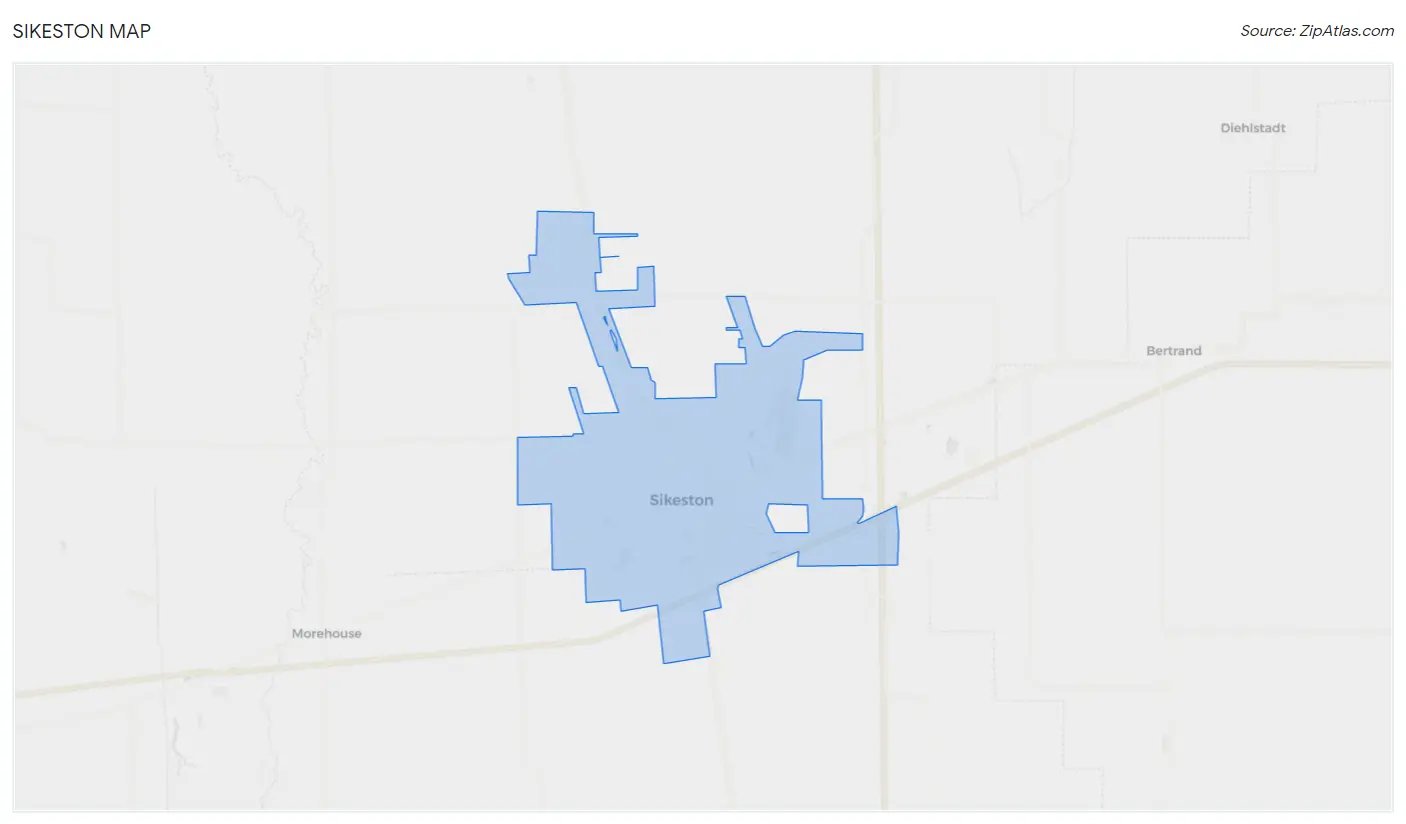
Sikeston Map
Sikeston Overview
16,146
TOTAL POPULATION
7,503
MALE POPULATION
8,643
FEMALE POPULATION
86.81
MALES / 100 FEMALES
115.19
FEMALES / 100 MALES
37.3
MEDIAN AGE
2.9
AVG FAMILY SIZE
2.3
AVG HOUSEHOLD SIZE
$29,247
PER CAPITA INCOME
$60,591
AVG FAMILY INCOME
$47,464
AVG HOUSEHOLD INCOME
22.4%
WAGE / INCOME GAP [ % ]
77.6¢/ $1
WAGE / INCOME GAP [ $ ]
$9,846
FAMILY INCOME DEFICIT
0.49
INEQUALITY / GINI INDEX
7,037
LABOR FORCE [ PEOPLE ]
56.3%
PERCENT IN LABOR FORCE
2.9%
UNEMPLOYMENT RATE
Sikeston Zip Codes
Sikeston Area Codes
Race in Sikeston
The most populous races in Sikeston are White / Caucasian (11,021 | 68.3%), Black / African American (4,013 | 24.8%), and Two or more Races (1,068 | 6.6%).
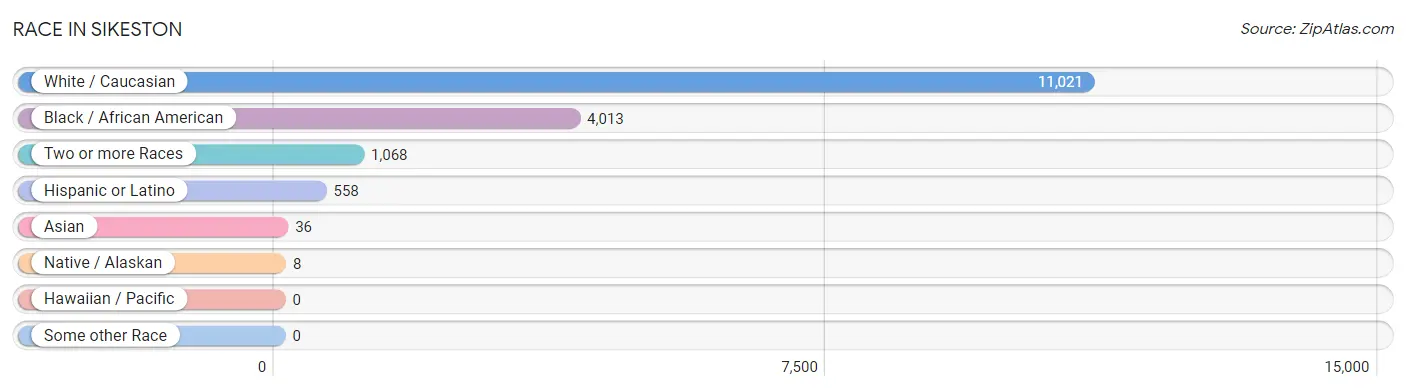
| Race | # Population | % Population |
| Asian | 36 | 0.2% |
| Black / African American | 4,013 | 24.8% |
| Hawaiian / Pacific | 0 | 0.0% |
| Hispanic or Latino | 558 | 3.5% |
| Native / Alaskan | 8 | 0.1% |
| White / Caucasian | 11,021 | 68.3% |
| Two or more Races | 1,068 | 6.6% |
| Some other Race | 0 | 0.0% |
| Total | 16,146 | 100.0% |
Ancestry in Sikeston
The most populous ancestries reported in Sikeston are German (2,185 | 13.5%), English (1,548 | 9.6%), American (1,294 | 8.0%), Irish (972 | 6.0%), and Scottish (425 | 2.6%), together accounting for 39.8% of all Sikeston residents.
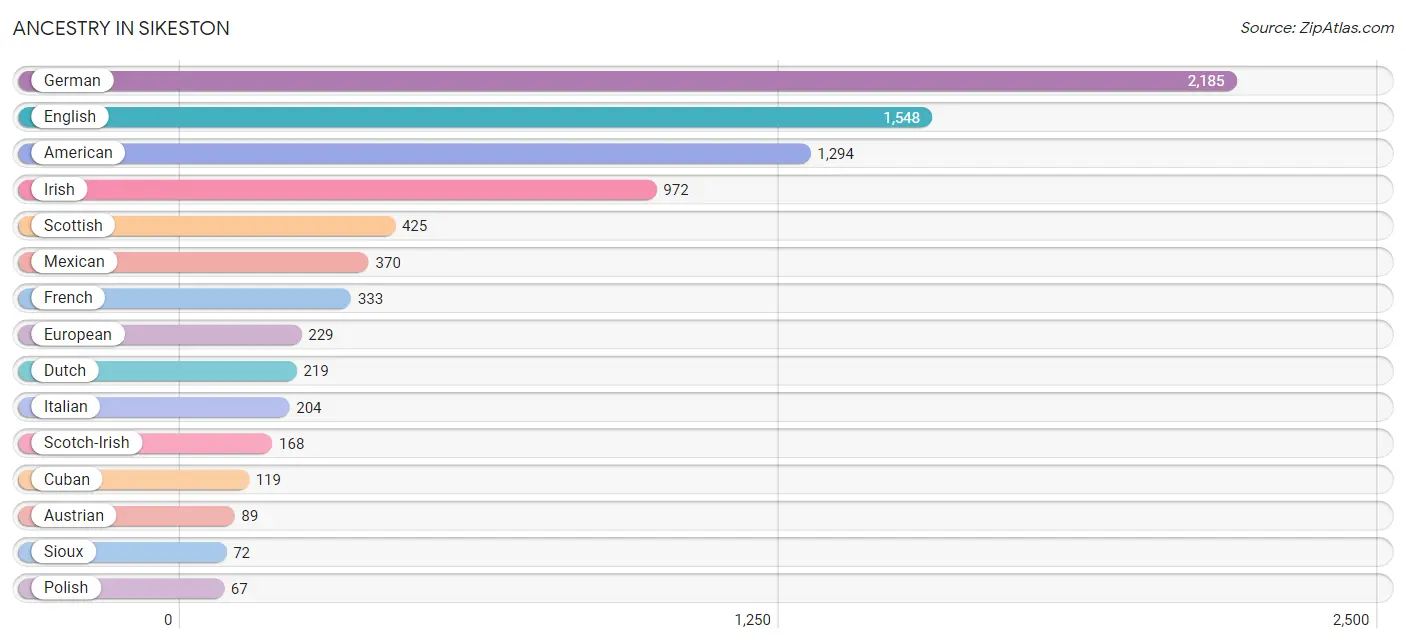
| Ancestry | # Population | % Population |
| American | 1,294 | 8.0% |
| Austrian | 89 | 0.5% |
| Bhutanese | 8 | 0.1% |
| British | 35 | 0.2% |
| Burmese | 9 | 0.1% |
| Central American | 18 | 0.1% |
| Cherokee | 51 | 0.3% |
| Chilean | 40 | 0.3% |
| Cuban | 119 | 0.7% |
| Czech | 29 | 0.2% |
| Czechoslovakian | 16 | 0.1% |
| Danish | 25 | 0.2% |
| Dutch | 219 | 1.4% |
| English | 1,548 | 9.6% |
| European | 229 | 1.4% |
| French | 333 | 2.1% |
| German | 2,185 | 13.5% |
| Guatemalan | 18 | 0.1% |
| Hungarian | 3 | 0.0% |
| Indian (Asian) | 9 | 0.1% |
| Irish | 972 | 6.0% |
| Iroquois | 5 | 0.0% |
| Italian | 204 | 1.3% |
| Korean | 59 | 0.4% |
| Mexican | 370 | 2.3% |
| Norwegian | 27 | 0.2% |
| Pakistani | 1 | 0.0% |
| Polish | 67 | 0.4% |
| Puerto Rican | 11 | 0.1% |
| Russian | 1 | 0.0% |
| Scandinavian | 6 | 0.0% |
| Scotch-Irish | 168 | 1.0% |
| Scottish | 425 | 2.6% |
| Sioux | 72 | 0.4% |
| South American | 40 | 0.3% |
| Swedish | 45 | 0.3% |
| Swiss | 2 | 0.0% |
| Welsh | 4 | 0.0% | View All 38 Rows |
Immigrants in Sikeston
The most numerous immigrant groups reported in Sikeston came from Europe (70 | 0.4%), France (63 | 0.4%), Western Europe (63 | 0.4%), Central America (49 | 0.3%), and Latin America (49 | 0.3%), together accounting for 1.8% of all Sikeston residents.
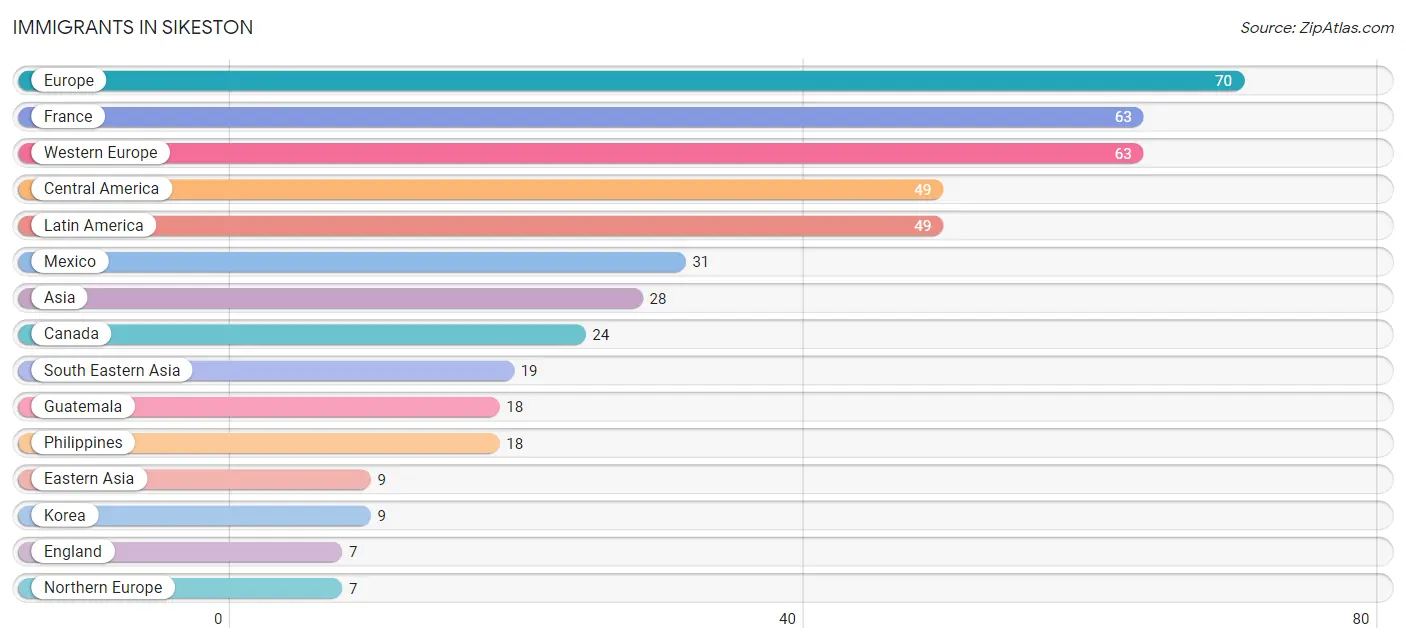
| Immigration Origin | # Population | % Population |
| Asia | 28 | 0.2% |
| Canada | 24 | 0.2% |
| Central America | 49 | 0.3% |
| Eastern Asia | 9 | 0.1% |
| England | 7 | 0.0% |
| Europe | 70 | 0.4% |
| France | 63 | 0.4% |
| Guatemala | 18 | 0.1% |
| Korea | 9 | 0.1% |
| Latin America | 49 | 0.3% |
| Mexico | 31 | 0.2% |
| Northern Europe | 7 | 0.0% |
| Philippines | 18 | 0.1% |
| South Eastern Asia | 19 | 0.1% |
| Thailand | 1 | 0.0% |
| Western Europe | 63 | 0.4% | View All 16 Rows |
Sex and Age in Sikeston
Sex and Age in Sikeston
The most populous age groups in Sikeston are 5 to 9 Years (730 | 9.7%) for men and 30 to 34 Years (770 | 8.9%) for women.
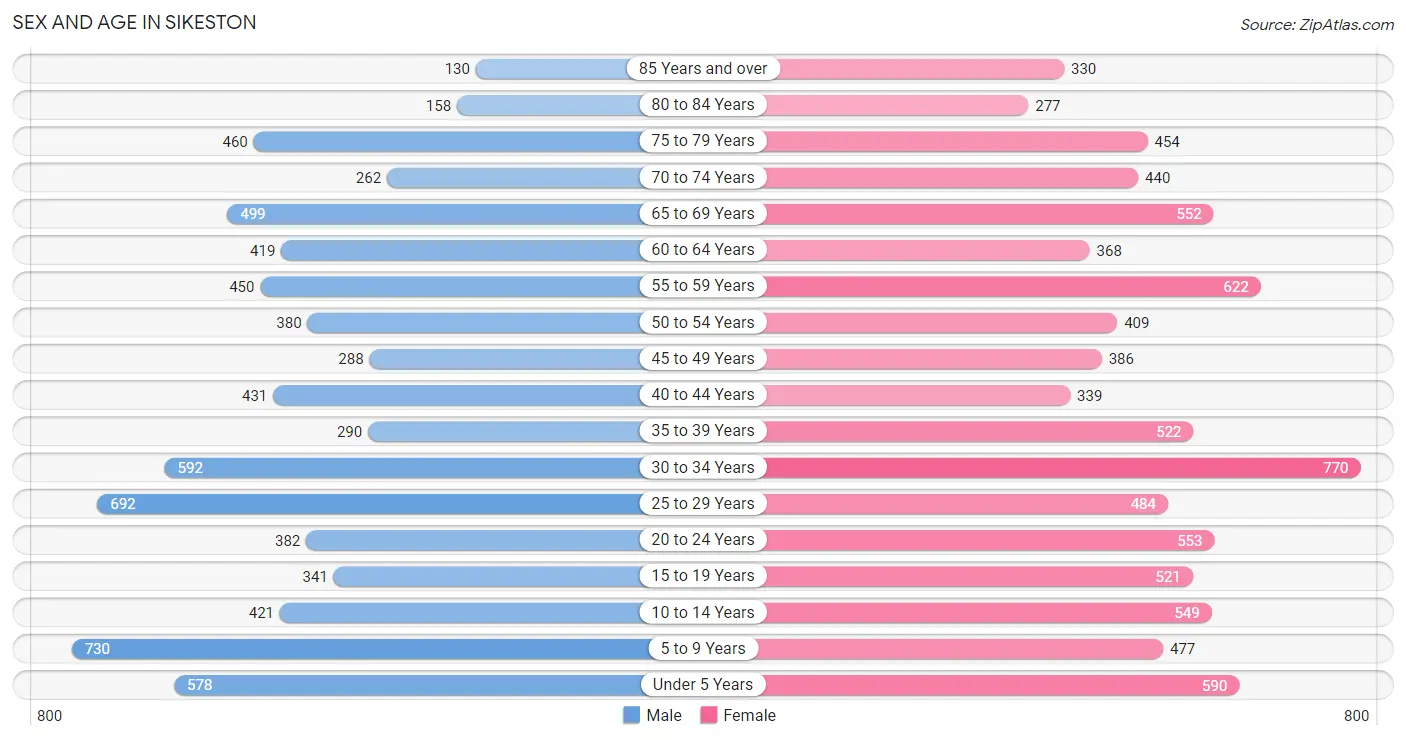
| Age Bracket | Male | Female |
| Under 5 Years | 578 (7.7%) | 590 (6.8%) |
| 5 to 9 Years | 730 (9.7%) | 477 (5.5%) |
| 10 to 14 Years | 421 (5.6%) | 549 (6.4%) |
| 15 to 19 Years | 341 (4.5%) | 521 (6.0%) |
| 20 to 24 Years | 382 (5.1%) | 553 (6.4%) |
| 25 to 29 Years | 692 (9.2%) | 484 (5.6%) |
| 30 to 34 Years | 592 (7.9%) | 770 (8.9%) |
| 35 to 39 Years | 290 (3.9%) | 522 (6.0%) |
| 40 to 44 Years | 431 (5.7%) | 339 (3.9%) |
| 45 to 49 Years | 288 (3.8%) | 386 (4.5%) |
| 50 to 54 Years | 380 (5.1%) | 409 (4.7%) |
| 55 to 59 Years | 450 (6.0%) | 622 (7.2%) |
| 60 to 64 Years | 419 (5.6%) | 368 (4.3%) |
| 65 to 69 Years | 499 (6.7%) | 552 (6.4%) |
| 70 to 74 Years | 262 (3.5%) | 440 (5.1%) |
| 75 to 79 Years | 460 (6.1%) | 454 (5.2%) |
| 80 to 84 Years | 158 (2.1%) | 277 (3.2%) |
| 85 Years and over | 130 (1.7%) | 330 (3.8%) |
| Total | 7,503 (100.0%) | 8,643 (100.0%) |
Families and Households in Sikeston
Median Family Size in Sikeston
The median family size in Sikeston is 2.94 persons per family, with single male/father families (416 | 9.7%) accounting for the largest median family size of 3.39 persons per family. On the other hand, single female/mother families (1,097 | 25.7%) represent the smallest median family size with 2.69 persons per family.
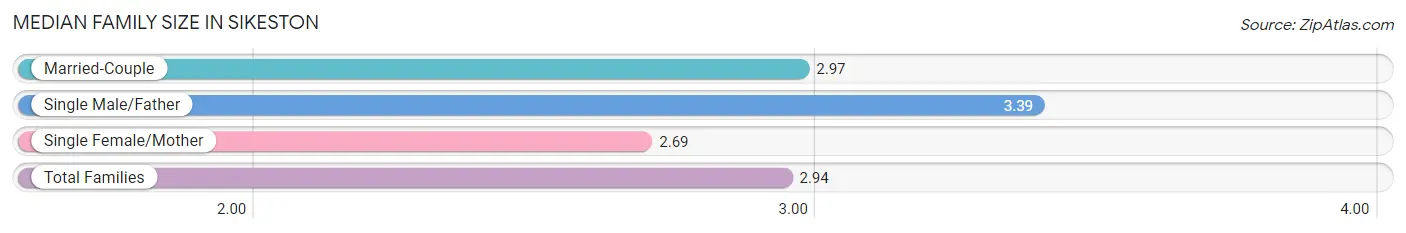
| Family Type | # Families | Family Size |
| Married-Couple | 2,757 (64.6%) | 2.97 |
| Single Male/Father | 416 (9.7%) | 3.39 |
| Single Female/Mother | 1,097 (25.7%) | 2.69 |
| Total Families | 4,270 (100.0%) | 2.94 |
Median Household Size in Sikeston
The median household size in Sikeston is 2.31 persons per household, with single male/father households (416 | 6.1%) accounting for the largest median household size of 3.75 persons per household. non-family households (2,566 | 37.5%) represent the smallest median household size with 1.13 persons per household.
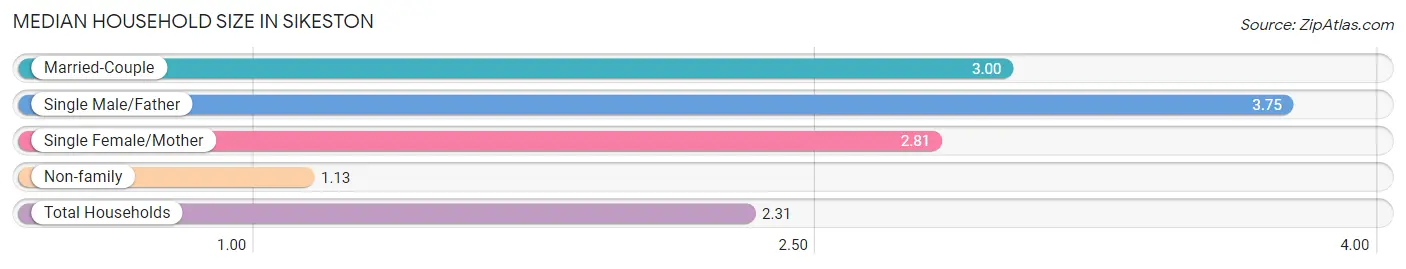
| Household Type | # Households | Household Size |
| Married-Couple | 2,757 (40.3%) | 3.00 |
| Single Male/Father | 416 (6.1%) | 3.75 |
| Single Female/Mother | 1,097 (16.1%) | 2.81 |
| Non-family | 2,566 (37.5%) | 1.13 |
| Total Households | 6,836 (100.0%) | 2.31 |
Household Size by Marriage Status in Sikeston
Out of a total of 6,836 households in Sikeston, 4,270 (62.5%) are family households, while 2,566 (37.5%) are nonfamily households. The most numerous type of family households are 2-person households, comprising 2,131, and the most common type of nonfamily households are 1-person households, comprising 2,293.
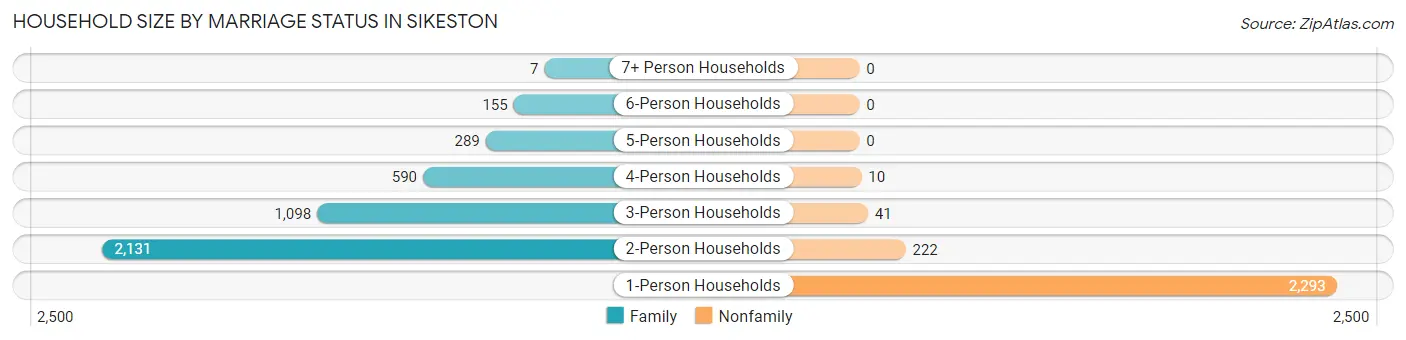
| Household Size | Family Households | Nonfamily Households |
| 1-Person Households | - | 2,293 (33.5%) |
| 2-Person Households | 2,131 (31.2%) | 222 (3.3%) |
| 3-Person Households | 1,098 (16.1%) | 41 (0.6%) |
| 4-Person Households | 590 (8.6%) | 10 (0.2%) |
| 5-Person Households | 289 (4.2%) | 0 (0.0%) |
| 6-Person Households | 155 (2.3%) | 0 (0.0%) |
| 7+ Person Households | 7 (0.1%) | 0 (0.0%) |
| Total | 4,270 (62.5%) | 2,566 (37.5%) |
Female Fertility in Sikeston
Fertility by Age in Sikeston
Average fertility rate in Sikeston is 87.0 births per 1,000 women. Women in the age bracket of 20 to 34 years have the highest fertility rate with 143.0 births per 1,000 women. Women in the age bracket of 20 to 34 years acount for 81.5% of all women with births.
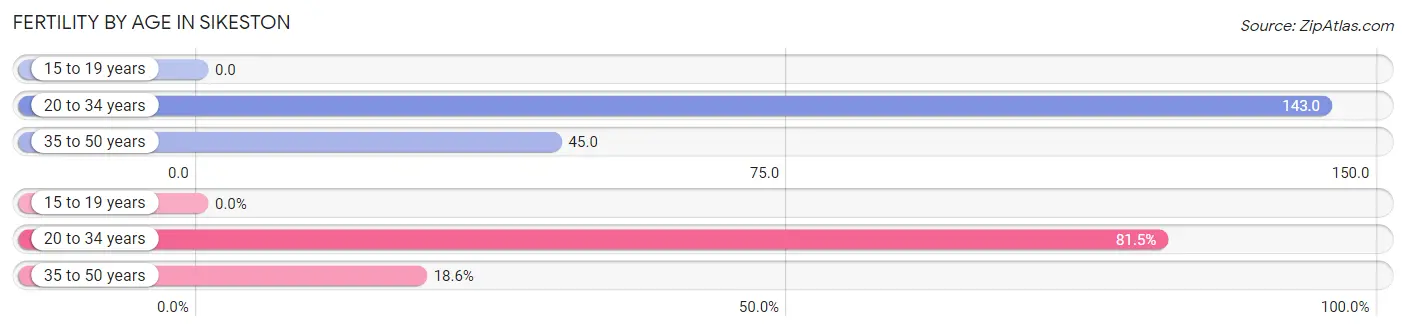
| Age Bracket | Women with Births | Births / 1,000 Women |
| 15 to 19 years | 0 (0.0%) | 0.0 |
| 20 to 34 years | 259 (81.5%) | 143.0 |
| 35 to 50 years | 59 (18.5%) | 45.0 |
| Total | 318 (100.0%) | 87.0 |
Fertility by Age by Marriage Status in Sikeston
41.8% of women with births (318) in Sikeston are married. The highest percentage of unmarried women with births falls into 20 to 34 years age bracket with 67.6% of them unmarried at the time of birth, while the lowest percentage of unmarried women with births belong to 35 to 50 years age bracket with 16.9% of them unmarried.
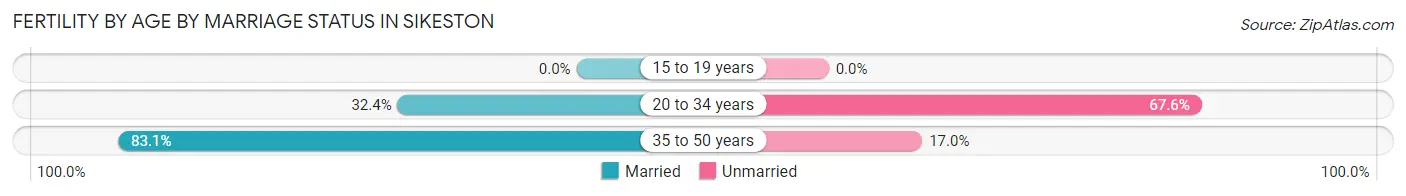
| Age Bracket | Married | Unmarried |
| 15 to 19 years | 0 (0.0%) | 0 (0.0%) |
| 20 to 34 years | 84 (32.4%) | 175 (67.6%) |
| 35 to 50 years | 49 (83.1%) | 10 (17.0%) |
| Total | 133 (41.8%) | 185 (58.2%) |
Fertility by Education in Sikeston
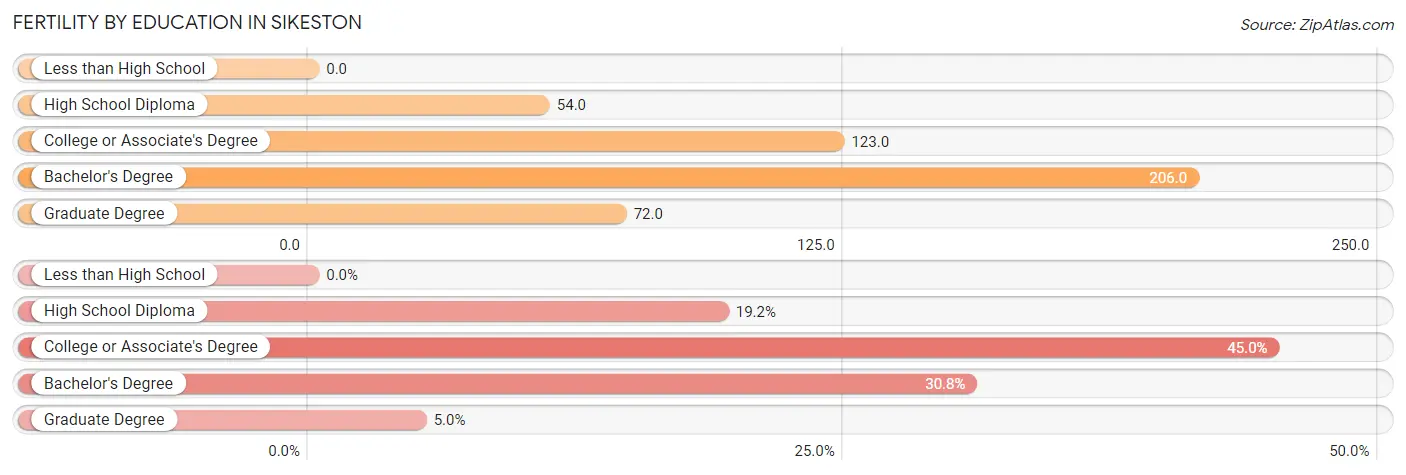
| Educational Attainment | Women with Births | Births / 1,000 Women |
| Less than High School | 0 (0.0%) | 0.0 |
| High School Diploma | 61 (19.2%) | 54.0 |
| College or Associate's Degree | 143 (45.0%) | 123.0 |
| Bachelor's Degree | 98 (30.8%) | 206.0 |
| Graduate Degree | 16 (5.0%) | 72.0 |
| Total | 318 (100.0%) | 87.0 |
Fertility by Education by Marriage Status in Sikeston
58.2% of women with births in Sikeston are unmarried. Women with the educational attainment of bachelor's degree are most likely to be married with 100.0% of them married at childbirth, while women with the educational attainment of high school diploma are least likely to be married with 100.0% of them unmarried at childbirth.
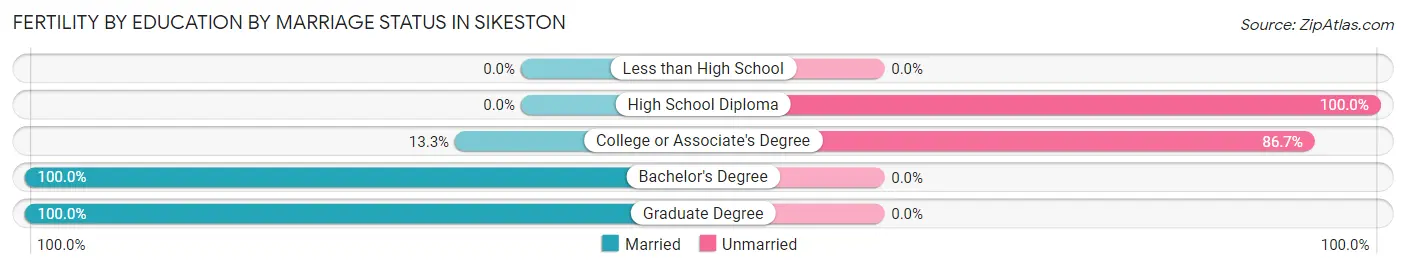
| Educational Attainment | Married | Unmarried |
| Less than High School | 0 (0.0%) | 0 (0.0%) |
| High School Diploma | 0 (0.0%) | 61 (100.0%) |
| College or Associate's Degree | 19 (13.3%) | 124 (86.7%) |
| Bachelor's Degree | 98 (100.0%) | 0 (0.0%) |
| Graduate Degree | 16 (100.0%) | 0 (0.0%) |
| Total | 133 (41.8%) | 185 (58.2%) |
Income in Sikeston
Income Overview in Sikeston
Per Capita Income in Sikeston is $29,247, while median incomes of families and households are $60,591 and $47,464 respectively.
| Characteristic | Number | Measure |
| Per Capita Income | 16,146 | $29,247 |
| Median Family Income | 4,270 | $60,591 |
| Mean Family Income | 4,270 | $84,607 |
| Median Household Income | 6,836 | $47,464 |
| Mean Household Income | 6,836 | $68,448 |
| Income Deficit | 4,270 | $9,846 |
| Wage / Income Gap (%) | 16,146 | 22.41% |
| Wage / Income Gap ($) | 16,146 | 77.59¢ per $1 |
| Gini / Inequality Index | 16,146 | 0.49 |
Earnings by Sex in Sikeston
Average Earnings in Sikeston are $30,355, $36,472 for men and $28,300 for women, a difference of 22.4%.
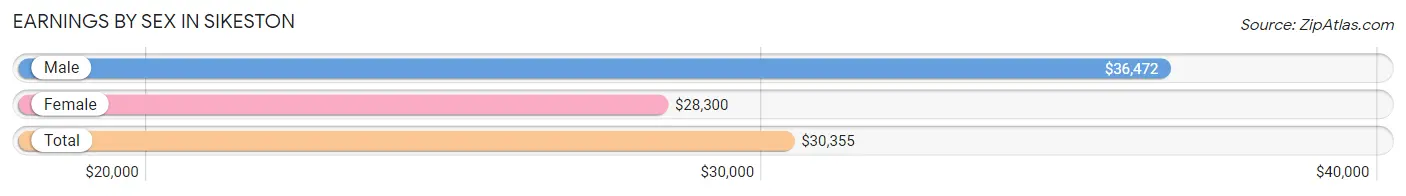
| Sex | Number | Average Earnings |
| Male | 3,798 (50.2%) | $36,472 |
| Female | 3,760 (49.7%) | $28,300 |
| Total | 7,558 (100.0%) | $30,355 |
Earnings by Sex by Income Bracket in Sikeston
The most common earnings brackets in Sikeston are $55,000 to $64,999 for men (365 | 9.6%) and $30,000 to $34,999 for women (468 | 12.4%).
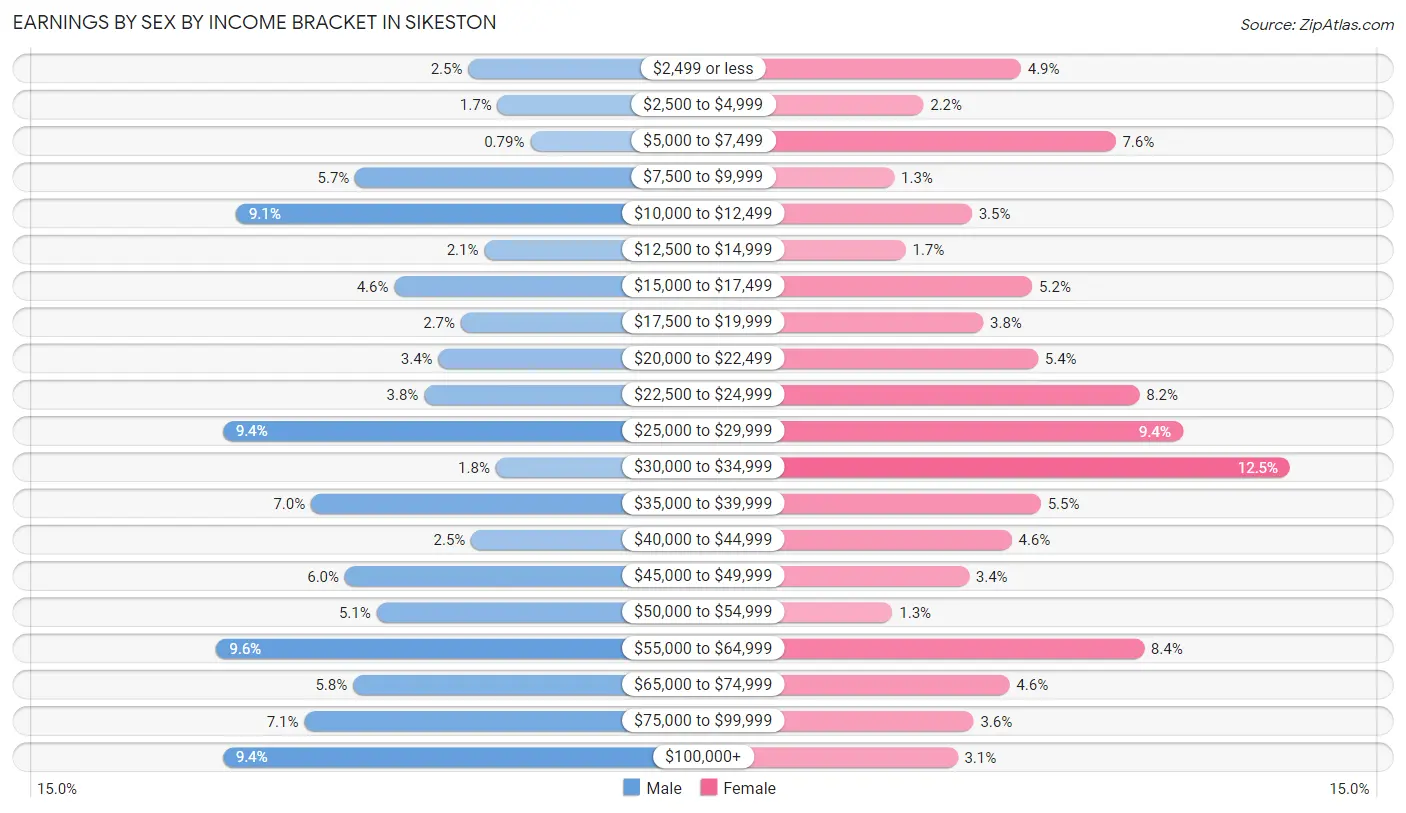
| Income | Male | Female |
| $2,499 or less | 96 (2.5%) | 184 (4.9%) |
| $2,500 to $4,999 | 65 (1.7%) | 81 (2.1%) |
| $5,000 to $7,499 | 30 (0.8%) | 284 (7.5%) |
| $7,500 to $9,999 | 217 (5.7%) | 50 (1.3%) |
| $10,000 to $12,499 | 344 (9.1%) | 132 (3.5%) |
| $12,500 to $14,999 | 79 (2.1%) | 62 (1.7%) |
| $15,000 to $17,499 | 175 (4.6%) | 196 (5.2%) |
| $17,500 to $19,999 | 104 (2.7%) | 144 (3.8%) |
| $20,000 to $22,499 | 128 (3.4%) | 202 (5.4%) |
| $22,500 to $24,999 | 143 (3.8%) | 309 (8.2%) |
| $25,000 to $29,999 | 358 (9.4%) | 355 (9.4%) |
| $30,000 to $34,999 | 67 (1.8%) | 468 (12.4%) |
| $35,000 to $39,999 | 264 (7.0%) | 205 (5.4%) |
| $40,000 to $44,999 | 93 (2.5%) | 174 (4.6%) |
| $45,000 to $49,999 | 228 (6.0%) | 129 (3.4%) |
| $50,000 to $54,999 | 194 (5.1%) | 48 (1.3%) |
| $55,000 to $64,999 | 365 (9.6%) | 314 (8.4%) |
| $65,000 to $74,999 | 219 (5.8%) | 172 (4.6%) |
| $75,000 to $99,999 | 271 (7.1%) | 134 (3.6%) |
| $100,000+ | 358 (9.4%) | 117 (3.1%) |
| Total | 3,798 (100.0%) | 3,760 (100.0%) |
Earnings by Sex by Educational Attainment in Sikeston
Average earnings in Sikeston are $41,483 for men and $31,478 for women, a difference of 24.1%. Men with an educational attainment of bachelor's degree enjoy the highest average annual earnings of $52,639, while those with less than high school education earn the least with $22,500. Women with an educational attainment of graduate degree earn the most with the average annual earnings of $61,979, while those with high school diploma education have the smallest earnings of $23,230.
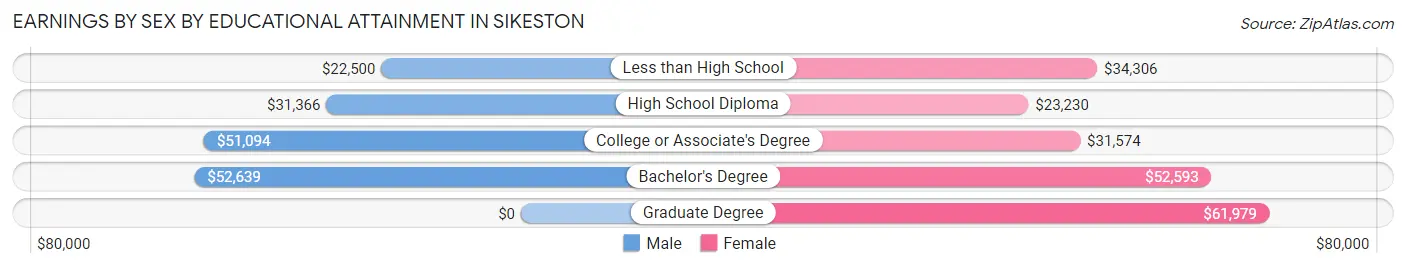
| Educational Attainment | Male Income | Female Income |
| Less than High School | $22,500 | $34,306 |
| High School Diploma | $31,366 | $23,230 |
| College or Associate's Degree | $51,094 | $31,574 |
| Bachelor's Degree | $52,639 | $52,593 |
| Graduate Degree | - | - |
| Total | $41,483 | $31,478 |
Family Income in Sikeston
Family Income Brackets in Sikeston
According to the Sikeston family income data, there are 871 families falling into the $50,000 to $74,999 income range, which is the most common income bracket and makes up 20.4% of all families. Conversely, the $10,000 to $14,999 income bracket is the least frequent group with only 145 families (3.4%) belonging to this category.
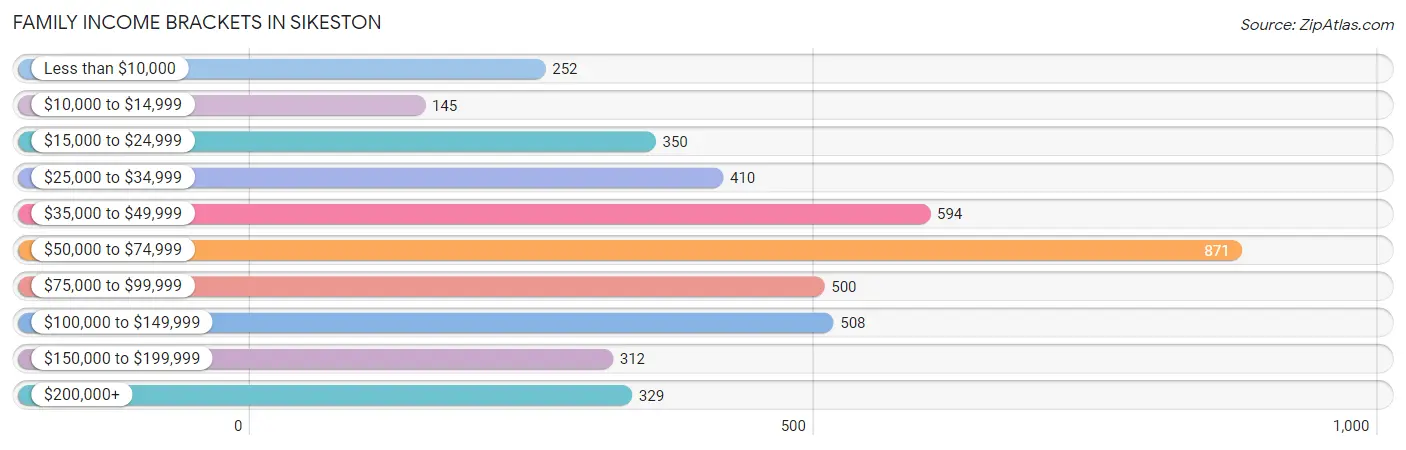
| Income Bracket | # Families | % Families |
| Less than $10,000 | 252 | 5.9% |
| $10,000 to $14,999 | 145 | 3.4% |
| $15,000 to $24,999 | 350 | 8.2% |
| $25,000 to $34,999 | 410 | 9.6% |
| $35,000 to $49,999 | 594 | 13.9% |
| $50,000 to $74,999 | 871 | 20.4% |
| $75,000 to $99,999 | 500 | 11.7% |
| $100,000 to $149,999 | 508 | 11.9% |
| $150,000 to $199,999 | 312 | 7.3% |
| $200,000+ | 329 | 7.7% |
Family Income by Famaliy Size in Sikeston
6-person families (137 | 3.2%) account for the highest median family income in Sikeston with $76,827 per family, while 2-person families (2,275 | 53.3%) have the highest median income of $31,762 per family member.
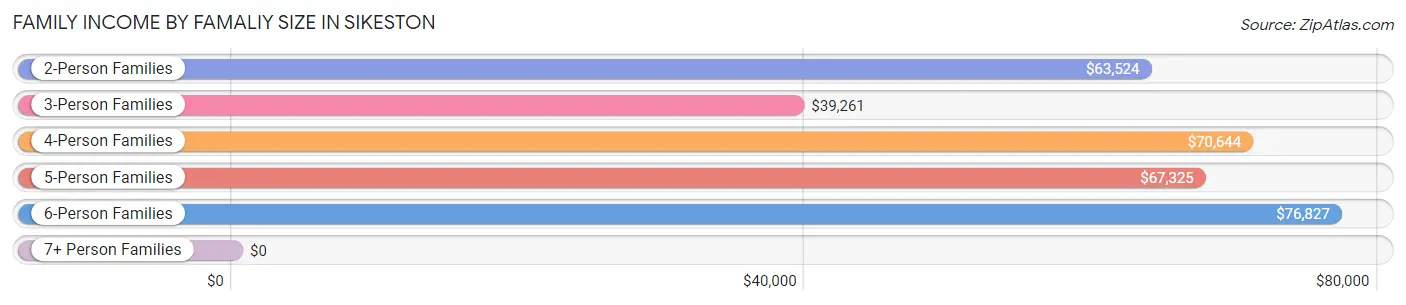
| Income Bracket | # Families | Median Income |
| 2-Person Families | 2,275 (53.3%) | $63,524 |
| 3-Person Families | 1,060 (24.8%) | $39,261 |
| 4-Person Families | 549 (12.9%) | $70,644 |
| 5-Person Families | 242 (5.7%) | $67,325 |
| 6-Person Families | 137 (3.2%) | $76,827 |
| 7+ Person Families | 7 (0.2%) | $0 |
| Total | 4,270 (100.0%) | $60,591 |
Family Income by Number of Earners in Sikeston
The median family income in Sikeston is $60,591, with families comprising 3+ earners (298) having the highest median family income of $102,829, while families with no earners (826) have the lowest median family income of $32,227, accounting for 7.0% and 19.3% of families, respectively.
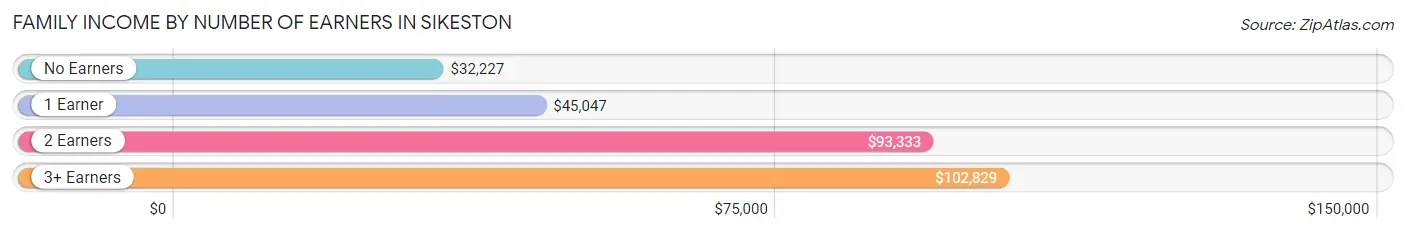
| Number of Earners | # Families | Median Income |
| No Earners | 826 (19.3%) | $32,227 |
| 1 Earner | 1,660 (38.9%) | $45,047 |
| 2 Earners | 1,486 (34.8%) | $93,333 |
| 3+ Earners | 298 (7.0%) | $102,829 |
| Total | 4,270 (100.0%) | $60,591 |
Household Income in Sikeston
Household Income Brackets in Sikeston
With 1,422 households falling in the category, the $50,000 to $74,999 income range is the most frequent in Sikeston, accounting for 20.8% of all households. In contrast, only 314 households (4.6%) fall into the $150,000 to $199,999 income bracket, making it the least populous group.
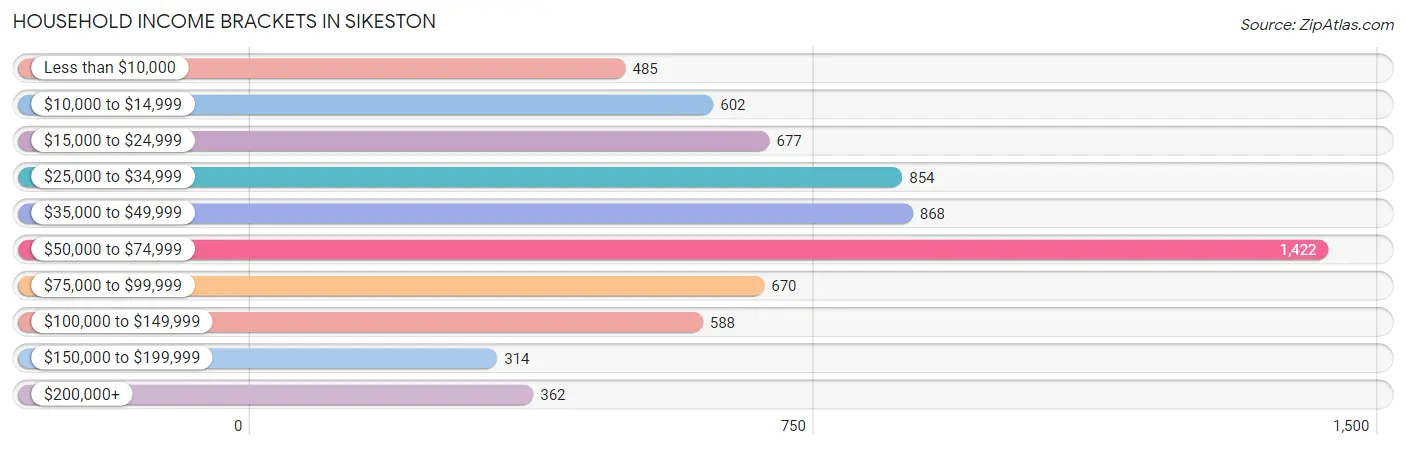
| Income Bracket | # Households | % Households |
| Less than $10,000 | 485 | 7.1% |
| $10,000 to $14,999 | 602 | 8.8% |
| $15,000 to $24,999 | 677 | 9.9% |
| $25,000 to $34,999 | 854 | 12.5% |
| $35,000 to $49,999 | 868 | 12.7% |
| $50,000 to $74,999 | 1,422 | 20.8% |
| $75,000 to $99,999 | 670 | 9.8% |
| $100,000 to $149,999 | 588 | 8.6% |
| $150,000 to $199,999 | 314 | 4.6% |
| $200,000+ | 362 | 5.3% |
Household Income by Householder Age in Sikeston
The median household income in Sikeston is $47,464, with the highest median household income of $58,023 found in the 45 to 64 years age bracket for the primary householder. A total of 1,962 households (28.7%) fall into this category. Meanwhile, the 15 to 24 years age bracket for the primary householder has the lowest median household income of $22,599, with 305 households (4.5%) in this group.
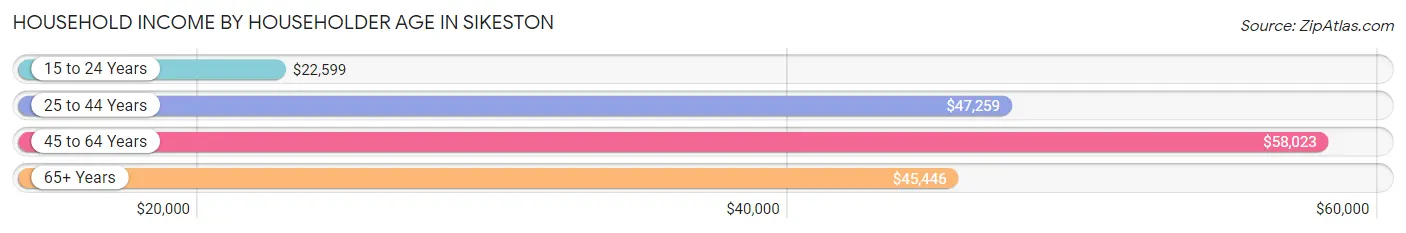
| Income Bracket | # Households | Median Income |
| 15 to 24 Years | 305 (4.5%) | $22,599 |
| 25 to 44 Years | 2,247 (32.9%) | $47,259 |
| 45 to 64 Years | 1,962 (28.7%) | $58,023 |
| 65+ Years | 2,322 (34.0%) | $45,446 |
| Total | 6,836 (100.0%) | $47,464 |
Poverty in Sikeston
Income Below Poverty by Sex and Age in Sikeston
With 16.5% poverty level for males and 22.9% for females among the residents of Sikeston, 12 to 14 year old males and under 5 year old females are the most vulnerable to poverty, with 138 males (51.9%) and 278 females (47.1%) in their respective age groups living below the poverty level.
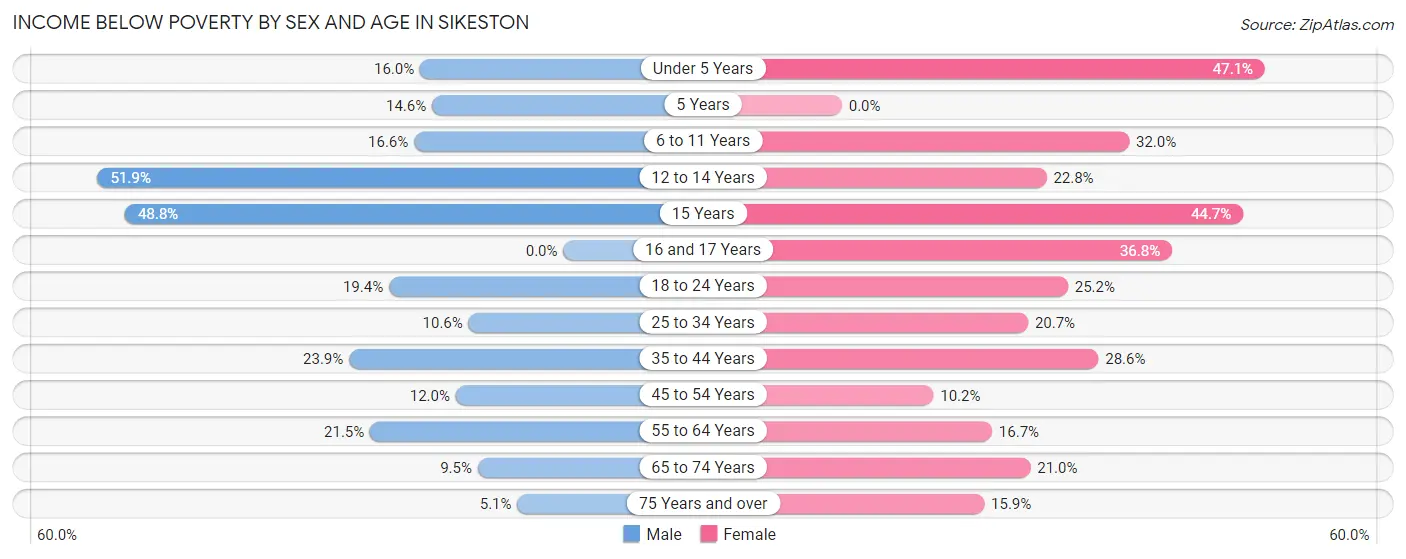
| Age Bracket | Male | Female |
| Under 5 Years | 91 (16.0%) | 278 (47.1%) |
| 5 Years | 25 (14.6%) | 0 (0.0%) |
| 6 to 11 Years | 115 (16.6%) | 135 (32.0%) |
| 12 to 14 Years | 138 (51.9%) | 103 (22.8%) |
| 15 Years | 83 (48.8%) | 59 (44.7%) |
| 16 and 17 Years | 0 (0.0%) | 82 (36.8%) |
| 18 to 24 Years | 93 (19.4%) | 181 (25.2%) |
| 25 to 34 Years | 135 (10.5%) | 260 (20.7%) |
| 35 to 44 Years | 172 (23.9%) | 246 (28.6%) |
| 45 to 54 Years | 80 (12.0%) | 81 (10.2%) |
| 55 to 64 Years | 181 (21.5%) | 165 (16.7%) |
| 65 to 74 Years | 71 (9.5%) | 207 (21.0%) |
| 75 Years and over | 36 (5.1%) | 142 (15.9%) |
| Total | 1,220 (16.5%) | 1,939 (22.9%) |
Income Above Poverty by Sex and Age in Sikeston
According to the poverty statistics in Sikeston, males aged 16 and 17 years and females aged 5 years are the age groups that are most secure financially, with 100.0% of males and 100.0% of females in these age groups living above the poverty line.
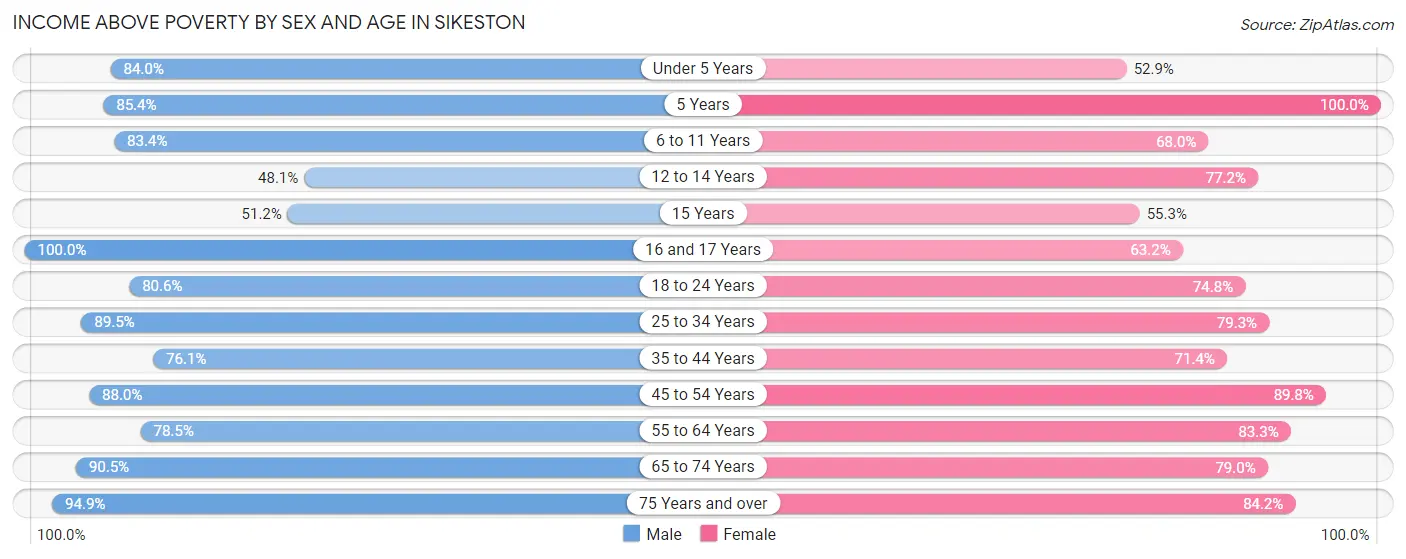
| Age Bracket | Male | Female |
| Under 5 Years | 479 (84.0%) | 312 (52.9%) |
| 5 Years | 146 (85.4%) | 136 (100.0%) |
| 6 to 11 Years | 577 (83.4%) | 287 (68.0%) |
| 12 to 14 Years | 128 (48.1%) | 349 (77.2%) |
| 15 Years | 87 (51.2%) | 73 (55.3%) |
| 16 and 17 Years | 74 (100.0%) | 141 (63.2%) |
| 18 to 24 Years | 386 (80.6%) | 538 (74.8%) |
| 25 to 34 Years | 1,145 (89.4%) | 994 (79.3%) |
| 35 to 44 Years | 549 (76.1%) | 615 (71.4%) |
| 45 to 54 Years | 588 (88.0%) | 714 (89.8%) |
| 55 to 64 Years | 660 (78.5%) | 822 (83.3%) |
| 65 to 74 Years | 674 (90.5%) | 779 (79.0%) |
| 75 Years and over | 667 (94.9%) | 754 (84.2%) |
| Total | 6,160 (83.5%) | 6,514 (77.1%) |
Income Below Poverty Among Married-Couple Families in Sikeston
The poverty statistics for married-couple families in Sikeston show that 6.2% or 172 of the total 2,757 families live below the poverty line. Families with 5 or more children have the highest poverty rate of 100.0%, comprising of 7 families. On the other hand, families with 1 or 2 children have the lowest poverty rate of 5.7%, which includes 37 families.
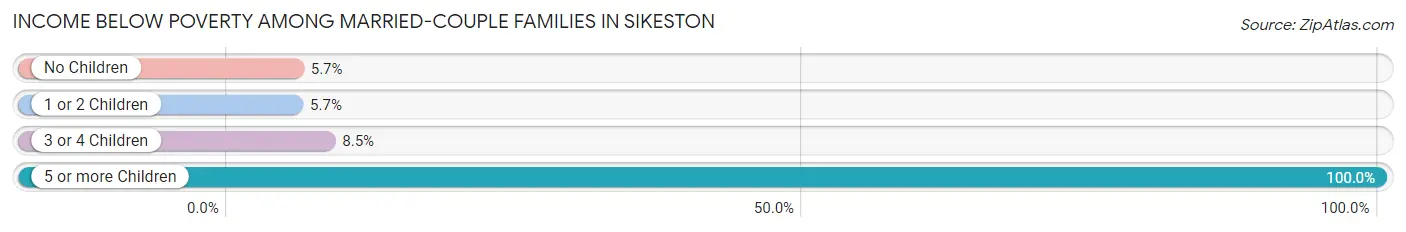
| Children | Above Poverty | Below Poverty |
| No Children | 1,699 (94.3%) | 103 (5.7%) |
| 1 or 2 Children | 616 (94.3%) | 37 (5.7%) |
| 3 or 4 Children | 270 (91.5%) | 25 (8.5%) |
| 5 or more Children | 0 (0.0%) | 7 (100.0%) |
| Total | 2,585 (93.8%) | 172 (6.2%) |
Income Below Poverty Among Single-Parent Households in Sikeston
According to the poverty data in Sikeston, 27.9% or 116 single-father households and 37.9% or 416 single-mother households are living below the poverty line. Among single-father households, those with 1 or 2 children have the highest poverty rate, with 109 households (55.6%) experiencing poverty. Likewise, among single-mother households, those with 3 or 4 children have the highest poverty rate, with 113 households (100.0%) falling below the poverty line.
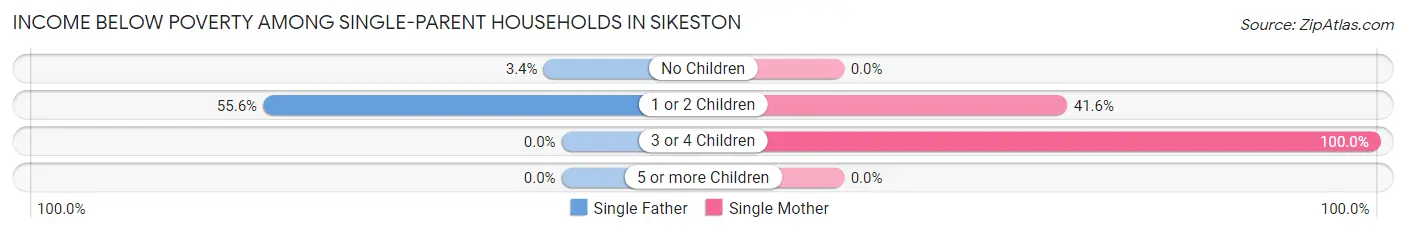
| Children | Single Father | Single Mother |
| No Children | 7 (3.4%) | 0 (0.0%) |
| 1 or 2 Children | 109 (55.6%) | 303 (41.6%) |
| 3 or 4 Children | 0 (0.0%) | 113 (100.0%) |
| 5 or more Children | 0 (0.0%) | 0 (0.0%) |
| Total | 116 (27.9%) | 416 (37.9%) |
Income Below Poverty Among Married-Couple vs Single-Parent Households in Sikeston
The poverty data for Sikeston shows that 172 of the married-couple family households (6.2%) and 532 of the single-parent households (35.2%) are living below the poverty level. Within the married-couple family households, those with 5 or more children have the highest poverty rate, with 7 households (100.0%) falling below the poverty line. Among the single-parent households, those with 3 or 4 children have the highest poverty rate, with 113 household (90.4%) living below poverty.
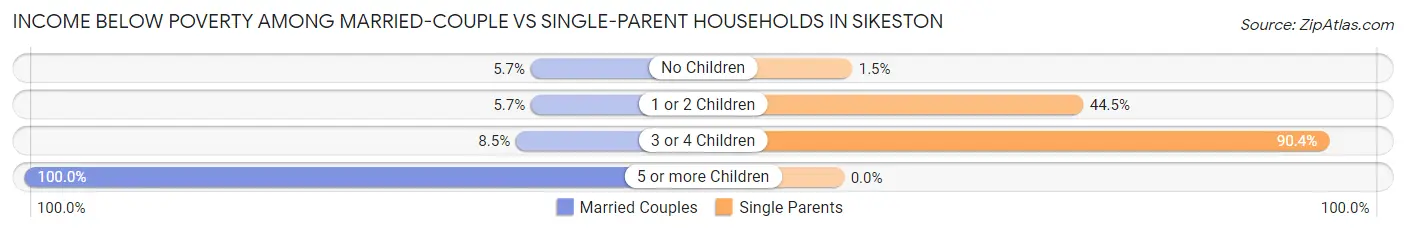
| Children | Married-Couple Families | Single-Parent Households |
| No Children | 103 (5.7%) | 7 (1.5%) |
| 1 or 2 Children | 37 (5.7%) | 412 (44.5%) |
| 3 or 4 Children | 25 (8.5%) | 113 (90.4%) |
| 5 or more Children | 7 (100.0%) | 0 (0.0%) |
| Total | 172 (6.2%) | 532 (35.2%) |
Employment Characteristics in Sikeston
Employment by Class of Employer in Sikeston
Among the 6,757 employed individuals in Sikeston, private company employees (4,791 | 70.9%), not-for-profit organizations (669 | 9.9%), and local government employees (431 | 6.4%) make up the most common classes of employment.
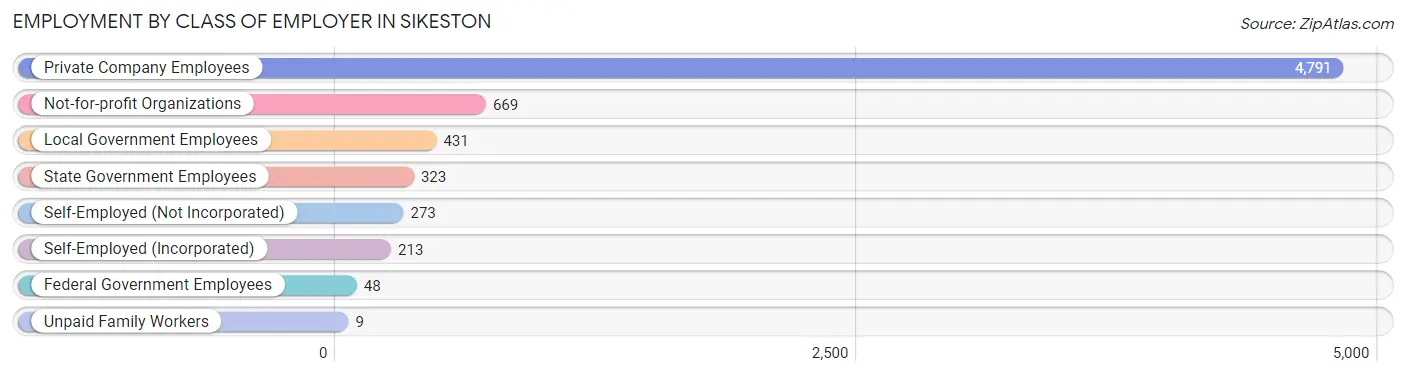
| Employer Class | # Employees | % Employees |
| Private Company Employees | 4,791 | 70.9% |
| Self-Employed (Incorporated) | 213 | 3.2% |
| Self-Employed (Not Incorporated) | 273 | 4.0% |
| Not-for-profit Organizations | 669 | 9.9% |
| Local Government Employees | 431 | 6.4% |
| State Government Employees | 323 | 4.8% |
| Federal Government Employees | 48 | 0.7% |
| Unpaid Family Workers | 9 | 0.1% |
| Total | 6,757 | 100.0% |
Employment Status by Age in Sikeston
According to the labor force statistics for Sikeston, out of the total population over 16 years of age (12,499), 56.3% or 7,037 individuals are in the labor force, with 2.9% or 204 of them unemployed. The age group with the highest labor force participation rate is 25 to 29 years, with 87.5% or 1,029 individuals in the labor force. Within the labor force, the 16 to 19 years age range has the highest percentage of unemployed individuals, with 22.9% or 40 of them being unemployed.
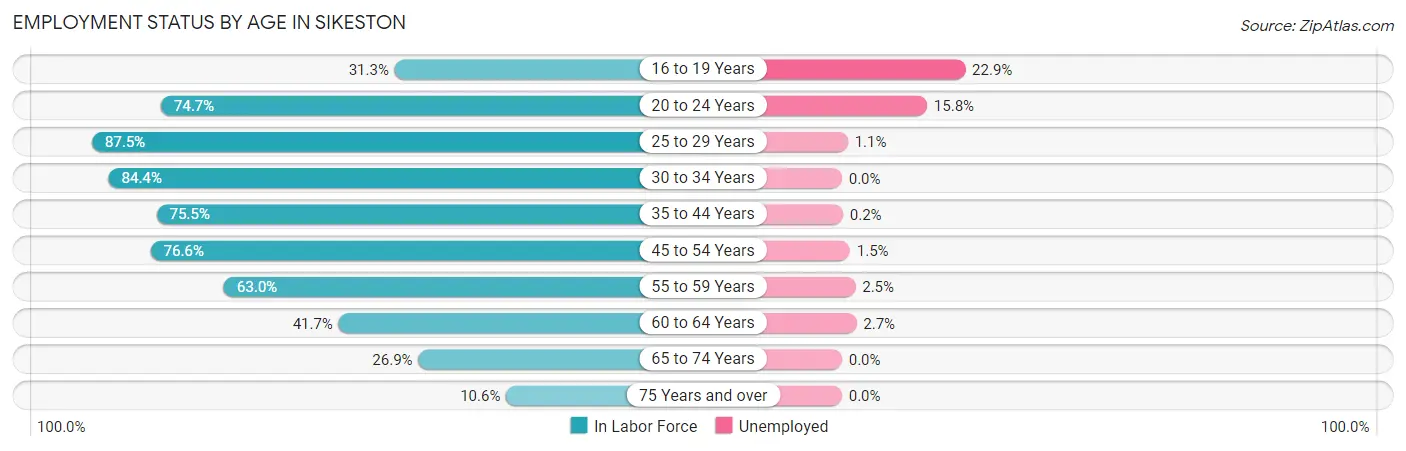
| Age Bracket | In Labor Force | Unemployed |
| 16 to 19 Years | 175 (31.3%) | 40 (22.9%) |
| 20 to 24 Years | 698 (74.7%) | 110 (15.8%) |
| 25 to 29 Years | 1,029 (87.5%) | 11 (1.1%) |
| 30 to 34 Years | 1,150 (84.4%) | 0 (0.0%) |
| 35 to 44 Years | 1,194 (75.5%) | 2 (0.2%) |
| 45 to 54 Years | 1,121 (76.6%) | 17 (1.5%) |
| 55 to 59 Years | 675 (63.0%) | 17 (2.5%) |
| 60 to 64 Years | 328 (41.7%) | 9 (2.7%) |
| 65 to 74 Years | 472 (26.9%) | 0 (0.0%) |
| 75 Years and over | 192 (10.6%) | 0 (0.0%) |
| Total | 7,037 (56.3%) | 204 (2.9%) |
Employment Status by Educational Attainment in Sikeston
According to labor force statistics for Sikeston, 73.9% of individuals (5,500) out of the total population between 25 and 64 years of age (7,442) are in the labor force, with 1.0% or 55 of them being unemployed. The group with the highest labor force participation rate are those with the educational attainment of bachelor's degree or higher, with 85.9% or 1,444 individuals in the labor force. Within the labor force, individuals with high school diploma education have the highest percentage of unemployment, with 2.5% or 48 of them being unemployed.
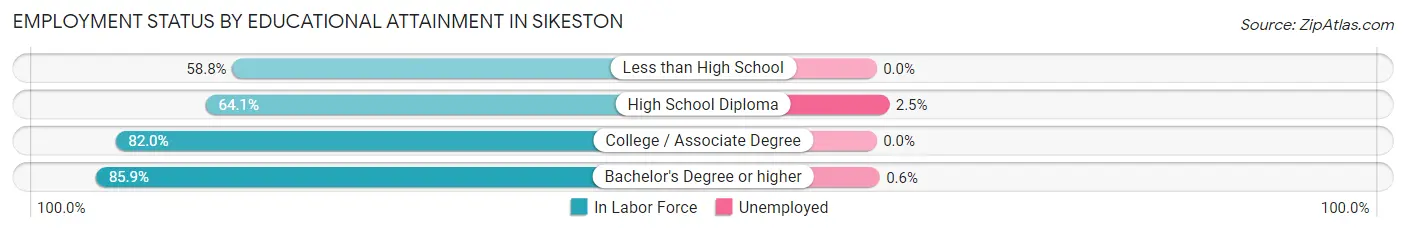
| Educational Attainment | In Labor Force | Unemployed |
| Less than High School | 360 (58.8%) | 0 (0.0%) |
| High School Diploma | 1,904 (64.1%) | 74 (2.5%) |
| College / Associate Degree | 1,786 (82.0%) | 0 (0.0%) |
| Bachelor's Degree or higher | 1,444 (85.9%) | 10 (0.6%) |
| Total | 5,500 (73.9%) | 74 (1.0%) |
Employment Occupations by Sex in Sikeston
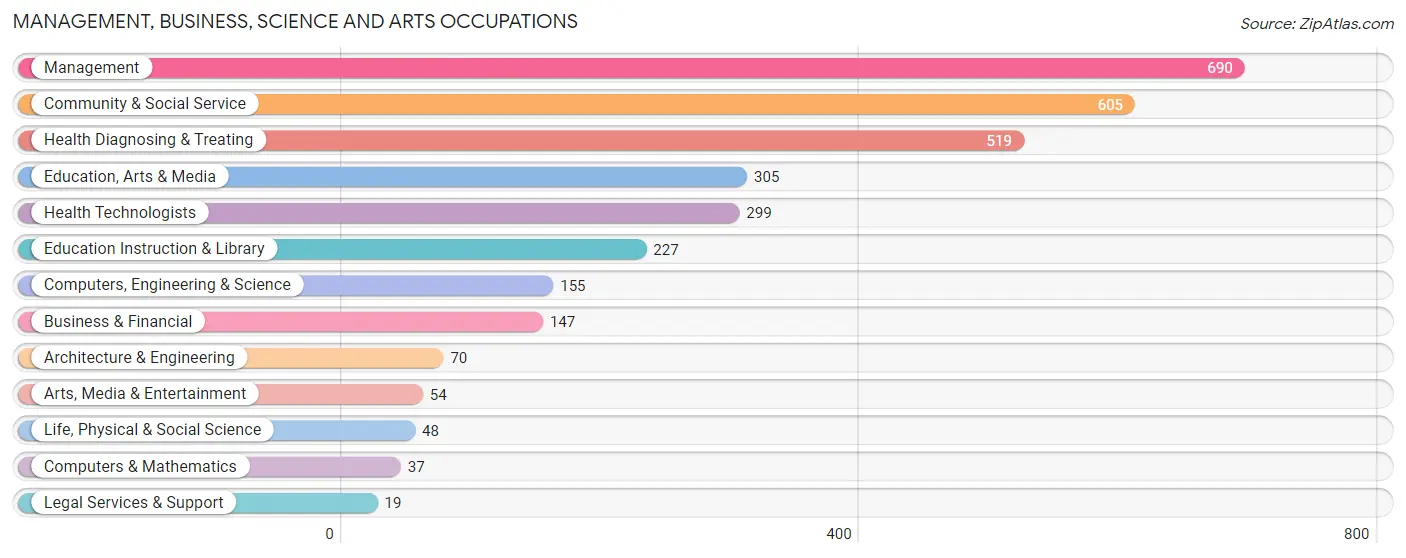
Management, Business, Science and Arts Occupations
The most common Management, Business, Science and Arts occupations in Sikeston are Management (690 | 10.1%), Community & Social Service (605 | 8.9%), Health Diagnosing & Treating (519 | 7.6%), Education, Arts & Media (305 | 4.5%), and Health Technologists (299 | 4.4%).
Management, Business, Science and Arts Occupations by Sex
Within the Management, Business, Science and Arts occupations in Sikeston, the most male-oriented occupations are Architecture & Engineering (100.0%), Management (65.2%), and Computers, Engineering & Science (65.2%), while the most female-oriented occupations are Education Instruction & Library (96.5%), Health Technologists (84.0%), and Health Diagnosing & Treating (82.5%).
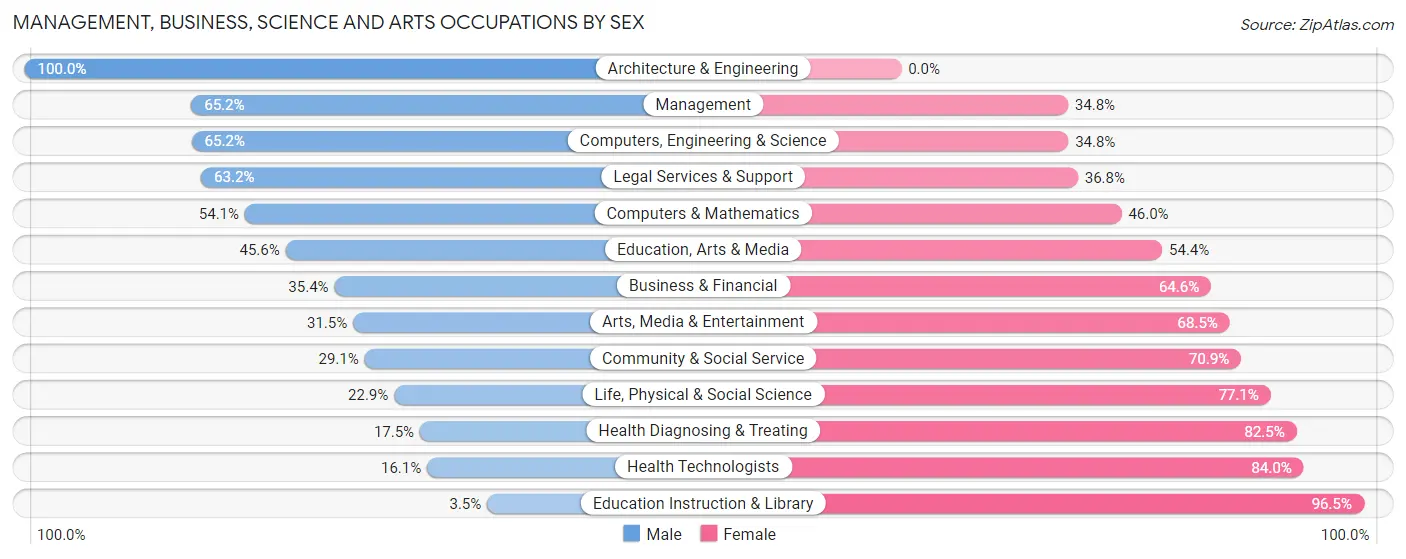
| Occupation | Male | Female |
| Management | 450 (65.2%) | 240 (34.8%) |
| Business & Financial | 52 (35.4%) | 95 (64.6%) |
| Computers, Engineering & Science | 101 (65.2%) | 54 (34.8%) |
| Computers & Mathematics | 20 (54.0%) | 17 (46.0%) |
| Architecture & Engineering | 70 (100.0%) | 0 (0.0%) |
| Life, Physical & Social Science | 11 (22.9%) | 37 (77.1%) |
| Community & Social Service | 176 (29.1%) | 429 (70.9%) |
| Education, Arts & Media | 139 (45.6%) | 166 (54.4%) |
| Legal Services & Support | 12 (63.2%) | 7 (36.8%) |
| Education Instruction & Library | 8 (3.5%) | 219 (96.5%) |
| Arts, Media & Entertainment | 17 (31.5%) | 37 (68.5%) |
| Health Diagnosing & Treating | 91 (17.5%) | 428 (82.5%) |
| Health Technologists | 48 (16.1%) | 251 (84.0%) |
| Total (Category) | 870 (41.1%) | 1,246 (58.9%) |
| Total (Overall) | 3,360 (49.3%) | 3,452 (50.7%) |
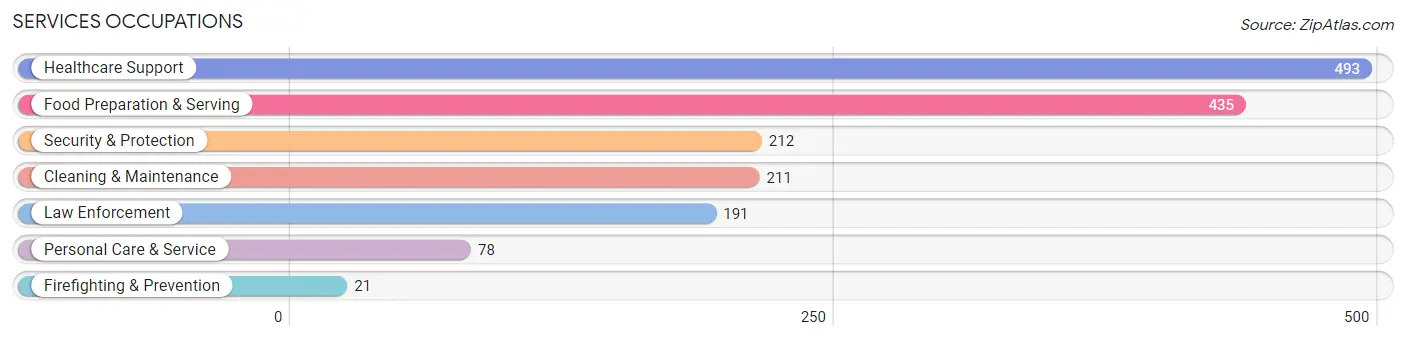
Services Occupations
The most common Services occupations in Sikeston are Healthcare Support (493 | 7.2%), Food Preparation & Serving (435 | 6.4%), Security & Protection (212 | 3.1%), Cleaning & Maintenance (211 | 3.1%), and Law Enforcement (191 | 2.8%).
Services Occupations by Sex
Within the Services occupations in Sikeston, the most male-oriented occupations are Firefighting & Prevention (100.0%), Cleaning & Maintenance (80.6%), and Security & Protection (73.6%), while the most female-oriented occupations are Healthcare Support (74.0%), Personal Care & Service (59.0%), and Law Enforcement (29.3%).
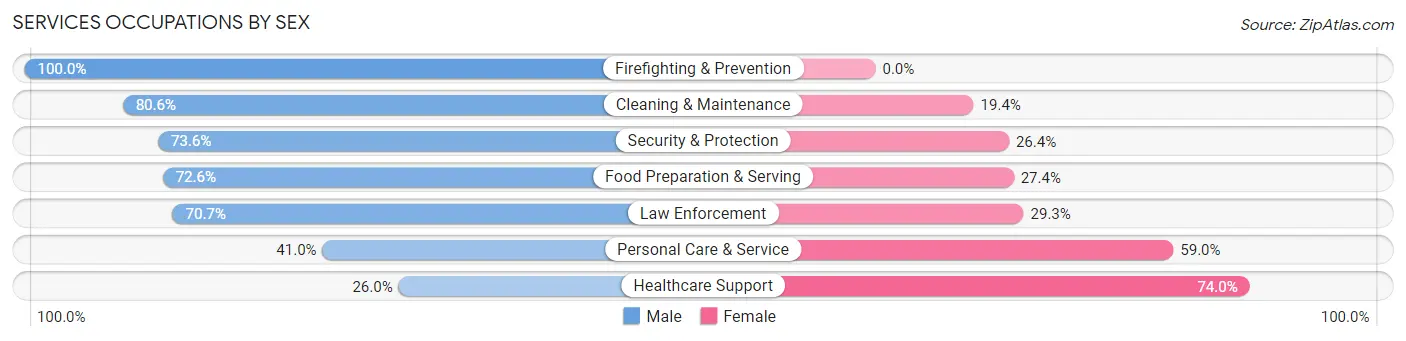
| Occupation | Male | Female |
| Healthcare Support | 128 (26.0%) | 365 (74.0%) |
| Security & Protection | 156 (73.6%) | 56 (26.4%) |
| Firefighting & Prevention | 21 (100.0%) | 0 (0.0%) |
| Law Enforcement | 135 (70.7%) | 56 (29.3%) |
| Food Preparation & Serving | 316 (72.6%) | 119 (27.4%) |
| Cleaning & Maintenance | 170 (80.6%) | 41 (19.4%) |
| Personal Care & Service | 32 (41.0%) | 46 (59.0%) |
| Total (Category) | 802 (56.1%) | 627 (43.9%) |
| Total (Overall) | 3,360 (49.3%) | 3,452 (50.7%) |
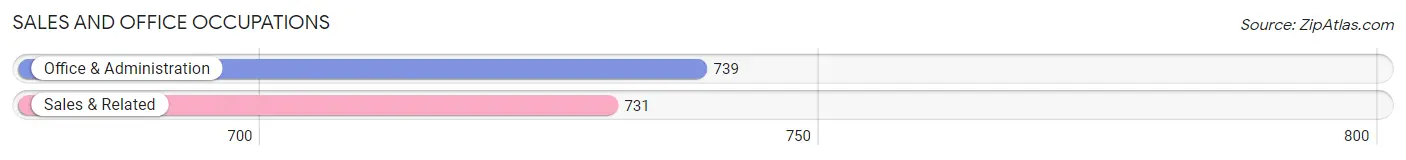
Sales and Office Occupations
The most common Sales and Office occupations in Sikeston are Office & Administration (739 | 10.8%), and Sales & Related (731 | 10.7%).
Sales and Office Occupations by Sex
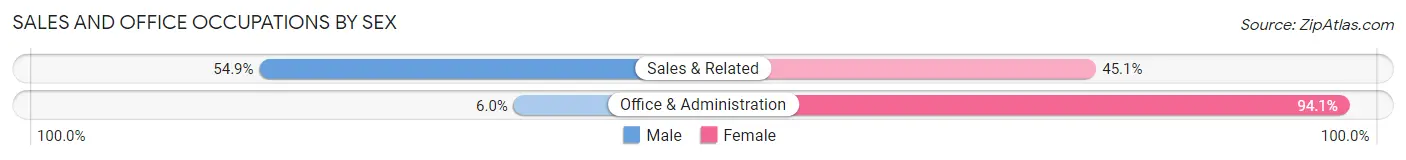
| Occupation | Male | Female |
| Sales & Related | 401 (54.9%) | 330 (45.1%) |
| Office & Administration | 44 (5.9%) | 695 (94.1%) |
| Total (Category) | 445 (30.3%) | 1,025 (69.7%) |
| Total (Overall) | 3,360 (49.3%) | 3,452 (50.7%) |
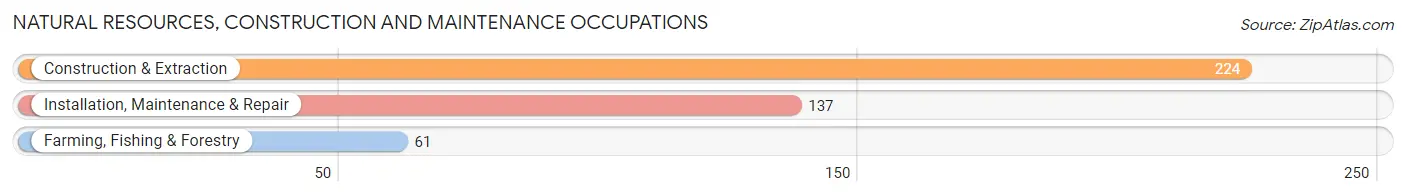
Natural Resources, Construction and Maintenance Occupations
The most common Natural Resources, Construction and Maintenance occupations in Sikeston are Construction & Extraction (224 | 3.3%), Installation, Maintenance & Repair (137 | 2.0%), and Farming, Fishing & Forestry (61 | 0.9%).
Natural Resources, Construction and Maintenance Occupations by Sex
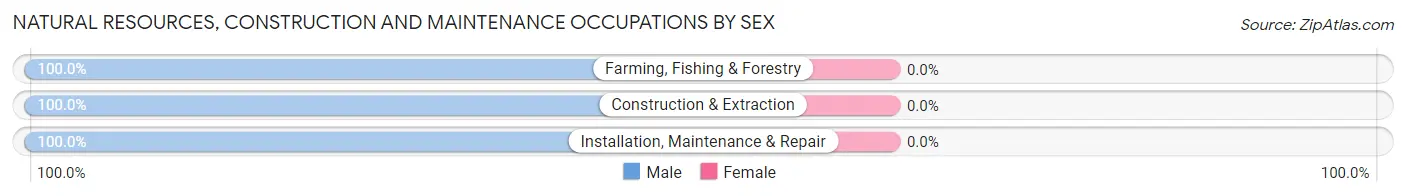
| Occupation | Male | Female |
| Farming, Fishing & Forestry | 61 (100.0%) | 0 (0.0%) |
| Construction & Extraction | 224 (100.0%) | 0 (0.0%) |
| Installation, Maintenance & Repair | 137 (100.0%) | 0 (0.0%) |
| Total (Category) | 422 (100.0%) | 0 (0.0%) |
| Total (Overall) | 3,360 (49.3%) | 3,452 (50.7%) |
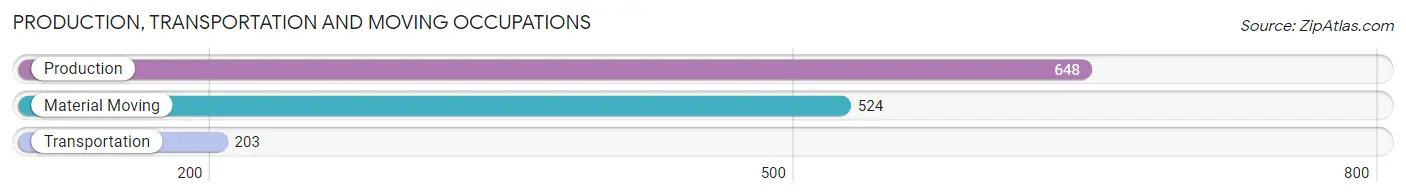
Production, Transportation and Moving Occupations
The most common Production, Transportation and Moving occupations in Sikeston are Production (648 | 9.5%), Material Moving (524 | 7.7%), and Transportation (203 | 3.0%).
Production, Transportation and Moving Occupations by Sex
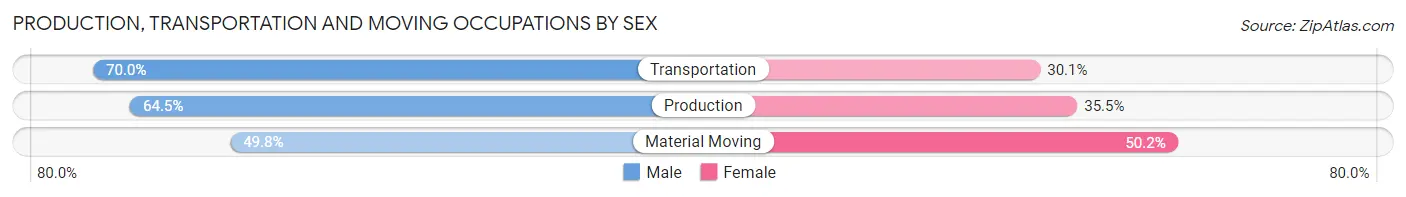
| Occupation | Male | Female |
| Production | 418 (64.5%) | 230 (35.5%) |
| Transportation | 142 (70.0%) | 61 (30.0%) |
| Material Moving | 261 (49.8%) | 263 (50.2%) |
| Total (Category) | 821 (59.7%) | 554 (40.3%) |
| Total (Overall) | 3,360 (49.3%) | 3,452 (50.7%) |
Employment Industries by Sex in Sikeston
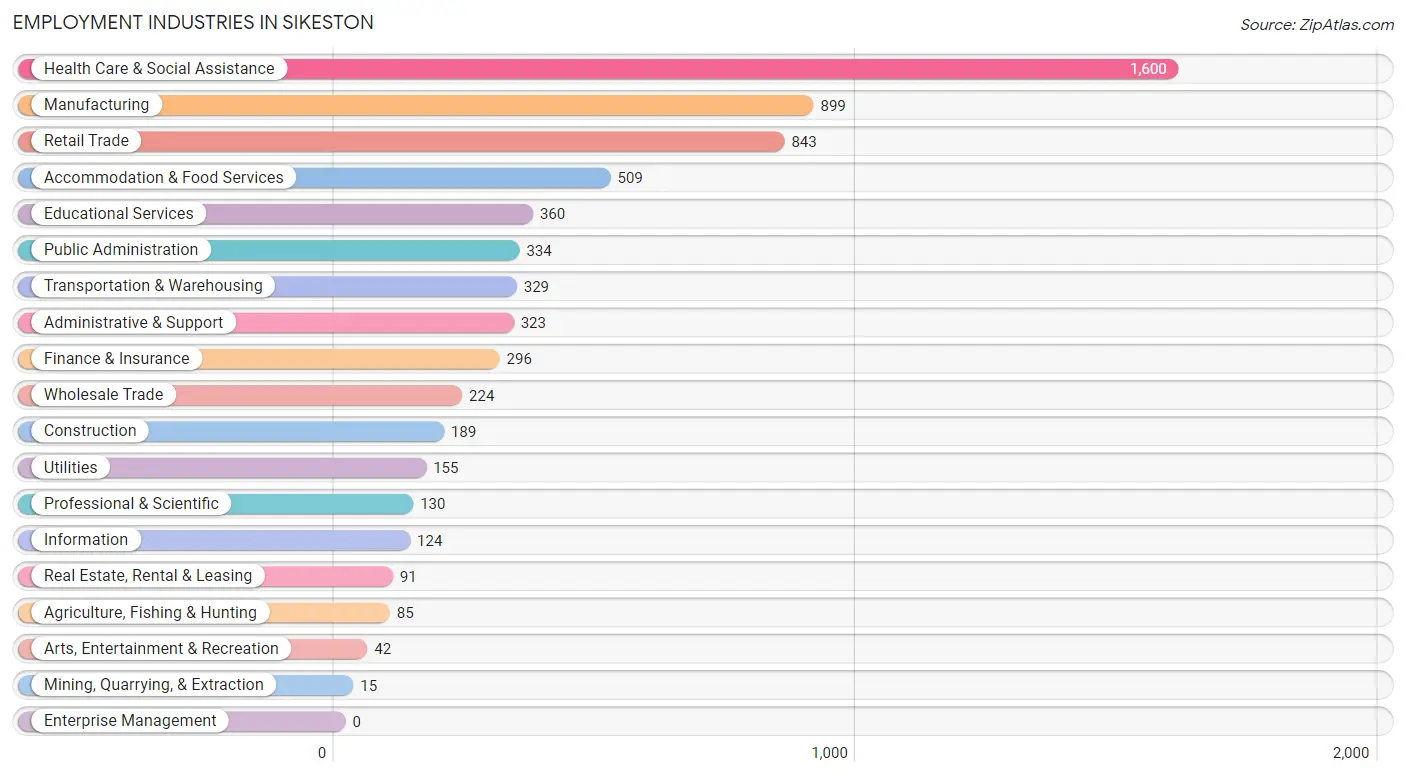
Employment Industries in Sikeston
The major employment industries in Sikeston include Health Care & Social Assistance (1,600 | 23.5%), Manufacturing (899 | 13.2%), Retail Trade (843 | 12.4%), Accommodation & Food Services (509 | 7.5%), and Educational Services (360 | 5.3%).
Employment Industries by Sex in Sikeston
The Sikeston industries that see more men than women are Mining, Quarrying, & Extraction (100.0%), Construction (93.6%), and Arts, Entertainment & Recreation (90.5%), whereas the industries that tend to have a higher number of women are Educational Services (84.4%), Health Care & Social Assistance (73.5%), and Real Estate, Rental & Leasing (67.0%).
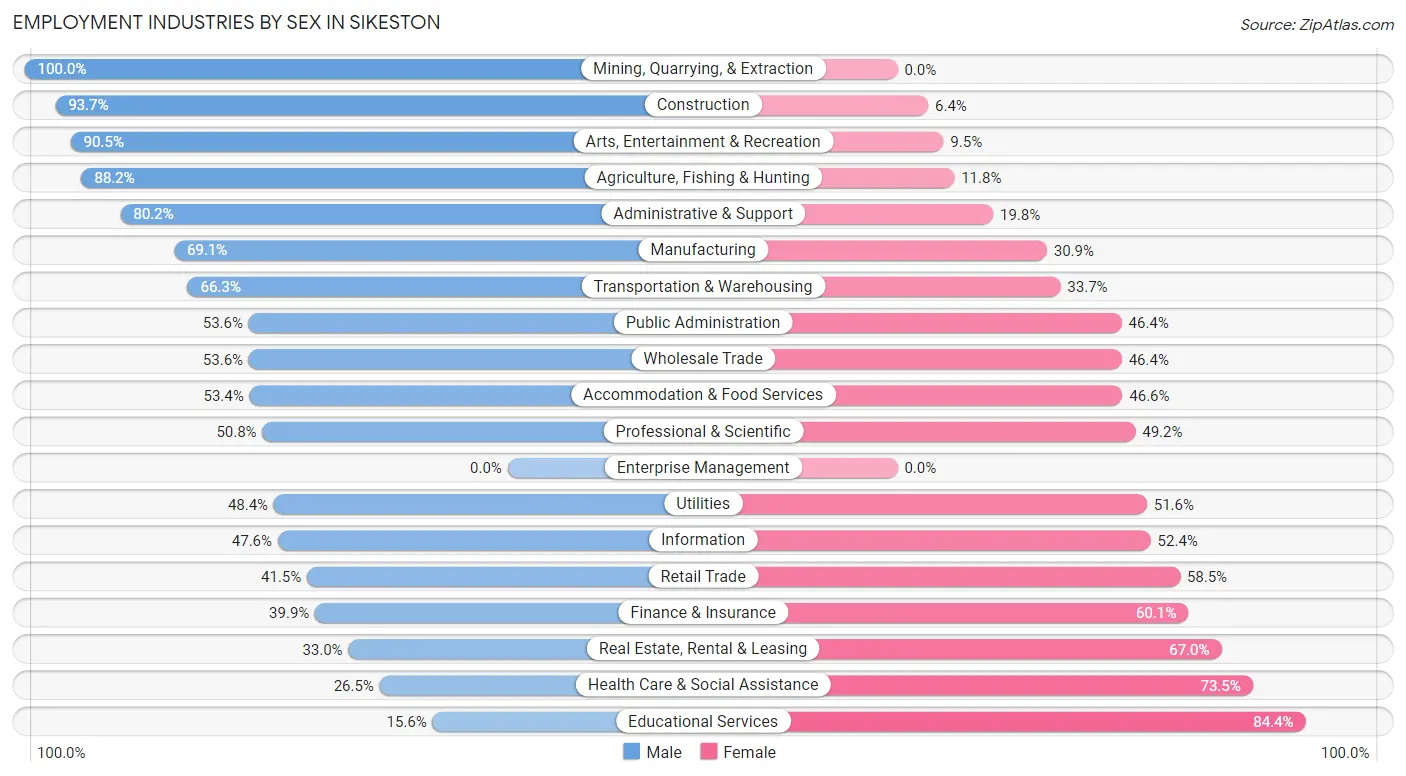
| Industry | Male | Female |
| Agriculture, Fishing & Hunting | 75 (88.2%) | 10 (11.8%) |
| Mining, Quarrying, & Extraction | 15 (100.0%) | 0 (0.0%) |
| Construction | 177 (93.6%) | 12 (6.4%) |
| Manufacturing | 621 (69.1%) | 278 (30.9%) |
| Wholesale Trade | 120 (53.6%) | 104 (46.4%) |
| Retail Trade | 350 (41.5%) | 493 (58.5%) |
| Transportation & Warehousing | 218 (66.3%) | 111 (33.7%) |
| Utilities | 75 (48.4%) | 80 (51.6%) |
| Information | 59 (47.6%) | 65 (52.4%) |
| Finance & Insurance | 118 (39.9%) | 178 (60.1%) |
| Real Estate, Rental & Leasing | 30 (33.0%) | 61 (67.0%) |
| Professional & Scientific | 66 (50.8%) | 64 (49.2%) |
| Enterprise Management | 0 (0.0%) | 0 (0.0%) |
| Administrative & Support | 259 (80.2%) | 64 (19.8%) |
| Educational Services | 56 (15.6%) | 304 (84.4%) |
| Health Care & Social Assistance | 424 (26.5%) | 1,176 (73.5%) |
| Arts, Entertainment & Recreation | 38 (90.5%) | 4 (9.5%) |
| Accommodation & Food Services | 272 (53.4%) | 237 (46.6%) |
| Public Administration | 179 (53.6%) | 155 (46.4%) |
| Total | 3,360 (49.3%) | 3,452 (50.7%) |
Education in Sikeston
School Enrollment in Sikeston
The most common levels of schooling among the 3,236 students in Sikeston are middle school (801 | 24.7%), elementary school (783 | 24.2%), and high school (700 | 21.6%).
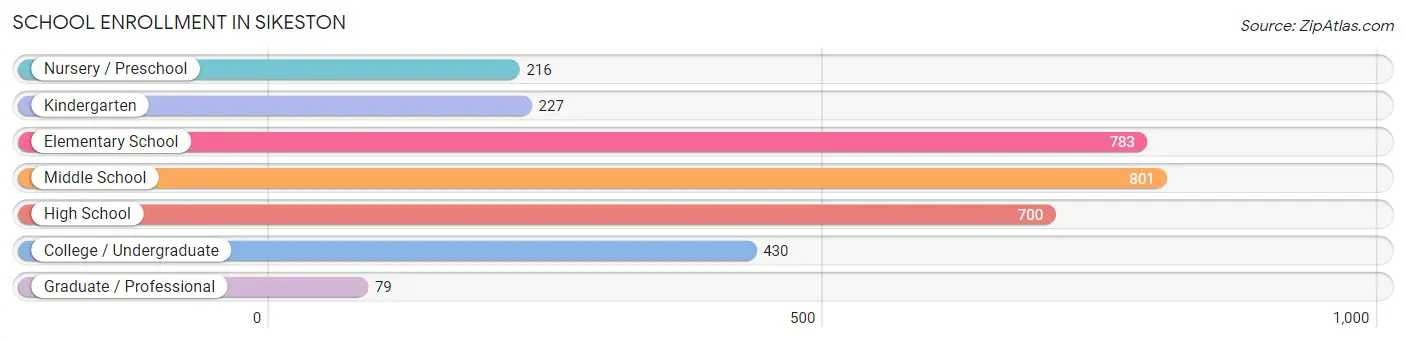
| School Level | # Students | % Students |
| Nursery / Preschool | 216 | 6.7% |
| Kindergarten | 227 | 7.0% |
| Elementary School | 783 | 24.2% |
| Middle School | 801 | 24.7% |
| High School | 700 | 21.6% |
| College / Undergraduate | 430 | 13.3% |
| Graduate / Professional | 79 | 2.4% |
| Total | 3,236 | 100.0% |
School Enrollment by Age by Funding Source in Sikeston
Out of a total of 3,236 students who are enrolled in schools in Sikeston, 463 (14.3%) attend a private institution, while the remaining 2,773 (85.7%) are enrolled in public schools. The age group of 35 years and over has the highest likelihood of being enrolled in private schools, with 59 (49.2% in the age bracket) enrolled. Conversely, the age group of 18 to 19 year olds has the lowest likelihood of being enrolled in a private school, with 149 (100.0% in the age bracket) attending a public institution.
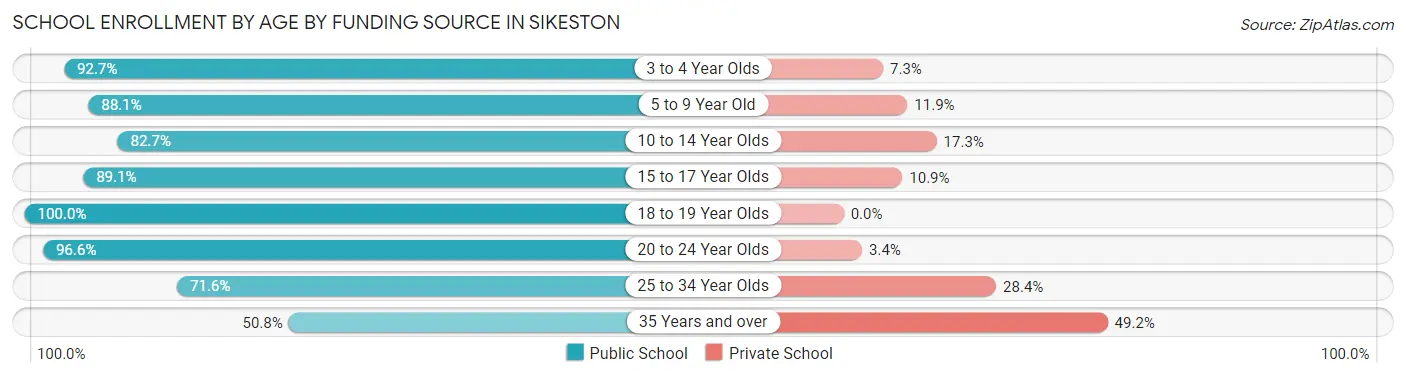
| Age Bracket | Public School | Private School |
| 3 to 4 Year Olds | 101 (92.7%) | 8 (7.3%) |
| 5 to 9 Year Old | 898 (88.1%) | 121 (11.9%) |
| 10 to 14 Year Olds | 802 (82.7%) | 168 (17.3%) |
| 15 to 17 Year Olds | 448 (89.1%) | 55 (10.9%) |
| 18 to 19 Year Olds | 149 (100.0%) | 0 (0.0%) |
| 20 to 24 Year Olds | 197 (96.6%) | 7 (3.4%) |
| 25 to 34 Year Olds | 116 (71.6%) | 46 (28.4%) |
| 35 Years and over | 61 (50.8%) | 59 (49.2%) |
| Total | 2,773 (85.7%) | 463 (14.3%) |
Educational Attainment by Field of Study in Sikeston
Education (591 | 21.5%), business (511 | 18.6%), science & technology (364 | 13.3%), psychology (238 | 8.7%), and arts & humanities (188 | 6.9%) are the most common fields of study among 2,743 individuals in Sikeston who have obtained a bachelor's degree or higher.
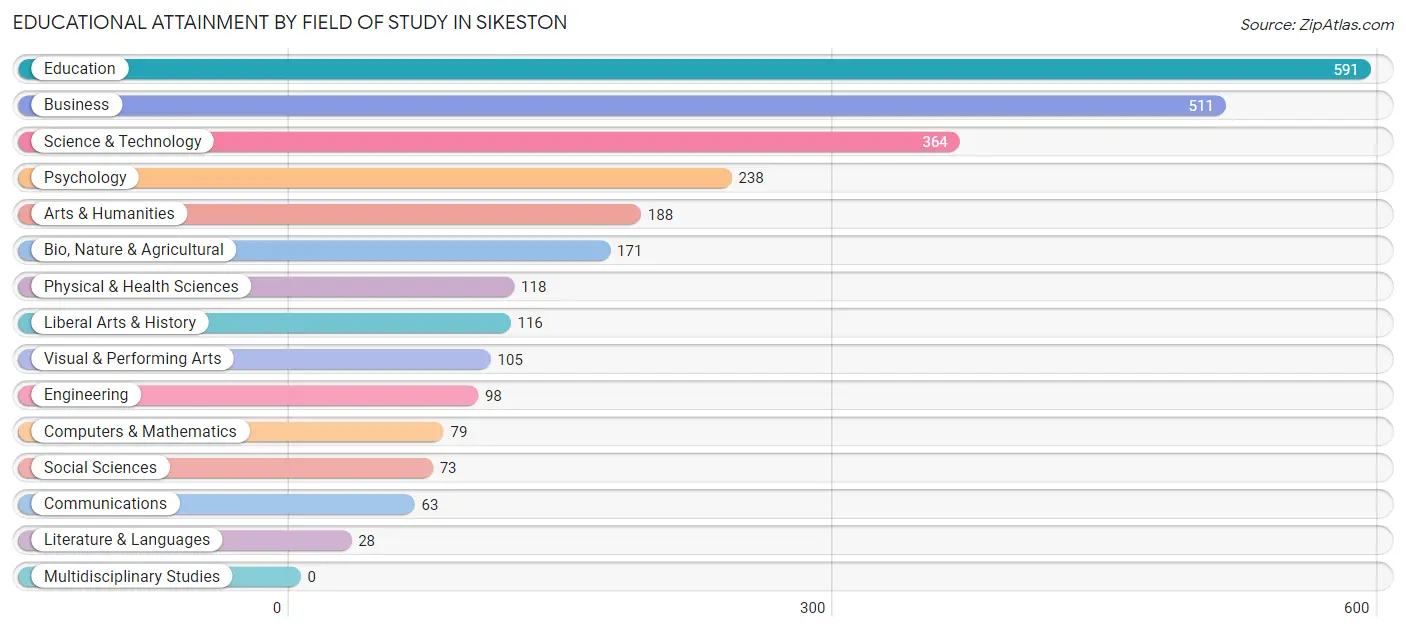
| Field of Study | # Graduates | % Graduates |
| Computers & Mathematics | 79 | 2.9% |
| Bio, Nature & Agricultural | 171 | 6.2% |
| Physical & Health Sciences | 118 | 4.3% |
| Psychology | 238 | 8.7% |
| Social Sciences | 73 | 2.7% |
| Engineering | 98 | 3.6% |
| Multidisciplinary Studies | 0 | 0.0% |
| Science & Technology | 364 | 13.3% |
| Business | 511 | 18.6% |
| Education | 591 | 21.5% |
| Literature & Languages | 28 | 1.0% |
| Liberal Arts & History | 116 | 4.2% |
| Visual & Performing Arts | 105 | 3.8% |
| Communications | 63 | 2.3% |
| Arts & Humanities | 188 | 6.9% |
| Total | 2,743 | 100.0% |
Transportation & Commute in Sikeston
Vehicle Availability by Sex in Sikeston
The most prevalent vehicle ownership categories in Sikeston are males with 2 vehicles (1,736, accounting for 51.7%) and females with 2 vehicles (1,360, making up 51.1%).
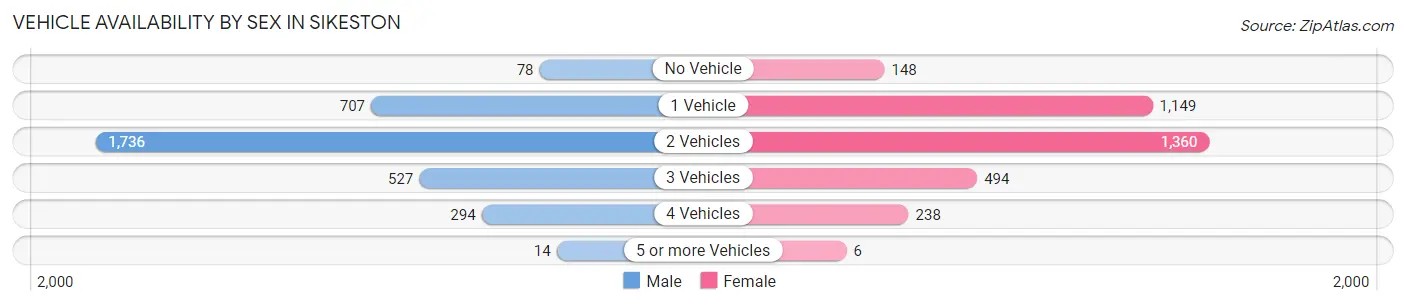
| Vehicles Available | Male | Female |
| No Vehicle | 78 (2.3%) | 148 (4.4%) |
| 1 Vehicle | 707 (21.1%) | 1,149 (33.8%) |
| 2 Vehicles | 1,736 (51.7%) | 1,360 (40.1%) |
| 3 Vehicles | 527 (15.7%) | 494 (14.5%) |
| 4 Vehicles | 294 (8.8%) | 238 (7.0%) |
| 5 or more Vehicles | 14 (0.4%) | 6 (0.2%) |
| Total | 3,356 (100.0%) | 3,395 (100.0%) |
Commute Time in Sikeston
The most frequently occuring commute durations in Sikeston are 5 to 9 minutes (2,051 commuters, 31.4%), 10 to 14 minutes (1,490 commuters, 22.8%), and less than 5 minutes (708 commuters, 10.8%).
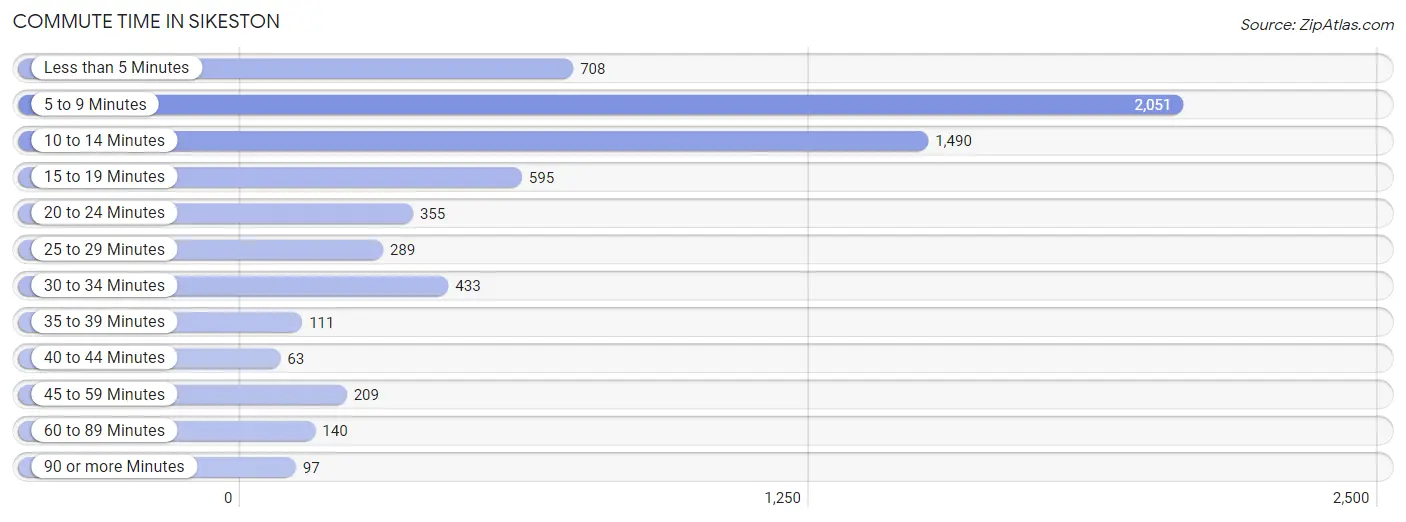
| Commute Time | # Commuters | % Commuters |
| Less than 5 Minutes | 708 | 10.8% |
| 5 to 9 Minutes | 2,051 | 31.4% |
| 10 to 14 Minutes | 1,490 | 22.8% |
| 15 to 19 Minutes | 595 | 9.1% |
| 20 to 24 Minutes | 355 | 5.4% |
| 25 to 29 Minutes | 289 | 4.4% |
| 30 to 34 Minutes | 433 | 6.6% |
| 35 to 39 Minutes | 111 | 1.7% |
| 40 to 44 Minutes | 63 | 1.0% |
| 45 to 59 Minutes | 209 | 3.2% |
| 60 to 89 Minutes | 140 | 2.1% |
| 90 or more Minutes | 97 | 1.5% |
Commute Time by Sex in Sikeston
The most common commute times in Sikeston are 5 to 9 minutes (1,151 commuters, 35.2%) for males and 5 to 9 minutes (900 commuters, 27.5%) for females.
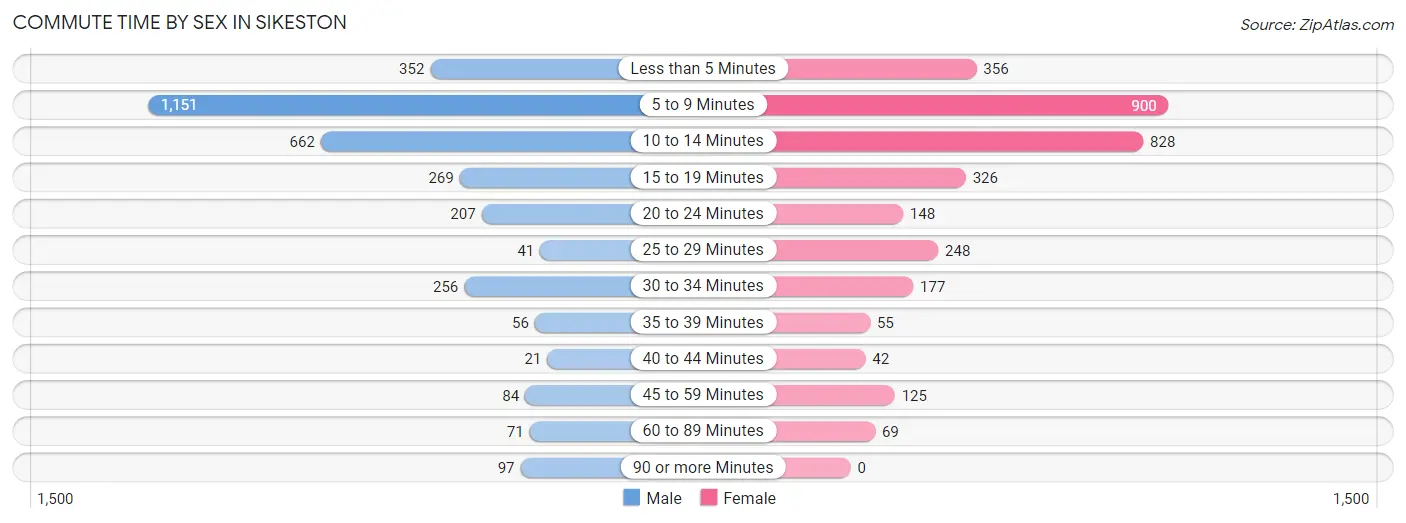
| Commute Time | Male | Female |
| Less than 5 Minutes | 352 (10.8%) | 356 (10.9%) |
| 5 to 9 Minutes | 1,151 (35.2%) | 900 (27.5%) |
| 10 to 14 Minutes | 662 (20.3%) | 828 (25.3%) |
| 15 to 19 Minutes | 269 (8.2%) | 326 (10.0%) |
| 20 to 24 Minutes | 207 (6.3%) | 148 (4.5%) |
| 25 to 29 Minutes | 41 (1.3%) | 248 (7.6%) |
| 30 to 34 Minutes | 256 (7.8%) | 177 (5.4%) |
| 35 to 39 Minutes | 56 (1.7%) | 55 (1.7%) |
| 40 to 44 Minutes | 21 (0.6%) | 42 (1.3%) |
| 45 to 59 Minutes | 84 (2.6%) | 125 (3.8%) |
| 60 to 89 Minutes | 71 (2.2%) | 69 (2.1%) |
| 90 or more Minutes | 97 (3.0%) | 0 (0.0%) |
Time of Departure to Work by Sex in Sikeston
The most frequent times of departure to work in Sikeston are 6:30 AM to 6:59 AM (663, 20.3%) for males and 7:30 AM to 7:59 AM (563, 17.2%) for females.
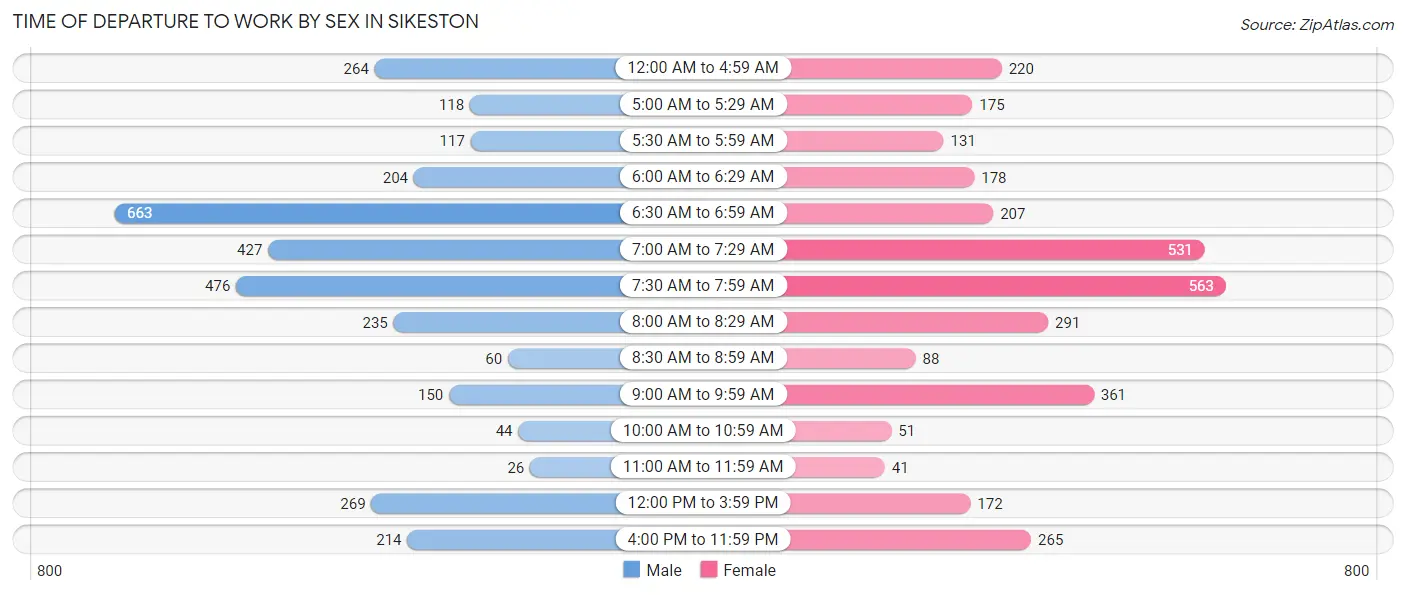
| Time of Departure | Male | Female |
| 12:00 AM to 4:59 AM | 264 (8.1%) | 220 (6.7%) |
| 5:00 AM to 5:29 AM | 118 (3.6%) | 175 (5.3%) |
| 5:30 AM to 5:59 AM | 117 (3.6%) | 131 (4.0%) |
| 6:00 AM to 6:29 AM | 204 (6.2%) | 178 (5.4%) |
| 6:30 AM to 6:59 AM | 663 (20.3%) | 207 (6.3%) |
| 7:00 AM to 7:29 AM | 427 (13.1%) | 531 (16.2%) |
| 7:30 AM to 7:59 AM | 476 (14.6%) | 563 (17.2%) |
| 8:00 AM to 8:29 AM | 235 (7.2%) | 291 (8.9%) |
| 8:30 AM to 8:59 AM | 60 (1.8%) | 88 (2.7%) |
| 9:00 AM to 9:59 AM | 150 (4.6%) | 361 (11.0%) |
| 10:00 AM to 10:59 AM | 44 (1.3%) | 51 (1.6%) |
| 11:00 AM to 11:59 AM | 26 (0.8%) | 41 (1.3%) |
| 12:00 PM to 3:59 PM | 269 (8.2%) | 172 (5.2%) |
| 4:00 PM to 11:59 PM | 214 (6.6%) | 265 (8.1%) |
| Total | 3,267 (100.0%) | 3,274 (100.0%) |
Housing Occupancy in Sikeston
Occupancy by Ownership in Sikeston
Of the total 6,836 dwellings in Sikeston, owner-occupied units account for 4,071 (59.6%), while renter-occupied units make up 2,765 (40.5%).
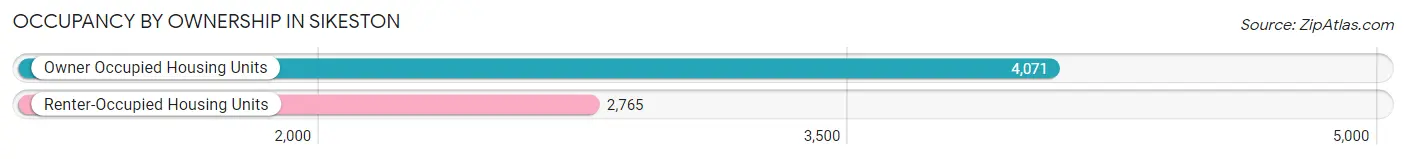
| Occupancy | # Housing Units | % Housing Units |
| Owner Occupied Housing Units | 4,071 | 59.6% |
| Renter-Occupied Housing Units | 2,765 | 40.5% |
| Total Occupied Housing Units | 6,836 | 100.0% |
Occupancy by Household Size in Sikeston
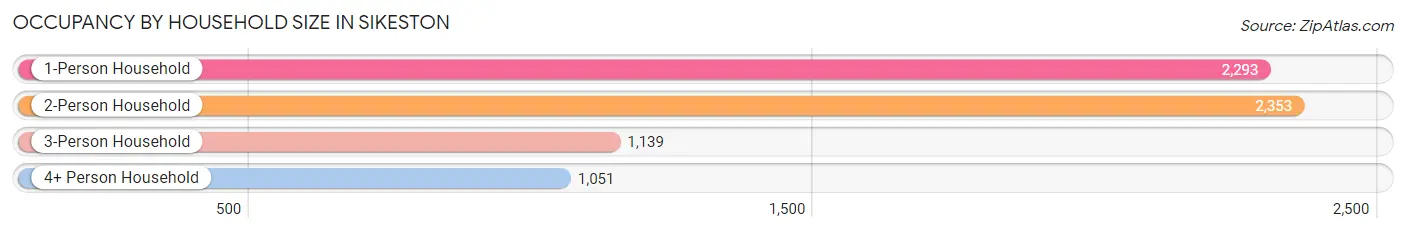
| Household Size | # Housing Units | % Housing Units |
| 1-Person Household | 2,293 | 33.5% |
| 2-Person Household | 2,353 | 34.4% |
| 3-Person Household | 1,139 | 16.7% |
| 4+ Person Household | 1,051 | 15.4% |
| Total Housing Units | 6,836 | 100.0% |
Occupancy by Ownership by Household Size in Sikeston
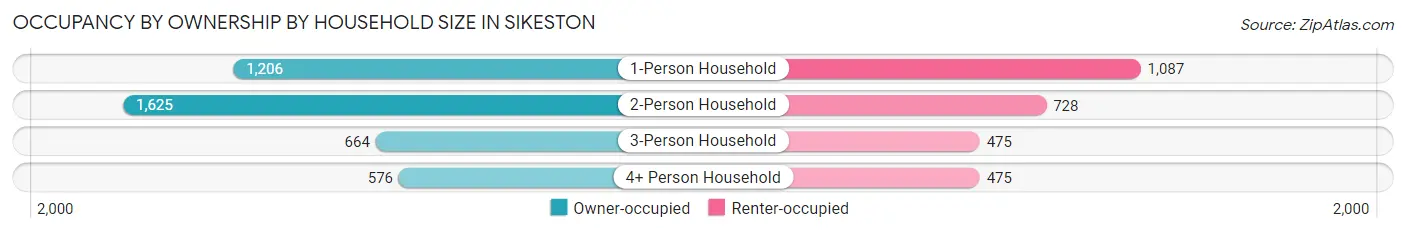
| Household Size | Owner-occupied | Renter-occupied |
| 1-Person Household | 1,206 (52.6%) | 1,087 (47.4%) |
| 2-Person Household | 1,625 (69.1%) | 728 (30.9%) |
| 3-Person Household | 664 (58.3%) | 475 (41.7%) |
| 4+ Person Household | 576 (54.8%) | 475 (45.2%) |
| Total Housing Units | 4,071 (59.6%) | 2,765 (40.5%) |
Occupancy by Educational Attainment in Sikeston
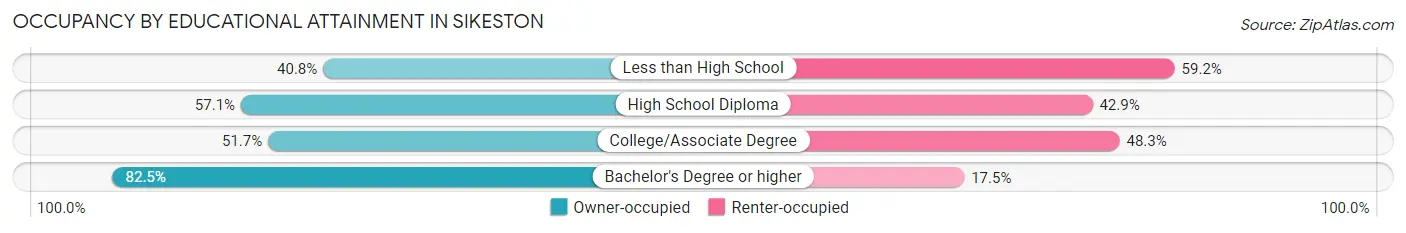
| Household Size | Owner-occupied | Renter-occupied |
| Less than High School | 329 (40.8%) | 477 (59.2%) |
| High School Diploma | 1,402 (57.1%) | 1,053 (42.9%) |
| College/Associate Degree | 1,026 (51.7%) | 957 (48.3%) |
| Bachelor's Degree or higher | 1,314 (82.5%) | 278 (17.5%) |
Occupancy by Age of Householder in Sikeston
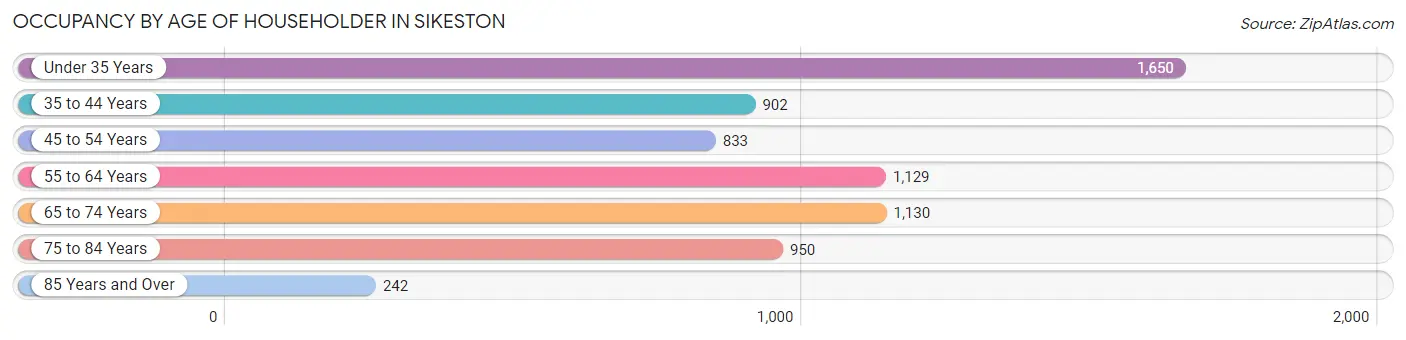
| Age Bracket | # Households | % Households |
| Under 35 Years | 1,650 | 24.1% |
| 35 to 44 Years | 902 | 13.2% |
| 45 to 54 Years | 833 | 12.2% |
| 55 to 64 Years | 1,129 | 16.5% |
| 65 to 74 Years | 1,130 | 16.5% |
| 75 to 84 Years | 950 | 13.9% |
| 85 Years and Over | 242 | 3.5% |
| Total | 6,836 | 100.0% |
Housing Finances in Sikeston
Median Income by Occupancy in Sikeston
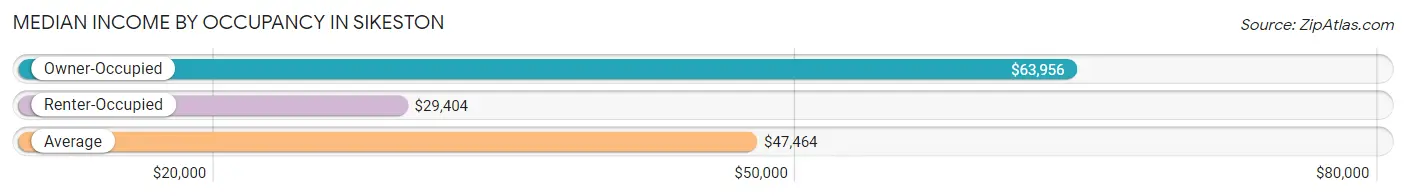
| Occupancy Type | # Households | Median Income |
| Owner-Occupied | 4,071 (59.6%) | $63,956 |
| Renter-Occupied | 2,765 (40.5%) | $29,404 |
| Average | 6,836 (100.0%) | $47,464 |
Occupancy by Householder Income Bracket in Sikeston
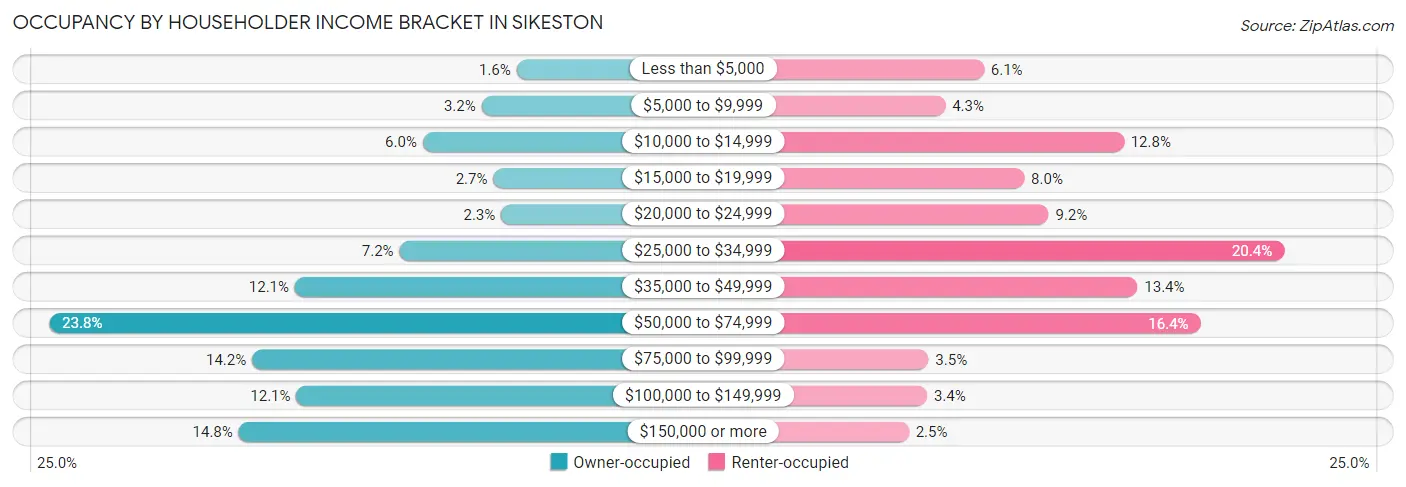
| Income Bracket | Owner-occupied | Renter-occupied |
| Less than $5,000 | 64 (1.6%) | 169 (6.1%) |
| $5,000 to $9,999 | 132 (3.2%) | 118 (4.3%) |
| $10,000 to $14,999 | 246 (6.0%) | 353 (12.8%) |
| $15,000 to $19,999 | 109 (2.7%) | 222 (8.0%) |
| $20,000 to $24,999 | 94 (2.3%) | 254 (9.2%) |
| $25,000 to $34,999 | 291 (7.1%) | 564 (20.4%) |
| $35,000 to $49,999 | 494 (12.1%) | 371 (13.4%) |
| $50,000 to $74,999 | 970 (23.8%) | 454 (16.4%) |
| $75,000 to $99,999 | 577 (14.2%) | 96 (3.5%) |
| $100,000 to $149,999 | 491 (12.1%) | 94 (3.4%) |
| $150,000 or more | 603 (14.8%) | 70 (2.5%) |
| Total | 4,071 (100.0%) | 2,765 (100.0%) |
Monthly Housing Cost Tiers in Sikeston
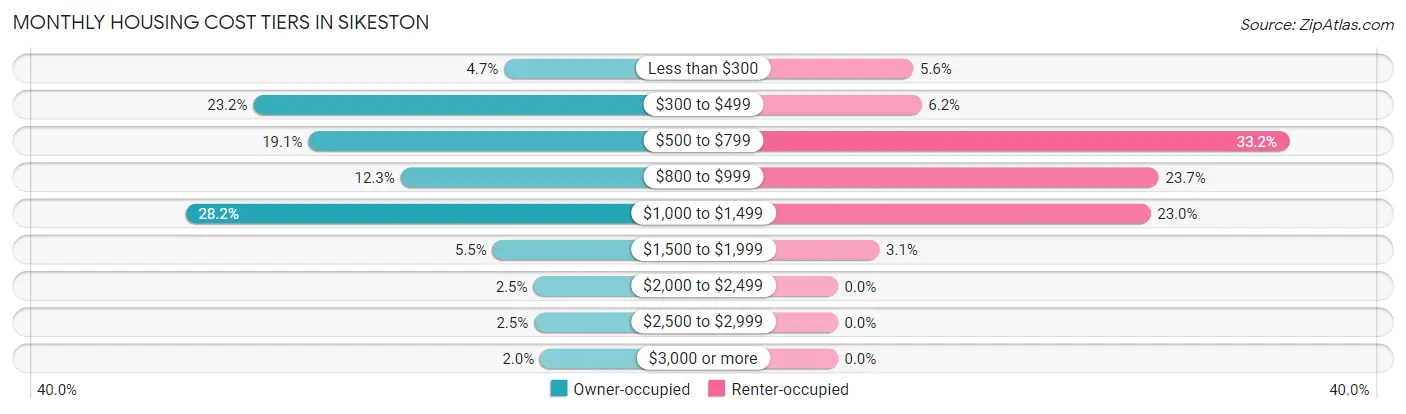
| Monthly Cost | Owner-occupied | Renter-occupied |
| Less than $300 | 191 (4.7%) | 154 (5.6%) |
| $300 to $499 | 943 (23.2%) | 171 (6.2%) |
| $500 to $799 | 778 (19.1%) | 919 (33.2%) |
| $800 to $999 | 501 (12.3%) | 654 (23.6%) |
| $1,000 to $1,499 | 1,146 (28.1%) | 637 (23.0%) |
| $1,500 to $1,999 | 225 (5.5%) | 85 (3.1%) |
| $2,000 to $2,499 | 103 (2.5%) | 0 (0.0%) |
| $2,500 to $2,999 | 101 (2.5%) | 0 (0.0%) |
| $3,000 or more | 83 (2.0%) | 0 (0.0%) |
| Total | 4,071 (100.0%) | 2,765 (100.0%) |
Physical Housing Characteristics in Sikeston
Housing Structures in Sikeston
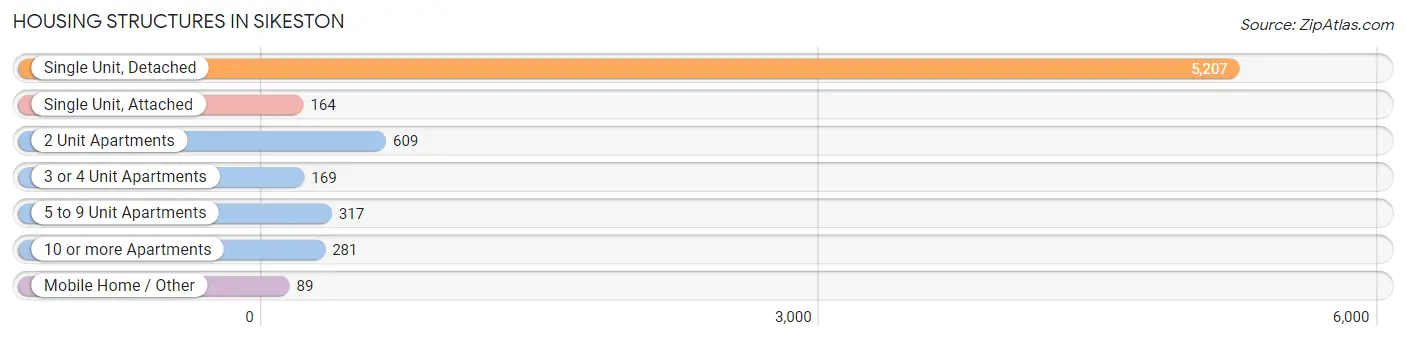
| Structure Type | # Housing Units | % Housing Units |
| Single Unit, Detached | 5,207 | 76.2% |
| Single Unit, Attached | 164 | 2.4% |
| 2 Unit Apartments | 609 | 8.9% |
| 3 or 4 Unit Apartments | 169 | 2.5% |
| 5 to 9 Unit Apartments | 317 | 4.6% |
| 10 or more Apartments | 281 | 4.1% |
| Mobile Home / Other | 89 | 1.3% |
| Total | 6,836 | 100.0% |
Housing Structures by Occupancy in Sikeston
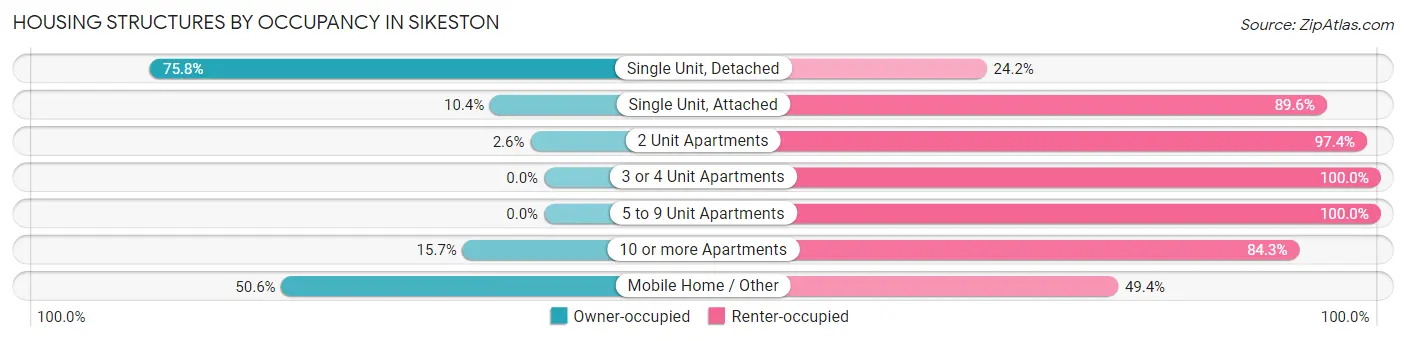
| Structure Type | Owner-occupied | Renter-occupied |
| Single Unit, Detached | 3,949 (75.8%) | 1,258 (24.2%) |
| Single Unit, Attached | 17 (10.4%) | 147 (89.6%) |
| 2 Unit Apartments | 16 (2.6%) | 593 (97.4%) |
| 3 or 4 Unit Apartments | 0 (0.0%) | 169 (100.0%) |
| 5 to 9 Unit Apartments | 0 (0.0%) | 317 (100.0%) |
| 10 or more Apartments | 44 (15.7%) | 237 (84.3%) |
| Mobile Home / Other | 45 (50.6%) | 44 (49.4%) |
| Total | 4,071 (59.6%) | 2,765 (40.5%) |
Housing Structures by Number of Rooms in Sikeston
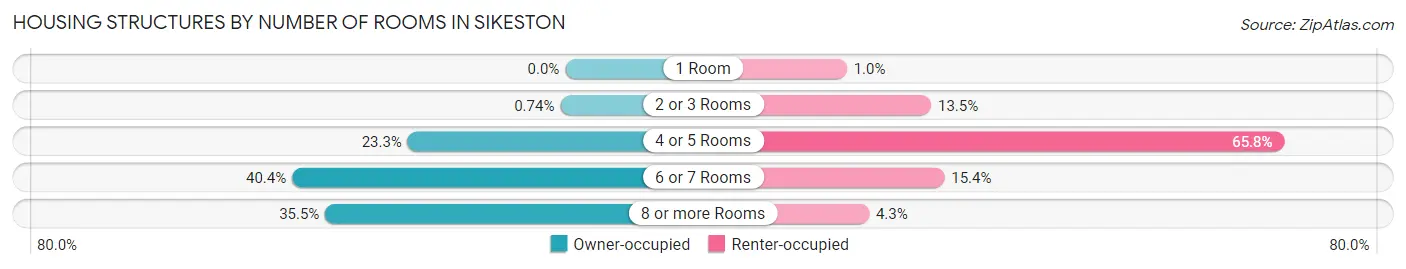
| Number of Rooms | Owner-occupied | Renter-occupied |
| 1 Room | 0 (0.0%) | 28 (1.0%) |
| 2 or 3 Rooms | 30 (0.7%) | 373 (13.5%) |
| 4 or 5 Rooms | 949 (23.3%) | 1,818 (65.7%) |
| 6 or 7 Rooms | 1,646 (40.4%) | 427 (15.4%) |
| 8 or more Rooms | 1,446 (35.5%) | 119 (4.3%) |
| Total | 4,071 (100.0%) | 2,765 (100.0%) |
Housing Structure by Heating Type in Sikeston
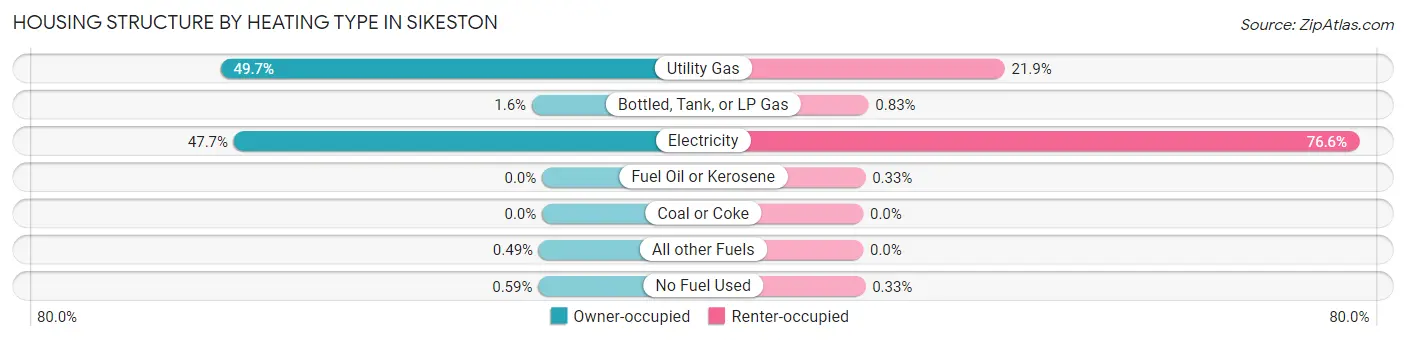
| Heating Type | Owner-occupied | Renter-occupied |
| Utility Gas | 2,023 (49.7%) | 605 (21.9%) |
| Bottled, Tank, or LP Gas | 64 (1.6%) | 23 (0.8%) |
| Electricity | 1,940 (47.6%) | 2,119 (76.6%) |
| Fuel Oil or Kerosene | 0 (0.0%) | 9 (0.3%) |
| Coal or Coke | 0 (0.0%) | 0 (0.0%) |
| All other Fuels | 20 (0.5%) | 0 (0.0%) |
| No Fuel Used | 24 (0.6%) | 9 (0.3%) |
| Total | 4,071 (100.0%) | 2,765 (100.0%) |
Household Vehicle Usage in Sikeston
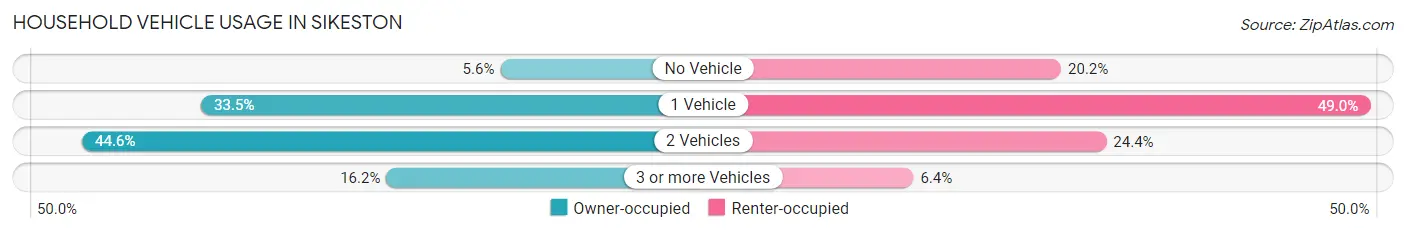
| Vehicles per Household | Owner-occupied | Renter-occupied |
| No Vehicle | 228 (5.6%) | 558 (20.2%) |
| 1 Vehicle | 1,365 (33.5%) | 1,355 (49.0%) |
| 2 Vehicles | 1,817 (44.6%) | 675 (24.4%) |
| 3 or more Vehicles | 661 (16.2%) | 177 (6.4%) |
| Total | 4,071 (100.0%) | 2,765 (100.0%) |
Real Estate & Mortgages in Sikeston
Real Estate and Mortgage Overview in Sikeston
| Characteristic | Without Mortgage | With Mortgage |
| Housing Units | 1,618 | 2,453 |
| Median Property Value | $145,400 | $153,700 |
| Median Household Income | $52,880 | $477 |
| Monthly Housing Costs | $455 | $83 |
| Real Estate Taxes | $1,073 | $31 |
Property Value by Mortgage Status in Sikeston
| Property Value | Without Mortgage | With Mortgage |
| Less than $50,000 | 196 (12.1%) | 132 (5.4%) |
| $50,000 to $99,999 | 380 (23.5%) | 752 (30.7%) |
| $100,000 to $299,999 | 903 (55.8%) | 1,278 (52.1%) |
| $300,000 to $499,999 | 127 (7.9%) | 218 (8.9%) |
| $500,000 to $749,999 | 0 (0.0%) | 66 (2.7%) |
| $750,000 to $999,999 | 0 (0.0%) | 0 (0.0%) |
| $1,000,000 or more | 12 (0.7%) | 7 (0.3%) |
| Total | 1,618 (100.0%) | 2,453 (100.0%) |
Household Income by Mortgage Status in Sikeston
| Household Income | Without Mortgage | With Mortgage |
| Less than $10,000 | 77 (4.8%) | 12 (0.5%) |
| $10,000 to $24,999 | 281 (17.4%) | 119 (4.9%) |
| $25,000 to $34,999 | 154 (9.5%) | 168 (6.9%) |
| $35,000 to $49,999 | 260 (16.1%) | 137 (5.6%) |
| $50,000 to $74,999 | 433 (26.8%) | 234 (9.5%) |
| $75,000 to $99,999 | 143 (8.8%) | 537 (21.9%) |
| $100,000 to $149,999 | 144 (8.9%) | 434 (17.7%) |
| $150,000 or more | 126 (7.8%) | 347 (14.1%) |
| Total | 1,618 (100.0%) | 2,453 (100.0%) |
Property Value to Household Income Ratio in Sikeston
| Value-to-Income Ratio | Without Mortgage | With Mortgage |
| Less than 2.0x | 644 (39.8%) | 76,291 (3,110.1%) |
| 2.0x to 2.9x | 256 (15.8%) | 1,272 (51.8%) |
| 3.0x to 3.9x | 312 (19.3%) | 492 (20.1%) |
| 4.0x or more | 385 (23.8%) | 157 (6.4%) |
| Total | 1,618 (100.0%) | 2,453 (100.0%) |
Real Estate Taxes by Mortgage Status in Sikeston
| Property Taxes | Without Mortgage | With Mortgage |
| Less than $800 | 565 (34.9%) | 0 (0.0%) |
| $800 to $1,499 | 768 (47.5%) | 1,080 (44.0%) |
| $800 to $1,499 | 285 (17.6%) | 768 (31.3%) |
| Total | 1,618 (100.0%) | 2,453 (100.0%) |
Health & Disability in Sikeston
Health Insurance Coverage by Age in Sikeston
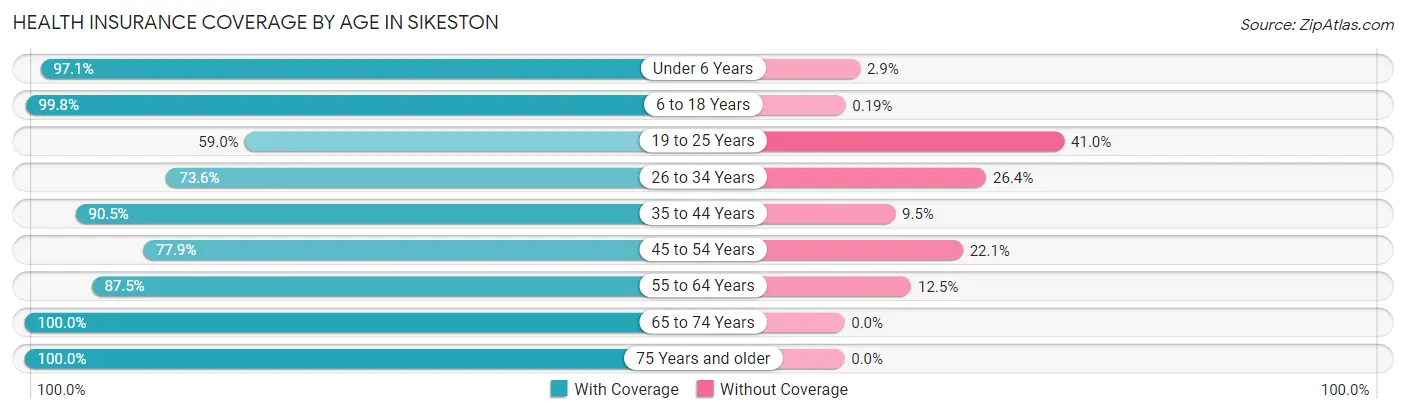
| Age Bracket | With Coverage | Without Coverage |
| Under 6 Years | 1,432 (97.1%) | 43 (2.9%) |
| 6 to 18 Years | 2,673 (99.8%) | 5 (0.2%) |
| 19 to 25 Years | 910 (59.0%) | 632 (41.0%) |
| 26 to 34 Years | 1,447 (73.6%) | 520 (26.4%) |
| 35 to 44 Years | 1,432 (90.5%) | 150 (9.5%) |
| 45 to 54 Years | 1,140 (77.9%) | 323 (22.1%) |
| 55 to 64 Years | 1,600 (87.5%) | 228 (12.5%) |
| 65 to 74 Years | 1,731 (100.0%) | 0 (0.0%) |
| 75 Years and older | 1,599 (100.0%) | 0 (0.0%) |
| Total | 13,964 (88.0%) | 1,901 (12.0%) |
Health Insurance Coverage by Citizenship Status in Sikeston
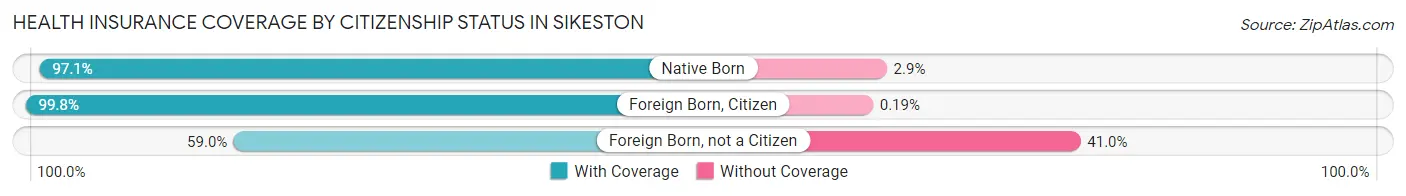
| Citizenship Status | With Coverage | Without Coverage |
| Native Born | 1,432 (97.1%) | 43 (2.9%) |
| Foreign Born, Citizen | 2,673 (99.8%) | 5 (0.2%) |
| Foreign Born, not a Citizen | 910 (59.0%) | 632 (41.0%) |
Health Insurance Coverage by Household Income in Sikeston
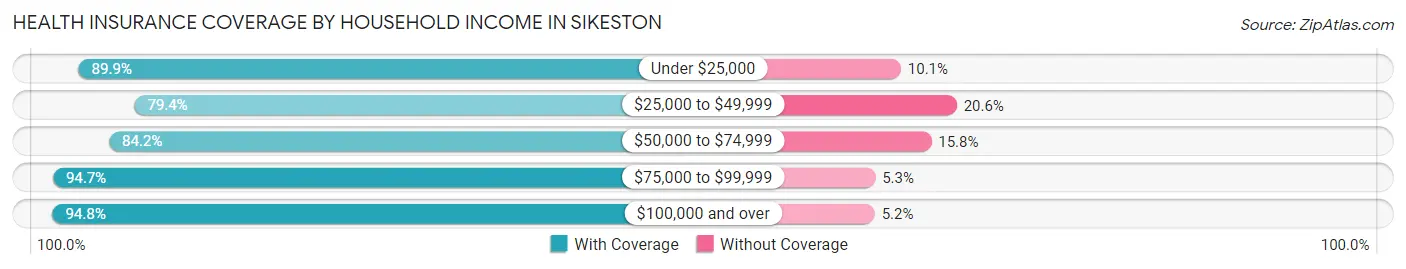
| Household Income | With Coverage | Without Coverage |
| Under $25,000 | 2,750 (89.9%) | 310 (10.1%) |
| $25,000 to $49,999 | 2,742 (79.4%) | 711 (20.6%) |
| $50,000 to $74,999 | 3,116 (84.2%) | 586 (15.8%) |
| $75,000 to $99,999 | 1,728 (94.7%) | 97 (5.3%) |
| $100,000 and over | 3,567 (94.8%) | 197 (5.2%) |
Public vs Private Health Insurance Coverage by Age in Sikeston
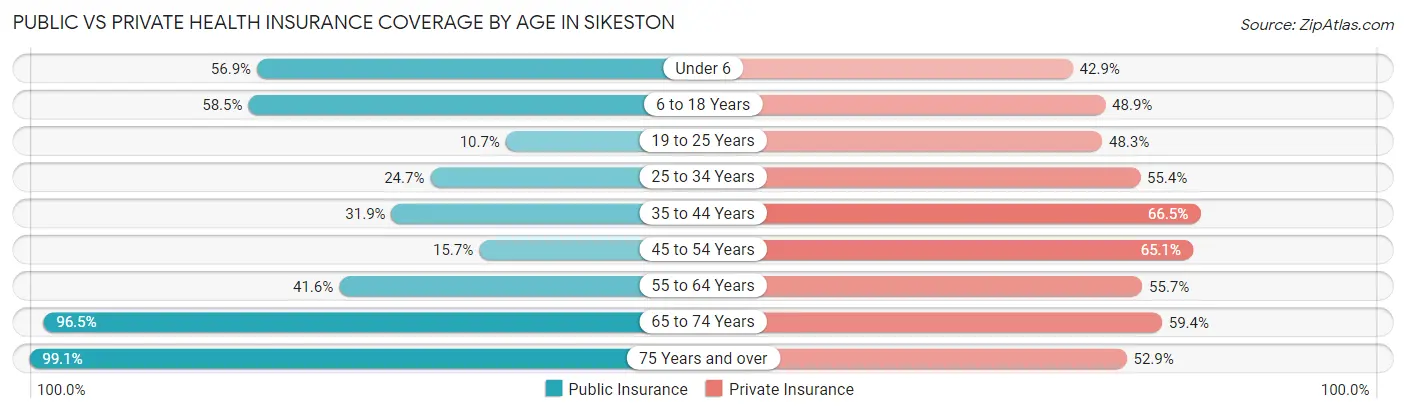
| Age Bracket | Public Insurance | Private Insurance |
| Under 6 | 839 (56.9%) | 632 (42.8%) |
| 6 to 18 Years | 1,566 (58.5%) | 1,309 (48.9%) |
| 19 to 25 Years | 165 (10.7%) | 745 (48.3%) |
| 25 to 34 Years | 486 (24.7%) | 1,089 (55.4%) |
| 35 to 44 Years | 505 (31.9%) | 1,052 (66.5%) |
| 45 to 54 Years | 229 (15.7%) | 953 (65.1%) |
| 55 to 64 Years | 761 (41.6%) | 1,019 (55.7%) |
| 65 to 74 Years | 1,671 (96.5%) | 1,028 (59.4%) |
| 75 Years and over | 1,585 (99.1%) | 845 (52.8%) |
| Total | 7,807 (49.2%) | 8,672 (54.7%) |
Disability Status by Sex by Age in Sikeston
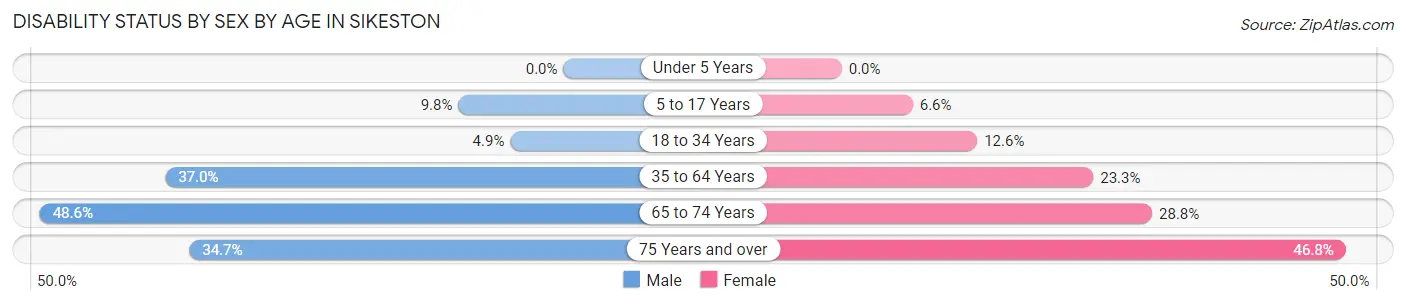
| Age Bracket | Male | Female |
| Under 5 Years | 0 (0.0%) | 0 (0.0%) |
| 5 to 17 Years | 136 (9.8%) | 91 (6.6%) |
| 18 to 34 Years | 86 (4.9%) | 248 (12.6%) |
| 35 to 64 Years | 824 (36.9%) | 617 (23.3%) |
| 65 to 74 Years | 362 (48.6%) | 284 (28.8%) |
| 75 Years and over | 244 (34.7%) | 419 (46.8%) |
Disability Class by Sex by Age in Sikeston
Disability Class: Hearing Difficulty
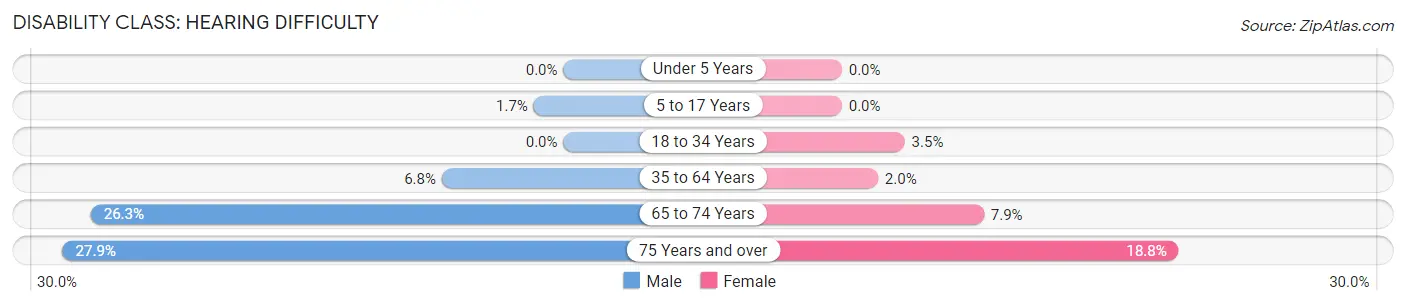
| Age Bracket | Male | Female |
| Under 5 Years | 0 (0.0%) | 0 (0.0%) |
| 5 to 17 Years | 23 (1.7%) | 0 (0.0%) |
| 18 to 34 Years | 0 (0.0%) | 69 (3.5%) |
| 35 to 64 Years | 151 (6.8%) | 53 (2.0%) |
| 65 to 74 Years | 196 (26.3%) | 78 (7.9%) |
| 75 Years and over | 196 (27.9%) | 168 (18.8%) |
Disability Class: Vision Difficulty
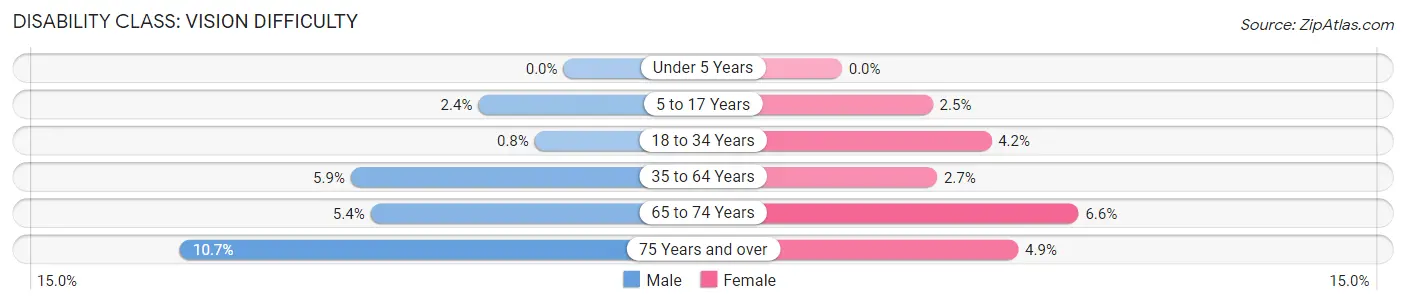
| Age Bracket | Male | Female |
| Under 5 Years | 0 (0.0%) | 0 (0.0%) |
| 5 to 17 Years | 33 (2.4%) | 35 (2.5%) |
| 18 to 34 Years | 14 (0.8%) | 82 (4.2%) |
| 35 to 64 Years | 132 (5.9%) | 70 (2.6%) |
| 65 to 74 Years | 40 (5.4%) | 65 (6.6%) |
| 75 Years and over | 75 (10.7%) | 44 (4.9%) |
Disability Class: Cognitive Difficulty
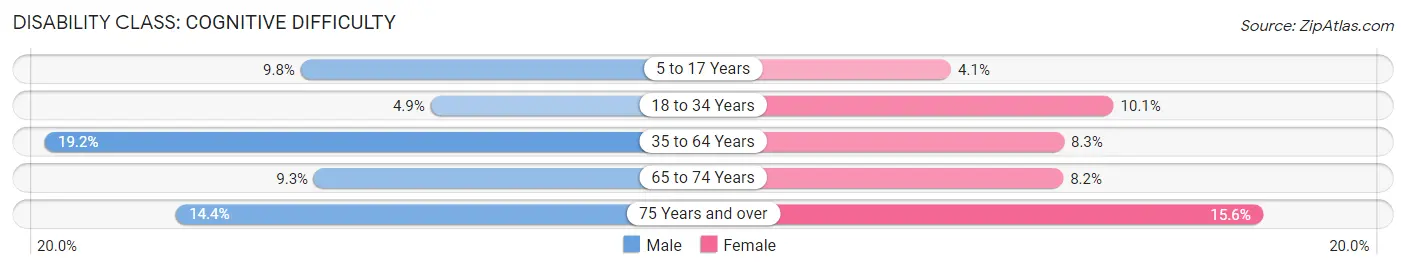
| Age Bracket | Male | Female |
| 5 to 17 Years | 136 (9.8%) | 56 (4.1%) |
| 18 to 34 Years | 86 (4.9%) | 199 (10.1%) |
| 35 to 64 Years | 429 (19.2%) | 218 (8.3%) |
| 65 to 74 Years | 69 (9.3%) | 81 (8.2%) |
| 75 Years and over | 101 (14.4%) | 140 (15.6%) |
Disability Class: Ambulatory Difficulty
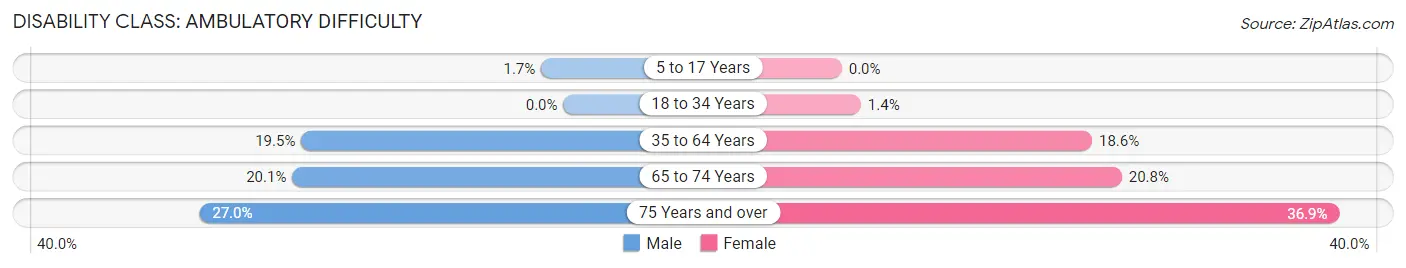
| Age Bracket | Male | Female |
| 5 to 17 Years | 23 (1.7%) | 0 (0.0%) |
| 18 to 34 Years | 0 (0.0%) | 28 (1.4%) |
| 35 to 64 Years | 434 (19.5%) | 491 (18.6%) |
| 65 to 74 Years | 150 (20.1%) | 205 (20.8%) |
| 75 Years and over | 190 (27.0%) | 331 (36.9%) |
Disability Class: Self-Care Difficulty
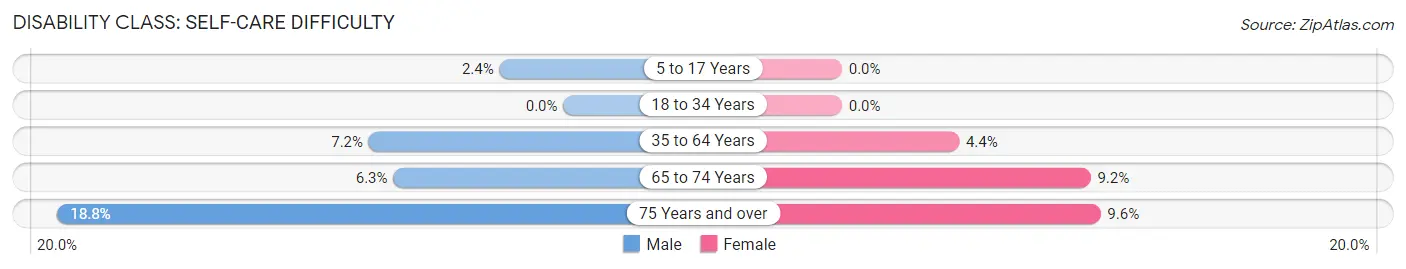
| Age Bracket | Male | Female |
| 5 to 17 Years | 33 (2.4%) | 0 (0.0%) |
| 18 to 34 Years | 0 (0.0%) | 0 (0.0%) |
| 35 to 64 Years | 161 (7.2%) | 115 (4.3%) |
| 65 to 74 Years | 47 (6.3%) | 91 (9.2%) |
| 75 Years and over | 132 (18.8%) | 86 (9.6%) |
Technology Access in Sikeston
Computing Device Access in Sikeston
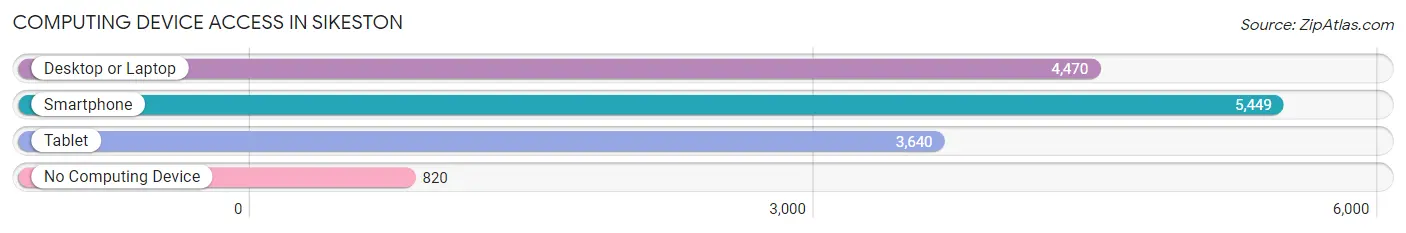
| Device Type | # Households | % Households |
| Desktop or Laptop | 4,470 | 65.4% |
| Smartphone | 5,449 | 79.7% |
| Tablet | 3,640 | 53.2% |
| No Computing Device | 820 | 12.0% |
| Total | 6,836 | 100.0% |
Internet Access in Sikeston
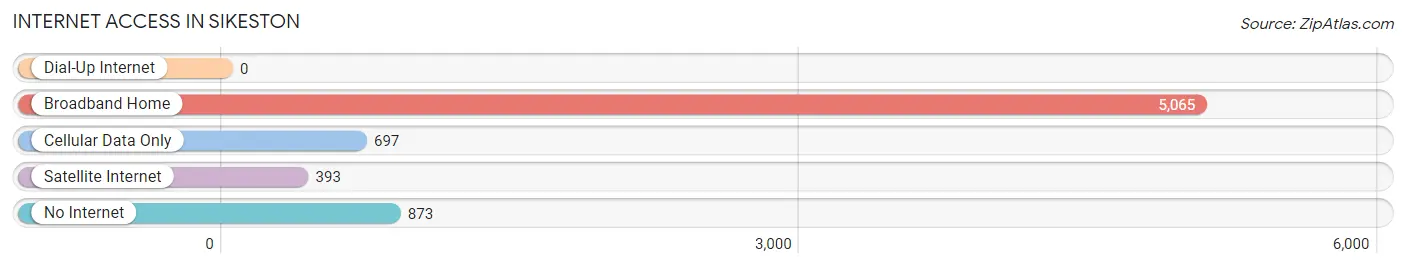
| Internet Type | # Households | % Households |
| Dial-Up Internet | 0 | 0.0% |
| Broadband Home | 5,065 | 74.1% |
| Cellular Data Only | 697 | 10.2% |
| Satellite Internet | 393 | 5.8% |
| No Internet | 873 | 12.8% |
| Total | 6,836 | 100.0% |
Sikeston Summary
Sikeston, Missouri is a city located in the southeastern corner of the state, in Scott County. It is situated along the banks of the Mississippi River, and is the county seat of Scott County. The city has a population of 16,318, according to the 2010 census.
History
Sikeston was founded in 1839 by John Sikes, a farmer from Tennessee. He named the town after himself, and it was incorporated in 1843. The city was an important stop on the Cairo and Fulton Railroad, which connected the Mississippi River to the Arkansas River. This allowed for the transportation of goods and people between the two rivers.
In the late 19th century, Sikeston became a major hub for the cotton industry. The city was home to several cotton gins, and the cotton industry was the main source of employment for the city’s residents.
In the early 20th century, Sikeston experienced a period of growth and development. The city was home to several factories, including a shoe factory, a furniture factory, and a canning factory. The city also had a thriving business district, with several stores and restaurants.
Geography
Sikeston is located in the southeastern corner of Missouri, in Scott County. It is situated along the banks of the Mississippi River, and is the county seat of Scott County. The city has a total area of 8.3 square miles, of which 8.2 square miles is land and 0.1 square miles is water.
The city is located in the Bootheel region of Missouri, and is part of the Mississippi Alluvial Plain. The climate in Sikeston is humid subtropical, with hot, humid summers and mild winters.
Economy
Sikeston’s economy is largely based on agriculture and manufacturing. The city is home to several factories, including a shoe factory, a furniture factory, and a canning factory. The city also has a thriving business district, with several stores and restaurants.
The city is also home to several large employers, including the Sikeston Public School District, the Missouri Delta Medical Center, and the Sikeston Regional Airport.
Demographics
According to the 2010 census, the population of Sikeston was 16,318. The racial makeup of the city was 79.2% White, 17.7% African American, 0.3% Native American, 0.5% Asian, 0.1% Pacific Islander, 0.7% from other races, and 1.5% from two or more races. Hispanic or Latino of any race were 2.2% of the population.
The median income for a household in the city was $30,945, and the median income for a family was $37,945. The per capita income for the city was $17,845. About 17.2% of families and 20.3% of the population were below the poverty line, including 28.2% of those under age 18 and 14.2% of those age 65 or over.
Common Questions
What is the Total Population of Sikeston?
Total Population of Sikeston is 16,146.
What is the Total Male Population of Sikeston?
Total Male Population of Sikeston is 7,503.
What is the Total Female Population of Sikeston?
Total Female Population of Sikeston is 8,643.
What is the Ratio of Males per 100 Females in Sikeston?
There are 86.81 Males per 100 Females in Sikeston.
What is the Ratio of Females per 100 Males in Sikeston?
There are 115.19 Females per 100 Males in Sikeston.
What is the Median Population Age in Sikeston?
Median Population Age in Sikeston is 37.3 Years.
What is the Average Family Size in Sikeston
Average Family Size in Sikeston is 2.9 People.
What is the Average Household Size in Sikeston
Average Household Size in Sikeston is 2.3 People.
What is Per Capita Income in Sikeston?
Per Capita income in Sikeston is $29,247.
What is the Median Family Income in Sikeston?
Median Family Income in Sikeston is $60,591.
What is the Median Household income in Sikeston?
Median Household Income in Sikeston is $47,464.
What is Income or Wage Gap in Sikeston?
Income or Wage Gap in Sikeston is 22.4%.
Women in Sikeston earn 77.6 cents for every dollar earned by a man.
What is Family Income Deficit in Sikeston?
Family Income Deficit in Sikeston is $9,846.
Families that are below poverty line in Sikeston earn $9,846 less on average than the poverty threshold level.
What is Inequality or Gini Index in Sikeston?
Inequality or Gini Index in Sikeston is 0.49.
How Large is the Labor Force in Sikeston?
There are 7,037 People in the Labor Forcein in Sikeston.
What is the Percentage of People in the Labor Force in Sikeston?
56.3% of People are in the Labor Force in Sikeston.
What is the Unemployment Rate in Sikeston?
Unemployment Rate in Sikeston is 2.9%.