Windfall City, IN
Windfall City Map
Windfall City Overview
740
TOTAL POPULATION
324
MALE POPULATION
416
FEMALE POPULATION
77.88
MALES / 100 FEMALES
128.40
FEMALES / 100 MALES
36.7
MEDIAN AGE
2.7
AVG FAMILY SIZE
2.2
AVG HOUSEHOLD SIZE
$24,979
PER CAPITA INCOME
$49,567
AVG FAMILY INCOME
$47,576
AVG HOUSEHOLD INCOME
58.9%
WAGE / INCOME GAP [ % ]
41.1¢/ $1
WAGE / INCOME GAP [ $ ]
0.42
INEQUALITY / GINI INDEX
368
LABOR FORCE [ PEOPLE ]
58.0%
PERCENT IN LABOR FORCE
0.5%
UNEMPLOYMENT RATE
Race in Windfall City
The most populous races in Windfall City are White / Caucasian (703 | 95.0%), Hispanic or Latino (114 | 15.4%), and Two or more Races (21 | 2.8%).
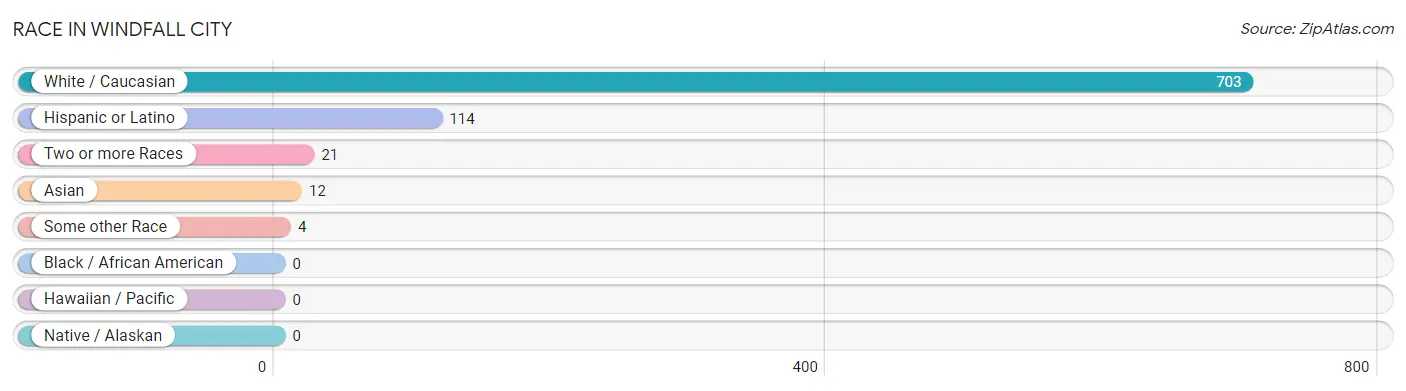
| Race | # Population | % Population |
| Asian | 12 | 1.6% |
| Black / African American | 0 | 0.0% |
| Hawaiian / Pacific | 0 | 0.0% |
| Hispanic or Latino | 114 | 15.4% |
| Native / Alaskan | 0 | 0.0% |
| White / Caucasian | 703 | 95.0% |
| Two or more Races | 21 | 2.8% |
| Some other Race | 4 | 0.5% |
| Total | 740 | 100.0% |
Ancestry in Windfall City
The most populous ancestries reported in Windfall City are German (109 | 14.7%), American (72 | 9.7%), English (61 | 8.2%), Mexican (61 | 8.2%), and Spanish (53 | 7.2%), together accounting for 48.1% of all Windfall City residents.
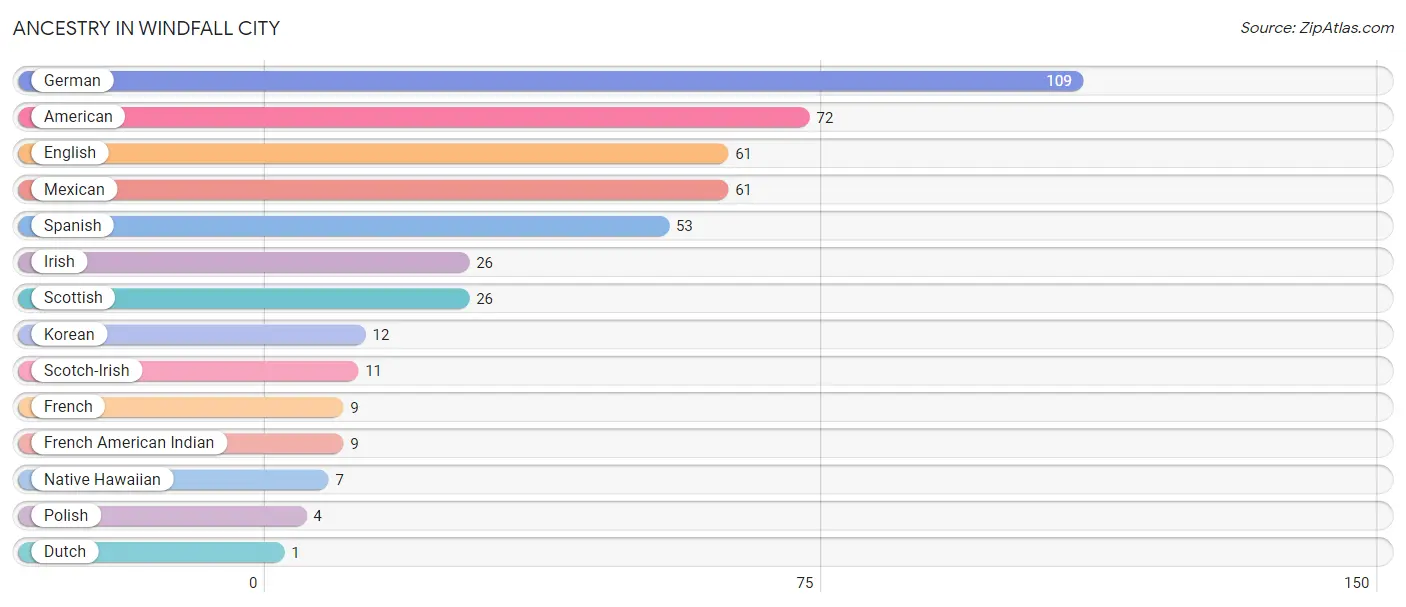
| Ancestry | # Population | % Population |
| American | 72 | 9.7% |
| Dutch | 1 | 0.1% |
| English | 61 | 8.2% |
| French | 9 | 1.2% |
| French American Indian | 9 | 1.2% |
| German | 109 | 14.7% |
| Irish | 26 | 3.5% |
| Korean | 12 | 1.6% |
| Mexican | 61 | 8.2% |
| Native Hawaiian | 7 | 0.9% |
| Polish | 4 | 0.5% |
| Scotch-Irish | 11 | 1.5% |
| Scottish | 26 | 3.5% |
| Spanish | 53 | 7.2% | View All 14 Rows |
Immigrants in Windfall City

| Immigration Origin | # Population | % Population | View All 0 Rows |
Sex and Age in Windfall City
Sex and Age in Windfall City
The most populous age groups in Windfall City are 65 to 69 Years (54 | 16.7%) for men and 15 to 19 Years (55 | 13.2%) for women.
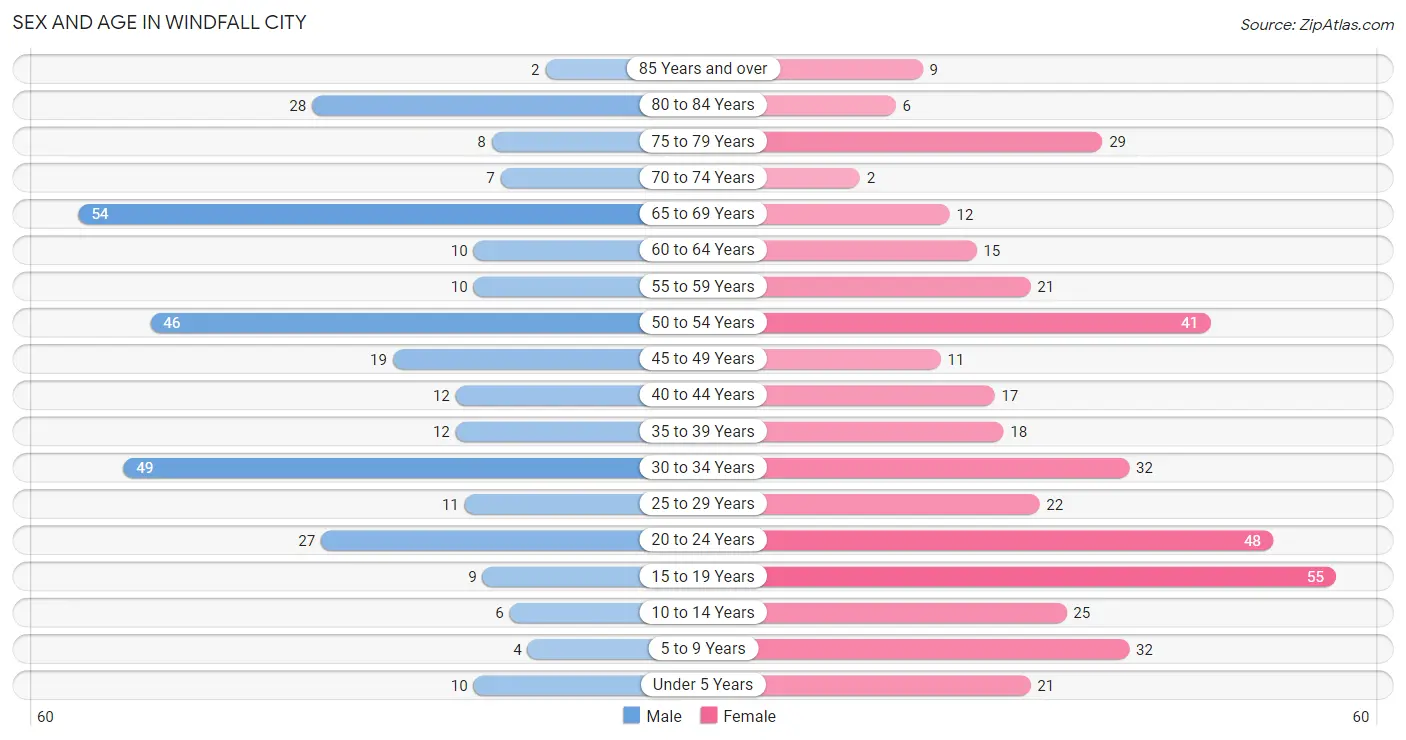
| Age Bracket | Male | Female |
| Under 5 Years | 10 (3.1%) | 21 (5.1%) |
| 5 to 9 Years | 4 (1.2%) | 32 (7.7%) |
| 10 to 14 Years | 6 (1.8%) | 25 (6.0%) |
| 15 to 19 Years | 9 (2.8%) | 55 (13.2%) |
| 20 to 24 Years | 27 (8.3%) | 48 (11.5%) |
| 25 to 29 Years | 11 (3.4%) | 22 (5.3%) |
| 30 to 34 Years | 49 (15.1%) | 32 (7.7%) |
| 35 to 39 Years | 12 (3.7%) | 18 (4.3%) |
| 40 to 44 Years | 12 (3.7%) | 17 (4.1%) |
| 45 to 49 Years | 19 (5.9%) | 11 (2.6%) |
| 50 to 54 Years | 46 (14.2%) | 41 (9.9%) |
| 55 to 59 Years | 10 (3.1%) | 21 (5.1%) |
| 60 to 64 Years | 10 (3.1%) | 15 (3.6%) |
| 65 to 69 Years | 54 (16.7%) | 12 (2.9%) |
| 70 to 74 Years | 7 (2.2%) | 2 (0.5%) |
| 75 to 79 Years | 8 (2.5%) | 29 (7.0%) |
| 80 to 84 Years | 28 (8.6%) | 6 (1.4%) |
| 85 Years and over | 2 (0.6%) | 9 (2.2%) |
| Total | 324 (100.0%) | 416 (100.0%) |
Families and Households in Windfall City
Median Family Size in Windfall City
The median family size in Windfall City is 2.72 persons per family, with single female/mother families (23 | 12.2%) accounting for the largest median family size of 3.17 persons per family. On the other hand, married-couple families (123 | 65.1%) represent the smallest median family size with 2.63 persons per family.
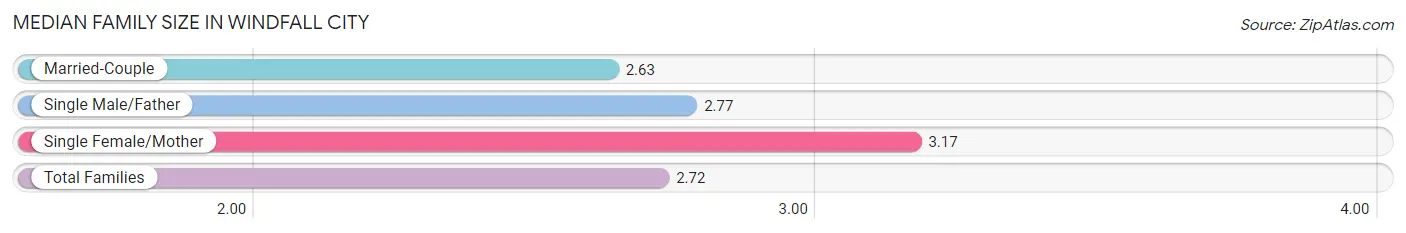
| Family Type | # Families | Family Size |
| Married-Couple | 123 (65.1%) | 2.63 |
| Single Male/Father | 43 (22.8%) | 2.77 |
| Single Female/Mother | 23 (12.2%) | 3.17 |
| Total Families | 189 (100.0%) | 2.72 |
Median Household Size in Windfall City
The median household size in Windfall City is 2.24 persons per household, with single female/mother households (23 | 7.0%) accounting for the largest median household size of 3.48 persons per household. non-family households (141 | 42.7%) represent the smallest median household size with 1.43 persons per household.
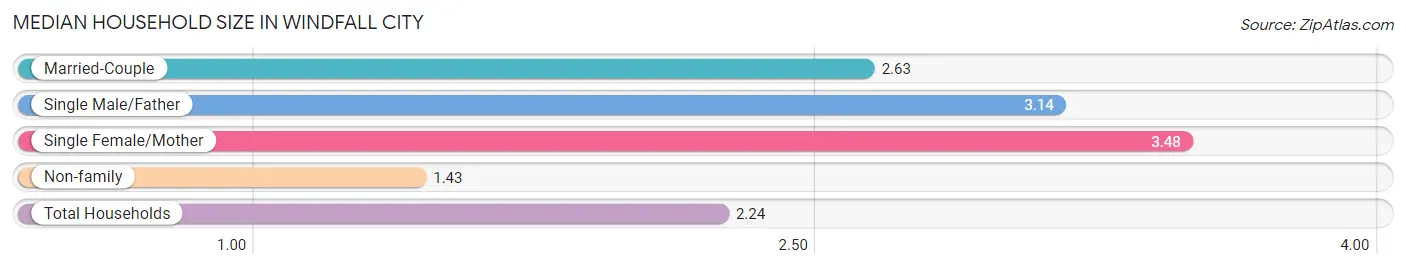
| Household Type | # Households | Household Size |
| Married-Couple | 123 (37.3%) | 2.63 |
| Single Male/Father | 43 (13.0%) | 3.14 |
| Single Female/Mother | 23 (7.0%) | 3.48 |
| Non-family | 141 (42.7%) | 1.43 |
| Total Households | 330 (100.0%) | 2.24 |
Household Size by Marriage Status in Windfall City
Out of a total of 330 households in Windfall City, 189 (57.3%) are family households, while 141 (42.7%) are nonfamily households. The most numerous type of family households are 2-person households, comprising 73, and the most common type of nonfamily households are 1-person households, comprising 92.
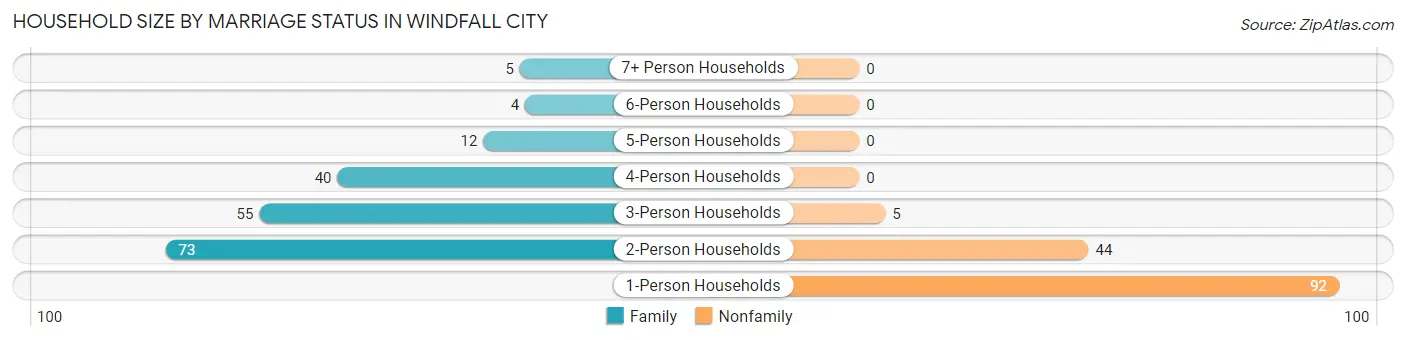
| Household Size | Family Households | Nonfamily Households |
| 1-Person Households | - | 92 (27.9%) |
| 2-Person Households | 73 (22.1%) | 44 (13.3%) |
| 3-Person Households | 55 (16.7%) | 5 (1.5%) |
| 4-Person Households | 40 (12.1%) | 0 (0.0%) |
| 5-Person Households | 12 (3.6%) | 0 (0.0%) |
| 6-Person Households | 4 (1.2%) | 0 (0.0%) |
| 7+ Person Households | 5 (1.5%) | 0 (0.0%) |
| Total | 189 (57.3%) | 141 (42.7%) |
Female Fertility in Windfall City
Fertility by Age in Windfall City
Average fertility rate in Windfall City is 74.0 births per 1,000 women. Women in the age bracket of 15 to 19 years have the highest fertility rate with 109.0 births per 1,000 women. Women in the age bracket of 20 to 34 years acount for 60.0% of all women with births.
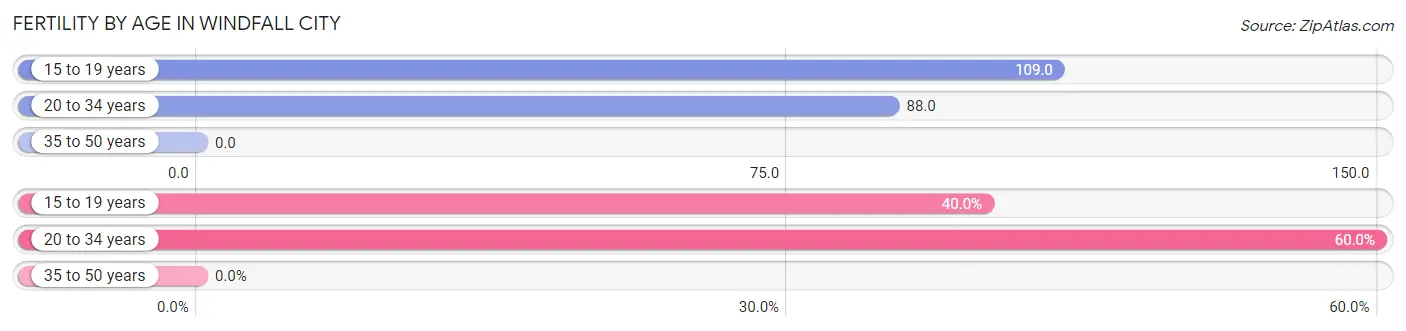
| Age Bracket | Women with Births | Births / 1,000 Women |
| 15 to 19 years | 6 (40.0%) | 109.0 |
| 20 to 34 years | 9 (60.0%) | 88.0 |
| 35 to 50 years | 0 (0.0%) | 0.0 |
| Total | 15 (100.0%) | 74.0 |
Fertility by Age by Marriage Status in Windfall City
13.3% of women with births (15) in Windfall City are married. The highest percentage of unmarried women with births falls into 15 to 19 years age bracket with 100.0% of them unmarried at the time of birth, while the lowest percentage of unmarried women with births belong to 20 to 34 years age bracket with 77.8% of them unmarried.
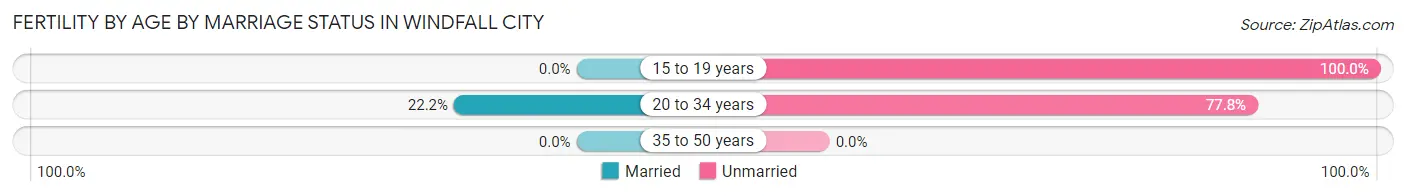
| Age Bracket | Married | Unmarried |
| 15 to 19 years | 0 (0.0%) | 6 (100.0%) |
| 20 to 34 years | 2 (22.2%) | 7 (77.8%) |
| 35 to 50 years | 0 (0.0%) | 0 (0.0%) |
| Total | 2 (13.3%) | 13 (86.7%) |
Fertility by Education in Windfall City
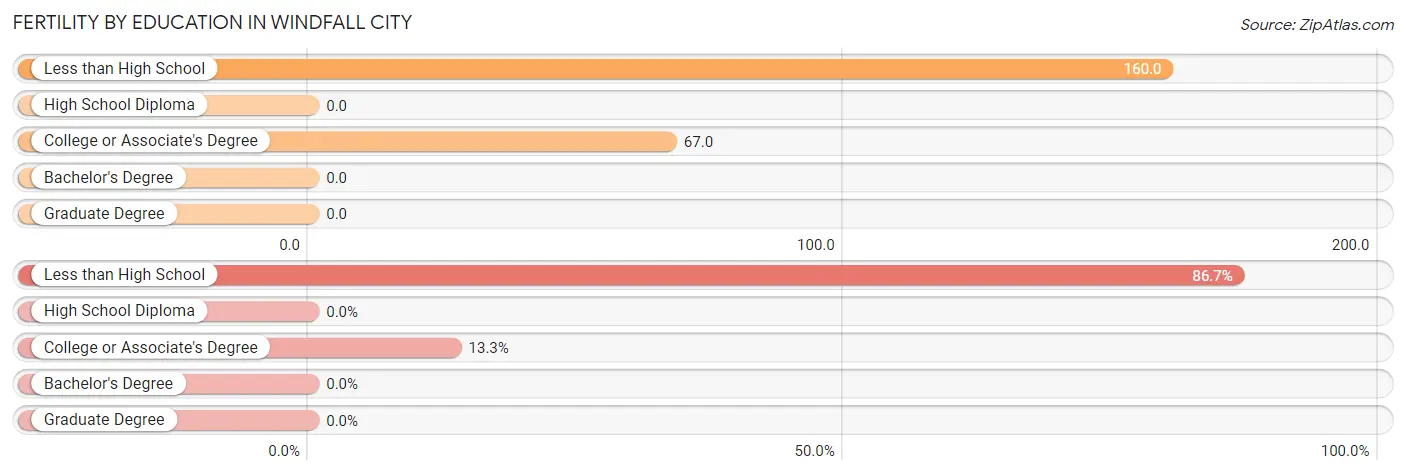
| Educational Attainment | Women with Births | Births / 1,000 Women |
| Less than High School | 13 (86.7%) | 160.0 |
| High School Diploma | 0 (0.0%) | 0.0 |
| College or Associate's Degree | 2 (13.3%) | 67.0 |
| Bachelor's Degree | 0 (0.0%) | 0.0 |
| Graduate Degree | 0 (0.0%) | 0.0 |
| Total | 15 (100.0%) | 74.0 |
Fertility by Education by Marriage Status in Windfall City
86.7% of women with births in Windfall City are unmarried. Women with the educational attainment of college or associate's degree are most likely to be married with 100.0% of them married at childbirth, while women with the educational attainment of less than high school are least likely to be married with 100.0% of them unmarried at childbirth.
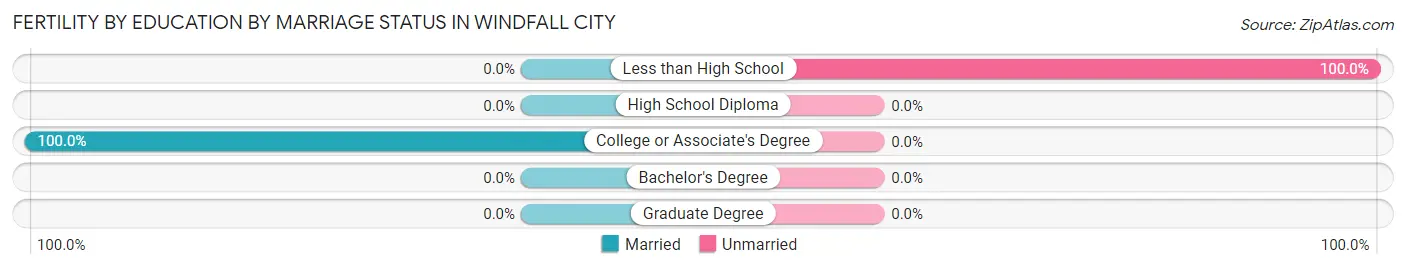
| Educational Attainment | Married | Unmarried |
| Less than High School | 0 (0.0%) | 13 (100.0%) |
| High School Diploma | 0 (0.0%) | 0 (0.0%) |
| College or Associate's Degree | 2 (100.0%) | 0 (0.0%) |
| Bachelor's Degree | 0 (0.0%) | 0 (0.0%) |
| Graduate Degree | 0 (0.0%) | 0 (0.0%) |
| Total | 2 (13.3%) | 13 (86.7%) |
Income in Windfall City
Income Overview in Windfall City
Per Capita Income in Windfall City is $24,979, while median incomes of families and households are $49,567 and $47,576 respectively.
| Characteristic | Number | Measure |
| Per Capita Income | 740 | $24,979 |
| Median Family Income | 189 | $49,567 |
| Mean Family Income | 189 | $67,714 |
| Median Household Income | 330 | $47,576 |
| Mean Household Income | 330 | $56,369 |
| Income Deficit | 189 | $0 |
| Wage / Income Gap (%) | 740 | 58.89% |
| Wage / Income Gap ($) | 740 | 41.11¢ per $1 |
| Gini / Inequality Index | 740 | 0.42 |
Earnings by Sex in Windfall City
Average Earnings in Windfall City are $30,664, $45,605 for men and $18,750 for women, a difference of 58.9%.
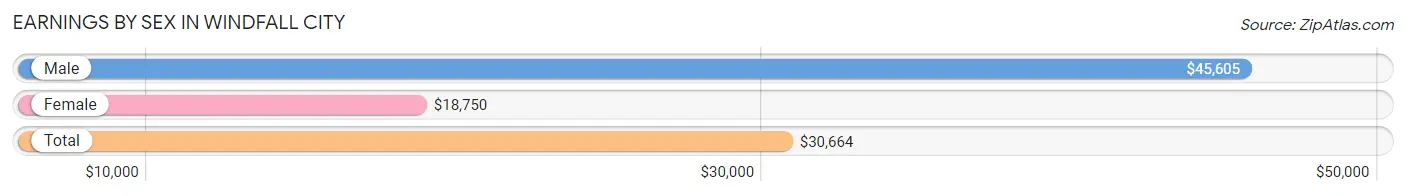
| Sex | Number | Average Earnings |
| Male | 185 (48.0%) | $45,605 |
| Female | 200 (51.9%) | $18,750 |
| Total | 385 (100.0%) | $30,664 |
Earnings by Sex by Income Bracket in Windfall City
The most common earnings brackets in Windfall City are $45,000 to $49,999 for men (33 | 17.8%) and $2,499 or less for women (43 | 21.5%).
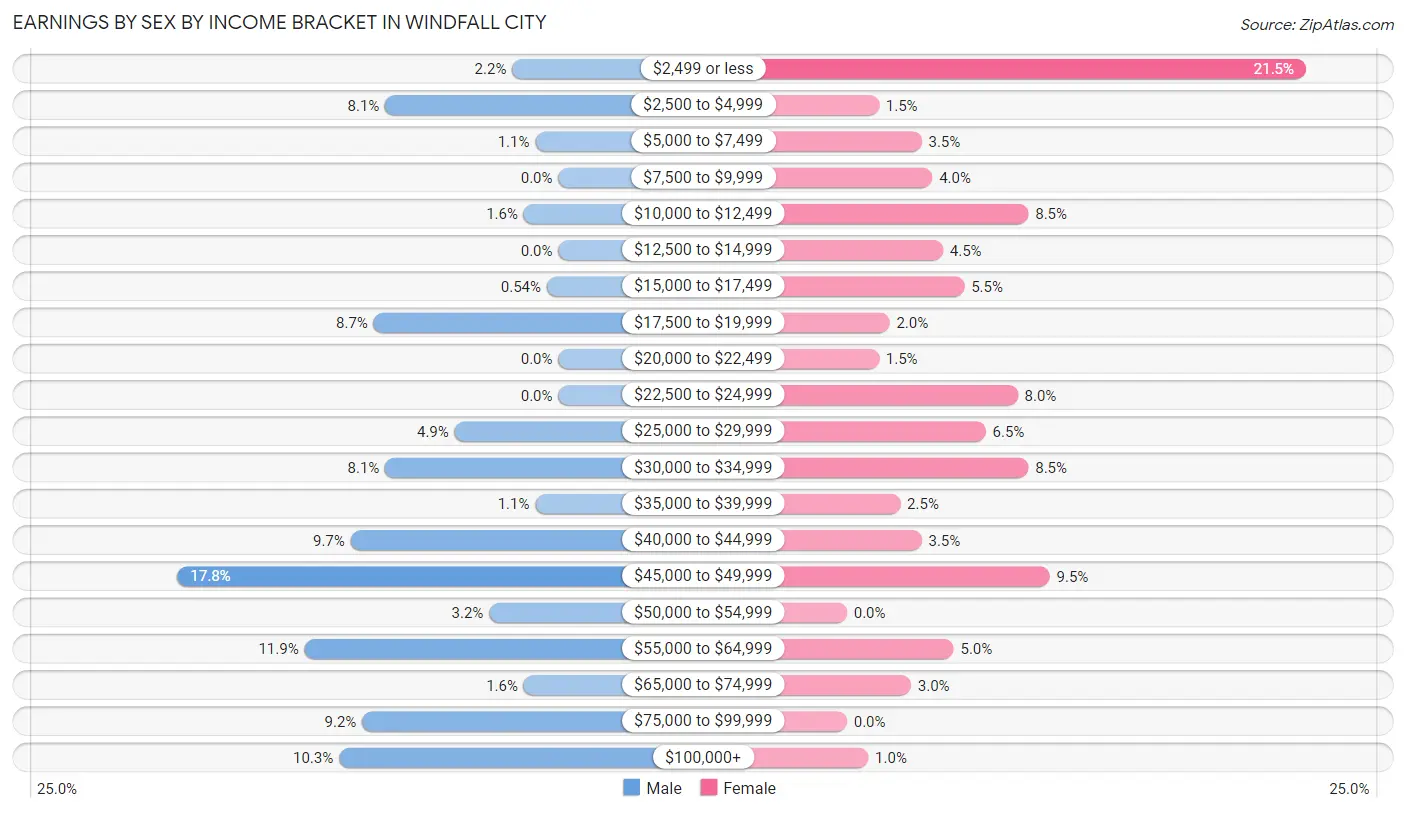
| Income | Male | Female |
| $2,499 or less | 4 (2.2%) | 43 (21.5%) |
| $2,500 to $4,999 | 15 (8.1%) | 3 (1.5%) |
| $5,000 to $7,499 | 2 (1.1%) | 7 (3.5%) |
| $7,500 to $9,999 | 0 (0.0%) | 8 (4.0%) |
| $10,000 to $12,499 | 3 (1.6%) | 17 (8.5%) |
| $12,500 to $14,999 | 0 (0.0%) | 9 (4.5%) |
| $15,000 to $17,499 | 1 (0.5%) | 11 (5.5%) |
| $17,500 to $19,999 | 16 (8.6%) | 4 (2.0%) |
| $20,000 to $22,499 | 0 (0.0%) | 3 (1.5%) |
| $22,500 to $24,999 | 0 (0.0%) | 16 (8.0%) |
| $25,000 to $29,999 | 9 (4.9%) | 13 (6.5%) |
| $30,000 to $34,999 | 15 (8.1%) | 17 (8.5%) |
| $35,000 to $39,999 | 2 (1.1%) | 5 (2.5%) |
| $40,000 to $44,999 | 18 (9.7%) | 7 (3.5%) |
| $45,000 to $49,999 | 33 (17.8%) | 19 (9.5%) |
| $50,000 to $54,999 | 6 (3.2%) | 0 (0.0%) |
| $55,000 to $64,999 | 22 (11.9%) | 10 (5.0%) |
| $65,000 to $74,999 | 3 (1.6%) | 6 (3.0%) |
| $75,000 to $99,999 | 17 (9.2%) | 0 (0.0%) |
| $100,000+ | 19 (10.3%) | 2 (1.0%) |
| Total | 185 (100.0%) | 200 (100.0%) |
Earnings by Sex by Educational Attainment in Windfall City
Average earnings in Windfall City are $45,815 for men and $30,221 for women, a difference of 34.0%. Men with an educational attainment of college or associate's degree enjoy the highest average annual earnings of $97,917, while those with less than high school education earn the least with $31,167. Women with an educational attainment of college or associate's degree earn the most with the average annual earnings of $47,639, while those with less than high school education have the smallest earnings of $11,786.
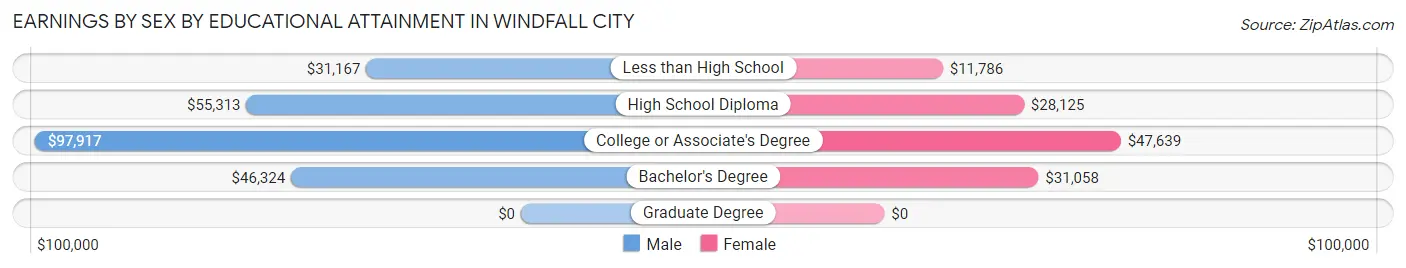
| Educational Attainment | Male Income | Female Income |
| Less than High School | $31,167 | $11,786 |
| High School Diploma | $55,313 | $28,125 |
| College or Associate's Degree | $97,917 | $47,639 |
| Bachelor's Degree | $46,324 | $31,058 |
| Graduate Degree | - | - |
| Total | $45,815 | $30,221 |
Family Income in Windfall City
Family Income Brackets in Windfall City
According to the Windfall City family income data, there are 43 families falling into the $35,000 to $49,999 income range, which is the most common income bracket and makes up 22.8% of all families.
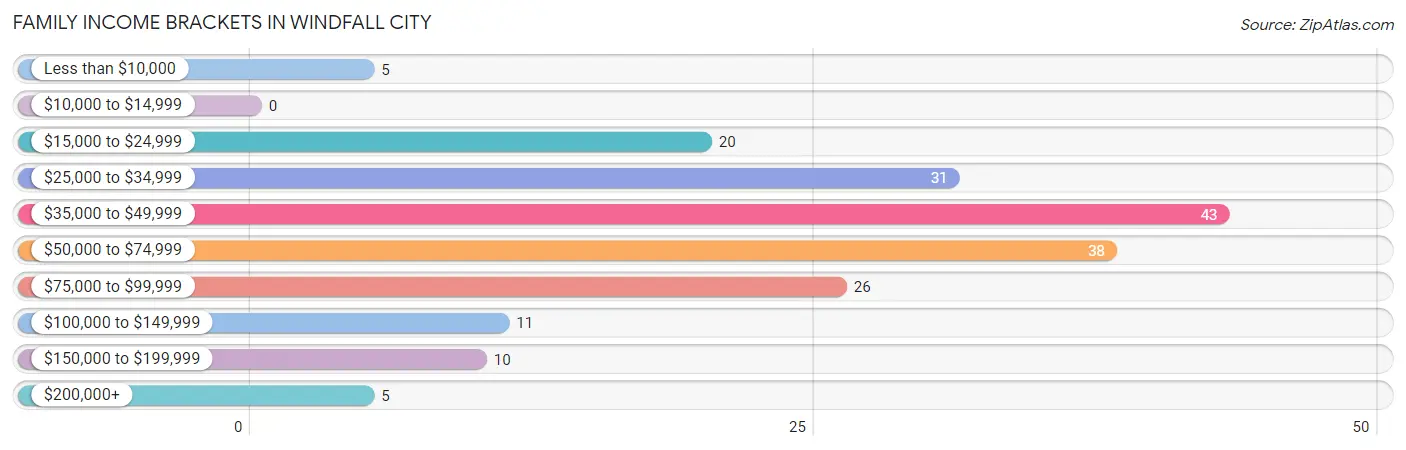
| Income Bracket | # Families | % Families |
| Less than $10,000 | 5 | 2.6% |
| $10,000 to $14,999 | 0 | 0.0% |
| $15,000 to $24,999 | 20 | 10.6% |
| $25,000 to $34,999 | 31 | 16.4% |
| $35,000 to $49,999 | 43 | 22.8% |
| $50,000 to $74,999 | 38 | 20.1% |
| $75,000 to $99,999 | 26 | 13.8% |
| $100,000 to $149,999 | 11 | 5.8% |
| $150,000 to $199,999 | 10 | 5.3% |
| $200,000+ | 5 | 2.6% |
Family Income by Famaliy Size in Windfall City
3-person families (71 | 37.6%) account for the highest median family income in Windfall City with $58,393 per family, while 3-person families (71 | 37.6%) have the highest median income of $19,464 per family member.
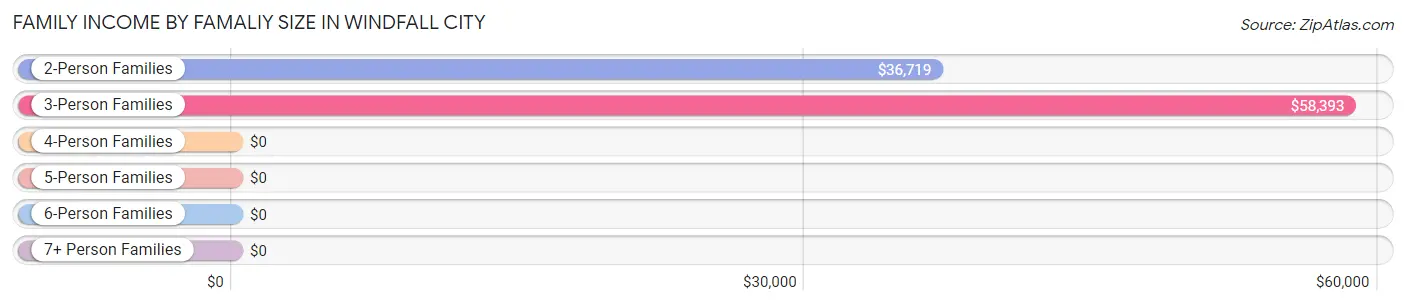
| Income Bracket | # Families | Median Income |
| 2-Person Families | 73 (38.6%) | $36,719 |
| 3-Person Families | 71 (37.6%) | $58,393 |
| 4-Person Families | 26 (13.8%) | $0 |
| 5-Person Families | 10 (5.3%) | $0 |
| 6-Person Families | 4 (2.1%) | $0 |
| 7+ Person Families | 5 (2.6%) | $0 |
| Total | 189 (100.0%) | $49,567 |
Family Income by Number of Earners in Windfall City
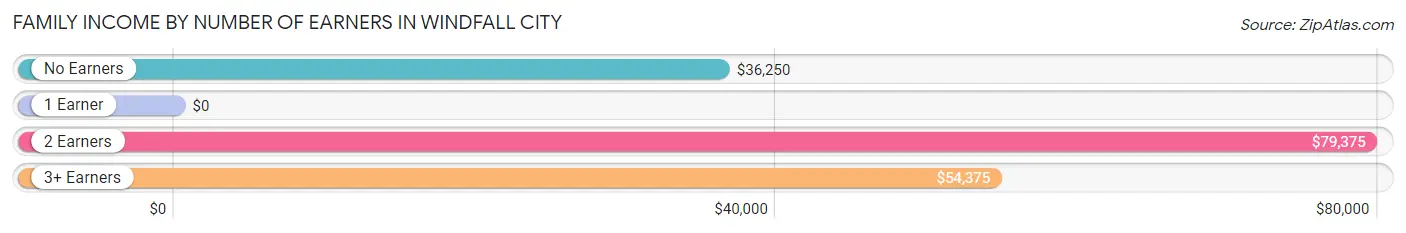
| Number of Earners | # Families | Median Income |
| No Earners | 26 (13.8%) | $36,250 |
| 1 Earner | 87 (46.0%) | $0 |
| 2 Earners | 39 (20.6%) | $79,375 |
| 3+ Earners | 37 (19.6%) | $54,375 |
| Total | 189 (100.0%) | $49,567 |
Household Income in Windfall City
Household Income Brackets in Windfall City
With 69 households falling in the category, the $25,000 to $34,999 income range is the most frequent in Windfall City, accounting for 20.9% of all households.
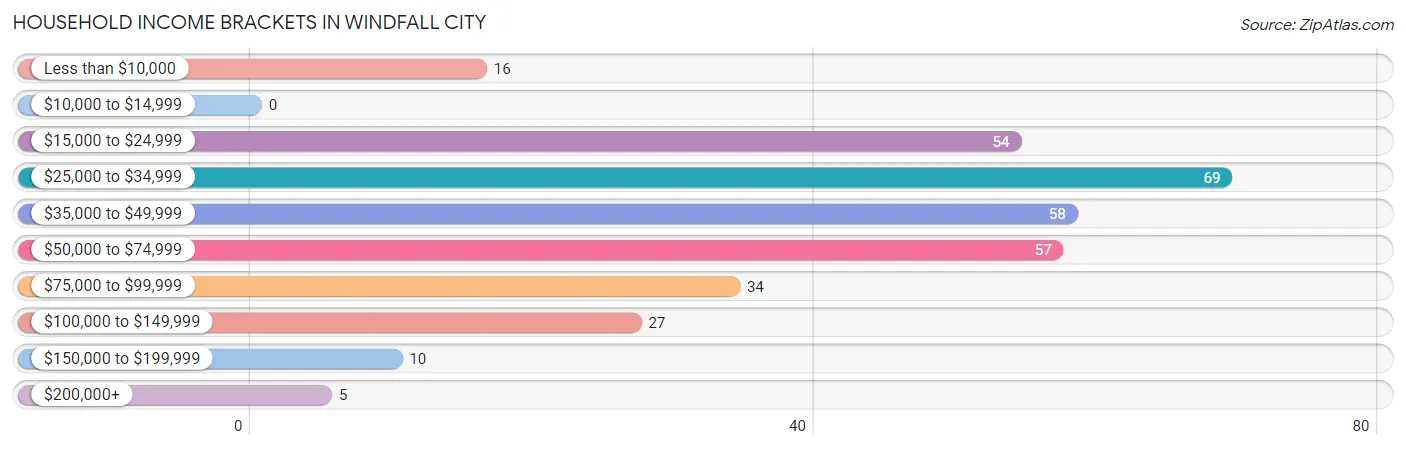
| Income Bracket | # Households | % Households |
| Less than $10,000 | 16 | 4.8% |
| $10,000 to $14,999 | 0 | 0.0% |
| $15,000 to $24,999 | 54 | 16.4% |
| $25,000 to $34,999 | 69 | 20.9% |
| $35,000 to $49,999 | 58 | 17.6% |
| $50,000 to $74,999 | 57 | 17.3% |
| $75,000 to $99,999 | 34 | 10.3% |
| $100,000 to $149,999 | 27 | 8.2% |
| $150,000 to $199,999 | 10 | 3.0% |
| $200,000+ | 5 | 1.5% |
Household Income by Householder Age in Windfall City
The median household income in Windfall City is $47,576, with the highest median household income of $58,750 found in the 25 to 44 years age bracket for the primary householder. A total of 86 households (26.1%) fall into this category. Meanwhile, the 15 to 24 years age bracket for the primary householder has the lowest median household income of $0, with 21 households (6.4%) in this group.
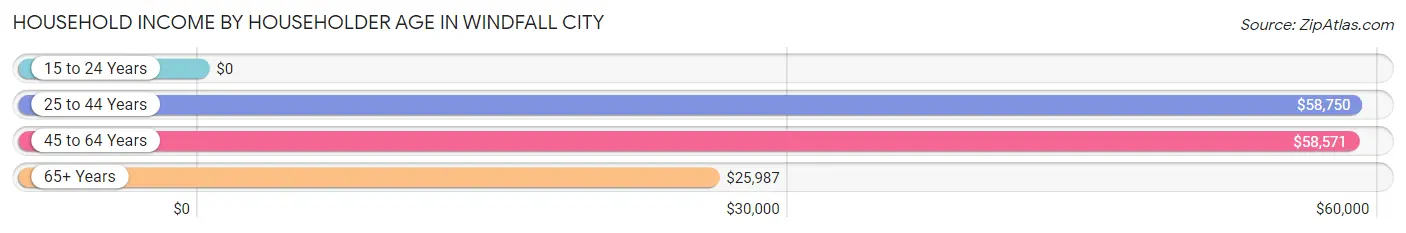
| Income Bracket | # Households | Median Income |
| 15 to 24 Years | 21 (6.4%) | $0 |
| 25 to 44 Years | 86 (26.1%) | $58,750 |
| 45 to 64 Years | 104 (31.5%) | $58,571 |
| 65+ Years | 119 (36.1%) | $25,987 |
| Total | 330 (100.0%) | $47,576 |
Poverty in Windfall City
Income Below Poverty by Sex and Age in Windfall City
With 13.6% poverty level for males and 19.7% for females among the residents of Windfall City, 12 to 14 year old males and 15 year old females are the most vulnerable to poverty, with 4 males (100.0%) and 6 females (100.0%) in their respective age groups living below the poverty level.
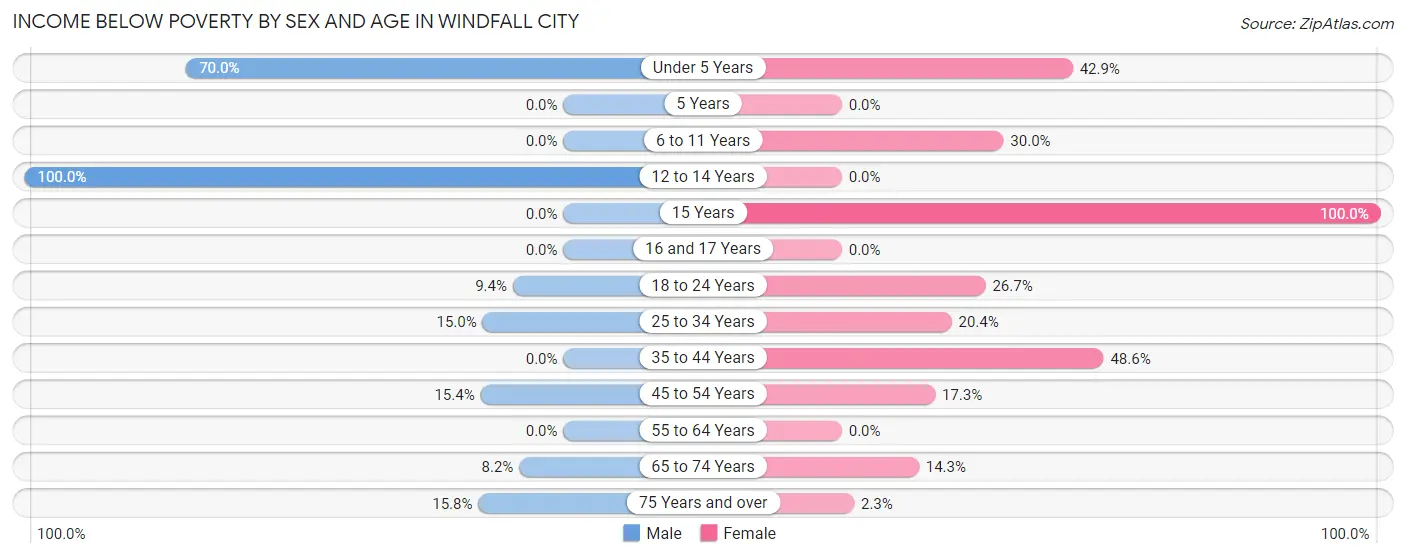
| Age Bracket | Male | Female |
| Under 5 Years | 7 (70.0%) | 9 (42.9%) |
| 5 Years | 0 (0.0%) | 0 (0.0%) |
| 6 to 11 Years | 0 (0.0%) | 6 (30.0%) |
| 12 to 14 Years | 4 (100.0%) | 0 (0.0%) |
| 15 Years | 0 (0.0%) | 6 (100.0%) |
| 16 and 17 Years | 0 (0.0%) | 0 (0.0%) |
| 18 to 24 Years | 3 (9.4%) | 20 (26.7%) |
| 25 to 34 Years | 9 (15.0%) | 11 (20.4%) |
| 35 to 44 Years | 0 (0.0%) | 17 (48.6%) |
| 45 to 54 Years | 10 (15.4%) | 9 (17.3%) |
| 55 to 64 Years | 0 (0.0%) | 0 (0.0%) |
| 65 to 74 Years | 5 (8.2%) | 2 (14.3%) |
| 75 Years and over | 6 (15.8%) | 1 (2.3%) |
| Total | 44 (13.6%) | 81 (19.7%) |
Income Above Poverty by Sex and Age in Windfall City
According to the poverty statistics in Windfall City, males aged 5 years and females aged 5 years are the age groups that are most secure financially, with 100.0% of males and 100.0% of females in these age groups living above the poverty line.
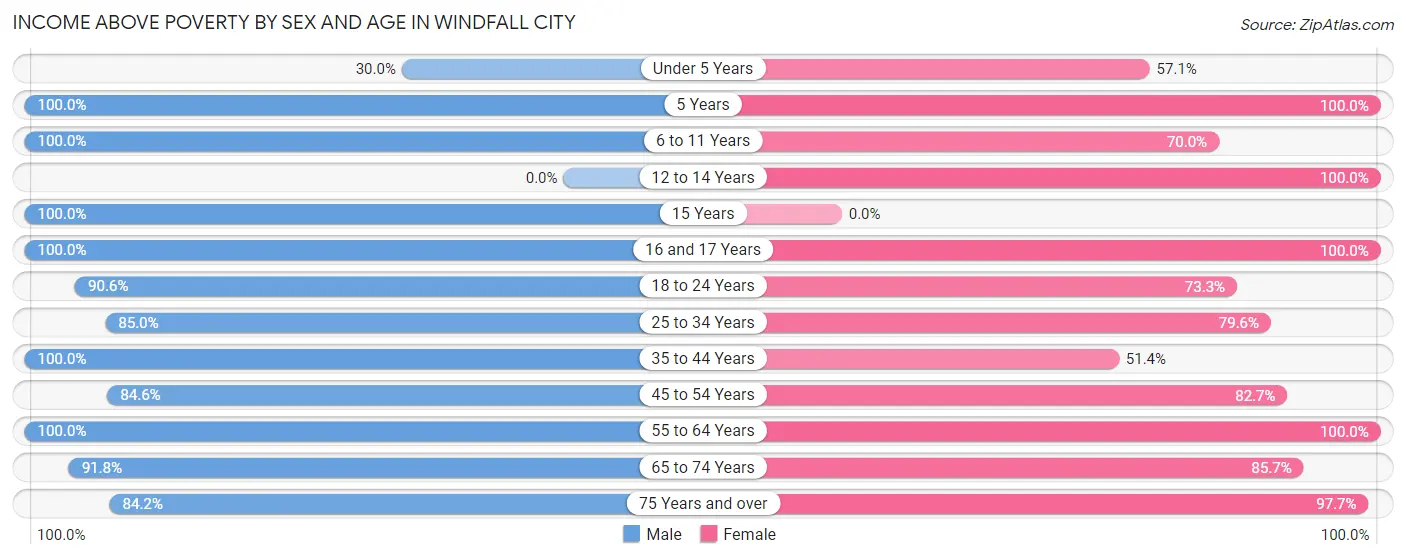
| Age Bracket | Male | Female |
| Under 5 Years | 3 (30.0%) | 12 (57.1%) |
| 5 Years | 3 (100.0%) | 12 (100.0%) |
| 6 to 11 Years | 3 (100.0%) | 14 (70.0%) |
| 12 to 14 Years | 0 (0.0%) | 20 (100.0%) |
| 15 Years | 1 (100.0%) | 0 (0.0%) |
| 16 and 17 Years | 3 (100.0%) | 22 (100.0%) |
| 18 to 24 Years | 29 (90.6%) | 55 (73.3%) |
| 25 to 34 Years | 51 (85.0%) | 43 (79.6%) |
| 35 to 44 Years | 24 (100.0%) | 18 (51.4%) |
| 45 to 54 Years | 55 (84.6%) | 43 (82.7%) |
| 55 to 64 Years | 20 (100.0%) | 36 (100.0%) |
| 65 to 74 Years | 56 (91.8%) | 12 (85.7%) |
| 75 Years and over | 32 (84.2%) | 43 (97.7%) |
| Total | 280 (86.4%) | 330 (80.3%) |
Income Below Poverty Among Married-Couple Families in Windfall City
The poverty statistics for married-couple families in Windfall City show that 1.6% or 2 of the total 123 families live below the poverty line. Families with no children have the highest poverty rate of 2.7%, comprising of 2 families. On the other hand, families with 1 or 2 children have the lowest poverty rate of 0.0%, which includes 0 families.
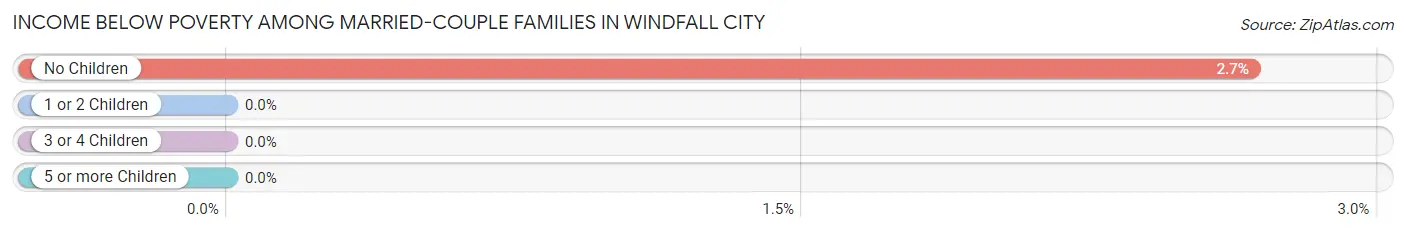
| Children | Above Poverty | Below Poverty |
| No Children | 73 (97.3%) | 2 (2.7%) |
| 1 or 2 Children | 43 (100.0%) | 0 (0.0%) |
| 3 or 4 Children | 5 (100.0%) | 0 (0.0%) |
| 5 or more Children | 0 (0.0%) | 0 (0.0%) |
| Total | 121 (98.4%) | 2 (1.6%) |
Income Below Poverty Among Single-Parent Households in Windfall City
According to the poverty data in Windfall City, 16.3% or 7 single-father households and 34.8% or 8 single-mother households are living below the poverty line. Among single-father households, those with 1 or 2 children have the highest poverty rate, with 7 households (28.0%) experiencing poverty. Likewise, among single-mother households, those with 3 or 4 children have the highest poverty rate, with 5 households (100.0%) falling below the poverty line.
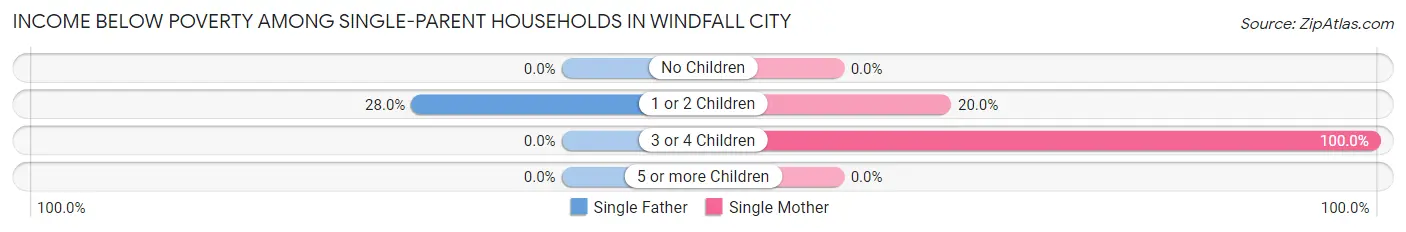
| Children | Single Father | Single Mother |
| No Children | 0 (0.0%) | 0 (0.0%) |
| 1 or 2 Children | 7 (28.0%) | 3 (20.0%) |
| 3 or 4 Children | 0 (0.0%) | 5 (100.0%) |
| 5 or more Children | 0 (0.0%) | 0 (0.0%) |
| Total | 7 (16.3%) | 8 (34.8%) |
Income Below Poverty Among Married-Couple vs Single-Parent Households in Windfall City
The poverty data for Windfall City shows that 2 of the married-couple family households (1.6%) and 15 of the single-parent households (22.7%) are living below the poverty level. Within the married-couple family households, those with no children have the highest poverty rate, with 2 households (2.7%) falling below the poverty line. Among the single-parent households, those with 3 or 4 children have the highest poverty rate, with 5 household (100.0%) living below poverty.
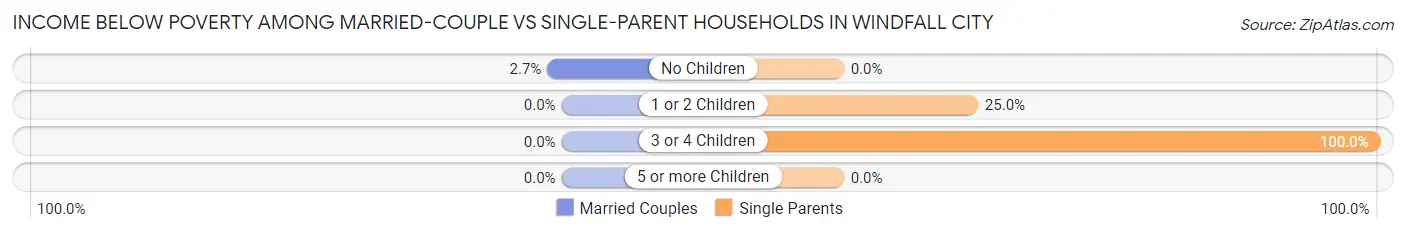
| Children | Married-Couple Families | Single-Parent Households |
| No Children | 2 (2.7%) | 0 (0.0%) |
| 1 or 2 Children | 0 (0.0%) | 10 (25.0%) |
| 3 or 4 Children | 0 (0.0%) | 5 (100.0%) |
| 5 or more Children | 0 (0.0%) | 0 (0.0%) |
| Total | 2 (1.6%) | 15 (22.7%) |
Employment Characteristics in Windfall City
Employment by Class of Employer in Windfall City
Among the 363 employed individuals in Windfall City, private company employees (313 | 86.2%), not-for-profit organizations (15 | 4.1%), and local government employees (13 | 3.6%) make up the most common classes of employment.
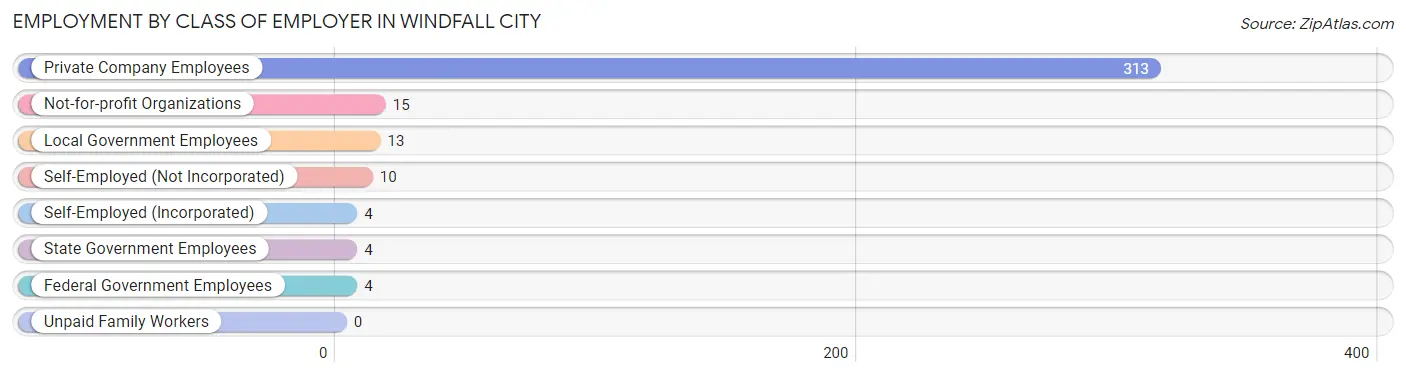
| Employer Class | # Employees | % Employees |
| Private Company Employees | 313 | 86.2% |
| Self-Employed (Incorporated) | 4 | 1.1% |
| Self-Employed (Not Incorporated) | 10 | 2.8% |
| Not-for-profit Organizations | 15 | 4.1% |
| Local Government Employees | 13 | 3.6% |
| State Government Employees | 4 | 1.1% |
| Federal Government Employees | 4 | 1.1% |
| Unpaid Family Workers | 0 | 0.0% |
| Total | 363 | 100.0% |
Employment Status by Age in Windfall City
According to the labor force statistics for Windfall City, out of the total population over 16 years of age (635), 58.0% or 368 individuals are in the labor force, with 0.5% or 2 of them unemployed. The age group with the highest labor force participation rate is 25 to 29 years, with 100.0% or 33 individuals in the labor force. Within the labor force, the 25 to 29 years age range has the highest percentage of unemployed individuals, with 3.0% or 1 of them being unemployed.
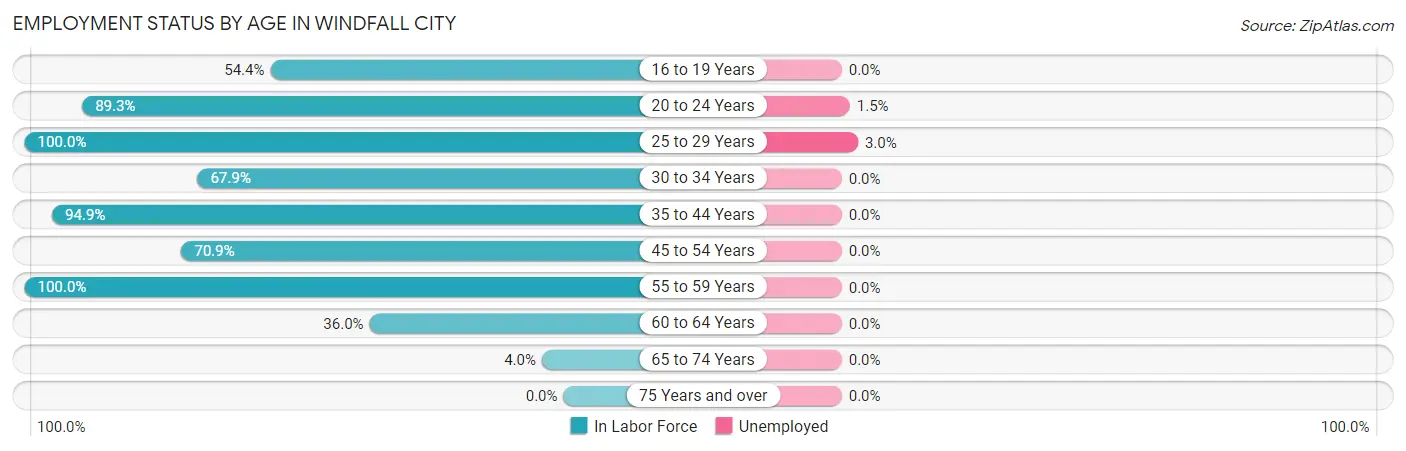
| Age Bracket | In Labor Force | Unemployed |
| 16 to 19 Years | 31 (54.4%) | 0 (0.0%) |
| 20 to 24 Years | 67 (89.3%) | 1 (1.5%) |
| 25 to 29 Years | 33 (100.0%) | 1 (3.0%) |
| 30 to 34 Years | 55 (67.9%) | 0 (0.0%) |
| 35 to 44 Years | 56 (94.9%) | 0 (0.0%) |
| 45 to 54 Years | 83 (70.9%) | 0 (0.0%) |
| 55 to 59 Years | 31 (100.0%) | 0 (0.0%) |
| 60 to 64 Years | 9 (36.0%) | 0 (0.0%) |
| 65 to 74 Years | 3 (4.0%) | 0 (0.0%) |
| 75 Years and over | 0 (0.0%) | 0 (0.0%) |
| Total | 368 (58.0%) | 2 (0.5%) |
Employment Status by Educational Attainment in Windfall City
According to labor force statistics for Windfall City, 77.2% of individuals (267) out of the total population between 25 and 64 years of age (346) are in the labor force, with 0.4% or 1 of them being unemployed. The group with the highest labor force participation rate are those with the educational attainment of bachelor's degree or higher, with 100.0% or 48 individuals in the labor force. Within the labor force, individuals with college / associate degree education have the highest percentage of unemployment, with 1.5% or 1 of them being unemployed.
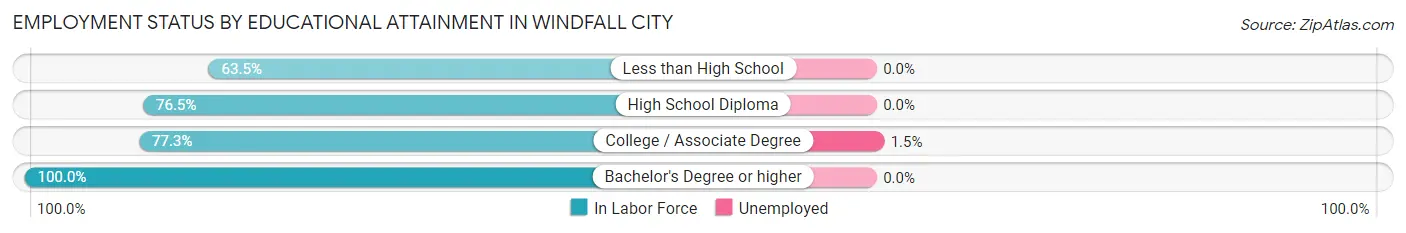
| Educational Attainment | In Labor Force | Unemployed |
| Less than High School | 47 (63.5%) | 0 (0.0%) |
| High School Diploma | 104 (76.5%) | 0 (0.0%) |
| College / Associate Degree | 68 (77.3%) | 1 (1.5%) |
| Bachelor's Degree or higher | 48 (100.0%) | 0 (0.0%) |
| Total | 267 (77.2%) | 1 (0.4%) |
Employment Occupations by Sex in Windfall City
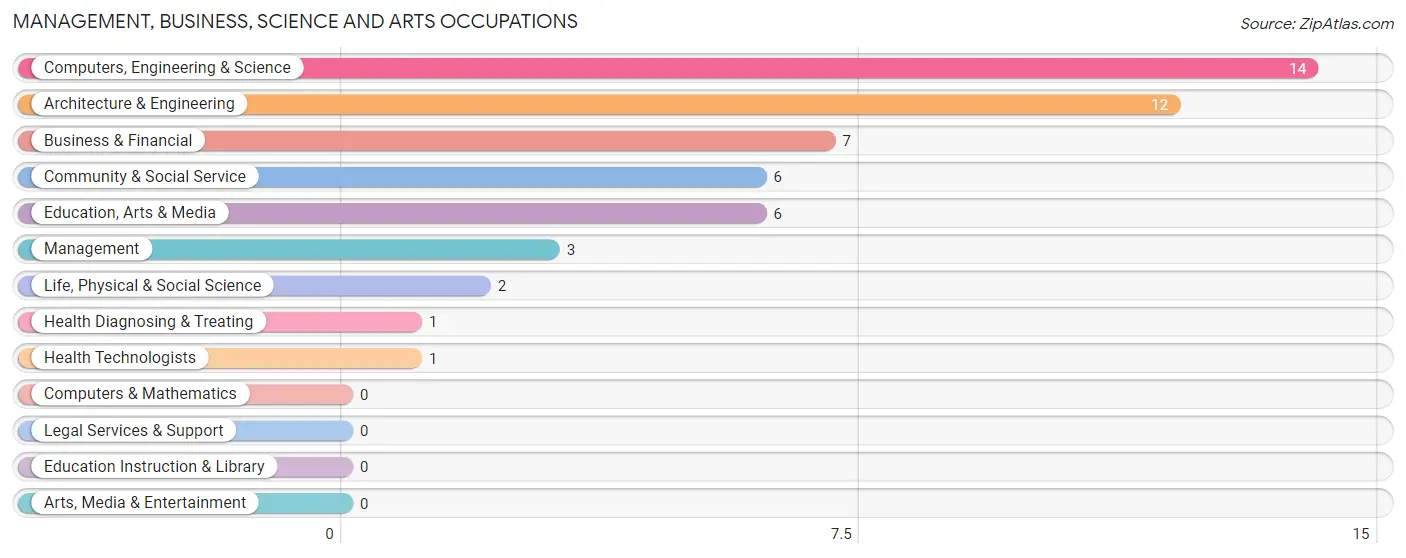
Management, Business, Science and Arts Occupations
The most common Management, Business, Science and Arts occupations in Windfall City are Computers, Engineering & Science (14 | 3.8%), Architecture & Engineering (12 | 3.3%), Business & Financial (7 | 1.9%), Community & Social Service (6 | 1.6%), and Education, Arts & Media (6 | 1.6%).
Management, Business, Science and Arts Occupations by Sex
Within the Management, Business, Science and Arts occupations in Windfall City, the most male-oriented occupations are Management (100.0%), Life, Physical & Social Science (100.0%), and Business & Financial (28.6%), while the most female-oriented occupations are Architecture & Engineering (100.0%), Community & Social Service (100.0%), and Education, Arts & Media (100.0%).
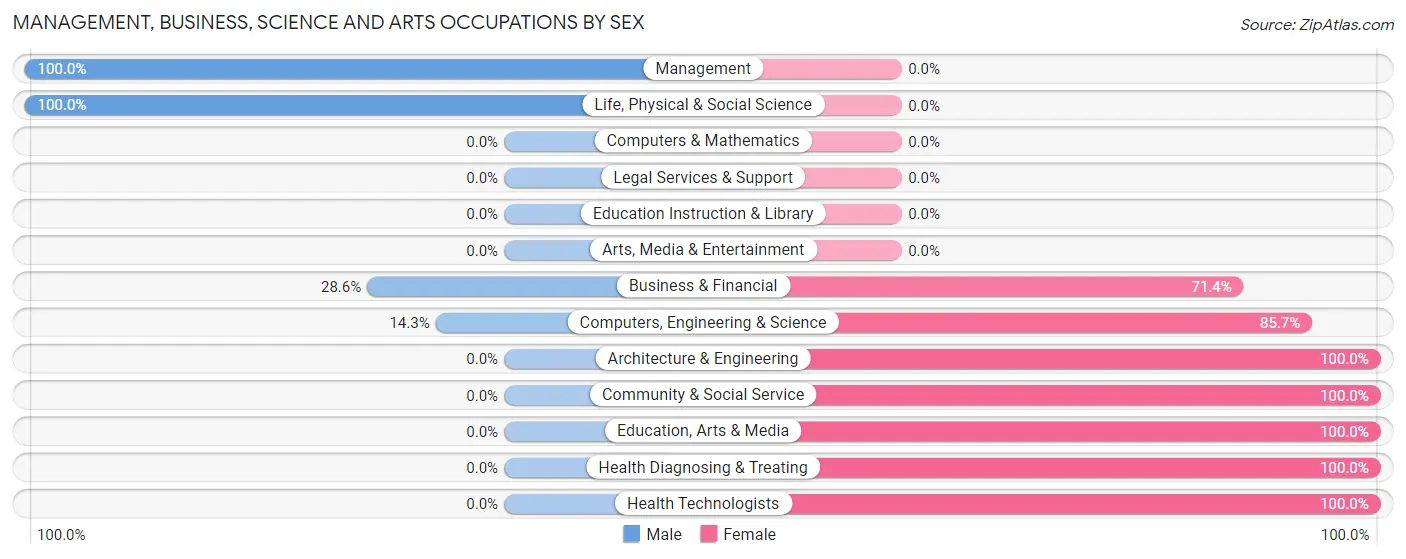
| Occupation | Male | Female |
| Management | 3 (100.0%) | 0 (0.0%) |
| Business & Financial | 2 (28.6%) | 5 (71.4%) |
| Computers, Engineering & Science | 2 (14.3%) | 12 (85.7%) |
| Computers & Mathematics | 0 (0.0%) | 0 (0.0%) |
| Architecture & Engineering | 0 (0.0%) | 12 (100.0%) |
| Life, Physical & Social Science | 2 (100.0%) | 0 (0.0%) |
| Community & Social Service | 0 (0.0%) | 6 (100.0%) |
| Education, Arts & Media | 0 (0.0%) | 6 (100.0%) |
| Legal Services & Support | 0 (0.0%) | 0 (0.0%) |
| Education Instruction & Library | 0 (0.0%) | 0 (0.0%) |
| Arts, Media & Entertainment | 0 (0.0%) | 0 (0.0%) |
| Health Diagnosing & Treating | 0 (0.0%) | 1 (100.0%) |
| Health Technologists | 0 (0.0%) | 1 (100.0%) |
| Total (Category) | 7 (22.6%) | 24 (77.4%) |
| Total (Overall) | 168 (45.9%) | 198 (54.1%) |
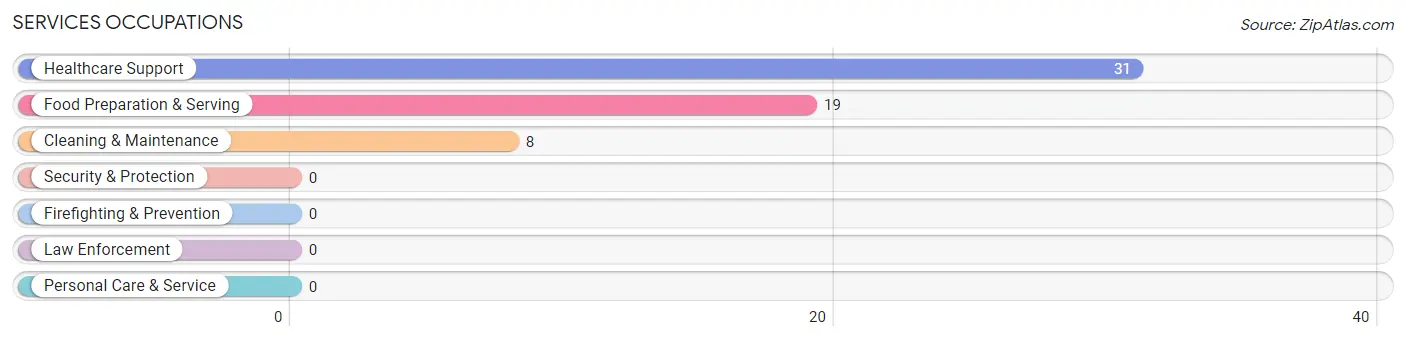
Services Occupations
The most common Services occupations in Windfall City are Healthcare Support (31 | 8.5%), Food Preparation & Serving (19 | 5.2%), and Cleaning & Maintenance (8 | 2.2%).
Services Occupations by Sex
Within the Services occupations in Windfall City, the most male-oriented occupations are Healthcare Support (25.8%), Cleaning & Maintenance (25.0%), and Food Preparation & Serving (15.8%), while the most female-oriented occupations are Food Preparation & Serving (84.2%), Cleaning & Maintenance (75.0%), and Healthcare Support (74.2%).
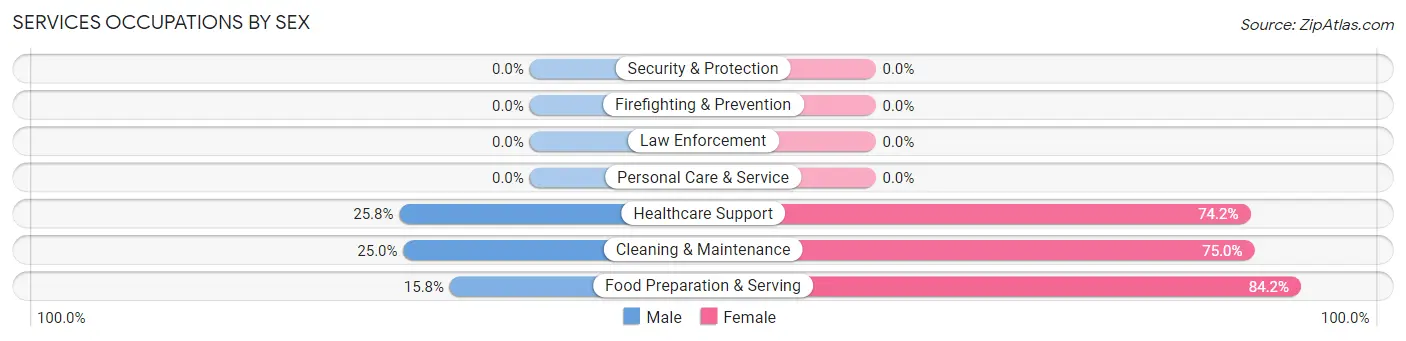
| Occupation | Male | Female |
| Healthcare Support | 8 (25.8%) | 23 (74.2%) |
| Security & Protection | 0 (0.0%) | 0 (0.0%) |
| Firefighting & Prevention | 0 (0.0%) | 0 (0.0%) |
| Law Enforcement | 0 (0.0%) | 0 (0.0%) |
| Food Preparation & Serving | 3 (15.8%) | 16 (84.2%) |
| Cleaning & Maintenance | 2 (25.0%) | 6 (75.0%) |
| Personal Care & Service | 0 (0.0%) | 0 (0.0%) |
| Total (Category) | 13 (22.4%) | 45 (77.6%) |
| Total (Overall) | 168 (45.9%) | 198 (54.1%) |
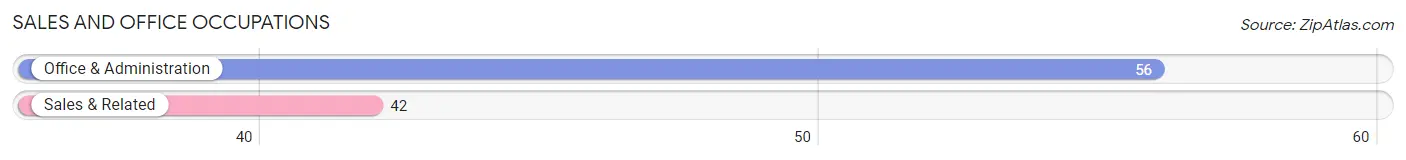
Sales and Office Occupations
The most common Sales and Office occupations in Windfall City are Office & Administration (56 | 15.3%), and Sales & Related (42 | 11.5%).
Sales and Office Occupations by Sex
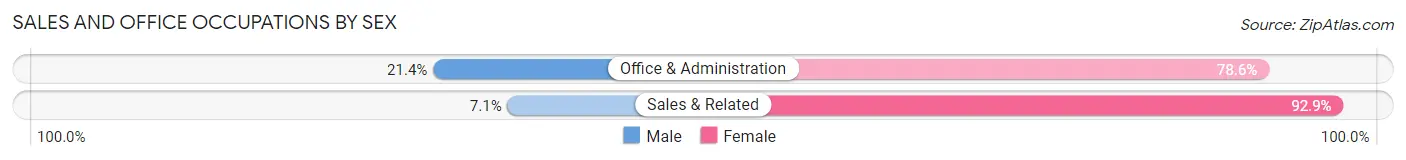
| Occupation | Male | Female |
| Sales & Related | 3 (7.1%) | 39 (92.9%) |
| Office & Administration | 12 (21.4%) | 44 (78.6%) |
| Total (Category) | 15 (15.3%) | 83 (84.7%) |
| Total (Overall) | 168 (45.9%) | 198 (54.1%) |
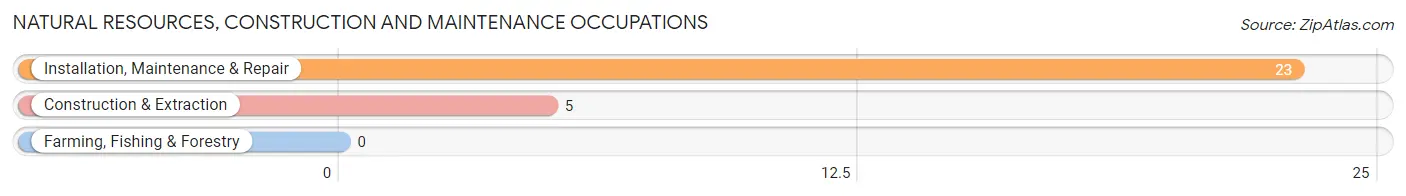
Natural Resources, Construction and Maintenance Occupations
The most common Natural Resources, Construction and Maintenance occupations in Windfall City are Installation, Maintenance & Repair (23 | 6.3%), and Construction & Extraction (5 | 1.4%).
Natural Resources, Construction and Maintenance Occupations by Sex
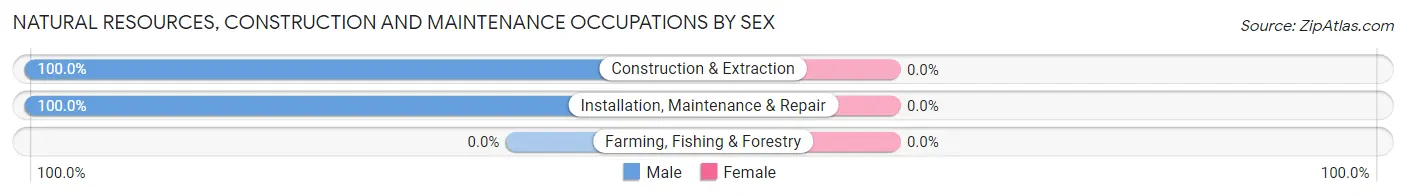
| Occupation | Male | Female |
| Farming, Fishing & Forestry | 0 (0.0%) | 0 (0.0%) |
| Construction & Extraction | 5 (100.0%) | 0 (0.0%) |
| Installation, Maintenance & Repair | 23 (100.0%) | 0 (0.0%) |
| Total (Category) | 28 (100.0%) | 0 (0.0%) |
| Total (Overall) | 168 (45.9%) | 198 (54.1%) |
Production, Transportation and Moving Occupations
The most common Production, Transportation and Moving occupations in Windfall City are Material Moving (54 | 14.7%), Transportation (52 | 14.2%), and Production (45 | 12.3%).
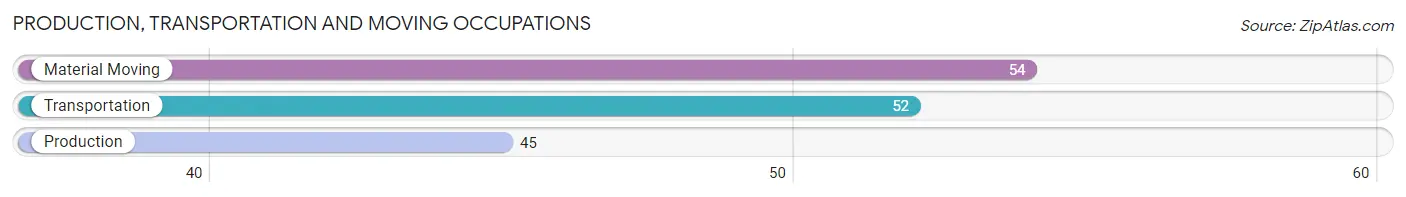
Production, Transportation and Moving Occupations by Sex
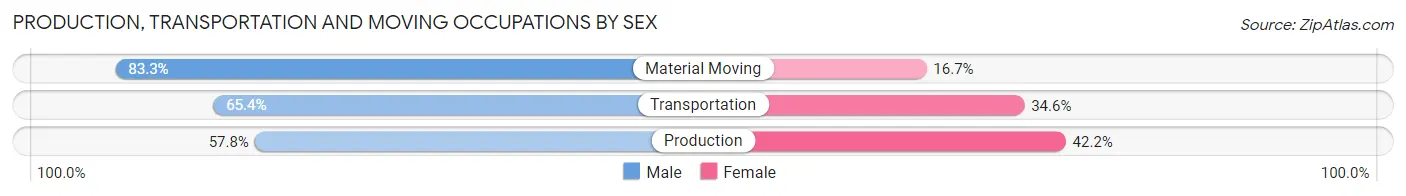
| Occupation | Male | Female |
| Production | 26 (57.8%) | 19 (42.2%) |
| Transportation | 34 (65.4%) | 18 (34.6%) |
| Material Moving | 45 (83.3%) | 9 (16.7%) |
| Total (Category) | 105 (69.5%) | 46 (30.5%) |
| Total (Overall) | 168 (45.9%) | 198 (54.1%) |
Employment Industries by Sex in Windfall City
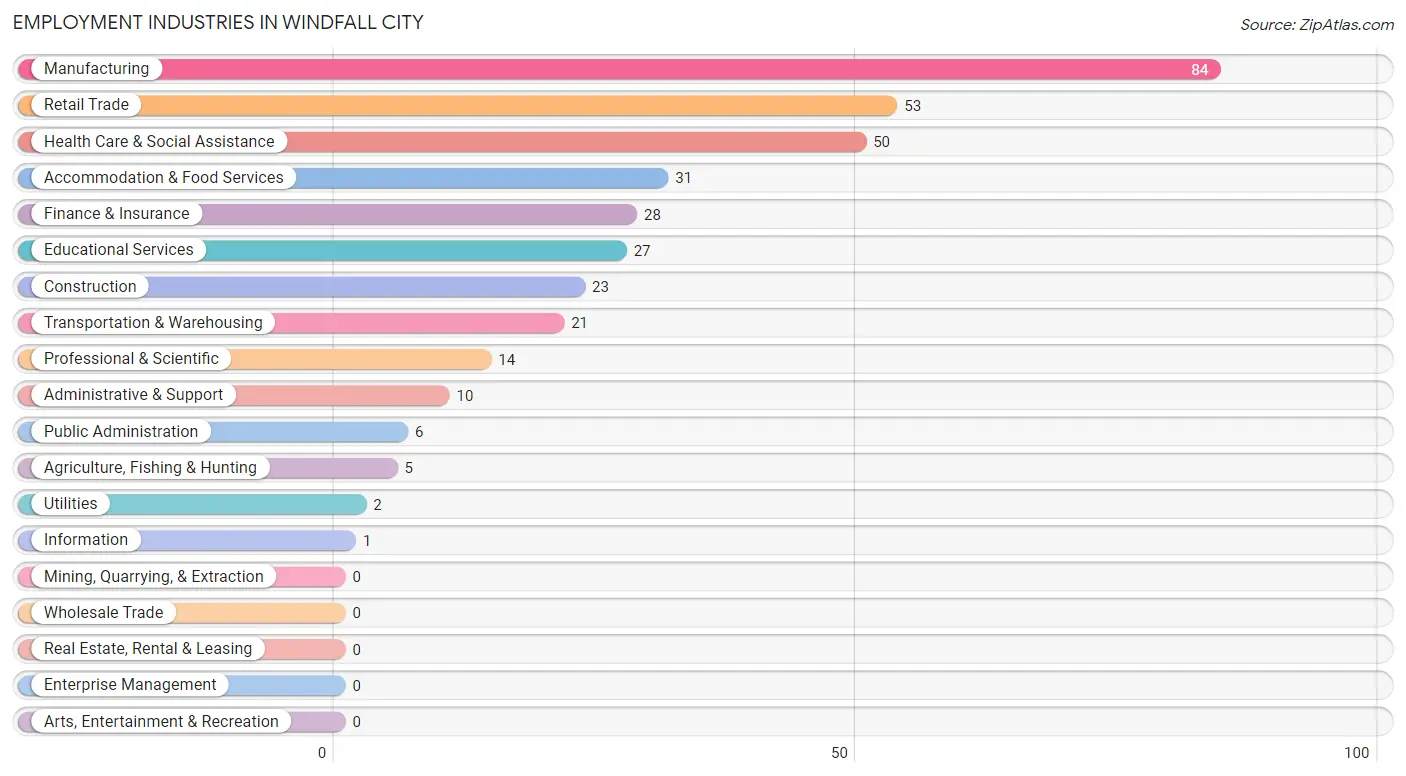
Employment Industries in Windfall City
The major employment industries in Windfall City include Manufacturing (84 | 23.0%), Retail Trade (53 | 14.5%), Health Care & Social Assistance (50 | 13.7%), Accommodation & Food Services (31 | 8.5%), and Finance & Insurance (28 | 7.6%).
Employment Industries by Sex in Windfall City
The Windfall City industries that see more men than women are Transportation & Warehousing (100.0%), Utilities (100.0%), and Information (100.0%), whereas the industries that tend to have a higher number of women are Agriculture, Fishing & Hunting (100.0%), Accommodation & Food Services (93.5%), and Educational Services (92.6%).
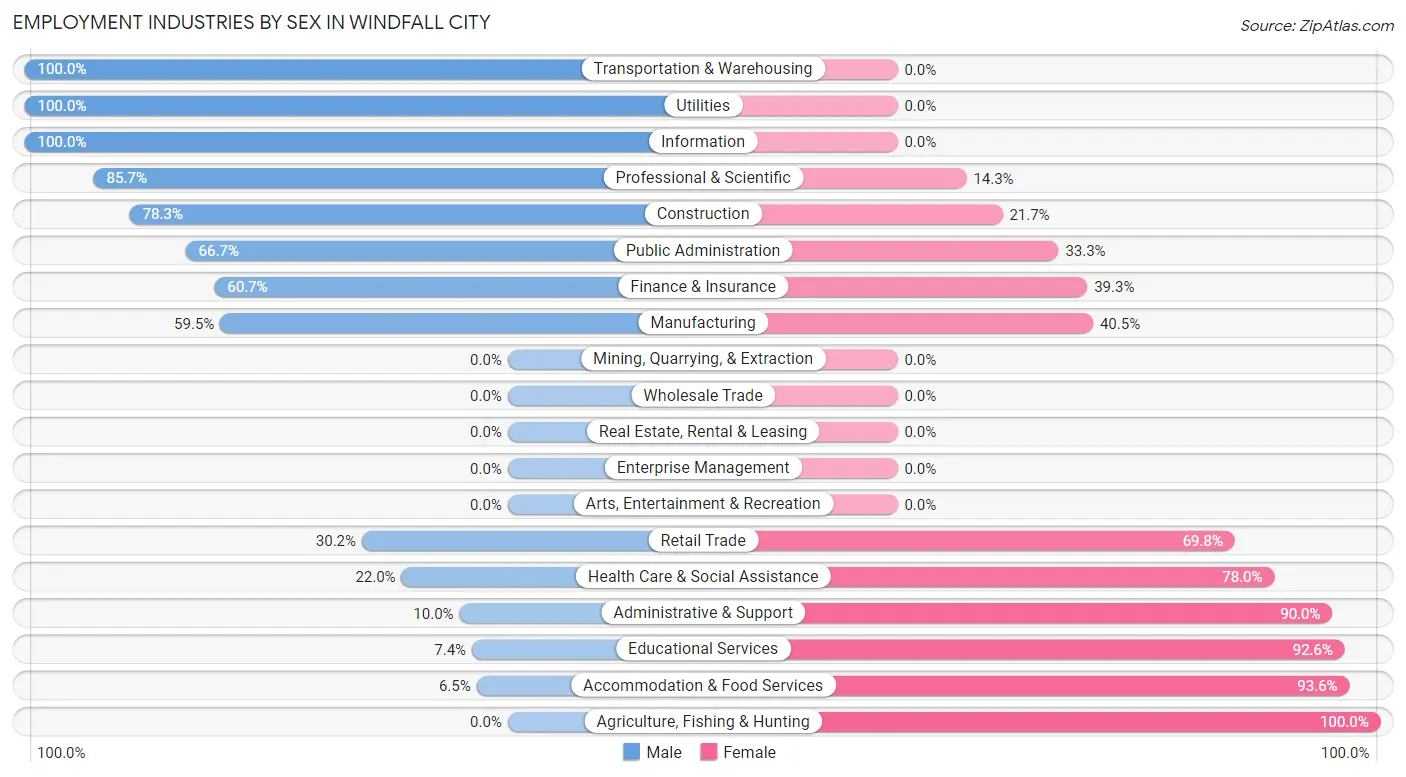
| Industry | Male | Female |
| Agriculture, Fishing & Hunting | 0 (0.0%) | 5 (100.0%) |
| Mining, Quarrying, & Extraction | 0 (0.0%) | 0 (0.0%) |
| Construction | 18 (78.3%) | 5 (21.7%) |
| Manufacturing | 50 (59.5%) | 34 (40.5%) |
| Wholesale Trade | 0 (0.0%) | 0 (0.0%) |
| Retail Trade | 16 (30.2%) | 37 (69.8%) |
| Transportation & Warehousing | 21 (100.0%) | 0 (0.0%) |
| Utilities | 2 (100.0%) | 0 (0.0%) |
| Information | 1 (100.0%) | 0 (0.0%) |
| Finance & Insurance | 17 (60.7%) | 11 (39.3%) |
| Real Estate, Rental & Leasing | 0 (0.0%) | 0 (0.0%) |
| Professional & Scientific | 12 (85.7%) | 2 (14.3%) |
| Enterprise Management | 0 (0.0%) | 0 (0.0%) |
| Administrative & Support | 1 (10.0%) | 9 (90.0%) |
| Educational Services | 2 (7.4%) | 25 (92.6%) |
| Health Care & Social Assistance | 11 (22.0%) | 39 (78.0%) |
| Arts, Entertainment & Recreation | 0 (0.0%) | 0 (0.0%) |
| Accommodation & Food Services | 2 (6.5%) | 29 (93.5%) |
| Public Administration | 4 (66.7%) | 2 (33.3%) |
| Total | 168 (45.9%) | 198 (54.1%) |
Education in Windfall City
School Enrollment in Windfall City
The most common levels of schooling among the 116 students in Windfall City are high school (55 | 47.4%), middle school (27 | 23.3%), and elementary school (21 | 18.1%).
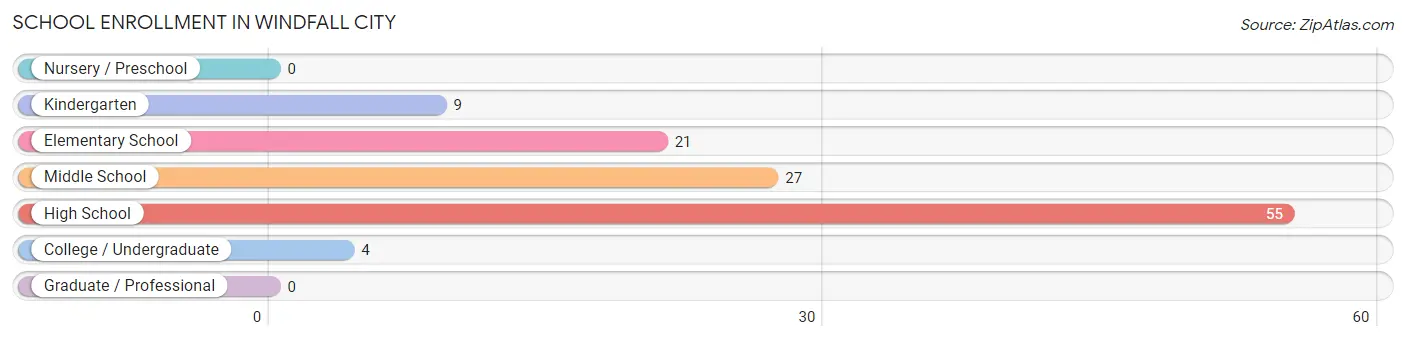
| School Level | # Students | % Students |
| Nursery / Preschool | 0 | 0.0% |
| Kindergarten | 9 | 7.8% |
| Elementary School | 21 | 18.1% |
| Middle School | 27 | 23.3% |
| High School | 55 | 47.4% |
| College / Undergraduate | 4 | 3.5% |
| Graduate / Professional | 0 | 0.0% |
| Total | 116 | 100.0% |
School Enrollment by Age by Funding Source in Windfall City
Out of a total of 116 students who are enrolled in schools in Windfall City, 4 (3.4%) attend a private institution, while the remaining 112 (96.6%) are enrolled in public schools. The age group of 20 to 24 year olds has the highest likelihood of being enrolled in private schools, with 2 (100.0% in the age bracket) enrolled. Conversely, the age group of 5 to 9 year old has the lowest likelihood of being enrolled in a private school, with 28 (100.0% in the age bracket) attending a public institution.
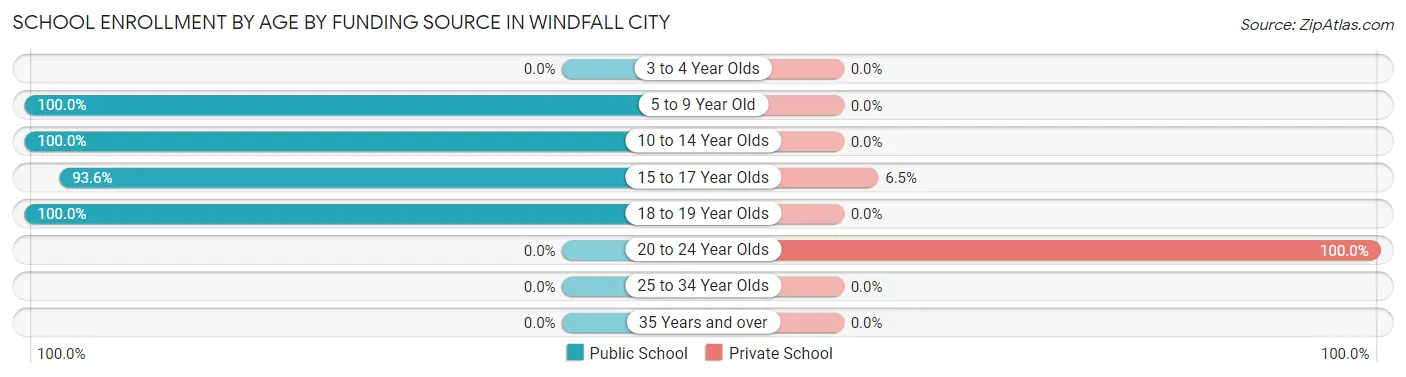
| Age Bracket | Public School | Private School |
| 3 to 4 Year Olds | 0 (0.0%) | 0 (0.0%) |
| 5 to 9 Year Old | 28 (100.0%) | 0 (0.0%) |
| 10 to 14 Year Olds | 31 (100.0%) | 0 (0.0%) |
| 15 to 17 Year Olds | 29 (93.5%) | 2 (6.5%) |
| 18 to 19 Year Olds | 24 (100.0%) | 0 (0.0%) |
| 20 to 24 Year Olds | 0 (0.0%) | 2 (100.0%) |
| 25 to 34 Year Olds | 0 (0.0%) | 0 (0.0%) |
| 35 Years and over | 0 (0.0%) | 0 (0.0%) |
| Total | 112 (96.6%) | 4 (3.4%) |
Educational Attainment by Field of Study in Windfall City
Liberal arts & history (19 | 39.6%), business (18 | 37.5%), computers & mathematics (4 | 8.3%), science & technology (4 | 8.3%), and bio, nature & agricultural (2 | 4.2%) are the most common fields of study among 48 individuals in Windfall City who have obtained a bachelor's degree or higher.
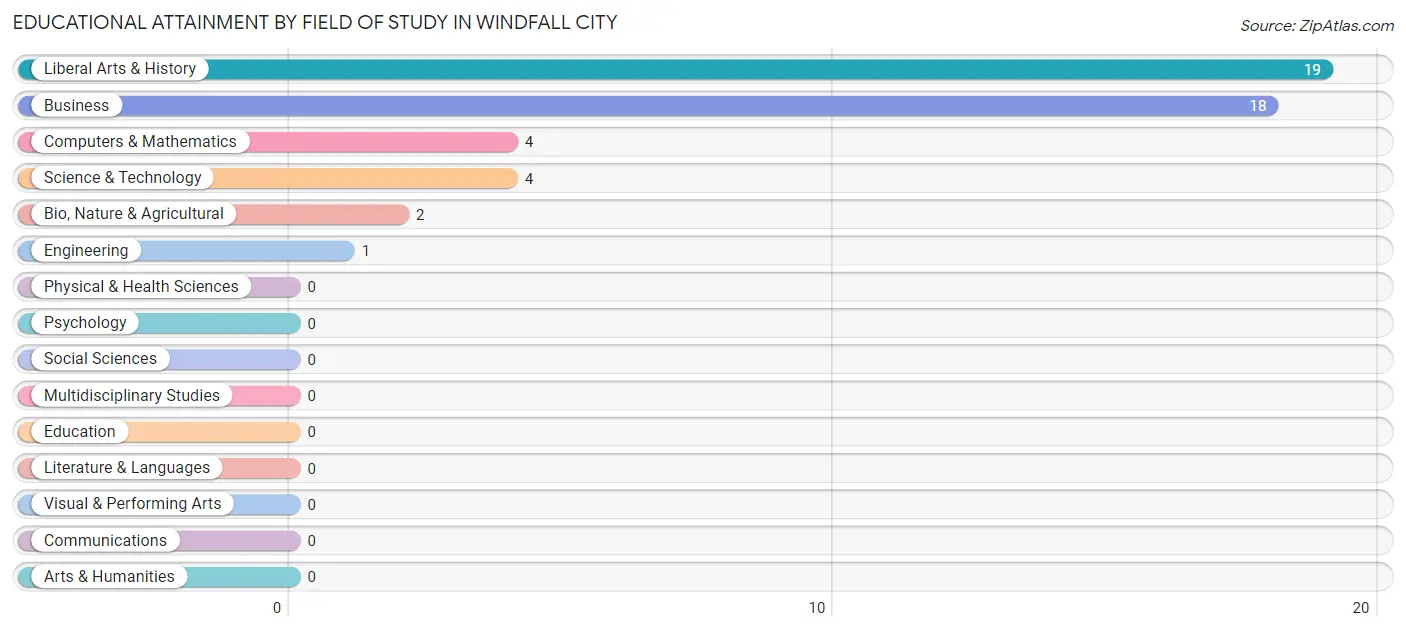
| Field of Study | # Graduates | % Graduates |
| Computers & Mathematics | 4 | 8.3% |
| Bio, Nature & Agricultural | 2 | 4.2% |
| Physical & Health Sciences | 0 | 0.0% |
| Psychology | 0 | 0.0% |
| Social Sciences | 0 | 0.0% |
| Engineering | 1 | 2.1% |
| Multidisciplinary Studies | 0 | 0.0% |
| Science & Technology | 4 | 8.3% |
| Business | 18 | 37.5% |
| Education | 0 | 0.0% |
| Literature & Languages | 0 | 0.0% |
| Liberal Arts & History | 19 | 39.6% |
| Visual & Performing Arts | 0 | 0.0% |
| Communications | 0 | 0.0% |
| Arts & Humanities | 0 | 0.0% |
| Total | 48 | 100.0% |
Transportation & Commute in Windfall City
Vehicle Availability by Sex in Windfall City
The most prevalent vehicle ownership categories in Windfall City are males with 2 vehicles (95, accounting for 56.9%) and females with 2 vehicles (106, making up 48.5%).
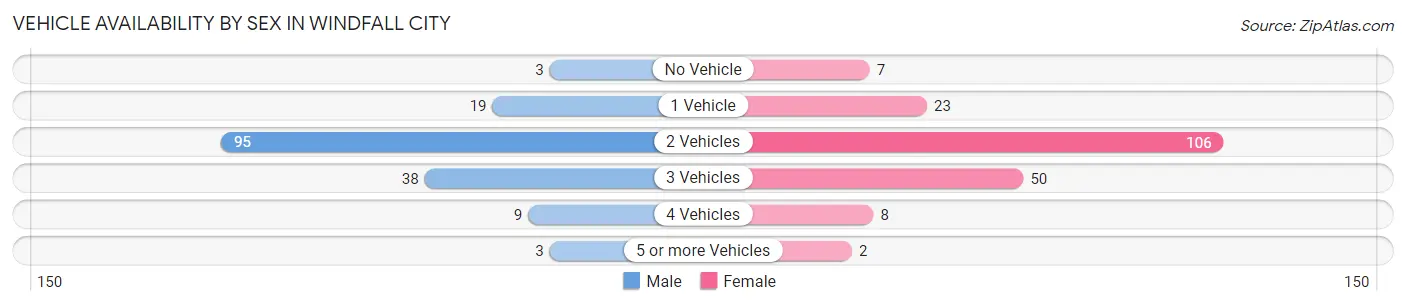
| Vehicles Available | Male | Female |
| No Vehicle | 3 (1.8%) | 7 (3.6%) |
| 1 Vehicle | 19 (11.4%) | 23 (11.7%) |
| 2 Vehicles | 95 (56.9%) | 106 (54.1%) |
| 3 Vehicles | 38 (22.8%) | 50 (25.5%) |
| 4 Vehicles | 9 (5.4%) | 8 (4.1%) |
| 5 or more Vehicles | 3 (1.8%) | 2 (1.0%) |
| Total | 167 (100.0%) | 196 (100.0%) |
Commute Time in Windfall City
The most frequently occuring commute durations in Windfall City are 20 to 24 minutes (79 commuters, 22.7%), 15 to 19 minutes (66 commuters, 19.0%), and 30 to 34 minutes (57 commuters, 16.4%).
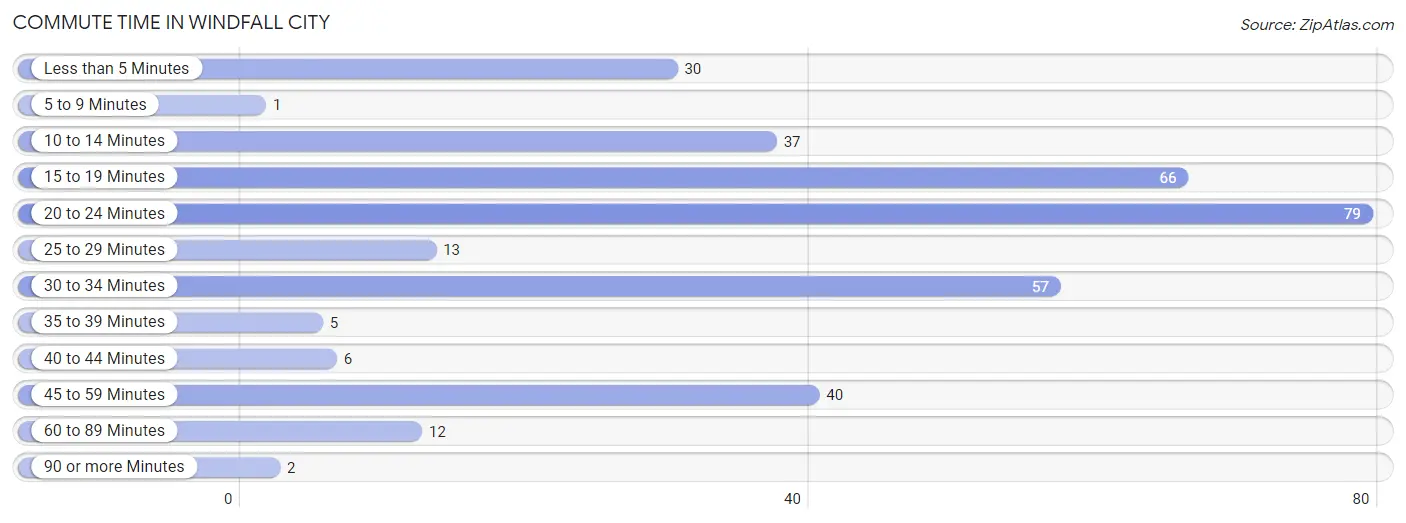
| Commute Time | # Commuters | % Commuters |
| Less than 5 Minutes | 30 | 8.6% |
| 5 to 9 Minutes | 1 | 0.3% |
| 10 to 14 Minutes | 37 | 10.6% |
| 15 to 19 Minutes | 66 | 19.0% |
| 20 to 24 Minutes | 79 | 22.7% |
| 25 to 29 Minutes | 13 | 3.7% |
| 30 to 34 Minutes | 57 | 16.4% |
| 35 to 39 Minutes | 5 | 1.4% |
| 40 to 44 Minutes | 6 | 1.7% |
| 45 to 59 Minutes | 40 | 11.5% |
| 60 to 89 Minutes | 12 | 3.5% |
| 90 or more Minutes | 2 | 0.6% |
Commute Time by Sex in Windfall City
The most common commute times in Windfall City are 20 to 24 minutes (36 commuters, 22.0%) for males and 20 to 24 minutes (43 commuters, 23.4%) for females.
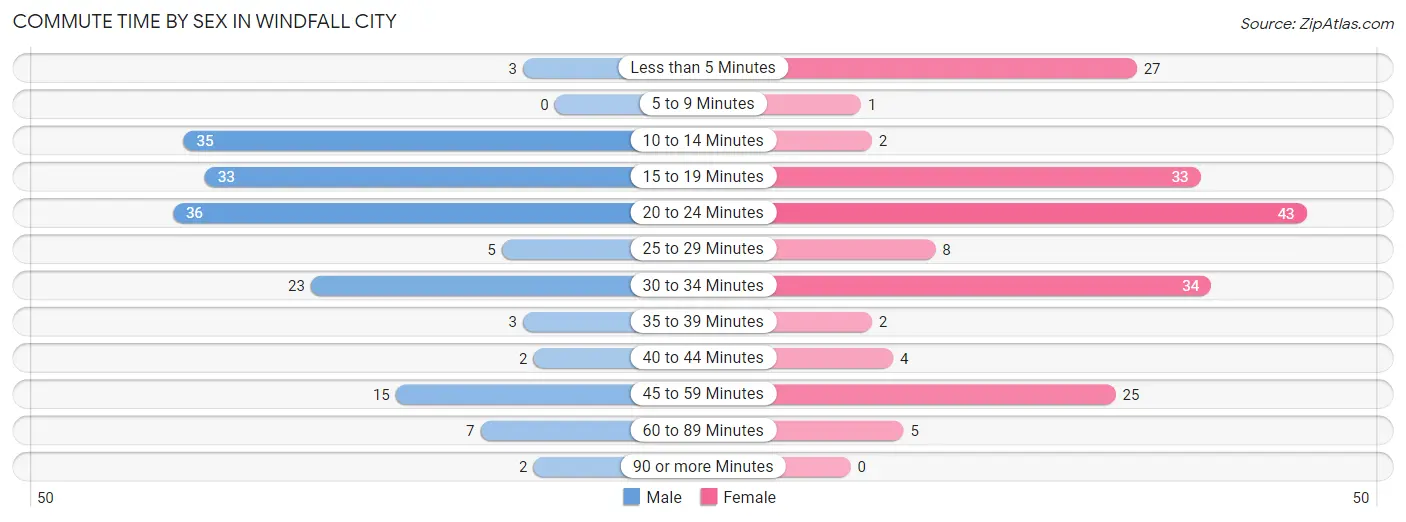
| Commute Time | Male | Female |
| Less than 5 Minutes | 3 (1.8%) | 27 (14.7%) |
| 5 to 9 Minutes | 0 (0.0%) | 1 (0.5%) |
| 10 to 14 Minutes | 35 (21.3%) | 2 (1.1%) |
| 15 to 19 Minutes | 33 (20.1%) | 33 (17.9%) |
| 20 to 24 Minutes | 36 (22.0%) | 43 (23.4%) |
| 25 to 29 Minutes | 5 (3.0%) | 8 (4.3%) |
| 30 to 34 Minutes | 23 (14.0%) | 34 (18.5%) |
| 35 to 39 Minutes | 3 (1.8%) | 2 (1.1%) |
| 40 to 44 Minutes | 2 (1.2%) | 4 (2.2%) |
| 45 to 59 Minutes | 15 (9.1%) | 25 (13.6%) |
| 60 to 89 Minutes | 7 (4.3%) | 5 (2.7%) |
| 90 or more Minutes | 2 (1.2%) | 0 (0.0%) |
Time of Departure to Work by Sex in Windfall City
The most frequent times of departure to work in Windfall City are 7:00 AM to 7:29 AM (35, 21.3%) for males and 5:30 AM to 5:59 AM (41, 22.3%) for females.
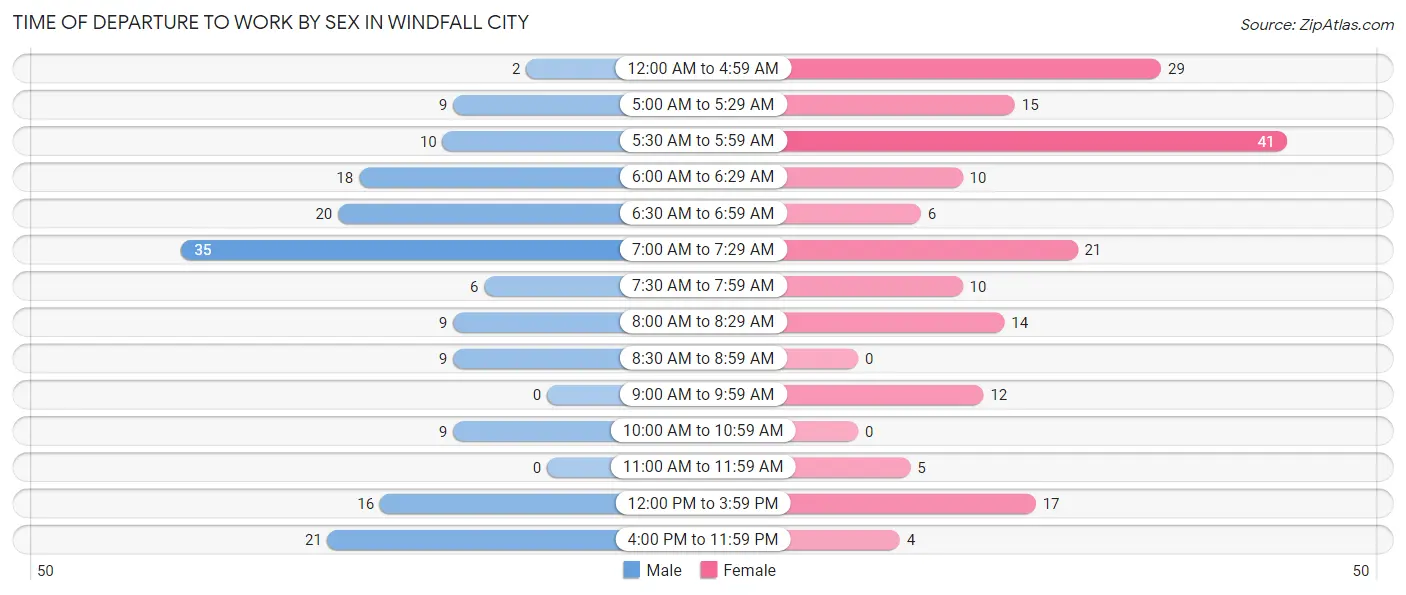
| Time of Departure | Male | Female |
| 12:00 AM to 4:59 AM | 2 (1.2%) | 29 (15.8%) |
| 5:00 AM to 5:29 AM | 9 (5.5%) | 15 (8.2%) |
| 5:30 AM to 5:59 AM | 10 (6.1%) | 41 (22.3%) |
| 6:00 AM to 6:29 AM | 18 (11.0%) | 10 (5.4%) |
| 6:30 AM to 6:59 AM | 20 (12.2%) | 6 (3.3%) |
| 7:00 AM to 7:29 AM | 35 (21.3%) | 21 (11.4%) |
| 7:30 AM to 7:59 AM | 6 (3.7%) | 10 (5.4%) |
| 8:00 AM to 8:29 AM | 9 (5.5%) | 14 (7.6%) |
| 8:30 AM to 8:59 AM | 9 (5.5%) | 0 (0.0%) |
| 9:00 AM to 9:59 AM | 0 (0.0%) | 12 (6.5%) |
| 10:00 AM to 10:59 AM | 9 (5.5%) | 0 (0.0%) |
| 11:00 AM to 11:59 AM | 0 (0.0%) | 5 (2.7%) |
| 12:00 PM to 3:59 PM | 16 (9.8%) | 17 (9.2%) |
| 4:00 PM to 11:59 PM | 21 (12.8%) | 4 (2.2%) |
| Total | 164 (100.0%) | 184 (100.0%) |
Housing Occupancy in Windfall City
Occupancy by Ownership in Windfall City
Of the total 330 dwellings in Windfall City, owner-occupied units account for 247 (74.9%), while renter-occupied units make up 83 (25.2%).
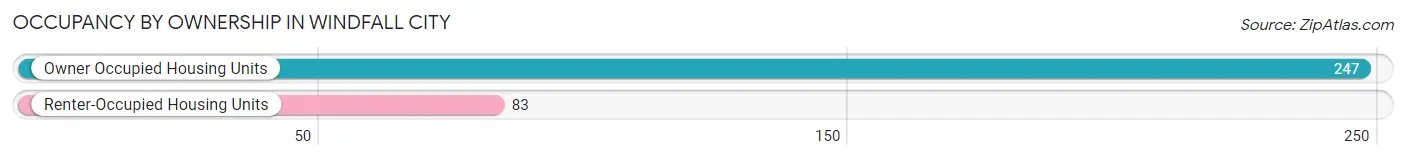
| Occupancy | # Housing Units | % Housing Units |
| Owner Occupied Housing Units | 247 | 74.9% |
| Renter-Occupied Housing Units | 83 | 25.2% |
| Total Occupied Housing Units | 330 | 100.0% |
Occupancy by Household Size in Windfall City
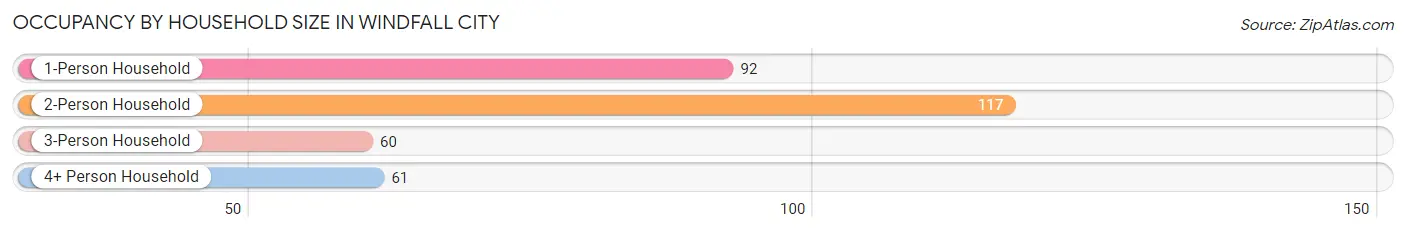
| Household Size | # Housing Units | % Housing Units |
| 1-Person Household | 92 | 27.9% |
| 2-Person Household | 117 | 35.4% |
| 3-Person Household | 60 | 18.2% |
| 4+ Person Household | 61 | 18.5% |
| Total Housing Units | 330 | 100.0% |
Occupancy by Ownership by Household Size in Windfall City
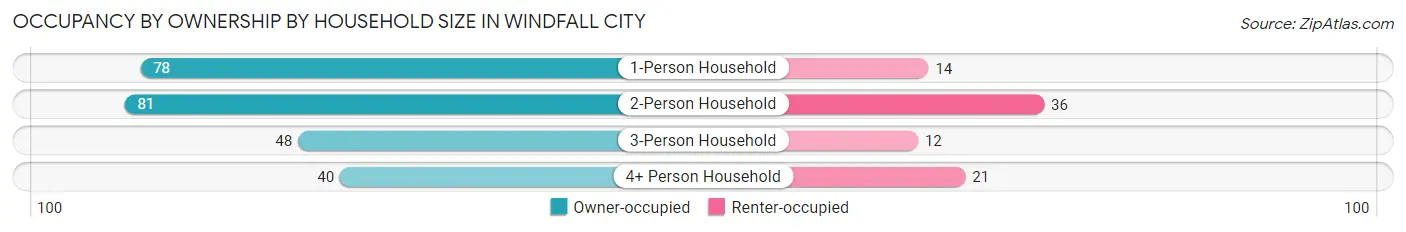
| Household Size | Owner-occupied | Renter-occupied |
| 1-Person Household | 78 (84.8%) | 14 (15.2%) |
| 2-Person Household | 81 (69.2%) | 36 (30.8%) |
| 3-Person Household | 48 (80.0%) | 12 (20.0%) |
| 4+ Person Household | 40 (65.6%) | 21 (34.4%) |
| Total Housing Units | 247 (74.9%) | 83 (25.2%) |
Occupancy by Educational Attainment in Windfall City
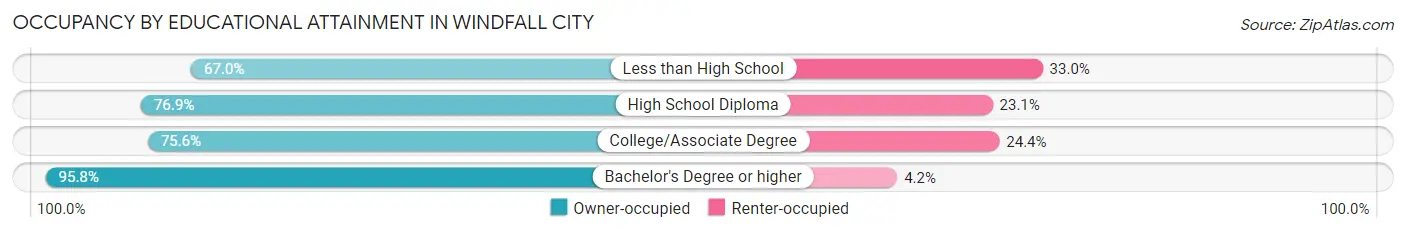
| Household Size | Owner-occupied | Renter-occupied |
| Less than High School | 69 (67.0%) | 34 (33.0%) |
| High School Diploma | 90 (76.9%) | 27 (23.1%) |
| College/Associate Degree | 65 (75.6%) | 21 (24.4%) |
| Bachelor's Degree or higher | 23 (95.8%) | 1 (4.2%) |
Occupancy by Age of Householder in Windfall City
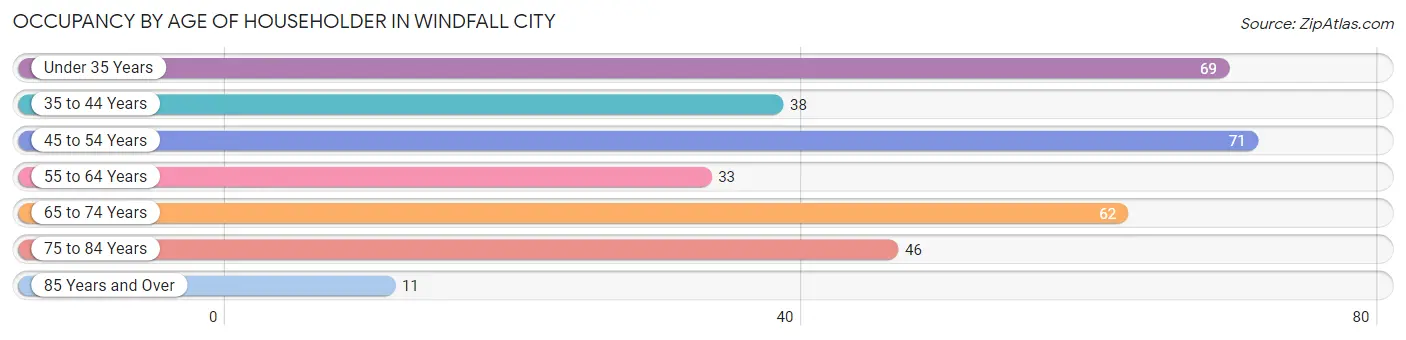
| Age Bracket | # Households | % Households |
| Under 35 Years | 69 | 20.9% |
| 35 to 44 Years | 38 | 11.5% |
| 45 to 54 Years | 71 | 21.5% |
| 55 to 64 Years | 33 | 10.0% |
| 65 to 74 Years | 62 | 18.8% |
| 75 to 84 Years | 46 | 13.9% |
| 85 Years and Over | 11 | 3.3% |
| Total | 330 | 100.0% |
Housing Finances in Windfall City
Median Income by Occupancy in Windfall City
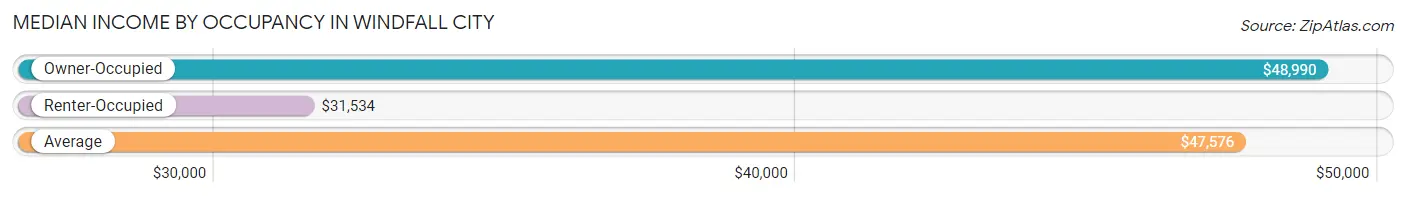
| Occupancy Type | # Households | Median Income |
| Owner-Occupied | 247 (74.9%) | $48,990 |
| Renter-Occupied | 83 (25.2%) | $31,534 |
| Average | 330 (100.0%) | $47,576 |
Occupancy by Householder Income Bracket in Windfall City
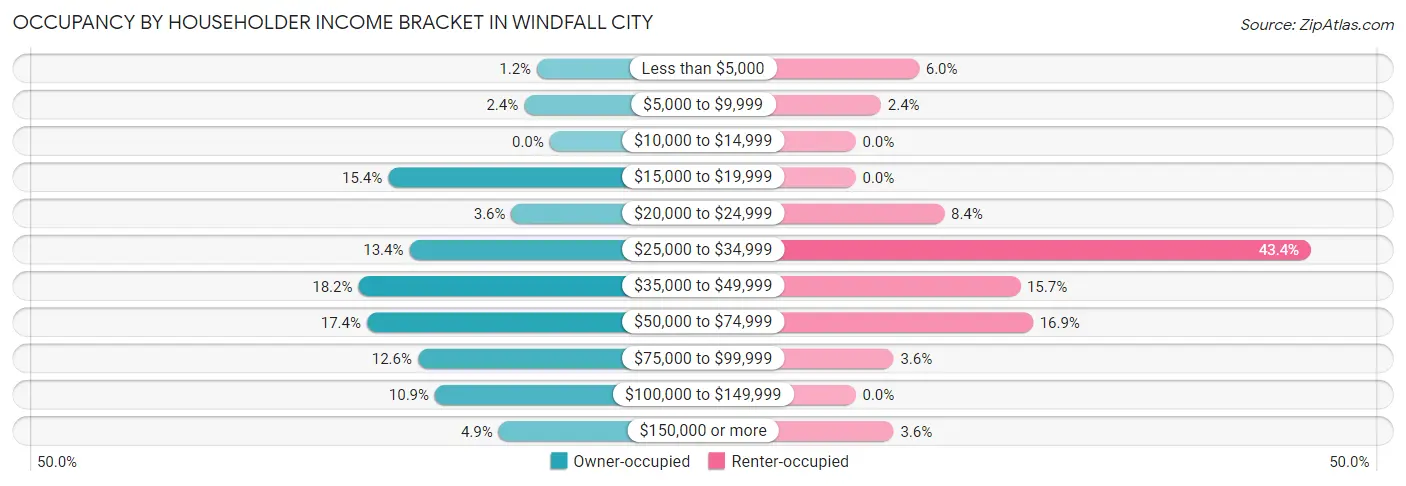
| Income Bracket | Owner-occupied | Renter-occupied |
| Less than $5,000 | 3 (1.2%) | 5 (6.0%) |
| $5,000 to $9,999 | 6 (2.4%) | 2 (2.4%) |
| $10,000 to $14,999 | 0 (0.0%) | 0 (0.0%) |
| $15,000 to $19,999 | 38 (15.4%) | 0 (0.0%) |
| $20,000 to $24,999 | 9 (3.6%) | 7 (8.4%) |
| $25,000 to $34,999 | 33 (13.4%) | 36 (43.4%) |
| $35,000 to $49,999 | 45 (18.2%) | 13 (15.7%) |
| $50,000 to $74,999 | 43 (17.4%) | 14 (16.9%) |
| $75,000 to $99,999 | 31 (12.6%) | 3 (3.6%) |
| $100,000 to $149,999 | 27 (10.9%) | 0 (0.0%) |
| $150,000 or more | 12 (4.9%) | 3 (3.6%) |
| Total | 247 (100.0%) | 83 (100.0%) |
Monthly Housing Cost Tiers in Windfall City
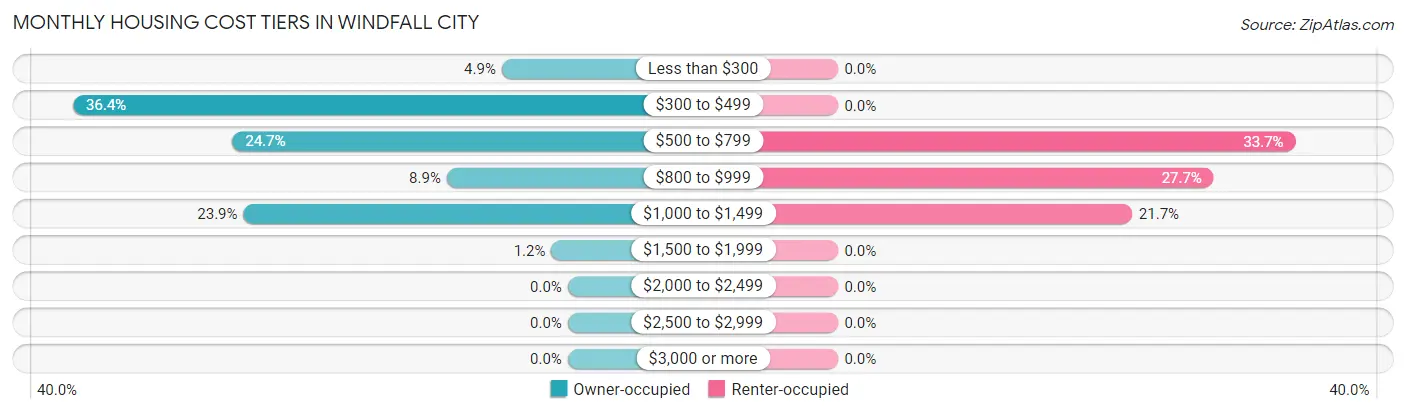
| Monthly Cost | Owner-occupied | Renter-occupied |
| Less than $300 | 12 (4.9%) | 0 (0.0%) |
| $300 to $499 | 90 (36.4%) | 0 (0.0%) |
| $500 to $799 | 61 (24.7%) | 28 (33.7%) |
| $800 to $999 | 22 (8.9%) | 23 (27.7%) |
| $1,000 to $1,499 | 59 (23.9%) | 18 (21.7%) |
| $1,500 to $1,999 | 3 (1.2%) | 0 (0.0%) |
| $2,000 to $2,499 | 0 (0.0%) | 0 (0.0%) |
| $2,500 to $2,999 | 0 (0.0%) | 0 (0.0%) |
| $3,000 or more | 0 (0.0%) | 0 (0.0%) |
| Total | 247 (100.0%) | 83 (100.0%) |
Physical Housing Characteristics in Windfall City
Housing Structures in Windfall City
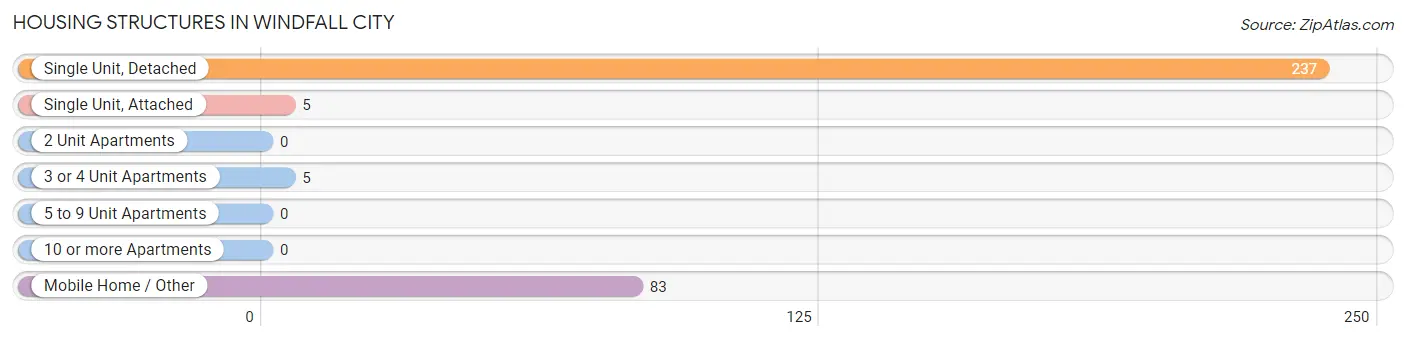
| Structure Type | # Housing Units | % Housing Units |
| Single Unit, Detached | 237 | 71.8% |
| Single Unit, Attached | 5 | 1.5% |
| 2 Unit Apartments | 0 | 0.0% |
| 3 or 4 Unit Apartments | 5 | 1.5% |
| 5 to 9 Unit Apartments | 0 | 0.0% |
| 10 or more Apartments | 0 | 0.0% |
| Mobile Home / Other | 83 | 25.2% |
| Total | 330 | 100.0% |
Housing Structures by Occupancy in Windfall City
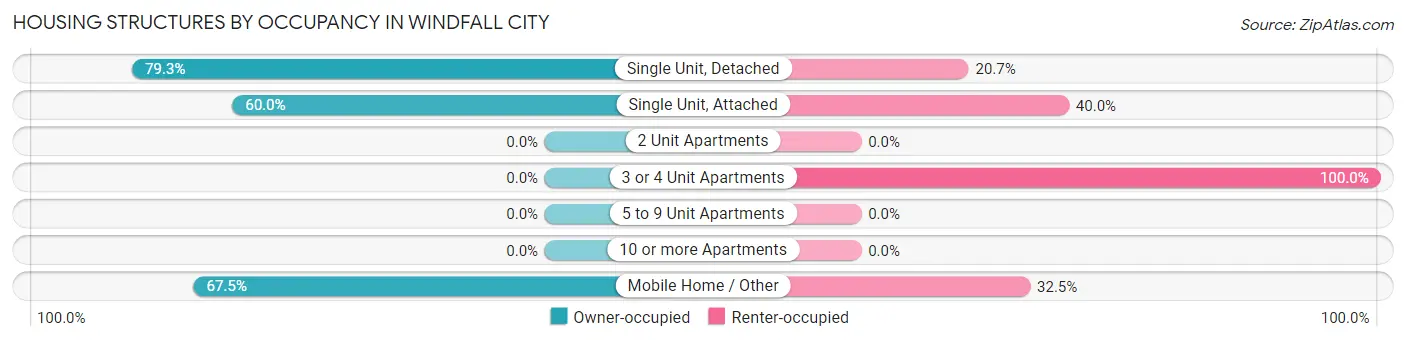
| Structure Type | Owner-occupied | Renter-occupied |
| Single Unit, Detached | 188 (79.3%) | 49 (20.7%) |
| Single Unit, Attached | 3 (60.0%) | 2 (40.0%) |
| 2 Unit Apartments | 0 (0.0%) | 0 (0.0%) |
| 3 or 4 Unit Apartments | 0 (0.0%) | 5 (100.0%) |
| 5 to 9 Unit Apartments | 0 (0.0%) | 0 (0.0%) |
| 10 or more Apartments | 0 (0.0%) | 0 (0.0%) |
| Mobile Home / Other | 56 (67.5%) | 27 (32.5%) |
| Total | 247 (74.9%) | 83 (25.2%) |
Housing Structures by Number of Rooms in Windfall City
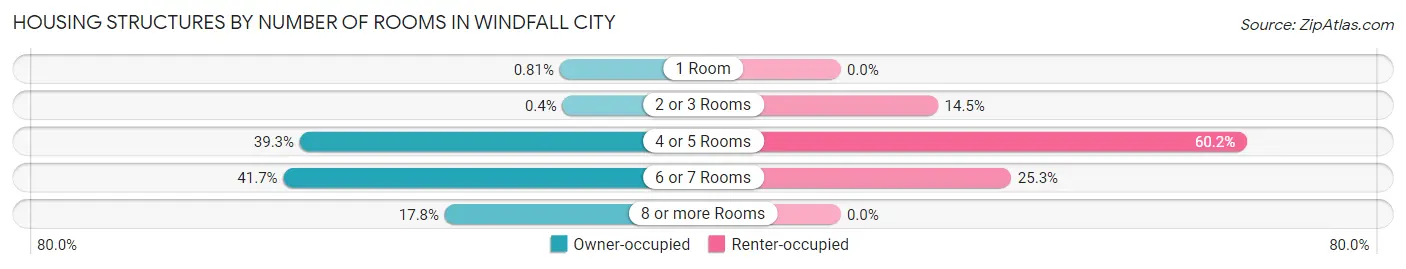
| Number of Rooms | Owner-occupied | Renter-occupied |
| 1 Room | 2 (0.8%) | 0 (0.0%) |
| 2 or 3 Rooms | 1 (0.4%) | 12 (14.5%) |
| 4 or 5 Rooms | 97 (39.3%) | 50 (60.2%) |
| 6 or 7 Rooms | 103 (41.7%) | 21 (25.3%) |
| 8 or more Rooms | 44 (17.8%) | 0 (0.0%) |
| Total | 247 (100.0%) | 83 (100.0%) |
Housing Structure by Heating Type in Windfall City
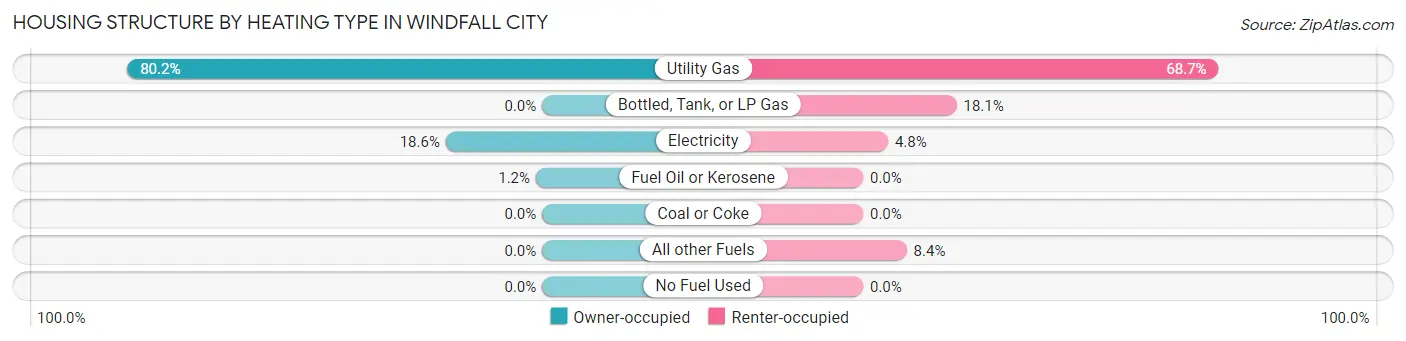
| Heating Type | Owner-occupied | Renter-occupied |
| Utility Gas | 198 (80.2%) | 57 (68.7%) |
| Bottled, Tank, or LP Gas | 0 (0.0%) | 15 (18.1%) |
| Electricity | 46 (18.6%) | 4 (4.8%) |
| Fuel Oil or Kerosene | 3 (1.2%) | 0 (0.0%) |
| Coal or Coke | 0 (0.0%) | 0 (0.0%) |
| All other Fuels | 0 (0.0%) | 7 (8.4%) |
| No Fuel Used | 0 (0.0%) | 0 (0.0%) |
| Total | 247 (100.0%) | 83 (100.0%) |
Household Vehicle Usage in Windfall City
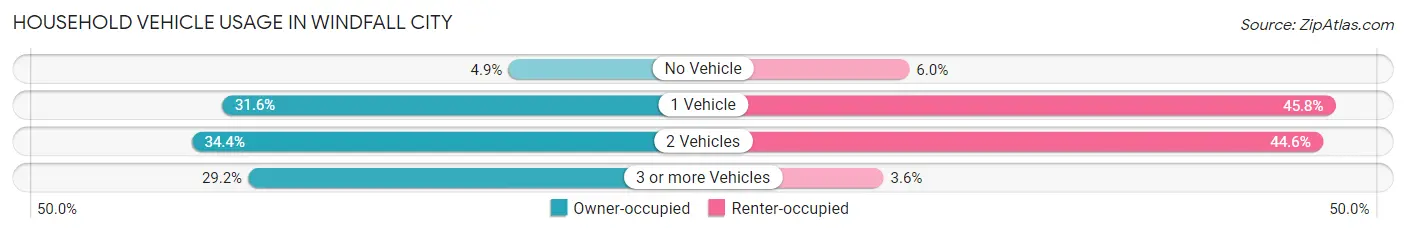
| Vehicles per Household | Owner-occupied | Renter-occupied |
| No Vehicle | 12 (4.9%) | 5 (6.0%) |
| 1 Vehicle | 78 (31.6%) | 38 (45.8%) |
| 2 Vehicles | 85 (34.4%) | 37 (44.6%) |
| 3 or more Vehicles | 72 (29.1%) | 3 (3.6%) |
| Total | 247 (100.0%) | 83 (100.0%) |
Real Estate & Mortgages in Windfall City
Real Estate and Mortgage Overview in Windfall City
| Characteristic | Without Mortgage | With Mortgage |
| Housing Units | 128 | 119 |
| Median Property Value | $50,000 | $90,800 |
| Median Household Income | $26,711 | $7 |
| Monthly Housing Costs | $400 | $0 |
| Real Estate Taxes | - | - |
Property Value by Mortgage Status in Windfall City
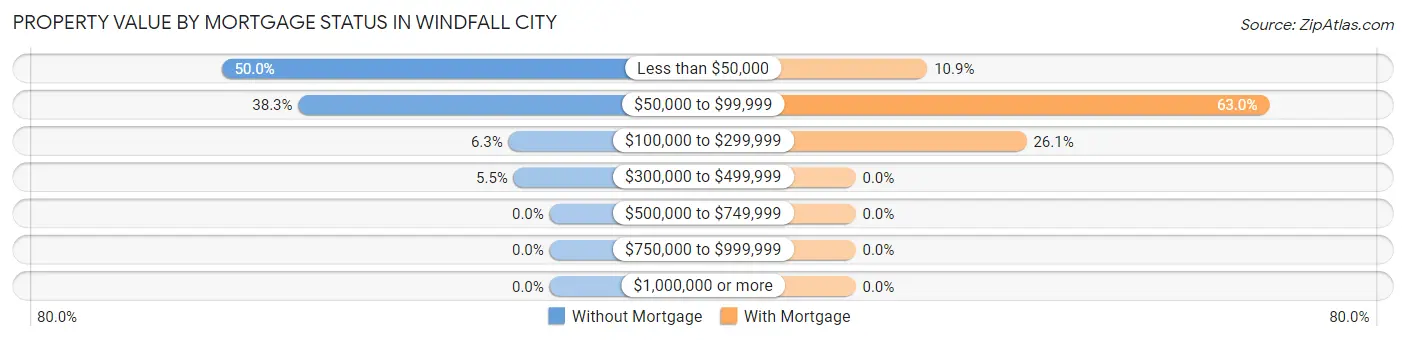
| Property Value | Without Mortgage | With Mortgage |
| Less than $50,000 | 64 (50.0%) | 13 (10.9%) |
| $50,000 to $99,999 | 49 (38.3%) | 75 (63.0%) |
| $100,000 to $299,999 | 8 (6.2%) | 31 (26.1%) |
| $300,000 to $499,999 | 7 (5.5%) | 0 (0.0%) |
| $500,000 to $749,999 | 0 (0.0%) | 0 (0.0%) |
| $750,000 to $999,999 | 0 (0.0%) | 0 (0.0%) |
| $1,000,000 or more | 0 (0.0%) | 0 (0.0%) |
| Total | 128 (100.0%) | 119 (100.0%) |
Household Income by Mortgage Status in Windfall City
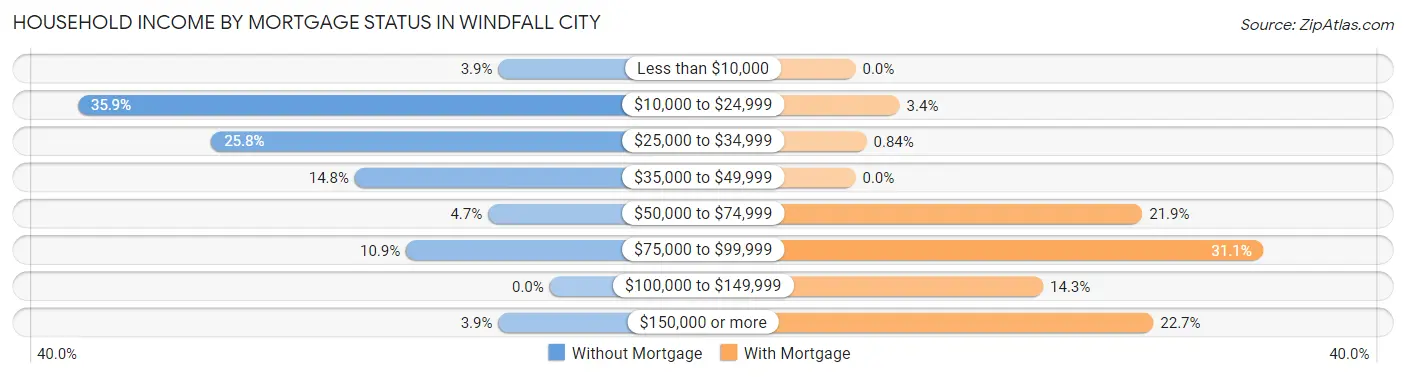
| Household Income | Without Mortgage | With Mortgage |
| Less than $10,000 | 5 (3.9%) | 0 (0.0%) |
| $10,000 to $24,999 | 46 (35.9%) | 4 (3.4%) |
| $25,000 to $34,999 | 33 (25.8%) | 1 (0.8%) |
| $35,000 to $49,999 | 19 (14.8%) | 0 (0.0%) |
| $50,000 to $74,999 | 6 (4.7%) | 26 (21.8%) |
| $75,000 to $99,999 | 14 (10.9%) | 37 (31.1%) |
| $100,000 to $149,999 | 0 (0.0%) | 17 (14.3%) |
| $150,000 or more | 5 (3.9%) | 27 (22.7%) |
| Total | 128 (100.0%) | 119 (100.0%) |
Property Value to Household Income Ratio in Windfall City
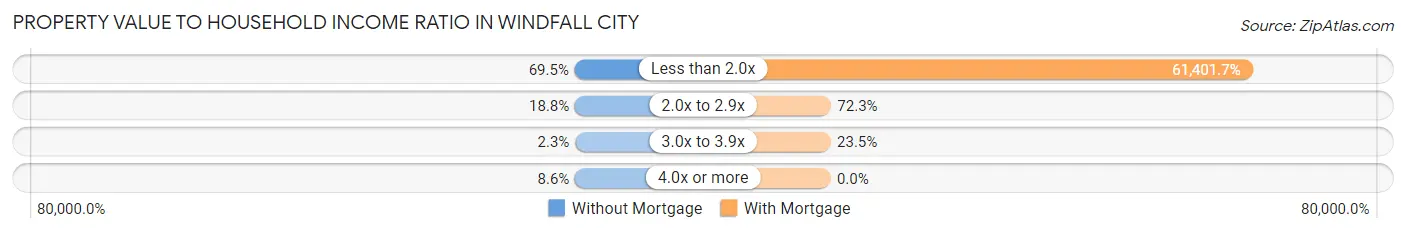
| Value-to-Income Ratio | Without Mortgage | With Mortgage |
| Less than 2.0x | 89 (69.5%) | 73,068 (61,401.7%) |
| 2.0x to 2.9x | 24 (18.8%) | 86 (72.3%) |
| 3.0x to 3.9x | 3 (2.3%) | 28 (23.5%) |
| 4.0x or more | 11 (8.6%) | 0 (0.0%) |
| Total | 128 (100.0%) | 119 (100.0%) |
Real Estate Taxes by Mortgage Status in Windfall City
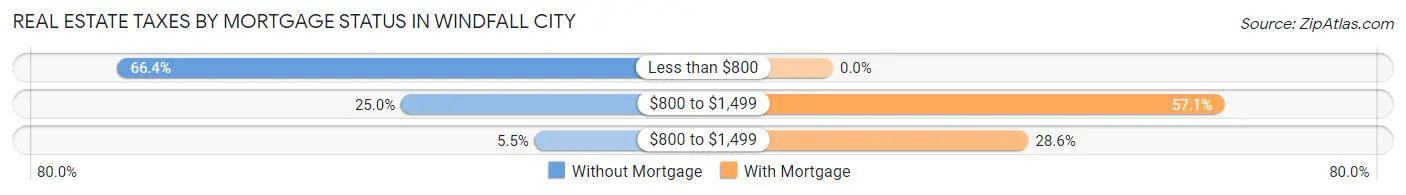
| Property Taxes | Without Mortgage | With Mortgage |
| Less than $800 | 85 (66.4%) | 0 (0.0%) |
| $800 to $1,499 | 32 (25.0%) | 68 (57.1%) |
| $800 to $1,499 | 7 (5.5%) | 34 (28.6%) |
| Total | 128 (100.0%) | 119 (100.0%) |
Health & Disability in Windfall City
Health Insurance Coverage by Age in Windfall City
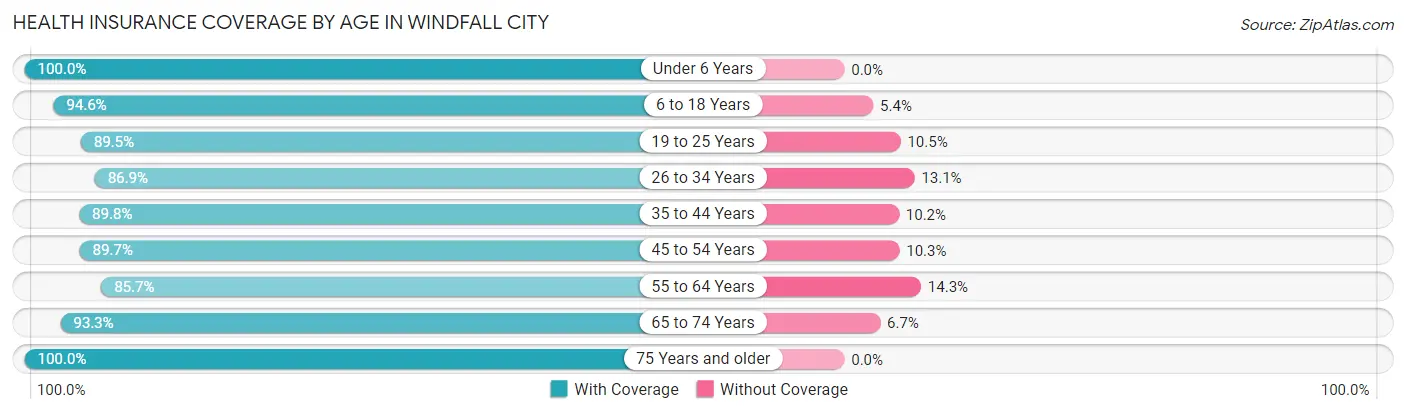
| Age Bracket | With Coverage | Without Coverage |
| Under 6 Years | 46 (100.0%) | 0 (0.0%) |
| 6 to 18 Years | 88 (94.6%) | 5 (5.4%) |
| 19 to 25 Years | 94 (89.5%) | 11 (10.5%) |
| 26 to 34 Years | 93 (86.9%) | 14 (13.1%) |
| 35 to 44 Years | 53 (89.8%) | 6 (10.2%) |
| 45 to 54 Years | 105 (89.7%) | 12 (10.3%) |
| 55 to 64 Years | 48 (85.7%) | 8 (14.3%) |
| 65 to 74 Years | 70 (93.3%) | 5 (6.7%) |
| 75 Years and older | 82 (100.0%) | 0 (0.0%) |
| Total | 679 (91.8%) | 61 (8.2%) |
Health Insurance Coverage by Citizenship Status in Windfall City
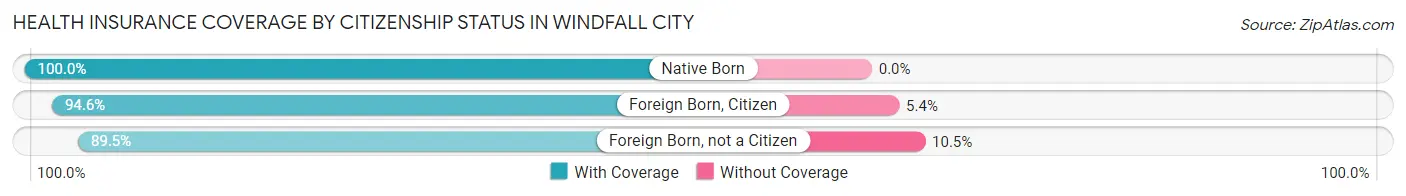
| Citizenship Status | With Coverage | Without Coverage |
| Native Born | 46 (100.0%) | 0 (0.0%) |
| Foreign Born, Citizen | 88 (94.6%) | 5 (5.4%) |
| Foreign Born, not a Citizen | 94 (89.5%) | 11 (10.5%) |
Health Insurance Coverage by Household Income in Windfall City
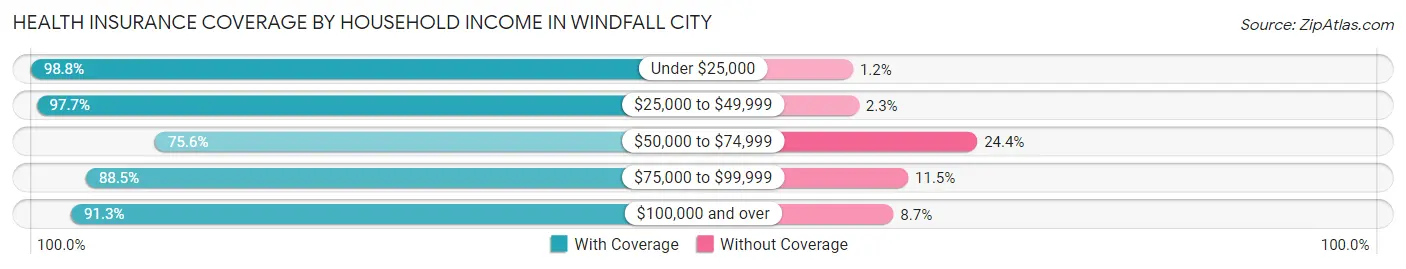
| Household Income | With Coverage | Without Coverage |
| Under $25,000 | 85 (98.8%) | 1 (1.2%) |
| $25,000 to $49,999 | 303 (97.7%) | 7 (2.3%) |
| $50,000 to $74,999 | 99 (75.6%) | 32 (24.4%) |
| $75,000 to $99,999 | 77 (88.5%) | 10 (11.5%) |
| $100,000 and over | 115 (91.3%) | 11 (8.7%) |
Public vs Private Health Insurance Coverage by Age in Windfall City
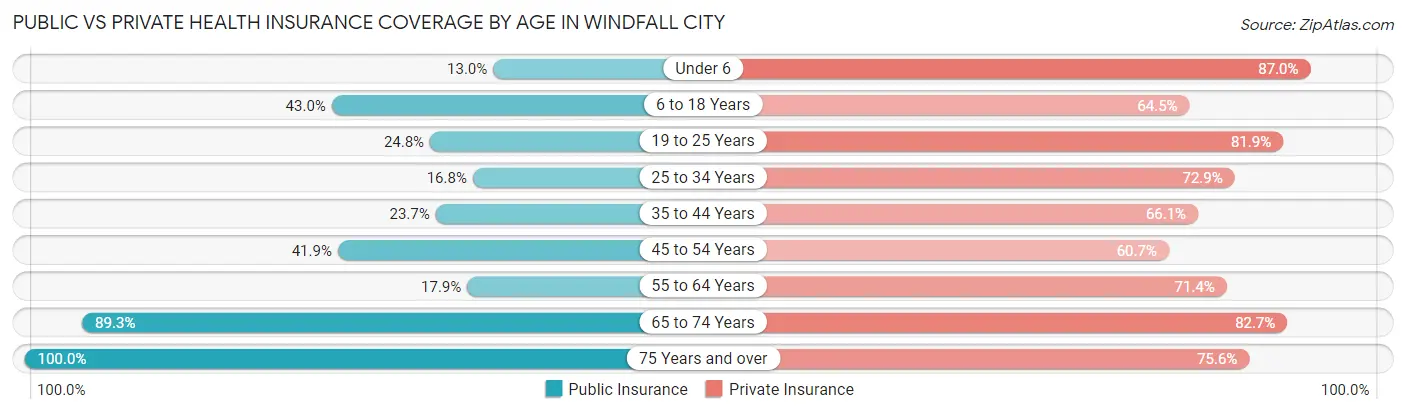
| Age Bracket | Public Insurance | Private Insurance |
| Under 6 | 6 (13.0%) | 40 (87.0%) |
| 6 to 18 Years | 40 (43.0%) | 60 (64.5%) |
| 19 to 25 Years | 26 (24.8%) | 86 (81.9%) |
| 25 to 34 Years | 18 (16.8%) | 78 (72.9%) |
| 35 to 44 Years | 14 (23.7%) | 39 (66.1%) |
| 45 to 54 Years | 49 (41.9%) | 71 (60.7%) |
| 55 to 64 Years | 10 (17.9%) | 40 (71.4%) |
| 65 to 74 Years | 67 (89.3%) | 62 (82.7%) |
| 75 Years and over | 82 (100.0%) | 62 (75.6%) |
| Total | 312 (42.2%) | 538 (72.7%) |
Disability Status by Sex by Age in Windfall City
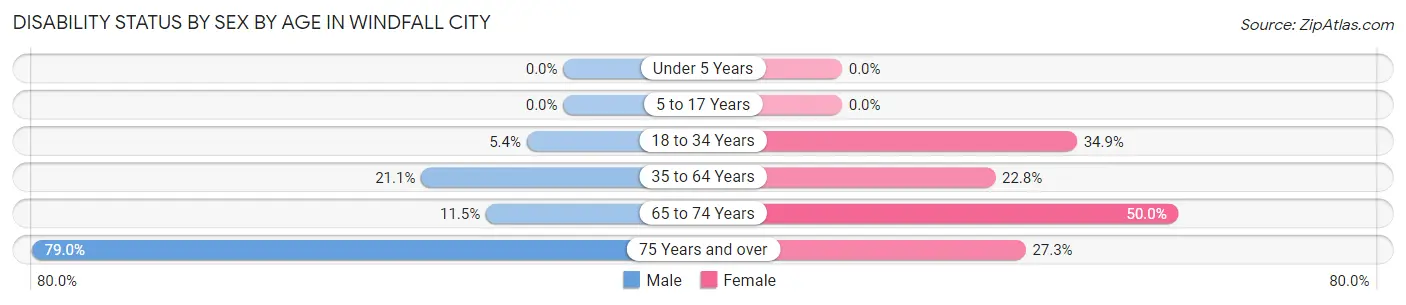
| Age Bracket | Male | Female |
| Under 5 Years | 0 (0.0%) | 0 (0.0%) |
| 5 to 17 Years | 0 (0.0%) | 0 (0.0%) |
| 18 to 34 Years | 5 (5.4%) | 45 (34.9%) |
| 35 to 64 Years | 23 (21.1%) | 28 (22.8%) |
| 65 to 74 Years | 7 (11.5%) | 7 (50.0%) |
| 75 Years and over | 30 (78.9%) | 12 (27.3%) |
Disability Class by Sex by Age in Windfall City
Disability Class: Hearing Difficulty
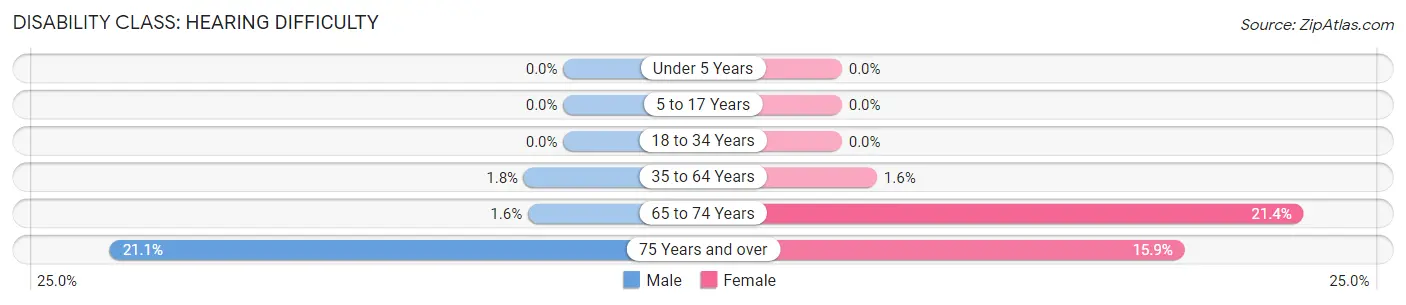
| Age Bracket | Male | Female |
| Under 5 Years | 0 (0.0%) | 0 (0.0%) |
| 5 to 17 Years | 0 (0.0%) | 0 (0.0%) |
| 18 to 34 Years | 0 (0.0%) | 0 (0.0%) |
| 35 to 64 Years | 2 (1.8%) | 2 (1.6%) |
| 65 to 74 Years | 1 (1.6%) | 3 (21.4%) |
| 75 Years and over | 8 (21.0%) | 7 (15.9%) |
Disability Class: Vision Difficulty
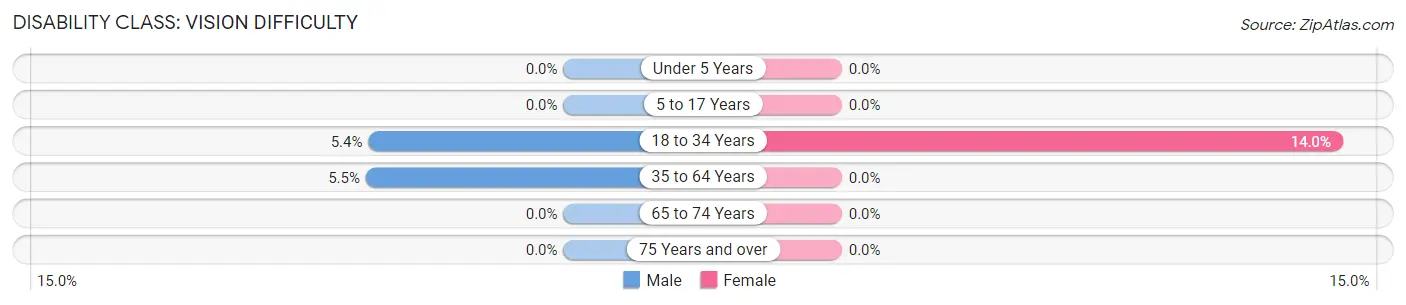
| Age Bracket | Male | Female |
| Under 5 Years | 0 (0.0%) | 0 (0.0%) |
| 5 to 17 Years | 0 (0.0%) | 0 (0.0%) |
| 18 to 34 Years | 5 (5.4%) | 18 (14.0%) |
| 35 to 64 Years | 6 (5.5%) | 0 (0.0%) |
| 65 to 74 Years | 0 (0.0%) | 0 (0.0%) |
| 75 Years and over | 0 (0.0%) | 0 (0.0%) |
Disability Class: Cognitive Difficulty
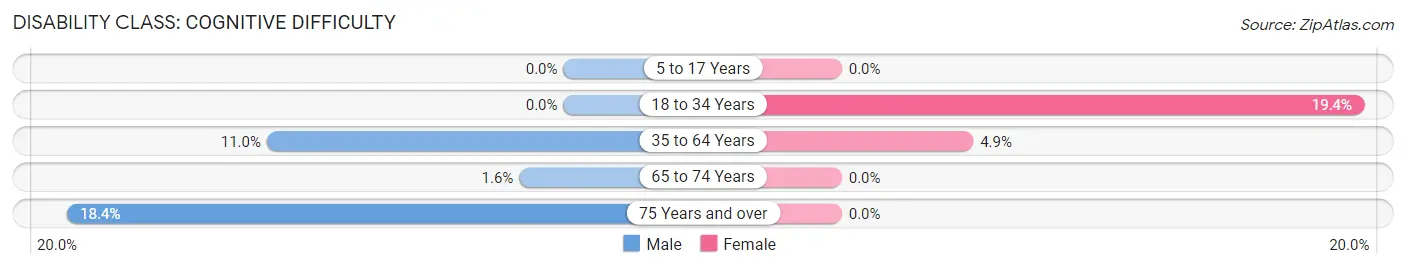
| Age Bracket | Male | Female |
| 5 to 17 Years | 0 (0.0%) | 0 (0.0%) |
| 18 to 34 Years | 0 (0.0%) | 25 (19.4%) |
| 35 to 64 Years | 12 (11.0%) | 6 (4.9%) |
| 65 to 74 Years | 1 (1.6%) | 0 (0.0%) |
| 75 Years and over | 7 (18.4%) | 0 (0.0%) |
Disability Class: Ambulatory Difficulty
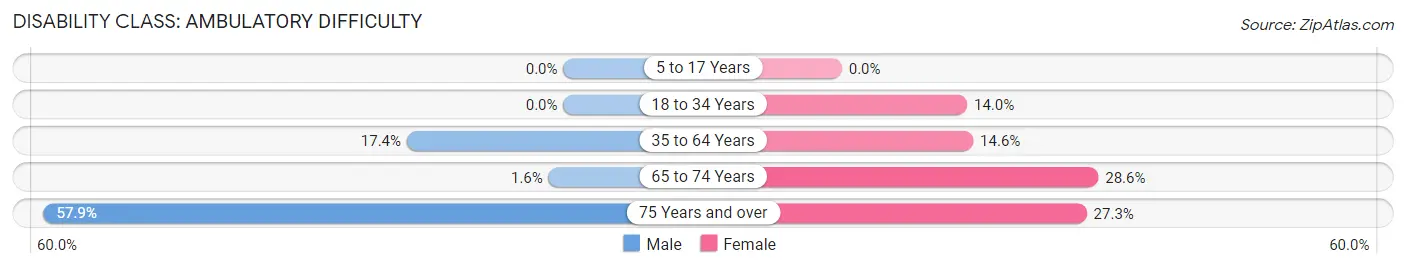
| Age Bracket | Male | Female |
| 5 to 17 Years | 0 (0.0%) | 0 (0.0%) |
| 18 to 34 Years | 0 (0.0%) | 18 (14.0%) |
| 35 to 64 Years | 19 (17.4%) | 18 (14.6%) |
| 65 to 74 Years | 1 (1.6%) | 4 (28.6%) |
| 75 Years and over | 22 (57.9%) | 12 (27.3%) |
Disability Class: Self-Care Difficulty
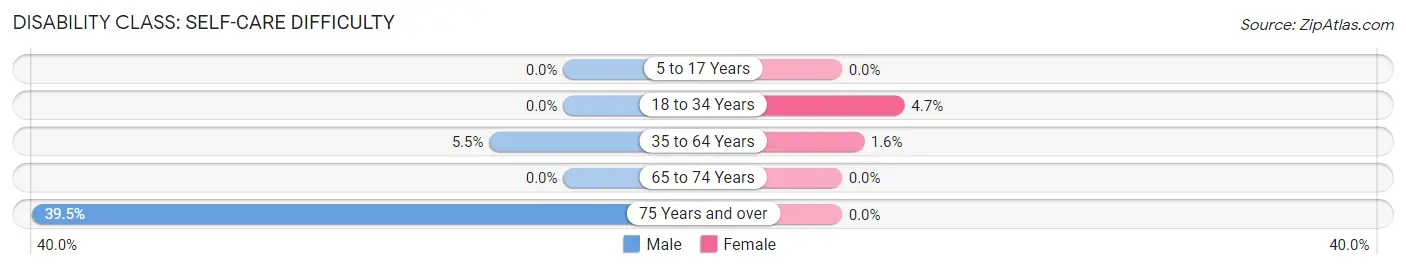
| Age Bracket | Male | Female |
| 5 to 17 Years | 0 (0.0%) | 0 (0.0%) |
| 18 to 34 Years | 0 (0.0%) | 6 (4.6%) |
| 35 to 64 Years | 6 (5.5%) | 2 (1.6%) |
| 65 to 74 Years | 0 (0.0%) | 0 (0.0%) |
| 75 Years and over | 15 (39.5%) | 0 (0.0%) |
Technology Access in Windfall City
Computing Device Access in Windfall City
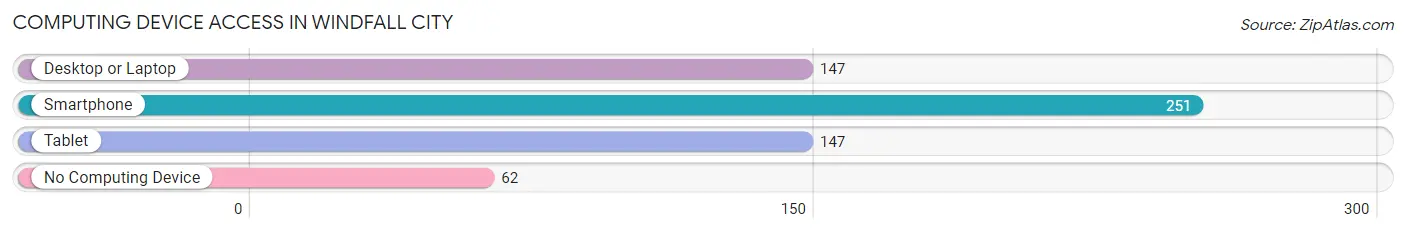
| Device Type | # Households | % Households |
| Desktop or Laptop | 147 | 44.6% |
| Smartphone | 251 | 76.1% |
| Tablet | 147 | 44.6% |
| No Computing Device | 62 | 18.8% |
| Total | 330 | 100.0% |
Internet Access in Windfall City
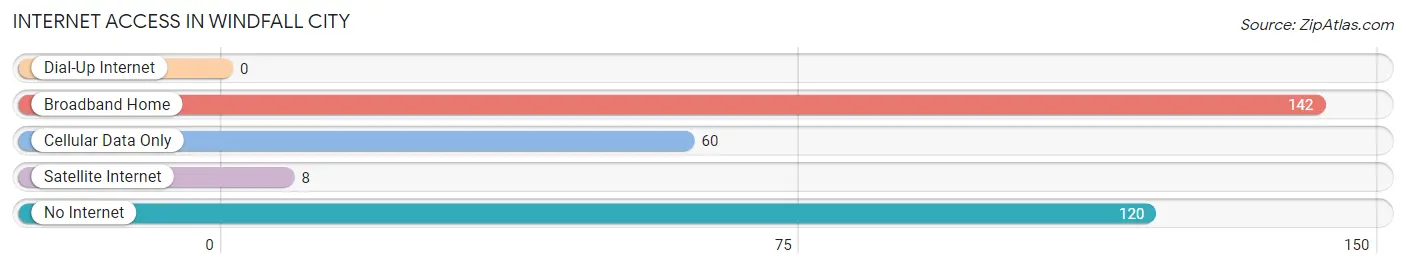
| Internet Type | # Households | % Households |
| Dial-Up Internet | 0 | 0.0% |
| Broadband Home | 142 | 43.0% |
| Cellular Data Only | 60 | 18.2% |
| Satellite Internet | 8 | 2.4% |
| No Internet | 120 | 36.4% |
| Total | 330 | 100.0% |
Windfall City Summary
History
Fall City, Indiana is a small town located in the northern part of the state, just south of the Michigan border. It was founded in 1837 by a group of settlers from Ohio, who were looking for a place to settle and start a new life. The town was originally called “Fallen City”, but the name was changed to “Fall City” in 1845.
The town was originally a farming community, but it soon became a center for industry. In the late 1800s, the town was home to several factories, including a paper mill, a sawmill, and a flour mill. The town also had a railroad station, which allowed for the transportation of goods and people.
In the early 1900s, Fall City began to experience a population boom. This was due to the influx of immigrants from Europe, who were looking for work in the factories. The population of the town grew from around 500 in 1900 to over 2,000 by 1920.
The town continued to grow throughout the 20th century, and by the year 2000, the population had reached over 4,000. The town has experienced a steady population growth since then, and as of 2020, the population is estimated to be around 5,000.
Geography
Fall City is located in the northern part of Indiana, just south of the Michigan border. It is situated in LaGrange County, and is bordered by the towns of Howe, Topeka, and Shipshewana. The town is located on the banks of the Elkhart River, and is surrounded by rolling hills and farmland.
The town has a total area of 2.2 square miles, and is located at an elevation of 845 feet above sea level. The climate in Fall City is classified as humid continental, with hot summers and cold winters. The average temperature in the summer is around 75 degrees Fahrenheit, and the average temperature in the winter is around 25 degrees Fahrenheit.
Economy
Fall City’s economy is largely based on agriculture and manufacturing. The town is home to several factories, including a paper mill, a sawmill, and a flour mill. The town also has a railroad station, which allows for the transportation of goods and people.
The town is also home to several small businesses, including restaurants, shops, and other services. The town also has a few tourist attractions, such as the Fall City Historical Museum and the Fall City Art Gallery.
Demographics
As of the 2020 census, the population of Fall City was estimated to be around 5,000. The town has a diverse population, with people of various ethnic backgrounds. The majority of the population is white (90.2%), followed by Hispanic or Latino (4.2%), African American (2.3%), and Asian (1.3%).
The median household income in Fall City is $45,000, and the median home value is $125,000. The town has a high rate of homeownership, with over 70% of the population owning their own homes. The town also has a low unemployment rate, with only 3.2% of the population being unemployed.
Conclusion
Fall City, Indiana is a small town located in the northern part of the state, just south of the Michigan border. It was founded in 1837 by a group of settlers from Ohio, and has since grown to a population of over 5,000. The town has a diverse population, with people of various ethnic backgrounds, and a strong economy based on agriculture and manufacturing. The town also has a few tourist attractions, such as the Fall City Historical Museum and the Fall City Art Gallery. Fall City is a great place to live, work, and visit.
Common Questions
What is the Total Population of Windfall City?
Total Population of Windfall City is 740.
What is the Total Male Population of Windfall City?
Total Male Population of Windfall City is 324.
What is the Total Female Population of Windfall City?
Total Female Population of Windfall City is 416.
What is the Ratio of Males per 100 Females in Windfall City?
There are 77.88 Males per 100 Females in Windfall City.
What is the Ratio of Females per 100 Males in Windfall City?
There are 128.40 Females per 100 Males in Windfall City.
What is the Median Population Age in Windfall City?
Median Population Age in Windfall City is 36.7 Years.
What is the Average Family Size in Windfall City
Average Family Size in Windfall City is 2.7 People.
What is the Average Household Size in Windfall City
Average Household Size in Windfall City is 2.2 People.
What is Per Capita Income in Windfall City?
Per Capita income in Windfall City is $24,979.
What is the Median Family Income in Windfall City?
Median Family Income in Windfall City is $49,567.
What is the Median Household income in Windfall City?
Median Household Income in Windfall City is $47,576.
What is Income or Wage Gap in Windfall City?
Income or Wage Gap in Windfall City is 58.9%.
Women in Windfall City earn 41.1 cents for every dollar earned by a man.
What is Inequality or Gini Index in Windfall City?
Inequality or Gini Index in Windfall City is 0.42.
How Large is the Labor Force in Windfall City?
There are 368 People in the Labor Forcein in Windfall City.
What is the Percentage of People in the Labor Force in Windfall City?
58.0% of People are in the Labor Force in Windfall City.
What is the Unemployment Rate in Windfall City?
Unemployment Rate in Windfall City is 0.5%.