White County, IN
White County Map
White County Overview
24,630
TOTAL POPULATION
12,424
MALE POPULATION
12,206
FEMALE POPULATION
101.79
MALES / 100 FEMALES
98.25
FEMALES / 100 MALES
42.6
MEDIAN AGE
3.0
AVG FAMILY SIZE
2.5
AVG HOUSEHOLD SIZE
$32,001
PER CAPITA INCOME
$79,914
AVG FAMILY INCOME
$65,345
AVG HOUSEHOLD INCOME
38.0%
WAGE / INCOME GAP [ % ]
62.0¢/ $1
WAGE / INCOME GAP [ $ ]
$9,545
FAMILY INCOME DEFICIT
0.40
INEQUALITY / GINI INDEX
11,858
LABOR FORCE [ PEOPLE ]
60.7%
PERCENT IN LABOR FORCE
4.4%
UNEMPLOYMENT RATE
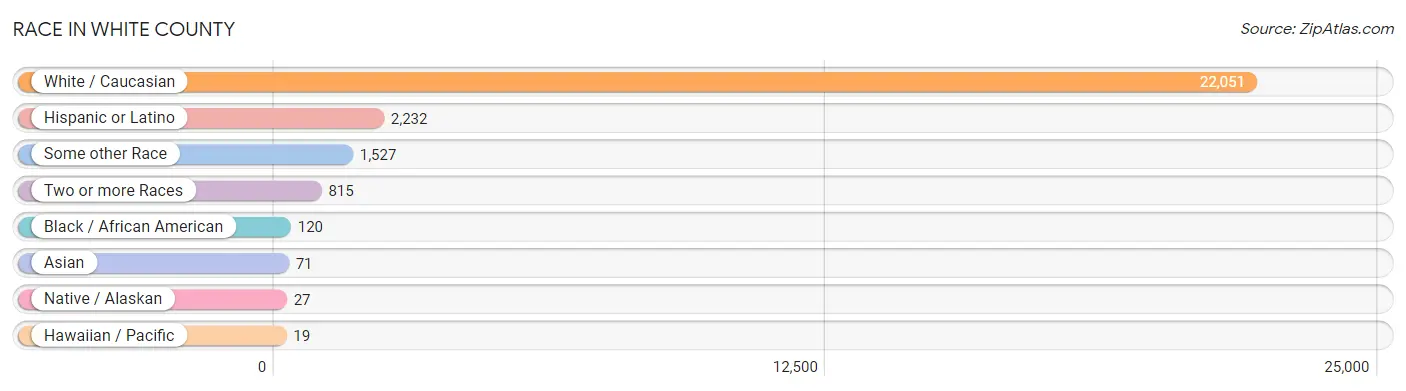
Race in White County
The most populous races in White County are White / Caucasian (22,051 | 89.5%), Hispanic or Latino (2,232 | 9.1%), and Some other Race (1,527 | 6.2%).
| Race | # Population | % Population |
| Asian | 71 | 0.3% |
| Black / African American | 120 | 0.5% |
| Hawaiian / Pacific | 19 | 0.1% |
| Hispanic or Latino | 2,232 | 9.1% |
| Native / Alaskan | 27 | 0.1% |
| White / Caucasian | 22,051 | 89.5% |
| Two or more Races | 815 | 3.3% |
| Some other Race | 1,527 | 6.2% |
| Total | 24,630 | 100.0% |
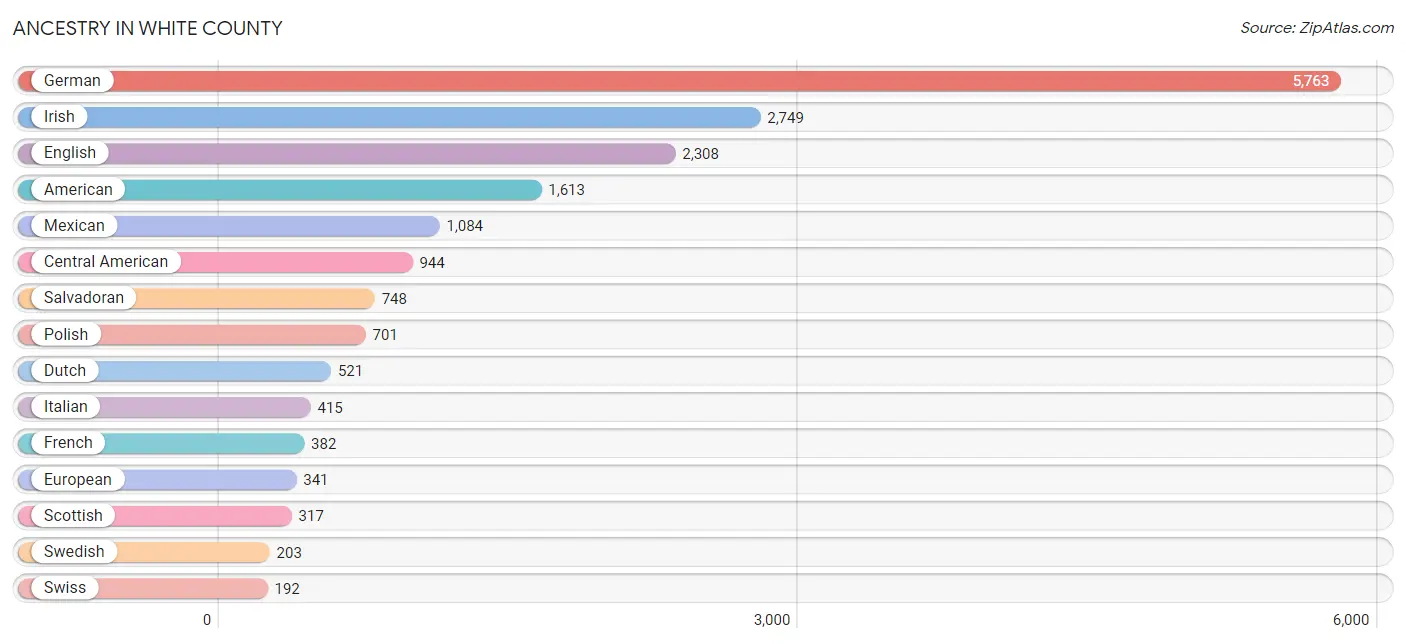
Ancestry in White County
The most populous ancestries reported in White County are German (5,763 | 23.4%), Irish (2,749 | 11.2%), English (2,308 | 9.4%), American (1,613 | 6.6%), and Mexican (1,084 | 4.4%), together accounting for 54.9% of all White County residents.
| Ancestry | # Population | % Population |
| African | 4 | 0.0% |
| Albanian | 63 | 0.3% |
| American | 1,613 | 6.6% |
| Arab | 6 | 0.0% |
| Australian | 9 | 0.0% |
| Austrian | 50 | 0.2% |
| Bhutanese | 14 | 0.1% |
| Blackfeet | 9 | 0.0% |
| British | 120 | 0.5% |
| Burmese | 7 | 0.0% |
| Canadian | 63 | 0.3% |
| Central American | 944 | 3.8% |
| Cherokee | 90 | 0.4% |
| Cheyenne | 5 | 0.0% |
| Colombian | 15 | 0.1% |
| Costa Rican | 6 | 0.0% |
| Cree | 9 | 0.0% |
| Croatian | 35 | 0.1% |
| Czech | 17 | 0.1% |
| Czechoslovakian | 1 | 0.0% |
| Danish | 8 | 0.0% |
| Dutch | 521 | 2.1% |
| Eastern European | 32 | 0.1% |
| Egyptian | 1 | 0.0% |
| English | 2,308 | 9.4% |
| European | 341 | 1.4% |
| French | 382 | 1.5% |
| French American Indian | 16 | 0.1% |
| French Canadian | 94 | 0.4% |
| German | 5,763 | 23.4% |
| Greek | 35 | 0.1% |
| Guamanian / Chamorro | 19 | 0.1% |
| Guatemalan | 158 | 0.6% |
| Honduran | 21 | 0.1% |
| Hungarian | 37 | 0.2% |
| Indian (Asian) | 16 | 0.1% |
| Irish | 2,749 | 11.2% |
| Italian | 415 | 1.7% |
| Jamaican | 7 | 0.0% |
| Korean | 79 | 0.3% |
| Laotian | 18 | 0.1% |
| Lebanese | 5 | 0.0% |
| Lithuanian | 11 | 0.0% |
| Mexican | 1,084 | 4.4% |
| Navajo | 2 | 0.0% |
| Northern European | 26 | 0.1% |
| Norwegian | 135 | 0.5% |
| Panamanian | 11 | 0.0% |
| Pennsylvania German | 5 | 0.0% |
| Polish | 701 | 2.9% |
| Portuguese | 24 | 0.1% |
| Puerto Rican | 19 | 0.1% |
| Romanian | 3 | 0.0% |
| Russian | 18 | 0.1% |
| Salvadoran | 748 | 3.0% |
| Samoan | 5 | 0.0% |
| Scandinavian | 16 | 0.1% |
| Scotch-Irish | 82 | 0.3% |
| Scottish | 317 | 1.3% |
| Slovak | 128 | 0.5% |
| Slovene | 5 | 0.0% |
| South American | 15 | 0.1% |
| Spaniard | 8 | 0.0% |
| Subsaharan African | 4 | 0.0% |
| Swedish | 203 | 0.8% |
| Swiss | 192 | 0.8% |
| Thai | 8 | 0.0% |
| Welsh | 86 | 0.4% | View All 68 Rows |
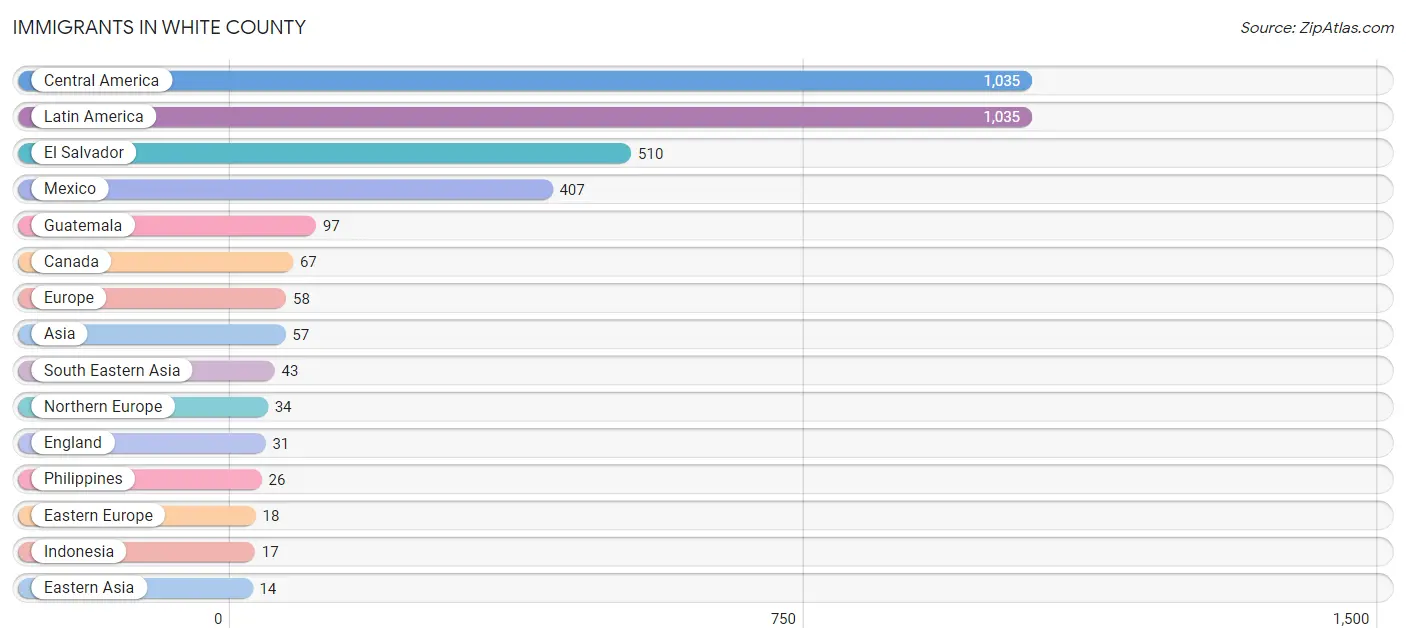
Immigrants in White County
The most numerous immigrant groups reported in White County came from Central America (1,035 | 4.2%), Latin America (1,035 | 4.2%), El Salvador (510 | 2.1%), Mexico (407 | 1.7%), and Guatemala (97 | 0.4%), together accounting for 12.5% of all White County residents.
| Immigration Origin | # Population | % Population |
| Albania | 10 | 0.0% |
| Asia | 57 | 0.2% |
| Canada | 67 | 0.3% |
| Central America | 1,035 | 4.2% |
| Eastern Asia | 14 | 0.1% |
| Eastern Europe | 18 | 0.1% |
| El Salvador | 510 | 2.1% |
| England | 31 | 0.1% |
| Europe | 58 | 0.2% |
| Germany | 2 | 0.0% |
| Greece | 4 | 0.0% |
| Guatemala | 97 | 0.4% |
| Honduras | 10 | 0.0% |
| Indonesia | 17 | 0.1% |
| Japan | 14 | 0.1% |
| Latin America | 1,035 | 4.2% |
| Mexico | 407 | 1.7% |
| Northern Europe | 34 | 0.1% |
| Panama | 11 | 0.0% |
| Philippines | 26 | 0.1% |
| Poland | 8 | 0.0% |
| Scotland | 3 | 0.0% |
| South Eastern Asia | 43 | 0.2% |
| Southern Europe | 4 | 0.0% |
| Western Europe | 2 | 0.0% | View All 25 Rows |
Sex and Age in White County
Sex and Age in White County
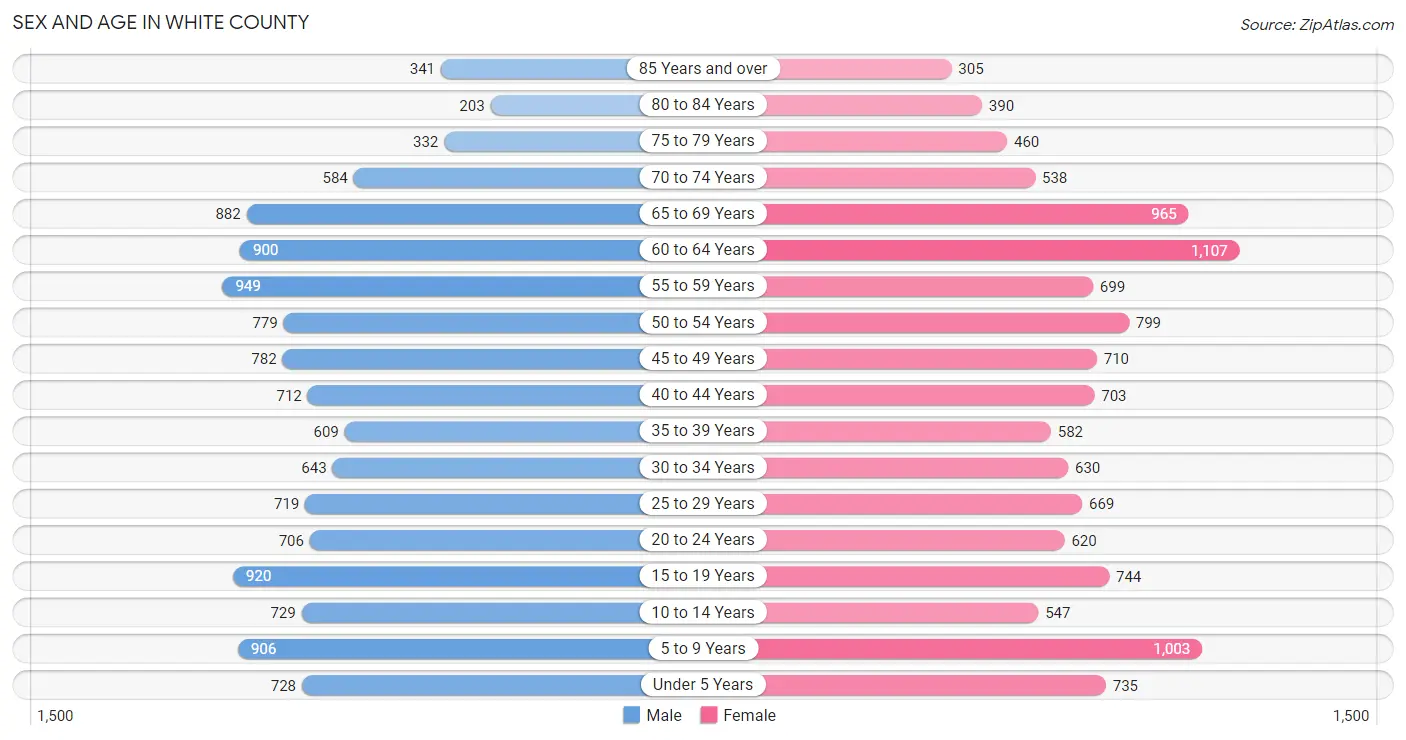
The most populous age groups in White County are 55 to 59 Years (949 | 7.6%) for men and 60 to 64 Years (1,107 | 9.1%) for women.
| Age Bracket | Male | Female |
| Under 5 Years | 728 (5.9%) | 735 (6.0%) |
| 5 to 9 Years | 906 (7.3%) | 1,003 (8.2%) |
| 10 to 14 Years | 729 (5.9%) | 547 (4.5%) |
| 15 to 19 Years | 920 (7.4%) | 744 (6.1%) |
| 20 to 24 Years | 706 (5.7%) | 620 (5.1%) |
| 25 to 29 Years | 719 (5.8%) | 669 (5.5%) |
| 30 to 34 Years | 643 (5.2%) | 630 (5.2%) |
| 35 to 39 Years | 609 (4.9%) | 582 (4.8%) |
| 40 to 44 Years | 712 (5.7%) | 703 (5.8%) |
| 45 to 49 Years | 782 (6.3%) | 710 (5.8%) |
| 50 to 54 Years | 779 (6.3%) | 799 (6.6%) |
| 55 to 59 Years | 949 (7.6%) | 699 (5.7%) |
| 60 to 64 Years | 900 (7.2%) | 1,107 (9.1%) |
| 65 to 69 Years | 882 (7.1%) | 965 (7.9%) |
| 70 to 74 Years | 584 (4.7%) | 538 (4.4%) |
| 75 to 79 Years | 332 (2.7%) | 460 (3.8%) |
| 80 to 84 Years | 203 (1.6%) | 390 (3.2%) |
| 85 Years and over | 341 (2.7%) | 305 (2.5%) |
| Total | 12,424 (100.0%) | 12,206 (100.0%) |
Families and Households in White County
Median Family Size in White County
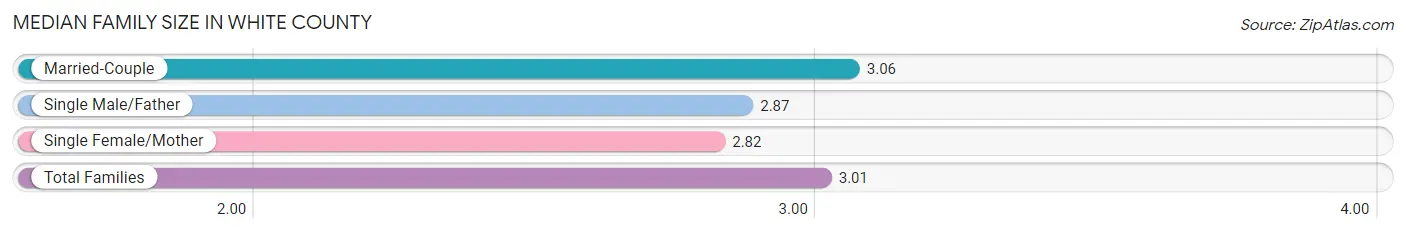
The median family size in White County is 3.01 persons per family, with married-couple families (5,033 | 77.0%) accounting for the largest median family size of 3.06 persons per family. On the other hand, single female/mother families (786 | 12.0%) represent the smallest median family size with 2.82 persons per family.
| Family Type | # Families | Family Size |
| Married-Couple | 5,033 (77.0%) | 3.06 |
| Single Male/Father | 719 (11.0%) | 2.87 |
| Single Female/Mother | 786 (12.0%) | 2.82 |
| Total Families | 6,538 (100.0%) | 3.01 |
Median Household Size in White County
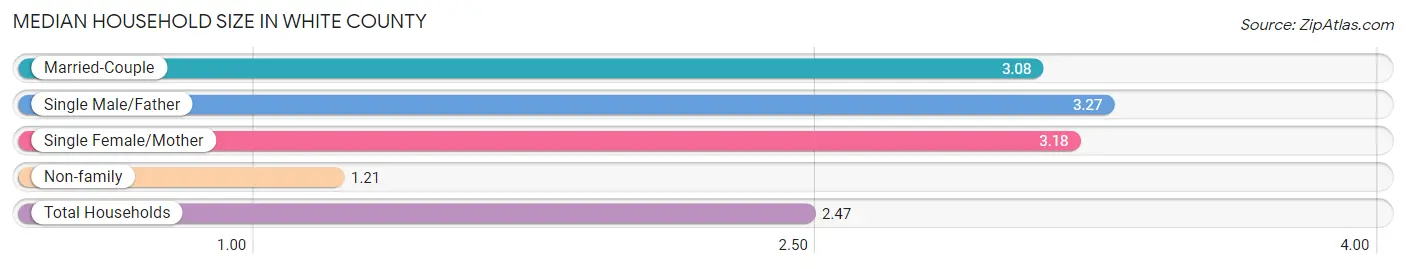
The median household size in White County is 2.47 persons per household, with single male/father households (719 | 7.3%) accounting for the largest median household size of 3.27 persons per household. non-family households (3,321 | 33.7%) represent the smallest median household size with 1.21 persons per household.
| Household Type | # Households | Household Size |
| Married-Couple | 5,033 (51.0%) | 3.08 |
| Single Male/Father | 719 (7.3%) | 3.27 |
| Single Female/Mother | 786 (8.0%) | 3.18 |
| Non-family | 3,321 (33.7%) | 1.21 |
| Total Households | 9,859 (100.0%) | 2.47 |
Household Size by Marriage Status in White County
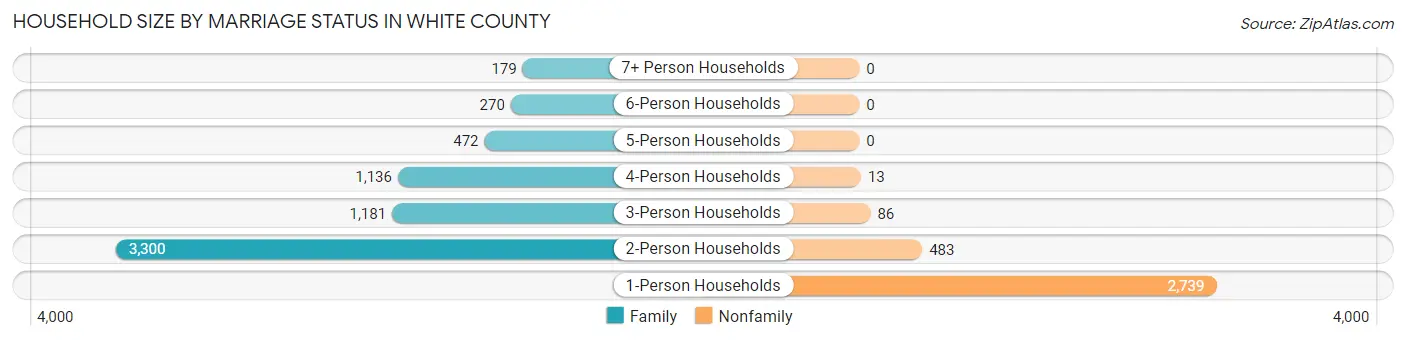
Out of a total of 9,859 households in White County, 6,538 (66.3%) are family households, while 3,321 (33.7%) are nonfamily households. The most numerous type of family households are 2-person households, comprising 3,300, and the most common type of nonfamily households are 1-person households, comprising 2,739.
| Household Size | Family Households | Nonfamily Households |
| 1-Person Households | - | 2,739 (27.8%) |
| 2-Person Households | 3,300 (33.5%) | 483 (4.9%) |
| 3-Person Households | 1,181 (12.0%) | 86 (0.9%) |
| 4-Person Households | 1,136 (11.5%) | 13 (0.1%) |
| 5-Person Households | 472 (4.8%) | 0 (0.0%) |
| 6-Person Households | 270 (2.7%) | 0 (0.0%) |
| 7+ Person Households | 179 (1.8%) | 0 (0.0%) |
| Total | 6,538 (66.3%) | 3,321 (33.7%) |
Female Fertility in White County
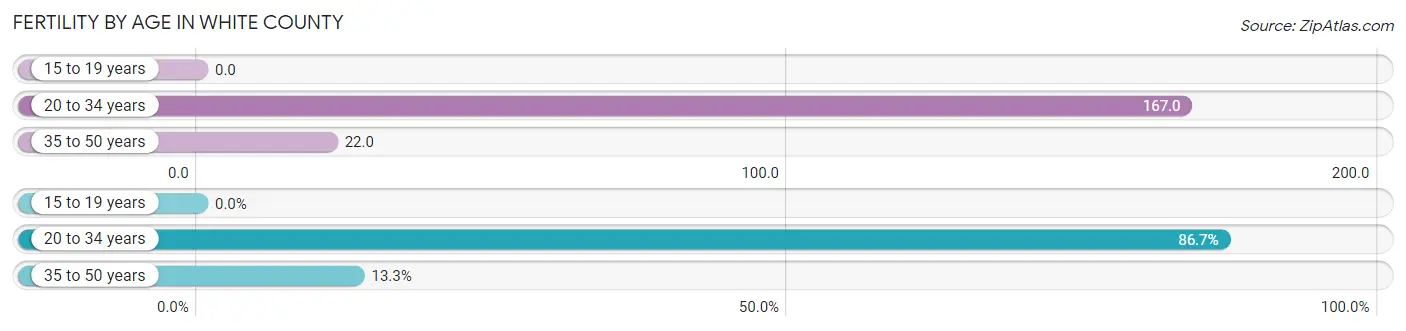
Fertility by Age in White County
Average fertility rate in White County is 76.0 births per 1,000 women. Women in the age bracket of 20 to 34 years have the highest fertility rate with 167.0 births per 1,000 women. Women in the age bracket of 20 to 34 years acount for 86.7% of all women with births.
| Age Bracket | Women with Births | Births / 1,000 Women |
| 15 to 19 years | 0 (0.0%) | 0.0 |
| 20 to 34 years | 320 (86.7%) | 167.0 |
| 35 to 50 years | 49 (13.3%) | 22.0 |
| Total | 369 (100.0%) | 76.0 |
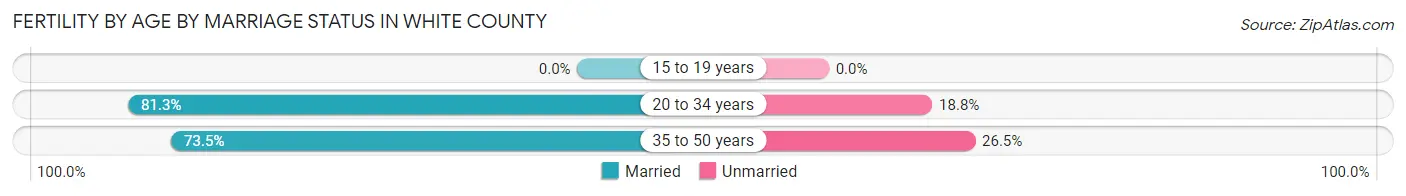
Fertility by Age by Marriage Status in White County
80.2% of women with births (369) in White County are married. The highest percentage of unmarried women with births falls into 35 to 50 years age bracket with 26.5% of them unmarried at the time of birth, while the lowest percentage of unmarried women with births belong to 20 to 34 years age bracket with 18.8% of them unmarried.
| Age Bracket | Married | Unmarried |
| 15 to 19 years | 0 (0.0%) | 0 (0.0%) |
| 20 to 34 years | 260 (81.2%) | 60 (18.8%) |
| 35 to 50 years | 36 (73.5%) | 13 (26.5%) |
| Total | 296 (80.2%) | 73 (19.8%) |
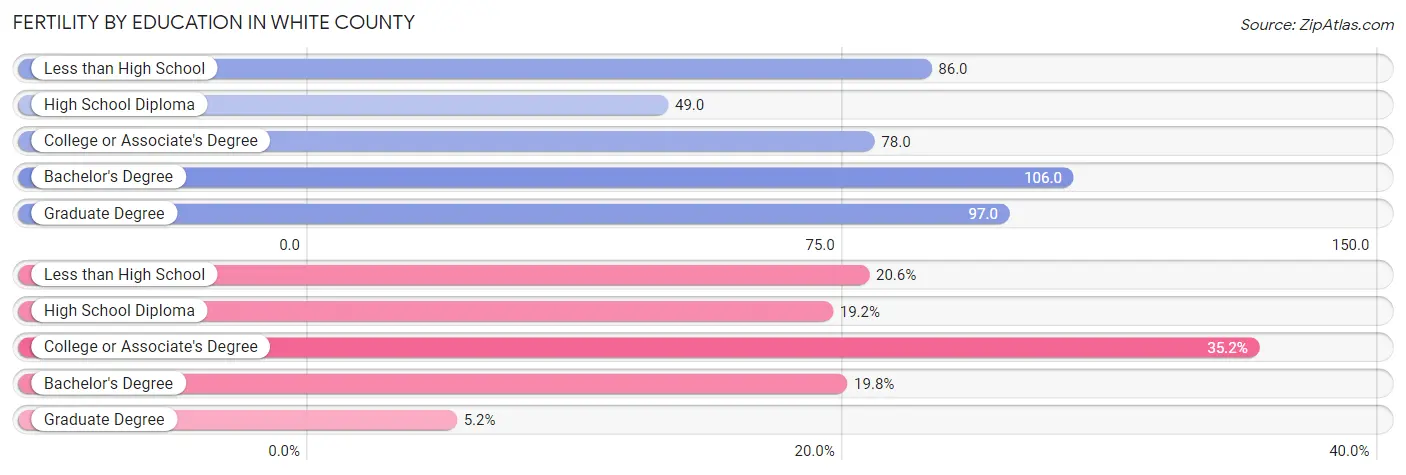
Fertility by Education in White County
Average fertility rate in White County is 76.0 births per 1,000 women. Women with the education attainment of bachelor's degree have the highest fertility rate of 106.0 births per 1,000 women, while women with the education attainment of high school diploma have the lowest fertility at 49.0 births per 1,000 women. Women with the education attainment of college or associate's degree represent 35.2% of all women with births.
| Educational Attainment | Women with Births | Births / 1,000 Women |
| Less than High School | 76 (20.6%) | 86.0 |
| High School Diploma | 71 (19.2%) | 49.0 |
| College or Associate's Degree | 130 (35.2%) | 78.0 |
| Bachelor's Degree | 73 (19.8%) | 106.0 |
| Graduate Degree | 19 (5.1%) | 97.0 |
| Total | 369 (100.0%) | 76.0 |
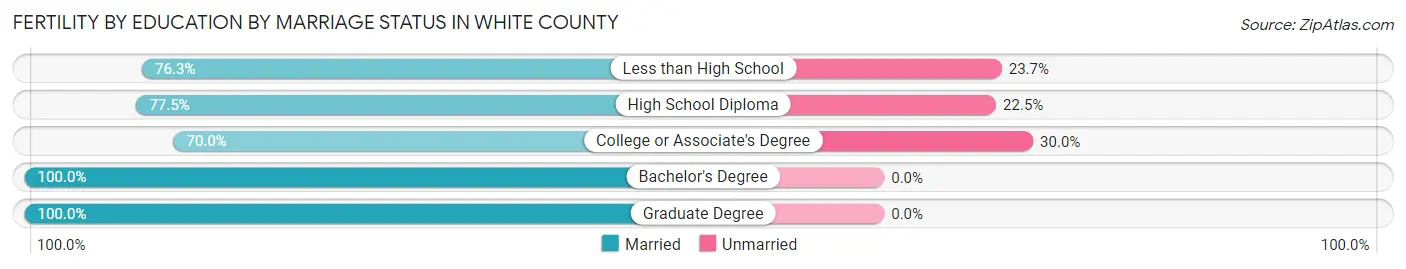
Fertility by Education by Marriage Status in White County
19.8% of women with births in White County are unmarried. Women with the educational attainment of bachelor's degree are most likely to be married with 100.0% of them married at childbirth, while women with the educational attainment of college or associate's degree are least likely to be married with 30.0% of them unmarried at childbirth.
| Educational Attainment | Married | Unmarried |
| Less than High School | 58 (76.3%) | 18 (23.7%) |
| High School Diploma | 55 (77.5%) | 16 (22.5%) |
| College or Associate's Degree | 91 (70.0%) | 39 (30.0%) |
| Bachelor's Degree | 73 (100.0%) | 0 (0.0%) |
| Graduate Degree | 19 (100.0%) | 0 (0.0%) |
| Total | 296 (80.2%) | 73 (19.8%) |
Income in White County
Income Overview in White County
Per Capita Income in White County is $32,001, while median incomes of families and households are $79,914 and $65,345 respectively.
| Characteristic | Number | Measure |
| Per Capita Income | 24,630 | $32,001 |
| Median Family Income | 6,538 | $79,914 |
| Mean Family Income | 6,538 | $92,770 |
| Median Household Income | 9,859 | $65,345 |
| Mean Household Income | 9,859 | $78,827 |
| Income Deficit | 6,538 | $9,545 |
| Wage / Income Gap (%) | 24,630 | 38.04% |
| Wage / Income Gap ($) | 24,630 | 61.96¢ per $1 |
| Gini / Inequality Index | 24,630 | 0.40 |
Earnings by Sex in White County
Average Earnings in White County are $40,322, $47,043 for men and $29,150 for women, a difference of 38.0%.
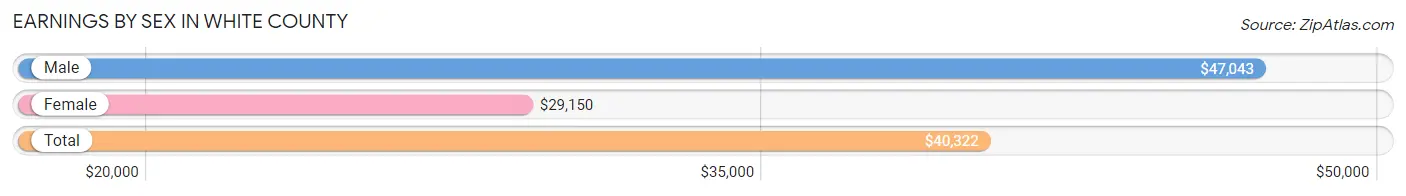
| Sex | Number | Average Earnings |
| Male | 7,017 (55.4%) | $47,043 |
| Female | 5,658 (44.6%) | $29,150 |
| Total | 12,675 (100.0%) | $40,322 |
Earnings by Sex by Income Bracket in White County
The most common earnings brackets in White County are $55,000 to $64,999 for men (765 | 10.9%) and $25,000 to $29,999 for women (548 | 9.7%).
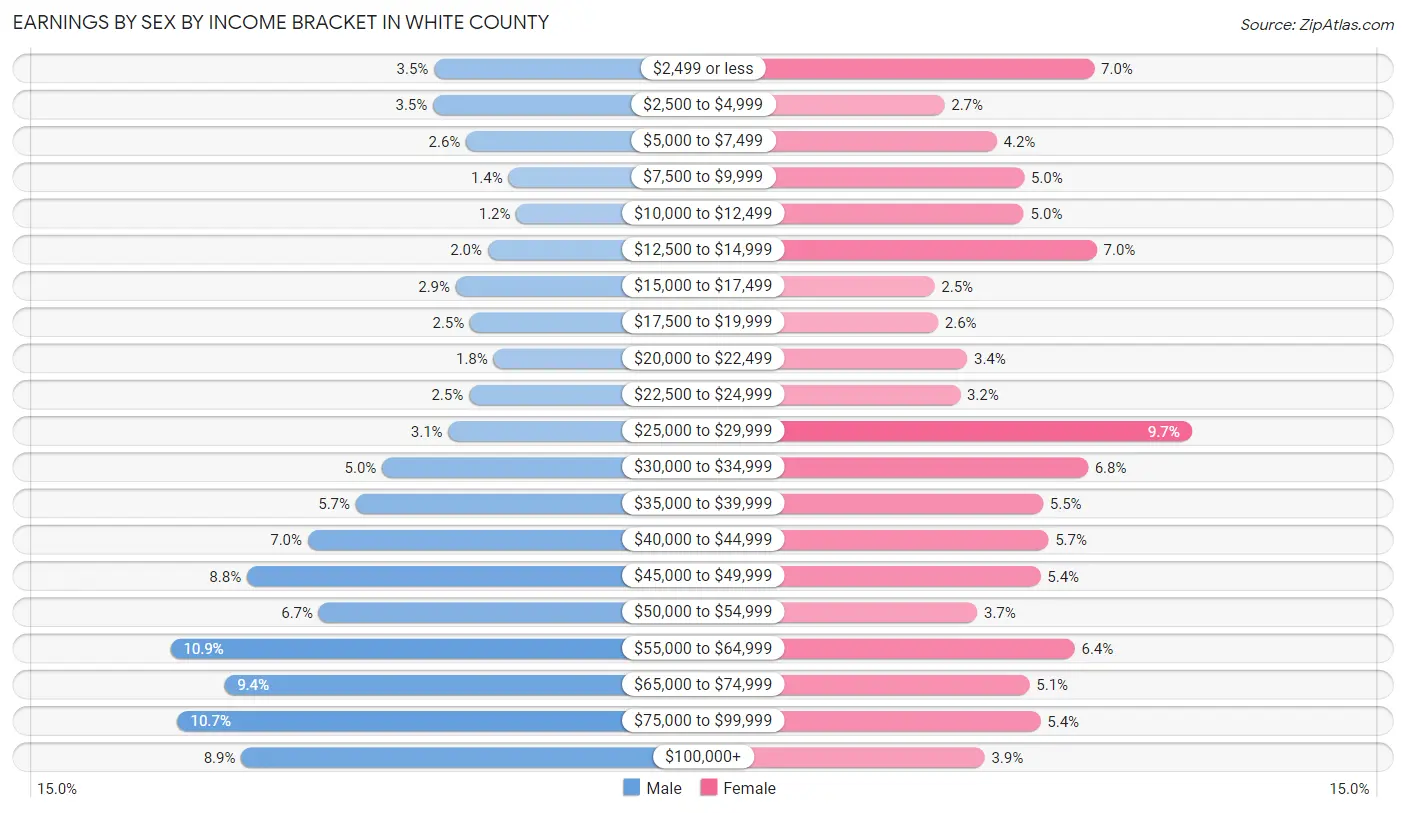
| Income | Male | Female |
| $2,499 or less | 245 (3.5%) | 393 (7.0%) |
| $2,500 to $4,999 | 247 (3.5%) | 155 (2.7%) |
| $5,000 to $7,499 | 182 (2.6%) | 238 (4.2%) |
| $7,500 to $9,999 | 98 (1.4%) | 282 (5.0%) |
| $10,000 to $12,499 | 83 (1.2%) | 281 (5.0%) |
| $12,500 to $14,999 | 139 (2.0%) | 397 (7.0%) |
| $15,000 to $17,499 | 202 (2.9%) | 139 (2.5%) |
| $17,500 to $19,999 | 174 (2.5%) | 145 (2.6%) |
| $20,000 to $22,499 | 128 (1.8%) | 191 (3.4%) |
| $22,500 to $24,999 | 176 (2.5%) | 180 (3.2%) |
| $25,000 to $29,999 | 217 (3.1%) | 548 (9.7%) |
| $30,000 to $34,999 | 347 (5.0%) | 383 (6.8%) |
| $35,000 to $39,999 | 399 (5.7%) | 312 (5.5%) |
| $40,000 to $44,999 | 494 (7.0%) | 320 (5.7%) |
| $45,000 to $49,999 | 614 (8.7%) | 308 (5.4%) |
| $50,000 to $54,999 | 472 (6.7%) | 207 (3.7%) |
| $55,000 to $64,999 | 765 (10.9%) | 362 (6.4%) |
| $65,000 to $74,999 | 659 (9.4%) | 290 (5.1%) |
| $75,000 to $99,999 | 751 (10.7%) | 308 (5.4%) |
| $100,000+ | 625 (8.9%) | 219 (3.9%) |
| Total | 7,017 (100.0%) | 5,658 (100.0%) |
Earnings by Sex by Educational Attainment in White County
Average earnings in White County are $52,342 for men and $32,488 for women, a difference of 37.9%. Men with an educational attainment of graduate degree enjoy the highest average annual earnings of $86,583, while those with less than high school education earn the least with $41,089. Women with an educational attainment of graduate degree earn the most with the average annual earnings of $56,367, while those with high school diploma education have the smallest earnings of $28,620.
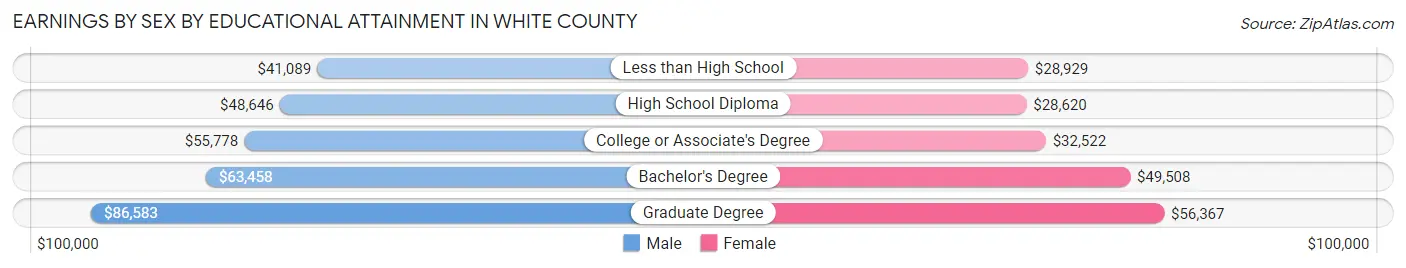
| Educational Attainment | Male Income | Female Income |
| Less than High School | $41,089 | $28,929 |
| High School Diploma | $48,646 | $28,620 |
| College or Associate's Degree | $55,778 | $32,522 |
| Bachelor's Degree | $63,458 | $49,508 |
| Graduate Degree | $86,583 | $56,367 |
| Total | $52,342 | $32,488 |
Family Income in White County
Family Income Brackets in White County
According to the White County family income data, there are 1,484 families falling into the $75,000 to $99,999 income range, which is the most common income bracket and makes up 22.7% of all families. Conversely, the $10,000 to $14,999 income bracket is the least frequent group with only 13 families (0.2%) belonging to this category.
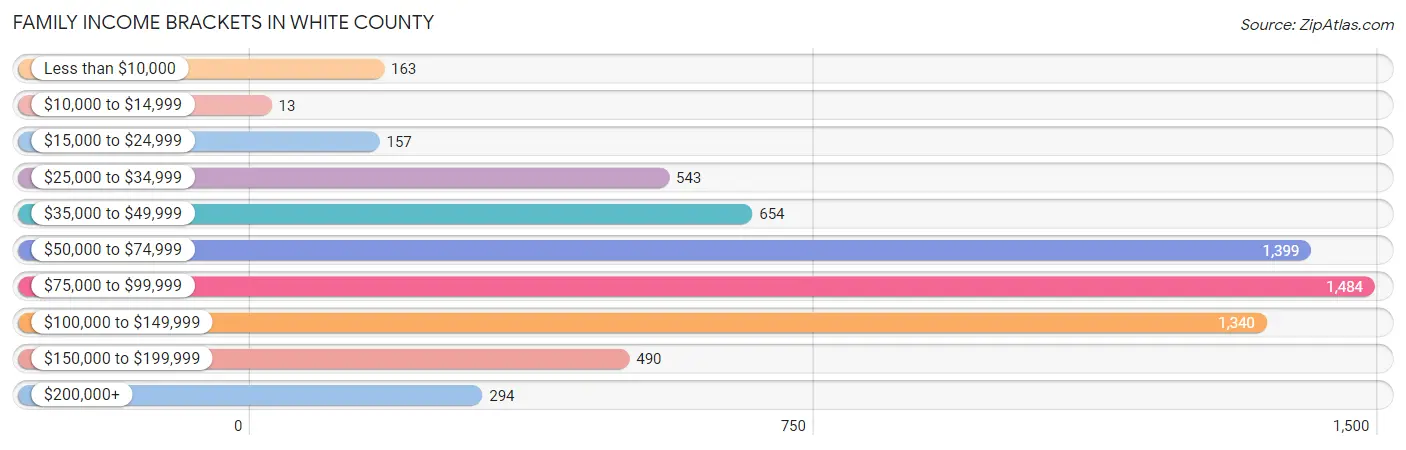
| Income Bracket | # Families | % Families |
| Less than $10,000 | 163 | 2.5% |
| $10,000 to $14,999 | 13 | 0.2% |
| $15,000 to $24,999 | 157 | 2.4% |
| $25,000 to $34,999 | 543 | 8.3% |
| $35,000 to $49,999 | 654 | 10.0% |
| $50,000 to $74,999 | 1,399 | 21.4% |
| $75,000 to $99,999 | 1,484 | 22.7% |
| $100,000 to $149,999 | 1,340 | 20.5% |
| $150,000 to $199,999 | 490 | 7.5% |
| $200,000+ | 294 | 4.5% |
Family Income by Famaliy Size in White County
7+ person families (118 | 1.8%) account for the highest median family income in White County with $117,250 per family, while 2-person families (3,627 | 55.5%) have the highest median income of $35,668 per family member.

| Income Bracket | # Families | Median Income |
| 2-Person Families | 3,627 (55.5%) | $71,336 |
| 3-Person Families | 1,038 (15.9%) | $78,947 |
| 4-Person Families | 1,026 (15.7%) | $92,067 |
| 5-Person Families | 445 (6.8%) | $83,115 |
| 6-Person Families | 284 (4.3%) | $84,375 |
| 7+ Person Families | 118 (1.8%) | $117,250 |
| Total | 6,538 (100.0%) | $79,914 |
Family Income by Number of Earners in White County
The median family income in White County is $79,914, with families comprising 3+ earners (690) having the highest median family income of $117,059, while families with 1 earner (1,969) have the lowest median family income of $54,764, accounting for 10.5% and 30.1% of families, respectively.
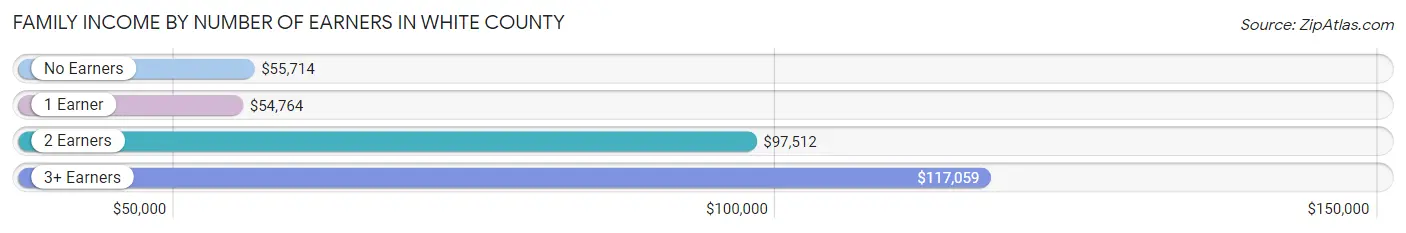
| Number of Earners | # Families | Median Income |
| No Earners | 1,154 (17.6%) | $55,714 |
| 1 Earner | 1,969 (30.1%) | $54,764 |
| 2 Earners | 2,725 (41.7%) | $97,512 |
| 3+ Earners | 690 (10.5%) | $117,059 |
| Total | 6,538 (100.0%) | $79,914 |
Household Income in White County
Household Income Brackets in White County
With 1,932 households falling in the category, the $50,000 to $74,999 income range is the most frequent in White County, accounting for 19.6% of all households. In contrast, only 325 households (3.3%) fall into the $10,000 to $14,999 income bracket, making it the least populous group.
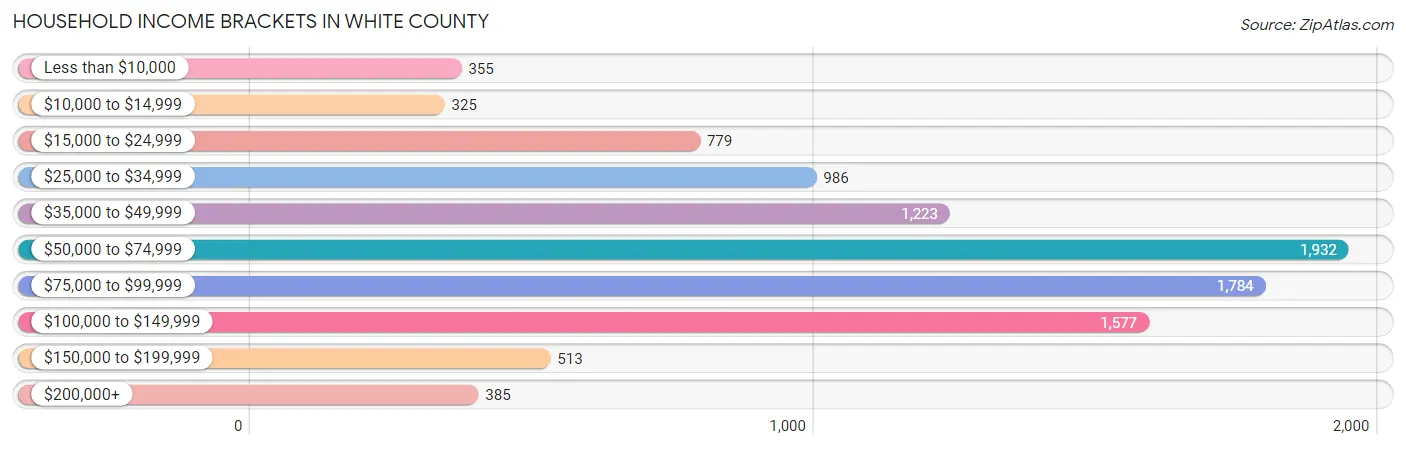
| Income Bracket | # Households | % Households |
| Less than $10,000 | 355 | 3.6% |
| $10,000 to $14,999 | 325 | 3.3% |
| $15,000 to $24,999 | 779 | 7.9% |
| $25,000 to $34,999 | 986 | 10.0% |
| $35,000 to $49,999 | 1,223 | 12.4% |
| $50,000 to $74,999 | 1,932 | 19.6% |
| $75,000 to $99,999 | 1,784 | 18.1% |
| $100,000 to $149,999 | 1,577 | 16.0% |
| $150,000 to $199,999 | 513 | 5.2% |
| $200,000+ | 385 | 3.9% |
Household Income by Householder Age in White County
The median household income in White County is $65,345, with the highest median household income of $83,093 found in the 45 to 64 years age bracket for the primary householder. A total of 3,728 households (37.8%) fall into this category. Meanwhile, the 15 to 24 years age bracket for the primary householder has the lowest median household income of $37,151, with 358 households (3.6%) in this group.
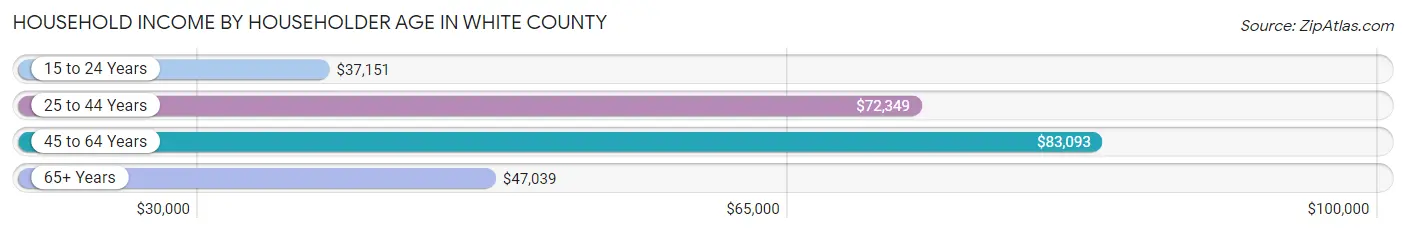
| Income Bracket | # Households | Median Income |
| 15 to 24 Years | 358 (3.6%) | $37,151 |
| 25 to 44 Years | 2,587 (26.2%) | $72,349 |
| 45 to 64 Years | 3,728 (37.8%) | $83,093 |
| 65+ Years | 3,186 (32.3%) | $47,039 |
| Total | 9,859 (100.0%) | $65,345 |
Poverty in White County
Income Below Poverty by Sex and Age in White County
With 7.3% poverty level for males and 10.1% for females among the residents of White County, 12 to 14 year old males and 18 to 24 year old females are the most vulnerable to poverty, with 88 males (17.6%) and 234 females (26.2%) in their respective age groups living below the poverty level.
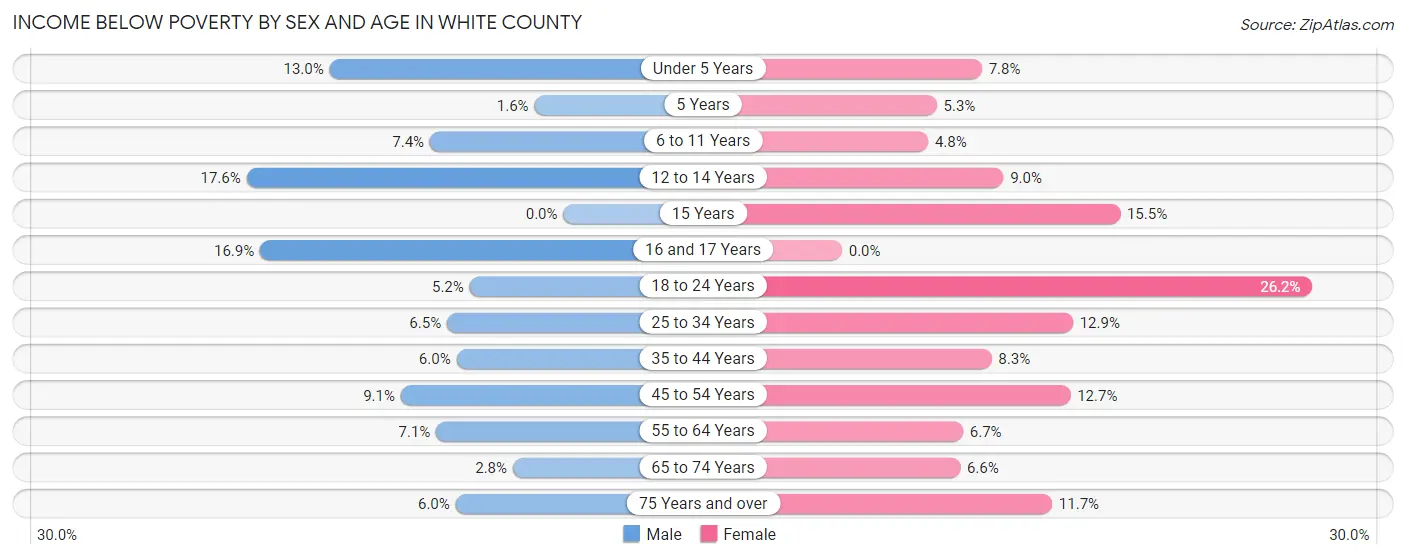
| Age Bracket | Male | Female |
| Under 5 Years | 85 (13.0%) | 56 (7.8%) |
| 5 Years | 2 (1.6%) | 14 (5.3%) |
| 6 to 11 Years | 73 (7.4%) | 47 (4.8%) |
| 12 to 14 Years | 88 (17.6%) | 25 (9.0%) |
| 15 Years | 0 (0.0%) | 35 (15.5%) |
| 16 and 17 Years | 62 (16.9%) | 0 (0.0%) |
| 18 to 24 Years | 54 (5.2%) | 234 (26.2%) |
| 25 to 34 Years | 87 (6.5%) | 167 (12.9%) |
| 35 to 44 Years | 77 (5.9%) | 107 (8.3%) |
| 45 to 54 Years | 140 (9.0%) | 192 (12.7%) |
| 55 to 64 Years | 131 (7.1%) | 121 (6.7%) |
| 65 to 74 Years | 41 (2.8%) | 98 (6.6%) |
| 75 Years and over | 52 (6.0%) | 121 (11.7%) |
| Total | 892 (7.3%) | 1,217 (10.1%) |
Income Above Poverty by Sex and Age in White County
According to the poverty statistics in White County, males aged 15 years and females aged 16 and 17 years are the age groups that are most secure financially, with 100.0% of males and 100.0% of females in these age groups living above the poverty line.
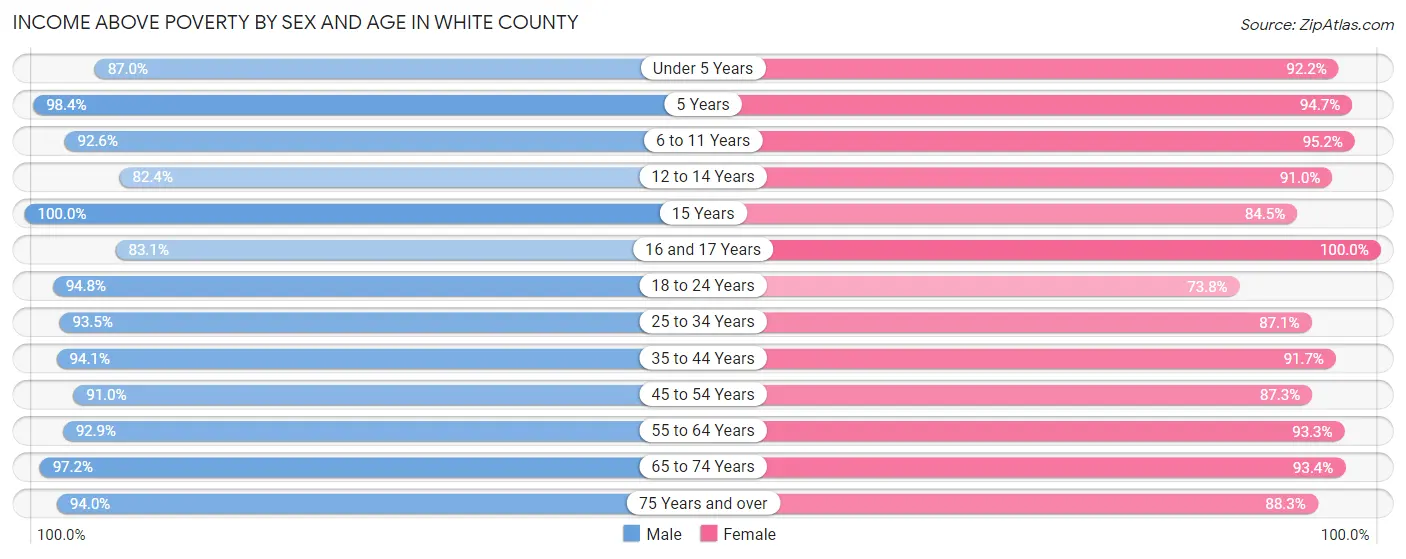
| Age Bracket | Male | Female |
| Under 5 Years | 568 (87.0%) | 663 (92.2%) |
| 5 Years | 122 (98.4%) | 251 (94.7%) |
| 6 to 11 Years | 910 (92.6%) | 933 (95.2%) |
| 12 to 14 Years | 411 (82.4%) | 253 (91.0%) |
| 15 Years | 221 (100.0%) | 191 (84.5%) |
| 16 and 17 Years | 305 (83.1%) | 245 (100.0%) |
| 18 to 24 Years | 981 (94.8%) | 659 (73.8%) |
| 25 to 34 Years | 1,256 (93.5%) | 1,132 (87.1%) |
| 35 to 44 Years | 1,218 (94.1%) | 1,178 (91.7%) |
| 45 to 54 Years | 1,407 (90.9%) | 1,317 (87.3%) |
| 55 to 64 Years | 1,718 (92.9%) | 1,675 (93.3%) |
| 65 to 74 Years | 1,416 (97.2%) | 1,391 (93.4%) |
| 75 Years and over | 815 (94.0%) | 913 (88.3%) |
| Total | 11,348 (92.7%) | 10,801 (89.9%) |
Income Below Poverty Among Married-Couple Families in White County
The poverty statistics for married-couple families in White County show that 3.0% or 153 of the total 5,033 families live below the poverty line. Families with 3 or 4 children have the highest poverty rate of 9.5%, comprising of 52 families. On the other hand, families with 5 or more children have the lowest poverty rate of 0.0%, which includes 0 families.
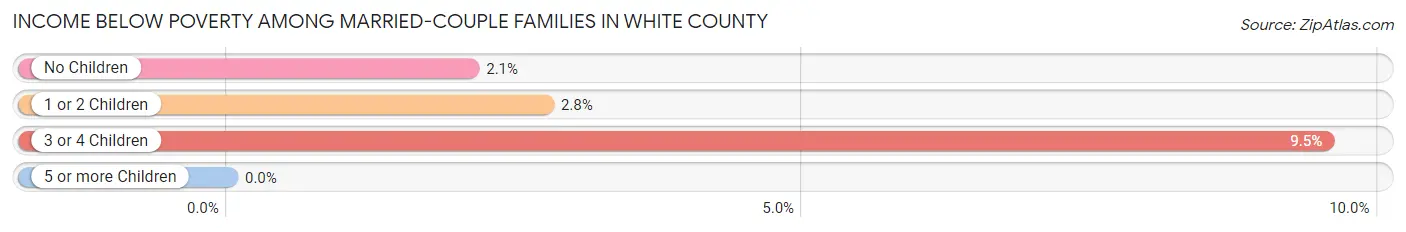
| Children | Above Poverty | Below Poverty |
| No Children | 3,126 (97.9%) | 67 (2.1%) |
| 1 or 2 Children | 1,204 (97.3%) | 34 (2.8%) |
| 3 or 4 Children | 493 (90.5%) | 52 (9.5%) |
| 5 or more Children | 57 (100.0%) | 0 (0.0%) |
| Total | 4,880 (97.0%) | 153 (3.0%) |
Income Below Poverty Among Single-Parent Households in White County
According to the poverty data in White County, 5.8% or 42 single-father households and 17.2% or 135 single-mother households are living below the poverty line. Among single-father households, those with 5 or more children have the highest poverty rate, with 3 households (100.0%) experiencing poverty. Likewise, among single-mother households, those with 3 or 4 children have the highest poverty rate, with 15 households (50.0%) falling below the poverty line.

| Children | Single Father | Single Mother |
| No Children | 12 (3.4%) | 14 (5.6%) |
| 1 or 2 Children | 27 (9.2%) | 106 (20.9%) |
| 3 or 4 Children | 0 (0.0%) | 15 (50.0%) |
| 5 or more Children | 3 (100.0%) | 0 (0.0%) |
| Total | 42 (5.8%) | 135 (17.2%) |
Income Below Poverty Among Married-Couple vs Single-Parent Households in White County
The poverty data for White County shows that 153 of the married-couple family households (3.0%) and 177 of the single-parent households (11.8%) are living below the poverty level. Within the married-couple family households, those with 3 or 4 children have the highest poverty rate, with 52 households (9.5%) falling below the poverty line. Among the single-parent households, those with 5 or more children have the highest poverty rate, with 3 household (100.0%) living below poverty.
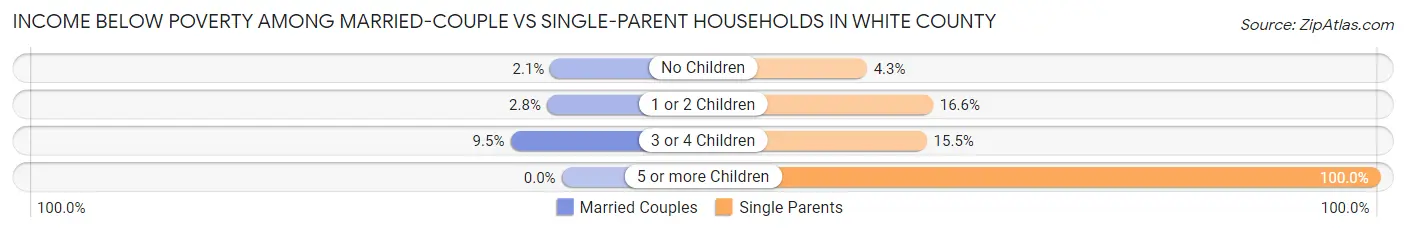
| Children | Married-Couple Families | Single-Parent Households |
| No Children | 67 (2.1%) | 26 (4.3%) |
| 1 or 2 Children | 34 (2.8%) | 133 (16.6%) |
| 3 or 4 Children | 52 (9.5%) | 15 (15.5%) |
| 5 or more Children | 0 (0.0%) | 3 (100.0%) |
| Total | 153 (3.0%) | 177 (11.8%) |
Employment Characteristics in White County
Employment by Class of Employer in White County
Among the 11,067 employed individuals in White County, private company employees (7,535 | 68.1%), local government employees (864 | 7.8%), and not-for-profit organizations (822 | 7.4%) make up the most common classes of employment.
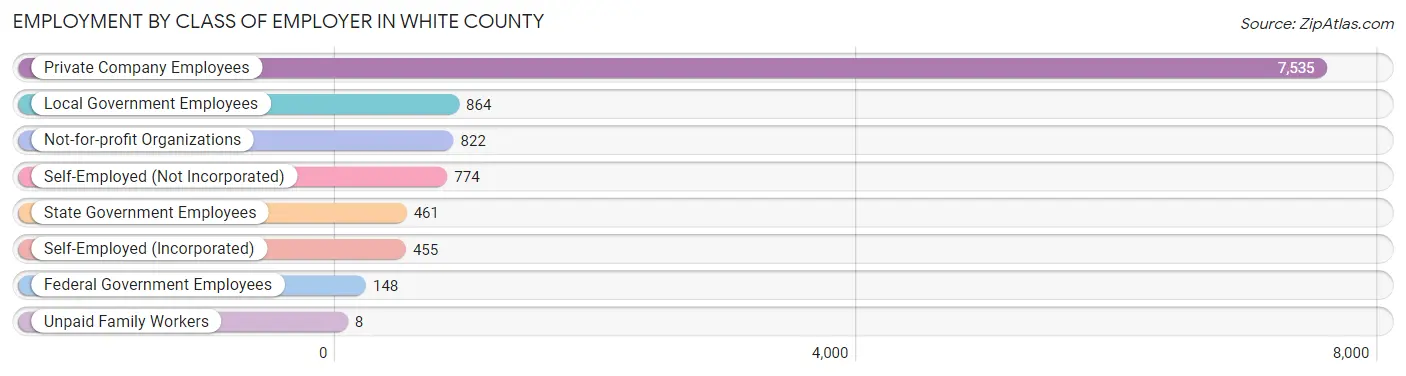
| Employer Class | # Employees | % Employees |
| Private Company Employees | 7,535 | 68.1% |
| Self-Employed (Incorporated) | 455 | 4.1% |
| Self-Employed (Not Incorporated) | 774 | 7.0% |
| Not-for-profit Organizations | 822 | 7.4% |
| Local Government Employees | 864 | 7.8% |
| State Government Employees | 461 | 4.2% |
| Federal Government Employees | 148 | 1.3% |
| Unpaid Family Workers | 8 | 0.1% |
| Total | 11,067 | 100.0% |
Employment Status by Age in White County
According to the labor force statistics for White County, out of the total population over 16 years of age (19,535), 60.7% or 11,858 individuals are in the labor force, with 4.4% or 522 of them unemployed. The age group with the highest labor force participation rate is 25 to 29 years, with 84.7% or 1,176 individuals in the labor force. Within the labor force, the 20 to 24 years age range has the highest percentage of unemployed individuals, with 15.9% or 171 of them being unemployed.
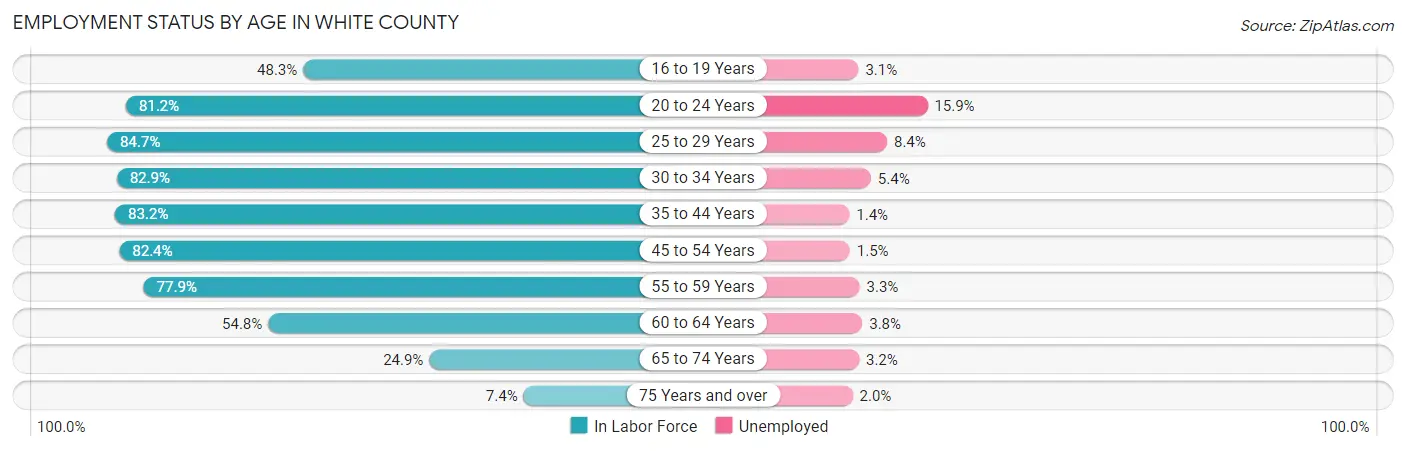
| Age Bracket | In Labor Force | Unemployed |
| 16 to 19 Years | 588 (48.3%) | 18 (3.1%) |
| 20 to 24 Years | 1,077 (81.2%) | 171 (15.9%) |
| 25 to 29 Years | 1,176 (84.7%) | 99 (8.4%) |
| 30 to 34 Years | 1,055 (82.9%) | 57 (5.4%) |
| 35 to 44 Years | 2,168 (83.2%) | 30 (1.4%) |
| 45 to 54 Years | 2,530 (82.4%) | 38 (1.5%) |
| 55 to 59 Years | 1,284 (77.9%) | 42 (3.3%) |
| 60 to 64 Years | 1,100 (54.8%) | 42 (3.8%) |
| 65 to 74 Years | 739 (24.9%) | 24 (3.2%) |
| 75 Years and over | 150 (7.4%) | 3 (2.0%) |
| Total | 11,858 (60.7%) | 522 (4.4%) |
Employment Status by Educational Attainment in White County
According to labor force statistics for White County, 77.6% of individuals (9,306) out of the total population between 25 and 64 years of age (11,992) are in the labor force, with 3.3% or 307 of them being unemployed. The group with the highest labor force participation rate are those with the educational attainment of bachelor's degree or higher, with 86.2% or 1,993 individuals in the labor force. Within the labor force, individuals with high school diploma education have the highest percentage of unemployment, with 5.2% or 165 of them being unemployed.
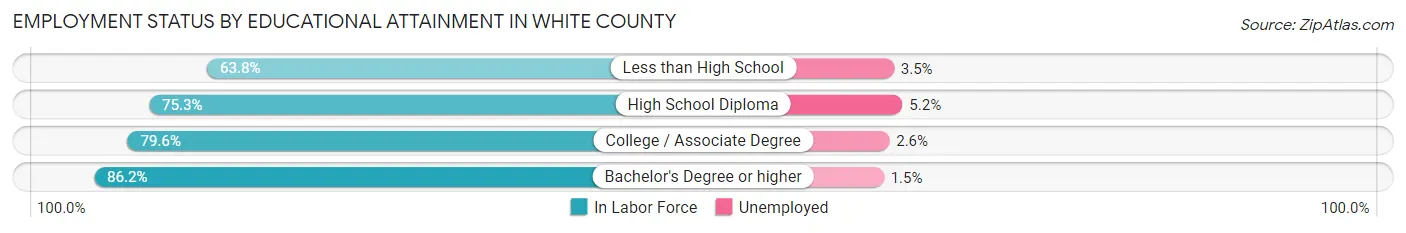
| Educational Attainment | In Labor Force | Unemployed |
| Less than High School | 838 (63.8%) | 46 (3.5%) |
| High School Diploma | 3,175 (75.3%) | 219 (5.2%) |
| College / Associate Degree | 3,303 (79.6%) | 108 (2.6%) |
| Bachelor's Degree or higher | 1,993 (86.2%) | 35 (1.5%) |
| Total | 9,306 (77.6%) | 396 (3.3%) |
Employment Occupations by Sex in White County
Management, Business, Science and Arts Occupations
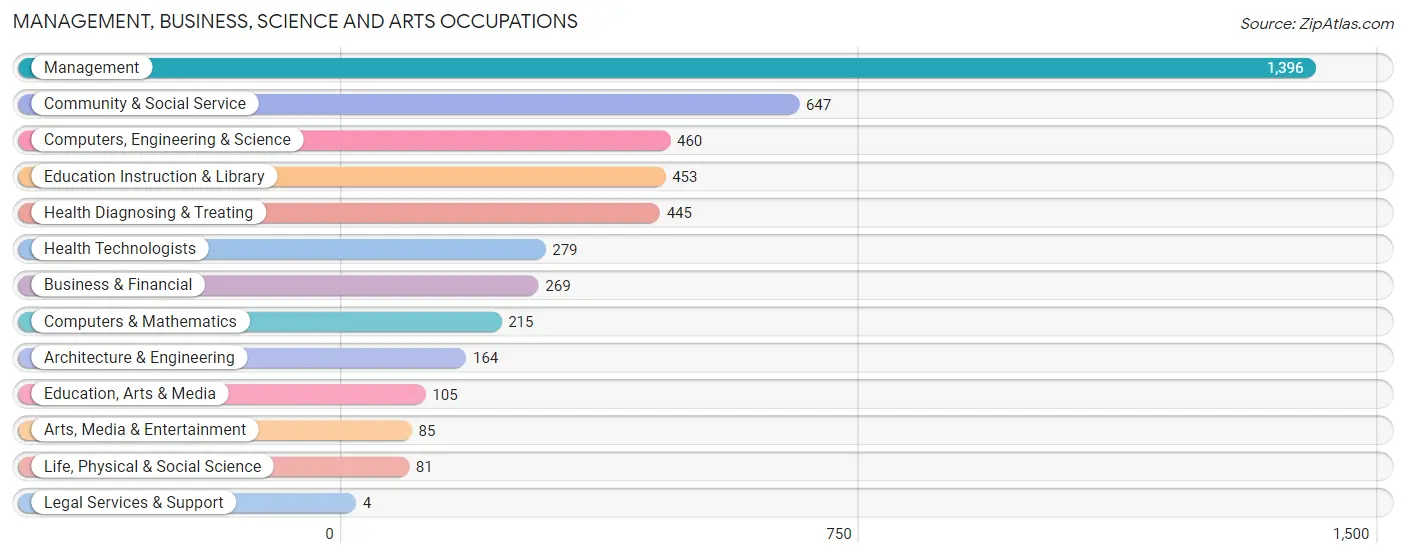
The most common Management, Business, Science and Arts occupations in White County are Management (1,396 | 12.3%), Community & Social Service (647 | 5.7%), Computers, Engineering & Science (460 | 4.1%), Education Instruction & Library (453 | 4.0%), and Health Diagnosing & Treating (445 | 3.9%).
Management, Business, Science and Arts Occupations by Sex
Within the Management, Business, Science and Arts occupations in White County, the most male-oriented occupations are Legal Services & Support (100.0%), Architecture & Engineering (93.9%), and Life, Physical & Social Science (86.4%), while the most female-oriented occupations are Health Diagnosing & Treating (94.8%), Health Technologists (94.6%), and Arts, Media & Entertainment (88.2%).
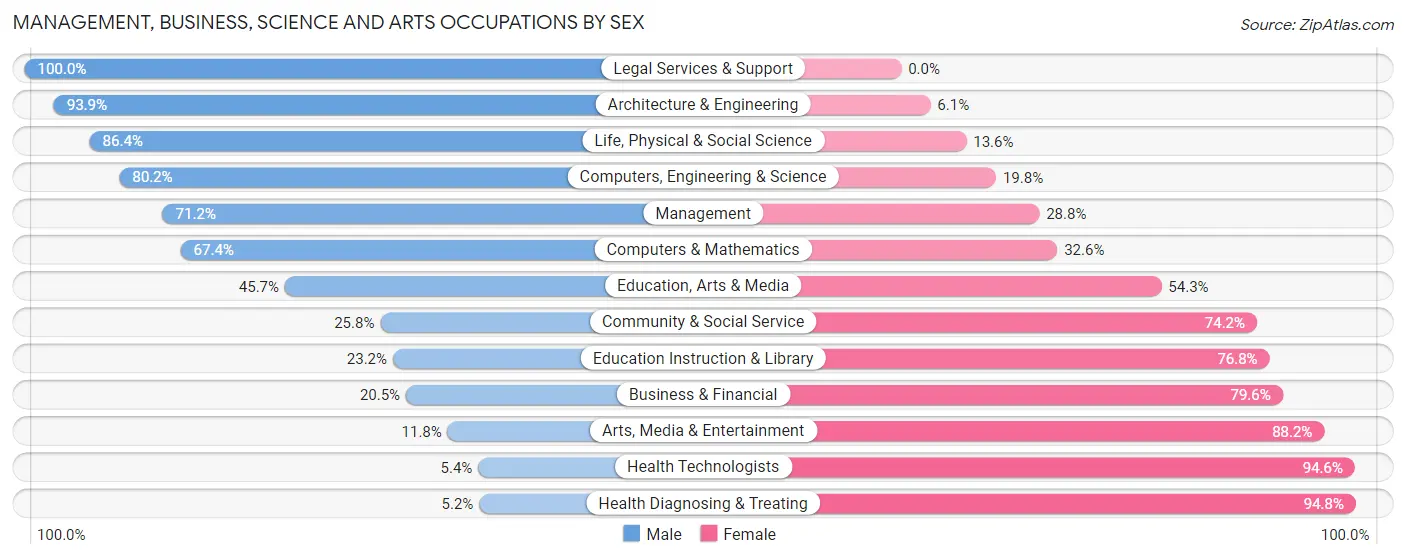
| Occupation | Male | Female |
| Management | 994 (71.2%) | 402 (28.8%) |
| Business & Financial | 55 (20.4%) | 214 (79.5%) |
| Computers, Engineering & Science | 369 (80.2%) | 91 (19.8%) |
| Computers & Mathematics | 145 (67.4%) | 70 (32.6%) |
| Architecture & Engineering | 154 (93.9%) | 10 (6.1%) |
| Life, Physical & Social Science | 70 (86.4%) | 11 (13.6%) |
| Community & Social Service | 167 (25.8%) | 480 (74.2%) |
| Education, Arts & Media | 48 (45.7%) | 57 (54.3%) |
| Legal Services & Support | 4 (100.0%) | 0 (0.0%) |
| Education Instruction & Library | 105 (23.2%) | 348 (76.8%) |
| Arts, Media & Entertainment | 10 (11.8%) | 75 (88.2%) |
| Health Diagnosing & Treating | 23 (5.2%) | 422 (94.8%) |
| Health Technologists | 15 (5.4%) | 264 (94.6%) |
| Total (Category) | 1,608 (50.0%) | 1,609 (50.0%) |
| Total (Overall) | 6,420 (56.6%) | 4,920 (43.4%) |
Services Occupations
The most common Services occupations in White County are Cleaning & Maintenance (574 | 5.1%), Food Preparation & Serving (499 | 4.4%), Personal Care & Service (312 | 2.8%), Healthcare Support (188 | 1.7%), and Security & Protection (167 | 1.5%).
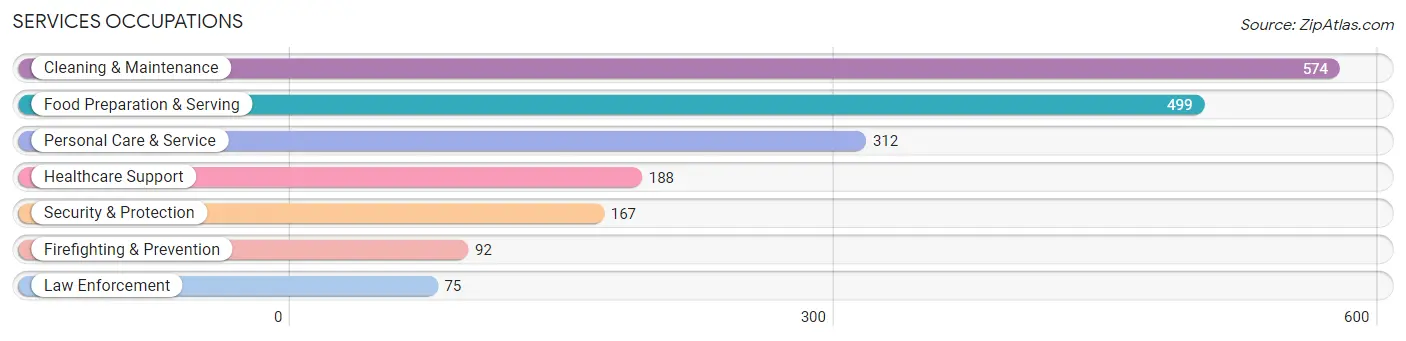
Services Occupations by Sex
Within the Services occupations in White County, the most male-oriented occupations are Law Enforcement (69.3%), Cleaning & Maintenance (67.8%), and Security & Protection (64.1%), while the most female-oriented occupations are Personal Care & Service (96.2%), Healthcare Support (89.9%), and Food Preparation & Serving (64.5%).

| Occupation | Male | Female |
| Healthcare Support | 19 (10.1%) | 169 (89.9%) |
| Security & Protection | 107 (64.1%) | 60 (35.9%) |
| Firefighting & Prevention | 55 (59.8%) | 37 (40.2%) |
| Law Enforcement | 52 (69.3%) | 23 (30.7%) |
| Food Preparation & Serving | 177 (35.5%) | 322 (64.5%) |
| Cleaning & Maintenance | 389 (67.8%) | 185 (32.2%) |
| Personal Care & Service | 12 (3.8%) | 300 (96.2%) |
| Total (Category) | 704 (40.5%) | 1,036 (59.5%) |
| Total (Overall) | 6,420 (56.6%) | 4,920 (43.4%) |
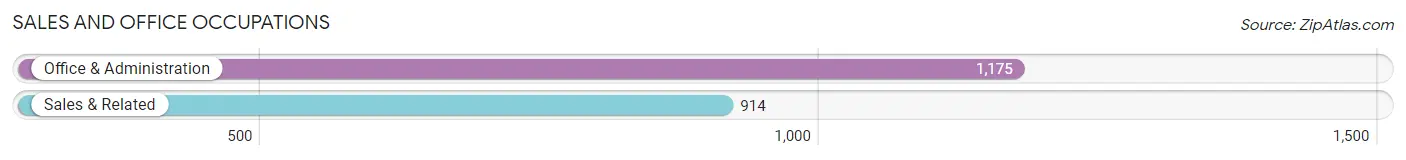
Sales and Office Occupations
The most common Sales and Office occupations in White County are Office & Administration (1,175 | 10.4%), and Sales & Related (914 | 8.1%).
Sales and Office Occupations by Sex
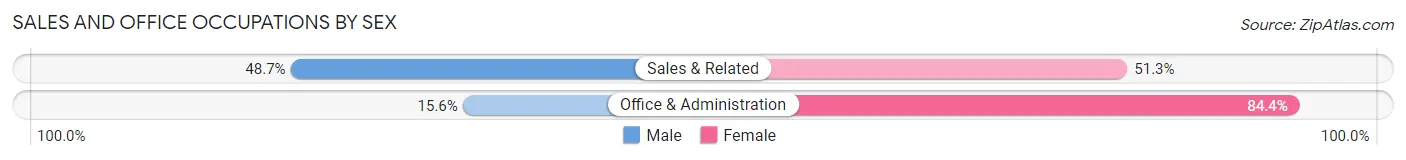
| Occupation | Male | Female |
| Sales & Related | 445 (48.7%) | 469 (51.3%) |
| Office & Administration | 183 (15.6%) | 992 (84.4%) |
| Total (Category) | 628 (30.1%) | 1,461 (69.9%) |
| Total (Overall) | 6,420 (56.6%) | 4,920 (43.4%) |
Natural Resources, Construction and Maintenance Occupations
The most common Natural Resources, Construction and Maintenance occupations in White County are Installation, Maintenance & Repair (431 | 3.8%), Construction & Extraction (407 | 3.6%), and Farming, Fishing & Forestry (216 | 1.9%).

Natural Resources, Construction and Maintenance Occupations by Sex

| Occupation | Male | Female |
| Farming, Fishing & Forestry | 208 (96.3%) | 8 (3.7%) |
| Construction & Extraction | 399 (98.0%) | 8 (2.0%) |
| Installation, Maintenance & Repair | 408 (94.7%) | 23 (5.3%) |
| Total (Category) | 1,015 (96.3%) | 39 (3.7%) |
| Total (Overall) | 6,420 (56.6%) | 4,920 (43.4%) |
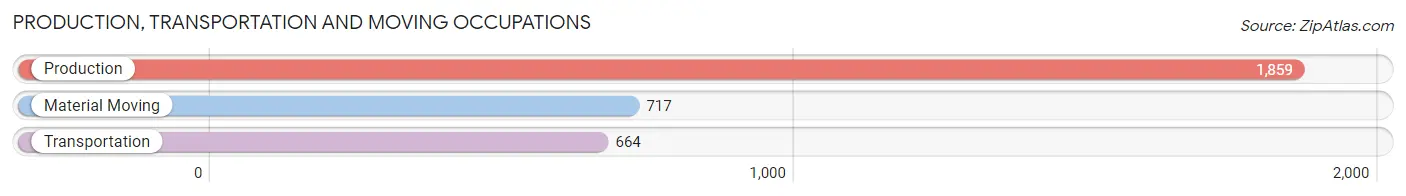
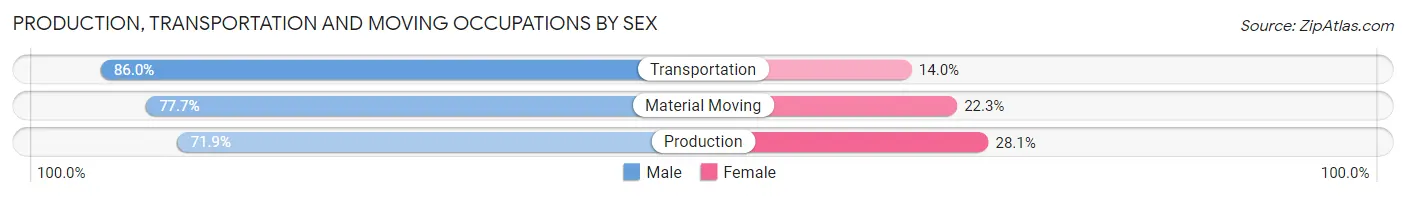
Production, Transportation and Moving Occupations
The most common Production, Transportation and Moving occupations in White County are Production (1,859 | 16.4%), Material Moving (717 | 6.3%), and Transportation (664 | 5.9%).
Production, Transportation and Moving Occupations by Sex
| Occupation | Male | Female |
| Production | 1,337 (71.9%) | 522 (28.1%) |
| Transportation | 571 (86.0%) | 93 (14.0%) |
| Material Moving | 557 (77.7%) | 160 (22.3%) |
| Total (Category) | 2,465 (76.1%) | 775 (23.9%) |
| Total (Overall) | 6,420 (56.6%) | 4,920 (43.4%) |
Employment Industries by Sex in White County
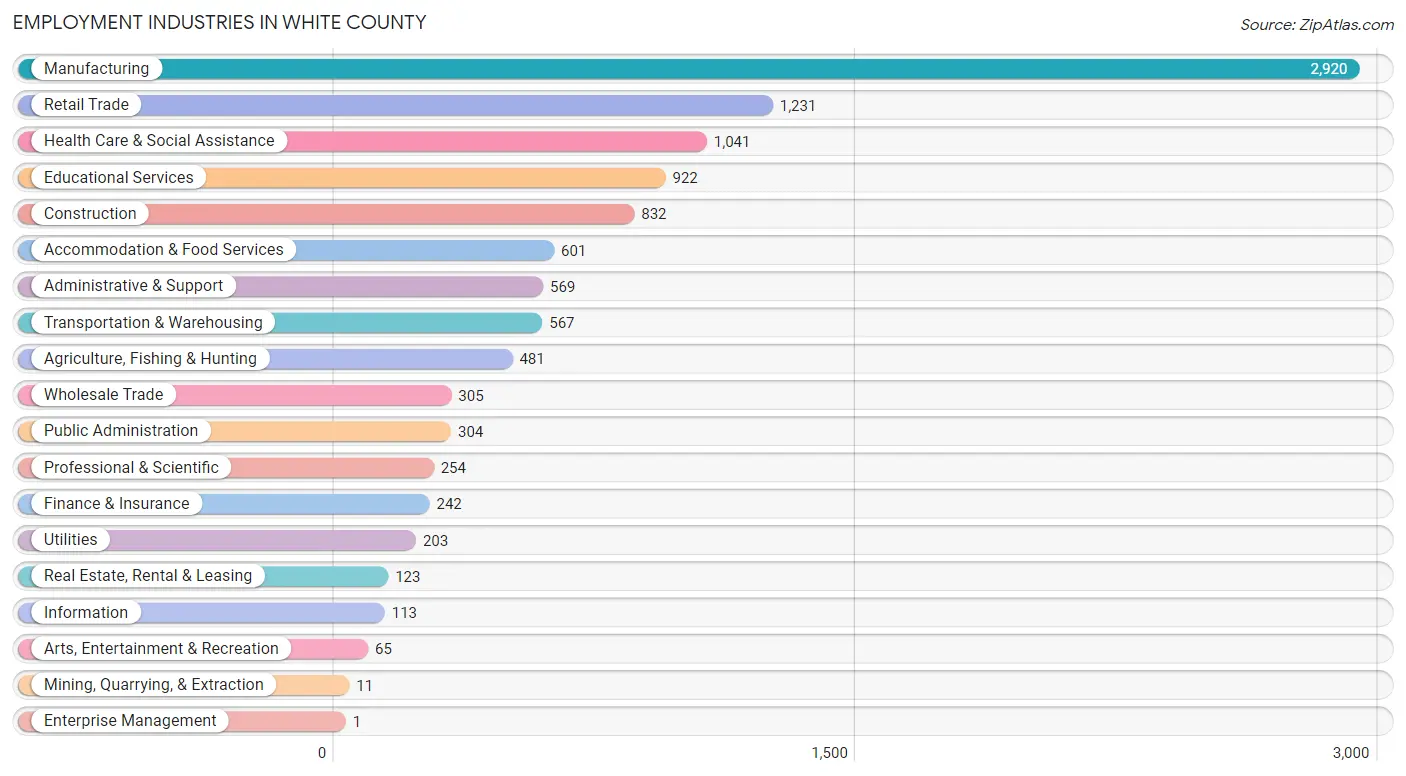
Employment Industries in White County
The major employment industries in White County include Manufacturing (2,920 | 25.8%), Retail Trade (1,231 | 10.9%), Health Care & Social Assistance (1,041 | 9.2%), Educational Services (922 | 8.1%), and Construction (832 | 7.3%).
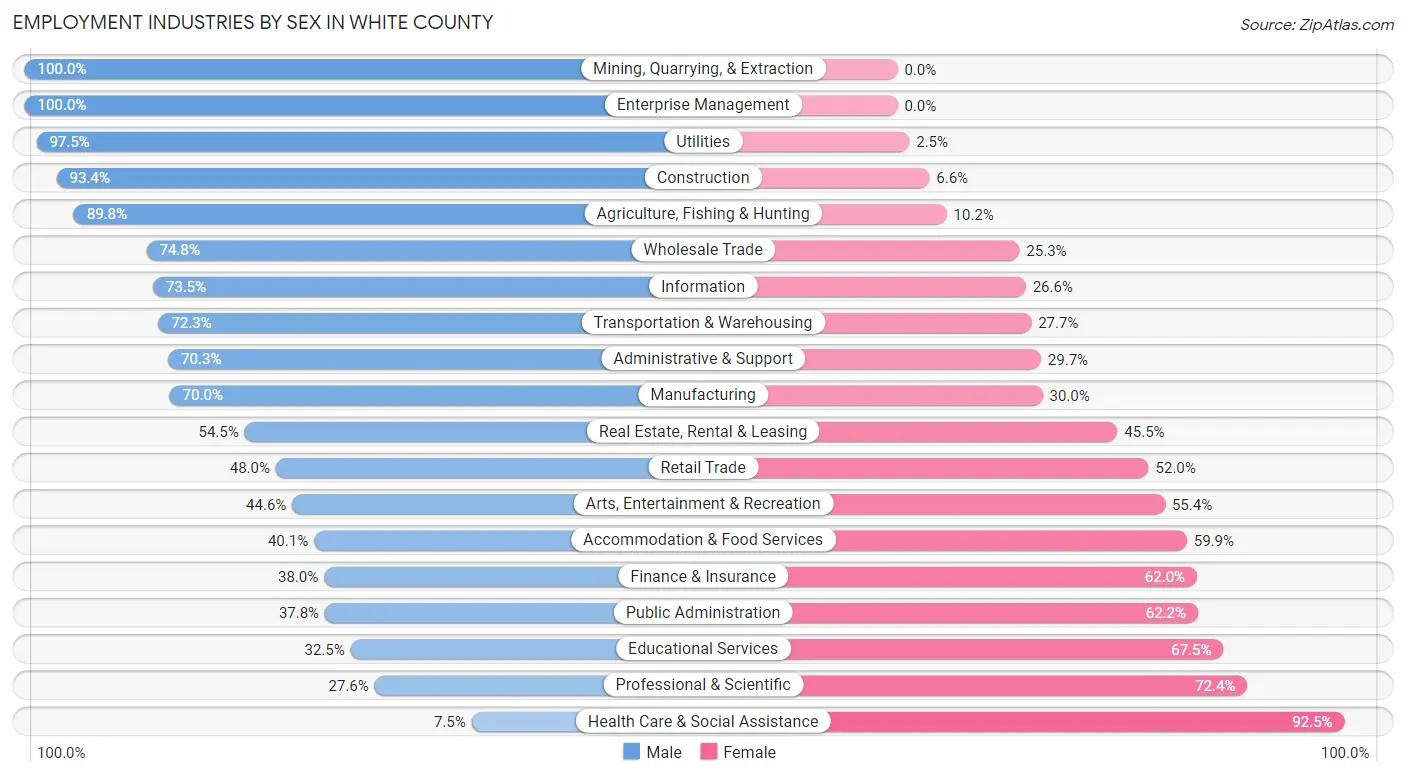
Employment Industries by Sex in White County
The White County industries that see more men than women are Mining, Quarrying, & Extraction (100.0%), Enterprise Management (100.0%), and Utilities (97.5%), whereas the industries that tend to have a higher number of women are Health Care & Social Assistance (92.5%), Professional & Scientific (72.4%), and Educational Services (67.5%).
| Industry | Male | Female |
| Agriculture, Fishing & Hunting | 432 (89.8%) | 49 (10.2%) |
| Mining, Quarrying, & Extraction | 11 (100.0%) | 0 (0.0%) |
| Construction | 777 (93.4%) | 55 (6.6%) |
| Manufacturing | 2,043 (70.0%) | 877 (30.0%) |
| Wholesale Trade | 228 (74.8%) | 77 (25.3%) |
| Retail Trade | 591 (48.0%) | 640 (52.0%) |
| Transportation & Warehousing | 410 (72.3%) | 157 (27.7%) |
| Utilities | 198 (97.5%) | 5 (2.5%) |
| Information | 83 (73.5%) | 30 (26.6%) |
| Finance & Insurance | 92 (38.0%) | 150 (62.0%) |
| Real Estate, Rental & Leasing | 67 (54.5%) | 56 (45.5%) |
| Professional & Scientific | 70 (27.6%) | 184 (72.4%) |
| Enterprise Management | 1 (100.0%) | 0 (0.0%) |
| Administrative & Support | 400 (70.3%) | 169 (29.7%) |
| Educational Services | 300 (32.5%) | 622 (67.5%) |
| Health Care & Social Assistance | 78 (7.5%) | 963 (92.5%) |
| Arts, Entertainment & Recreation | 29 (44.6%) | 36 (55.4%) |
| Accommodation & Food Services | 241 (40.1%) | 360 (59.9%) |
| Public Administration | 115 (37.8%) | 189 (62.2%) |
| Total | 6,420 (56.6%) | 4,920 (43.4%) |
Education in White County
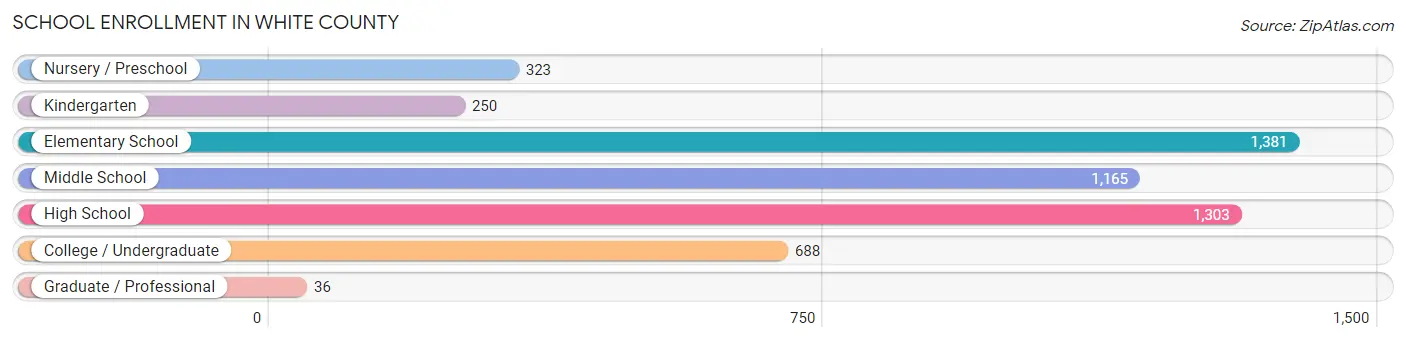
School Enrollment in White County
The most common levels of schooling among the 5,146 students in White County are elementary school (1,381 | 26.8%), high school (1,303 | 25.3%), and middle school (1,165 | 22.6%).
| School Level | # Students | % Students |
| Nursery / Preschool | 323 | 6.3% |
| Kindergarten | 250 | 4.9% |
| Elementary School | 1,381 | 26.8% |
| Middle School | 1,165 | 22.6% |
| High School | 1,303 | 25.3% |
| College / Undergraduate | 688 | 13.4% |
| Graduate / Professional | 36 | 0.7% |
| Total | 5,146 | 100.0% |
School Enrollment by Age by Funding Source in White County
Out of a total of 5,146 students who are enrolled in schools in White County, 515 (10.0%) attend a private institution, while the remaining 4,631 (90.0%) are enrolled in public schools. The age group of 3 to 4 year olds has the highest likelihood of being enrolled in private schools, with 67 (42.7% in the age bracket) enrolled. Conversely, the age group of 10 to 14 year olds has the lowest likelihood of being enrolled in a private school, with 1,179 (93.3% in the age bracket) attending a public institution.

| Age Bracket | Public School | Private School |
| 3 to 4 Year Olds | 90 (57.3%) | 67 (42.7%) |
| 5 to 9 Year Old | 1,579 (90.4%) | 168 (9.6%) |
| 10 to 14 Year Olds | 1,179 (93.3%) | 85 (6.7%) |
| 15 to 17 Year Olds | 951 (92.9%) | 73 (7.1%) |
| 18 to 19 Year Olds | 304 (89.7%) | 35 (10.3%) |
| 20 to 24 Year Olds | 283 (90.4%) | 30 (9.6%) |
| 25 to 34 Year Olds | 151 (82.5%) | 32 (17.5%) |
| 35 Years and over | 96 (80.7%) | 23 (19.3%) |
| Total | 4,631 (90.0%) | 515 (10.0%) |
Educational Attainment by Field of Study in White County
Education (761 | 23.4%), science & technology (579 | 17.8%), business (526 | 16.2%), bio, nature & agricultural (330 | 10.2%), and psychology (173 | 5.3%) are the most common fields of study among 3,251 individuals in White County who have obtained a bachelor's degree or higher.
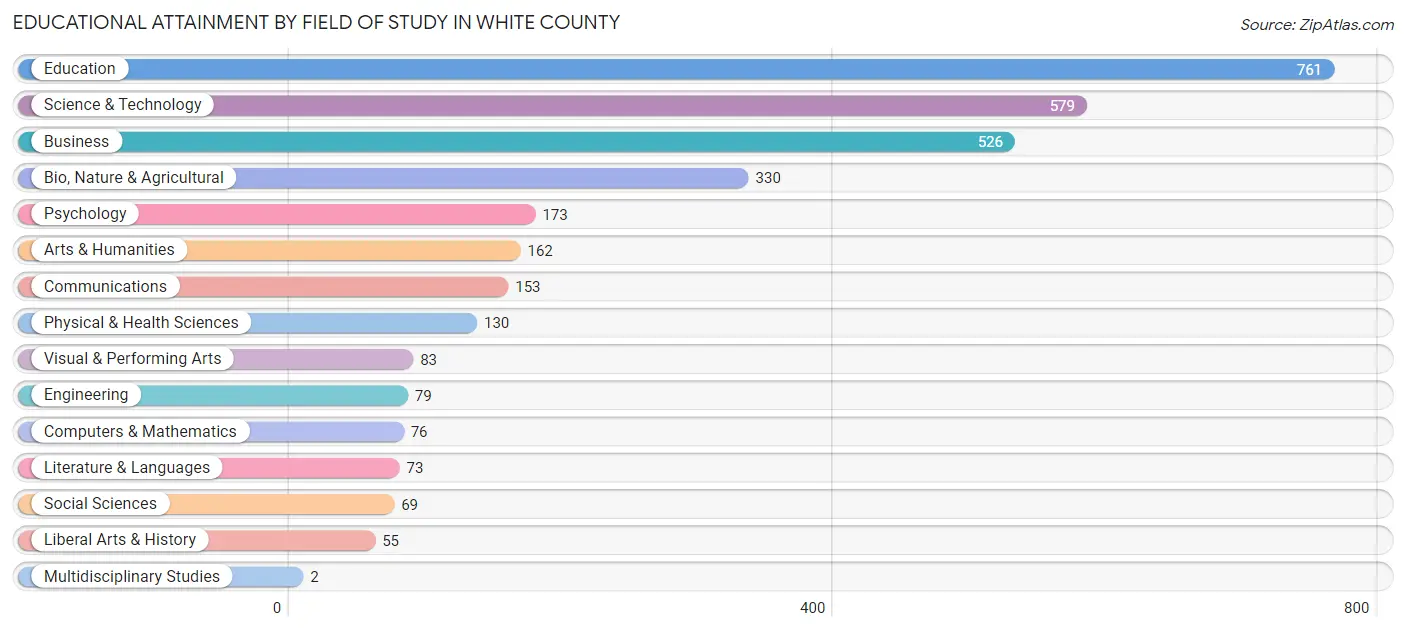
| Field of Study | # Graduates | % Graduates |
| Computers & Mathematics | 76 | 2.3% |
| Bio, Nature & Agricultural | 330 | 10.2% |
| Physical & Health Sciences | 130 | 4.0% |
| Psychology | 173 | 5.3% |
| Social Sciences | 69 | 2.1% |
| Engineering | 79 | 2.4% |
| Multidisciplinary Studies | 2 | 0.1% |
| Science & Technology | 579 | 17.8% |
| Business | 526 | 16.2% |
| Education | 761 | 23.4% |
| Literature & Languages | 73 | 2.2% |
| Liberal Arts & History | 55 | 1.7% |
| Visual & Performing Arts | 83 | 2.5% |
| Communications | 153 | 4.7% |
| Arts & Humanities | 162 | 5.0% |
| Total | 3,251 | 100.0% |
Transportation & Commute in White County
Vehicle Availability by Sex in White County
The most prevalent vehicle ownership categories in White County are males with 2 vehicles (2,906, accounting for 46.1%) and females with 2 vehicles (2,165, making up 61.0%).
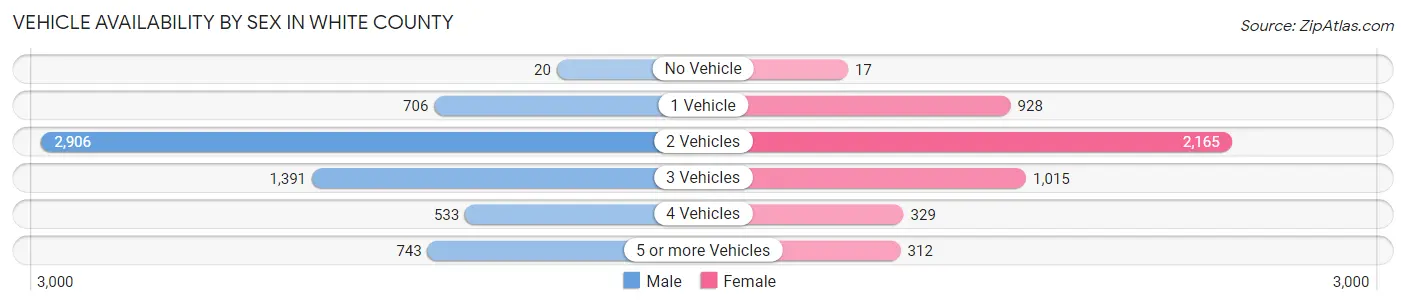
| Vehicles Available | Male | Female |
| No Vehicle | 20 (0.3%) | 17 (0.4%) |
| 1 Vehicle | 706 (11.2%) | 928 (19.5%) |
| 2 Vehicles | 2,906 (46.1%) | 2,165 (45.4%) |
| 3 Vehicles | 1,391 (22.1%) | 1,015 (21.3%) |
| 4 Vehicles | 533 (8.5%) | 329 (6.9%) |
| 5 or more Vehicles | 743 (11.8%) | 312 (6.6%) |
| Total | 6,299 (100.0%) | 4,766 (100.0%) |
Commute Time in White County
The most frequently occuring commute durations in White County are 20 to 24 minutes (1,676 commuters, 16.1%), 5 to 9 minutes (1,541 commuters, 14.8%), and 10 to 14 minutes (1,337 commuters, 12.8%).
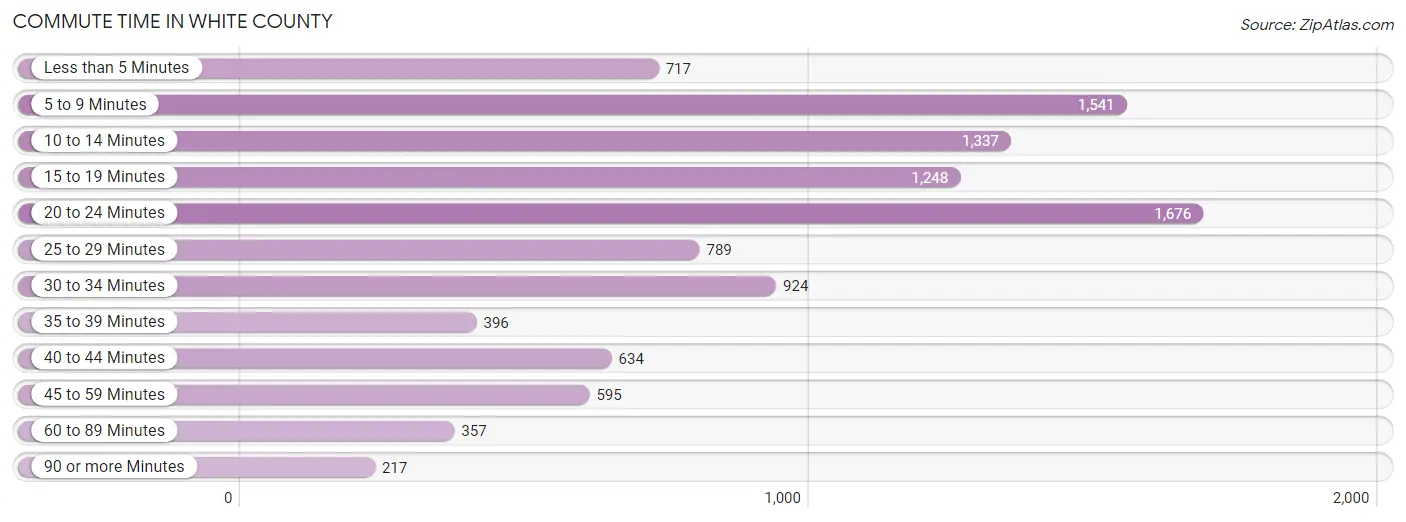
| Commute Time | # Commuters | % Commuters |
| Less than 5 Minutes | 717 | 6.9% |
| 5 to 9 Minutes | 1,541 | 14.8% |
| 10 to 14 Minutes | 1,337 | 12.8% |
| 15 to 19 Minutes | 1,248 | 12.0% |
| 20 to 24 Minutes | 1,676 | 16.1% |
| 25 to 29 Minutes | 789 | 7.6% |
| 30 to 34 Minutes | 924 | 8.9% |
| 35 to 39 Minutes | 396 | 3.8% |
| 40 to 44 Minutes | 634 | 6.1% |
| 45 to 59 Minutes | 595 | 5.7% |
| 60 to 89 Minutes | 357 | 3.4% |
| 90 or more Minutes | 217 | 2.1% |
Commute Time by Sex in White County
The most common commute times in White County are 20 to 24 minutes (965 commuters, 16.3%) for males and 10 to 14 minutes (782 commuters, 17.3%) for females.
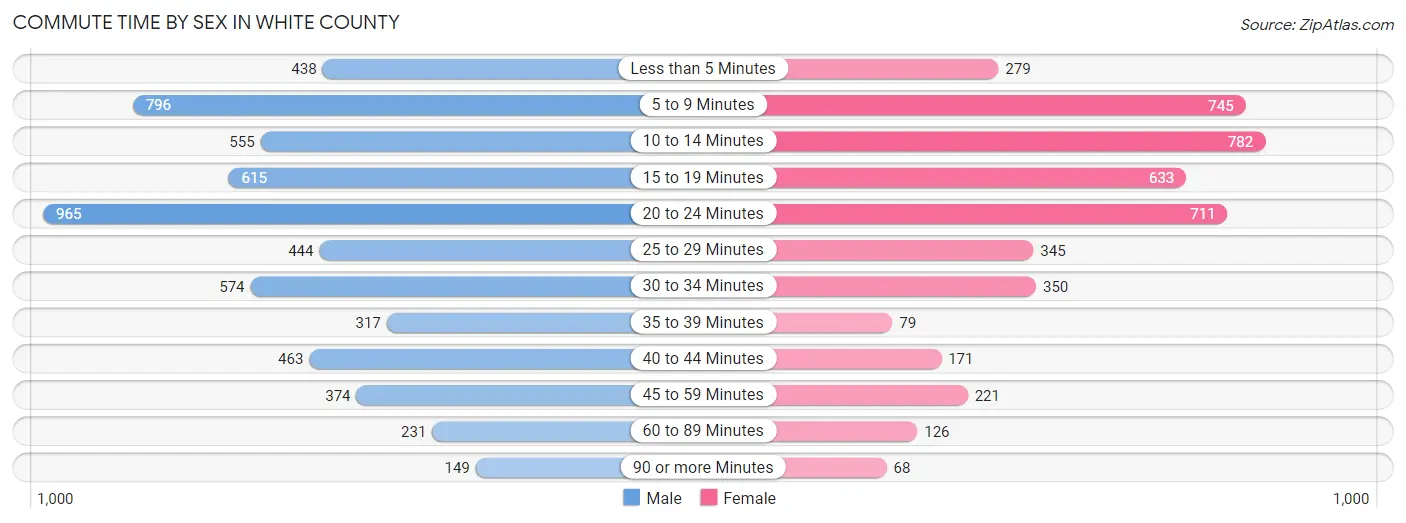
| Commute Time | Male | Female |
| Less than 5 Minutes | 438 (7.4%) | 279 (6.2%) |
| 5 to 9 Minutes | 796 (13.4%) | 745 (16.5%) |
| 10 to 14 Minutes | 555 (9.4%) | 782 (17.3%) |
| 15 to 19 Minutes | 615 (10.4%) | 633 (14.0%) |
| 20 to 24 Minutes | 965 (16.3%) | 711 (15.8%) |
| 25 to 29 Minutes | 444 (7.5%) | 345 (7.6%) |
| 30 to 34 Minutes | 574 (9.7%) | 350 (7.8%) |
| 35 to 39 Minutes | 317 (5.3%) | 79 (1.8%) |
| 40 to 44 Minutes | 463 (7.8%) | 171 (3.8%) |
| 45 to 59 Minutes | 374 (6.3%) | 221 (4.9%) |
| 60 to 89 Minutes | 231 (3.9%) | 126 (2.8%) |
| 90 or more Minutes | 149 (2.5%) | 68 (1.5%) |
Time of Departure to Work by Sex in White County
The most frequent times of departure to work in White County are 7:00 AM to 7:29 AM (968, 16.4%) for males and 7:30 AM to 7:59 AM (933, 20.7%) for females.
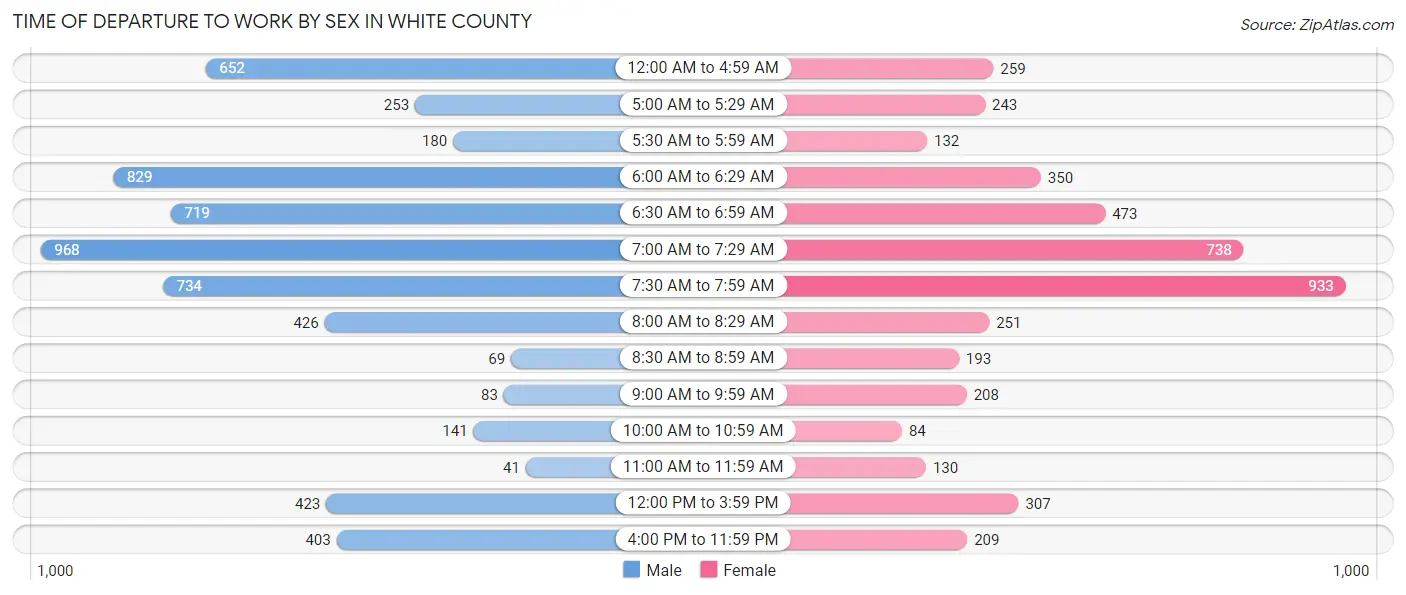
| Time of Departure | Male | Female |
| 12:00 AM to 4:59 AM | 652 (11.0%) | 259 (5.7%) |
| 5:00 AM to 5:29 AM | 253 (4.3%) | 243 (5.4%) |
| 5:30 AM to 5:59 AM | 180 (3.0%) | 132 (2.9%) |
| 6:00 AM to 6:29 AM | 829 (14.0%) | 350 (7.8%) |
| 6:30 AM to 6:59 AM | 719 (12.1%) | 473 (10.5%) |
| 7:00 AM to 7:29 AM | 968 (16.4%) | 738 (16.4%) |
| 7:30 AM to 7:59 AM | 734 (12.4%) | 933 (20.7%) |
| 8:00 AM to 8:29 AM | 426 (7.2%) | 251 (5.6%) |
| 8:30 AM to 8:59 AM | 69 (1.2%) | 193 (4.3%) |
| 9:00 AM to 9:59 AM | 83 (1.4%) | 208 (4.6%) |
| 10:00 AM to 10:59 AM | 141 (2.4%) | 84 (1.9%) |
| 11:00 AM to 11:59 AM | 41 (0.7%) | 130 (2.9%) |
| 12:00 PM to 3:59 PM | 423 (7.1%) | 307 (6.8%) |
| 4:00 PM to 11:59 PM | 403 (6.8%) | 209 (4.6%) |
| Total | 5,921 (100.0%) | 4,510 (100.0%) |
Housing Occupancy in White County
Occupancy by Ownership in White County
Of the total 9,859 dwellings in White County, owner-occupied units account for 7,739 (78.5%), while renter-occupied units make up 2,120 (21.5%).
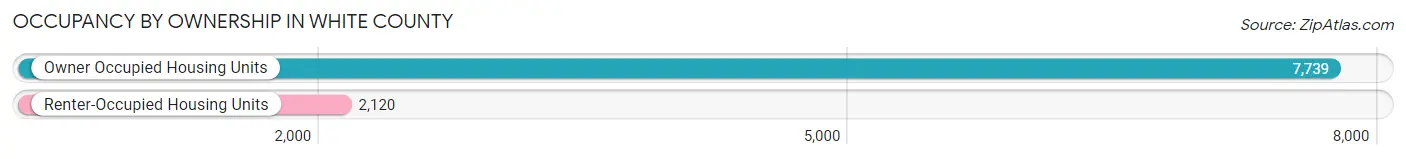
| Occupancy | # Housing Units | % Housing Units |
| Owner Occupied Housing Units | 7,739 | 78.5% |
| Renter-Occupied Housing Units | 2,120 | 21.5% |
| Total Occupied Housing Units | 9,859 | 100.0% |
Occupancy by Household Size in White County

| Household Size | # Housing Units | % Housing Units |
| 1-Person Household | 2,739 | 27.8% |
| 2-Person Household | 3,783 | 38.4% |
| 3-Person Household | 1,267 | 12.9% |
| 4+ Person Household | 2,070 | 21.0% |
| Total Housing Units | 9,859 | 100.0% |
Occupancy by Ownership by Household Size in White County
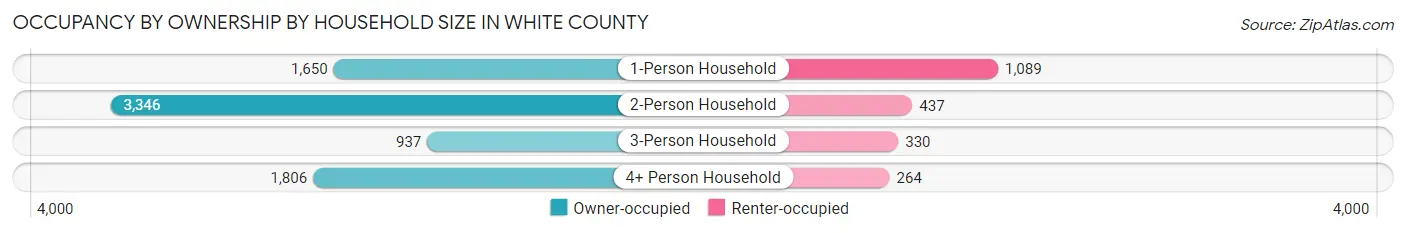
| Household Size | Owner-occupied | Renter-occupied |
| 1-Person Household | 1,650 (60.2%) | 1,089 (39.8%) |
| 2-Person Household | 3,346 (88.4%) | 437 (11.6%) |
| 3-Person Household | 937 (74.0%) | 330 (26.1%) |
| 4+ Person Household | 1,806 (87.3%) | 264 (12.8%) |
| Total Housing Units | 7,739 (78.5%) | 2,120 (21.5%) |
Occupancy by Educational Attainment in White County
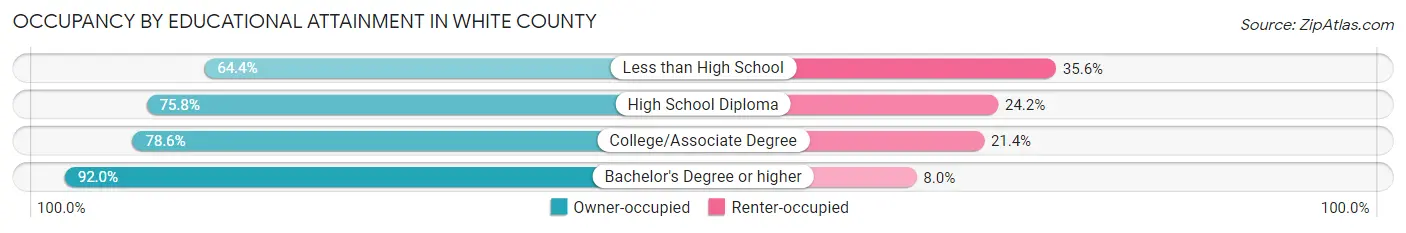
| Household Size | Owner-occupied | Renter-occupied |
| Less than High School | 580 (64.4%) | 321 (35.6%) |
| High School Diploma | 2,917 (75.8%) | 930 (24.2%) |
| College/Associate Degree | 2,708 (78.6%) | 736 (21.4%) |
| Bachelor's Degree or higher | 1,534 (92.0%) | 133 (8.0%) |
Occupancy by Age of Householder in White County
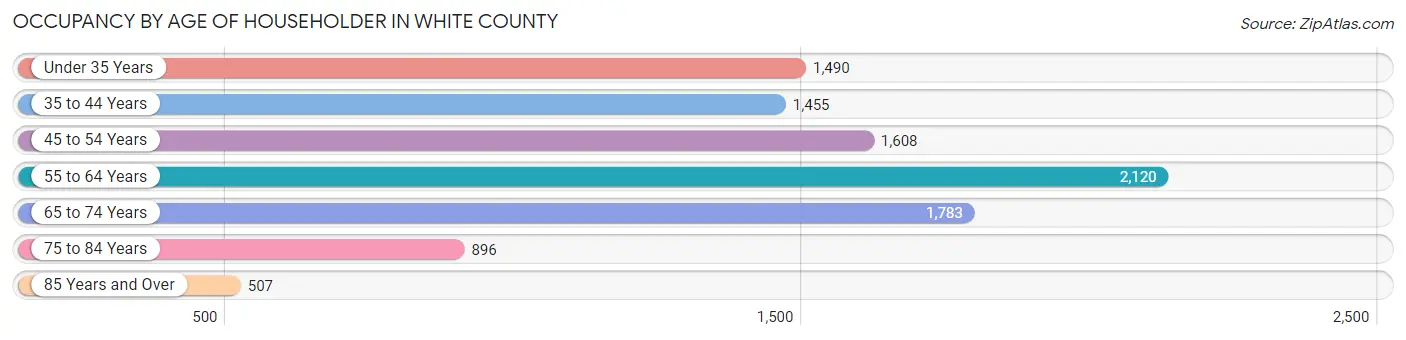
| Age Bracket | # Households | % Households |
| Under 35 Years | 1,490 | 15.1% |
| 35 to 44 Years | 1,455 | 14.8% |
| 45 to 54 Years | 1,608 | 16.3% |
| 55 to 64 Years | 2,120 | 21.5% |
| 65 to 74 Years | 1,783 | 18.1% |
| 75 to 84 Years | 896 | 9.1% |
| 85 Years and Over | 507 | 5.1% |
| Total | 9,859 | 100.0% |
Housing Finances in White County
Median Income by Occupancy in White County
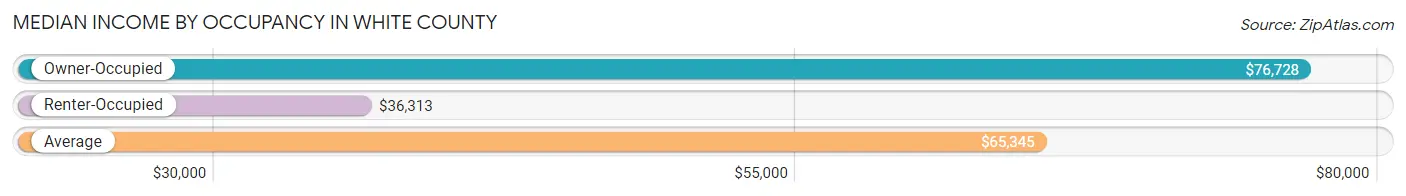
| Occupancy Type | # Households | Median Income |
| Owner-Occupied | 7,739 (78.5%) | $76,728 |
| Renter-Occupied | 2,120 (21.5%) | $36,313 |
| Average | 9,859 (100.0%) | $65,345 |
Occupancy by Householder Income Bracket in White County
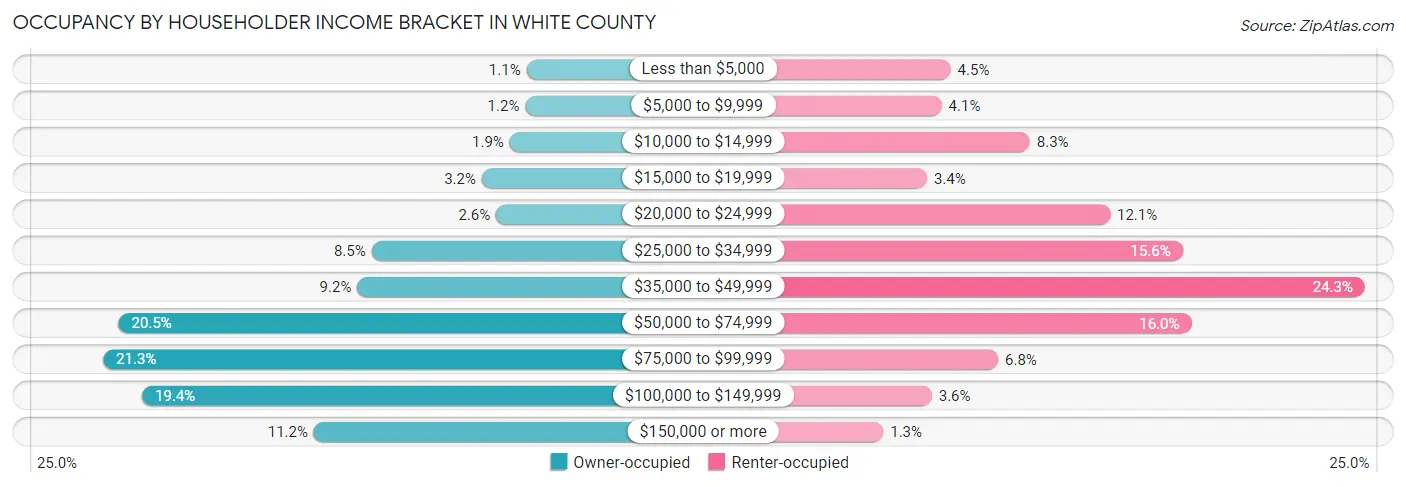
| Income Bracket | Owner-occupied | Renter-occupied |
| Less than $5,000 | 85 (1.1%) | 96 (4.5%) |
| $5,000 to $9,999 | 90 (1.2%) | 87 (4.1%) |
| $10,000 to $14,999 | 147 (1.9%) | 176 (8.3%) |
| $15,000 to $19,999 | 250 (3.2%) | 72 (3.4%) |
| $20,000 to $24,999 | 197 (2.5%) | 257 (12.1%) |
| $25,000 to $34,999 | 656 (8.5%) | 330 (15.6%) |
| $35,000 to $49,999 | 709 (9.2%) | 514 (24.2%) |
| $50,000 to $74,999 | 1,589 (20.5%) | 339 (16.0%) |
| $75,000 to $99,999 | 1,645 (21.3%) | 144 (6.8%) |
| $100,000 to $149,999 | 1,502 (19.4%) | 77 (3.6%) |
| $150,000 or more | 869 (11.2%) | 28 (1.3%) |
| Total | 7,739 (100.0%) | 2,120 (100.0%) |
Monthly Housing Cost Tiers in White County
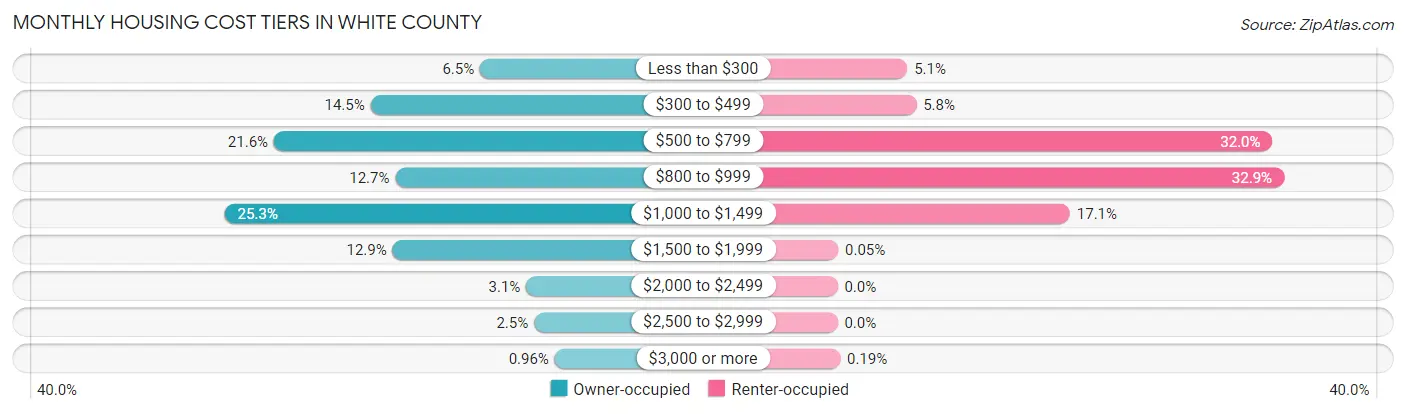
| Monthly Cost | Owner-occupied | Renter-occupied |
| Less than $300 | 500 (6.5%) | 109 (5.1%) |
| $300 to $499 | 1,124 (14.5%) | 123 (5.8%) |
| $500 to $799 | 1,675 (21.6%) | 679 (32.0%) |
| $800 to $999 | 983 (12.7%) | 697 (32.9%) |
| $1,000 to $1,499 | 1,956 (25.3%) | 363 (17.1%) |
| $1,500 to $1,999 | 998 (12.9%) | 1 (0.1%) |
| $2,000 to $2,499 | 237 (3.1%) | 0 (0.0%) |
| $2,500 to $2,999 | 192 (2.5%) | 0 (0.0%) |
| $3,000 or more | 74 (1.0%) | 4 (0.2%) |
| Total | 7,739 (100.0%) | 2,120 (100.0%) |
Physical Housing Characteristics in White County
Housing Structures in White County
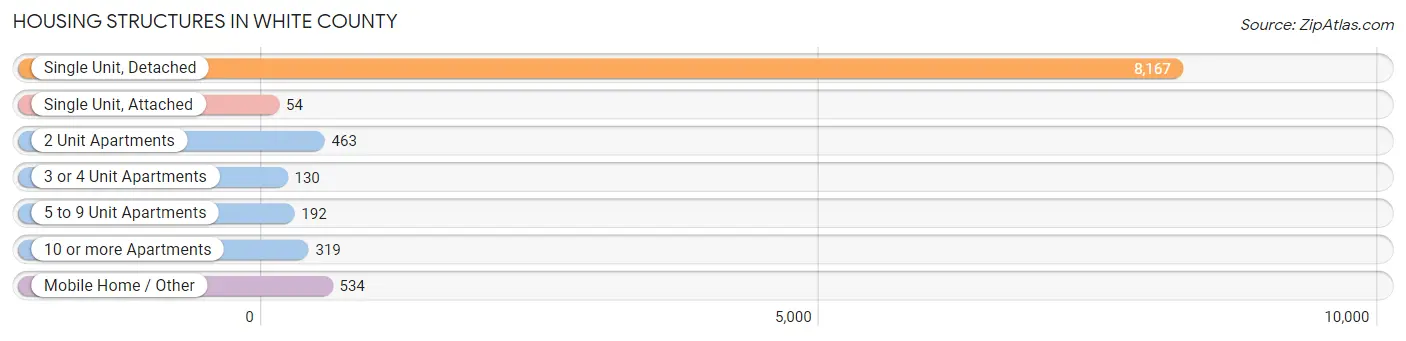
| Structure Type | # Housing Units | % Housing Units |
| Single Unit, Detached | 8,167 | 82.8% |
| Single Unit, Attached | 54 | 0.5% |
| 2 Unit Apartments | 463 | 4.7% |
| 3 or 4 Unit Apartments | 130 | 1.3% |
| 5 to 9 Unit Apartments | 192 | 1.9% |
| 10 or more Apartments | 319 | 3.2% |
| Mobile Home / Other | 534 | 5.4% |
| Total | 9,859 | 100.0% |
Housing Structures by Occupancy in White County
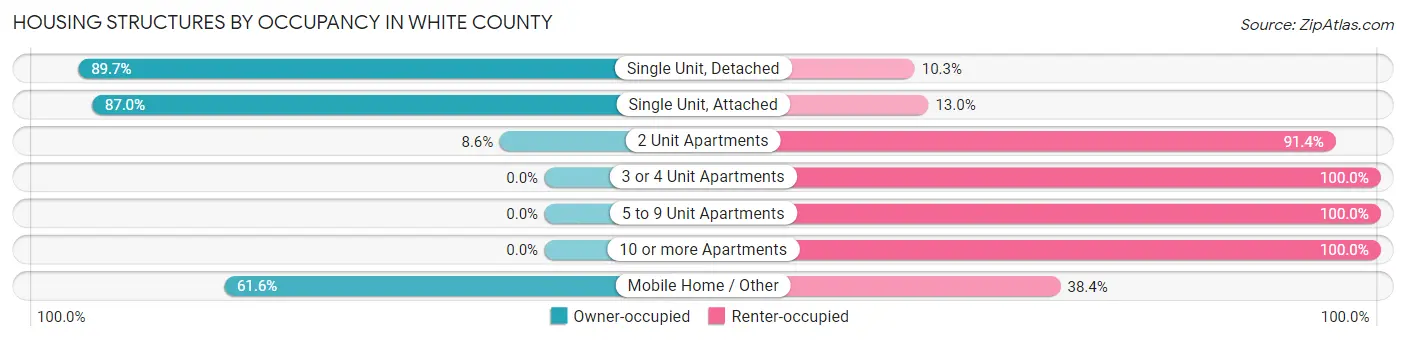
| Structure Type | Owner-occupied | Renter-occupied |
| Single Unit, Detached | 7,323 (89.7%) | 844 (10.3%) |
| Single Unit, Attached | 47 (87.0%) | 7 (13.0%) |
| 2 Unit Apartments | 40 (8.6%) | 423 (91.4%) |
| 3 or 4 Unit Apartments | 0 (0.0%) | 130 (100.0%) |
| 5 to 9 Unit Apartments | 0 (0.0%) | 192 (100.0%) |
| 10 or more Apartments | 0 (0.0%) | 319 (100.0%) |
| Mobile Home / Other | 329 (61.6%) | 205 (38.4%) |
| Total | 7,739 (78.5%) | 2,120 (21.5%) |
Housing Structures by Number of Rooms in White County
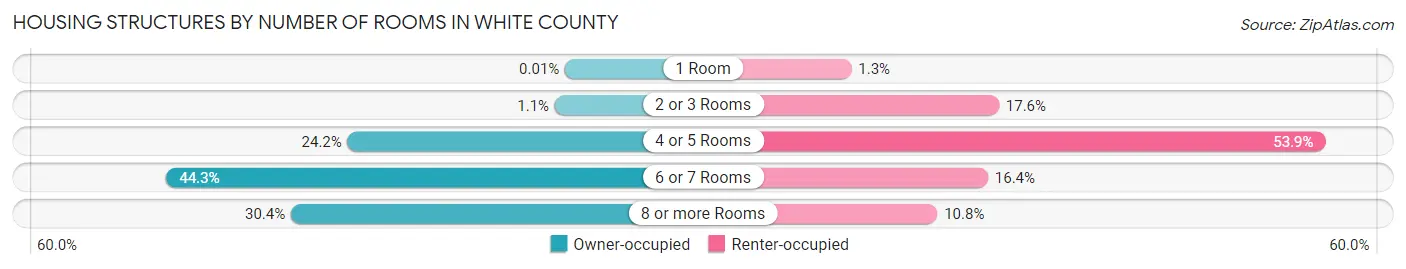
| Number of Rooms | Owner-occupied | Renter-occupied |
| 1 Room | 1 (0.0%) | 27 (1.3%) |
| 2 or 3 Rooms | 88 (1.1%) | 374 (17.6%) |
| 4 or 5 Rooms | 1,869 (24.1%) | 1,142 (53.9%) |
| 6 or 7 Rooms | 3,426 (44.3%) | 348 (16.4%) |
| 8 or more Rooms | 2,355 (30.4%) | 229 (10.8%) |
| Total | 7,739 (100.0%) | 2,120 (100.0%) |
Housing Structure by Heating Type in White County
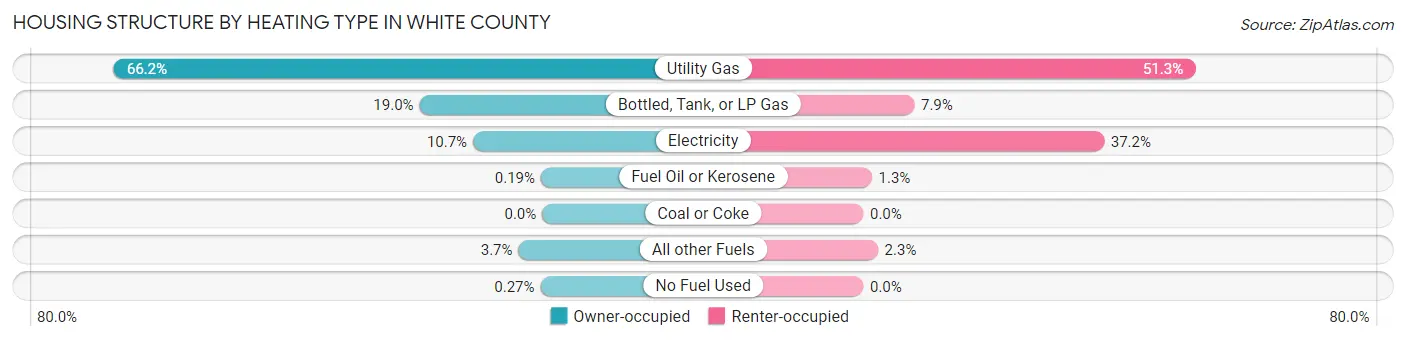
| Heating Type | Owner-occupied | Renter-occupied |
| Utility Gas | 5,124 (66.2%) | 1,088 (51.3%) |
| Bottled, Tank, or LP Gas | 1,468 (19.0%) | 167 (7.9%) |
| Electricity | 827 (10.7%) | 789 (37.2%) |
| Fuel Oil or Kerosene | 15 (0.2%) | 28 (1.3%) |
| Coal or Coke | 0 (0.0%) | 0 (0.0%) |
| All other Fuels | 284 (3.7%) | 48 (2.3%) |
| No Fuel Used | 21 (0.3%) | 0 (0.0%) |
| Total | 7,739 (100.0%) | 2,120 (100.0%) |
Household Vehicle Usage in White County

| Vehicles per Household | Owner-occupied | Renter-occupied |
| No Vehicle | 67 (0.9%) | 178 (8.4%) |
| 1 Vehicle | 1,703 (22.0%) | 1,148 (54.1%) |
| 2 Vehicles | 3,502 (45.3%) | 718 (33.9%) |
| 3 or more Vehicles | 2,467 (31.9%) | 76 (3.6%) |
| Total | 7,739 (100.0%) | 2,120 (100.0%) |
Real Estate & Mortgages in White County
Real Estate and Mortgage Overview in White County
| Characteristic | Without Mortgage | With Mortgage |
| Housing Units | 2,677 | 5,062 |
| Median Property Value | $143,500 | $157,300 |
| Median Household Income | $61,456 | $619 |
| Monthly Housing Costs | $453 | $57 |
| Real Estate Taxes | $848 | $98 |
Property Value by Mortgage Status in White County
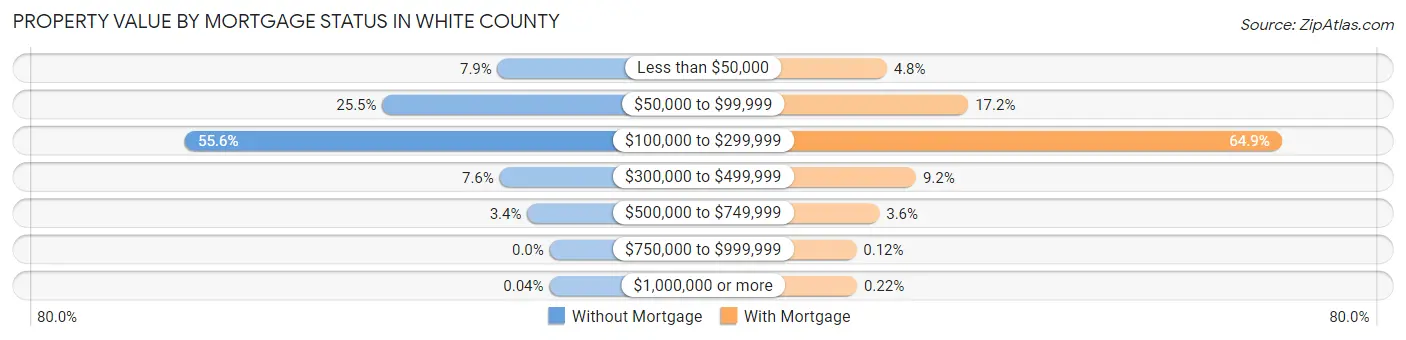
| Property Value | Without Mortgage | With Mortgage |
| Less than $50,000 | 212 (7.9%) | 241 (4.8%) |
| $50,000 to $99,999 | 682 (25.5%) | 869 (17.2%) |
| $100,000 to $299,999 | 1,487 (55.5%) | 3,286 (64.9%) |
| $300,000 to $499,999 | 204 (7.6%) | 466 (9.2%) |
| $500,000 to $749,999 | 91 (3.4%) | 183 (3.6%) |
| $750,000 to $999,999 | 0 (0.0%) | 6 (0.1%) |
| $1,000,000 or more | 1 (0.0%) | 11 (0.2%) |
| Total | 2,677 (100.0%) | 5,062 (100.0%) |
Household Income by Mortgage Status in White County

| Household Income | Without Mortgage | With Mortgage |
| Less than $10,000 | 61 (2.3%) | 144 (2.8%) |
| $10,000 to $24,999 | 345 (12.9%) | 114 (2.2%) |
| $25,000 to $34,999 | 400 (14.9%) | 249 (4.9%) |
| $35,000 to $49,999 | 246 (9.2%) | 256 (5.1%) |
| $50,000 to $74,999 | 578 (21.6%) | 463 (9.1%) |
| $75,000 to $99,999 | 560 (20.9%) | 1,011 (20.0%) |
| $100,000 to $149,999 | 237 (8.8%) | 1,085 (21.4%) |
| $150,000 or more | 250 (9.3%) | 1,265 (25.0%) |
| Total | 2,677 (100.0%) | 5,062 (100.0%) |
Property Value to Household Income Ratio in White County

| Value-to-Income Ratio | Without Mortgage | With Mortgage |
| Less than 2.0x | 1,112 (41.5%) | 82,924 (1,638.2%) |
| 2.0x to 2.9x | 374 (14.0%) | 2,618 (51.7%) |
| 3.0x to 3.9x | 363 (13.6%) | 1,156 (22.8%) |
| 4.0x or more | 800 (29.9%) | 467 (9.2%) |
| Total | 2,677 (100.0%) | 5,062 (100.0%) |
Real Estate Taxes by Mortgage Status in White County
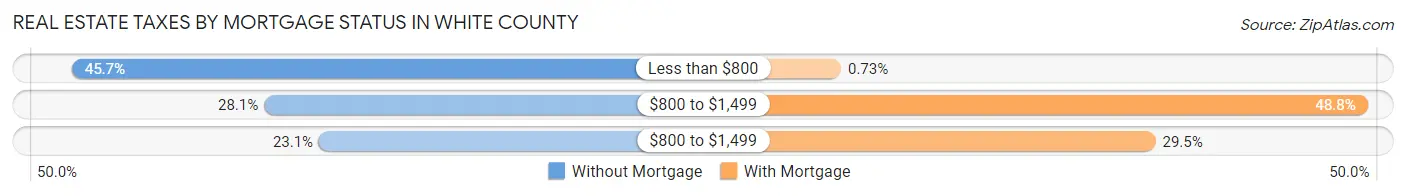
| Property Taxes | Without Mortgage | With Mortgage |
| Less than $800 | 1,223 (45.7%) | 37 (0.7%) |
| $800 to $1,499 | 753 (28.1%) | 2,471 (48.8%) |
| $800 to $1,499 | 619 (23.1%) | 1,491 (29.4%) |
| Total | 2,677 (100.0%) | 5,062 (100.0%) |
Health & Disability in White County
Health Insurance Coverage by Age in White County
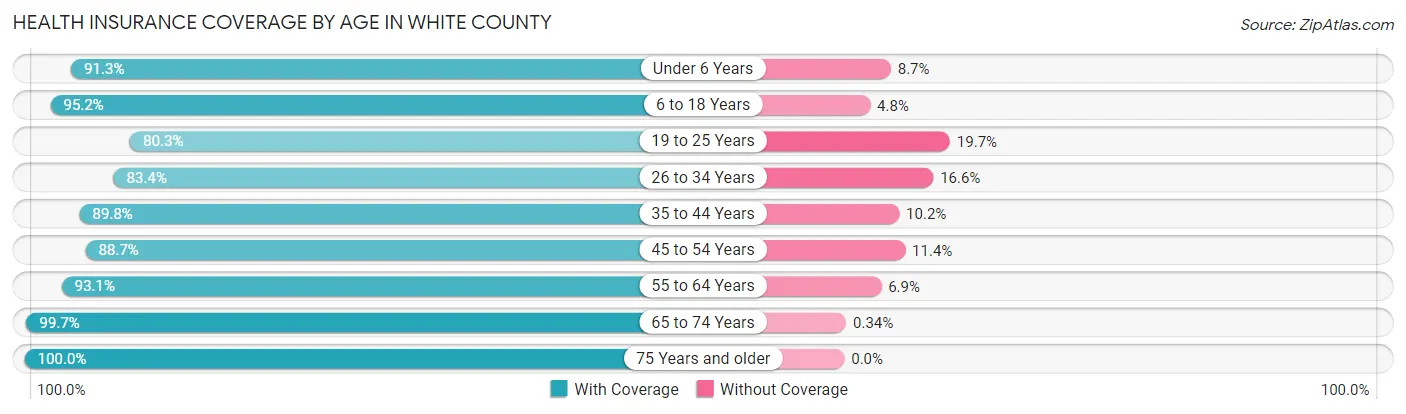
| Age Bracket | With Coverage | Without Coverage |
| Under 6 Years | 1,706 (91.3%) | 162 (8.7%) |
| 6 to 18 Years | 3,990 (95.2%) | 202 (4.8%) |
| 19 to 25 Years | 1,415 (80.3%) | 347 (19.7%) |
| 26 to 34 Years | 2,048 (83.4%) | 407 (16.6%) |
| 35 to 44 Years | 2,316 (89.8%) | 264 (10.2%) |
| 45 to 54 Years | 2,709 (88.6%) | 347 (11.4%) |
| 55 to 64 Years | 3,394 (93.1%) | 251 (6.9%) |
| 65 to 74 Years | 2,936 (99.7%) | 10 (0.3%) |
| 75 Years and older | 1,901 (100.0%) | 0 (0.0%) |
| Total | 22,415 (91.8%) | 1,990 (8.2%) |
Health Insurance Coverage by Citizenship Status in White County
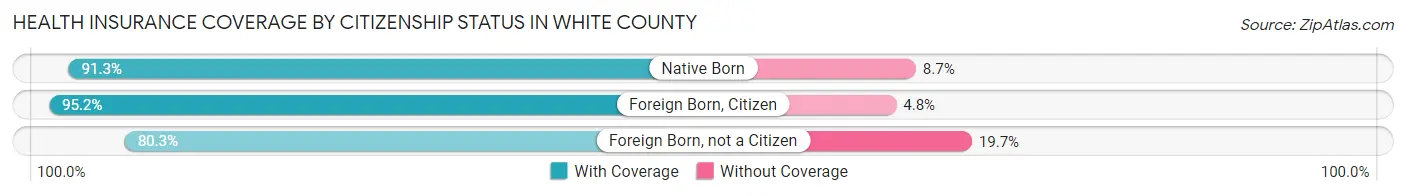
| Citizenship Status | With Coverage | Without Coverage |
| Native Born | 1,706 (91.3%) | 162 (8.7%) |
| Foreign Born, Citizen | 3,990 (95.2%) | 202 (4.8%) |
| Foreign Born, not a Citizen | 1,415 (80.3%) | 347 (19.7%) |
Health Insurance Coverage by Household Income in White County

| Household Income | With Coverage | Without Coverage |
| Under $25,000 | 1,806 (91.2%) | 175 (8.8%) |
| $25,000 to $49,999 | 3,719 (84.0%) | 709 (16.0%) |
| $50,000 to $74,999 | 4,356 (89.9%) | 491 (10.1%) |
| $75,000 to $99,999 | 5,374 (95.8%) | 237 (4.2%) |
| $100,000 and over | 7,117 (95.0%) | 374 (5.0%) |
Public vs Private Health Insurance Coverage by Age in White County
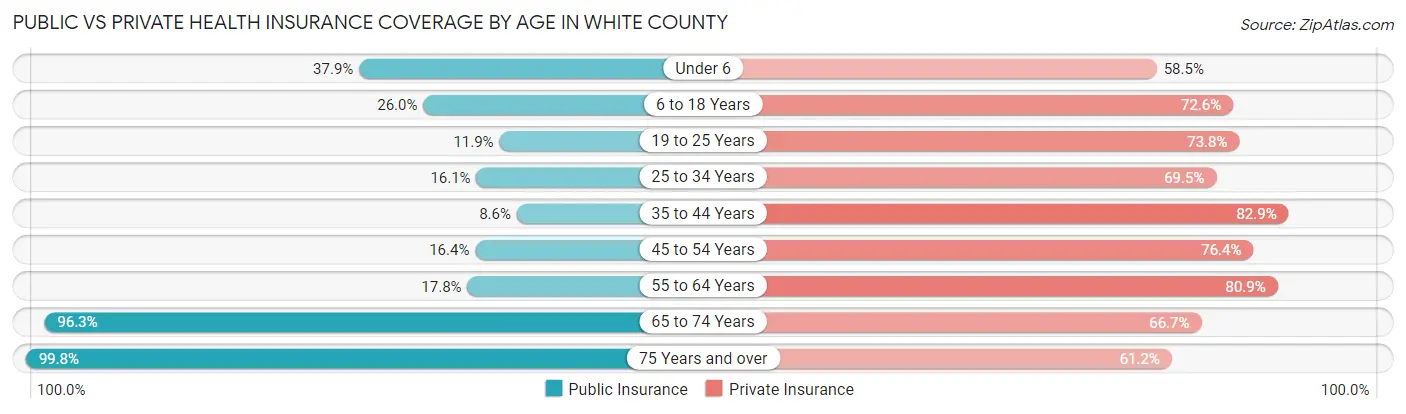
| Age Bracket | Public Insurance | Private Insurance |
| Under 6 | 708 (37.9%) | 1,092 (58.5%) |
| 6 to 18 Years | 1,090 (26.0%) | 3,044 (72.6%) |
| 19 to 25 Years | 209 (11.9%) | 1,300 (73.8%) |
| 25 to 34 Years | 396 (16.1%) | 1,706 (69.5%) |
| 35 to 44 Years | 223 (8.6%) | 2,139 (82.9%) |
| 45 to 54 Years | 500 (16.4%) | 2,334 (76.4%) |
| 55 to 64 Years | 649 (17.8%) | 2,948 (80.9%) |
| 65 to 74 Years | 2,838 (96.3%) | 1,966 (66.7%) |
| 75 Years and over | 1,897 (99.8%) | 1,164 (61.2%) |
| Total | 8,510 (34.9%) | 17,693 (72.5%) |
Disability Status by Sex by Age in White County
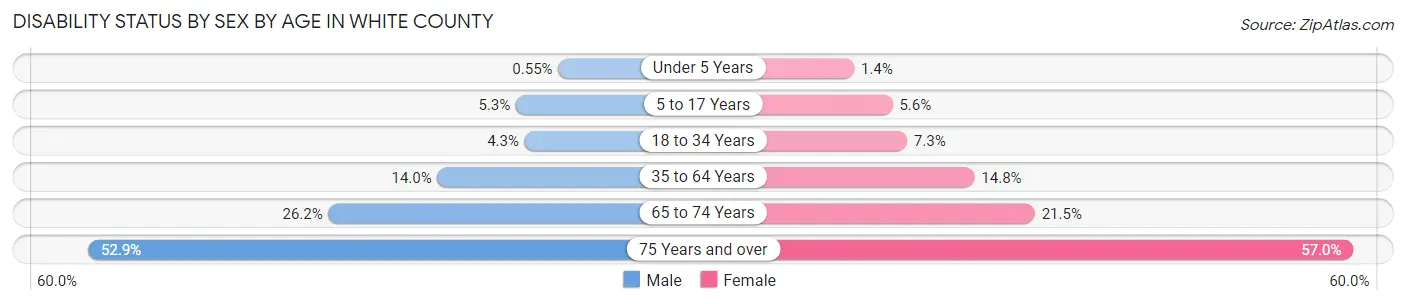
| Age Bracket | Male | Female |
| Under 5 Years | 4 (0.5%) | 10 (1.4%) |
| 5 to 17 Years | 117 (5.3%) | 114 (5.6%) |
| 18 to 34 Years | 102 (4.3%) | 159 (7.2%) |
| 35 to 64 Years | 657 (14.0%) | 678 (14.8%) |
| 65 to 74 Years | 381 (26.2%) | 320 (21.5%) |
| 75 Years and over | 459 (52.9%) | 589 (57.0%) |
Disability Class by Sex by Age in White County
Disability Class: Hearing Difficulty

| Age Bracket | Male | Female |
| Under 5 Years | 0 (0.0%) | 10 (1.4%) |
| 5 to 17 Years | 15 (0.7%) | 20 (1.0%) |
| 18 to 34 Years | 17 (0.7%) | 8 (0.4%) |
| 35 to 64 Years | 301 (6.4%) | 145 (3.2%) |
| 65 to 74 Years | 217 (14.9%) | 104 (7.0%) |
| 75 Years and over | 223 (25.7%) | 142 (13.7%) |
Disability Class: Vision Difficulty

| Age Bracket | Male | Female |
| Under 5 Years | 4 (0.5%) | 10 (1.4%) |
| 5 to 17 Years | 3 (0.1%) | 16 (0.8%) |
| 18 to 34 Years | 17 (0.7%) | 10 (0.5%) |
| 35 to 64 Years | 85 (1.8%) | 94 (2.1%) |
| 65 to 74 Years | 74 (5.1%) | 82 (5.5%) |
| 75 Years and over | 152 (17.5%) | 147 (14.2%) |
Disability Class: Cognitive Difficulty
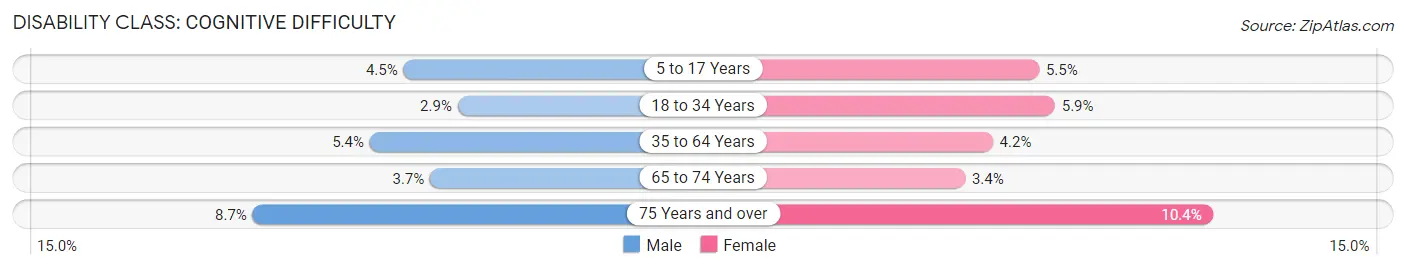
| Age Bracket | Male | Female |
| 5 to 17 Years | 99 (4.4%) | 111 (5.5%) |
| 18 to 34 Years | 70 (2.9%) | 130 (5.9%) |
| 35 to 64 Years | 253 (5.4%) | 193 (4.2%) |
| 65 to 74 Years | 54 (3.7%) | 51 (3.4%) |
| 75 Years and over | 75 (8.6%) | 107 (10.3%) |
Disability Class: Ambulatory Difficulty
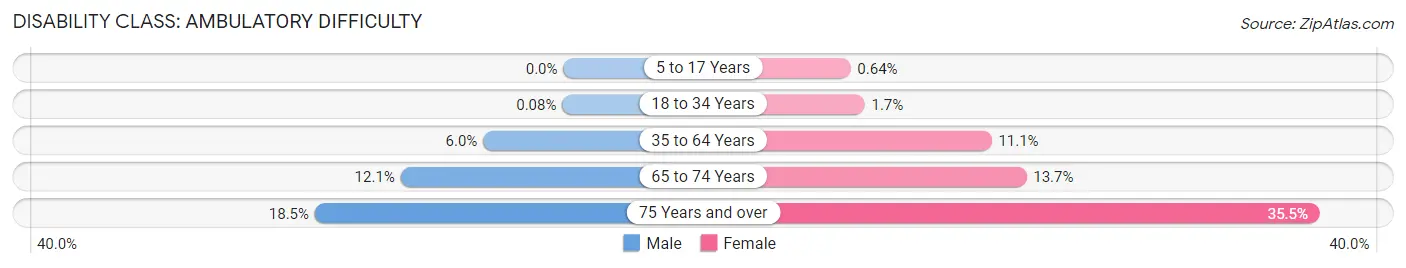
| Age Bracket | Male | Female |
| 5 to 17 Years | 0 (0.0%) | 13 (0.6%) |
| 18 to 34 Years | 2 (0.1%) | 37 (1.7%) |
| 35 to 64 Years | 279 (5.9%) | 510 (11.1%) |
| 65 to 74 Years | 176 (12.1%) | 204 (13.7%) |
| 75 Years and over | 160 (18.4%) | 367 (35.5%) |
Disability Class: Self-Care Difficulty
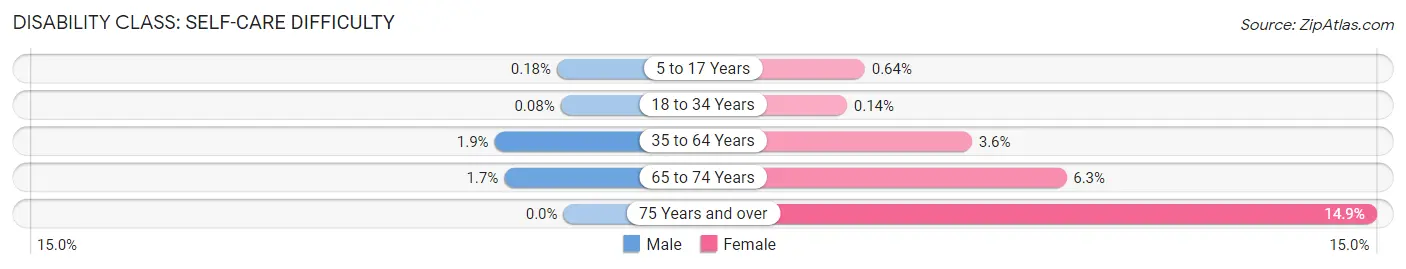
| Age Bracket | Male | Female |
| 5 to 17 Years | 4 (0.2%) | 13 (0.6%) |
| 18 to 34 Years | 2 (0.1%) | 3 (0.1%) |
| 35 to 64 Years | 90 (1.9%) | 166 (3.6%) |
| 65 to 74 Years | 24 (1.7%) | 93 (6.2%) |
| 75 Years and over | 0 (0.0%) | 154 (14.9%) |
Technology Access in White County
Computing Device Access in White County
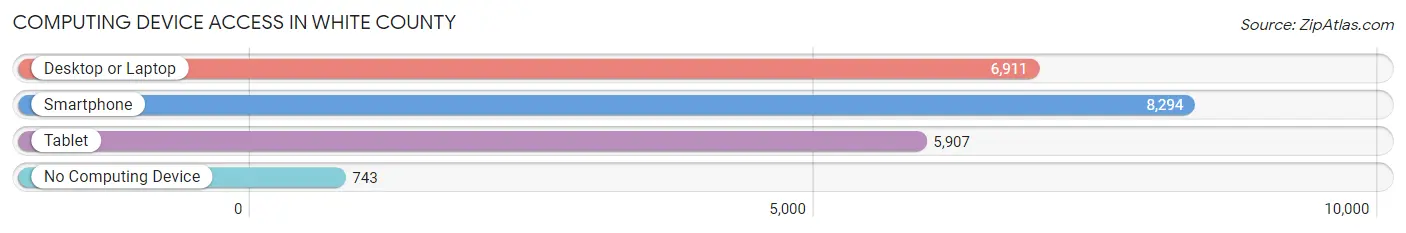
| Device Type | # Households | % Households |
| Desktop or Laptop | 6,911 | 70.1% |
| Smartphone | 8,294 | 84.1% |
| Tablet | 5,907 | 59.9% |
| No Computing Device | 743 | 7.5% |
| Total | 9,859 | 100.0% |
Internet Access in White County
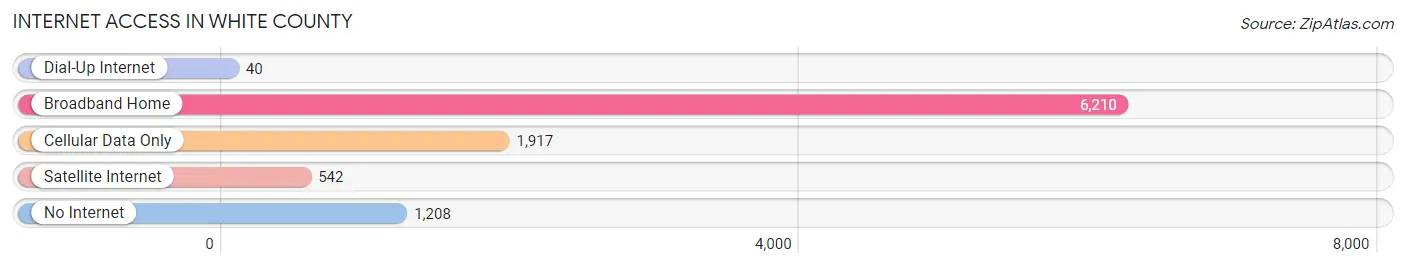
| Internet Type | # Households | % Households |
| Dial-Up Internet | 40 | 0.4% |
| Broadband Home | 6,210 | 63.0% |
| Cellular Data Only | 1,917 | 19.4% |
| Satellite Internet | 542 | 5.5% |
| No Internet | 1,208 | 12.2% |
| Total | 9,859 | 100.0% |
White County Summary
White County is located in the northern part of Indiana, in the United States. It is bordered by Cass County to the north, Carroll County to the east, Tippecanoe County to the south, and Benton County to the west. The county seat is Monticello, and the largest city is Monticello. The county was established in 1834 and named for Isaac White, a soldier in the War of 1812.
History
White County was first settled in the early 1800s by pioneers from the east. The first settlers were mostly of German and English descent. The county was officially established in 1834 and named for Isaac White, a soldier in the War of 1812.
The first county seat was located in the town of Big Creek, but it was moved to Monticello in 1836. Monticello was named after Thomas Jefferson's home in Virginia. The county was largely agricultural in its early years, with corn, wheat, and oats being the main crops.
In the late 1800s, the county began to industrialize, with the establishment of several factories. The first factory was a sawmill, which was built in 1876. Other factories included a flour mill, a woolen mill, and a furniture factory.
Geography
White County is located in the northern part of Indiana, in the United States. It is bordered by Cass County to the north, Carroll County to the east, Tippecanoe County to the south, and Benton County to the west. The county has a total area of 441 square miles, of which 437 square miles is land and 4 square miles is water.
The terrain of White County is mostly flat, with some rolling hills in the northern part of the county. The highest point in the county is located in the town of Big Creek, at an elevation of 890 feet. The county is drained by the Tippecanoe River, which flows through the county from north to south.
Economy
White County has a diverse economy, with a mix of manufacturing, agriculture, and services. The county's largest employer is the White County School Corporation, which employs over 1,000 people. Other major employers include the White County Hospital, the White County Government, and the White County Sheriff's Office.
Agriculture is an important part of the county's economy, with corn, soybeans, and wheat being the main crops. Livestock production is also important, with beef cattle, dairy cattle, and hogs being the main animals raised.
Manufacturing is also an important part of the county's economy, with several factories located in the county. The largest factory is the White County Furniture Company, which produces furniture for the home and office. Other factories include a sawmill, a flour mill, and a woolen mill.
Demographics
As of the 2010 census, White County had a population of 24,643. The racial makeup of the county was 97.2% White, 0.7% African American, 0.3% Native American, 0.4% Asian, 0.1% Pacific Islander, 0.4% from other races, and 0.9% from two or more races. Hispanic or Latino of any race were 1.3% of the population.
The median income for a household in the county was $45,945, and the median income for a family was $54,945. The per capita income for the county was $21,945. About 8.7% of families and 11.2% of the population were below the poverty line, including 15.2% of those under age 18 and 8.2% of those age 65 or over.
Common Questions
What is the Total Population of White County?
Total Population of White County is 24,630.
What is the Total Male Population of White County?
Total Male Population of White County is 12,424.
What is the Total Female Population of White County?
Total Female Population of White County is 12,206.
What is the Ratio of Males per 100 Females in White County?
There are 101.79 Males per 100 Females in White County.
What is the Ratio of Females per 100 Males in White County?
There are 98.25 Females per 100 Males in White County.
What is the Median Population Age in White County?
Median Population Age in White County is 42.6 Years.
What is the Average Family Size in White County
Average Family Size in White County is 3.0 People.
What is the Average Household Size in White County
Average Household Size in White County is 2.5 People.
What is Per Capita Income in White County?
Per Capita income in White County is $32,001.
What is the Median Family Income in White County?
Median Family Income in White County is $79,914.
What is the Median Household income in White County?
Median Household Income in White County is $65,345.
What is Income or Wage Gap in White County?
Income or Wage Gap in White County is 38.0%.
Women in White County earn 62.0 cents for every dollar earned by a man.
What is Family Income Deficit in White County?
Family Income Deficit in White County is $9,545.
Families that are below poverty line in White County earn $9,545 less on average than the poverty threshold level.
What is Inequality or Gini Index in White County?
Inequality or Gini Index in White County is 0.40.
How Large is the Labor Force in White County?
There are 11,858 People in the Labor Forcein in White County.
What is the Percentage of People in the Labor Force in White County?
60.7% of People are in the Labor Force in White County.
What is the Unemployment Rate in White County?
Unemployment Rate in White County is 4.4%.