Washington County, IN
Washington County Overview
28,133
TOTAL POPULATION
13,988
MALE POPULATION
14,145
FEMALE POPULATION
98.89
MALES / 100 FEMALES
101.12
FEMALES / 100 MALES
40.9
MEDIAN AGE
3.0
AVG FAMILY SIZE
2.6
AVG HOUSEHOLD SIZE
$28,963
PER CAPITA INCOME
$74,597
AVG FAMILY INCOME
$60,695
AVG HOUSEHOLD INCOME
22.9%
WAGE / INCOME GAP [ % ]
77.1¢/ $1
WAGE / INCOME GAP [ $ ]
$9,523
FAMILY INCOME DEFICIT
0.41
INEQUALITY / GINI INDEX
13,742
LABOR FORCE [ PEOPLE ]
61.1%
PERCENT IN LABOR FORCE
4.2%
UNEMPLOYMENT RATE
Washington County Area Codes
Race in Washington County
The most populous races in Washington County are White / Caucasian (27,149 | 96.5%), Two or more Races (784 | 2.8%), and Hispanic or Latino (397 | 1.4%).

| Race | # Population | % Population |
| Asian | 30 | 0.1% |
| Black / African American | 54 | 0.2% |
| Hawaiian / Pacific | 0 | 0.0% |
| Hispanic or Latino | 397 | 1.4% |
| Native / Alaskan | 2 | 0.0% |
| White / Caucasian | 27,149 | 96.5% |
| Two or more Races | 784 | 2.8% |
| Some other Race | 114 | 0.4% |
| Total | 28,133 | 100.0% |
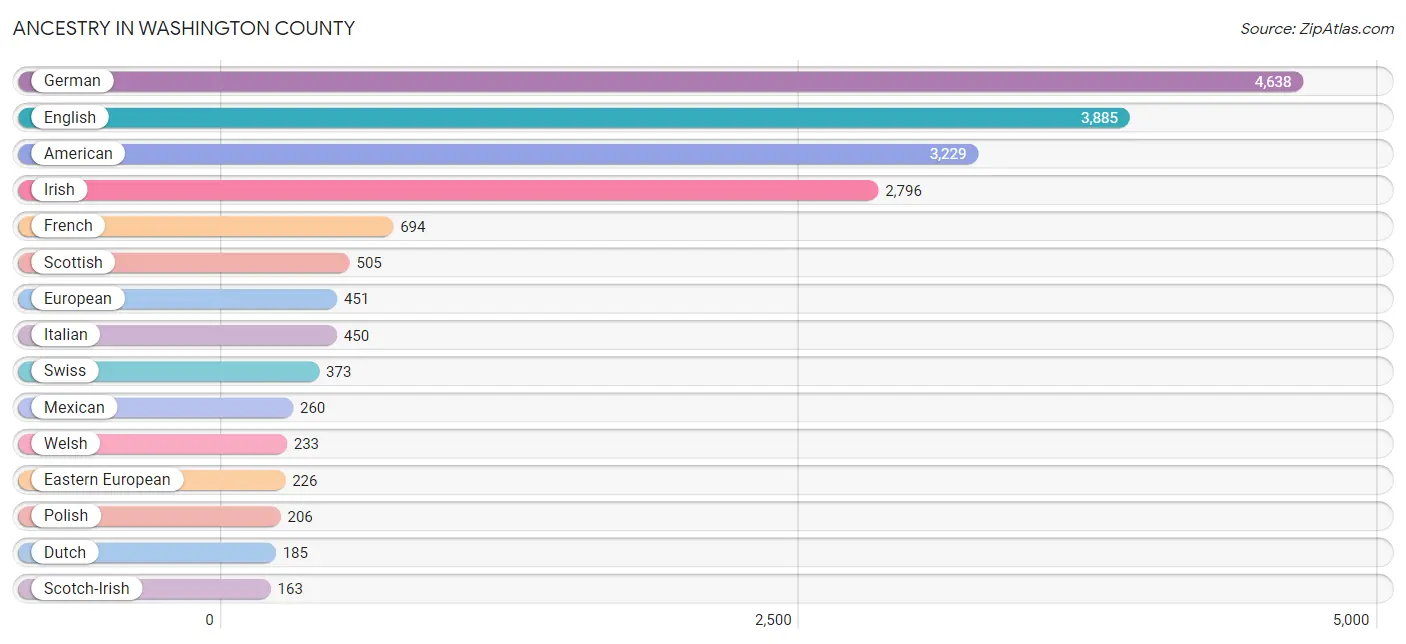
Ancestry in Washington County
The most populous ancestries reported in Washington County are German (4,638 | 16.5%), English (3,885 | 13.8%), American (3,229 | 11.5%), Irish (2,796 | 9.9%), and French (694 | 2.5%), together accounting for 54.2% of all Washington County residents.
| Ancestry | # Population | % Population |
| African | 6 | 0.0% |
| American | 3,229 | 11.5% |
| Austrian | 29 | 0.1% |
| Bhutanese | 5 | 0.0% |
| Blackfeet | 7 | 0.0% |
| British | 122 | 0.4% |
| Burmese | 24 | 0.1% |
| Cajun | 24 | 0.1% |
| Canadian | 40 | 0.1% |
| Central American | 1 | 0.0% |
| Cherokee | 77 | 0.3% |
| Croatian | 9 | 0.0% |
| Czech | 5 | 0.0% |
| Danish | 9 | 0.0% |
| Dutch | 185 | 0.7% |
| Eastern European | 226 | 0.8% |
| English | 3,885 | 13.8% |
| European | 451 | 1.6% |
| Finnish | 29 | 0.1% |
| French | 694 | 2.5% |
| French Canadian | 7 | 0.0% |
| German | 4,638 | 16.5% |
| Greek | 42 | 0.2% |
| Honduran | 1 | 0.0% |
| Hungarian | 19 | 0.1% |
| Indian (Asian) | 11 | 0.0% |
| Iranian | 11 | 0.0% |
| Irish | 2,796 | 9.9% |
| Iroquois | 2 | 0.0% |
| Italian | 450 | 1.6% |
| Korean | 16 | 0.1% |
| Lithuanian | 131 | 0.5% |
| Mexican | 260 | 0.9% |
| Native Hawaiian | 13 | 0.1% |
| Norwegian | 82 | 0.3% |
| Pakistani | 3 | 0.0% |
| Pennsylvania German | 54 | 0.2% |
| Polish | 206 | 0.7% |
| Portuguese | 10 | 0.0% |
| Puerto Rican | 34 | 0.1% |
| Romanian | 39 | 0.1% |
| Russian | 46 | 0.2% |
| Scandinavian | 159 | 0.6% |
| Scotch-Irish | 163 | 0.6% |
| Scottish | 505 | 1.8% |
| Slovak | 7 | 0.0% |
| Slovene | 54 | 0.2% |
| Spaniard | 55 | 0.2% |
| Sri Lankan | 11 | 0.0% |
| Subsaharan African | 6 | 0.0% |
| Swedish | 107 | 0.4% |
| Swiss | 373 | 1.3% |
| Turkish | 5 | 0.0% |
| Welsh | 233 | 0.8% | View All 54 Rows |
Immigrants in Washington County
The most numerous immigrant groups reported in Washington County came from Central America (70 | 0.3%), Latin America (70 | 0.3%), Mexico (70 | 0.3%), Canada (54 | 0.2%), and Asia (38 | 0.1%), together accounting for 1.1% of all Washington County residents.

| Immigration Origin | # Population | % Population |
| Africa | 1 | 0.0% |
| Asia | 38 | 0.1% |
| Canada | 54 | 0.2% |
| Central America | 70 | 0.3% |
| Eastern Asia | 24 | 0.1% |
| Eastern Europe | 7 | 0.0% |
| England | 3 | 0.0% |
| Europe | 29 | 0.1% |
| Germany | 19 | 0.1% |
| Ghana | 1 | 0.0% |
| Korea | 24 | 0.1% |
| Latin America | 70 | 0.3% |
| Mexico | 70 | 0.3% |
| Northern Europe | 3 | 0.0% |
| Philippines | 11 | 0.0% |
| Romania | 7 | 0.0% |
| South Eastern Asia | 14 | 0.1% |
| Thailand | 3 | 0.0% |
| Western Africa | 1 | 0.0% |
| Western Europe | 19 | 0.1% | View All 20 Rows |
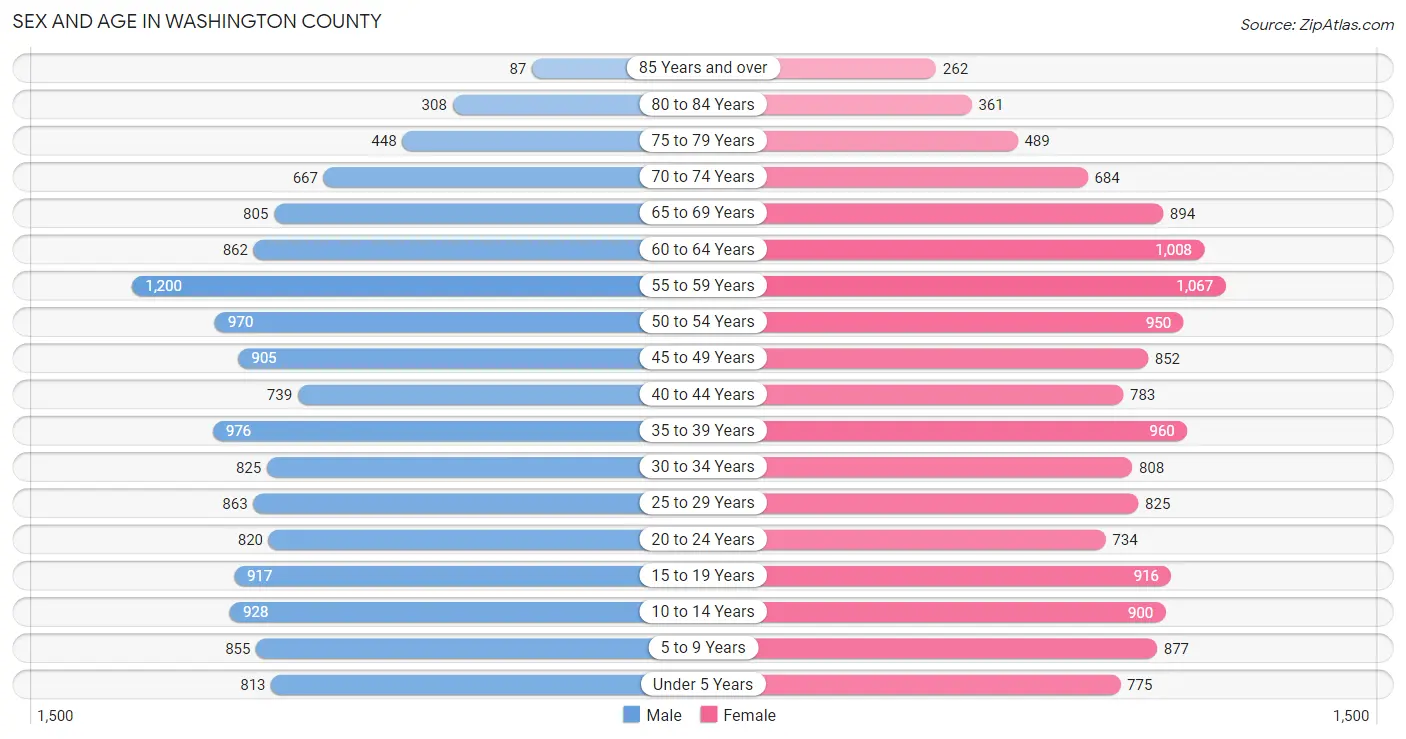
Sex and Age in Washington County
Sex and Age in Washington County
The most populous age groups in Washington County are 55 to 59 Years (1,200 | 8.6%) for men and 55 to 59 Years (1,067 | 7.5%) for women.
| Age Bracket | Male | Female |
| Under 5 Years | 813 (5.8%) | 775 (5.5%) |
| 5 to 9 Years | 855 (6.1%) | 877 (6.2%) |
| 10 to 14 Years | 928 (6.6%) | 900 (6.4%) |
| 15 to 19 Years | 917 (6.6%) | 916 (6.5%) |
| 20 to 24 Years | 820 (5.9%) | 734 (5.2%) |
| 25 to 29 Years | 863 (6.2%) | 825 (5.8%) |
| 30 to 34 Years | 825 (5.9%) | 808 (5.7%) |
| 35 to 39 Years | 976 (7.0%) | 960 (6.8%) |
| 40 to 44 Years | 739 (5.3%) | 783 (5.5%) |
| 45 to 49 Years | 905 (6.5%) | 852 (6.0%) |
| 50 to 54 Years | 970 (6.9%) | 950 (6.7%) |
| 55 to 59 Years | 1,200 (8.6%) | 1,067 (7.5%) |
| 60 to 64 Years | 862 (6.2%) | 1,008 (7.1%) |
| 65 to 69 Years | 805 (5.8%) | 894 (6.3%) |
| 70 to 74 Years | 667 (4.8%) | 684 (4.8%) |
| 75 to 79 Years | 448 (3.2%) | 489 (3.5%) |
| 80 to 84 Years | 308 (2.2%) | 361 (2.5%) |
| 85 Years and over | 87 (0.6%) | 262 (1.8%) |
| Total | 13,988 (100.0%) | 14,145 (100.0%) |
Families and Households in Washington County
Median Family Size in Washington County
The median family size in Washington County is 3.01 persons per family, with married-couple families (5,681 | 74.4%) accounting for the largest median family size of 3.07 persons per family. On the other hand, single male/father families (637 | 8.4%) represent the smallest median family size with 2.60 persons per family.

| Family Type | # Families | Family Size |
| Married-Couple | 5,681 (74.4%) | 3.07 |
| Single Male/Father | 637 (8.4%) | 2.60 |
| Single Female/Mother | 1,314 (17.2%) | 2.91 |
| Total Families | 7,632 (100.0%) | 3.01 |
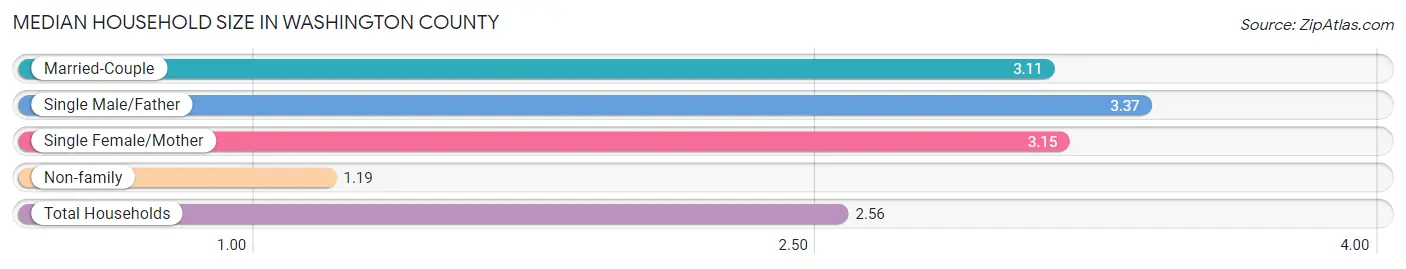
Median Household Size in Washington County
The median household size in Washington County is 2.56 persons per household, with single male/father households (637 | 5.9%) accounting for the largest median household size of 3.37 persons per household. non-family households (3,250 | 29.9%) represent the smallest median household size with 1.19 persons per household.
| Household Type | # Households | Household Size |
| Married-Couple | 5,681 (52.2%) | 3.11 |
| Single Male/Father | 637 (5.9%) | 3.37 |
| Single Female/Mother | 1,314 (12.1%) | 3.15 |
| Non-family | 3,250 (29.9%) | 1.19 |
| Total Households | 10,882 (100.0%) | 2.56 |
Household Size by Marriage Status in Washington County
Out of a total of 10,882 households in Washington County, 7,632 (70.1%) are family households, while 3,250 (29.9%) are nonfamily households. The most numerous type of family households are 2-person households, comprising 3,429, and the most common type of nonfamily households are 1-person households, comprising 2,772.

| Household Size | Family Households | Nonfamily Households |
| 1-Person Households | - | 2,772 (25.5%) |
| 2-Person Households | 3,429 (31.5%) | 403 (3.7%) |
| 3-Person Households | 2,014 (18.5%) | 49 (0.4%) |
| 4-Person Households | 1,089 (10.0%) | 26 (0.2%) |
| 5-Person Households | 439 (4.0%) | 0 (0.0%) |
| 6-Person Households | 299 (2.8%) | 0 (0.0%) |
| 7+ Person Households | 362 (3.3%) | 0 (0.0%) |
| Total | 7,632 (70.1%) | 3,250 (29.9%) |
Female Fertility in Washington County
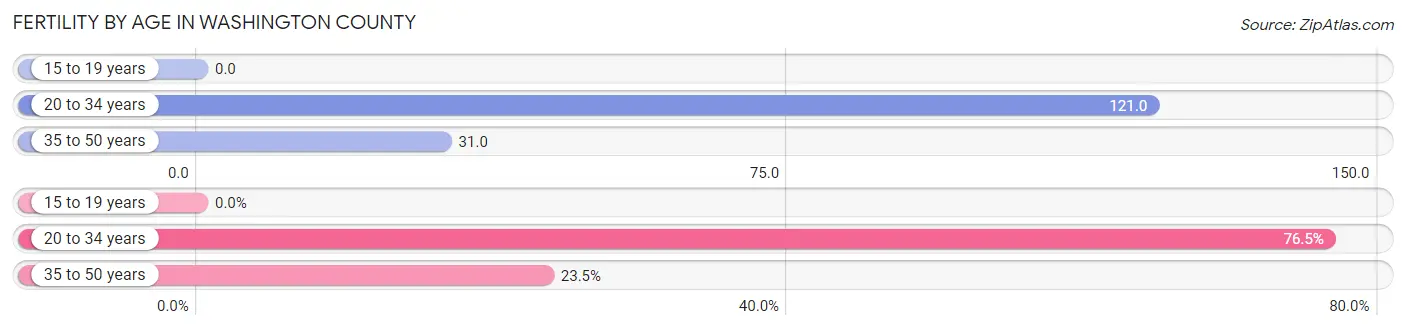
Fertility by Age in Washington County
Average fertility rate in Washington County is 61.0 births per 1,000 women. Women in the age bracket of 20 to 34 years have the highest fertility rate with 121.0 births per 1,000 women. Women in the age bracket of 20 to 34 years acount for 76.5% of all women with births.
| Age Bracket | Women with Births | Births / 1,000 Women |
| 15 to 19 years | 0 (0.0%) | 0.0 |
| 20 to 34 years | 287 (76.5%) | 121.0 |
| 35 to 50 years | 88 (23.5%) | 31.0 |
| Total | 375 (100.0%) | 61.0 |
Fertility by Age by Marriage Status in Washington County
66.7% of women with births (375) in Washington County are married. The highest percentage of unmarried women with births falls into 20 to 34 years age bracket with 39.0% of them unmarried at the time of birth, while the lowest percentage of unmarried women with births belong to 35 to 50 years age bracket with 14.8% of them unmarried.
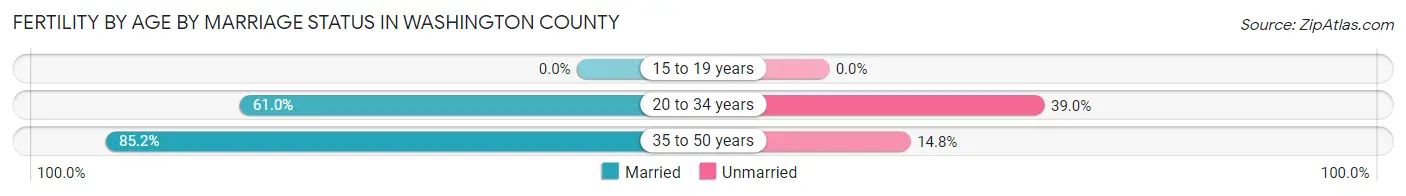
| Age Bracket | Married | Unmarried |
| 15 to 19 years | 0 (0.0%) | 0 (0.0%) |
| 20 to 34 years | 175 (61.0%) | 112 (39.0%) |
| 35 to 50 years | 75 (85.2%) | 13 (14.8%) |
| Total | 250 (66.7%) | 125 (33.3%) |
Fertility by Education in Washington County
Average fertility rate in Washington County is 61.0 births per 1,000 women. Women with the education attainment of high school diploma have the highest fertility rate of 100.0 births per 1,000 women, while women with the education attainment of graduate degree have the lowest fertility at 34.0 births per 1,000 women. Women with the education attainment of high school diploma represent 42.7% of all women with births.

| Educational Attainment | Women with Births | Births / 1,000 Women |
| Less than High School | 83 (22.1%) | 73.0 |
| High School Diploma | 160 (42.7%) | 100.0 |
| College or Associate's Degree | 81 (21.6%) | 35.0 |
| Bachelor's Degree | 44 (11.7%) | 53.0 |
| Graduate Degree | 7 (1.9%) | 34.0 |
| Total | 375 (100.0%) | 61.0 |
Fertility by Education by Marriage Status in Washington County
33.3% of women with births in Washington County are unmarried. Women with the educational attainment of less than high school are most likely to be married with 100.0% of them married at childbirth, while women with the educational attainment of high school diploma are least likely to be married with 56.2% of them unmarried at childbirth.

| Educational Attainment | Married | Unmarried |
| Less than High School | 83 (100.0%) | 0 (0.0%) |
| High School Diploma | 70 (43.8%) | 90 (56.2%) |
| College or Associate's Degree | 46 (56.8%) | 35 (43.2%) |
| Bachelor's Degree | 44 (100.0%) | 0 (0.0%) |
| Graduate Degree | 7 (100.0%) | 0 (0.0%) |
| Total | 250 (66.7%) | 125 (33.3%) |
Income in Washington County
Income Overview in Washington County
Per Capita Income in Washington County is $28,963, while median incomes of families and households are $74,597 and $60,695 respectively.
| Characteristic | Number | Measure |
| Per Capita Income | 28,133 | $28,963 |
| Median Family Income | 7,632 | $74,597 |
| Mean Family Income | 7,632 | $85,973 |
| Median Household Income | 10,882 | $60,695 |
| Mean Household Income | 10,882 | $73,702 |
| Income Deficit | 7,632 | $9,523 |
| Wage / Income Gap (%) | 28,133 | 22.89% |
| Wage / Income Gap ($) | 28,133 | 77.11¢ per $1 |
| Gini / Inequality Index | 28,133 | 0.41 |
Earnings by Sex in Washington County
Average Earnings in Washington County are $37,392, $43,595 for men and $33,615 for women, a difference of 22.9%.

| Sex | Number | Average Earnings |
| Male | 7,912 (55.6%) | $43,595 |
| Female | 6,308 (44.4%) | $33,615 |
| Total | 14,220 (100.0%) | $37,392 |
Earnings by Sex by Income Bracket in Washington County
The most common earnings brackets in Washington County are $55,000 to $64,999 for men (969 | 12.2%) and $35,000 to $39,999 for women (756 | 12.0%).

| Income | Male | Female |
| $2,499 or less | 402 (5.1%) | 313 (5.0%) |
| $2,500 to $4,999 | 88 (1.1%) | 100 (1.6%) |
| $5,000 to $7,499 | 131 (1.7%) | 260 (4.1%) |
| $7,500 to $9,999 | 120 (1.5%) | 101 (1.6%) |
| $10,000 to $12,499 | 193 (2.4%) | 363 (5.8%) |
| $12,500 to $14,999 | 142 (1.8%) | 233 (3.7%) |
| $15,000 to $17,499 | 200 (2.5%) | 392 (6.2%) |
| $17,500 to $19,999 | 209 (2.6%) | 211 (3.3%) |
| $20,000 to $22,499 | 112 (1.4%) | 214 (3.4%) |
| $22,500 to $24,999 | 320 (4.0%) | 207 (3.3%) |
| $25,000 to $29,999 | 471 (5.9%) | 435 (6.9%) |
| $30,000 to $34,999 | 651 (8.2%) | 469 (7.4%) |
| $35,000 to $39,999 | 625 (7.9%) | 756 (12.0%) |
| $40,000 to $44,999 | 351 (4.4%) | 377 (6.0%) |
| $45,000 to $49,999 | 543 (6.9%) | 445 (7.0%) |
| $50,000 to $54,999 | 406 (5.1%) | 262 (4.2%) |
| $55,000 to $64,999 | 969 (12.2%) | 465 (7.4%) |
| $65,000 to $74,999 | 703 (8.9%) | 347 (5.5%) |
| $75,000 to $99,999 | 629 (8.0%) | 201 (3.2%) |
| $100,000+ | 647 (8.2%) | 157 (2.5%) |
| Total | 7,912 (100.0%) | 6,308 (100.0%) |
Earnings by Sex by Educational Attainment in Washington County
Average earnings in Washington County are $47,358 for men and $36,078 for women, a difference of 23.8%. Men with an educational attainment of bachelor's degree enjoy the highest average annual earnings of $65,347, while those with less than high school education earn the least with $37,361. Women with an educational attainment of graduate degree earn the most with the average annual earnings of $60,298, while those with high school diploma education have the smallest earnings of $28,516.
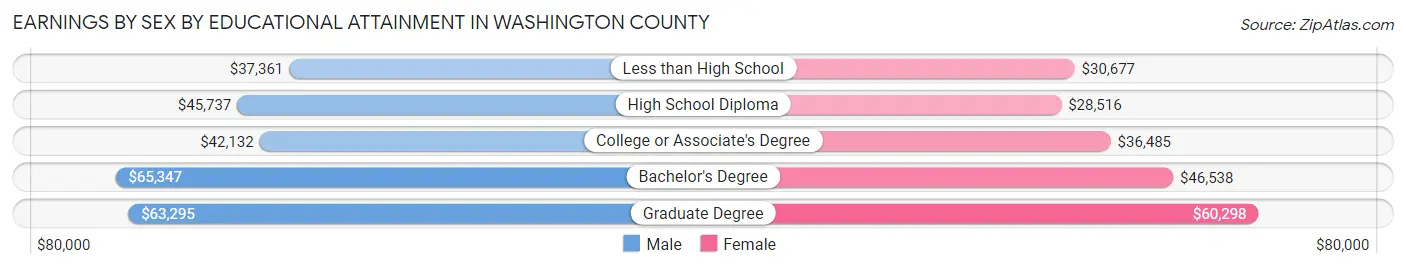
| Educational Attainment | Male Income | Female Income |
| Less than High School | $37,361 | $30,677 |
| High School Diploma | $45,737 | $28,516 |
| College or Associate's Degree | $42,132 | $36,485 |
| Bachelor's Degree | $65,347 | $46,538 |
| Graduate Degree | $63,295 | $60,298 |
| Total | $47,358 | $36,078 |
Family Income in Washington County
Family Income Brackets in Washington County
According to the Washington County family income data, there are 1,626 families falling into the $50,000 to $74,999 income range, which is the most common income bracket and makes up 21.3% of all families. Conversely, the $10,000 to $14,999 income bracket is the least frequent group with only 160 families (2.1%) belonging to this category.

| Income Bracket | # Families | % Families |
| Less than $10,000 | 168 | 2.2% |
| $10,000 to $14,999 | 160 | 2.1% |
| $15,000 to $24,999 | 290 | 3.8% |
| $25,000 to $34,999 | 572 | 7.5% |
| $35,000 to $49,999 | 1,038 | 13.6% |
| $50,000 to $74,999 | 1,626 | 21.3% |
| $75,000 to $99,999 | 1,519 | 19.9% |
| $100,000 to $149,999 | 1,244 | 16.3% |
| $150,000 to $199,999 | 740 | 9.7% |
| $200,000+ | 275 | 3.6% |
Family Income by Famaliy Size in Washington County
5-person families (491 | 6.4%) account for the highest median family income in Washington County with $115,341 per family, while 2-person families (3,761 | 49.3%) have the highest median income of $33,012 per family member.
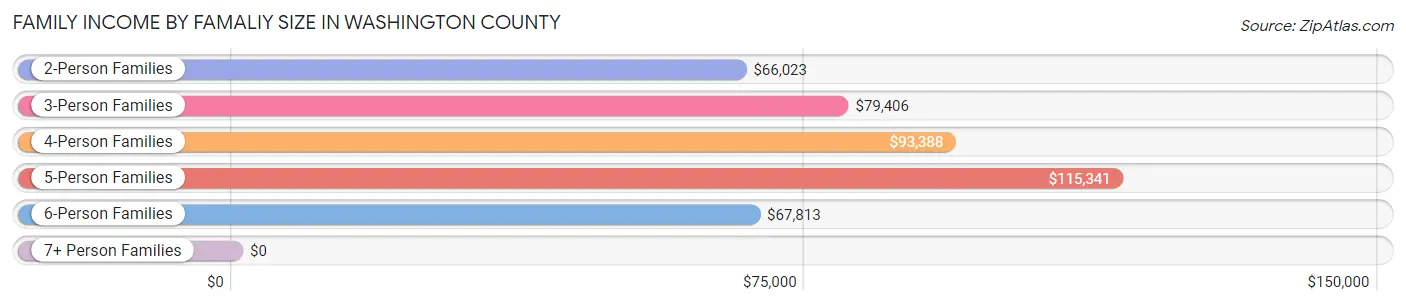
| Income Bracket | # Families | Median Income |
| 2-Person Families | 3,761 (49.3%) | $66,023 |
| 3-Person Families | 1,907 (25.0%) | $79,406 |
| 4-Person Families | 965 (12.6%) | $93,388 |
| 5-Person Families | 491 (6.4%) | $115,341 |
| 6-Person Families | 302 (4.0%) | $67,813 |
| 7+ Person Families | 206 (2.7%) | $0 |
| Total | 7,632 (100.0%) | $74,597 |
Family Income by Number of Earners in Washington County
The median family income in Washington County is $74,597, with families comprising 3+ earners (773) having the highest median family income of $125,625, while families with no earners (1,351) have the lowest median family income of $34,618, accounting for 10.1% and 17.7% of families, respectively.

| Number of Earners | # Families | Median Income |
| No Earners | 1,351 (17.7%) | $34,618 |
| 1 Earner | 2,341 (30.7%) | $55,554 |
| 2 Earners | 3,167 (41.5%) | $93,740 |
| 3+ Earners | 773 (10.1%) | $125,625 |
| Total | 7,632 (100.0%) | $74,597 |
Household Income in Washington County
Household Income Brackets in Washington County
With 1,872 households falling in the category, the $50,000 to $74,999 income range is the most frequent in Washington County, accounting for 17.2% of all households. In contrast, only 316 households (2.9%) fall into the $200,000+ income bracket, making it the least populous group.
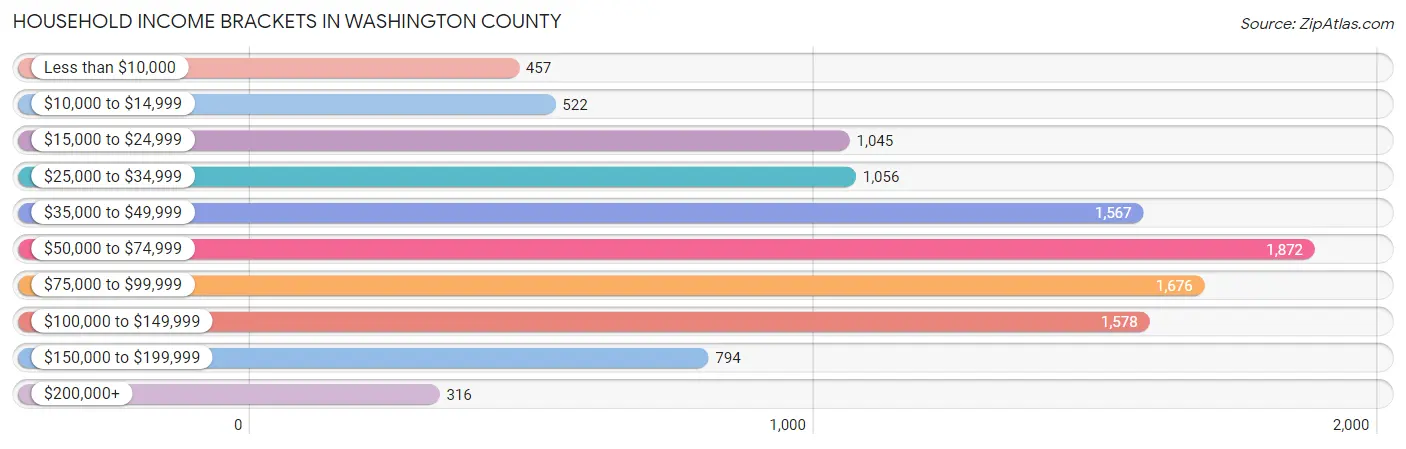
| Income Bracket | # Households | % Households |
| Less than $10,000 | 457 | 4.2% |
| $10,000 to $14,999 | 522 | 4.8% |
| $15,000 to $24,999 | 1,045 | 9.6% |
| $25,000 to $34,999 | 1,056 | 9.7% |
| $35,000 to $49,999 | 1,567 | 14.4% |
| $50,000 to $74,999 | 1,872 | 17.2% |
| $75,000 to $99,999 | 1,676 | 15.4% |
| $100,000 to $149,999 | 1,578 | 14.5% |
| $150,000 to $199,999 | 794 | 7.3% |
| $200,000+ | 316 | 2.9% |
Household Income by Householder Age in Washington County
The median household income in Washington County is $60,695, with the highest median household income of $74,125 found in the 15 to 24 years age bracket for the primary householder. A total of 289 households (2.7%) fall into this category. Meanwhile, the 65+ years age bracket for the primary householder has the lowest median household income of $37,214, with 3,269 households (30.0%) in this group.
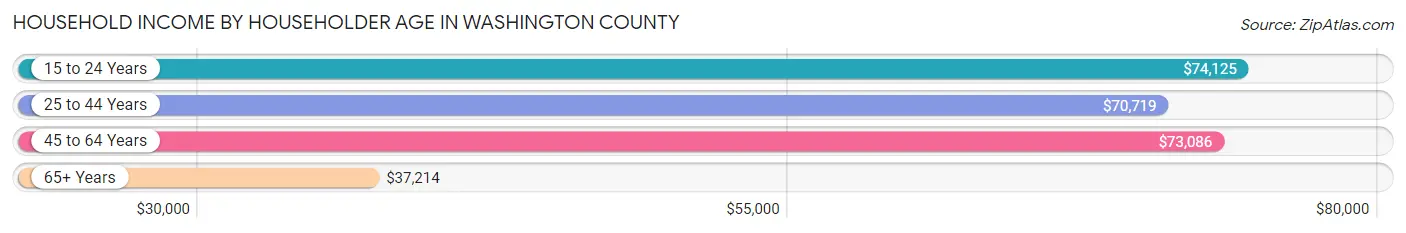
| Income Bracket | # Households | Median Income |
| 15 to 24 Years | 289 (2.7%) | $74,125 |
| 25 to 44 Years | 2,977 (27.4%) | $70,719 |
| 45 to 64 Years | 4,347 (40.0%) | $73,086 |
| 65+ Years | 3,269 (30.0%) | $37,214 |
| Total | 10,882 (100.0%) | $60,695 |
Poverty in Washington County
Income Below Poverty by Sex and Age in Washington County
With 12.2% poverty level for males and 14.0% for females among the residents of Washington County, 6 to 11 year old males and 5 year old females are the most vulnerable to poverty, with 274 males (25.3%) and 70 females (35.5%) in their respective age groups living below the poverty level.

| Age Bracket | Male | Female |
| Under 5 Years | 61 (9.0%) | 141 (18.9%) |
| 5 Years | 14 (11.8%) | 70 (35.5%) |
| 6 to 11 Years | 274 (25.3%) | 117 (12.3%) |
| 12 to 14 Years | 98 (17.1%) | 115 (18.6%) |
| 15 Years | 16 (6.1%) | 37 (16.0%) |
| 16 and 17 Years | 2 (0.6%) | 61 (15.5%) |
| 18 to 24 Years | 78 (7.0%) | 158 (15.5%) |
| 25 to 34 Years | 277 (16.6%) | 380 (23.4%) |
| 35 to 44 Years | 175 (10.3%) | 132 (7.7%) |
| 45 to 54 Years | 183 (9.8%) | 193 (10.8%) |
| 55 to 64 Years | 370 (18.1%) | 222 (10.7%) |
| 65 to 74 Years | 47 (3.2%) | 196 (12.5%) |
| 75 Years and over | 88 (10.8%) | 121 (12.0%) |
| Total | 1,683 (12.2%) | 1,943 (14.0%) |
Income Above Poverty by Sex and Age in Washington County
According to the poverty statistics in Washington County, males aged 16 and 17 years and females aged 35 to 44 years are the age groups that are most secure financially, with 99.4% of males and 92.3% of females in these age groups living above the poverty line.

| Age Bracket | Male | Female |
| Under 5 Years | 613 (90.9%) | 605 (81.1%) |
| 5 Years | 105 (88.2%) | 127 (64.5%) |
| 6 to 11 Years | 808 (74.7%) | 837 (87.7%) |
| 12 to 14 Years | 476 (82.9%) | 503 (81.4%) |
| 15 Years | 246 (93.9%) | 195 (84.1%) |
| 16 and 17 Years | 338 (99.4%) | 333 (84.5%) |
| 18 to 24 Years | 1,043 (93.0%) | 858 (84.5%) |
| 25 to 34 Years | 1,392 (83.4%) | 1,244 (76.6%) |
| 35 to 44 Years | 1,530 (89.7%) | 1,587 (92.3%) |
| 45 to 54 Years | 1,692 (90.2%) | 1,587 (89.2%) |
| 55 to 64 Years | 1,669 (81.9%) | 1,847 (89.3%) |
| 65 to 74 Years | 1,416 (96.8%) | 1,370 (87.5%) |
| 75 Years and over | 724 (89.2%) | 888 (88.0%) |
| Total | 12,052 (87.7%) | 11,981 (86.1%) |
Income Below Poverty Among Married-Couple Families in Washington County
The poverty statistics for married-couple families in Washington County show that 4.3% or 243 of the total 5,681 families live below the poverty line. Families with 5 or more children have the highest poverty rate of 16.7%, comprising of 16 families. On the other hand, families with 1 or 2 children have the lowest poverty rate of 2.4%, which includes 31 families.
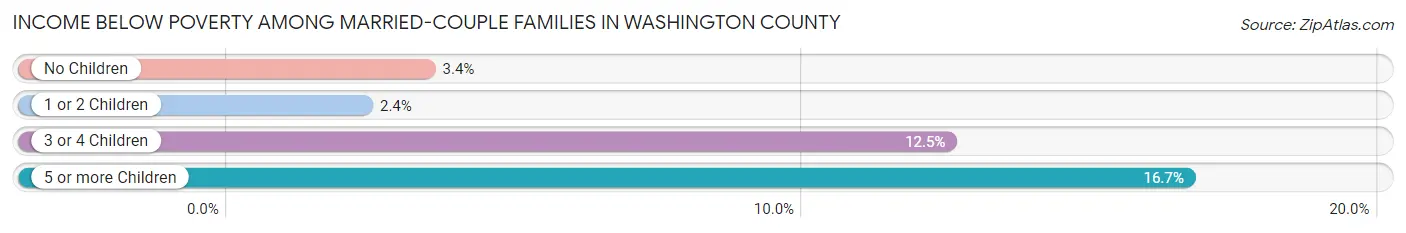
| Children | Above Poverty | Below Poverty |
| No Children | 3,594 (96.6%) | 128 (3.4%) |
| 1 or 2 Children | 1,289 (97.7%) | 31 (2.4%) |
| 3 or 4 Children | 475 (87.5%) | 68 (12.5%) |
| 5 or more Children | 80 (83.3%) | 16 (16.7%) |
| Total | 5,438 (95.7%) | 243 (4.3%) |
Income Below Poverty Among Single-Parent Households in Washington County
According to the poverty data in Washington County, 9.6% or 61 single-father households and 23.1% or 304 single-mother households are living below the poverty line. Among single-father households, those with 1 or 2 children have the highest poverty rate, with 47 households (14.3%) experiencing poverty. Likewise, among single-mother households, those with 5 or more children have the highest poverty rate, with 21 households (61.8%) falling below the poverty line.
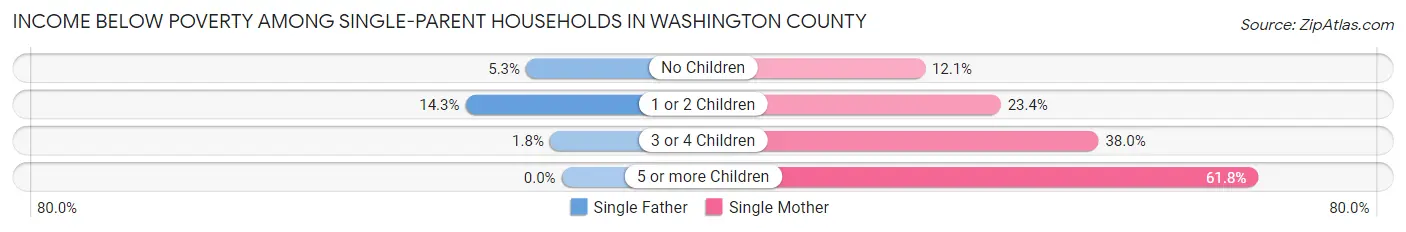
| Children | Single Father | Single Mother |
| No Children | 13 (5.3%) | 47 (12.1%) |
| 1 or 2 Children | 47 (14.3%) | 165 (23.4%) |
| 3 or 4 Children | 1 (1.8%) | 71 (38.0%) |
| 5 or more Children | 0 (0.0%) | 21 (61.8%) |
| Total | 61 (9.6%) | 304 (23.1%) |
Income Below Poverty Among Married-Couple vs Single-Parent Households in Washington County
The poverty data for Washington County shows that 243 of the married-couple family households (4.3%) and 365 of the single-parent households (18.7%) are living below the poverty level. Within the married-couple family households, those with 5 or more children have the highest poverty rate, with 16 households (16.7%) falling below the poverty line. Among the single-parent households, those with 5 or more children have the highest poverty rate, with 21 household (51.2%) living below poverty.
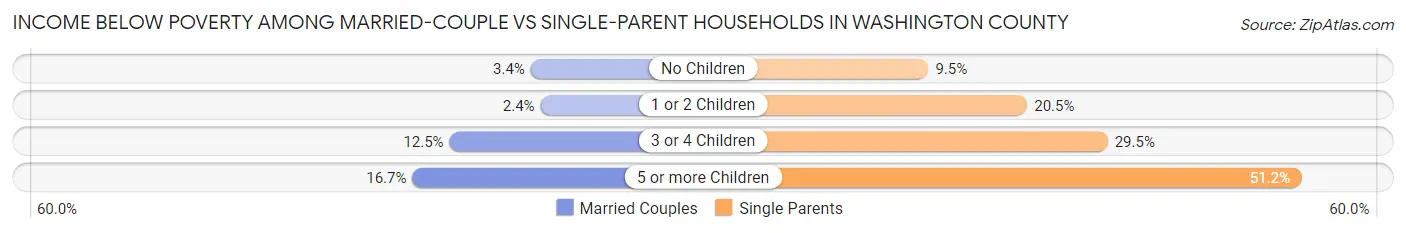
| Children | Married-Couple Families | Single-Parent Households |
| No Children | 128 (3.4%) | 60 (9.5%) |
| 1 or 2 Children | 31 (2.4%) | 212 (20.5%) |
| 3 or 4 Children | 68 (12.5%) | 72 (29.5%) |
| 5 or more Children | 16 (16.7%) | 21 (51.2%) |
| Total | 243 (4.3%) | 365 (18.7%) |
Employment Characteristics in Washington County
Employment by Class of Employer in Washington County
Among the 12,768 employed individuals in Washington County, private company employees (9,187 | 72.0%), local government employees (1,002 | 7.9%), and self-employed (not incorporated) (806 | 6.3%) make up the most common classes of employment.
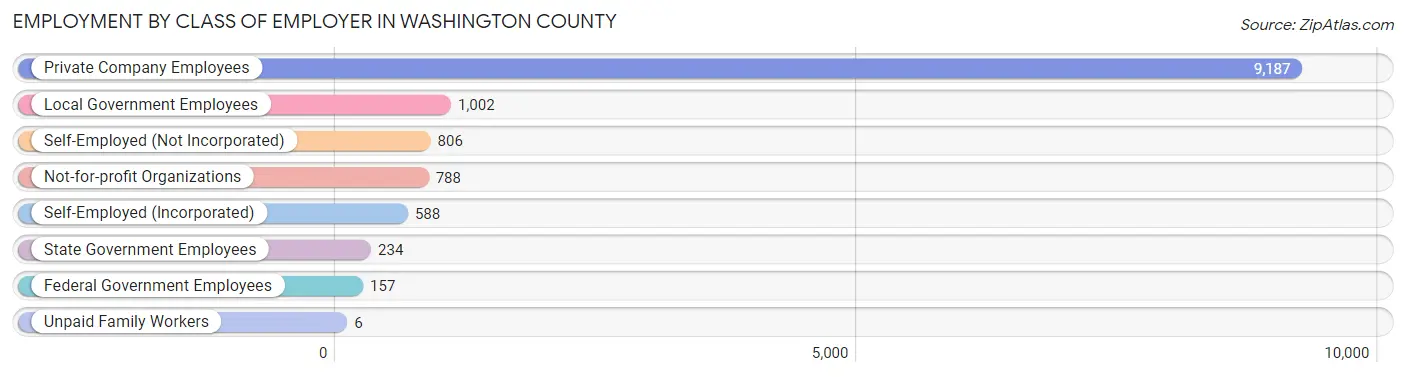
| Employer Class | # Employees | % Employees |
| Private Company Employees | 9,187 | 72.0% |
| Self-Employed (Incorporated) | 588 | 4.6% |
| Self-Employed (Not Incorporated) | 806 | 6.3% |
| Not-for-profit Organizations | 788 | 6.2% |
| Local Government Employees | 1,002 | 7.9% |
| State Government Employees | 234 | 1.8% |
| Federal Government Employees | 157 | 1.2% |
| Unpaid Family Workers | 6 | 0.1% |
| Total | 12,768 | 100.0% |
Employment Status by Age in Washington County
According to the labor force statistics for Washington County, out of the total population over 16 years of age (22,491), 61.1% or 13,742 individuals are in the labor force, with 4.2% or 577 of them unemployed. The age group with the highest labor force participation rate is 35 to 44 years, with 85.9% or 2,970 individuals in the labor force. Within the labor force, the 20 to 24 years age range has the highest percentage of unemployed individuals, with 13.6% or 161 of them being unemployed.
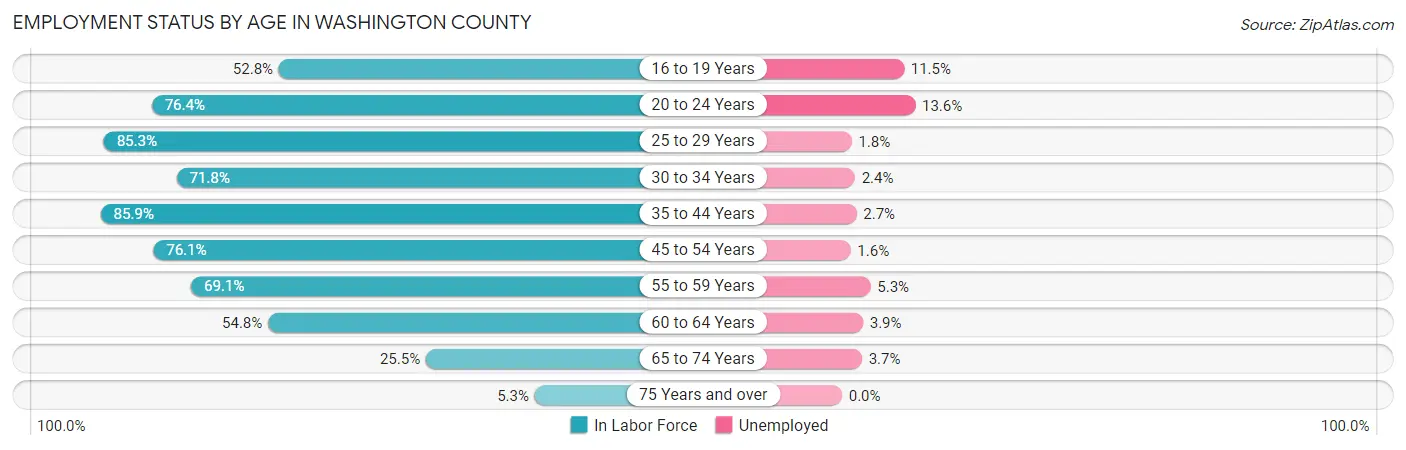
| Age Bracket | In Labor Force | Unemployed |
| 16 to 19 Years | 707 (52.8%) | 81 (11.5%) |
| 20 to 24 Years | 1,187 (76.4%) | 161 (13.6%) |
| 25 to 29 Years | 1,440 (85.3%) | 26 (1.8%) |
| 30 to 34 Years | 1,172 (71.8%) | 28 (2.4%) |
| 35 to 44 Years | 2,970 (85.9%) | 80 (2.7%) |
| 45 to 54 Years | 2,798 (76.1%) | 45 (1.6%) |
| 55 to 59 Years | 1,566 (69.1%) | 83 (5.3%) |
| 60 to 64 Years | 1,025 (54.8%) | 40 (3.9%) |
| 65 to 74 Years | 778 (25.5%) | 29 (3.7%) |
| 75 Years and over | 104 (5.3%) | 0 (0.0%) |
| Total | 13,742 (61.1%) | 577 (4.2%) |
Employment Status by Educational Attainment in Washington County
According to labor force statistics for Washington County, 75.2% of individuals (10,974) out of the total population between 25 and 64 years of age (14,593) are in the labor force, with 2.8% or 307 of them being unemployed. The group with the highest labor force participation rate are those with the educational attainment of bachelor's degree or higher, with 88.7% or 1,963 individuals in the labor force. Within the labor force, individuals with college / associate degree education have the highest percentage of unemployment, with 3.6% or 144 of them being unemployed.

| Educational Attainment | In Labor Force | Unemployed |
| Less than High School | 718 (48.5%) | 10 (0.7%) |
| High School Diploma | 4,293 (72.4%) | 154 (2.6%) |
| College / Associate Degree | 3,996 (80.4%) | 179 (3.6%) |
| Bachelor's Degree or higher | 1,963 (88.7%) | 46 (2.1%) |
| Total | 10,974 (75.2%) | 409 (2.8%) |
Employment Occupations by Sex in Washington County
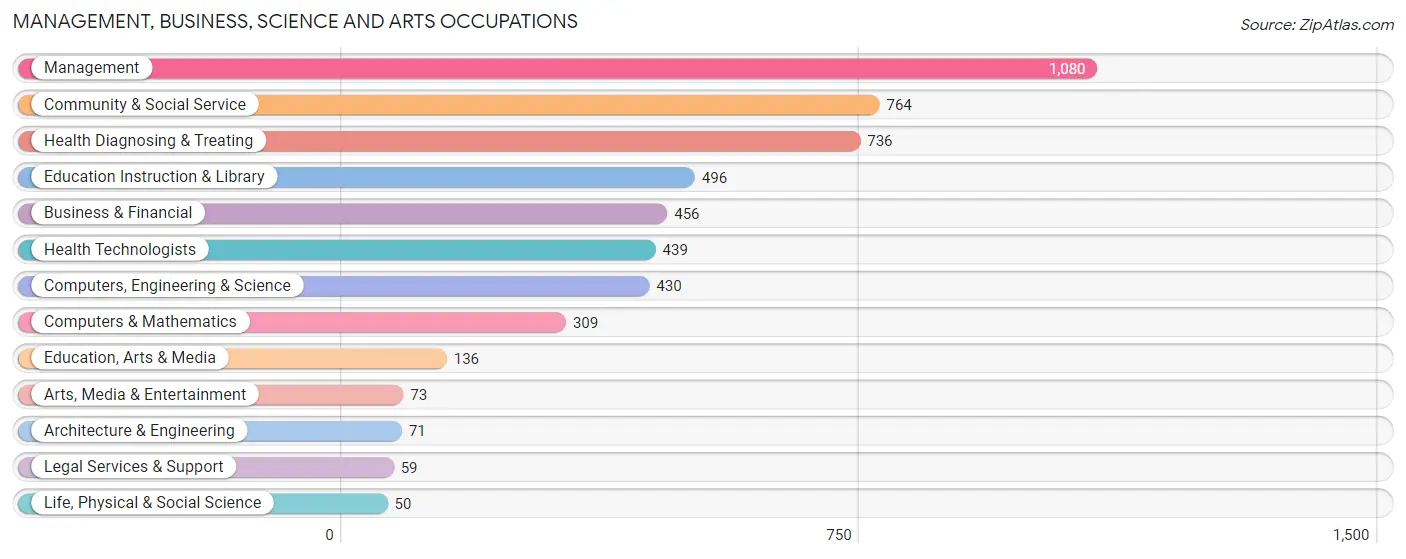
Management, Business, Science and Arts Occupations
The most common Management, Business, Science and Arts occupations in Washington County are Management (1,080 | 8.2%), Community & Social Service (764 | 5.8%), Health Diagnosing & Treating (736 | 5.6%), Education Instruction & Library (496 | 3.8%), and Business & Financial (456 | 3.5%).
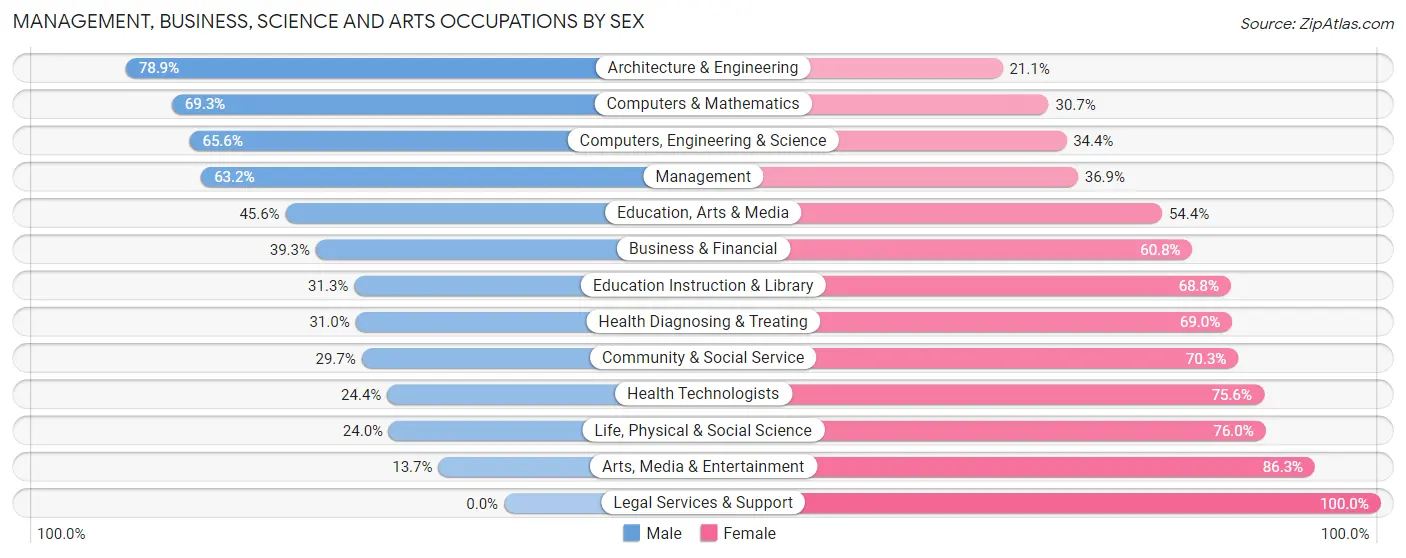
Management, Business, Science and Arts Occupations by Sex
Within the Management, Business, Science and Arts occupations in Washington County, the most male-oriented occupations are Architecture & Engineering (78.9%), Computers & Mathematics (69.3%), and Computers, Engineering & Science (65.6%), while the most female-oriented occupations are Legal Services & Support (100.0%), Arts, Media & Entertainment (86.3%), and Life, Physical & Social Science (76.0%).
| Occupation | Male | Female |
| Management | 682 (63.1%) | 398 (36.8%) |
| Business & Financial | 179 (39.3%) | 277 (60.8%) |
| Computers, Engineering & Science | 282 (65.6%) | 148 (34.4%) |
| Computers & Mathematics | 214 (69.3%) | 95 (30.7%) |
| Architecture & Engineering | 56 (78.9%) | 15 (21.1%) |
| Life, Physical & Social Science | 12 (24.0%) | 38 (76.0%) |
| Community & Social Service | 227 (29.7%) | 537 (70.3%) |
| Education, Arts & Media | 62 (45.6%) | 74 (54.4%) |
| Legal Services & Support | 0 (0.0%) | 59 (100.0%) |
| Education Instruction & Library | 155 (31.2%) | 341 (68.8%) |
| Arts, Media & Entertainment | 10 (13.7%) | 63 (86.3%) |
| Health Diagnosing & Treating | 228 (31.0%) | 508 (69.0%) |
| Health Technologists | 107 (24.4%) | 332 (75.6%) |
| Total (Category) | 1,598 (46.1%) | 1,868 (53.9%) |
| Total (Overall) | 7,448 (56.6%) | 5,716 (43.4%) |
Services Occupations
The most common Services occupations in Washington County are Healthcare Support (491 | 3.7%), Food Preparation & Serving (468 | 3.6%), Cleaning & Maintenance (367 | 2.8%), Personal Care & Service (294 | 2.2%), and Security & Protection (184 | 1.4%).

Services Occupations by Sex
Within the Services occupations in Washington County, the most male-oriented occupations are Law Enforcement (100.0%), Security & Protection (84.8%), and Firefighting & Prevention (63.2%), while the most female-oriented occupations are Healthcare Support (96.1%), Personal Care & Service (90.1%), and Food Preparation & Serving (65.8%).
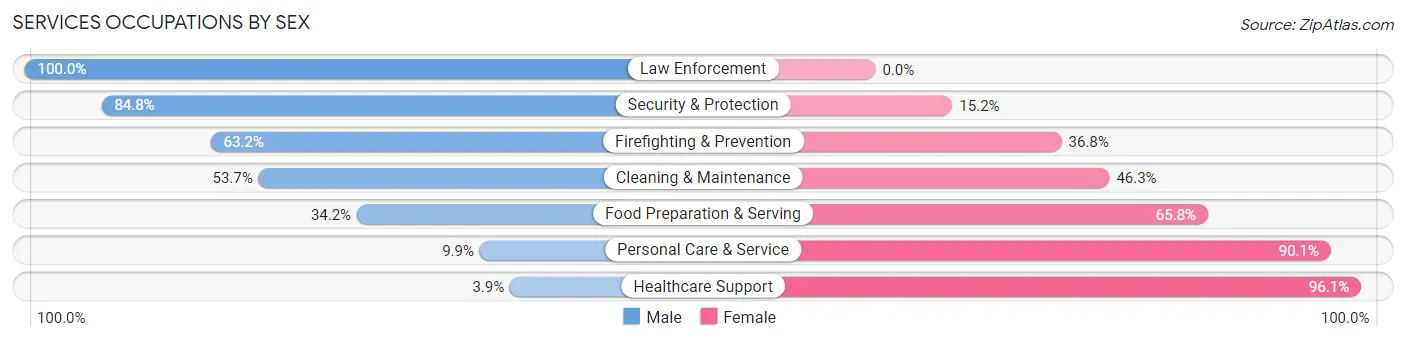
| Occupation | Male | Female |
| Healthcare Support | 19 (3.9%) | 472 (96.1%) |
| Security & Protection | 156 (84.8%) | 28 (15.2%) |
| Firefighting & Prevention | 48 (63.2%) | 28 (36.8%) |
| Law Enforcement | 108 (100.0%) | 0 (0.0%) |
| Food Preparation & Serving | 160 (34.2%) | 308 (65.8%) |
| Cleaning & Maintenance | 197 (53.7%) | 170 (46.3%) |
| Personal Care & Service | 29 (9.9%) | 265 (90.1%) |
| Total (Category) | 561 (31.1%) | 1,243 (68.9%) |
| Total (Overall) | 7,448 (56.6%) | 5,716 (43.4%) |
Sales and Office Occupations
The most common Sales and Office occupations in Washington County are Office & Administration (1,388 | 10.5%), and Sales & Related (1,029 | 7.8%).

Sales and Office Occupations by Sex
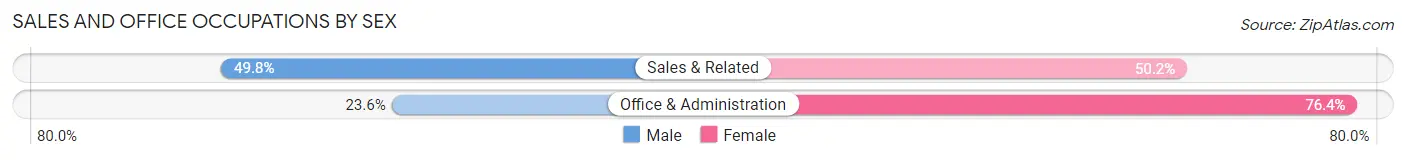
| Occupation | Male | Female |
| Sales & Related | 512 (49.8%) | 517 (50.2%) |
| Office & Administration | 327 (23.6%) | 1,061 (76.4%) |
| Total (Category) | 839 (34.7%) | 1,578 (65.3%) |
| Total (Overall) | 7,448 (56.6%) | 5,716 (43.4%) |
Natural Resources, Construction and Maintenance Occupations
The most common Natural Resources, Construction and Maintenance occupations in Washington County are Construction & Extraction (1,090 | 8.3%), Installation, Maintenance & Repair (389 | 3.0%), and Farming, Fishing & Forestry (197 | 1.5%).

Natural Resources, Construction and Maintenance Occupations by Sex

| Occupation | Male | Female |
| Farming, Fishing & Forestry | 185 (93.9%) | 12 (6.1%) |
| Construction & Extraction | 1,015 (93.1%) | 75 (6.9%) |
| Installation, Maintenance & Repair | 389 (100.0%) | 0 (0.0%) |
| Total (Category) | 1,589 (94.8%) | 87 (5.2%) |
| Total (Overall) | 7,448 (56.6%) | 5,716 (43.4%) |
Production, Transportation and Moving Occupations
The most common Production, Transportation and Moving occupations in Washington County are Production (1,734 | 13.2%), Material Moving (1,067 | 8.1%), and Transportation (1,000 | 7.6%).

Production, Transportation and Moving Occupations by Sex
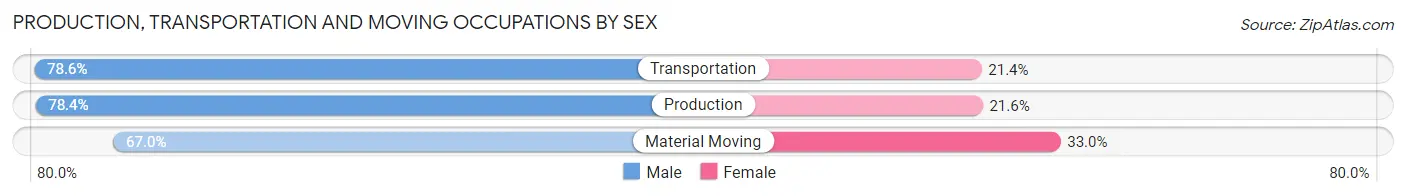
| Occupation | Male | Female |
| Production | 1,360 (78.4%) | 374 (21.6%) |
| Transportation | 786 (78.6%) | 214 (21.4%) |
| Material Moving | 715 (67.0%) | 352 (33.0%) |
| Total (Category) | 2,861 (75.3%) | 940 (24.7%) |
| Total (Overall) | 7,448 (56.6%) | 5,716 (43.4%) |
Employment Industries by Sex in Washington County
Employment Industries in Washington County
The major employment industries in Washington County include Manufacturing (3,120 | 23.7%), Retail Trade (1,661 | 12.6%), Health Care & Social Assistance (1,460 | 11.1%), Construction (1,338 | 10.2%), and Transportation & Warehousing (875 | 6.7%).

Employment Industries by Sex in Washington County
The Washington County industries that see more men than women are Mining, Quarrying, & Extraction (100.0%), Agriculture, Fishing & Hunting (93.0%), and Construction (87.9%), whereas the industries that tend to have a higher number of women are Finance & Insurance (85.2%), Health Care & Social Assistance (77.8%), and Educational Services (75.3%).
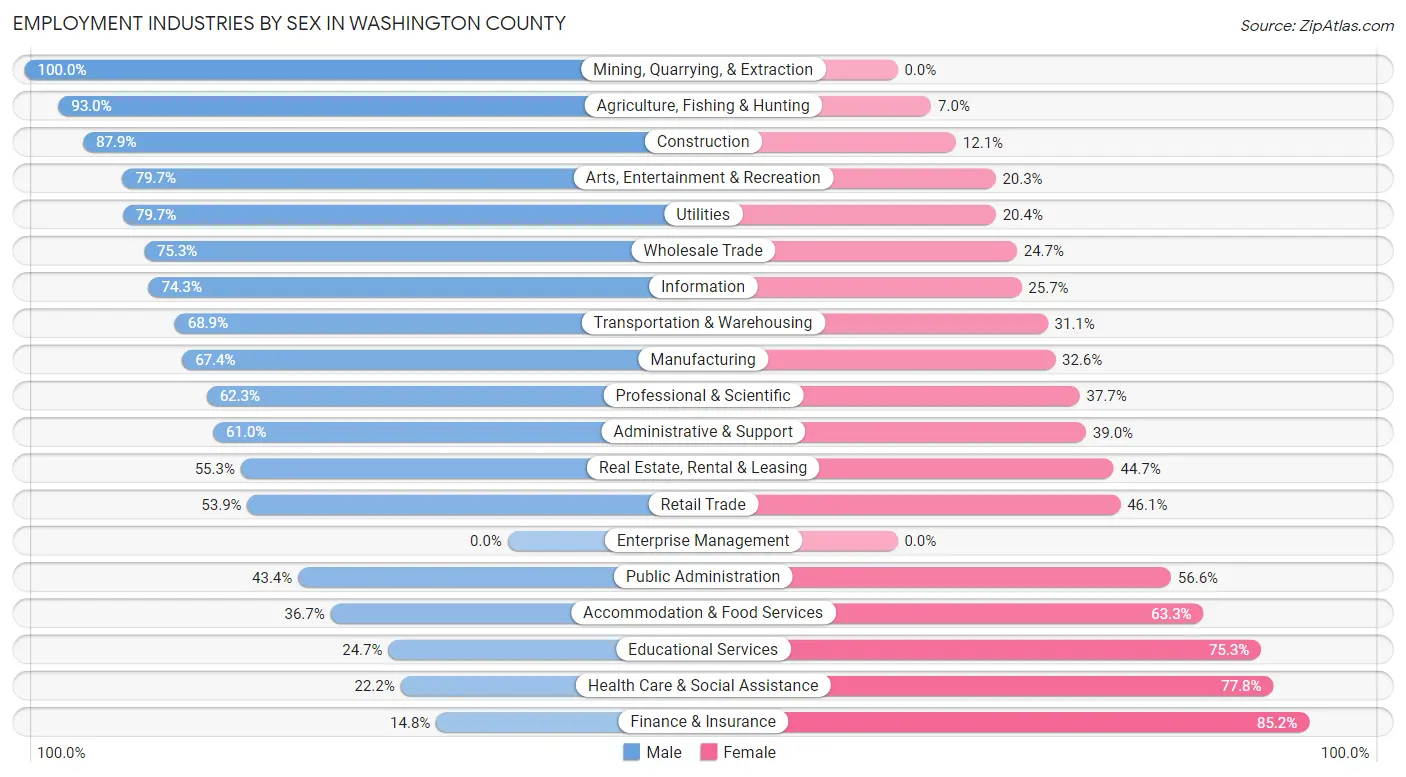
| Industry | Male | Female |
| Agriculture, Fishing & Hunting | 480 (93.0%) | 36 (7.0%) |
| Mining, Quarrying, & Extraction | 38 (100.0%) | 0 (0.0%) |
| Construction | 1,176 (87.9%) | 162 (12.1%) |
| Manufacturing | 2,102 (67.4%) | 1,018 (32.6%) |
| Wholesale Trade | 131 (75.3%) | 43 (24.7%) |
| Retail Trade | 895 (53.9%) | 766 (46.1%) |
| Transportation & Warehousing | 603 (68.9%) | 272 (31.1%) |
| Utilities | 90 (79.6%) | 23 (20.3%) |
| Information | 113 (74.3%) | 39 (25.7%) |
| Finance & Insurance | 56 (14.8%) | 322 (85.2%) |
| Real Estate, Rental & Leasing | 63 (55.3%) | 51 (44.7%) |
| Professional & Scientific | 276 (62.3%) | 167 (37.7%) |
| Enterprise Management | 0 (0.0%) | 0 (0.0%) |
| Administrative & Support | 175 (61.0%) | 112 (39.0%) |
| Educational Services | 199 (24.7%) | 606 (75.3%) |
| Health Care & Social Assistance | 324 (22.2%) | 1,136 (77.8%) |
| Arts, Entertainment & Recreation | 55 (79.7%) | 14 (20.3%) |
| Accommodation & Food Services | 165 (36.7%) | 285 (63.3%) |
| Public Administration | 210 (43.4%) | 274 (56.6%) |
| Total | 7,448 (56.6%) | 5,716 (43.4%) |
Education in Washington County
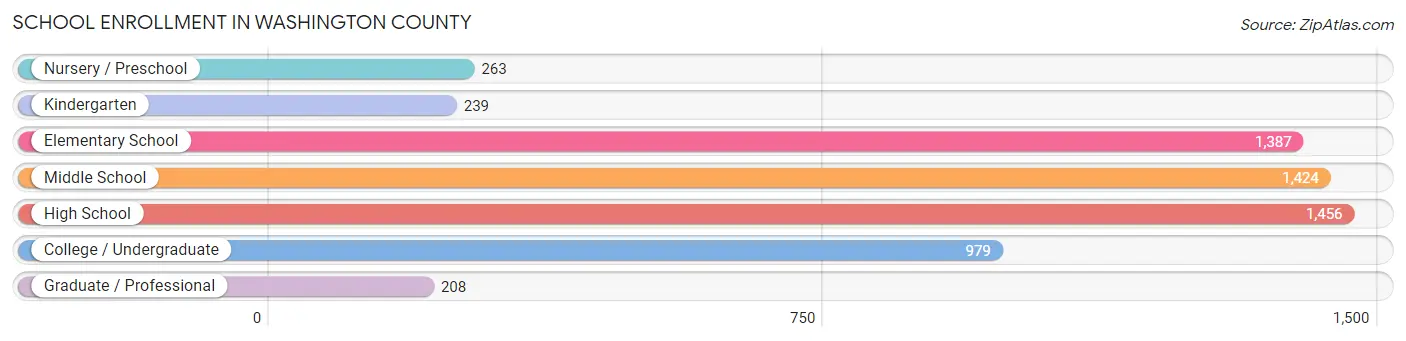
School Enrollment in Washington County
The most common levels of schooling among the 5,956 students in Washington County are high school (1,456 | 24.4%), middle school (1,424 | 23.9%), and elementary school (1,387 | 23.3%).
| School Level | # Students | % Students |
| Nursery / Preschool | 263 | 4.4% |
| Kindergarten | 239 | 4.0% |
| Elementary School | 1,387 | 23.3% |
| Middle School | 1,424 | 23.9% |
| High School | 1,456 | 24.4% |
| College / Undergraduate | 979 | 16.4% |
| Graduate / Professional | 208 | 3.5% |
| Total | 5,956 | 100.0% |
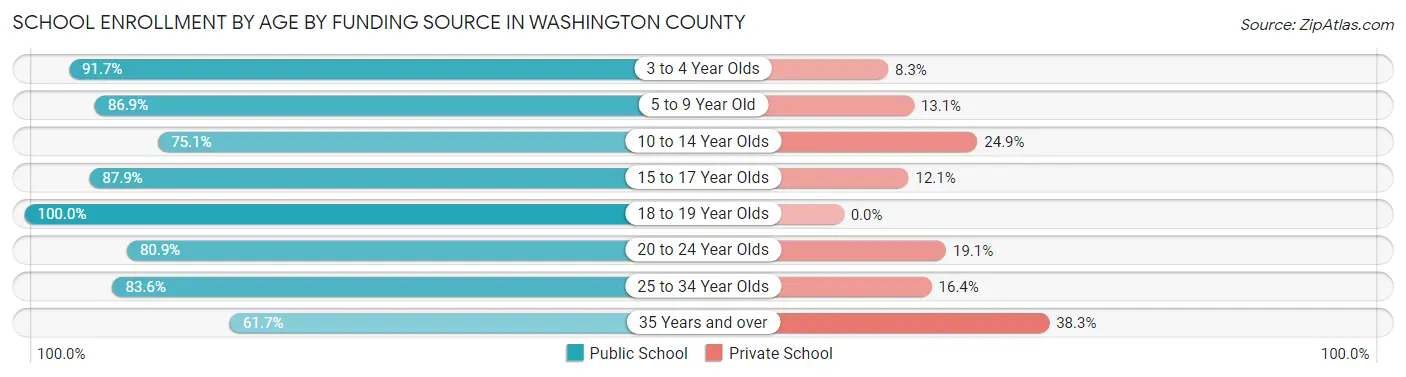
School Enrollment by Age by Funding Source in Washington County
Out of a total of 5,956 students who are enrolled in schools in Washington County, 1,030 (17.3%) attend a private institution, while the remaining 4,926 (82.7%) are enrolled in public schools. The age group of 35 years and over has the highest likelihood of being enrolled in private schools, with 103 (38.3% in the age bracket) enrolled. Conversely, the age group of 18 to 19 year olds has the lowest likelihood of being enrolled in a private school, with 354 (100.0% in the age bracket) attending a public institution.
| Age Bracket | Public School | Private School |
| 3 to 4 Year Olds | 144 (91.7%) | 13 (8.3%) |
| 5 to 9 Year Old | 1,334 (86.9%) | 201 (13.1%) |
| 10 to 14 Year Olds | 1,342 (75.1%) | 445 (24.9%) |
| 15 to 17 Year Olds | 983 (87.9%) | 135 (12.1%) |
| 18 to 19 Year Olds | 354 (100.0%) | 0 (0.0%) |
| 20 to 24 Year Olds | 314 (80.9%) | 74 (19.1%) |
| 25 to 34 Year Olds | 291 (83.6%) | 57 (16.4%) |
| 35 Years and over | 166 (61.7%) | 103 (38.3%) |
| Total | 4,926 (82.7%) | 1,030 (17.3%) |
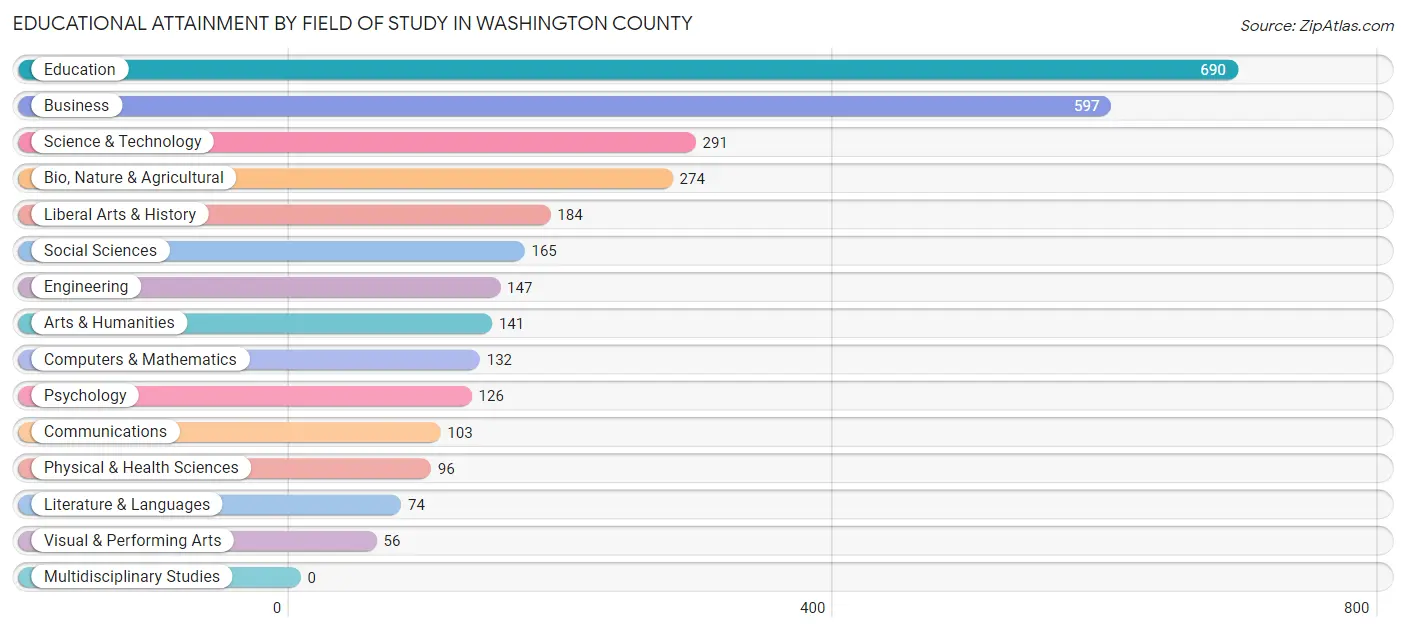
Educational Attainment by Field of Study in Washington County
Education (690 | 22.4%), business (597 | 19.4%), science & technology (291 | 9.5%), bio, nature & agricultural (274 | 8.9%), and liberal arts & history (184 | 6.0%) are the most common fields of study among 3,076 individuals in Washington County who have obtained a bachelor's degree or higher.
| Field of Study | # Graduates | % Graduates |
| Computers & Mathematics | 132 | 4.3% |
| Bio, Nature & Agricultural | 274 | 8.9% |
| Physical & Health Sciences | 96 | 3.1% |
| Psychology | 126 | 4.1% |
| Social Sciences | 165 | 5.4% |
| Engineering | 147 | 4.8% |
| Multidisciplinary Studies | 0 | 0.0% |
| Science & Technology | 291 | 9.5% |
| Business | 597 | 19.4% |
| Education | 690 | 22.4% |
| Literature & Languages | 74 | 2.4% |
| Liberal Arts & History | 184 | 6.0% |
| Visual & Performing Arts | 56 | 1.8% |
| Communications | 103 | 3.4% |
| Arts & Humanities | 141 | 4.6% |
| Total | 3,076 | 100.0% |
Transportation & Commute in Washington County
Vehicle Availability by Sex in Washington County
The most prevalent vehicle ownership categories in Washington County are males with 3 vehicles (2,201, accounting for 30.7%) and females with 3 vehicles (1,421, making up 39.4%).

| Vehicles Available | Male | Female |
| No Vehicle | 250 (3.5%) | 135 (2.4%) |
| 1 Vehicle | 583 (8.1%) | 936 (16.8%) |
| 2 Vehicles | 2,180 (30.4%) | 1,619 (29.0%) |
| 3 Vehicles | 2,201 (30.7%) | 1,421 (25.5%) |
| 4 Vehicles | 1,235 (17.2%) | 924 (16.6%) |
| 5 or more Vehicles | 727 (10.1%) | 548 (9.8%) |
| Total | 7,176 (100.0%) | 5,583 (100.0%) |
Commute Time in Washington County
The most frequently occuring commute durations in Washington County are 45 to 59 minutes (2,246 commuters, 18.8%), 10 to 14 minutes (1,523 commuters, 12.8%), and 20 to 24 minutes (1,372 commuters, 11.5%).

| Commute Time | # Commuters | % Commuters |
| Less than 5 Minutes | 383 | 3.2% |
| 5 to 9 Minutes | 1,245 | 10.4% |
| 10 to 14 Minutes | 1,523 | 12.8% |
| 15 to 19 Minutes | 845 | 7.1% |
| 20 to 24 Minutes | 1,372 | 11.5% |
| 25 to 29 Minutes | 499 | 4.2% |
| 30 to 34 Minutes | 1,124 | 9.4% |
| 35 to 39 Minutes | 471 | 4.0% |
| 40 to 44 Minutes | 787 | 6.6% |
| 45 to 59 Minutes | 2,246 | 18.8% |
| 60 to 89 Minutes | 995 | 8.4% |
| 90 or more Minutes | 430 | 3.6% |
Commute Time by Sex in Washington County
The most common commute times in Washington County are 45 to 59 minutes (1,249 commuters, 18.3%) for males and 45 to 59 minutes (997 commuters, 19.6%) for females.

| Commute Time | Male | Female |
| Less than 5 Minutes | 216 (3.2%) | 167 (3.3%) |
| 5 to 9 Minutes | 688 (10.1%) | 557 (10.9%) |
| 10 to 14 Minutes | 796 (11.7%) | 727 (14.3%) |
| 15 to 19 Minutes | 509 (7.4%) | 336 (6.6%) |
| 20 to 24 Minutes | 666 (9.8%) | 706 (13.9%) |
| 25 to 29 Minutes | 280 (4.1%) | 219 (4.3%) |
| 30 to 34 Minutes | 708 (10.4%) | 416 (8.2%) |
| 35 to 39 Minutes | 290 (4.3%) | 181 (3.6%) |
| 40 to 44 Minutes | 519 (7.6%) | 268 (5.3%) |
| 45 to 59 Minutes | 1,249 (18.3%) | 997 (19.6%) |
| 60 to 89 Minutes | 651 (9.5%) | 344 (6.8%) |
| 90 or more Minutes | 257 (3.8%) | 173 (3.4%) |
Time of Departure to Work by Sex in Washington County
The most frequent times of departure to work in Washington County are 7:00 AM to 7:29 AM (1,148, 16.8%) for males and 7:30 AM to 7:59 AM (765, 15.0%) for females.

| Time of Departure | Male | Female |
| 12:00 AM to 4:59 AM | 641 (9.4%) | 309 (6.1%) |
| 5:00 AM to 5:29 AM | 472 (6.9%) | 303 (5.9%) |
| 5:30 AM to 5:59 AM | 577 (8.5%) | 318 (6.2%) |
| 6:00 AM to 6:29 AM | 643 (9.4%) | 341 (6.7%) |
| 6:30 AM to 6:59 AM | 780 (11.4%) | 654 (12.9%) |
| 7:00 AM to 7:29 AM | 1,148 (16.8%) | 746 (14.6%) |
| 7:30 AM to 7:59 AM | 571 (8.4%) | 765 (15.0%) |
| 8:00 AM to 8:29 AM | 378 (5.5%) | 517 (10.2%) |
| 8:30 AM to 8:59 AM | 137 (2.0%) | 22 (0.4%) |
| 9:00 AM to 9:59 AM | 104 (1.5%) | 204 (4.0%) |
| 10:00 AM to 10:59 AM | 84 (1.2%) | 109 (2.1%) |
| 11:00 AM to 11:59 AM | 113 (1.7%) | 45 (0.9%) |
| 12:00 PM to 3:59 PM | 428 (6.3%) | 313 (6.1%) |
| 4:00 PM to 11:59 PM | 753 (11.0%) | 445 (8.7%) |
| Total | 6,829 (100.0%) | 5,091 (100.0%) |
Housing Occupancy in Washington County
Occupancy by Ownership in Washington County
Of the total 10,882 dwellings in Washington County, owner-occupied units account for 8,836 (81.2%), while renter-occupied units make up 2,046 (18.8%).

| Occupancy | # Housing Units | % Housing Units |
| Owner Occupied Housing Units | 8,836 | 81.2% |
| Renter-Occupied Housing Units | 2,046 | 18.8% |
| Total Occupied Housing Units | 10,882 | 100.0% |
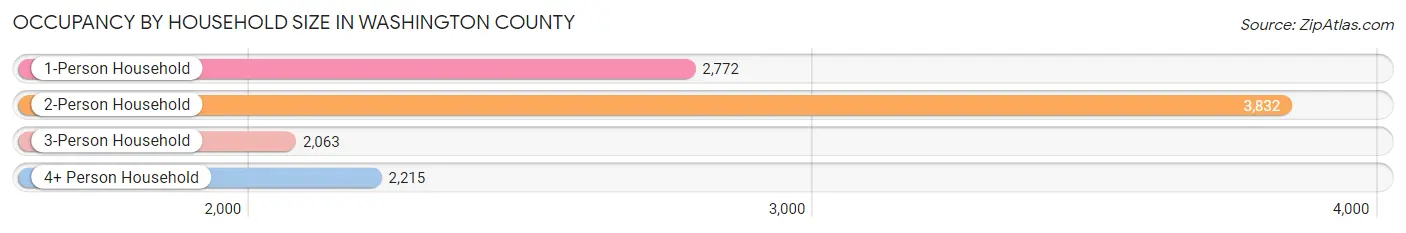
Occupancy by Household Size in Washington County
| Household Size | # Housing Units | % Housing Units |
| 1-Person Household | 2,772 | 25.5% |
| 2-Person Household | 3,832 | 35.2% |
| 3-Person Household | 2,063 | 19.0% |
| 4+ Person Household | 2,215 | 20.3% |
| Total Housing Units | 10,882 | 100.0% |
Occupancy by Ownership by Household Size in Washington County
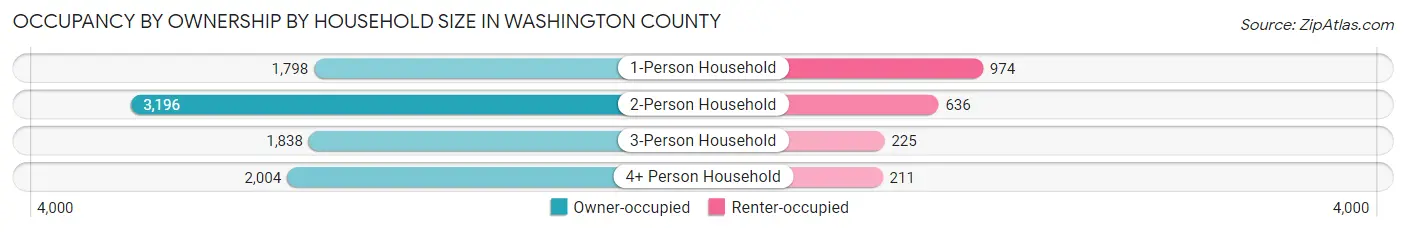
| Household Size | Owner-occupied | Renter-occupied |
| 1-Person Household | 1,798 (64.9%) | 974 (35.1%) |
| 2-Person Household | 3,196 (83.4%) | 636 (16.6%) |
| 3-Person Household | 1,838 (89.1%) | 225 (10.9%) |
| 4+ Person Household | 2,004 (90.5%) | 211 (9.5%) |
| Total Housing Units | 8,836 (81.2%) | 2,046 (18.8%) |
Occupancy by Educational Attainment in Washington County
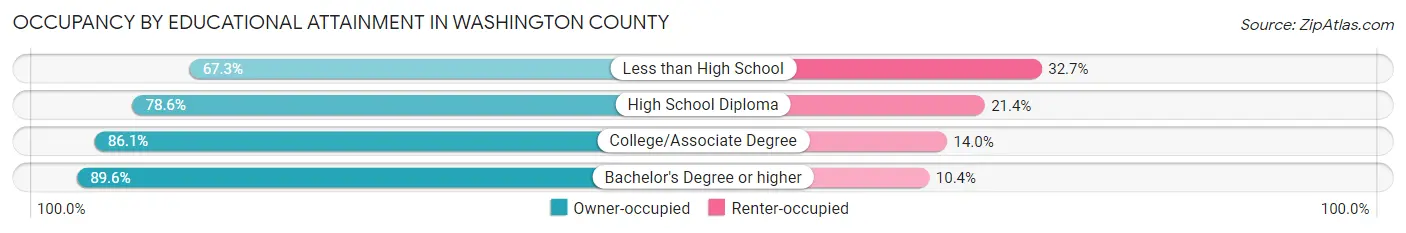
| Household Size | Owner-occupied | Renter-occupied |
| Less than High School | 941 (67.3%) | 458 (32.7%) |
| High School Diploma | 3,361 (78.6%) | 916 (21.4%) |
| College/Associate Degree | 3,153 (86.1%) | 511 (14.0%) |
| Bachelor's Degree or higher | 1,381 (89.6%) | 161 (10.4%) |
Occupancy by Age of Householder in Washington County
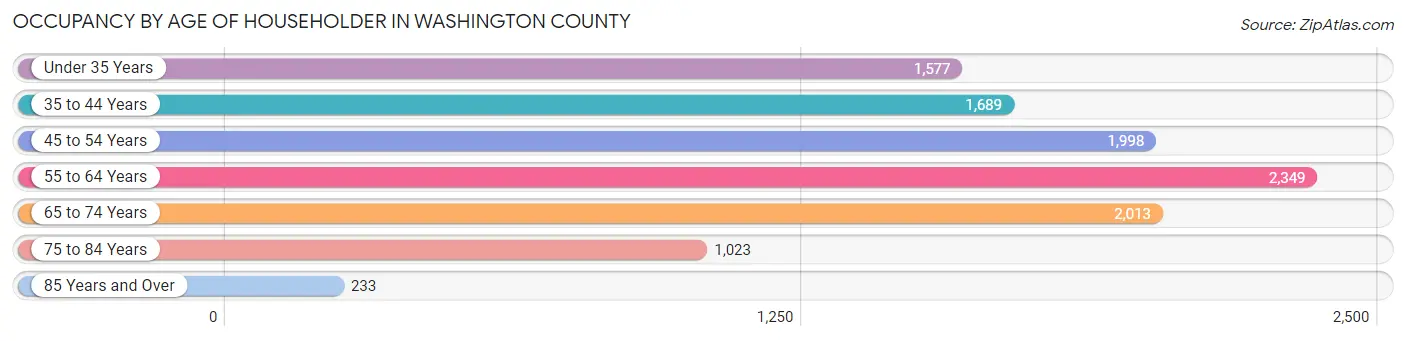
| Age Bracket | # Households | % Households |
| Under 35 Years | 1,577 | 14.5% |
| 35 to 44 Years | 1,689 | 15.5% |
| 45 to 54 Years | 1,998 | 18.4% |
| 55 to 64 Years | 2,349 | 21.6% |
| 65 to 74 Years | 2,013 | 18.5% |
| 75 to 84 Years | 1,023 | 9.4% |
| 85 Years and Over | 233 | 2.1% |
| Total | 10,882 | 100.0% |
Housing Finances in Washington County
Median Income by Occupancy in Washington County

| Occupancy Type | # Households | Median Income |
| Owner-Occupied | 8,836 (81.2%) | $69,526 |
| Renter-Occupied | 2,046 (18.8%) | $30,978 |
| Average | 10,882 (100.0%) | $60,695 |
Occupancy by Householder Income Bracket in Washington County

| Income Bracket | Owner-occupied | Renter-occupied |
| Less than $5,000 | 157 (1.8%) | 159 (7.8%) |
| $5,000 to $9,999 | 58 (0.7%) | 82 (4.0%) |
| $10,000 to $14,999 | 222 (2.5%) | 301 (14.7%) |
| $15,000 to $19,999 | 302 (3.4%) | 258 (12.6%) |
| $20,000 to $24,999 | 366 (4.1%) | 115 (5.6%) |
| $25,000 to $34,999 | 851 (9.6%) | 203 (9.9%) |
| $35,000 to $49,999 | 1,261 (14.3%) | 309 (15.1%) |
| $50,000 to $74,999 | 1,580 (17.9%) | 297 (14.5%) |
| $75,000 to $99,999 | 1,464 (16.6%) | 207 (10.1%) |
| $100,000 to $149,999 | 1,510 (17.1%) | 71 (3.5%) |
| $150,000 or more | 1,065 (12.0%) | 44 (2.1%) |
| Total | 8,836 (100.0%) | 2,046 (100.0%) |
Monthly Housing Cost Tiers in Washington County

| Monthly Cost | Owner-occupied | Renter-occupied |
| Less than $300 | 939 (10.6%) | 80 (3.9%) |
| $300 to $499 | 1,480 (16.8%) | 371 (18.1%) |
| $500 to $799 | 1,722 (19.5%) | 689 (33.7%) |
| $800 to $999 | 917 (10.4%) | 486 (23.7%) |
| $1,000 to $1,499 | 2,379 (26.9%) | 159 (7.8%) |
| $1,500 to $1,999 | 973 (11.0%) | 54 (2.6%) |
| $2,000 to $2,499 | 260 (2.9%) | 0 (0.0%) |
| $2,500 to $2,999 | 18 (0.2%) | 0 (0.0%) |
| $3,000 or more | 148 (1.7%) | 0 (0.0%) |
| Total | 8,836 (100.0%) | 2,046 (100.0%) |
Physical Housing Characteristics in Washington County
Housing Structures in Washington County

| Structure Type | # Housing Units | % Housing Units |
| Single Unit, Detached | 8,320 | 76.5% |
| Single Unit, Attached | 45 | 0.4% |
| 2 Unit Apartments | 168 | 1.5% |
| 3 or 4 Unit Apartments | 165 | 1.5% |
| 5 to 9 Unit Apartments | 86 | 0.8% |
| 10 or more Apartments | 138 | 1.3% |
| Mobile Home / Other | 1,960 | 18.0% |
| Total | 10,882 | 100.0% |
Housing Structures by Occupancy in Washington County

| Structure Type | Owner-occupied | Renter-occupied |
| Single Unit, Detached | 7,460 (89.7%) | 860 (10.3%) |
| Single Unit, Attached | 21 (46.7%) | 24 (53.3%) |
| 2 Unit Apartments | 0 (0.0%) | 168 (100.0%) |
| 3 or 4 Unit Apartments | 0 (0.0%) | 165 (100.0%) |
| 5 to 9 Unit Apartments | 0 (0.0%) | 86 (100.0%) |
| 10 or more Apartments | 0 (0.0%) | 138 (100.0%) |
| Mobile Home / Other | 1,355 (69.1%) | 605 (30.9%) |
| Total | 8,836 (81.2%) | 2,046 (18.8%) |
Housing Structures by Number of Rooms in Washington County

| Number of Rooms | Owner-occupied | Renter-occupied |
| 1 Room | 46 (0.5%) | 52 (2.5%) |
| 2 or 3 Rooms | 160 (1.8%) | 206 (10.1%) |
| 4 or 5 Rooms | 2,763 (31.3%) | 1,065 (52.0%) |
| 6 or 7 Rooms | 3,230 (36.6%) | 559 (27.3%) |
| 8 or more Rooms | 2,637 (29.8%) | 164 (8.0%) |
| Total | 8,836 (100.0%) | 2,046 (100.0%) |
Housing Structure by Heating Type in Washington County
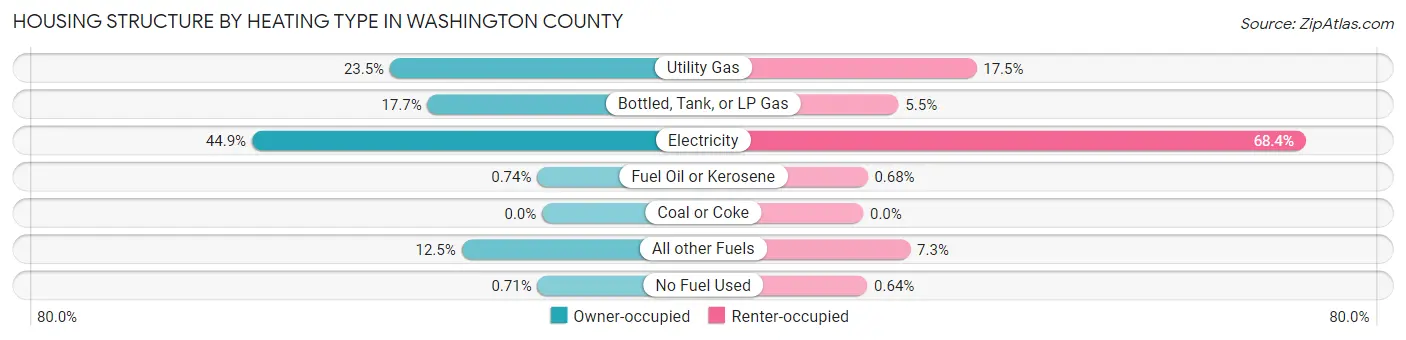
| Heating Type | Owner-occupied | Renter-occupied |
| Utility Gas | 2,078 (23.5%) | 358 (17.5%) |
| Bottled, Tank, or LP Gas | 1,566 (17.7%) | 112 (5.5%) |
| Electricity | 3,964 (44.9%) | 1,400 (68.4%) |
| Fuel Oil or Kerosene | 65 (0.7%) | 14 (0.7%) |
| Coal or Coke | 0 (0.0%) | 0 (0.0%) |
| All other Fuels | 1,100 (12.4%) | 149 (7.3%) |
| No Fuel Used | 63 (0.7%) | 13 (0.6%) |
| Total | 8,836 (100.0%) | 2,046 (100.0%) |
Household Vehicle Usage in Washington County

| Vehicles per Household | Owner-occupied | Renter-occupied |
| No Vehicle | 382 (4.3%) | 286 (14.0%) |
| 1 Vehicle | 1,715 (19.4%) | 1,042 (50.9%) |
| 2 Vehicles | 3,121 (35.3%) | 447 (21.8%) |
| 3 or more Vehicles | 3,618 (40.9%) | 271 (13.3%) |
| Total | 8,836 (100.0%) | 2,046 (100.0%) |
Real Estate & Mortgages in Washington County
Real Estate and Mortgage Overview in Washington County
| Characteristic | Without Mortgage | With Mortgage |
| Housing Units | 3,451 | 5,385 |
| Median Property Value | $127,100 | $176,700 |
| Median Household Income | $43,670 | $861 |
| Monthly Housing Costs | $413 | $123 |
| Real Estate Taxes | $729 | $286 |
Property Value by Mortgage Status in Washington County
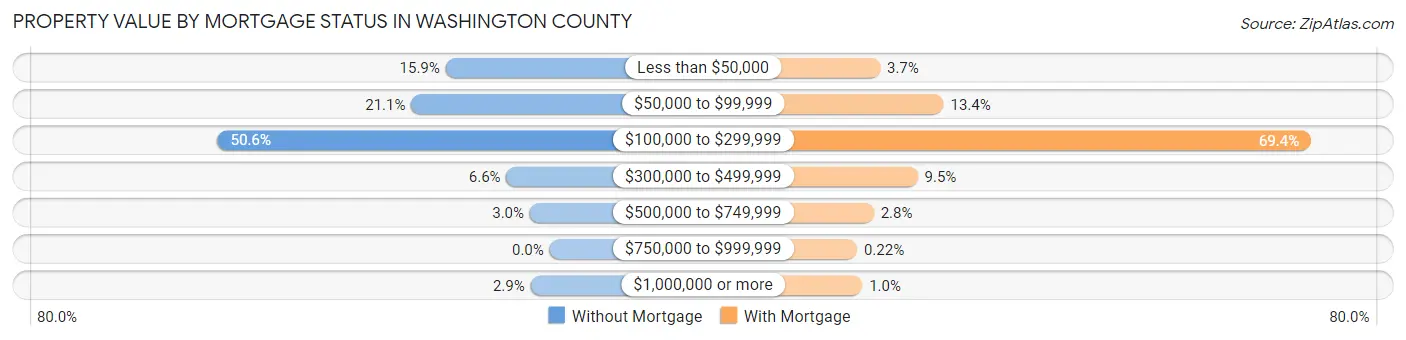
| Property Value | Without Mortgage | With Mortgage |
| Less than $50,000 | 547 (15.9%) | 201 (3.7%) |
| $50,000 to $99,999 | 727 (21.1%) | 722 (13.4%) |
| $100,000 to $299,999 | 1,746 (50.6%) | 3,737 (69.4%) |
| $300,000 to $499,999 | 227 (6.6%) | 509 (9.5%) |
| $500,000 to $749,999 | 104 (3.0%) | 149 (2.8%) |
| $750,000 to $999,999 | 0 (0.0%) | 12 (0.2%) |
| $1,000,000 or more | 100 (2.9%) | 55 (1.0%) |
| Total | 3,451 (100.0%) | 5,385 (100.0%) |
Household Income by Mortgage Status in Washington County

| Household Income | Without Mortgage | With Mortgage |
| Less than $10,000 | 106 (3.1%) | 161 (3.0%) |
| $10,000 to $24,999 | 563 (16.3%) | 109 (2.0%) |
| $25,000 to $34,999 | 659 (19.1%) | 327 (6.1%) |
| $35,000 to $49,999 | 599 (17.4%) | 192 (3.6%) |
| $50,000 to $74,999 | 515 (14.9%) | 662 (12.3%) |
| $75,000 to $99,999 | 520 (15.1%) | 1,065 (19.8%) |
| $100,000 to $149,999 | 285 (8.3%) | 944 (17.5%) |
| $150,000 or more | 204 (5.9%) | 1,225 (22.8%) |
| Total | 3,451 (100.0%) | 5,385 (100.0%) |
Property Value to Household Income Ratio in Washington County

| Value-to-Income Ratio | Without Mortgage | With Mortgage |
| Less than 2.0x | 1,304 (37.8%) | 83,576 (1,552.0%) |
| 2.0x to 2.9x | 599 (17.4%) | 2,600 (48.3%) |
| 3.0x to 3.9x | 440 (12.8%) | 1,111 (20.6%) |
| 4.0x or more | 1,070 (31.0%) | 642 (11.9%) |
| Total | 3,451 (100.0%) | 5,385 (100.0%) |
Real Estate Taxes by Mortgage Status in Washington County

| Property Taxes | Without Mortgage | With Mortgage |
| Less than $800 | 1,750 (50.7%) | 53 (1.0%) |
| $800 to $1,499 | 835 (24.2%) | 1,682 (31.2%) |
| $800 to $1,499 | 652 (18.9%) | 1,736 (32.2%) |
| Total | 3,451 (100.0%) | 5,385 (100.0%) |
Health & Disability in Washington County
Health Insurance Coverage by Age in Washington County

| Age Bracket | With Coverage | Without Coverage |
| Under 6 Years | 1,709 (89.8%) | 195 (10.2%) |
| 6 to 18 Years | 4,327 (91.8%) | 387 (8.2%) |
| 19 to 25 Years | 1,895 (84.6%) | 345 (15.4%) |
| 26 to 34 Years | 2,563 (87.2%) | 377 (12.8%) |
| 35 to 44 Years | 3,032 (88.5%) | 392 (11.5%) |
| 45 to 54 Years | 3,240 (88.6%) | 415 (11.4%) |
| 55 to 64 Years | 3,814 (92.8%) | 294 (7.2%) |
| 65 to 74 Years | 2,995 (98.9%) | 34 (1.1%) |
| 75 Years and older | 1,821 (100.0%) | 0 (0.0%) |
| Total | 25,396 (91.2%) | 2,439 (8.8%) |
Health Insurance Coverage by Citizenship Status in Washington County
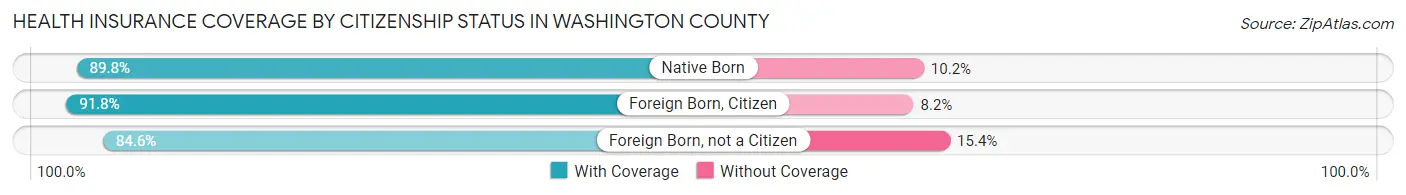
| Citizenship Status | With Coverage | Without Coverage |
| Native Born | 1,709 (89.8%) | 195 (10.2%) |
| Foreign Born, Citizen | 4,327 (91.8%) | 387 (8.2%) |
| Foreign Born, not a Citizen | 1,895 (84.6%) | 345 (15.4%) |
Health Insurance Coverage by Household Income in Washington County

| Household Income | With Coverage | Without Coverage |
| Under $25,000 | 2,594 (92.6%) | 207 (7.4%) |
| $25,000 to $49,999 | 4,800 (88.4%) | 632 (11.6%) |
| $50,000 to $74,999 | 4,873 (83.4%) | 971 (16.6%) |
| $75,000 to $99,999 | 4,324 (95.0%) | 229 (5.0%) |
| $100,000 and over | 8,787 (95.7%) | 400 (4.3%) |
Public vs Private Health Insurance Coverage by Age in Washington County

| Age Bracket | Public Insurance | Private Insurance |
| Under 6 | 784 (41.2%) | 972 (51.0%) |
| 6 to 18 Years | 1,816 (38.5%) | 2,710 (57.5%) |
| 19 to 25 Years | 370 (16.5%) | 1,548 (69.1%) |
| 25 to 34 Years | 817 (27.8%) | 1,822 (62.0%) |
| 35 to 44 Years | 642 (18.8%) | 2,527 (73.8%) |
| 45 to 54 Years | 892 (24.4%) | 2,475 (67.7%) |
| 55 to 64 Years | 1,086 (26.4%) | 3,020 (73.5%) |
| 65 to 74 Years | 2,958 (97.7%) | 1,374 (45.4%) |
| 75 Years and over | 1,821 (100.0%) | 908 (49.9%) |
| Total | 11,186 (40.2%) | 17,356 (62.4%) |
Disability Status by Sex by Age in Washington County

| Age Bracket | Male | Female |
| Under 5 Years | 0 (0.0%) | 4 (0.5%) |
| 5 to 17 Years | 93 (3.9%) | 45 (1.9%) |
| 18 to 34 Years | 201 (7.2%) | 404 (15.3%) |
| 35 to 64 Years | 1,074 (19.1%) | 919 (16.5%) |
| 65 to 74 Years | 516 (35.3%) | 413 (26.4%) |
| 75 Years and over | 476 (58.6%) | 453 (44.9%) |
Disability Class by Sex by Age in Washington County
Disability Class: Hearing Difficulty

| Age Bracket | Male | Female |
| Under 5 Years | 0 (0.0%) | 4 (0.5%) |
| 5 to 17 Years | 0 (0.0%) | 7 (0.3%) |
| 18 to 34 Years | 0 (0.0%) | 4 (0.2%) |
| 35 to 64 Years | 290 (5.2%) | 79 (1.4%) |
| 65 to 74 Years | 222 (15.2%) | 84 (5.4%) |
| 75 Years and over | 307 (37.8%) | 209 (20.7%) |
Disability Class: Vision Difficulty
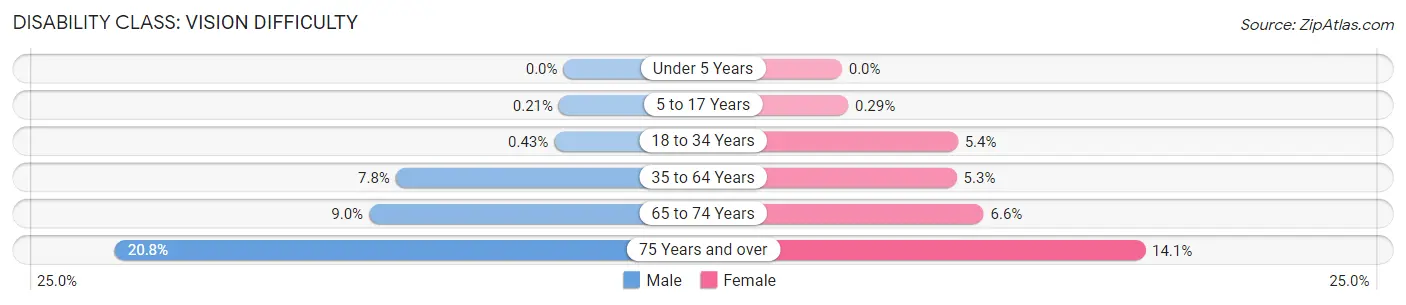
| Age Bracket | Male | Female |
| Under 5 Years | 0 (0.0%) | 0 (0.0%) |
| 5 to 17 Years | 5 (0.2%) | 7 (0.3%) |
| 18 to 34 Years | 12 (0.4%) | 142 (5.4%) |
| 35 to 64 Years | 437 (7.8%) | 297 (5.3%) |
| 65 to 74 Years | 132 (9.0%) | 103 (6.6%) |
| 75 Years and over | 169 (20.8%) | 142 (14.1%) |
Disability Class: Cognitive Difficulty
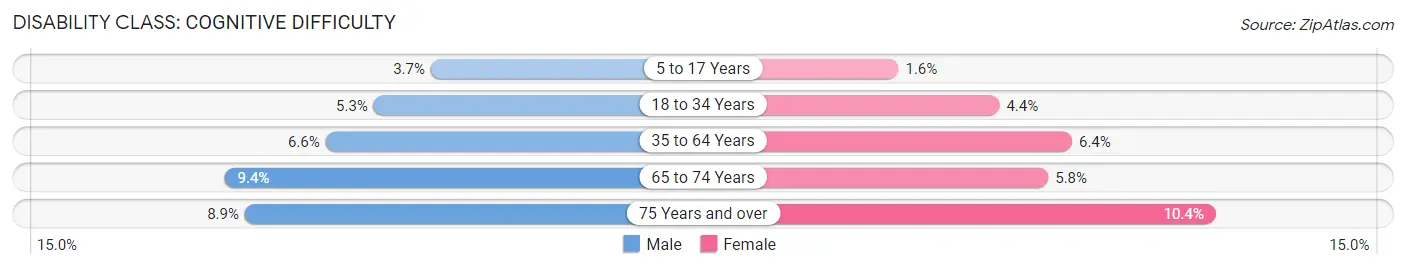
| Age Bracket | Male | Female |
| 5 to 17 Years | 88 (3.7%) | 38 (1.6%) |
| 18 to 34 Years | 147 (5.3%) | 116 (4.4%) |
| 35 to 64 Years | 372 (6.6%) | 357 (6.4%) |
| 65 to 74 Years | 138 (9.4%) | 90 (5.8%) |
| 75 Years and over | 72 (8.9%) | 105 (10.4%) |
Disability Class: Ambulatory Difficulty

| Age Bracket | Male | Female |
| 5 to 17 Years | 1 (0.0%) | 0 (0.0%) |
| 18 to 34 Years | 73 (2.6%) | 33 (1.3%) |
| 35 to 64 Years | 383 (6.8%) | 477 (8.6%) |
| 65 to 74 Years | 210 (14.3%) | 246 (15.7%) |
| 75 Years and over | 166 (20.4%) | 329 (32.6%) |
Disability Class: Self-Care Difficulty
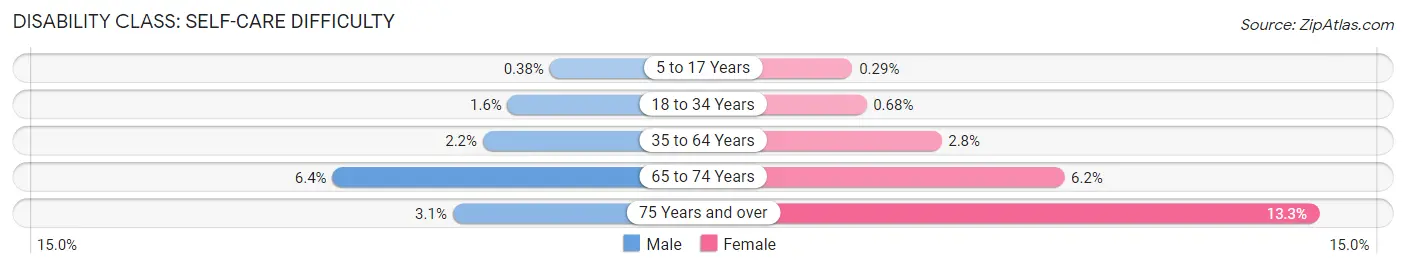
| Age Bracket | Male | Female |
| 5 to 17 Years | 9 (0.4%) | 7 (0.3%) |
| 18 to 34 Years | 43 (1.5%) | 18 (0.7%) |
| 35 to 64 Years | 126 (2.2%) | 154 (2.8%) |
| 65 to 74 Years | 94 (6.4%) | 97 (6.2%) |
| 75 Years and over | 25 (3.1%) | 134 (13.3%) |
Technology Access in Washington County
Computing Device Access in Washington County

| Device Type | # Households | % Households |
| Desktop or Laptop | 7,099 | 65.2% |
| Smartphone | 8,597 | 79.0% |
| Tablet | 5,885 | 54.1% |
| No Computing Device | 1,502 | 13.8% |
| Total | 10,882 | 100.0% |
Internet Access in Washington County
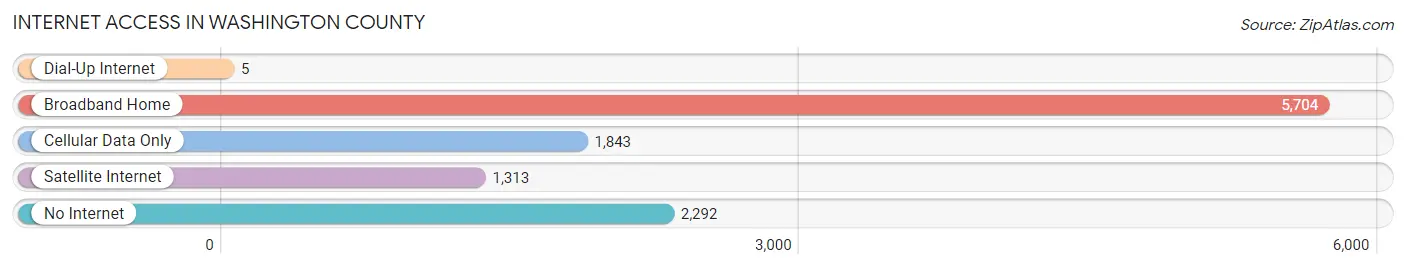
| Internet Type | # Households | % Households |
| Dial-Up Internet | 5 | 0.1% |
| Broadband Home | 5,704 | 52.4% |
| Cellular Data Only | 1,843 | 16.9% |
| Satellite Internet | 1,313 | 12.1% |
| No Internet | 2,292 | 21.1% |
| Total | 10,882 | 100.0% |
Washington County Summary
Introduction
Washington County, Indiana is located in the southwestern corner of the state and is part of the Indianapolis metropolitan area. It is bordered by the states of Illinois and Kentucky and is the second smallest county in Indiana. The county was established in 1814 and named after George Washington, the first president of the United States. The county seat is Salem, which is also the largest city in the county.
History
The area that is now Washington County was first settled in the early 1800s by pioneers from Kentucky and Virginia. The first county seat was established in 1814 in the town of Pekin. In 1817, the county seat was moved to Salem, which is still the county seat today.
The county was largely agricultural in the 19th century, with the main crops being corn, wheat, and tobacco. The county also had a thriving timber industry, with the main products being lumber and staves.
In the early 20th century, the county began to industrialize, with the establishment of several factories in the area. The most notable of these was the Salem Iron Works, which was established in 1906 and produced steel products for the automotive and railroad industries.
Geography
Washington County is located in the southwestern corner of Indiana and is bordered by the states of Illinois and Kentucky. The county is mostly rural, with the majority of the land being used for agricultural purposes. The county is also home to several small towns and villages, including Salem, Pekin, Campbellsburg, and Hardinsburg.
The county is located in the Central Till Plains region of Indiana and is characterized by rolling hills and flat plains. The county is drained by the White River, which flows through the county from north to south.
Economy
Washington County has a diverse economy, with the largest industries being manufacturing, agriculture, and tourism. The county is home to several manufacturing companies, including Salem Iron Works, which produces steel products for the automotive and railroad industries.
Agriculture is also an important part of the county’s economy, with the main crops being corn, wheat, and tobacco. The county is also home to several wineries and vineyards, which produce a variety of wines.
Tourism is also an important part of the county’s economy, with the county being home to several state parks and recreational areas. The county is also home to several historic sites, including the Salem Iron Works and the Pekin Historic District.
Demographics
As of the 2010 census, the population of Washington County was 28,262. The population is mostly white (94.3%), with small percentages of African Americans (2.3%), Hispanics (1.7%), and Asians (0.7%). The median household income in the county is $45,845, and the median home value is $117,400.
Conclusion
Washington County, Indiana is a rural county located in the southwestern corner of the state. The county has a diverse economy, with the largest industries being manufacturing, agriculture, and tourism. The population of the county is mostly white, with small percentages of African Americans, Hispanics, and Asians. The median household income in the county is $45,845, and the median home value is $117,400.
Common Questions
What is the Total Population of Washington County?
Total Population of Washington County is 28,133.
What is the Total Male Population of Washington County?
Total Male Population of Washington County is 13,988.
What is the Total Female Population of Washington County?
Total Female Population of Washington County is 14,145.
What is the Ratio of Males per 100 Females in Washington County?
There are 98.89 Males per 100 Females in Washington County.
What is the Ratio of Females per 100 Males in Washington County?
There are 101.12 Females per 100 Males in Washington County.
What is the Median Population Age in Washington County?
Median Population Age in Washington County is 40.9 Years.
What is the Average Family Size in Washington County
Average Family Size in Washington County is 3.0 People.
What is the Average Household Size in Washington County
Average Household Size in Washington County is 2.6 People.
What is Per Capita Income in Washington County?
Per Capita income in Washington County is $28,963.
What is the Median Family Income in Washington County?
Median Family Income in Washington County is $74,597.
What is the Median Household income in Washington County?
Median Household Income in Washington County is $60,695.
What is Income or Wage Gap in Washington County?
Income or Wage Gap in Washington County is 22.9%.
Women in Washington County earn 77.1 cents for every dollar earned by a man.
What is Family Income Deficit in Washington County?
Family Income Deficit in Washington County is $9,523.
Families that are below poverty line in Washington County earn $9,523 less on average than the poverty threshold level.
What is Inequality or Gini Index in Washington County?
Inequality or Gini Index in Washington County is 0.41.
How Large is the Labor Force in Washington County?
There are 13,742 People in the Labor Forcein in Washington County.
What is the Percentage of People in the Labor Force in Washington County?
61.1% of People are in the Labor Force in Washington County.
What is the Unemployment Rate in Washington County?
Unemployment Rate in Washington County is 4.2%.