Warrick County, IN
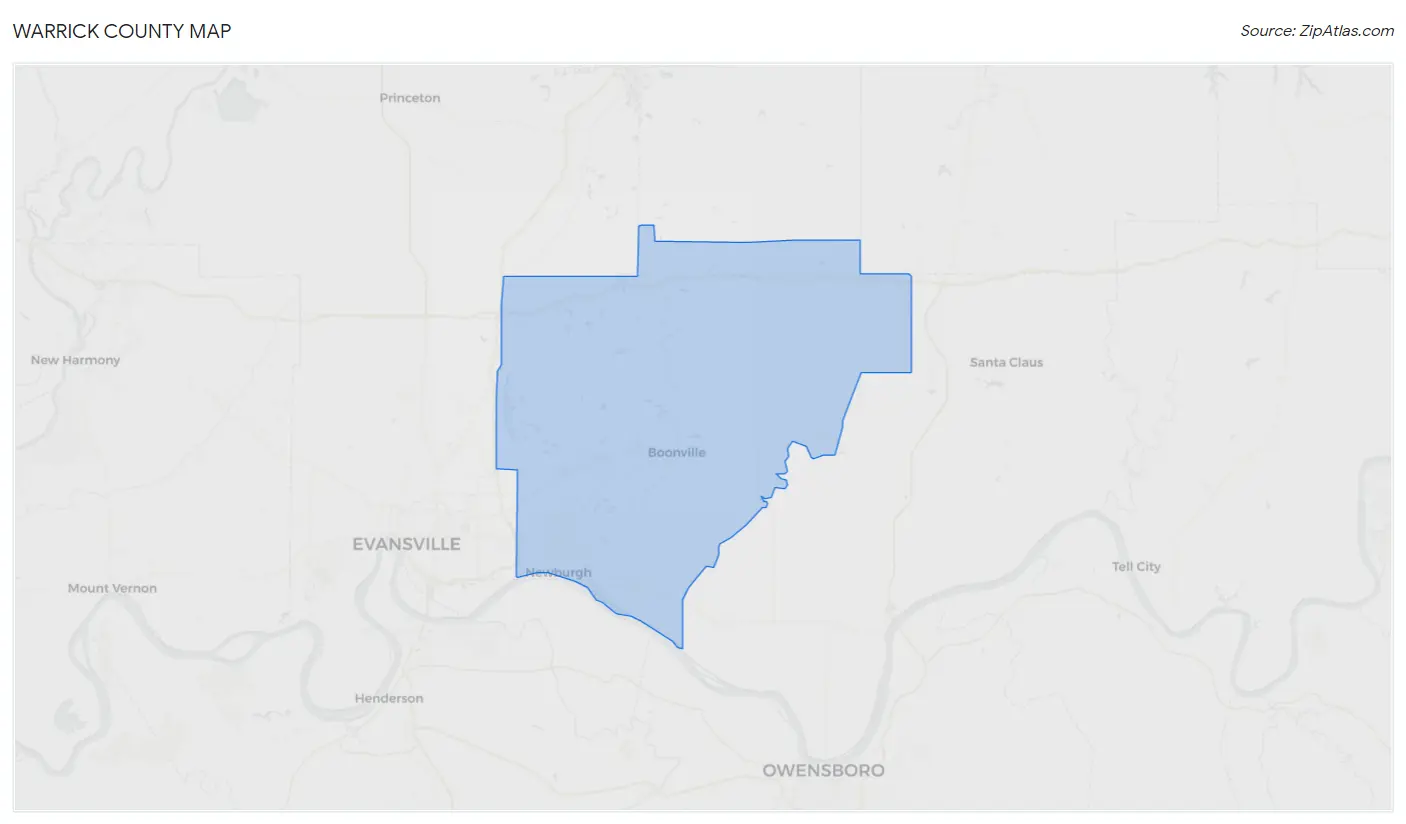
Warrick County Map
Warrick County Overview
64,065
TOTAL POPULATION
31,526
MALE POPULATION
32,539
FEMALE POPULATION
96.89
MALES / 100 FEMALES
103.21
FEMALES / 100 MALES
41.7
MEDIAN AGE
3.1
AVG FAMILY SIZE
2.6
AVG HOUSEHOLD SIZE
$46,734
PER CAPITA INCOME
$108,457
AVG FAMILY INCOME
$91,105
AVG HOUSEHOLD INCOME
36.8%
WAGE / INCOME GAP [ % ]
63.2¢/ $1
WAGE / INCOME GAP [ $ ]
$9,040
FAMILY INCOME DEFICIT
0.46
INEQUALITY / GINI INDEX
32,691
LABOR FORCE [ PEOPLE ]
63.9%
PERCENT IN LABOR FORCE
3.3%
UNEMPLOYMENT RATE
Warrick County Area Codes
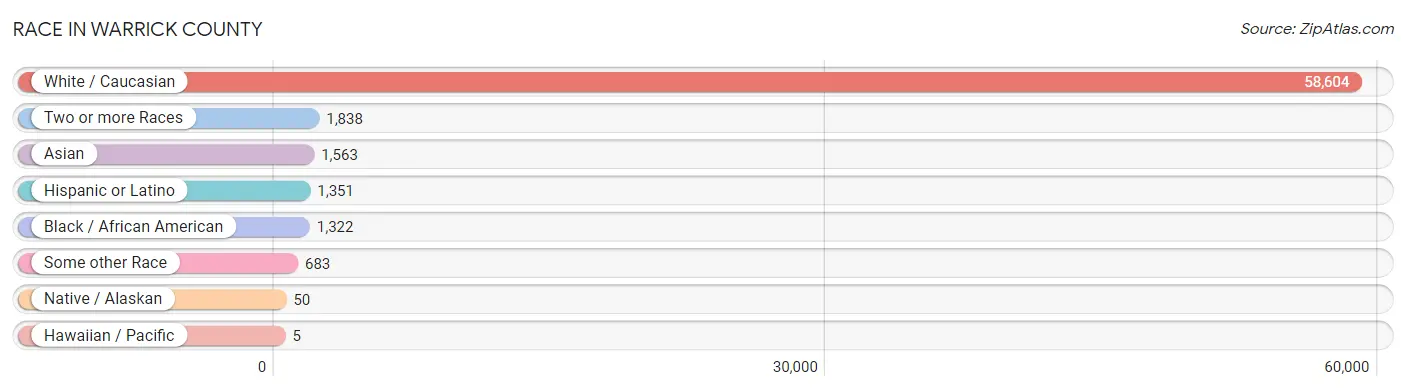
Race in Warrick County
The most populous races in Warrick County are White / Caucasian (58,604 | 91.5%), Two or more Races (1,838 | 2.9%), and Asian (1,563 | 2.4%).
| Race | # Population | % Population |
| Asian | 1,563 | 2.4% |
| Black / African American | 1,322 | 2.1% |
| Hawaiian / Pacific | 5 | 0.0% |
| Hispanic or Latino | 1,351 | 2.1% |
| Native / Alaskan | 50 | 0.1% |
| White / Caucasian | 58,604 | 91.5% |
| Two or more Races | 1,838 | 2.9% |
| Some other Race | 683 | 1.1% |
| Total | 64,065 | 100.0% |
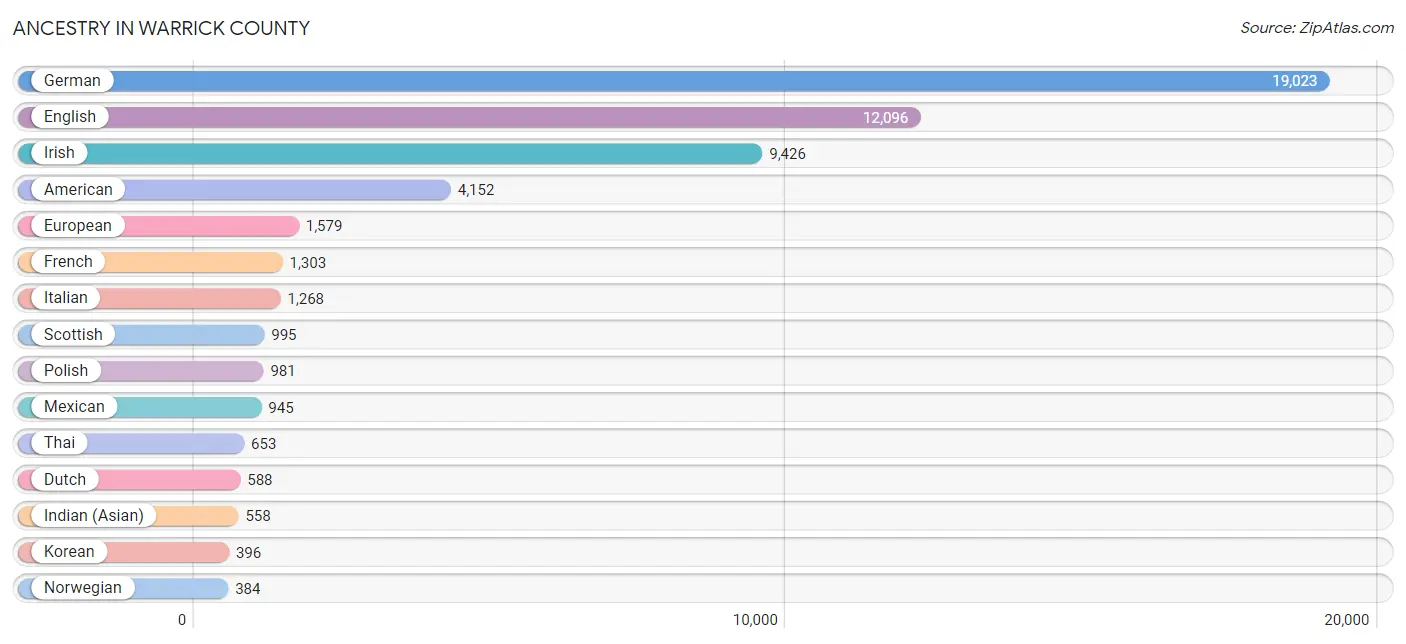
Ancestry in Warrick County
The most populous ancestries reported in Warrick County are German (19,023 | 29.7%), English (12,096 | 18.9%), Irish (9,426 | 14.7%), American (4,152 | 6.5%), and European (1,579 | 2.5%), together accounting for 72.2% of all Warrick County residents.
| Ancestry | # Population | % Population |
| African | 15 | 0.0% |
| American | 4,152 | 6.5% |
| Arab | 58 | 0.1% |
| Austrian | 24 | 0.0% |
| Belgian | 60 | 0.1% |
| Bhutanese | 49 | 0.1% |
| Blackfeet | 13 | 0.0% |
| Brazilian | 17 | 0.0% |
| British | 297 | 0.5% |
| Bulgarian | 41 | 0.1% |
| Burmese | 46 | 0.1% |
| Canadian | 52 | 0.1% |
| Central American | 16 | 0.0% |
| Central American Indian | 44 | 0.1% |
| Cherokee | 77 | 0.1% |
| Chickasaw | 1 | 0.0% |
| Croatian | 27 | 0.0% |
| Cuban | 13 | 0.0% |
| Cypriot | 74 | 0.1% |
| Czech | 121 | 0.2% |
| Danish | 58 | 0.1% |
| Dutch | 588 | 0.9% |
| Eastern European | 147 | 0.2% |
| English | 12,096 | 18.9% |
| European | 1,579 | 2.5% |
| Finnish | 90 | 0.1% |
| French | 1,303 | 2.0% |
| French Canadian | 141 | 0.2% |
| German | 19,023 | 29.7% |
| Greek | 106 | 0.2% |
| Haitian | 21 | 0.0% |
| Hungarian | 131 | 0.2% |
| Indian (Asian) | 558 | 0.9% |
| Iranian | 21 | 0.0% |
| Irish | 9,426 | 14.7% |
| Italian | 1,268 | 2.0% |
| Jamaican | 208 | 0.3% |
| Korean | 396 | 0.6% |
| Latvian | 13 | 0.0% |
| Lithuanian | 48 | 0.1% |
| Mexican | 945 | 1.5% |
| Mexican American Indian | 34 | 0.1% |
| Native Hawaiian | 10 | 0.0% |
| Northern European | 107 | 0.2% |
| Norwegian | 384 | 0.6% |
| Pakistani | 169 | 0.3% |
| Palestinian | 21 | 0.0% |
| Peruvian | 122 | 0.2% |
| Polish | 981 | 1.5% |
| Portuguese | 41 | 0.1% |
| Puerto Rican | 13 | 0.0% |
| Romanian | 10 | 0.0% |
| Russian | 169 | 0.3% |
| Salvadoran | 16 | 0.0% |
| Scandinavian | 297 | 0.5% |
| Scotch-Irish | 357 | 0.6% |
| Scottish | 995 | 1.5% |
| Serbian | 10 | 0.0% |
| Slavic | 21 | 0.0% |
| Slovak | 9 | 0.0% |
| South African | 11 | 0.0% |
| South American | 260 | 0.4% |
| Spaniard | 47 | 0.1% |
| Sri Lankan | 148 | 0.2% |
| Subsaharan African | 66 | 0.1% |
| Swedish | 147 | 0.2% |
| Swiss | 53 | 0.1% |
| Thai | 653 | 1.0% |
| Tohono O'Odham | 37 | 0.1% |
| Ukrainian | 144 | 0.2% |
| Venezuelan | 138 | 0.2% |
| Welsh | 291 | 0.4% |
| Yugoslavian | 52 | 0.1% | View All 73 Rows |
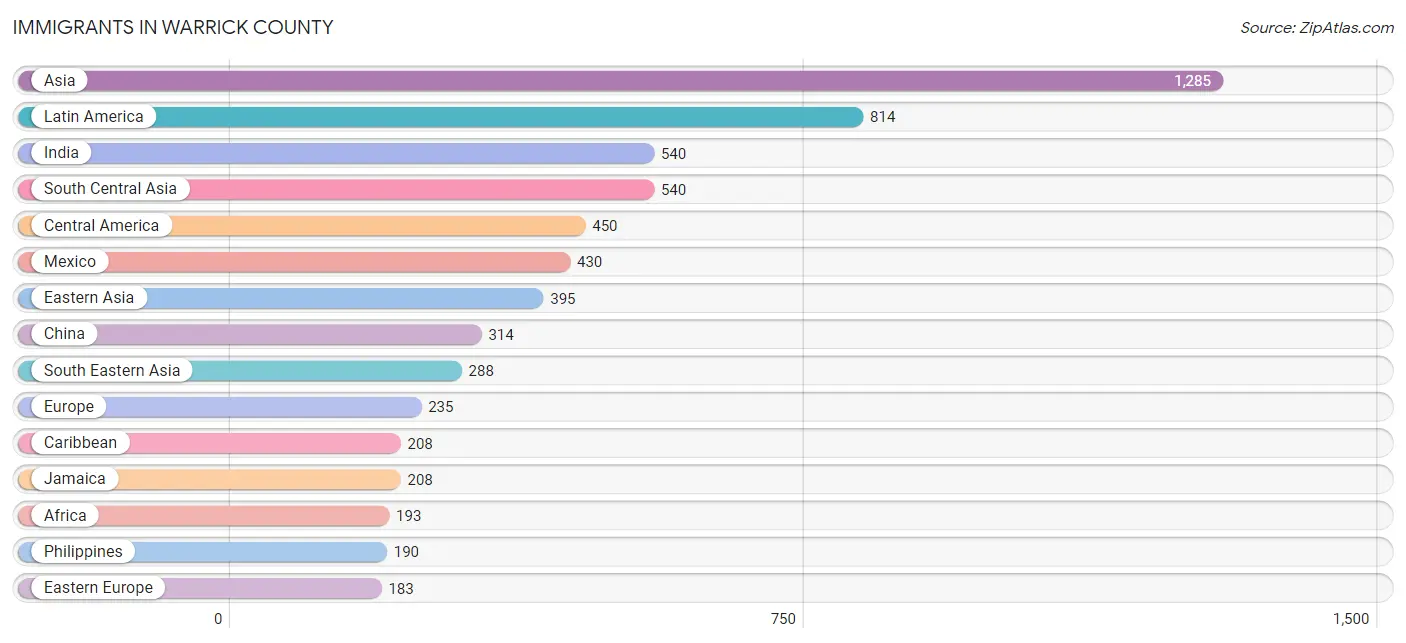
Immigrants in Warrick County
The most numerous immigrant groups reported in Warrick County came from Asia (1,285 | 2.0%), Latin America (814 | 1.3%), India (540 | 0.8%), South Central Asia (540 | 0.8%), and Central America (450 | 0.7%), together accounting for 5.7% of all Warrick County residents.
| Immigration Origin | # Population | % Population |
| Africa | 193 | 0.3% |
| Asia | 1,285 | 2.0% |
| Belarus | 25 | 0.0% |
| Bulgaria | 10 | 0.0% |
| Canada | 29 | 0.1% |
| Caribbean | 208 | 0.3% |
| Central America | 450 | 0.7% |
| China | 314 | 0.5% |
| Costa Rica | 20 | 0.0% |
| Croatia | 7 | 0.0% |
| Eastern Africa | 88 | 0.1% |
| Eastern Asia | 395 | 0.6% |
| Eastern Europe | 183 | 0.3% |
| England | 13 | 0.0% |
| Eritrea | 80 | 0.1% |
| Europe | 235 | 0.4% |
| Germany | 12 | 0.0% |
| India | 540 | 0.8% |
| Ireland | 10 | 0.0% |
| Jamaica | 208 | 0.3% |
| Japan | 49 | 0.1% |
| Korea | 32 | 0.1% |
| Latin America | 814 | 1.3% |
| Mexico | 430 | 0.7% |
| Northern Europe | 23 | 0.0% |
| Peru | 88 | 0.1% |
| Philippines | 190 | 0.3% |
| Romania | 10 | 0.0% |
| Russia | 11 | 0.0% |
| South Africa | 105 | 0.2% |
| South America | 156 | 0.2% |
| South Central Asia | 540 | 0.8% |
| South Eastern Asia | 288 | 0.4% |
| Switzerland | 17 | 0.0% |
| Taiwan | 124 | 0.2% |
| Thailand | 72 | 0.1% |
| Ukraine | 120 | 0.2% |
| Venezuela | 68 | 0.1% |
| Vietnam | 26 | 0.0% |
| Western Asia | 36 | 0.1% |
| Western Europe | 29 | 0.1% | View All 41 Rows |
Sex and Age in Warrick County
Sex and Age in Warrick County
The most populous age groups in Warrick County are 60 to 64 Years (2,361 | 7.5%) for men and 40 to 44 Years (2,435 | 7.5%) for women.
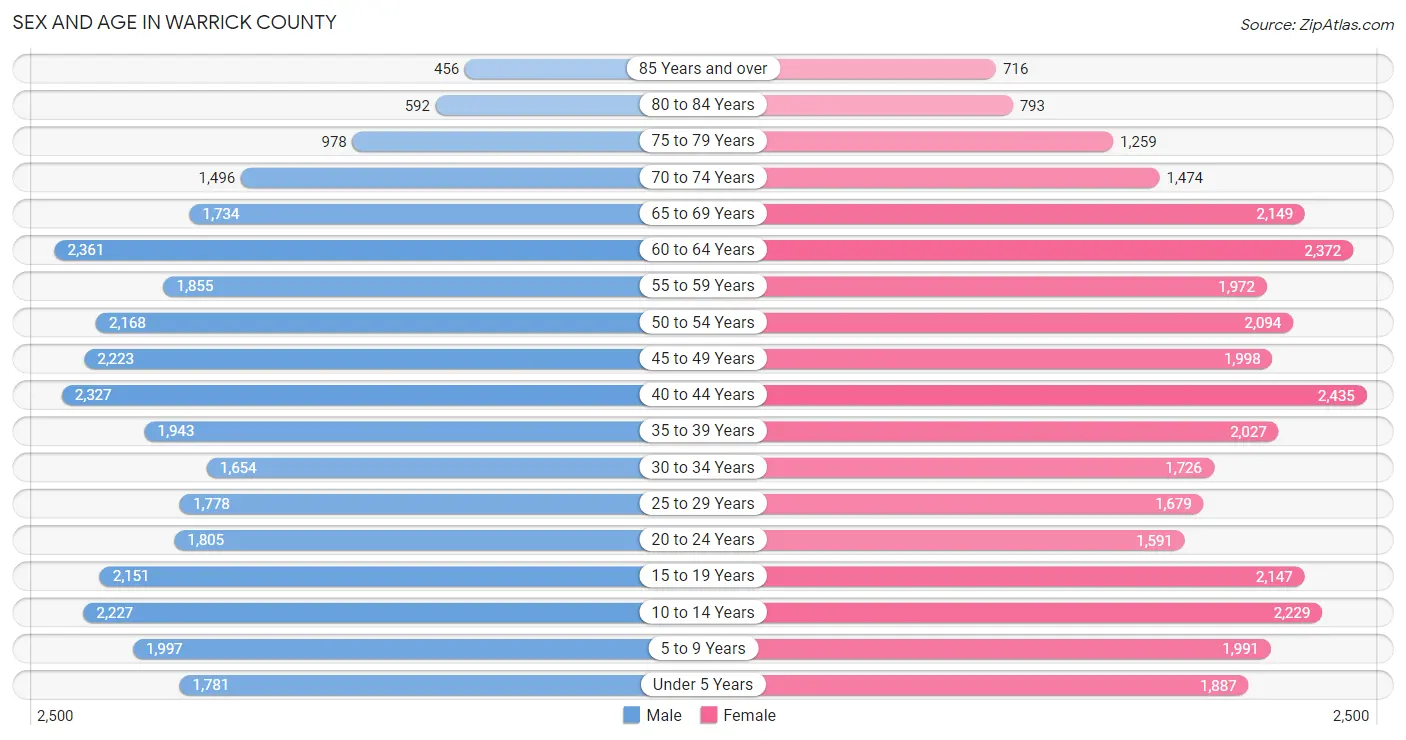
| Age Bracket | Male | Female |
| Under 5 Years | 1,781 (5.7%) | 1,887 (5.8%) |
| 5 to 9 Years | 1,997 (6.3%) | 1,991 (6.1%) |
| 10 to 14 Years | 2,227 (7.1%) | 2,229 (6.9%) |
| 15 to 19 Years | 2,151 (6.8%) | 2,147 (6.6%) |
| 20 to 24 Years | 1,805 (5.7%) | 1,591 (4.9%) |
| 25 to 29 Years | 1,778 (5.6%) | 1,679 (5.2%) |
| 30 to 34 Years | 1,654 (5.2%) | 1,726 (5.3%) |
| 35 to 39 Years | 1,943 (6.2%) | 2,027 (6.2%) |
| 40 to 44 Years | 2,327 (7.4%) | 2,435 (7.5%) |
| 45 to 49 Years | 2,223 (7.0%) | 1,998 (6.1%) |
| 50 to 54 Years | 2,168 (6.9%) | 2,094 (6.4%) |
| 55 to 59 Years | 1,855 (5.9%) | 1,972 (6.1%) |
| 60 to 64 Years | 2,361 (7.5%) | 2,372 (7.3%) |
| 65 to 69 Years | 1,734 (5.5%) | 2,149 (6.6%) |
| 70 to 74 Years | 1,496 (4.8%) | 1,474 (4.5%) |
| 75 to 79 Years | 978 (3.1%) | 1,259 (3.9%) |
| 80 to 84 Years | 592 (1.9%) | 793 (2.4%) |
| 85 Years and over | 456 (1.5%) | 716 (2.2%) |
| Total | 31,526 (100.0%) | 32,539 (100.0%) |
Families and Households in Warrick County
Median Family Size in Warrick County
The median family size in Warrick County is 3.06 persons per family, with married-couple families (14,969 | 85.3%) accounting for the largest median family size of 3.09 persons per family. On the other hand, single male/father families (823 | 4.7%) represent the smallest median family size with 2.74 persons per family.
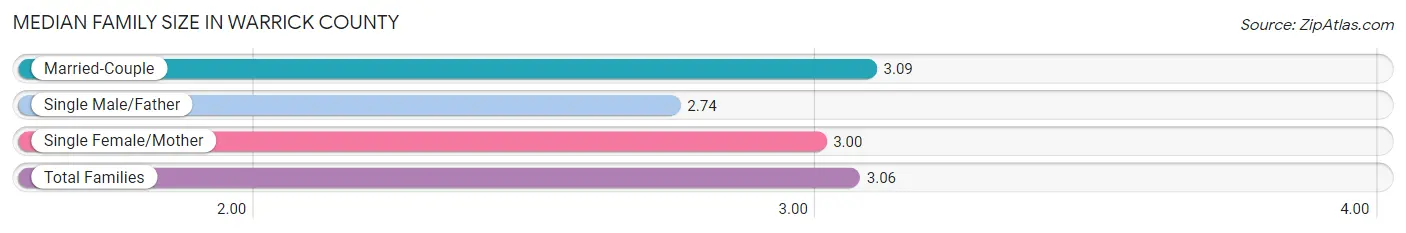
| Family Type | # Families | Family Size |
| Married-Couple | 14,969 (85.3%) | 3.09 |
| Single Male/Father | 823 (4.7%) | 2.74 |
| Single Female/Mother | 1,750 (10.0%) | 3.00 |
| Total Families | 17,542 (100.0%) | 3.06 |
Median Household Size in Warrick County
The median household size in Warrick County is 2.58 persons per household, with single female/mother households (1,750 | 7.1%) accounting for the largest median household size of 3.2 persons per household. non-family households (6,998 | 28.5%) represent the smallest median household size with 1.24 persons per household.
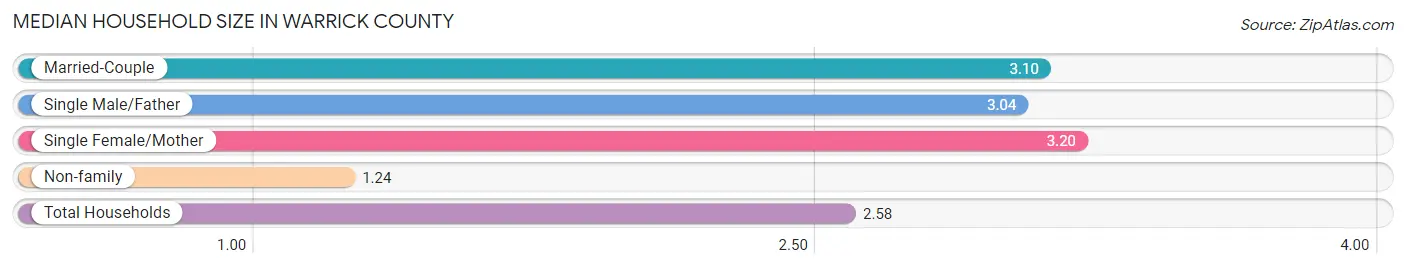
| Household Type | # Households | Household Size |
| Married-Couple | 14,969 (61.0%) | 3.10 |
| Single Male/Father | 823 (3.4%) | 3.04 |
| Single Female/Mother | 1,750 (7.1%) | 3.20 |
| Non-family | 6,998 (28.5%) | 1.24 |
| Total Households | 24,540 (100.0%) | 2.58 |
Household Size by Marriage Status in Warrick County
Out of a total of 24,540 households in Warrick County, 17,542 (71.5%) are family households, while 6,998 (28.5%) are nonfamily households. The most numerous type of family households are 2-person households, comprising 8,556, and the most common type of nonfamily households are 1-person households, comprising 5,741.
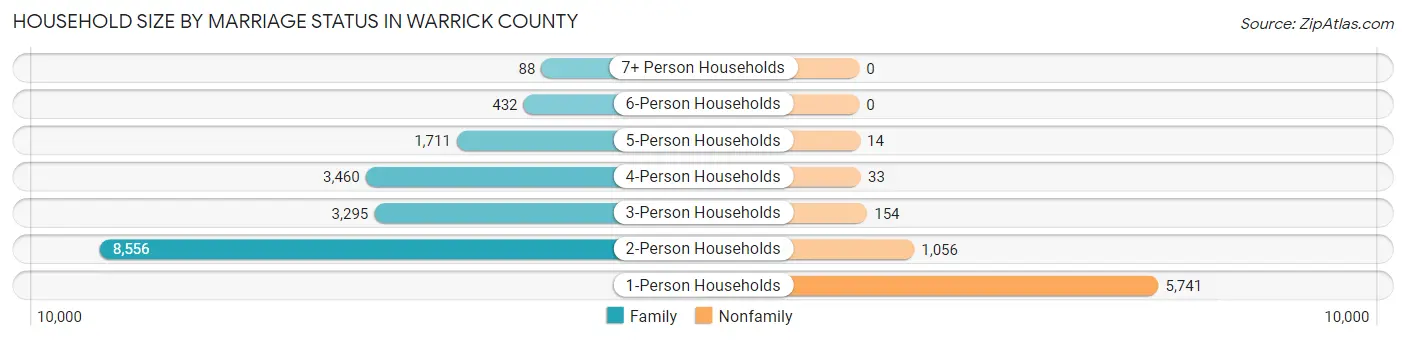
| Household Size | Family Households | Nonfamily Households |
| 1-Person Households | - | 5,741 (23.4%) |
| 2-Person Households | 8,556 (34.9%) | 1,056 (4.3%) |
| 3-Person Households | 3,295 (13.4%) | 154 (0.6%) |
| 4-Person Households | 3,460 (14.1%) | 33 (0.1%) |
| 5-Person Households | 1,711 (7.0%) | 14 (0.1%) |
| 6-Person Households | 432 (1.8%) | 0 (0.0%) |
| 7+ Person Households | 88 (0.4%) | 0 (0.0%) |
| Total | 17,542 (71.5%) | 6,998 (28.5%) |
Female Fertility in Warrick County
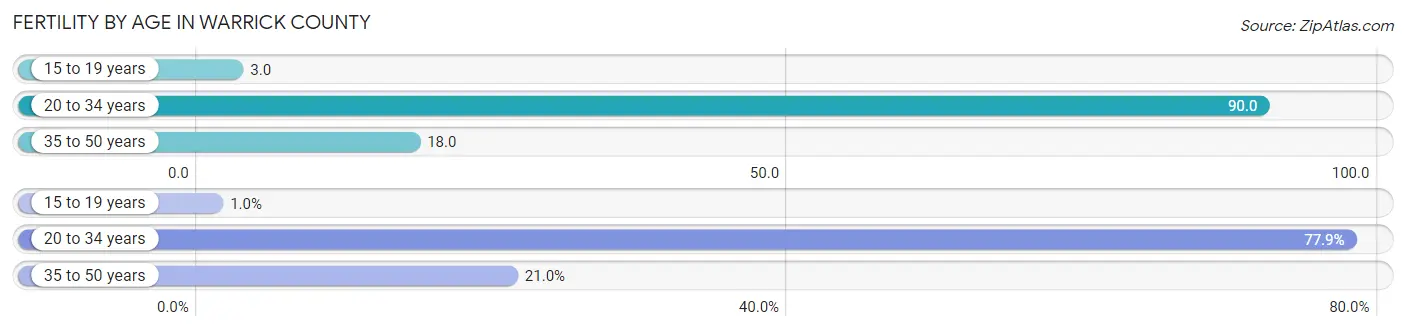
Fertility by Age in Warrick County
Average fertility rate in Warrick County is 42.0 births per 1,000 women. Women in the age bracket of 20 to 34 years have the highest fertility rate with 90.0 births per 1,000 women. Women in the age bracket of 20 to 34 years acount for 77.9% of all women with births.
| Age Bracket | Women with Births | Births / 1,000 Women |
| 15 to 19 years | 6 (1.0%) | 3.0 |
| 20 to 34 years | 452 (77.9%) | 90.0 |
| 35 to 50 years | 122 (21.0%) | 18.0 |
| Total | 580 (100.0%) | 42.0 |
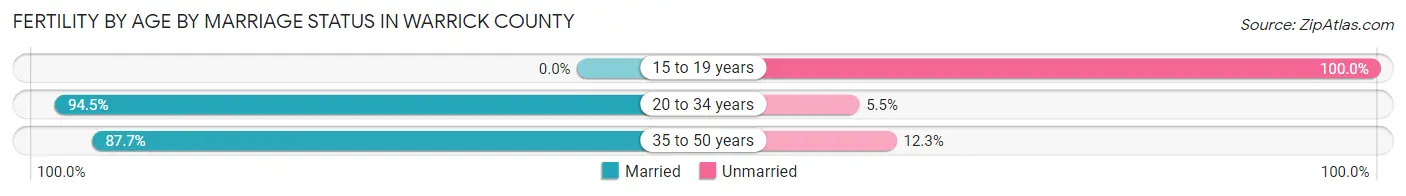
Fertility by Age by Marriage Status in Warrick County
92.1% of women with births (580) in Warrick County are married. The highest percentage of unmarried women with births falls into 15 to 19 years age bracket with 100.0% of them unmarried at the time of birth, while the lowest percentage of unmarried women with births belong to 20 to 34 years age bracket with 5.5% of them unmarried.
| Age Bracket | Married | Unmarried |
| 15 to 19 years | 0 (0.0%) | 6 (100.0%) |
| 20 to 34 years | 427 (94.5%) | 25 (5.5%) |
| 35 to 50 years | 107 (87.7%) | 15 (12.3%) |
| Total | 534 (92.1%) | 46 (7.9%) |
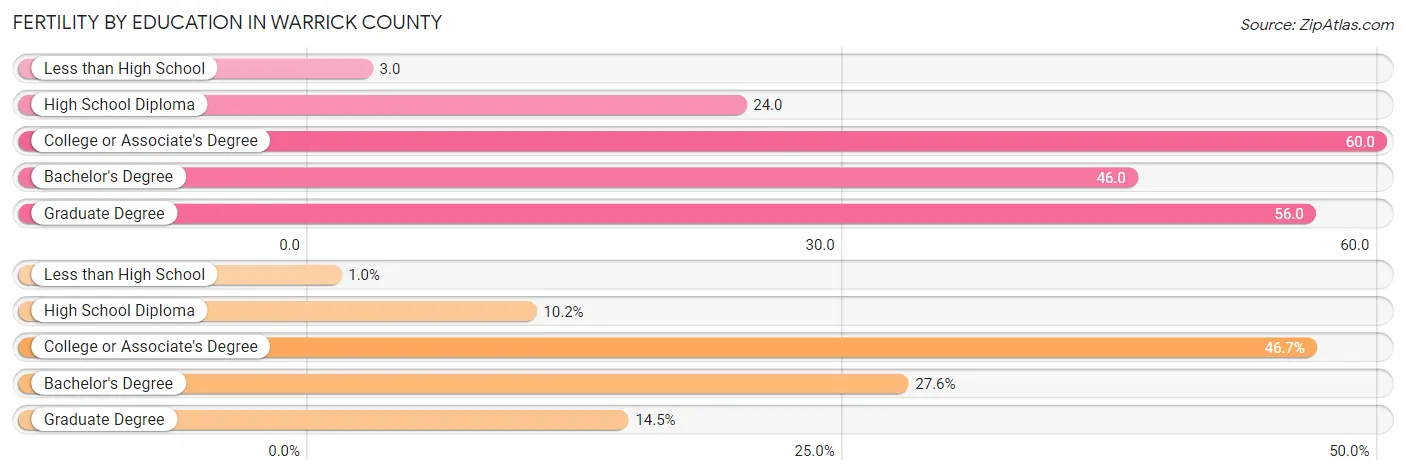
Fertility by Education in Warrick County
Average fertility rate in Warrick County is 42.0 births per 1,000 women. Women with the education attainment of college or associate's degree have the highest fertility rate of 60.0 births per 1,000 women, while women with the education attainment of less than high school have the lowest fertility at 3.0 births per 1,000 women. Women with the education attainment of college or associate's degree represent 46.7% of all women with births.
| Educational Attainment | Women with Births | Births / 1,000 Women |
| Less than High School | 6 (1.0%) | 3.0 |
| High School Diploma | 59 (10.2%) | 24.0 |
| College or Associate's Degree | 271 (46.7%) | 60.0 |
| Bachelor's Degree | 160 (27.6%) | 46.0 |
| Graduate Degree | 84 (14.5%) | 56.0 |
| Total | 580 (100.0%) | 42.0 |
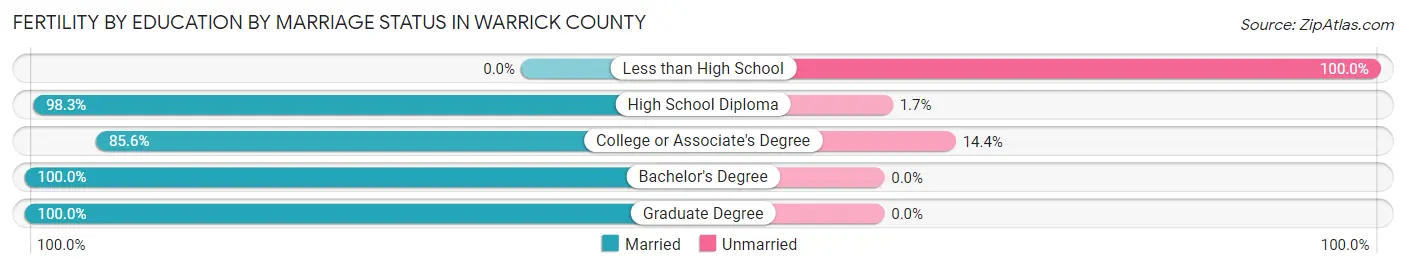
Fertility by Education by Marriage Status in Warrick County
7.9% of women with births in Warrick County are unmarried. Women with the educational attainment of bachelor's degree are most likely to be married with 100.0% of them married at childbirth, while women with the educational attainment of less than high school are least likely to be married with 100.0% of them unmarried at childbirth.
| Educational Attainment | Married | Unmarried |
| Less than High School | 0 (0.0%) | 6 (100.0%) |
| High School Diploma | 58 (98.3%) | 1 (1.7%) |
| College or Associate's Degree | 232 (85.6%) | 39 (14.4%) |
| Bachelor's Degree | 160 (100.0%) | 0 (0.0%) |
| Graduate Degree | 84 (100.0%) | 0 (0.0%) |
| Total | 534 (92.1%) | 46 (7.9%) |
Income in Warrick County
Income Overview in Warrick County
Per Capita Income in Warrick County is $46,734, while median incomes of families and households are $108,457 and $91,105 respectively.
| Characteristic | Number | Measure |
| Per Capita Income | 64,065 | $46,734 |
| Median Family Income | 17,542 | $108,457 |
| Mean Family Income | 17,542 | $142,177 |
| Median Household Income | 24,540 | $91,105 |
| Mean Household Income | 24,540 | $120,609 |
| Income Deficit | 17,542 | $9,040 |
| Wage / Income Gap (%) | 64,065 | 36.77% |
| Wage / Income Gap ($) | 64,065 | 63.23¢ per $1 |
| Gini / Inequality Index | 64,065 | 0.46 |
Earnings by Sex in Warrick County
Average Earnings in Warrick County are $48,121, $59,993 for men and $37,934 for women, a difference of 36.8%.
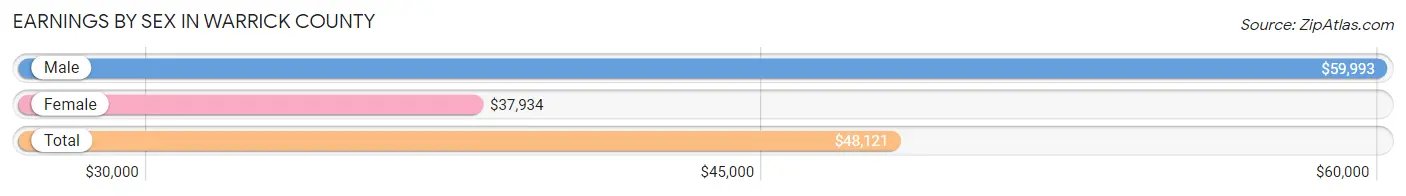
| Sex | Number | Average Earnings |
| Male | 17,824 (52.0%) | $59,993 |
| Female | 16,427 (48.0%) | $37,934 |
| Total | 34,251 (100.0%) | $48,121 |
Earnings by Sex by Income Bracket in Warrick County
The most common earnings brackets in Warrick County are $100,000+ for men (3,631 | 20.4%) and $75,000 to $99,999 for women (1,688 | 10.3%).
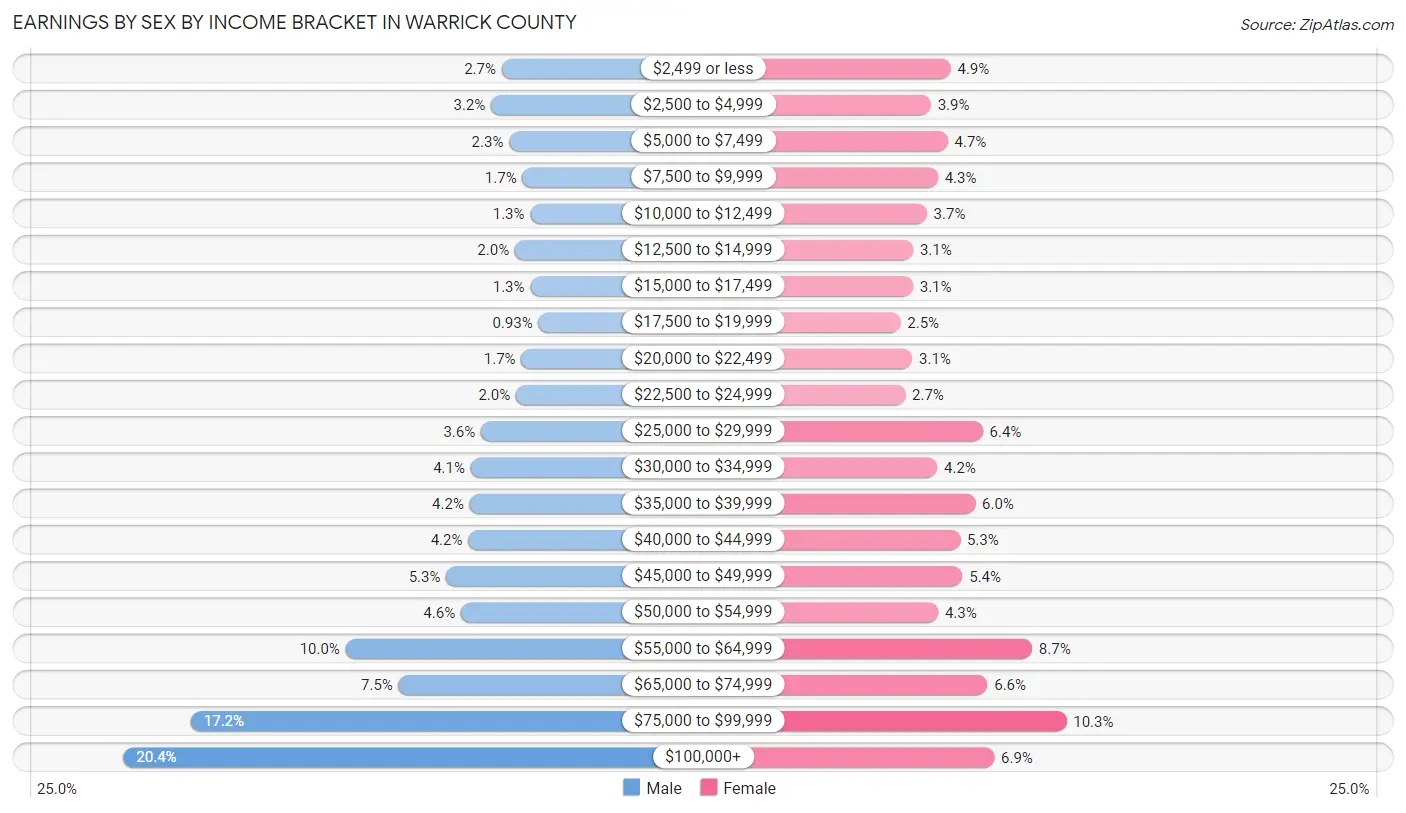
| Income | Male | Female |
| $2,499 or less | 472 (2.6%) | 798 (4.9%) |
| $2,500 to $4,999 | 562 (3.2%) | 646 (3.9%) |
| $5,000 to $7,499 | 410 (2.3%) | 776 (4.7%) |
| $7,500 to $9,999 | 300 (1.7%) | 699 (4.3%) |
| $10,000 to $12,499 | 233 (1.3%) | 615 (3.7%) |
| $12,500 to $14,999 | 361 (2.0%) | 509 (3.1%) |
| $15,000 to $17,499 | 233 (1.3%) | 507 (3.1%) |
| $17,500 to $19,999 | 165 (0.9%) | 413 (2.5%) |
| $20,000 to $22,499 | 308 (1.7%) | 502 (3.1%) |
| $22,500 to $24,999 | 353 (2.0%) | 448 (2.7%) |
| $25,000 to $29,999 | 645 (3.6%) | 1,044 (6.4%) |
| $30,000 to $34,999 | 731 (4.1%) | 695 (4.2%) |
| $35,000 to $39,999 | 740 (4.2%) | 987 (6.0%) |
| $40,000 to $44,999 | 753 (4.2%) | 870 (5.3%) |
| $45,000 to $49,999 | 936 (5.2%) | 888 (5.4%) |
| $50,000 to $54,999 | 813 (4.6%) | 702 (4.3%) |
| $55,000 to $64,999 | 1,776 (10.0%) | 1,425 (8.7%) |
| $65,000 to $74,999 | 1,334 (7.5%) | 1,081 (6.6%) |
| $75,000 to $99,999 | 3,068 (17.2%) | 1,688 (10.3%) |
| $100,000+ | 3,631 (20.4%) | 1,134 (6.9%) |
| Total | 17,824 (100.0%) | 16,427 (100.0%) |
Earnings by Sex by Educational Attainment in Warrick County
Average earnings in Warrick County are $67,174 for men and $43,019 for women, a difference of 36.0%. Men with an educational attainment of graduate degree enjoy the highest average annual earnings of $93,243, while those with less than high school education earn the least with $41,985. Women with an educational attainment of graduate degree earn the most with the average annual earnings of $75,606, while those with high school diploma education have the smallest earnings of $28,571.
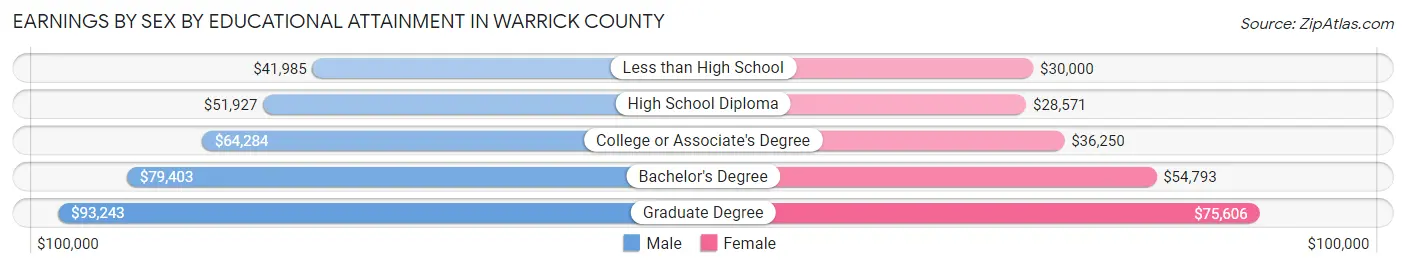
| Educational Attainment | Male Income | Female Income |
| Less than High School | $41,985 | $30,000 |
| High School Diploma | $51,927 | $28,571 |
| College or Associate's Degree | $64,284 | $36,250 |
| Bachelor's Degree | $79,403 | $54,793 |
| Graduate Degree | $93,243 | $75,606 |
| Total | $67,174 | $43,019 |
Family Income in Warrick County
Family Income Brackets in Warrick County
According to the Warrick County family income data, there are 4,754 families falling into the $100,000 to $149,999 income range, which is the most common income bracket and makes up 27.1% of all families. Conversely, the less than $10,000 income bracket is the least frequent group with only 70 families (0.4%) belonging to this category.
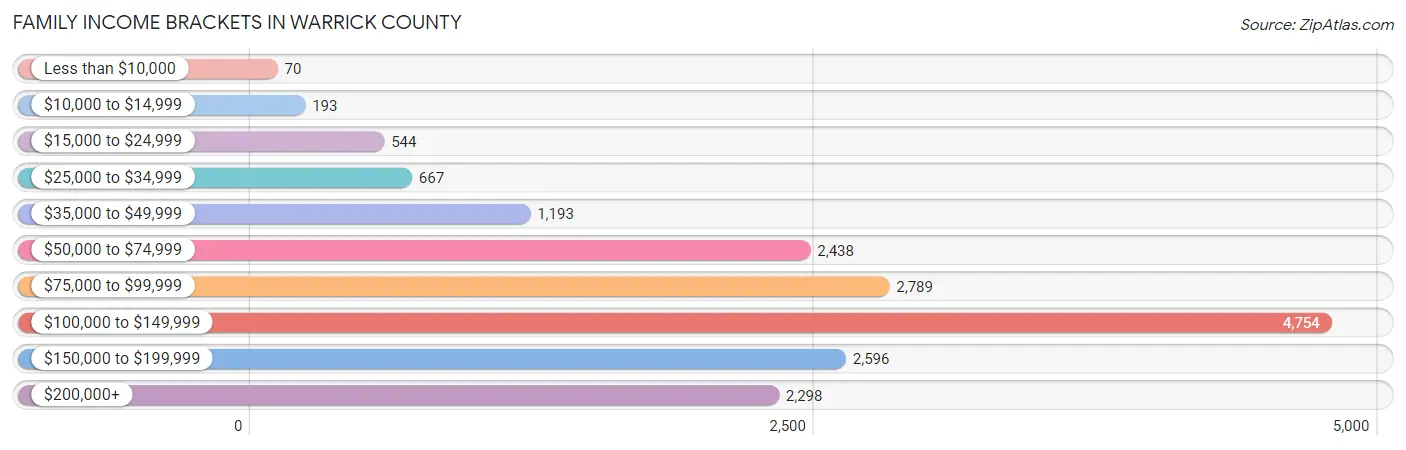
| Income Bracket | # Families | % Families |
| Less than $10,000 | 70 | 0.4% |
| $10,000 to $14,999 | 193 | 1.1% |
| $15,000 to $24,999 | 544 | 3.1% |
| $25,000 to $34,999 | 667 | 3.8% |
| $35,000 to $49,999 | 1,193 | 6.8% |
| $50,000 to $74,999 | 2,438 | 13.9% |
| $75,000 to $99,999 | 2,789 | 15.9% |
| $100,000 to $149,999 | 4,754 | 27.1% |
| $150,000 to $199,999 | 2,596 | 14.8% |
| $200,000+ | 2,298 | 13.1% |
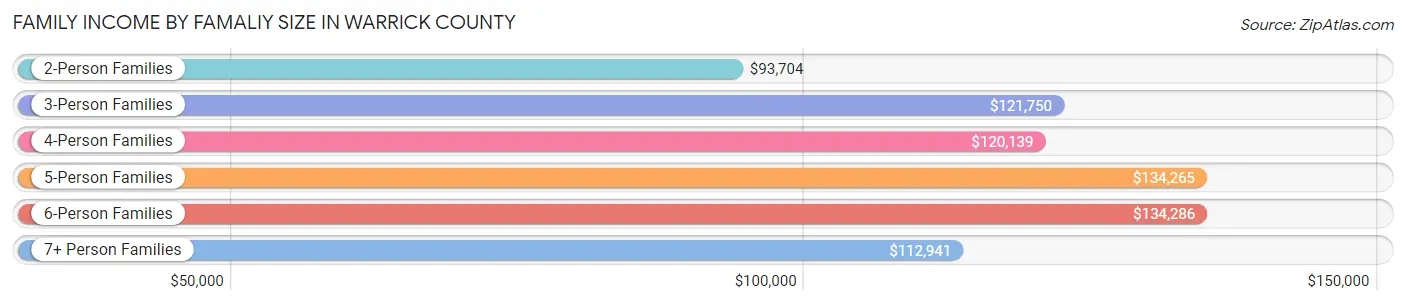
Family Income by Famaliy Size in Warrick County
6-person families (330 | 1.9%) account for the highest median family income in Warrick County with $134,286 per family, while 2-person families (8,837 | 50.4%) have the highest median income of $46,852 per family member.
| Income Bracket | # Families | Median Income |
| 2-Person Families | 8,837 (50.4%) | $93,704 |
| 3-Person Families | 3,238 (18.5%) | $121,750 |
| 4-Person Families | 3,371 (19.2%) | $120,139 |
| 5-Person Families | 1,678 (9.6%) | $134,265 |
| 6-Person Families | 330 (1.9%) | $134,286 |
| 7+ Person Families | 88 (0.5%) | $112,941 |
| Total | 17,542 (100.0%) | $108,457 |
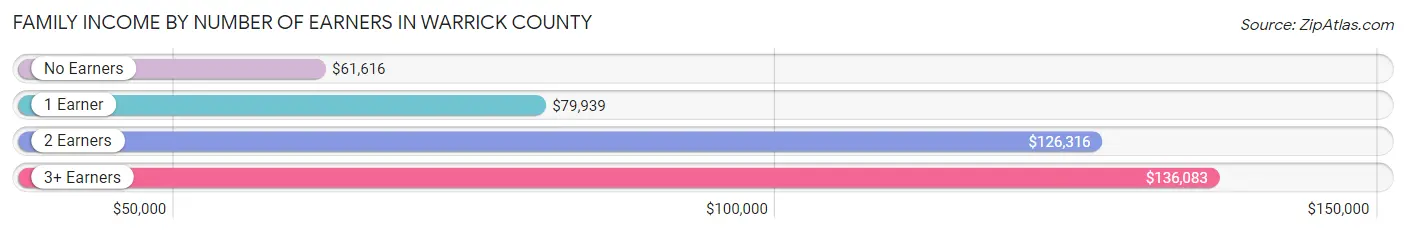
Family Income by Number of Earners in Warrick County
The median family income in Warrick County is $108,457, with families comprising 3+ earners (2,169) having the highest median family income of $136,083, while families with no earners (2,687) have the lowest median family income of $61,616, accounting for 12.4% and 15.3% of families, respectively.
| Number of Earners | # Families | Median Income |
| No Earners | 2,687 (15.3%) | $61,616 |
| 1 Earner | 4,695 (26.8%) | $79,939 |
| 2 Earners | 7,991 (45.6%) | $126,316 |
| 3+ Earners | 2,169 (12.4%) | $136,083 |
| Total | 17,542 (100.0%) | $108,457 |
Household Income in Warrick County
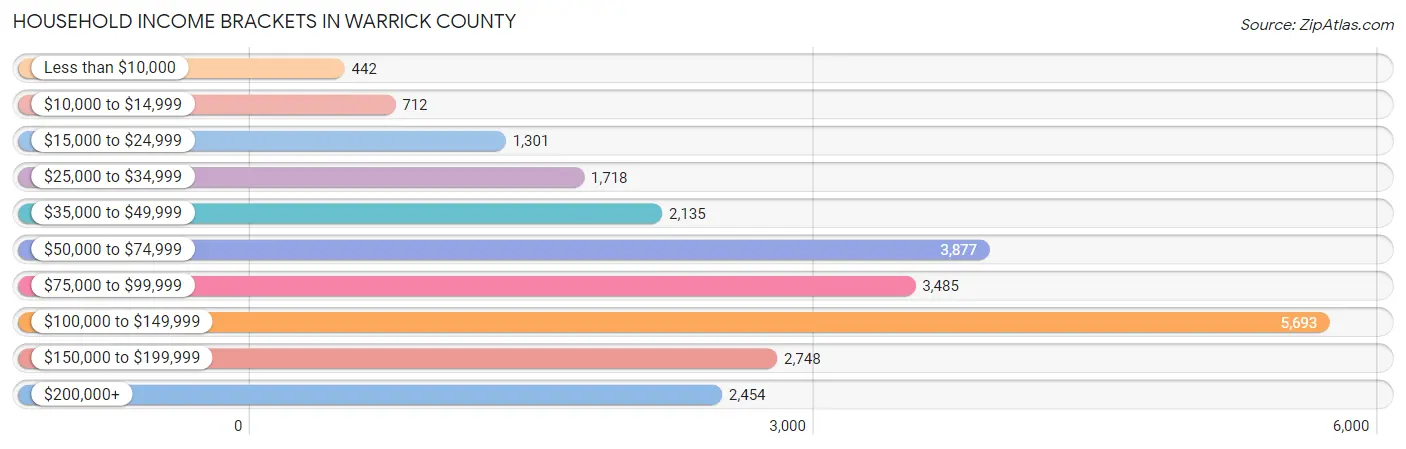
Household Income Brackets in Warrick County
With 5,693 households falling in the category, the $100,000 to $149,999 income range is the most frequent in Warrick County, accounting for 23.2% of all households. In contrast, only 442 households (1.8%) fall into the less than $10,000 income bracket, making it the least populous group.
| Income Bracket | # Households | % Households |
| Less than $10,000 | 442 | 1.8% |
| $10,000 to $14,999 | 712 | 2.9% |
| $15,000 to $24,999 | 1,301 | 5.3% |
| $25,000 to $34,999 | 1,718 | 7.0% |
| $35,000 to $49,999 | 2,135 | 8.7% |
| $50,000 to $74,999 | 3,877 | 15.8% |
| $75,000 to $99,999 | 3,485 | 14.2% |
| $100,000 to $149,999 | 5,693 | 23.2% |
| $150,000 to $199,999 | 2,748 | 11.2% |
| $200,000+ | 2,454 | 10.0% |
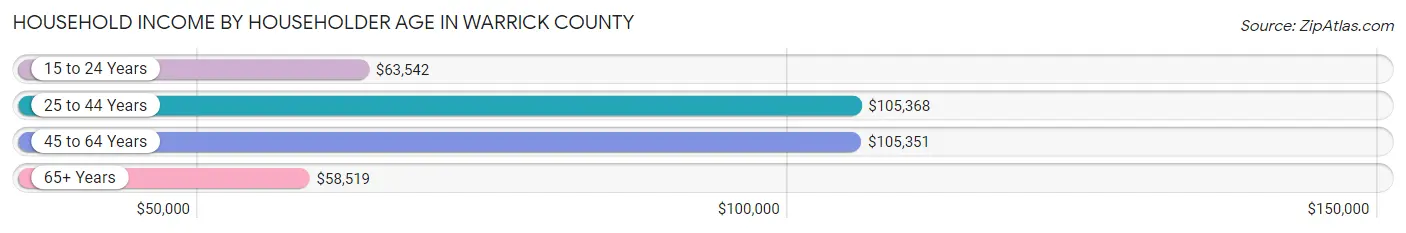
Household Income by Householder Age in Warrick County
The median household income in Warrick County is $91,105, with the highest median household income of $105,368 found in the 25 to 44 years age bracket for the primary householder. A total of 7,501 households (30.6%) fall into this category. Meanwhile, the 65+ years age bracket for the primary householder has the lowest median household income of $58,519, with 6,579 households (26.8%) in this group.
| Income Bracket | # Households | Median Income |
| 15 to 24 Years | 772 (3.2%) | $63,542 |
| 25 to 44 Years | 7,501 (30.6%) | $105,368 |
| 45 to 64 Years | 9,688 (39.5%) | $105,351 |
| 65+ Years | 6,579 (26.8%) | $58,519 |
| Total | 24,540 (100.0%) | $91,105 |
Poverty in Warrick County
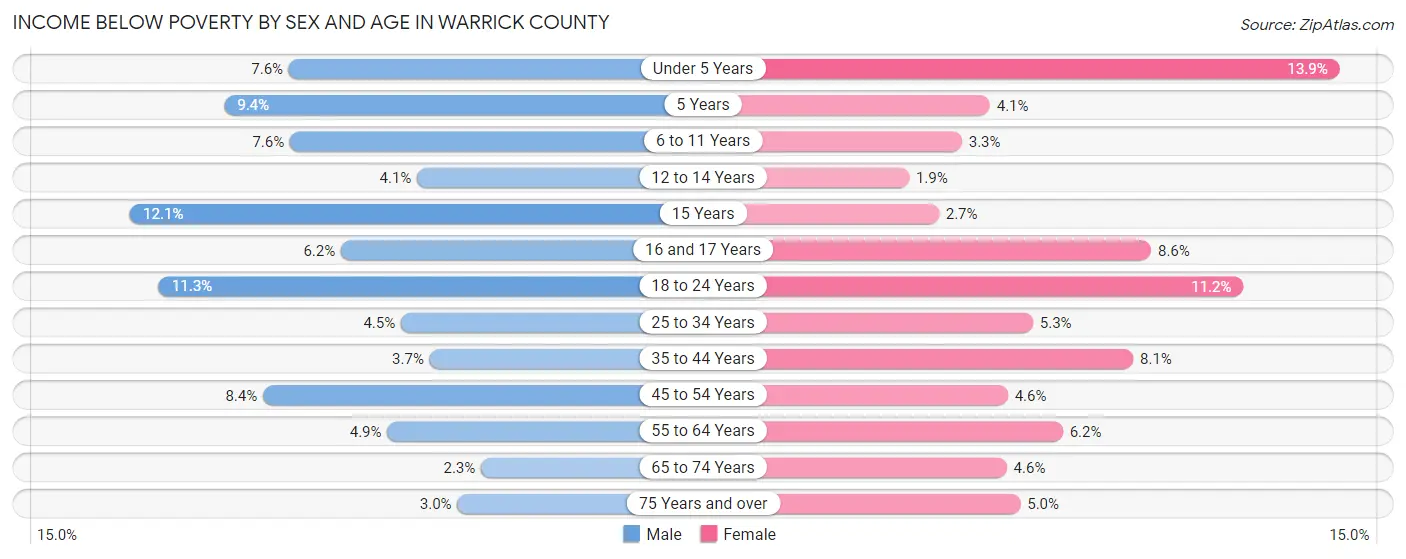
Income Below Poverty by Sex and Age in Warrick County
With 5.8% poverty level for males and 6.3% for females among the residents of Warrick County, 15 year old males and under 5 year old females are the most vulnerable to poverty, with 51 males (12.1%) and 240 females (13.9%) in their respective age groups living below the poverty level.
| Age Bracket | Male | Female |
| Under 5 Years | 136 (7.6%) | 240 (13.9%) |
| 5 Years | 27 (9.4%) | 8 (4.1%) |
| 6 to 11 Years | 181 (7.6%) | 93 (3.3%) |
| 12 to 14 Years | 61 (4.1%) | 21 (1.9%) |
| 15 Years | 51 (12.1%) | 10 (2.7%) |
| 16 and 17 Years | 62 (6.2%) | 92 (8.6%) |
| 18 to 24 Years | 285 (11.3%) | 257 (11.2%) |
| 25 to 34 Years | 154 (4.5%) | 181 (5.3%) |
| 35 to 44 Years | 158 (3.7%) | 361 (8.1%) |
| 45 to 54 Years | 366 (8.4%) | 189 (4.6%) |
| 55 to 64 Years | 205 (4.9%) | 267 (6.1%) |
| 65 to 74 Years | 72 (2.3%) | 162 (4.6%) |
| 75 Years and over | 55 (2.9%) | 121 (5.0%) |
| Total | 1,813 (5.8%) | 2,002 (6.3%) |
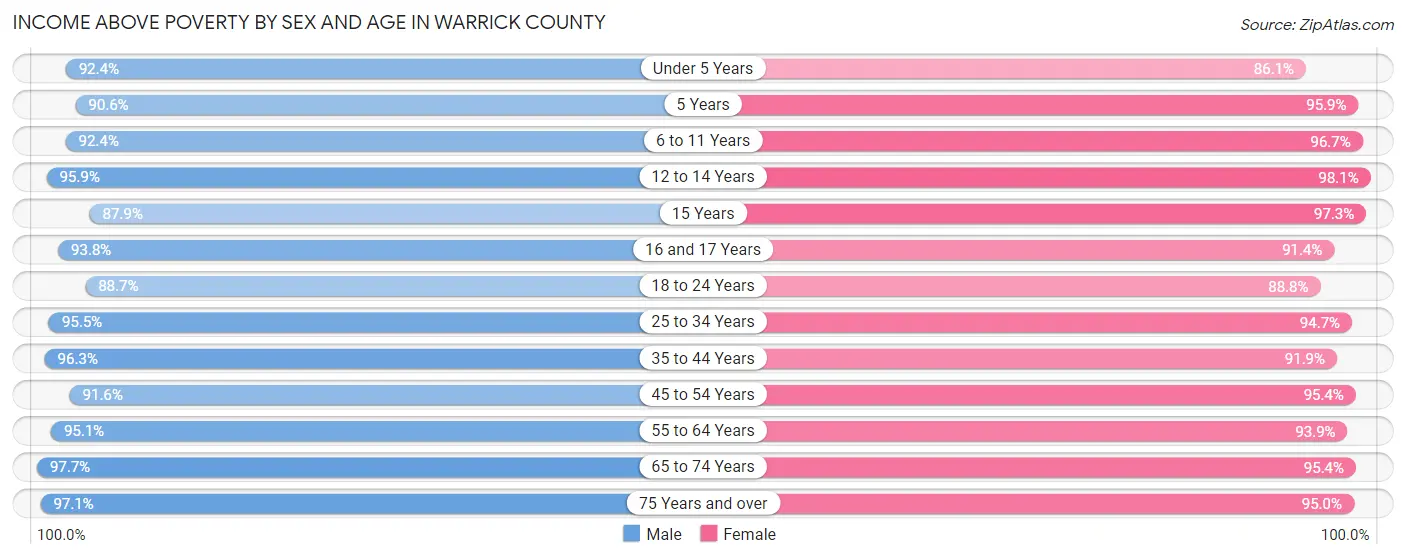
Income Above Poverty by Sex and Age in Warrick County
According to the poverty statistics in Warrick County, males aged 65 to 74 years and females aged 12 to 14 years are the age groups that are most secure financially, with 97.7% of males and 98.1% of females in these age groups living above the poverty line.
| Age Bracket | Male | Female |
| Under 5 Years | 1,645 (92.4%) | 1,492 (86.1%) |
| 5 Years | 259 (90.6%) | 186 (95.9%) |
| 6 to 11 Years | 2,198 (92.4%) | 2,695 (96.7%) |
| 12 to 14 Years | 1,438 (95.9%) | 1,103 (98.1%) |
| 15 Years | 372 (87.9%) | 360 (97.3%) |
| 16 and 17 Years | 939 (93.8%) | 977 (91.4%) |
| 18 to 24 Years | 2,245 (88.7%) | 2,041 (88.8%) |
| 25 to 34 Years | 3,253 (95.5%) | 3,224 (94.7%) |
| 35 to 44 Years | 4,084 (96.3%) | 4,089 (91.9%) |
| 45 to 54 Years | 4,013 (91.6%) | 3,900 (95.4%) |
| 55 to 64 Years | 3,981 (95.1%) | 4,073 (93.9%) |
| 65 to 74 Years | 3,075 (97.7%) | 3,368 (95.4%) |
| 75 Years and over | 1,812 (97.1%) | 2,315 (95.0%) |
| Total | 29,314 (94.2%) | 29,823 (93.7%) |
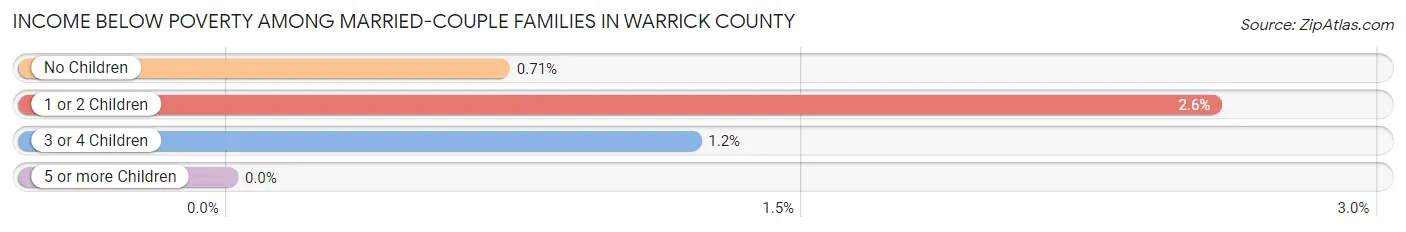
Income Below Poverty Among Married-Couple Families in Warrick County
The poverty statistics for married-couple families in Warrick County show that 1.3% or 195 of the total 14,969 families live below the poverty line. Families with 1 or 2 children have the highest poverty rate of 2.6%, comprising of 114 families. On the other hand, families with 5 or more children have the lowest poverty rate of 0.0%, which includes 0 families.
| Children | Above Poverty | Below Poverty |
| No Children | 9,126 (99.3%) | 65 (0.7%) |
| 1 or 2 Children | 4,328 (97.4%) | 114 (2.6%) |
| 3 or 4 Children | 1,305 (98.8%) | 16 (1.2%) |
| 5 or more Children | 15 (100.0%) | 0 (0.0%) |
| Total | 14,774 (98.7%) | 195 (1.3%) |
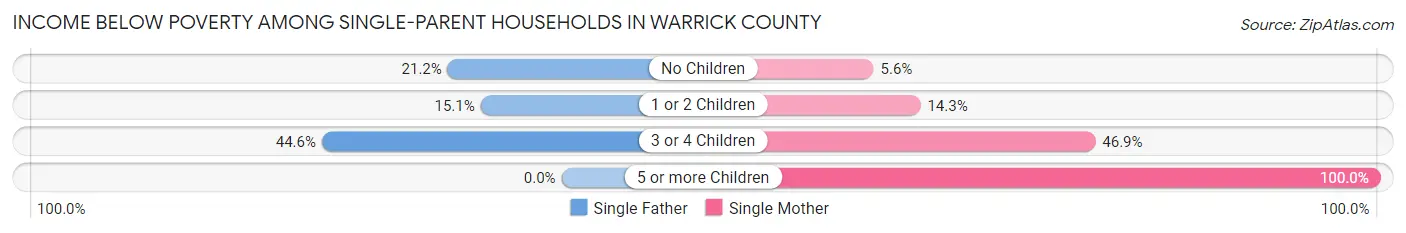
Income Below Poverty Among Single-Parent Households in Warrick County
According to the poverty data in Warrick County, 19.9% or 164 single-father households and 14.9% or 261 single-mother households are living below the poverty line. Among single-father households, those with 3 or 4 children have the highest poverty rate, with 25 households (44.6%) experiencing poverty. Likewise, among single-mother households, those with 5 or more children have the highest poverty rate, with 1 households (100.0%) falling below the poverty line.
| Children | Single Father | Single Mother |
| No Children | 84 (21.2%) | 27 (5.6%) |
| 1 or 2 Children | 55 (15.1%) | 158 (14.3%) |
| 3 or 4 Children | 25 (44.6%) | 75 (46.9%) |
| 5 or more Children | 0 (0.0%) | 1 (100.0%) |
| Total | 164 (19.9%) | 261 (14.9%) |
Income Below Poverty Among Married-Couple vs Single-Parent Households in Warrick County
The poverty data for Warrick County shows that 195 of the married-couple family households (1.3%) and 425 of the single-parent households (16.5%) are living below the poverty level. Within the married-couple family households, those with 1 or 2 children have the highest poverty rate, with 114 households (2.6%) falling below the poverty line. Among the single-parent households, those with 3 or 4 children have the highest poverty rate, with 100 household (46.3%) living below poverty.
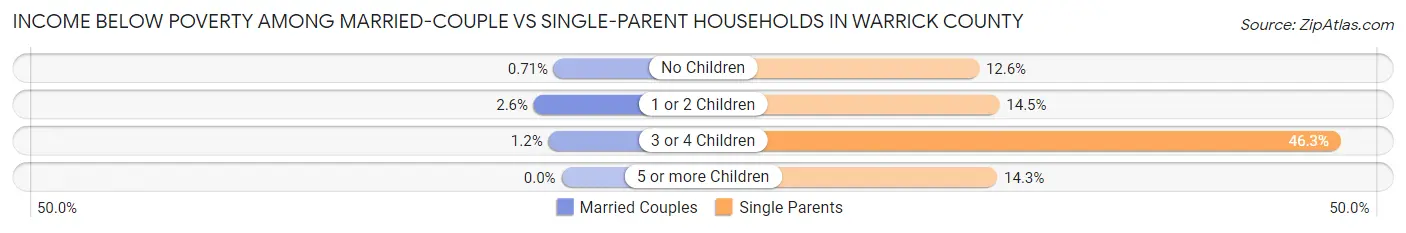
| Children | Married-Couple Families | Single-Parent Households |
| No Children | 65 (0.7%) | 111 (12.6%) |
| 1 or 2 Children | 114 (2.6%) | 213 (14.5%) |
| 3 or 4 Children | 16 (1.2%) | 100 (46.3%) |
| 5 or more Children | 0 (0.0%) | 1 (14.3%) |
| Total | 195 (1.3%) | 425 (16.5%) |
Employment Characteristics in Warrick County
Employment by Class of Employer in Warrick County
Among the 31,207 employed individuals in Warrick County, private company employees (21,619 | 69.3%), not-for-profit organizations (3,125 | 10.0%), and local government employees (2,653 | 8.5%) make up the most common classes of employment.
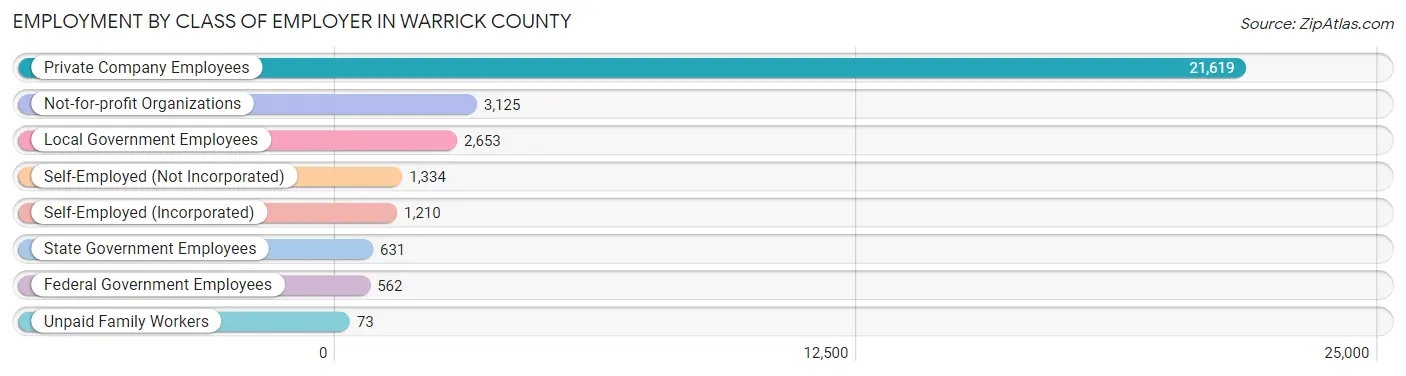
| Employer Class | # Employees | % Employees |
| Private Company Employees | 21,619 | 69.3% |
| Self-Employed (Incorporated) | 1,210 | 3.9% |
| Self-Employed (Not Incorporated) | 1,334 | 4.3% |
| Not-for-profit Organizations | 3,125 | 10.0% |
| Local Government Employees | 2,653 | 8.5% |
| State Government Employees | 631 | 2.0% |
| Federal Government Employees | 562 | 1.8% |
| Unpaid Family Workers | 73 | 0.2% |
| Total | 31,207 | 100.0% |
Employment Status by Age in Warrick County
According to the labor force statistics for Warrick County, out of the total population over 16 years of age (51,159), 63.9% or 32,691 individuals are in the labor force, with 3.3% or 1,079 of them unemployed. The age group with the highest labor force participation rate is 35 to 44 years, with 88.7% or 7,745 individuals in the labor force. Within the labor force, the 16 to 19 years age range has the highest percentage of unemployed individuals, with 9.5% or 145 of them being unemployed.
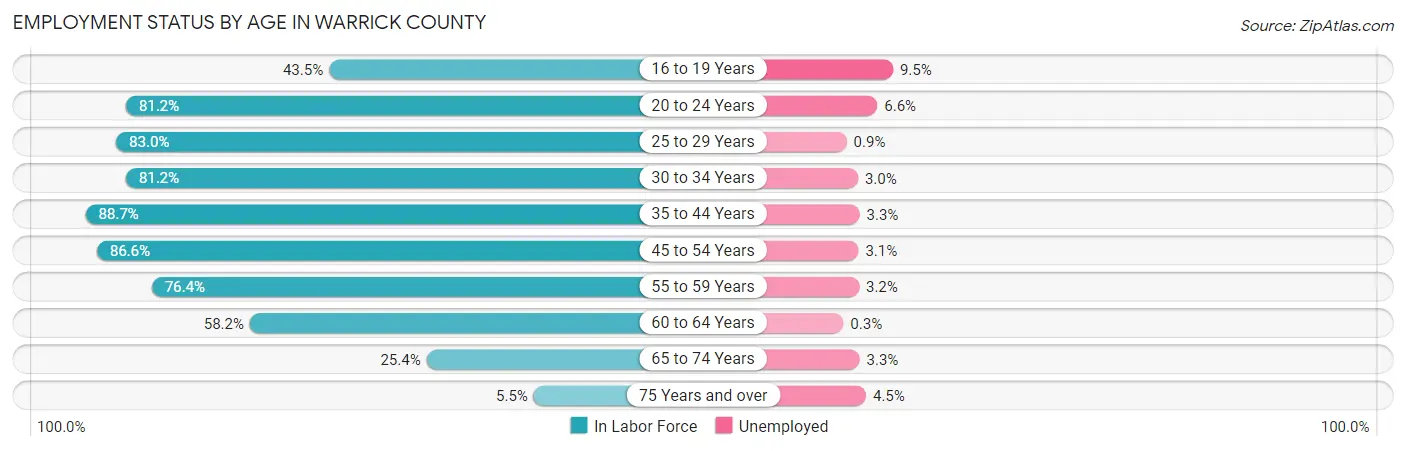
| Age Bracket | In Labor Force | Unemployed |
| 16 to 19 Years | 1,524 (43.5%) | 145 (9.5%) |
| 20 to 24 Years | 2,758 (81.2%) | 182 (6.6%) |
| 25 to 29 Years | 2,869 (83.0%) | 26 (0.9%) |
| 30 to 34 Years | 2,745 (81.2%) | 82 (3.0%) |
| 35 to 44 Years | 7,745 (88.7%) | 256 (3.3%) |
| 45 to 54 Years | 7,346 (86.6%) | 228 (3.1%) |
| 55 to 59 Years | 2,924 (76.4%) | 94 (3.2%) |
| 60 to 64 Years | 2,755 (58.2%) | 8 (0.3%) |
| 65 to 74 Years | 1,741 (25.4%) | 57 (3.3%) |
| 75 Years and over | 264 (5.5%) | 12 (4.5%) |
| Total | 32,691 (63.9%) | 1,079 (3.3%) |
Employment Status by Educational Attainment in Warrick County
According to labor force statistics for Warrick County, 80.9% of individuals (26,383) out of the total population between 25 and 64 years of age (32,612) are in the labor force, with 2.6% or 686 of them being unemployed. The group with the highest labor force participation rate are those with the educational attainment of bachelor's degree or higher, with 88.2% or 10,988 individuals in the labor force. Within the labor force, individuals with less than high school education have the highest percentage of unemployment, with 7.3% or 51 of them being unemployed.
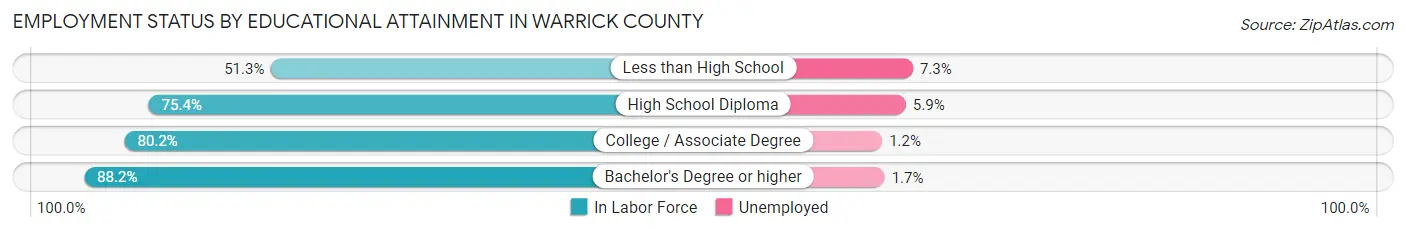
| Educational Attainment | In Labor Force | Unemployed |
| Less than High School | 695 (51.3%) | 99 (7.3%) |
| High School Diploma | 5,976 (75.4%) | 468 (5.9%) |
| College / Associate Degree | 8,721 (80.2%) | 130 (1.2%) |
| Bachelor's Degree or higher | 10,988 (88.2%) | 212 (1.7%) |
| Total | 26,383 (80.9%) | 848 (2.6%) |
Employment Occupations by Sex in Warrick County
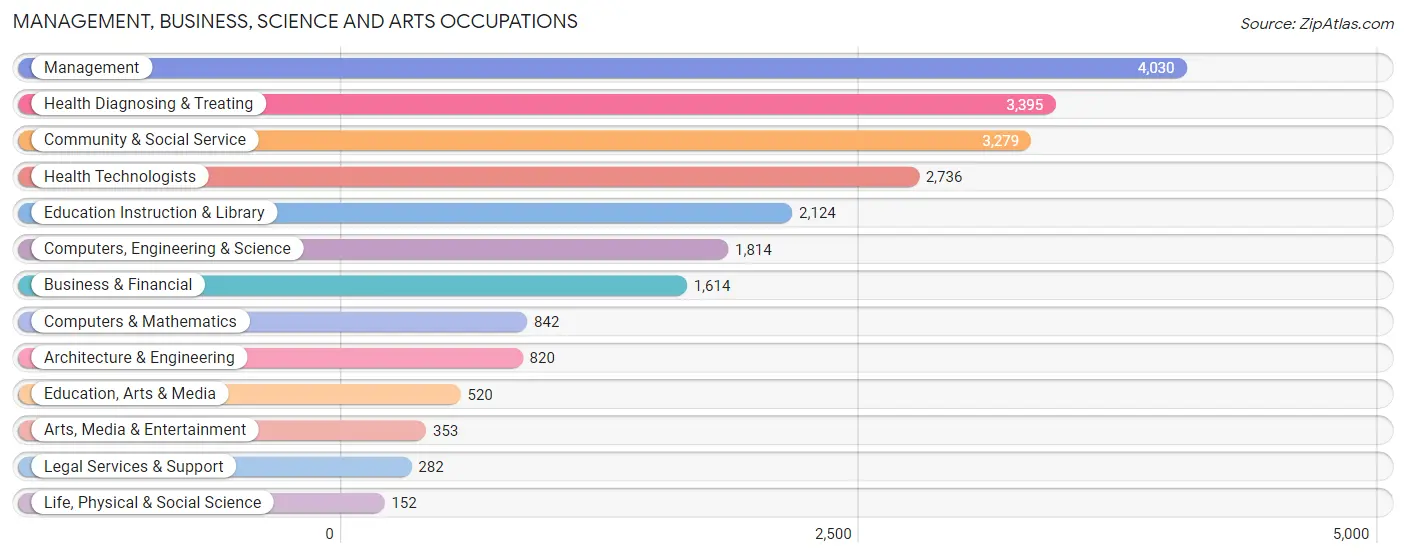
Management, Business, Science and Arts Occupations
The most common Management, Business, Science and Arts occupations in Warrick County are Management (4,030 | 12.8%), Health Diagnosing & Treating (3,395 | 10.8%), Community & Social Service (3,279 | 10.4%), Health Technologists (2,736 | 8.7%), and Education Instruction & Library (2,124 | 6.7%).
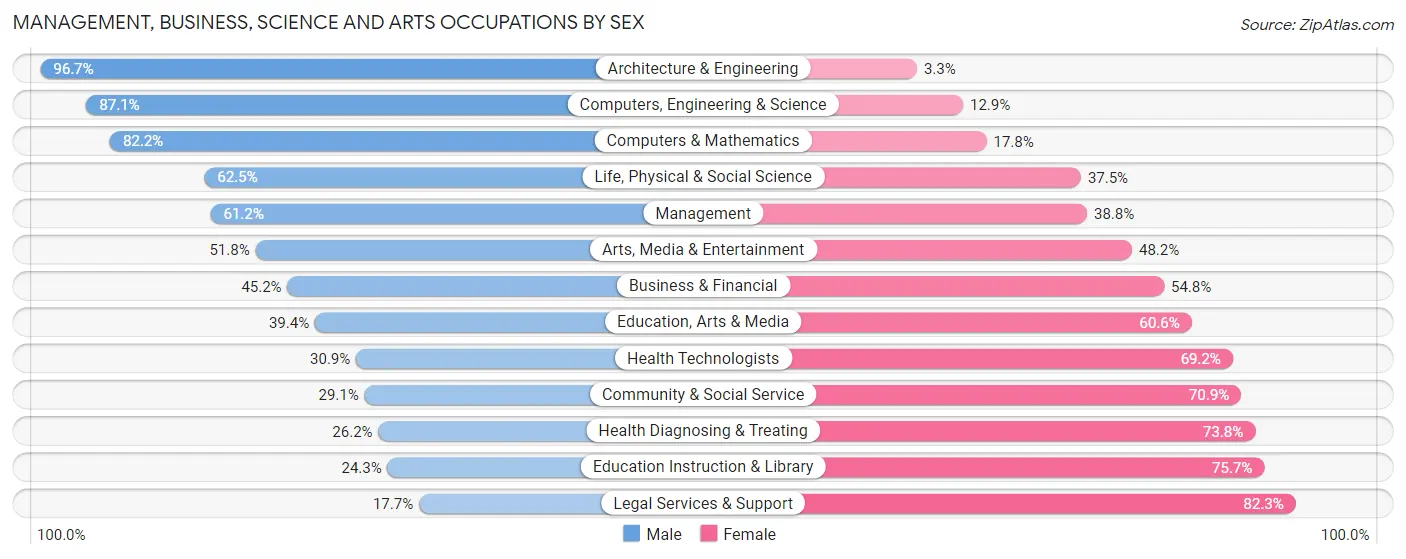
Management, Business, Science and Arts Occupations by Sex
Within the Management, Business, Science and Arts occupations in Warrick County, the most male-oriented occupations are Architecture & Engineering (96.7%), Computers, Engineering & Science (87.1%), and Computers & Mathematics (82.2%), while the most female-oriented occupations are Legal Services & Support (82.3%), Education Instruction & Library (75.7%), and Health Diagnosing & Treating (73.8%).
| Occupation | Male | Female |
| Management | 2,467 (61.2%) | 1,563 (38.8%) |
| Business & Financial | 729 (45.2%) | 885 (54.8%) |
| Computers, Engineering & Science | 1,580 (87.1%) | 234 (12.9%) |
| Computers & Mathematics | 692 (82.2%) | 150 (17.8%) |
| Architecture & Engineering | 793 (96.7%) | 27 (3.3%) |
| Life, Physical & Social Science | 95 (62.5%) | 57 (37.5%) |
| Community & Social Service | 954 (29.1%) | 2,325 (70.9%) |
| Education, Arts & Media | 205 (39.4%) | 315 (60.6%) |
| Legal Services & Support | 50 (17.7%) | 232 (82.3%) |
| Education Instruction & Library | 516 (24.3%) | 1,608 (75.7%) |
| Arts, Media & Entertainment | 183 (51.8%) | 170 (48.2%) |
| Health Diagnosing & Treating | 889 (26.2%) | 2,506 (73.8%) |
| Health Technologists | 844 (30.8%) | 1,892 (69.2%) |
| Total (Category) | 6,619 (46.8%) | 7,513 (53.2%) |
| Total (Overall) | 16,430 (52.1%) | 15,111 (47.9%) |
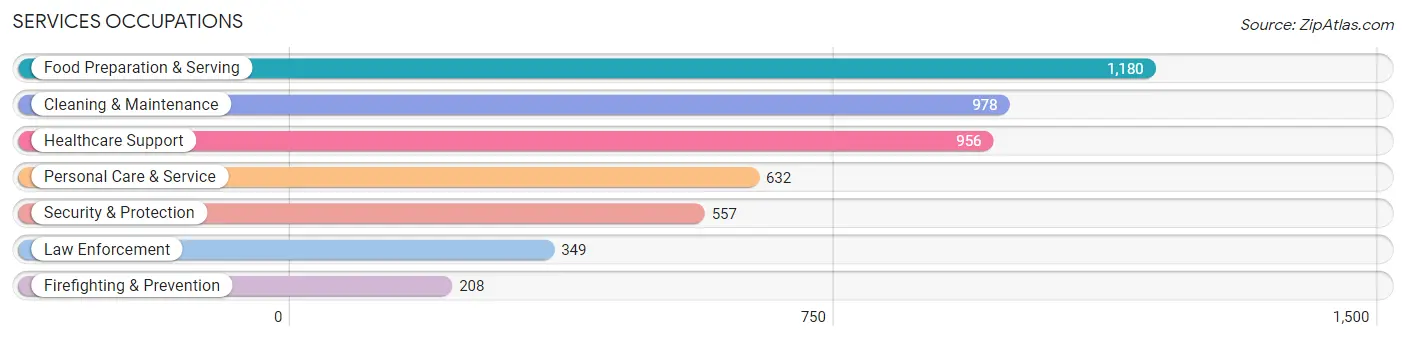
Services Occupations
The most common Services occupations in Warrick County are Food Preparation & Serving (1,180 | 3.7%), Cleaning & Maintenance (978 | 3.1%), Healthcare Support (956 | 3.0%), Personal Care & Service (632 | 2.0%), and Security & Protection (557 | 1.8%).
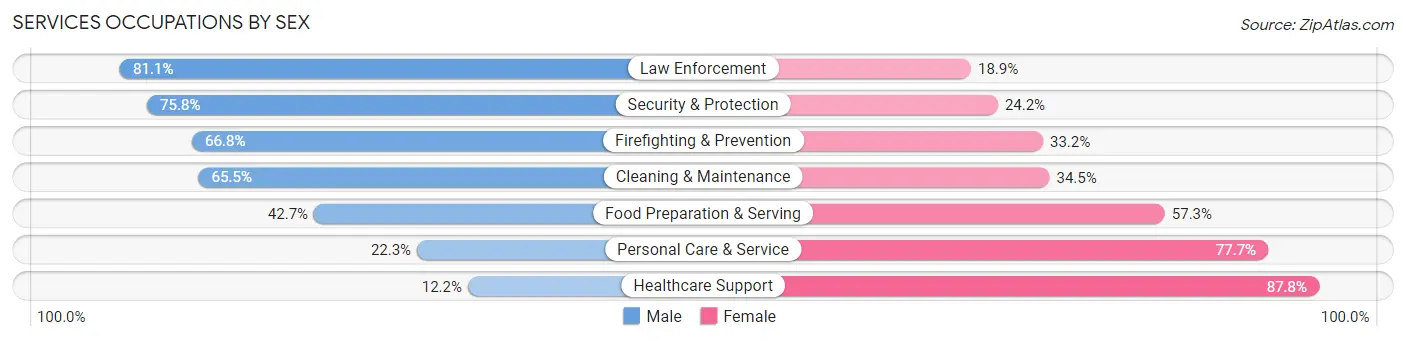
Services Occupations by Sex
Within the Services occupations in Warrick County, the most male-oriented occupations are Law Enforcement (81.1%), Security & Protection (75.8%), and Firefighting & Prevention (66.8%), while the most female-oriented occupations are Healthcare Support (87.8%), Personal Care & Service (77.7%), and Food Preparation & Serving (57.3%).
| Occupation | Male | Female |
| Healthcare Support | 117 (12.2%) | 839 (87.8%) |
| Security & Protection | 422 (75.8%) | 135 (24.2%) |
| Firefighting & Prevention | 139 (66.8%) | 69 (33.2%) |
| Law Enforcement | 283 (81.1%) | 66 (18.9%) |
| Food Preparation & Serving | 504 (42.7%) | 676 (57.3%) |
| Cleaning & Maintenance | 641 (65.5%) | 337 (34.5%) |
| Personal Care & Service | 141 (22.3%) | 491 (77.7%) |
| Total (Category) | 1,825 (42.4%) | 2,478 (57.6%) |
| Total (Overall) | 16,430 (52.1%) | 15,111 (47.9%) |
Sales and Office Occupations
The most common Sales and Office occupations in Warrick County are Office & Administration (3,177 | 10.1%), and Sales & Related (2,666 | 8.5%).

Sales and Office Occupations by Sex
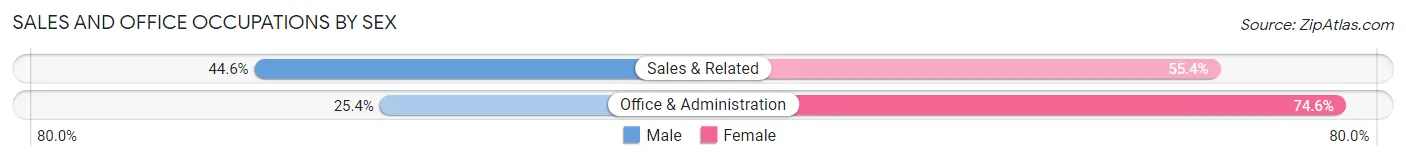
| Occupation | Male | Female |
| Sales & Related | 1,190 (44.6%) | 1,476 (55.4%) |
| Office & Administration | 806 (25.4%) | 2,371 (74.6%) |
| Total (Category) | 1,996 (34.2%) | 3,847 (65.8%) |
| Total (Overall) | 16,430 (52.1%) | 15,111 (47.9%) |
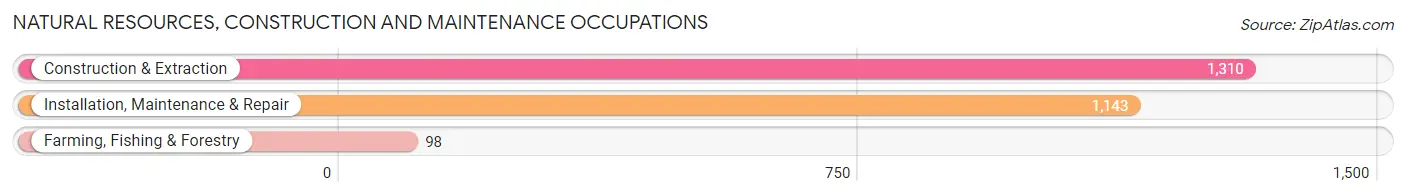
Natural Resources, Construction and Maintenance Occupations
The most common Natural Resources, Construction and Maintenance occupations in Warrick County are Construction & Extraction (1,310 | 4.2%), Installation, Maintenance & Repair (1,143 | 3.6%), and Farming, Fishing & Forestry (98 | 0.3%).
Natural Resources, Construction and Maintenance Occupations by Sex
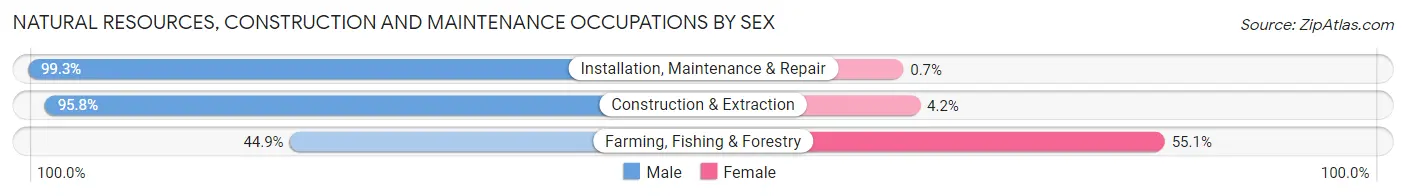
| Occupation | Male | Female |
| Farming, Fishing & Forestry | 44 (44.9%) | 54 (55.1%) |
| Construction & Extraction | 1,255 (95.8%) | 55 (4.2%) |
| Installation, Maintenance & Repair | 1,135 (99.3%) | 8 (0.7%) |
| Total (Category) | 2,434 (95.4%) | 117 (4.6%) |
| Total (Overall) | 16,430 (52.1%) | 15,111 (47.9%) |
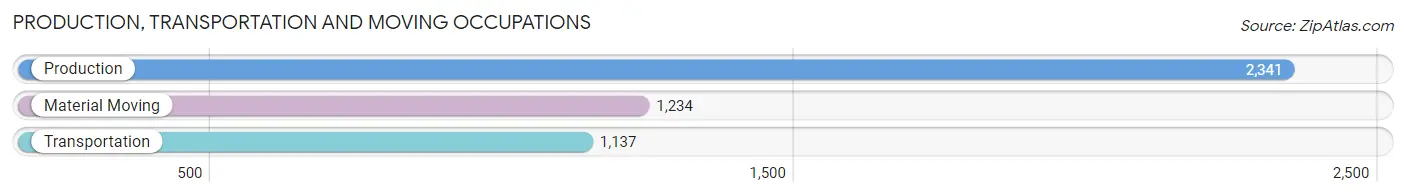
Production, Transportation and Moving Occupations
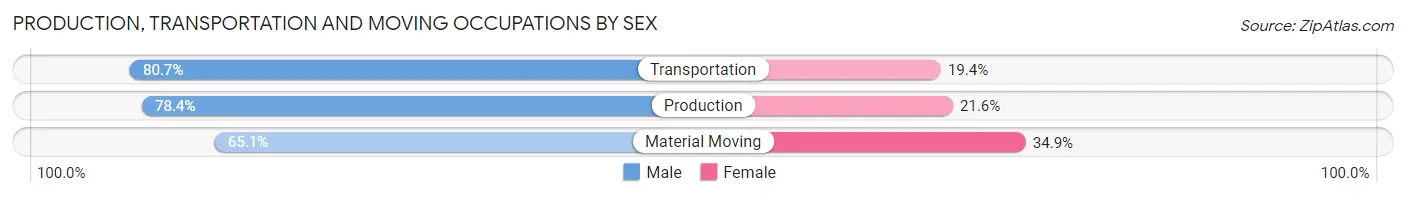
The most common Production, Transportation and Moving occupations in Warrick County are Production (2,341 | 7.4%), Material Moving (1,234 | 3.9%), and Transportation (1,137 | 3.6%).
Production, Transportation and Moving Occupations by Sex
| Occupation | Male | Female |
| Production | 1,836 (78.4%) | 505 (21.6%) |
| Transportation | 917 (80.6%) | 220 (19.4%) |
| Material Moving | 803 (65.1%) | 431 (34.9%) |
| Total (Category) | 3,556 (75.5%) | 1,156 (24.5%) |
| Total (Overall) | 16,430 (52.1%) | 15,111 (47.9%) |
Employment Industries by Sex in Warrick County
Employment Industries in Warrick County
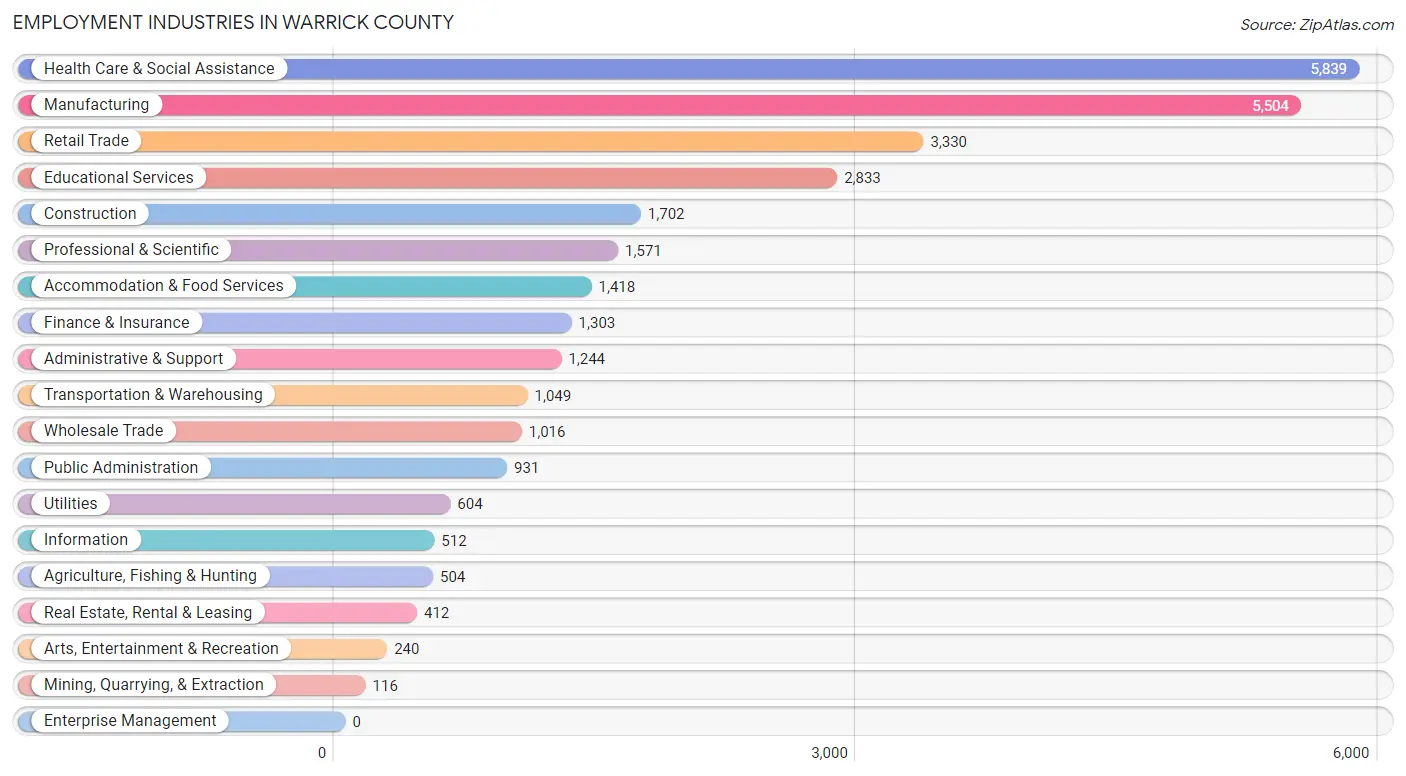
The major employment industries in Warrick County include Health Care & Social Assistance (5,839 | 18.5%), Manufacturing (5,504 | 17.4%), Retail Trade (3,330 | 10.6%), Educational Services (2,833 | 9.0%), and Construction (1,702 | 5.4%).
Employment Industries by Sex in Warrick County
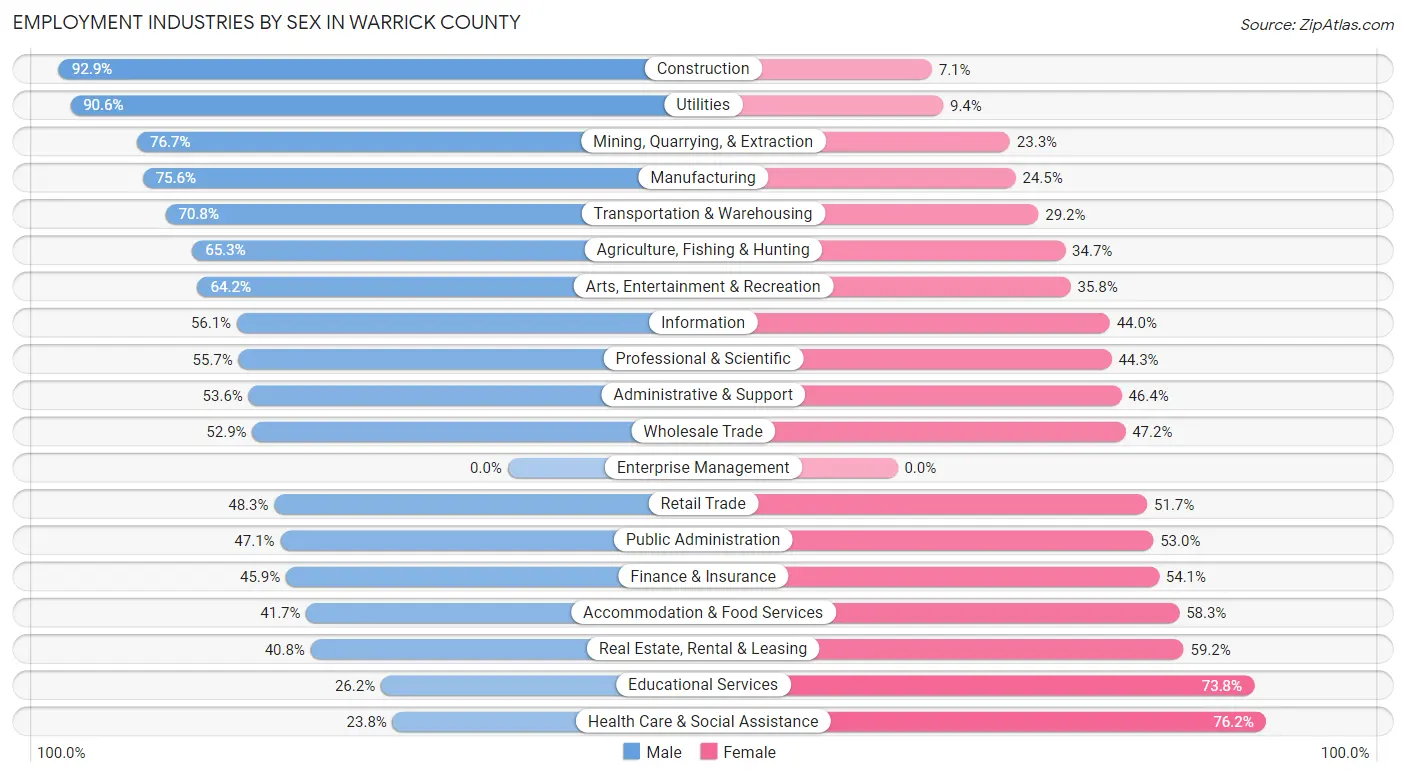
The Warrick County industries that see more men than women are Construction (92.9%), Utilities (90.6%), and Mining, Quarrying, & Extraction (76.7%), whereas the industries that tend to have a higher number of women are Health Care & Social Assistance (76.2%), Educational Services (73.8%), and Real Estate, Rental & Leasing (59.2%).
| Industry | Male | Female |
| Agriculture, Fishing & Hunting | 329 (65.3%) | 175 (34.7%) |
| Mining, Quarrying, & Extraction | 89 (76.7%) | 27 (23.3%) |
| Construction | 1,581 (92.9%) | 121 (7.1%) |
| Manufacturing | 4,158 (75.5%) | 1,346 (24.4%) |
| Wholesale Trade | 537 (52.8%) | 479 (47.1%) |
| Retail Trade | 1,609 (48.3%) | 1,721 (51.7%) |
| Transportation & Warehousing | 743 (70.8%) | 306 (29.2%) |
| Utilities | 547 (90.6%) | 57 (9.4%) |
| Information | 287 (56.0%) | 225 (44.0%) |
| Finance & Insurance | 598 (45.9%) | 705 (54.1%) |
| Real Estate, Rental & Leasing | 168 (40.8%) | 244 (59.2%) |
| Professional & Scientific | 875 (55.7%) | 696 (44.3%) |
| Enterprise Management | 0 (0.0%) | 0 (0.0%) |
| Administrative & Support | 667 (53.6%) | 577 (46.4%) |
| Educational Services | 743 (26.2%) | 2,090 (73.8%) |
| Health Care & Social Assistance | 1,391 (23.8%) | 4,448 (76.2%) |
| Arts, Entertainment & Recreation | 154 (64.2%) | 86 (35.8%) |
| Accommodation & Food Services | 591 (41.7%) | 827 (58.3%) |
| Public Administration | 438 (47.0%) | 493 (52.9%) |
| Total | 16,430 (52.1%) | 15,111 (47.9%) |
Education in Warrick County
School Enrollment in Warrick County
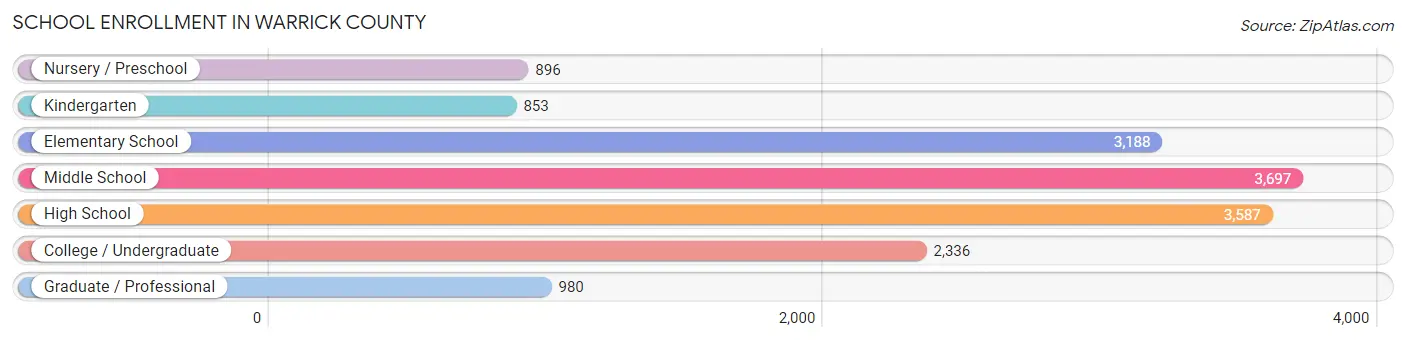
The most common levels of schooling among the 15,537 students in Warrick County are middle school (3,697 | 23.8%), high school (3,587 | 23.1%), and elementary school (3,188 | 20.5%).
| School Level | # Students | % Students |
| Nursery / Preschool | 896 | 5.8% |
| Kindergarten | 853 | 5.5% |
| Elementary School | 3,188 | 20.5% |
| Middle School | 3,697 | 23.8% |
| High School | 3,587 | 23.1% |
| College / Undergraduate | 2,336 | 15.0% |
| Graduate / Professional | 980 | 6.3% |
| Total | 15,537 | 100.0% |
School Enrollment by Age by Funding Source in Warrick County
Out of a total of 15,537 students who are enrolled in schools in Warrick County, 2,610 (16.8%) attend a private institution, while the remaining 12,927 (83.2%) are enrolled in public schools. The age group of 3 to 4 year olds has the highest likelihood of being enrolled in private schools, with 295 (43.0% in the age bracket) enrolled. Conversely, the age group of 20 to 24 year olds has the lowest likelihood of being enrolled in a private school, with 1,062 (95.1% in the age bracket) attending a public institution.
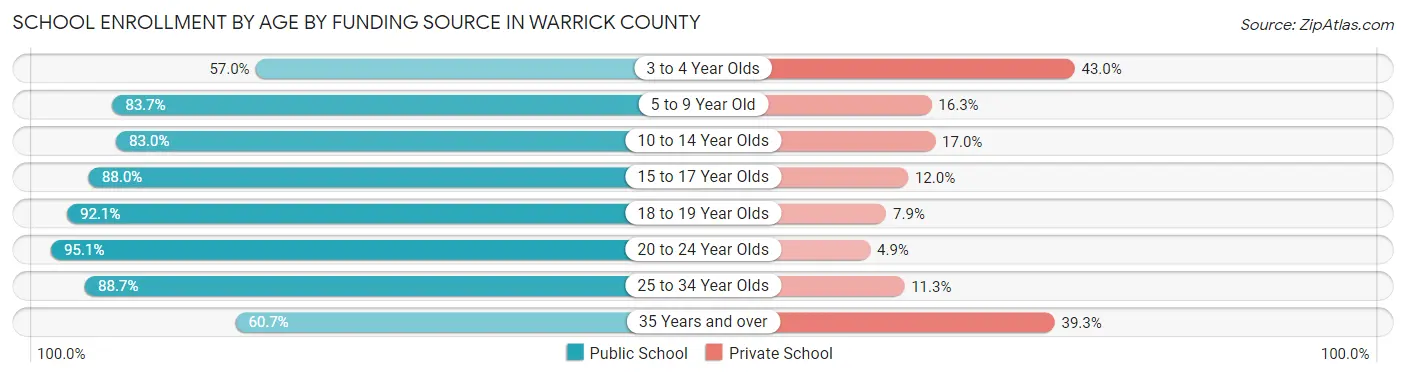
| Age Bracket | Public School | Private School |
| 3 to 4 Year Olds | 391 (57.0%) | 295 (43.0%) |
| 5 to 9 Year Old | 3,204 (83.7%) | 626 (16.3%) |
| 10 to 14 Year Olds | 3,564 (83.0%) | 732 (17.0%) |
| 15 to 17 Year Olds | 2,513 (88.0%) | 342 (12.0%) |
| 18 to 19 Year Olds | 978 (92.1%) | 84 (7.9%) |
| 20 to 24 Year Olds | 1,062 (95.1%) | 55 (4.9%) |
| 25 to 34 Year Olds | 590 (88.7%) | 75 (11.3%) |
| 35 Years and over | 623 (60.7%) | 403 (39.3%) |
| Total | 12,927 (83.2%) | 2,610 (16.8%) |
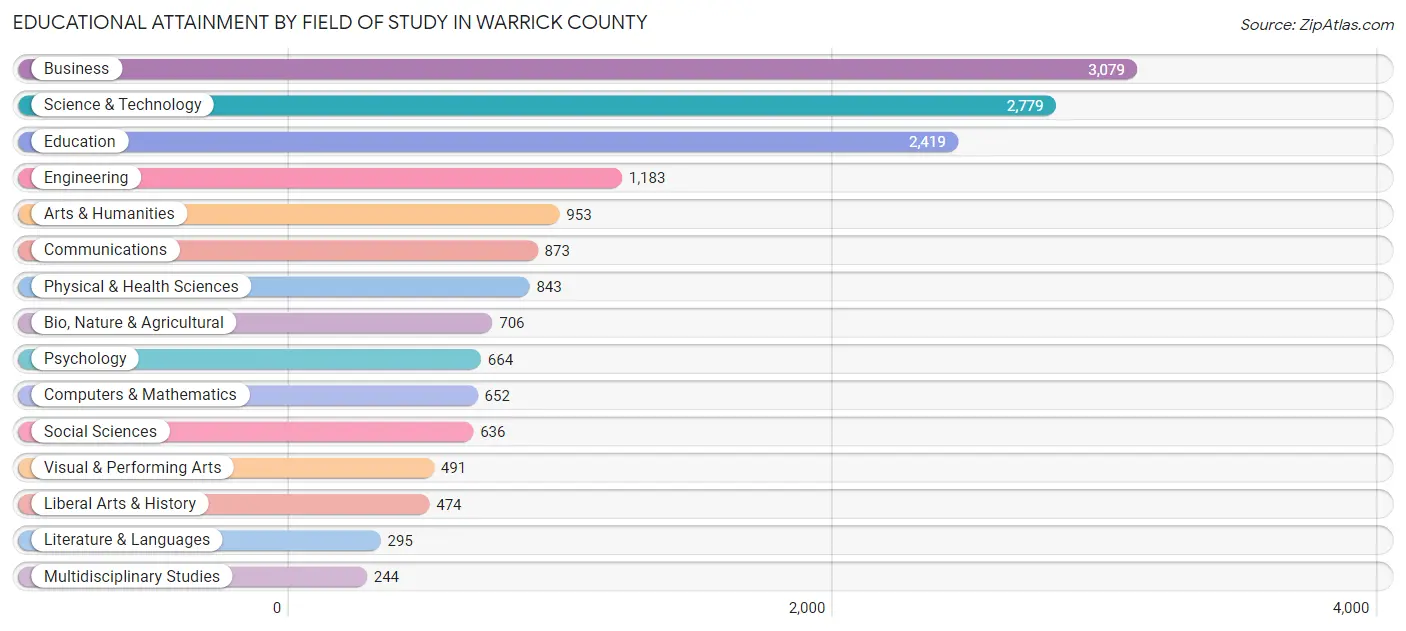
Educational Attainment by Field of Study in Warrick County
Business (3,079 | 18.9%), science & technology (2,779 | 17.1%), education (2,419 | 14.8%), engineering (1,183 | 7.3%), and arts & humanities (953 | 5.9%) are the most common fields of study among 16,291 individuals in Warrick County who have obtained a bachelor's degree or higher.
| Field of Study | # Graduates | % Graduates |
| Computers & Mathematics | 652 | 4.0% |
| Bio, Nature & Agricultural | 706 | 4.3% |
| Physical & Health Sciences | 843 | 5.2% |
| Psychology | 664 | 4.1% |
| Social Sciences | 636 | 3.9% |
| Engineering | 1,183 | 7.3% |
| Multidisciplinary Studies | 244 | 1.5% |
| Science & Technology | 2,779 | 17.1% |
| Business | 3,079 | 18.9% |
| Education | 2,419 | 14.8% |
| Literature & Languages | 295 | 1.8% |
| Liberal Arts & History | 474 | 2.9% |
| Visual & Performing Arts | 491 | 3.0% |
| Communications | 873 | 5.4% |
| Arts & Humanities | 953 | 5.9% |
| Total | 16,291 | 100.0% |
Transportation & Commute in Warrick County
Vehicle Availability by Sex in Warrick County
The most prevalent vehicle ownership categories in Warrick County are males with 2 vehicles (7,046, accounting for 43.2%) and females with 2 vehicles (6,447, making up 47.3%).
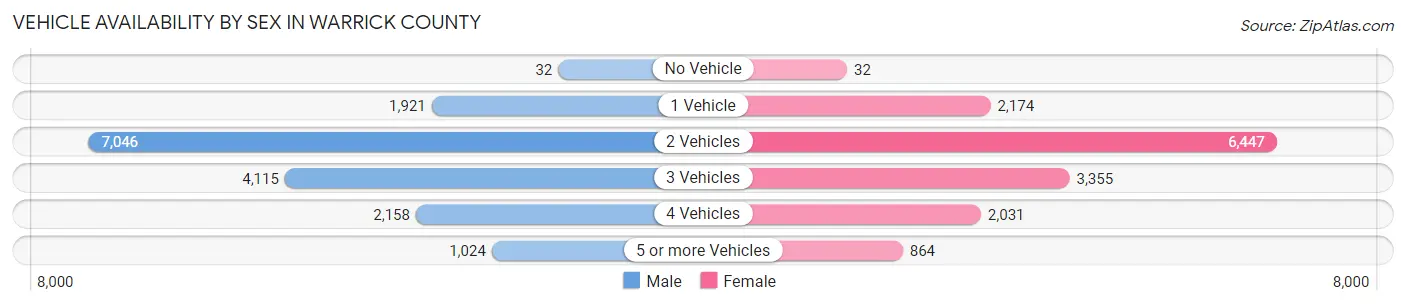
| Vehicles Available | Male | Female |
| No Vehicle | 32 (0.2%) | 32 (0.2%) |
| 1 Vehicle | 1,921 (11.8%) | 2,174 (14.6%) |
| 2 Vehicles | 7,046 (43.2%) | 6,447 (43.3%) |
| 3 Vehicles | 4,115 (25.3%) | 3,355 (22.5%) |
| 4 Vehicles | 2,158 (13.2%) | 2,031 (13.6%) |
| 5 or more Vehicles | 1,024 (6.3%) | 864 (5.8%) |
| Total | 16,296 (100.0%) | 14,903 (100.0%) |
Commute Time in Warrick County
The most frequently occuring commute durations in Warrick County are 20 to 24 minutes (5,229 commuters, 18.2%), 15 to 19 minutes (5,185 commuters, 18.0%), and 10 to 14 minutes (3,707 commuters, 12.9%).
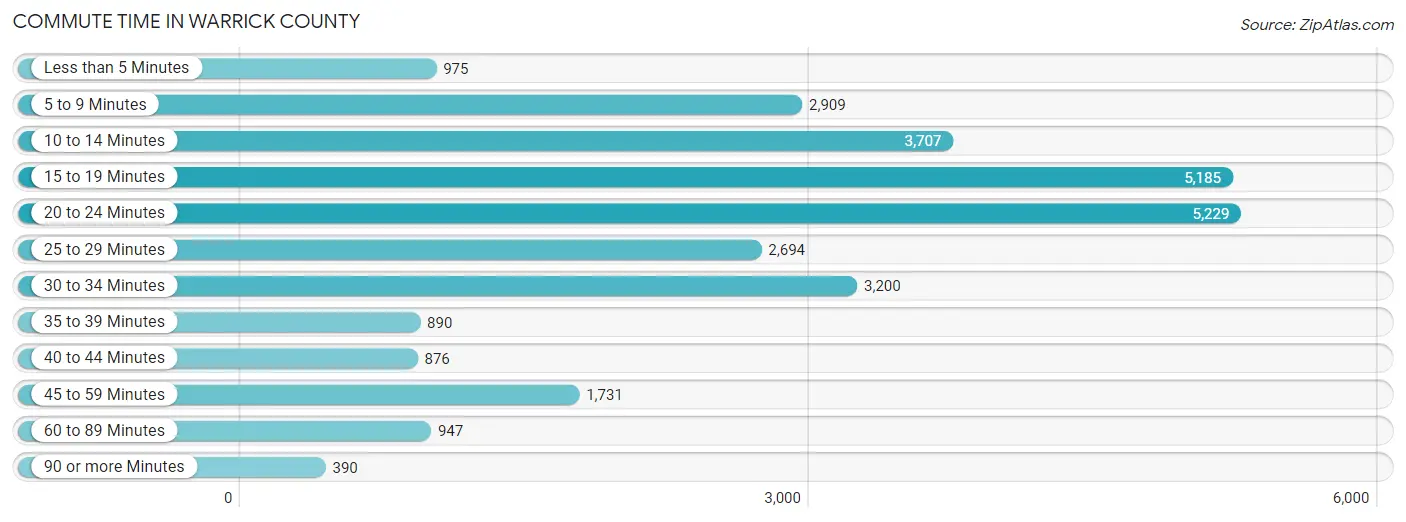
| Commute Time | # Commuters | % Commuters |
| Less than 5 Minutes | 975 | 3.4% |
| 5 to 9 Minutes | 2,909 | 10.1% |
| 10 to 14 Minutes | 3,707 | 12.9% |
| 15 to 19 Minutes | 5,185 | 18.0% |
| 20 to 24 Minutes | 5,229 | 18.2% |
| 25 to 29 Minutes | 2,694 | 9.4% |
| 30 to 34 Minutes | 3,200 | 11.1% |
| 35 to 39 Minutes | 890 | 3.1% |
| 40 to 44 Minutes | 876 | 3.0% |
| 45 to 59 Minutes | 1,731 | 6.0% |
| 60 to 89 Minutes | 947 | 3.3% |
| 90 or more Minutes | 390 | 1.4% |
Commute Time by Sex in Warrick County
The most common commute times in Warrick County are 15 to 19 minutes (2,629 commuters, 17.5%) for males and 20 to 24 minutes (2,677 commuters, 19.5%) for females.
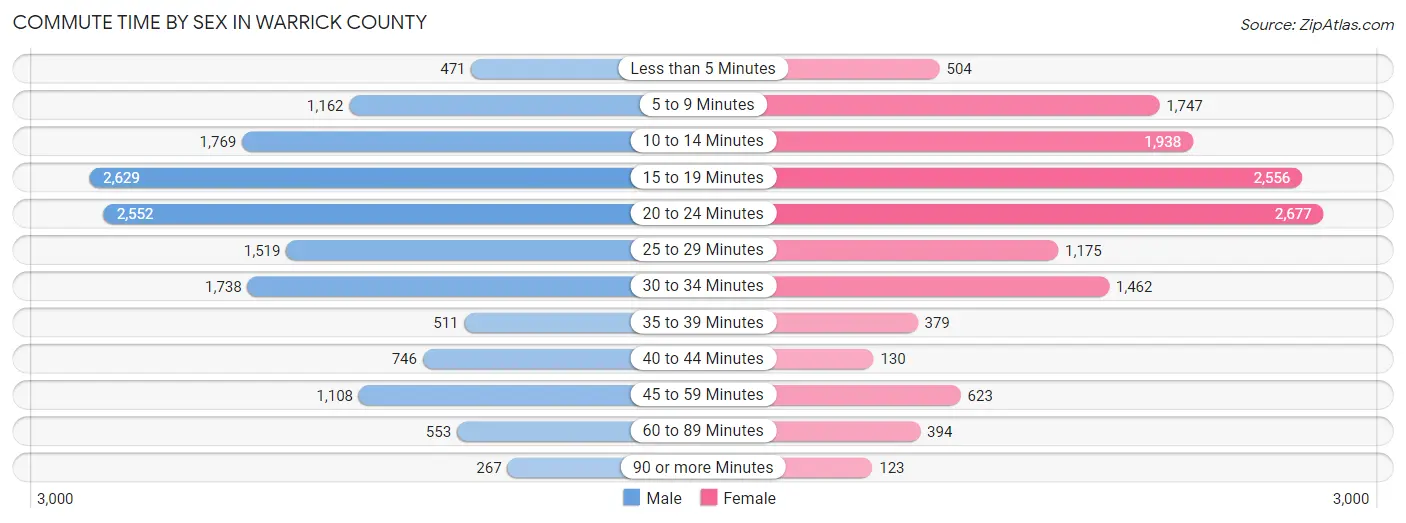
| Commute Time | Male | Female |
| Less than 5 Minutes | 471 (3.1%) | 504 (3.7%) |
| 5 to 9 Minutes | 1,162 (7.7%) | 1,747 (12.7%) |
| 10 to 14 Minutes | 1,769 (11.8%) | 1,938 (14.1%) |
| 15 to 19 Minutes | 2,629 (17.5%) | 2,556 (18.6%) |
| 20 to 24 Minutes | 2,552 (17.0%) | 2,677 (19.5%) |
| 25 to 29 Minutes | 1,519 (10.1%) | 1,175 (8.6%) |
| 30 to 34 Minutes | 1,738 (11.6%) | 1,462 (10.7%) |
| 35 to 39 Minutes | 511 (3.4%) | 379 (2.8%) |
| 40 to 44 Minutes | 746 (5.0%) | 130 (0.9%) |
| 45 to 59 Minutes | 1,108 (7.4%) | 623 (4.5%) |
| 60 to 89 Minutes | 553 (3.7%) | 394 (2.9%) |
| 90 or more Minutes | 267 (1.8%) | 123 (0.9%) |
Time of Departure to Work by Sex in Warrick County
The most frequent times of departure to work in Warrick County are 7:00 AM to 7:29 AM (2,216, 14.7%) for males and 7:00 AM to 7:29 AM (2,797, 20.4%) for females.
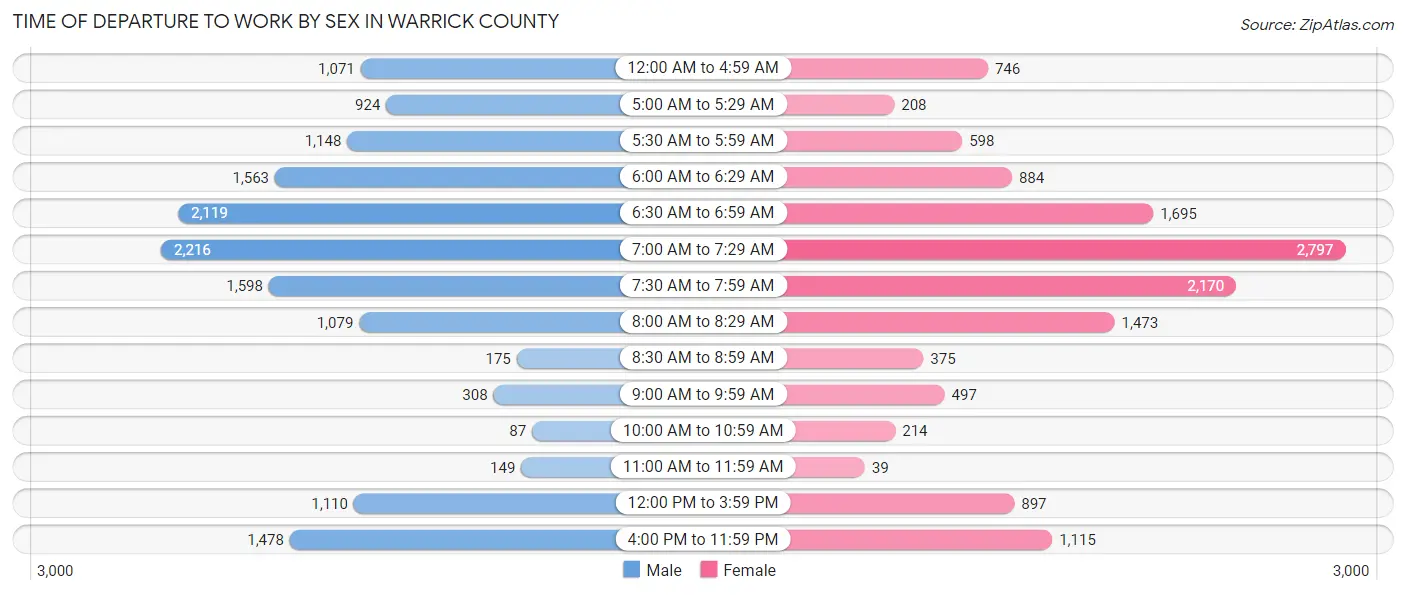
| Time of Departure | Male | Female |
| 12:00 AM to 4:59 AM | 1,071 (7.1%) | 746 (5.4%) |
| 5:00 AM to 5:29 AM | 924 (6.1%) | 208 (1.5%) |
| 5:30 AM to 5:59 AM | 1,148 (7.6%) | 598 (4.4%) |
| 6:00 AM to 6:29 AM | 1,563 (10.4%) | 884 (6.5%) |
| 6:30 AM to 6:59 AM | 2,119 (14.1%) | 1,695 (12.4%) |
| 7:00 AM to 7:29 AM | 2,216 (14.7%) | 2,797 (20.4%) |
| 7:30 AM to 7:59 AM | 1,598 (10.6%) | 2,170 (15.8%) |
| 8:00 AM to 8:29 AM | 1,079 (7.2%) | 1,473 (10.7%) |
| 8:30 AM to 8:59 AM | 175 (1.2%) | 375 (2.7%) |
| 9:00 AM to 9:59 AM | 308 (2.1%) | 497 (3.6%) |
| 10:00 AM to 10:59 AM | 87 (0.6%) | 214 (1.6%) |
| 11:00 AM to 11:59 AM | 149 (1.0%) | 39 (0.3%) |
| 12:00 PM to 3:59 PM | 1,110 (7.4%) | 897 (6.5%) |
| 4:00 PM to 11:59 PM | 1,478 (9.8%) | 1,115 (8.1%) |
| Total | 15,025 (100.0%) | 13,708 (100.0%) |
Housing Occupancy in Warrick County
Occupancy by Ownership in Warrick County
Of the total 24,540 dwellings in Warrick County, owner-occupied units account for 20,183 (82.3%), while renter-occupied units make up 4,357 (17.7%).
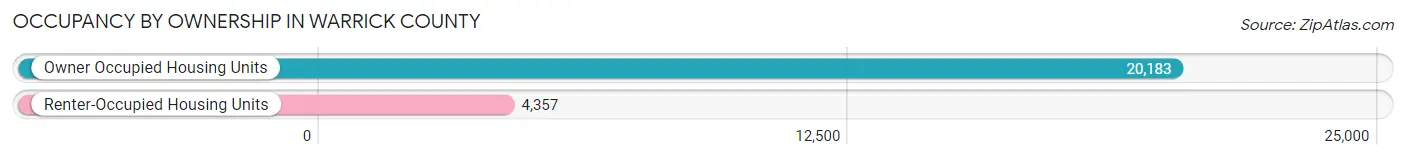
| Occupancy | # Housing Units | % Housing Units |
| Owner Occupied Housing Units | 20,183 | 82.3% |
| Renter-Occupied Housing Units | 4,357 | 17.7% |
| Total Occupied Housing Units | 24,540 | 100.0% |
Occupancy by Household Size in Warrick County
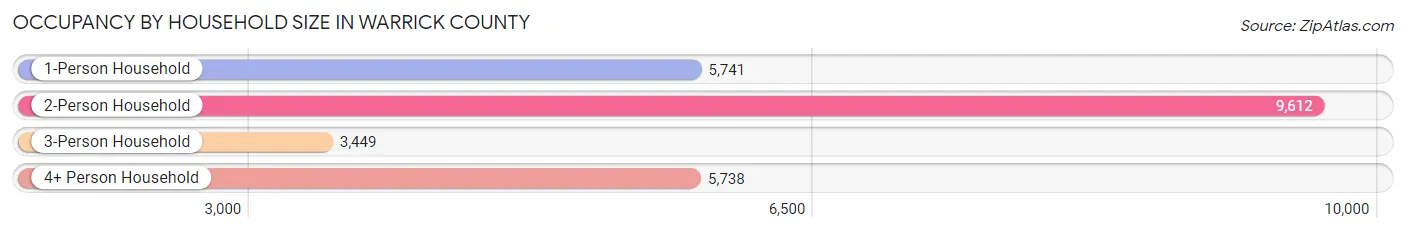
| Household Size | # Housing Units | % Housing Units |
| 1-Person Household | 5,741 | 23.4% |
| 2-Person Household | 9,612 | 39.2% |
| 3-Person Household | 3,449 | 14.1% |
| 4+ Person Household | 5,738 | 23.4% |
| Total Housing Units | 24,540 | 100.0% |
Occupancy by Ownership by Household Size in Warrick County
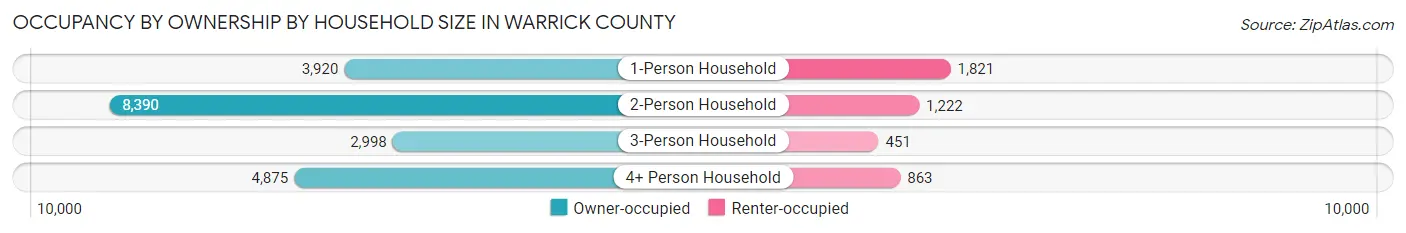
| Household Size | Owner-occupied | Renter-occupied |
| 1-Person Household | 3,920 (68.3%) | 1,821 (31.7%) |
| 2-Person Household | 8,390 (87.3%) | 1,222 (12.7%) |
| 3-Person Household | 2,998 (86.9%) | 451 (13.1%) |
| 4+ Person Household | 4,875 (85.0%) | 863 (15.0%) |
| Total Housing Units | 20,183 (82.3%) | 4,357 (17.7%) |
Occupancy by Educational Attainment in Warrick County
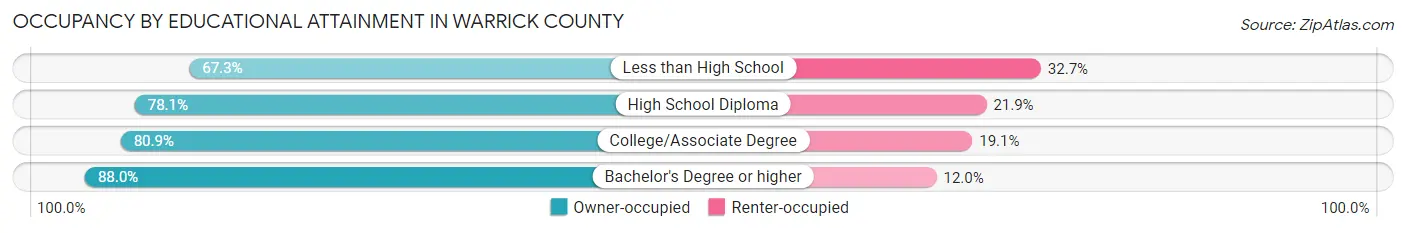
| Household Size | Owner-occupied | Renter-occupied |
| Less than High School | 769 (67.3%) | 373 (32.7%) |
| High School Diploma | 4,779 (78.1%) | 1,337 (21.9%) |
| College/Associate Degree | 6,605 (80.9%) | 1,555 (19.1%) |
| Bachelor's Degree or higher | 8,030 (88.0%) | 1,092 (12.0%) |
Occupancy by Age of Householder in Warrick County
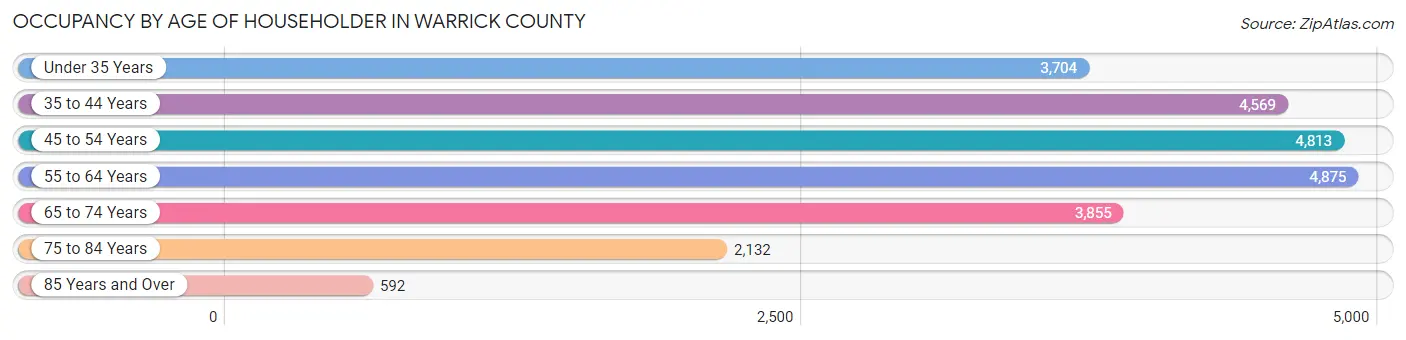
| Age Bracket | # Households | % Households |
| Under 35 Years | 3,704 | 15.1% |
| 35 to 44 Years | 4,569 | 18.6% |
| 45 to 54 Years | 4,813 | 19.6% |
| 55 to 64 Years | 4,875 | 19.9% |
| 65 to 74 Years | 3,855 | 15.7% |
| 75 to 84 Years | 2,132 | 8.7% |
| 85 Years and Over | 592 | 2.4% |
| Total | 24,540 | 100.0% |
Housing Finances in Warrick County
Median Income by Occupancy in Warrick County
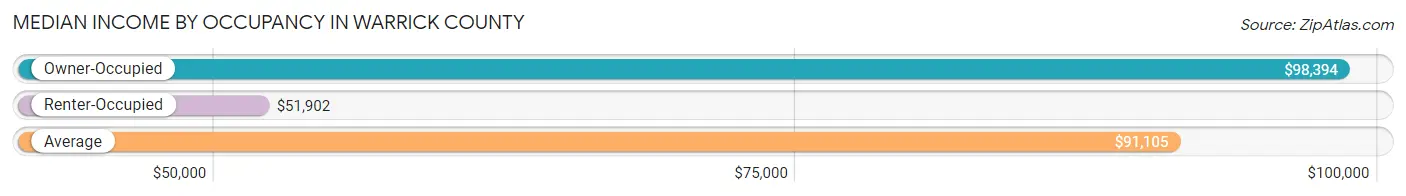
| Occupancy Type | # Households | Median Income |
| Owner-Occupied | 20,183 (82.3%) | $98,394 |
| Renter-Occupied | 4,357 (17.7%) | $51,902 |
| Average | 24,540 (100.0%) | $91,105 |
Occupancy by Householder Income Bracket in Warrick County
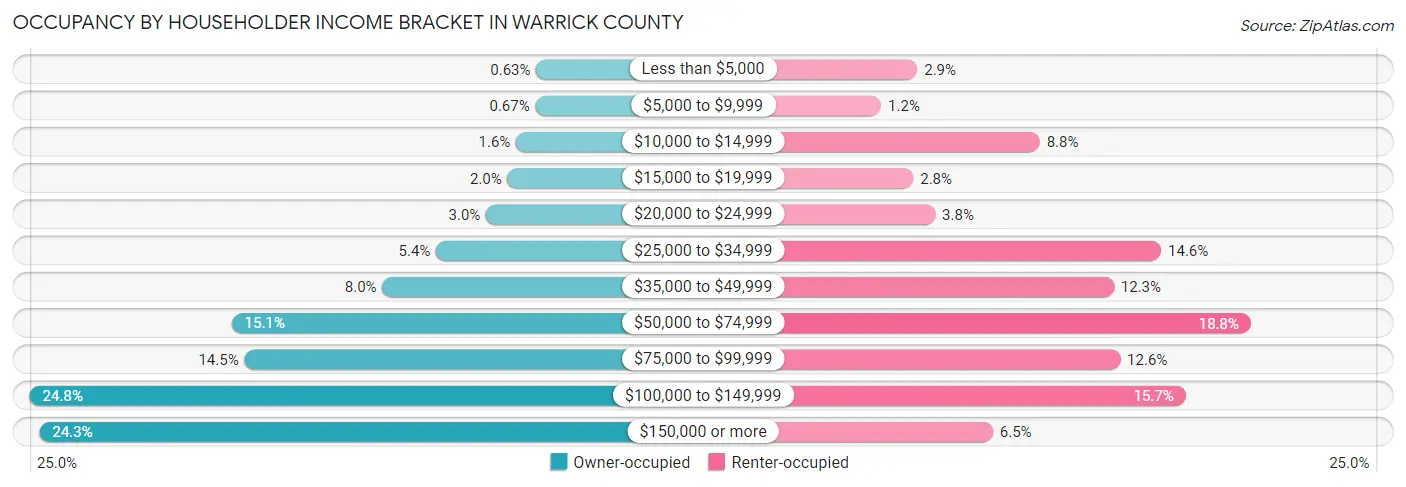
| Income Bracket | Owner-occupied | Renter-occupied |
| Less than $5,000 | 127 (0.6%) | 128 (2.9%) |
| $5,000 to $9,999 | 136 (0.7%) | 53 (1.2%) |
| $10,000 to $14,999 | 320 (1.6%) | 382 (8.8%) |
| $15,000 to $19,999 | 404 (2.0%) | 120 (2.8%) |
| $20,000 to $24,999 | 609 (3.0%) | 165 (3.8%) |
| $25,000 to $34,999 | 1,090 (5.4%) | 634 (14.5%) |
| $35,000 to $49,999 | 1,607 (8.0%) | 536 (12.3%) |
| $50,000 to $74,999 | 3,056 (15.1%) | 820 (18.8%) |
| $75,000 to $99,999 | 2,932 (14.5%) | 549 (12.6%) |
| $100,000 to $149,999 | 4,997 (24.8%) | 685 (15.7%) |
| $150,000 or more | 4,905 (24.3%) | 285 (6.5%) |
| Total | 20,183 (100.0%) | 4,357 (100.0%) |
Monthly Housing Cost Tiers in Warrick County
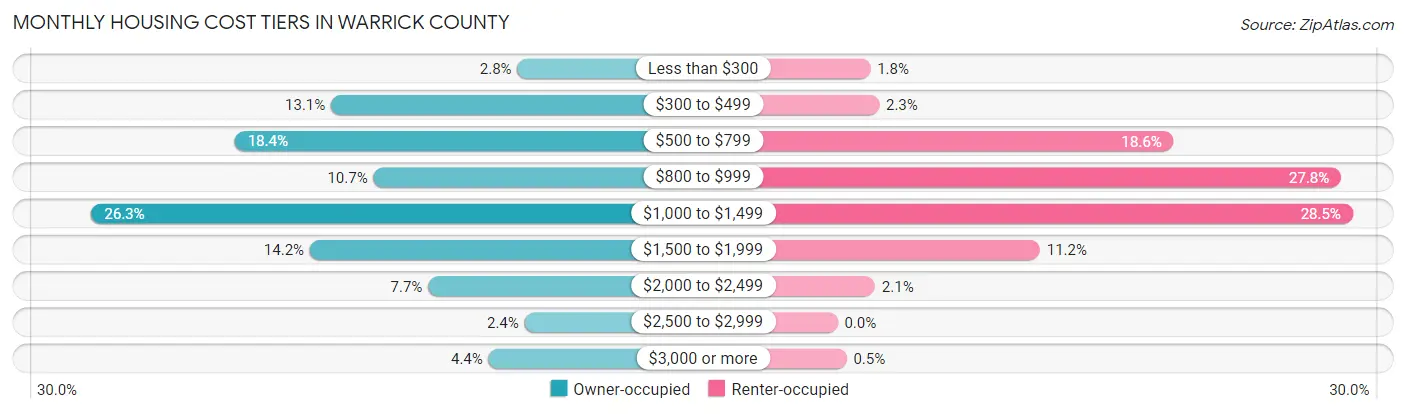
| Monthly Cost | Owner-occupied | Renter-occupied |
| Less than $300 | 561 (2.8%) | 79 (1.8%) |
| $300 to $499 | 2,637 (13.1%) | 100 (2.3%) |
| $500 to $799 | 3,712 (18.4%) | 809 (18.6%) |
| $800 to $999 | 2,166 (10.7%) | 1,212 (27.8%) |
| $1,000 to $1,499 | 5,311 (26.3%) | 1,240 (28.5%) |
| $1,500 to $1,999 | 2,875 (14.2%) | 487 (11.2%) |
| $2,000 to $2,499 | 1,557 (7.7%) | 90 (2.1%) |
| $2,500 to $2,999 | 481 (2.4%) | 0 (0.0%) |
| $3,000 or more | 883 (4.4%) | 22 (0.5%) |
| Total | 20,183 (100.0%) | 4,357 (100.0%) |
Physical Housing Characteristics in Warrick County
Housing Structures in Warrick County
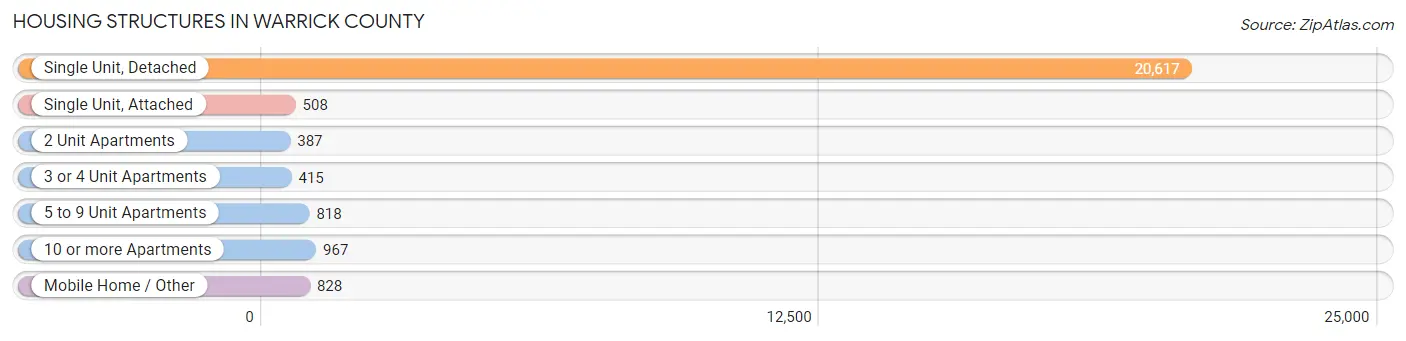
| Structure Type | # Housing Units | % Housing Units |
| Single Unit, Detached | 20,617 | 84.0% |
| Single Unit, Attached | 508 | 2.1% |
| 2 Unit Apartments | 387 | 1.6% |
| 3 or 4 Unit Apartments | 415 | 1.7% |
| 5 to 9 Unit Apartments | 818 | 3.3% |
| 10 or more Apartments | 967 | 3.9% |
| Mobile Home / Other | 828 | 3.4% |
| Total | 24,540 | 100.0% |
Housing Structures by Occupancy in Warrick County
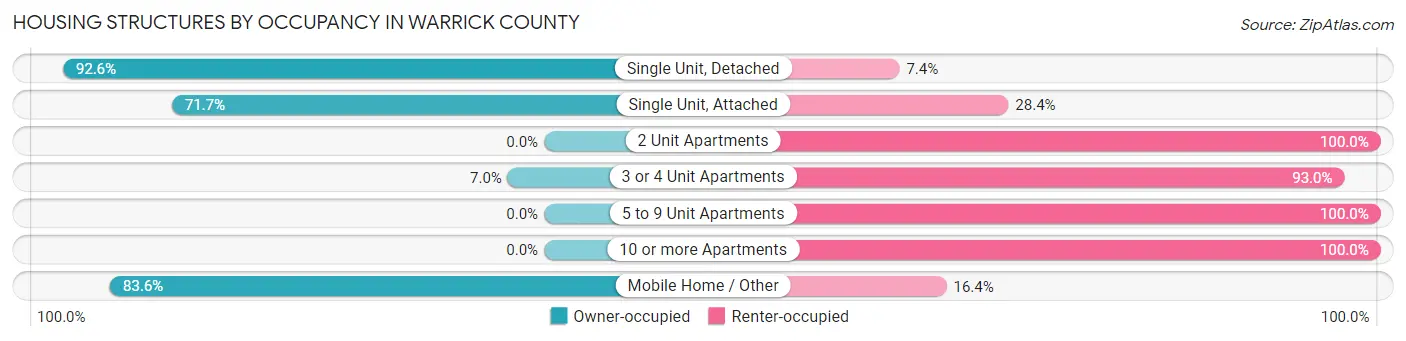
| Structure Type | Owner-occupied | Renter-occupied |
| Single Unit, Detached | 19,098 (92.6%) | 1,519 (7.4%) |
| Single Unit, Attached | 364 (71.7%) | 144 (28.3%) |
| 2 Unit Apartments | 0 (0.0%) | 387 (100.0%) |
| 3 or 4 Unit Apartments | 29 (7.0%) | 386 (93.0%) |
| 5 to 9 Unit Apartments | 0 (0.0%) | 818 (100.0%) |
| 10 or more Apartments | 0 (0.0%) | 967 (100.0%) |
| Mobile Home / Other | 692 (83.6%) | 136 (16.4%) |
| Total | 20,183 (82.3%) | 4,357 (17.7%) |
Housing Structures by Number of Rooms in Warrick County
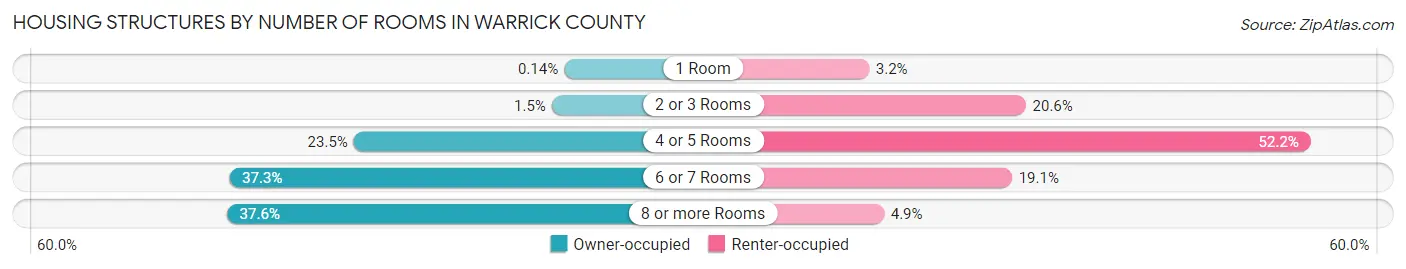
| Number of Rooms | Owner-occupied | Renter-occupied |
| 1 Room | 28 (0.1%) | 140 (3.2%) |
| 2 or 3 Rooms | 302 (1.5%) | 898 (20.6%) |
| 4 or 5 Rooms | 4,739 (23.5%) | 2,276 (52.2%) |
| 6 or 7 Rooms | 7,531 (37.3%) | 831 (19.1%) |
| 8 or more Rooms | 7,583 (37.6%) | 212 (4.9%) |
| Total | 20,183 (100.0%) | 4,357 (100.0%) |
Housing Structure by Heating Type in Warrick County
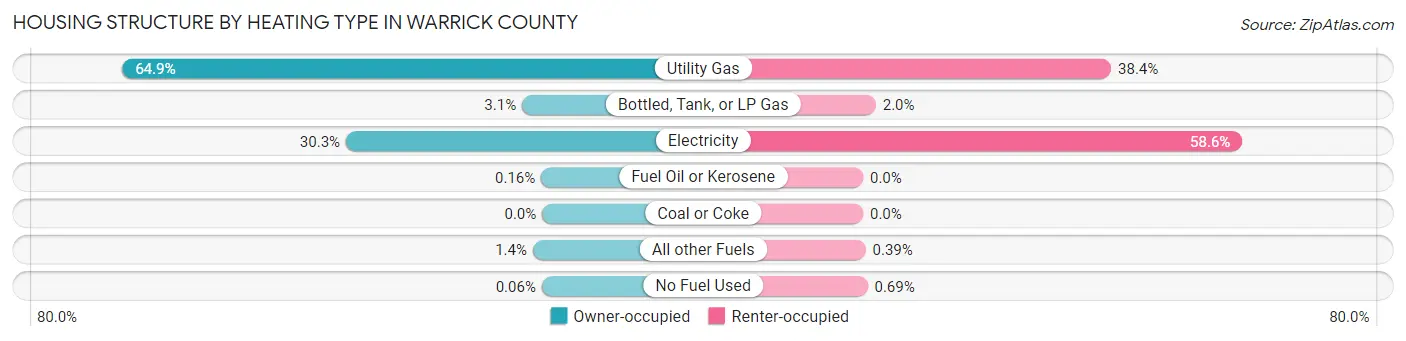
| Heating Type | Owner-occupied | Renter-occupied |
| Utility Gas | 13,098 (64.9%) | 1,671 (38.4%) |
| Bottled, Tank, or LP Gas | 628 (3.1%) | 86 (2.0%) |
| Electricity | 6,122 (30.3%) | 2,553 (58.6%) |
| Fuel Oil or Kerosene | 32 (0.2%) | 0 (0.0%) |
| Coal or Coke | 0 (0.0%) | 0 (0.0%) |
| All other Fuels | 291 (1.4%) | 17 (0.4%) |
| No Fuel Used | 12 (0.1%) | 30 (0.7%) |
| Total | 20,183 (100.0%) | 4,357 (100.0%) |
Household Vehicle Usage in Warrick County
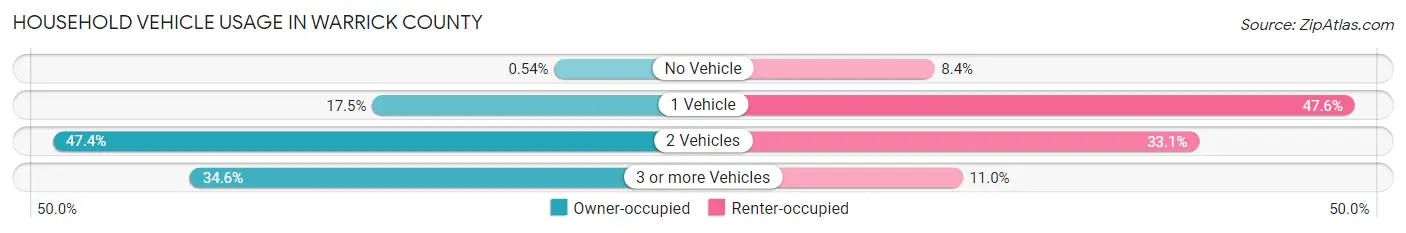
| Vehicles per Household | Owner-occupied | Renter-occupied |
| No Vehicle | 108 (0.5%) | 364 (8.4%) |
| 1 Vehicle | 3,540 (17.5%) | 2,074 (47.6%) |
| 2 Vehicles | 9,557 (47.3%) | 1,441 (33.1%) |
| 3 or more Vehicles | 6,978 (34.6%) | 478 (11.0%) |
| Total | 20,183 (100.0%) | 4,357 (100.0%) |
Real Estate & Mortgages in Warrick County
Real Estate and Mortgage Overview in Warrick County
| Characteristic | Without Mortgage | With Mortgage |
| Housing Units | 7,197 | 12,986 |
| Median Property Value | $208,500 | $219,200 |
| Median Household Income | $72,887 | $3,651 |
| Monthly Housing Costs | $541 | $863 |
| Real Estate Taxes | $1,344 | $177 |
Property Value by Mortgage Status in Warrick County
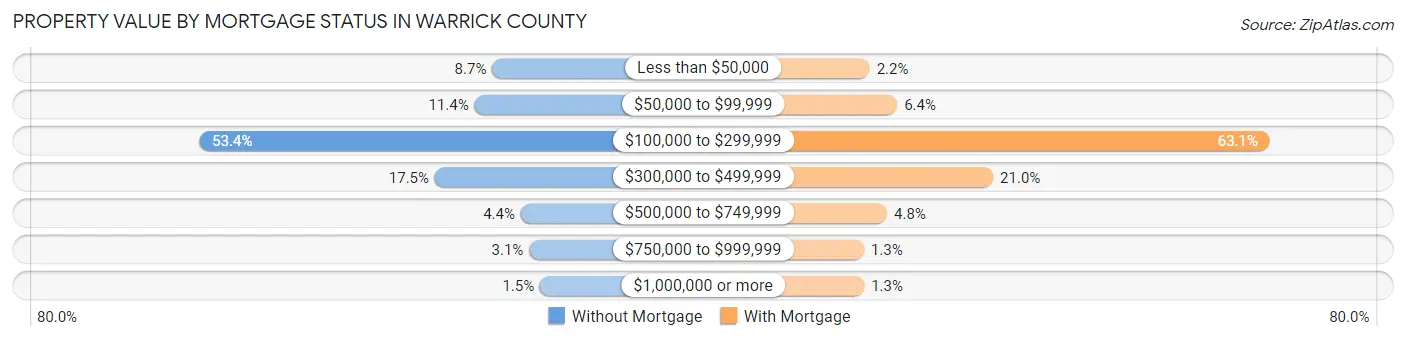
| Property Value | Without Mortgage | With Mortgage |
| Less than $50,000 | 629 (8.7%) | 280 (2.2%) |
| $50,000 to $99,999 | 823 (11.4%) | 824 (6.4%) |
| $100,000 to $299,999 | 3,843 (53.4%) | 8,197 (63.1%) |
| $300,000 to $499,999 | 1,258 (17.5%) | 2,723 (21.0%) |
| $500,000 to $749,999 | 316 (4.4%) | 624 (4.8%) |
| $750,000 to $999,999 | 224 (3.1%) | 166 (1.3%) |
| $1,000,000 or more | 104 (1.5%) | 172 (1.3%) |
| Total | 7,197 (100.0%) | 12,986 (100.0%) |
Household Income by Mortgage Status in Warrick County
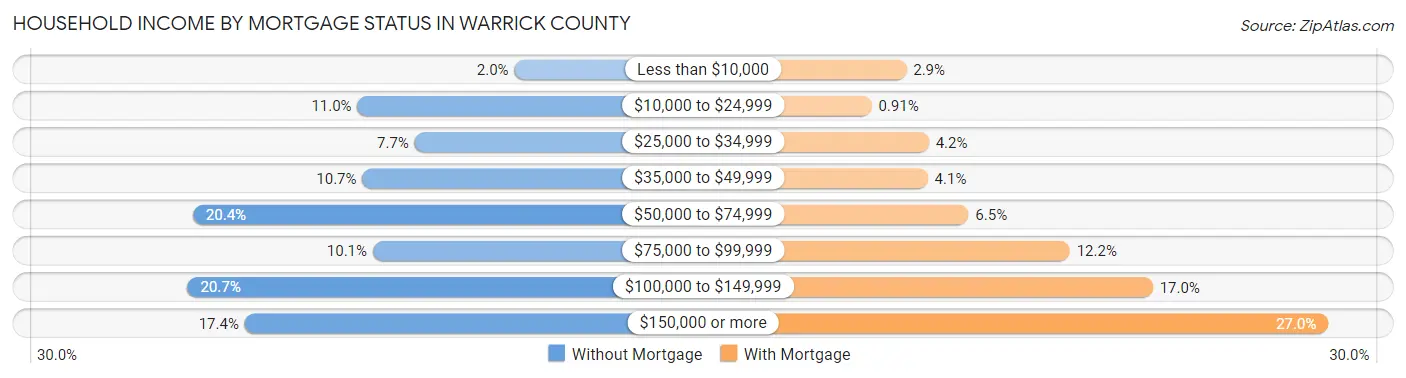
| Household Income | Without Mortgage | With Mortgage |
| Less than $10,000 | 145 (2.0%) | 377 (2.9%) |
| $10,000 to $24,999 | 790 (11.0%) | 118 (0.9%) |
| $25,000 to $34,999 | 555 (7.7%) | 543 (4.2%) |
| $35,000 to $49,999 | 770 (10.7%) | 535 (4.1%) |
| $50,000 to $74,999 | 1,467 (20.4%) | 837 (6.5%) |
| $75,000 to $99,999 | 727 (10.1%) | 1,589 (12.2%) |
| $100,000 to $149,999 | 1,489 (20.7%) | 2,205 (17.0%) |
| $150,000 or more | 1,254 (17.4%) | 3,508 (27.0%) |
| Total | 7,197 (100.0%) | 12,986 (100.0%) |
Property Value to Household Income Ratio in Warrick County
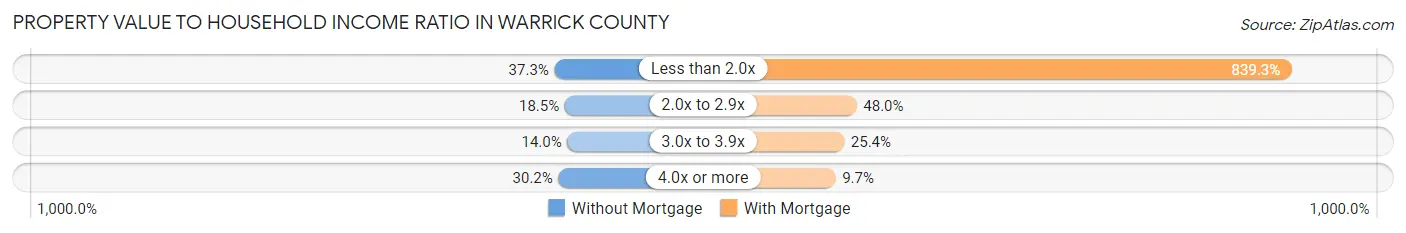
| Value-to-Income Ratio | Without Mortgage | With Mortgage |
| Less than 2.0x | 2,687 (37.3%) | 108,993 (839.3%) |
| 2.0x to 2.9x | 1,329 (18.5%) | 6,235 (48.0%) |
| 3.0x to 3.9x | 1,006 (14.0%) | 3,293 (25.4%) |
| 4.0x or more | 2,173 (30.2%) | 1,253 (9.7%) |
| Total | 7,197 (100.0%) | 12,986 (100.0%) |
Real Estate Taxes by Mortgage Status in Warrick County

| Property Taxes | Without Mortgage | With Mortgage |
| Less than $800 | 1,957 (27.2%) | 0 (0.0%) |
| $800 to $1,499 | 2,040 (28.3%) | 2,471 (19.0%) |
| $800 to $1,499 | 3,133 (43.5%) | 4,417 (34.0%) |
| Total | 7,197 (100.0%) | 12,986 (100.0%) |
Health & Disability in Warrick County
Health Insurance Coverage by Age in Warrick County
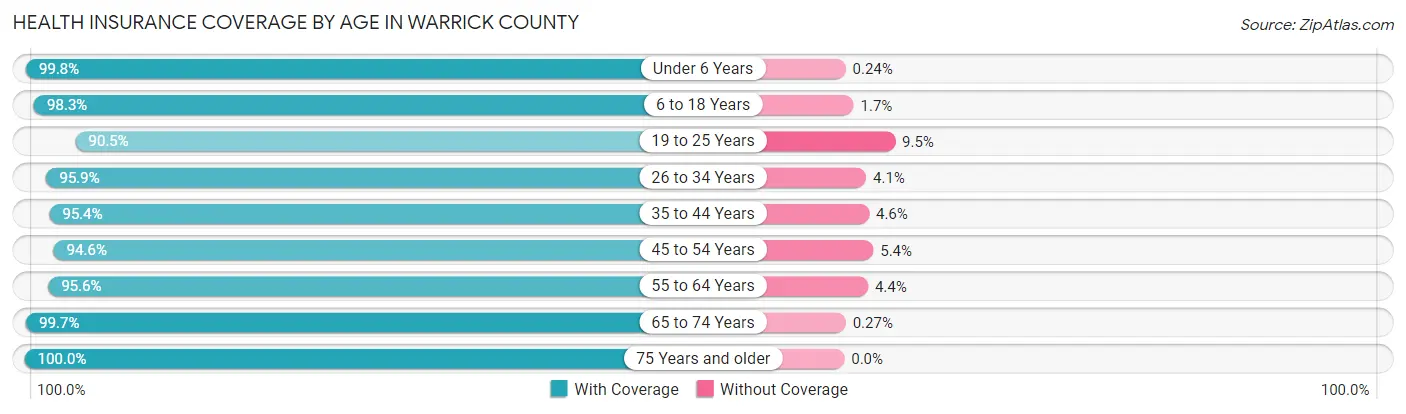
| Age Bracket | With Coverage | Without Coverage |
| Under 6 Years | 4,152 (99.8%) | 10 (0.2%) |
| 6 to 18 Years | 11,370 (98.3%) | 201 (1.7%) |
| 19 to 25 Years | 4,256 (90.5%) | 445 (9.5%) |
| 26 to 34 Years | 5,905 (95.9%) | 250 (4.1%) |
| 35 to 44 Years | 8,291 (95.4%) | 401 (4.6%) |
| 45 to 54 Years | 7,993 (94.6%) | 457 (5.4%) |
| 55 to 64 Years | 8,150 (95.6%) | 376 (4.4%) |
| 65 to 74 Years | 6,659 (99.7%) | 18 (0.3%) |
| 75 Years and older | 4,303 (100.0%) | 0 (0.0%) |
| Total | 61,079 (96.6%) | 2,158 (3.4%) |
Health Insurance Coverage by Citizenship Status in Warrick County

| Citizenship Status | With Coverage | Without Coverage |
| Native Born | 4,152 (99.8%) | 10 (0.2%) |
| Foreign Born, Citizen | 11,370 (98.3%) | 201 (1.7%) |
| Foreign Born, not a Citizen | 4,256 (90.5%) | 445 (9.5%) |
Health Insurance Coverage by Household Income in Warrick County
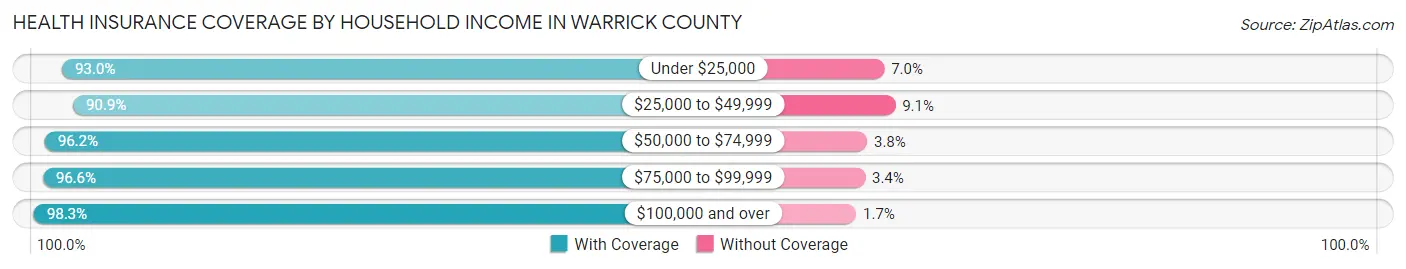
| Household Income | With Coverage | Without Coverage |
| Under $25,000 | 3,820 (93.0%) | 288 (7.0%) |
| $25,000 to $49,999 | 6,284 (90.9%) | 627 (9.1%) |
| $50,000 to $74,999 | 8,176 (96.2%) | 322 (3.8%) |
| $75,000 to $99,999 | 9,166 (96.6%) | 325 (3.4%) |
| $100,000 and over | 33,568 (98.3%) | 593 (1.7%) |
Public vs Private Health Insurance Coverage by Age in Warrick County
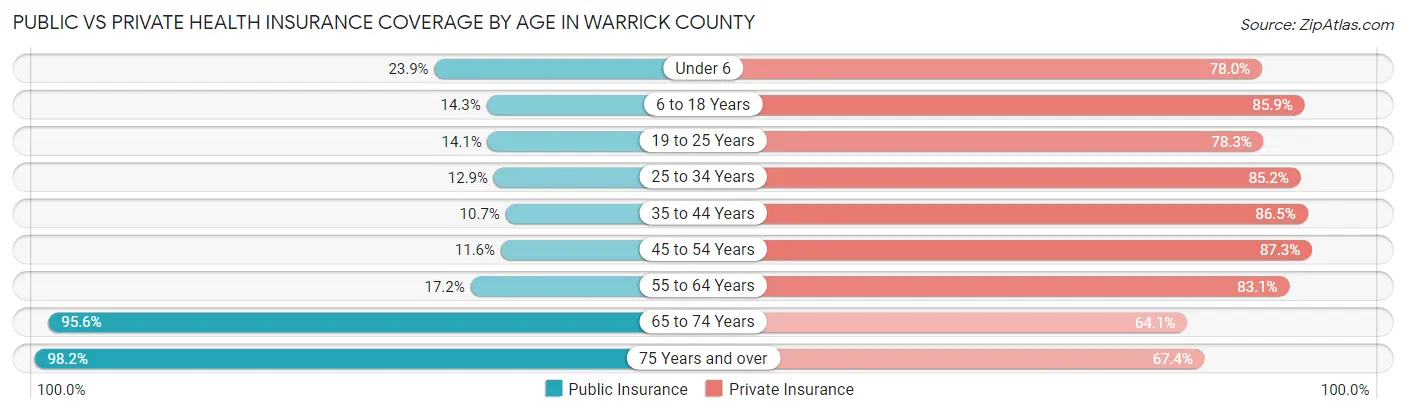
| Age Bracket | Public Insurance | Private Insurance |
| Under 6 | 996 (23.9%) | 3,245 (78.0%) |
| 6 to 18 Years | 1,649 (14.2%) | 9,941 (85.9%) |
| 19 to 25 Years | 661 (14.1%) | 3,681 (78.3%) |
| 25 to 34 Years | 794 (12.9%) | 5,242 (85.2%) |
| 35 to 44 Years | 931 (10.7%) | 7,514 (86.5%) |
| 45 to 54 Years | 980 (11.6%) | 7,374 (87.3%) |
| 55 to 64 Years | 1,469 (17.2%) | 7,083 (83.1%) |
| 65 to 74 Years | 6,382 (95.6%) | 4,280 (64.1%) |
| 75 Years and over | 4,224 (98.2%) | 2,899 (67.4%) |
| Total | 18,086 (28.6%) | 51,259 (81.1%) |
Disability Status by Sex by Age in Warrick County
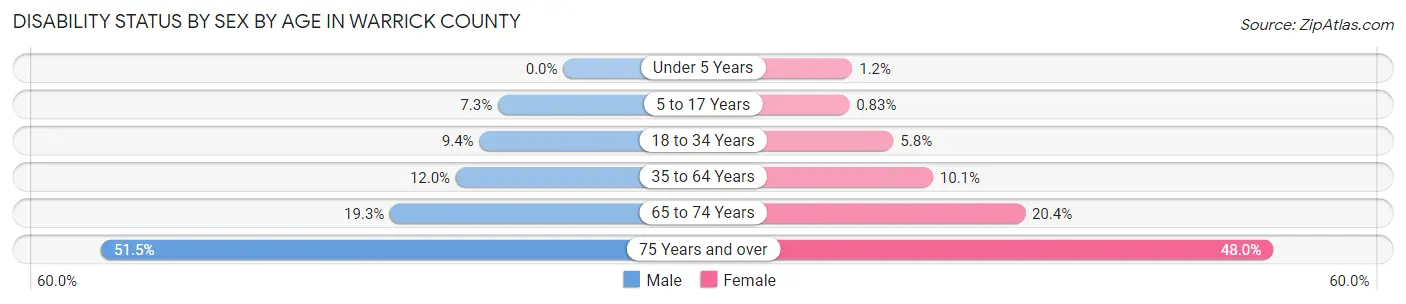
| Age Bracket | Male | Female |
| Under 5 Years | 0 (0.0%) | 22 (1.2%) |
| 5 to 17 Years | 411 (7.3%) | 47 (0.8%) |
| 18 to 34 Years | 553 (9.3%) | 328 (5.8%) |
| 35 to 64 Years | 1,530 (12.0%) | 1,306 (10.1%) |
| 65 to 74 Years | 607 (19.3%) | 720 (20.4%) |
| 75 Years and over | 961 (51.5%) | 1,170 (48.0%) |
Disability Class by Sex by Age in Warrick County
Disability Class: Hearing Difficulty
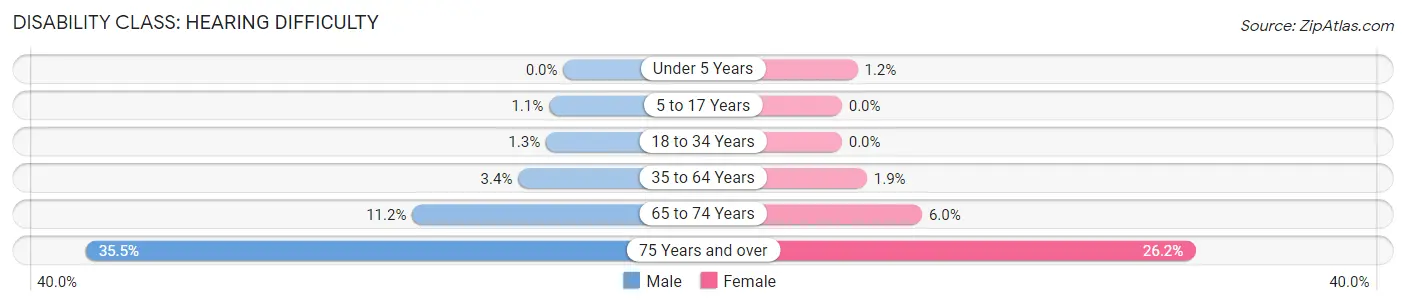
| Age Bracket | Male | Female |
| Under 5 Years | 0 (0.0%) | 22 (1.2%) |
| 5 to 17 Years | 60 (1.1%) | 0 (0.0%) |
| 18 to 34 Years | 76 (1.3%) | 0 (0.0%) |
| 35 to 64 Years | 429 (3.4%) | 239 (1.9%) |
| 65 to 74 Years | 353 (11.2%) | 210 (5.9%) |
| 75 Years and over | 662 (35.5%) | 639 (26.2%) |
Disability Class: Vision Difficulty
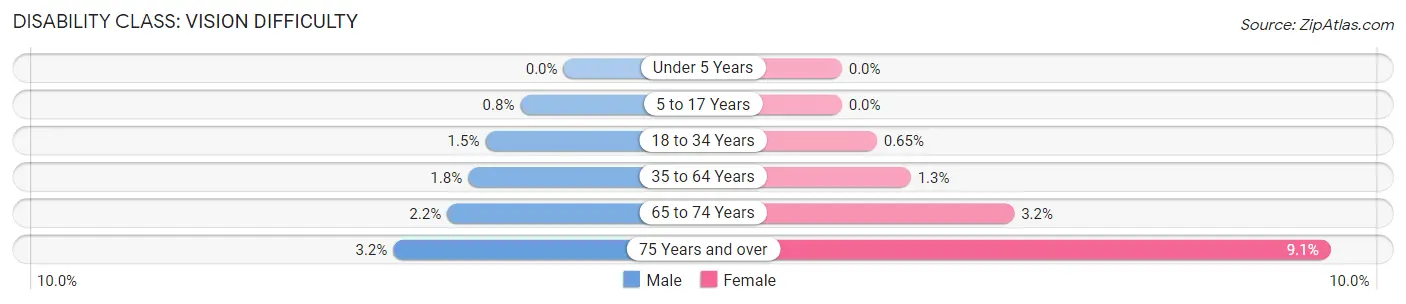
| Age Bracket | Male | Female |
| Under 5 Years | 0 (0.0%) | 0 (0.0%) |
| 5 to 17 Years | 45 (0.8%) | 0 (0.0%) |
| 18 to 34 Years | 86 (1.5%) | 37 (0.6%) |
| 35 to 64 Years | 227 (1.8%) | 165 (1.3%) |
| 65 to 74 Years | 68 (2.2%) | 113 (3.2%) |
| 75 Years and over | 59 (3.2%) | 221 (9.1%) |
Disability Class: Cognitive Difficulty
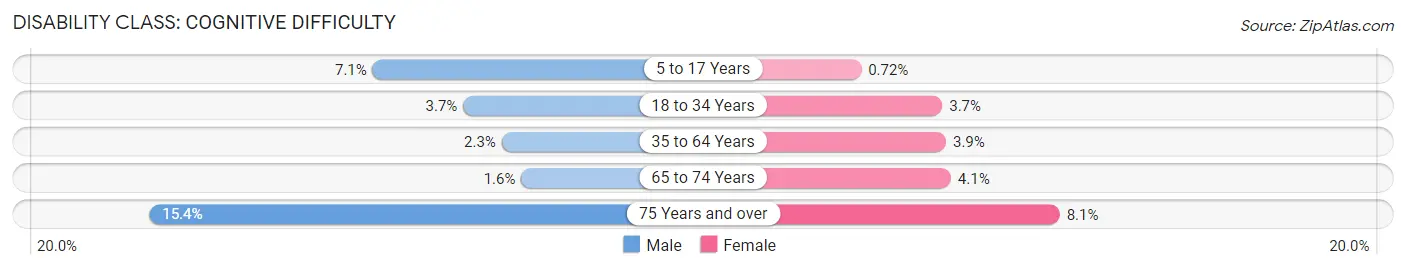
| Age Bracket | Male | Female |
| 5 to 17 Years | 400 (7.1%) | 41 (0.7%) |
| 18 to 34 Years | 220 (3.7%) | 213 (3.7%) |
| 35 to 64 Years | 293 (2.3%) | 498 (3.9%) |
| 65 to 74 Years | 49 (1.6%) | 143 (4.1%) |
| 75 Years and over | 287 (15.4%) | 197 (8.1%) |
Disability Class: Ambulatory Difficulty
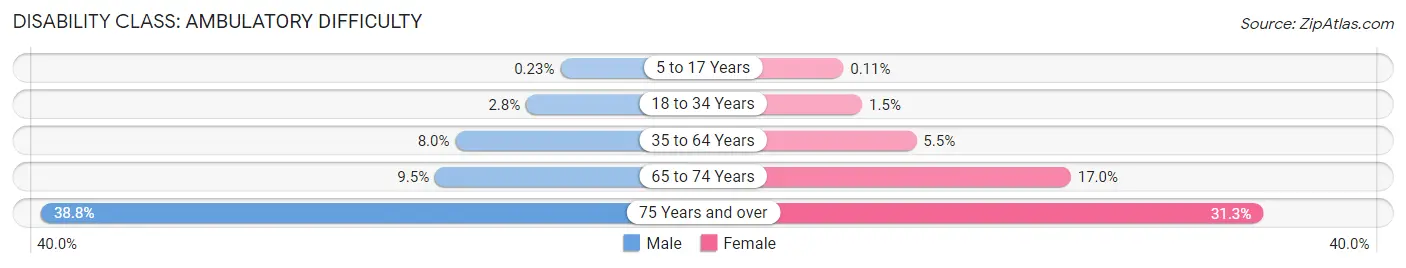
| Age Bracket | Male | Female |
| 5 to 17 Years | 13 (0.2%) | 6 (0.1%) |
| 18 to 34 Years | 164 (2.8%) | 86 (1.5%) |
| 35 to 64 Years | 1,026 (8.0%) | 713 (5.5%) |
| 65 to 74 Years | 300 (9.5%) | 600 (17.0%) |
| 75 Years and over | 724 (38.8%) | 762 (31.3%) |
Disability Class: Self-Care Difficulty
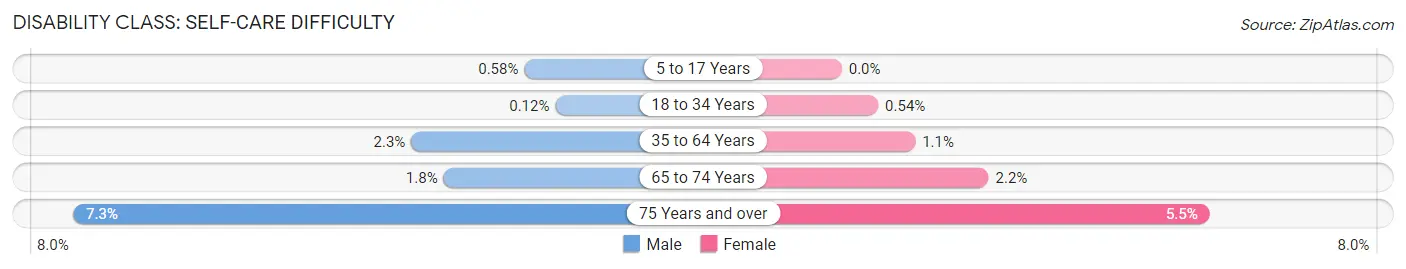
| Age Bracket | Male | Female |
| 5 to 17 Years | 33 (0.6%) | 0 (0.0%) |
| 18 to 34 Years | 7 (0.1%) | 31 (0.5%) |
| 35 to 64 Years | 289 (2.3%) | 141 (1.1%) |
| 65 to 74 Years | 56 (1.8%) | 77 (2.2%) |
| 75 Years and over | 136 (7.3%) | 133 (5.5%) |
Technology Access in Warrick County
Computing Device Access in Warrick County
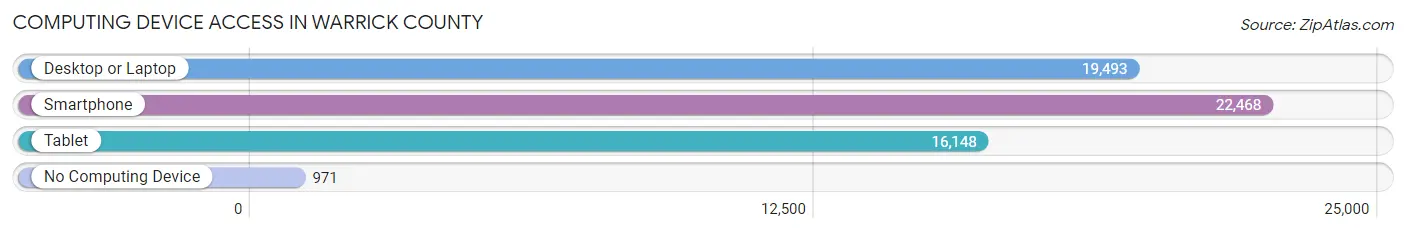
| Device Type | # Households | % Households |
| Desktop or Laptop | 19,493 | 79.4% |
| Smartphone | 22,468 | 91.6% |
| Tablet | 16,148 | 65.8% |
| No Computing Device | 971 | 4.0% |
| Total | 24,540 | 100.0% |
Internet Access in Warrick County
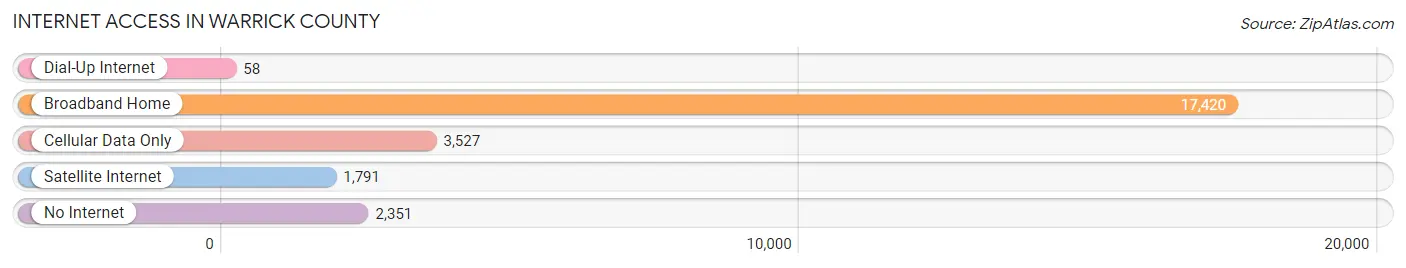
| Internet Type | # Households | % Households |
| Dial-Up Internet | 58 | 0.2% |
| Broadband Home | 17,420 | 71.0% |
| Cellular Data Only | 3,527 | 14.4% |
| Satellite Internet | 1,791 | 7.3% |
| No Internet | 2,351 | 9.6% |
| Total | 24,540 | 100.0% |
Warrick County Summary
Warrick County is located in the southwestern corner of Indiana, and is part of the Evansville Metropolitan Statistical Area. It is bordered by Posey County to the north, Spencer County to the east, Gibson County to the south, and Vanderburgh County to the west. The county seat is Boonville, and the county was named for Captain Jacob Warrick, a Revolutionary War veteran.
Geography
Warrick County covers an area of 437 square miles, of which 434 square miles is land and 3 square miles is water. The county is located in the southwestern corner of Indiana, and is part of the Evansville Metropolitan Statistical Area. It is bordered by Posey County to the north, Spencer County to the east, Gibson County to the south, and Vanderburgh County to the west. The county is mostly flat, with some rolling hills in the northern part. The highest point in the county is located in the northern part, at an elevation of 830 feet. The county is drained by the Wabash River, which forms the western border of the county.
Demographics
As of the 2010 census, there were 59,689 people, 23,717 households, and 16,845 families living in the county. The population density was 137.3 people per square mile. The racial makeup of the county was 94.2% White, 2.7% African American, 0.3% Native American, 0.7% Asian, 0.7% from other races, and 1.4% from two or more races. Hispanic or Latino of any race were 2.2% of the population.
The median income for a household in the county was $45,945, and the median income for a family was $54,945. The per capita income for the county was $22,845. About 8.2% of families and 10.7% of the population were below the poverty line, including 15.2% of those under age 18 and 8.2% of those age 65 or over.
Economy
Warrick County has a diverse economy, with a mix of manufacturing, agriculture, and services. The county is home to several large employers, including Toyota Motor Manufacturing Indiana, Alcoa Warrick Operations, and Berry Plastics. The county is also home to several smaller businesses, including several wineries, a distillery, and a brewery.
Agriculture is an important part of the county's economy, with corn, soybeans, and wheat being the main crops. Livestock production is also important, with beef cattle, dairy cattle, and hogs being the main animals raised.
The county is also home to several tourist attractions, including the Holiday World & Splashin' Safari amusement park, the Lincoln Boyhood National Memorial, and the Angel Mounds State Historic Site.
Conclusion
Warrick County is a diverse county located in the southwestern corner of Indiana. It is home to a mix of manufacturing, agriculture, and services, and is also home to several tourist attractions. The county has a population of 59,689, and the median income for a household is $45,945. Warrick County is an important part of the Evansville Metropolitan Statistical Area, and is an important contributor to the region's economy.
Common Questions
What is the Total Population of Warrick County?
Total Population of Warrick County is 64,065.
What is the Total Male Population of Warrick County?
Total Male Population of Warrick County is 31,526.
What is the Total Female Population of Warrick County?
Total Female Population of Warrick County is 32,539.
What is the Ratio of Males per 100 Females in Warrick County?
There are 96.89 Males per 100 Females in Warrick County.
What is the Ratio of Females per 100 Males in Warrick County?
There are 103.21 Females per 100 Males in Warrick County.
What is the Median Population Age in Warrick County?
Median Population Age in Warrick County is 41.7 Years.
What is the Average Family Size in Warrick County
Average Family Size in Warrick County is 3.1 People.
What is the Average Household Size in Warrick County
Average Household Size in Warrick County is 2.6 People.
What is Per Capita Income in Warrick County?
Per Capita income in Warrick County is $46,734.
What is the Median Family Income in Warrick County?
Median Family Income in Warrick County is $108,457.
What is the Median Household income in Warrick County?
Median Household Income in Warrick County is $91,105.
What is Income or Wage Gap in Warrick County?
Income or Wage Gap in Warrick County is 36.8%.
Women in Warrick County earn 63.2 cents for every dollar earned by a man.
What is Family Income Deficit in Warrick County?
Family Income Deficit in Warrick County is $9,040.
Families that are below poverty line in Warrick County earn $9,040 less on average than the poverty threshold level.
What is Inequality or Gini Index in Warrick County?
Inequality or Gini Index in Warrick County is 0.46.
How Large is the Labor Force in Warrick County?
There are 32,691 People in the Labor Forcein in Warrick County.
What is the Percentage of People in the Labor Force in Warrick County?
63.9% of People are in the Labor Force in Warrick County.
What is the Unemployment Rate in Warrick County?
Unemployment Rate in Warrick County is 3.3%.