Wabash County, IN
Wabash County Map

Wabash County Overview
31,032
TOTAL POPULATION
15,174
MALE POPULATION
15,858
FEMALE POPULATION
95.69
MALES / 100 FEMALES
104.51
FEMALES / 100 MALES
42.8
MEDIAN AGE
2.9
AVG FAMILY SIZE
2.3
AVG HOUSEHOLD SIZE
$32,763
PER CAPITA INCOME
$78,110
AVG FAMILY INCOME
$66,194
AVG HOUSEHOLD INCOME
43.9%
WAGE / INCOME GAP [ % ]
56.1¢/ $1
WAGE / INCOME GAP [ $ ]
$10,415
FAMILY INCOME DEFICIT
0.41
INEQUALITY / GINI INDEX
14,934
LABOR FORCE [ PEOPLE ]
59.2%
PERCENT IN LABOR FORCE
3.5%
UNEMPLOYMENT RATE
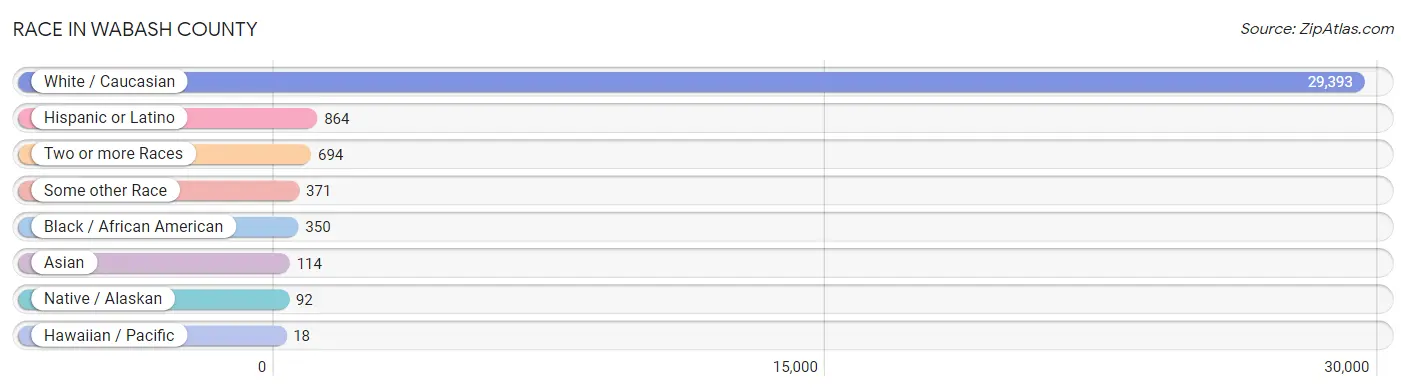
Race in Wabash County
The most populous races in Wabash County are White / Caucasian (29,393 | 94.7%), Hispanic or Latino (864 | 2.8%), and Two or more Races (694 | 2.2%).
| Race | # Population | % Population |
| Asian | 114 | 0.4% |
| Black / African American | 350 | 1.1% |
| Hawaiian / Pacific | 18 | 0.1% |
| Hispanic or Latino | 864 | 2.8% |
| Native / Alaskan | 92 | 0.3% |
| White / Caucasian | 29,393 | 94.7% |
| Two or more Races | 694 | 2.2% |
| Some other Race | 371 | 1.2% |
| Total | 31,032 | 100.0% |
Ancestry in Wabash County
The most populous ancestries reported in Wabash County are German (7,901 | 25.5%), English (4,136 | 13.3%), Irish (3,416 | 11.0%), American (2,930 | 9.4%), and European (721 | 2.3%), together accounting for 61.6% of all Wabash County residents.

| Ancestry | # Population | % Population |
| African | 11 | 0.0% |
| American | 2,930 | 9.4% |
| Arab | 31 | 0.1% |
| Austrian | 1 | 0.0% |
| Bahamian | 5 | 0.0% |
| Belgian | 128 | 0.4% |
| Bhutanese | 79 | 0.3% |
| British | 105 | 0.3% |
| Cambodian | 8 | 0.0% |
| Canadian | 168 | 0.5% |
| Central American | 197 | 0.6% |
| Cherokee | 26 | 0.1% |
| Costa Rican | 14 | 0.1% |
| Cuban | 55 | 0.2% |
| Czech | 1 | 0.0% |
| Czechoslovakian | 25 | 0.1% |
| Danish | 26 | 0.1% |
| Dutch | 413 | 1.3% |
| Eastern European | 22 | 0.1% |
| Ecuadorian | 4 | 0.0% |
| English | 4,136 | 13.3% |
| European | 721 | 2.3% |
| Filipino | 10 | 0.0% |
| Finnish | 9 | 0.0% |
| French | 532 | 1.7% |
| French Canadian | 100 | 0.3% |
| German | 7,901 | 25.5% |
| Greek | 45 | 0.2% |
| Guatemalan | 158 | 0.5% |
| Hungarian | 71 | 0.2% |
| Indian (Asian) | 69 | 0.2% |
| Indonesian | 9 | 0.0% |
| Iraqi | 18 | 0.1% |
| Irish | 3,416 | 11.0% |
| Italian | 426 | 1.4% |
| Korean | 22 | 0.1% |
| Liberian | 5 | 0.0% |
| Lithuanian | 12 | 0.0% |
| Mexican | 532 | 1.7% |
| Northern European | 26 | 0.1% |
| Norwegian | 308 | 1.0% |
| Pennsylvania German | 16 | 0.1% |
| Polish | 270 | 0.9% |
| Portuguese | 75 | 0.2% |
| Puerto Rican | 13 | 0.0% |
| Romanian | 23 | 0.1% |
| Russian | 51 | 0.2% |
| Salvadoran | 25 | 0.1% |
| Scandinavian | 26 | 0.1% |
| Scotch-Irish | 257 | 0.8% |
| Scottish | 538 | 1.7% |
| Sioux | 67 | 0.2% |
| Slavic | 13 | 0.0% |
| Slovak | 16 | 0.1% |
| South American | 4 | 0.0% |
| Spaniard | 5 | 0.0% |
| Spanish | 11 | 0.0% |
| Sri Lankan | 11 | 0.0% |
| Subsaharan African | 37 | 0.1% |
| Swedish | 121 | 0.4% |
| Swiss | 80 | 0.3% |
| Ukrainian | 56 | 0.2% |
| Welsh | 193 | 0.6% |
| Yugoslavian | 194 | 0.6% | View All 64 Rows |
Immigrants in Wabash County
The most numerous immigrant groups reported in Wabash County came from Asia (117 | 0.4%), Central America (111 | 0.4%), Latin America (111 | 0.4%), Guatemala (63 | 0.2%), and Eastern Asia (61 | 0.2%), together accounting for 1.5% of all Wabash County residents.

| Immigration Origin | # Population | % Population |
| Africa | 37 | 0.1% |
| Asia | 117 | 0.4% |
| Cameroon | 21 | 0.1% |
| Canada | 4 | 0.0% |
| Central America | 111 | 0.4% |
| China | 55 | 0.2% |
| Costa Rica | 14 | 0.1% |
| Eastern Asia | 61 | 0.2% |
| Europe | 34 | 0.1% |
| Germany | 24 | 0.1% |
| Guatemala | 63 | 0.2% |
| Honduras | 9 | 0.0% |
| Iraq | 18 | 0.1% |
| Kazakhstan | 12 | 0.0% |
| Latin America | 111 | 0.4% |
| Liberia | 5 | 0.0% |
| Mexico | 25 | 0.1% |
| Middle Africa | 21 | 0.1% |
| Nigeria | 11 | 0.0% |
| Northern Europe | 10 | 0.0% |
| Philippines | 6 | 0.0% |
| South Central Asia | 12 | 0.0% |
| South Eastern Asia | 26 | 0.1% |
| Taiwan | 10 | 0.0% |
| Vietnam | 11 | 0.0% |
| Western Africa | 16 | 0.1% |
| Western Asia | 18 | 0.1% |
| Western Europe | 24 | 0.1% | View All 28 Rows |
Sex and Age in Wabash County
Sex and Age in Wabash County
The most populous age groups in Wabash County are 15 to 19 Years (1,212 | 8.0%) for men and 55 to 59 Years (1,251 | 7.9%) for women.

| Age Bracket | Male | Female |
| Under 5 Years | 809 (5.3%) | 776 (4.9%) |
| 5 to 9 Years | 804 (5.3%) | 725 (4.6%) |
| 10 to 14 Years | 919 (6.1%) | 1,159 (7.3%) |
| 15 to 19 Years | 1,212 (8.0%) | 1,017 (6.4%) |
| 20 to 24 Years | 988 (6.5%) | 1,002 (6.3%) |
| 25 to 29 Years | 876 (5.8%) | 845 (5.3%) |
| 30 to 34 Years | 833 (5.5%) | 853 (5.4%) |
| 35 to 39 Years | 698 (4.6%) | 548 (3.5%) |
| 40 to 44 Years | 1,036 (6.8%) | 1,179 (7.4%) |
| 45 to 49 Years | 908 (6.0%) | 887 (5.6%) |
| 50 to 54 Years | 977 (6.4%) | 999 (6.3%) |
| 55 to 59 Years | 1,059 (7.0%) | 1,251 (7.9%) |
| 60 to 64 Years | 1,175 (7.7%) | 921 (5.8%) |
| 65 to 69 Years | 928 (6.1%) | 950 (6.0%) |
| 70 to 74 Years | 800 (5.3%) | 874 (5.5%) |
| 75 to 79 Years | 485 (3.2%) | 743 (4.7%) |
| 80 to 84 Years | 374 (2.5%) | 550 (3.5%) |
| 85 Years and over | 293 (1.9%) | 579 (3.6%) |
| Total | 15,174 (100.0%) | 15,858 (100.0%) |
Families and Households in Wabash County
Median Family Size in Wabash County
The median family size in Wabash County is 2.85 persons per family, with single female/mother families (1,186 | 14.4%) accounting for the largest median family size of 2.94 persons per family. On the other hand, single male/father families (522 | 6.4%) represent the smallest median family size with 2.74 persons per family.

| Family Type | # Families | Family Size |
| Married-Couple | 6,502 (79.2%) | 2.85 |
| Single Male/Father | 522 (6.4%) | 2.74 |
| Single Female/Mother | 1,186 (14.4%) | 2.94 |
| Total Families | 8,210 (100.0%) | 2.85 |
Median Household Size in Wabash County
The median household size in Wabash County is 2.34 persons per household, with single female/mother households (1,186 | 9.5%) accounting for the largest median household size of 3.17 persons per household. non-family households (4,261 | 34.2%) represent the smallest median household size with 1.22 persons per household.

| Household Type | # Households | Household Size |
| Married-Couple | 6,502 (52.1%) | 2.87 |
| Single Male/Father | 522 (4.2%) | 3.08 |
| Single Female/Mother | 1,186 (9.5%) | 3.17 |
| Non-family | 4,261 (34.2%) | 1.22 |
| Total Households | 12,471 (100.0%) | 2.34 |
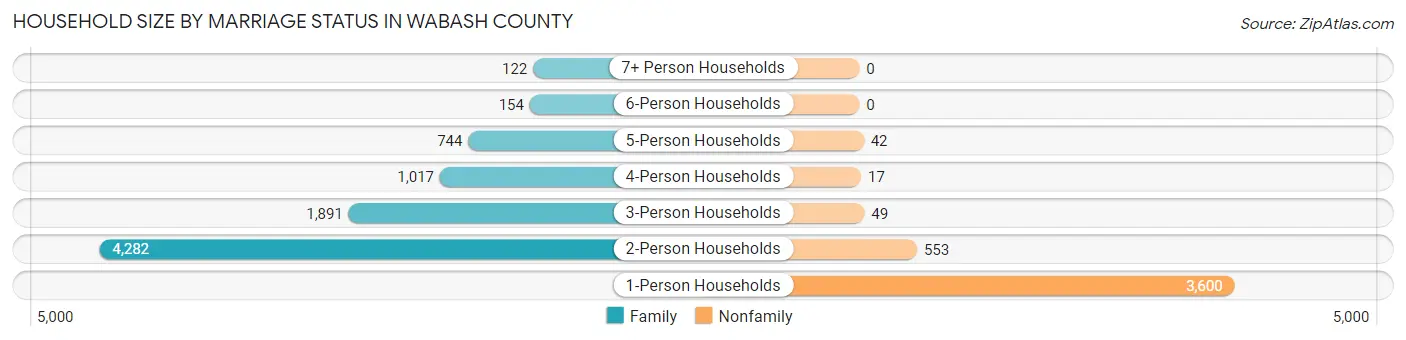
Household Size by Marriage Status in Wabash County
Out of a total of 12,471 households in Wabash County, 8,210 (65.8%) are family households, while 4,261 (34.2%) are nonfamily households. The most numerous type of family households are 2-person households, comprising 4,282, and the most common type of nonfamily households are 1-person households, comprising 3,600.
| Household Size | Family Households | Nonfamily Households |
| 1-Person Households | - | 3,600 (28.9%) |
| 2-Person Households | 4,282 (34.3%) | 553 (4.4%) |
| 3-Person Households | 1,891 (15.2%) | 49 (0.4%) |
| 4-Person Households | 1,017 (8.2%) | 17 (0.1%) |
| 5-Person Households | 744 (6.0%) | 42 (0.3%) |
| 6-Person Households | 154 (1.2%) | 0 (0.0%) |
| 7+ Person Households | 122 (1.0%) | 0 (0.0%) |
| Total | 8,210 (65.8%) | 4,261 (34.2%) |
Female Fertility in Wabash County
Fertility by Age in Wabash County
Average fertility rate in Wabash County is 38.0 births per 1,000 women. Women in the age bracket of 20 to 34 years have the highest fertility rate with 90.0 births per 1,000 women. Women in the age bracket of 20 to 34 years acount for 98.4% of all women with births.

| Age Bracket | Women with Births | Births / 1,000 Women |
| 15 to 19 years | 0 (0.0%) | 0.0 |
| 20 to 34 years | 244 (98.4%) | 90.0 |
| 35 to 50 years | 4 (1.6%) | 1.0 |
| Total | 248 (100.0%) | 38.0 |
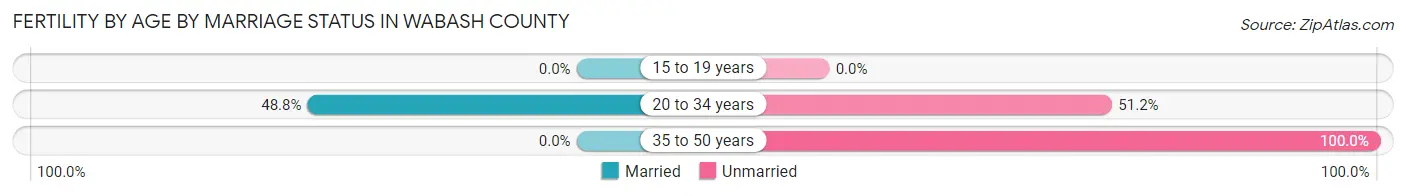
Fertility by Age by Marriage Status in Wabash County
48.0% of women with births (248) in Wabash County are married. The highest percentage of unmarried women with births falls into 35 to 50 years age bracket with 100.0% of them unmarried at the time of birth, while the lowest percentage of unmarried women with births belong to 20 to 34 years age bracket with 51.2% of them unmarried.
| Age Bracket | Married | Unmarried |
| 15 to 19 years | 0 (0.0%) | 0 (0.0%) |
| 20 to 34 years | 119 (48.8%) | 125 (51.2%) |
| 35 to 50 years | 0 (0.0%) | 4 (100.0%) |
| Total | 119 (48.0%) | 129 (52.0%) |
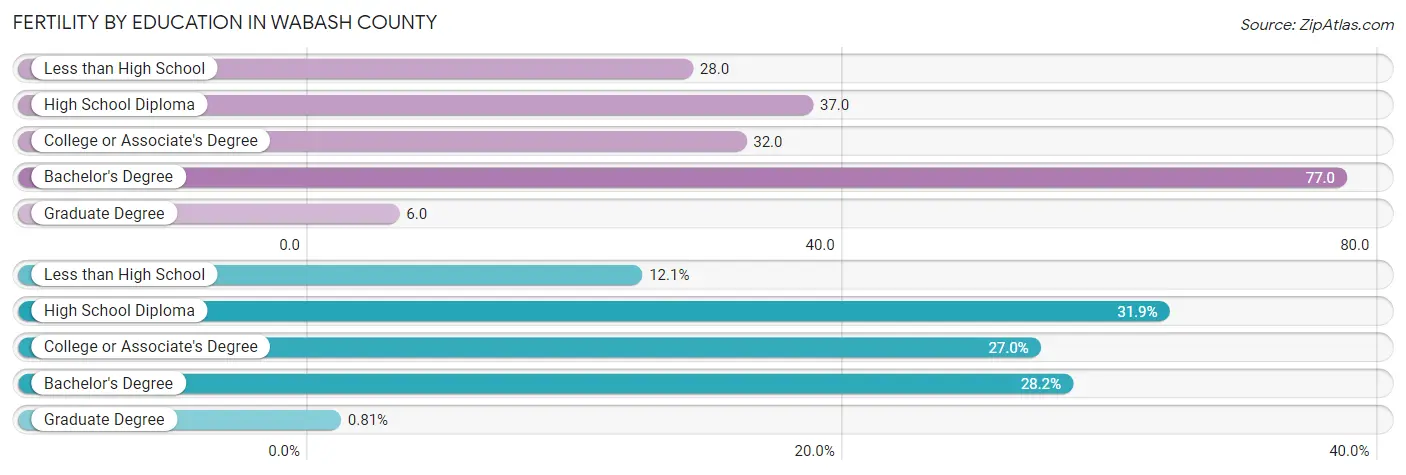
Fertility by Education in Wabash County
Average fertility rate in Wabash County is 38.0 births per 1,000 women. Women with the education attainment of bachelor's degree have the highest fertility rate of 77.0 births per 1,000 women, while women with the education attainment of graduate degree have the lowest fertility at 6.0 births per 1,000 women. Women with the education attainment of high school diploma represent 31.9% of all women with births.
| Educational Attainment | Women with Births | Births / 1,000 Women |
| Less than High School | 30 (12.1%) | 28.0 |
| High School Diploma | 79 (31.9%) | 37.0 |
| College or Associate's Degree | 67 (27.0%) | 32.0 |
| Bachelor's Degree | 70 (28.2%) | 77.0 |
| Graduate Degree | 2 (0.8%) | 6.0 |
| Total | 248 (100.0%) | 38.0 |
Fertility by Education by Marriage Status in Wabash County
52.0% of women with births in Wabash County are unmarried. Women with the educational attainment of graduate degree are most likely to be married with 100.0% of them married at childbirth, while women with the educational attainment of less than high school are least likely to be married with 100.0% of them unmarried at childbirth.

| Educational Attainment | Married | Unmarried |
| Less than High School | 0 (0.0%) | 30 (100.0%) |
| High School Diploma | 24 (30.4%) | 55 (69.6%) |
| College or Associate's Degree | 36 (53.7%) | 31 (46.3%) |
| Bachelor's Degree | 57 (81.4%) | 13 (18.6%) |
| Graduate Degree | 2 (100.0%) | 0 (0.0%) |
| Total | 119 (48.0%) | 129 (52.0%) |
Income in Wabash County
Income Overview in Wabash County
Per Capita Income in Wabash County is $32,763, while median incomes of families and households are $78,110 and $66,194 respectively.
| Characteristic | Number | Measure |
| Per Capita Income | 31,032 | $32,763 |
| Median Family Income | 8,210 | $78,110 |
| Mean Family Income | 8,210 | $91,188 |
| Median Household Income | 12,471 | $66,194 |
| Mean Household Income | 12,471 | $79,536 |
| Income Deficit | 8,210 | $10,415 |
| Wage / Income Gap (%) | 31,032 | 43.92% |
| Wage / Income Gap ($) | 31,032 | 56.08¢ per $1 |
| Gini / Inequality Index | 31,032 | 0.41 |
Earnings by Sex in Wabash County
Average Earnings in Wabash County are $37,969, $50,640 for men and $28,400 for women, a difference of 43.9%.

| Sex | Number | Average Earnings |
| Male | 8,446 (52.7%) | $50,640 |
| Female | 7,593 (47.3%) | $28,400 |
| Total | 16,039 (100.0%) | $37,969 |
Earnings by Sex by Income Bracket in Wabash County
The most common earnings brackets in Wabash County are $75,000 to $99,999 for men (1,140 | 13.5%) and $45,000 to $49,999 for women (559 | 7.4%).

| Income | Male | Female |
| $2,499 or less | 404 (4.8%) | 443 (5.8%) |
| $2,500 to $4,999 | 294 (3.5%) | 366 (4.8%) |
| $5,000 to $7,499 | 369 (4.4%) | 479 (6.3%) |
| $7,500 to $9,999 | 182 (2.1%) | 341 (4.5%) |
| $10,000 to $12,499 | 182 (2.1%) | 384 (5.1%) |
| $12,500 to $14,999 | 153 (1.8%) | 316 (4.2%) |
| $15,000 to $17,499 | 206 (2.4%) | 241 (3.2%) |
| $17,500 to $19,999 | 83 (1.0%) | 283 (3.7%) |
| $20,000 to $22,499 | 149 (1.8%) | 290 (3.8%) |
| $22,500 to $24,999 | 202 (2.4%) | 261 (3.4%) |
| $25,000 to $29,999 | 384 (4.5%) | 525 (6.9%) |
| $30,000 to $34,999 | 359 (4.3%) | 558 (7.3%) |
| $35,000 to $39,999 | 482 (5.7%) | 510 (6.7%) |
| $40,000 to $44,999 | 364 (4.3%) | 351 (4.6%) |
| $45,000 to $49,999 | 322 (3.8%) | 559 (7.4%) |
| $50,000 to $54,999 | 717 (8.5%) | 329 (4.3%) |
| $55,000 to $64,999 | 755 (8.9%) | 531 (7.0%) |
| $65,000 to $74,999 | 694 (8.2%) | 313 (4.1%) |
| $75,000 to $99,999 | 1,140 (13.5%) | 393 (5.2%) |
| $100,000+ | 1,005 (11.9%) | 120 (1.6%) |
| Total | 8,446 (100.0%) | 7,593 (100.0%) |
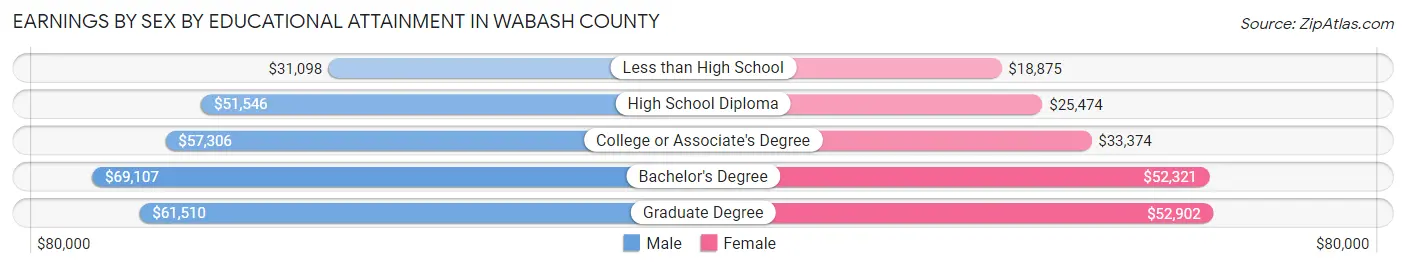
Earnings by Sex by Educational Attainment in Wabash County
Average earnings in Wabash County are $54,836 for men and $33,714 for women, a difference of 38.5%. Men with an educational attainment of bachelor's degree enjoy the highest average annual earnings of $69,107, while those with less than high school education earn the least with $31,098. Women with an educational attainment of graduate degree earn the most with the average annual earnings of $52,902, while those with less than high school education have the smallest earnings of $18,875.
| Educational Attainment | Male Income | Female Income |
| Less than High School | $31,098 | $18,875 |
| High School Diploma | $51,546 | $25,474 |
| College or Associate's Degree | $57,306 | $33,374 |
| Bachelor's Degree | $69,107 | $52,321 |
| Graduate Degree | $61,510 | $52,902 |
| Total | $54,836 | $33,714 |
Family Income in Wabash County
Family Income Brackets in Wabash County
According to the Wabash County family income data, there are 1,814 families falling into the $100,000 to $149,999 income range, which is the most common income bracket and makes up 22.1% of all families. Conversely, the $10,000 to $14,999 income bracket is the least frequent group with only 90 families (1.1%) belonging to this category.

| Income Bracket | # Families | % Families |
| Less than $10,000 | 197 | 2.4% |
| $10,000 to $14,999 | 90 | 1.1% |
| $15,000 to $24,999 | 410 | 5.0% |
| $25,000 to $34,999 | 665 | 8.1% |
| $35,000 to $49,999 | 895 | 10.9% |
| $50,000 to $74,999 | 1,585 | 19.3% |
| $75,000 to $99,999 | 1,511 | 18.4% |
| $100,000 to $149,999 | 1,814 | 22.1% |
| $150,000 to $199,999 | 714 | 8.7% |
| $200,000+ | 337 | 4.1% |
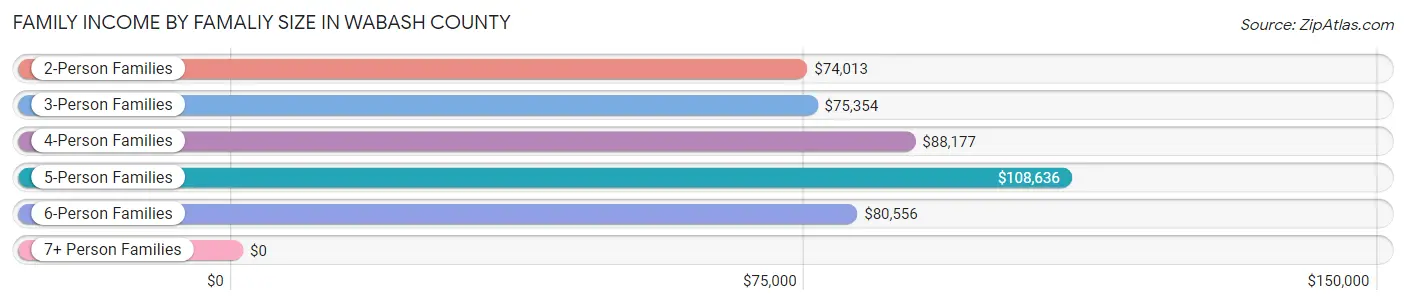
Family Income by Famaliy Size in Wabash County
5-person families (668 | 8.1%) account for the highest median family income in Wabash County with $108,636 per family, while 2-person families (4,507 | 54.9%) have the highest median income of $37,006 per family member.
| Income Bracket | # Families | Median Income |
| 2-Person Families | 4,507 (54.9%) | $74,013 |
| 3-Person Families | 1,865 (22.7%) | $75,354 |
| 4-Person Families | 905 (11.0%) | $88,177 |
| 5-Person Families | 668 (8.1%) | $108,636 |
| 6-Person Families | 150 (1.8%) | $80,556 |
| 7+ Person Families | 115 (1.4%) | $0 |
| Total | 8,210 (100.0%) | $78,110 |
Family Income by Number of Earners in Wabash County
The median family income in Wabash County is $78,110, with families comprising 3+ earners (645) having the highest median family income of $126,625, while families with no earners (1,626) have the lowest median family income of $53,191, accounting for 7.9% and 19.8% of families, respectively.

| Number of Earners | # Families | Median Income |
| No Earners | 1,626 (19.8%) | $53,191 |
| 1 Earner | 2,362 (28.8%) | $54,355 |
| 2 Earners | 3,577 (43.6%) | $98,298 |
| 3+ Earners | 645 (7.9%) | $126,625 |
| Total | 8,210 (100.0%) | $78,110 |
Household Income in Wabash County
Household Income Brackets in Wabash County
With 2,482 households falling in the category, the $50,000 to $74,999 income range is the most frequent in Wabash County, accounting for 19.9% of all households. In contrast, only 349 households (2.8%) fall into the less than $10,000 income bracket, making it the least populous group.

| Income Bracket | # Households | % Households |
| Less than $10,000 | 349 | 2.8% |
| $10,000 to $14,999 | 574 | 4.6% |
| $15,000 to $24,999 | 1,073 | 8.6% |
| $25,000 to $34,999 | 1,110 | 8.9% |
| $35,000 to $49,999 | 1,509 | 12.1% |
| $50,000 to $74,999 | 2,482 | 19.9% |
| $75,000 to $99,999 | 1,908 | 15.3% |
| $100,000 to $149,999 | 2,320 | 18.6% |
| $150,000 to $199,999 | 761 | 6.1% |
| $200,000+ | 387 | 3.1% |
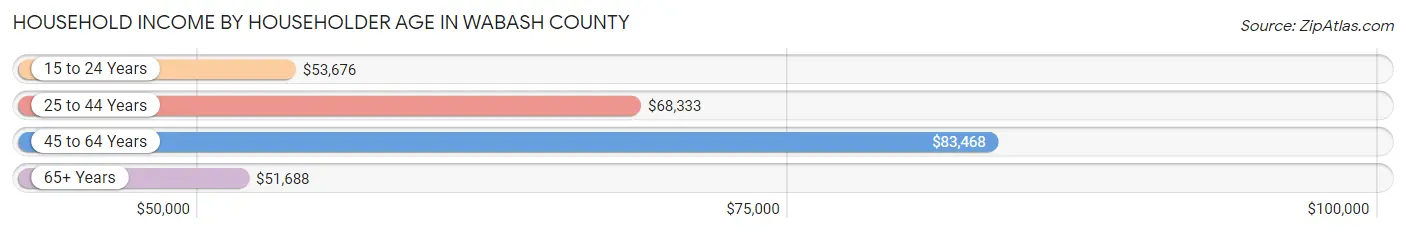
Household Income by Householder Age in Wabash County
The median household income in Wabash County is $66,194, with the highest median household income of $83,468 found in the 45 to 64 years age bracket for the primary householder. A total of 4,474 households (35.9%) fall into this category. Meanwhile, the 65+ years age bracket for the primary householder has the lowest median household income of $51,688, with 3,895 households (31.2%) in this group.
| Income Bracket | # Households | Median Income |
| 15 to 24 Years | 394 (3.2%) | $53,676 |
| 25 to 44 Years | 3,708 (29.7%) | $68,333 |
| 45 to 64 Years | 4,474 (35.9%) | $83,468 |
| 65+ Years | 3,895 (31.2%) | $51,688 |
| Total | 12,471 (100.0%) | $66,194 |
Poverty in Wabash County
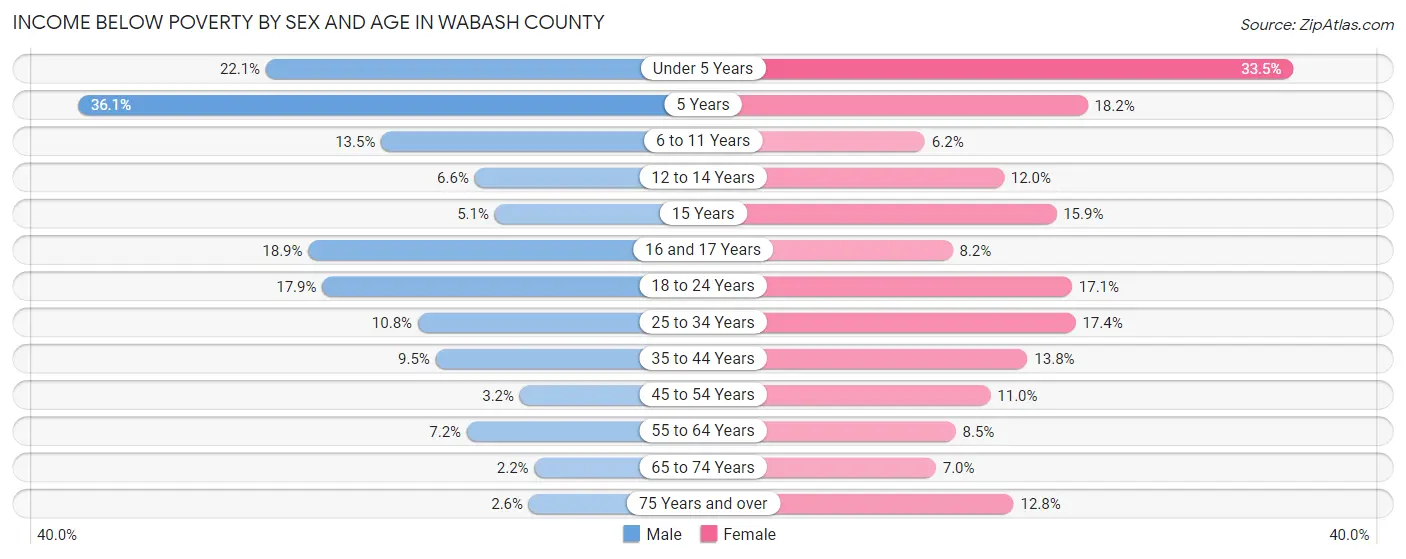
Income Below Poverty by Sex and Age in Wabash County
With 9.1% poverty level for males and 12.8% for females among the residents of Wabash County, 5 year old males and under 5 year old females are the most vulnerable to poverty, with 62 males (36.0%) and 235 females (33.5%) in their respective age groups living below the poverty level.
| Age Bracket | Male | Female |
| Under 5 Years | 172 (22.1%) | 235 (33.5%) |
| 5 Years | 62 (36.0%) | 27 (18.2%) |
| 6 to 11 Years | 123 (13.5%) | 60 (6.2%) |
| 12 to 14 Years | 37 (6.6%) | 84 (12.0%) |
| 15 Years | 11 (5.1%) | 60 (15.9%) |
| 16 and 17 Years | 74 (18.9%) | 18 (8.2%) |
| 18 to 24 Years | 194 (17.9%) | 188 (17.1%) |
| 25 to 34 Years | 180 (10.8%) | 290 (17.3%) |
| 35 to 44 Years | 162 (9.5%) | 238 (13.8%) |
| 45 to 54 Years | 60 (3.2%) | 202 (11.0%) |
| 55 to 64 Years | 158 (7.2%) | 177 (8.5%) |
| 65 to 74 Years | 37 (2.1%) | 126 (7.0%) |
| 75 Years and over | 25 (2.6%) | 194 (12.8%) |
| Total | 1,295 (9.1%) | 1,899 (12.8%) |
Income Above Poverty by Sex and Age in Wabash County
According to the poverty statistics in Wabash County, males aged 65 to 74 years and females aged 6 to 11 years are the age groups that are most secure financially, with 97.9% of males and 93.8% of females in these age groups living above the poverty line.

| Age Bracket | Male | Female |
| Under 5 Years | 607 (77.9%) | 466 (66.5%) |
| 5 Years | 110 (63.9%) | 121 (81.8%) |
| 6 to 11 Years | 787 (86.5%) | 912 (93.8%) |
| 12 to 14 Years | 525 (93.4%) | 614 (88.0%) |
| 15 Years | 205 (94.9%) | 317 (84.1%) |
| 16 and 17 Years | 317 (81.1%) | 201 (91.8%) |
| 18 to 24 Years | 890 (82.1%) | 913 (82.9%) |
| 25 to 34 Years | 1,486 (89.2%) | 1,381 (82.7%) |
| 35 to 44 Years | 1,547 (90.5%) | 1,489 (86.2%) |
| 45 to 54 Years | 1,795 (96.8%) | 1,630 (89.0%) |
| 55 to 64 Years | 2,048 (92.8%) | 1,918 (91.5%) |
| 65 to 74 Years | 1,685 (97.9%) | 1,680 (93.0%) |
| 75 Years and over | 951 (97.4%) | 1,327 (87.3%) |
| Total | 12,953 (90.9%) | 12,969 (87.2%) |
Income Below Poverty Among Married-Couple Families in Wabash County
The poverty statistics for married-couple families in Wabash County show that 3.3% or 213 of the total 6,502 families live below the poverty line. Families with 5 or more children have the highest poverty rate of 46.7%, comprising of 21 families. On the other hand, families with no children have the lowest poverty rate of 2.1%, which includes 91 families.

| Children | Above Poverty | Below Poverty |
| No Children | 4,218 (97.9%) | 91 (2.1%) |
| 1 or 2 Children | 1,604 (96.0%) | 67 (4.0%) |
| 3 or 4 Children | 443 (92.9%) | 34 (7.1%) |
| 5 or more Children | 24 (53.3%) | 21 (46.7%) |
| Total | 6,289 (96.7%) | 213 (3.3%) |
Income Below Poverty Among Single-Parent Households in Wabash County
According to the poverty data in Wabash County, 19.7% or 103 single-father households and 19.7% or 234 single-mother households are living below the poverty line. Among single-father households, those with 3 or 4 children have the highest poverty rate, with 24 households (39.3%) experiencing poverty. Likewise, among single-mother households, those with 5 or more children have the highest poverty rate, with 39 households (100.0%) falling below the poverty line.

| Children | Single Father | Single Mother |
| No Children | 19 (11.0%) | 9 (2.0%) |
| 1 or 2 Children | 60 (20.8%) | 166 (26.9%) |
| 3 or 4 Children | 24 (39.3%) | 20 (24.4%) |
| 5 or more Children | 0 (0.0%) | 39 (100.0%) |
| Total | 103 (19.7%) | 234 (19.7%) |
Income Below Poverty Among Married-Couple vs Single-Parent Households in Wabash County
The poverty data for Wabash County shows that 213 of the married-couple family households (3.3%) and 337 of the single-parent households (19.7%) are living below the poverty level. Within the married-couple family households, those with 5 or more children have the highest poverty rate, with 21 households (46.7%) falling below the poverty line. Among the single-parent households, those with 5 or more children have the highest poverty rate, with 39 household (100.0%) living below poverty.

| Children | Married-Couple Families | Single-Parent Households |
| No Children | 91 (2.1%) | 28 (4.5%) |
| 1 or 2 Children | 67 (4.0%) | 226 (25.0%) |
| 3 or 4 Children | 34 (7.1%) | 44 (30.8%) |
| 5 or more Children | 21 (46.7%) | 39 (100.0%) |
| Total | 213 (3.3%) | 337 (19.7%) |
Employment Characteristics in Wabash County
Employment by Class of Employer in Wabash County
Among the 14,096 employed individuals in Wabash County, private company employees (9,587 | 68.0%), not-for-profit organizations (1,781 | 12.6%), and local government employees (982 | 7.0%) make up the most common classes of employment.

| Employer Class | # Employees | % Employees |
| Private Company Employees | 9,587 | 68.0% |
| Self-Employed (Incorporated) | 389 | 2.8% |
| Self-Employed (Not Incorporated) | 778 | 5.5% |
| Not-for-profit Organizations | 1,781 | 12.6% |
| Local Government Employees | 982 | 7.0% |
| State Government Employees | 412 | 2.9% |
| Federal Government Employees | 149 | 1.1% |
| Unpaid Family Workers | 18 | 0.1% |
| Total | 14,096 | 100.0% |
Employment Status by Age in Wabash County
According to the labor force statistics for Wabash County, out of the total population over 16 years of age (25,227), 59.2% or 14,934 individuals are in the labor force, with 3.5% or 523 of them unemployed. The age group with the highest labor force participation rate is 25 to 29 years, with 90.2% or 1,552 individuals in the labor force. Within the labor force, the 16 to 19 years age range has the highest percentage of unemployed individuals, with 6.0% or 41 of them being unemployed.

| Age Bracket | In Labor Force | Unemployed |
| 16 to 19 Years | 679 (42.0%) | 41 (6.0%) |
| 20 to 24 Years | 1,411 (70.9%) | 54 (3.8%) |
| 25 to 29 Years | 1,552 (90.2%) | 78 (5.0%) |
| 30 to 34 Years | 1,393 (82.6%) | 33 (2.4%) |
| 35 to 44 Years | 2,904 (83.9%) | 96 (3.3%) |
| 45 to 54 Years | 3,209 (85.1%) | 135 (4.2%) |
| 55 to 59 Years | 1,786 (77.3%) | 48 (2.7%) |
| 60 to 64 Years | 1,075 (51.3%) | 20 (1.9%) |
| 65 to 74 Years | 725 (20.4%) | 19 (2.6%) |
| 75 Years and over | 209 (6.9%) | 0 (0.0%) |
| Total | 14,934 (59.2%) | 523 (3.5%) |
Employment Status by Educational Attainment in Wabash County
According to labor force statistics for Wabash County, 79.2% of individuals (11,916) out of the total population between 25 and 64 years of age (15,045) are in the labor force, with 3.4% or 405 of them being unemployed. The group with the highest labor force participation rate are those with the educational attainment of bachelor's degree or higher, with 87.5% or 3,042 individuals in the labor force. Within the labor force, individuals with less than high school education have the highest percentage of unemployment, with 6.9% or 50 of them being unemployed.

| Educational Attainment | In Labor Force | Unemployed |
| Less than High School | 719 (55.3%) | 90 (6.9%) |
| High School Diploma | 4,528 (77.7%) | 280 (4.8%) |
| College / Associate Degree | 3,632 (81.8%) | 84 (1.9%) |
| Bachelor's Degree or higher | 3,042 (87.5%) | 83 (2.4%) |
| Total | 11,916 (79.2%) | 512 (3.4%) |
Employment Occupations by Sex in Wabash County
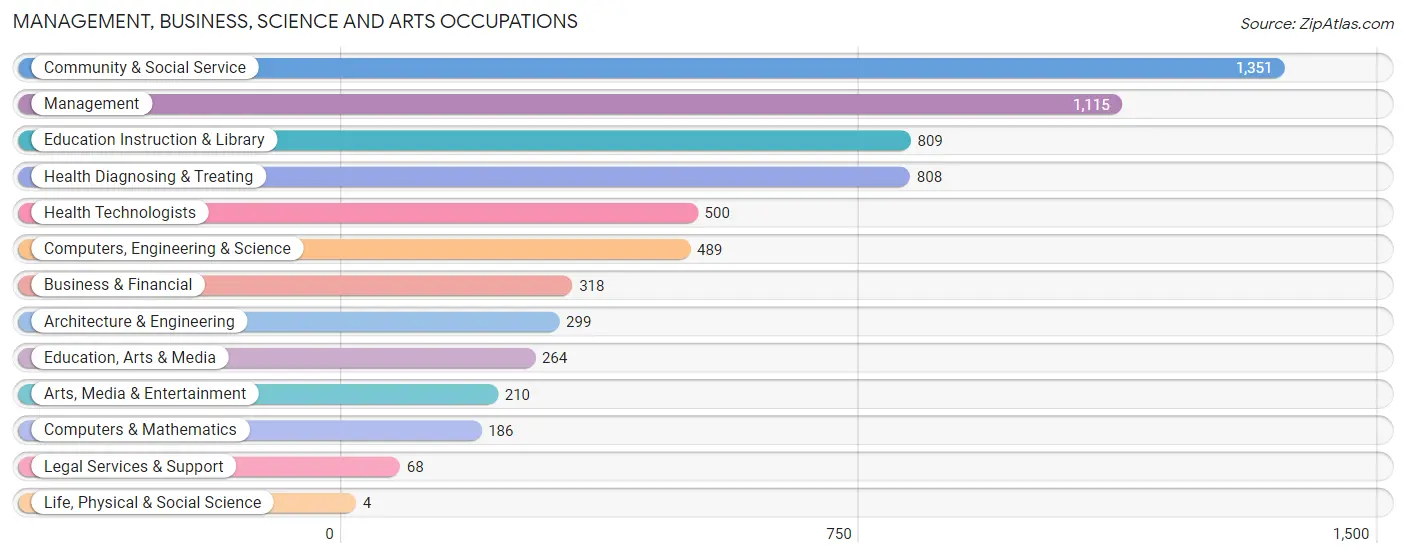
Management, Business, Science and Arts Occupations
The most common Management, Business, Science and Arts occupations in Wabash County are Community & Social Service (1,351 | 9.4%), Management (1,115 | 7.7%), Education Instruction & Library (809 | 5.6%), Health Diagnosing & Treating (808 | 5.6%), and Health Technologists (500 | 3.5%).
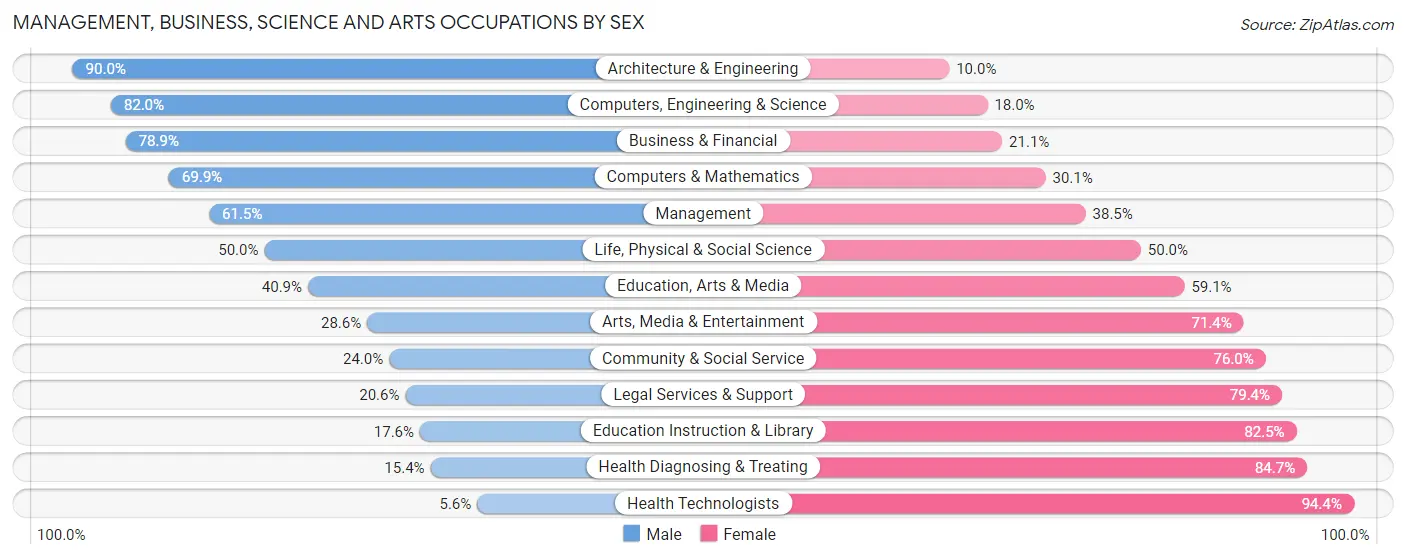
Management, Business, Science and Arts Occupations by Sex
Within the Management, Business, Science and Arts occupations in Wabash County, the most male-oriented occupations are Architecture & Engineering (90.0%), Computers, Engineering & Science (82.0%), and Business & Financial (78.9%), while the most female-oriented occupations are Health Technologists (94.4%), Health Diagnosing & Treating (84.7%), and Education Instruction & Library (82.5%).
| Occupation | Male | Female |
| Management | 686 (61.5%) | 429 (38.5%) |
| Business & Financial | 251 (78.9%) | 67 (21.1%) |
| Computers, Engineering & Science | 401 (82.0%) | 88 (18.0%) |
| Computers & Mathematics | 130 (69.9%) | 56 (30.1%) |
| Architecture & Engineering | 269 (90.0%) | 30 (10.0%) |
| Life, Physical & Social Science | 2 (50.0%) | 2 (50.0%) |
| Community & Social Service | 324 (24.0%) | 1,027 (76.0%) |
| Education, Arts & Media | 108 (40.9%) | 156 (59.1%) |
| Legal Services & Support | 14 (20.6%) | 54 (79.4%) |
| Education Instruction & Library | 142 (17.5%) | 667 (82.5%) |
| Arts, Media & Entertainment | 60 (28.6%) | 150 (71.4%) |
| Health Diagnosing & Treating | 124 (15.3%) | 684 (84.7%) |
| Health Technologists | 28 (5.6%) | 472 (94.4%) |
| Total (Category) | 1,786 (43.8%) | 2,295 (56.2%) |
| Total (Overall) | 7,523 (52.2%) | 6,894 (47.8%) |
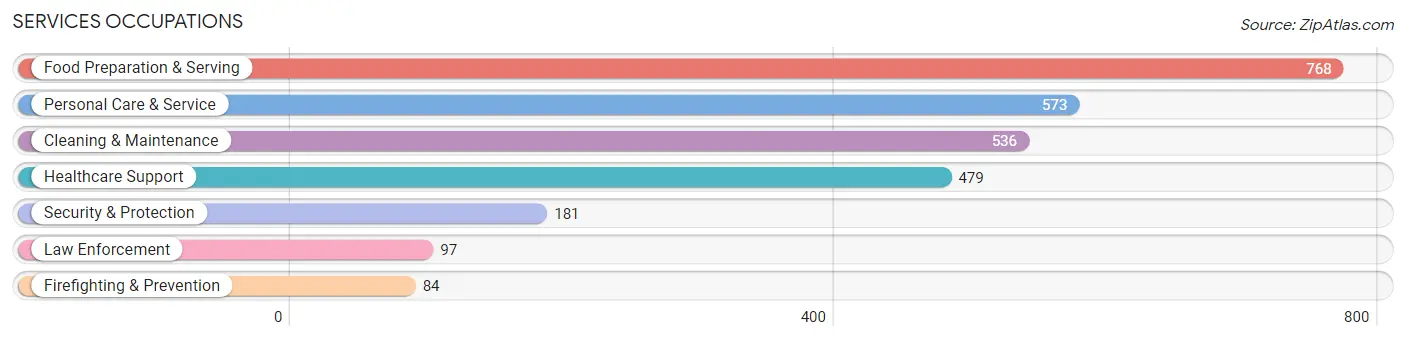
Services Occupations
The most common Services occupations in Wabash County are Food Preparation & Serving (768 | 5.3%), Personal Care & Service (573 | 4.0%), Cleaning & Maintenance (536 | 3.7%), Healthcare Support (479 | 3.3%), and Security & Protection (181 | 1.3%).
Services Occupations by Sex
Within the Services occupations in Wabash County, the most male-oriented occupations are Law Enforcement (100.0%), Security & Protection (95.0%), and Firefighting & Prevention (89.3%), while the most female-oriented occupations are Healthcare Support (88.5%), Food Preparation & Serving (71.0%), and Personal Care & Service (70.9%).

| Occupation | Male | Female |
| Healthcare Support | 55 (11.5%) | 424 (88.5%) |
| Security & Protection | 172 (95.0%) | 9 (5.0%) |
| Firefighting & Prevention | 75 (89.3%) | 9 (10.7%) |
| Law Enforcement | 97 (100.0%) | 0 (0.0%) |
| Food Preparation & Serving | 223 (29.0%) | 545 (71.0%) |
| Cleaning & Maintenance | 299 (55.8%) | 237 (44.2%) |
| Personal Care & Service | 167 (29.1%) | 406 (70.9%) |
| Total (Category) | 916 (36.1%) | 1,621 (63.9%) |
| Total (Overall) | 7,523 (52.2%) | 6,894 (47.8%) |
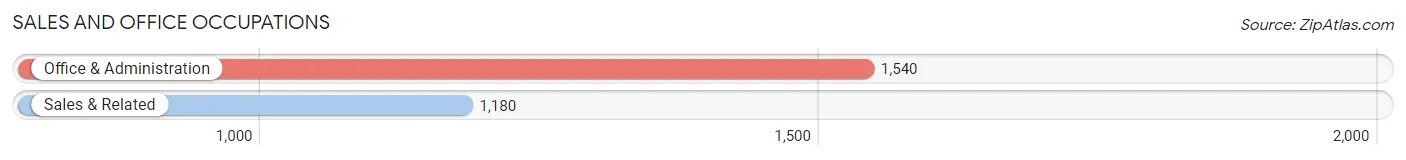
Sales and Office Occupations
The most common Sales and Office occupations in Wabash County are Office & Administration (1,540 | 10.7%), and Sales & Related (1,180 | 8.2%).
Sales and Office Occupations by Sex

| Occupation | Male | Female |
| Sales & Related | 523 (44.3%) | 657 (55.7%) |
| Office & Administration | 221 (14.3%) | 1,319 (85.7%) |
| Total (Category) | 744 (27.4%) | 1,976 (72.7%) |
| Total (Overall) | 7,523 (52.2%) | 6,894 (47.8%) |
Natural Resources, Construction and Maintenance Occupations
The most common Natural Resources, Construction and Maintenance occupations in Wabash County are Installation, Maintenance & Repair (789 | 5.5%), Construction & Extraction (595 | 4.1%), and Farming, Fishing & Forestry (39 | 0.3%).
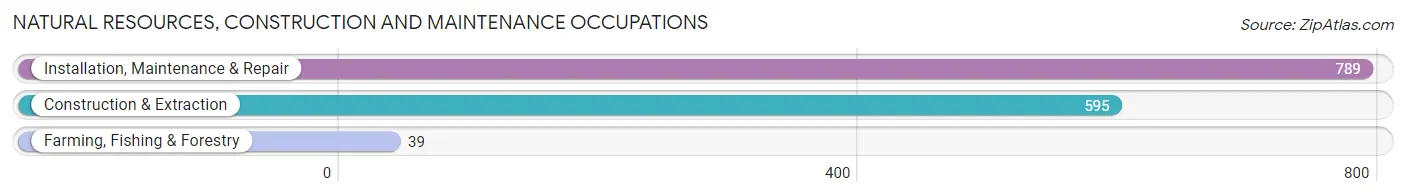
Natural Resources, Construction and Maintenance Occupations by Sex

| Occupation | Male | Female |
| Farming, Fishing & Forestry | 19 (48.7%) | 20 (51.3%) |
| Construction & Extraction | 563 (94.6%) | 32 (5.4%) |
| Installation, Maintenance & Repair | 775 (98.2%) | 14 (1.8%) |
| Total (Category) | 1,357 (95.4%) | 66 (4.6%) |
| Total (Overall) | 7,523 (52.2%) | 6,894 (47.8%) |
Production, Transportation and Moving Occupations
The most common Production, Transportation and Moving occupations in Wabash County are Production (2,302 | 16.0%), Material Moving (793 | 5.5%), and Transportation (561 | 3.9%).

Production, Transportation and Moving Occupations by Sex
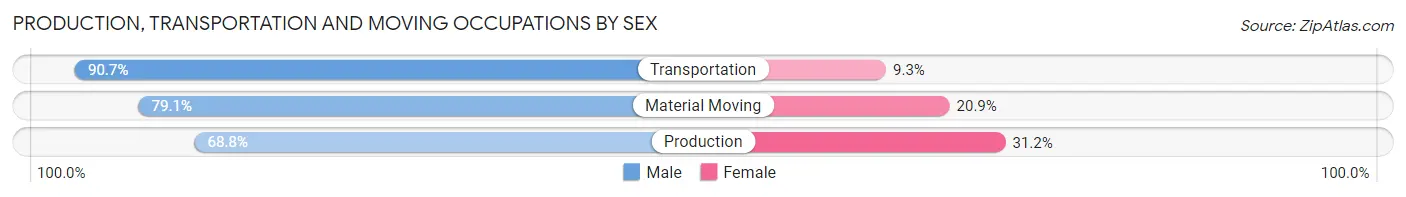
| Occupation | Male | Female |
| Production | 1,584 (68.8%) | 718 (31.2%) |
| Transportation | 509 (90.7%) | 52 (9.3%) |
| Material Moving | 627 (79.1%) | 166 (20.9%) |
| Total (Category) | 2,720 (74.4%) | 936 (25.6%) |
| Total (Overall) | 7,523 (52.2%) | 6,894 (47.8%) |
Employment Industries by Sex in Wabash County
Employment Industries in Wabash County
The major employment industries in Wabash County include Manufacturing (4,068 | 28.2%), Health Care & Social Assistance (2,153 | 14.9%), Educational Services (1,526 | 10.6%), Retail Trade (1,488 | 10.3%), and Accommodation & Food Services (760 | 5.3%).

Employment Industries by Sex in Wabash County
The Wabash County industries that see more men than women are Construction (94.5%), Agriculture, Fishing & Hunting (79.7%), and Mining, Quarrying, & Extraction (78.8%), whereas the industries that tend to have a higher number of women are Enterprise Management (100.0%), Health Care & Social Assistance (82.1%), and Accommodation & Food Services (75.0%).

| Industry | Male | Female |
| Agriculture, Fishing & Hunting | 248 (79.7%) | 63 (20.3%) |
| Mining, Quarrying, & Extraction | 26 (78.8%) | 7 (21.2%) |
| Construction | 700 (94.5%) | 41 (5.5%) |
| Manufacturing | 2,985 (73.4%) | 1,083 (26.6%) |
| Wholesale Trade | 140 (74.5%) | 48 (25.5%) |
| Retail Trade | 673 (45.2%) | 815 (54.8%) |
| Transportation & Warehousing | 463 (77.9%) | 131 (22.1%) |
| Utilities | 50 (55.6%) | 40 (44.4%) |
| Information | 29 (38.2%) | 47 (61.8%) |
| Finance & Insurance | 109 (38.5%) | 174 (61.5%) |
| Real Estate, Rental & Leasing | 44 (25.4%) | 129 (74.6%) |
| Professional & Scientific | 169 (63.1%) | 99 (36.9%) |
| Enterprise Management | 0 (0.0%) | 9 (100.0%) |
| Administrative & Support | 106 (50.2%) | 105 (49.8%) |
| Educational Services | 506 (33.2%) | 1,020 (66.8%) |
| Health Care & Social Assistance | 385 (17.9%) | 1,768 (82.1%) |
| Arts, Entertainment & Recreation | 125 (39.2%) | 194 (60.8%) |
| Accommodation & Food Services | 190 (25.0%) | 570 (75.0%) |
| Public Administration | 183 (58.7%) | 129 (41.3%) |
| Total | 7,523 (52.2%) | 6,894 (47.8%) |
Education in Wabash County
School Enrollment in Wabash County
The most common levels of schooling among the 7,280 students in Wabash County are middle school (1,792 | 24.6%), college / undergraduate (1,670 | 22.9%), and high school (1,665 | 22.9%).

| School Level | # Students | % Students |
| Nursery / Preschool | 259 | 3.6% |
| Kindergarten | 257 | 3.5% |
| Elementary School | 1,392 | 19.1% |
| Middle School | 1,792 | 24.6% |
| High School | 1,665 | 22.9% |
| College / Undergraduate | 1,670 | 22.9% |
| Graduate / Professional | 245 | 3.4% |
| Total | 7,280 | 100.0% |
School Enrollment by Age by Funding Source in Wabash County
Out of a total of 7,280 students who are enrolled in schools in Wabash County, 1,390 (19.1%) attend a private institution, while the remaining 5,890 (80.9%) are enrolled in public schools. The age group of 20 to 24 year olds has the highest likelihood of being enrolled in private schools, with 509 (58.4% in the age bracket) enrolled. Conversely, the age group of 10 to 14 year olds has the lowest likelihood of being enrolled in a private school, with 1,950 (94.3% in the age bracket) attending a public institution.

| Age Bracket | Public School | Private School |
| 3 to 4 Year Olds | 107 (69.9%) | 46 (30.1%) |
| 5 to 9 Year Old | 1,300 (88.9%) | 162 (11.1%) |
| 10 to 14 Year Olds | 1,950 (94.3%) | 118 (5.7%) |
| 15 to 17 Year Olds | 1,119 (87.7%) | 157 (12.3%) |
| 18 to 19 Year Olds | 497 (66.4%) | 251 (33.6%) |
| 20 to 24 Year Olds | 362 (41.6%) | 509 (58.4%) |
| 25 to 34 Year Olds | 382 (79.9%) | 96 (20.1%) |
| 35 Years and over | 173 (77.2%) | 51 (22.8%) |
| Total | 5,890 (80.9%) | 1,390 (19.1%) |
Educational Attainment by Field of Study in Wabash County
Education (1,499 | 28.7%), business (866 | 16.6%), science & technology (697 | 13.4%), engineering (319 | 6.1%), and social sciences (313 | 6.0%) are the most common fields of study among 5,222 individuals in Wabash County who have obtained a bachelor's degree or higher.

| Field of Study | # Graduates | % Graduates |
| Computers & Mathematics | 119 | 2.3% |
| Bio, Nature & Agricultural | 226 | 4.3% |
| Physical & Health Sciences | 79 | 1.5% |
| Psychology | 204 | 3.9% |
| Social Sciences | 313 | 6.0% |
| Engineering | 319 | 6.1% |
| Multidisciplinary Studies | 44 | 0.8% |
| Science & Technology | 697 | 13.4% |
| Business | 866 | 16.6% |
| Education | 1,499 | 28.7% |
| Literature & Languages | 79 | 1.5% |
| Liberal Arts & History | 309 | 5.9% |
| Visual & Performing Arts | 95 | 1.8% |
| Communications | 142 | 2.7% |
| Arts & Humanities | 231 | 4.4% |
| Total | 5,222 | 100.0% |
Transportation & Commute in Wabash County
Vehicle Availability by Sex in Wabash County
The most prevalent vehicle ownership categories in Wabash County are males with 2 vehicles (2,802, accounting for 38.9%) and females with 2 vehicles (2,775, making up 43.0%).

| Vehicles Available | Male | Female |
| No Vehicle | 191 (2.6%) | 78 (1.2%) |
| 1 Vehicle | 1,092 (15.1%) | 1,088 (16.7%) |
| 2 Vehicles | 2,802 (38.9%) | 2,775 (42.6%) |
| 3 Vehicles | 1,677 (23.3%) | 1,360 (20.9%) |
| 4 Vehicles | 1,127 (15.6%) | 884 (13.6%) |
| 5 or more Vehicles | 317 (4.4%) | 328 (5.0%) |
| Total | 7,206 (100.0%) | 6,513 (100.0%) |
Commute Time in Wabash County
The most frequently occuring commute durations in Wabash County are 5 to 9 minutes (2,740 commuters, 20.4%), 10 to 14 minutes (2,199 commuters, 16.4%), and 15 to 19 minutes (1,674 commuters, 12.5%).

| Commute Time | # Commuters | % Commuters |
| Less than 5 Minutes | 957 | 7.1% |
| 5 to 9 Minutes | 2,740 | 20.4% |
| 10 to 14 Minutes | 2,199 | 16.4% |
| 15 to 19 Minutes | 1,674 | 12.5% |
| 20 to 24 Minutes | 1,629 | 12.1% |
| 25 to 29 Minutes | 685 | 5.1% |
| 30 to 34 Minutes | 1,251 | 9.3% |
| 35 to 39 Minutes | 276 | 2.1% |
| 40 to 44 Minutes | 382 | 2.8% |
| 45 to 59 Minutes | 1,063 | 7.9% |
| 60 to 89 Minutes | 447 | 3.3% |
| 90 or more Minutes | 137 | 1.0% |
Commute Time by Sex in Wabash County
The most common commute times in Wabash County are 10 to 14 minutes (1,264 commuters, 18.1%) for males and 5 to 9 minutes (1,709 commuters, 26.5%) for females.

| Commute Time | Male | Female |
| Less than 5 Minutes | 565 (8.1%) | 392 (6.1%) |
| 5 to 9 Minutes | 1,031 (14.7%) | 1,709 (26.5%) |
| 10 to 14 Minutes | 1,264 (18.1%) | 935 (14.5%) |
| 15 to 19 Minutes | 831 (11.9%) | 843 (13.1%) |
| 20 to 24 Minutes | 690 (9.9%) | 939 (14.6%) |
| 25 to 29 Minutes | 438 (6.3%) | 247 (3.8%) |
| 30 to 34 Minutes | 814 (11.6%) | 437 (6.8%) |
| 35 to 39 Minutes | 146 (2.1%) | 130 (2.0%) |
| 40 to 44 Minutes | 212 (3.0%) | 170 (2.6%) |
| 45 to 59 Minutes | 605 (8.6%) | 458 (7.1%) |
| 60 to 89 Minutes | 304 (4.3%) | 143 (2.2%) |
| 90 or more Minutes | 95 (1.4%) | 42 (0.6%) |
Time of Departure to Work by Sex in Wabash County
The most frequent times of departure to work in Wabash County are 7:00 AM to 7:29 AM (976, 14.0%) for males and 7:30 AM to 7:59 AM (1,190, 18.5%) for females.

| Time of Departure | Male | Female |
| 12:00 AM to 4:59 AM | 638 (9.1%) | 297 (4.6%) |
| 5:00 AM to 5:29 AM | 375 (5.4%) | 321 (5.0%) |
| 5:30 AM to 5:59 AM | 392 (5.6%) | 428 (6.6%) |
| 6:00 AM to 6:29 AM | 653 (9.3%) | 249 (3.9%) |
| 6:30 AM to 6:59 AM | 973 (13.9%) | 618 (9.6%) |
| 7:00 AM to 7:29 AM | 976 (14.0%) | 755 (11.7%) |
| 7:30 AM to 7:59 AM | 765 (10.9%) | 1,190 (18.5%) |
| 8:00 AM to 8:29 AM | 554 (7.9%) | 526 (8.2%) |
| 8:30 AM to 8:59 AM | 262 (3.7%) | 194 (3.0%) |
| 9:00 AM to 9:59 AM | 165 (2.4%) | 517 (8.0%) |
| 10:00 AM to 10:59 AM | 142 (2.0%) | 204 (3.2%) |
| 11:00 AM to 11:59 AM | 56 (0.8%) | 82 (1.3%) |
| 12:00 PM to 3:59 PM | 598 (8.6%) | 491 (7.6%) |
| 4:00 PM to 11:59 PM | 446 (6.4%) | 573 (8.9%) |
| Total | 6,995 (100.0%) | 6,445 (100.0%) |
Housing Occupancy in Wabash County
Occupancy by Ownership in Wabash County
Of the total 12,471 dwellings in Wabash County, owner-occupied units account for 9,906 (79.4%), while renter-occupied units make up 2,565 (20.6%).
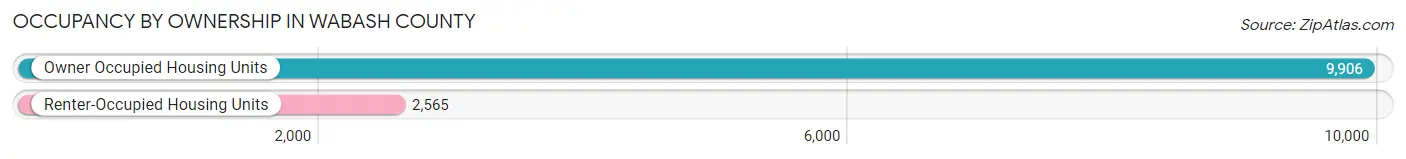
| Occupancy | # Housing Units | % Housing Units |
| Owner Occupied Housing Units | 9,906 | 79.4% |
| Renter-Occupied Housing Units | 2,565 | 20.6% |
| Total Occupied Housing Units | 12,471 | 100.0% |
Occupancy by Household Size in Wabash County
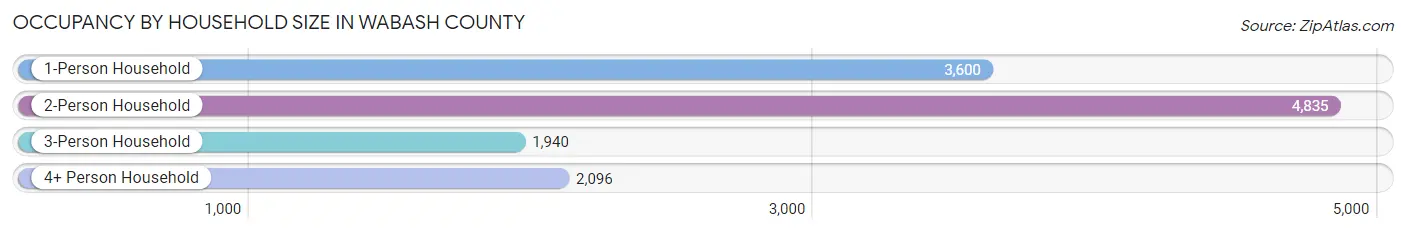
| Household Size | # Housing Units | % Housing Units |
| 1-Person Household | 3,600 | 28.9% |
| 2-Person Household | 4,835 | 38.8% |
| 3-Person Household | 1,940 | 15.6% |
| 4+ Person Household | 2,096 | 16.8% |
| Total Housing Units | 12,471 | 100.0% |
Occupancy by Ownership by Household Size in Wabash County

| Household Size | Owner-occupied | Renter-occupied |
| 1-Person Household | 2,546 (70.7%) | 1,054 (29.3%) |
| 2-Person Household | 4,169 (86.2%) | 666 (13.8%) |
| 3-Person Household | 1,524 (78.6%) | 416 (21.4%) |
| 4+ Person Household | 1,667 (79.5%) | 429 (20.5%) |
| Total Housing Units | 9,906 (79.4%) | 2,565 (20.6%) |
Occupancy by Educational Attainment in Wabash County
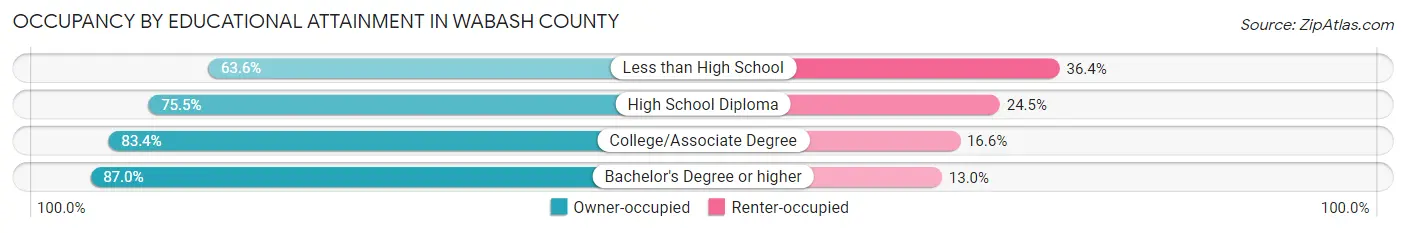
| Household Size | Owner-occupied | Renter-occupied |
| Less than High School | 602 (63.6%) | 344 (36.4%) |
| High School Diploma | 3,859 (75.5%) | 1,253 (24.5%) |
| College/Associate Degree | 3,086 (83.4%) | 615 (16.6%) |
| Bachelor's Degree or higher | 2,359 (87.0%) | 353 (13.0%) |
Occupancy by Age of Householder in Wabash County

| Age Bracket | # Households | % Households |
| Under 35 Years | 1,948 | 15.6% |
| 35 to 44 Years | 2,154 | 17.3% |
| 45 to 54 Years | 1,993 | 16.0% |
| 55 to 64 Years | 2,481 | 19.9% |
| 65 to 74 Years | 2,182 | 17.5% |
| 75 to 84 Years | 1,320 | 10.6% |
| 85 Years and Over | 393 | 3.2% |
| Total | 12,471 | 100.0% |
Housing Finances in Wabash County
Median Income by Occupancy in Wabash County
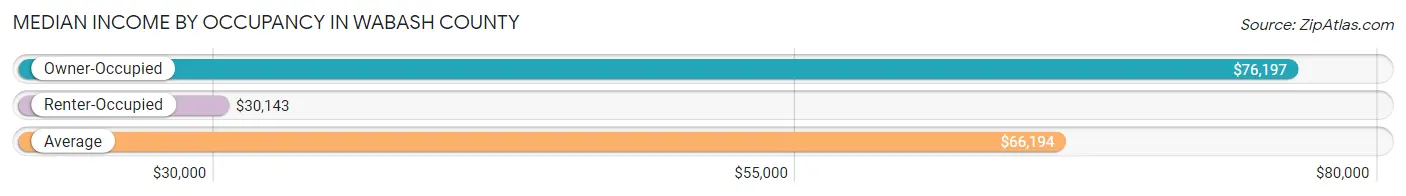
| Occupancy Type | # Households | Median Income |
| Owner-Occupied | 9,906 (79.4%) | $76,197 |
| Renter-Occupied | 2,565 (20.6%) | $30,143 |
| Average | 12,471 (100.0%) | $66,194 |
Occupancy by Householder Income Bracket in Wabash County

| Income Bracket | Owner-occupied | Renter-occupied |
| Less than $5,000 | 107 (1.1%) | 94 (3.7%) |
| $5,000 to $9,999 | 91 (0.9%) | 56 (2.2%) |
| $10,000 to $14,999 | 294 (3.0%) | 281 (11.0%) |
| $15,000 to $19,999 | 226 (2.3%) | 229 (8.9%) |
| $20,000 to $24,999 | 292 (2.9%) | 321 (12.5%) |
| $25,000 to $34,999 | 695 (7.0%) | 417 (16.3%) |
| $35,000 to $49,999 | 1,156 (11.7%) | 350 (13.7%) |
| $50,000 to $74,999 | 1,980 (20.0%) | 502 (19.6%) |
| $75,000 to $99,999 | 1,766 (17.8%) | 148 (5.8%) |
| $100,000 to $149,999 | 2,187 (22.1%) | 135 (5.3%) |
| $150,000 or more | 1,112 (11.2%) | 32 (1.3%) |
| Total | 9,906 (100.0%) | 2,565 (100.0%) |
Monthly Housing Cost Tiers in Wabash County
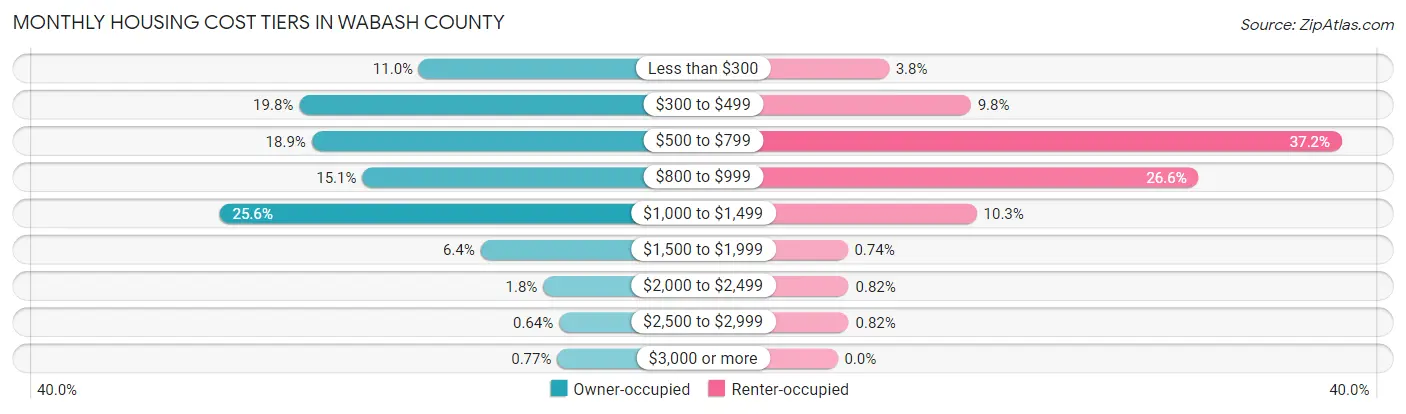
| Monthly Cost | Owner-occupied | Renter-occupied |
| Less than $300 | 1,086 (11.0%) | 97 (3.8%) |
| $300 to $499 | 1,959 (19.8%) | 252 (9.8%) |
| $500 to $799 | 1,868 (18.9%) | 953 (37.1%) |
| $800 to $999 | 1,499 (15.1%) | 682 (26.6%) |
| $1,000 to $1,499 | 2,540 (25.6%) | 263 (10.2%) |
| $1,500 to $1,999 | 636 (6.4%) | 19 (0.7%) |
| $2,000 to $2,499 | 179 (1.8%) | 21 (0.8%) |
| $2,500 to $2,999 | 63 (0.6%) | 21 (0.8%) |
| $3,000 or more | 76 (0.8%) | 0 (0.0%) |
| Total | 9,906 (100.0%) | 2,565 (100.0%) |
Physical Housing Characteristics in Wabash County
Housing Structures in Wabash County
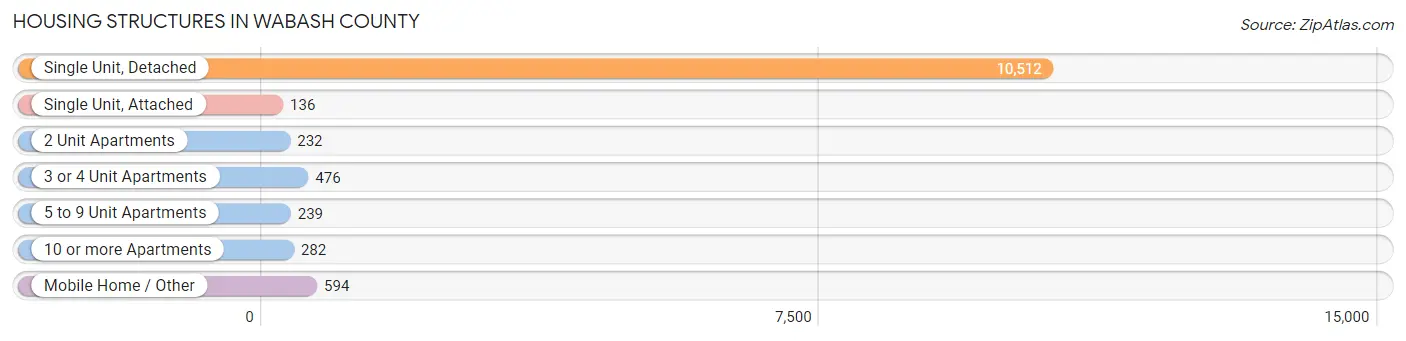
| Structure Type | # Housing Units | % Housing Units |
| Single Unit, Detached | 10,512 | 84.3% |
| Single Unit, Attached | 136 | 1.1% |
| 2 Unit Apartments | 232 | 1.9% |
| 3 or 4 Unit Apartments | 476 | 3.8% |
| 5 to 9 Unit Apartments | 239 | 1.9% |
| 10 or more Apartments | 282 | 2.3% |
| Mobile Home / Other | 594 | 4.8% |
| Total | 12,471 | 100.0% |
Housing Structures by Occupancy in Wabash County
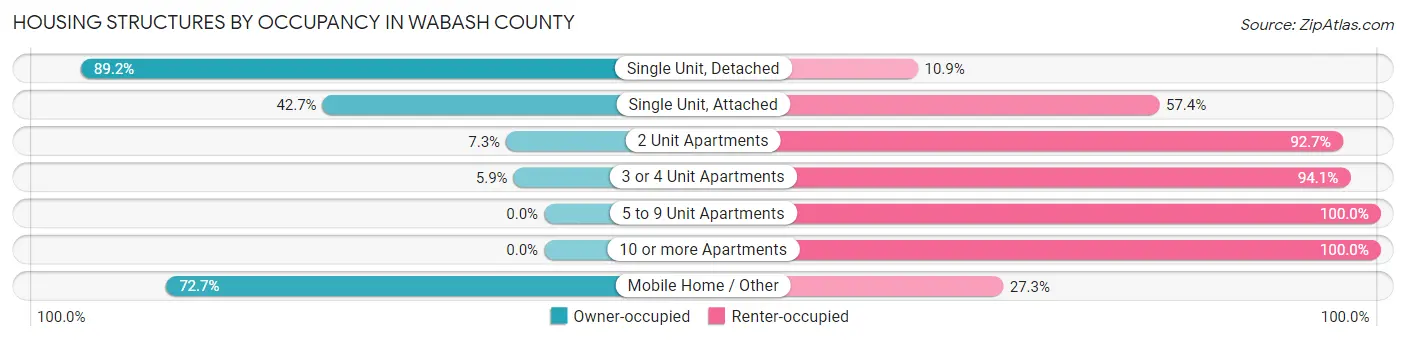
| Structure Type | Owner-occupied | Renter-occupied |
| Single Unit, Detached | 9,371 (89.1%) | 1,141 (10.8%) |
| Single Unit, Attached | 58 (42.6%) | 78 (57.4%) |
| 2 Unit Apartments | 17 (7.3%) | 215 (92.7%) |
| 3 or 4 Unit Apartments | 28 (5.9%) | 448 (94.1%) |
| 5 to 9 Unit Apartments | 0 (0.0%) | 239 (100.0%) |
| 10 or more Apartments | 0 (0.0%) | 282 (100.0%) |
| Mobile Home / Other | 432 (72.7%) | 162 (27.3%) |
| Total | 9,906 (79.4%) | 2,565 (20.6%) |
Housing Structures by Number of Rooms in Wabash County
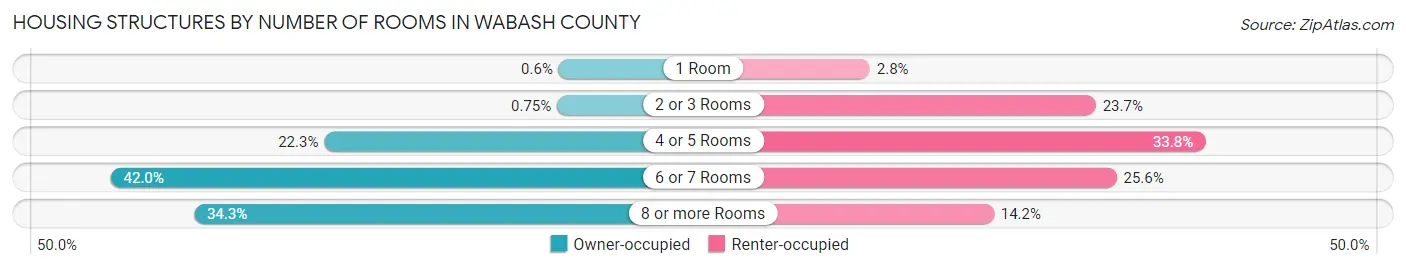
| Number of Rooms | Owner-occupied | Renter-occupied |
| 1 Room | 59 (0.6%) | 71 (2.8%) |
| 2 or 3 Rooms | 74 (0.7%) | 607 (23.7%) |
| 4 or 5 Rooms | 2,208 (22.3%) | 866 (33.8%) |
| 6 or 7 Rooms | 4,164 (42.0%) | 656 (25.6%) |
| 8 or more Rooms | 3,401 (34.3%) | 365 (14.2%) |
| Total | 9,906 (100.0%) | 2,565 (100.0%) |
Housing Structure by Heating Type in Wabash County
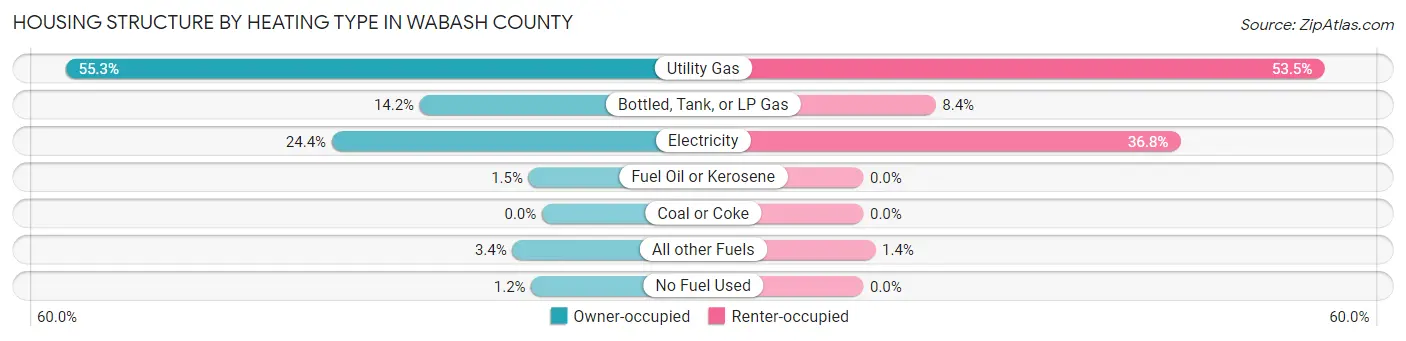
| Heating Type | Owner-occupied | Renter-occupied |
| Utility Gas | 5,473 (55.2%) | 1,371 (53.4%) |
| Bottled, Tank, or LP Gas | 1,403 (14.2%) | 215 (8.4%) |
| Electricity | 2,414 (24.4%) | 943 (36.8%) |
| Fuel Oil or Kerosene | 153 (1.5%) | 0 (0.0%) |
| Coal or Coke | 0 (0.0%) | 0 (0.0%) |
| All other Fuels | 340 (3.4%) | 36 (1.4%) |
| No Fuel Used | 123 (1.2%) | 0 (0.0%) |
| Total | 9,906 (100.0%) | 2,565 (100.0%) |
Household Vehicle Usage in Wabash County
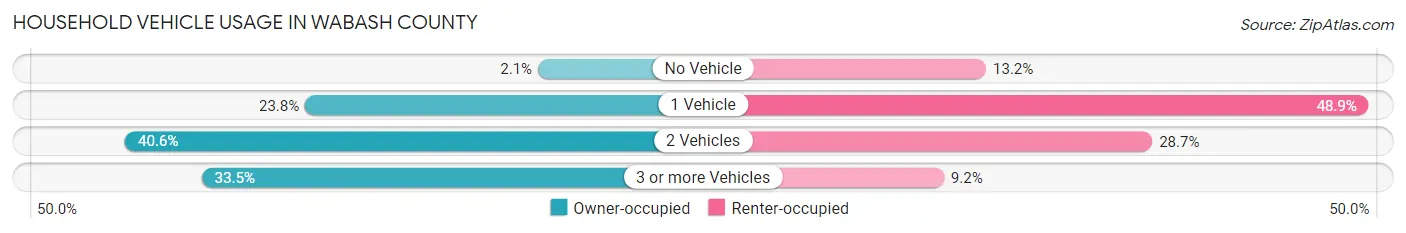
| Vehicles per Household | Owner-occupied | Renter-occupied |
| No Vehicle | 206 (2.1%) | 338 (13.2%) |
| 1 Vehicle | 2,360 (23.8%) | 1,254 (48.9%) |
| 2 Vehicles | 4,024 (40.6%) | 736 (28.7%) |
| 3 or more Vehicles | 3,316 (33.5%) | 237 (9.2%) |
| Total | 9,906 (100.0%) | 2,565 (100.0%) |
Real Estate & Mortgages in Wabash County
Real Estate and Mortgage Overview in Wabash County
| Characteristic | Without Mortgage | With Mortgage |
| Housing Units | 3,786 | 6,120 |
| Median Property Value | $115,700 | $145,200 |
| Median Household Income | $58,194 | $756 |
| Monthly Housing Costs | $391 | $76 |
| Real Estate Taxes | $564 | $280 |
Property Value by Mortgage Status in Wabash County

| Property Value | Without Mortgage | With Mortgage |
| Less than $50,000 | 632 (16.7%) | 167 (2.7%) |
| $50,000 to $99,999 | 978 (25.8%) | 1,383 (22.6%) |
| $100,000 to $299,999 | 1,840 (48.6%) | 3,981 (65.0%) |
| $300,000 to $499,999 | 193 (5.1%) | 470 (7.7%) |
| $500,000 to $749,999 | 88 (2.3%) | 63 (1.0%) |
| $750,000 to $999,999 | 33 (0.9%) | 46 (0.7%) |
| $1,000,000 or more | 22 (0.6%) | 10 (0.2%) |
| Total | 3,786 (100.0%) | 6,120 (100.0%) |
Household Income by Mortgage Status in Wabash County

| Household Income | Without Mortgage | With Mortgage |
| Less than $10,000 | 132 (3.5%) | 264 (4.3%) |
| $10,000 to $24,999 | 445 (11.7%) | 66 (1.1%) |
| $25,000 to $34,999 | 392 (10.3%) | 367 (6.0%) |
| $35,000 to $49,999 | 705 (18.6%) | 303 (5.0%) |
| $50,000 to $74,999 | 579 (15.3%) | 451 (7.4%) |
| $75,000 to $99,999 | 547 (14.4%) | 1,401 (22.9%) |
| $100,000 to $149,999 | 630 (16.6%) | 1,219 (19.9%) |
| $150,000 or more | 356 (9.4%) | 1,557 (25.4%) |
| Total | 3,786 (100.0%) | 6,120 (100.0%) |
Property Value to Household Income Ratio in Wabash County

| Value-to-Income Ratio | Without Mortgage | With Mortgage |
| Less than 2.0x | 1,927 (50.9%) | 84,973 (1,388.4%) |
| 2.0x to 2.9x | 588 (15.5%) | 3,540 (57.8%) |
| 3.0x to 3.9x | 509 (13.4%) | 1,191 (19.5%) |
| 4.0x or more | 713 (18.8%) | 411 (6.7%) |
| Total | 3,786 (100.0%) | 6,120 (100.0%) |
Real Estate Taxes by Mortgage Status in Wabash County

| Property Taxes | Without Mortgage | With Mortgage |
| Less than $800 | 2,264 (59.8%) | 29 (0.5%) |
| $800 to $1,499 | 688 (18.2%) | 2,948 (48.2%) |
| $800 to $1,499 | 599 (15.8%) | 1,878 (30.7%) |
| Total | 3,786 (100.0%) | 6,120 (100.0%) |
Health & Disability in Wabash County
Health Insurance Coverage by Age in Wabash County

| Age Bracket | With Coverage | Without Coverage |
| Under 6 Years | 1,798 (94.4%) | 107 (5.6%) |
| 6 to 18 Years | 4,834 (95.8%) | 210 (4.2%) |
| 19 to 25 Years | 2,368 (88.2%) | 316 (11.8%) |
| 26 to 34 Years | 2,617 (88.6%) | 336 (11.4%) |
| 35 to 44 Years | 2,871 (83.7%) | 560 (16.3%) |
| 45 to 54 Years | 3,390 (91.9%) | 297 (8.1%) |
| 55 to 64 Years | 4,079 (94.8%) | 222 (5.2%) |
| 65 to 74 Years | 3,503 (99.3%) | 25 (0.7%) |
| 75 Years and older | 2,497 (100.0%) | 0 (0.0%) |
| Total | 27,957 (93.1%) | 2,073 (6.9%) |
Health Insurance Coverage by Citizenship Status in Wabash County

| Citizenship Status | With Coverage | Without Coverage |
| Native Born | 1,798 (94.4%) | 107 (5.6%) |
| Foreign Born, Citizen | 4,834 (95.8%) | 210 (4.2%) |
| Foreign Born, not a Citizen | 2,368 (88.2%) | 316 (11.8%) |
Health Insurance Coverage by Household Income in Wabash County

| Household Income | With Coverage | Without Coverage |
| Under $25,000 | 3,004 (91.8%) | 269 (8.2%) |
| $25,000 to $49,999 | 5,091 (91.9%) | 446 (8.1%) |
| $50,000 to $74,999 | 5,129 (91.1%) | 500 (8.9%) |
| $75,000 to $99,999 | 4,660 (93.0%) | 350 (7.0%) |
| $100,000 and over | 9,316 (95.4%) | 451 (4.6%) |
Public vs Private Health Insurance Coverage by Age in Wabash County
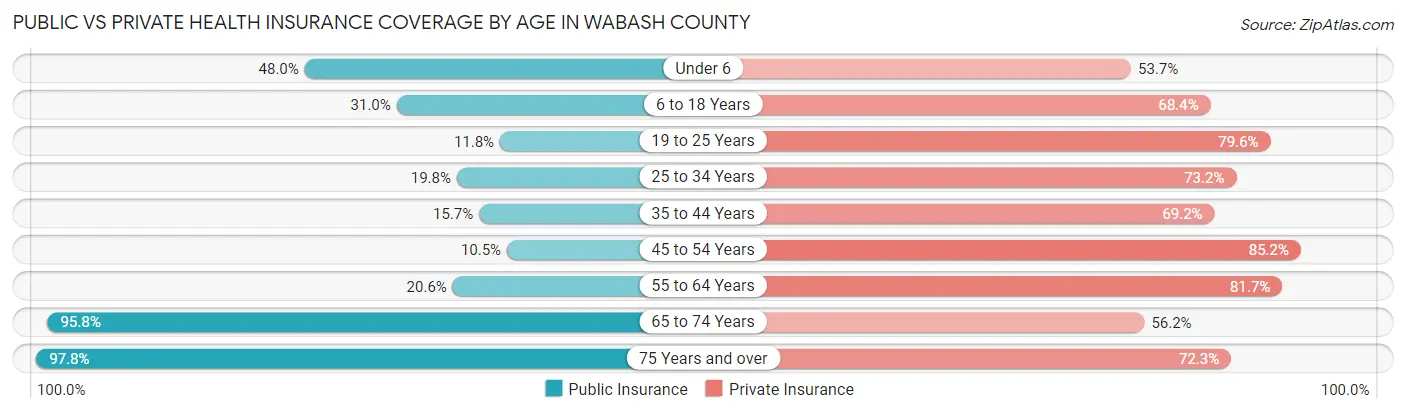
| Age Bracket | Public Insurance | Private Insurance |
| Under 6 | 915 (48.0%) | 1,023 (53.7%) |
| 6 to 18 Years | 1,561 (30.9%) | 3,452 (68.4%) |
| 19 to 25 Years | 316 (11.8%) | 2,135 (79.5%) |
| 25 to 34 Years | 584 (19.8%) | 2,162 (73.2%) |
| 35 to 44 Years | 537 (15.7%) | 2,373 (69.2%) |
| 45 to 54 Years | 386 (10.5%) | 3,141 (85.2%) |
| 55 to 64 Years | 884 (20.5%) | 3,515 (81.7%) |
| 65 to 74 Years | 3,378 (95.8%) | 1,982 (56.2%) |
| 75 Years and over | 2,443 (97.8%) | 1,804 (72.3%) |
| Total | 11,004 (36.6%) | 21,587 (71.9%) |
Disability Status by Sex by Age in Wabash County

| Age Bracket | Male | Female |
| Under 5 Years | 11 (1.4%) | 0 (0.0%) |
| 5 to 17 Years | 140 (6.0%) | 119 (4.8%) |
| 18 to 34 Years | 307 (9.9%) | 119 (3.8%) |
| 35 to 64 Years | 1,049 (18.2%) | 750 (13.3%) |
| 65 to 74 Years | 422 (24.5%) | 414 (22.9%) |
| 75 Years and over | 502 (51.4%) | 744 (48.9%) |
Disability Class by Sex by Age in Wabash County
Disability Class: Hearing Difficulty
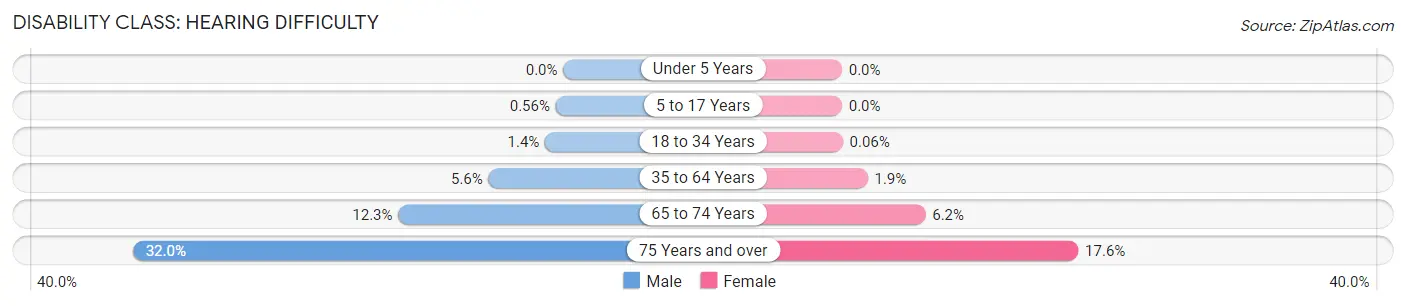
| Age Bracket | Male | Female |
| Under 5 Years | 0 (0.0%) | 0 (0.0%) |
| 5 to 17 Years | 13 (0.6%) | 0 (0.0%) |
| 18 to 34 Years | 42 (1.3%) | 2 (0.1%) |
| 35 to 64 Years | 320 (5.6%) | 108 (1.9%) |
| 65 to 74 Years | 211 (12.2%) | 112 (6.2%) |
| 75 Years and over | 312 (32.0%) | 267 (17.5%) |
Disability Class: Vision Difficulty

| Age Bracket | Male | Female |
| Under 5 Years | 11 (1.4%) | 0 (0.0%) |
| 5 to 17 Years | 10 (0.4%) | 27 (1.1%) |
| 18 to 34 Years | 49 (1.6%) | 24 (0.8%) |
| 35 to 64 Years | 217 (3.8%) | 173 (3.1%) |
| 65 to 74 Years | 28 (1.6%) | 65 (3.6%) |
| 75 Years and over | 85 (8.7%) | 151 (9.9%) |
Disability Class: Cognitive Difficulty

| Age Bracket | Male | Female |
| 5 to 17 Years | 84 (3.6%) | 86 (3.5%) |
| 18 to 34 Years | 220 (7.1%) | 83 (2.7%) |
| 35 to 64 Years | 358 (6.2%) | 266 (4.7%) |
| 65 to 74 Years | 72 (4.2%) | 36 (2.0%) |
| 75 Years and over | 46 (4.7%) | 215 (14.1%) |
Disability Class: Ambulatory Difficulty

| Age Bracket | Male | Female |
| 5 to 17 Years | 0 (0.0%) | 0 (0.0%) |
| 18 to 34 Years | 72 (2.3%) | 18 (0.6%) |
| 35 to 64 Years | 413 (7.2%) | 443 (7.8%) |
| 65 to 74 Years | 223 (13.0%) | 288 (16.0%) |
| 75 Years and over | 176 (18.0%) | 499 (32.8%) |
Disability Class: Self-Care Difficulty
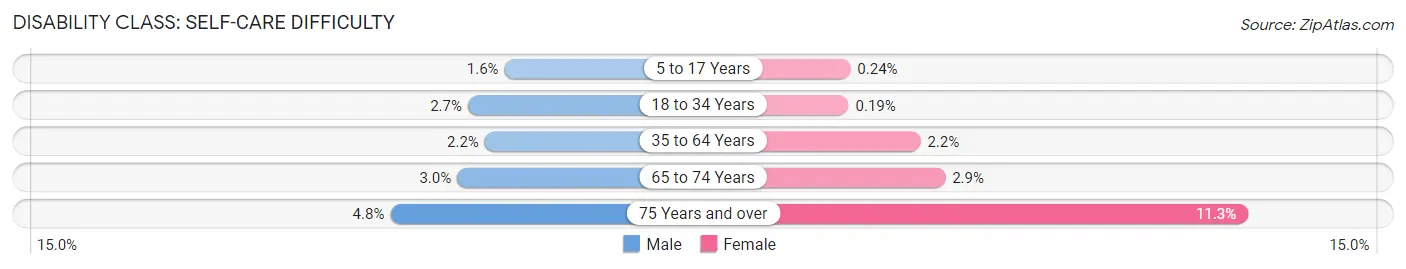
| Age Bracket | Male | Female |
| 5 to 17 Years | 38 (1.6%) | 6 (0.2%) |
| 18 to 34 Years | 83 (2.7%) | 6 (0.2%) |
| 35 to 64 Years | 126 (2.2%) | 124 (2.2%) |
| 65 to 74 Years | 51 (3.0%) | 52 (2.9%) |
| 75 Years and over | 47 (4.8%) | 172 (11.3%) |
Technology Access in Wabash County
Computing Device Access in Wabash County
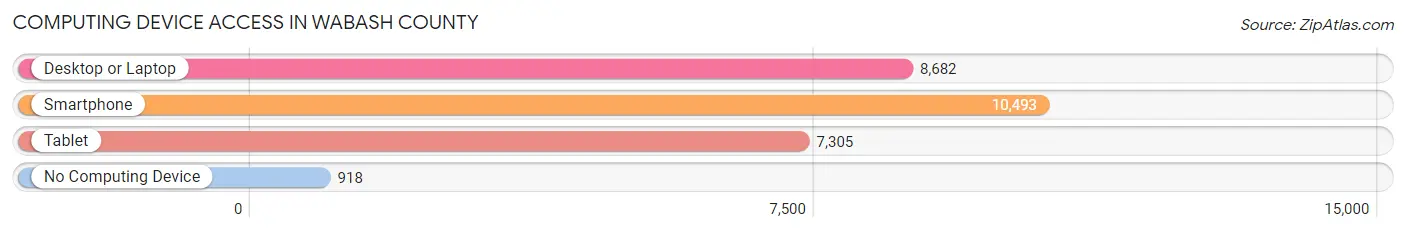
| Device Type | # Households | % Households |
| Desktop or Laptop | 8,682 | 69.6% |
| Smartphone | 10,493 | 84.1% |
| Tablet | 7,305 | 58.6% |
| No Computing Device | 918 | 7.4% |
| Total | 12,471 | 100.0% |
Internet Access in Wabash County
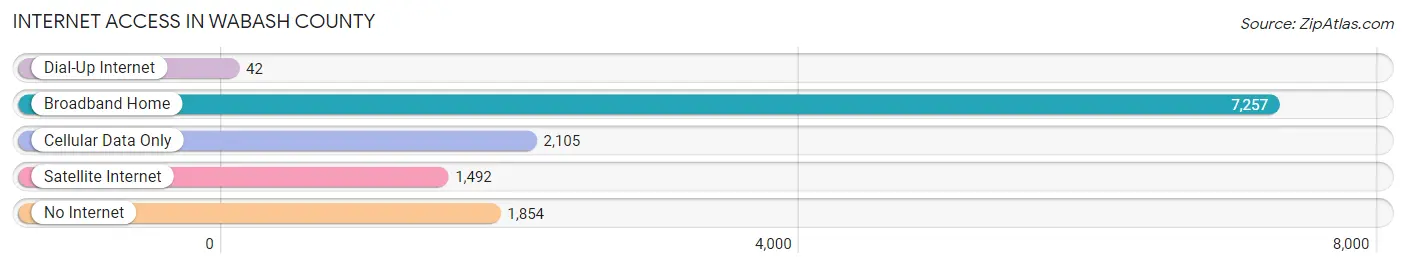
| Internet Type | # Households | % Households |
| Dial-Up Internet | 42 | 0.3% |
| Broadband Home | 7,257 | 58.2% |
| Cellular Data Only | 2,105 | 16.9% |
| Satellite Internet | 1,492 | 12.0% |
| No Internet | 1,854 | 14.9% |
| Total | 12,471 | 100.0% |
Wabash County Summary
Wabash County, Indiana is located in the north-central part of the state, and is bordered by Grant, Huntington, Miami, and Whitley counties. The county seat is Wabash, and the county was named for the Wabash River, which runs through it. The county has a total area of 437 square miles, of which 434 square miles is land and 3 square miles is water.
The population of Wabash County was 32,888 in the 2010 census, a decrease of 4.2% from the 2000 census. The population density was 75 people per square mile. The racial makeup of the county was 95.2% White, 1.3% African American, 0.3% Native American, 0.4% Asian, 0.1% Pacific Islander, 1.7% from other races, and 1.1% from two or more races. Hispanic or Latino of any race were 3.3% of the population.
The median income for a household in Wabash County was $41,845, and the median income for a family was $50,945. The per capita income for the county was $20,945. About 10.2% of families and 13.2% of the population were below the poverty line, including 17.2% of those under age 18 and 8.2% of those age 65 or over.
The economy of Wabash County is largely based on agriculture, manufacturing, and retail. The county is home to several large employers, including Wabash National Corporation, a manufacturer of semi-trailers, and Honeywell International, a manufacturer of aerospace and automotive products. Other major employers include Wabash Valley Power Association, a utility company, and Wabash County Hospital, a healthcare provider.
The county is also home to several educational institutions, including Manchester University, a private liberal arts college, and Ivy Tech Community College, a public two-year college. The county is served by the Wabash County Public Library System, which has branches in Wabash, North Manchester, and Lagro.
Wabash County is home to several parks and recreational areas, including the Wabash River Trail, a hiking and biking trail that runs along the Wabash River. The county is also home to several historic sites, including the Wabash County Courthouse, the Wabash County Historical Museum, and the Wabash County Jail.
Wabash County is a great place to live, work, and play. With its strong economy, diverse population, and abundance of recreational opportunities, Wabash County is a great place to call home.
Common Questions
What is the Total Population of Wabash County?
Total Population of Wabash County is 31,032.
What is the Total Male Population of Wabash County?
Total Male Population of Wabash County is 15,174.
What is the Total Female Population of Wabash County?
Total Female Population of Wabash County is 15,858.
What is the Ratio of Males per 100 Females in Wabash County?
There are 95.69 Males per 100 Females in Wabash County.
What is the Ratio of Females per 100 Males in Wabash County?
There are 104.51 Females per 100 Males in Wabash County.
What is the Median Population Age in Wabash County?
Median Population Age in Wabash County is 42.8 Years.
What is the Average Family Size in Wabash County
Average Family Size in Wabash County is 2.9 People.
What is the Average Household Size in Wabash County
Average Household Size in Wabash County is 2.3 People.
What is Per Capita Income in Wabash County?
Per Capita income in Wabash County is $32,763.
What is the Median Family Income in Wabash County?
Median Family Income in Wabash County is $78,110.
What is the Median Household income in Wabash County?
Median Household Income in Wabash County is $66,194.
What is Income or Wage Gap in Wabash County?
Income or Wage Gap in Wabash County is 43.9%.
Women in Wabash County earn 56.1 cents for every dollar earned by a man.
What is Family Income Deficit in Wabash County?
Family Income Deficit in Wabash County is $10,415.
Families that are below poverty line in Wabash County earn $10,415 less on average than the poverty threshold level.
What is Inequality or Gini Index in Wabash County?
Inequality or Gini Index in Wabash County is 0.41.
How Large is the Labor Force in Wabash County?
There are 14,934 People in the Labor Forcein in Wabash County.
What is the Percentage of People in the Labor Force in Wabash County?
59.2% of People are in the Labor Force in Wabash County.
What is the Unemployment Rate in Wabash County?
Unemployment Rate in Wabash County is 3.5%.