Vigo County, IN
Vigo County Map
Vigo County Overview
106,355
TOTAL POPULATION
53,823
MALE POPULATION
52,532
FEMALE POPULATION
102.46
MALES / 100 FEMALES
97.60
FEMALES / 100 MALES
36.4
MEDIAN AGE
3.0
AVG FAMILY SIZE
2.3
AVG HOUSEHOLD SIZE
$30,240
PER CAPITA INCOME
$71,371
AVG FAMILY INCOME
$52,789
AVG HOUSEHOLD INCOME
31.0%
WAGE / INCOME GAP [ % ]
69.0¢/ $1
WAGE / INCOME GAP [ $ ]
$11,546
FAMILY INCOME DEFICIT
0.47
INEQUALITY / GINI INDEX
52,178
LABOR FORCE [ PEOPLE ]
59.8%
PERCENT IN LABOR FORCE
6.1%
UNEMPLOYMENT RATE
Vigo County Area Codes
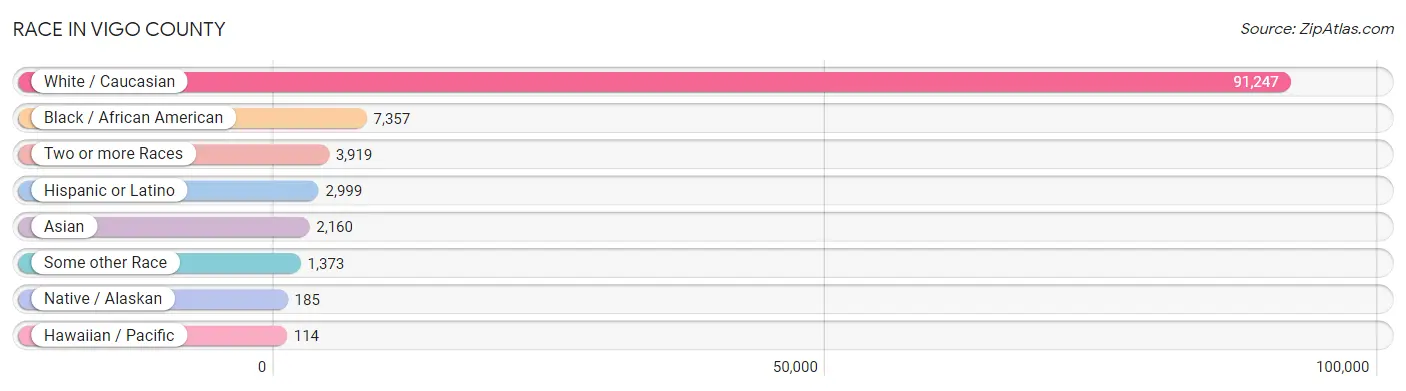
Race in Vigo County
The most populous races in Vigo County are White / Caucasian (91,247 | 85.8%), Black / African American (7,357 | 6.9%), and Two or more Races (3,919 | 3.7%).
| Race | # Population | % Population |
| Asian | 2,160 | 2.0% |
| Black / African American | 7,357 | 6.9% |
| Hawaiian / Pacific | 114 | 0.1% |
| Hispanic or Latino | 2,999 | 2.8% |
| Native / Alaskan | 185 | 0.2% |
| White / Caucasian | 91,247 | 85.8% |
| Two or more Races | 3,919 | 3.7% |
| Some other Race | 1,373 | 1.3% |
| Total | 106,355 | 100.0% |
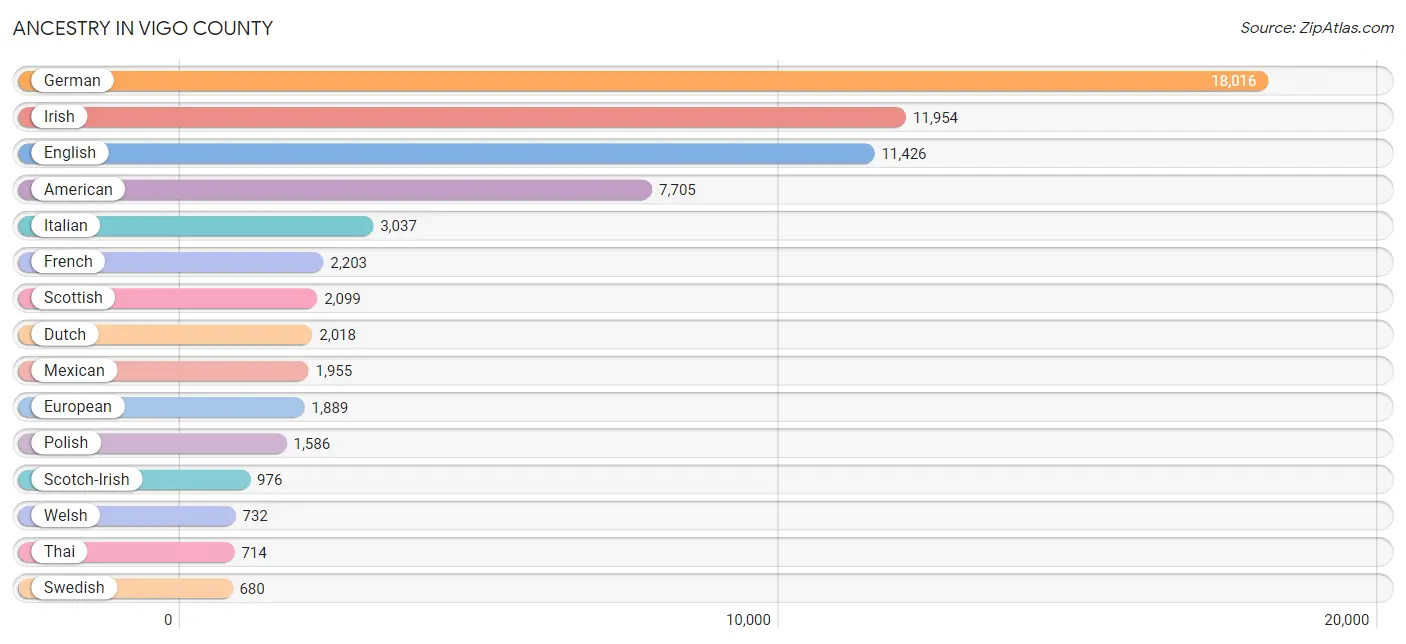
Ancestry in Vigo County
The most populous ancestries reported in Vigo County are German (18,016 | 16.9%), Irish (11,954 | 11.2%), English (11,426 | 10.7%), American (7,705 | 7.2%), and Italian (3,037 | 2.9%), together accounting for 49.0% of all Vigo County residents.
| Ancestry | # Population | % Population |
| African | 226 | 0.2% |
| American | 7,705 | 7.2% |
| Apache | 12 | 0.0% |
| Arab | 299 | 0.3% |
| Armenian | 6 | 0.0% |
| Australian | 77 | 0.1% |
| Austrian | 116 | 0.1% |
| Belgian | 29 | 0.0% |
| Bhutanese | 149 | 0.1% |
| Blackfeet | 53 | 0.1% |
| British | 419 | 0.4% |
| Burmese | 225 | 0.2% |
| Cajun | 27 | 0.0% |
| Cambodian | 6 | 0.0% |
| Canadian | 145 | 0.1% |
| Celtic | 2 | 0.0% |
| Central American | 176 | 0.2% |
| Central American Indian | 11 | 0.0% |
| Cherokee | 254 | 0.2% |
| Cheyenne | 3 | 0.0% |
| Choctaw | 21 | 0.0% |
| Colombian | 71 | 0.1% |
| Croatian | 25 | 0.0% |
| Cuban | 32 | 0.0% |
| Czech | 143 | 0.1% |
| Czechoslovakian | 52 | 0.1% |
| Danish | 128 | 0.1% |
| Dominican | 35 | 0.0% |
| Dutch | 2,018 | 1.9% |
| Eastern European | 151 | 0.1% |
| Ecuadorian | 21 | 0.0% |
| English | 11,426 | 10.7% |
| European | 1,889 | 1.8% |
| Filipino | 99 | 0.1% |
| Finnish | 93 | 0.1% |
| French | 2,203 | 2.1% |
| French Canadian | 108 | 0.1% |
| German | 18,016 | 16.9% |
| Ghanaian | 16 | 0.0% |
| Greek | 230 | 0.2% |
| Guatemalan | 69 | 0.1% |
| Haitian | 11 | 0.0% |
| Hmong | 118 | 0.1% |
| Honduran | 23 | 0.0% |
| Hungarian | 450 | 0.4% |
| Icelander | 7 | 0.0% |
| Indian (Asian) | 649 | 0.6% |
| Inupiat | 5 | 0.0% |
| Iranian | 95 | 0.1% |
| Irish | 11,954 | 11.2% |
| Israeli | 26 | 0.0% |
| Italian | 3,037 | 2.9% |
| Japanese | 4 | 0.0% |
| Kenyan | 23 | 0.0% |
| Korean | 641 | 0.6% |
| Laotian | 13 | 0.0% |
| Lithuanian | 189 | 0.2% |
| Lumbee | 4 | 0.0% |
| Macedonian | 58 | 0.1% |
| Malaysian | 7 | 0.0% |
| Mexican | 1,955 | 1.8% |
| Mexican American Indian | 44 | 0.0% |
| Moroccan | 14 | 0.0% |
| Native Hawaiian | 90 | 0.1% |
| Navajo | 33 | 0.0% |
| Nigerian | 45 | 0.0% |
| Northern European | 246 | 0.2% |
| Norwegian | 426 | 0.4% |
| Okinawan | 16 | 0.0% |
| Pakistani | 12 | 0.0% |
| Palestinian | 46 | 0.0% |
| Pennsylvania German | 39 | 0.0% |
| Polish | 1,586 | 1.5% |
| Portuguese | 70 | 0.1% |
| Puerto Rican | 300 | 0.3% |
| Romanian | 161 | 0.2% |
| Russian | 271 | 0.3% |
| Salvadoran | 84 | 0.1% |
| Samoan | 53 | 0.1% |
| Scandinavian | 142 | 0.1% |
| Scotch-Irish | 976 | 0.9% |
| Scottish | 2,099 | 2.0% |
| Serbian | 112 | 0.1% |
| Sioux | 58 | 0.1% |
| Slavic | 74 | 0.1% |
| Slovak | 118 | 0.1% |
| Slovene | 34 | 0.0% |
| South American | 92 | 0.1% |
| Spaniard | 21 | 0.0% |
| Spanish | 24 | 0.0% |
| Sri Lankan | 39 | 0.0% |
| Subsaharan African | 450 | 0.4% |
| Swedish | 680 | 0.6% |
| Swiss | 165 | 0.2% |
| Syrian | 186 | 0.2% |
| Thai | 714 | 0.7% |
| Turkish | 6 | 0.0% |
| Ukrainian | 52 | 0.1% |
| Ute | 31 | 0.0% |
| Vietnamese | 1 | 0.0% |
| Welsh | 732 | 0.7% |
| Yugoslavian | 105 | 0.1% | View All 102 Rows |
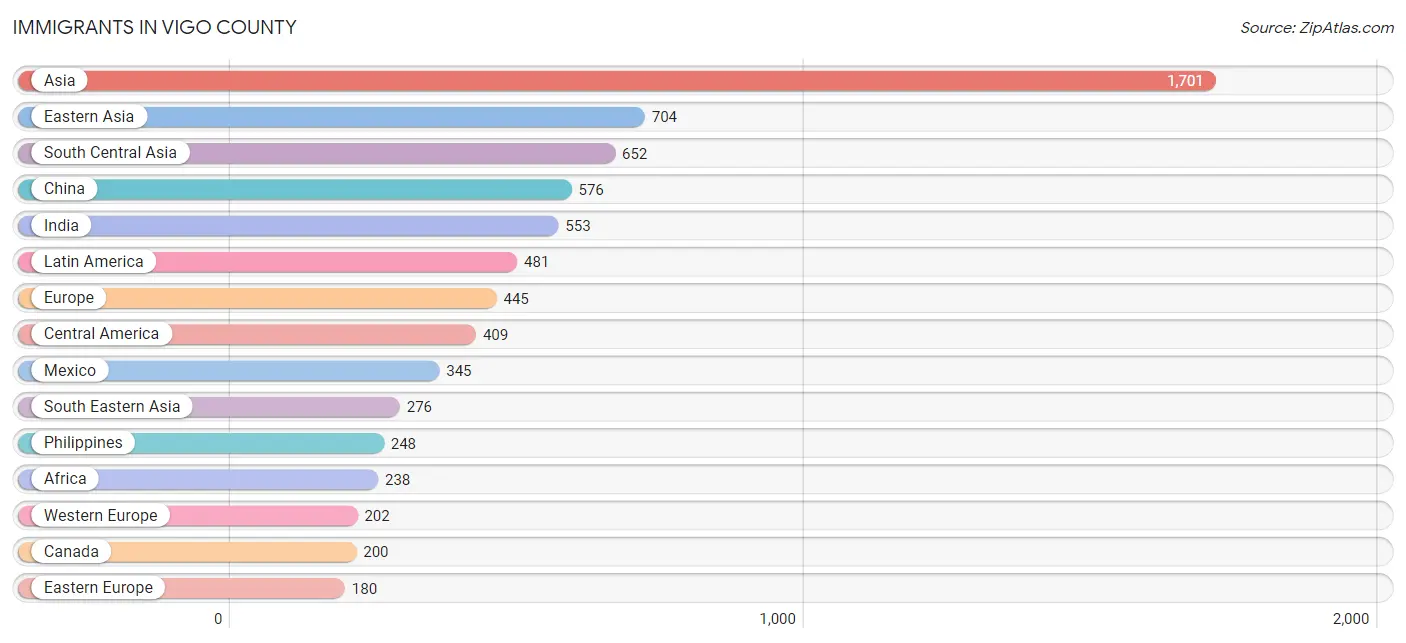
Immigrants in Vigo County
The most numerous immigrant groups reported in Vigo County came from Asia (1,701 | 1.6%), Eastern Asia (704 | 0.7%), South Central Asia (652 | 0.6%), China (576 | 0.5%), and India (553 | 0.5%), together accounting for 3.9% of all Vigo County residents.
| Immigration Origin | # Population | % Population |
| Africa | 238 | 0.2% |
| Asia | 1,701 | 1.6% |
| Australia | 15 | 0.0% |
| Bangladesh | 1 | 0.0% |
| Bosnia and Herzegovina | 26 | 0.0% |
| Brazil | 16 | 0.0% |
| Cameroon | 51 | 0.1% |
| Canada | 200 | 0.2% |
| Caribbean | 56 | 0.1% |
| Central America | 409 | 0.4% |
| China | 576 | 0.5% |
| Congo | 18 | 0.0% |
| Cuba | 37 | 0.0% |
| Denmark | 17 | 0.0% |
| Dominican Republic | 17 | 0.0% |
| Eastern Africa | 26 | 0.0% |
| Eastern Asia | 704 | 0.7% |
| Eastern Europe | 180 | 0.2% |
| El Salvador | 21 | 0.0% |
| England | 21 | 0.0% |
| Europe | 445 | 0.4% |
| France | 31 | 0.0% |
| Germany | 146 | 0.1% |
| Ghana | 44 | 0.0% |
| Honduras | 33 | 0.0% |
| India | 553 | 0.5% |
| Iran | 73 | 0.1% |
| Japan | 14 | 0.0% |
| Kenya | 26 | 0.0% |
| Korea | 114 | 0.1% |
| Kuwait | 10 | 0.0% |
| Latin America | 481 | 0.4% |
| Lebanon | 10 | 0.0% |
| Mexico | 345 | 0.3% |
| Middle Africa | 69 | 0.1% |
| Morocco | 6 | 0.0% |
| Netherlands | 19 | 0.0% |
| Nicaragua | 10 | 0.0% |
| Nigeria | 45 | 0.0% |
| Northern Africa | 6 | 0.0% |
| Northern Europe | 53 | 0.1% |
| Oceania | 15 | 0.0% |
| Pakistan | 25 | 0.0% |
| Philippines | 248 | 0.2% |
| Poland | 14 | 0.0% |
| Portugal | 10 | 0.0% |
| Russia | 57 | 0.1% |
| Saudi Arabia | 29 | 0.0% |
| Scotland | 15 | 0.0% |
| Serbia | 83 | 0.1% |
| Singapore | 16 | 0.0% |
| South America | 16 | 0.0% |
| South Central Asia | 652 | 0.6% |
| South Eastern Asia | 276 | 0.3% |
| Southern Europe | 10 | 0.0% |
| Switzerland | 6 | 0.0% |
| Syria | 20 | 0.0% |
| Taiwan | 176 | 0.2% |
| Thailand | 12 | 0.0% |
| Western Africa | 89 | 0.1% |
| Western Asia | 69 | 0.1% |
| Western Europe | 202 | 0.2% | View All 62 Rows |
Sex and Age in Vigo County
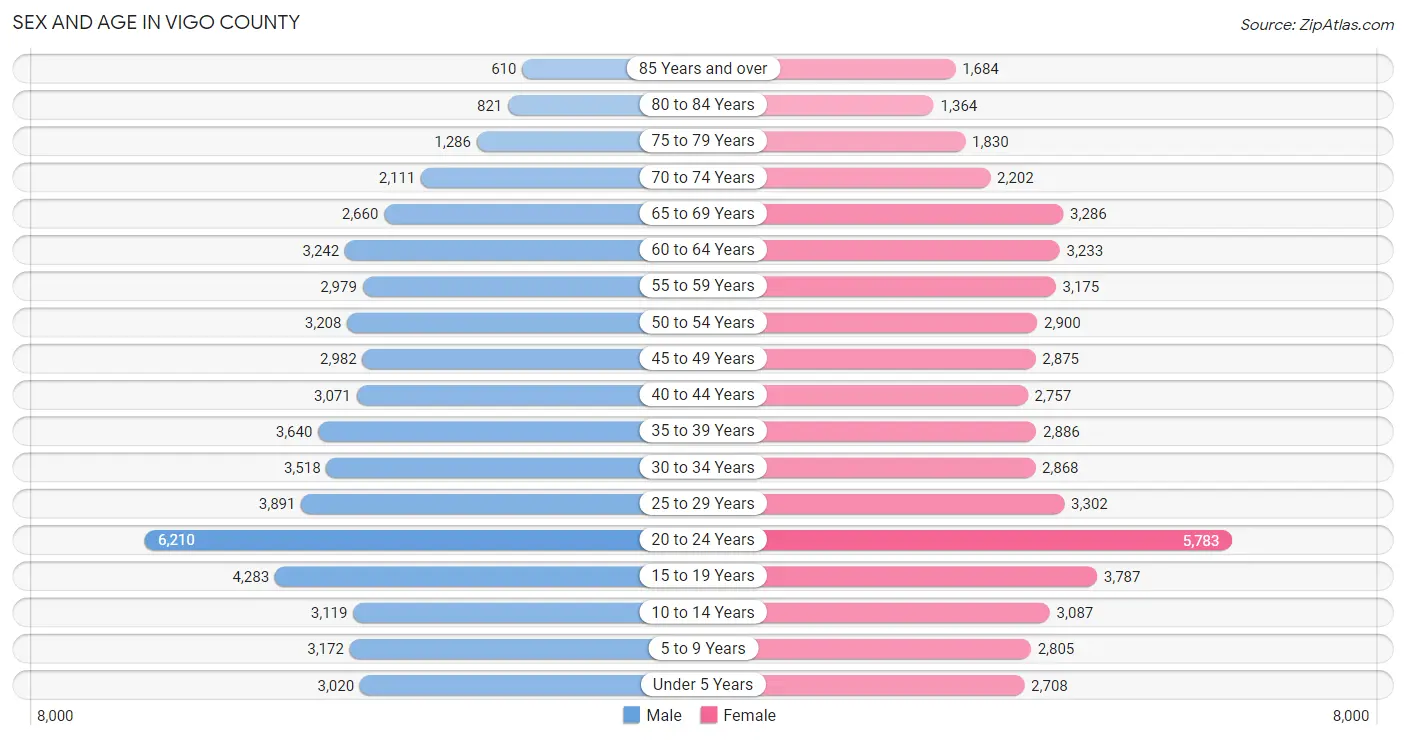
Sex and Age in Vigo County
The most populous age groups in Vigo County are 20 to 24 Years (6,210 | 11.5%) for men and 20 to 24 Years (5,783 | 11.0%) for women.
| Age Bracket | Male | Female |
| Under 5 Years | 3,020 (5.6%) | 2,708 (5.1%) |
| 5 to 9 Years | 3,172 (5.9%) | 2,805 (5.3%) |
| 10 to 14 Years | 3,119 (5.8%) | 3,087 (5.9%) |
| 15 to 19 Years | 4,283 (8.0%) | 3,787 (7.2%) |
| 20 to 24 Years | 6,210 (11.5%) | 5,783 (11.0%) |
| 25 to 29 Years | 3,891 (7.2%) | 3,302 (6.3%) |
| 30 to 34 Years | 3,518 (6.5%) | 2,868 (5.5%) |
| 35 to 39 Years | 3,640 (6.8%) | 2,886 (5.5%) |
| 40 to 44 Years | 3,071 (5.7%) | 2,757 (5.2%) |
| 45 to 49 Years | 2,982 (5.5%) | 2,875 (5.5%) |
| 50 to 54 Years | 3,208 (6.0%) | 2,900 (5.5%) |
| 55 to 59 Years | 2,979 (5.5%) | 3,175 (6.0%) |
| 60 to 64 Years | 3,242 (6.0%) | 3,233 (6.1%) |
| 65 to 69 Years | 2,660 (4.9%) | 3,286 (6.3%) |
| 70 to 74 Years | 2,111 (3.9%) | 2,202 (4.2%) |
| 75 to 79 Years | 1,286 (2.4%) | 1,830 (3.5%) |
| 80 to 84 Years | 821 (1.5%) | 1,364 (2.6%) |
| 85 Years and over | 610 (1.1%) | 1,684 (3.2%) |
| Total | 53,823 (100.0%) | 52,532 (100.0%) |
Families and Households in Vigo County
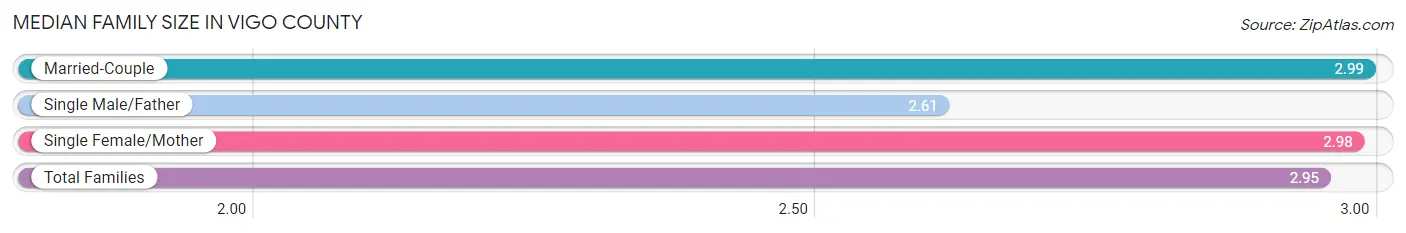
Median Family Size in Vigo County
The median family size in Vigo County is 2.95 persons per family, with married-couple families (17,071 | 70.4%) accounting for the largest median family size of 2.99 persons per family. On the other hand, single male/father families (2,541 | 10.5%) represent the smallest median family size with 2.61 persons per family.
| Family Type | # Families | Family Size |
| Married-Couple | 17,071 (70.4%) | 2.99 |
| Single Male/Father | 2,541 (10.5%) | 2.61 |
| Single Female/Mother | 4,651 (19.2%) | 2.98 |
| Total Families | 24,263 (100.0%) | 2.95 |
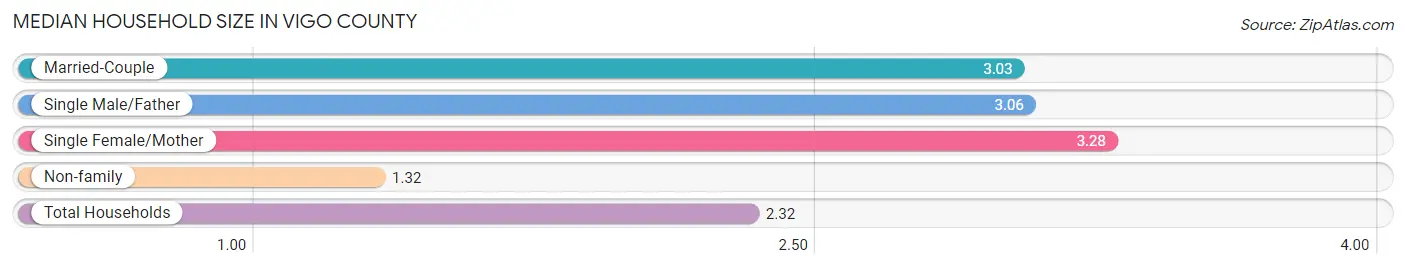
Median Household Size in Vigo County
The median household size in Vigo County is 2.32 persons per household, with single female/mother households (4,651 | 10.9%) accounting for the largest median household size of 3.28 persons per household. non-family households (18,493 | 43.2%) represent the smallest median household size with 1.32 persons per household.
| Household Type | # Households | Household Size |
| Married-Couple | 17,071 (39.9%) | 3.03 |
| Single Male/Father | 2,541 (5.9%) | 3.06 |
| Single Female/Mother | 4,651 (10.9%) | 3.28 |
| Non-family | 18,493 (43.2%) | 1.32 |
| Total Households | 42,756 (100.0%) | 2.32 |
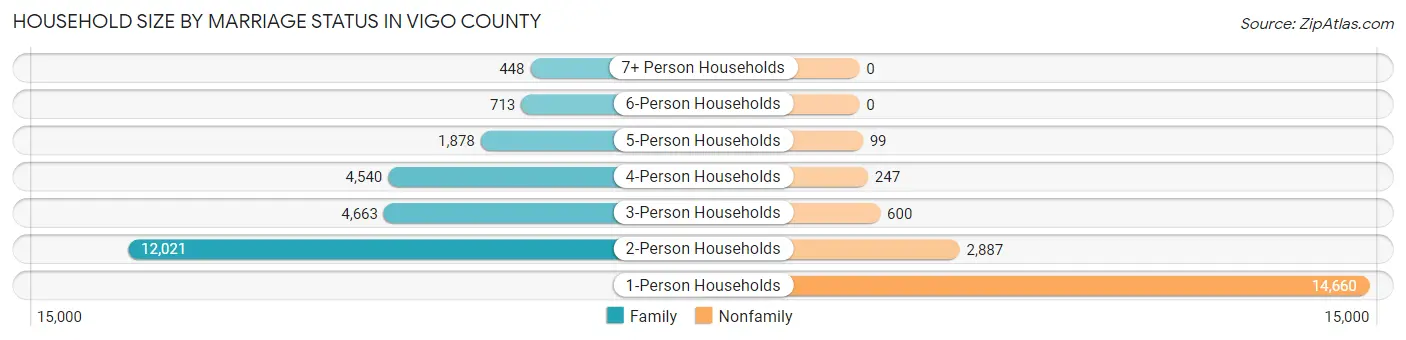
Household Size by Marriage Status in Vigo County
Out of a total of 42,756 households in Vigo County, 24,263 (56.8%) are family households, while 18,493 (43.2%) are nonfamily households. The most numerous type of family households are 2-person households, comprising 12,021, and the most common type of nonfamily households are 1-person households, comprising 14,660.
| Household Size | Family Households | Nonfamily Households |
| 1-Person Households | - | 14,660 (34.3%) |
| 2-Person Households | 12,021 (28.1%) | 2,887 (6.8%) |
| 3-Person Households | 4,663 (10.9%) | 600 (1.4%) |
| 4-Person Households | 4,540 (10.6%) | 247 (0.6%) |
| 5-Person Households | 1,878 (4.4%) | 99 (0.2%) |
| 6-Person Households | 713 (1.7%) | 0 (0.0%) |
| 7+ Person Households | 448 (1.1%) | 0 (0.0%) |
| Total | 24,263 (56.8%) | 18,493 (43.2%) |
Female Fertility in Vigo County
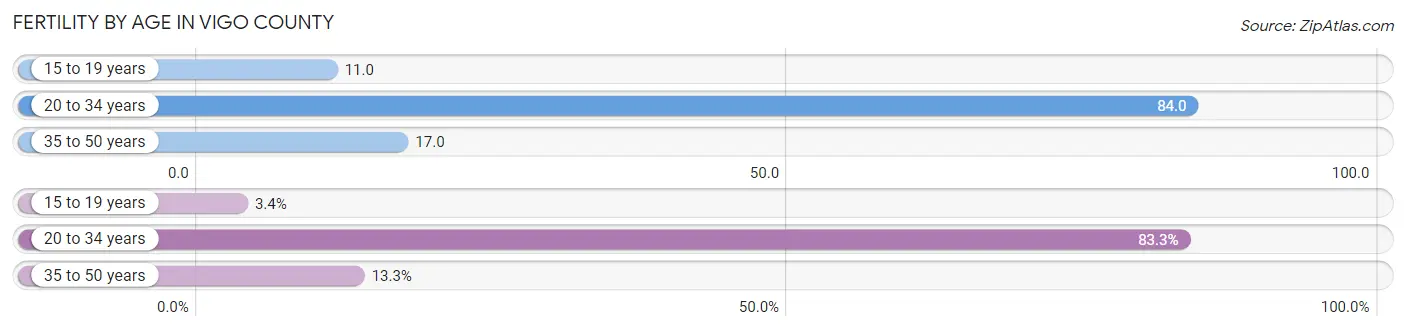
Fertility by Age in Vigo County
Average fertility rate in Vigo County is 49.0 births per 1,000 women. Women in the age bracket of 20 to 34 years have the highest fertility rate with 84.0 births per 1,000 women. Women in the age bracket of 20 to 34 years acount for 83.3% of all women with births.
| Age Bracket | Women with Births | Births / 1,000 Women |
| 15 to 19 years | 41 (3.4%) | 11.0 |
| 20 to 34 years | 1,009 (83.3%) | 84.0 |
| 35 to 50 years | 161 (13.3%) | 17.0 |
| Total | 1,211 (100.0%) | 49.0 |
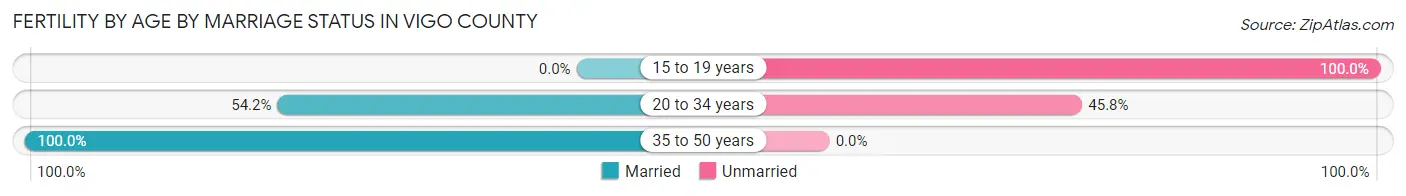
Fertility by Age by Marriage Status in Vigo County
58.5% of women with births (1,211) in Vigo County are married. The highest percentage of unmarried women with births falls into 15 to 19 years age bracket with 100.0% of them unmarried at the time of birth, while the lowest percentage of unmarried women with births belong to 35 to 50 years age bracket with 0.0% of them unmarried.
| Age Bracket | Married | Unmarried |
| 15 to 19 years | 0 (0.0%) | 41 (100.0%) |
| 20 to 34 years | 547 (54.2%) | 462 (45.8%) |
| 35 to 50 years | 161 (100.0%) | 0 (0.0%) |
| Total | 708 (58.5%) | 503 (41.5%) |
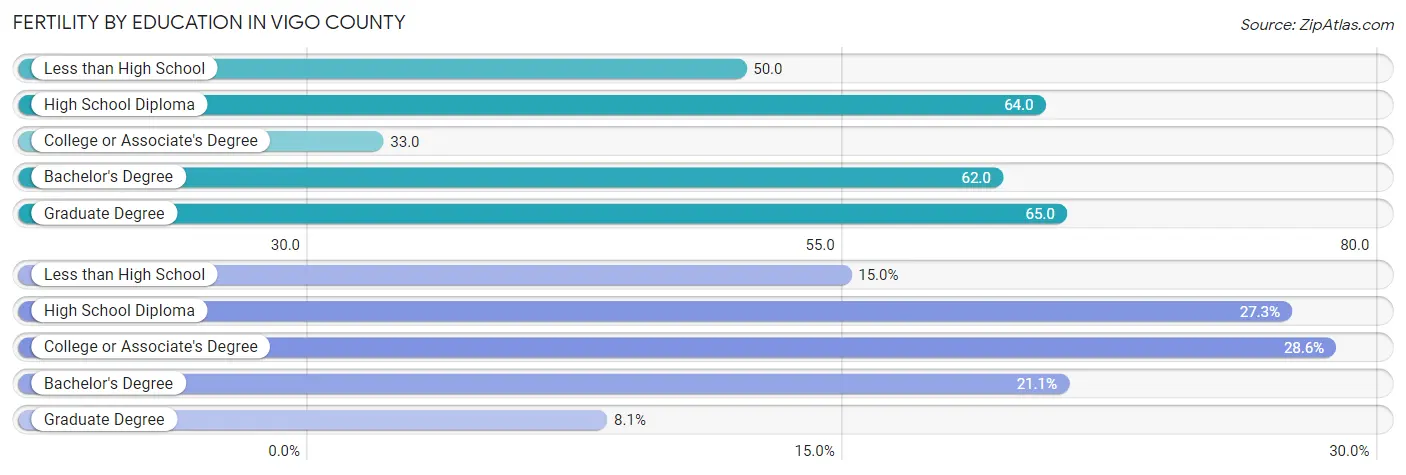
Fertility by Education in Vigo County
Average fertility rate in Vigo County is 49.0 births per 1,000 women. Women with the education attainment of graduate degree have the highest fertility rate of 65.0 births per 1,000 women, while women with the education attainment of college or associate's degree have the lowest fertility at 33.0 births per 1,000 women. Women with the education attainment of college or associate's degree represent 28.6% of all women with births.
| Educational Attainment | Women with Births | Births / 1,000 Women |
| Less than High School | 181 (14.9%) | 50.0 |
| High School Diploma | 331 (27.3%) | 64.0 |
| College or Associate's Degree | 346 (28.6%) | 33.0 |
| Bachelor's Degree | 255 (21.1%) | 62.0 |
| Graduate Degree | 98 (8.1%) | 65.0 |
| Total | 1,211 (100.0%) | 49.0 |
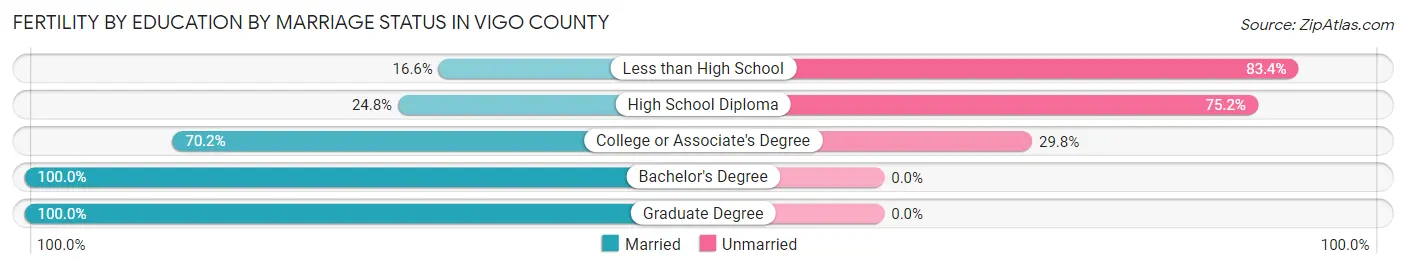
Fertility by Education by Marriage Status in Vigo County
41.5% of women with births in Vigo County are unmarried. Women with the educational attainment of bachelor's degree are most likely to be married with 100.0% of them married at childbirth, while women with the educational attainment of less than high school are least likely to be married with 83.4% of them unmarried at childbirth.
| Educational Attainment | Married | Unmarried |
| Less than High School | 30 (16.6%) | 151 (83.4%) |
| High School Diploma | 82 (24.8%) | 249 (75.2%) |
| College or Associate's Degree | 243 (70.2%) | 103 (29.8%) |
| Bachelor's Degree | 255 (100.0%) | 0 (0.0%) |
| Graduate Degree | 98 (100.0%) | 0 (0.0%) |
| Total | 708 (58.5%) | 503 (41.5%) |
Income in Vigo County
Income Overview in Vigo County
Per Capita Income in Vigo County is $30,240, while median incomes of families and households are $71,371 and $52,789 respectively.
| Characteristic | Number | Measure |
| Per Capita Income | 106,355 | $30,240 |
| Median Family Income | 24,263 | $71,371 |
| Mean Family Income | 24,263 | $89,732 |
| Median Household Income | 42,756 | $52,789 |
| Mean Household Income | 42,756 | $72,845 |
| Income Deficit | 24,263 | $11,546 |
| Wage / Income Gap (%) | 106,355 | 31.01% |
| Wage / Income Gap ($) | 106,355 | 68.99¢ per $1 |
| Gini / Inequality Index | 106,355 | 0.47 |
Earnings by Sex in Vigo County
Average Earnings in Vigo County are $31,731, $37,706 for men and $26,014 for women, a difference of 31.0%.
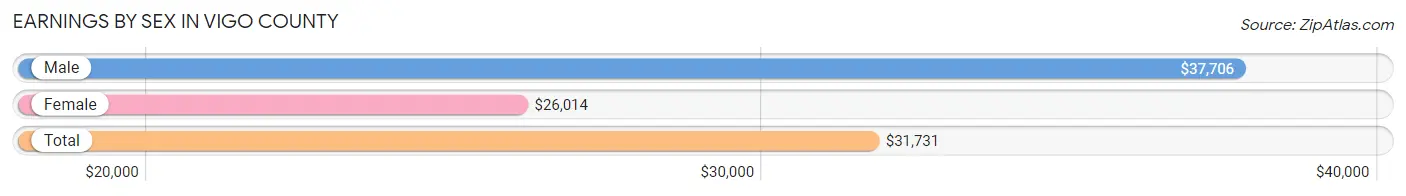
| Sex | Number | Average Earnings |
| Male | 29,224 (51.6%) | $37,706 |
| Female | 27,352 (48.3%) | $26,014 |
| Total | 56,576 (100.0%) | $31,731 |
Earnings by Sex by Income Bracket in Vigo County
The most common earnings brackets in Vigo County are $100,000+ for men (2,756 | 9.4%) and $2,499 or less for women (2,503 | 9.1%).
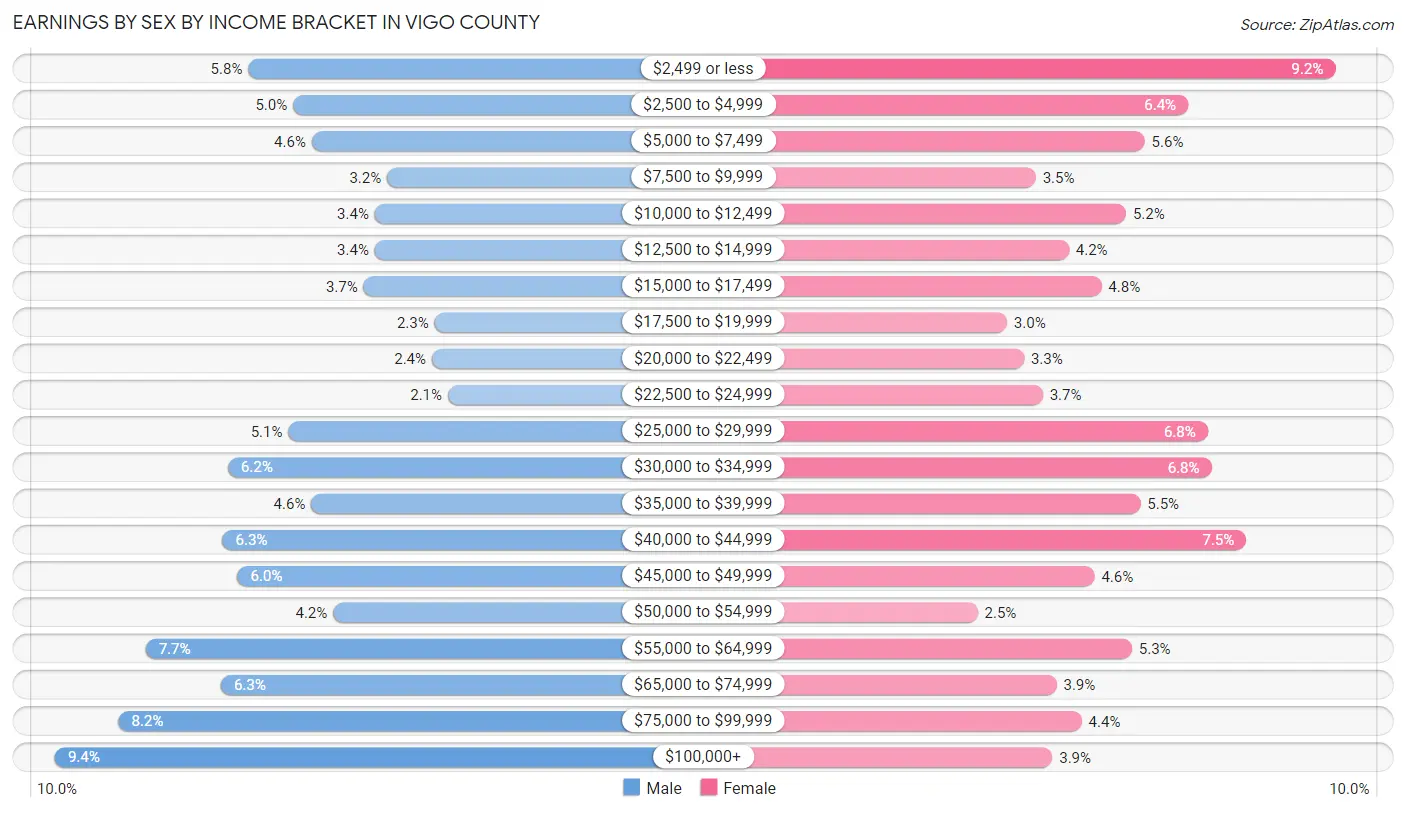
| Income | Male | Female |
| $2,499 or less | 1,698 (5.8%) | 2,503 (9.1%) |
| $2,500 to $4,999 | 1,451 (5.0%) | 1,749 (6.4%) |
| $5,000 to $7,499 | 1,350 (4.6%) | 1,525 (5.6%) |
| $7,500 to $9,999 | 938 (3.2%) | 969 (3.5%) |
| $10,000 to $12,499 | 1,004 (3.4%) | 1,430 (5.2%) |
| $12,500 to $14,999 | 1,004 (3.4%) | 1,139 (4.2%) |
| $15,000 to $17,499 | 1,068 (3.6%) | 1,304 (4.8%) |
| $17,500 to $19,999 | 677 (2.3%) | 820 (3.0%) |
| $20,000 to $22,499 | 692 (2.4%) | 909 (3.3%) |
| $22,500 to $24,999 | 604 (2.1%) | 1,004 (3.7%) |
| $25,000 to $29,999 | 1,478 (5.1%) | 1,848 (6.8%) |
| $30,000 to $34,999 | 1,808 (6.2%) | 1,869 (6.8%) |
| $35,000 to $39,999 | 1,353 (4.6%) | 1,504 (5.5%) |
| $40,000 to $44,999 | 1,839 (6.3%) | 2,046 (7.5%) |
| $45,000 to $49,999 | 1,757 (6.0%) | 1,269 (4.6%) |
| $50,000 to $54,999 | 1,234 (4.2%) | 670 (2.5%) |
| $55,000 to $64,999 | 2,258 (7.7%) | 1,461 (5.3%) |
| $65,000 to $74,999 | 1,846 (6.3%) | 1,076 (3.9%) |
| $75,000 to $99,999 | 2,409 (8.2%) | 1,204 (4.4%) |
| $100,000+ | 2,756 (9.4%) | 1,053 (3.8%) |
| Total | 29,224 (100.0%) | 27,352 (100.0%) |
Earnings by Sex by Educational Attainment in Vigo County
Average earnings in Vigo County are $46,319 for men and $34,126 for women, a difference of 26.3%. Men with an educational attainment of graduate degree enjoy the highest average annual earnings of $85,274, while those with less than high school education earn the least with $16,425. Women with an educational attainment of graduate degree earn the most with the average annual earnings of $60,781, while those with high school diploma education have the smallest earnings of $27,416.
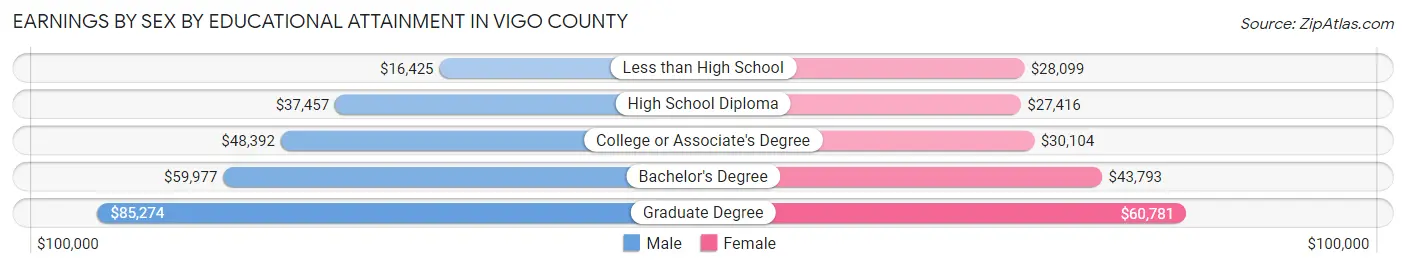
| Educational Attainment | Male Income | Female Income |
| Less than High School | $16,425 | $28,099 |
| High School Diploma | $37,457 | $27,416 |
| College or Associate's Degree | $48,392 | $30,104 |
| Bachelor's Degree | $59,977 | $43,793 |
| Graduate Degree | $85,274 | $60,781 |
| Total | $46,319 | $34,126 |
Family Income in Vigo County
Family Income Brackets in Vigo County
According to the Vigo County family income data, there are 4,513 families falling into the $100,000 to $149,999 income range, which is the most common income bracket and makes up 18.6% of all families. Conversely, the $10,000 to $14,999 income bracket is the least frequent group with only 728 families (3.0%) belonging to this category.
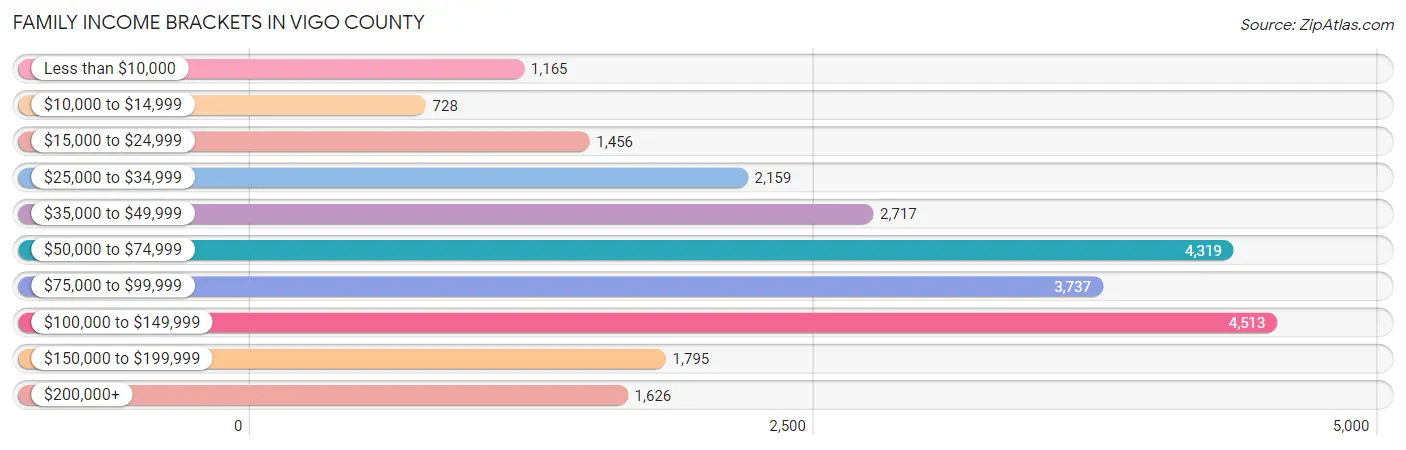
| Income Bracket | # Families | % Families |
| Less than $10,000 | 1,165 | 4.8% |
| $10,000 to $14,999 | 728 | 3.0% |
| $15,000 to $24,999 | 1,456 | 6.0% |
| $25,000 to $34,999 | 2,159 | 8.9% |
| $35,000 to $49,999 | 2,717 | 11.2% |
| $50,000 to $74,999 | 4,319 | 17.8% |
| $75,000 to $99,999 | 3,737 | 15.4% |
| $100,000 to $149,999 | 4,513 | 18.6% |
| $150,000 to $199,999 | 1,795 | 7.4% |
| $200,000+ | 1,626 | 6.7% |
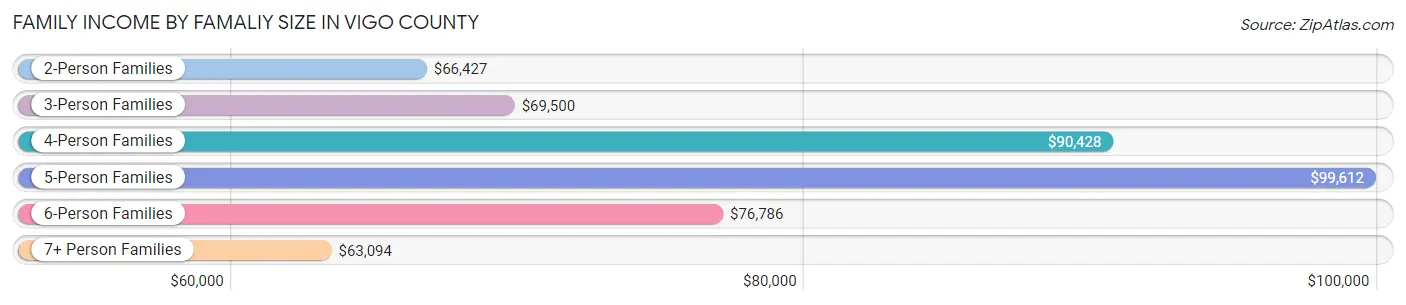
Family Income by Famaliy Size in Vigo County
5-person families (1,666 | 6.9%) account for the highest median family income in Vigo County with $99,612 per family, while 2-person families (13,005 | 53.6%) have the highest median income of $33,214 per family member.
| Income Bracket | # Families | Median Income |
| 2-Person Families | 13,005 (53.6%) | $66,427 |
| 3-Person Families | 4,748 (19.6%) | $69,500 |
| 4-Person Families | 3,913 (16.1%) | $90,428 |
| 5-Person Families | 1,666 (6.9%) | $99,612 |
| 6-Person Families | 614 (2.5%) | $76,786 |
| 7+ Person Families | 317 (1.3%) | $63,094 |
| Total | 24,263 (100.0%) | $71,371 |
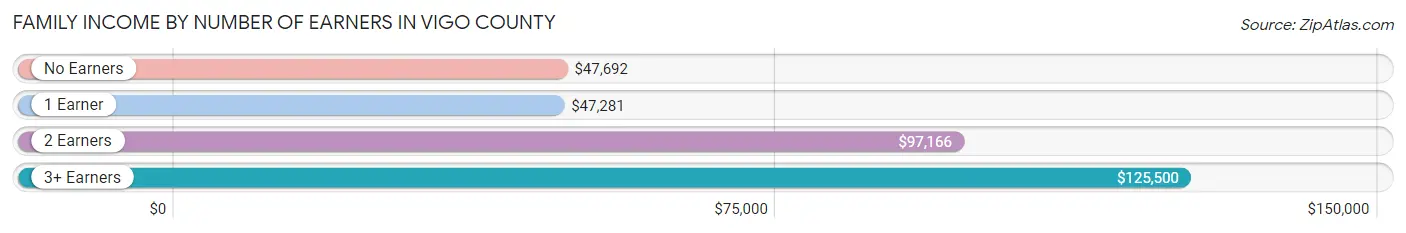
Family Income by Number of Earners in Vigo County
The median family income in Vigo County is $71,371, with families comprising 3+ earners (2,162) having the highest median family income of $125,500, while families with 1 earner (8,522) have the lowest median family income of $47,281, accounting for 8.9% and 35.1% of families, respectively.
| Number of Earners | # Families | Median Income |
| No Earners | 4,262 (17.6%) | $47,692 |
| 1 Earner | 8,522 (35.1%) | $47,281 |
| 2 Earners | 9,317 (38.4%) | $97,166 |
| 3+ Earners | 2,162 (8.9%) | $125,500 |
| Total | 24,263 (100.0%) | $71,371 |
Household Income in Vigo County
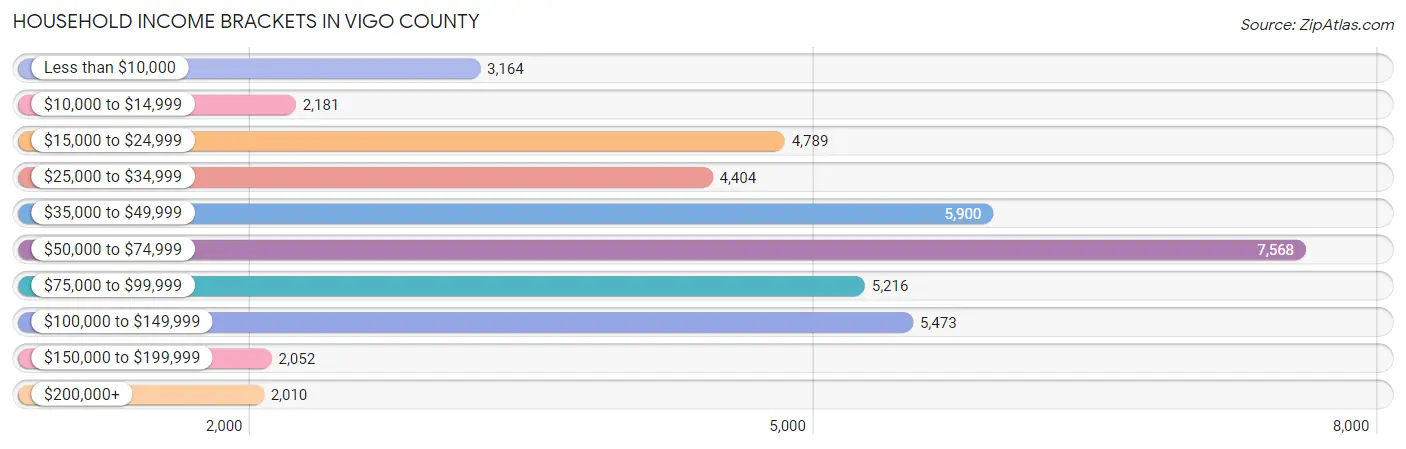
Household Income Brackets in Vigo County
With 7,568 households falling in the category, the $50,000 to $74,999 income range is the most frequent in Vigo County, accounting for 17.7% of all households. In contrast, only 2,010 households (4.7%) fall into the $200,000+ income bracket, making it the least populous group.
| Income Bracket | # Households | % Households |
| Less than $10,000 | 3,164 | 7.4% |
| $10,000 to $14,999 | 2,181 | 5.1% |
| $15,000 to $24,999 | 4,789 | 11.2% |
| $25,000 to $34,999 | 4,404 | 10.3% |
| $35,000 to $49,999 | 5,900 | 13.8% |
| $50,000 to $74,999 | 7,568 | 17.7% |
| $75,000 to $99,999 | 5,216 | 12.2% |
| $100,000 to $149,999 | 5,473 | 12.8% |
| $150,000 to $199,999 | 2,052 | 4.8% |
| $200,000+ | 2,010 | 4.7% |
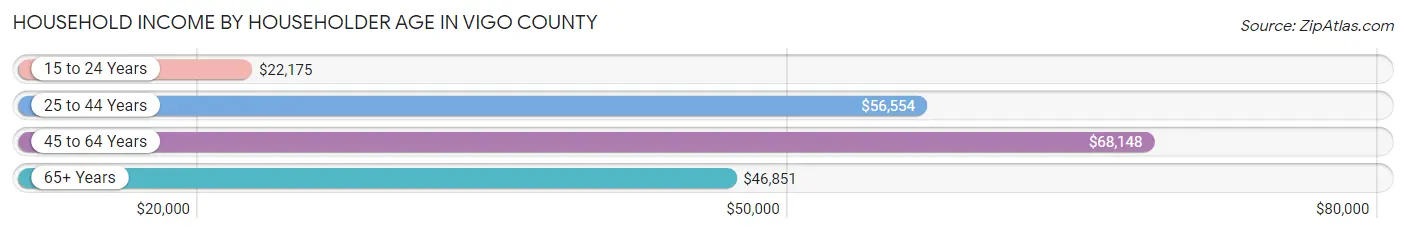
Household Income by Householder Age in Vigo County
The median household income in Vigo County is $52,789, with the highest median household income of $68,148 found in the 45 to 64 years age bracket for the primary householder. A total of 13,799 households (32.3%) fall into this category. Meanwhile, the 15 to 24 years age bracket for the primary householder has the lowest median household income of $22,175, with 4,483 households (10.5%) in this group.
| Income Bracket | # Households | Median Income |
| 15 to 24 Years | 4,483 (10.5%) | $22,175 |
| 25 to 44 Years | 13,104 (30.6%) | $56,554 |
| 45 to 64 Years | 13,799 (32.3%) | $68,148 |
| 65+ Years | 11,370 (26.6%) | $46,851 |
| Total | 42,756 (100.0%) | $52,789 |
Poverty in Vigo County
Income Below Poverty by Sex and Age in Vigo County
With 19.1% poverty level for males and 20.8% for females among the residents of Vigo County, 18 to 24 year old males and 18 to 24 year old females are the most vulnerable to poverty, with 2,322 males (36.1%) and 2,900 females (46.8%) in their respective age groups living below the poverty level.
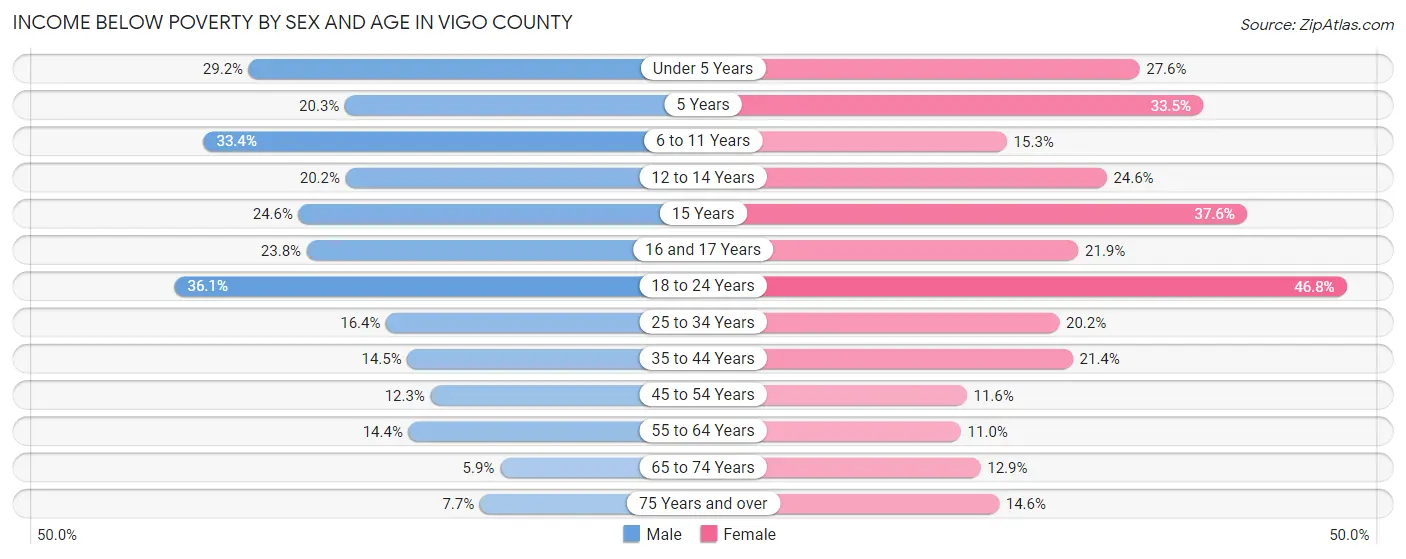
| Age Bracket | Male | Female |
| Under 5 Years | 870 (29.2%) | 729 (27.6%) |
| 5 Years | 128 (20.3%) | 204 (33.5%) |
| 6 to 11 Years | 1,155 (33.4%) | 488 (15.3%) |
| 12 to 14 Years | 359 (20.2%) | 473 (24.6%) |
| 15 Years | 149 (24.5%) | 210 (37.6%) |
| 16 and 17 Years | 317 (23.8%) | 257 (21.9%) |
| 18 to 24 Years | 2,322 (36.1%) | 2,900 (46.8%) |
| 25 to 34 Years | 1,111 (16.4%) | 1,242 (20.2%) |
| 35 to 44 Years | 844 (14.5%) | 1,207 (21.4%) |
| 45 to 54 Years | 702 (12.3%) | 665 (11.6%) |
| 55 to 64 Years | 854 (14.3%) | 703 (11.0%) |
| 65 to 74 Years | 271 (5.9%) | 690 (12.9%) |
| 75 Years and over | 201 (7.7%) | 651 (14.6%) |
| Total | 9,283 (19.1%) | 10,419 (20.8%) |
Income Above Poverty by Sex and Age in Vigo County
According to the poverty statistics in Vigo County, males aged 65 to 74 years and females aged 55 to 64 years are the age groups that are most secure financially, with 94.1% of males and 89.0% of females in these age groups living above the poverty line.
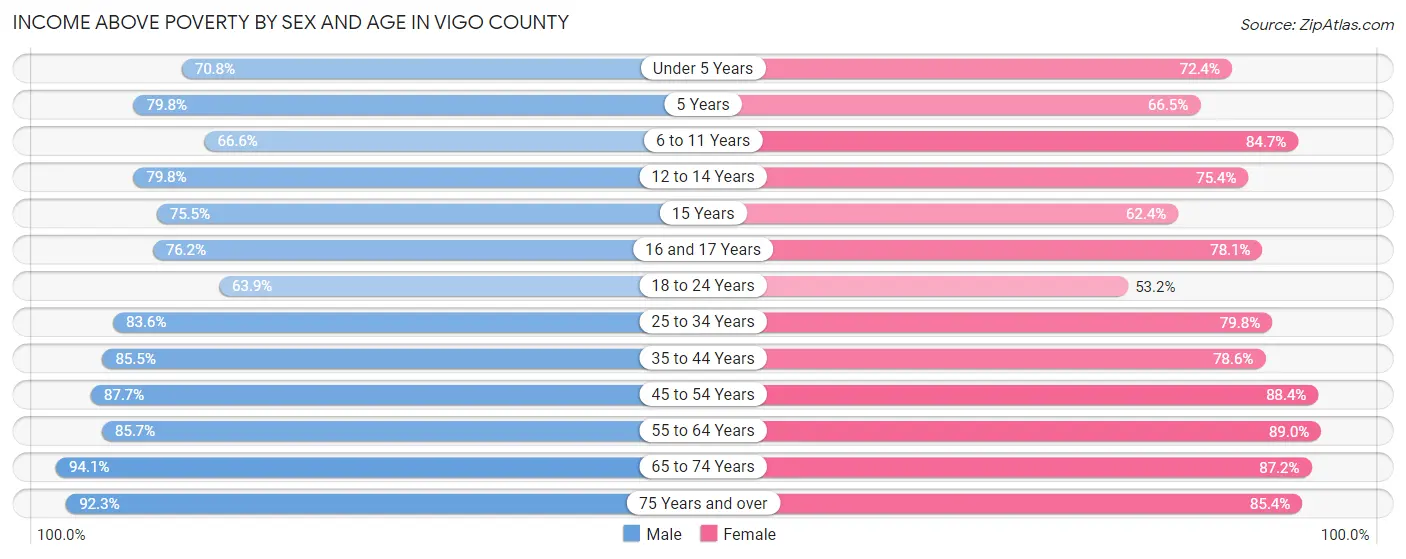
| Age Bracket | Male | Female |
| Under 5 Years | 2,112 (70.8%) | 1,911 (72.4%) |
| 5 Years | 504 (79.7%) | 405 (66.5%) |
| 6 to 11 Years | 2,304 (66.6%) | 2,701 (84.7%) |
| 12 to 14 Years | 1,419 (79.8%) | 1,453 (75.4%) |
| 15 Years | 458 (75.4%) | 349 (62.4%) |
| 16 and 17 Years | 1,015 (76.2%) | 915 (78.1%) |
| 18 to 24 Years | 4,114 (63.9%) | 3,293 (53.2%) |
| 25 to 34 Years | 5,649 (83.6%) | 4,920 (79.8%) |
| 35 to 44 Years | 4,994 (85.5%) | 4,428 (78.6%) |
| 45 to 54 Years | 4,999 (87.7%) | 5,076 (88.4%) |
| 55 to 64 Years | 5,097 (85.7%) | 5,671 (89.0%) |
| 65 to 74 Years | 4,350 (94.1%) | 4,681 (87.2%) |
| 75 Years and over | 2,399 (92.3%) | 3,816 (85.4%) |
| Total | 39,414 (80.9%) | 39,619 (79.2%) |
Income Below Poverty Among Married-Couple Families in Vigo County
The poverty statistics for married-couple families in Vigo County show that 5.8% or 987 of the total 17,071 families live below the poverty line. Families with 5 or more children have the highest poverty rate of 54.2%, comprising of 13 families. On the other hand, families with no children have the lowest poverty rate of 3.9%, which includes 423 families.
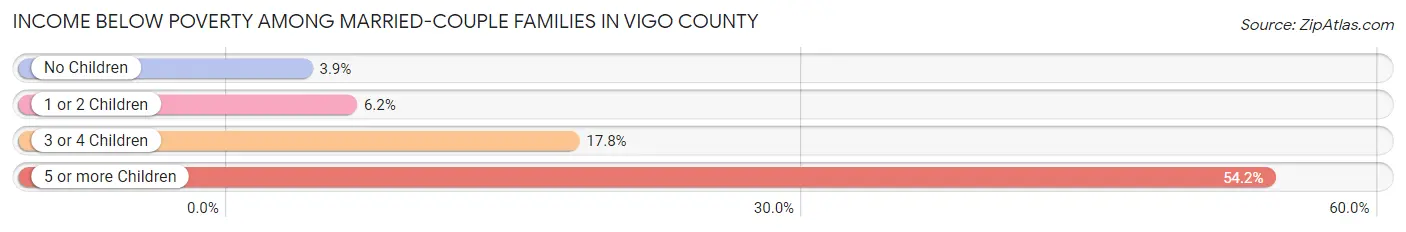
| Children | Above Poverty | Below Poverty |
| No Children | 10,438 (96.1%) | 423 (3.9%) |
| 1 or 2 Children | 4,455 (93.8%) | 295 (6.2%) |
| 3 or 4 Children | 1,180 (82.2%) | 256 (17.8%) |
| 5 or more Children | 11 (45.8%) | 13 (54.2%) |
| Total | 16,084 (94.2%) | 987 (5.8%) |
Income Below Poverty Among Single-Parent Households in Vigo County
According to the poverty data in Vigo County, 15.7% or 399 single-father households and 38.0% or 1,766 single-mother households are living below the poverty line. Among single-father households, those with 3 or 4 children have the highest poverty rate, with 109 households (72.7%) experiencing poverty. Likewise, among single-mother households, those with 3 or 4 children have the highest poverty rate, with 388 households (68.8%) falling below the poverty line.
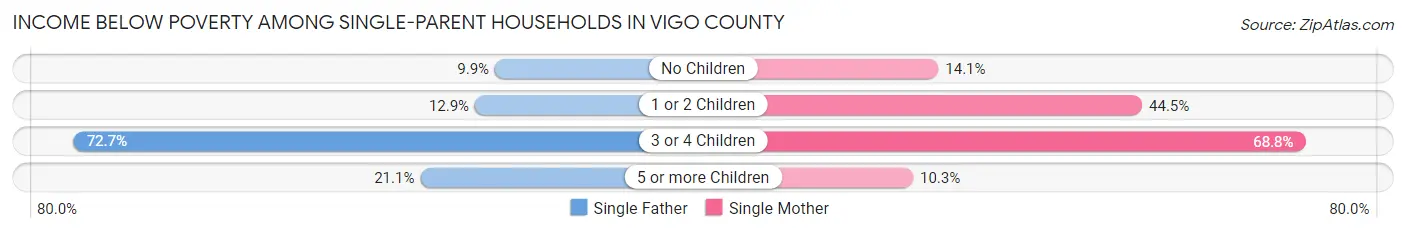
| Children | Single Father | Single Mother |
| No Children | 76 (9.9%) | 195 (14.1%) |
| 1 or 2 Children | 202 (12.9%) | 1,177 (44.5%) |
| 3 or 4 Children | 109 (72.7%) | 388 (68.8%) |
| 5 or more Children | 12 (21.0%) | 6 (10.3%) |
| Total | 399 (15.7%) | 1,766 (38.0%) |
Income Below Poverty Among Married-Couple vs Single-Parent Households in Vigo County
The poverty data for Vigo County shows that 987 of the married-couple family households (5.8%) and 2,165 of the single-parent households (30.1%) are living below the poverty level. Within the married-couple family households, those with 5 or more children have the highest poverty rate, with 13 households (54.2%) falling below the poverty line. Among the single-parent households, those with 3 or 4 children have the highest poverty rate, with 497 household (69.6%) living below poverty.
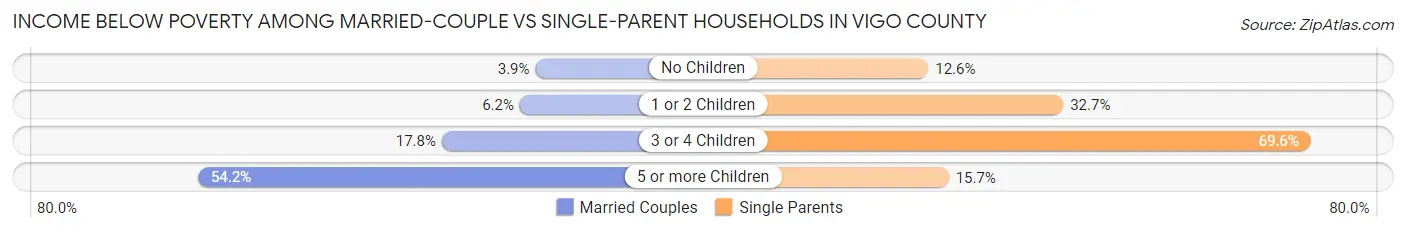
| Children | Married-Couple Families | Single-Parent Households |
| No Children | 423 (3.9%) | 271 (12.6%) |
| 1 or 2 Children | 295 (6.2%) | 1,379 (32.7%) |
| 3 or 4 Children | 256 (17.8%) | 497 (69.6%) |
| 5 or more Children | 13 (54.2%) | 18 (15.7%) |
| Total | 987 (5.8%) | 2,165 (30.1%) |
Employment Characteristics in Vigo County
Employment by Class of Employer in Vigo County
Among the 47,887 employed individuals in Vigo County, private company employees (31,331 | 65.4%), not-for-profit organizations (6,192 | 12.9%), and local government employees (3,497 | 7.3%) make up the most common classes of employment.
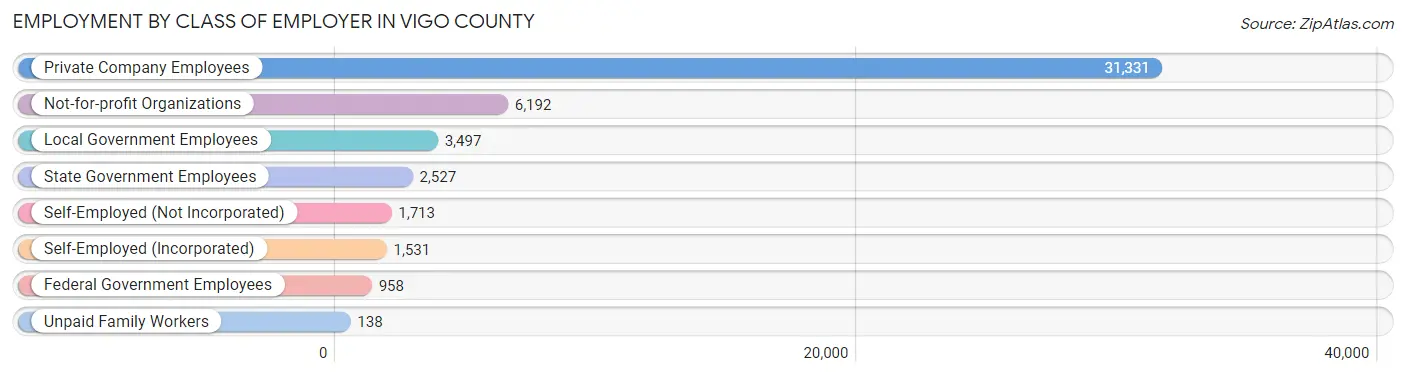
| Employer Class | # Employees | % Employees |
| Private Company Employees | 31,331 | 65.4% |
| Self-Employed (Incorporated) | 1,531 | 3.2% |
| Self-Employed (Not Incorporated) | 1,713 | 3.6% |
| Not-for-profit Organizations | 6,192 | 12.9% |
| Local Government Employees | 3,497 | 7.3% |
| State Government Employees | 2,527 | 5.3% |
| Federal Government Employees | 958 | 2.0% |
| Unpaid Family Workers | 138 | 0.3% |
| Total | 47,887 | 100.0% |
Employment Status by Age in Vigo County
According to the labor force statistics for Vigo County, out of the total population over 16 years of age (87,254), 59.8% or 52,178 individuals are in the labor force, with 6.1% or 3,183 of them unemployed. The age group with the highest labor force participation rate is 25 to 29 years, with 80.8% or 5,812 individuals in the labor force. Within the labor force, the 20 to 24 years age range has the highest percentage of unemployed individuals, with 8.8% or 805 of them being unemployed.
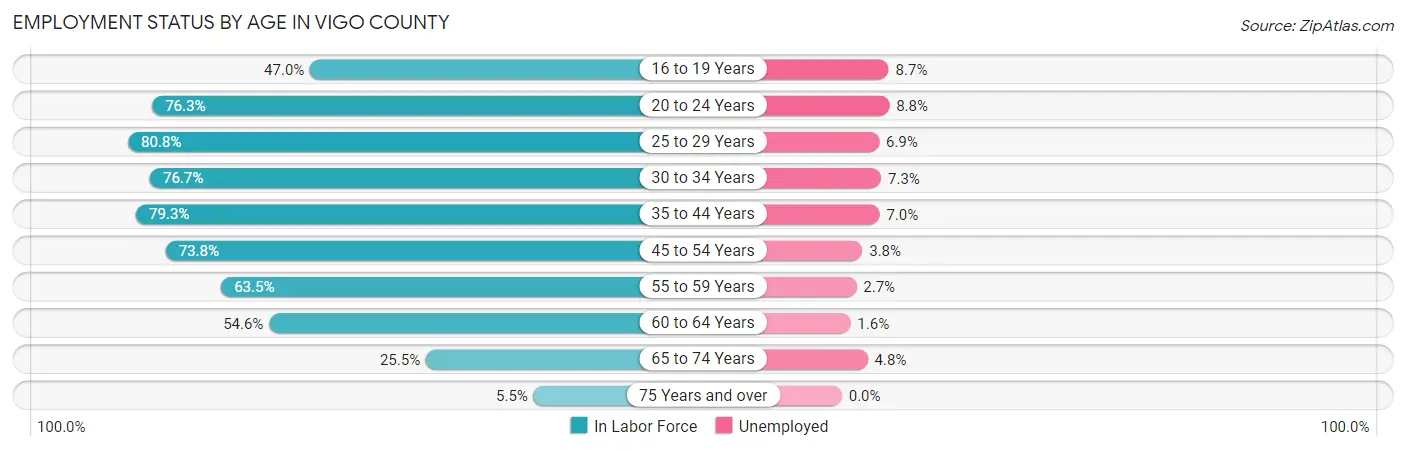
| Age Bracket | In Labor Force | Unemployed |
| 16 to 19 Years | 3,234 (47.0%) | 281 (8.7%) |
| 20 to 24 Years | 9,151 (76.3%) | 805 (8.8%) |
| 25 to 29 Years | 5,812 (80.8%) | 401 (6.9%) |
| 30 to 34 Years | 4,898 (76.7%) | 358 (7.3%) |
| 35 to 44 Years | 9,797 (79.3%) | 686 (7.0%) |
| 45 to 54 Years | 8,830 (73.8%) | 336 (3.8%) |
| 55 to 59 Years | 3,908 (63.5%) | 106 (2.7%) |
| 60 to 64 Years | 3,535 (54.6%) | 57 (1.6%) |
| 65 to 74 Years | 2,616 (25.5%) | 126 (4.8%) |
| 75 Years and over | 418 (5.5%) | 0 (0.0%) |
| Total | 52,178 (59.8%) | 3,183 (6.1%) |
Employment Status by Educational Attainment in Vigo County
According to labor force statistics for Vigo County, 72.8% of individuals (36,784) out of the total population between 25 and 64 years of age (50,527) are in the labor force, with 5.3% or 1,950 of them being unemployed. The group with the highest labor force participation rate are those with the educational attainment of bachelor's degree or higher, with 87.4% or 10,999 individuals in the labor force. Within the labor force, individuals with less than high school education have the highest percentage of unemployment, with 13.1% or 311 of them being unemployed.
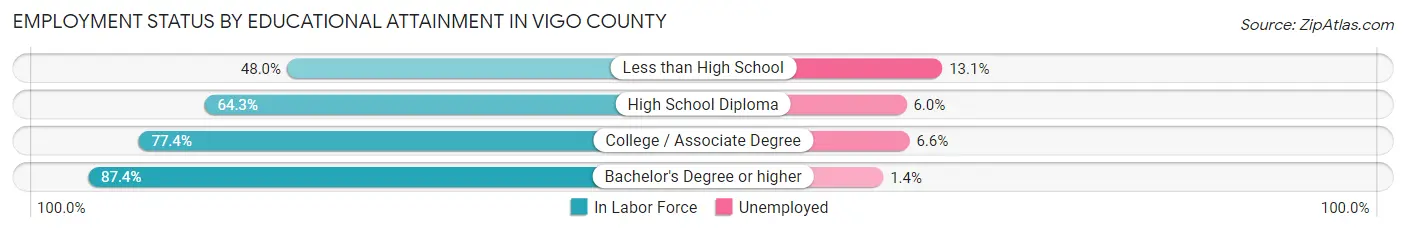
| Educational Attainment | In Labor Force | Unemployed |
| Less than High School | 2,376 (48.0%) | 648 (13.1%) |
| High School Diploma | 10,467 (64.3%) | 977 (6.0%) |
| College / Associate Degree | 12,937 (77.4%) | 1,103 (6.6%) |
| Bachelor's Degree or higher | 10,999 (87.4%) | 176 (1.4%) |
| Total | 36,784 (72.8%) | 2,678 (5.3%) |
Employment Occupations by Sex in Vigo County
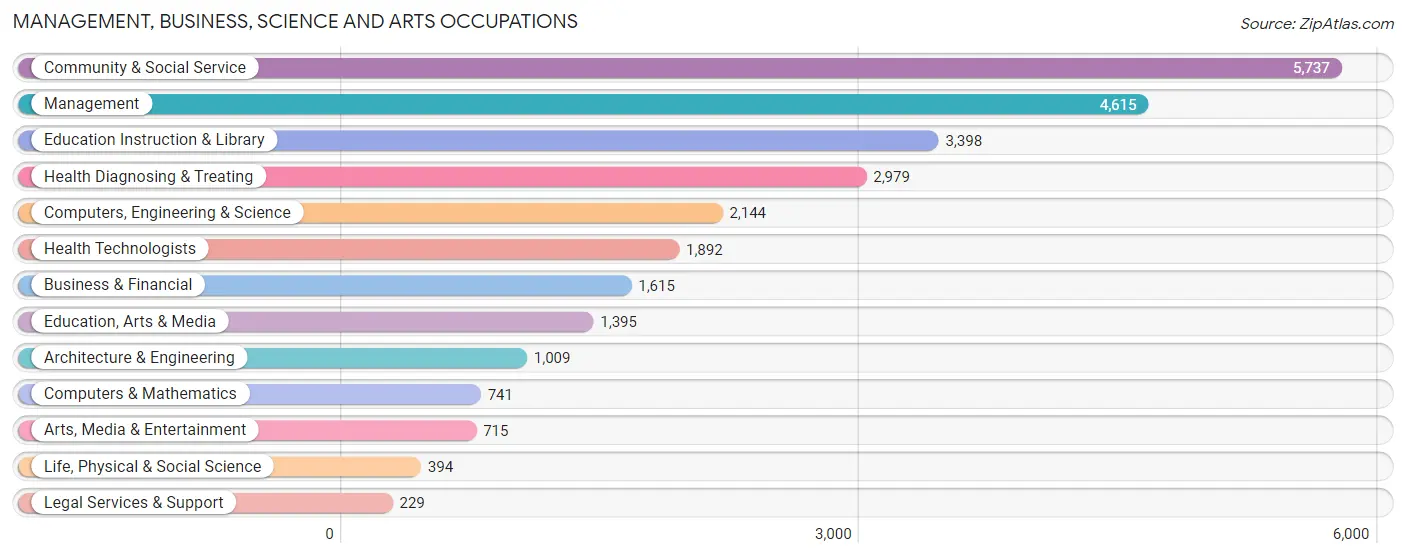
Management, Business, Science and Arts Occupations
The most common Management, Business, Science and Arts occupations in Vigo County are Community & Social Service (5,737 | 11.8%), Management (4,615 | 9.5%), Education Instruction & Library (3,398 | 7.0%), Health Diagnosing & Treating (2,979 | 6.1%), and Computers, Engineering & Science (2,144 | 4.4%).
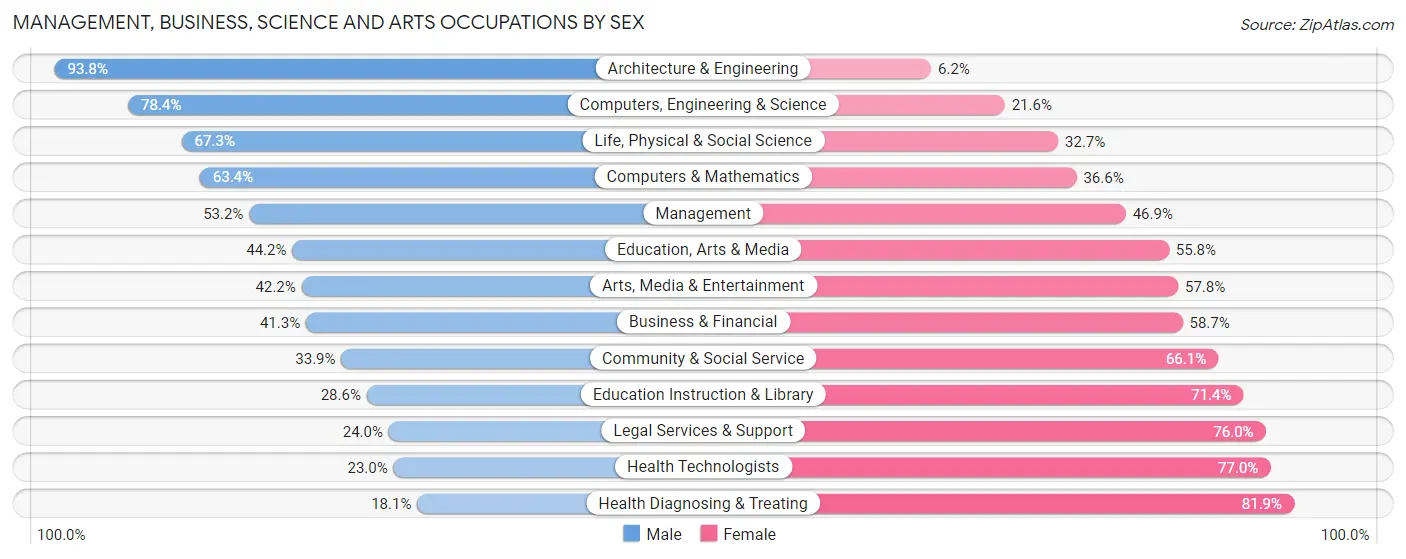
Management, Business, Science and Arts Occupations by Sex
Within the Management, Business, Science and Arts occupations in Vigo County, the most male-oriented occupations are Architecture & Engineering (93.8%), Computers, Engineering & Science (78.4%), and Life, Physical & Social Science (67.3%), while the most female-oriented occupations are Health Diagnosing & Treating (81.9%), Health Technologists (77.0%), and Legal Services & Support (76.0%).
| Occupation | Male | Female |
| Management | 2,453 (53.1%) | 2,162 (46.9%) |
| Business & Financial | 667 (41.3%) | 948 (58.7%) |
| Computers, Engineering & Science | 1,681 (78.4%) | 463 (21.6%) |
| Computers & Mathematics | 470 (63.4%) | 271 (36.6%) |
| Architecture & Engineering | 946 (93.8%) | 63 (6.2%) |
| Life, Physical & Social Science | 265 (67.3%) | 129 (32.7%) |
| Community & Social Service | 1,946 (33.9%) | 3,791 (66.1%) |
| Education, Arts & Media | 616 (44.2%) | 779 (55.8%) |
| Legal Services & Support | 55 (24.0%) | 174 (76.0%) |
| Education Instruction & Library | 973 (28.6%) | 2,425 (71.4%) |
| Arts, Media & Entertainment | 302 (42.2%) | 413 (57.8%) |
| Health Diagnosing & Treating | 539 (18.1%) | 2,440 (81.9%) |
| Health Technologists | 436 (23.0%) | 1,456 (77.0%) |
| Total (Category) | 7,286 (42.6%) | 9,804 (57.4%) |
| Total (Overall) | 24,658 (50.5%) | 24,142 (49.5%) |
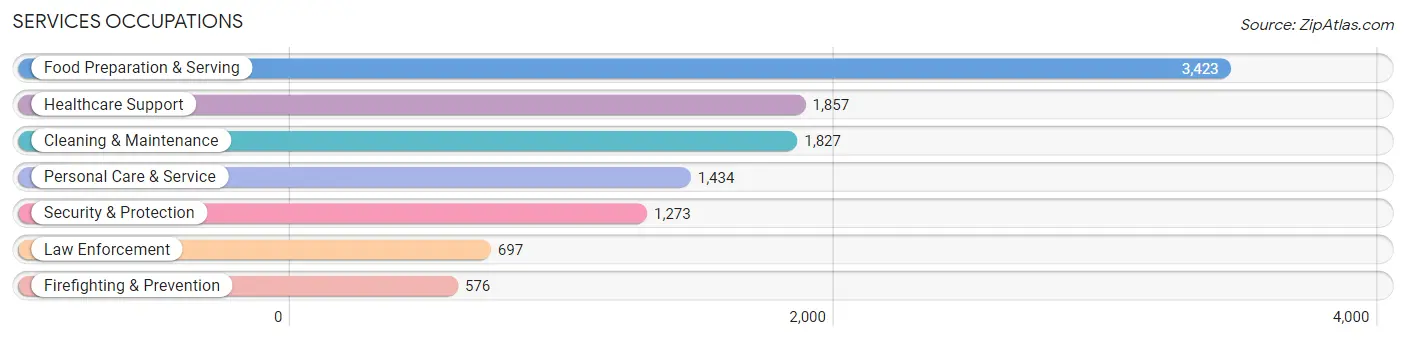
Services Occupations
The most common Services occupations in Vigo County are Food Preparation & Serving (3,423 | 7.0%), Healthcare Support (1,857 | 3.8%), Cleaning & Maintenance (1,827 | 3.7%), Personal Care & Service (1,434 | 2.9%), and Security & Protection (1,273 | 2.6%).
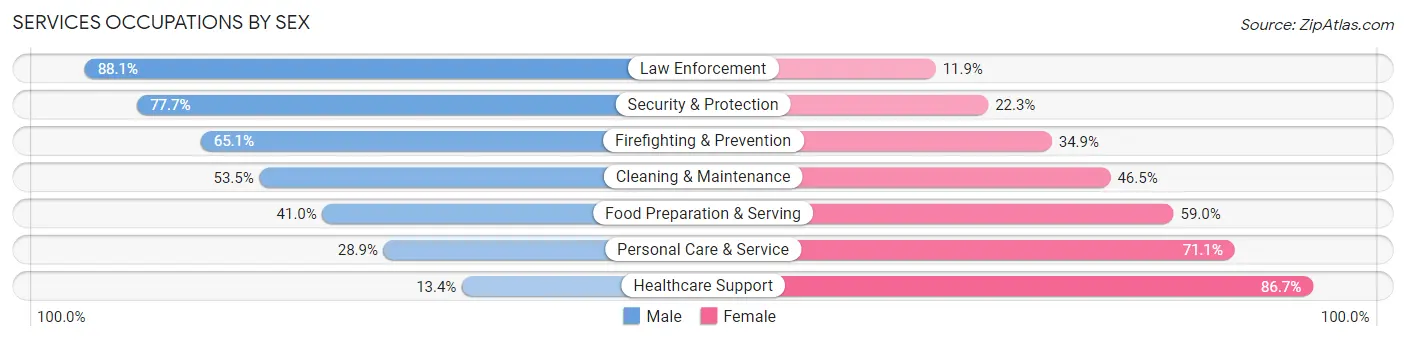
Services Occupations by Sex
Within the Services occupations in Vigo County, the most male-oriented occupations are Law Enforcement (88.1%), Security & Protection (77.7%), and Firefighting & Prevention (65.1%), while the most female-oriented occupations are Healthcare Support (86.7%), Personal Care & Service (71.1%), and Food Preparation & Serving (59.0%).
| Occupation | Male | Female |
| Healthcare Support | 248 (13.4%) | 1,609 (86.7%) |
| Security & Protection | 989 (77.7%) | 284 (22.3%) |
| Firefighting & Prevention | 375 (65.1%) | 201 (34.9%) |
| Law Enforcement | 614 (88.1%) | 83 (11.9%) |
| Food Preparation & Serving | 1,403 (41.0%) | 2,020 (59.0%) |
| Cleaning & Maintenance | 977 (53.5%) | 850 (46.5%) |
| Personal Care & Service | 414 (28.9%) | 1,020 (71.1%) |
| Total (Category) | 4,031 (41.1%) | 5,783 (58.9%) |
| Total (Overall) | 24,658 (50.5%) | 24,142 (49.5%) |
Sales and Office Occupations
The most common Sales and Office occupations in Vigo County are Sales & Related (5,011 | 10.3%), and Office & Administration (4,712 | 9.7%).

Sales and Office Occupations by Sex
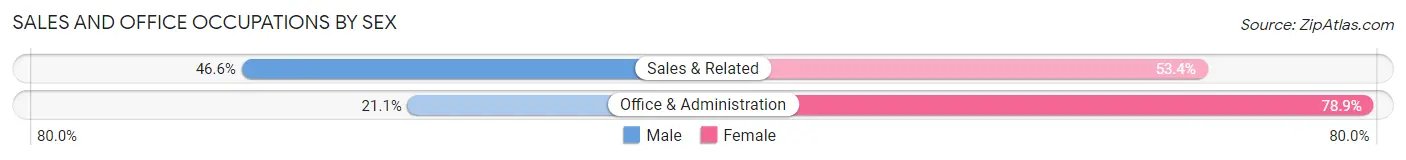
| Occupation | Male | Female |
| Sales & Related | 2,335 (46.6%) | 2,676 (53.4%) |
| Office & Administration | 993 (21.1%) | 3,719 (78.9%) |
| Total (Category) | 3,328 (34.2%) | 6,395 (65.8%) |
| Total (Overall) | 24,658 (50.5%) | 24,142 (49.5%) |
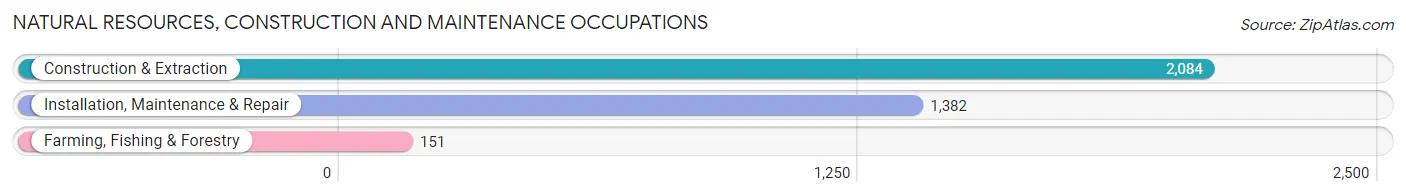
Natural Resources, Construction and Maintenance Occupations
The most common Natural Resources, Construction and Maintenance occupations in Vigo County are Construction & Extraction (2,084 | 4.3%), Installation, Maintenance & Repair (1,382 | 2.8%), and Farming, Fishing & Forestry (151 | 0.3%).
Natural Resources, Construction and Maintenance Occupations by Sex
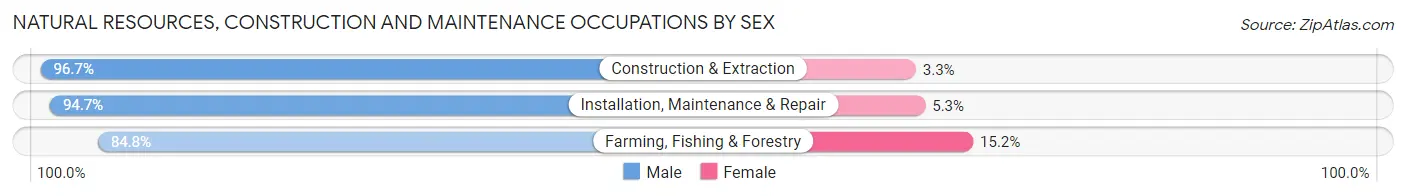
| Occupation | Male | Female |
| Farming, Fishing & Forestry | 128 (84.8%) | 23 (15.2%) |
| Construction & Extraction | 2,015 (96.7%) | 69 (3.3%) |
| Installation, Maintenance & Repair | 1,309 (94.7%) | 73 (5.3%) |
| Total (Category) | 3,452 (95.4%) | 165 (4.6%) |
| Total (Overall) | 24,658 (50.5%) | 24,142 (49.5%) |
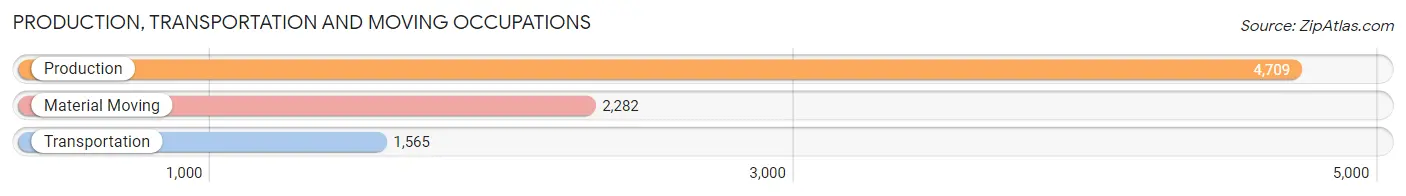
Production, Transportation and Moving Occupations
The most common Production, Transportation and Moving occupations in Vigo County are Production (4,709 | 9.7%), Material Moving (2,282 | 4.7%), and Transportation (1,565 | 3.2%).
Production, Transportation and Moving Occupations by Sex
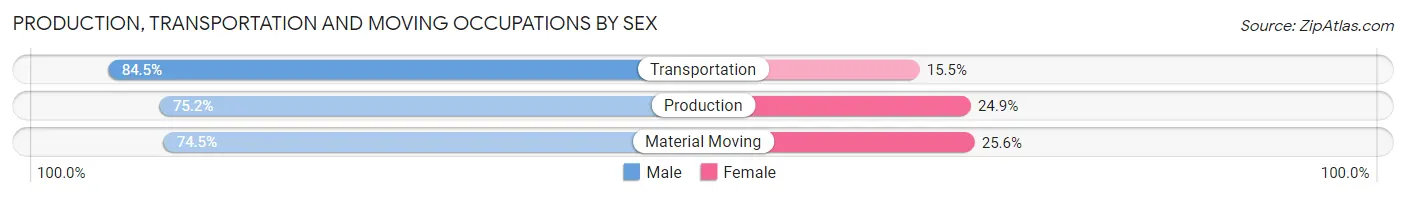
| Occupation | Male | Female |
| Production | 3,539 (75.1%) | 1,170 (24.8%) |
| Transportation | 1,323 (84.5%) | 242 (15.5%) |
| Material Moving | 1,699 (74.5%) | 583 (25.6%) |
| Total (Category) | 6,561 (76.7%) | 1,995 (23.3%) |
| Total (Overall) | 24,658 (50.5%) | 24,142 (49.5%) |
Employment Industries by Sex in Vigo County
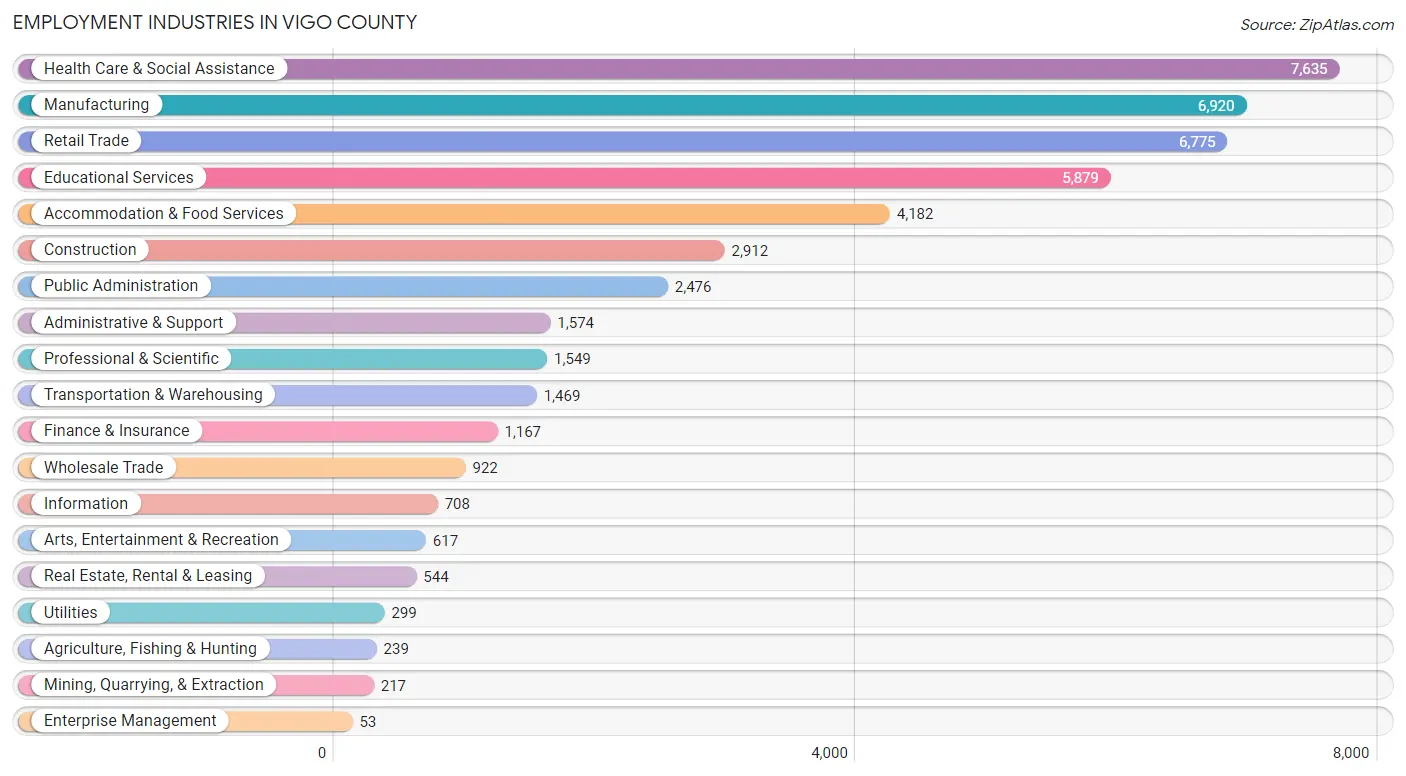
Employment Industries in Vigo County
The major employment industries in Vigo County include Health Care & Social Assistance (7,635 | 15.7%), Manufacturing (6,920 | 14.2%), Retail Trade (6,775 | 13.9%), Educational Services (5,879 | 12.0%), and Accommodation & Food Services (4,182 | 8.6%).
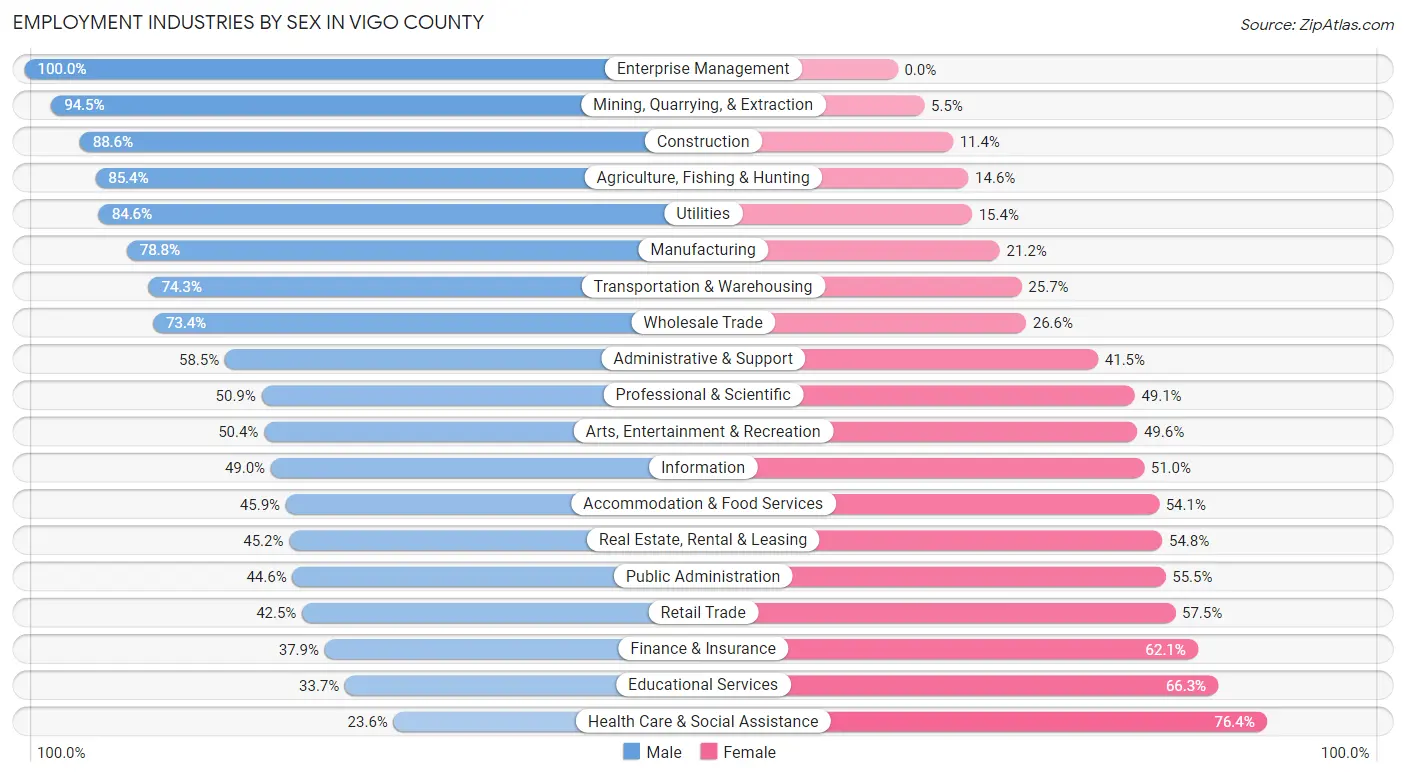
Employment Industries by Sex in Vigo County
The Vigo County industries that see more men than women are Enterprise Management (100.0%), Mining, Quarrying, & Extraction (94.5%), and Construction (88.6%), whereas the industries that tend to have a higher number of women are Health Care & Social Assistance (76.4%), Educational Services (66.3%), and Finance & Insurance (62.1%).
| Industry | Male | Female |
| Agriculture, Fishing & Hunting | 204 (85.4%) | 35 (14.6%) |
| Mining, Quarrying, & Extraction | 205 (94.5%) | 12 (5.5%) |
| Construction | 2,579 (88.6%) | 333 (11.4%) |
| Manufacturing | 5,456 (78.8%) | 1,464 (21.2%) |
| Wholesale Trade | 677 (73.4%) | 245 (26.6%) |
| Retail Trade | 2,882 (42.5%) | 3,893 (57.5%) |
| Transportation & Warehousing | 1,092 (74.3%) | 377 (25.7%) |
| Utilities | 253 (84.6%) | 46 (15.4%) |
| Information | 347 (49.0%) | 361 (51.0%) |
| Finance & Insurance | 442 (37.9%) | 725 (62.1%) |
| Real Estate, Rental & Leasing | 246 (45.2%) | 298 (54.8%) |
| Professional & Scientific | 789 (50.9%) | 760 (49.1%) |
| Enterprise Management | 53 (100.0%) | 0 (0.0%) |
| Administrative & Support | 921 (58.5%) | 653 (41.5%) |
| Educational Services | 1,979 (33.7%) | 3,900 (66.3%) |
| Health Care & Social Assistance | 1,803 (23.6%) | 5,832 (76.4%) |
| Arts, Entertainment & Recreation | 311 (50.4%) | 306 (49.6%) |
| Accommodation & Food Services | 1,920 (45.9%) | 2,262 (54.1%) |
| Public Administration | 1,103 (44.6%) | 1,373 (55.4%) |
| Total | 24,658 (50.5%) | 24,142 (49.5%) |
Education in Vigo County
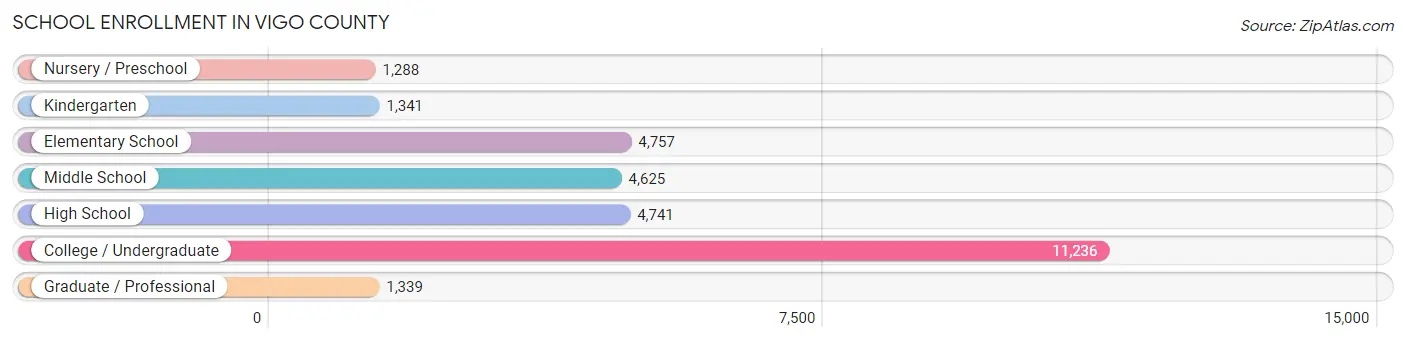
School Enrollment in Vigo County
The most common levels of schooling among the 29,327 students in Vigo County are college / undergraduate (11,236 | 38.3%), elementary school (4,757 | 16.2%), and high school (4,741 | 16.2%).
| School Level | # Students | % Students |
| Nursery / Preschool | 1,288 | 4.4% |
| Kindergarten | 1,341 | 4.6% |
| Elementary School | 4,757 | 16.2% |
| Middle School | 4,625 | 15.8% |
| High School | 4,741 | 16.2% |
| College / Undergraduate | 11,236 | 38.3% |
| Graduate / Professional | 1,339 | 4.6% |
| Total | 29,327 | 100.0% |
School Enrollment by Age by Funding Source in Vigo County
Out of a total of 29,327 students who are enrolled in schools in Vigo County, 4,516 (15.4%) attend a private institution, while the remaining 24,811 (84.6%) are enrolled in public schools. The age group of 3 to 4 year olds has the highest likelihood of being enrolled in private schools, with 324 (36.6% in the age bracket) enrolled. Conversely, the age group of 25 to 34 year olds has the lowest likelihood of being enrolled in a private school, with 1,391 (91.9% in the age bracket) attending a public institution.
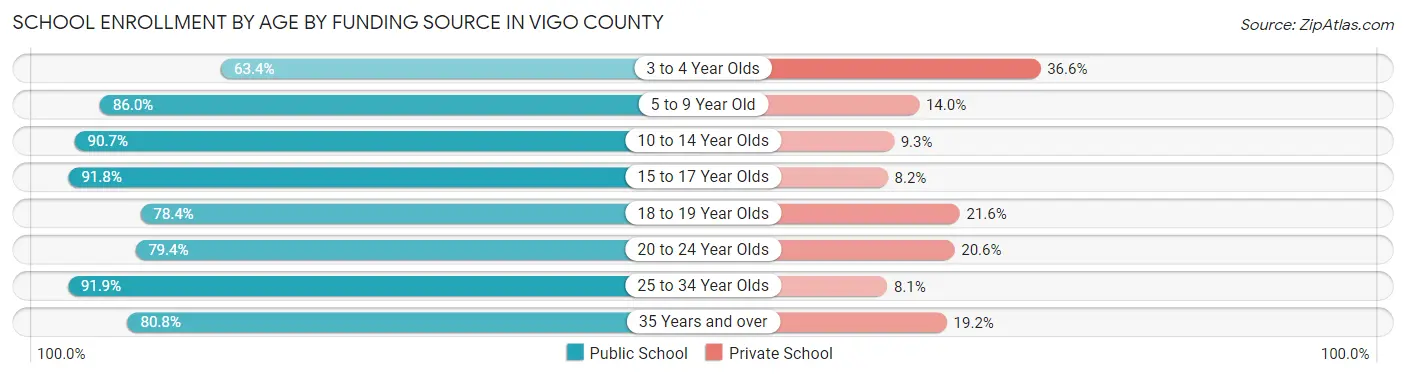
| Age Bracket | Public School | Private School |
| 3 to 4 Year Olds | 561 (63.4%) | 324 (36.6%) |
| 5 to 9 Year Old | 4,689 (86.0%) | 765 (14.0%) |
| 10 to 14 Year Olds | 5,528 (90.7%) | 568 (9.3%) |
| 15 to 17 Year Olds | 3,380 (91.8%) | 301 (8.2%) |
| 18 to 19 Year Olds | 2,831 (78.4%) | 779 (21.6%) |
| 20 to 24 Year Olds | 5,473 (79.4%) | 1,421 (20.6%) |
| 25 to 34 Year Olds | 1,391 (91.9%) | 122 (8.1%) |
| 35 Years and over | 965 (80.8%) | 229 (19.2%) |
| Total | 24,811 (84.6%) | 4,516 (15.4%) |
Educational Attainment by Field of Study in Vigo County
Education (3,792 | 19.8%), business (2,809 | 14.7%), science & technology (2,401 | 12.5%), arts & humanities (1,654 | 8.6%), and social sciences (1,372 | 7.2%) are the most common fields of study among 19,157 individuals in Vigo County who have obtained a bachelor's degree or higher.
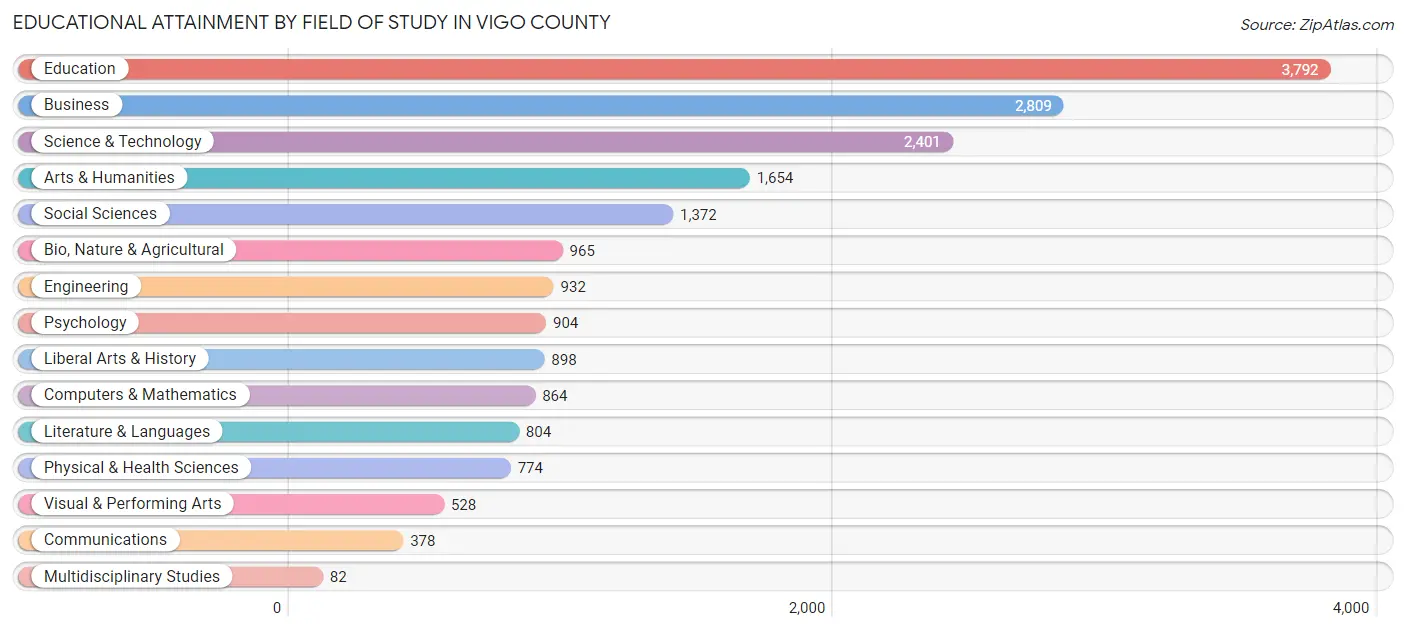
| Field of Study | # Graduates | % Graduates |
| Computers & Mathematics | 864 | 4.5% |
| Bio, Nature & Agricultural | 965 | 5.0% |
| Physical & Health Sciences | 774 | 4.0% |
| Psychology | 904 | 4.7% |
| Social Sciences | 1,372 | 7.2% |
| Engineering | 932 | 4.9% |
| Multidisciplinary Studies | 82 | 0.4% |
| Science & Technology | 2,401 | 12.5% |
| Business | 2,809 | 14.7% |
| Education | 3,792 | 19.8% |
| Literature & Languages | 804 | 4.2% |
| Liberal Arts & History | 898 | 4.7% |
| Visual & Performing Arts | 528 | 2.8% |
| Communications | 378 | 2.0% |
| Arts & Humanities | 1,654 | 8.6% |
| Total | 19,157 | 100.0% |
Transportation & Commute in Vigo County
Vehicle Availability by Sex in Vigo County
The most prevalent vehicle ownership categories in Vigo County are males with 2 vehicles (9,877, accounting for 41.5%) and females with 2 vehicles (8,936, making up 44.1%).
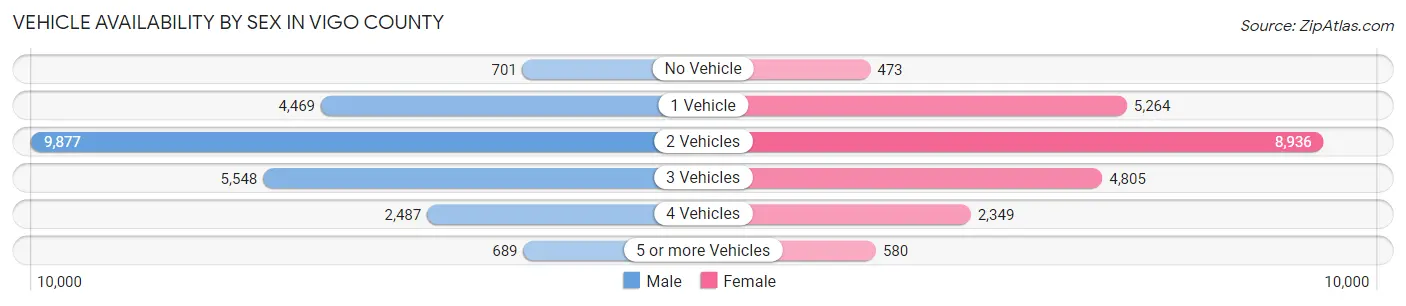
| Vehicles Available | Male | Female |
| No Vehicle | 701 (2.9%) | 473 (2.1%) |
| 1 Vehicle | 4,469 (18.8%) | 5,264 (23.5%) |
| 2 Vehicles | 9,877 (41.5%) | 8,936 (39.9%) |
| 3 Vehicles | 5,548 (23.3%) | 4,805 (21.4%) |
| 4 Vehicles | 2,487 (10.5%) | 2,349 (10.5%) |
| 5 or more Vehicles | 689 (2.9%) | 580 (2.6%) |
| Total | 23,771 (100.0%) | 22,407 (100.0%) |
Commute Time in Vigo County
The most frequently occuring commute durations in Vigo County are 15 to 19 minutes (10,052 commuters, 21.9%), 10 to 14 minutes (9,993 commuters, 21.8%), and 20 to 24 minutes (7,232 commuters, 15.8%).
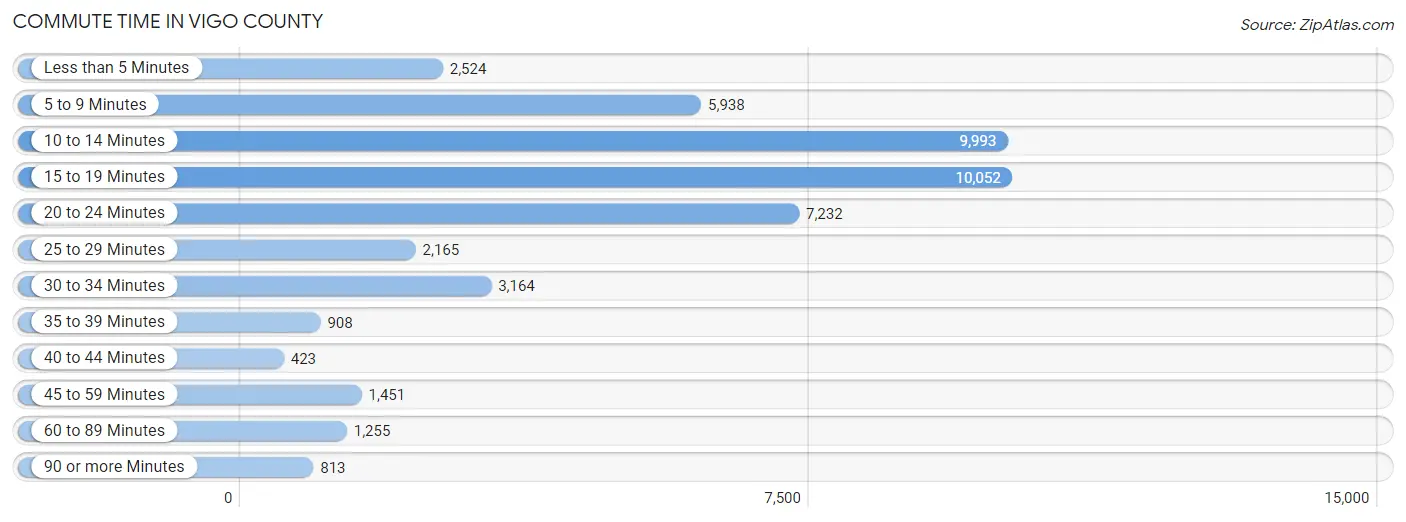
| Commute Time | # Commuters | % Commuters |
| Less than 5 Minutes | 2,524 | 5.5% |
| 5 to 9 Minutes | 5,938 | 12.9% |
| 10 to 14 Minutes | 9,993 | 21.8% |
| 15 to 19 Minutes | 10,052 | 21.9% |
| 20 to 24 Minutes | 7,232 | 15.8% |
| 25 to 29 Minutes | 2,165 | 4.7% |
| 30 to 34 Minutes | 3,164 | 6.9% |
| 35 to 39 Minutes | 908 | 2.0% |
| 40 to 44 Minutes | 423 | 0.9% |
| 45 to 59 Minutes | 1,451 | 3.2% |
| 60 to 89 Minutes | 1,255 | 2.7% |
| 90 or more Minutes | 813 | 1.8% |
Commute Time by Sex in Vigo County
The most common commute times in Vigo County are 10 to 14 minutes (5,075 commuters, 21.6%) for males and 15 to 19 minutes (5,554 commuters, 24.8%) for females.
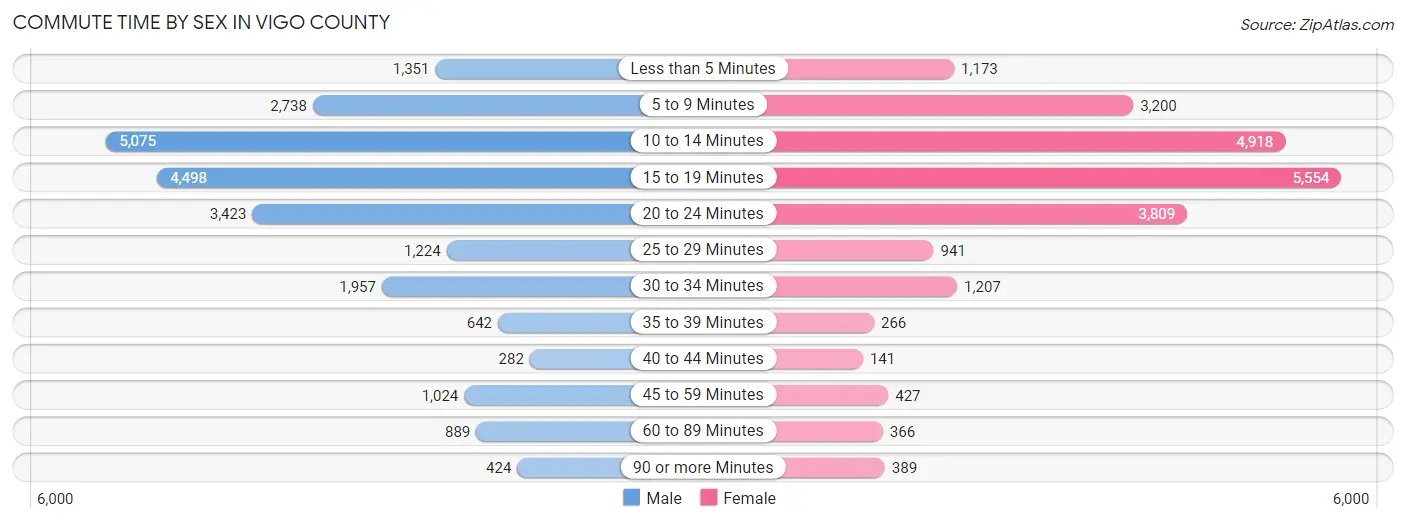
| Commute Time | Male | Female |
| Less than 5 Minutes | 1,351 (5.7%) | 1,173 (5.2%) |
| 5 to 9 Minutes | 2,738 (11.6%) | 3,200 (14.3%) |
| 10 to 14 Minutes | 5,075 (21.6%) | 4,918 (22.0%) |
| 15 to 19 Minutes | 4,498 (19.1%) | 5,554 (24.8%) |
| 20 to 24 Minutes | 3,423 (14.5%) | 3,809 (17.0%) |
| 25 to 29 Minutes | 1,224 (5.2%) | 941 (4.2%) |
| 30 to 34 Minutes | 1,957 (8.3%) | 1,207 (5.4%) |
| 35 to 39 Minutes | 642 (2.7%) | 266 (1.2%) |
| 40 to 44 Minutes | 282 (1.2%) | 141 (0.6%) |
| 45 to 59 Minutes | 1,024 (4.3%) | 427 (1.9%) |
| 60 to 89 Minutes | 889 (3.8%) | 366 (1.6%) |
| 90 or more Minutes | 424 (1.8%) | 389 (1.7%) |
Time of Departure to Work by Sex in Vigo County
The most frequent times of departure to work in Vigo County are 4:00 PM to 11:59 PM (3,184, 13.5%) for males and 7:30 AM to 7:59 AM (4,636, 20.7%) for females.
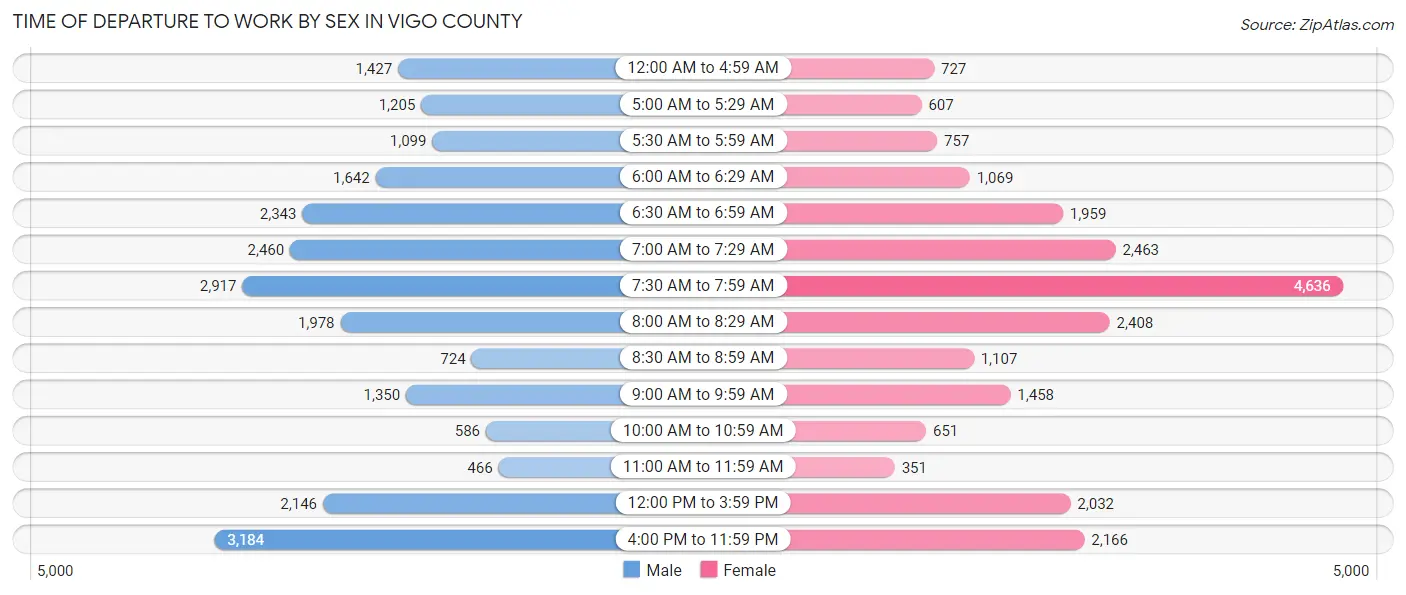
| Time of Departure | Male | Female |
| 12:00 AM to 4:59 AM | 1,427 (6.1%) | 727 (3.3%) |
| 5:00 AM to 5:29 AM | 1,205 (5.1%) | 607 (2.7%) |
| 5:30 AM to 5:59 AM | 1,099 (4.7%) | 757 (3.4%) |
| 6:00 AM to 6:29 AM | 1,642 (7.0%) | 1,069 (4.8%) |
| 6:30 AM to 6:59 AM | 2,343 (10.0%) | 1,959 (8.7%) |
| 7:00 AM to 7:29 AM | 2,460 (10.5%) | 2,463 (11.0%) |
| 7:30 AM to 7:59 AM | 2,917 (12.4%) | 4,636 (20.7%) |
| 8:00 AM to 8:29 AM | 1,978 (8.4%) | 2,408 (10.7%) |
| 8:30 AM to 8:59 AM | 724 (3.1%) | 1,107 (4.9%) |
| 9:00 AM to 9:59 AM | 1,350 (5.7%) | 1,458 (6.5%) |
| 10:00 AM to 10:59 AM | 586 (2.5%) | 651 (2.9%) |
| 11:00 AM to 11:59 AM | 466 (2.0%) | 351 (1.6%) |
| 12:00 PM to 3:59 PM | 2,146 (9.1%) | 2,032 (9.1%) |
| 4:00 PM to 11:59 PM | 3,184 (13.5%) | 2,166 (9.7%) |
| Total | 23,527 (100.0%) | 22,391 (100.0%) |
Housing Occupancy in Vigo County
Occupancy by Ownership in Vigo County
Of the total 42,756 dwellings in Vigo County, owner-occupied units account for 26,975 (63.1%), while renter-occupied units make up 15,781 (36.9%).
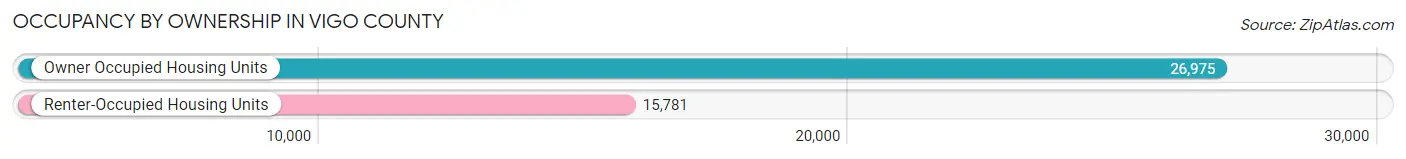
| Occupancy | # Housing Units | % Housing Units |
| Owner Occupied Housing Units | 26,975 | 63.1% |
| Renter-Occupied Housing Units | 15,781 | 36.9% |
| Total Occupied Housing Units | 42,756 | 100.0% |
Occupancy by Household Size in Vigo County
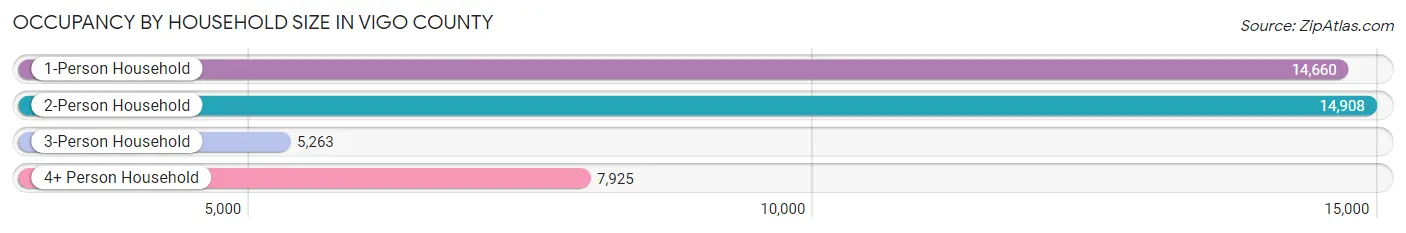
| Household Size | # Housing Units | % Housing Units |
| 1-Person Household | 14,660 | 34.3% |
| 2-Person Household | 14,908 | 34.9% |
| 3-Person Household | 5,263 | 12.3% |
| 4+ Person Household | 7,925 | 18.5% |
| Total Housing Units | 42,756 | 100.0% |
Occupancy by Ownership by Household Size in Vigo County
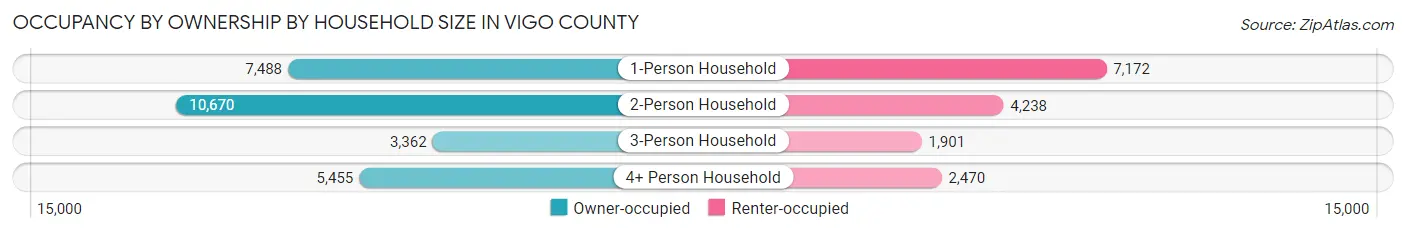
| Household Size | Owner-occupied | Renter-occupied |
| 1-Person Household | 7,488 (51.1%) | 7,172 (48.9%) |
| 2-Person Household | 10,670 (71.6%) | 4,238 (28.4%) |
| 3-Person Household | 3,362 (63.9%) | 1,901 (36.1%) |
| 4+ Person Household | 5,455 (68.8%) | 2,470 (31.2%) |
| Total Housing Units | 26,975 (63.1%) | 15,781 (36.9%) |
Occupancy by Educational Attainment in Vigo County
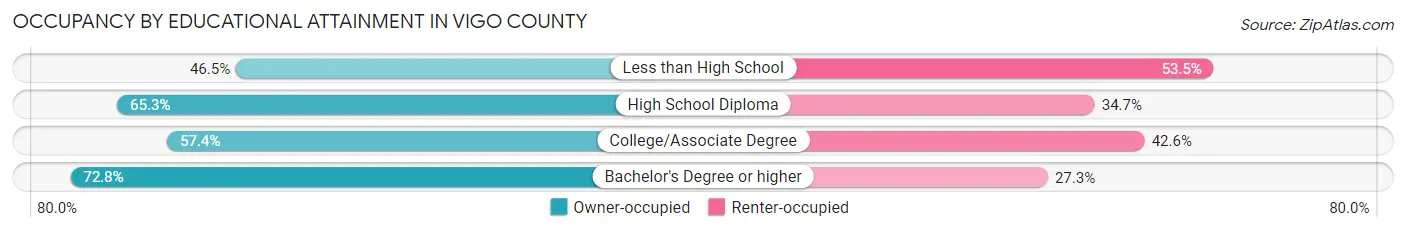
| Household Size | Owner-occupied | Renter-occupied |
| Less than High School | 1,397 (46.5%) | 1,609 (53.5%) |
| High School Diploma | 8,226 (65.3%) | 4,367 (34.7%) |
| College/Associate Degree | 8,989 (57.4%) | 6,672 (42.6%) |
| Bachelor's Degree or higher | 8,363 (72.8%) | 3,133 (27.3%) |
Occupancy by Age of Householder in Vigo County
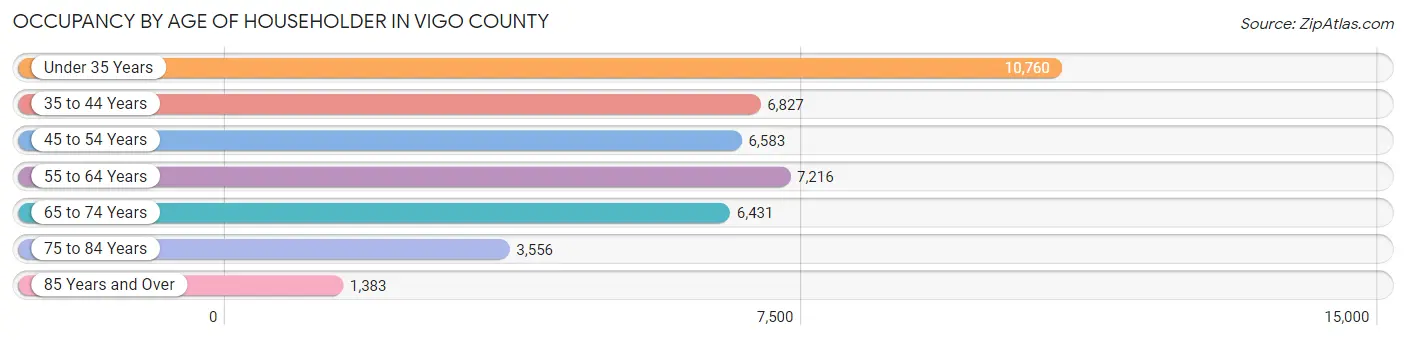
| Age Bracket | # Households | % Households |
| Under 35 Years | 10,760 | 25.2% |
| 35 to 44 Years | 6,827 | 16.0% |
| 45 to 54 Years | 6,583 | 15.4% |
| 55 to 64 Years | 7,216 | 16.9% |
| 65 to 74 Years | 6,431 | 15.0% |
| 75 to 84 Years | 3,556 | 8.3% |
| 85 Years and Over | 1,383 | 3.2% |
| Total | 42,756 | 100.0% |
Housing Finances in Vigo County
Median Income by Occupancy in Vigo County
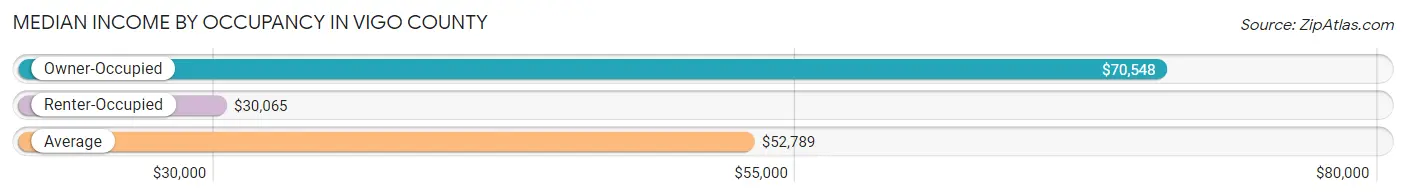
| Occupancy Type | # Households | Median Income |
| Owner-Occupied | 26,975 (63.1%) | $70,548 |
| Renter-Occupied | 15,781 (36.9%) | $30,065 |
| Average | 42,756 (100.0%) | $52,789 |
Occupancy by Householder Income Bracket in Vigo County
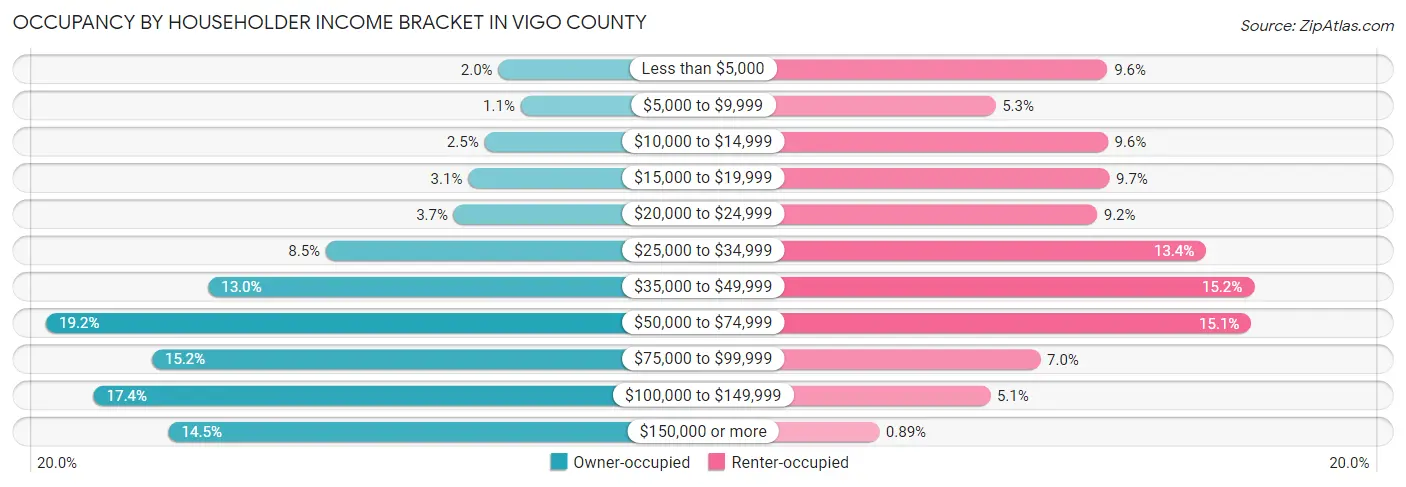
| Income Bracket | Owner-occupied | Renter-occupied |
| Less than $5,000 | 527 (1.9%) | 1,513 (9.6%) |
| $5,000 to $9,999 | 296 (1.1%) | 840 (5.3%) |
| $10,000 to $14,999 | 668 (2.5%) | 1,515 (9.6%) |
| $15,000 to $19,999 | 836 (3.1%) | 1,525 (9.7%) |
| $20,000 to $24,999 | 984 (3.6%) | 1,450 (9.2%) |
| $25,000 to $34,999 | 2,299 (8.5%) | 2,106 (13.4%) |
| $35,000 to $49,999 | 3,506 (13.0%) | 2,396 (15.2%) |
| $50,000 to $74,999 | 5,173 (19.2%) | 2,378 (15.1%) |
| $75,000 to $99,999 | 4,086 (15.1%) | 1,110 (7.0%) |
| $100,000 to $149,999 | 4,686 (17.4%) | 808 (5.1%) |
| $150,000 or more | 3,914 (14.5%) | 140 (0.9%) |
| Total | 26,975 (100.0%) | 15,781 (100.0%) |
Monthly Housing Cost Tiers in Vigo County
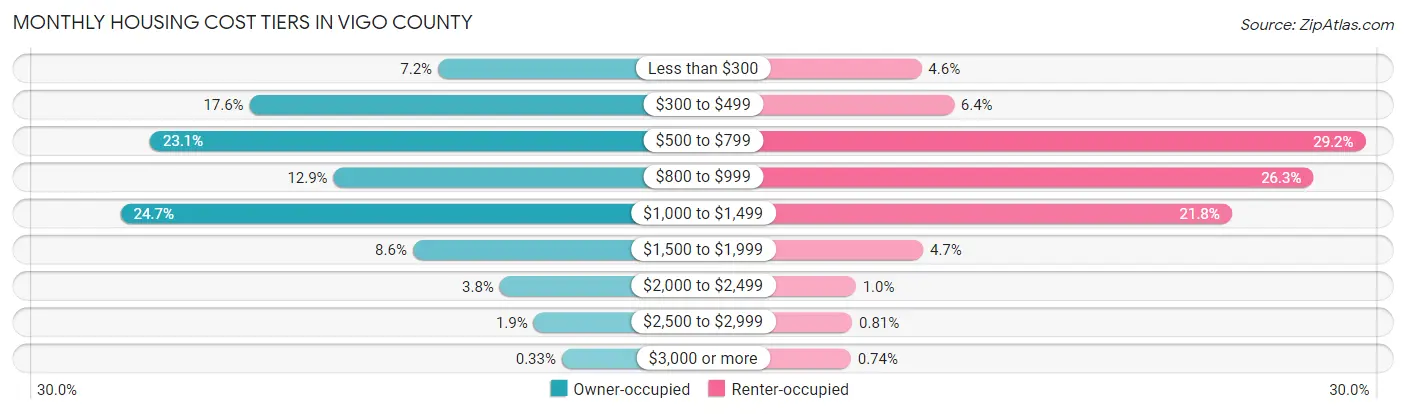
| Monthly Cost | Owner-occupied | Renter-occupied |
| Less than $300 | 1,933 (7.2%) | 733 (4.6%) |
| $300 to $499 | 4,742 (17.6%) | 1,015 (6.4%) |
| $500 to $799 | 6,226 (23.1%) | 4,601 (29.2%) |
| $800 to $999 | 3,491 (12.9%) | 4,148 (26.3%) |
| $1,000 to $1,499 | 6,662 (24.7%) | 3,435 (21.8%) |
| $1,500 to $1,999 | 2,309 (8.6%) | 747 (4.7%) |
| $2,000 to $2,499 | 1,014 (3.8%) | 159 (1.0%) |
| $2,500 to $2,999 | 509 (1.9%) | 128 (0.8%) |
| $3,000 or more | 89 (0.3%) | 116 (0.7%) |
| Total | 26,975 (100.0%) | 15,781 (100.0%) |
Physical Housing Characteristics in Vigo County
Housing Structures in Vigo County
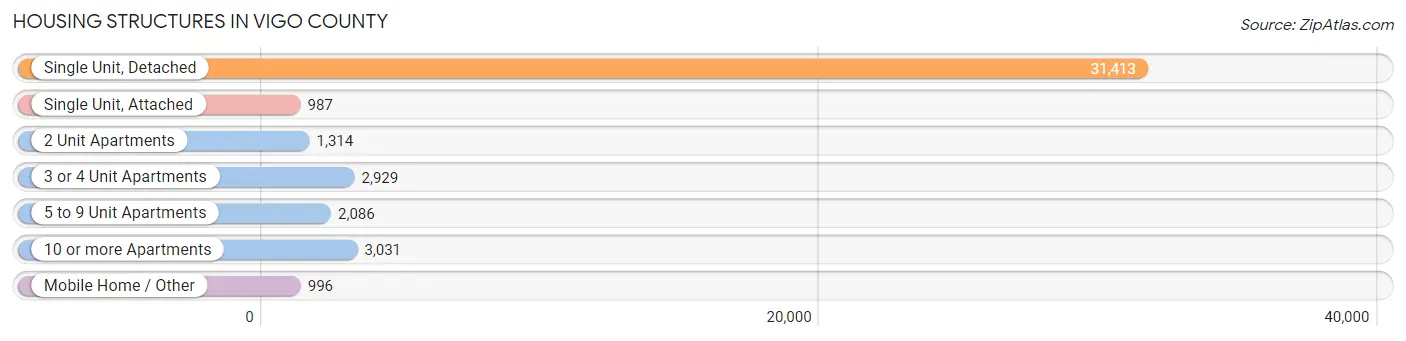
| Structure Type | # Housing Units | % Housing Units |
| Single Unit, Detached | 31,413 | 73.5% |
| Single Unit, Attached | 987 | 2.3% |
| 2 Unit Apartments | 1,314 | 3.1% |
| 3 or 4 Unit Apartments | 2,929 | 6.9% |
| 5 to 9 Unit Apartments | 2,086 | 4.9% |
| 10 or more Apartments | 3,031 | 7.1% |
| Mobile Home / Other | 996 | 2.3% |
| Total | 42,756 | 100.0% |
Housing Structures by Occupancy in Vigo County
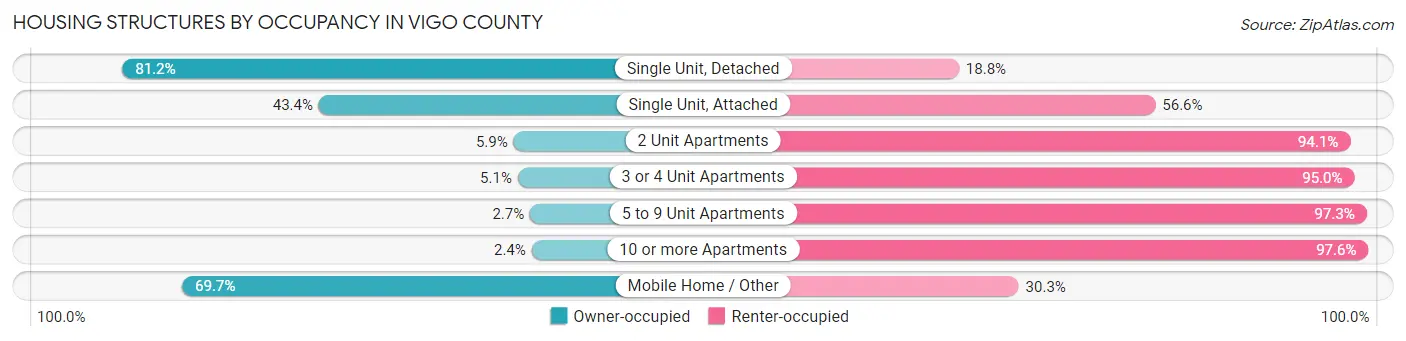
| Structure Type | Owner-occupied | Renter-occupied |
| Single Unit, Detached | 25,500 (81.2%) | 5,913 (18.8%) |
| Single Unit, Attached | 428 (43.4%) | 559 (56.6%) |
| 2 Unit Apartments | 77 (5.9%) | 1,237 (94.1%) |
| 3 or 4 Unit Apartments | 148 (5.1%) | 2,781 (95.0%) |
| 5 to 9 Unit Apartments | 56 (2.7%) | 2,030 (97.3%) |
| 10 or more Apartments | 72 (2.4%) | 2,959 (97.6%) |
| Mobile Home / Other | 694 (69.7%) | 302 (30.3%) |
| Total | 26,975 (63.1%) | 15,781 (36.9%) |
Housing Structures by Number of Rooms in Vigo County
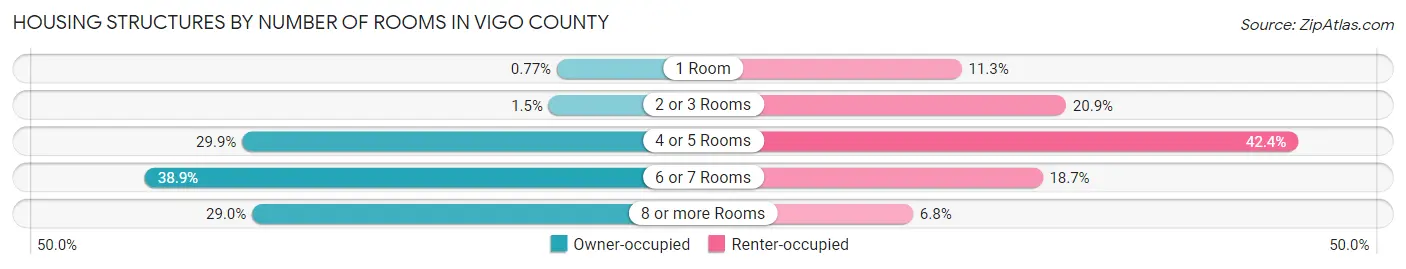
| Number of Rooms | Owner-occupied | Renter-occupied |
| 1 Room | 207 (0.8%) | 1,776 (11.3%) |
| 2 or 3 Rooms | 411 (1.5%) | 3,298 (20.9%) |
| 4 or 5 Rooms | 8,060 (29.9%) | 6,686 (42.4%) |
| 6 or 7 Rooms | 10,484 (38.9%) | 2,956 (18.7%) |
| 8 or more Rooms | 7,813 (29.0%) | 1,065 (6.8%) |
| Total | 26,975 (100.0%) | 15,781 (100.0%) |
Housing Structure by Heating Type in Vigo County
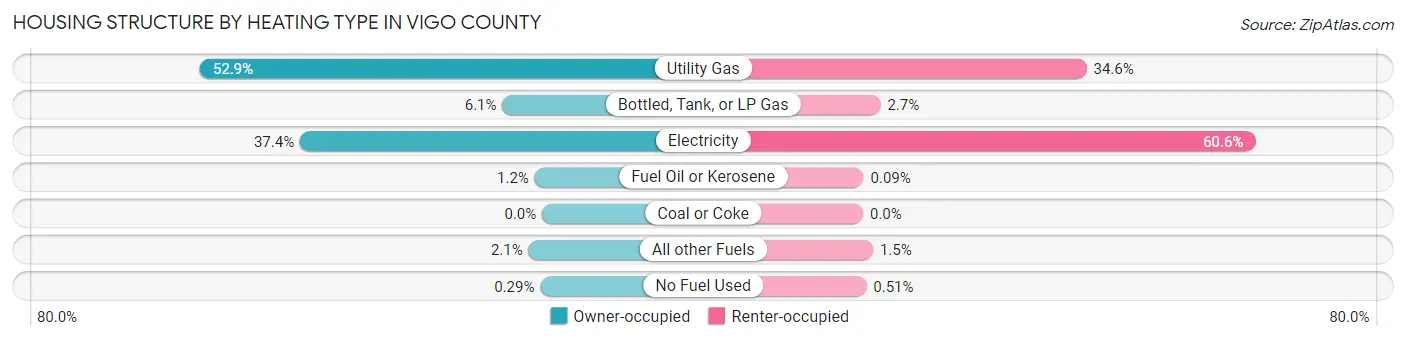
| Heating Type | Owner-occupied | Renter-occupied |
| Utility Gas | 14,270 (52.9%) | 5,453 (34.5%) |
| Bottled, Tank, or LP Gas | 1,656 (6.1%) | 425 (2.7%) |
| Electricity | 10,096 (37.4%) | 9,567 (60.6%) |
| Fuel Oil or Kerosene | 309 (1.1%) | 14 (0.1%) |
| Coal or Coke | 0 (0.0%) | 0 (0.0%) |
| All other Fuels | 566 (2.1%) | 242 (1.5%) |
| No Fuel Used | 78 (0.3%) | 80 (0.5%) |
| Total | 26,975 (100.0%) | 15,781 (100.0%) |
Household Vehicle Usage in Vigo County
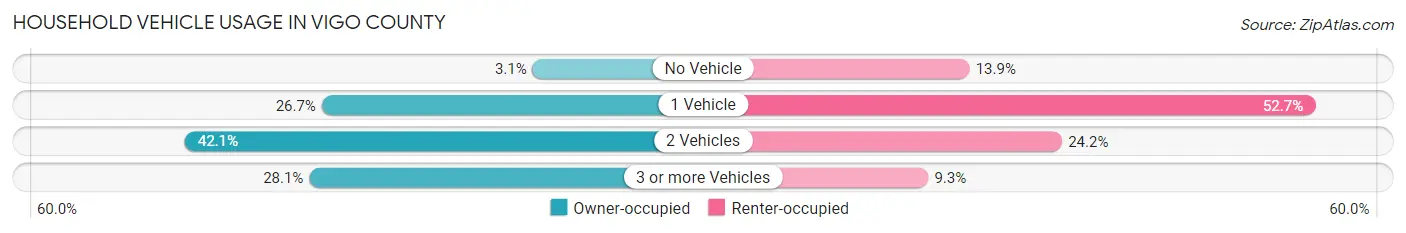
| Vehicles per Household | Owner-occupied | Renter-occupied |
| No Vehicle | 837 (3.1%) | 2,189 (13.9%) |
| 1 Vehicle | 7,209 (26.7%) | 8,309 (52.6%) |
| 2 Vehicles | 11,344 (42.0%) | 3,823 (24.2%) |
| 3 or more Vehicles | 7,585 (28.1%) | 1,460 (9.2%) |
| Total | 26,975 (100.0%) | 15,781 (100.0%) |
Real Estate & Mortgages in Vigo County
Real Estate and Mortgage Overview in Vigo County
| Characteristic | Without Mortgage | With Mortgage |
| Housing Units | 10,252 | 16,723 |
| Median Property Value | $108,700 | $143,500 |
| Median Household Income | $57,232 | $2,499 |
| Monthly Housing Costs | $444 | $77 |
| Real Estate Taxes | $1,069 | $703 |
Property Value by Mortgage Status in Vigo County
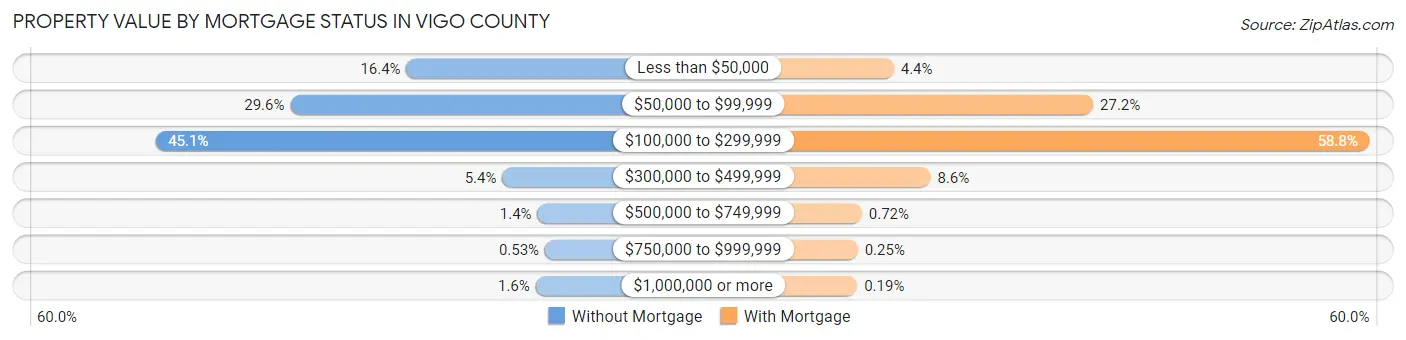
| Property Value | Without Mortgage | With Mortgage |
| Less than $50,000 | 1,677 (16.4%) | 730 (4.4%) |
| $50,000 to $99,999 | 3,038 (29.6%) | 4,541 (27.2%) |
| $100,000 to $299,999 | 4,621 (45.1%) | 9,826 (58.8%) |
| $300,000 to $499,999 | 555 (5.4%) | 1,433 (8.6%) |
| $500,000 to $749,999 | 143 (1.4%) | 121 (0.7%) |
| $750,000 to $999,999 | 54 (0.5%) | 41 (0.3%) |
| $1,000,000 or more | 164 (1.6%) | 31 (0.2%) |
| Total | 10,252 (100.0%) | 16,723 (100.0%) |
Household Income by Mortgage Status in Vigo County
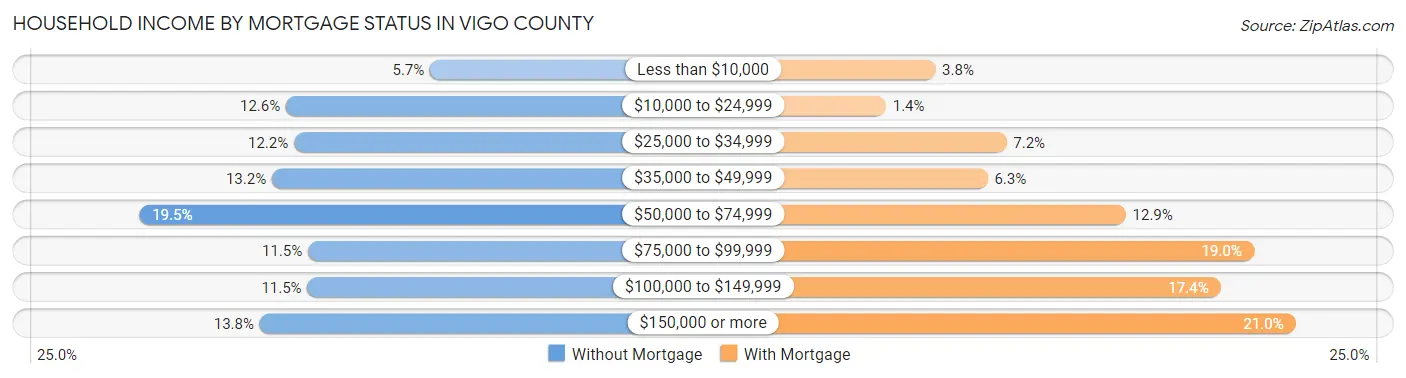
| Household Income | Without Mortgage | With Mortgage |
| Less than $10,000 | 583 (5.7%) | 634 (3.8%) |
| $10,000 to $24,999 | 1,287 (12.6%) | 240 (1.4%) |
| $25,000 to $34,999 | 1,248 (12.2%) | 1,201 (7.2%) |
| $35,000 to $49,999 | 1,355 (13.2%) | 1,051 (6.3%) |
| $50,000 to $74,999 | 2,003 (19.5%) | 2,151 (12.9%) |
| $75,000 to $99,999 | 1,179 (11.5%) | 3,170 (19.0%) |
| $100,000 to $149,999 | 1,182 (11.5%) | 2,907 (17.4%) |
| $150,000 or more | 1,415 (13.8%) | 3,504 (20.9%) |
| Total | 10,252 (100.0%) | 16,723 (100.0%) |
Property Value to Household Income Ratio in Vigo County
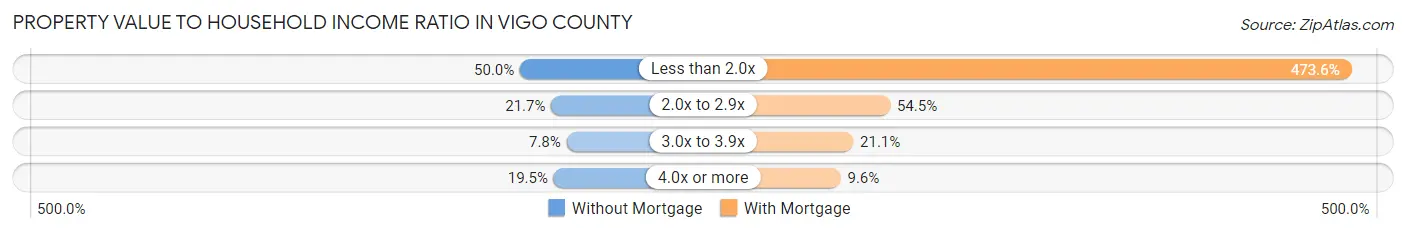
| Value-to-Income Ratio | Without Mortgage | With Mortgage |
| Less than 2.0x | 5,130 (50.0%) | 79,195 (473.6%) |
| 2.0x to 2.9x | 2,226 (21.7%) | 9,121 (54.5%) |
| 3.0x to 3.9x | 799 (7.8%) | 3,526 (21.1%) |
| 4.0x or more | 1,997 (19.5%) | 1,611 (9.6%) |
| Total | 10,252 (100.0%) | 16,723 (100.0%) |
Real Estate Taxes by Mortgage Status in Vigo County
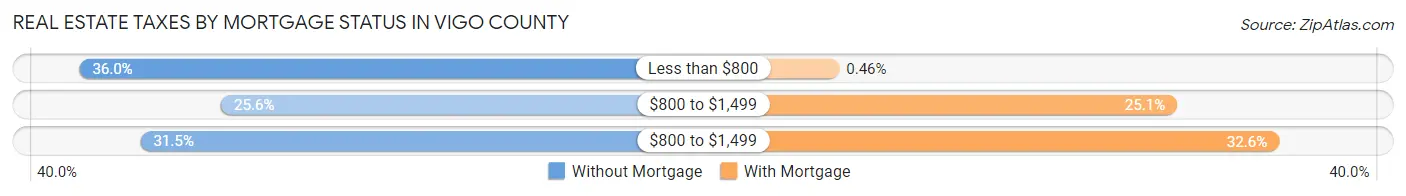
| Property Taxes | Without Mortgage | With Mortgage |
| Less than $800 | 3,690 (36.0%) | 77 (0.5%) |
| $800 to $1,499 | 2,629 (25.6%) | 4,202 (25.1%) |
| $800 to $1,499 | 3,232 (31.5%) | 5,448 (32.6%) |
| Total | 10,252 (100.0%) | 16,723 (100.0%) |
Health & Disability in Vigo County
Health Insurance Coverage by Age in Vigo County
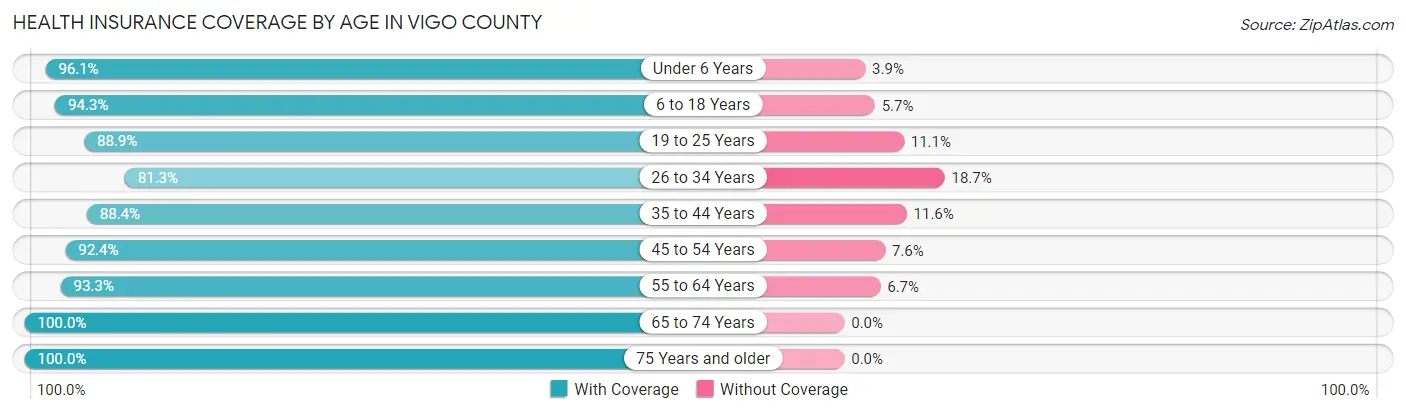
| Age Bracket | With Coverage | Without Coverage |
| Under 6 Years | 6,792 (96.1%) | 275 (3.9%) |
| 6 to 18 Years | 15,567 (94.3%) | 938 (5.7%) |
| 19 to 25 Years | 13,942 (88.9%) | 1,741 (11.1%) |
| 26 to 34 Years | 9,262 (81.3%) | 2,131 (18.7%) |
| 35 to 44 Years | 10,054 (88.4%) | 1,322 (11.6%) |
| 45 to 54 Years | 10,526 (92.4%) | 864 (7.6%) |
| 55 to 64 Years | 11,480 (93.3%) | 826 (6.7%) |
| 65 to 74 Years | 9,992 (100.0%) | 0 (0.0%) |
| 75 Years and older | 7,067 (100.0%) | 0 (0.0%) |
| Total | 94,682 (92.1%) | 8,097 (7.9%) |
Health Insurance Coverage by Citizenship Status in Vigo County
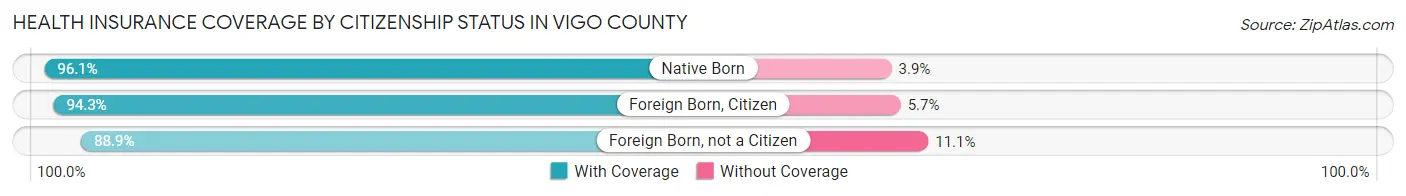
| Citizenship Status | With Coverage | Without Coverage |
| Native Born | 6,792 (96.1%) | 275 (3.9%) |
| Foreign Born, Citizen | 15,567 (94.3%) | 938 (5.7%) |
| Foreign Born, not a Citizen | 13,942 (88.9%) | 1,741 (11.1%) |
Health Insurance Coverage by Household Income in Vigo County
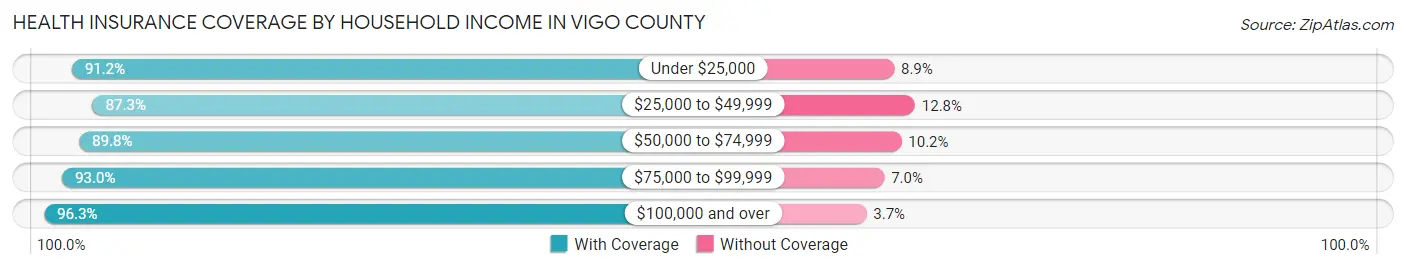
| Household Income | With Coverage | Without Coverage |
| Under $25,000 | 16,410 (91.1%) | 1,593 (8.8%) |
| $25,000 to $49,999 | 18,234 (87.3%) | 2,665 (12.8%) |
| $50,000 to $74,999 | 15,135 (89.8%) | 1,722 (10.2%) |
| $75,000 to $99,999 | 13,256 (93.0%) | 999 (7.0%) |
| $100,000 and over | 27,707 (96.3%) | 1,056 (3.7%) |
Public vs Private Health Insurance Coverage by Age in Vigo County
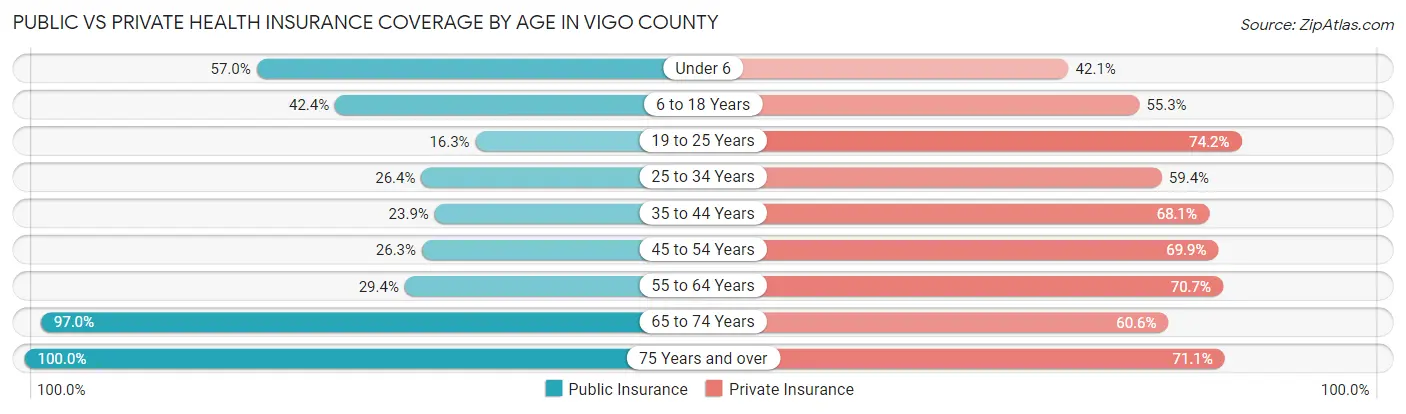
| Age Bracket | Public Insurance | Private Insurance |
| Under 6 | 4,025 (57.0%) | 2,976 (42.1%) |
| 6 to 18 Years | 6,995 (42.4%) | 9,119 (55.2%) |
| 19 to 25 Years | 2,560 (16.3%) | 11,631 (74.2%) |
| 25 to 34 Years | 3,003 (26.4%) | 6,770 (59.4%) |
| 35 to 44 Years | 2,718 (23.9%) | 7,749 (68.1%) |
| 45 to 54 Years | 2,991 (26.3%) | 7,959 (69.9%) |
| 55 to 64 Years | 3,623 (29.4%) | 8,701 (70.7%) |
| 65 to 74 Years | 9,690 (97.0%) | 6,054 (60.6%) |
| 75 Years and over | 7,067 (100.0%) | 5,021 (71.1%) |
| Total | 42,672 (41.5%) | 65,980 (64.2%) |
Disability Status by Sex by Age in Vigo County
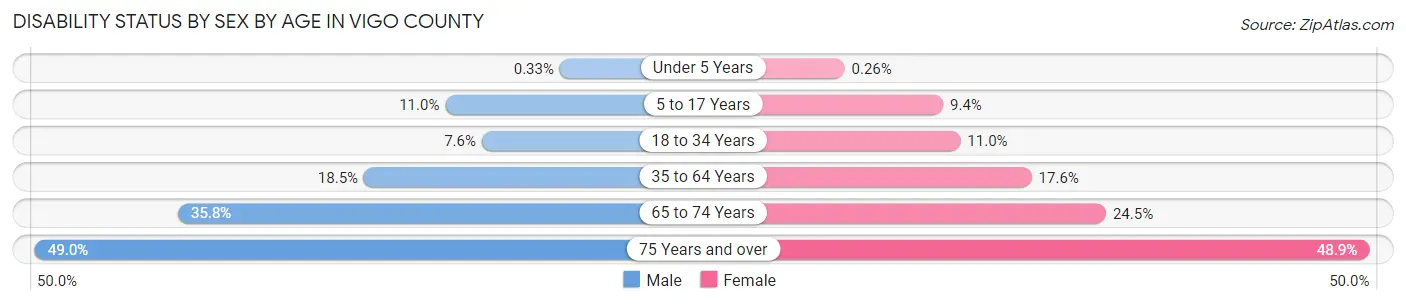
| Age Bracket | Male | Female |
| Under 5 Years | 10 (0.3%) | 7 (0.3%) |
| 5 to 17 Years | 901 (11.0%) | 717 (9.4%) |
| 18 to 34 Years | 1,143 (7.6%) | 1,539 (11.0%) |
| 35 to 64 Years | 3,203 (18.5%) | 3,131 (17.6%) |
| 65 to 74 Years | 1,653 (35.8%) | 1,317 (24.5%) |
| 75 Years and over | 1,275 (49.0%) | 2,186 (48.9%) |
Disability Class by Sex by Age in Vigo County
Disability Class: Hearing Difficulty
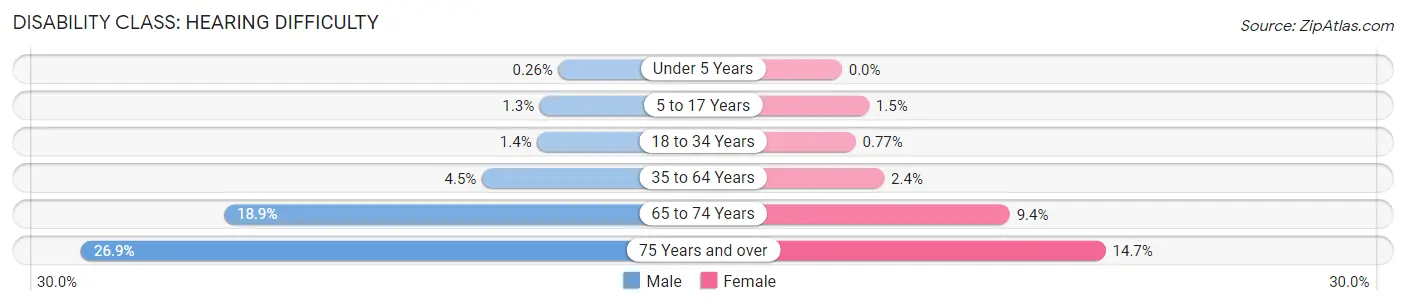
| Age Bracket | Male | Female |
| Under 5 Years | 8 (0.3%) | 0 (0.0%) |
| 5 to 17 Years | 107 (1.3%) | 115 (1.5%) |
| 18 to 34 Years | 218 (1.4%) | 107 (0.8%) |
| 35 to 64 Years | 782 (4.5%) | 420 (2.4%) |
| 65 to 74 Years | 873 (18.9%) | 502 (9.3%) |
| 75 Years and over | 698 (26.9%) | 656 (14.7%) |
Disability Class: Vision Difficulty
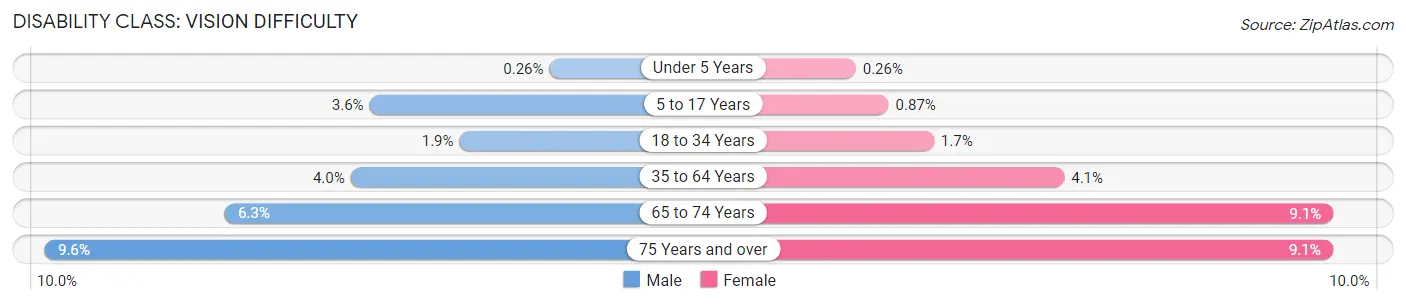
| Age Bracket | Male | Female |
| Under 5 Years | 8 (0.3%) | 7 (0.3%) |
| 5 to 17 Years | 296 (3.6%) | 66 (0.9%) |
| 18 to 34 Years | 291 (1.9%) | 239 (1.7%) |
| 35 to 64 Years | 684 (4.0%) | 734 (4.1%) |
| 65 to 74 Years | 290 (6.3%) | 490 (9.1%) |
| 75 Years and over | 250 (9.6%) | 407 (9.1%) |
Disability Class: Cognitive Difficulty
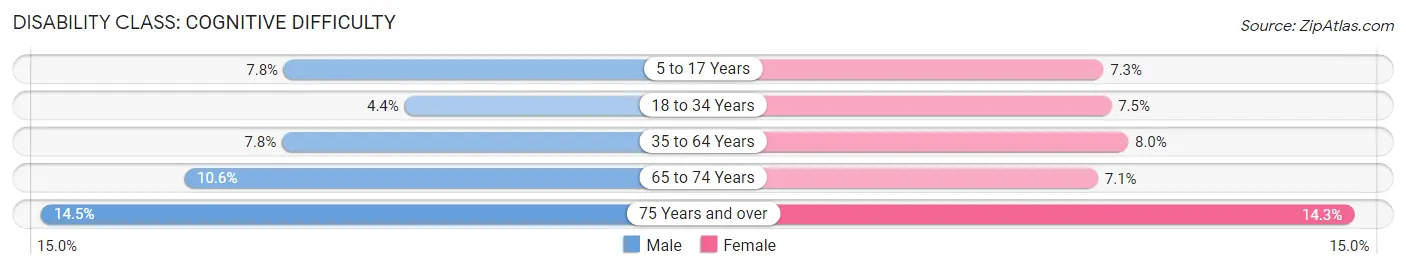
| Age Bracket | Male | Female |
| 5 to 17 Years | 640 (7.8%) | 555 (7.3%) |
| 18 to 34 Years | 667 (4.4%) | 1,049 (7.5%) |
| 35 to 64 Years | 1,356 (7.8%) | 1,416 (8.0%) |
| 65 to 74 Years | 488 (10.6%) | 383 (7.1%) |
| 75 Years and over | 378 (14.5%) | 637 (14.3%) |
Disability Class: Ambulatory Difficulty
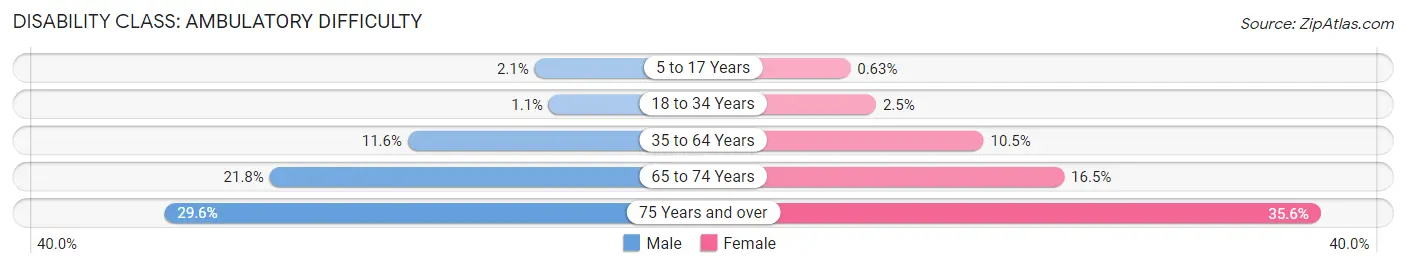
| Age Bracket | Male | Female |
| 5 to 17 Years | 176 (2.1%) | 48 (0.6%) |
| 18 to 34 Years | 162 (1.1%) | 355 (2.5%) |
| 35 to 64 Years | 1,999 (11.6%) | 1,871 (10.5%) |
| 65 to 74 Years | 1,008 (21.8%) | 887 (16.5%) |
| 75 Years and over | 770 (29.6%) | 1,588 (35.5%) |
Disability Class: Self-Care Difficulty
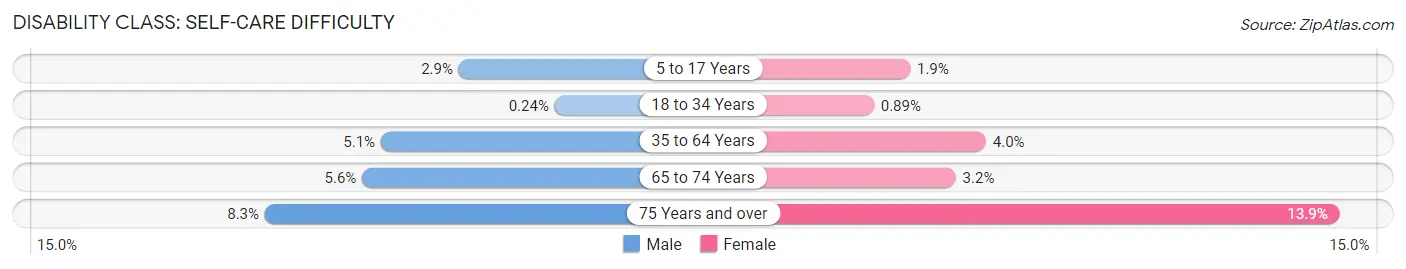
| Age Bracket | Male | Female |
| 5 to 17 Years | 239 (2.9%) | 145 (1.9%) |
| 18 to 34 Years | 36 (0.2%) | 124 (0.9%) |
| 35 to 64 Years | 880 (5.1%) | 713 (4.0%) |
| 65 to 74 Years | 259 (5.6%) | 170 (3.2%) |
| 75 Years and over | 216 (8.3%) | 619 (13.9%) |
Technology Access in Vigo County
Computing Device Access in Vigo County
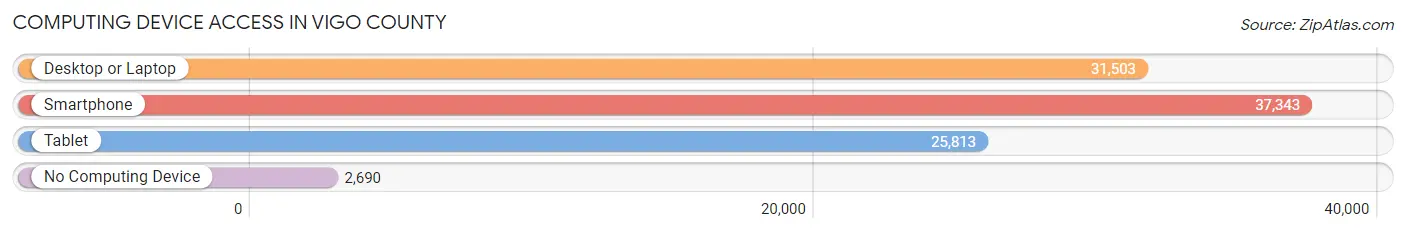
| Device Type | # Households | % Households |
| Desktop or Laptop | 31,503 | 73.7% |
| Smartphone | 37,343 | 87.3% |
| Tablet | 25,813 | 60.4% |
| No Computing Device | 2,690 | 6.3% |
| Total | 42,756 | 100.0% |
Internet Access in Vigo County
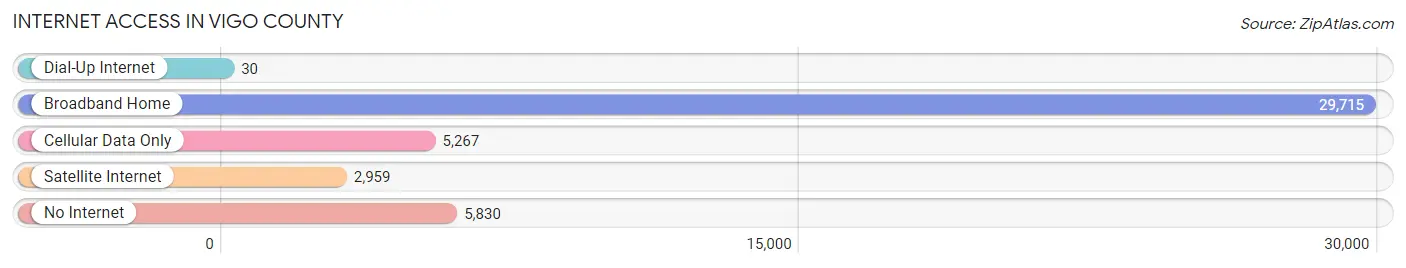
| Internet Type | # Households | % Households |
| Dial-Up Internet | 30 | 0.1% |
| Broadband Home | 29,715 | 69.5% |
| Cellular Data Only | 5,267 | 12.3% |
| Satellite Internet | 2,959 | 6.9% |
| No Internet | 5,830 | 13.6% |
| Total | 42,756 | 100.0% |
Vigo County Summary
Vigo County, Indiana is located in the western part of the state, and is bordered by Clay, Sullivan, Vermillion, Parke, and Putnam counties. It is part of the Terre Haute Metropolitan Statistical Area, and is the largest county in the state by population. The county seat is Terre Haute, and the county is home to a population of 107,848 people, according to the 2010 census.
Geography
Vigo County is located in the western part of Indiana, and is bordered by Clay, Sullivan, Vermillion, Parke, and Putnam counties. It is part of the Terre Haute Metropolitan Statistical Area, and is the largest county in the state by population. The county is located in the Wabash Valley region of the state, and is characterized by rolling hills and flat plains. The Wabash River runs through the county, and is a major source of recreation and economic activity. The county is also home to several state parks, including Shades State Park, Turkey Run State Park, and Fort Harrison State Park.
History
Vigo County was formed in 1818 from parts of Sullivan and Knox counties. It was named after Colonel Francis Vigo, an Italian-born fur trader and Revolutionary War hero. The county was initially a part of the Northwest Territory, and was later included in the Indiana Territory. The county was officially organized in 1819, and the county seat was established in Terre Haute.
The county was an important center of industry and commerce in the 19th century, and was home to several major railroads. The county was also a major center of the coal mining industry, and was home to several large coal mines. The county was also home to several large manufacturing plants, including the Terre Haute Brewing Company, the Terre Haute Glass Company, and the Terre Haute Paper Company.
Economy
Vigo County is home to a diverse economy, with a variety of industries represented. The county is home to several large employers, including Indiana State University, Union Hospital, and the Terre Haute Regional Airport. The county is also home to several major manufacturing plants, including the Terre Haute Brewing Company, the Terre Haute Glass Company, and the Terre Haute Paper Company. The county is also home to several large retail stores, including Walmart, Target, and Kohl's.
Demographics
According to the 2010 census, Vigo County had a population of 107,848 people. The population was spread out, with 48.3% of the population being male and 51.7% being female. The median age was 38.2 years, and the median household income was $41,945. The racial makeup of the county was 87.2% White, 8.3% African American, 0.7% Native American, 1.2% Asian, 0.1% Pacific Islander, and 2.5% from other races.
Conclusion
Vigo County, Indiana is a large county located in the western part of the state. It is home to a diverse population and a variety of industries, and is an important center of industry and commerce in the region. The county is home to several large employers, and is also home to several state parks and recreational areas. The county is also home to a diverse population, with a median age of 38.2 years and a median household income of $41,945.
Common Questions
What is the Total Population of Vigo County?
Total Population of Vigo County is 106,355.
What is the Total Male Population of Vigo County?
Total Male Population of Vigo County is 53,823.
What is the Total Female Population of Vigo County?
Total Female Population of Vigo County is 52,532.
What is the Ratio of Males per 100 Females in Vigo County?
There are 102.46 Males per 100 Females in Vigo County.
What is the Ratio of Females per 100 Males in Vigo County?
There are 97.60 Females per 100 Males in Vigo County.
What is the Median Population Age in Vigo County?
Median Population Age in Vigo County is 36.4 Years.
What is the Average Family Size in Vigo County
Average Family Size in Vigo County is 3.0 People.
What is the Average Household Size in Vigo County
Average Household Size in Vigo County is 2.3 People.
What is Per Capita Income in Vigo County?
Per Capita income in Vigo County is $30,240.
What is the Median Family Income in Vigo County?
Median Family Income in Vigo County is $71,371.
What is the Median Household income in Vigo County?
Median Household Income in Vigo County is $52,789.
What is Income or Wage Gap in Vigo County?
Income or Wage Gap in Vigo County is 31.0%.
Women in Vigo County earn 69.0 cents for every dollar earned by a man.
What is Family Income Deficit in Vigo County?
Family Income Deficit in Vigo County is $11,546.
Families that are below poverty line in Vigo County earn $11,546 less on average than the poverty threshold level.
What is Inequality or Gini Index in Vigo County?
Inequality or Gini Index in Vigo County is 0.47.
How Large is the Labor Force in Vigo County?
There are 52,178 People in the Labor Forcein in Vigo County.
What is the Percentage of People in the Labor Force in Vigo County?
59.8% of People are in the Labor Force in Vigo County.
What is the Unemployment Rate in Vigo County?
Unemployment Rate in Vigo County is 6.1%.