Vanderburgh County, IN
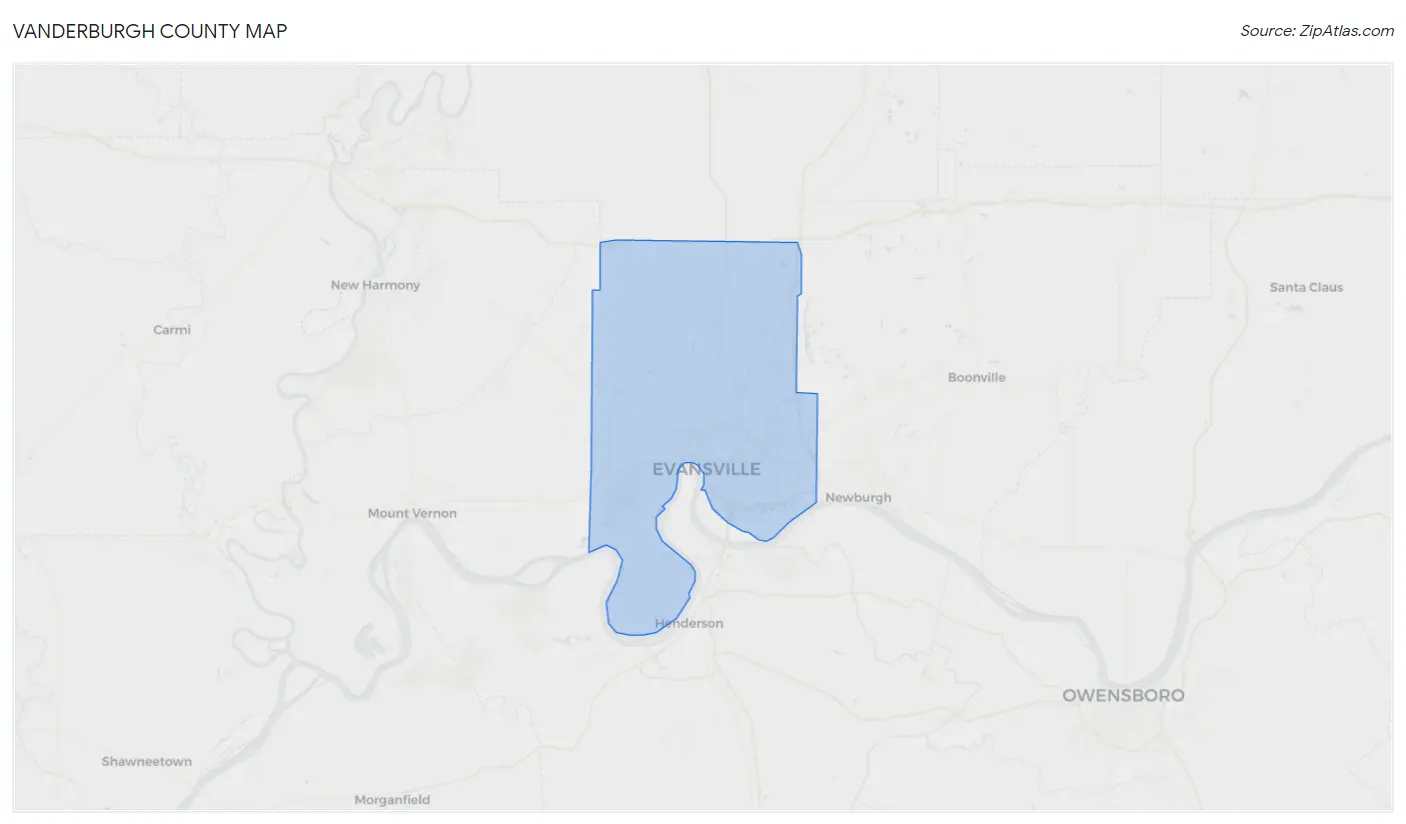
Vanderburgh County Map
Vanderburgh County Overview
179,900
TOTAL POPULATION
88,005
MALE POPULATION
91,895
FEMALE POPULATION
95.77
MALES / 100 FEMALES
104.42
FEMALES / 100 MALES
38.9
MEDIAN AGE
2.9
AVG FAMILY SIZE
2.3
AVG HOUSEHOLD SIZE
$33,614
PER CAPITA INCOME
$74,561
AVG FAMILY INCOME
$58,839
AVG HOUSEHOLD INCOME
32.6%
WAGE / INCOME GAP [ % ]
67.4¢/ $1
WAGE / INCOME GAP [ $ ]
$11,215
FAMILY INCOME DEFICIT
0.45
INEQUALITY / GINI INDEX
93,704
LABOR FORCE [ PEOPLE ]
64.4%
PERCENT IN LABOR FORCE
4.7%
UNEMPLOYMENT RATE
Vanderburgh County Area Codes
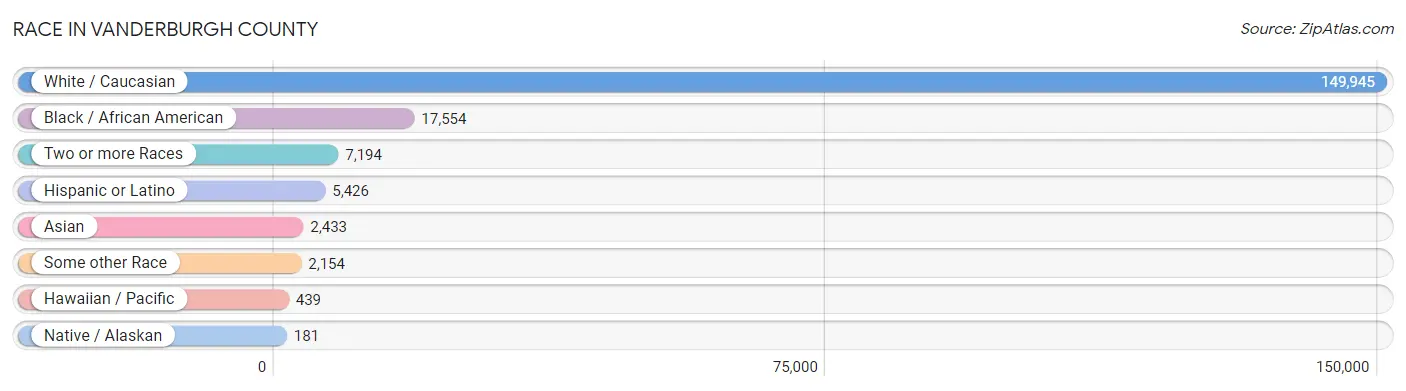
Race in Vanderburgh County
The most populous races in Vanderburgh County are White / Caucasian (149,945 | 83.4%), Black / African American (17,554 | 9.8%), and Two or more Races (7,194 | 4.0%).
| Race | # Population | % Population |
| Asian | 2,433 | 1.3% |
| Black / African American | 17,554 | 9.8% |
| Hawaiian / Pacific | 439 | 0.2% |
| Hispanic or Latino | 5,426 | 3.0% |
| Native / Alaskan | 181 | 0.1% |
| White / Caucasian | 149,945 | 83.4% |
| Two or more Races | 7,194 | 4.0% |
| Some other Race | 2,154 | 1.2% |
| Total | 179,900 | 100.0% |
Ancestry in Vanderburgh County
The most populous ancestries reported in Vanderburgh County are German (47,295 | 26.3%), English (21,257 | 11.8%), Irish (18,646 | 10.4%), American (10,488 | 5.8%), and Italian (3,847 | 2.1%), together accounting for 56.4% of all Vanderburgh County residents.

| Ancestry | # Population | % Population |
| African | 532 | 0.3% |
| Albanian | 7 | 0.0% |
| Alsatian | 10 | 0.0% |
| American | 10,488 | 5.8% |
| Apache | 32 | 0.0% |
| Arab | 172 | 0.1% |
| Argentinean | 78 | 0.0% |
| Armenian | 12 | 0.0% |
| Australian | 7 | 0.0% |
| Austrian | 195 | 0.1% |
| Bahamian | 11 | 0.0% |
| Belgian | 116 | 0.1% |
| Bhutanese | 244 | 0.1% |
| Blackfeet | 89 | 0.1% |
| Bolivian | 15 | 0.0% |
| Brazilian | 39 | 0.0% |
| British | 880 | 0.5% |
| Burmese | 332 | 0.2% |
| Canadian | 138 | 0.1% |
| Celtic | 8 | 0.0% |
| Central American | 691 | 0.4% |
| Central American Indian | 107 | 0.1% |
| Cherokee | 399 | 0.2% |
| Chickasaw | 7 | 0.0% |
| Choctaw | 4 | 0.0% |
| Colombian | 31 | 0.0% |
| Comanche | 3 | 0.0% |
| Creek | 5 | 0.0% |
| Croatian | 37 | 0.0% |
| Cuban | 212 | 0.1% |
| Czech | 180 | 0.1% |
| Czechoslovakian | 25 | 0.0% |
| Danish | 97 | 0.1% |
| Dominican | 63 | 0.0% |
| Dutch | 1,432 | 0.8% |
| Dutch West Indian | 22 | 0.0% |
| Eastern European | 161 | 0.1% |
| Ecuadorian | 16 | 0.0% |
| English | 21,257 | 11.8% |
| Estonian | 16 | 0.0% |
| Ethiopian | 2 | 0.0% |
| European | 3,199 | 1.8% |
| Fijian | 277 | 0.2% |
| Filipino | 51 | 0.0% |
| Finnish | 94 | 0.1% |
| French | 3,478 | 1.9% |
| French Canadian | 356 | 0.2% |
| German | 47,295 | 26.3% |
| German Russian | 32 | 0.0% |
| Ghanaian | 3 | 0.0% |
| Greek | 152 | 0.1% |
| Guamanian / Chamorro | 20 | 0.0% |
| Guatemalan | 148 | 0.1% |
| Guyanese | 34 | 0.0% |
| Haitian | 294 | 0.2% |
| Honduran | 177 | 0.1% |
| Hungarian | 321 | 0.2% |
| Indian (Asian) | 1,049 | 0.6% |
| Indonesian | 60 | 0.0% |
| Iranian | 87 | 0.1% |
| Irish | 18,646 | 10.4% |
| Israeli | 32 | 0.0% |
| Italian | 3,847 | 2.1% |
| Jamaican | 289 | 0.2% |
| Japanese | 56 | 0.0% |
| Jordanian | 4 | 0.0% |
| Kenyan | 26 | 0.0% |
| Korean | 446 | 0.3% |
| Lebanese | 15 | 0.0% |
| Liberian | 1 | 0.0% |
| Lithuanian | 58 | 0.0% |
| Lumbee | 8 | 0.0% |
| Mexican | 3,230 | 1.8% |
| Mexican American Indian | 120 | 0.1% |
| Mongolian | 133 | 0.1% |
| Native Hawaiian | 26 | 0.0% |
| Navajo | 9 | 0.0% |
| Nicaraguan | 36 | 0.0% |
| Nigerian | 60 | 0.0% |
| Northern European | 164 | 0.1% |
| Norwegian | 662 | 0.4% |
| Pakistani | 54 | 0.0% |
| Palestinian | 30 | 0.0% |
| Panamanian | 21 | 0.0% |
| Pennsylvania German | 8 | 0.0% |
| Peruvian | 44 | 0.0% |
| Polish | 2,803 | 1.6% |
| Portuguese | 38 | 0.0% |
| Potawatomi | 5 | 0.0% |
| Puerto Rican | 400 | 0.2% |
| Romanian | 36 | 0.0% |
| Russian | 291 | 0.2% |
| Salvadoran | 309 | 0.2% |
| Samoan | 93 | 0.1% |
| Scandinavian | 304 | 0.2% |
| Scotch-Irish | 1,494 | 0.8% |
| Scottish | 3,247 | 1.8% |
| Seminole | 16 | 0.0% |
| Senegalese | 124 | 0.1% |
| Serbian | 131 | 0.1% |
| Sioux | 56 | 0.0% |
| Slavic | 1 | 0.0% |
| Slovak | 99 | 0.1% |
| Slovene | 7 | 0.0% |
| South American | 314 | 0.2% |
| Spaniard | 96 | 0.1% |
| Spanish | 185 | 0.1% |
| Sri Lankan | 393 | 0.2% |
| Subsaharan African | 781 | 0.4% |
| Swedish | 560 | 0.3% |
| Swiss | 323 | 0.2% |
| Syrian | 51 | 0.0% |
| Thai | 534 | 0.3% |
| Trinidadian and Tobagonian | 45 | 0.0% |
| Turkish | 116 | 0.1% |
| Ukrainian | 93 | 0.1% |
| Venezuelan | 112 | 0.1% |
| Welsh | 1,189 | 0.7% |
| West Indian | 71 | 0.0% |
| Yugoslavian | 82 | 0.1% | View All 120 Rows |
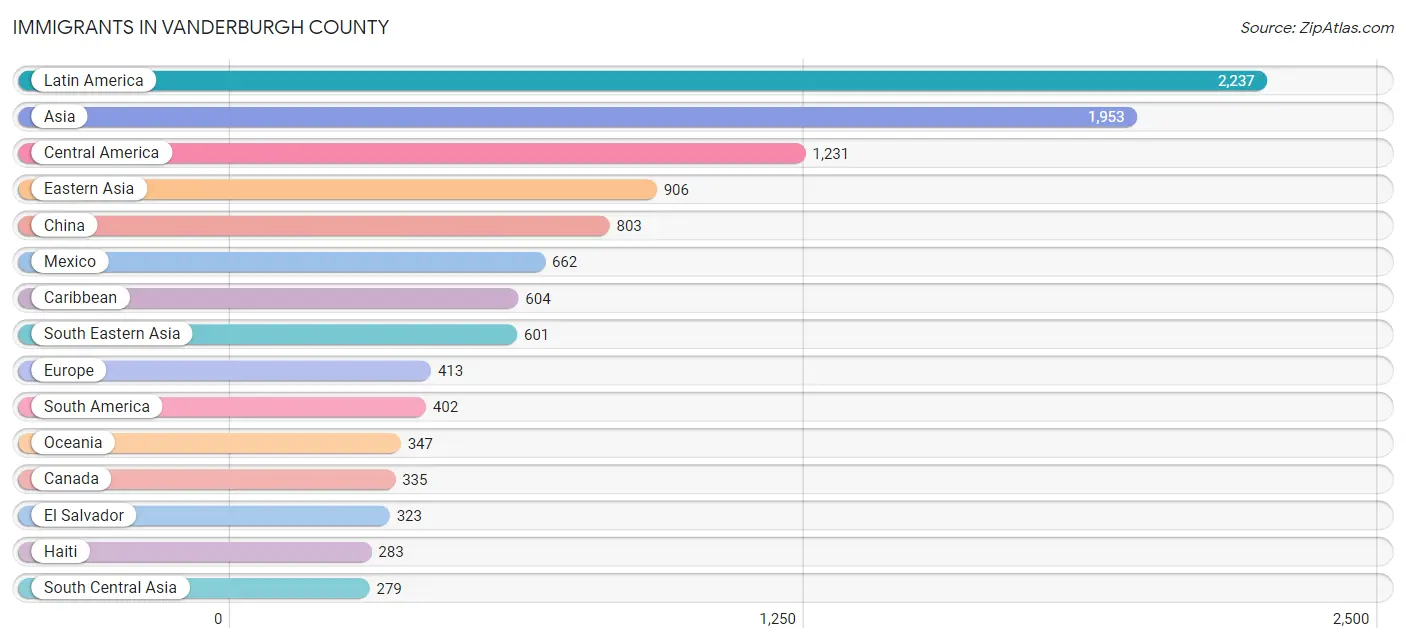
Immigrants in Vanderburgh County
The most numerous immigrant groups reported in Vanderburgh County came from Latin America (2,237 | 1.2%), Asia (1,953 | 1.1%), Central America (1,231 | 0.7%), Eastern Asia (906 | 0.5%), and China (803 | 0.4%), together accounting for 4.0% of all Vanderburgh County residents.
| Immigration Origin | # Population | % Population |
| Afghanistan | 21 | 0.0% |
| Africa | 206 | 0.1% |
| Albania | 7 | 0.0% |
| Asia | 1,953 | 1.1% |
| Australia | 6 | 0.0% |
| Bangladesh | 9 | 0.0% |
| Belarus | 10 | 0.0% |
| Belize | 9 | 0.0% |
| Bolivia | 15 | 0.0% |
| Brazil | 51 | 0.0% |
| Cambodia | 29 | 0.0% |
| Canada | 335 | 0.2% |
| Caribbean | 604 | 0.3% |
| Central America | 1,231 | 0.7% |
| China | 803 | 0.4% |
| Colombia | 16 | 0.0% |
| Congo | 3 | 0.0% |
| Cuba | 58 | 0.0% |
| Denmark | 7 | 0.0% |
| Dominica | 62 | 0.0% |
| Dominican Republic | 14 | 0.0% |
| Eastern Africa | 40 | 0.0% |
| Eastern Asia | 906 | 0.5% |
| Eastern Europe | 215 | 0.1% |
| Ecuador | 16 | 0.0% |
| El Salvador | 323 | 0.2% |
| England | 60 | 0.0% |
| Ethiopia | 2 | 0.0% |
| Europe | 413 | 0.2% |
| France | 2 | 0.0% |
| Germany | 43 | 0.0% |
| Ghana | 7 | 0.0% |
| Guatemala | 139 | 0.1% |
| Guyana | 13 | 0.0% |
| Haiti | 283 | 0.2% |
| Honduras | 83 | 0.1% |
| Hong Kong | 54 | 0.0% |
| India | 225 | 0.1% |
| Iran | 7 | 0.0% |
| Ireland | 26 | 0.0% |
| Israel | 1 | 0.0% |
| Italy | 31 | 0.0% |
| Jamaica | 187 | 0.1% |
| Japan | 53 | 0.0% |
| Kenya | 26 | 0.0% |
| Korea | 50 | 0.0% |
| Latin America | 2,237 | 1.2% |
| Lebanon | 21 | 0.0% |
| Malaysia | 57 | 0.0% |
| Mexico | 662 | 0.4% |
| Middle Africa | 3 | 0.0% |
| Moldova | 17 | 0.0% |
| Morocco | 6 | 0.0% |
| Nigeria | 47 | 0.0% |
| Northern Africa | 6 | 0.0% |
| Northern Europe | 104 | 0.1% |
| Norway | 5 | 0.0% |
| Oceania | 347 | 0.2% |
| Pakistan | 17 | 0.0% |
| Panama | 15 | 0.0% |
| Peru | 176 | 0.1% |
| Philippines | 229 | 0.1% |
| Poland | 13 | 0.0% |
| Romania | 12 | 0.0% |
| Russia | 38 | 0.0% |
| Saudi Arabia | 17 | 0.0% |
| Senegal | 76 | 0.0% |
| Serbia | 10 | 0.0% |
| South America | 402 | 0.2% |
| South Central Asia | 279 | 0.2% |
| South Eastern Asia | 601 | 0.3% |
| Southern Europe | 49 | 0.0% |
| Spain | 18 | 0.0% |
| Syria | 30 | 0.0% |
| Taiwan | 30 | 0.0% |
| Thailand | 54 | 0.0% |
| Turkey | 50 | 0.0% |
| Ukraine | 57 | 0.0% |
| Venezuela | 115 | 0.1% |
| Vietnam | 172 | 0.1% |
| Western Africa | 157 | 0.1% |
| Western Asia | 137 | 0.1% |
| Western Europe | 45 | 0.0% | View All 83 Rows |
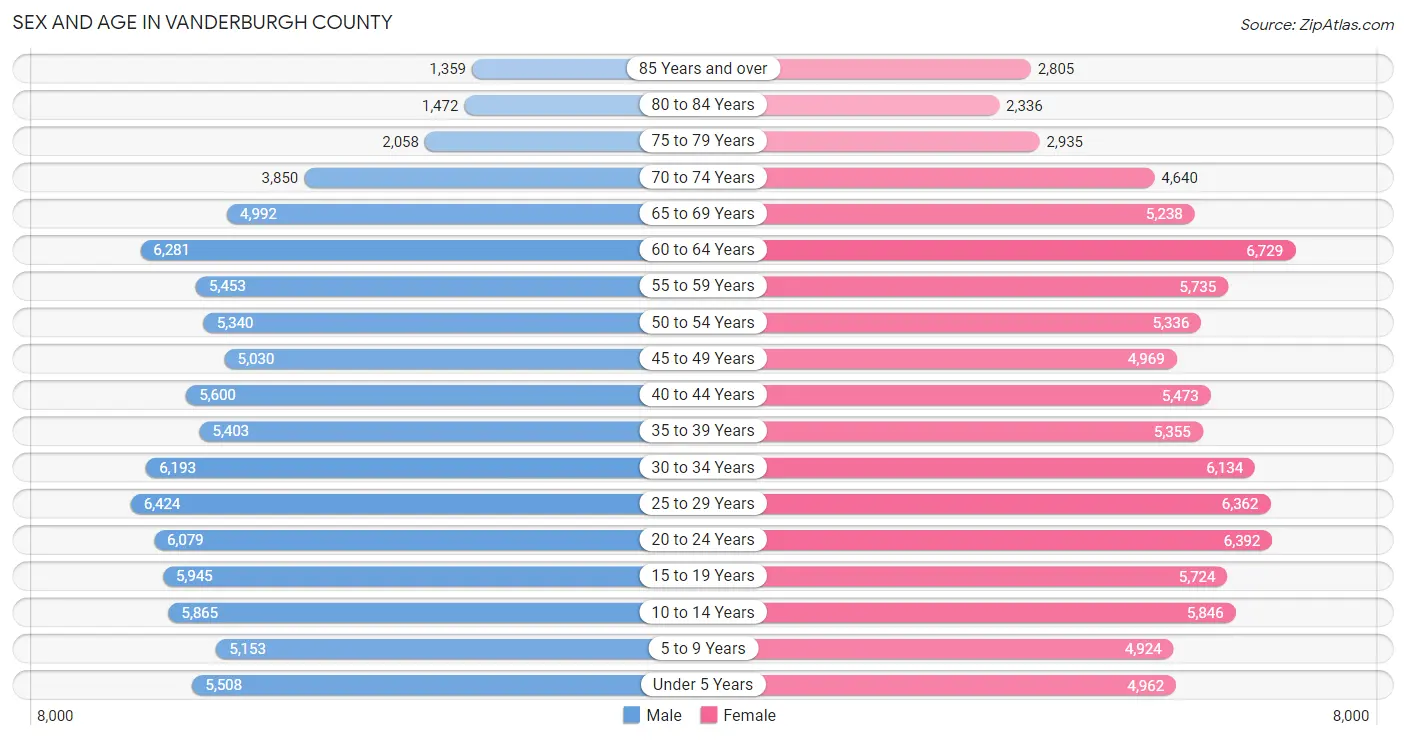
Sex and Age in Vanderburgh County
Sex and Age in Vanderburgh County
The most populous age groups in Vanderburgh County are 25 to 29 Years (6,424 | 7.3%) for men and 60 to 64 Years (6,729 | 7.3%) for women.
| Age Bracket | Male | Female |
| Under 5 Years | 5,508 (6.3%) | 4,962 (5.4%) |
| 5 to 9 Years | 5,153 (5.9%) | 4,924 (5.4%) |
| 10 to 14 Years | 5,865 (6.7%) | 5,846 (6.4%) |
| 15 to 19 Years | 5,945 (6.8%) | 5,724 (6.2%) |
| 20 to 24 Years | 6,079 (6.9%) | 6,392 (7.0%) |
| 25 to 29 Years | 6,424 (7.3%) | 6,362 (6.9%) |
| 30 to 34 Years | 6,193 (7.0%) | 6,134 (6.7%) |
| 35 to 39 Years | 5,403 (6.1%) | 5,355 (5.8%) |
| 40 to 44 Years | 5,600 (6.4%) | 5,473 (6.0%) |
| 45 to 49 Years | 5,030 (5.7%) | 4,969 (5.4%) |
| 50 to 54 Years | 5,340 (6.1%) | 5,336 (5.8%) |
| 55 to 59 Years | 5,453 (6.2%) | 5,735 (6.2%) |
| 60 to 64 Years | 6,281 (7.1%) | 6,729 (7.3%) |
| 65 to 69 Years | 4,992 (5.7%) | 5,238 (5.7%) |
| 70 to 74 Years | 3,850 (4.4%) | 4,640 (5.1%) |
| 75 to 79 Years | 2,058 (2.3%) | 2,935 (3.2%) |
| 80 to 84 Years | 1,472 (1.7%) | 2,336 (2.5%) |
| 85 Years and over | 1,359 (1.5%) | 2,805 (3.0%) |
| Total | 88,005 (100.0%) | 91,895 (100.0%) |
Families and Households in Vanderburgh County
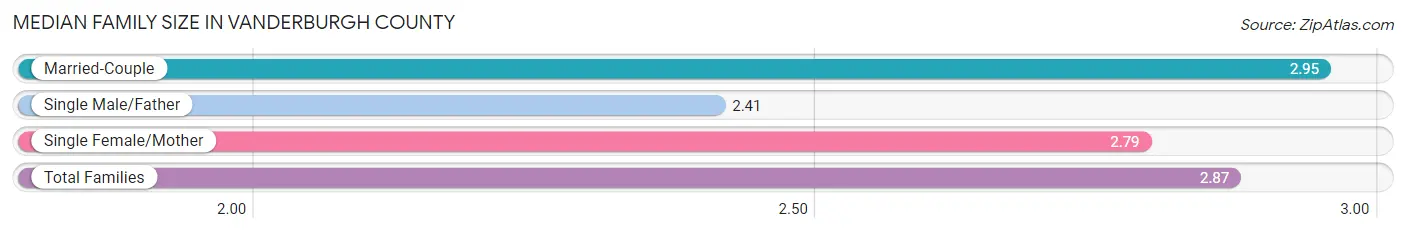
Median Family Size in Vanderburgh County
The median family size in Vanderburgh County is 2.87 persons per family, with married-couple families (31,987 | 69.6%) accounting for the largest median family size of 2.95 persons per family. On the other hand, single male/father families (4,144 | 9.0%) represent the smallest median family size with 2.41 persons per family.
| Family Type | # Families | Family Size |
| Married-Couple | 31,987 (69.6%) | 2.95 |
| Single Male/Father | 4,144 (9.0%) | 2.41 |
| Single Female/Mother | 9,854 (21.4%) | 2.79 |
| Total Families | 45,985 (100.0%) | 2.87 |
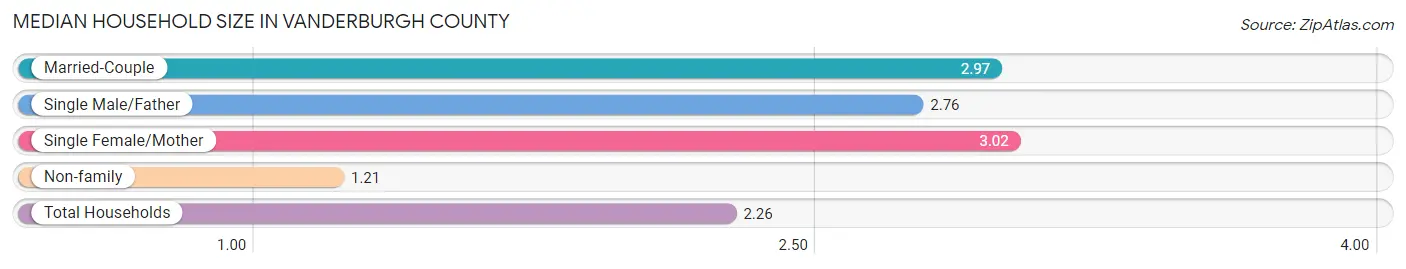
Median Household Size in Vanderburgh County
The median household size in Vanderburgh County is 2.26 persons per household, with single female/mother households (9,854 | 12.8%) accounting for the largest median household size of 3.02 persons per household. non-family households (30,872 | 40.2%) represent the smallest median household size with 1.21 persons per household.
| Household Type | # Households | Household Size |
| Married-Couple | 31,987 (41.6%) | 2.97 |
| Single Male/Father | 4,144 (5.4%) | 2.76 |
| Single Female/Mother | 9,854 (12.8%) | 3.02 |
| Non-family | 30,872 (40.2%) | 1.21 |
| Total Households | 76,857 (100.0%) | 2.26 |
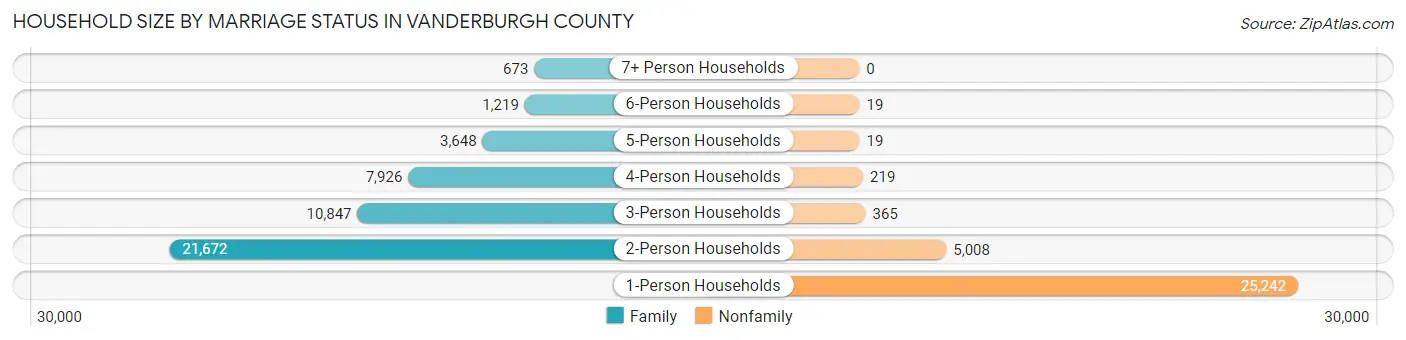
Household Size by Marriage Status in Vanderburgh County
Out of a total of 76,857 households in Vanderburgh County, 45,985 (59.8%) are family households, while 30,872 (40.2%) are nonfamily households. The most numerous type of family households are 2-person households, comprising 21,672, and the most common type of nonfamily households are 1-person households, comprising 25,242.
| Household Size | Family Households | Nonfamily Households |
| 1-Person Households | - | 25,242 (32.8%) |
| 2-Person Households | 21,672 (28.2%) | 5,008 (6.5%) |
| 3-Person Households | 10,847 (14.1%) | 365 (0.5%) |
| 4-Person Households | 7,926 (10.3%) | 219 (0.3%) |
| 5-Person Households | 3,648 (4.8%) | 19 (0.0%) |
| 6-Person Households | 1,219 (1.6%) | 19 (0.0%) |
| 7+ Person Households | 673 (0.9%) | 0 (0.0%) |
| Total | 45,985 (59.8%) | 30,872 (40.2%) |
Female Fertility in Vanderburgh County
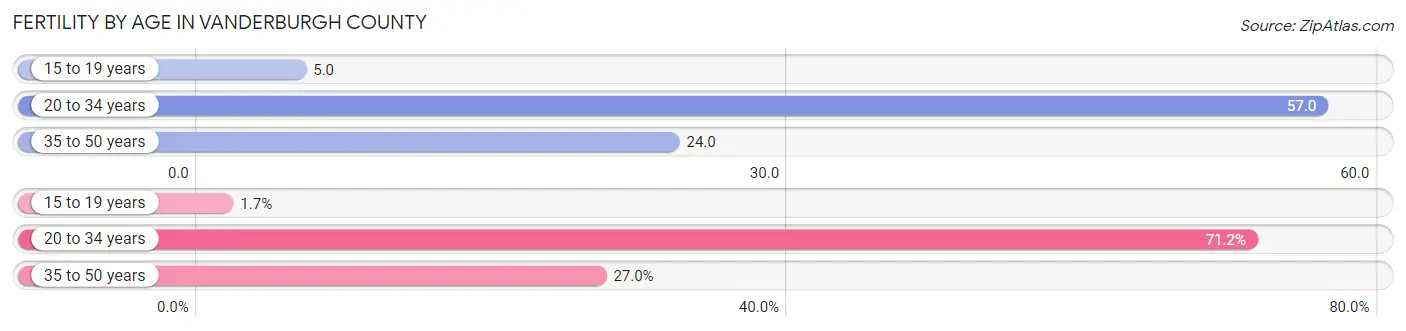
Fertility by Age in Vanderburgh County
Average fertility rate in Vanderburgh County is 36.0 births per 1,000 women. Women in the age bracket of 20 to 34 years have the highest fertility rate with 57.0 births per 1,000 women. Women in the age bracket of 20 to 34 years acount for 71.2% of all women with births.
| Age Bracket | Women with Births | Births / 1,000 Women |
| 15 to 19 years | 26 (1.7%) | 5.0 |
| 20 to 34 years | 1,075 (71.2%) | 57.0 |
| 35 to 50 years | 408 (27.0%) | 24.0 |
| Total | 1,509 (100.0%) | 36.0 |
Fertility by Age by Marriage Status in Vanderburgh County
69.9% of women with births (1,509) in Vanderburgh County are married. The highest percentage of unmarried women with births falls into 15 to 19 years age bracket with 100.0% of them unmarried at the time of birth, while the lowest percentage of unmarried women with births belong to 35 to 50 years age bracket with 13.5% of them unmarried.
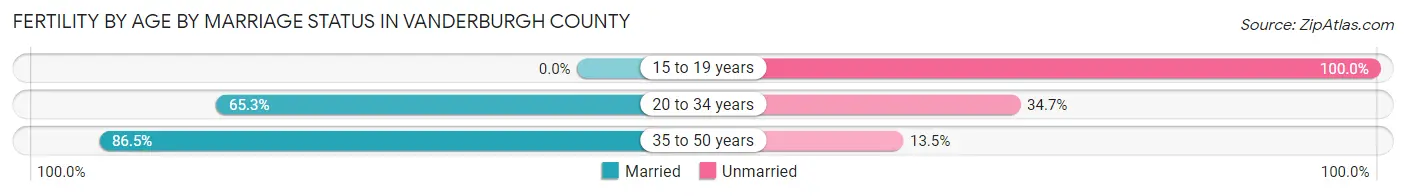
| Age Bracket | Married | Unmarried |
| 15 to 19 years | 0 (0.0%) | 26 (100.0%) |
| 20 to 34 years | 702 (65.3%) | 373 (34.7%) |
| 35 to 50 years | 353 (86.5%) | 55 (13.5%) |
| Total | 1,055 (69.9%) | 454 (30.1%) |
Fertility by Education in Vanderburgh County
Average fertility rate in Vanderburgh County is 36.0 births per 1,000 women. Women with the education attainment of bachelor's degree have the highest fertility rate of 53.0 births per 1,000 women, while women with the education attainment of less than high school have the lowest fertility at 7.0 births per 1,000 women. Women with the education attainment of college or associate's degree represent 34.1% of all women with births.
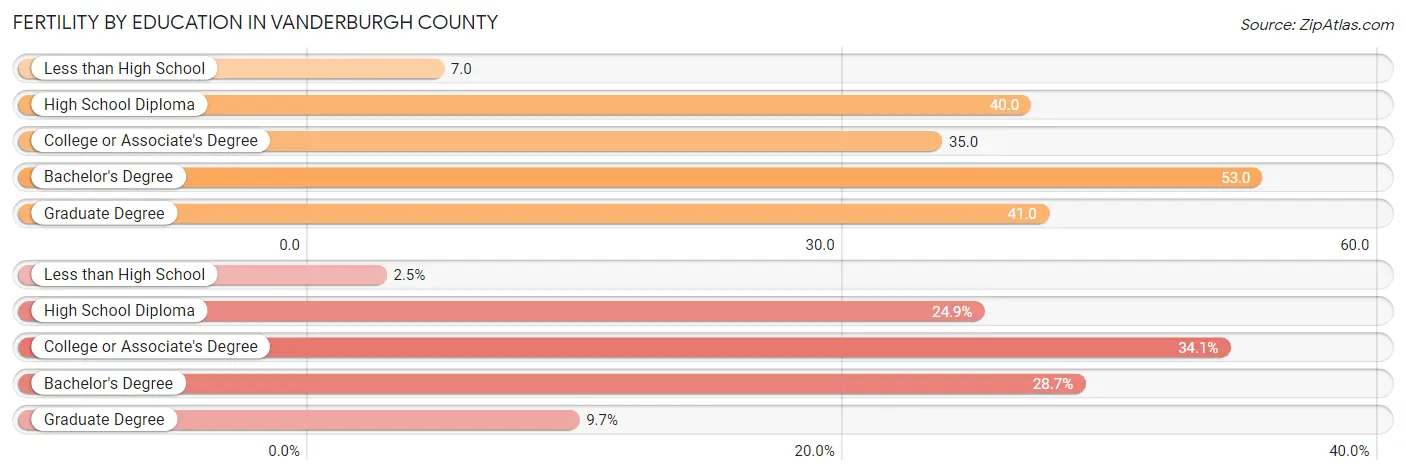
| Educational Attainment | Women with Births | Births / 1,000 Women |
| Less than High School | 38 (2.5%) | 7.0 |
| High School Diploma | 376 (24.9%) | 40.0 |
| College or Associate's Degree | 515 (34.1%) | 35.0 |
| Bachelor's Degree | 433 (28.7%) | 53.0 |
| Graduate Degree | 147 (9.7%) | 41.0 |
| Total | 1,509 (100.0%) | 36.0 |
Fertility by Education by Marriage Status in Vanderburgh County
30.1% of women with births in Vanderburgh County are unmarried. Women with the educational attainment of bachelor's degree are most likely to be married with 98.6% of them married at childbirth, while women with the educational attainment of high school diploma are least likely to be married with 66.2% of them unmarried at childbirth.
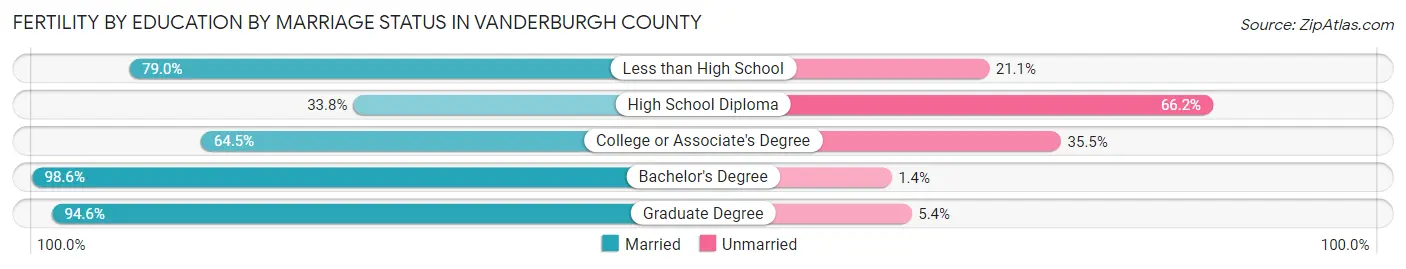
| Educational Attainment | Married | Unmarried |
| Less than High School | 30 (78.9%) | 8 (21.0%) |
| High School Diploma | 127 (33.8%) | 249 (66.2%) |
| College or Associate's Degree | 332 (64.5%) | 183 (35.5%) |
| Bachelor's Degree | 427 (98.6%) | 6 (1.4%) |
| Graduate Degree | 139 (94.6%) | 8 (5.4%) |
| Total | 1,055 (69.9%) | 454 (30.1%) |
Income in Vanderburgh County
Income Overview in Vanderburgh County
Per Capita Income in Vanderburgh County is $33,614, while median incomes of families and households are $74,561 and $58,839 respectively.
| Characteristic | Number | Measure |
| Per Capita Income | 179,900 | $33,614 |
| Median Family Income | 45,985 | $74,561 |
| Mean Family Income | 45,985 | $95,987 |
| Median Household Income | 76,857 | $58,839 |
| Mean Household Income | 76,857 | $78,153 |
| Income Deficit | 45,985 | $11,215 |
| Wage / Income Gap (%) | 179,900 | 32.58% |
| Wage / Income Gap ($) | 179,900 | 67.42¢ per $1 |
| Gini / Inequality Index | 179,900 | 0.45 |
Earnings by Sex in Vanderburgh County
Average Earnings in Vanderburgh County are $36,624, $44,868 for men and $30,250 for women, a difference of 32.6%.
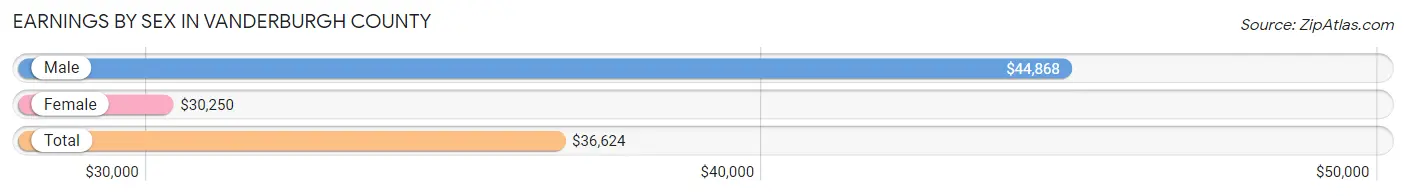
| Sex | Number | Average Earnings |
| Male | 50,104 (51.1%) | $44,868 |
| Female | 47,893 (48.9%) | $30,250 |
| Total | 97,997 (100.0%) | $36,624 |
Earnings by Sex by Income Bracket in Vanderburgh County
The most common earnings brackets in Vanderburgh County are $100,000+ for men (5,684 | 11.3%) and $25,000 to $29,999 for women (3,608 | 7.5%).
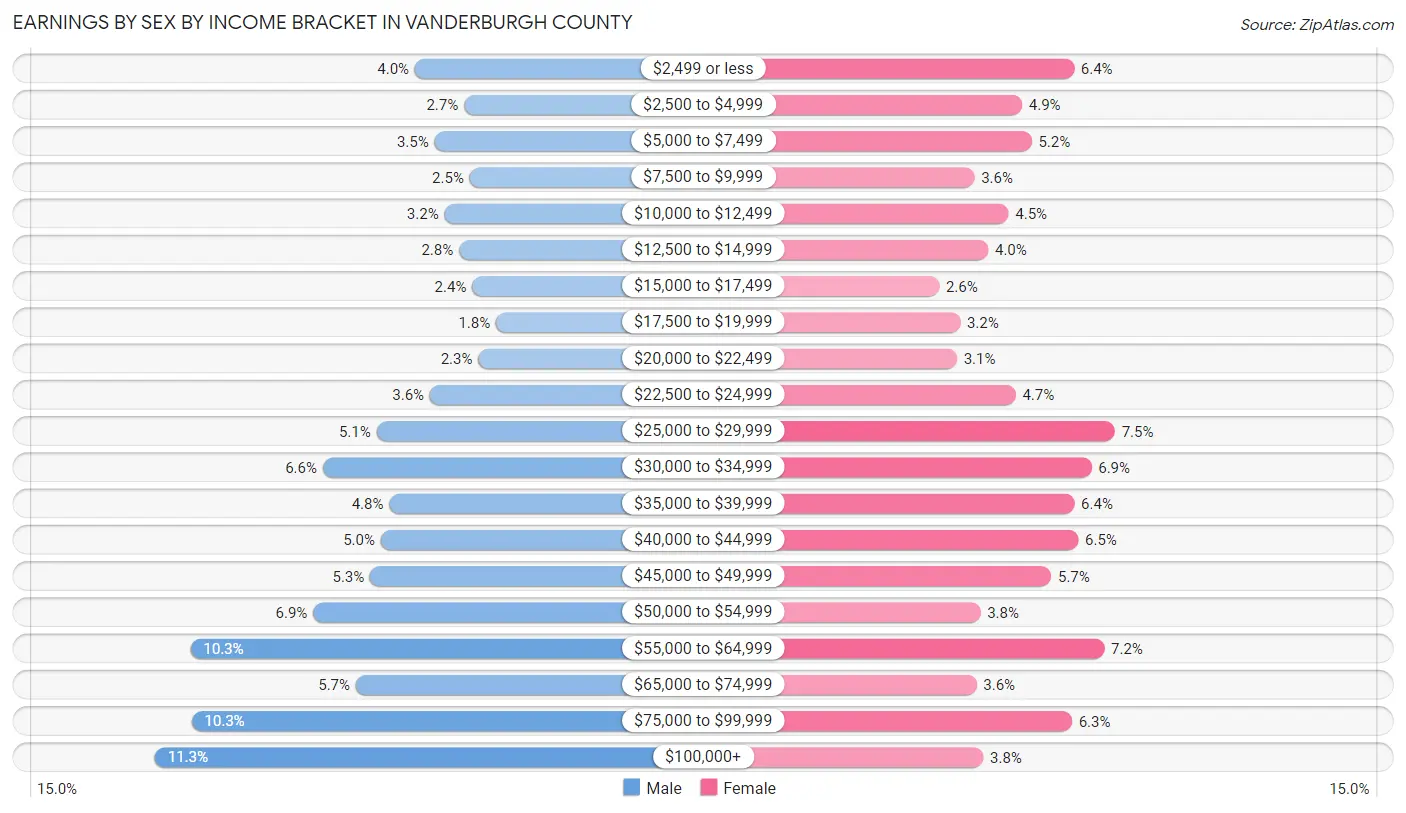
| Income | Male | Female |
| $2,499 or less | 2,018 (4.0%) | 3,054 (6.4%) |
| $2,500 to $4,999 | 1,327 (2.6%) | 2,356 (4.9%) |
| $5,000 to $7,499 | 1,746 (3.5%) | 2,488 (5.2%) |
| $7,500 to $9,999 | 1,248 (2.5%) | 1,714 (3.6%) |
| $10,000 to $12,499 | 1,603 (3.2%) | 2,176 (4.5%) |
| $12,500 to $14,999 | 1,396 (2.8%) | 1,903 (4.0%) |
| $15,000 to $17,499 | 1,212 (2.4%) | 1,242 (2.6%) |
| $17,500 to $19,999 | 877 (1.8%) | 1,525 (3.2%) |
| $20,000 to $22,499 | 1,126 (2.2%) | 1,481 (3.1%) |
| $22,500 to $24,999 | 1,808 (3.6%) | 2,272 (4.7%) |
| $25,000 to $29,999 | 2,558 (5.1%) | 3,608 (7.5%) |
| $30,000 to $34,999 | 3,319 (6.6%) | 3,292 (6.9%) |
| $35,000 to $39,999 | 2,381 (4.8%) | 3,059 (6.4%) |
| $40,000 to $44,999 | 2,500 (5.0%) | 3,111 (6.5%) |
| $45,000 to $49,999 | 2,649 (5.3%) | 2,748 (5.7%) |
| $50,000 to $54,999 | 3,450 (6.9%) | 1,797 (3.7%) |
| $55,000 to $64,999 | 5,183 (10.3%) | 3,461 (7.2%) |
| $65,000 to $74,999 | 2,852 (5.7%) | 1,742 (3.6%) |
| $75,000 to $99,999 | 5,167 (10.3%) | 3,029 (6.3%) |
| $100,000+ | 5,684 (11.3%) | 1,835 (3.8%) |
| Total | 50,104 (100.0%) | 47,893 (100.0%) |
Earnings by Sex by Educational Attainment in Vanderburgh County
Average earnings in Vanderburgh County are $50,907 for men and $34,860 for women, a difference of 31.5%. Men with an educational attainment of graduate degree enjoy the highest average annual earnings of $70,250, while those with less than high school education earn the least with $26,902. Women with an educational attainment of graduate degree earn the most with the average annual earnings of $61,340, while those with less than high school education have the smallest earnings of $23,571.
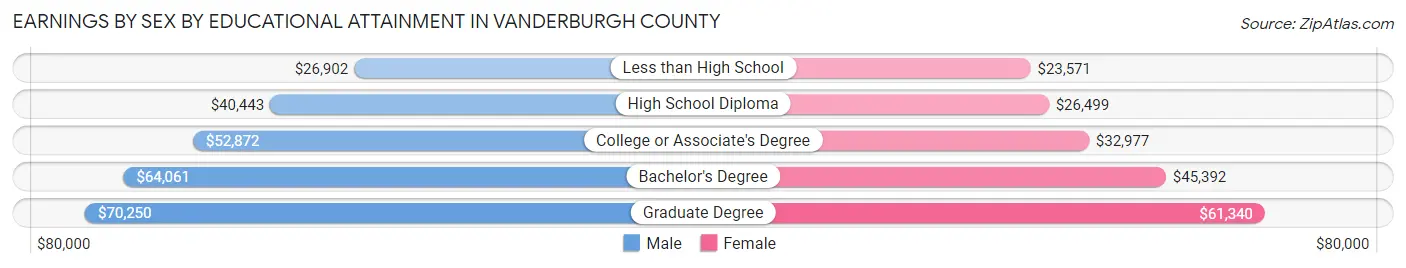
| Educational Attainment | Male Income | Female Income |
| Less than High School | $26,902 | $23,571 |
| High School Diploma | $40,443 | $26,499 |
| College or Associate's Degree | $52,872 | $32,977 |
| Bachelor's Degree | $64,061 | $45,392 |
| Graduate Degree | $70,250 | $61,340 |
| Total | $50,907 | $34,860 |
Family Income in Vanderburgh County
Family Income Brackets in Vanderburgh County
According to the Vanderburgh County family income data, there are 9,289 families falling into the $50,000 to $74,999 income range, which is the most common income bracket and makes up 20.2% of all families. Conversely, the $10,000 to $14,999 income bracket is the least frequent group with only 1,012 families (2.2%) belonging to this category.
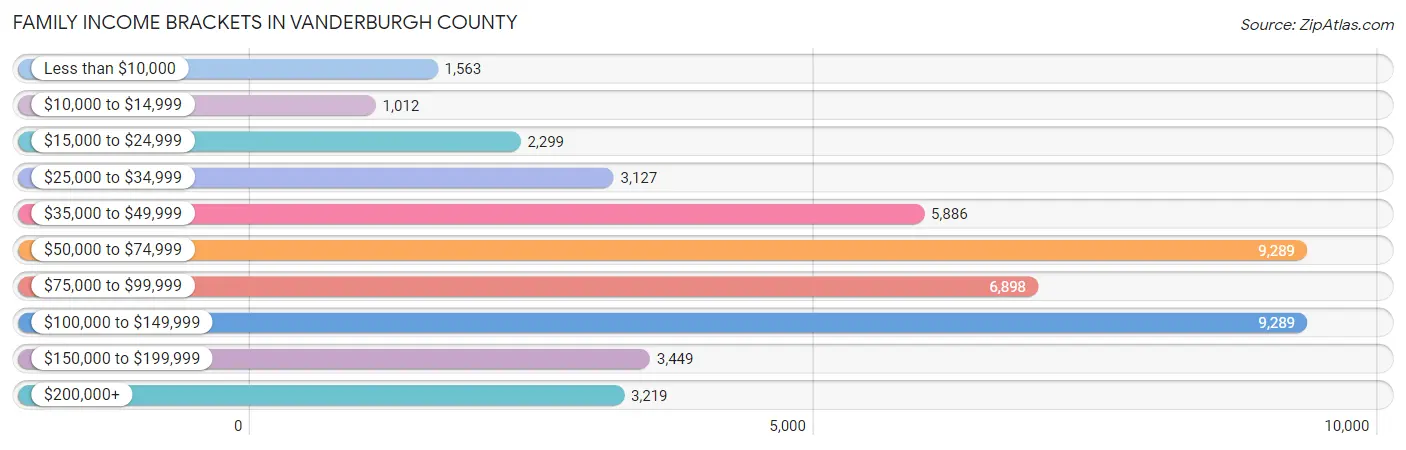
| Income Bracket | # Families | % Families |
| Less than $10,000 | 1,563 | 3.4% |
| $10,000 to $14,999 | 1,012 | 2.2% |
| $15,000 to $24,999 | 2,299 | 5.0% |
| $25,000 to $34,999 | 3,127 | 6.8% |
| $35,000 to $49,999 | 5,886 | 12.8% |
| $50,000 to $74,999 | 9,289 | 20.2% |
| $75,000 to $99,999 | 6,898 | 15.0% |
| $100,000 to $149,999 | 9,289 | 20.2% |
| $150,000 to $199,999 | 3,449 | 7.5% |
| $200,000+ | 3,219 | 7.0% |
Family Income by Famaliy Size in Vanderburgh County
7+ person families (612 | 1.3%) account for the highest median family income in Vanderburgh County with $102,816 per family, while 2-person families (23,806 | 51.8%) have the highest median income of $33,566 per family member.
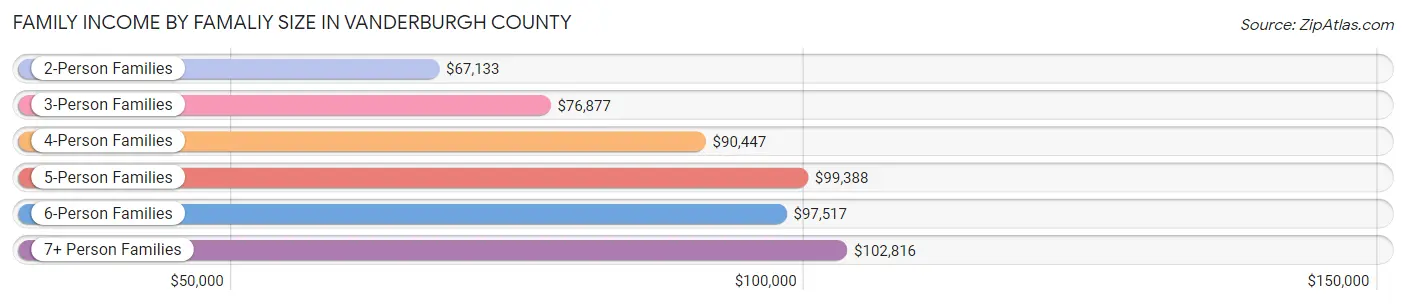
| Income Bracket | # Families | Median Income |
| 2-Person Families | 23,806 (51.8%) | $67,133 |
| 3-Person Families | 10,166 (22.1%) | $76,877 |
| 4-Person Families | 7,222 (15.7%) | $90,447 |
| 5-Person Families | 3,148 (6.9%) | $99,388 |
| 6-Person Families | 1,031 (2.2%) | $97,517 |
| 7+ Person Families | 612 (1.3%) | $102,816 |
| Total | 45,985 (100.0%) | $74,561 |
Family Income by Number of Earners in Vanderburgh County
The median family income in Vanderburgh County is $74,561, with families comprising 3+ earners (4,783) having the highest median family income of $122,006, while families with no earners (6,801) have the lowest median family income of $46,566, accounting for 10.4% and 14.8% of families, respectively.
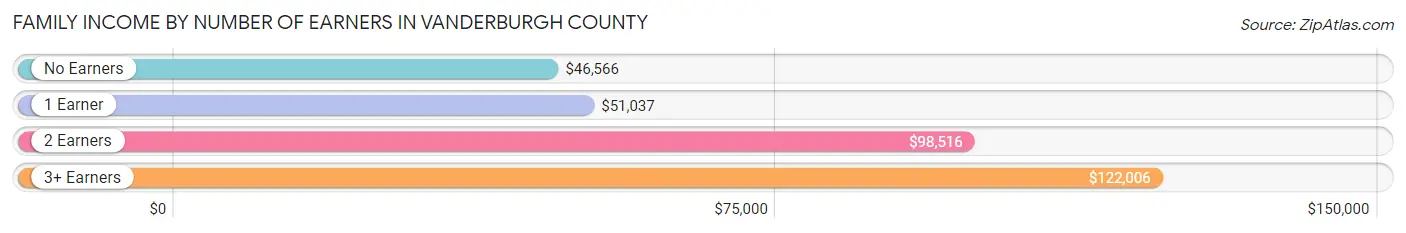
| Number of Earners | # Families | Median Income |
| No Earners | 6,801 (14.8%) | $46,566 |
| 1 Earner | 14,959 (32.5%) | $51,037 |
| 2 Earners | 19,442 (42.3%) | $98,516 |
| 3+ Earners | 4,783 (10.4%) | $122,006 |
| Total | 45,985 (100.0%) | $74,561 |
Household Income in Vanderburgh County
Household Income Brackets in Vanderburgh County
With 15,064 households falling in the category, the $50,000 to $74,999 income range is the most frequent in Vanderburgh County, accounting for 19.6% of all households. In contrast, only 3,612 households (4.7%) fall into the $10,000 to $14,999 income bracket, making it the least populous group.
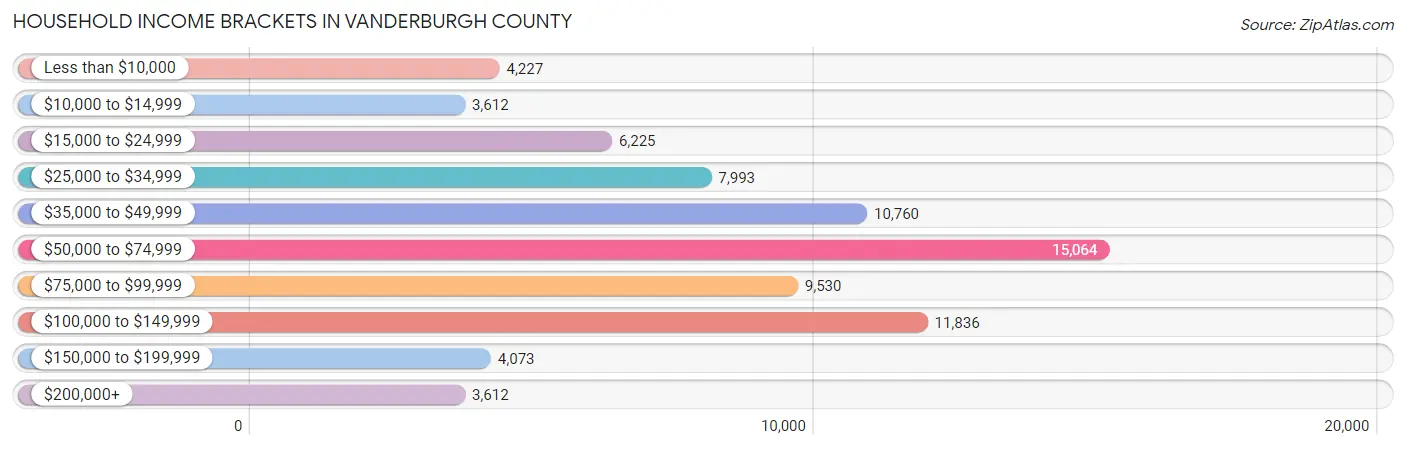
| Income Bracket | # Households | % Households |
| Less than $10,000 | 4,227 | 5.5% |
| $10,000 to $14,999 | 3,612 | 4.7% |
| $15,000 to $24,999 | 6,225 | 8.1% |
| $25,000 to $34,999 | 7,993 | 10.4% |
| $35,000 to $49,999 | 10,760 | 14.0% |
| $50,000 to $74,999 | 15,064 | 19.6% |
| $75,000 to $99,999 | 9,530 | 12.4% |
| $100,000 to $149,999 | 11,836 | 15.4% |
| $150,000 to $199,999 | 4,073 | 5.3% |
| $200,000+ | 3,612 | 4.7% |
Household Income by Householder Age in Vanderburgh County
The median household income in Vanderburgh County is $58,839, with the highest median household income of $68,490 found in the 25 to 44 years age bracket for the primary householder. A total of 25,419 households (33.1%) fall into this category. Meanwhile, the 15 to 24 years age bracket for the primary householder has the lowest median household income of $37,319, with 4,694 households (6.1%) in this group.
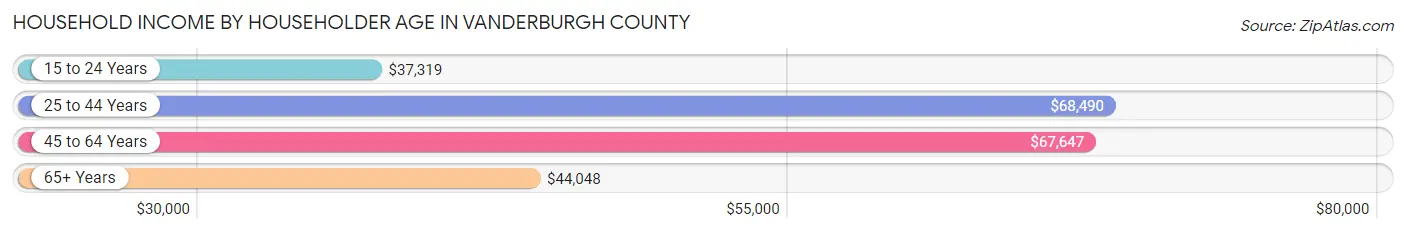
| Income Bracket | # Households | Median Income |
| 15 to 24 Years | 4,694 (6.1%) | $37,319 |
| 25 to 44 Years | 25,419 (33.1%) | $68,490 |
| 45 to 64 Years | 26,478 (34.4%) | $67,647 |
| 65+ Years | 20,266 (26.4%) | $44,048 |
| Total | 76,857 (100.0%) | $58,839 |
Poverty in Vanderburgh County
Income Below Poverty by Sex and Age in Vanderburgh County
With 12.2% poverty level for males and 16.3% for females among the residents of Vanderburgh County, 5 year old males and 5 year old females are the most vulnerable to poverty, with 160 males (21.4%) and 279 females (34.4%) in their respective age groups living below the poverty level.
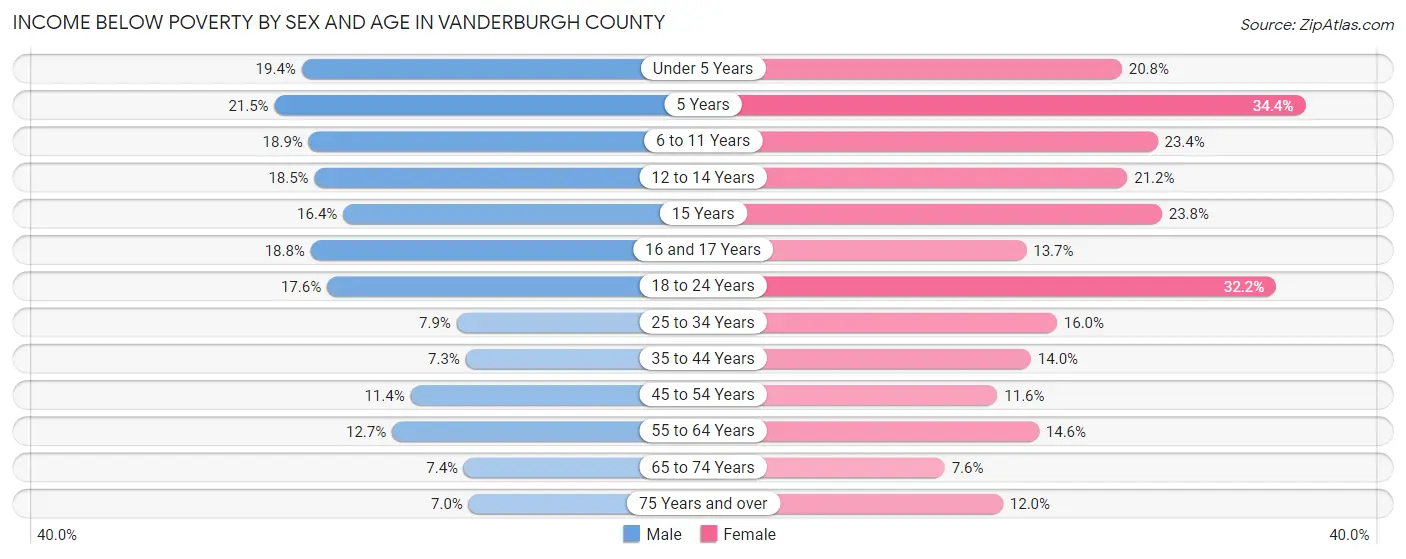
| Age Bracket | Male | Female |
| Under 5 Years | 1,049 (19.4%) | 1,006 (20.8%) |
| 5 Years | 160 (21.4%) | 279 (34.4%) |
| 6 to 11 Years | 1,222 (18.9%) | 1,499 (23.4%) |
| 12 to 14 Years | 672 (18.5%) | 708 (21.2%) |
| 15 Years | 178 (16.4%) | 249 (23.8%) |
| 16 and 17 Years | 425 (18.8%) | 286 (13.7%) |
| 18 to 24 Years | 1,314 (17.5%) | 2,249 (32.2%) |
| 25 to 34 Years | 983 (7.9%) | 1,976 (16.0%) |
| 35 to 44 Years | 783 (7.2%) | 1,514 (14.0%) |
| 45 to 54 Years | 1,166 (11.4%) | 1,187 (11.6%) |
| 55 to 64 Years | 1,478 (12.7%) | 1,812 (14.6%) |
| 65 to 74 Years | 642 (7.4%) | 739 (7.6%) |
| 75 Years and over | 316 (7.0%) | 871 (12.0%) |
| Total | 10,388 (12.2%) | 14,375 (16.3%) |
Income Above Poverty by Sex and Age in Vanderburgh County
According to the poverty statistics in Vanderburgh County, males aged 75 years and over and females aged 65 to 74 years are the age groups that are most secure financially, with 93.0% of males and 92.4% of females in these age groups living above the poverty line.
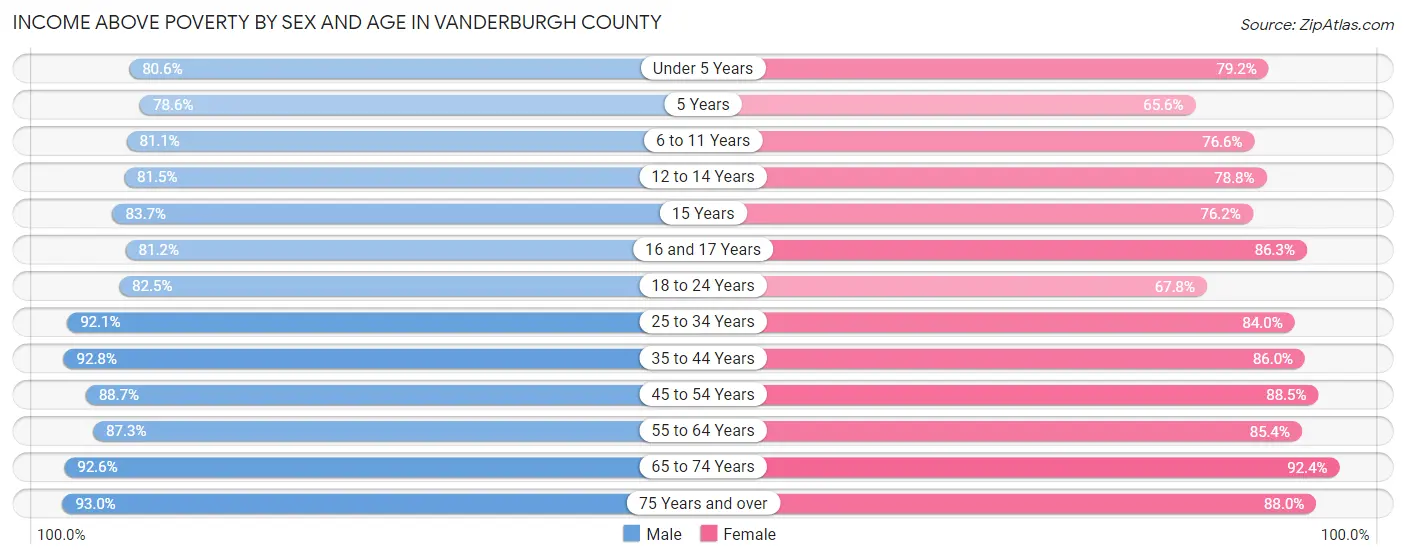
| Age Bracket | Male | Female |
| Under 5 Years | 4,349 (80.6%) | 3,832 (79.2%) |
| 5 Years | 586 (78.5%) | 532 (65.6%) |
| 6 to 11 Years | 5,240 (81.1%) | 4,896 (76.6%) |
| 12 to 14 Years | 2,965 (81.5%) | 2,631 (78.8%) |
| 15 Years | 911 (83.7%) | 799 (76.2%) |
| 16 and 17 Years | 1,841 (81.2%) | 1,801 (86.3%) |
| 18 to 24 Years | 6,173 (82.5%) | 4,727 (67.8%) |
| 25 to 34 Years | 11,432 (92.1%) | 10,398 (84.0%) |
| 35 to 44 Years | 10,020 (92.7%) | 9,272 (86.0%) |
| 45 to 54 Years | 9,109 (88.6%) | 9,094 (88.4%) |
| 55 to 64 Years | 10,143 (87.3%) | 10,571 (85.4%) |
| 65 to 74 Years | 8,058 (92.6%) | 8,933 (92.4%) |
| 75 Years and over | 4,179 (93.0%) | 6,411 (88.0%) |
| Total | 75,006 (87.8%) | 73,897 (83.7%) |
Income Below Poverty Among Married-Couple Families in Vanderburgh County
The poverty statistics for married-couple families in Vanderburgh County show that 3.2% or 1,020 of the total 31,987 families live below the poverty line. Families with 5 or more children have the highest poverty rate of 21.0%, comprising of 35 families. On the other hand, families with no children have the lowest poverty rate of 2.5%, which includes 505 families.
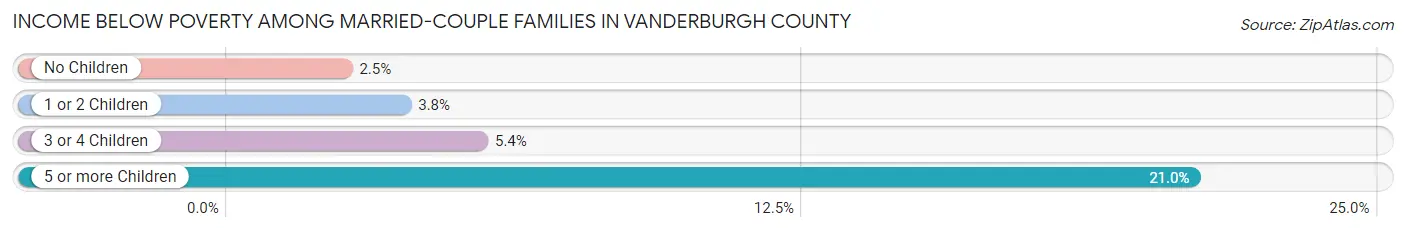
| Children | Above Poverty | Below Poverty |
| No Children | 19,776 (97.5%) | 505 (2.5%) |
| 1 or 2 Children | 8,519 (96.2%) | 334 (3.8%) |
| 3 or 4 Children | 2,540 (94.6%) | 146 (5.4%) |
| 5 or more Children | 132 (79.0%) | 35 (21.0%) |
| Total | 30,967 (96.8%) | 1,020 (3.2%) |
Income Below Poverty Among Single-Parent Households in Vanderburgh County
According to the poverty data in Vanderburgh County, 15.7% or 652 single-father households and 26.9% or 2,647 single-mother households are living below the poverty line. Among single-father households, those with 5 or more children have the highest poverty rate, with 32 households (78.0%) experiencing poverty. Likewise, among single-mother households, those with 5 or more children have the highest poverty rate, with 57 households (93.4%) falling below the poverty line.
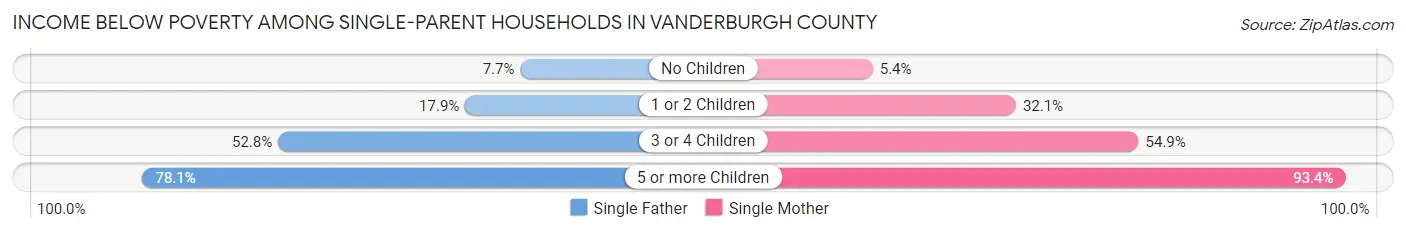
| Children | Single Father | Single Mother |
| No Children | 138 (7.7%) | 169 (5.4%) |
| 1 or 2 Children | 378 (17.9%) | 1,752 (32.1%) |
| 3 or 4 Children | 104 (52.8%) | 669 (54.9%) |
| 5 or more Children | 32 (78.0%) | 57 (93.4%) |
| Total | 652 (15.7%) | 2,647 (26.9%) |
Income Below Poverty Among Married-Couple vs Single-Parent Households in Vanderburgh County
The poverty data for Vanderburgh County shows that 1,020 of the married-couple family households (3.2%) and 3,299 of the single-parent households (23.6%) are living below the poverty level. Within the married-couple family households, those with 5 or more children have the highest poverty rate, with 35 households (21.0%) falling below the poverty line. Among the single-parent households, those with 5 or more children have the highest poverty rate, with 89 household (87.3%) living below poverty.
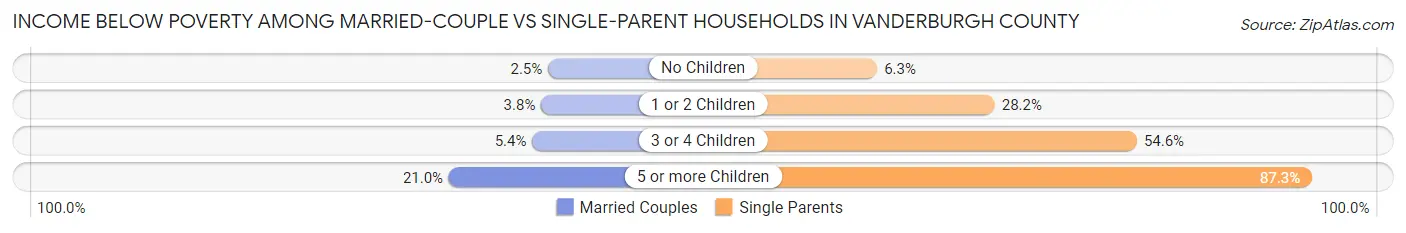
| Children | Married-Couple Families | Single-Parent Households |
| No Children | 505 (2.5%) | 307 (6.2%) |
| 1 or 2 Children | 334 (3.8%) | 2,130 (28.1%) |
| 3 or 4 Children | 146 (5.4%) | 773 (54.6%) |
| 5 or more Children | 35 (21.0%) | 89 (87.3%) |
| Total | 1,020 (3.2%) | 3,299 (23.6%) |
Employment Characteristics in Vanderburgh County
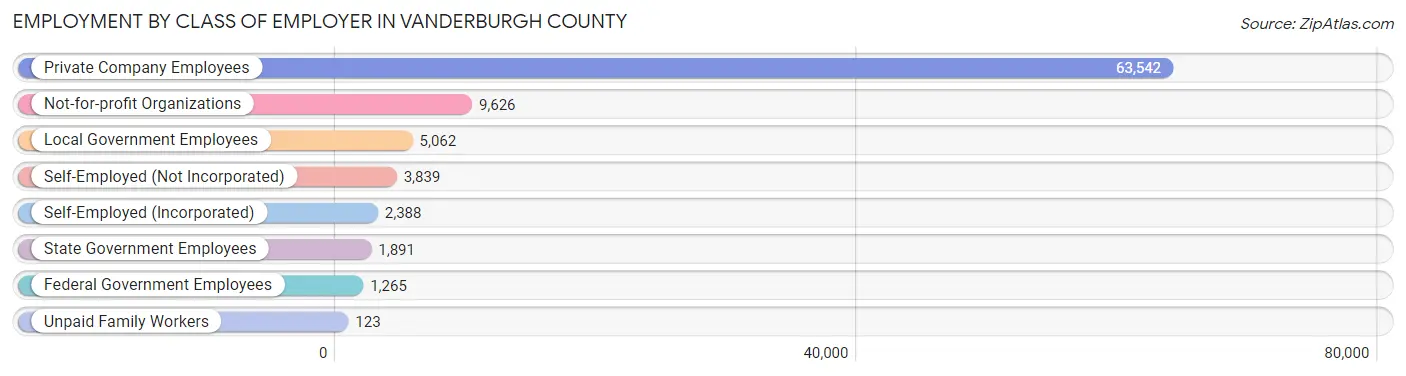
Employment by Class of Employer in Vanderburgh County
Among the 87,736 employed individuals in Vanderburgh County, private company employees (63,542 | 72.4%), not-for-profit organizations (9,626 | 11.0%), and local government employees (5,062 | 5.8%) make up the most common classes of employment.
| Employer Class | # Employees | % Employees |
| Private Company Employees | 63,542 | 72.4% |
| Self-Employed (Incorporated) | 2,388 | 2.7% |
| Self-Employed (Not Incorporated) | 3,839 | 4.4% |
| Not-for-profit Organizations | 9,626 | 11.0% |
| Local Government Employees | 5,062 | 5.8% |
| State Government Employees | 1,891 | 2.2% |
| Federal Government Employees | 1,265 | 1.4% |
| Unpaid Family Workers | 123 | 0.1% |
| Total | 87,736 | 100.0% |
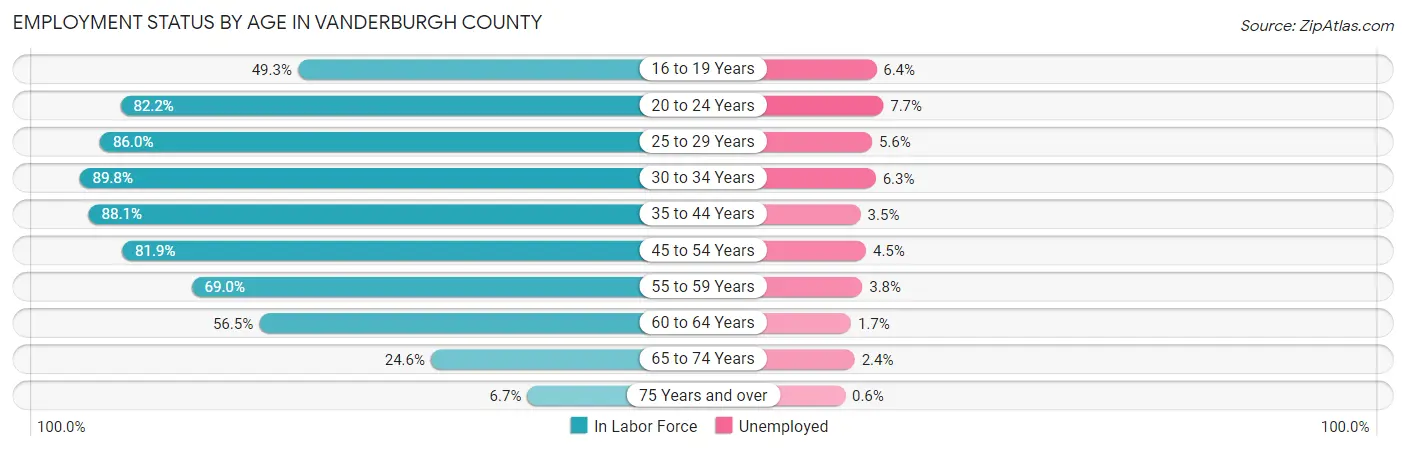
Employment Status by Age in Vanderburgh County
According to the labor force statistics for Vanderburgh County, out of the total population over 16 years of age (145,503), 64.4% or 93,704 individuals are in the labor force, with 4.7% or 4,404 of them unemployed. The age group with the highest labor force participation rate is 30 to 34 years, with 89.8% or 11,070 individuals in the labor force. Within the labor force, the 20 to 24 years age range has the highest percentage of unemployed individuals, with 7.7% or 789 of them being unemployed.
| Age Bracket | In Labor Force | Unemployed |
| 16 to 19 Years | 4,698 (49.3%) | 301 (6.4%) |
| 20 to 24 Years | 10,251 (82.2%) | 789 (7.7%) |
| 25 to 29 Years | 10,996 (86.0%) | 616 (5.6%) |
| 30 to 34 Years | 11,070 (89.8%) | 697 (6.3%) |
| 35 to 44 Years | 19,233 (88.1%) | 673 (3.5%) |
| 45 to 54 Years | 16,933 (81.9%) | 762 (4.5%) |
| 55 to 59 Years | 7,720 (69.0%) | 293 (3.8%) |
| 60 to 64 Years | 7,351 (56.5%) | 125 (1.7%) |
| 65 to 74 Years | 4,605 (24.6%) | 111 (2.4%) |
| 75 Years and over | 869 (6.7%) | 5 (0.6%) |
| Total | 93,704 (64.4%) | 4,404 (4.7%) |
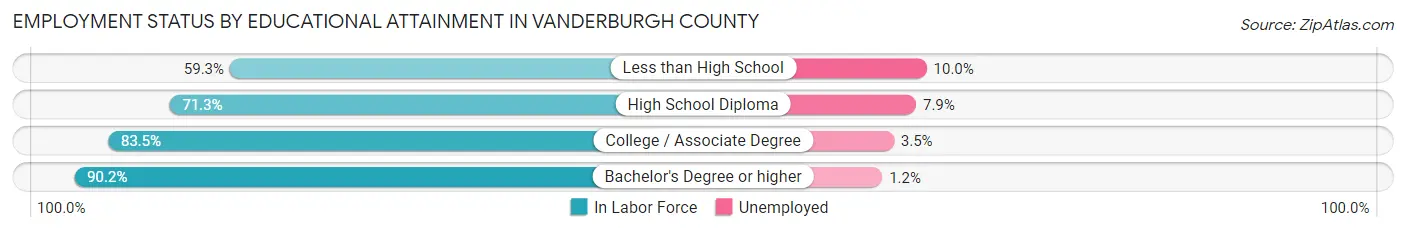
Employment Status by Educational Attainment in Vanderburgh County
According to labor force statistics for Vanderburgh County, 79.8% of individuals (73,270) out of the total population between 25 and 64 years of age (91,817) are in the labor force, with 4.3% or 3,151 of them being unemployed. The group with the highest labor force participation rate are those with the educational attainment of bachelor's degree or higher, with 90.2% or 23,799 individuals in the labor force. Within the labor force, individuals with less than high school education have the highest percentage of unemployment, with 10.0% or 433 of them being unemployed.
| Educational Attainment | In Labor Force | Unemployed |
| Less than High School | 4,334 (59.3%) | 731 (10.0%) |
| High School Diploma | 19,804 (71.3%) | 2,194 (7.9%) |
| College / Associate Degree | 25,341 (83.5%) | 1,062 (3.5%) |
| Bachelor's Degree or higher | 23,799 (90.2%) | 317 (1.2%) |
| Total | 73,270 (79.8%) | 3,948 (4.3%) |
Employment Occupations by Sex in Vanderburgh County
Management, Business, Science and Arts Occupations
The most common Management, Business, Science and Arts occupations in Vanderburgh County are Management (8,200 | 9.2%), Community & Social Service (7,541 | 8.4%), Health Diagnosing & Treating (6,369 | 7.1%), Education Instruction & Library (4,426 | 5.0%), and Computers, Engineering & Science (4,333 | 4.9%).
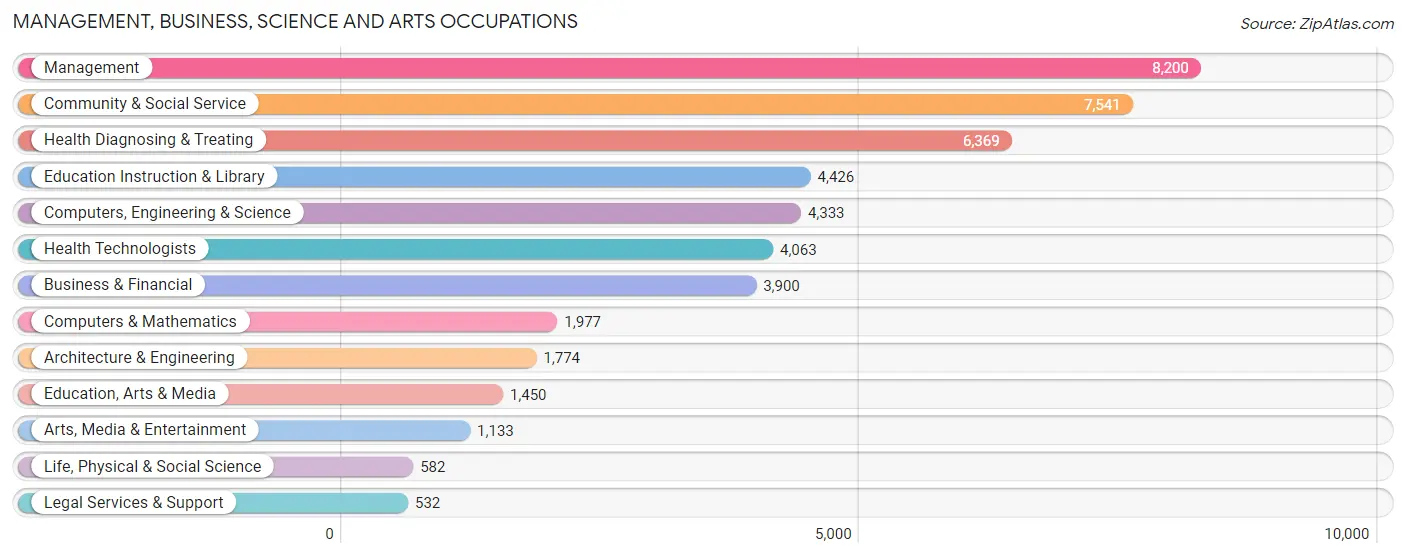
Management, Business, Science and Arts Occupations by Sex
Within the Management, Business, Science and Arts occupations in Vanderburgh County, the most male-oriented occupations are Architecture & Engineering (84.1%), Computers, Engineering & Science (75.0%), and Computers & Mathematics (71.2%), while the most female-oriented occupations are Health Diagnosing & Treating (81.6%), Health Technologists (79.8%), and Education, Arts & Media (69.9%).
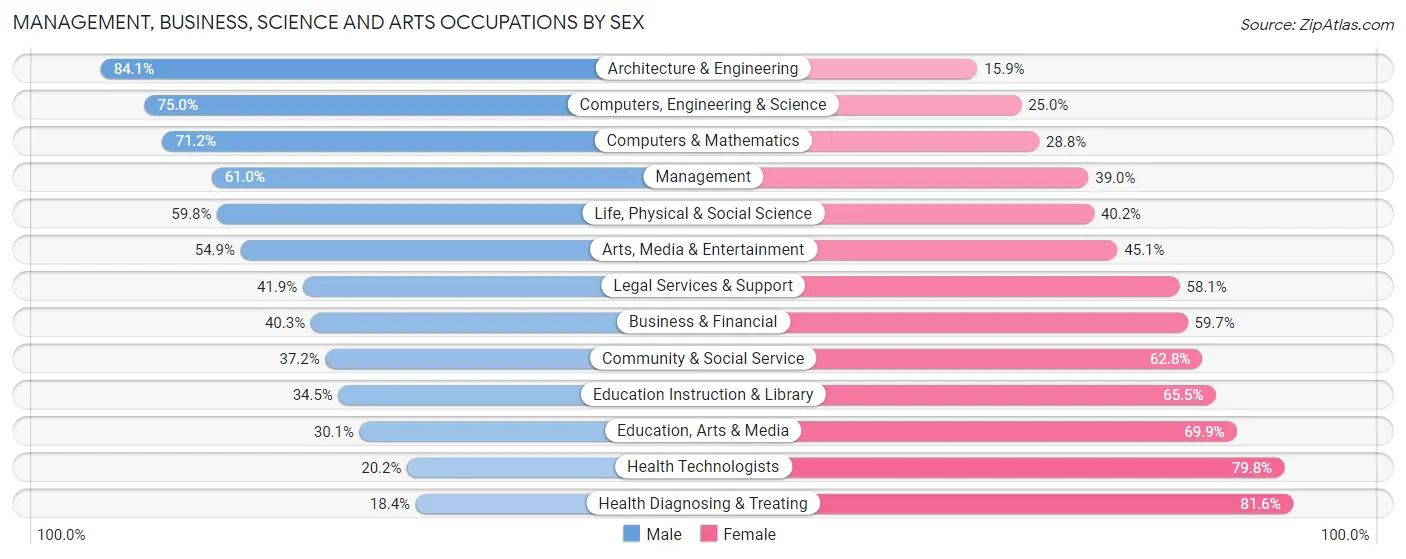
| Occupation | Male | Female |
| Management | 4,999 (61.0%) | 3,201 (39.0%) |
| Business & Financial | 1,570 (40.3%) | 2,330 (59.7%) |
| Computers, Engineering & Science | 3,248 (75.0%) | 1,085 (25.0%) |
| Computers & Mathematics | 1,408 (71.2%) | 569 (28.8%) |
| Architecture & Engineering | 1,492 (84.1%) | 282 (15.9%) |
| Life, Physical & Social Science | 348 (59.8%) | 234 (40.2%) |
| Community & Social Service | 2,807 (37.2%) | 4,734 (62.8%) |
| Education, Arts & Media | 436 (30.1%) | 1,014 (69.9%) |
| Legal Services & Support | 223 (41.9%) | 309 (58.1%) |
| Education Instruction & Library | 1,526 (34.5%) | 2,900 (65.5%) |
| Arts, Media & Entertainment | 622 (54.9%) | 511 (45.1%) |
| Health Diagnosing & Treating | 1,170 (18.4%) | 5,199 (81.6%) |
| Health Technologists | 819 (20.2%) | 3,244 (79.8%) |
| Total (Category) | 13,794 (45.5%) | 16,549 (54.5%) |
| Total (Overall) | 45,809 (51.3%) | 43,520 (48.7%) |
Services Occupations
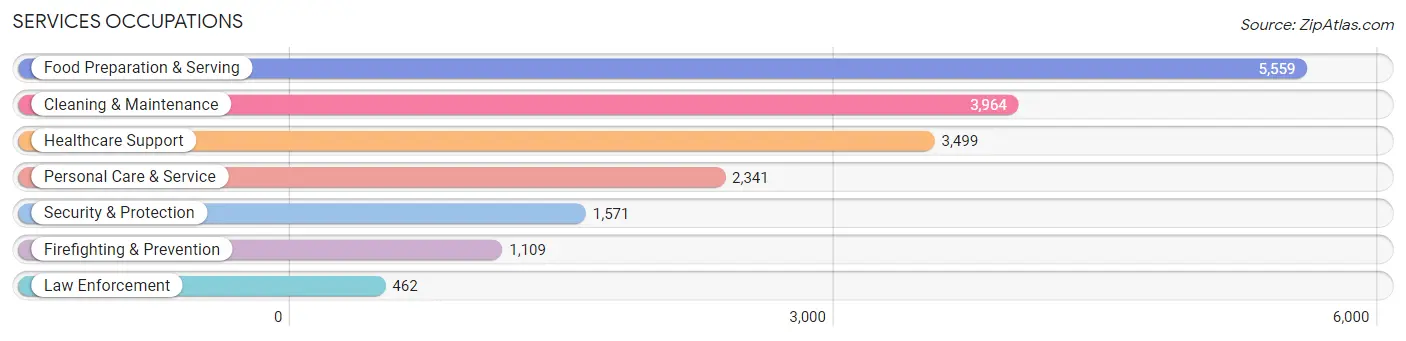
The most common Services occupations in Vanderburgh County are Food Preparation & Serving (5,559 | 6.2%), Cleaning & Maintenance (3,964 | 4.4%), Healthcare Support (3,499 | 3.9%), Personal Care & Service (2,341 | 2.6%), and Security & Protection (1,571 | 1.8%).
Services Occupations by Sex
Within the Services occupations in Vanderburgh County, the most male-oriented occupations are Law Enforcement (79.2%), Security & Protection (73.0%), and Firefighting & Prevention (70.4%), while the most female-oriented occupations are Personal Care & Service (88.1%), Healthcare Support (81.8%), and Food Preparation & Serving (60.3%).
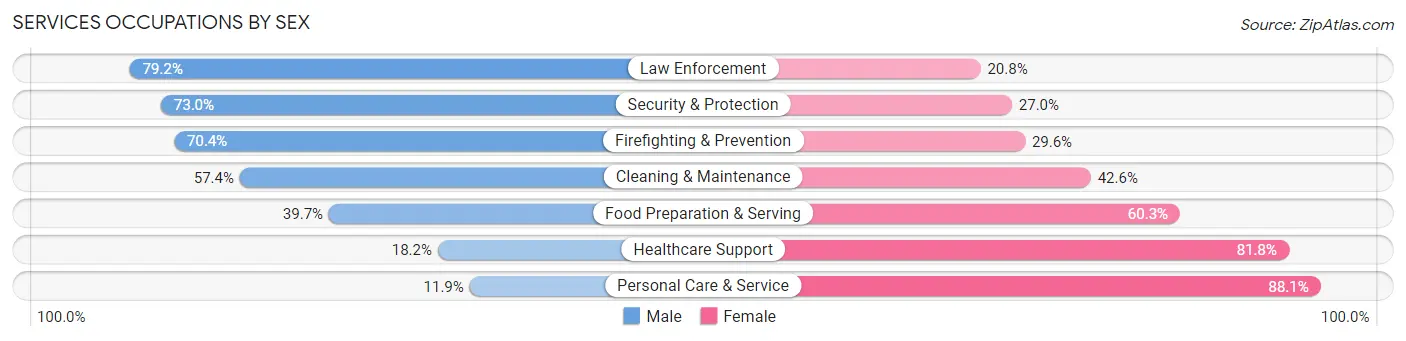
| Occupation | Male | Female |
| Healthcare Support | 636 (18.2%) | 2,863 (81.8%) |
| Security & Protection | 1,147 (73.0%) | 424 (27.0%) |
| Firefighting & Prevention | 781 (70.4%) | 328 (29.6%) |
| Law Enforcement | 366 (79.2%) | 96 (20.8%) |
| Food Preparation & Serving | 2,209 (39.7%) | 3,350 (60.3%) |
| Cleaning & Maintenance | 2,275 (57.4%) | 1,689 (42.6%) |
| Personal Care & Service | 278 (11.9%) | 2,063 (88.1%) |
| Total (Category) | 6,545 (38.7%) | 10,389 (61.4%) |
| Total (Overall) | 45,809 (51.3%) | 43,520 (48.7%) |
Sales and Office Occupations
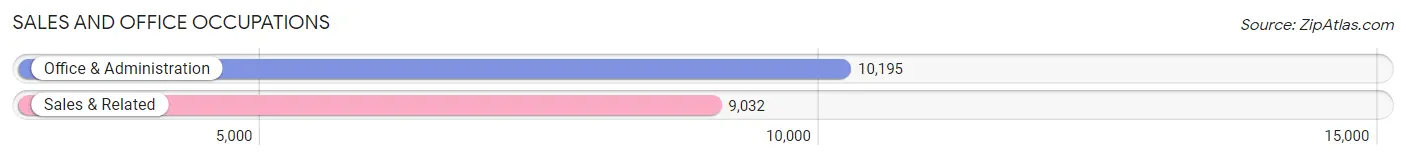
The most common Sales and Office occupations in Vanderburgh County are Office & Administration (10,195 | 11.4%), and Sales & Related (9,032 | 10.1%).
Sales and Office Occupations by Sex
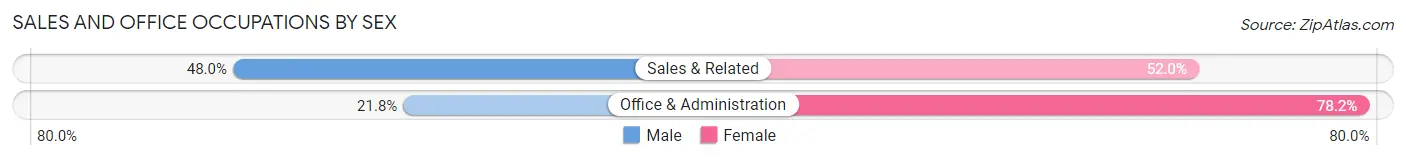
| Occupation | Male | Female |
| Sales & Related | 4,333 (48.0%) | 4,699 (52.0%) |
| Office & Administration | 2,218 (21.8%) | 7,977 (78.2%) |
| Total (Category) | 6,551 (34.1%) | 12,676 (65.9%) |
| Total (Overall) | 45,809 (51.3%) | 43,520 (48.7%) |
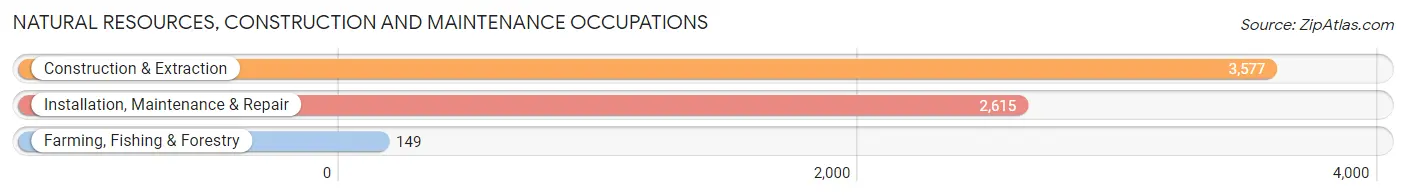
Natural Resources, Construction and Maintenance Occupations
The most common Natural Resources, Construction and Maintenance occupations in Vanderburgh County are Construction & Extraction (3,577 | 4.0%), Installation, Maintenance & Repair (2,615 | 2.9%), and Farming, Fishing & Forestry (149 | 0.2%).
Natural Resources, Construction and Maintenance Occupations by Sex
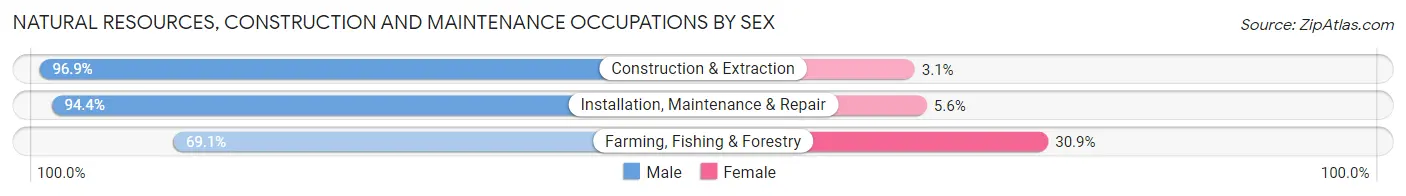
| Occupation | Male | Female |
| Farming, Fishing & Forestry | 103 (69.1%) | 46 (30.9%) |
| Construction & Extraction | 3,466 (96.9%) | 111 (3.1%) |
| Installation, Maintenance & Repair | 2,468 (94.4%) | 147 (5.6%) |
| Total (Category) | 6,037 (95.2%) | 304 (4.8%) |
| Total (Overall) | 45,809 (51.3%) | 43,520 (48.7%) |
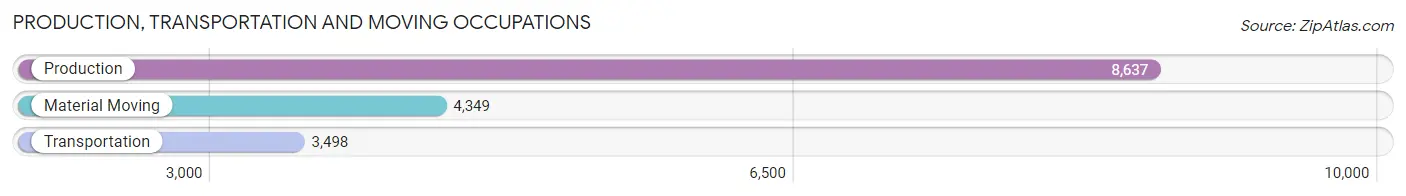
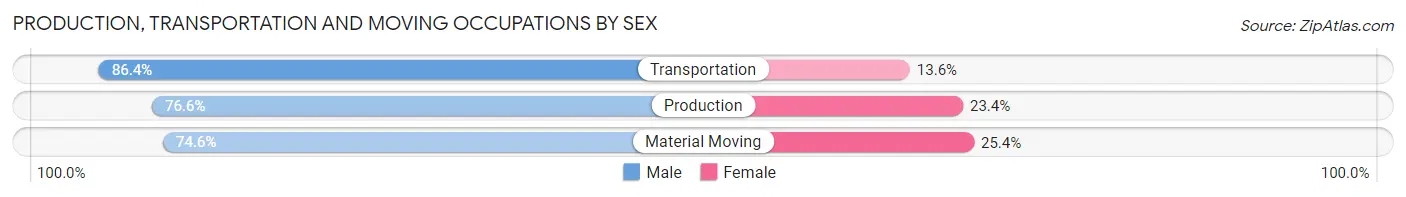
Production, Transportation and Moving Occupations
The most common Production, Transportation and Moving occupations in Vanderburgh County are Production (8,637 | 9.7%), Material Moving (4,349 | 4.9%), and Transportation (3,498 | 3.9%).
Production, Transportation and Moving Occupations by Sex
| Occupation | Male | Female |
| Production | 6,617 (76.6%) | 2,020 (23.4%) |
| Transportation | 3,021 (86.4%) | 477 (13.6%) |
| Material Moving | 3,244 (74.6%) | 1,105 (25.4%) |
| Total (Category) | 12,882 (78.1%) | 3,602 (21.8%) |
| Total (Overall) | 45,809 (51.3%) | 43,520 (48.7%) |
Employment Industries by Sex in Vanderburgh County
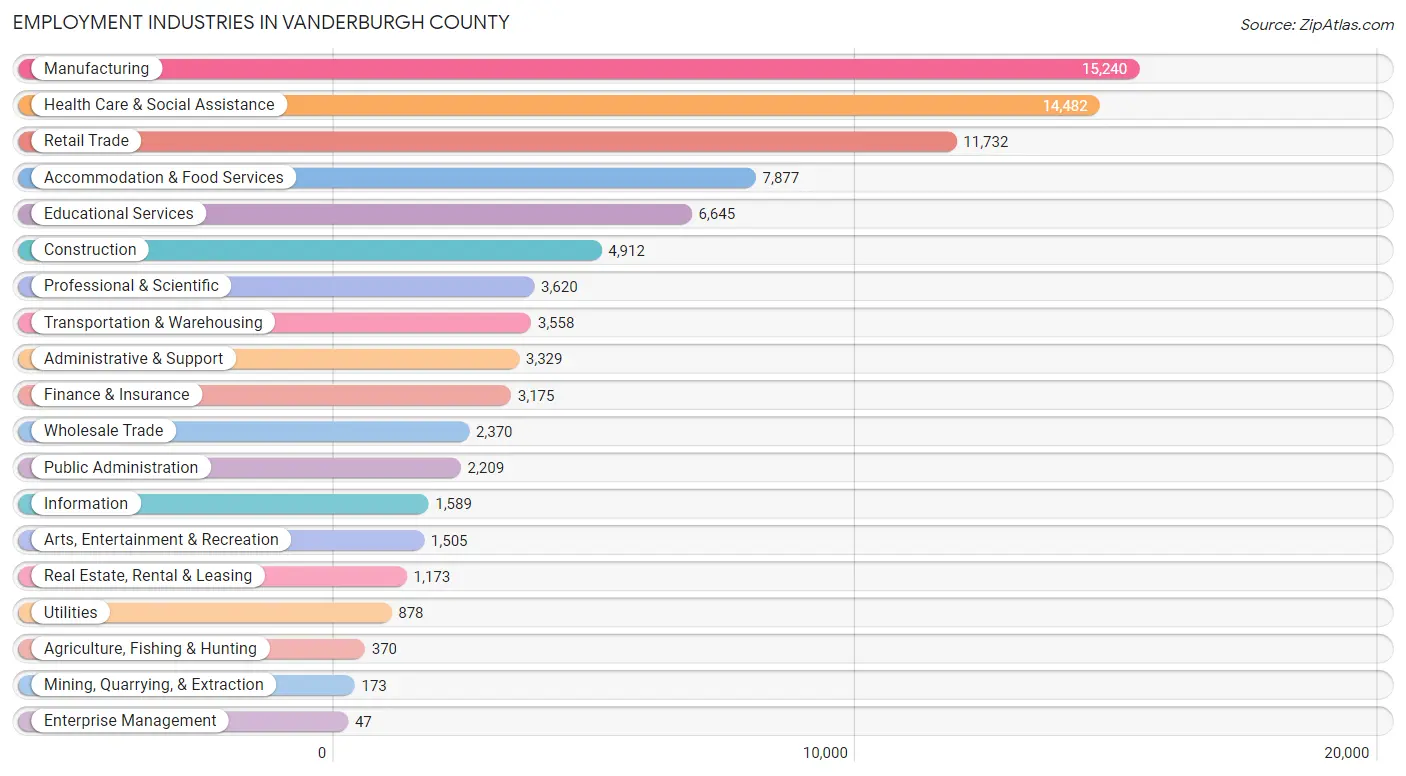
Employment Industries in Vanderburgh County
The major employment industries in Vanderburgh County include Manufacturing (15,240 | 17.1%), Health Care & Social Assistance (14,482 | 16.2%), Retail Trade (11,732 | 13.1%), Accommodation & Food Services (7,877 | 8.8%), and Educational Services (6,645 | 7.4%).
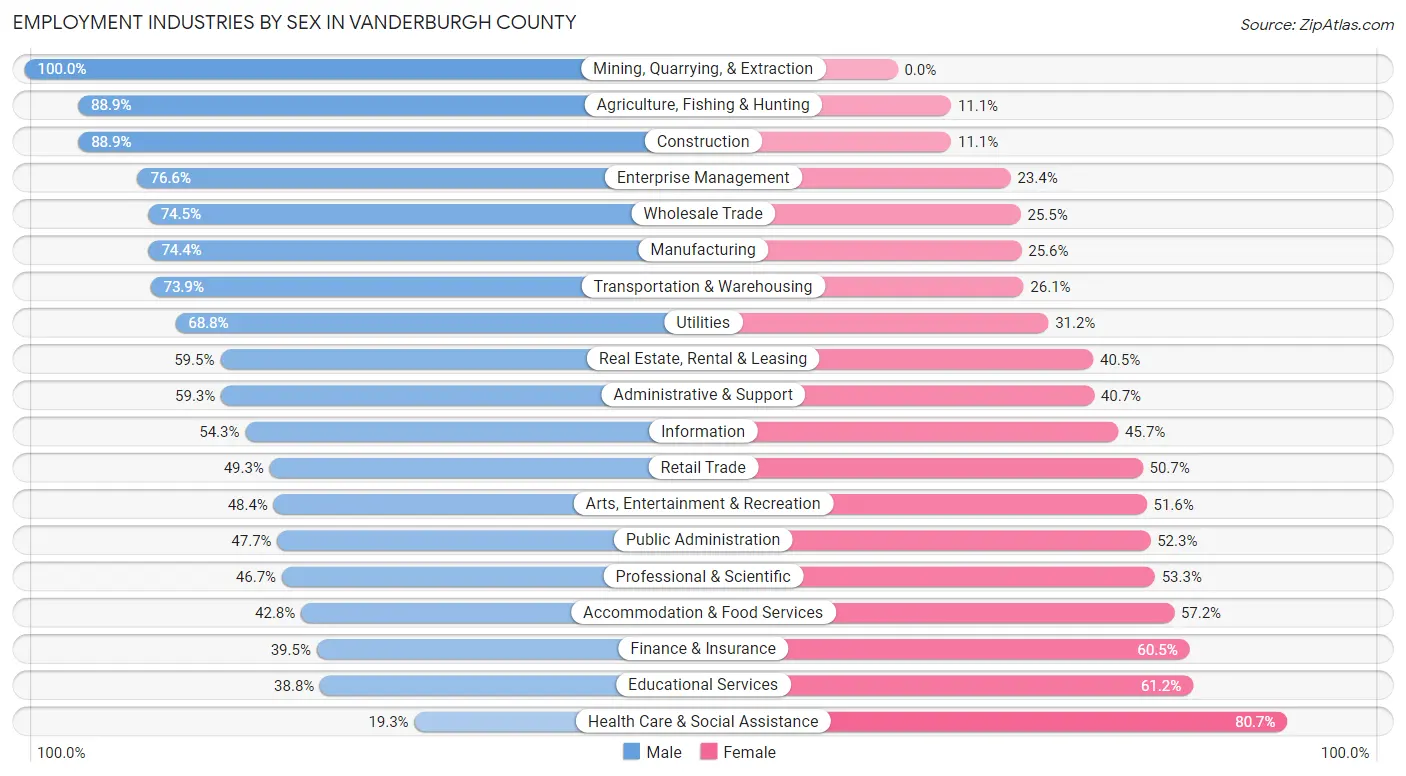
Employment Industries by Sex in Vanderburgh County
The Vanderburgh County industries that see more men than women are Mining, Quarrying, & Extraction (100.0%), Agriculture, Fishing & Hunting (88.9%), and Construction (88.9%), whereas the industries that tend to have a higher number of women are Health Care & Social Assistance (80.7%), Educational Services (61.2%), and Finance & Insurance (60.5%).
| Industry | Male | Female |
| Agriculture, Fishing & Hunting | 329 (88.9%) | 41 (11.1%) |
| Mining, Quarrying, & Extraction | 173 (100.0%) | 0 (0.0%) |
| Construction | 4,367 (88.9%) | 545 (11.1%) |
| Manufacturing | 11,332 (74.4%) | 3,908 (25.6%) |
| Wholesale Trade | 1,766 (74.5%) | 604 (25.5%) |
| Retail Trade | 5,780 (49.3%) | 5,952 (50.7%) |
| Transportation & Warehousing | 2,630 (73.9%) | 928 (26.1%) |
| Utilities | 604 (68.8%) | 274 (31.2%) |
| Information | 863 (54.3%) | 726 (45.7%) |
| Finance & Insurance | 1,255 (39.5%) | 1,920 (60.5%) |
| Real Estate, Rental & Leasing | 698 (59.5%) | 475 (40.5%) |
| Professional & Scientific | 1,692 (46.7%) | 1,928 (53.3%) |
| Enterprise Management | 36 (76.6%) | 11 (23.4%) |
| Administrative & Support | 1,975 (59.3%) | 1,354 (40.7%) |
| Educational Services | 2,580 (38.8%) | 4,065 (61.2%) |
| Health Care & Social Assistance | 2,796 (19.3%) | 11,686 (80.7%) |
| Arts, Entertainment & Recreation | 729 (48.4%) | 776 (51.6%) |
| Accommodation & Food Services | 3,368 (42.8%) | 4,509 (57.2%) |
| Public Administration | 1,053 (47.7%) | 1,156 (52.3%) |
| Total | 45,809 (51.3%) | 43,520 (48.7%) |
Education in Vanderburgh County
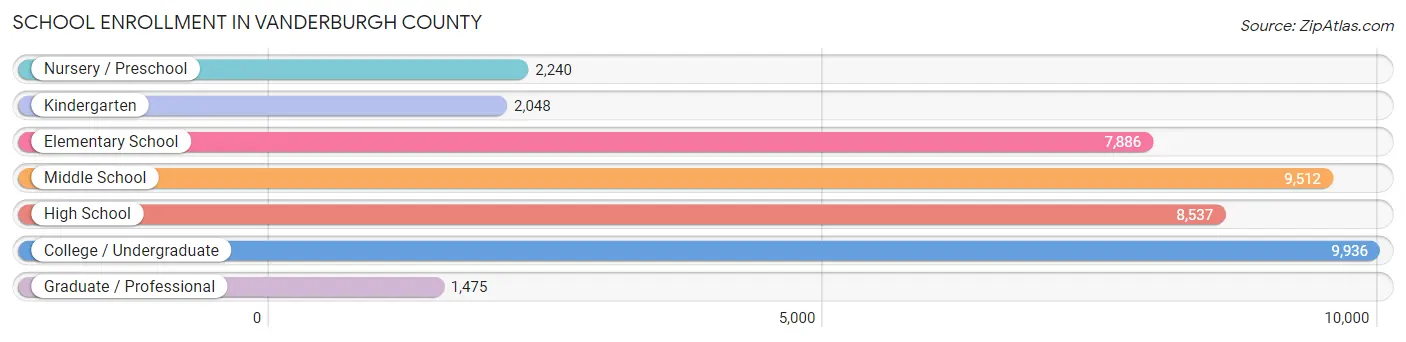
School Enrollment in Vanderburgh County
The most common levels of schooling among the 41,634 students in Vanderburgh County are college / undergraduate (9,936 | 23.9%), middle school (9,512 | 22.9%), and high school (8,537 | 20.5%).
| School Level | # Students | % Students |
| Nursery / Preschool | 2,240 | 5.4% |
| Kindergarten | 2,048 | 4.9% |
| Elementary School | 7,886 | 18.9% |
| Middle School | 9,512 | 22.9% |
| High School | 8,537 | 20.5% |
| College / Undergraduate | 9,936 | 23.9% |
| Graduate / Professional | 1,475 | 3.5% |
| Total | 41,634 | 100.0% |
School Enrollment by Age by Funding Source in Vanderburgh County
Out of a total of 41,634 students who are enrolled in schools in Vanderburgh County, 9,576 (23.0%) attend a private institution, while the remaining 32,058 (77.0%) are enrolled in public schools. The age group of 3 to 4 year olds has the highest likelihood of being enrolled in private schools, with 914 (55.8% in the age bracket) enrolled. Conversely, the age group of 20 to 24 year olds has the lowest likelihood of being enrolled in a private school, with 3,872 (84.1% in the age bracket) attending a public institution.
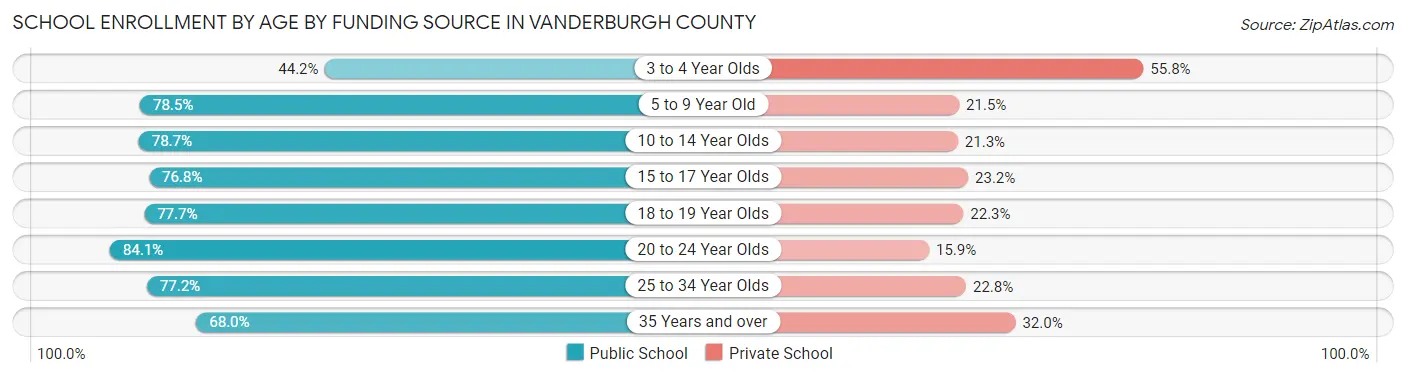
| Age Bracket | Public School | Private School |
| 3 to 4 Year Olds | 723 (44.2%) | 914 (55.8%) |
| 5 to 9 Year Old | 7,399 (78.5%) | 2,028 (21.5%) |
| 10 to 14 Year Olds | 9,139 (78.7%) | 2,470 (21.3%) |
| 15 to 17 Year Olds | 4,877 (76.8%) | 1,472 (23.2%) |
| 18 to 19 Year Olds | 3,187 (77.7%) | 914 (22.3%) |
| 20 to 24 Year Olds | 3,872 (84.1%) | 732 (15.9%) |
| 25 to 34 Year Olds | 1,745 (77.2%) | 515 (22.8%) |
| 35 Years and over | 1,120 (68.0%) | 527 (32.0%) |
| Total | 32,058 (77.0%) | 9,576 (23.0%) |
Educational Attainment by Field of Study in Vanderburgh County
Business (7,432 | 20.8%), education (5,652 | 15.8%), science & technology (4,580 | 12.8%), arts & humanities (2,488 | 7.0%), and social sciences (2,233 | 6.2%) are the most common fields of study among 35,801 individuals in Vanderburgh County who have obtained a bachelor's degree or higher.
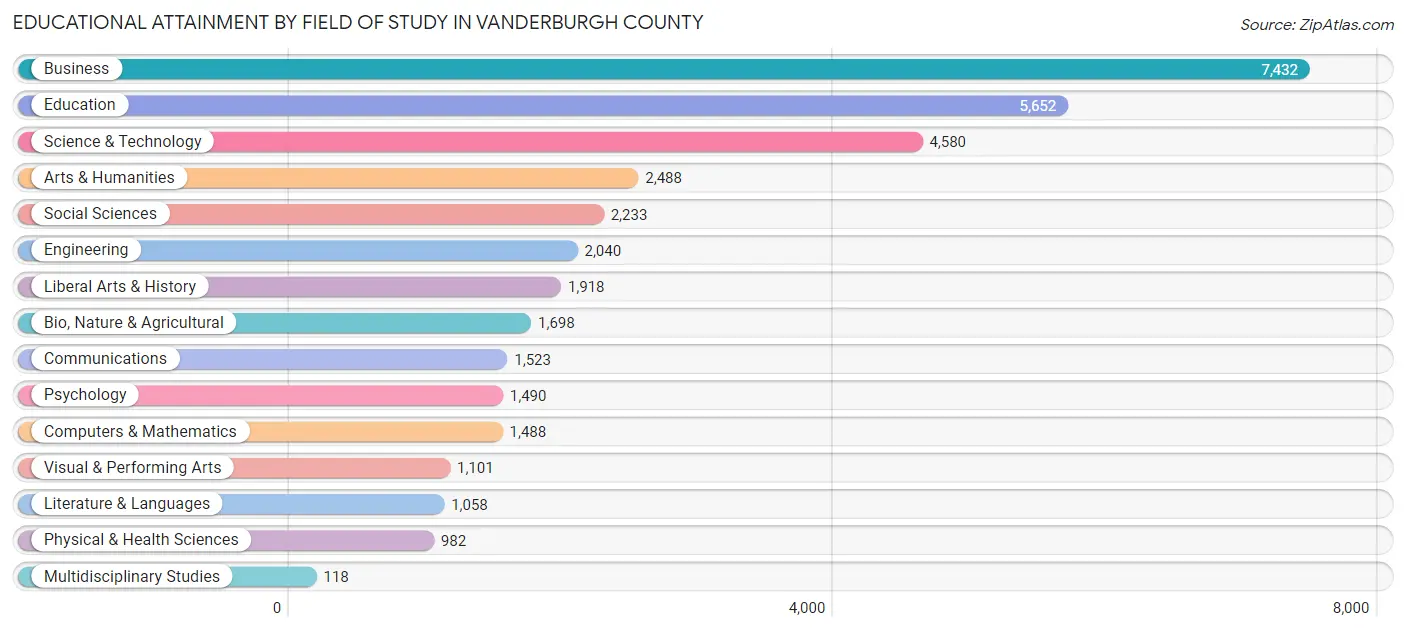
| Field of Study | # Graduates | % Graduates |
| Computers & Mathematics | 1,488 | 4.2% |
| Bio, Nature & Agricultural | 1,698 | 4.7% |
| Physical & Health Sciences | 982 | 2.7% |
| Psychology | 1,490 | 4.2% |
| Social Sciences | 2,233 | 6.2% |
| Engineering | 2,040 | 5.7% |
| Multidisciplinary Studies | 118 | 0.3% |
| Science & Technology | 4,580 | 12.8% |
| Business | 7,432 | 20.8% |
| Education | 5,652 | 15.8% |
| Literature & Languages | 1,058 | 3.0% |
| Liberal Arts & History | 1,918 | 5.4% |
| Visual & Performing Arts | 1,101 | 3.1% |
| Communications | 1,523 | 4.3% |
| Arts & Humanities | 2,488 | 7.0% |
| Total | 35,801 | 100.0% |
Transportation & Commute in Vanderburgh County
Vehicle Availability by Sex in Vanderburgh County
The most prevalent vehicle ownership categories in Vanderburgh County are males with 2 vehicles (19,695, accounting for 44.0%) and females with 2 vehicles (16,914, making up 47.4%).
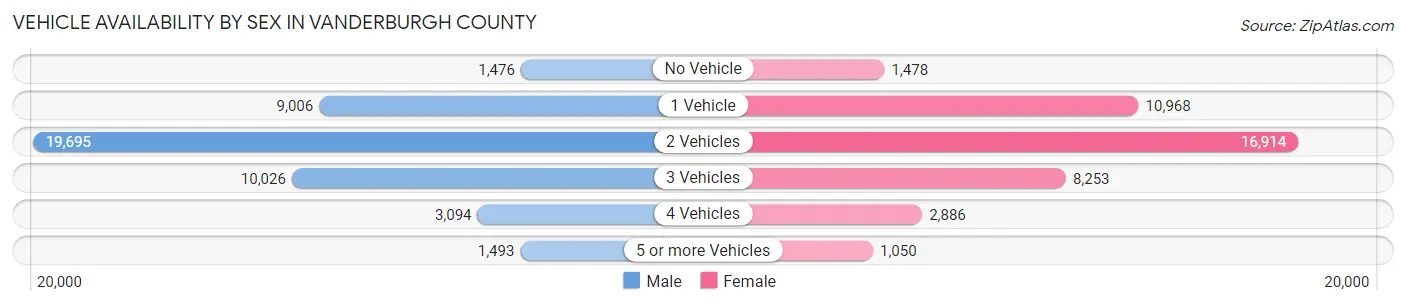
| Vehicles Available | Male | Female |
| No Vehicle | 1,476 (3.3%) | 1,478 (3.6%) |
| 1 Vehicle | 9,006 (20.1%) | 10,968 (26.4%) |
| 2 Vehicles | 19,695 (44.0%) | 16,914 (40.7%) |
| 3 Vehicles | 10,026 (22.4%) | 8,253 (19.9%) |
| 4 Vehicles | 3,094 (6.9%) | 2,886 (7.0%) |
| 5 or more Vehicles | 1,493 (3.3%) | 1,050 (2.5%) |
| Total | 44,790 (100.0%) | 41,549 (100.0%) |
Commute Time in Vanderburgh County
The most frequently occuring commute durations in Vanderburgh County are 10 to 14 minutes (17,585 commuters, 21.1%), 15 to 19 minutes (17,476 commuters, 21.0%), and 20 to 24 minutes (13,164 commuters, 15.8%).
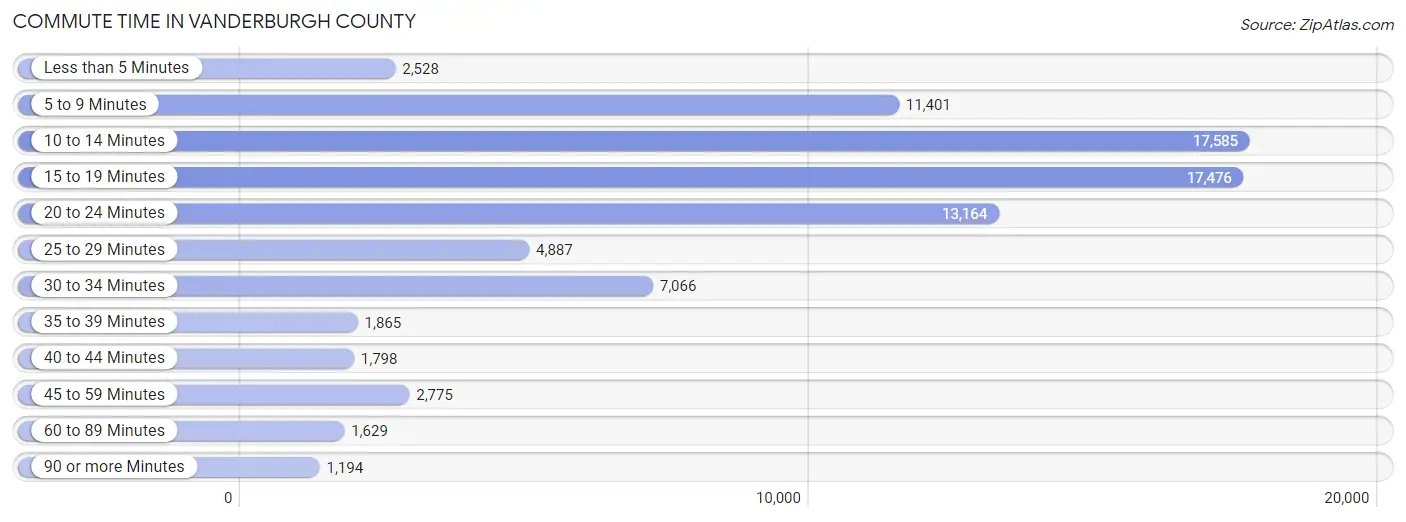
| Commute Time | # Commuters | % Commuters |
| Less than 5 Minutes | 2,528 | 3.0% |
| 5 to 9 Minutes | 11,401 | 13.7% |
| 10 to 14 Minutes | 17,585 | 21.1% |
| 15 to 19 Minutes | 17,476 | 21.0% |
| 20 to 24 Minutes | 13,164 | 15.8% |
| 25 to 29 Minutes | 4,887 | 5.9% |
| 30 to 34 Minutes | 7,066 | 8.5% |
| 35 to 39 Minutes | 1,865 | 2.2% |
| 40 to 44 Minutes | 1,798 | 2.2% |
| 45 to 59 Minutes | 2,775 | 3.3% |
| 60 to 89 Minutes | 1,629 | 1.9% |
| 90 or more Minutes | 1,194 | 1.4% |
Commute Time by Sex in Vanderburgh County
The most common commute times in Vanderburgh County are 15 to 19 minutes (8,381 commuters, 19.3%) for males and 10 to 14 minutes (9,677 commuters, 24.3%) for females.
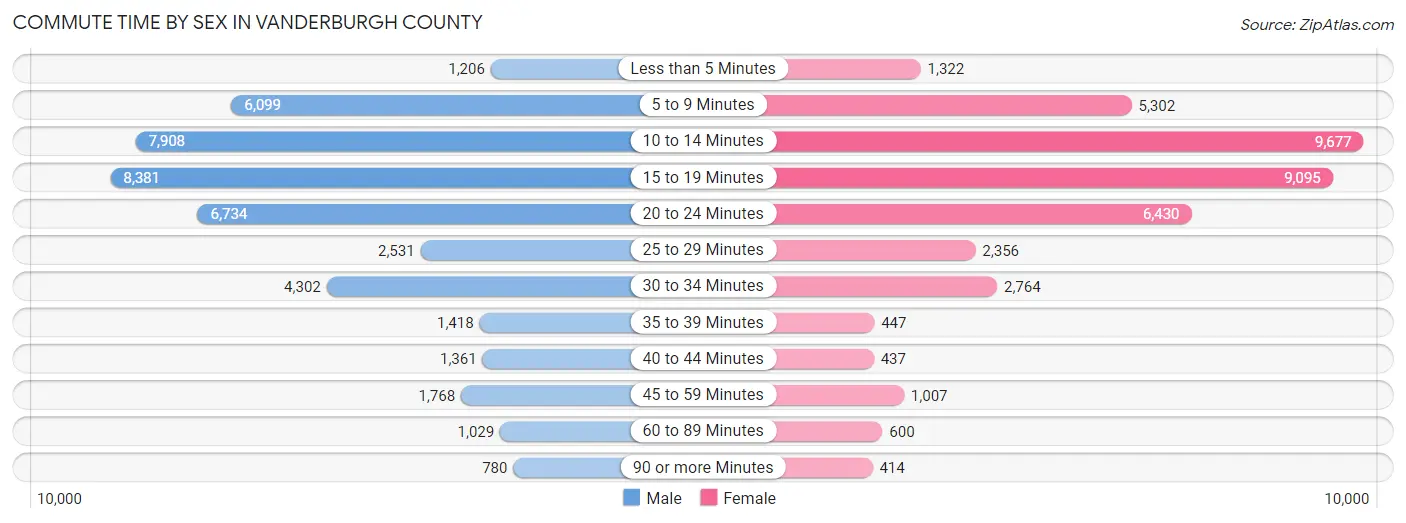
| Commute Time | Male | Female |
| Less than 5 Minutes | 1,206 (2.8%) | 1,322 (3.3%) |
| 5 to 9 Minutes | 6,099 (14.0%) | 5,302 (13.3%) |
| 10 to 14 Minutes | 7,908 (18.2%) | 9,677 (24.3%) |
| 15 to 19 Minutes | 8,381 (19.3%) | 9,095 (22.8%) |
| 20 to 24 Minutes | 6,734 (15.5%) | 6,430 (16.1%) |
| 25 to 29 Minutes | 2,531 (5.8%) | 2,356 (5.9%) |
| 30 to 34 Minutes | 4,302 (9.9%) | 2,764 (6.9%) |
| 35 to 39 Minutes | 1,418 (3.3%) | 447 (1.1%) |
| 40 to 44 Minutes | 1,361 (3.1%) | 437 (1.1%) |
| 45 to 59 Minutes | 1,768 (4.1%) | 1,007 (2.5%) |
| 60 to 89 Minutes | 1,029 (2.4%) | 600 (1.5%) |
| 90 or more Minutes | 780 (1.8%) | 414 (1.0%) |
Time of Departure to Work by Sex in Vanderburgh County
The most frequent times of departure to work in Vanderburgh County are 7:00 AM to 7:29 AM (5,604, 12.9%) for males and 7:30 AM to 7:59 AM (6,183, 15.5%) for females.
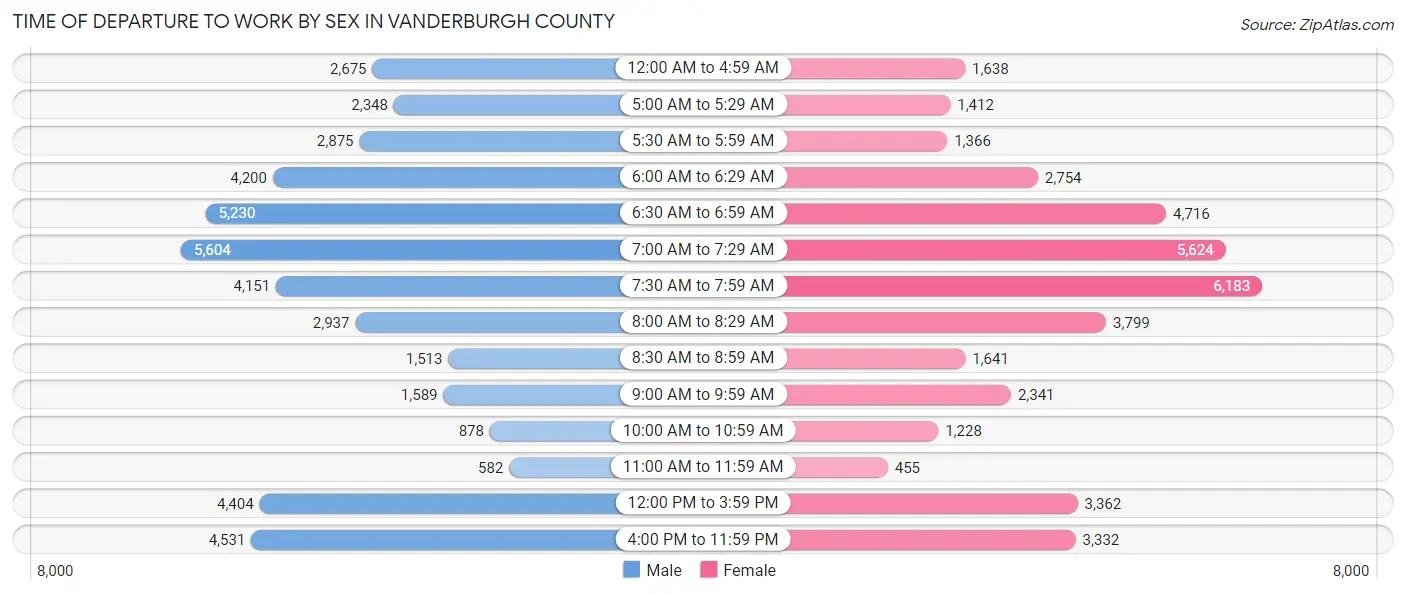
| Time of Departure | Male | Female |
| 12:00 AM to 4:59 AM | 2,675 (6.1%) | 1,638 (4.1%) |
| 5:00 AM to 5:29 AM | 2,348 (5.4%) | 1,412 (3.5%) |
| 5:30 AM to 5:59 AM | 2,875 (6.6%) | 1,366 (3.4%) |
| 6:00 AM to 6:29 AM | 4,200 (9.7%) | 2,754 (6.9%) |
| 6:30 AM to 6:59 AM | 5,230 (12.0%) | 4,716 (11.8%) |
| 7:00 AM to 7:29 AM | 5,604 (12.9%) | 5,624 (14.1%) |
| 7:30 AM to 7:59 AM | 4,151 (9.5%) | 6,183 (15.5%) |
| 8:00 AM to 8:29 AM | 2,937 (6.8%) | 3,799 (9.5%) |
| 8:30 AM to 8:59 AM | 1,513 (3.5%) | 1,641 (4.1%) |
| 9:00 AM to 9:59 AM | 1,589 (3.6%) | 2,341 (5.9%) |
| 10:00 AM to 10:59 AM | 878 (2.0%) | 1,228 (3.1%) |
| 11:00 AM to 11:59 AM | 582 (1.3%) | 455 (1.1%) |
| 12:00 PM to 3:59 PM | 4,404 (10.1%) | 3,362 (8.4%) |
| 4:00 PM to 11:59 PM | 4,531 (10.4%) | 3,332 (8.4%) |
| Total | 43,517 (100.0%) | 39,851 (100.0%) |
Housing Occupancy in Vanderburgh County
Occupancy by Ownership in Vanderburgh County
Of the total 76,857 dwellings in Vanderburgh County, owner-occupied units account for 49,786 (64.8%), while renter-occupied units make up 27,071 (35.2%).
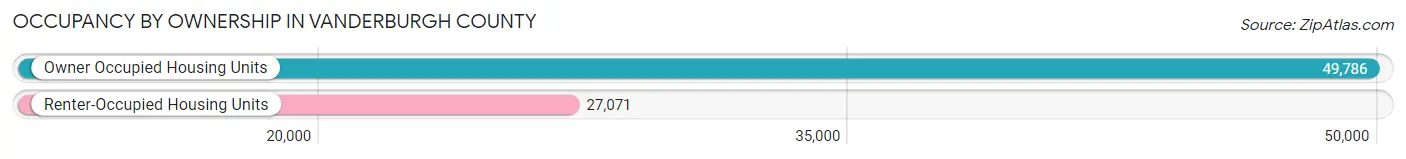
| Occupancy | # Housing Units | % Housing Units |
| Owner Occupied Housing Units | 49,786 | 64.8% |
| Renter-Occupied Housing Units | 27,071 | 35.2% |
| Total Occupied Housing Units | 76,857 | 100.0% |
Occupancy by Household Size in Vanderburgh County
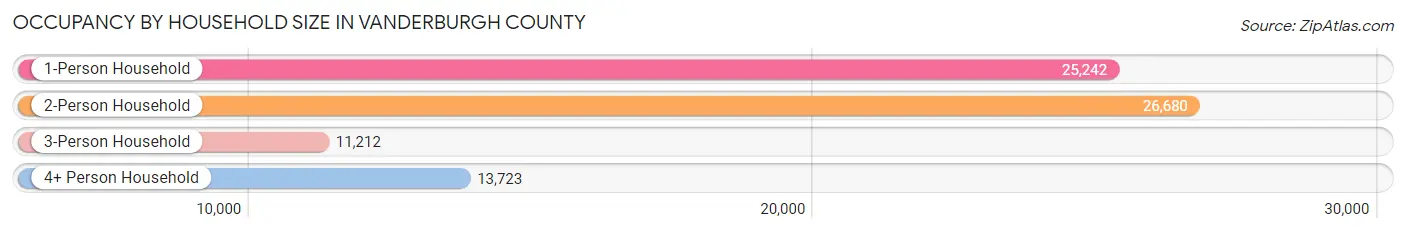
| Household Size | # Housing Units | % Housing Units |
| 1-Person Household | 25,242 | 32.8% |
| 2-Person Household | 26,680 | 34.7% |
| 3-Person Household | 11,212 | 14.6% |
| 4+ Person Household | 13,723 | 17.9% |
| Total Housing Units | 76,857 | 100.0% |
Occupancy by Ownership by Household Size in Vanderburgh County
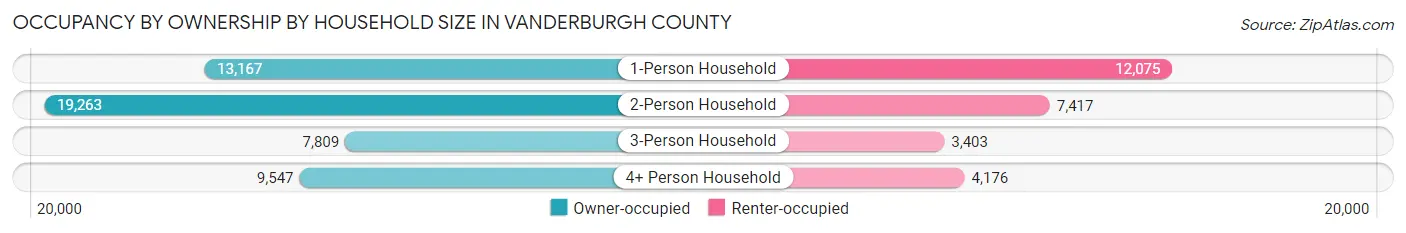
| Household Size | Owner-occupied | Renter-occupied |
| 1-Person Household | 13,167 (52.2%) | 12,075 (47.8%) |
| 2-Person Household | 19,263 (72.2%) | 7,417 (27.8%) |
| 3-Person Household | 7,809 (69.7%) | 3,403 (30.3%) |
| 4+ Person Household | 9,547 (69.6%) | 4,176 (30.4%) |
| Total Housing Units | 49,786 (64.8%) | 27,071 (35.2%) |
Occupancy by Educational Attainment in Vanderburgh County
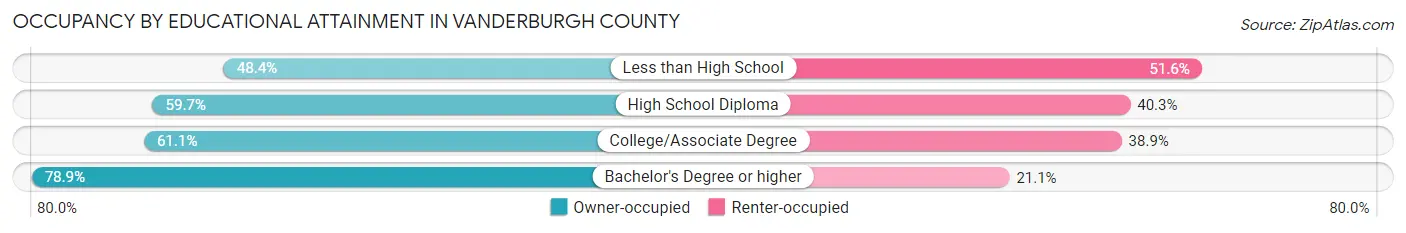
| Household Size | Owner-occupied | Renter-occupied |
| Less than High School | 2,959 (48.4%) | 3,157 (51.6%) |
| High School Diploma | 13,375 (59.7%) | 9,033 (40.3%) |
| College/Associate Degree | 15,991 (61.1%) | 10,199 (38.9%) |
| Bachelor's Degree or higher | 17,461 (78.9%) | 4,682 (21.1%) |
Occupancy by Age of Householder in Vanderburgh County
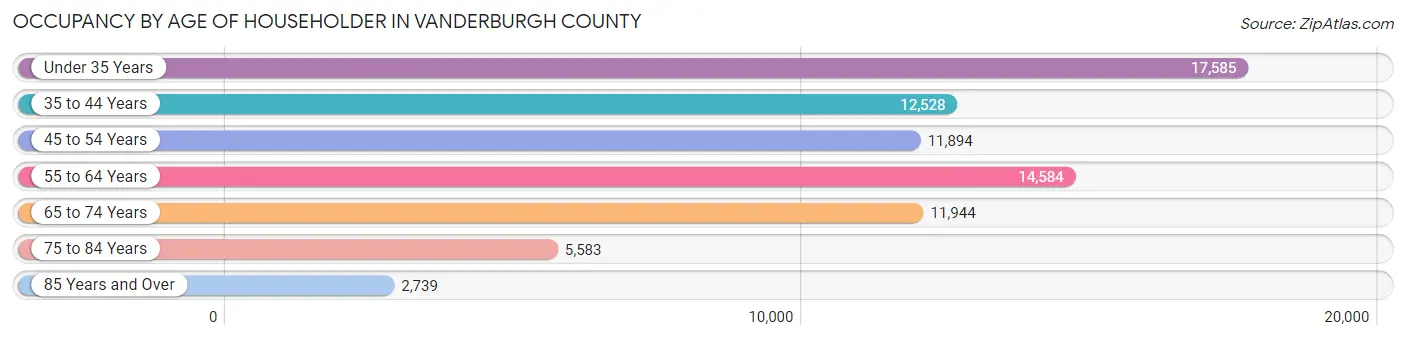
| Age Bracket | # Households | % Households |
| Under 35 Years | 17,585 | 22.9% |
| 35 to 44 Years | 12,528 | 16.3% |
| 45 to 54 Years | 11,894 | 15.5% |
| 55 to 64 Years | 14,584 | 19.0% |
| 65 to 74 Years | 11,944 | 15.5% |
| 75 to 84 Years | 5,583 | 7.3% |
| 85 Years and Over | 2,739 | 3.6% |
| Total | 76,857 | 100.0% |
Housing Finances in Vanderburgh County
Median Income by Occupancy in Vanderburgh County
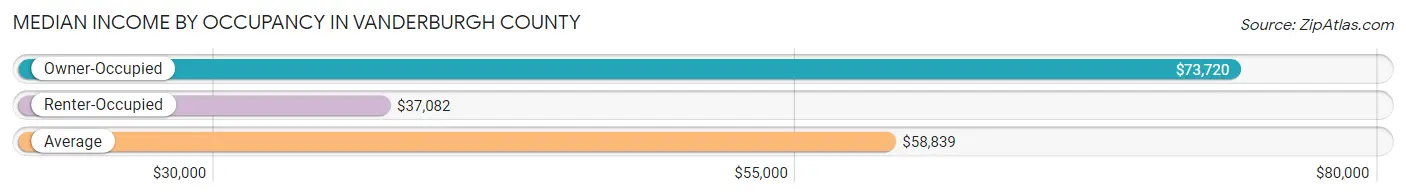
| Occupancy Type | # Households | Median Income |
| Owner-Occupied | 49,786 (64.8%) | $73,720 |
| Renter-Occupied | 27,071 (35.2%) | $37,082 |
| Average | 76,857 (100.0%) | $58,839 |
Occupancy by Householder Income Bracket in Vanderburgh County
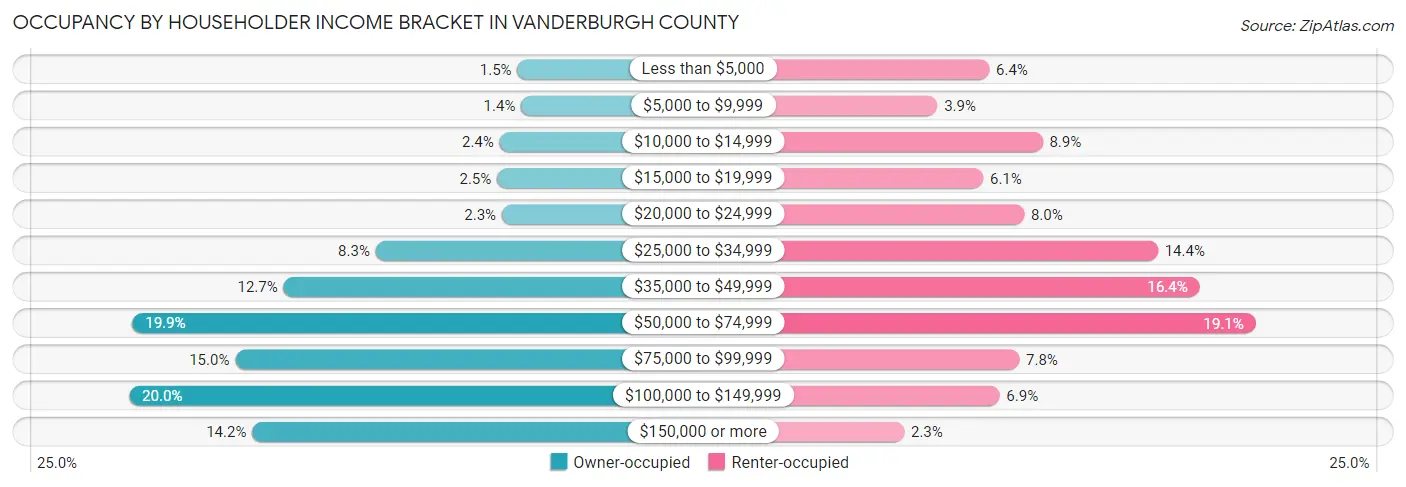
| Income Bracket | Owner-occupied | Renter-occupied |
| Less than $5,000 | 763 (1.5%) | 1,721 (6.4%) |
| $5,000 to $9,999 | 673 (1.3%) | 1,052 (3.9%) |
| $10,000 to $14,999 | 1,187 (2.4%) | 2,410 (8.9%) |
| $15,000 to $19,999 | 1,246 (2.5%) | 1,643 (6.1%) |
| $20,000 to $24,999 | 1,129 (2.3%) | 2,170 (8.0%) |
| $25,000 to $34,999 | 4,120 (8.3%) | 3,895 (14.4%) |
| $35,000 to $49,999 | 6,309 (12.7%) | 4,434 (16.4%) |
| $50,000 to $74,999 | 9,892 (19.9%) | 5,156 (19.1%) |
| $75,000 to $99,999 | 7,452 (15.0%) | 2,110 (7.8%) |
| $100,000 to $149,999 | 9,965 (20.0%) | 1,855 (6.9%) |
| $150,000 or more | 7,050 (14.2%) | 625 (2.3%) |
| Total | 49,786 (100.0%) | 27,071 (100.0%) |
Monthly Housing Cost Tiers in Vanderburgh County
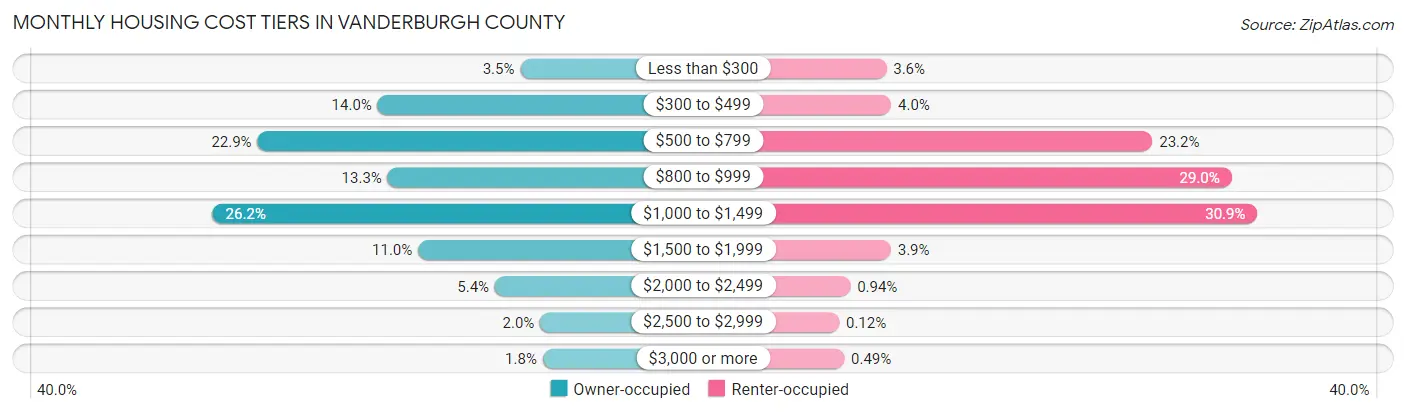
| Monthly Cost | Owner-occupied | Renter-occupied |
| Less than $300 | 1,739 (3.5%) | 975 (3.6%) |
| $300 to $499 | 6,970 (14.0%) | 1,070 (4.0%) |
| $500 to $799 | 11,378 (22.9%) | 6,278 (23.2%) |
| $800 to $999 | 6,600 (13.3%) | 7,859 (29.0%) |
| $1,000 to $1,499 | 13,018 (26.2%) | 8,371 (30.9%) |
| $1,500 to $1,999 | 5,486 (11.0%) | 1,063 (3.9%) |
| $2,000 to $2,499 | 2,668 (5.4%) | 255 (0.9%) |
| $2,500 to $2,999 | 1,011 (2.0%) | 33 (0.1%) |
| $3,000 or more | 916 (1.8%) | 133 (0.5%) |
| Total | 49,786 (100.0%) | 27,071 (100.0%) |
Physical Housing Characteristics in Vanderburgh County
Housing Structures in Vanderburgh County
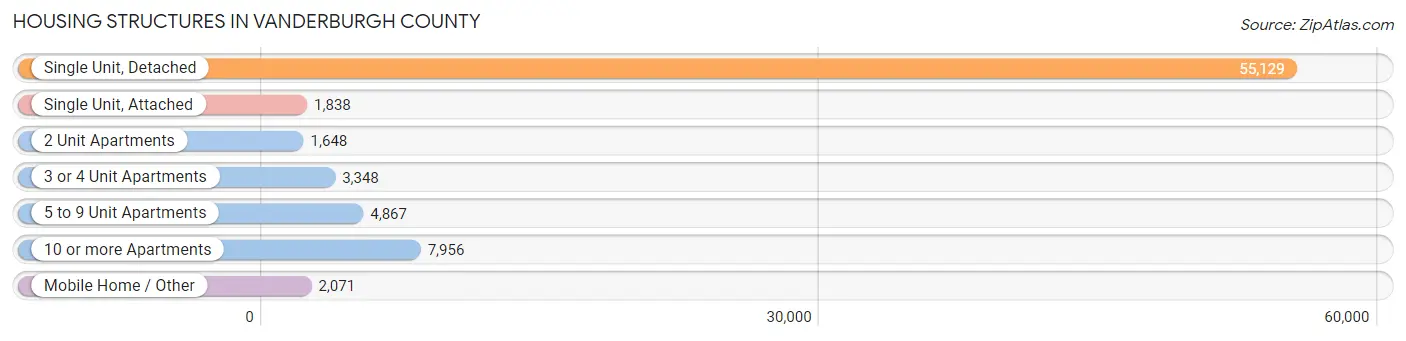
| Structure Type | # Housing Units | % Housing Units |
| Single Unit, Detached | 55,129 | 71.7% |
| Single Unit, Attached | 1,838 | 2.4% |
| 2 Unit Apartments | 1,648 | 2.1% |
| 3 or 4 Unit Apartments | 3,348 | 4.4% |
| 5 to 9 Unit Apartments | 4,867 | 6.3% |
| 10 or more Apartments | 7,956 | 10.3% |
| Mobile Home / Other | 2,071 | 2.7% |
| Total | 76,857 | 100.0% |
Housing Structures by Occupancy in Vanderburgh County
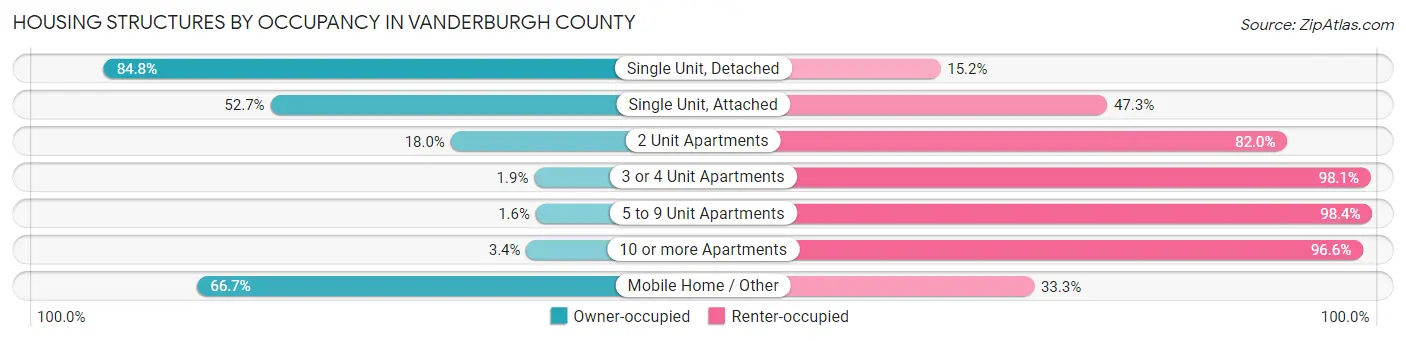
| Structure Type | Owner-occupied | Renter-occupied |
| Single Unit, Detached | 46,730 (84.8%) | 8,399 (15.2%) |
| Single Unit, Attached | 968 (52.7%) | 870 (47.3%) |
| 2 Unit Apartments | 296 (18.0%) | 1,352 (82.0%) |
| 3 or 4 Unit Apartments | 63 (1.9%) | 3,285 (98.1%) |
| 5 to 9 Unit Apartments | 77 (1.6%) | 4,790 (98.4%) |
| 10 or more Apartments | 270 (3.4%) | 7,686 (96.6%) |
| Mobile Home / Other | 1,382 (66.7%) | 689 (33.3%) |
| Total | 49,786 (64.8%) | 27,071 (35.2%) |
Housing Structures by Number of Rooms in Vanderburgh County
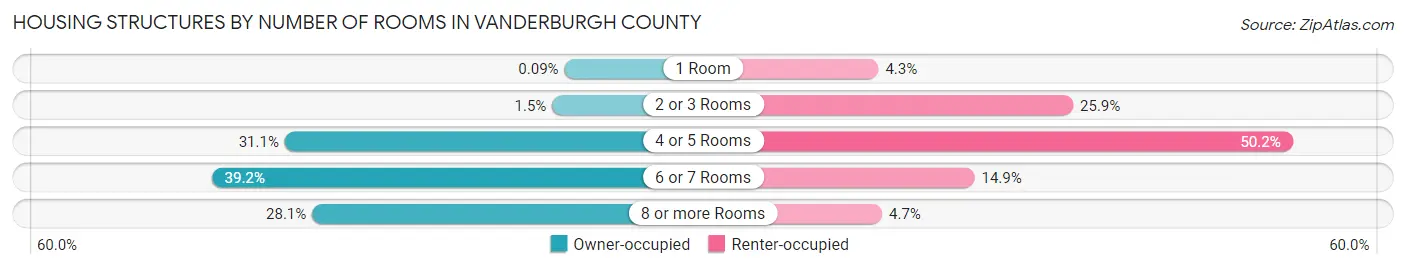
| Number of Rooms | Owner-occupied | Renter-occupied |
| 1 Room | 47 (0.1%) | 1,159 (4.3%) |
| 2 or 3 Rooms | 722 (1.5%) | 7,007 (25.9%) |
| 4 or 5 Rooms | 15,497 (31.1%) | 13,595 (50.2%) |
| 6 or 7 Rooms | 19,537 (39.2%) | 4,044 (14.9%) |
| 8 or more Rooms | 13,983 (28.1%) | 1,266 (4.7%) |
| Total | 49,786 (100.0%) | 27,071 (100.0%) |
Housing Structure by Heating Type in Vanderburgh County
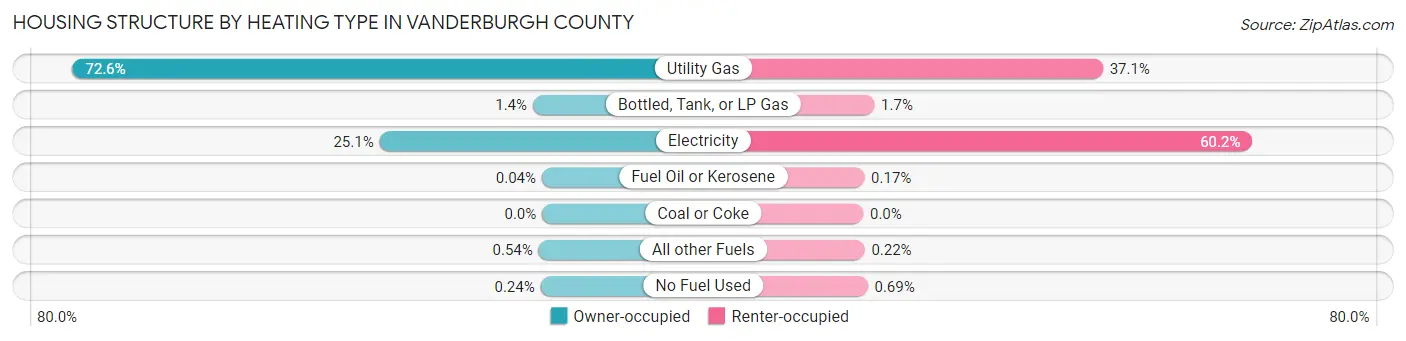
| Heating Type | Owner-occupied | Renter-occupied |
| Utility Gas | 36,150 (72.6%) | 10,031 (37.0%) |
| Bottled, Tank, or LP Gas | 713 (1.4%) | 465 (1.7%) |
| Electricity | 12,516 (25.1%) | 16,285 (60.2%) |
| Fuel Oil or Kerosene | 21 (0.0%) | 45 (0.2%) |
| Coal or Coke | 0 (0.0%) | 0 (0.0%) |
| All other Fuels | 267 (0.5%) | 59 (0.2%) |
| No Fuel Used | 119 (0.2%) | 186 (0.7%) |
| Total | 49,786 (100.0%) | 27,071 (100.0%) |
Household Vehicle Usage in Vanderburgh County
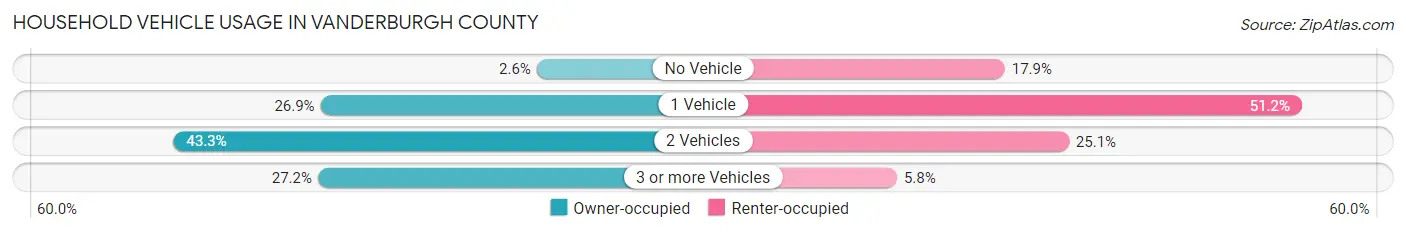
| Vehicles per Household | Owner-occupied | Renter-occupied |
| No Vehicle | 1,316 (2.6%) | 4,849 (17.9%) |
| 1 Vehicle | 13,375 (26.9%) | 13,852 (51.2%) |
| 2 Vehicles | 21,572 (43.3%) | 6,791 (25.1%) |
| 3 or more Vehicles | 13,523 (27.2%) | 1,579 (5.8%) |
| Total | 49,786 (100.0%) | 27,071 (100.0%) |
Real Estate & Mortgages in Vanderburgh County
Real Estate and Mortgage Overview in Vanderburgh County
| Characteristic | Without Mortgage | With Mortgage |
| Housing Units | 18,916 | 30,870 |
| Median Property Value | $156,800 | $165,700 |
| Median Household Income | $58,609 | $4,910 |
| Monthly Housing Costs | $536 | $886 |
| Real Estate Taxes | $1,393 | $1,241 |
Property Value by Mortgage Status in Vanderburgh County
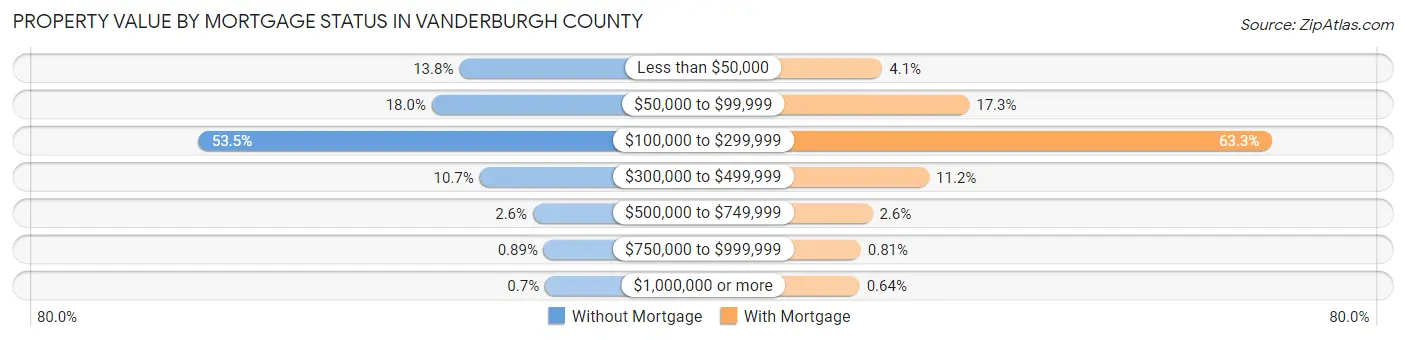
| Property Value | Without Mortgage | With Mortgage |
| Less than $50,000 | 2,605 (13.8%) | 1,260 (4.1%) |
| $50,000 to $99,999 | 3,397 (18.0%) | 5,350 (17.3%) |
| $100,000 to $299,999 | 10,110 (53.4%) | 19,553 (63.3%) |
| $300,000 to $499,999 | 2,020 (10.7%) | 3,464 (11.2%) |
| $500,000 to $749,999 | 482 (2.5%) | 795 (2.6%) |
| $750,000 to $999,999 | 169 (0.9%) | 250 (0.8%) |
| $1,000,000 or more | 133 (0.7%) | 198 (0.6%) |
| Total | 18,916 (100.0%) | 30,870 (100.0%) |
Household Income by Mortgage Status in Vanderburgh County
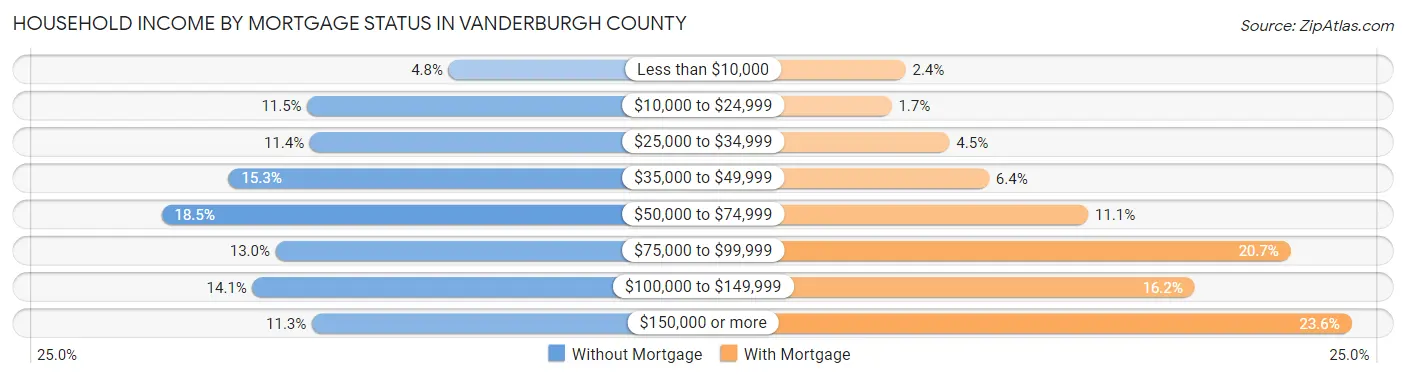
| Household Income | Without Mortgage | With Mortgage |
| Less than $10,000 | 908 (4.8%) | 736 (2.4%) |
| $10,000 to $24,999 | 2,181 (11.5%) | 528 (1.7%) |
| $25,000 to $34,999 | 2,159 (11.4%) | 1,381 (4.5%) |
| $35,000 to $49,999 | 2,893 (15.3%) | 1,961 (6.4%) |
| $50,000 to $74,999 | 3,495 (18.5%) | 3,416 (11.1%) |
| $75,000 to $99,999 | 2,466 (13.0%) | 6,397 (20.7%) |
| $100,000 to $149,999 | 2,674 (14.1%) | 4,986 (16.2%) |
| $150,000 or more | 2,140 (11.3%) | 7,291 (23.6%) |
| Total | 18,916 (100.0%) | 30,870 (100.0%) |
Property Value to Household Income Ratio in Vanderburgh County
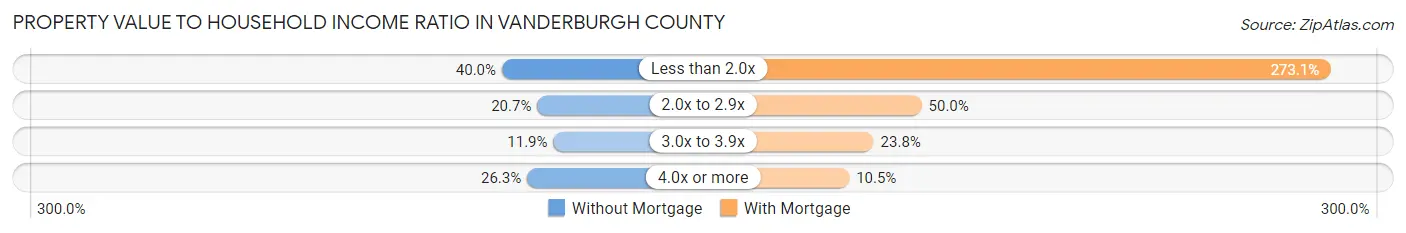
| Value-to-Income Ratio | Without Mortgage | With Mortgage |
| Less than 2.0x | 7,565 (40.0%) | 84,296 (273.1%) |
| 2.0x to 2.9x | 3,916 (20.7%) | 15,426 (50.0%) |
| 3.0x to 3.9x | 2,251 (11.9%) | 7,352 (23.8%) |
| 4.0x or more | 4,970 (26.3%) | 3,244 (10.5%) |
| Total | 18,916 (100.0%) | 30,870 (100.0%) |
Real Estate Taxes by Mortgage Status in Vanderburgh County
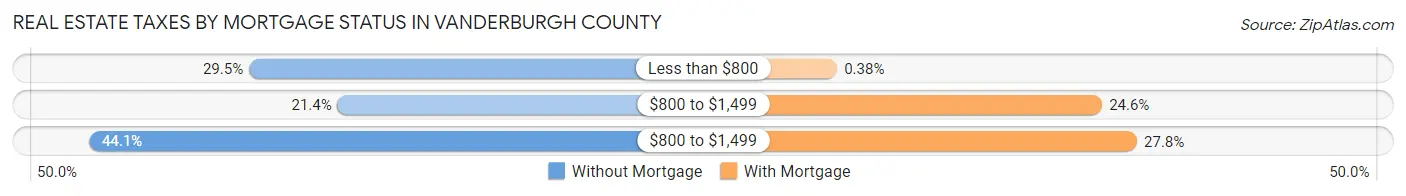
| Property Taxes | Without Mortgage | With Mortgage |
| Less than $800 | 5,582 (29.5%) | 118 (0.4%) |
| $800 to $1,499 | 4,052 (21.4%) | 7,589 (24.6%) |
| $800 to $1,499 | 8,345 (44.1%) | 8,573 (27.8%) |
| Total | 18,916 (100.0%) | 30,870 (100.0%) |
Health & Disability in Vanderburgh County
Health Insurance Coverage by Age in Vanderburgh County
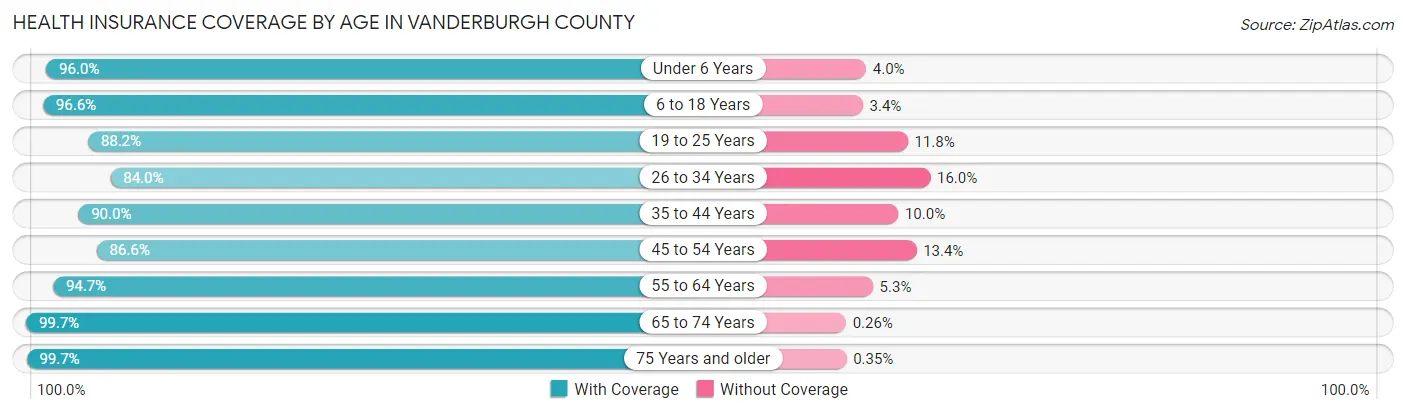
| Age Bracket | With Coverage | Without Coverage |
| Under 6 Years | 11,561 (96.0%) | 484 (4.0%) |
| 6 to 18 Years | 28,034 (96.6%) | 992 (3.4%) |
| 19 to 25 Years | 15,722 (88.2%) | 2,104 (11.8%) |
| 26 to 34 Years | 18,637 (84.0%) | 3,546 (16.0%) |
| 35 to 44 Years | 19,413 (90.0%) | 2,159 (10.0%) |
| 45 to 54 Years | 17,800 (86.6%) | 2,756 (13.4%) |
| 55 to 64 Years | 22,735 (94.7%) | 1,269 (5.3%) |
| 65 to 74 Years | 18,324 (99.7%) | 48 (0.3%) |
| 75 Years and older | 11,736 (99.7%) | 41 (0.4%) |
| Total | 163,962 (92.4%) | 13,399 (7.5%) |
Health Insurance Coverage by Citizenship Status in Vanderburgh County
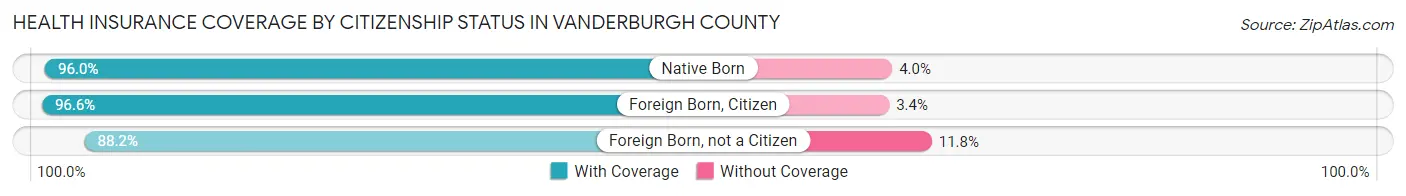
| Citizenship Status | With Coverage | Without Coverage |
| Native Born | 11,561 (96.0%) | 484 (4.0%) |
| Foreign Born, Citizen | 28,034 (96.6%) | 992 (3.4%) |
| Foreign Born, not a Citizen | 15,722 (88.2%) | 2,104 (11.8%) |
Health Insurance Coverage by Household Income in Vanderburgh County
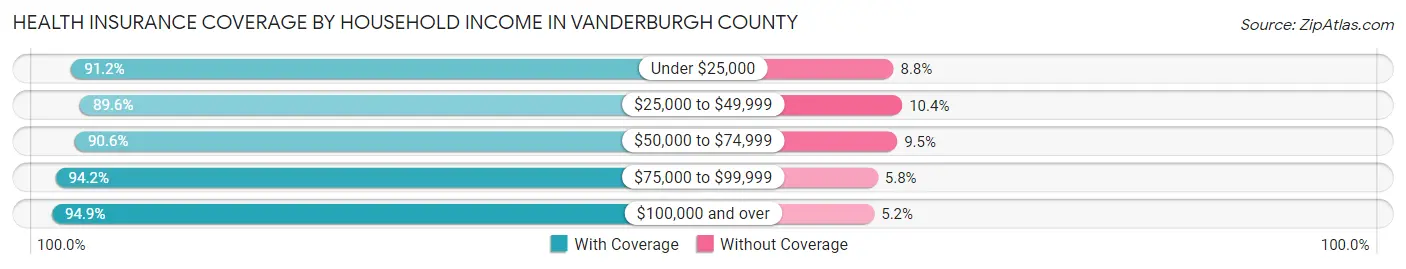
| Household Income | With Coverage | Without Coverage |
| Under $25,000 | 21,414 (91.2%) | 2,056 (8.8%) |
| $25,000 to $49,999 | 31,782 (89.6%) | 3,684 (10.4%) |
| $50,000 to $74,999 | 30,182 (90.5%) | 3,151 (9.5%) |
| $75,000 to $99,999 | 22,878 (94.2%) | 1,414 (5.8%) |
| $100,000 and over | 53,977 (94.9%) | 2,932 (5.1%) |
Public vs Private Health Insurance Coverage by Age in Vanderburgh County
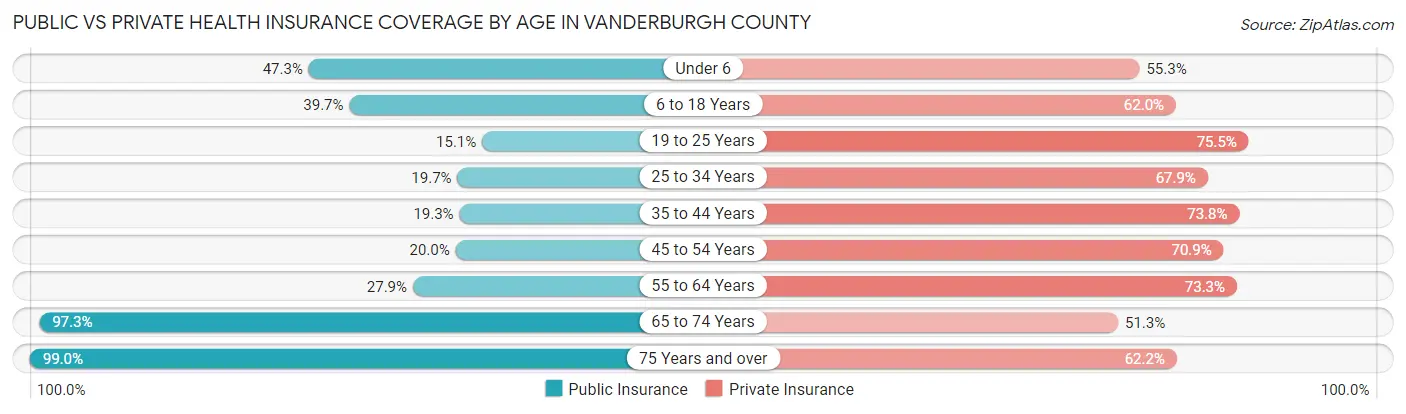
| Age Bracket | Public Insurance | Private Insurance |
| Under 6 | 5,693 (47.3%) | 6,656 (55.3%) |
| 6 to 18 Years | 11,528 (39.7%) | 17,999 (62.0%) |
| 19 to 25 Years | 2,689 (15.1%) | 13,463 (75.5%) |
| 25 to 34 Years | 4,362 (19.7%) | 15,065 (67.9%) |
| 35 to 44 Years | 4,161 (19.3%) | 15,918 (73.8%) |
| 45 to 54 Years | 4,114 (20.0%) | 14,563 (70.9%) |
| 55 to 64 Years | 6,704 (27.9%) | 17,600 (73.3%) |
| 65 to 74 Years | 17,872 (97.3%) | 9,422 (51.3%) |
| 75 Years and over | 11,663 (99.0%) | 7,321 (62.2%) |
| Total | 68,786 (38.8%) | 118,007 (66.5%) |
Disability Status by Sex by Age in Vanderburgh County
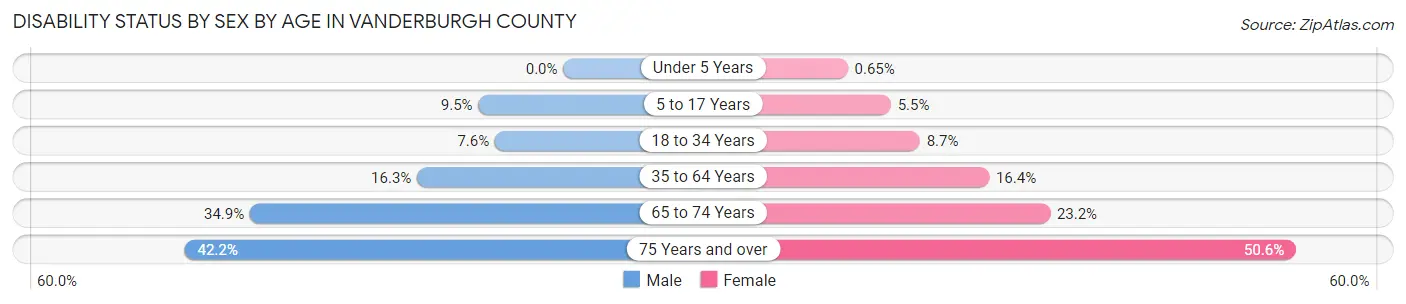
| Age Bracket | Male | Female |
| Under 5 Years | 0 (0.0%) | 32 (0.6%) |
| 5 to 17 Years | 1,360 (9.5%) | 758 (5.4%) |
| 18 to 34 Years | 1,598 (7.6%) | 1,852 (8.7%) |
| 35 to 64 Years | 5,321 (16.3%) | 5,483 (16.4%) |
| 65 to 74 Years | 3,035 (34.9%) | 2,242 (23.2%) |
| 75 Years and over | 1,896 (42.2%) | 3,684 (50.6%) |
Disability Class by Sex by Age in Vanderburgh County
Disability Class: Hearing Difficulty
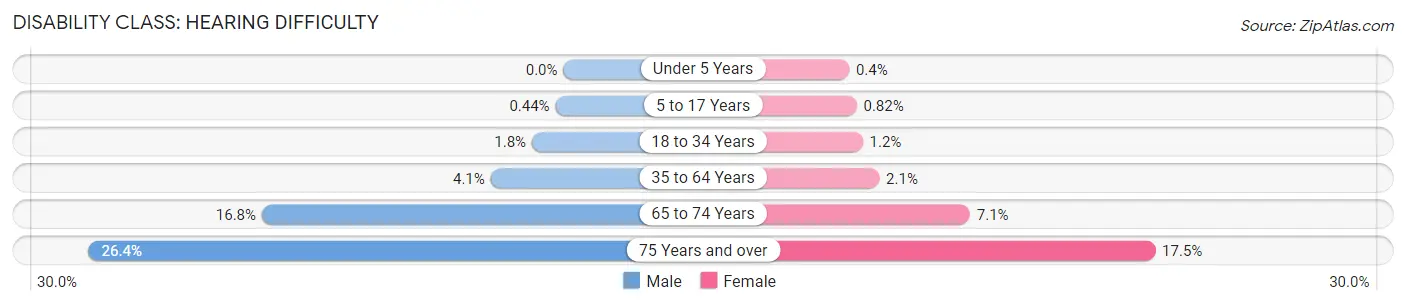
| Age Bracket | Male | Female |
| Under 5 Years | 0 (0.0%) | 20 (0.4%) |
| 5 to 17 Years | 63 (0.4%) | 114 (0.8%) |
| 18 to 34 Years | 367 (1.8%) | 248 (1.2%) |
| 35 to 64 Years | 1,323 (4.1%) | 696 (2.1%) |
| 65 to 74 Years | 1,461 (16.8%) | 690 (7.1%) |
| 75 Years and over | 1,188 (26.4%) | 1,271 (17.4%) |
Disability Class: Vision Difficulty
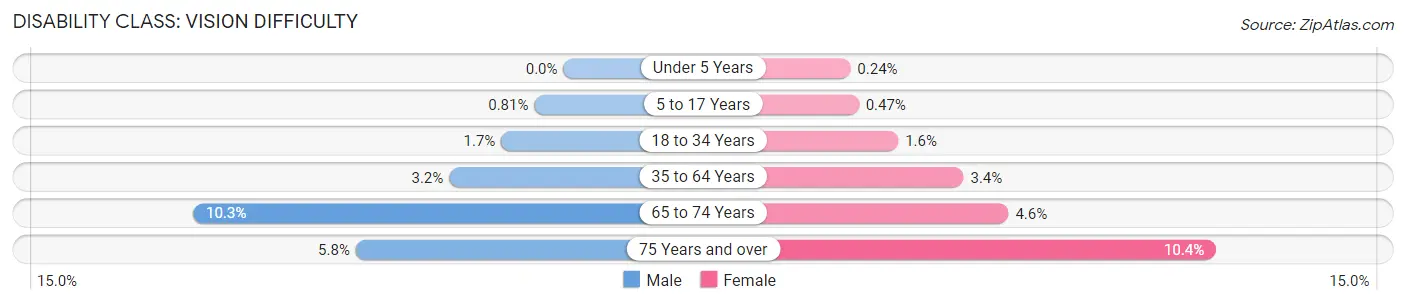
| Age Bracket | Male | Female |
| Under 5 Years | 0 (0.0%) | 12 (0.2%) |
| 5 to 17 Years | 117 (0.8%) | 65 (0.5%) |
| 18 to 34 Years | 363 (1.7%) | 335 (1.6%) |
| 35 to 64 Years | 1,040 (3.2%) | 1,133 (3.4%) |
| 65 to 74 Years | 897 (10.3%) | 449 (4.6%) |
| 75 Years and over | 260 (5.8%) | 759 (10.4%) |
Disability Class: Cognitive Difficulty
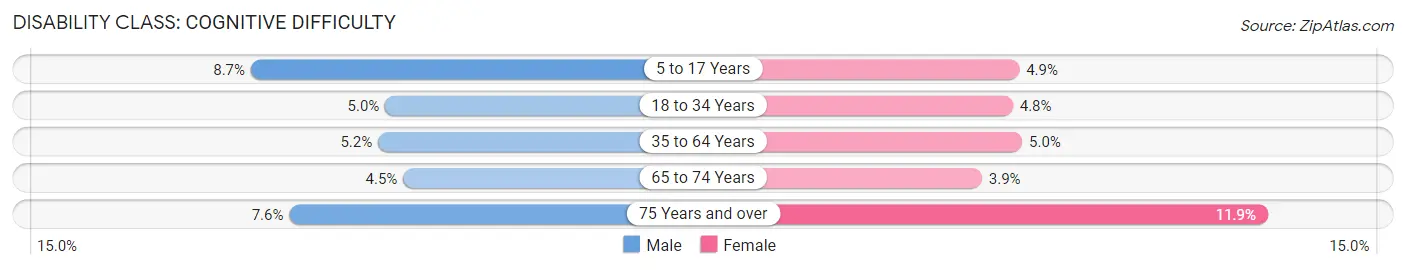
| Age Bracket | Male | Female |
| 5 to 17 Years | 1,251 (8.7%) | 686 (4.9%) |
| 18 to 34 Years | 1,041 (5.0%) | 1,017 (4.8%) |
| 35 to 64 Years | 1,688 (5.2%) | 1,679 (5.0%) |
| 65 to 74 Years | 388 (4.5%) | 377 (3.9%) |
| 75 Years and over | 343 (7.6%) | 864 (11.9%) |
Disability Class: Ambulatory Difficulty
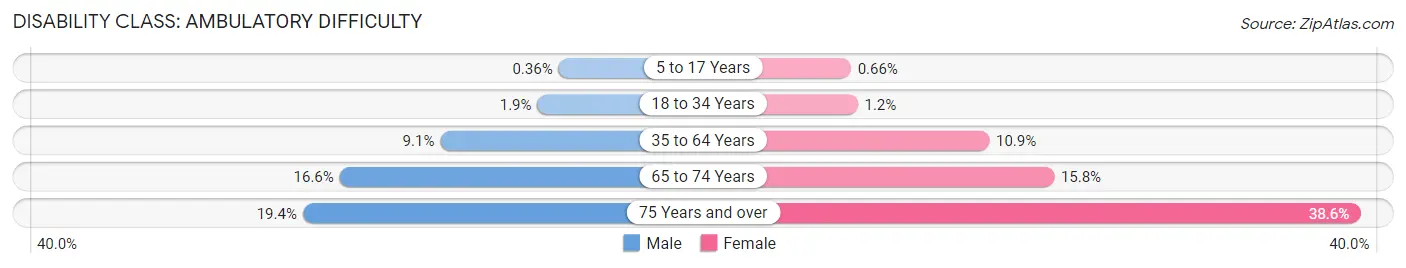
| Age Bracket | Male | Female |
| 5 to 17 Years | 52 (0.4%) | 92 (0.7%) |
| 18 to 34 Years | 405 (1.9%) | 250 (1.2%) |
| 35 to 64 Years | 2,987 (9.1%) | 3,656 (10.9%) |
| 65 to 74 Years | 1,445 (16.6%) | 1,523 (15.8%) |
| 75 Years and over | 870 (19.4%) | 2,807 (38.6%) |
Disability Class: Self-Care Difficulty
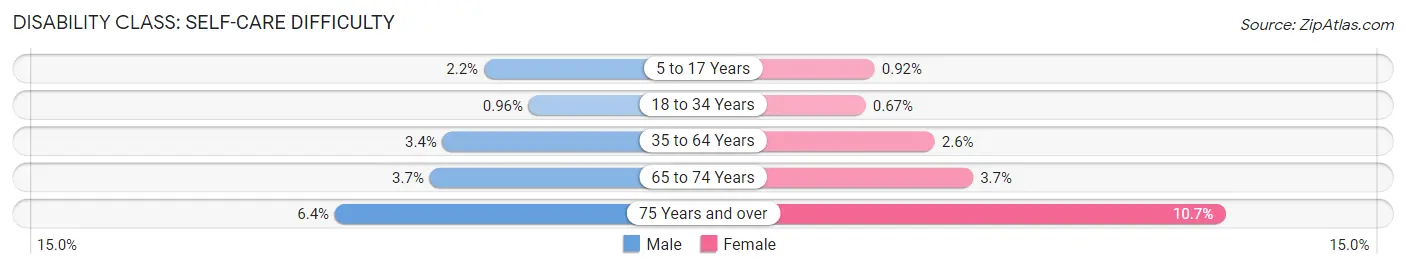
| Age Bracket | Male | Female |
| 5 to 17 Years | 318 (2.2%) | 128 (0.9%) |
| 18 to 34 Years | 202 (1.0%) | 144 (0.7%) |
| 35 to 64 Years | 1,099 (3.4%) | 867 (2.6%) |
| 65 to 74 Years | 324 (3.7%) | 354 (3.7%) |
| 75 Years and over | 286 (6.4%) | 777 (10.7%) |
Technology Access in Vanderburgh County
Computing Device Access in Vanderburgh County
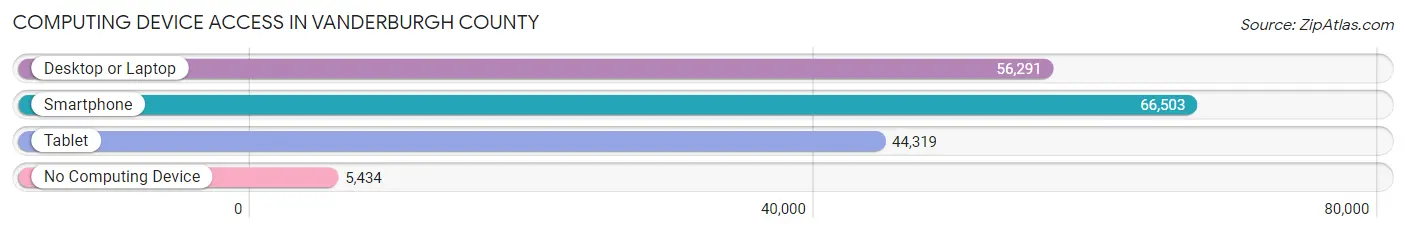
| Device Type | # Households | % Households |
| Desktop or Laptop | 56,291 | 73.2% |
| Smartphone | 66,503 | 86.5% |
| Tablet | 44,319 | 57.7% |
| No Computing Device | 5,434 | 7.1% |
| Total | 76,857 | 100.0% |
Internet Access in Vanderburgh County
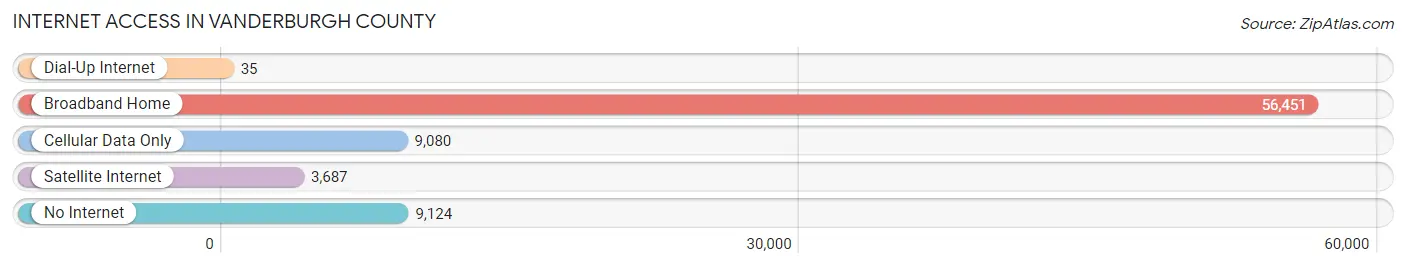
| Internet Type | # Households | % Households |
| Dial-Up Internet | 35 | 0.1% |
| Broadband Home | 56,451 | 73.5% |
| Cellular Data Only | 9,080 | 11.8% |
| Satellite Internet | 3,687 | 4.8% |
| No Internet | 9,124 | 11.9% |
| Total | 76,857 | 100.0% |
Vanderburgh County Summary
Vanderburgh County is located in the southwestern corner of Indiana, and is part of the Evansville Metropolitan Statistical Area. It is bordered by Posey County to the west, Warrick County to the north, Gibson County to the east, and Henderson County, Kentucky to the south. The county seat is Evansville, which is the third largest city in Indiana. Vanderburgh County was established in 1818 and named after Captain Henry Vanderburgh, an officer in the American Revolutionary War.
Geography
Vanderburgh County covers an area of approximately 545 square miles, with a population of 179,703 as of the 2010 census. The terrain is mostly flat, with some rolling hills in the northern part of the county. The Wabash River forms the county’s eastern border, and the Ohio River forms the southern border. The county is home to several parks, including Angel Mounds State Historic Site, Mesker Park Zoo and Botanic Garden, and Wesselman Woods Nature Preserve.
Economy
Vanderburgh County’s economy is largely based on manufacturing, healthcare, and retail. The county is home to several major employers, including Deaconess Health System, Berry Plastics, and Toyota Motor Manufacturing. The county also has a thriving tourism industry, with attractions such as the Evansville Museum of Arts, History, and Science, the Evansville African American Museum, and the Evansville Zoo.
Demographics
As of the 2010 census, Vanderburgh County had a population of 179,703, with a population density of 327.7 people per square mile. The racial makeup of the county was 87.2% White, 8.7% African American, 0.5% Native American, 1.3% Asian, 0.1% Pacific Islander, 1.2% from other races, and 1.1% from two or more races. Hispanic or Latino of any race were 3.2% of the population.
The median income for a household in the county was $41,945, and the median income for a family was $51,919. The per capita income for the county was $22,845. About 11.2% of families and 14.7% of the population were below the poverty line, including 20.2% of those under age 18 and 8.2% of those age 65 or over.
Conclusion
Vanderburgh County is a vibrant and diverse county located in the southwestern corner of Indiana. It is home to a thriving economy based on manufacturing, healthcare, and retail, as well as a thriving tourism industry. The county has a population of 179,703, with a median income of $41,945 for households and $51,919 for families. The county is home to several parks and attractions, making it a great place to live, work, and visit.
Common Questions
What is the Total Population of Vanderburgh County?
Total Population of Vanderburgh County is 179,900.
What is the Total Male Population of Vanderburgh County?
Total Male Population of Vanderburgh County is 88,005.
What is the Total Female Population of Vanderburgh County?
Total Female Population of Vanderburgh County is 91,895.
What is the Ratio of Males per 100 Females in Vanderburgh County?
There are 95.77 Males per 100 Females in Vanderburgh County.
What is the Ratio of Females per 100 Males in Vanderburgh County?
There are 104.42 Females per 100 Males in Vanderburgh County.
What is the Median Population Age in Vanderburgh County?
Median Population Age in Vanderburgh County is 38.9 Years.
What is the Average Family Size in Vanderburgh County
Average Family Size in Vanderburgh County is 2.9 People.
What is the Average Household Size in Vanderburgh County
Average Household Size in Vanderburgh County is 2.3 People.
What is Per Capita Income in Vanderburgh County?
Per Capita income in Vanderburgh County is $33,614.
What is the Median Family Income in Vanderburgh County?
Median Family Income in Vanderburgh County is $74,561.
What is the Median Household income in Vanderburgh County?
Median Household Income in Vanderburgh County is $58,839.
What is Income or Wage Gap in Vanderburgh County?
Income or Wage Gap in Vanderburgh County is 32.6%.
Women in Vanderburgh County earn 67.4 cents for every dollar earned by a man.
What is Family Income Deficit in Vanderburgh County?
Family Income Deficit in Vanderburgh County is $11,215.
Families that are below poverty line in Vanderburgh County earn $11,215 less on average than the poverty threshold level.
What is Inequality or Gini Index in Vanderburgh County?
Inequality or Gini Index in Vanderburgh County is 0.45.
How Large is the Labor Force in Vanderburgh County?
There are 93,704 People in the Labor Forcein in Vanderburgh County.
What is the Percentage of People in the Labor Force in Vanderburgh County?
64.4% of People are in the Labor Force in Vanderburgh County.
What is the Unemployment Rate in Vanderburgh County?
Unemployment Rate in Vanderburgh County is 4.7%.