Union County, IN
Union County Map

Union County Overview
7,041
TOTAL POPULATION
3,487
MALE POPULATION
3,554
FEMALE POPULATION
98.11
MALES / 100 FEMALES
101.92
FEMALES / 100 MALES
44.5
MEDIAN AGE
2.8
AVG FAMILY SIZE
2.4
AVG HOUSEHOLD SIZE
$33,377
PER CAPITA INCOME
$89,495
AVG FAMILY INCOME
$68,514
AVG HOUSEHOLD INCOME
22.1%
WAGE / INCOME GAP [ % ]
77.9¢/ $1
WAGE / INCOME GAP [ $ ]
0.38
INEQUALITY / GINI INDEX
3,762
LABOR FORCE [ PEOPLE ]
65.4%
PERCENT IN LABOR FORCE
5.1%
UNEMPLOYMENT RATE
Race in Union County
The most populous races in Union County are White / Caucasian (6,756 | 96.0%), Two or more Races (189 | 2.7%), and Hispanic or Latino (160 | 2.3%).

| Race | # Population | % Population |
| Asian | 48 | 0.7% |
| Black / African American | 43 | 0.6% |
| Hawaiian / Pacific | 0 | 0.0% |
| Hispanic or Latino | 160 | 2.3% |
| Native / Alaskan | 0 | 0.0% |
| White / Caucasian | 6,756 | 96.0% |
| Two or more Races | 189 | 2.7% |
| Some other Race | 5 | 0.1% |
| Total | 7,041 | 100.0% |
Ancestry in Union County
The most populous ancestries reported in Union County are German (1,316 | 18.7%), English (821 | 11.7%), American (707 | 10.0%), Irish (626 | 8.9%), and Dutch (278 | 4.0%), together accounting for 53.2% of all Union County residents.

| Ancestry | # Population | % Population |
| American | 707 | 10.0% |
| Bhutanese | 5 | 0.1% |
| Blackfeet | 15 | 0.2% |
| British | 4 | 0.1% |
| Burmese | 10 | 0.1% |
| Central American | 17 | 0.2% |
| Cherokee | 55 | 0.8% |
| Costa Rican | 17 | 0.2% |
| Dutch | 278 | 4.0% |
| Eastern European | 3 | 0.0% |
| English | 821 | 11.7% |
| European | 132 | 1.9% |
| Finnish | 9 | 0.1% |
| French | 108 | 1.5% |
| French Canadian | 4 | 0.1% |
| German | 1,316 | 18.7% |
| Greek | 3 | 0.0% |
| Hungarian | 38 | 0.5% |
| Indian (Asian) | 24 | 0.3% |
| Irish | 626 | 8.9% |
| Iroquois | 69 | 1.0% |
| Italian | 152 | 2.2% |
| Laotian | 3 | 0.0% |
| Lithuanian | 15 | 0.2% |
| Mexican | 21 | 0.3% |
| Northern European | 2 | 0.0% |
| Norwegian | 67 | 0.9% |
| Polish | 30 | 0.4% |
| Puerto Rican | 85 | 1.2% |
| Russian | 2 | 0.0% |
| Scandinavian | 22 | 0.3% |
| Scotch-Irish | 59 | 0.8% |
| Scottish | 173 | 2.5% |
| South American | 14 | 0.2% |
| Sri Lankan | 2 | 0.0% |
| Swedish | 33 | 0.5% |
| Thai | 9 | 0.1% |
| Venezuelan | 14 | 0.2% |
| Welsh | 39 | 0.5% | View All 39 Rows |
Immigrants in Union County
The most numerous immigrant groups reported in Union County came from Asia (42 | 0.6%), Latin America (36 | 0.5%), China (28 | 0.4%), Eastern Asia (28 | 0.4%), and Central America (22 | 0.3%), together accounting for 2.2% of all Union County residents.

| Immigration Origin | # Population | % Population |
| Asia | 42 | 0.6% |
| Central America | 22 | 0.3% |
| China | 28 | 0.4% |
| Costa Rica | 17 | 0.2% |
| Eastern Asia | 28 | 0.4% |
| Hong Kong | 1 | 0.0% |
| India | 9 | 0.1% |
| Indonesia | 3 | 0.0% |
| Latin America | 36 | 0.5% |
| Mexico | 5 | 0.1% |
| South America | 14 | 0.2% |
| South Central Asia | 9 | 0.1% |
| South Eastern Asia | 5 | 0.1% |
| Venezuela | 14 | 0.2% |
| Vietnam | 2 | 0.0% | View All 15 Rows |
Sex and Age in Union County
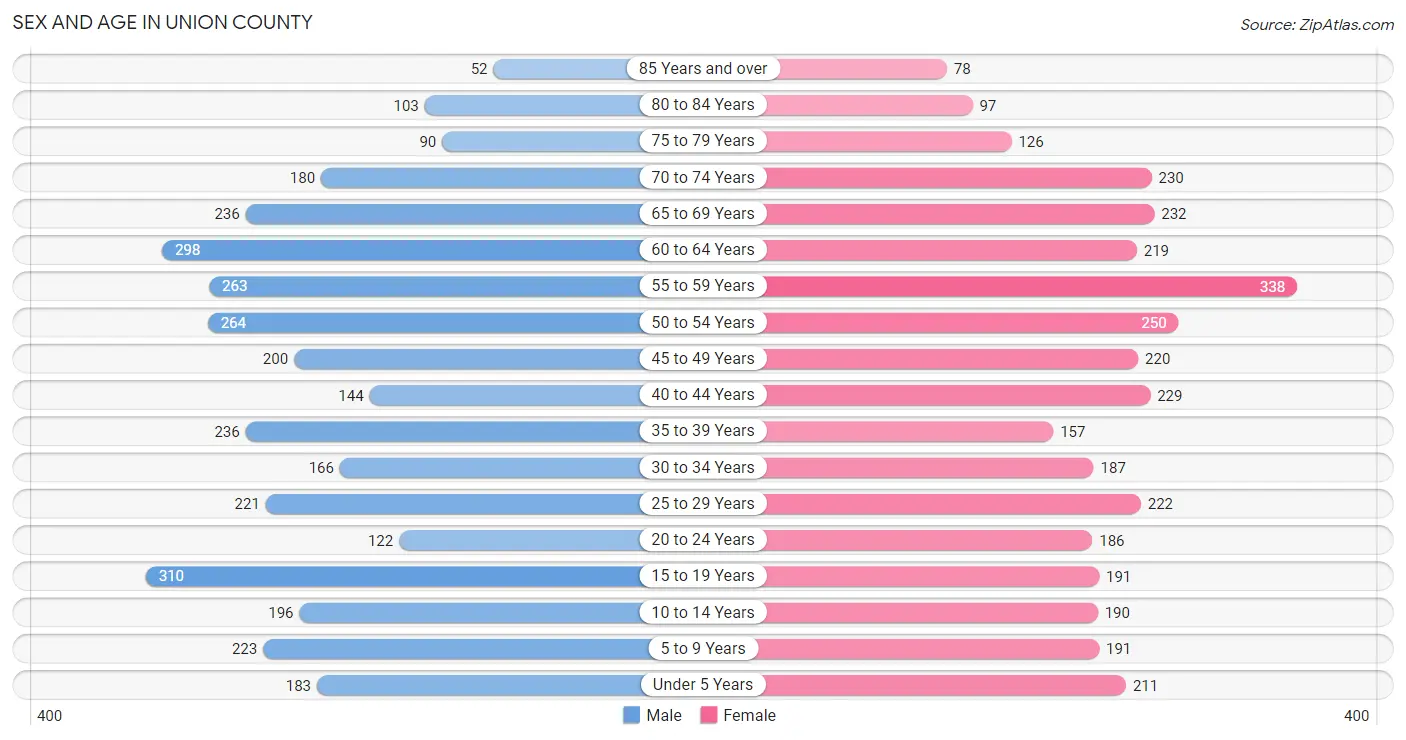
Sex and Age in Union County
The most populous age groups in Union County are 15 to 19 Years (310 | 8.9%) for men and 55 to 59 Years (338 | 9.5%) for women.
| Age Bracket | Male | Female |
| Under 5 Years | 183 (5.2%) | 211 (5.9%) |
| 5 to 9 Years | 223 (6.4%) | 191 (5.4%) |
| 10 to 14 Years | 196 (5.6%) | 190 (5.3%) |
| 15 to 19 Years | 310 (8.9%) | 191 (5.4%) |
| 20 to 24 Years | 122 (3.5%) | 186 (5.2%) |
| 25 to 29 Years | 221 (6.3%) | 222 (6.2%) |
| 30 to 34 Years | 166 (4.8%) | 187 (5.3%) |
| 35 to 39 Years | 236 (6.8%) | 157 (4.4%) |
| 40 to 44 Years | 144 (4.1%) | 229 (6.4%) |
| 45 to 49 Years | 200 (5.7%) | 220 (6.2%) |
| 50 to 54 Years | 264 (7.6%) | 250 (7.0%) |
| 55 to 59 Years | 263 (7.5%) | 338 (9.5%) |
| 60 to 64 Years | 298 (8.6%) | 219 (6.2%) |
| 65 to 69 Years | 236 (6.8%) | 232 (6.5%) |
| 70 to 74 Years | 180 (5.2%) | 230 (6.5%) |
| 75 to 79 Years | 90 (2.6%) | 126 (3.5%) |
| 80 to 84 Years | 103 (2.9%) | 97 (2.7%) |
| 85 Years and over | 52 (1.5%) | 78 (2.2%) |
| Total | 3,487 (100.0%) | 3,554 (100.0%) |
Families and Households in Union County
Median Family Size in Union County
The median family size in Union County is 2.81 persons per family, with married-couple families (1,721 | 81.1%) accounting for the largest median family size of 2.9 persons per family. On the other hand, single female/mother families (227 | 10.7%) represent the smallest median family size with 2.41 persons per family.

| Family Type | # Families | Family Size |
| Married-Couple | 1,721 (81.1%) | 2.90 |
| Single Male/Father | 174 (8.2%) | 2.45 |
| Single Female/Mother | 227 (10.7%) | 2.41 |
| Total Families | 2,122 (100.0%) | 2.81 |
Median Household Size in Union County
The median household size in Union County is 2.40 persons per household, with married-couple households (1,721 | 59.1%) accounting for the largest median household size of 2.94 persons per household. non-family households (790 | 27.1%) represent the smallest median household size with 1.11 persons per household.

| Household Type | # Households | Household Size |
| Married-Couple | 1,721 (59.1%) | 2.94 |
| Single Male/Father | 174 (6.0%) | 2.80 |
| Single Female/Mother | 227 (7.8%) | 2.45 |
| Non-family | 790 (27.1%) | 1.11 |
| Total Households | 2,912 (100.0%) | 2.40 |
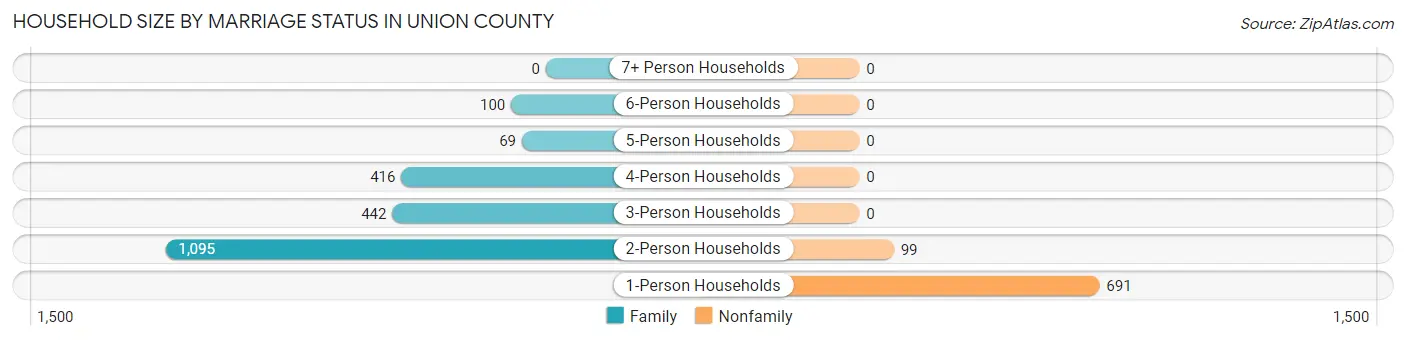
Household Size by Marriage Status in Union County
Out of a total of 2,912 households in Union County, 2,122 (72.9%) are family households, while 790 (27.1%) are nonfamily households. The most numerous type of family households are 2-person households, comprising 1,095, and the most common type of nonfamily households are 1-person households, comprising 691.
| Household Size | Family Households | Nonfamily Households |
| 1-Person Households | - | 691 (23.7%) |
| 2-Person Households | 1,095 (37.6%) | 99 (3.4%) |
| 3-Person Households | 442 (15.2%) | 0 (0.0%) |
| 4-Person Households | 416 (14.3%) | 0 (0.0%) |
| 5-Person Households | 69 (2.4%) | 0 (0.0%) |
| 6-Person Households | 100 (3.4%) | 0 (0.0%) |
| 7+ Person Households | 0 (0.0%) | 0 (0.0%) |
| Total | 2,122 (72.9%) | 790 (27.1%) |
Female Fertility in Union County
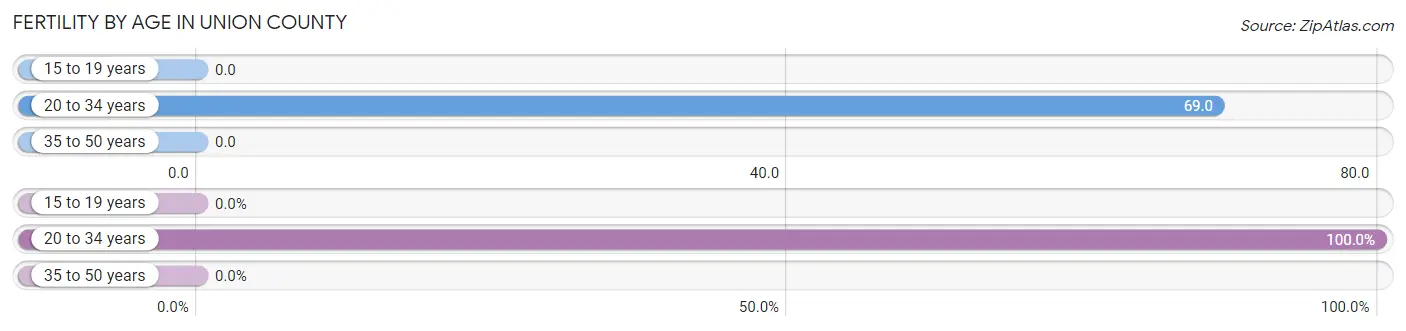
Fertility by Age in Union County
Average fertility rate in Union County is 28.0 births per 1,000 women. Women in the age bracket of 20 to 34 years have the highest fertility rate with 69.0 births per 1,000 women. Women in the age bracket of 20 to 34 years acount for 100.0% of all women with births.
| Age Bracket | Women with Births | Births / 1,000 Women |
| 15 to 19 years | 0 (0.0%) | 0.0 |
| 20 to 34 years | 41 (100.0%) | 69.0 |
| 35 to 50 years | 0 (0.0%) | 0.0 |
| Total | 41 (100.0%) | 28.0 |
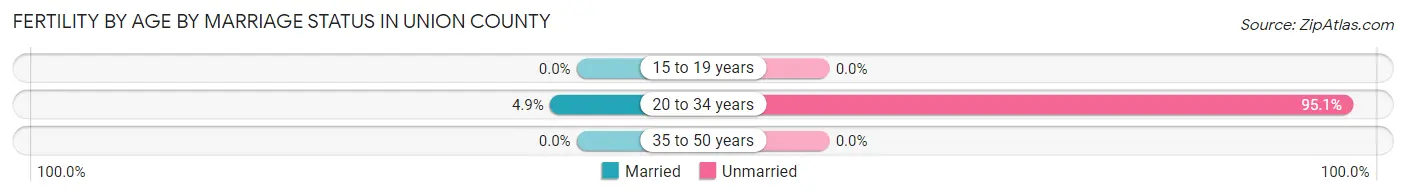
Fertility by Age by Marriage Status in Union County
4.9% of women with births (41) in Union County are married. The highest percentage of unmarried women with births falls into 20 to 34 years age bracket with 95.1% of them unmarried at the time of birth, while the lowest percentage of unmarried women with births belong to 20 to 34 years age bracket with 95.1% of them unmarried.
| Age Bracket | Married | Unmarried |
| 15 to 19 years | 0 (0.0%) | 0 (0.0%) |
| 20 to 34 years | 2 (4.9%) | 39 (95.1%) |
| 35 to 50 years | 0 (0.0%) | 0 (0.0%) |
| Total | 2 (4.9%) | 39 (95.1%) |
Fertility by Education in Union County

| Educational Attainment | Women with Births | Births / 1,000 Women |
| Less than High School | 0 (0.0%) | 0.0 |
| High School Diploma | 14 (34.2%) | 37.0 |
| College or Associate's Degree | 27 (65.8%) | 47.0 |
| Bachelor's Degree | 0 (0.0%) | 0.0 |
| Graduate Degree | 0 (0.0%) | 0.0 |
| Total | 41 (100.0%) | 28.0 |
Fertility by Education by Marriage Status in Union County
95.1% of women with births in Union County are unmarried. Women with the educational attainment of college or associate's degree are most likely to be married with 7.4% of them married at childbirth, while women with the educational attainment of high school diploma are least likely to be married with 100.0% of them unmarried at childbirth.
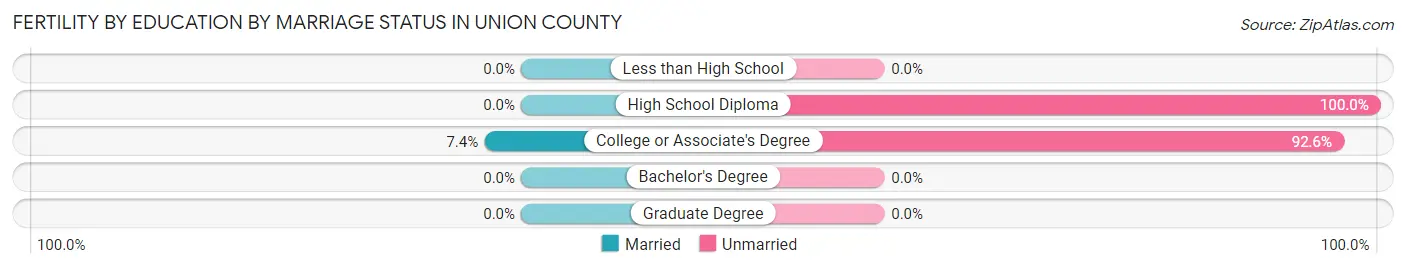
| Educational Attainment | Married | Unmarried |
| Less than High School | 0 (0.0%) | 0 (0.0%) |
| High School Diploma | 0 (0.0%) | 14 (100.0%) |
| College or Associate's Degree | 2 (7.4%) | 25 (92.6%) |
| Bachelor's Degree | 0 (0.0%) | 0 (0.0%) |
| Graduate Degree | 0 (0.0%) | 0 (0.0%) |
| Total | 2 (4.9%) | 39 (95.1%) |
Income in Union County
Income Overview in Union County
Per Capita Income in Union County is $33,377, while median incomes of families and households are $89,495 and $68,514 respectively.
| Characteristic | Number | Measure |
| Per Capita Income | 7,041 | $33,377 |
| Median Family Income | 2,122 | $89,495 |
| Mean Family Income | 2,122 | $98,257 |
| Median Household Income | 2,912 | $68,514 |
| Mean Household Income | 2,912 | $83,247 |
| Income Deficit | 2,122 | $0 |
| Wage / Income Gap (%) | 7,041 | 22.10% |
| Wage / Income Gap ($) | 7,041 | 77.90¢ per $1 |
| Gini / Inequality Index | 7,041 | 0.38 |
Earnings by Sex in Union County
Average Earnings in Union County are $38,012, $43,681 for men and $34,026 for women, a difference of 22.1%.
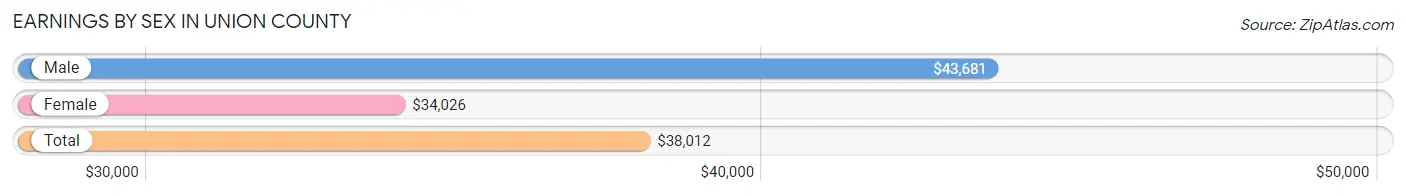
| Sex | Number | Average Earnings |
| Male | 2,093 (51.7%) | $43,681 |
| Female | 1,953 (48.3%) | $34,026 |
| Total | 4,046 (100.0%) | $38,012 |
Earnings by Sex by Income Bracket in Union County
The most common earnings brackets in Union County are $55,000 to $64,999 for men (244 | 11.7%) and $30,000 to $34,999 for women (225 | 11.5%).
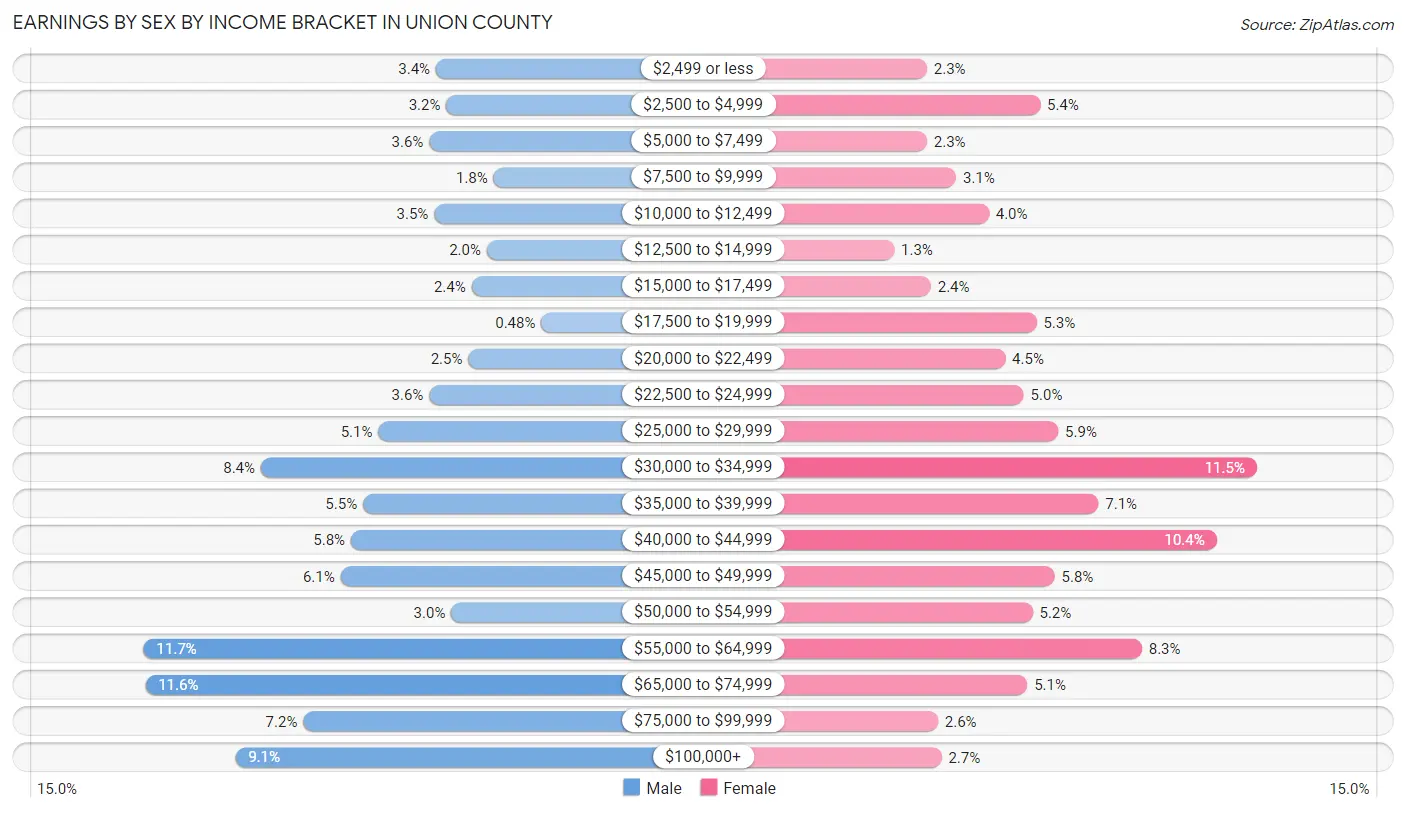
| Income | Male | Female |
| $2,499 or less | 72 (3.4%) | 44 (2.2%) |
| $2,500 to $4,999 | 66 (3.2%) | 106 (5.4%) |
| $5,000 to $7,499 | 76 (3.6%) | 44 (2.2%) |
| $7,500 to $9,999 | 38 (1.8%) | 60 (3.1%) |
| $10,000 to $12,499 | 73 (3.5%) | 78 (4.0%) |
| $12,500 to $14,999 | 42 (2.0%) | 26 (1.3%) |
| $15,000 to $17,499 | 51 (2.4%) | 46 (2.4%) |
| $17,500 to $19,999 | 10 (0.5%) | 104 (5.3%) |
| $20,000 to $22,499 | 53 (2.5%) | 87 (4.4%) |
| $22,500 to $24,999 | 76 (3.6%) | 97 (5.0%) |
| $25,000 to $29,999 | 106 (5.1%) | 116 (5.9%) |
| $30,000 to $34,999 | 175 (8.4%) | 225 (11.5%) |
| $35,000 to $39,999 | 115 (5.5%) | 138 (7.1%) |
| $40,000 to $44,999 | 122 (5.8%) | 203 (10.4%) |
| $45,000 to $49,999 | 128 (6.1%) | 114 (5.8%) |
| $50,000 to $54,999 | 63 (3.0%) | 102 (5.2%) |
| $55,000 to $64,999 | 244 (11.7%) | 162 (8.3%) |
| $65,000 to $74,999 | 243 (11.6%) | 99 (5.1%) |
| $75,000 to $99,999 | 150 (7.2%) | 50 (2.6%) |
| $100,000+ | 190 (9.1%) | 52 (2.7%) |
| Total | 2,093 (100.0%) | 1,953 (100.0%) |
Earnings by Sex by Educational Attainment in Union County
Average earnings in Union County are $48,472 for men and $37,388 for women, a difference of 22.9%. Men with an educational attainment of graduate degree enjoy the highest average annual earnings of $68,882, while those with high school diploma education earn the least with $45,175. Women with an educational attainment of graduate degree earn the most with the average annual earnings of $56,169, while those with less than high school education have the smallest earnings of $27,232.
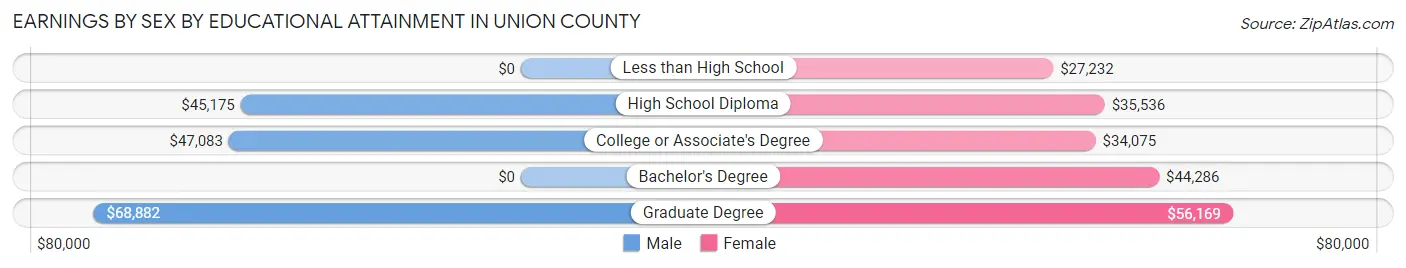
| Educational Attainment | Male Income | Female Income |
| Less than High School | - | - |
| High School Diploma | $45,175 | $35,536 |
| College or Associate's Degree | $47,083 | $34,075 |
| Bachelor's Degree | - | - |
| Graduate Degree | $68,882 | $56,169 |
| Total | $48,472 | $37,388 |
Family Income in Union County
Family Income Brackets in Union County
According to the Union County family income data, there are 666 families falling into the $100,000 to $149,999 income range, which is the most common income bracket and makes up 31.4% of all families. Conversely, the $10,000 to $14,999 income bracket is the least frequent group with only 32 families (1.5%) belonging to this category.

| Income Bracket | # Families | % Families |
| Less than $10,000 | 64 | 3.0% |
| $10,000 to $14,999 | 32 | 1.5% |
| $15,000 to $24,999 | 34 | 1.6% |
| $25,000 to $34,999 | 98 | 4.6% |
| $35,000 to $49,999 | 197 | 9.3% |
| $50,000 to $74,999 | 429 | 20.2% |
| $75,000 to $99,999 | 395 | 18.6% |
| $100,000 to $149,999 | 666 | 31.4% |
| $150,000 to $199,999 | 104 | 4.9% |
| $200,000+ | 104 | 4.9% |
Family Income by Famaliy Size in Union County
4-person families (419 | 19.8%) account for the highest median family income in Union County with $117,462 per family, while 2-person families (1,149 | 54.1%) have the highest median income of $43,982 per family member.
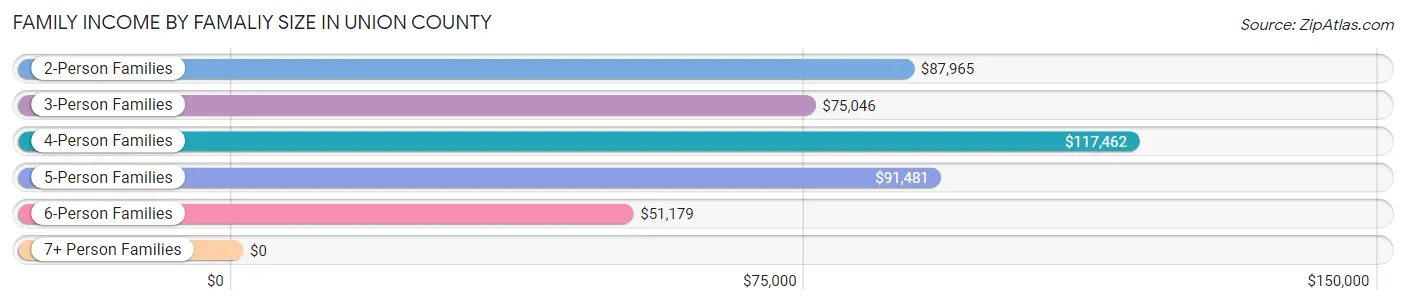
| Income Bracket | # Families | Median Income |
| 2-Person Families | 1,149 (54.1%) | $87,965 |
| 3-Person Families | 415 (19.6%) | $75,046 |
| 4-Person Families | 419 (19.8%) | $117,462 |
| 5-Person Families | 88 (4.2%) | $91,481 |
| 6-Person Families | 51 (2.4%) | $51,179 |
| 7+ Person Families | 0 (0.0%) | $0 |
| Total | 2,122 (100.0%) | $89,495 |
Family Income by Number of Earners in Union County
The median family income in Union County is $89,495, with families comprising 3+ earners (367) having the highest median family income of $140,655, while families with no earners (304) have the lowest median family income of $55,521, accounting for 17.3% and 14.3% of families, respectively.

| Number of Earners | # Families | Median Income |
| No Earners | 304 (14.3%) | $55,521 |
| 1 Earner | 557 (26.3%) | $60,380 |
| 2 Earners | 894 (42.1%) | $104,926 |
| 3+ Earners | 367 (17.3%) | $140,655 |
| Total | 2,122 (100.0%) | $89,495 |
Household Income in Union County
Household Income Brackets in Union County
With 699 households falling in the category, the $100,000 to $149,999 income range is the most frequent in Union County, accounting for 24.0% of all households. In contrast, only 87 households (3.0%) fall into the $10,000 to $14,999 income bracket, making it the least populous group.
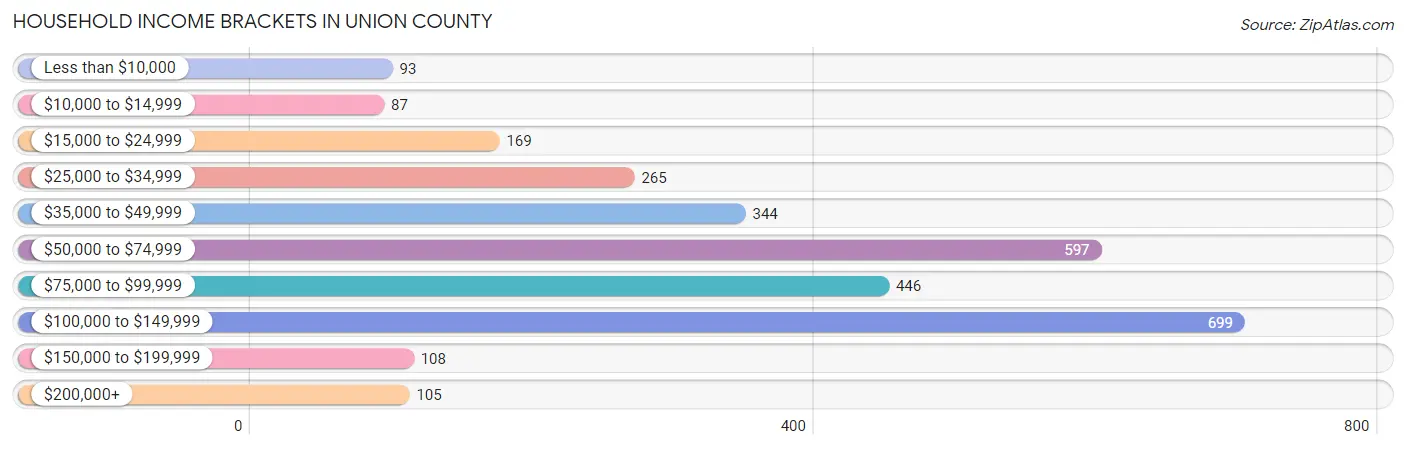
| Income Bracket | # Households | % Households |
| Less than $10,000 | 93 | 3.2% |
| $10,000 to $14,999 | 87 | 3.0% |
| $15,000 to $24,999 | 169 | 5.8% |
| $25,000 to $34,999 | 265 | 9.1% |
| $35,000 to $49,999 | 344 | 11.8% |
| $50,000 to $74,999 | 597 | 20.5% |
| $75,000 to $99,999 | 446 | 15.3% |
| $100,000 to $149,999 | 699 | 24.0% |
| $150,000 to $199,999 | 108 | 3.7% |
| $200,000+ | 105 | 3.6% |
Household Income by Householder Age in Union County
The median household income in Union County is $68,514, with the highest median household income of $105,726 found in the 45 to 64 years age bracket for the primary householder. A total of 1,120 households (38.5%) fall into this category. Meanwhile, the 15 to 24 years age bracket for the primary householder has the lowest median household income of $44,306, with 61 households (2.1%) in this group.
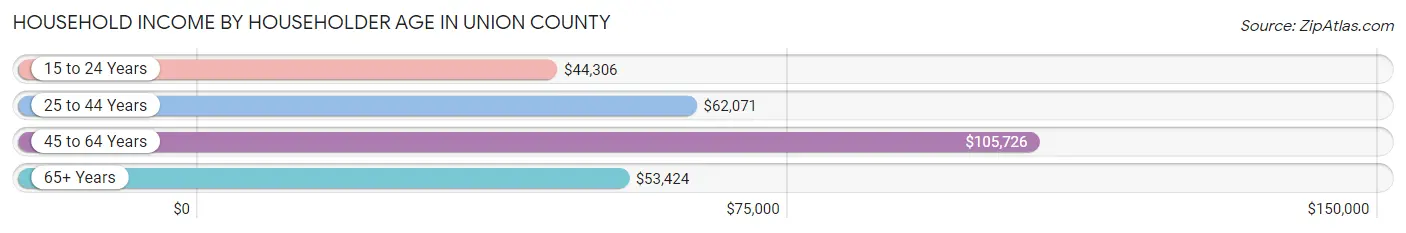
| Income Bracket | # Households | Median Income |
| 15 to 24 Years | 61 (2.1%) | $44,306 |
| 25 to 44 Years | 816 (28.0%) | $62,071 |
| 45 to 64 Years | 1,120 (38.5%) | $105,726 |
| 65+ Years | 915 (31.4%) | $53,424 |
| Total | 2,912 (100.0%) | $68,514 |
Poverty in Union County
Income Below Poverty by Sex and Age in Union County
With 4.4% poverty level for males and 7.6% for females among the residents of Union County, 16 and 17 year old males and 15 year old females are the most vulnerable to poverty, with 22 males (30.6%) and 19 females (63.3%) in their respective age groups living below the poverty level.

| Age Bracket | Male | Female |
| Under 5 Years | 15 (9.8%) | 4 (2.2%) |
| 5 Years | 20 (15.1%) | 0 (0.0%) |
| 6 to 11 Years | 19 (10.4%) | 1 (0.4%) |
| 12 to 14 Years | 0 (0.0%) | 0 (0.0%) |
| 15 Years | 0 (0.0%) | 19 (63.3%) |
| 16 and 17 Years | 22 (30.6%) | 0 (0.0%) |
| 18 to 24 Years | 0 (0.0%) | 37 (14.5%) |
| 25 to 34 Years | 18 (4.6%) | 49 (12.2%) |
| 35 to 44 Years | 2 (0.5%) | 24 (6.3%) |
| 45 to 54 Years | 16 (3.5%) | 20 (4.3%) |
| 55 to 64 Years | 25 (4.5%) | 39 (7.0%) |
| 65 to 74 Years | 0 (0.0%) | 40 (8.8%) |
| 75 Years and over | 14 (5.8%) | 34 (11.6%) |
| Total | 151 (4.4%) | 267 (7.6%) |
Income Above Poverty by Sex and Age in Union County
According to the poverty statistics in Union County, males aged 12 to 14 years and females aged 5 years are the age groups that are most secure financially, with 100.0% of males and 100.0% of females in these age groups living above the poverty line.
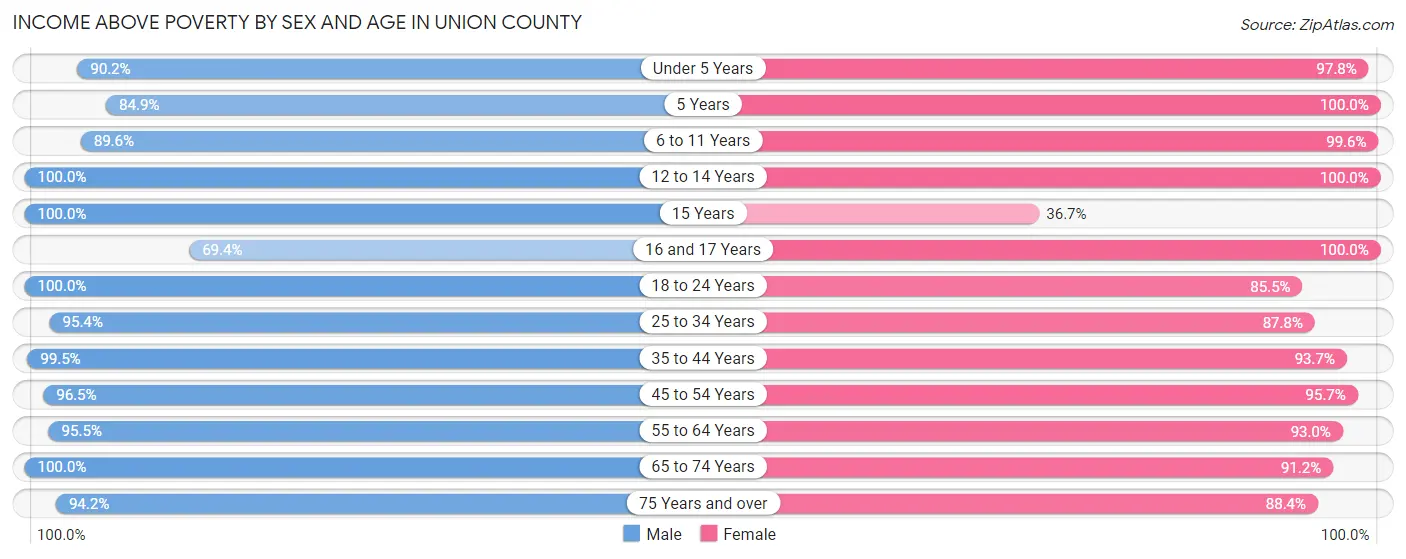
| Age Bracket | Male | Female |
| Under 5 Years | 138 (90.2%) | 176 (97.8%) |
| 5 Years | 112 (84.9%) | 7 (100.0%) |
| 6 to 11 Years | 163 (89.6%) | 230 (99.6%) |
| 12 to 14 Years | 105 (100.0%) | 143 (100.0%) |
| 15 Years | 65 (100.0%) | 11 (36.7%) |
| 16 and 17 Years | 50 (69.4%) | 92 (100.0%) |
| 18 to 24 Years | 287 (100.0%) | 218 (85.5%) |
| 25 to 34 Years | 369 (95.4%) | 352 (87.8%) |
| 35 to 44 Years | 377 (99.5%) | 358 (93.7%) |
| 45 to 54 Years | 445 (96.5%) | 450 (95.7%) |
| 55 to 64 Years | 534 (95.5%) | 516 (93.0%) |
| 65 to 74 Years | 411 (100.0%) | 413 (91.2%) |
| 75 Years and over | 226 (94.2%) | 258 (88.4%) |
| Total | 3,282 (95.6%) | 3,224 (92.3%) |
Income Below Poverty Among Married-Couple Families in Union County
The poverty statistics for married-couple families in Union County show that 3.1% or 54 of the total 1,721 families live below the poverty line. Families with no children have the highest poverty rate of 3.8%, comprising of 47 families. On the other hand, families with 1 or 2 children have the lowest poverty rate of 1.3%, which includes 5 families.

| Children | Above Poverty | Below Poverty |
| No Children | 1,202 (96.2%) | 47 (3.8%) |
| 1 or 2 Children | 395 (98.8%) | 5 (1.3%) |
| 3 or 4 Children | 70 (97.2%) | 2 (2.8%) |
| 5 or more Children | 0 (0.0%) | 0 (0.0%) |
| Total | 1,667 (96.9%) | 54 (3.1%) |
Income Below Poverty Among Single-Parent Households in Union County
According to the poverty data in Union County, 2.3% or 4 single-father households and 28.2% or 64 single-mother households are living below the poverty line. Among single-father households, those with 1 or 2 children have the highest poverty rate, with 4 households (5.6%) experiencing poverty. Likewise, among single-mother households, those with 1 or 2 children have the highest poverty rate, with 55 households (36.4%) falling below the poverty line.
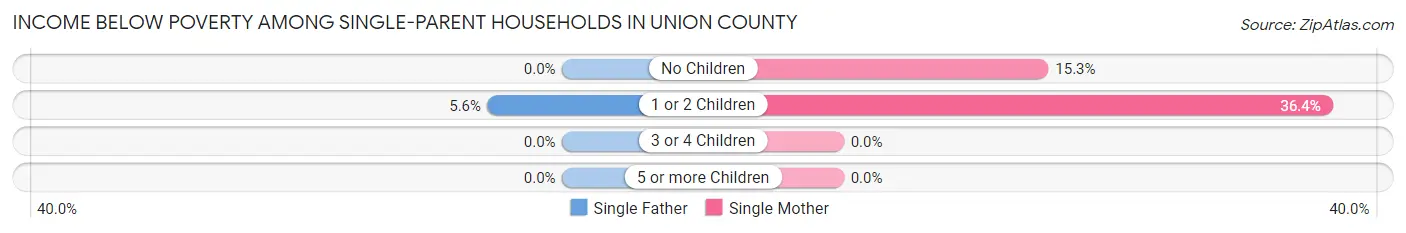
| Children | Single Father | Single Mother |
| No Children | 0 (0.0%) | 9 (15.2%) |
| 1 or 2 Children | 4 (5.6%) | 55 (36.4%) |
| 3 or 4 Children | 0 (0.0%) | 0 (0.0%) |
| 5 or more Children | 0 (0.0%) | 0 (0.0%) |
| Total | 4 (2.3%) | 64 (28.2%) |
Income Below Poverty Among Married-Couple vs Single-Parent Households in Union County
The poverty data for Union County shows that 54 of the married-couple family households (3.1%) and 68 of the single-parent households (17.0%) are living below the poverty level. Within the married-couple family households, those with no children have the highest poverty rate, with 47 households (3.8%) falling below the poverty line. Among the single-parent households, those with 1 or 2 children have the highest poverty rate, with 59 household (26.5%) living below poverty.
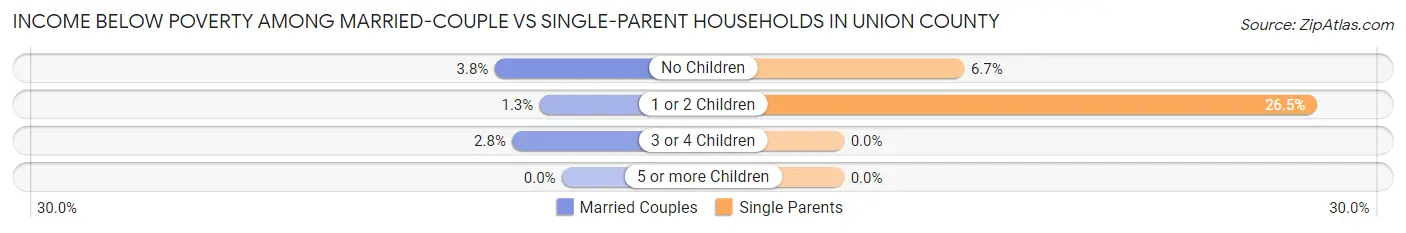
| Children | Married-Couple Families | Single-Parent Households |
| No Children | 47 (3.8%) | 9 (6.7%) |
| 1 or 2 Children | 5 (1.3%) | 59 (26.5%) |
| 3 or 4 Children | 2 (2.8%) | 0 (0.0%) |
| 5 or more Children | 0 (0.0%) | 0 (0.0%) |
| Total | 54 (3.1%) | 68 (17.0%) |
Employment Characteristics in Union County
Employment by Class of Employer in Union County
Among the 3,533 employed individuals in Union County, private company employees (2,413 | 68.3%), not-for-profit organizations (316 | 8.9%), and state government employees (240 | 6.8%) make up the most common classes of employment.

| Employer Class | # Employees | % Employees |
| Private Company Employees | 2,413 | 68.3% |
| Self-Employed (Incorporated) | 151 | 4.3% |
| Self-Employed (Not Incorporated) | 201 | 5.7% |
| Not-for-profit Organizations | 316 | 8.9% |
| Local Government Employees | 192 | 5.4% |
| State Government Employees | 240 | 6.8% |
| Federal Government Employees | 8 | 0.2% |
| Unpaid Family Workers | 12 | 0.3% |
| Total | 3,533 | 100.0% |
Employment Status by Age in Union County
According to the labor force statistics for Union County, out of the total population over 16 years of age (5,752), 65.4% or 3,762 individuals are in the labor force, with 5.1% or 192 of them unemployed. The age group with the highest labor force participation rate is 25 to 29 years, with 95.3% or 422 individuals in the labor force. Within the labor force, the 16 to 19 years age range has the highest percentage of unemployed individuals, with 36.8% or 89 of them being unemployed.
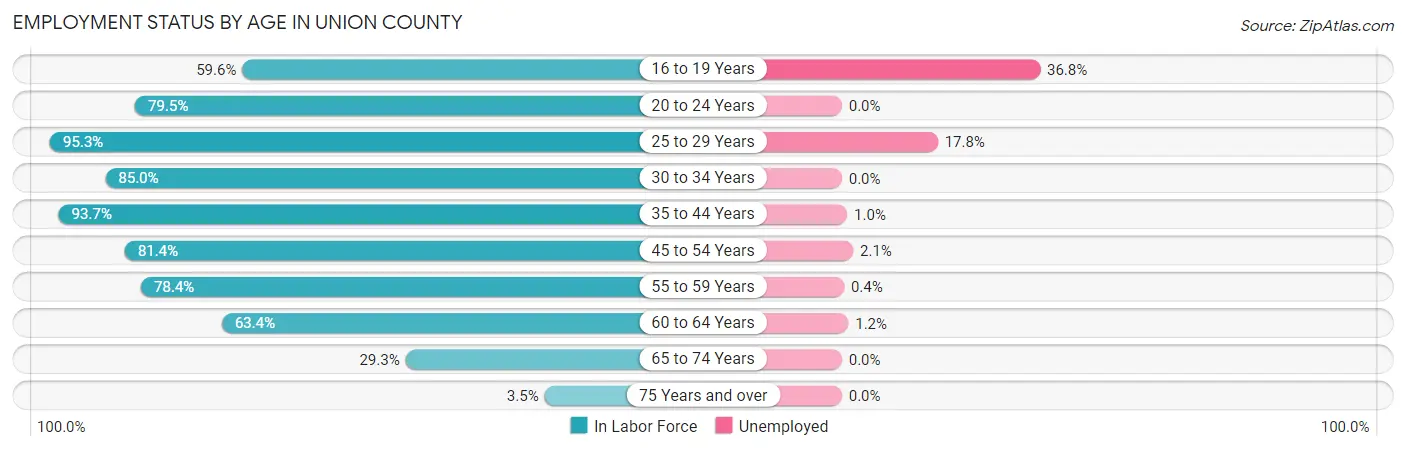
| Age Bracket | In Labor Force | Unemployed |
| 16 to 19 Years | 242 (59.6%) | 89 (36.8%) |
| 20 to 24 Years | 245 (79.5%) | 0 (0.0%) |
| 25 to 29 Years | 422 (95.3%) | 75 (17.8%) |
| 30 to 34 Years | 300 (85.0%) | 0 (0.0%) |
| 35 to 44 Years | 718 (93.7%) | 7 (1.0%) |
| 45 to 54 Years | 760 (81.4%) | 16 (2.1%) |
| 55 to 59 Years | 471 (78.4%) | 2 (0.4%) |
| 60 to 64 Years | 328 (63.4%) | 4 (1.2%) |
| 65 to 74 Years | 257 (29.3%) | 0 (0.0%) |
| 75 Years and over | 19 (3.5%) | 0 (0.0%) |
| Total | 3,762 (65.4%) | 192 (5.1%) |
Employment Status by Educational Attainment in Union County
According to labor force statistics for Union County, 83.0% of individuals (3,000) out of the total population between 25 and 64 years of age (3,614) are in the labor force, with 3.5% or 105 of them being unemployed. The group with the highest labor force participation rate are those with the educational attainment of college / associate degree, with 93.5% or 1,113 individuals in the labor force. Within the labor force, individuals with less than high school education have the highest percentage of unemployment, with 16.9% or 23 of them being unemployed.
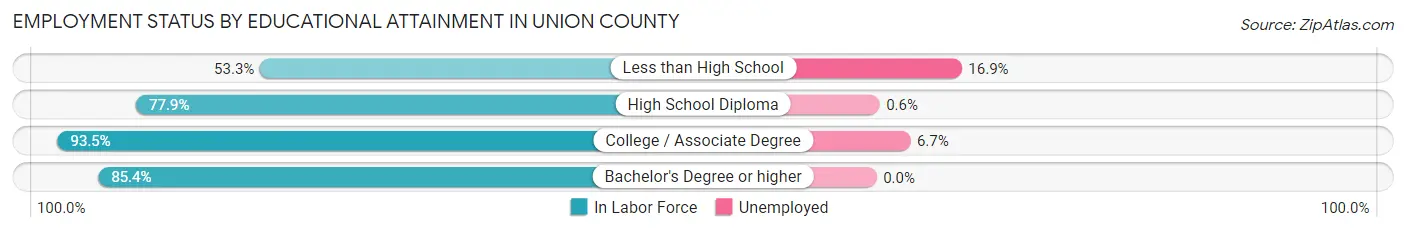
| Educational Attainment | In Labor Force | Unemployed |
| Less than High School | 136 (53.3%) | 43 (16.9%) |
| High School Diploma | 1,069 (77.9%) | 8 (0.6%) |
| College / Associate Degree | 1,113 (93.5%) | 80 (6.7%) |
| Bachelor's Degree or higher | 681 (85.4%) | 0 (0.0%) |
| Total | 3,000 (83.0%) | 126 (3.5%) |
Employment Occupations by Sex in Union County
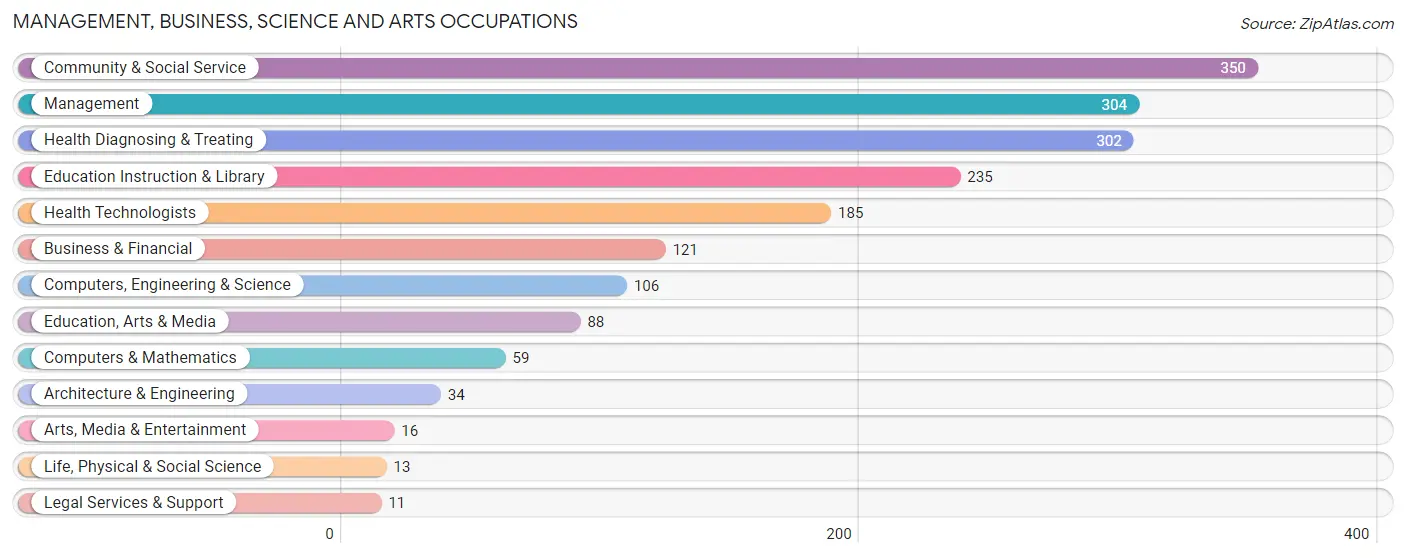
Management, Business, Science and Arts Occupations
The most common Management, Business, Science and Arts occupations in Union County are Community & Social Service (350 | 9.8%), Management (304 | 8.5%), Health Diagnosing & Treating (302 | 8.5%), Education Instruction & Library (235 | 6.6%), and Health Technologists (185 | 5.2%).
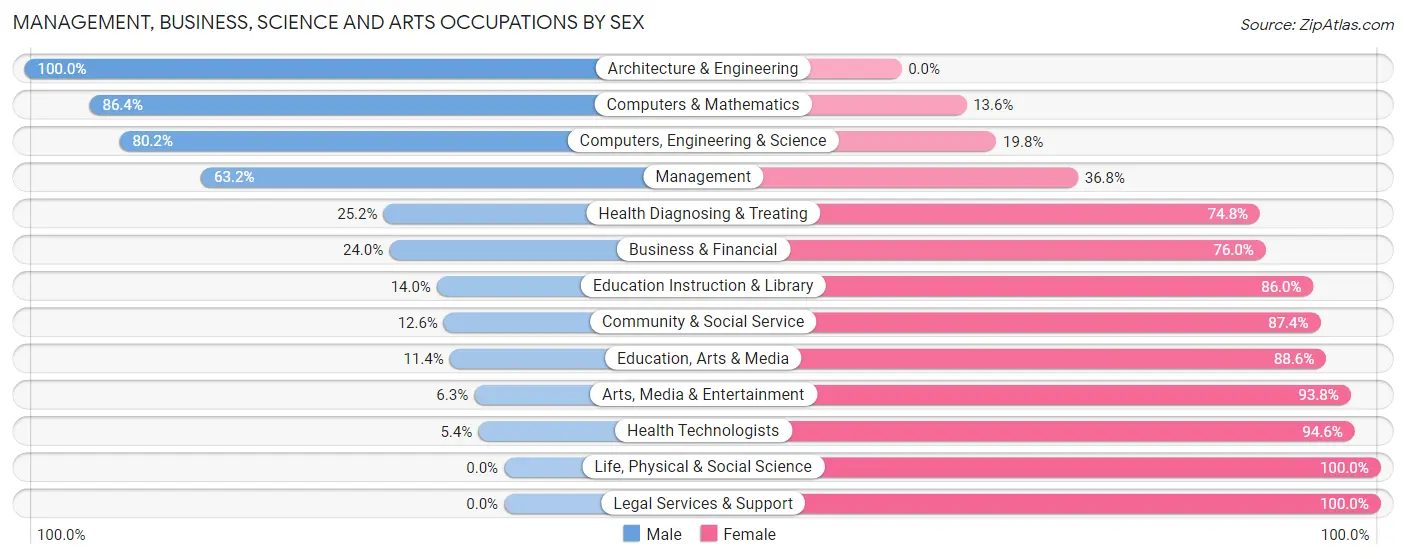
Management, Business, Science and Arts Occupations by Sex
Within the Management, Business, Science and Arts occupations in Union County, the most male-oriented occupations are Architecture & Engineering (100.0%), Computers & Mathematics (86.4%), and Computers, Engineering & Science (80.2%), while the most female-oriented occupations are Life, Physical & Social Science (100.0%), Legal Services & Support (100.0%), and Health Technologists (94.6%).
| Occupation | Male | Female |
| Management | 192 (63.2%) | 112 (36.8%) |
| Business & Financial | 29 (24.0%) | 92 (76.0%) |
| Computers, Engineering & Science | 85 (80.2%) | 21 (19.8%) |
| Computers & Mathematics | 51 (86.4%) | 8 (13.6%) |
| Architecture & Engineering | 34 (100.0%) | 0 (0.0%) |
| Life, Physical & Social Science | 0 (0.0%) | 13 (100.0%) |
| Community & Social Service | 44 (12.6%) | 306 (87.4%) |
| Education, Arts & Media | 10 (11.4%) | 78 (88.6%) |
| Legal Services & Support | 0 (0.0%) | 11 (100.0%) |
| Education Instruction & Library | 33 (14.0%) | 202 (86.0%) |
| Arts, Media & Entertainment | 1 (6.2%) | 15 (93.8%) |
| Health Diagnosing & Treating | 76 (25.2%) | 226 (74.8%) |
| Health Technologists | 10 (5.4%) | 175 (94.6%) |
| Total (Category) | 426 (36.0%) | 757 (64.0%) |
| Total (Overall) | 1,808 (50.7%) | 1,761 (49.3%) |
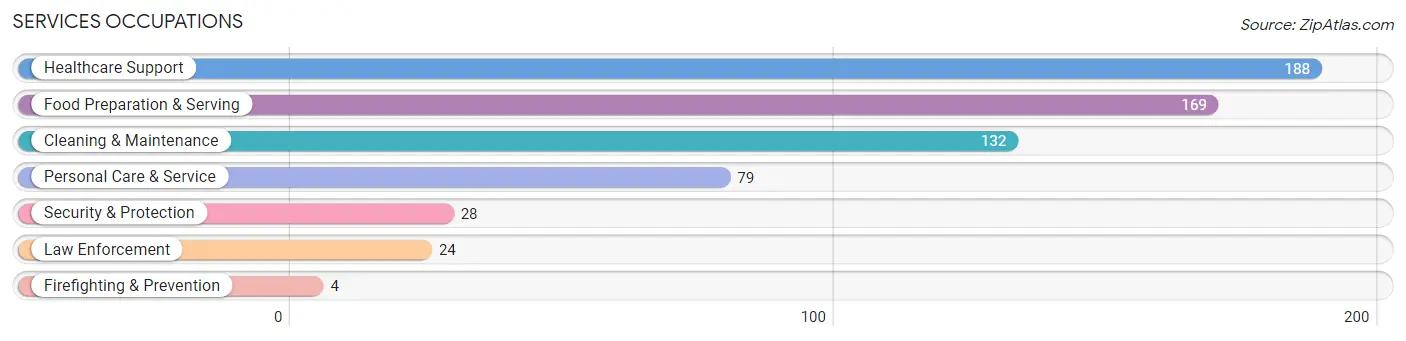
Services Occupations
The most common Services occupations in Union County are Healthcare Support (188 | 5.3%), Food Preparation & Serving (169 | 4.7%), Cleaning & Maintenance (132 | 3.7%), Personal Care & Service (79 | 2.2%), and Security & Protection (28 | 0.8%).
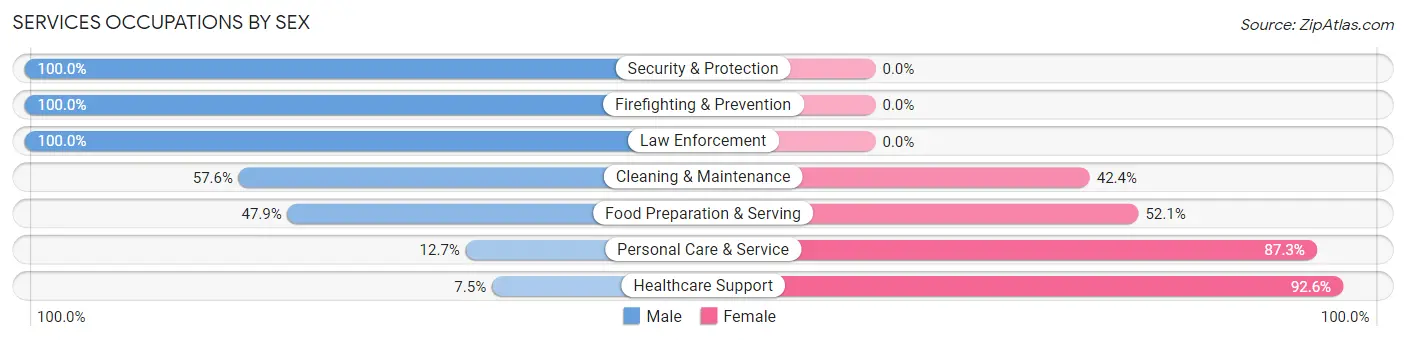
Services Occupations by Sex
Within the Services occupations in Union County, the most male-oriented occupations are Security & Protection (100.0%), Firefighting & Prevention (100.0%), and Law Enforcement (100.0%), while the most female-oriented occupations are Healthcare Support (92.5%), Personal Care & Service (87.3%), and Food Preparation & Serving (52.1%).
| Occupation | Male | Female |
| Healthcare Support | 14 (7.4%) | 174 (92.5%) |
| Security & Protection | 28 (100.0%) | 0 (0.0%) |
| Firefighting & Prevention | 4 (100.0%) | 0 (0.0%) |
| Law Enforcement | 24 (100.0%) | 0 (0.0%) |
| Food Preparation & Serving | 81 (47.9%) | 88 (52.1%) |
| Cleaning & Maintenance | 76 (57.6%) | 56 (42.4%) |
| Personal Care & Service | 10 (12.7%) | 69 (87.3%) |
| Total (Category) | 209 (35.1%) | 387 (64.9%) |
| Total (Overall) | 1,808 (50.7%) | 1,761 (49.3%) |
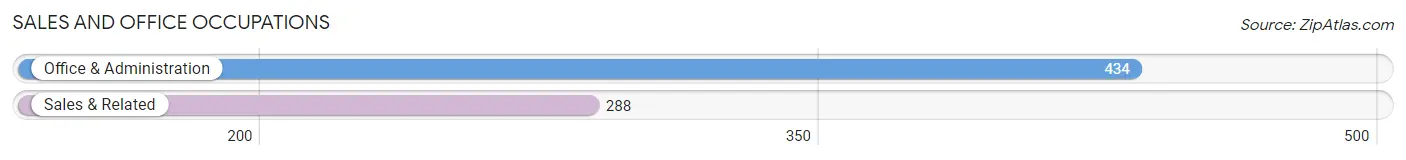
Sales and Office Occupations
The most common Sales and Office occupations in Union County are Office & Administration (434 | 12.2%), and Sales & Related (288 | 8.1%).
Sales and Office Occupations by Sex
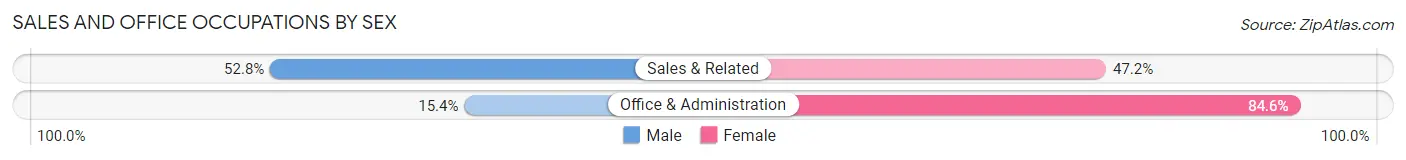
| Occupation | Male | Female |
| Sales & Related | 152 (52.8%) | 136 (47.2%) |
| Office & Administration | 67 (15.4%) | 367 (84.6%) |
| Total (Category) | 219 (30.3%) | 503 (69.7%) |
| Total (Overall) | 1,808 (50.7%) | 1,761 (49.3%) |
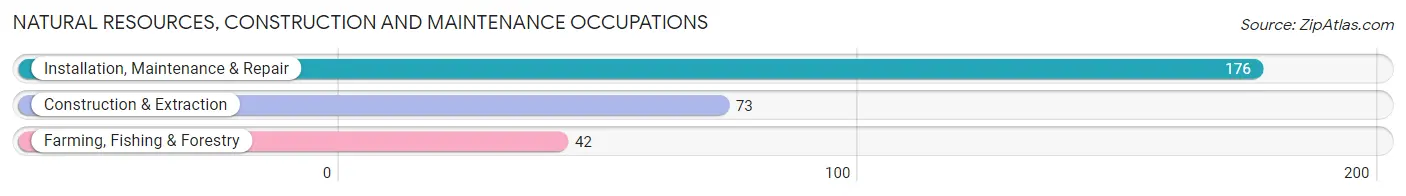
Natural Resources, Construction and Maintenance Occupations
The most common Natural Resources, Construction and Maintenance occupations in Union County are Installation, Maintenance & Repair (176 | 4.9%), Construction & Extraction (73 | 2.1%), and Farming, Fishing & Forestry (42 | 1.2%).
Natural Resources, Construction and Maintenance Occupations by Sex
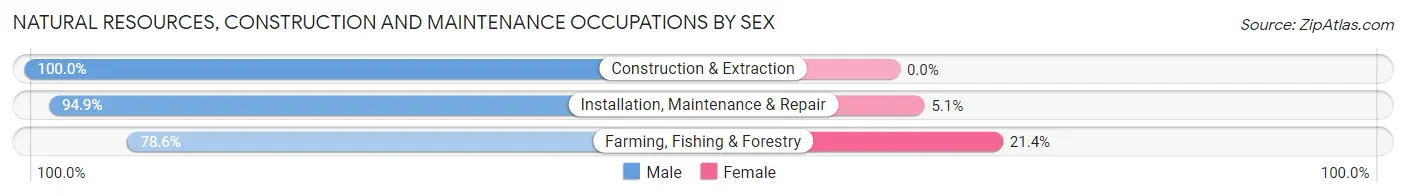
| Occupation | Male | Female |
| Farming, Fishing & Forestry | 33 (78.6%) | 9 (21.4%) |
| Construction & Extraction | 73 (100.0%) | 0 (0.0%) |
| Installation, Maintenance & Repair | 167 (94.9%) | 9 (5.1%) |
| Total (Category) | 273 (93.8%) | 18 (6.2%) |
| Total (Overall) | 1,808 (50.7%) | 1,761 (49.3%) |
Production, Transportation and Moving Occupations
The most common Production, Transportation and Moving occupations in Union County are Production (357 | 10.0%), Transportation (280 | 7.9%), and Material Moving (140 | 3.9%).

Production, Transportation and Moving Occupations by Sex
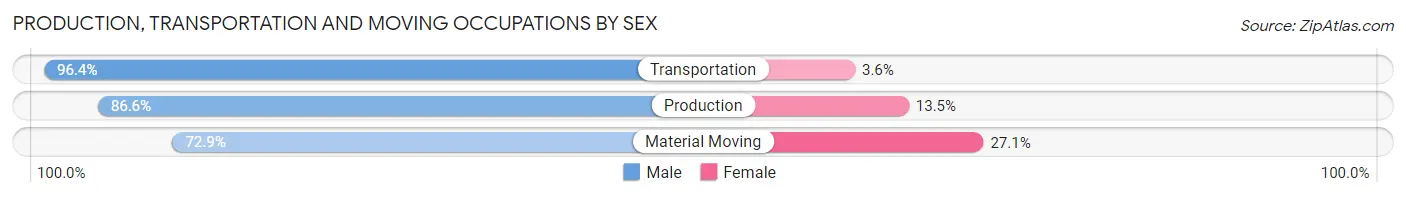
| Occupation | Male | Female |
| Production | 309 (86.6%) | 48 (13.5%) |
| Transportation | 270 (96.4%) | 10 (3.6%) |
| Material Moving | 102 (72.9%) | 38 (27.1%) |
| Total (Category) | 681 (87.6%) | 96 (12.4%) |
| Total (Overall) | 1,808 (50.7%) | 1,761 (49.3%) |
Employment Industries by Sex in Union County
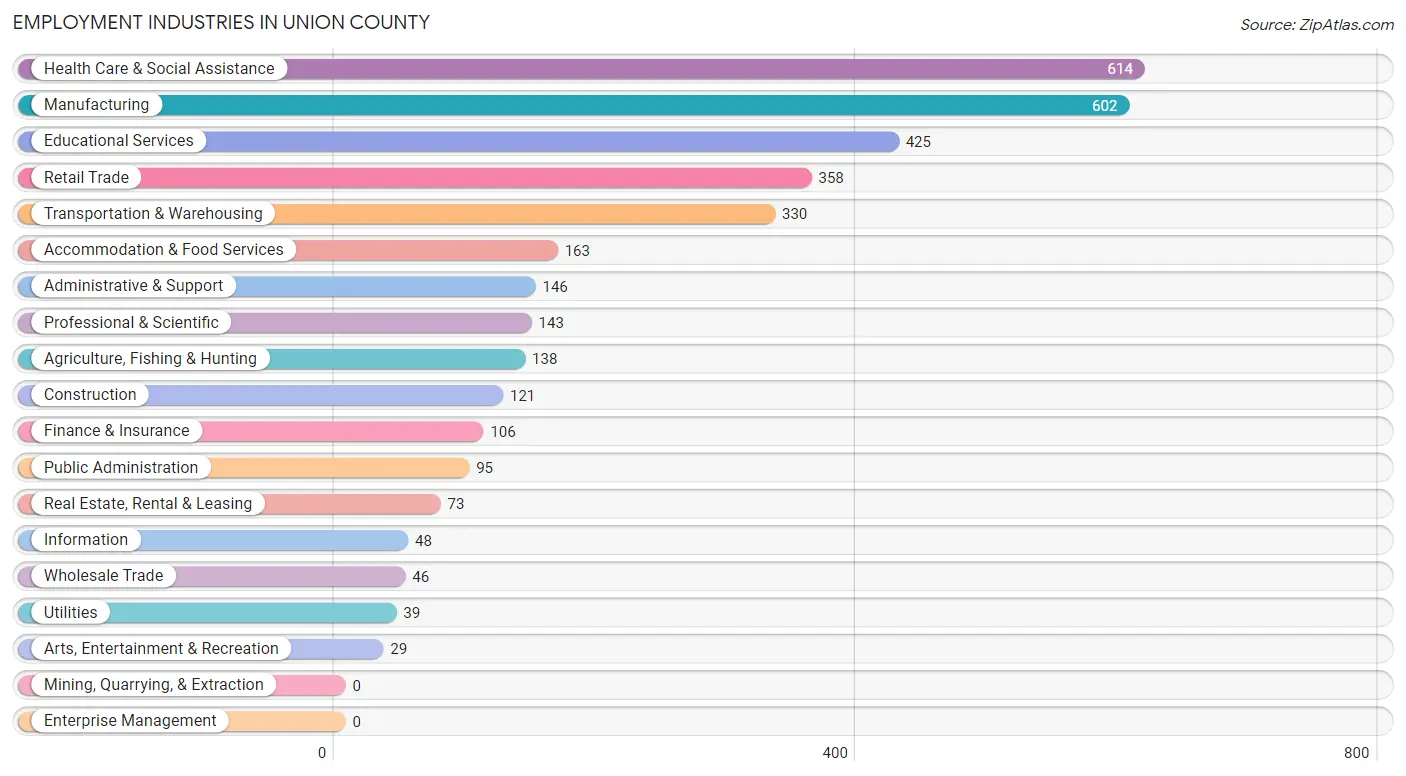
Employment Industries in Union County
The major employment industries in Union County include Health Care & Social Assistance (614 | 17.2%), Manufacturing (602 | 16.9%), Educational Services (425 | 11.9%), Retail Trade (358 | 10.0%), and Transportation & Warehousing (330 | 9.2%).
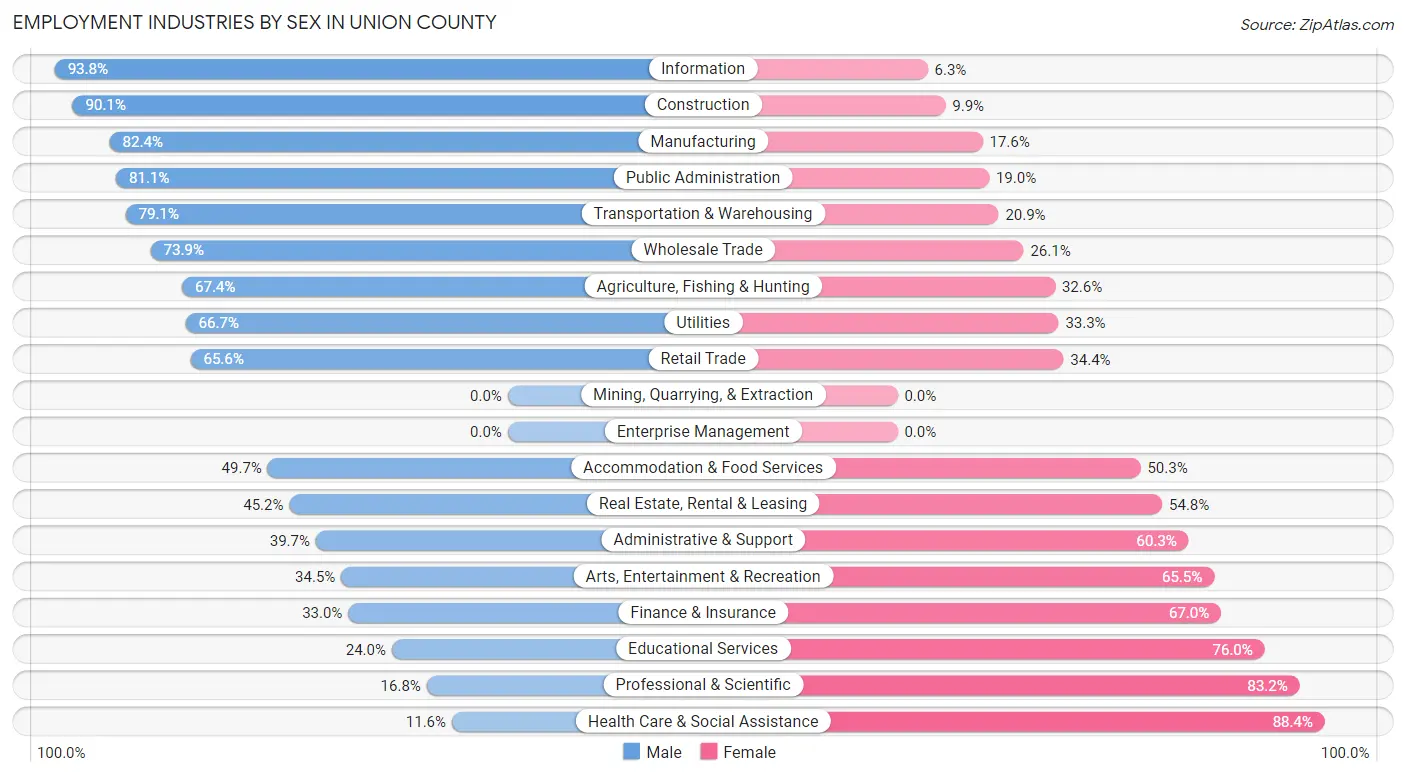
Employment Industries by Sex in Union County
The Union County industries that see more men than women are Information (93.8%), Construction (90.1%), and Manufacturing (82.4%), whereas the industries that tend to have a higher number of women are Health Care & Social Assistance (88.4%), Professional & Scientific (83.2%), and Educational Services (76.0%).
| Industry | Male | Female |
| Agriculture, Fishing & Hunting | 93 (67.4%) | 45 (32.6%) |
| Mining, Quarrying, & Extraction | 0 (0.0%) | 0 (0.0%) |
| Construction | 109 (90.1%) | 12 (9.9%) |
| Manufacturing | 496 (82.4%) | 106 (17.6%) |
| Wholesale Trade | 34 (73.9%) | 12 (26.1%) |
| Retail Trade | 235 (65.6%) | 123 (34.4%) |
| Transportation & Warehousing | 261 (79.1%) | 69 (20.9%) |
| Utilities | 26 (66.7%) | 13 (33.3%) |
| Information | 45 (93.8%) | 3 (6.2%) |
| Finance & Insurance | 35 (33.0%) | 71 (67.0%) |
| Real Estate, Rental & Leasing | 33 (45.2%) | 40 (54.8%) |
| Professional & Scientific | 24 (16.8%) | 119 (83.2%) |
| Enterprise Management | 0 (0.0%) | 0 (0.0%) |
| Administrative & Support | 58 (39.7%) | 88 (60.3%) |
| Educational Services | 102 (24.0%) | 323 (76.0%) |
| Health Care & Social Assistance | 71 (11.6%) | 543 (88.4%) |
| Arts, Entertainment & Recreation | 10 (34.5%) | 19 (65.5%) |
| Accommodation & Food Services | 81 (49.7%) | 82 (50.3%) |
| Public Administration | 77 (81.0%) | 18 (19.0%) |
| Total | 1,808 (50.7%) | 1,761 (49.3%) |
Education in Union County
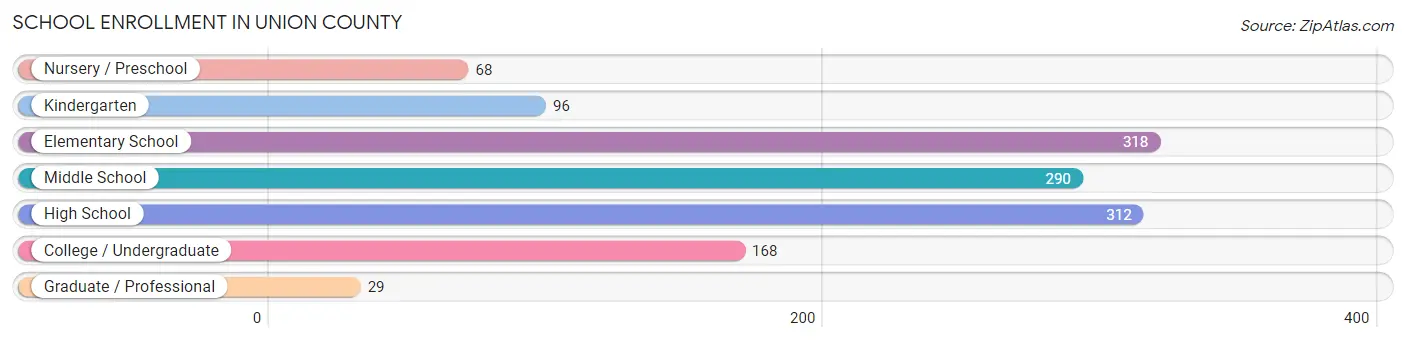
School Enrollment in Union County
The most common levels of schooling among the 1,281 students in Union County are elementary school (318 | 24.8%), high school (312 | 24.4%), and middle school (290 | 22.6%).
| School Level | # Students | % Students |
| Nursery / Preschool | 68 | 5.3% |
| Kindergarten | 96 | 7.5% |
| Elementary School | 318 | 24.8% |
| Middle School | 290 | 22.6% |
| High School | 312 | 24.4% |
| College / Undergraduate | 168 | 13.1% |
| Graduate / Professional | 29 | 2.3% |
| Total | 1,281 | 100.0% |
School Enrollment by Age by Funding Source in Union County
Out of a total of 1,281 students who are enrolled in schools in Union County, 168 (13.1%) attend a private institution, while the remaining 1,113 (86.9%) are enrolled in public schools. The age group of 3 to 4 year olds has the highest likelihood of being enrolled in private schools, with 9 (33.3% in the age bracket) enrolled. Conversely, the age group of 15 to 17 year olds has the lowest likelihood of being enrolled in a private school, with 259 (100.0% in the age bracket) attending a public institution.
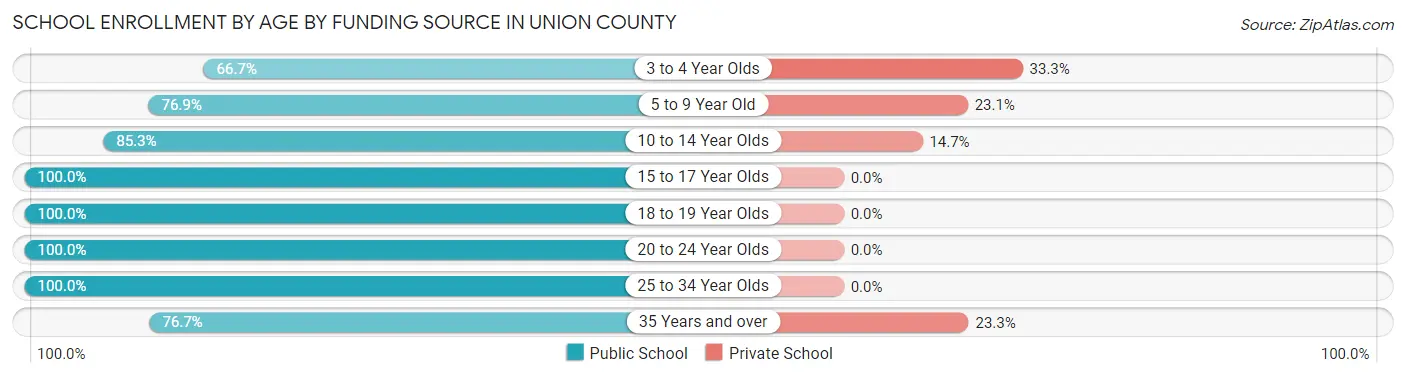
| Age Bracket | Public School | Private School |
| 3 to 4 Year Olds | 18 (66.7%) | 9 (33.3%) |
| 5 to 9 Year Old | 313 (76.9%) | 94 (23.1%) |
| 10 to 14 Year Olds | 320 (85.3%) | 55 (14.7%) |
| 15 to 17 Year Olds | 259 (100.0%) | 0 (0.0%) |
| 18 to 19 Year Olds | 102 (100.0%) | 0 (0.0%) |
| 20 to 24 Year Olds | 27 (100.0%) | 0 (0.0%) |
| 25 to 34 Year Olds | 41 (100.0%) | 0 (0.0%) |
| 35 Years and over | 33 (76.7%) | 10 (23.3%) |
| Total | 1,113 (86.9%) | 168 (13.1%) |
Educational Attainment by Field of Study in Union County
Business (215 | 19.1%), education (205 | 18.2%), arts & humanities (156 | 13.8%), science & technology (154 | 13.7%), and psychology (85 | 7.5%) are the most common fields of study among 1,128 individuals in Union County who have obtained a bachelor's degree or higher.

| Field of Study | # Graduates | % Graduates |
| Computers & Mathematics | 36 | 3.2% |
| Bio, Nature & Agricultural | 79 | 7.0% |
| Physical & Health Sciences | 4 | 0.4% |
| Psychology | 85 | 7.5% |
| Social Sciences | 49 | 4.3% |
| Engineering | 40 | 3.5% |
| Multidisciplinary Studies | 2 | 0.2% |
| Science & Technology | 154 | 13.7% |
| Business | 215 | 19.1% |
| Education | 205 | 18.2% |
| Literature & Languages | 4 | 0.4% |
| Liberal Arts & History | 41 | 3.6% |
| Visual & Performing Arts | 33 | 2.9% |
| Communications | 25 | 2.2% |
| Arts & Humanities | 156 | 13.8% |
| Total | 1,128 | 100.0% |
Transportation & Commute in Union County
Vehicle Availability by Sex in Union County
The most prevalent vehicle ownership categories in Union County are males with 2 vehicles (659, accounting for 36.9%) and females with 2 vehicles (542, making up 37.8%).
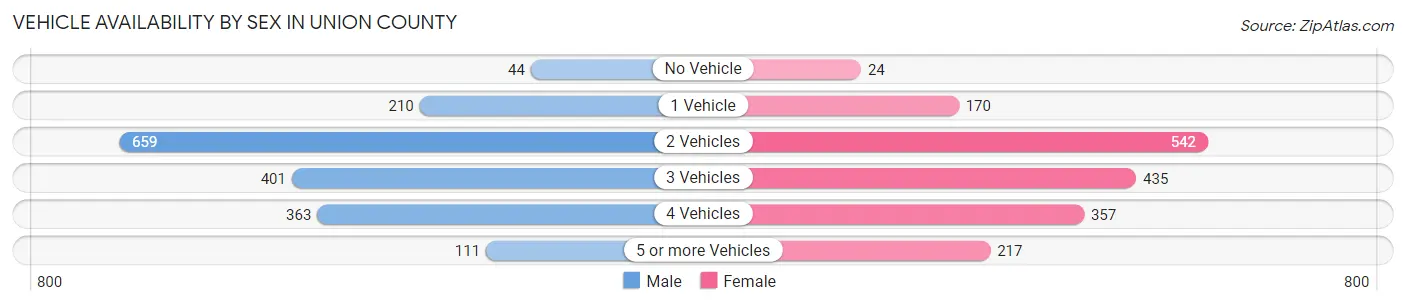
| Vehicles Available | Male | Female |
| No Vehicle | 44 (2.5%) | 24 (1.4%) |
| 1 Vehicle | 210 (11.7%) | 170 (9.7%) |
| 2 Vehicles | 659 (36.9%) | 542 (31.1%) |
| 3 Vehicles | 401 (22.4%) | 435 (24.9%) |
| 4 Vehicles | 363 (20.3%) | 357 (20.5%) |
| 5 or more Vehicles | 111 (6.2%) | 217 (12.4%) |
| Total | 1,788 (100.0%) | 1,745 (100.0%) |
Commute Time in Union County
The most frequently occuring commute durations in Union County are 30 to 34 minutes (671 commuters, 19.6%), 20 to 24 minutes (501 commuters, 14.6%), and 10 to 14 minutes (470 commuters, 13.7%).

| Commute Time | # Commuters | % Commuters |
| Less than 5 Minutes | 202 | 5.9% |
| 5 to 9 Minutes | 342 | 10.0% |
| 10 to 14 Minutes | 470 | 13.7% |
| 15 to 19 Minutes | 265 | 7.7% |
| 20 to 24 Minutes | 501 | 14.6% |
| 25 to 29 Minutes | 272 | 7.9% |
| 30 to 34 Minutes | 671 | 19.6% |
| 35 to 39 Minutes | 80 | 2.3% |
| 40 to 44 Minutes | 170 | 5.0% |
| 45 to 59 Minutes | 155 | 4.5% |
| 60 to 89 Minutes | 165 | 4.8% |
| 90 or more Minutes | 134 | 3.9% |
Commute Time by Sex in Union County
The most common commute times in Union County are 30 to 34 minutes (302 commuters, 17.4%) for males and 30 to 34 minutes (369 commuters, 21.8%) for females.

| Commute Time | Male | Female |
| Less than 5 Minutes | 113 (6.5%) | 89 (5.3%) |
| 5 to 9 Minutes | 198 (11.4%) | 144 (8.5%) |
| 10 to 14 Minutes | 163 (9.4%) | 307 (18.1%) |
| 15 to 19 Minutes | 157 (9.0%) | 108 (6.4%) |
| 20 to 24 Minutes | 260 (15.0%) | 241 (14.2%) |
| 25 to 29 Minutes | 132 (7.6%) | 140 (8.3%) |
| 30 to 34 Minutes | 302 (17.4%) | 369 (21.8%) |
| 35 to 39 Minutes | 31 (1.8%) | 49 (2.9%) |
| 40 to 44 Minutes | 95 (5.5%) | 75 (4.4%) |
| 45 to 59 Minutes | 65 (3.7%) | 90 (5.3%) |
| 60 to 89 Minutes | 152 (8.8%) | 13 (0.8%) |
| 90 or more Minutes | 67 (3.9%) | 67 (4.0%) |
Time of Departure to Work by Sex in Union County
The most frequent times of departure to work in Union County are 6:30 AM to 6:59 AM (274, 15.8%) for males and 7:30 AM to 7:59 AM (313, 18.5%) for females.

| Time of Departure | Male | Female |
| 12:00 AM to 4:59 AM | 199 (11.5%) | 63 (3.7%) |
| 5:00 AM to 5:29 AM | 104 (6.0%) | 66 (3.9%) |
| 5:30 AM to 5:59 AM | 136 (7.8%) | 72 (4.3%) |
| 6:00 AM to 6:29 AM | 92 (5.3%) | 155 (9.2%) |
| 6:30 AM to 6:59 AM | 274 (15.8%) | 218 (12.9%) |
| 7:00 AM to 7:29 AM | 209 (12.0%) | 248 (14.7%) |
| 7:30 AM to 7:59 AM | 165 (9.5%) | 313 (18.5%) |
| 8:00 AM to 8:29 AM | 117 (6.7%) | 175 (10.3%) |
| 8:30 AM to 8:59 AM | 73 (4.2%) | 51 (3.0%) |
| 9:00 AM to 9:59 AM | 29 (1.7%) | 150 (8.9%) |
| 10:00 AM to 10:59 AM | 54 (3.1%) | 12 (0.7%) |
| 11:00 AM to 11:59 AM | 19 (1.1%) | 8 (0.5%) |
| 12:00 PM to 3:59 PM | 140 (8.1%) | 80 (4.7%) |
| 4:00 PM to 11:59 PM | 124 (7.1%) | 81 (4.8%) |
| Total | 1,735 (100.0%) | 1,692 (100.0%) |
Housing Occupancy in Union County
Occupancy by Ownership in Union County
Of the total 2,912 dwellings in Union County, owner-occupied units account for 2,305 (79.2%), while renter-occupied units make up 607 (20.8%).
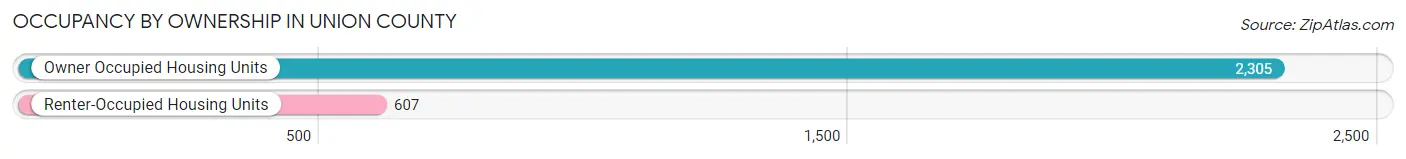
| Occupancy | # Housing Units | % Housing Units |
| Owner Occupied Housing Units | 2,305 | 79.2% |
| Renter-Occupied Housing Units | 607 | 20.8% |
| Total Occupied Housing Units | 2,912 | 100.0% |
Occupancy by Household Size in Union County

| Household Size | # Housing Units | % Housing Units |
| 1-Person Household | 691 | 23.7% |
| 2-Person Household | 1,194 | 41.0% |
| 3-Person Household | 442 | 15.2% |
| 4+ Person Household | 585 | 20.1% |
| Total Housing Units | 2,912 | 100.0% |
Occupancy by Ownership by Household Size in Union County
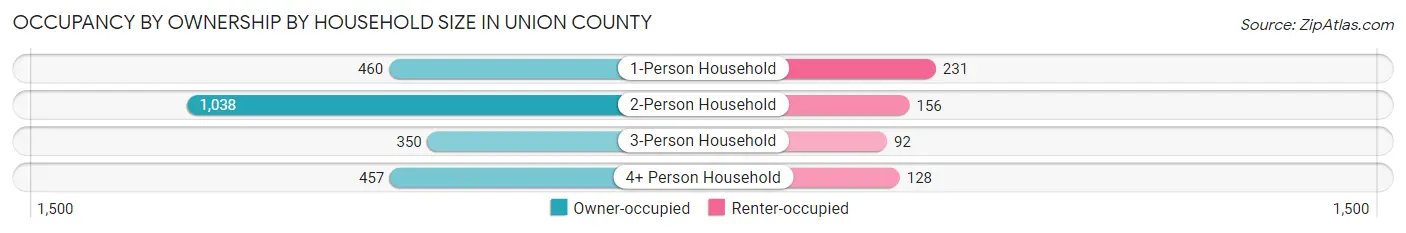
| Household Size | Owner-occupied | Renter-occupied |
| 1-Person Household | 460 (66.6%) | 231 (33.4%) |
| 2-Person Household | 1,038 (86.9%) | 156 (13.1%) |
| 3-Person Household | 350 (79.2%) | 92 (20.8%) |
| 4+ Person Household | 457 (78.1%) | 128 (21.9%) |
| Total Housing Units | 2,305 (79.2%) | 607 (20.8%) |
Occupancy by Educational Attainment in Union County

| Household Size | Owner-occupied | Renter-occupied |
| Less than High School | 212 (76.3%) | 66 (23.7%) |
| High School Diploma | 925 (80.2%) | 229 (19.8%) |
| College/Associate Degree | 637 (75.7%) | 204 (24.3%) |
| Bachelor's Degree or higher | 531 (83.1%) | 108 (16.9%) |
Occupancy by Age of Householder in Union County
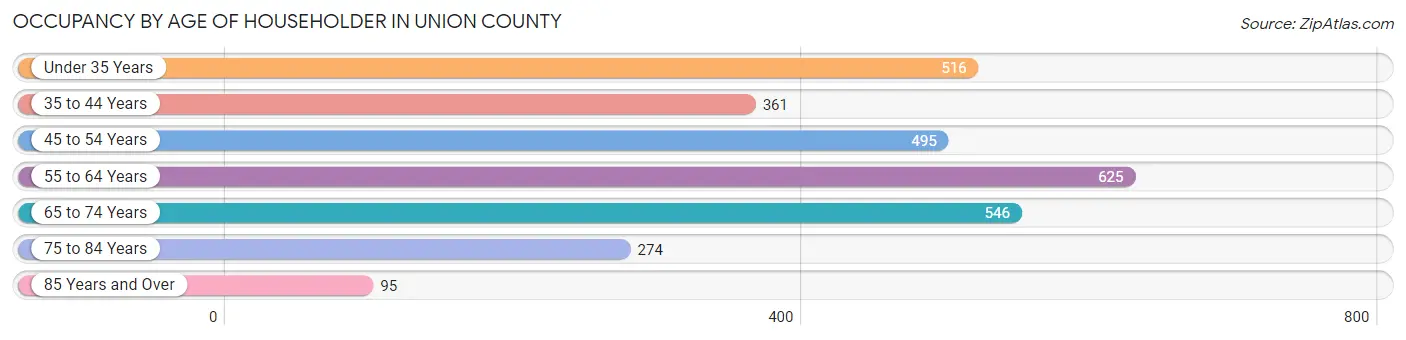
| Age Bracket | # Households | % Households |
| Under 35 Years | 516 | 17.7% |
| 35 to 44 Years | 361 | 12.4% |
| 45 to 54 Years | 495 | 17.0% |
| 55 to 64 Years | 625 | 21.5% |
| 65 to 74 Years | 546 | 18.8% |
| 75 to 84 Years | 274 | 9.4% |
| 85 Years and Over | 95 | 3.3% |
| Total | 2,912 | 100.0% |
Housing Finances in Union County
Median Income by Occupancy in Union County

| Occupancy Type | # Households | Median Income |
| Owner-Occupied | 2,305 (79.2%) | $77,306 |
| Renter-Occupied | 607 (20.8%) | $45,341 |
| Average | 2,912 (100.0%) | $68,514 |
Occupancy by Householder Income Bracket in Union County

| Income Bracket | Owner-occupied | Renter-occupied |
| Less than $5,000 | 32 (1.4%) | 0 (0.0%) |
| $5,000 to $9,999 | 1 (0.0%) | 60 (9.9%) |
| $10,000 to $14,999 | 44 (1.9%) | 42 (6.9%) |
| $15,000 to $19,999 | 40 (1.7%) | 18 (3.0%) |
| $20,000 to $24,999 | 70 (3.0%) | 42 (6.9%) |
| $25,000 to $34,999 | 210 (9.1%) | 56 (9.2%) |
| $35,000 to $49,999 | 201 (8.7%) | 142 (23.4%) |
| $50,000 to $74,999 | 513 (22.3%) | 84 (13.8%) |
| $75,000 to $99,999 | 399 (17.3%) | 46 (7.6%) |
| $100,000 to $149,999 | 598 (25.9%) | 101 (16.6%) |
| $150,000 or more | 197 (8.6%) | 16 (2.6%) |
| Total | 2,305 (100.0%) | 607 (100.0%) |
Monthly Housing Cost Tiers in Union County
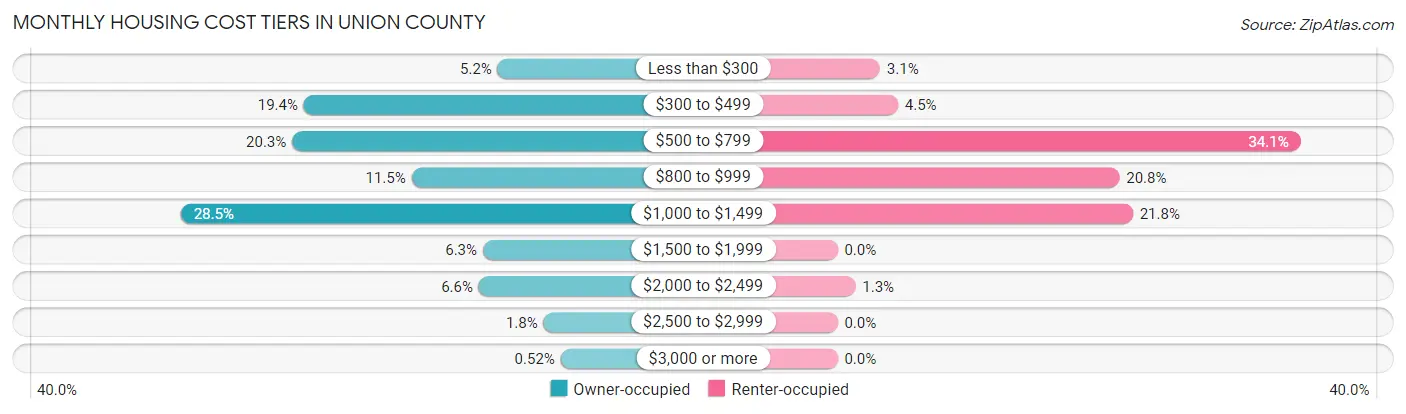
| Monthly Cost | Owner-occupied | Renter-occupied |
| Less than $300 | 119 (5.2%) | 19 (3.1%) |
| $300 to $499 | 448 (19.4%) | 27 (4.4%) |
| $500 to $799 | 468 (20.3%) | 207 (34.1%) |
| $800 to $999 | 265 (11.5%) | 126 (20.8%) |
| $1,000 to $1,499 | 657 (28.5%) | 132 (21.7%) |
| $1,500 to $1,999 | 144 (6.2%) | 0 (0.0%) |
| $2,000 to $2,499 | 151 (6.6%) | 8 (1.3%) |
| $2,500 to $2,999 | 41 (1.8%) | 0 (0.0%) |
| $3,000 or more | 12 (0.5%) | 0 (0.0%) |
| Total | 2,305 (100.0%) | 607 (100.0%) |
Physical Housing Characteristics in Union County
Housing Structures in Union County
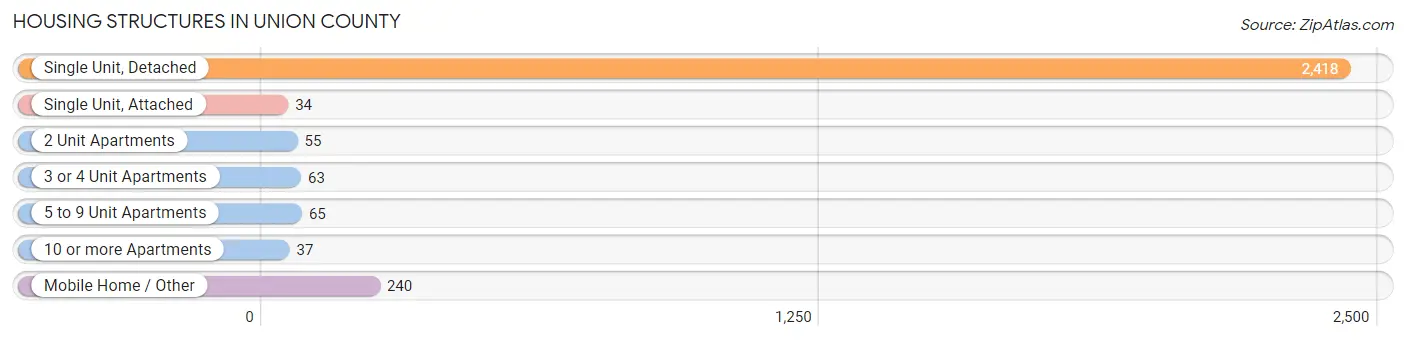
| Structure Type | # Housing Units | % Housing Units |
| Single Unit, Detached | 2,418 | 83.0% |
| Single Unit, Attached | 34 | 1.2% |
| 2 Unit Apartments | 55 | 1.9% |
| 3 or 4 Unit Apartments | 63 | 2.2% |
| 5 to 9 Unit Apartments | 65 | 2.2% |
| 10 or more Apartments | 37 | 1.3% |
| Mobile Home / Other | 240 | 8.2% |
| Total | 2,912 | 100.0% |
Housing Structures by Occupancy in Union County
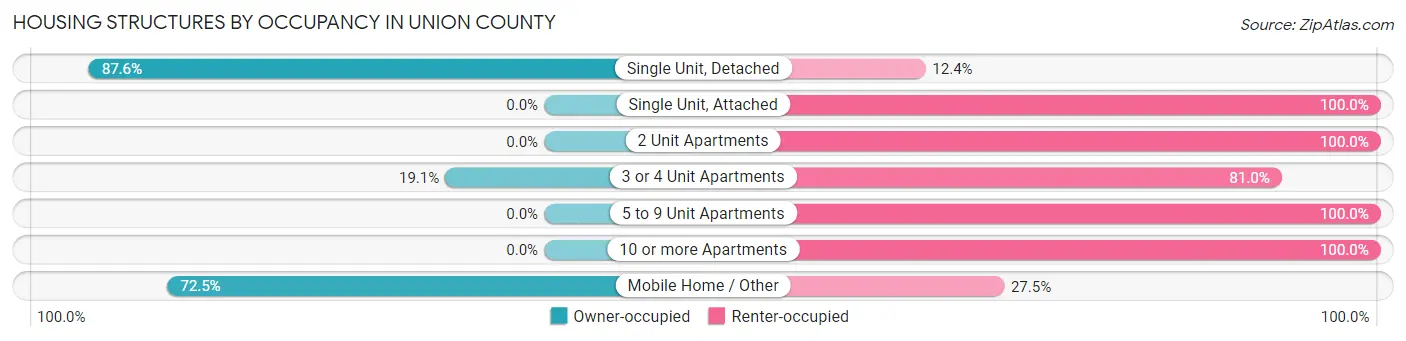
| Structure Type | Owner-occupied | Renter-occupied |
| Single Unit, Detached | 2,119 (87.6%) | 299 (12.4%) |
| Single Unit, Attached | 0 (0.0%) | 34 (100.0%) |
| 2 Unit Apartments | 0 (0.0%) | 55 (100.0%) |
| 3 or 4 Unit Apartments | 12 (19.1%) | 51 (80.9%) |
| 5 to 9 Unit Apartments | 0 (0.0%) | 65 (100.0%) |
| 10 or more Apartments | 0 (0.0%) | 37 (100.0%) |
| Mobile Home / Other | 174 (72.5%) | 66 (27.5%) |
| Total | 2,305 (79.2%) | 607 (20.8%) |
Housing Structures by Number of Rooms in Union County

| Number of Rooms | Owner-occupied | Renter-occupied |
| 1 Room | 0 (0.0%) | 0 (0.0%) |
| 2 or 3 Rooms | 16 (0.7%) | 104 (17.1%) |
| 4 or 5 Rooms | 596 (25.9%) | 295 (48.6%) |
| 6 or 7 Rooms | 668 (29.0%) | 124 (20.4%) |
| 8 or more Rooms | 1,025 (44.5%) | 84 (13.8%) |
| Total | 2,305 (100.0%) | 607 (100.0%) |
Housing Structure by Heating Type in Union County

| Heating Type | Owner-occupied | Renter-occupied |
| Utility Gas | 539 (23.4%) | 76 (12.5%) |
| Bottled, Tank, or LP Gas | 648 (28.1%) | 227 (37.4%) |
| Electricity | 682 (29.6%) | 267 (44.0%) |
| Fuel Oil or Kerosene | 226 (9.8%) | 10 (1.7%) |
| Coal or Coke | 0 (0.0%) | 0 (0.0%) |
| All other Fuels | 178 (7.7%) | 27 (4.4%) |
| No Fuel Used | 32 (1.4%) | 0 (0.0%) |
| Total | 2,305 (100.0%) | 607 (100.0%) |
Household Vehicle Usage in Union County

| Vehicles per Household | Owner-occupied | Renter-occupied |
| No Vehicle | 55 (2.4%) | 63 (10.4%) |
| 1 Vehicle | 444 (19.3%) | 230 (37.9%) |
| 2 Vehicles | 818 (35.5%) | 178 (29.3%) |
| 3 or more Vehicles | 988 (42.9%) | 136 (22.4%) |
| Total | 2,305 (100.0%) | 607 (100.0%) |
Real Estate & Mortgages in Union County
Real Estate and Mortgage Overview in Union County
| Characteristic | Without Mortgage | With Mortgage |
| Housing Units | 936 | 1,369 |
| Median Property Value | $124,400 | $157,000 |
| Median Household Income | $67,500 | $128 |
| Monthly Housing Costs | $462 | $5 |
| Real Estate Taxes | $1,078 | $35 |
Property Value by Mortgage Status in Union County

| Property Value | Without Mortgage | With Mortgage |
| Less than $50,000 | 103 (11.0%) | 76 (5.6%) |
| $50,000 to $99,999 | 210 (22.4%) | 245 (17.9%) |
| $100,000 to $299,999 | 522 (55.8%) | 918 (67.1%) |
| $300,000 to $499,999 | 45 (4.8%) | 118 (8.6%) |
| $500,000 to $749,999 | 0 (0.0%) | 7 (0.5%) |
| $750,000 to $999,999 | 56 (6.0%) | 0 (0.0%) |
| $1,000,000 or more | 0 (0.0%) | 5 (0.4%) |
| Total | 936 (100.0%) | 1,369 (100.0%) |
Household Income by Mortgage Status in Union County
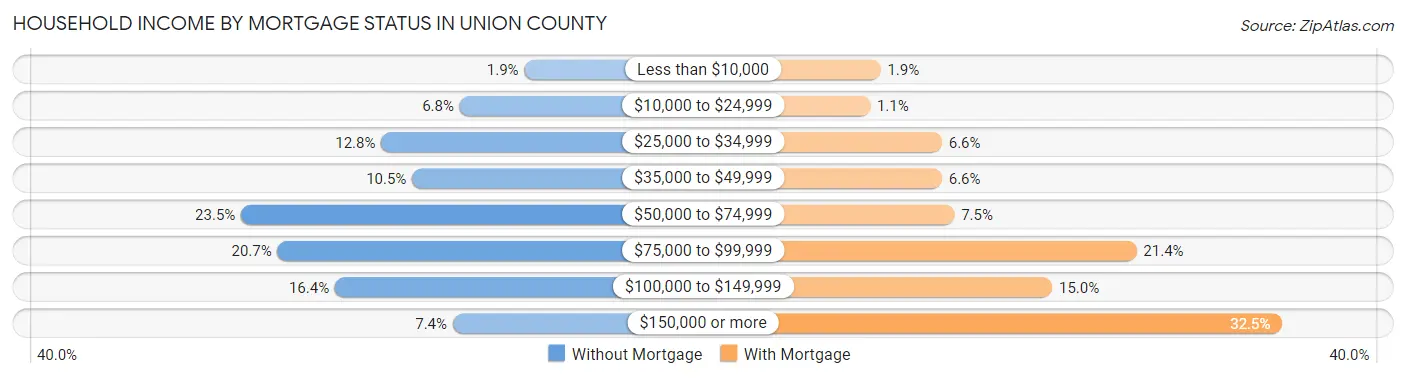
| Household Income | Without Mortgage | With Mortgage |
| Less than $10,000 | 18 (1.9%) | 26 (1.9%) |
| $10,000 to $24,999 | 64 (6.8%) | 15 (1.1%) |
| $25,000 to $34,999 | 120 (12.8%) | 90 (6.6%) |
| $35,000 to $49,999 | 98 (10.5%) | 90 (6.6%) |
| $50,000 to $74,999 | 220 (23.5%) | 103 (7.5%) |
| $75,000 to $99,999 | 194 (20.7%) | 293 (21.4%) |
| $100,000 to $149,999 | 153 (16.4%) | 205 (15.0%) |
| $150,000 or more | 69 (7.4%) | 445 (32.5%) |
| Total | 936 (100.0%) | 1,369 (100.0%) |
Property Value to Household Income Ratio in Union County
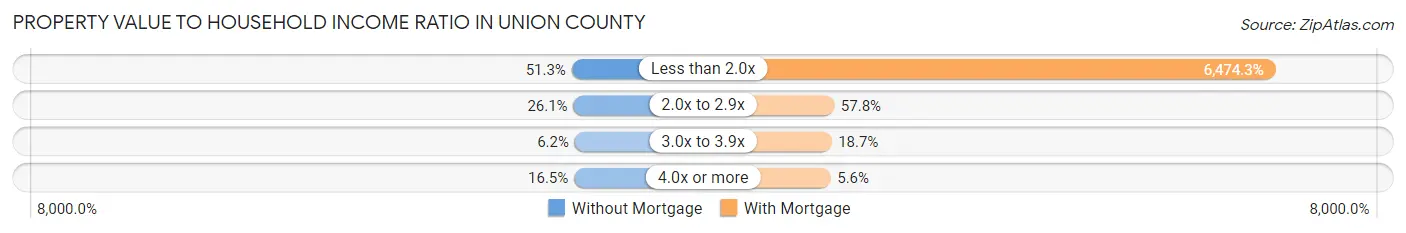
| Value-to-Income Ratio | Without Mortgage | With Mortgage |
| Less than 2.0x | 480 (51.3%) | 88,633 (6,474.3%) |
| 2.0x to 2.9x | 244 (26.1%) | 791 (57.8%) |
| 3.0x to 3.9x | 58 (6.2%) | 256 (18.7%) |
| 4.0x or more | 154 (16.5%) | 77 (5.6%) |
| Total | 936 (100.0%) | 1,369 (100.0%) |
Real Estate Taxes by Mortgage Status in Union County
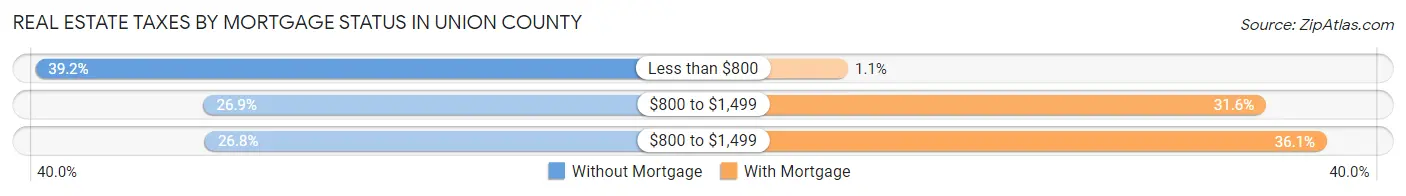
| Property Taxes | Without Mortgage | With Mortgage |
| Less than $800 | 367 (39.2%) | 15 (1.1%) |
| $800 to $1,499 | 252 (26.9%) | 433 (31.6%) |
| $800 to $1,499 | 251 (26.8%) | 494 (36.1%) |
| Total | 936 (100.0%) | 1,369 (100.0%) |
Health & Disability in Union County
Health Insurance Coverage by Age in Union County
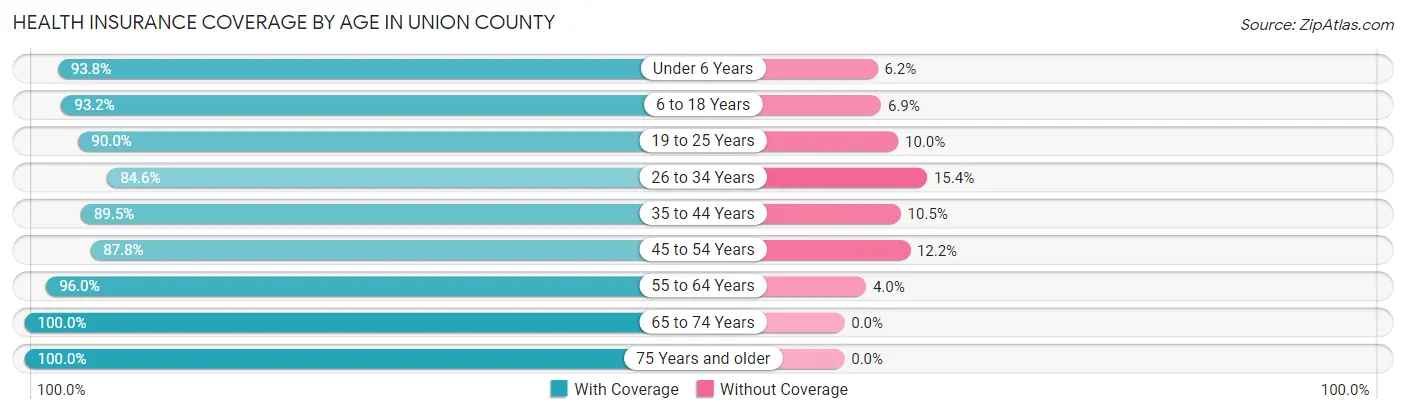
| Age Bracket | With Coverage | Without Coverage |
| Under 6 Years | 500 (93.8%) | 33 (6.2%) |
| 6 to 18 Years | 939 (93.1%) | 69 (6.9%) |
| 19 to 25 Years | 493 (90.0%) | 55 (10.0%) |
| 26 to 34 Years | 587 (84.6%) | 107 (15.4%) |
| 35 to 44 Years | 681 (89.5%) | 80 (10.5%) |
| 45 to 54 Years | 817 (87.8%) | 114 (12.2%) |
| 55 to 64 Years | 1,069 (96.0%) | 45 (4.0%) |
| 65 to 74 Years | 864 (100.0%) | 0 (0.0%) |
| 75 Years and older | 532 (100.0%) | 0 (0.0%) |
| Total | 6,482 (92.8%) | 503 (7.2%) |
Health Insurance Coverage by Citizenship Status in Union County
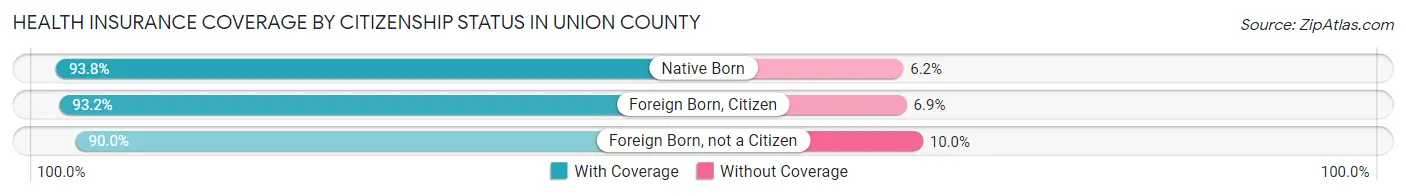
| Citizenship Status | With Coverage | Without Coverage |
| Native Born | 500 (93.8%) | 33 (6.2%) |
| Foreign Born, Citizen | 939 (93.1%) | 69 (6.9%) |
| Foreign Born, not a Citizen | 493 (90.0%) | 55 (10.0%) |
Health Insurance Coverage by Household Income in Union County

| Household Income | With Coverage | Without Coverage |
| Under $25,000 | 494 (98.0%) | 10 (2.0%) |
| $25,000 to $49,999 | 942 (89.5%) | 111 (10.5%) |
| $50,000 to $74,999 | 1,365 (92.7%) | 108 (7.3%) |
| $75,000 to $99,999 | 1,005 (94.6%) | 57 (5.4%) |
| $100,000 and over | 2,672 (92.5%) | 217 (7.5%) |
Public vs Private Health Insurance Coverage by Age in Union County

| Age Bracket | Public Insurance | Private Insurance |
| Under 6 | 241 (45.2%) | 277 (52.0%) |
| 6 to 18 Years | 199 (19.7%) | 756 (75.0%) |
| 19 to 25 Years | 87 (15.9%) | 423 (77.2%) |
| 25 to 34 Years | 115 (16.6%) | 477 (68.7%) |
| 35 to 44 Years | 47 (6.2%) | 642 (84.4%) |
| 45 to 54 Years | 97 (10.4%) | 737 (79.2%) |
| 55 to 64 Years | 139 (12.5%) | 934 (83.8%) |
| 65 to 74 Years | 847 (98.0%) | 383 (44.3%) |
| 75 Years and over | 532 (100.0%) | 331 (62.2%) |
| Total | 2,304 (33.0%) | 4,960 (71.0%) |
Disability Status by Sex by Age in Union County

| Age Bracket | Male | Female |
| Under 5 Years | 0 (0.0%) | 0 (0.0%) |
| 5 to 17 Years | 58 (10.4%) | 8 (1.6%) |
| 18 to 34 Years | 11 (1.6%) | 60 (9.1%) |
| 35 to 64 Years | 170 (12.1%) | 261 (18.5%) |
| 65 to 74 Years | 60 (14.6%) | 74 (16.3%) |
| 75 Years and over | 143 (59.6%) | 160 (54.8%) |
Disability Class by Sex by Age in Union County
Disability Class: Hearing Difficulty

| Age Bracket | Male | Female |
| Under 5 Years | 0 (0.0%) | 0 (0.0%) |
| 5 to 17 Years | 12 (2.2%) | 0 (0.0%) |
| 18 to 34 Years | 0 (0.0%) | 0 (0.0%) |
| 35 to 64 Years | 86 (6.1%) | 25 (1.8%) |
| 65 to 74 Years | 15 (3.6%) | 8 (1.8%) |
| 75 Years and over | 88 (36.7%) | 67 (23.0%) |
Disability Class: Vision Difficulty

| Age Bracket | Male | Female |
| Under 5 Years | 0 (0.0%) | 0 (0.0%) |
| 5 to 17 Years | 0 (0.0%) | 6 (1.2%) |
| 18 to 34 Years | 0 (0.0%) | 4 (0.6%) |
| 35 to 64 Years | 3 (0.2%) | 121 (8.6%) |
| 65 to 74 Years | 17 (4.1%) | 7 (1.5%) |
| 75 Years and over | 0 (0.0%) | 19 (6.5%) |
Disability Class: Cognitive Difficulty

| Age Bracket | Male | Female |
| 5 to 17 Years | 37 (6.7%) | 2 (0.4%) |
| 18 to 34 Years | 9 (1.3%) | 60 (9.1%) |
| 35 to 64 Years | 45 (3.2%) | 39 (2.8%) |
| 65 to 74 Years | 7 (1.7%) | 2 (0.4%) |
| 75 Years and over | 55 (22.9%) | 60 (20.5%) |
Disability Class: Ambulatory Difficulty
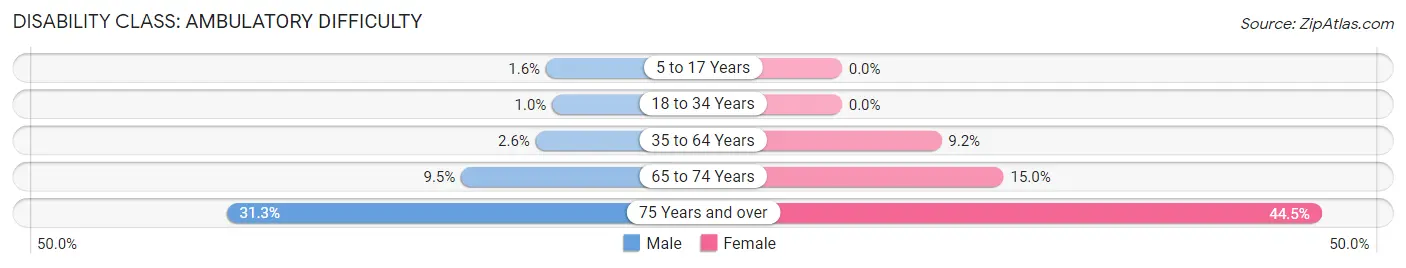
| Age Bracket | Male | Female |
| 5 to 17 Years | 9 (1.6%) | 0 (0.0%) |
| 18 to 34 Years | 7 (1.0%) | 0 (0.0%) |
| 35 to 64 Years | 36 (2.6%) | 130 (9.2%) |
| 65 to 74 Years | 39 (9.5%) | 68 (15.0%) |
| 75 Years and over | 75 (31.2%) | 130 (44.5%) |
Disability Class: Self-Care Difficulty
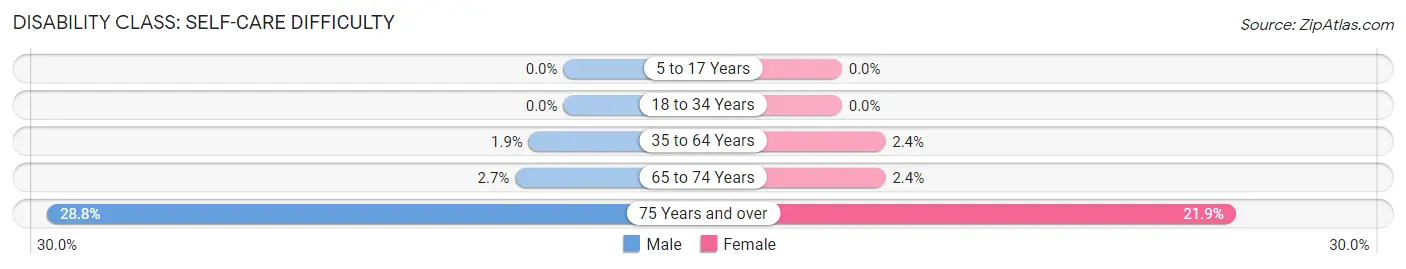
| Age Bracket | Male | Female |
| 5 to 17 Years | 0 (0.0%) | 0 (0.0%) |
| 18 to 34 Years | 0 (0.0%) | 0 (0.0%) |
| 35 to 64 Years | 27 (1.9%) | 34 (2.4%) |
| 65 to 74 Years | 11 (2.7%) | 11 (2.4%) |
| 75 Years and over | 69 (28.7%) | 64 (21.9%) |
Technology Access in Union County
Computing Device Access in Union County
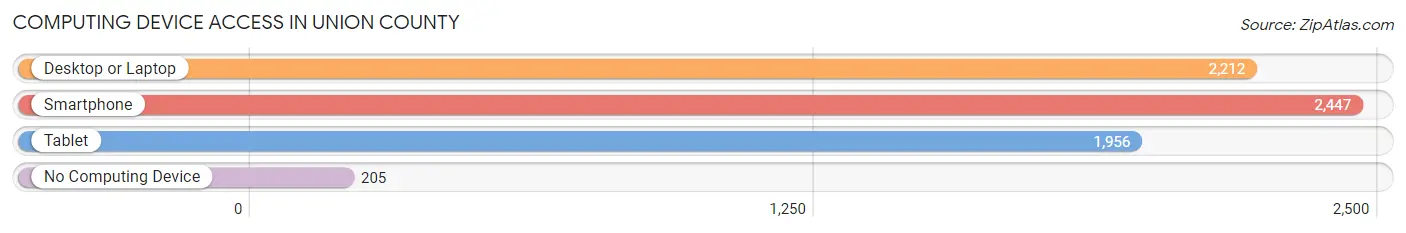
| Device Type | # Households | % Households |
| Desktop or Laptop | 2,212 | 76.0% |
| Smartphone | 2,447 | 84.0% |
| Tablet | 1,956 | 67.2% |
| No Computing Device | 205 | 7.0% |
| Total | 2,912 | 100.0% |
Internet Access in Union County
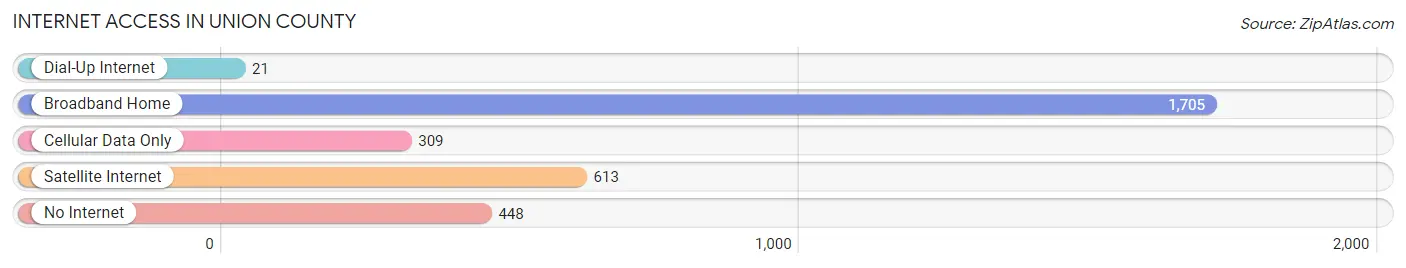
| Internet Type | # Households | % Households |
| Dial-Up Internet | 21 | 0.7% |
| Broadband Home | 1,705 | 58.6% |
| Cellular Data Only | 309 | 10.6% |
| Satellite Internet | 613 | 21.0% |
| No Internet | 448 | 15.4% |
| Total | 2,912 | 100.0% |
Union County Summary
County History
Union County, Indiana is located in the east-central part of the state and is part of the Indianapolis metropolitan area. The county was established in 1821 and was named for the union of the United States. The county seat is Liberty, Indiana.
The first settlers in Union County were of German descent and arrived in the early 1800s. The county was largely agricultural, with corn, wheat, and oats being the main crops. The county also had a thriving livestock industry, with cattle, hogs, and sheep being raised.
The county was also home to several small towns, including Liberty, West College Corner, and College Corner. The county was also home to several small industries, including a sawmill, a gristmill, and a woolen mill.
The county was also home to several churches, including the Methodist Episcopal Church, the Presbyterian Church, and the Baptist Church. The county also had several schools, including the Union County Seminary, which was established in 1845.
Geography
Union County is located in east-central Indiana and is part of the Indianapolis metropolitan area. The county is bordered by Fayette County to the north, Franklin County to the east, Wayne County to the south, and Randolph County to the west.
The county has a total area of 437 square miles, of which 434 square miles is land and 3 square miles is water. The county is mostly flat, with some rolling hills in the northern part of the county. The highest point in the county is located in the northern part of the county, near the town of Liberty, and is 890 feet above sea level.
The county is drained by the White River, which flows through the county from north to south. The county also has several small lakes, including Lake Liberty, Lake West College Corner, and Lake College Corner.
Economy
Union County has a diverse economy, with a mix of manufacturing, agriculture, and services. The county is home to several large employers, including Honda Manufacturing of Indiana, which employs over 4,000 people, and Cummins, which employs over 1,000 people.
The county is also home to several small businesses, including restaurants, retail stores, and service providers. The county is also home to several farms, which produce corn, wheat, soybeans, and other crops.
Demographics
As of the 2010 census, the population of Union County was 27,134. The population density was 62 people per square mile. The racial makeup of the county was 95.3% White, 1.3% African American, 0.3% Native American, 0.5% Asian, 0.1% Pacific Islander, 1.2% from other races, and 1.3% from two or more races. Hispanic or Latino of any race were 3.2% of the population.
The median income for a household in the county was $45,837 and the median income for a family was $54,837. The per capita income for the county was $21,837. About 8.7% of families and 11.2% of the population were below the poverty line, including 15.2% of those under age 18 and 8.2% of those age 65 or over.
Common Questions
What is the Total Population of Union County?
Total Population of Union County is 7,041.
What is the Total Male Population of Union County?
Total Male Population of Union County is 3,487.
What is the Total Female Population of Union County?
Total Female Population of Union County is 3,554.
What is the Ratio of Males per 100 Females in Union County?
There are 98.11 Males per 100 Females in Union County.
What is the Ratio of Females per 100 Males in Union County?
There are 101.92 Females per 100 Males in Union County.
What is the Median Population Age in Union County?
Median Population Age in Union County is 44.5 Years.
What is the Average Family Size in Union County
Average Family Size in Union County is 2.8 People.
What is the Average Household Size in Union County
Average Household Size in Union County is 2.4 People.
What is Per Capita Income in Union County?
Per Capita income in Union County is $33,377.
What is the Median Family Income in Union County?
Median Family Income in Union County is $89,495.
What is the Median Household income in Union County?
Median Household Income in Union County is $68,514.
What is Income or Wage Gap in Union County?
Income or Wage Gap in Union County is 22.1%.
Women in Union County earn 77.9 cents for every dollar earned by a man.
What is Inequality or Gini Index in Union County?
Inequality or Gini Index in Union County is 0.38.
How Large is the Labor Force in Union County?
There are 3,762 People in the Labor Forcein in Union County.
What is the Percentage of People in the Labor Force in Union County?
65.4% of People are in the Labor Force in Union County.
What is the Unemployment Rate in Union County?
Unemployment Rate in Union County is 5.1%.