Tipton County, IN
Tipton County Map

Tipton County Overview
15,328
TOTAL POPULATION
7,637
MALE POPULATION
7,691
FEMALE POPULATION
99.30
MALES / 100 FEMALES
100.71
FEMALES / 100 MALES
44.4
MEDIAN AGE
2.8
AVG FAMILY SIZE
2.4
AVG HOUSEHOLD SIZE
$34,595
PER CAPITA INCOME
$81,180
AVG FAMILY INCOME
$71,947
AVG HOUSEHOLD INCOME
35.6%
WAGE / INCOME GAP [ % ]
64.4¢/ $1
WAGE / INCOME GAP [ $ ]
$12,074
FAMILY INCOME DEFICIT
0.37
INEQUALITY / GINI INDEX
7,783
LABOR FORCE [ PEOPLE ]
62.2%
PERCENT IN LABOR FORCE
3.8%
UNEMPLOYMENT RATE
Tipton County Area Codes
Race in Tipton County
The most populous races in Tipton County are White / Caucasian (14,705 | 95.9%), Hispanic or Latino (469 | 3.1%), and Two or more Races (326 | 2.1%).

| Race | # Population | % Population |
| Asian | 116 | 0.8% |
| Black / African American | 79 | 0.5% |
| Hawaiian / Pacific | 0 | 0.0% |
| Hispanic or Latino | 469 | 3.1% |
| Native / Alaskan | 17 | 0.1% |
| White / Caucasian | 14,705 | 95.9% |
| Two or more Races | 326 | 2.1% |
| Some other Race | 85 | 0.5% |
| Total | 15,328 | 100.0% |
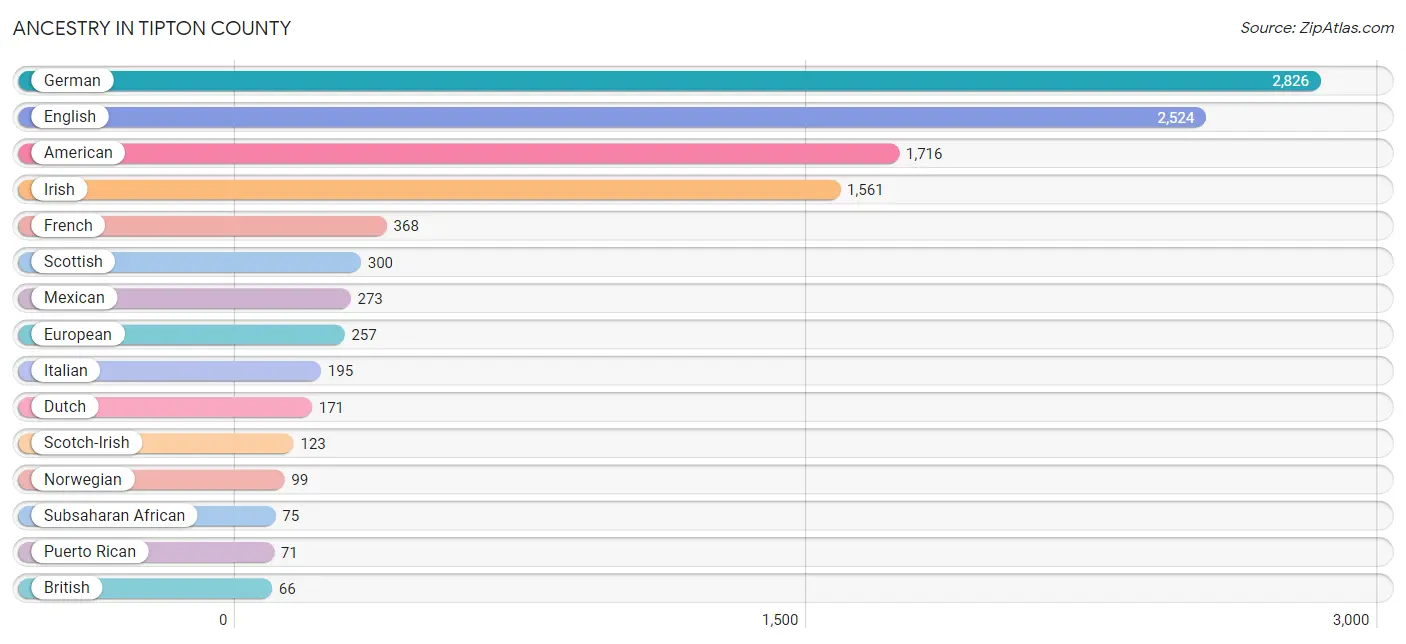
Ancestry in Tipton County
The most populous ancestries reported in Tipton County are German (2,826 | 18.4%), English (2,524 | 16.5%), American (1,716 | 11.2%), Irish (1,561 | 10.2%), and French (368 | 2.4%), together accounting for 58.7% of all Tipton County residents.
| Ancestry | # Population | % Population |
| African | 32 | 0.2% |
| American | 1,716 | 11.2% |
| Armenian | 9 | 0.1% |
| British | 66 | 0.4% |
| Canadian | 3 | 0.0% |
| Central American | 42 | 0.3% |
| Cherokee | 12 | 0.1% |
| Comanche | 18 | 0.1% |
| Cuban | 30 | 0.2% |
| Danish | 2 | 0.0% |
| Dutch | 171 | 1.1% |
| Eastern European | 45 | 0.3% |
| English | 2,524 | 16.5% |
| Ethiopian | 31 | 0.2% |
| European | 257 | 1.7% |
| French | 368 | 2.4% |
| French American Indian | 9 | 0.1% |
| French Canadian | 5 | 0.0% |
| German | 2,826 | 18.4% |
| Ghanaian | 5 | 0.0% |
| Greek | 31 | 0.2% |
| Guatemalan | 1 | 0.0% |
| Hungarian | 3 | 0.0% |
| Indian (Asian) | 59 | 0.4% |
| Iranian | 16 | 0.1% |
| Irish | 1,561 | 10.2% |
| Italian | 195 | 1.3% |
| Korean | 64 | 0.4% |
| Mexican | 273 | 1.8% |
| Native Hawaiian | 7 | 0.1% |
| Norwegian | 99 | 0.6% |
| Pakistani | 16 | 0.1% |
| Pennsylvania German | 31 | 0.2% |
| Polish | 62 | 0.4% |
| Puerto Rican | 71 | 0.5% |
| Salvadoran | 41 | 0.3% |
| Scandinavian | 17 | 0.1% |
| Scotch-Irish | 123 | 0.8% |
| Scottish | 300 | 2.0% |
| Seminole | 11 | 0.1% |
| Sierra Leonean | 7 | 0.1% |
| Slovak | 46 | 0.3% |
| Spanish | 53 | 0.4% |
| Sri Lankan | 22 | 0.1% |
| Subsaharan African | 75 | 0.5% |
| Swedish | 14 | 0.1% |
| Swiss | 48 | 0.3% |
| Thai | 18 | 0.1% |
| Welsh | 41 | 0.3% | View All 49 Rows |
Immigrants in Tipton County
The most numerous immigrant groups reported in Tipton County came from Asia (58 | 0.4%), Latin America (47 | 0.3%), Africa (31 | 0.2%), Eastern Africa (31 | 0.2%), and Ethiopia (31 | 0.2%), together accounting for 1.3% of all Tipton County residents.

| Immigration Origin | # Population | % Population |
| Africa | 31 | 0.2% |
| Asia | 58 | 0.4% |
| Australia | 15 | 0.1% |
| Caribbean | 4 | 0.0% |
| Central America | 21 | 0.1% |
| China | 22 | 0.1% |
| Colombia | 22 | 0.1% |
| Cuba | 4 | 0.0% |
| Eastern Africa | 31 | 0.2% |
| Eastern Asia | 22 | 0.1% |
| Eastern Europe | 21 | 0.1% |
| Ethiopia | 31 | 0.2% |
| Europe | 24 | 0.2% |
| Germany | 3 | 0.0% |
| Guatemala | 1 | 0.0% |
| India | 10 | 0.1% |
| Latin America | 47 | 0.3% |
| Mexico | 20 | 0.1% |
| Oceania | 15 | 0.1% |
| Philippines | 17 | 0.1% |
| Russia | 21 | 0.1% |
| Saudi Arabia | 9 | 0.1% |
| South America | 22 | 0.1% |
| South Central Asia | 10 | 0.1% |
| South Eastern Asia | 17 | 0.1% |
| Western Asia | 9 | 0.1% |
| Western Europe | 3 | 0.0% | View All 27 Rows |
Sex and Age in Tipton County
Sex and Age in Tipton County
The most populous age groups in Tipton County are 50 to 54 Years (583 | 7.6%) for men and 60 to 64 Years (590 | 7.7%) for women.

| Age Bracket | Male | Female |
| Under 5 Years | 451 (5.9%) | 482 (6.3%) |
| 5 to 9 Years | 499 (6.5%) | 379 (4.9%) |
| 10 to 14 Years | 326 (4.3%) | 466 (6.1%) |
| 15 to 19 Years | 444 (5.8%) | 466 (6.1%) |
| 20 to 24 Years | 461 (6.0%) | 376 (4.9%) |
| 25 to 29 Years | 487 (6.4%) | 491 (6.4%) |
| 30 to 34 Years | 420 (5.5%) | 415 (5.4%) |
| 35 to 39 Years | 450 (5.9%) | 468 (6.1%) |
| 40 to 44 Years | 382 (5.0%) | 308 (4.0%) |
| 45 to 49 Years | 485 (6.4%) | 478 (6.2%) |
| 50 to 54 Years | 583 (7.6%) | 499 (6.5%) |
| 55 to 59 Years | 563 (7.4%) | 513 (6.7%) |
| 60 to 64 Years | 567 (7.4%) | 590 (7.7%) |
| 65 to 69 Years | 447 (5.9%) | 468 (6.1%) |
| 70 to 74 Years | 457 (6.0%) | 470 (6.1%) |
| 75 to 79 Years | 250 (3.3%) | 415 (5.4%) |
| 80 to 84 Years | 276 (3.6%) | 229 (3.0%) |
| 85 Years and over | 89 (1.2%) | 178 (2.3%) |
| Total | 7,637 (100.0%) | 7,691 (100.0%) |
Families and Households in Tipton County
Median Family Size in Tipton County
The median family size in Tipton County is 2.78 persons per family, with married-couple families (3,882 | 83.1%) accounting for the largest median family size of 2.87 persons per family. On the other hand, single male/father families (337 | 7.2%) represent the smallest median family size with 2.06 persons per family.

| Family Type | # Families | Family Size |
| Married-Couple | 3,882 (83.1%) | 2.87 |
| Single Male/Father | 337 (7.2%) | 2.06 |
| Single Female/Mother | 450 (9.6%) | 2.56 |
| Total Families | 4,669 (100.0%) | 2.78 |
Median Household Size in Tipton County
The median household size in Tipton County is 2.44 persons per household, with married-couple households (3,882 | 62.9%) accounting for the largest median household size of 2.88 persons per household. non-family households (1,501 | 24.3%) represent the smallest median household size with 1.18 persons per household.

| Household Type | # Households | Household Size |
| Married-Couple | 3,882 (62.9%) | 2.88 |
| Single Male/Father | 337 (5.5%) | 2.59 |
| Single Female/Mother | 450 (7.3%) | 2.81 |
| Non-family | 1,501 (24.3%) | 1.18 |
| Total Households | 6,170 (100.0%) | 2.44 |
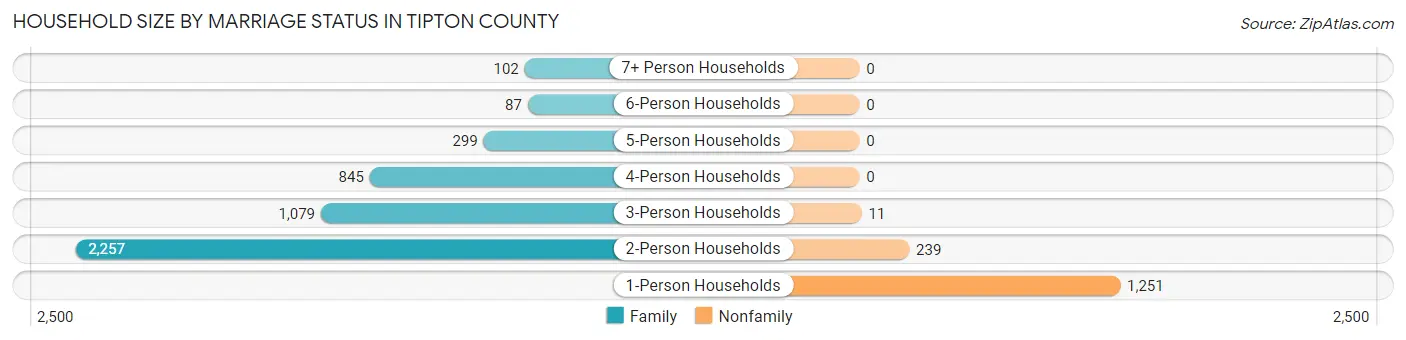
Household Size by Marriage Status in Tipton County
Out of a total of 6,170 households in Tipton County, 4,669 (75.7%) are family households, while 1,501 (24.3%) are nonfamily households. The most numerous type of family households are 2-person households, comprising 2,257, and the most common type of nonfamily households are 1-person households, comprising 1,251.
| Household Size | Family Households | Nonfamily Households |
| 1-Person Households | - | 1,251 (20.3%) |
| 2-Person Households | 2,257 (36.6%) | 239 (3.9%) |
| 3-Person Households | 1,079 (17.5%) | 11 (0.2%) |
| 4-Person Households | 845 (13.7%) | 0 (0.0%) |
| 5-Person Households | 299 (4.9%) | 0 (0.0%) |
| 6-Person Households | 87 (1.4%) | 0 (0.0%) |
| 7+ Person Households | 102 (1.7%) | 0 (0.0%) |
| Total | 4,669 (75.7%) | 1,501 (24.3%) |
Female Fertility in Tipton County
Fertility by Age in Tipton County
Average fertility rate in Tipton County is 76.0 births per 1,000 women. Women in the age bracket of 20 to 34 years have the highest fertility rate with 122.0 births per 1,000 women. Women in the age bracket of 20 to 34 years acount for 65.4% of all women with births.

| Age Bracket | Women with Births | Births / 1,000 Women |
| 15 to 19 years | 11 (4.6%) | 24.0 |
| 20 to 34 years | 157 (65.4%) | 122.0 |
| 35 to 50 years | 72 (30.0%) | 52.0 |
| Total | 240 (100.0%) | 76.0 |
Fertility by Age by Marriage Status in Tipton County
92.5% of women with births (240) in Tipton County are married. The highest percentage of unmarried women with births falls into 15 to 19 years age bracket with 100.0% of them unmarried at the time of birth, while the lowest percentage of unmarried women with births belong to 35 to 50 years age bracket with 0.0% of them unmarried.

| Age Bracket | Married | Unmarried |
| 15 to 19 years | 0 (0.0%) | 11 (100.0%) |
| 20 to 34 years | 150 (95.5%) | 7 (4.5%) |
| 35 to 50 years | 72 (100.0%) | 0 (0.0%) |
| Total | 222 (92.5%) | 18 (7.5%) |
Fertility by Education in Tipton County

| Educational Attainment | Women with Births | Births / 1,000 Women |
| Less than High School | 18 (7.5%) | 28.0 |
| High School Diploma | 26 (10.8%) | 42.0 |
| College or Associate's Degree | 101 (42.1%) | 117.0 |
| Bachelor's Degree | 95 (39.6%) | 117.0 |
| Graduate Degree | 0 (0.0%) | 0.0 |
| Total | 240 (100.0%) | 76.0 |
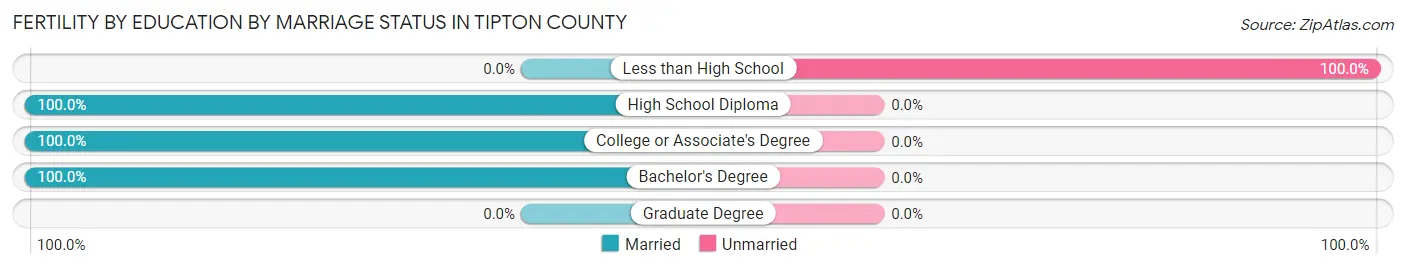
Fertility by Education by Marriage Status in Tipton County
7.5% of women with births in Tipton County are unmarried. Women with the educational attainment of high school diploma are most likely to be married with 100.0% of them married at childbirth, while women with the educational attainment of less than high school are least likely to be married with 100.0% of them unmarried at childbirth.
| Educational Attainment | Married | Unmarried |
| Less than High School | 0 (0.0%) | 18 (100.0%) |
| High School Diploma | 26 (100.0%) | 0 (0.0%) |
| College or Associate's Degree | 101 (100.0%) | 0 (0.0%) |
| Bachelor's Degree | 95 (100.0%) | 0 (0.0%) |
| Graduate Degree | 0 (0.0%) | 0 (0.0%) |
| Total | 222 (92.5%) | 18 (7.5%) |
Income in Tipton County
Income Overview in Tipton County
Per Capita Income in Tipton County is $34,595, while median incomes of families and households are $81,180 and $71,947 respectively.
| Characteristic | Number | Measure |
| Per Capita Income | 15,328 | $34,595 |
| Median Family Income | 4,669 | $81,180 |
| Mean Family Income | 4,669 | $95,029 |
| Median Household Income | 6,170 | $71,947 |
| Mean Household Income | 6,170 | $85,471 |
| Income Deficit | 4,669 | $12,074 |
| Wage / Income Gap (%) | 15,328 | 35.57% |
| Wage / Income Gap ($) | 15,328 | 64.43¢ per $1 |
| Gini / Inequality Index | 15,328 | 0.37 |
Earnings by Sex in Tipton County
Average Earnings in Tipton County are $45,636, $53,050 for men and $34,178 for women, a difference of 35.6%.

| Sex | Number | Average Earnings |
| Male | 4,326 (54.3%) | $53,050 |
| Female | 3,639 (45.7%) | $34,178 |
| Total | 7,965 (100.0%) | $45,636 |
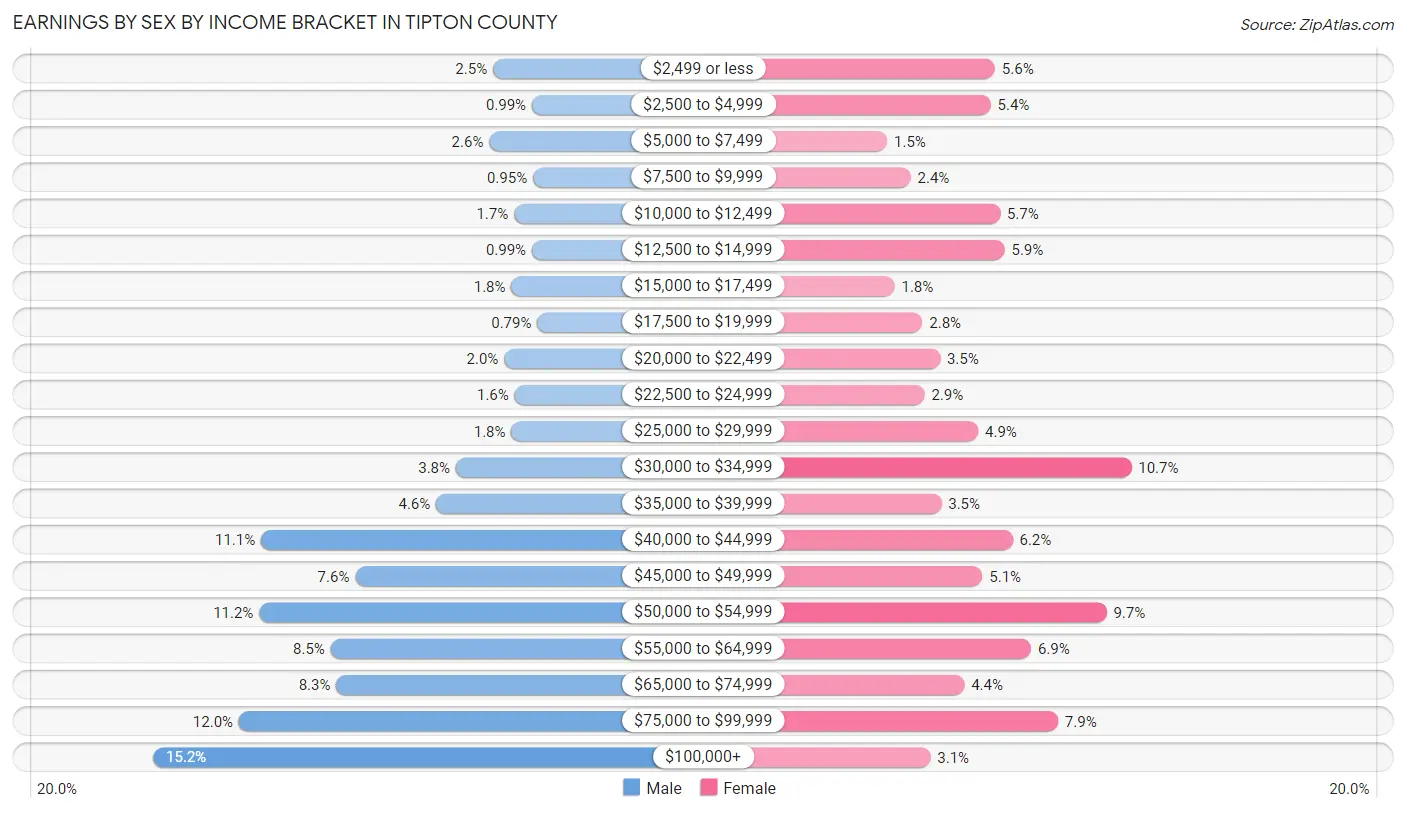
Earnings by Sex by Income Bracket in Tipton County
The most common earnings brackets in Tipton County are $100,000+ for men (657 | 15.2%) and $30,000 to $34,999 for women (388 | 10.7%).
| Income | Male | Female |
| $2,499 or less | 106 (2.5%) | 202 (5.6%) |
| $2,500 to $4,999 | 43 (1.0%) | 196 (5.4%) |
| $5,000 to $7,499 | 112 (2.6%) | 55 (1.5%) |
| $7,500 to $9,999 | 41 (0.9%) | 87 (2.4%) |
| $10,000 to $12,499 | 72 (1.7%) | 209 (5.7%) |
| $12,500 to $14,999 | 43 (1.0%) | 215 (5.9%) |
| $15,000 to $17,499 | 76 (1.8%) | 65 (1.8%) |
| $17,500 to $19,999 | 34 (0.8%) | 103 (2.8%) |
| $20,000 to $22,499 | 88 (2.0%) | 127 (3.5%) |
| $22,500 to $24,999 | 71 (1.6%) | 106 (2.9%) |
| $25,000 to $29,999 | 76 (1.8%) | 179 (4.9%) |
| $30,000 to $34,999 | 166 (3.8%) | 388 (10.7%) |
| $35,000 to $39,999 | 198 (4.6%) | 129 (3.5%) |
| $40,000 to $44,999 | 482 (11.1%) | 226 (6.2%) |
| $45,000 to $49,999 | 329 (7.6%) | 185 (5.1%) |
| $50,000 to $54,999 | 485 (11.2%) | 354 (9.7%) |
| $55,000 to $64,999 | 369 (8.5%) | 251 (6.9%) |
| $65,000 to $74,999 | 360 (8.3%) | 160 (4.4%) |
| $75,000 to $99,999 | 518 (12.0%) | 288 (7.9%) |
| $100,000+ | 657 (15.2%) | 114 (3.1%) |
| Total | 4,326 (100.0%) | 3,639 (100.0%) |
Earnings by Sex by Educational Attainment in Tipton County
Average earnings in Tipton County are $54,413 for men and $36,134 for women, a difference of 33.6%. Men with an educational attainment of graduate degree enjoy the highest average annual earnings of $71,906, while those with less than high school education earn the least with $44,917. Women with an educational attainment of graduate degree earn the most with the average annual earnings of $64,750, while those with less than high school education have the smallest earnings of $11,495.

| Educational Attainment | Male Income | Female Income |
| Less than High School | $44,917 | $11,495 |
| High School Diploma | $53,128 | $29,792 |
| College or Associate's Degree | $59,095 | $32,642 |
| Bachelor's Degree | $62,636 | $52,154 |
| Graduate Degree | $71,906 | $64,750 |
| Total | $54,413 | $36,134 |
Family Income in Tipton County
Family Income Brackets in Tipton County
According to the Tipton County family income data, there are 1,074 families falling into the $50,000 to $74,999 income range, which is the most common income bracket and makes up 23.0% of all families. Conversely, the $10,000 to $14,999 income bracket is the least frequent group with only 65 families (1.4%) belonging to this category.

| Income Bracket | # Families | % Families |
| Less than $10,000 | 173 | 3.7% |
| $10,000 to $14,999 | 65 | 1.4% |
| $15,000 to $24,999 | 117 | 2.5% |
| $25,000 to $34,999 | 271 | 5.8% |
| $35,000 to $49,999 | 467 | 10.0% |
| $50,000 to $74,999 | 1,074 | 23.0% |
| $75,000 to $99,999 | 705 | 15.1% |
| $100,000 to $149,999 | 1,032 | 22.1% |
| $150,000 to $199,999 | 523 | 11.2% |
| $200,000+ | 243 | 5.2% |
Family Income by Famaliy Size in Tipton County
6-person families (80 | 1.7%) account for the highest median family income in Tipton County with $146,250 per family, while 2-person families (2,450 | 52.5%) have the highest median income of $39,000 per family member.

| Income Bracket | # Families | Median Income |
| 2-Person Families | 2,450 (52.5%) | $78,000 |
| 3-Person Families | 969 (20.7%) | $68,351 |
| 4-Person Families | 835 (17.9%) | $129,323 |
| 5-Person Families | 236 (5.1%) | $110,769 |
| 6-Person Families | 80 (1.7%) | $146,250 |
| 7+ Person Families | 99 (2.1%) | $55,521 |
| Total | 4,669 (100.0%) | $81,180 |
Family Income by Number of Earners in Tipton County
The median family income in Tipton County is $81,180, with families comprising 3+ earners (428) having the highest median family income of $137,214, while families with no earners (833) have the lowest median family income of $44,291, accounting for 9.2% and 17.8% of families, respectively.

| Number of Earners | # Families | Median Income |
| No Earners | 833 (17.8%) | $44,291 |
| 1 Earner | 1,366 (29.3%) | $64,722 |
| 2 Earners | 2,042 (43.7%) | $110,184 |
| 3+ Earners | 428 (9.2%) | $137,214 |
| Total | 4,669 (100.0%) | $81,180 |
Household Income in Tipton County
Household Income Brackets in Tipton County
With 1,234 households falling in the category, the $100,000 to $149,999 income range is the most frequent in Tipton County, accounting for 20.0% of all households. In contrast, only 111 households (1.8%) fall into the $10,000 to $14,999 income bracket, making it the least populous group.

| Income Bracket | # Households | % Households |
| Less than $10,000 | 259 | 4.2% |
| $10,000 to $14,999 | 111 | 1.8% |
| $15,000 to $24,999 | 321 | 5.2% |
| $25,000 to $34,999 | 450 | 7.3% |
| $35,000 to $49,999 | 839 | 13.6% |
| $50,000 to $74,999 | 1,166 | 18.9% |
| $75,000 to $99,999 | 987 | 16.0% |
| $100,000 to $149,999 | 1,234 | 20.0% |
| $150,000 to $199,999 | 555 | 9.0% |
| $200,000+ | 247 | 4.0% |
Household Income by Householder Age in Tipton County
The median household income in Tipton County is $71,947, with the highest median household income of $82,877 found in the 45 to 64 years age bracket for the primary householder. A total of 2,436 households (39.5%) fall into this category. Meanwhile, the 15 to 24 years age bracket for the primary householder has the lowest median household income of $0, with 222 households (3.6%) in this group.

| Income Bracket | # Households | Median Income |
| 15 to 24 Years | 222 (3.6%) | $0 |
| 25 to 44 Years | 1,631 (26.4%) | $79,477 |
| 45 to 64 Years | 2,436 (39.5%) | $82,877 |
| 65+ Years | 1,881 (30.5%) | $51,234 |
| Total | 6,170 (100.0%) | $71,947 |
Poverty in Tipton County
Income Below Poverty by Sex and Age in Tipton County
With 8.7% poverty level for males and 15.5% for females among the residents of Tipton County, 5 year old males and under 5 year old females are the most vulnerable to poverty, with 35 males (67.3%) and 141 females (29.9%) in their respective age groups living below the poverty level.

| Age Bracket | Male | Female |
| Under 5 Years | 24 (5.3%) | 141 (29.9%) |
| 5 Years | 35 (67.3%) | 5 (7.5%) |
| 6 to 11 Years | 129 (20.2%) | 103 (22.3%) |
| 12 to 14 Years | 26 (19.3%) | 51 (16.6%) |
| 15 Years | 0 (0.0%) | 22 (15.5%) |
| 16 and 17 Years | 16 (7.8%) | 24 (15.3%) |
| 18 to 24 Years | 46 (7.3%) | 134 (24.7%) |
| 25 to 34 Years | 45 (5.0%) | 239 (26.4%) |
| 35 to 44 Years | 49 (5.9%) | 177 (23.0%) |
| 45 to 54 Years | 124 (11.7%) | 38 (3.9%) |
| 55 to 64 Years | 59 (5.2%) | 138 (12.5%) |
| 65 to 74 Years | 54 (6.0%) | 39 (4.2%) |
| 75 Years and over | 46 (8.4%) | 57 (7.9%) |
| Total | 653 (8.7%) | 1,168 (15.5%) |
Income Above Poverty by Sex and Age in Tipton County
According to the poverty statistics in Tipton County, males aged 15 years and females aged 45 to 54 years are the age groups that are most secure financially, with 100.0% of males and 96.1% of females in these age groups living above the poverty line.
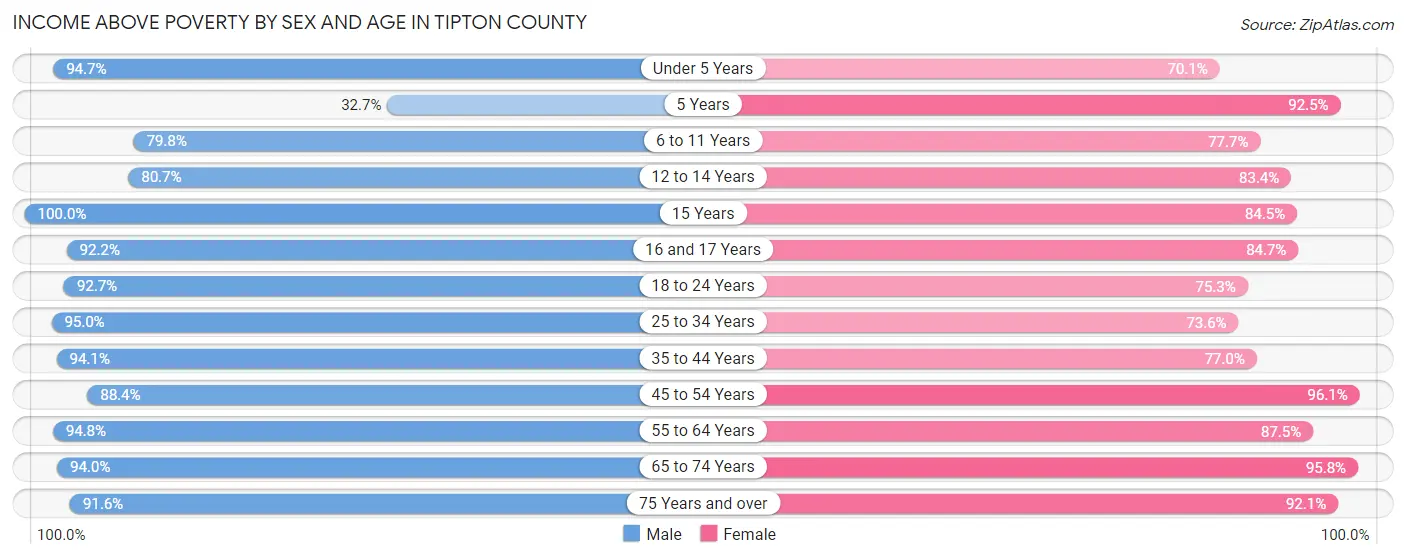
| Age Bracket | Male | Female |
| Under 5 Years | 427 (94.7%) | 331 (70.1%) |
| 5 Years | 17 (32.7%) | 62 (92.5%) |
| 6 to 11 Years | 509 (79.8%) | 358 (77.7%) |
| 12 to 14 Years | 109 (80.7%) | 256 (83.4%) |
| 15 Years | 70 (100.0%) | 120 (84.5%) |
| 16 and 17 Years | 189 (92.2%) | 133 (84.7%) |
| 18 to 24 Years | 584 (92.7%) | 409 (75.3%) |
| 25 to 34 Years | 857 (95.0%) | 667 (73.6%) |
| 35 to 44 Years | 778 (94.1%) | 593 (77.0%) |
| 45 to 54 Years | 940 (88.3%) | 939 (96.1%) |
| 55 to 64 Years | 1,066 (94.8%) | 963 (87.5%) |
| 65 to 74 Years | 842 (94.0%) | 889 (95.8%) |
| 75 Years and over | 500 (91.6%) | 664 (92.1%) |
| Total | 6,888 (91.3%) | 6,384 (84.5%) |
Income Below Poverty Among Married-Couple Families in Tipton County
The poverty statistics for married-couple families in Tipton County show that 5.4% or 209 of the total 3,882 families live below the poverty line. Families with 5 or more children have the highest poverty rate of 41.0%, comprising of 25 families. On the other hand, families with no children have the lowest poverty rate of 2.8%, which includes 67 families.
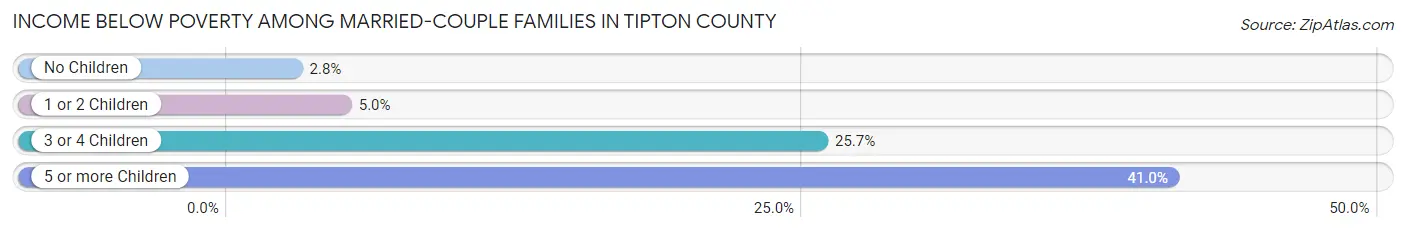
| Children | Above Poverty | Below Poverty |
| No Children | 2,319 (97.2%) | 67 (2.8%) |
| 1 or 2 Children | 1,153 (95.1%) | 60 (5.0%) |
| 3 or 4 Children | 165 (74.3%) | 57 (25.7%) |
| 5 or more Children | 36 (59.0%) | 25 (41.0%) |
| Total | 3,673 (94.6%) | 209 (5.4%) |
Income Below Poverty Among Single-Parent Households in Tipton County
According to the poverty data in Tipton County, 8.0% or 27 single-father households and 37.8% or 170 single-mother households are living below the poverty line. Among single-father households, those with no children have the highest poverty rate, with 13 households (31.7%) experiencing poverty. Likewise, among single-mother households, those with 3 or 4 children have the highest poverty rate, with 27 households (100.0%) falling below the poverty line.
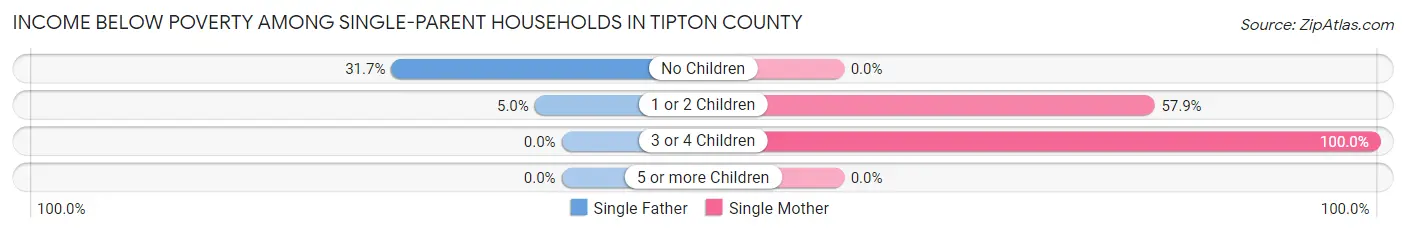
| Children | Single Father | Single Mother |
| No Children | 13 (31.7%) | 0 (0.0%) |
| 1 or 2 Children | 14 (5.0%) | 143 (57.9%) |
| 3 or 4 Children | 0 (0.0%) | 27 (100.0%) |
| 5 or more Children | 0 (0.0%) | 0 (0.0%) |
| Total | 27 (8.0%) | 170 (37.8%) |
Income Below Poverty Among Married-Couple vs Single-Parent Households in Tipton County
The poverty data for Tipton County shows that 209 of the married-couple family households (5.4%) and 197 of the single-parent households (25.0%) are living below the poverty level. Within the married-couple family households, those with 5 or more children have the highest poverty rate, with 25 households (41.0%) falling below the poverty line. Among the single-parent households, those with 3 or 4 children have the highest poverty rate, with 27 household (62.8%) living below poverty.

| Children | Married-Couple Families | Single-Parent Households |
| No Children | 67 (2.8%) | 13 (6.0%) |
| 1 or 2 Children | 60 (5.0%) | 157 (29.8%) |
| 3 or 4 Children | 57 (25.7%) | 27 (62.8%) |
| 5 or more Children | 25 (41.0%) | 0 (0.0%) |
| Total | 209 (5.4%) | 197 (25.0%) |
Employment Characteristics in Tipton County
Employment by Class of Employer in Tipton County
Among the 7,268 employed individuals in Tipton County, private company employees (5,026 | 69.2%), local government employees (923 | 12.7%), and not-for-profit organizations (539 | 7.4%) make up the most common classes of employment.

| Employer Class | # Employees | % Employees |
| Private Company Employees | 5,026 | 69.2% |
| Self-Employed (Incorporated) | 199 | 2.7% |
| Self-Employed (Not Incorporated) | 319 | 4.4% |
| Not-for-profit Organizations | 539 | 7.4% |
| Local Government Employees | 923 | 12.7% |
| State Government Employees | 143 | 2.0% |
| Federal Government Employees | 119 | 1.6% |
| Unpaid Family Workers | 0 | 0.0% |
| Total | 7,268 | 100.0% |
Employment Status by Age in Tipton County
According to the labor force statistics for Tipton County, out of the total population over 16 years of age (12,513), 62.2% or 7,783 individuals are in the labor force, with 3.8% or 296 of them unemployed. The age group with the highest labor force participation rate is 25 to 29 years, with 89.4% or 874 individuals in the labor force. Within the labor force, the 16 to 19 years age range has the highest percentage of unemployed individuals, with 19.0% or 56 of them being unemployed.

| Age Bracket | In Labor Force | Unemployed |
| 16 to 19 Years | 295 (42.3%) | 56 (19.0%) |
| 20 to 24 Years | 697 (83.3%) | 26 (3.7%) |
| 25 to 29 Years | 874 (89.4%) | 21 (2.4%) |
| 30 to 34 Years | 729 (87.3%) | 14 (1.9%) |
| 35 to 44 Years | 1,405 (87.4%) | 38 (2.7%) |
| 45 to 54 Years | 1,761 (86.1%) | 123 (7.0%) |
| 55 to 59 Years | 799 (74.3%) | 6 (0.8%) |
| 60 to 64 Years | 751 (64.9%) | 9 (1.2%) |
| 65 to 74 Years | 418 (22.7%) | 6 (1.4%) |
| 75 Years and over | 55 (3.8%) | 0 (0.0%) |
| Total | 7,783 (62.2%) | 296 (3.8%) |
Employment Status by Educational Attainment in Tipton County
According to labor force statistics for Tipton County, 82.1% of individuals (6,321) out of the total population between 25 and 64 years of age (7,699) are in the labor force, with 3.3% or 209 of them being unemployed. The group with the highest labor force participation rate are those with the educational attainment of bachelor's degree or higher, with 94.2% or 1,950 individuals in the labor force. Within the labor force, individuals with less than high school education have the highest percentage of unemployment, with 7.6% or 28 of them being unemployed.
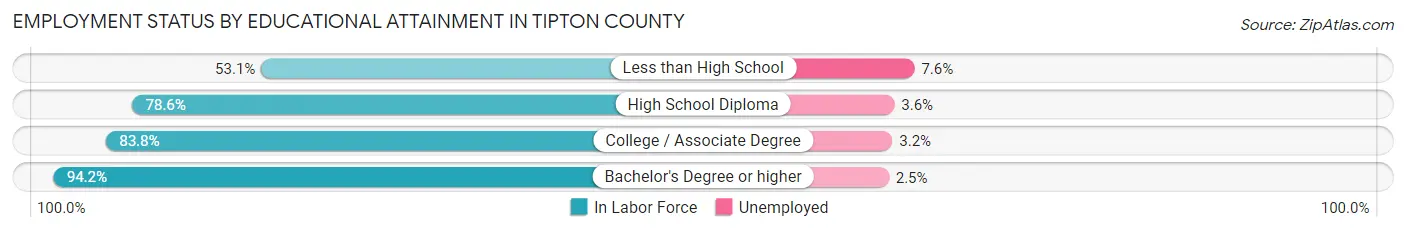
| Educational Attainment | In Labor Force | Unemployed |
| Less than High School | 367 (53.1%) | 53 (7.6%) |
| High School Diploma | 2,014 (78.6%) | 92 (3.6%) |
| College / Associate Degree | 1,991 (83.8%) | 76 (3.2%) |
| Bachelor's Degree or higher | 1,950 (94.2%) | 52 (2.5%) |
| Total | 6,321 (82.1%) | 254 (3.3%) |
Employment Occupations by Sex in Tipton County
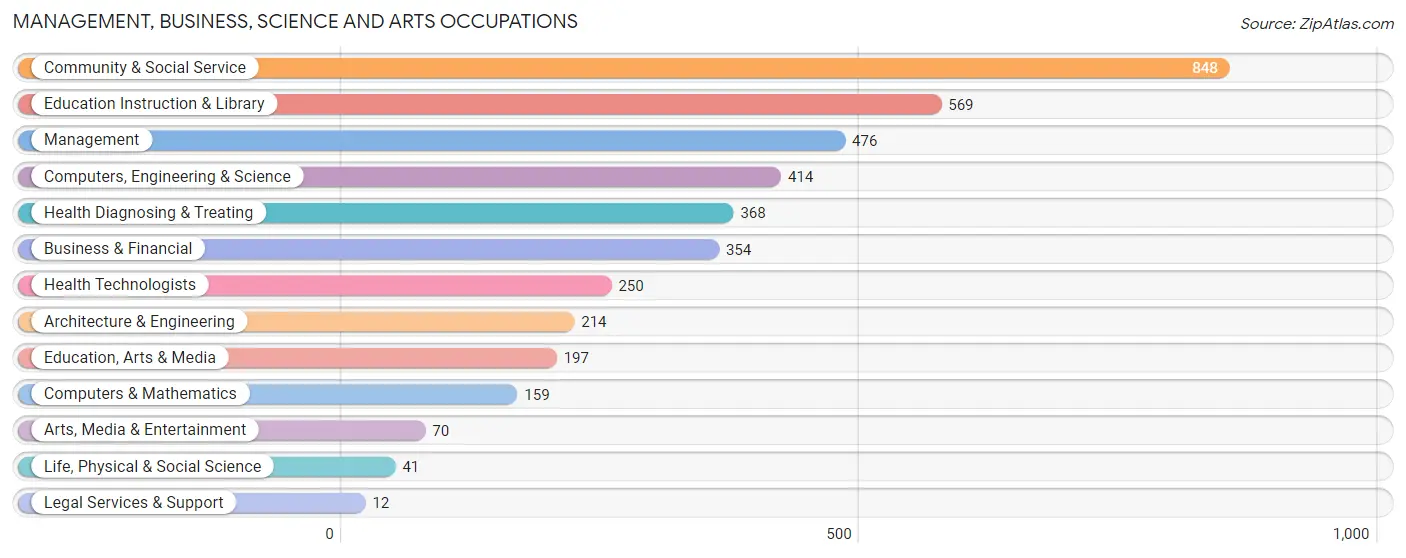
Management, Business, Science and Arts Occupations
The most common Management, Business, Science and Arts occupations in Tipton County are Community & Social Service (848 | 11.4%), Education Instruction & Library (569 | 7.6%), Management (476 | 6.4%), Computers, Engineering & Science (414 | 5.5%), and Health Diagnosing & Treating (368 | 4.9%).
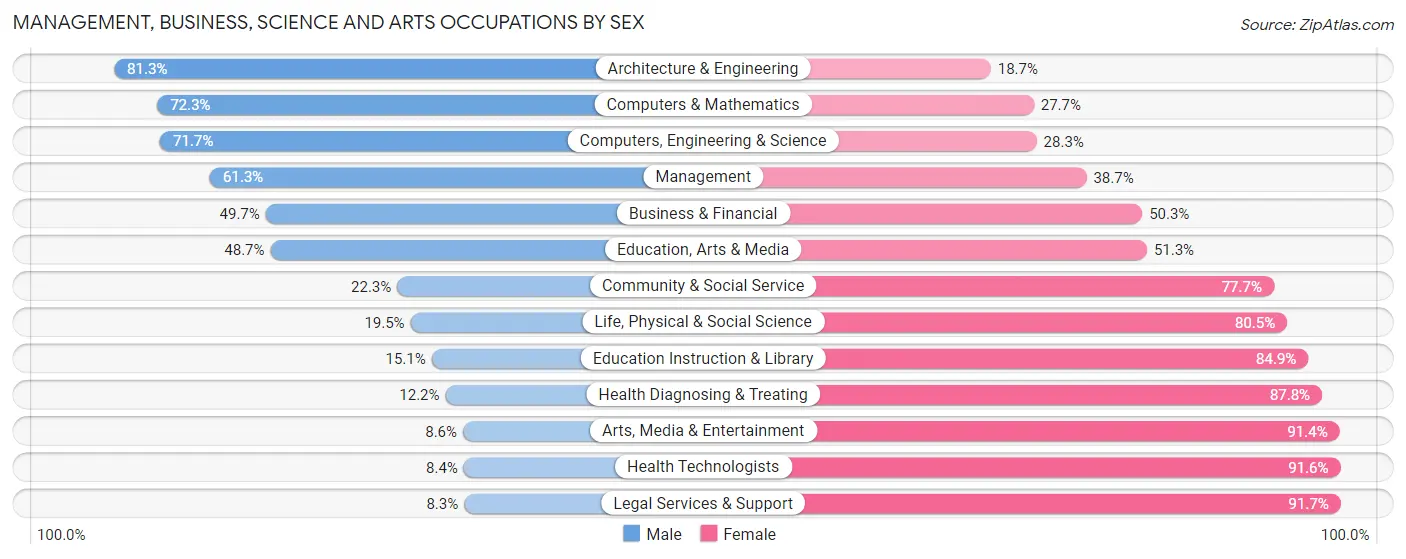
Management, Business, Science and Arts Occupations by Sex
Within the Management, Business, Science and Arts occupations in Tipton County, the most male-oriented occupations are Architecture & Engineering (81.3%), Computers & Mathematics (72.3%), and Computers, Engineering & Science (71.7%), while the most female-oriented occupations are Legal Services & Support (91.7%), Health Technologists (91.6%), and Arts, Media & Entertainment (91.4%).
| Occupation | Male | Female |
| Management | 292 (61.3%) | 184 (38.7%) |
| Business & Financial | 176 (49.7%) | 178 (50.3%) |
| Computers, Engineering & Science | 297 (71.7%) | 117 (28.3%) |
| Computers & Mathematics | 115 (72.3%) | 44 (27.7%) |
| Architecture & Engineering | 174 (81.3%) | 40 (18.7%) |
| Life, Physical & Social Science | 8 (19.5%) | 33 (80.5%) |
| Community & Social Service | 189 (22.3%) | 659 (77.7%) |
| Education, Arts & Media | 96 (48.7%) | 101 (51.3%) |
| Legal Services & Support | 1 (8.3%) | 11 (91.7%) |
| Education Instruction & Library | 86 (15.1%) | 483 (84.9%) |
| Arts, Media & Entertainment | 6 (8.6%) | 64 (91.4%) |
| Health Diagnosing & Treating | 45 (12.2%) | 323 (87.8%) |
| Health Technologists | 21 (8.4%) | 229 (91.6%) |
| Total (Category) | 999 (40.6%) | 1,461 (59.4%) |
| Total (Overall) | 4,056 (54.3%) | 3,414 (45.7%) |
Services Occupations
The most common Services occupations in Tipton County are Food Preparation & Serving (301 | 4.0%), Cleaning & Maintenance (296 | 4.0%), Security & Protection (195 | 2.6%), Healthcare Support (173 | 2.3%), and Law Enforcement (143 | 1.9%).

Services Occupations by Sex
Within the Services occupations in Tipton County, the most male-oriented occupations are Law Enforcement (99.3%), Security & Protection (78.5%), and Cleaning & Maintenance (69.9%), while the most female-oriented occupations are Healthcare Support (95.4%), Firefighting & Prevention (78.8%), and Personal Care & Service (63.4%).

| Occupation | Male | Female |
| Healthcare Support | 8 (4.6%) | 165 (95.4%) |
| Security & Protection | 153 (78.5%) | 42 (21.5%) |
| Firefighting & Prevention | 11 (21.1%) | 41 (78.8%) |
| Law Enforcement | 142 (99.3%) | 1 (0.7%) |
| Food Preparation & Serving | 131 (43.5%) | 170 (56.5%) |
| Cleaning & Maintenance | 207 (69.9%) | 89 (30.1%) |
| Personal Care & Service | 34 (36.6%) | 59 (63.4%) |
| Total (Category) | 533 (50.4%) | 525 (49.6%) |
| Total (Overall) | 4,056 (54.3%) | 3,414 (45.7%) |
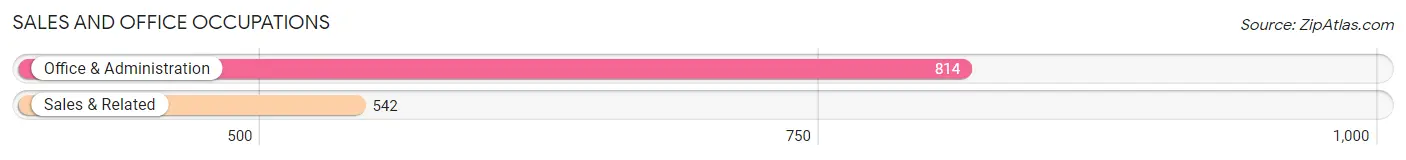
Sales and Office Occupations
The most common Sales and Office occupations in Tipton County are Office & Administration (814 | 10.9%), and Sales & Related (542 | 7.3%).
Sales and Office Occupations by Sex
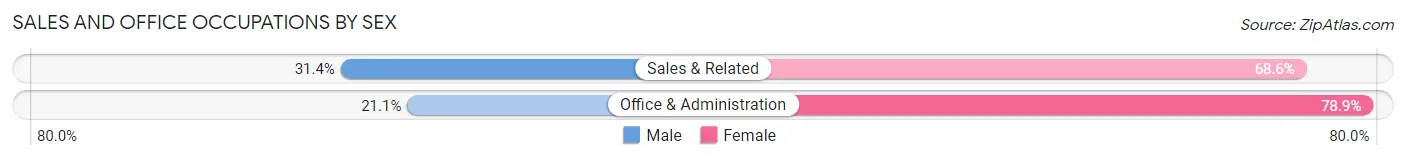
| Occupation | Male | Female |
| Sales & Related | 170 (31.4%) | 372 (68.6%) |
| Office & Administration | 172 (21.1%) | 642 (78.9%) |
| Total (Category) | 342 (25.2%) | 1,014 (74.8%) |
| Total (Overall) | 4,056 (54.3%) | 3,414 (45.7%) |
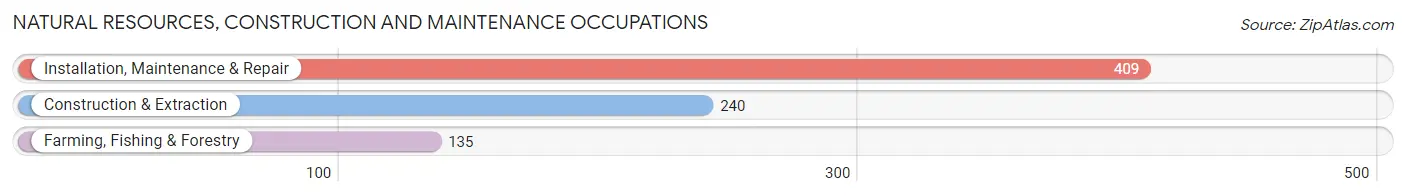
Natural Resources, Construction and Maintenance Occupations
The most common Natural Resources, Construction and Maintenance occupations in Tipton County are Installation, Maintenance & Repair (409 | 5.5%), Construction & Extraction (240 | 3.2%), and Farming, Fishing & Forestry (135 | 1.8%).
Natural Resources, Construction and Maintenance Occupations by Sex
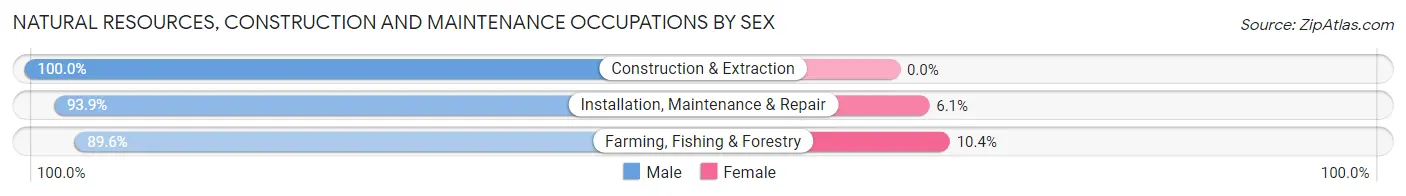
| Occupation | Male | Female |
| Farming, Fishing & Forestry | 121 (89.6%) | 14 (10.4%) |
| Construction & Extraction | 240 (100.0%) | 0 (0.0%) |
| Installation, Maintenance & Repair | 384 (93.9%) | 25 (6.1%) |
| Total (Category) | 745 (95.0%) | 39 (5.0%) |
| Total (Overall) | 4,056 (54.3%) | 3,414 (45.7%) |
Production, Transportation and Moving Occupations
The most common Production, Transportation and Moving occupations in Tipton County are Production (969 | 13.0%), Material Moving (549 | 7.3%), and Transportation (294 | 3.9%).

Production, Transportation and Moving Occupations by Sex
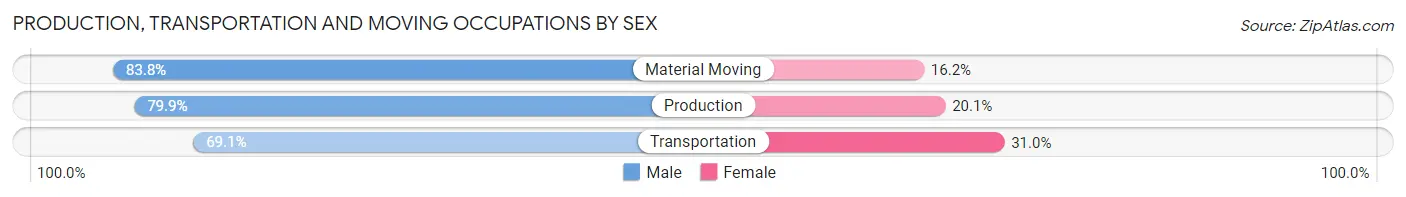
| Occupation | Male | Female |
| Production | 774 (79.9%) | 195 (20.1%) |
| Transportation | 203 (69.1%) | 91 (30.9%) |
| Material Moving | 460 (83.8%) | 89 (16.2%) |
| Total (Category) | 1,437 (79.3%) | 375 (20.7%) |
| Total (Overall) | 4,056 (54.3%) | 3,414 (45.7%) |
Employment Industries by Sex in Tipton County
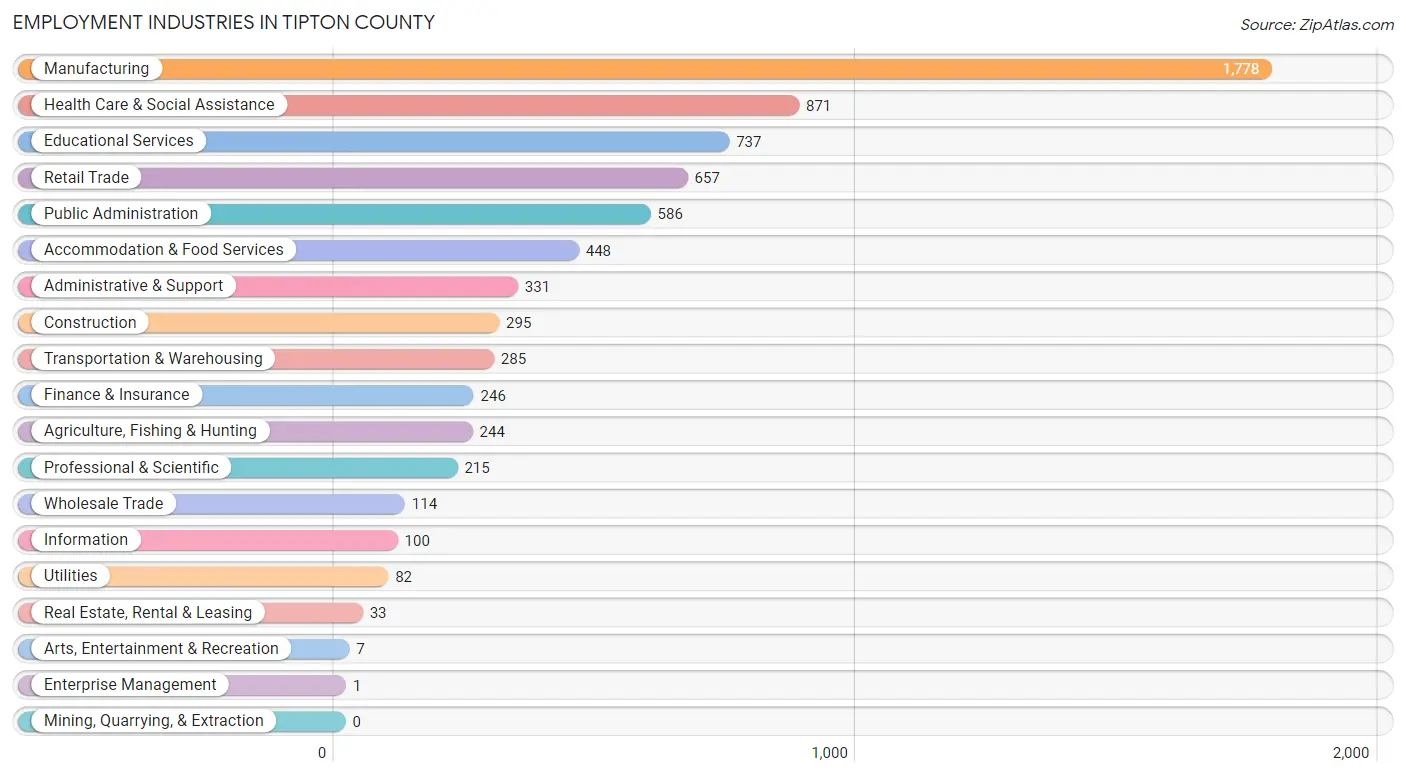
Employment Industries in Tipton County
The major employment industries in Tipton County include Manufacturing (1,778 | 23.8%), Health Care & Social Assistance (871 | 11.7%), Educational Services (737 | 9.9%), Retail Trade (657 | 8.8%), and Public Administration (586 | 7.8%).
Employment Industries by Sex in Tipton County
The Tipton County industries that see more men than women are Utilities (100.0%), Arts, Entertainment & Recreation (100.0%), and Wholesale Trade (95.6%), whereas the industries that tend to have a higher number of women are Enterprise Management (100.0%), Real Estate, Rental & Leasing (97.0%), and Health Care & Social Assistance (83.7%).

| Industry | Male | Female |
| Agriculture, Fishing & Hunting | 195 (79.9%) | 49 (20.1%) |
| Mining, Quarrying, & Extraction | 0 (0.0%) | 0 (0.0%) |
| Construction | 274 (92.9%) | 21 (7.1%) |
| Manufacturing | 1,326 (74.6%) | 452 (25.4%) |
| Wholesale Trade | 109 (95.6%) | 5 (4.4%) |
| Retail Trade | 299 (45.5%) | 358 (54.5%) |
| Transportation & Warehousing | 210 (73.7%) | 75 (26.3%) |
| Utilities | 82 (100.0%) | 0 (0.0%) |
| Information | 70 (70.0%) | 30 (30.0%) |
| Finance & Insurance | 42 (17.1%) | 204 (82.9%) |
| Real Estate, Rental & Leasing | 1 (3.0%) | 32 (97.0%) |
| Professional & Scientific | 131 (60.9%) | 84 (39.1%) |
| Enterprise Management | 0 (0.0%) | 1 (100.0%) |
| Administrative & Support | 240 (72.5%) | 91 (27.5%) |
| Educational Services | 187 (25.4%) | 550 (74.6%) |
| Health Care & Social Assistance | 142 (16.3%) | 729 (83.7%) |
| Arts, Entertainment & Recreation | 7 (100.0%) | 0 (0.0%) |
| Accommodation & Food Services | 177 (39.5%) | 271 (60.5%) |
| Public Administration | 211 (36.0%) | 375 (64.0%) |
| Total | 4,056 (54.3%) | 3,414 (45.7%) |
Education in Tipton County
School Enrollment in Tipton County
The most common levels of schooling among the 3,031 students in Tipton County are elementary school (841 | 27.8%), high school (809 | 26.7%), and middle school (541 | 17.8%).

| School Level | # Students | % Students |
| Nursery / Preschool | 160 | 5.3% |
| Kindergarten | 148 | 4.9% |
| Elementary School | 841 | 27.8% |
| Middle School | 541 | 17.8% |
| High School | 809 | 26.7% |
| College / Undergraduate | 458 | 15.1% |
| Graduate / Professional | 74 | 2.4% |
| Total | 3,031 | 100.0% |
School Enrollment by Age by Funding Source in Tipton County
Out of a total of 3,031 students who are enrolled in schools in Tipton County, 382 (12.6%) attend a private institution, while the remaining 2,649 (87.4%) are enrolled in public schools. The age group of 3 to 4 year olds has the highest likelihood of being enrolled in private schools, with 71 (61.2% in the age bracket) enrolled. Conversely, the age group of 18 to 19 year olds has the lowest likelihood of being enrolled in a private school, with 251 (100.0% in the age bracket) attending a public institution.

| Age Bracket | Public School | Private School |
| 3 to 4 Year Olds | 45 (38.8%) | 71 (61.2%) |
| 5 to 9 Year Old | 731 (86.2%) | 117 (13.8%) |
| 10 to 14 Year Olds | 665 (84.2%) | 125 (15.8%) |
| 15 to 17 Year Olds | 510 (93.1%) | 38 (6.9%) |
| 18 to 19 Year Olds | 251 (100.0%) | 0 (0.0%) |
| 20 to 24 Year Olds | 161 (88.5%) | 21 (11.5%) |
| 25 to 34 Year Olds | 101 (95.3%) | 5 (4.7%) |
| 35 Years and over | 185 (97.4%) | 5 (2.6%) |
| Total | 2,649 (87.4%) | 382 (12.6%) |
Educational Attainment by Field of Study in Tipton County
Business (620 | 21.3%), education (571 | 19.6%), science & technology (455 | 15.6%), bio, nature & agricultural (347 | 11.9%), and arts & humanities (252 | 8.6%) are the most common fields of study among 2,913 individuals in Tipton County who have obtained a bachelor's degree or higher.

| Field of Study | # Graduates | % Graduates |
| Computers & Mathematics | 36 | 1.2% |
| Bio, Nature & Agricultural | 347 | 11.9% |
| Physical & Health Sciences | 15 | 0.5% |
| Psychology | 108 | 3.7% |
| Social Sciences | 33 | 1.1% |
| Engineering | 131 | 4.5% |
| Multidisciplinary Studies | 71 | 2.4% |
| Science & Technology | 455 | 15.6% |
| Business | 620 | 21.3% |
| Education | 571 | 19.6% |
| Literature & Languages | 45 | 1.5% |
| Liberal Arts & History | 98 | 3.4% |
| Visual & Performing Arts | 74 | 2.5% |
| Communications | 57 | 2.0% |
| Arts & Humanities | 252 | 8.6% |
| Total | 2,913 | 100.0% |
Transportation & Commute in Tipton County
Vehicle Availability by Sex in Tipton County
The most prevalent vehicle ownership categories in Tipton County are males with 2 vehicles (1,944, accounting for 48.3%) and females with 2 vehicles (1,545, making up 60.0%).
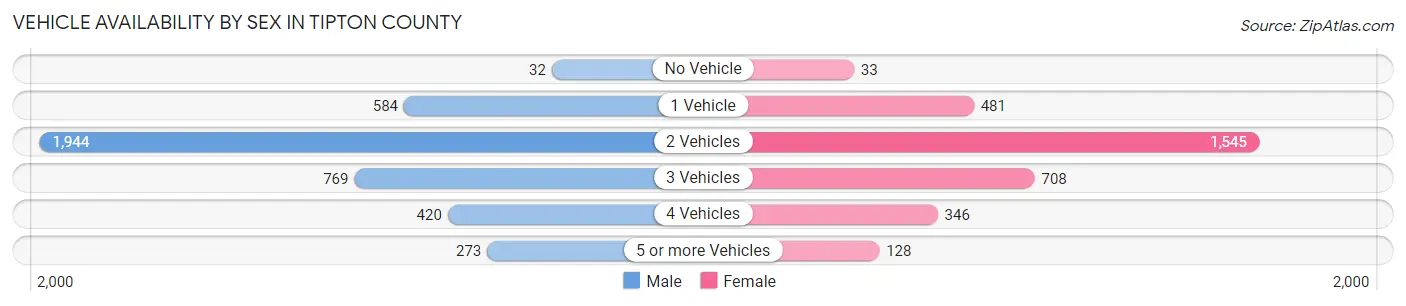
| Vehicles Available | Male | Female |
| No Vehicle | 32 (0.8%) | 33 (1.0%) |
| 1 Vehicle | 584 (14.5%) | 481 (14.8%) |
| 2 Vehicles | 1,944 (48.3%) | 1,545 (47.7%) |
| 3 Vehicles | 769 (19.1%) | 708 (21.8%) |
| 4 Vehicles | 420 (10.4%) | 346 (10.7%) |
| 5 or more Vehicles | 273 (6.8%) | 128 (4.0%) |
| Total | 4,022 (100.0%) | 3,241 (100.0%) |
Commute Time in Tipton County
The most frequently occuring commute durations in Tipton County are 10 to 14 minutes (1,073 commuters, 15.4%), 20 to 24 minutes (940 commuters, 13.5%), and 30 to 34 minutes (846 commuters, 12.1%).

| Commute Time | # Commuters | % Commuters |
| Less than 5 Minutes | 527 | 7.6% |
| 5 to 9 Minutes | 544 | 7.8% |
| 10 to 14 Minutes | 1,073 | 15.4% |
| 15 to 19 Minutes | 766 | 11.0% |
| 20 to 24 Minutes | 940 | 13.5% |
| 25 to 29 Minutes | 536 | 7.7% |
| 30 to 34 Minutes | 846 | 12.1% |
| 35 to 39 Minutes | 382 | 5.5% |
| 40 to 44 Minutes | 221 | 3.2% |
| 45 to 59 Minutes | 619 | 8.9% |
| 60 to 89 Minutes | 365 | 5.2% |
| 90 or more Minutes | 150 | 2.1% |
Commute Time by Sex in Tipton County
The most common commute times in Tipton County are 10 to 14 minutes (587 commuters, 15.1%) for males and 10 to 14 minutes (486 commuters, 15.7%) for females.

| Commute Time | Male | Female |
| Less than 5 Minutes | 320 (8.3%) | 207 (6.7%) |
| 5 to 9 Minutes | 282 (7.3%) | 262 (8.5%) |
| 10 to 14 Minutes | 587 (15.1%) | 486 (15.7%) |
| 15 to 19 Minutes | 479 (12.4%) | 287 (9.3%) |
| 20 to 24 Minutes | 516 (13.3%) | 424 (13.7%) |
| 25 to 29 Minutes | 312 (8.1%) | 224 (7.2%) |
| 30 to 34 Minutes | 431 (11.1%) | 415 (13.4%) |
| 35 to 39 Minutes | 217 (5.6%) | 165 (5.3%) |
| 40 to 44 Minutes | 67 (1.7%) | 154 (5.0%) |
| 45 to 59 Minutes | 366 (9.5%) | 253 (8.2%) |
| 60 to 89 Minutes | 211 (5.4%) | 154 (5.0%) |
| 90 or more Minutes | 87 (2.2%) | 63 (2.0%) |
Time of Departure to Work by Sex in Tipton County
The most frequent times of departure to work in Tipton County are 7:00 AM to 7:29 AM (658, 17.0%) for males and 7:00 AM to 7:29 AM (454, 14.7%) for females.

| Time of Departure | Male | Female |
| 12:00 AM to 4:59 AM | 114 (2.9%) | 131 (4.2%) |
| 5:00 AM to 5:29 AM | 289 (7.5%) | 107 (3.5%) |
| 5:30 AM to 5:59 AM | 137 (3.5%) | 347 (11.2%) |
| 6:00 AM to 6:29 AM | 431 (11.1%) | 263 (8.5%) |
| 6:30 AM to 6:59 AM | 496 (12.8%) | 225 (7.3%) |
| 7:00 AM to 7:29 AM | 658 (17.0%) | 454 (14.7%) |
| 7:30 AM to 7:59 AM | 376 (9.7%) | 372 (12.0%) |
| 8:00 AM to 8:29 AM | 306 (7.9%) | 356 (11.5%) |
| 8:30 AM to 8:59 AM | 123 (3.2%) | 77 (2.5%) |
| 9:00 AM to 9:59 AM | 51 (1.3%) | 137 (4.4%) |
| 10:00 AM to 10:59 AM | 41 (1.1%) | 95 (3.1%) |
| 11:00 AM to 11:59 AM | 25 (0.6%) | 69 (2.2%) |
| 12:00 PM to 3:59 PM | 403 (10.4%) | 294 (9.5%) |
| 4:00 PM to 11:59 PM | 425 (11.0%) | 167 (5.4%) |
| Total | 3,875 (100.0%) | 3,094 (100.0%) |
Housing Occupancy in Tipton County
Occupancy by Ownership in Tipton County
Of the total 6,170 dwellings in Tipton County, owner-occupied units account for 4,986 (80.8%), while renter-occupied units make up 1,184 (19.2%).

| Occupancy | # Housing Units | % Housing Units |
| Owner Occupied Housing Units | 4,986 | 80.8% |
| Renter-Occupied Housing Units | 1,184 | 19.2% |
| Total Occupied Housing Units | 6,170 | 100.0% |
Occupancy by Household Size in Tipton County

| Household Size | # Housing Units | % Housing Units |
| 1-Person Household | 1,251 | 20.3% |
| 2-Person Household | 2,496 | 40.5% |
| 3-Person Household | 1,090 | 17.7% |
| 4+ Person Household | 1,333 | 21.6% |
| Total Housing Units | 6,170 | 100.0% |
Occupancy by Ownership by Household Size in Tipton County

| Household Size | Owner-occupied | Renter-occupied |
| 1-Person Household | 889 (71.1%) | 362 (28.9%) |
| 2-Person Household | 2,250 (90.1%) | 246 (9.9%) |
| 3-Person Household | 687 (63.0%) | 403 (37.0%) |
| 4+ Person Household | 1,160 (87.0%) | 173 (13.0%) |
| Total Housing Units | 4,986 (80.8%) | 1,184 (19.2%) |
Occupancy by Educational Attainment in Tipton County

| Household Size | Owner-occupied | Renter-occupied |
| Less than High School | 232 (57.1%) | 174 (42.9%) |
| High School Diploma | 1,960 (81.4%) | 448 (18.6%) |
| College/Associate Degree | 1,421 (78.5%) | 390 (21.5%) |
| Bachelor's Degree or higher | 1,373 (88.9%) | 172 (11.1%) |
Occupancy by Age of Householder in Tipton County

| Age Bracket | # Households | % Households |
| Under 35 Years | 1,067 | 17.3% |
| 35 to 44 Years | 786 | 12.7% |
| 45 to 54 Years | 1,173 | 19.0% |
| 55 to 64 Years | 1,263 | 20.5% |
| 65 to 74 Years | 1,094 | 17.7% |
| 75 to 84 Years | 686 | 11.1% |
| 85 Years and Over | 101 | 1.6% |
| Total | 6,170 | 100.0% |
Housing Finances in Tipton County
Median Income by Occupancy in Tipton County
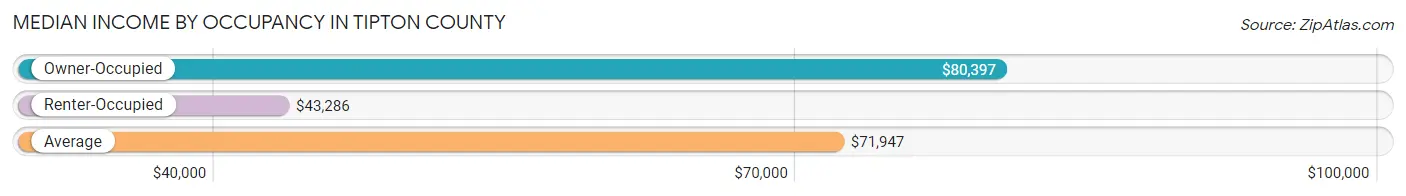
| Occupancy Type | # Households | Median Income |
| Owner-Occupied | 4,986 (80.8%) | $80,397 |
| Renter-Occupied | 1,184 (19.2%) | $43,286 |
| Average | 6,170 (100.0%) | $71,947 |
Occupancy by Householder Income Bracket in Tipton County
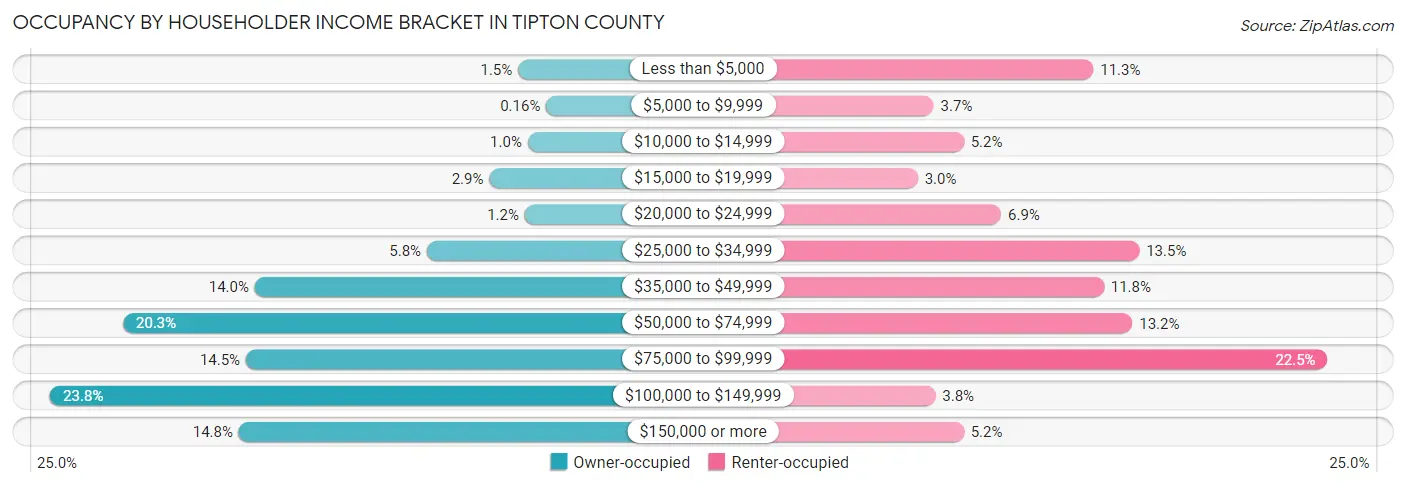
| Income Bracket | Owner-occupied | Renter-occupied |
| Less than $5,000 | 75 (1.5%) | 134 (11.3%) |
| $5,000 to $9,999 | 8 (0.2%) | 44 (3.7%) |
| $10,000 to $14,999 | 52 (1.0%) | 61 (5.1%) |
| $15,000 to $19,999 | 143 (2.9%) | 35 (3.0%) |
| $20,000 to $24,999 | 59 (1.2%) | 82 (6.9%) |
| $25,000 to $34,999 | 291 (5.8%) | 160 (13.5%) |
| $35,000 to $49,999 | 700 (14.0%) | 140 (11.8%) |
| $50,000 to $74,999 | 1,013 (20.3%) | 156 (13.2%) |
| $75,000 to $99,999 | 721 (14.5%) | 266 (22.5%) |
| $100,000 to $149,999 | 1,186 (23.8%) | 45 (3.8%) |
| $150,000 or more | 738 (14.8%) | 61 (5.1%) |
| Total | 4,986 (100.0%) | 1,184 (100.0%) |
Monthly Housing Cost Tiers in Tipton County

| Monthly Cost | Owner-occupied | Renter-occupied |
| Less than $300 | 199 (4.0%) | 50 (4.2%) |
| $300 to $499 | 1,131 (22.7%) | 66 (5.6%) |
| $500 to $799 | 873 (17.5%) | 260 (22.0%) |
| $800 to $999 | 620 (12.4%) | 366 (30.9%) |
| $1,000 to $1,499 | 1,374 (27.6%) | 182 (15.4%) |
| $1,500 to $1,999 | 419 (8.4%) | 16 (1.3%) |
| $2,000 to $2,499 | 125 (2.5%) | 0 (0.0%) |
| $2,500 to $2,999 | 225 (4.5%) | 58 (4.9%) |
| $3,000 or more | 20 (0.4%) | 0 (0.0%) |
| Total | 4,986 (100.0%) | 1,184 (100.0%) |
Physical Housing Characteristics in Tipton County
Housing Structures in Tipton County

| Structure Type | # Housing Units | % Housing Units |
| Single Unit, Detached | 5,457 | 88.4% |
| Single Unit, Attached | 68 | 1.1% |
| 2 Unit Apartments | 35 | 0.6% |
| 3 or 4 Unit Apartments | 98 | 1.6% |
| 5 to 9 Unit Apartments | 186 | 3.0% |
| 10 or more Apartments | 49 | 0.8% |
| Mobile Home / Other | 277 | 4.5% |
| Total | 6,170 | 100.0% |
Housing Structures by Occupancy in Tipton County

| Structure Type | Owner-occupied | Renter-occupied |
| Single Unit, Detached | 4,753 (87.1%) | 704 (12.9%) |
| Single Unit, Attached | 43 (63.2%) | 25 (36.8%) |
| 2 Unit Apartments | 0 (0.0%) | 35 (100.0%) |
| 3 or 4 Unit Apartments | 0 (0.0%) | 98 (100.0%) |
| 5 to 9 Unit Apartments | 13 (7.0%) | 173 (93.0%) |
| 10 or more Apartments | 0 (0.0%) | 49 (100.0%) |
| Mobile Home / Other | 177 (63.9%) | 100 (36.1%) |
| Total | 4,986 (80.8%) | 1,184 (19.2%) |
Housing Structures by Number of Rooms in Tipton County

| Number of Rooms | Owner-occupied | Renter-occupied |
| 1 Room | 3 (0.1%) | 8 (0.7%) |
| 2 or 3 Rooms | 23 (0.5%) | 143 (12.1%) |
| 4 or 5 Rooms | 902 (18.1%) | 549 (46.4%) |
| 6 or 7 Rooms | 2,319 (46.5%) | 288 (24.3%) |
| 8 or more Rooms | 1,739 (34.9%) | 196 (16.6%) |
| Total | 4,986 (100.0%) | 1,184 (100.0%) |
Housing Structure by Heating Type in Tipton County
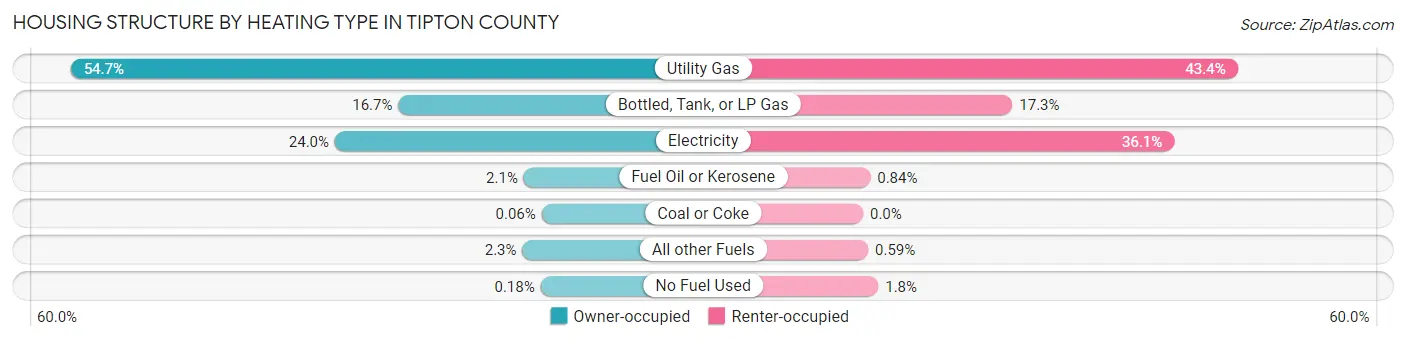
| Heating Type | Owner-occupied | Renter-occupied |
| Utility Gas | 2,725 (54.6%) | 514 (43.4%) |
| Bottled, Tank, or LP Gas | 831 (16.7%) | 205 (17.3%) |
| Electricity | 1,198 (24.0%) | 427 (36.1%) |
| Fuel Oil or Kerosene | 106 (2.1%) | 10 (0.8%) |
| Coal or Coke | 3 (0.1%) | 0 (0.0%) |
| All other Fuels | 114 (2.3%) | 7 (0.6%) |
| No Fuel Used | 9 (0.2%) | 21 (1.8%) |
| Total | 4,986 (100.0%) | 1,184 (100.0%) |
Household Vehicle Usage in Tipton County

| Vehicles per Household | Owner-occupied | Renter-occupied |
| No Vehicle | 46 (0.9%) | 27 (2.3%) |
| 1 Vehicle | 1,004 (20.1%) | 673 (56.8%) |
| 2 Vehicles | 2,416 (48.5%) | 390 (32.9%) |
| 3 or more Vehicles | 1,520 (30.5%) | 94 (7.9%) |
| Total | 4,986 (100.0%) | 1,184 (100.0%) |
Real Estate & Mortgages in Tipton County
Real Estate and Mortgage Overview in Tipton County
| Characteristic | Without Mortgage | With Mortgage |
| Housing Units | 1,900 | 3,086 |
| Median Property Value | $144,800 | $153,600 |
| Median Household Income | $54,943 | $532 |
| Monthly Housing Costs | $426 | $20 |
| Real Estate Taxes | $1,085 | $50 |
Property Value by Mortgage Status in Tipton County
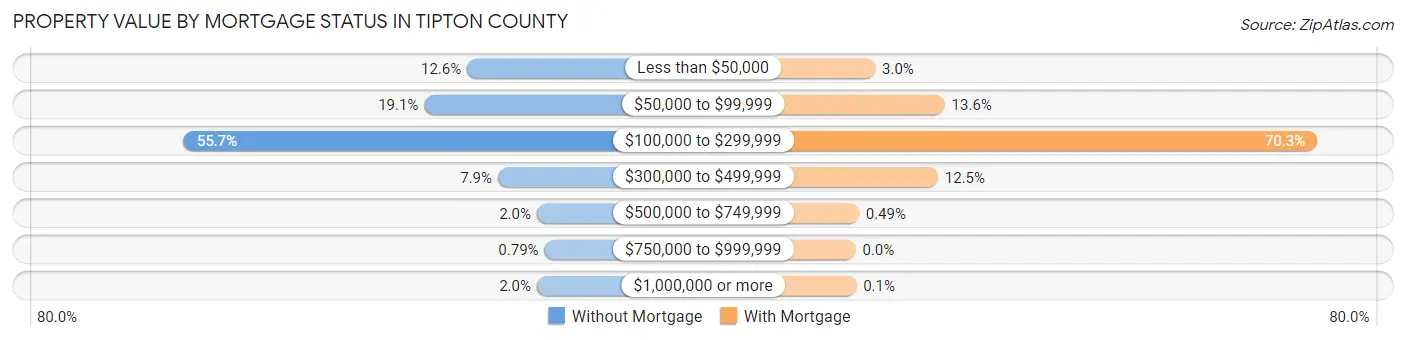
| Property Value | Without Mortgage | With Mortgage |
| Less than $50,000 | 239 (12.6%) | 92 (3.0%) |
| $50,000 to $99,999 | 363 (19.1%) | 419 (13.6%) |
| $100,000 to $299,999 | 1,059 (55.7%) | 2,170 (70.3%) |
| $300,000 to $499,999 | 150 (7.9%) | 387 (12.5%) |
| $500,000 to $749,999 | 37 (1.9%) | 15 (0.5%) |
| $750,000 to $999,999 | 15 (0.8%) | 0 (0.0%) |
| $1,000,000 or more | 37 (1.9%) | 3 (0.1%) |
| Total | 1,900 (100.0%) | 3,086 (100.0%) |
Household Income by Mortgage Status in Tipton County

| Household Income | Without Mortgage | With Mortgage |
| Less than $10,000 | 54 (2.8%) | 67 (2.2%) |
| $10,000 to $24,999 | 208 (11.0%) | 29 (0.9%) |
| $25,000 to $34,999 | 168 (8.8%) | 46 (1.5%) |
| $35,000 to $49,999 | 393 (20.7%) | 123 (4.0%) |
| $50,000 to $74,999 | 367 (19.3%) | 307 (10.0%) |
| $75,000 to $99,999 | 191 (10.1%) | 646 (20.9%) |
| $100,000 to $149,999 | 313 (16.5%) | 530 (17.2%) |
| $150,000 or more | 206 (10.8%) | 873 (28.3%) |
| Total | 1,900 (100.0%) | 3,086 (100.0%) |
Property Value to Household Income Ratio in Tipton County

| Value-to-Income Ratio | Without Mortgage | With Mortgage |
| Less than 2.0x | 876 (46.1%) | 93,636 (3,034.2%) |
| 2.0x to 2.9x | 273 (14.4%) | 1,825 (59.1%) |
| 3.0x to 3.9x | 137 (7.2%) | 804 (26.1%) |
| 4.0x or more | 591 (31.1%) | 130 (4.2%) |
| Total | 1,900 (100.0%) | 3,086 (100.0%) |
Real Estate Taxes by Mortgage Status in Tipton County
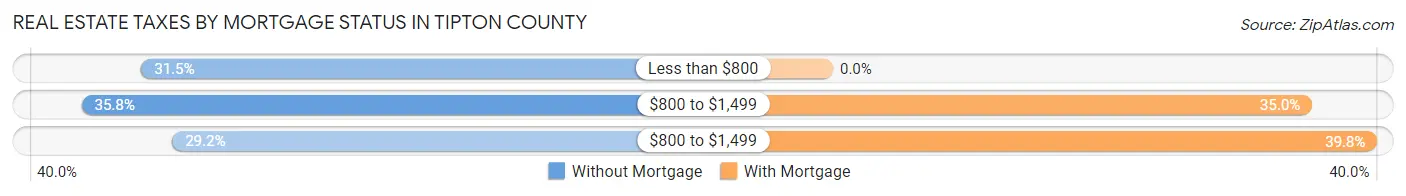
| Property Taxes | Without Mortgage | With Mortgage |
| Less than $800 | 598 (31.5%) | 0 (0.0%) |
| $800 to $1,499 | 681 (35.8%) | 1,080 (35.0%) |
| $800 to $1,499 | 555 (29.2%) | 1,227 (39.8%) |
| Total | 1,900 (100.0%) | 3,086 (100.0%) |
Health & Disability in Tipton County
Health Insurance Coverage by Age in Tipton County

| Age Bracket | With Coverage | Without Coverage |
| Under 6 Years | 1,030 (97.9%) | 22 (2.1%) |
| 6 to 18 Years | 2,256 (96.7%) | 77 (3.3%) |
| 19 to 25 Years | 936 (82.4%) | 200 (17.6%) |
| 26 to 34 Years | 1,360 (83.9%) | 261 (16.1%) |
| 35 to 44 Years | 1,414 (88.5%) | 183 (11.5%) |
| 45 to 54 Years | 1,930 (94.6%) | 111 (5.4%) |
| 55 to 64 Years | 1,795 (80.6%) | 431 (19.4%) |
| 65 to 74 Years | 1,819 (99.7%) | 5 (0.3%) |
| 75 Years and older | 1,267 (100.0%) | 0 (0.0%) |
| Total | 13,807 (91.5%) | 1,290 (8.5%) |
Health Insurance Coverage by Citizenship Status in Tipton County

| Citizenship Status | With Coverage | Without Coverage |
| Native Born | 1,030 (97.9%) | 22 (2.1%) |
| Foreign Born, Citizen | 2,256 (96.7%) | 77 (3.3%) |
| Foreign Born, not a Citizen | 936 (82.4%) | 200 (17.6%) |
Health Insurance Coverage by Household Income in Tipton County
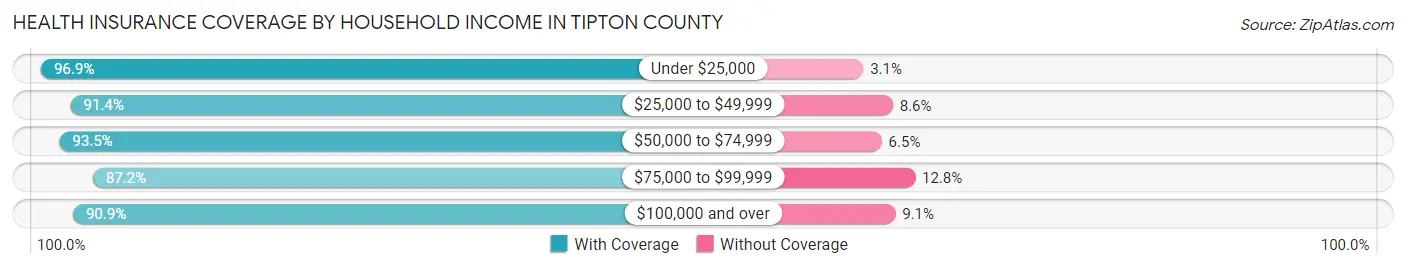
| Household Income | With Coverage | Without Coverage |
| Under $25,000 | 1,070 (96.9%) | 34 (3.1%) |
| $25,000 to $49,999 | 2,458 (91.4%) | 232 (8.6%) |
| $50,000 to $74,999 | 2,991 (93.5%) | 209 (6.5%) |
| $75,000 to $99,999 | 1,973 (87.2%) | 289 (12.8%) |
| $100,000 and over | 5,274 (90.9%) | 526 (9.1%) |
Public vs Private Health Insurance Coverage by Age in Tipton County

| Age Bracket | Public Insurance | Private Insurance |
| Under 6 | 348 (33.1%) | 712 (67.7%) |
| 6 to 18 Years | 924 (39.6%) | 1,438 (61.6%) |
| 19 to 25 Years | 141 (12.4%) | 813 (71.6%) |
| 25 to 34 Years | 327 (20.2%) | 1,079 (66.6%) |
| 35 to 44 Years | 182 (11.4%) | 1,264 (79.1%) |
| 45 to 54 Years | 319 (15.6%) | 1,715 (84.0%) |
| 55 to 64 Years | 362 (16.3%) | 1,579 (70.9%) |
| 65 to 74 Years | 1,746 (95.7%) | 1,292 (70.8%) |
| 75 Years and over | 1,262 (99.6%) | 913 (72.1%) |
| Total | 5,611 (37.2%) | 10,805 (71.6%) |
Disability Status by Sex by Age in Tipton County
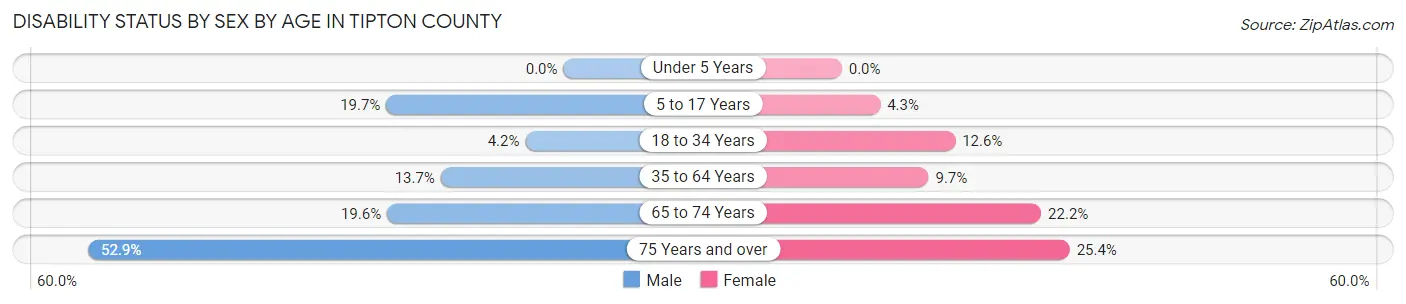
| Age Bracket | Male | Female |
| Under 5 Years | 0 (0.0%) | 0 (0.0%) |
| 5 to 17 Years | 217 (19.7%) | 49 (4.3%) |
| 18 to 34 Years | 65 (4.2%) | 181 (12.6%) |
| 35 to 64 Years | 412 (13.7%) | 275 (9.7%) |
| 65 to 74 Years | 176 (19.6%) | 206 (22.2%) |
| 75 Years and over | 289 (52.9%) | 183 (25.4%) |
Disability Class by Sex by Age in Tipton County
Disability Class: Hearing Difficulty

| Age Bracket | Male | Female |
| Under 5 Years | 0 (0.0%) | 0 (0.0%) |
| 5 to 17 Years | 0 (0.0%) | 16 (1.4%) |
| 18 to 34 Years | 0 (0.0%) | 18 (1.3%) |
| 35 to 64 Years | 169 (5.6%) | 35 (1.2%) |
| 65 to 74 Years | 77 (8.6%) | 83 (8.9%) |
| 75 Years and over | 203 (37.2%) | 32 (4.4%) |
Disability Class: Vision Difficulty
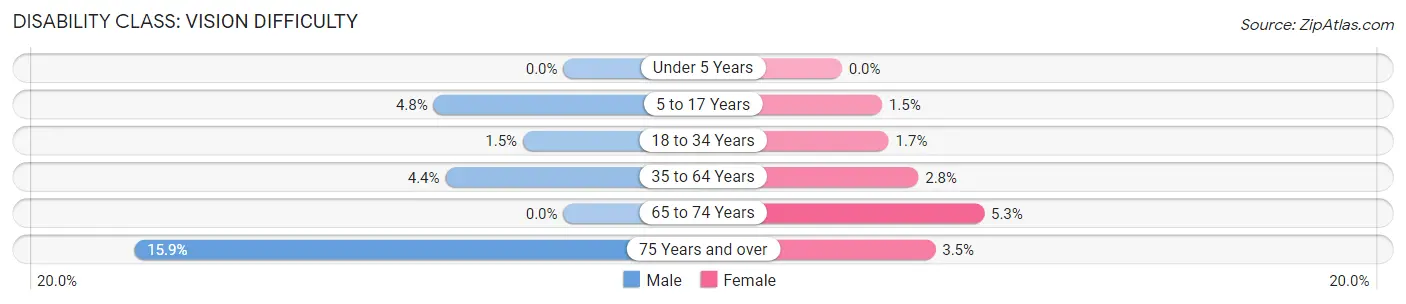
| Age Bracket | Male | Female |
| Under 5 Years | 0 (0.0%) | 0 (0.0%) |
| 5 to 17 Years | 53 (4.8%) | 17 (1.5%) |
| 18 to 34 Years | 23 (1.5%) | 25 (1.7%) |
| 35 to 64 Years | 132 (4.4%) | 81 (2.8%) |
| 65 to 74 Years | 0 (0.0%) | 49 (5.3%) |
| 75 Years and over | 87 (15.9%) | 25 (3.5%) |
Disability Class: Cognitive Difficulty
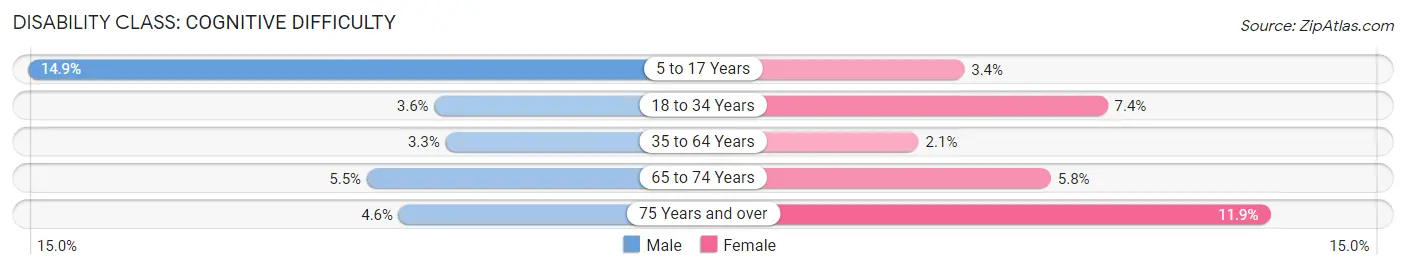
| Age Bracket | Male | Female |
| 5 to 17 Years | 164 (14.9%) | 39 (3.4%) |
| 18 to 34 Years | 55 (3.6%) | 106 (7.4%) |
| 35 to 64 Years | 99 (3.3%) | 61 (2.1%) |
| 65 to 74 Years | 49 (5.5%) | 54 (5.8%) |
| 75 Years and over | 25 (4.6%) | 86 (11.9%) |
Disability Class: Ambulatory Difficulty

| Age Bracket | Male | Female |
| 5 to 17 Years | 8 (0.7%) | 0 (0.0%) |
| 18 to 34 Years | 2 (0.1%) | 121 (8.4%) |
| 35 to 64 Years | 133 (4.4%) | 158 (5.6%) |
| 65 to 74 Years | 93 (10.4%) | 132 (14.2%) |
| 75 Years and over | 96 (17.6%) | 167 (23.2%) |
Disability Class: Self-Care Difficulty

| Age Bracket | Male | Female |
| 5 to 17 Years | 51 (4.6%) | 16 (1.4%) |
| 18 to 34 Years | 10 (0.6%) | 55 (3.8%) |
| 35 to 64 Years | 52 (1.7%) | 35 (1.2%) |
| 65 to 74 Years | 0 (0.0%) | 54 (5.8%) |
| 75 Years and over | 38 (7.0%) | 54 (7.5%) |
Technology Access in Tipton County
Computing Device Access in Tipton County

| Device Type | # Households | % Households |
| Desktop or Laptop | 4,573 | 74.1% |
| Smartphone | 5,489 | 89.0% |
| Tablet | 3,824 | 62.0% |
| No Computing Device | 334 | 5.4% |
| Total | 6,170 | 100.0% |
Internet Access in Tipton County

| Internet Type | # Households | % Households |
| Dial-Up Internet | 19 | 0.3% |
| Broadband Home | 3,702 | 60.0% |
| Cellular Data Only | 1,129 | 18.3% |
| Satellite Internet | 582 | 9.4% |
| No Internet | 765 | 12.4% |
| Total | 6,170 | 100.0% |
Tipton County Summary
Tipton County is located in the central part of Indiana, in the United States. It is part of the Kokomo-Peru-Logansport Combined Statistical Area. The county was established in 1844 and named after John Tipton, a senator and a brigadier general in the War of 1812. The county seat is Tipton, Indiana.
Geography
Tipton County is located in the central part of Indiana, in the United States. It is part of the Kokomo-Peru-Logansport Combined Statistical Area. The county is bordered by Howard County to the north, Madison County to the east, Hamilton County to the south, and Grant County to the west. The county has a total area of 437 square miles, of which 434 square miles is land and 3 square miles is water. The county is drained by the Wildcat Creek and the Tippecanoe River.
The terrain of Tipton County is generally flat, with some rolling hills in the northern part of the county. The highest point in the county is located in the northwest corner, at an elevation of 890 feet above sea level. The county is located in the Central Till Plains region of Indiana.
Demographics
As of the 2010 United States Census, there were 17,062 people, 6,717 households, and 4,717 families residing in the county. The population density was 39.3 people per square mile. The racial makeup of the county was 97.2% White, 0.6% Black or African American, 0.2% Native American, 0.3% Asian, 0.2% from other races, and 1.5% from two or more races. 1.2% of the population were Hispanic or Latino of any race.
There were 6,717 households, out of which 32.2% had children under the age of 18 living with them, 56.2% were married couples living together, 10.2% had a female householder with no husband present, and 29.2% were non-families. 25.2% of all households were made up of individuals, and 11.2% had someone living alone who was 65 years of age or older. The average household size was 2.51 and the average family size was 3.00.
The median income for a household in the county was $45,845, and the median income for a family was $53,813. Males had a median income of $41,845 versus $27,917 for females. The per capita income for the county was $21,845. About 8.2% of families and 10.2% of the population were below the poverty line, including 14.2% of those under age 18 and 8.2% of those age 65 or over.
Economy
Tipton County is home to a variety of industries, including manufacturing, agriculture, and tourism. The county is home to several large manufacturing companies, including Honda Manufacturing of Indiana, which produces automobiles and engines, and Tipton Manufacturing, which produces industrial equipment.
Agriculture is an important part of the economy of Tipton County. The county is home to several large farms, which produce corn, soybeans, wheat, and other crops. Livestock production is also important, with cattle, hogs, and poultry being raised in the county.
Tourism is also an important part of the economy of Tipton County. The county is home to several popular attractions, including the Tipton County Historical Museum, the Tipton County Fairgrounds, and the Tipton County Park. The county is also home to several popular festivals, including the Tipton County Fair and the Tipton County Bluegrass Festival.
Conclusion
Tipton County is a county located in the central part of Indiana, in the United States. It is part of the Kokomo-Peru-Logansport Combined Statistical Area. The county was established in 1844 and named after John Tipton, a senator and a brigadier general in the War of 1812. The county has a total area of 437 square miles, of which 434 square miles is land and 3 square miles is water. As of the 2010 United States Census, there were 17,062 people, 6,717 households, and 4,717 families residing in the county. The economy of Tipton County is based on manufacturing, agriculture, and tourism. The county is home to several large manufacturing companies, several large farms, and several popular attractions and festivals.
Common Questions
What is the Total Population of Tipton County?
Total Population of Tipton County is 15,328.
What is the Total Male Population of Tipton County?
Total Male Population of Tipton County is 7,637.
What is the Total Female Population of Tipton County?
Total Female Population of Tipton County is 7,691.
What is the Ratio of Males per 100 Females in Tipton County?
There are 99.30 Males per 100 Females in Tipton County.
What is the Ratio of Females per 100 Males in Tipton County?
There are 100.71 Females per 100 Males in Tipton County.
What is the Median Population Age in Tipton County?
Median Population Age in Tipton County is 44.4 Years.
What is the Average Family Size in Tipton County
Average Family Size in Tipton County is 2.8 People.
What is the Average Household Size in Tipton County
Average Household Size in Tipton County is 2.4 People.
What is Per Capita Income in Tipton County?
Per Capita income in Tipton County is $34,595.
What is the Median Family Income in Tipton County?
Median Family Income in Tipton County is $81,180.
What is the Median Household income in Tipton County?
Median Household Income in Tipton County is $71,947.
What is Income or Wage Gap in Tipton County?
Income or Wage Gap in Tipton County is 35.6%.
Women in Tipton County earn 64.4 cents for every dollar earned by a man.
What is Family Income Deficit in Tipton County?
Family Income Deficit in Tipton County is $12,074.
Families that are below poverty line in Tipton County earn $12,074 less on average than the poverty threshold level.
What is Inequality or Gini Index in Tipton County?
Inequality or Gini Index in Tipton County is 0.37.
How Large is the Labor Force in Tipton County?
There are 7,783 People in the Labor Forcein in Tipton County.
What is the Percentage of People in the Labor Force in Tipton County?
62.2% of People are in the Labor Force in Tipton County.
What is the Unemployment Rate in Tipton County?
Unemployment Rate in Tipton County is 3.8%.