Tippecanoe County, IN
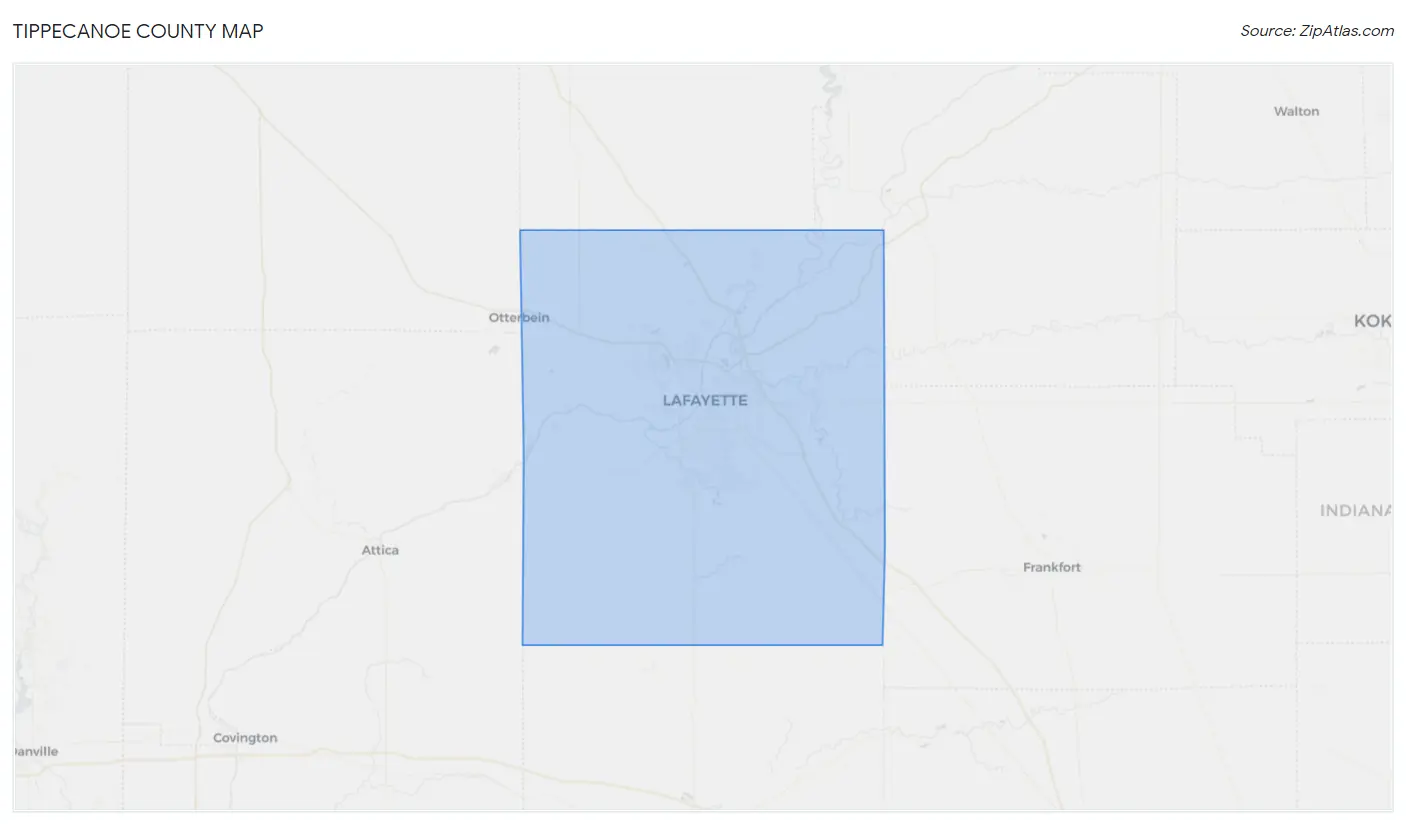
Tippecanoe County Map
Tippecanoe County Overview
186,955
TOTAL POPULATION
96,158
MALE POPULATION
90,797
FEMALE POPULATION
105.90
MALES / 100 FEMALES
94.42
FEMALES / 100 MALES
28.4
MEDIAN AGE
3.0
AVG FAMILY SIZE
2.3
AVG HOUSEHOLD SIZE
$30,608
PER CAPITA INCOME
$81,545
AVG FAMILY INCOME
$55,728
AVG HOUSEHOLD INCOME
28.7%
WAGE / INCOME GAP [ % ]
71.3¢/ $1
WAGE / INCOME GAP [ $ ]
$10,876
FAMILY INCOME DEFICIT
0.48
INEQUALITY / GINI INDEX
95,259
LABOR FORCE [ PEOPLE ]
62.1%
PERCENT IN LABOR FORCE
3.6%
UNEMPLOYMENT RATE
Tippecanoe County Area Codes
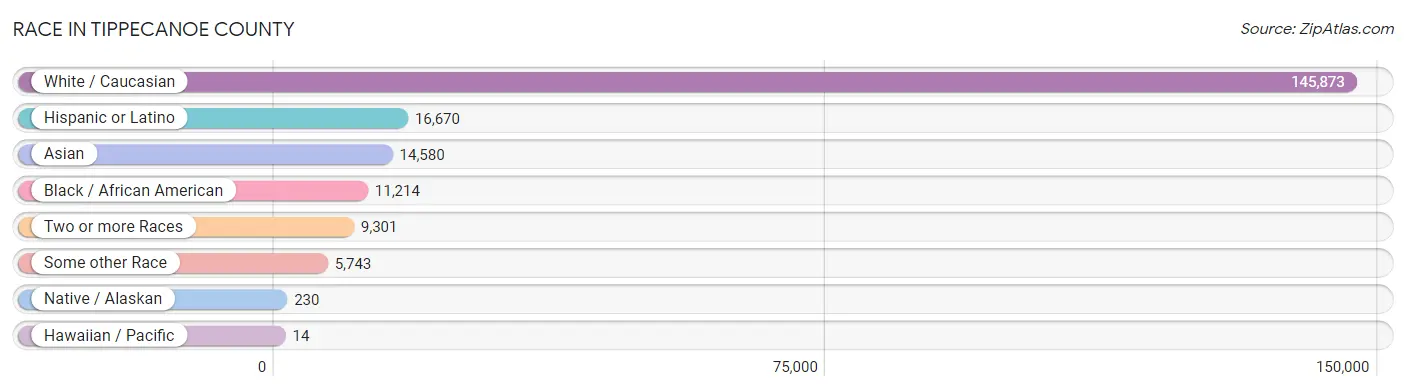
Race in Tippecanoe County
The most populous races in Tippecanoe County are White / Caucasian (145,873 | 78.0%), Hispanic or Latino (16,670 | 8.9%), and Asian (14,580 | 7.8%).
| Race | # Population | % Population |
| Asian | 14,580 | 7.8% |
| Black / African American | 11,214 | 6.0% |
| Hawaiian / Pacific | 14 | 0.0% |
| Hispanic or Latino | 16,670 | 8.9% |
| Native / Alaskan | 230 | 0.1% |
| White / Caucasian | 145,873 | 78.0% |
| Two or more Races | 9,301 | 5.0% |
| Some other Race | 5,743 | 3.1% |
| Total | 186,955 | 100.0% |
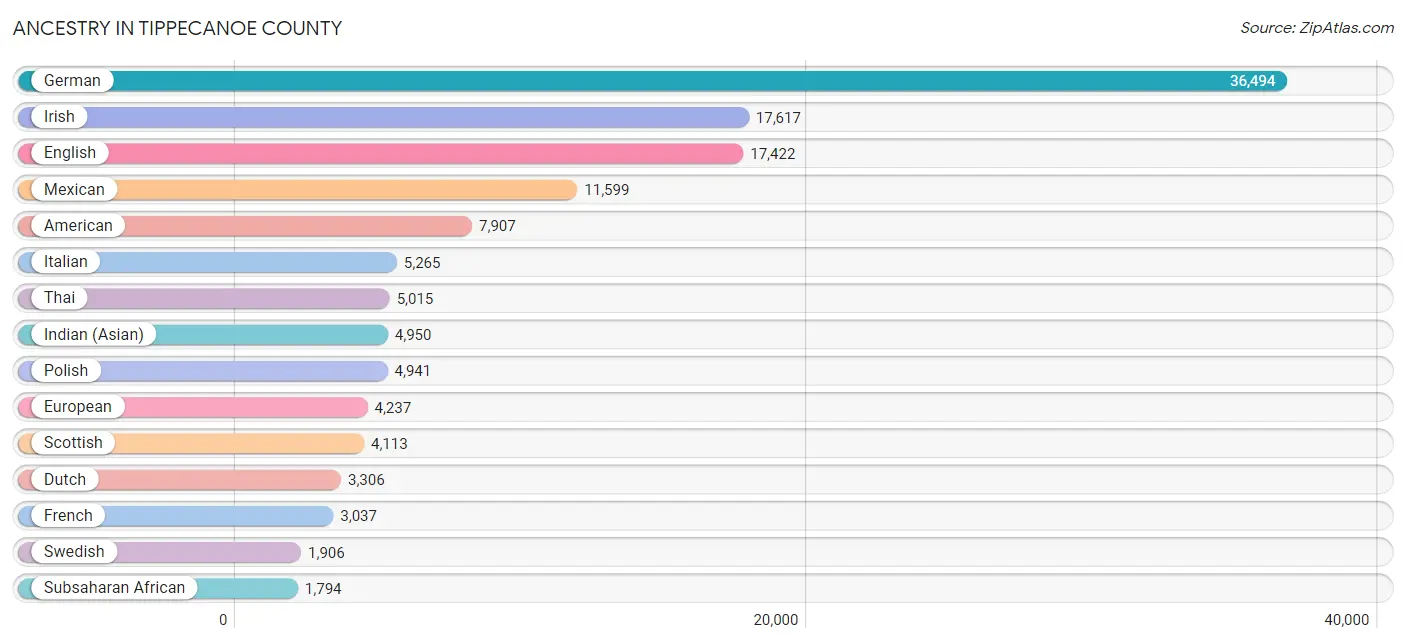
Ancestry in Tippecanoe County
The most populous ancestries reported in Tippecanoe County are German (36,494 | 19.5%), Irish (17,617 | 9.4%), English (17,422 | 9.3%), Mexican (11,599 | 6.2%), and American (7,907 | 4.2%), together accounting for 48.7% of all Tippecanoe County residents.
| Ancestry | # Population | % Population |
| Afghan | 16 | 0.0% |
| African | 774 | 0.4% |
| Albanian | 104 | 0.1% |
| Aleut | 7 | 0.0% |
| American | 7,907 | 4.2% |
| Apache | 4 | 0.0% |
| Arab | 759 | 0.4% |
| Argentinean | 107 | 0.1% |
| Armenian | 198 | 0.1% |
| Assyrian / Chaldean / Syriac | 71 | 0.0% |
| Australian | 67 | 0.0% |
| Austrian | 216 | 0.1% |
| Belgian | 164 | 0.1% |
| Bhutanese | 1,076 | 0.6% |
| Blackfeet | 16 | 0.0% |
| Bolivian | 34 | 0.0% |
| Brazilian | 147 | 0.1% |
| British | 1,367 | 0.7% |
| British West Indian | 7 | 0.0% |
| Bulgarian | 9 | 0.0% |
| Burmese | 1,639 | 0.9% |
| Cajun | 13 | 0.0% |
| Canadian | 137 | 0.1% |
| Celtic | 30 | 0.0% |
| Central American | 1,421 | 0.8% |
| Central American Indian | 54 | 0.0% |
| Cherokee | 406 | 0.2% |
| Chilean | 9 | 0.0% |
| Chinese | 4 | 0.0% |
| Chippewa | 33 | 0.0% |
| Choctaw | 28 | 0.0% |
| Colombian | 389 | 0.2% |
| Costa Rican | 50 | 0.0% |
| Croatian | 220 | 0.1% |
| Cuban | 577 | 0.3% |
| Czech | 753 | 0.4% |
| Czechoslovakian | 70 | 0.0% |
| Danish | 191 | 0.1% |
| Dominican | 59 | 0.0% |
| Dutch | 3,306 | 1.8% |
| Eastern European | 313 | 0.2% |
| Ecuadorian | 247 | 0.1% |
| Egyptian | 335 | 0.2% |
| English | 17,422 | 9.3% |
| Estonian | 20 | 0.0% |
| Ethiopian | 72 | 0.0% |
| European | 4,237 | 2.3% |
| Filipino | 402 | 0.2% |
| Finnish | 137 | 0.1% |
| French | 3,037 | 1.6% |
| French American Indian | 22 | 0.0% |
| French Canadian | 618 | 0.3% |
| German | 36,494 | 19.5% |
| German Russian | 13 | 0.0% |
| Ghanaian | 112 | 0.1% |
| Greek | 593 | 0.3% |
| Guatemalan | 689 | 0.4% |
| Guyanese | 79 | 0.0% |
| Haitian | 278 | 0.2% |
| Honduran | 30 | 0.0% |
| Hungarian | 435 | 0.2% |
| Icelander | 10 | 0.0% |
| Indian (Asian) | 4,950 | 2.6% |
| Indonesian | 16 | 0.0% |
| Iranian | 450 | 0.2% |
| Irish | 17,617 | 9.4% |
| Iroquois | 14 | 0.0% |
| Israeli | 16 | 0.0% |
| Italian | 5,265 | 2.8% |
| Jamaican | 128 | 0.1% |
| Japanese | 47 | 0.0% |
| Jordanian | 20 | 0.0% |
| Kenyan | 139 | 0.1% |
| Korean | 1,459 | 0.8% |
| Laotian | 304 | 0.2% |
| Latvian | 51 | 0.0% |
| Lebanese | 80 | 0.0% |
| Lithuanian | 310 | 0.2% |
| Macedonian | 135 | 0.1% |
| Malaysian | 78 | 0.0% |
| Maltese | 8 | 0.0% |
| Mexican | 11,599 | 6.2% |
| Mexican American Indian | 106 | 0.1% |
| Mongolian | 60 | 0.0% |
| Moroccan | 65 | 0.0% |
| Native Hawaiian | 21 | 0.0% |
| Nicaraguan | 79 | 0.0% |
| Nigerian | 474 | 0.3% |
| Northern European | 306 | 0.2% |
| Norwegian | 1,443 | 0.8% |
| Okinawan | 16 | 0.0% |
| Pakistani | 624 | 0.3% |
| Palestinian | 40 | 0.0% |
| Panamanian | 437 | 0.2% |
| Pennsylvania German | 57 | 0.0% |
| Peruvian | 158 | 0.1% |
| Polish | 4,941 | 2.6% |
| Portuguese | 406 | 0.2% |
| Potawatomi | 19 | 0.0% |
| Puerto Rican | 885 | 0.5% |
| Puget Sound Salish | 51 | 0.0% |
| Romanian | 312 | 0.2% |
| Russian | 542 | 0.3% |
| Salvadoran | 136 | 0.1% |
| Samoan | 58 | 0.0% |
| Scandinavian | 392 | 0.2% |
| Scotch-Irish | 1,204 | 0.6% |
| Scottish | 4,113 | 2.2% |
| Serbian | 164 | 0.1% |
| Sioux | 30 | 0.0% |
| Slavic | 54 | 0.0% |
| Slovak | 371 | 0.2% |
| Slovene | 231 | 0.1% |
| South African | 142 | 0.1% |
| South American | 1,354 | 0.7% |
| South American Indian | 32 | 0.0% |
| Spaniard | 291 | 0.2% |
| Spanish | 102 | 0.1% |
| Sri Lankan | 839 | 0.4% |
| Subsaharan African | 1,794 | 1.0% |
| Sudanese | 6 | 0.0% |
| Swedish | 1,906 | 1.0% |
| Swiss | 686 | 0.4% |
| Syrian | 31 | 0.0% |
| Thai | 5,015 | 2.7% |
| Tlingit-Haida | 51 | 0.0% |
| Trinidadian and Tobagonian | 29 | 0.0% |
| Turkish | 336 | 0.2% |
| U.S. Virgin Islander | 22 | 0.0% |
| Ukrainian | 343 | 0.2% |
| Uruguayan | 20 | 0.0% |
| Venezuelan | 390 | 0.2% |
| Vietnamese | 16 | 0.0% |
| Welsh | 910 | 0.5% |
| West Indian | 13 | 0.0% |
| Yugoslavian | 57 | 0.0% |
| Zimbabwean | 57 | 0.0% | View All 137 Rows |
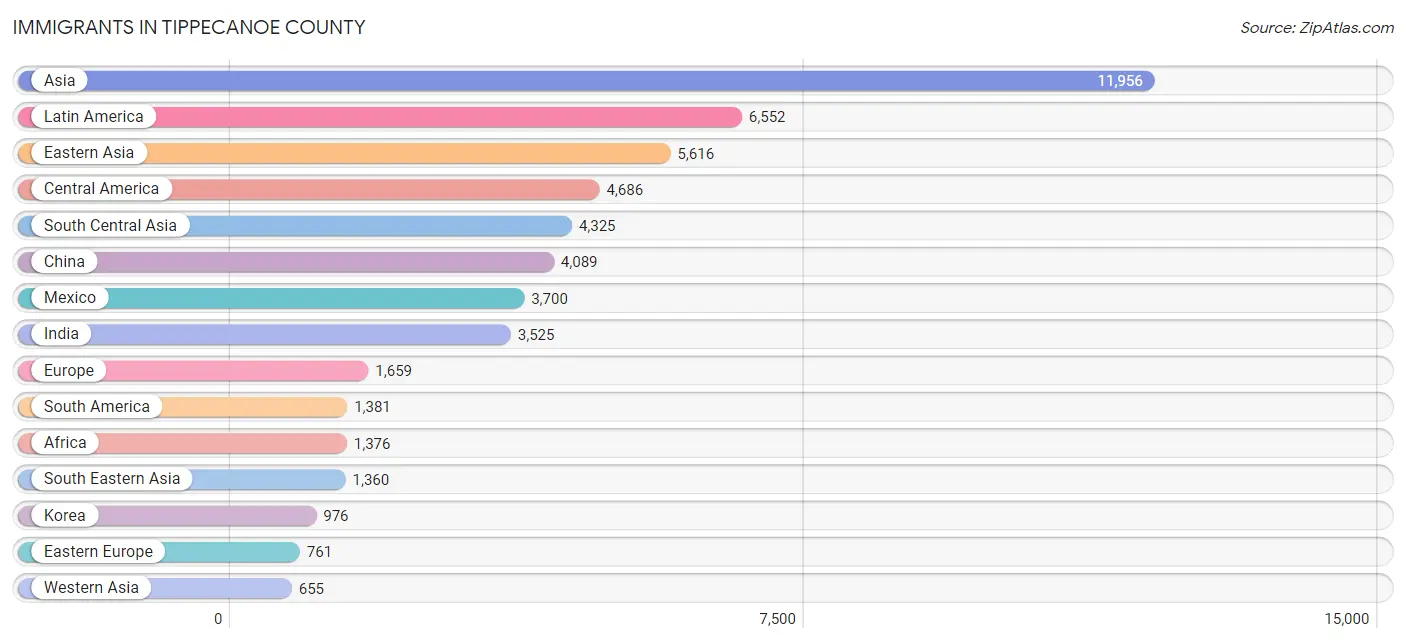
Immigrants in Tippecanoe County
The most numerous immigrant groups reported in Tippecanoe County came from Asia (11,956 | 6.4%), Latin America (6,552 | 3.5%), Eastern Asia (5,616 | 3.0%), Central America (4,686 | 2.5%), and South Central Asia (4,325 | 2.3%), together accounting for 17.7% of all Tippecanoe County residents.
| Immigration Origin | # Population | % Population |
| Africa | 1,376 | 0.7% |
| Albania | 33 | 0.0% |
| Argentina | 76 | 0.0% |
| Armenia | 22 | 0.0% |
| Asia | 11,956 | 6.4% |
| Australia | 92 | 0.1% |
| Austria | 3 | 0.0% |
| Bangladesh | 90 | 0.1% |
| Belarus | 5 | 0.0% |
| Bolivia | 34 | 0.0% |
| Brazil | 180 | 0.1% |
| Cambodia | 15 | 0.0% |
| Canada | 347 | 0.2% |
| Caribbean | 485 | 0.3% |
| Central America | 4,686 | 2.5% |
| Chile | 17 | 0.0% |
| China | 4,089 | 2.2% |
| Colombia | 378 | 0.2% |
| Costa Rica | 41 | 0.0% |
| Croatia | 4 | 0.0% |
| Cuba | 125 | 0.1% |
| Czechoslovakia | 18 | 0.0% |
| Dominican Republic | 49 | 0.0% |
| Eastern Africa | 261 | 0.1% |
| Eastern Asia | 5,616 | 3.0% |
| Eastern Europe | 761 | 0.4% |
| Ecuador | 227 | 0.1% |
| Egypt | 234 | 0.1% |
| El Salvador | 64 | 0.0% |
| England | 27 | 0.0% |
| Ethiopia | 10 | 0.0% |
| Europe | 1,659 | 0.9% |
| France | 19 | 0.0% |
| Germany | 132 | 0.1% |
| Ghana | 57 | 0.0% |
| Greece | 43 | 0.0% |
| Guatemala | 533 | 0.3% |
| Haiti | 239 | 0.1% |
| Honduras | 43 | 0.0% |
| Hong Kong | 51 | 0.0% |
| India | 3,525 | 1.9% |
| Indonesia | 229 | 0.1% |
| Iran | 291 | 0.2% |
| Ireland | 25 | 0.0% |
| Israel | 8 | 0.0% |
| Italy | 132 | 0.1% |
| Jamaica | 35 | 0.0% |
| Japan | 551 | 0.3% |
| Kazakhstan | 8 | 0.0% |
| Kenya | 173 | 0.1% |
| Korea | 976 | 0.5% |
| Kuwait | 52 | 0.0% |
| Laos | 76 | 0.0% |
| Latin America | 6,552 | 3.5% |
| Latvia | 51 | 0.0% |
| Lebanon | 27 | 0.0% |
| Lithuania | 40 | 0.0% |
| Malaysia | 119 | 0.1% |
| Mexico | 3,700 | 2.0% |
| Morocco | 10 | 0.0% |
| Nepal | 60 | 0.0% |
| Netherlands | 47 | 0.0% |
| Nicaragua | 46 | 0.0% |
| Nigeria | 412 | 0.2% |
| Northern Africa | 244 | 0.1% |
| Northern Europe | 400 | 0.2% |
| Oceania | 109 | 0.1% |
| Pakistan | 247 | 0.1% |
| Panama | 259 | 0.1% |
| Peru | 115 | 0.1% |
| Philippines | 273 | 0.2% |
| Poland | 81 | 0.0% |
| Portugal | 20 | 0.0% |
| Romania | 163 | 0.1% |
| Russia | 298 | 0.2% |
| Saudi Arabia | 153 | 0.1% |
| Scotland | 54 | 0.0% |
| Serbia | 26 | 0.0% |
| Singapore | 31 | 0.0% |
| South Africa | 222 | 0.1% |
| South America | 1,381 | 0.7% |
| South Central Asia | 4,325 | 2.3% |
| South Eastern Asia | 1,360 | 0.7% |
| Southern Europe | 212 | 0.1% |
| Spain | 17 | 0.0% |
| Sri Lanka | 48 | 0.0% |
| Sweden | 38 | 0.0% |
| Switzerland | 85 | 0.1% |
| Syria | 17 | 0.0% |
| Taiwan | 500 | 0.3% |
| Thailand | 310 | 0.2% |
| Trinidad and Tobago | 37 | 0.0% |
| Turkey | 291 | 0.2% |
| Ukraine | 42 | 0.0% |
| Venezuela | 354 | 0.2% |
| Vietnam | 287 | 0.2% |
| Western Africa | 604 | 0.3% |
| Western Asia | 655 | 0.4% |
| Western Europe | 286 | 0.2% |
| Zimbabwe | 67 | 0.0% | View All 100 Rows |
Sex and Age in Tippecanoe County
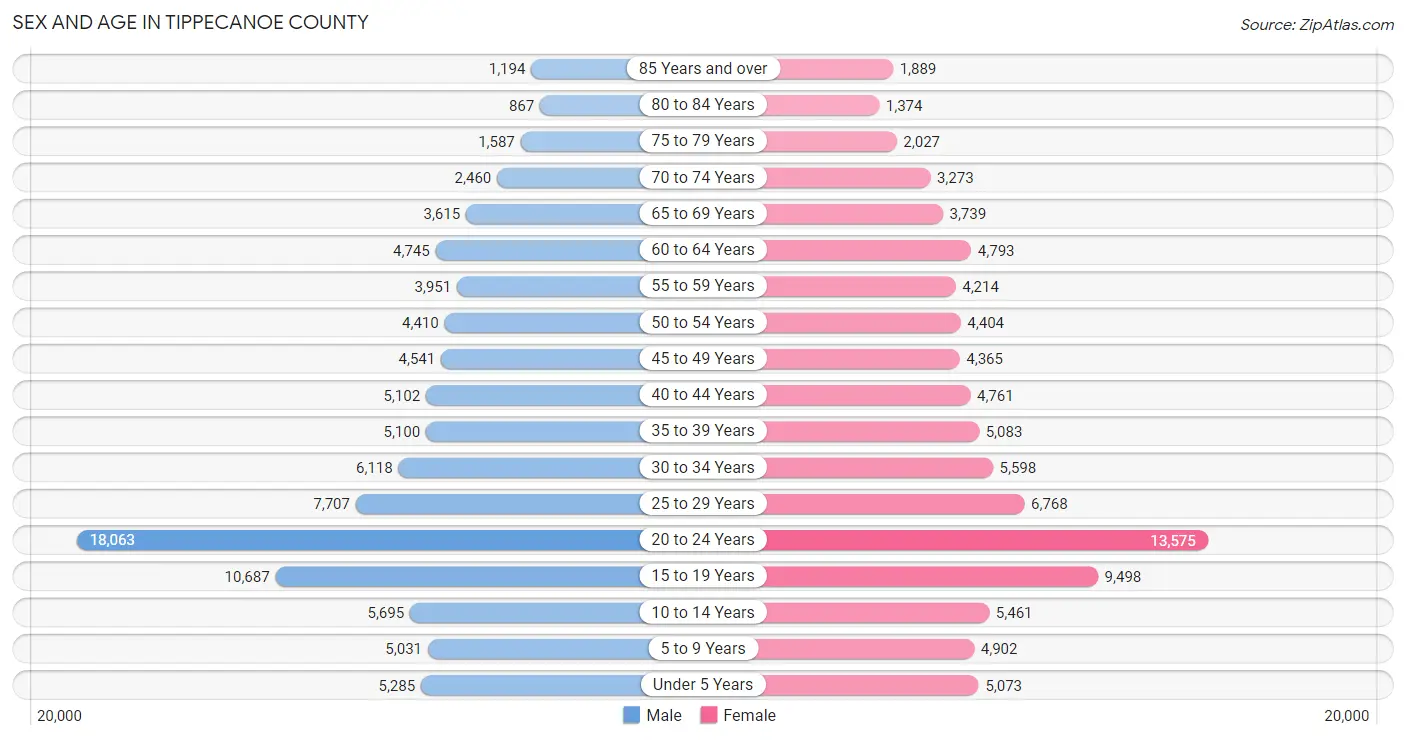
Sex and Age in Tippecanoe County
The most populous age groups in Tippecanoe County are 20 to 24 Years (18,063 | 18.8%) for men and 20 to 24 Years (13,575 | 14.9%) for women.
| Age Bracket | Male | Female |
| Under 5 Years | 5,285 (5.5%) | 5,073 (5.6%) |
| 5 to 9 Years | 5,031 (5.2%) | 4,902 (5.4%) |
| 10 to 14 Years | 5,695 (5.9%) | 5,461 (6.0%) |
| 15 to 19 Years | 10,687 (11.1%) | 9,498 (10.5%) |
| 20 to 24 Years | 18,063 (18.8%) | 13,575 (14.9%) |
| 25 to 29 Years | 7,707 (8.0%) | 6,768 (7.4%) |
| 30 to 34 Years | 6,118 (6.4%) | 5,598 (6.2%) |
| 35 to 39 Years | 5,100 (5.3%) | 5,083 (5.6%) |
| 40 to 44 Years | 5,102 (5.3%) | 4,761 (5.2%) |
| 45 to 49 Years | 4,541 (4.7%) | 4,365 (4.8%) |
| 50 to 54 Years | 4,410 (4.6%) | 4,404 (4.9%) |
| 55 to 59 Years | 3,951 (4.1%) | 4,214 (4.6%) |
| 60 to 64 Years | 4,745 (4.9%) | 4,793 (5.3%) |
| 65 to 69 Years | 3,615 (3.8%) | 3,739 (4.1%) |
| 70 to 74 Years | 2,460 (2.6%) | 3,273 (3.6%) |
| 75 to 79 Years | 1,587 (1.7%) | 2,027 (2.2%) |
| 80 to 84 Years | 867 (0.9%) | 1,374 (1.5%) |
| 85 Years and over | 1,194 (1.2%) | 1,889 (2.1%) |
| Total | 96,158 (100.0%) | 90,797 (100.0%) |
Families and Households in Tippecanoe County
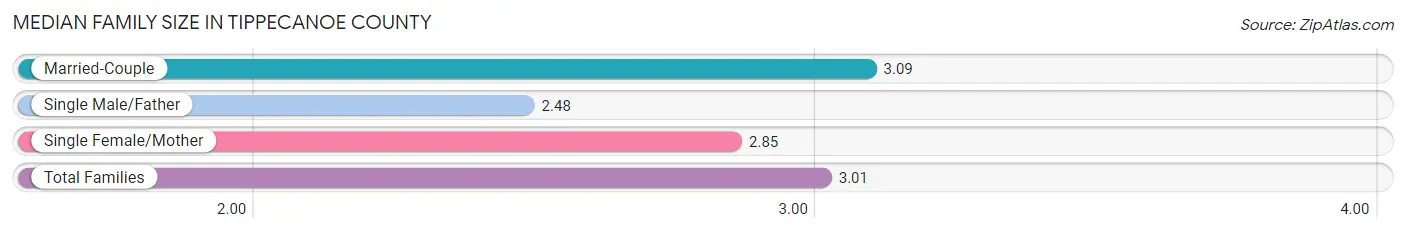
Median Family Size in Tippecanoe County
The median family size in Tippecanoe County is 3.01 persons per family, with married-couple families (29,730 | 75.9%) accounting for the largest median family size of 3.09 persons per family. On the other hand, single male/father families (2,891 | 7.4%) represent the smallest median family size with 2.48 persons per family.
| Family Type | # Families | Family Size |
| Married-Couple | 29,730 (75.9%) | 3.09 |
| Single Male/Father | 2,891 (7.4%) | 2.48 |
| Single Female/Mother | 6,553 (16.7%) | 2.85 |
| Total Families | 39,174 (100.0%) | 3.01 |
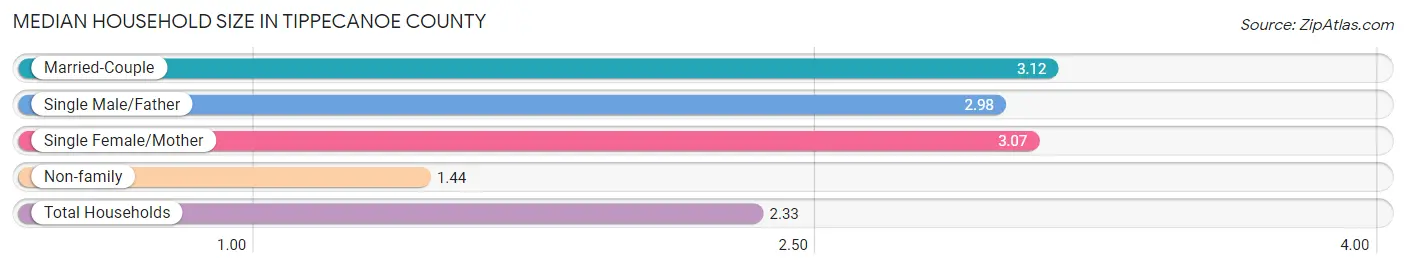
Median Household Size in Tippecanoe County
The median household size in Tippecanoe County is 2.33 persons per household, with married-couple households (29,730 | 40.5%) accounting for the largest median household size of 3.12 persons per household. non-family households (34,153 | 46.6%) represent the smallest median household size with 1.44 persons per household.
| Household Type | # Households | Household Size |
| Married-Couple | 29,730 (40.5%) | 3.12 |
| Single Male/Father | 2,891 (3.9%) | 2.98 |
| Single Female/Mother | 6,553 (8.9%) | 3.07 |
| Non-family | 34,153 (46.6%) | 1.44 |
| Total Households | 73,327 (100.0%) | 2.33 |
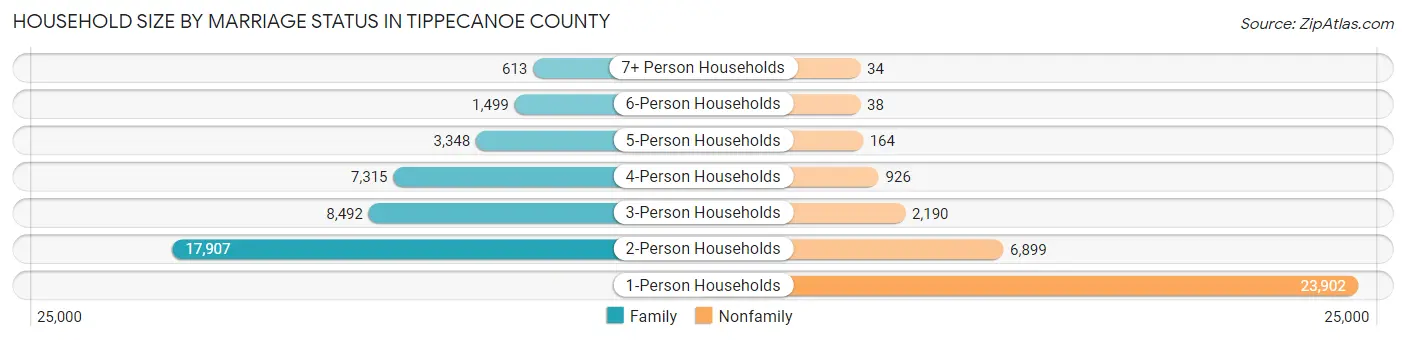
Household Size by Marriage Status in Tippecanoe County
Out of a total of 73,327 households in Tippecanoe County, 39,174 (53.4%) are family households, while 34,153 (46.6%) are nonfamily households. The most numerous type of family households are 2-person households, comprising 17,907, and the most common type of nonfamily households are 1-person households, comprising 23,902.
| Household Size | Family Households | Nonfamily Households |
| 1-Person Households | - | 23,902 (32.6%) |
| 2-Person Households | 17,907 (24.4%) | 6,899 (9.4%) |
| 3-Person Households | 8,492 (11.6%) | 2,190 (3.0%) |
| 4-Person Households | 7,315 (10.0%) | 926 (1.3%) |
| 5-Person Households | 3,348 (4.6%) | 164 (0.2%) |
| 6-Person Households | 1,499 (2.0%) | 38 (0.1%) |
| 7+ Person Households | 613 (0.8%) | 34 (0.1%) |
| Total | 39,174 (53.4%) | 34,153 (46.6%) |
Female Fertility in Tippecanoe County
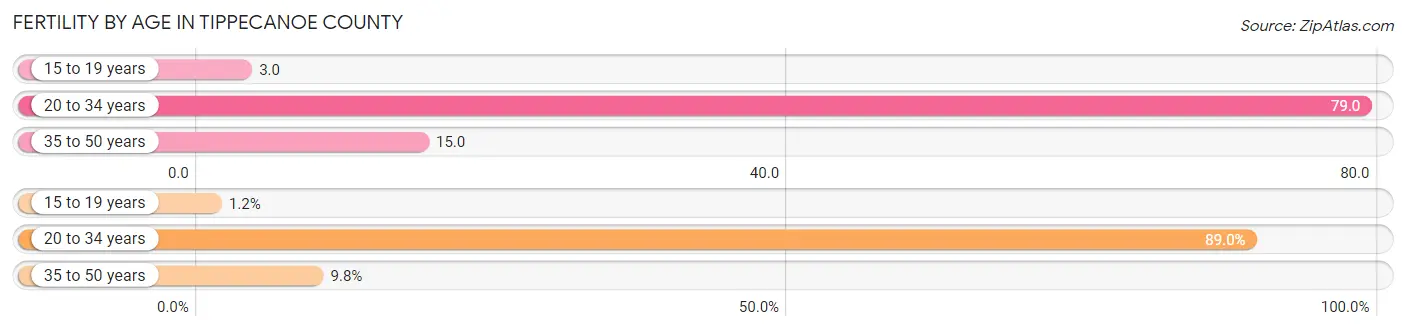
Fertility by Age in Tippecanoe County
Average fertility rate in Tippecanoe County is 45.0 births per 1,000 women. Women in the age bracket of 20 to 34 years have the highest fertility rate with 79.0 births per 1,000 women. Women in the age bracket of 20 to 34 years acount for 89.0% of all women with births.
| Age Bracket | Women with Births | Births / 1,000 Women |
| 15 to 19 years | 27 (1.2%) | 3.0 |
| 20 to 34 years | 2,043 (89.0%) | 79.0 |
| 35 to 50 years | 225 (9.8%) | 15.0 |
| Total | 2,295 (100.0%) | 45.0 |
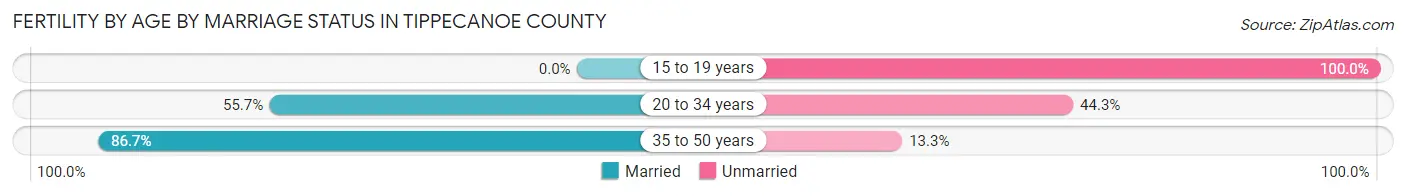
Fertility by Age by Marriage Status in Tippecanoe County
58.1% of women with births (2,295) in Tippecanoe County are married. The highest percentage of unmarried women with births falls into 15 to 19 years age bracket with 100.0% of them unmarried at the time of birth, while the lowest percentage of unmarried women with births belong to 35 to 50 years age bracket with 13.3% of them unmarried.
| Age Bracket | Married | Unmarried |
| 15 to 19 years | 0 (0.0%) | 27 (100.0%) |
| 20 to 34 years | 1,138 (55.7%) | 905 (44.3%) |
| 35 to 50 years | 195 (86.7%) | 30 (13.3%) |
| Total | 1,333 (58.1%) | 962 (41.9%) |
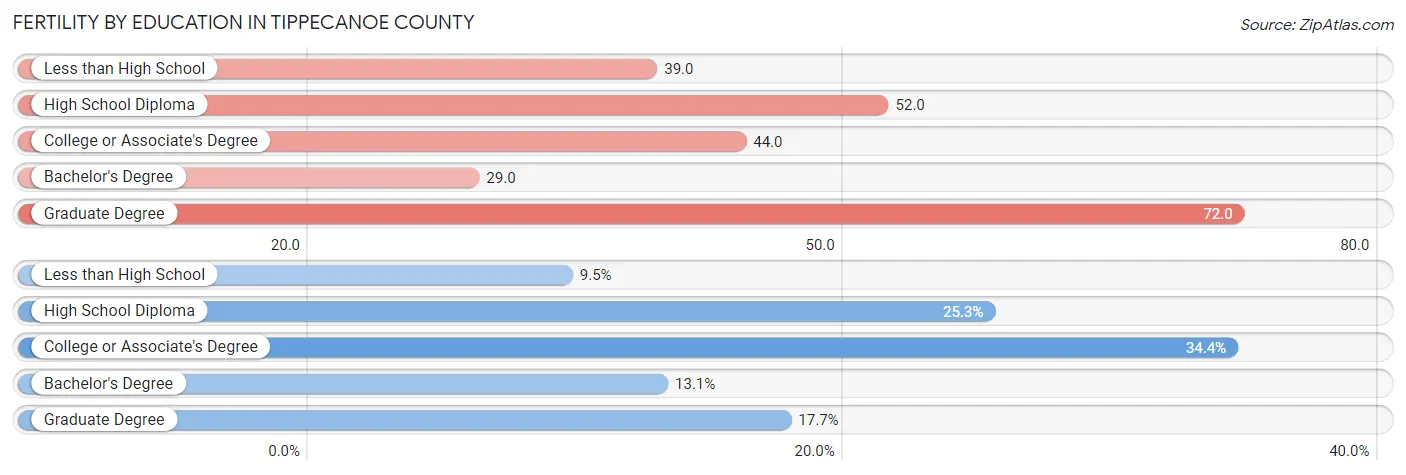
Fertility by Education in Tippecanoe County
Average fertility rate in Tippecanoe County is 45.0 births per 1,000 women. Women with the education attainment of graduate degree have the highest fertility rate of 72.0 births per 1,000 women, while women with the education attainment of bachelor's degree have the lowest fertility at 29.0 births per 1,000 women. Women with the education attainment of college or associate's degree represent 34.4% of all women with births.
| Educational Attainment | Women with Births | Births / 1,000 Women |
| Less than High School | 218 (9.5%) | 39.0 |
| High School Diploma | 581 (25.3%) | 52.0 |
| College or Associate's Degree | 790 (34.4%) | 44.0 |
| Bachelor's Degree | 300 (13.1%) | 29.0 |
| Graduate Degree | 406 (17.7%) | 72.0 |
| Total | 2,295 (100.0%) | 45.0 |
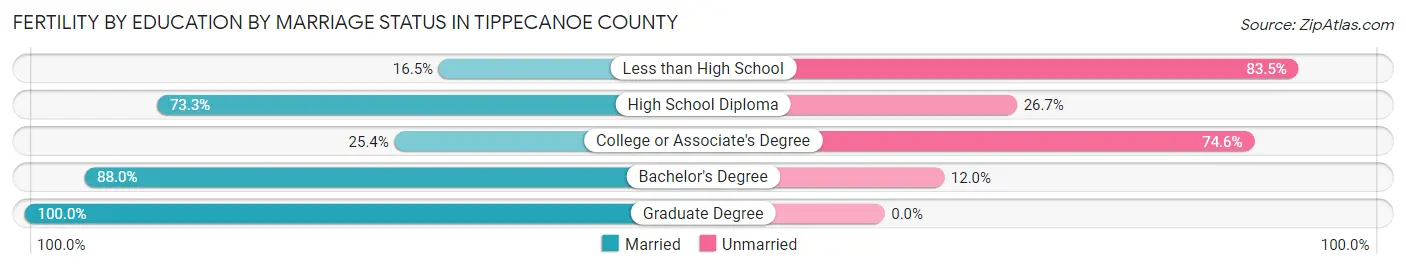
Fertility by Education by Marriage Status in Tippecanoe County
41.9% of women with births in Tippecanoe County are unmarried. Women with the educational attainment of graduate degree are most likely to be married with 100.0% of them married at childbirth, while women with the educational attainment of less than high school are least likely to be married with 83.5% of them unmarried at childbirth.
| Educational Attainment | Married | Unmarried |
| Less than High School | 36 (16.5%) | 182 (83.5%) |
| High School Diploma | 426 (73.3%) | 155 (26.7%) |
| College or Associate's Degree | 201 (25.4%) | 589 (74.6%) |
| Bachelor's Degree | 264 (88.0%) | 36 (12.0%) |
| Graduate Degree | 406 (100.0%) | 0 (0.0%) |
| Total | 1,333 (58.1%) | 962 (41.9%) |
Income in Tippecanoe County
Income Overview in Tippecanoe County
Per Capita Income in Tippecanoe County is $30,608, while median incomes of families and households are $81,545 and $55,728 respectively.
| Characteristic | Number | Measure |
| Per Capita Income | 186,955 | $30,608 |
| Median Family Income | 39,174 | $81,545 |
| Mean Family Income | 39,174 | $101,022 |
| Median Household Income | 73,327 | $55,728 |
| Mean Household Income | 73,327 | $76,830 |
| Income Deficit | 39,174 | $10,876 |
| Wage / Income Gap (%) | 186,955 | 28.69% |
| Wage / Income Gap ($) | 186,955 | 71.31¢ per $1 |
| Gini / Inequality Index | 186,955 | 0.48 |
Earnings by Sex in Tippecanoe County
Average Earnings in Tippecanoe County are $30,471, $35,338 for men and $25,198 for women, a difference of 28.7%.
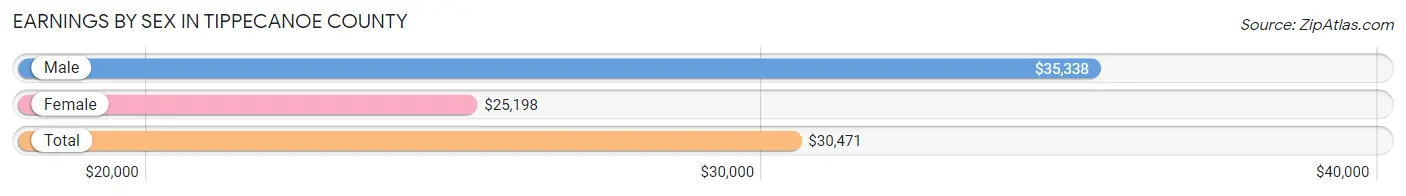
| Sex | Number | Average Earnings |
| Male | 59,414 (54.8%) | $35,338 |
| Female | 48,917 (45.2%) | $25,198 |
| Total | 108,331 (100.0%) | $30,471 |
Earnings by Sex by Income Bracket in Tippecanoe County
The most common earnings brackets in Tippecanoe County are $100,000+ for men (6,516 | 11.0%) and $2,499 or less for women (4,458 | 9.1%).
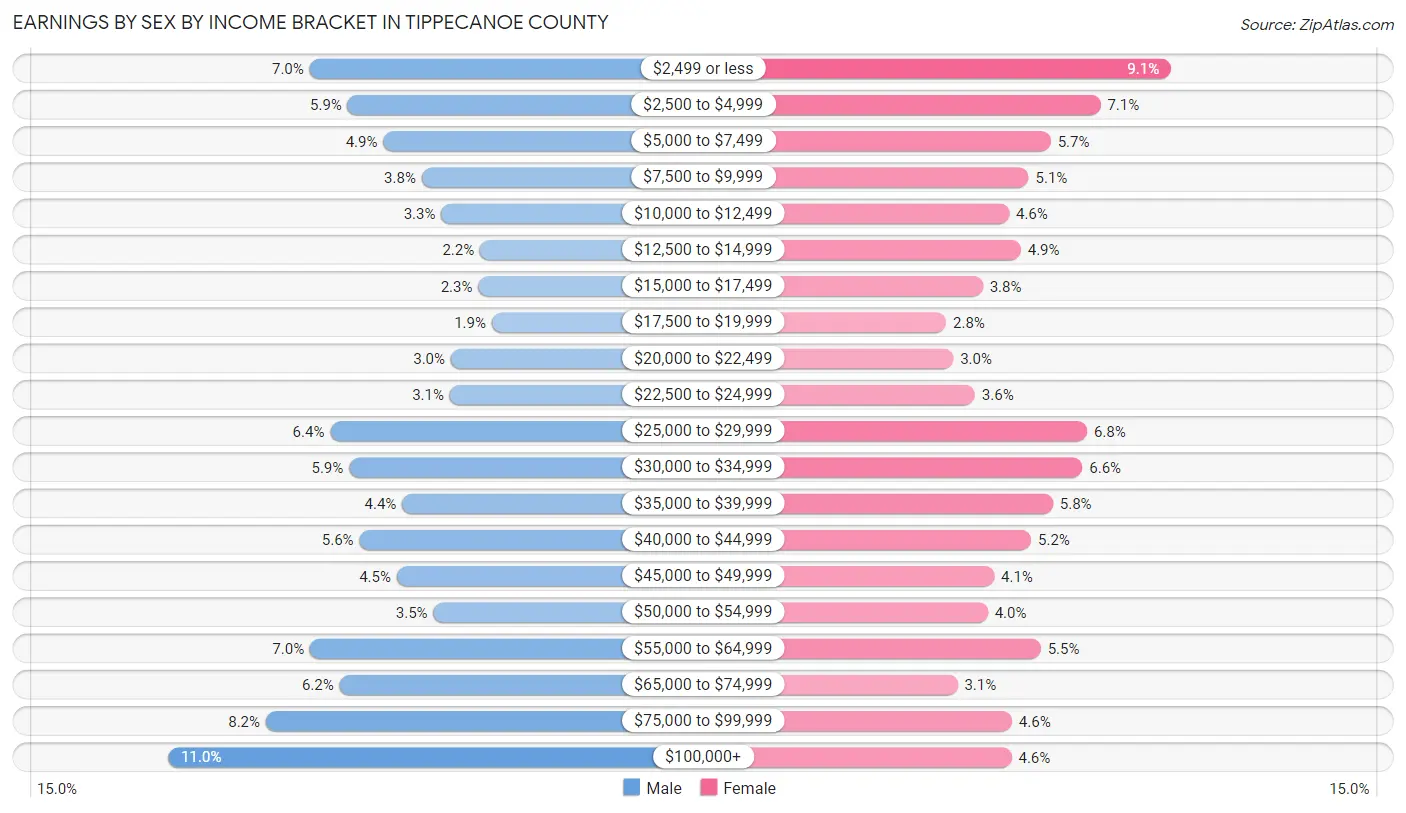
| Income | Male | Female |
| $2,499 or less | 4,153 (7.0%) | 4,458 (9.1%) |
| $2,500 to $4,999 | 3,519 (5.9%) | 3,490 (7.1%) |
| $5,000 to $7,499 | 2,925 (4.9%) | 2,803 (5.7%) |
| $7,500 to $9,999 | 2,282 (3.8%) | 2,498 (5.1%) |
| $10,000 to $12,499 | 1,953 (3.3%) | 2,233 (4.6%) |
| $12,500 to $14,999 | 1,309 (2.2%) | 2,393 (4.9%) |
| $15,000 to $17,499 | 1,338 (2.2%) | 1,867 (3.8%) |
| $17,500 to $19,999 | 1,112 (1.9%) | 1,366 (2.8%) |
| $20,000 to $22,499 | 1,797 (3.0%) | 1,464 (3.0%) |
| $22,500 to $24,999 | 1,815 (3.0%) | 1,761 (3.6%) |
| $25,000 to $29,999 | 3,806 (6.4%) | 3,302 (6.8%) |
| $30,000 to $34,999 | 3,494 (5.9%) | 3,240 (6.6%) |
| $35,000 to $39,999 | 2,611 (4.4%) | 2,830 (5.8%) |
| $40,000 to $44,999 | 3,322 (5.6%) | 2,533 (5.2%) |
| $45,000 to $49,999 | 2,695 (4.5%) | 2,025 (4.1%) |
| $50,000 to $54,999 | 2,087 (3.5%) | 1,936 (4.0%) |
| $55,000 to $64,999 | 4,145 (7.0%) | 2,667 (5.4%) |
| $65,000 to $74,999 | 3,652 (6.1%) | 1,519 (3.1%) |
| $75,000 to $99,999 | 4,883 (8.2%) | 2,268 (4.6%) |
| $100,000+ | 6,516 (11.0%) | 2,264 (4.6%) |
| Total | 59,414 (100.0%) | 48,917 (100.0%) |
Earnings by Sex by Educational Attainment in Tippecanoe County
Average earnings in Tippecanoe County are $50,378 for men and $36,887 for women, a difference of 26.8%. Men with an educational attainment of graduate degree enjoy the highest average annual earnings of $75,185, while those with less than high school education earn the least with $33,306. Women with an educational attainment of graduate degree earn the most with the average annual earnings of $56,660, while those with less than high school education have the smallest earnings of $21,412.
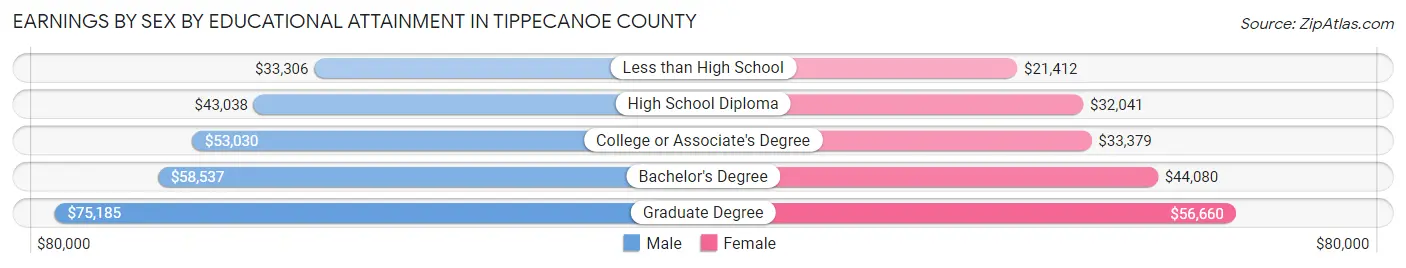
| Educational Attainment | Male Income | Female Income |
| Less than High School | $33,306 | $21,412 |
| High School Diploma | $43,038 | $32,041 |
| College or Associate's Degree | $53,030 | $33,379 |
| Bachelor's Degree | $58,537 | $44,080 |
| Graduate Degree | $75,185 | $56,660 |
| Total | $50,378 | $36,887 |
Family Income in Tippecanoe County
Family Income Brackets in Tippecanoe County
According to the Tippecanoe County family income data, there are 8,697 families falling into the $100,000 to $149,999 income range, which is the most common income bracket and makes up 22.2% of all families. Conversely, the less than $10,000 income bracket is the least frequent group with only 940 families (2.4%) belonging to this category.
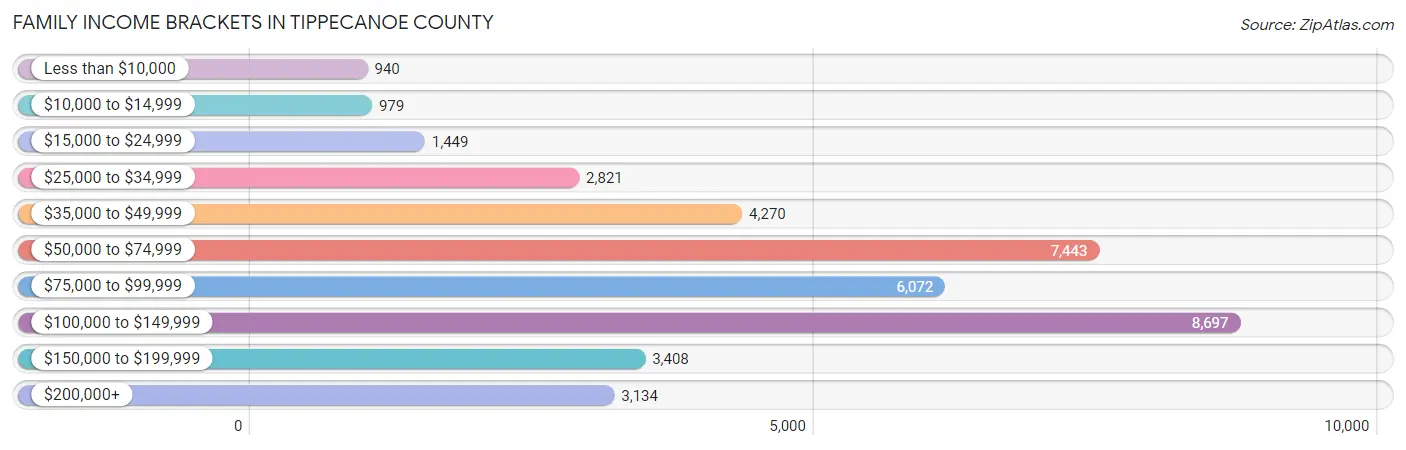
| Income Bracket | # Families | % Families |
| Less than $10,000 | 940 | 2.4% |
| $10,000 to $14,999 | 979 | 2.5% |
| $15,000 to $24,999 | 1,449 | 3.7% |
| $25,000 to $34,999 | 2,821 | 7.2% |
| $35,000 to $49,999 | 4,270 | 10.9% |
| $50,000 to $74,999 | 7,443 | 19.0% |
| $75,000 to $99,999 | 6,072 | 15.5% |
| $100,000 to $149,999 | 8,697 | 22.2% |
| $150,000 to $199,999 | 3,408 | 8.7% |
| $200,000+ | 3,134 | 8.0% |
Family Income by Famaliy Size in Tippecanoe County
4-person families (6,671 | 17.0%) account for the highest median family income in Tippecanoe County with $96,278 per family, while 2-person families (19,532 | 49.9%) have the highest median income of $38,697 per family member.
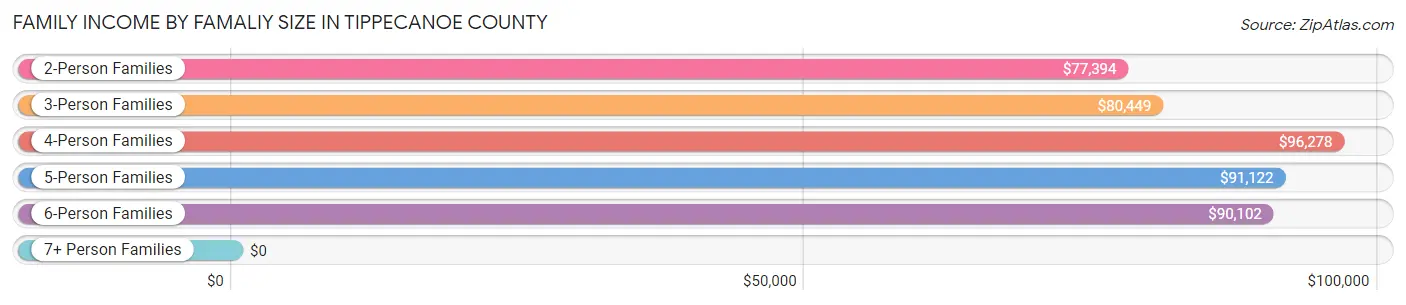
| Income Bracket | # Families | Median Income |
| 2-Person Families | 19,532 (49.9%) | $77,394 |
| 3-Person Families | 8,042 (20.5%) | $80,449 |
| 4-Person Families | 6,671 (17.0%) | $96,278 |
| 5-Person Families | 3,061 (7.8%) | $91,122 |
| 6-Person Families | 1,294 (3.3%) | $90,102 |
| 7+ Person Families | 574 (1.5%) | $0 |
| Total | 39,174 (100.0%) | $81,545 |
Family Income by Number of Earners in Tippecanoe County
The median family income in Tippecanoe County is $81,545, with families comprising 3+ earners (3,091) having the highest median family income of $122,538, while families with no earners (5,000) have the lowest median family income of $50,617, accounting for 7.9% and 12.8% of families, respectively.
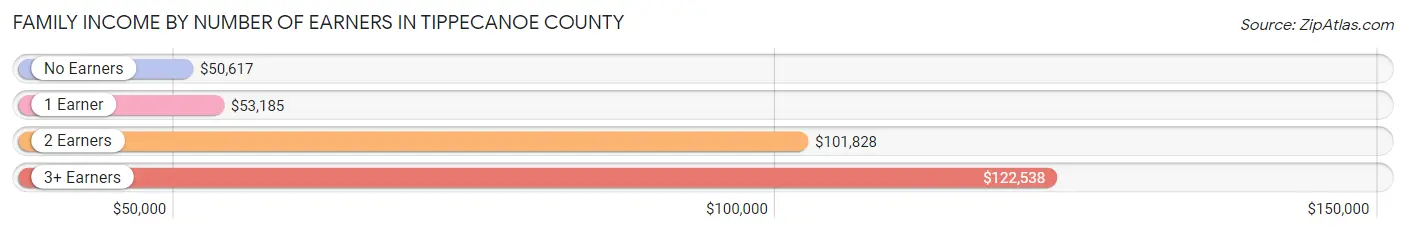
| Number of Earners | # Families | Median Income |
| No Earners | 5,000 (12.8%) | $50,617 |
| 1 Earner | 12,613 (32.2%) | $53,185 |
| 2 Earners | 18,470 (47.1%) | $101,828 |
| 3+ Earners | 3,091 (7.9%) | $122,538 |
| Total | 39,174 (100.0%) | $81,545 |
Household Income in Tippecanoe County
Household Income Brackets in Tippecanoe County
With 12,759 households falling in the category, the $50,000 to $74,999 income range is the most frequent in Tippecanoe County, accounting for 17.4% of all households. In contrast, only 3,226 households (4.4%) fall into the $10,000 to $14,999 income bracket, making it the least populous group.
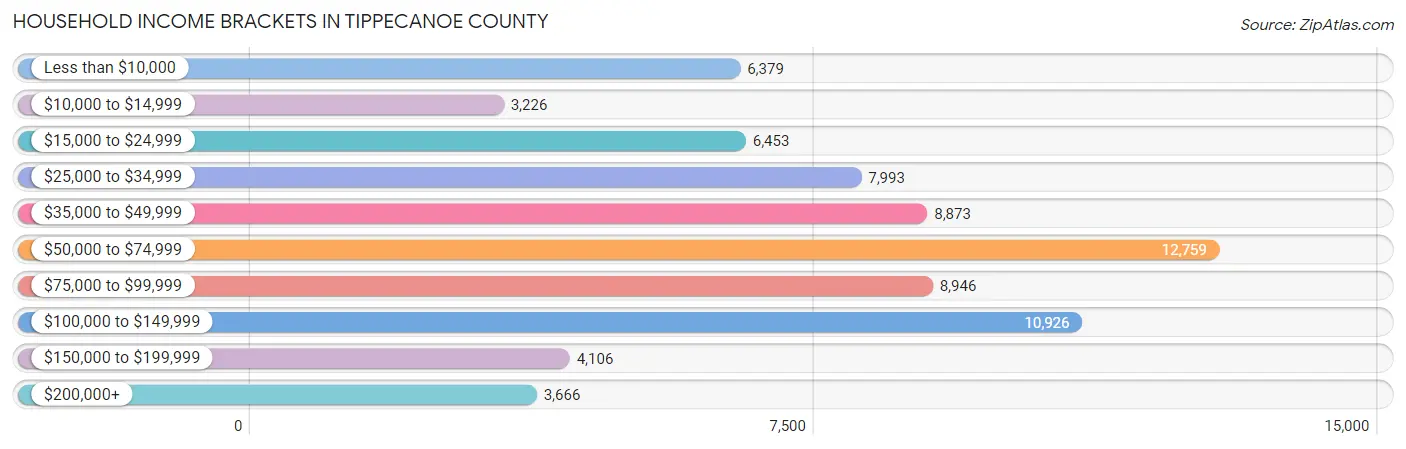
| Income Bracket | # Households | % Households |
| Less than $10,000 | 6,379 | 8.7% |
| $10,000 to $14,999 | 3,226 | 4.4% |
| $15,000 to $24,999 | 6,453 | 8.8% |
| $25,000 to $34,999 | 7,993 | 10.9% |
| $35,000 to $49,999 | 8,873 | 12.1% |
| $50,000 to $74,999 | 12,759 | 17.4% |
| $75,000 to $99,999 | 8,946 | 12.2% |
| $100,000 to $149,999 | 10,926 | 14.9% |
| $150,000 to $199,999 | 4,106 | 5.6% |
| $200,000+ | 3,666 | 5.0% |
Household Income by Householder Age in Tippecanoe County
The median household income in Tippecanoe County is $55,728, with the highest median household income of $81,944 found in the 45 to 64 years age bracket for the primary householder. A total of 21,174 households (28.9%) fall into this category. Meanwhile, the 15 to 24 years age bracket for the primary householder has the lowest median household income of $21,948, with 13,053 households (17.8%) in this group.
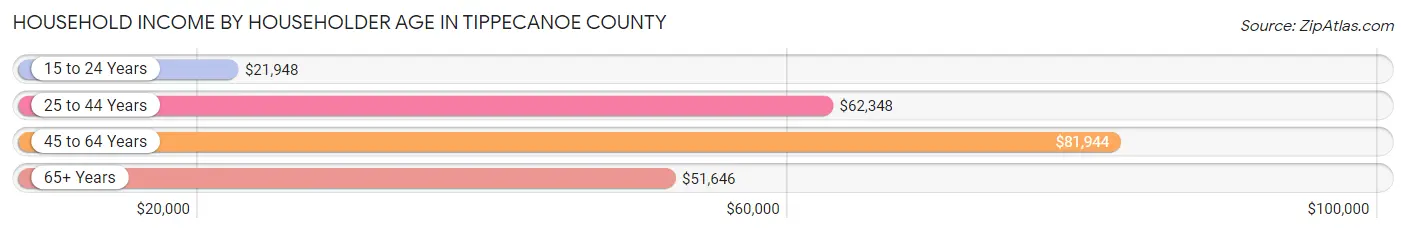
| Income Bracket | # Households | Median Income |
| 15 to 24 Years | 13,053 (17.8%) | $21,948 |
| 25 to 44 Years | 25,508 (34.8%) | $62,348 |
| 45 to 64 Years | 21,174 (28.9%) | $81,944 |
| 65+ Years | 13,592 (18.5%) | $51,646 |
| Total | 73,327 (100.0%) | $55,728 |
Poverty in Tippecanoe County
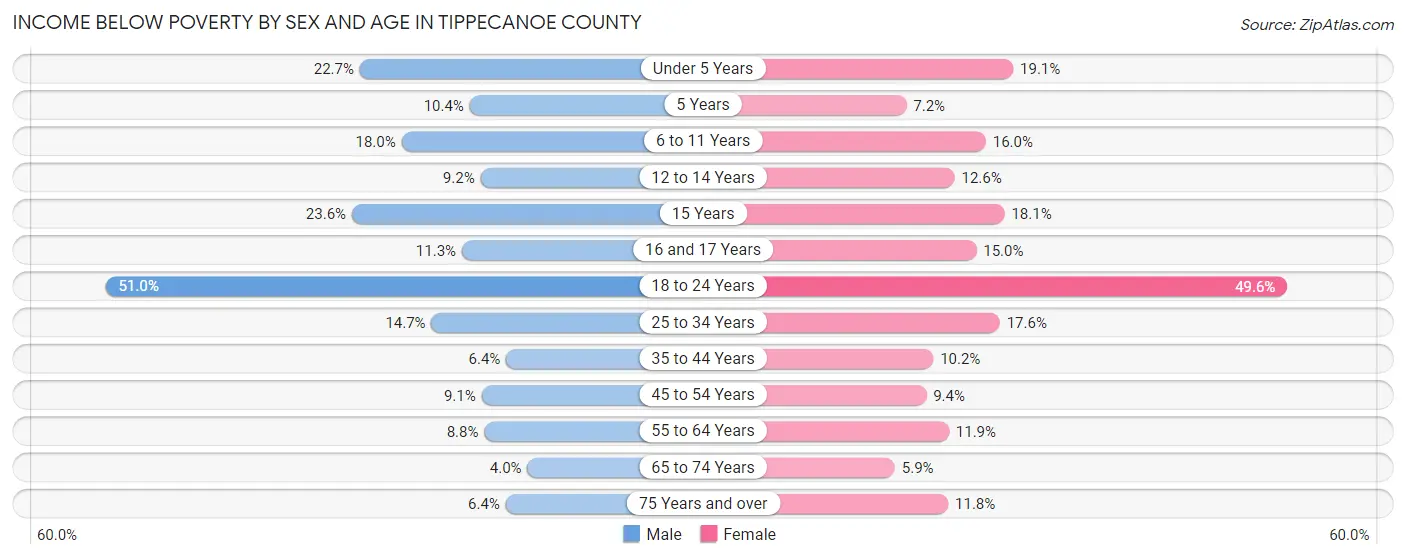
Income Below Poverty by Sex and Age in Tippecanoe County
With 19.4% poverty level for males and 18.8% for females among the residents of Tippecanoe County, 18 to 24 year old males and 18 to 24 year old females are the most vulnerable to poverty, with 9,131 males (51.0%) and 6,802 females (49.6%) in their respective age groups living below the poverty level.
| Age Bracket | Male | Female |
| Under 5 Years | 1,178 (22.7%) | 950 (19.1%) |
| 5 Years | 87 (10.4%) | 68 (7.2%) |
| 6 to 11 Years | 1,157 (18.0%) | 959 (16.0%) |
| 12 to 14 Years | 300 (9.2%) | 405 (12.6%) |
| 15 Years | 231 (23.5%) | 204 (18.1%) |
| 16 and 17 Years | 251 (11.3%) | 286 (15.0%) |
| 18 to 24 Years | 9,131 (51.0%) | 6,802 (49.6%) |
| 25 to 34 Years | 1,991 (14.7%) | 2,153 (17.6%) |
| 35 to 44 Years | 640 (6.4%) | 995 (10.2%) |
| 45 to 54 Years | 813 (9.1%) | 824 (9.4%) |
| 55 to 64 Years | 760 (8.8%) | 1,070 (11.9%) |
| 65 to 74 Years | 239 (4.0%) | 405 (5.9%) |
| 75 Years and over | 225 (6.4%) | 564 (11.8%) |
| Total | 17,003 (19.4%) | 15,685 (18.8%) |
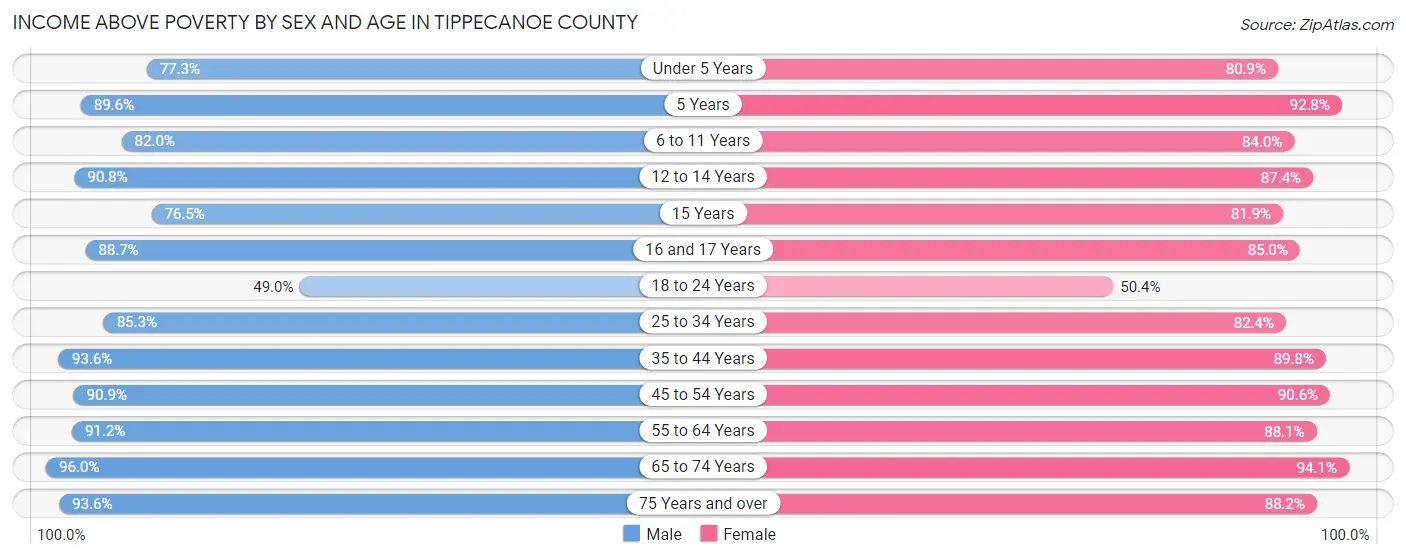
Income Above Poverty by Sex and Age in Tippecanoe County
According to the poverty statistics in Tippecanoe County, males aged 65 to 74 years and females aged 65 to 74 years are the age groups that are most secure financially, with 96.0% of males and 94.1% of females in these age groups living above the poverty line.
| Age Bracket | Male | Female |
| Under 5 Years | 4,019 (77.3%) | 4,028 (80.9%) |
| 5 Years | 747 (89.6%) | 878 (92.8%) |
| 6 to 11 Years | 5,264 (82.0%) | 5,018 (84.0%) |
| 12 to 14 Years | 2,949 (90.8%) | 2,820 (87.4%) |
| 15 Years | 750 (76.4%) | 922 (81.9%) |
| 16 and 17 Years | 1,971 (88.7%) | 1,623 (85.0%) |
| 18 to 24 Years | 8,777 (49.0%) | 6,913 (50.4%) |
| 25 to 34 Years | 11,562 (85.3%) | 10,084 (82.4%) |
| 35 to 44 Years | 9,404 (93.6%) | 8,782 (89.8%) |
| 45 to 54 Years | 8,113 (90.9%) | 7,940 (90.6%) |
| 55 to 64 Years | 7,880 (91.2%) | 7,906 (88.1%) |
| 65 to 74 Years | 5,735 (96.0%) | 6,443 (94.1%) |
| 75 Years and over | 3,282 (93.6%) | 4,200 (88.2%) |
| Total | 70,453 (80.6%) | 67,557 (81.2%) |
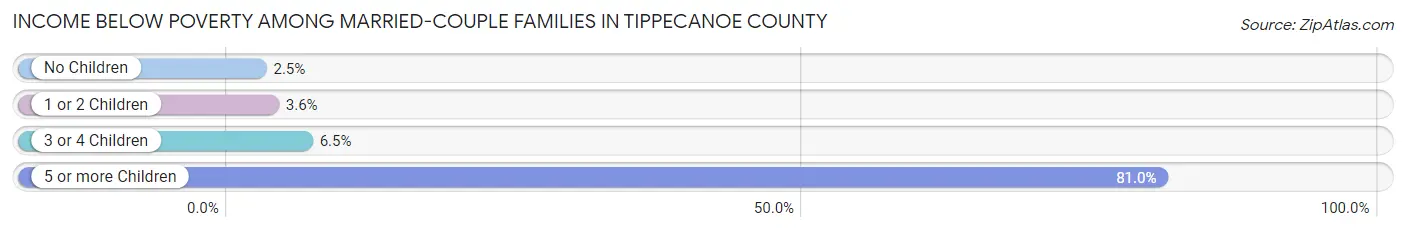
Income Below Poverty Among Married-Couple Families in Tippecanoe County
The poverty statistics for married-couple families in Tippecanoe County show that 4.1% or 1,225 of the total 29,730 families live below the poverty line. Families with 5 or more children have the highest poverty rate of 81.0%, comprising of 268 families. On the other hand, families with no children have the lowest poverty rate of 2.5%, which includes 419 families.
| Children | Above Poverty | Below Poverty |
| No Children | 16,444 (97.5%) | 419 (2.5%) |
| 1 or 2 Children | 9,064 (96.5%) | 334 (3.5%) |
| 3 or 4 Children | 2,934 (93.5%) | 204 (6.5%) |
| 5 or more Children | 63 (19.0%) | 268 (81.0%) |
| Total | 28,505 (95.9%) | 1,225 (4.1%) |
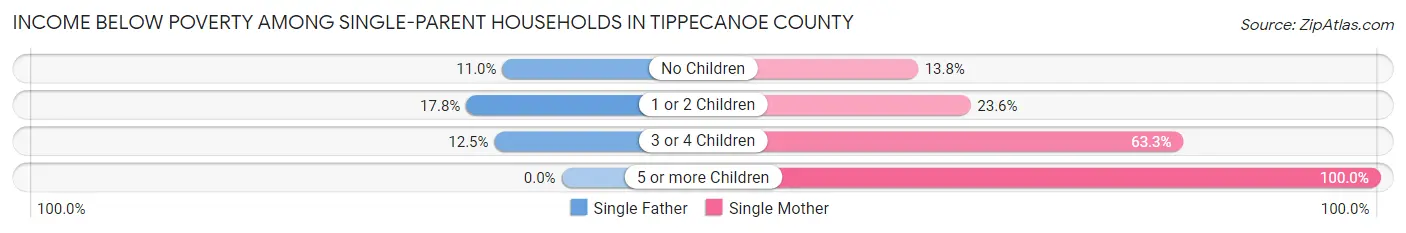
Income Below Poverty Among Single-Parent Households in Tippecanoe County
According to the poverty data in Tippecanoe County, 14.8% or 428 single-father households and 26.7% or 1,747 single-mother households are living below the poverty line. Among single-father households, those with 1 or 2 children have the highest poverty rate, with 285 households (17.7%) experiencing poverty. Likewise, among single-mother households, those with 5 or more children have the highest poverty rate, with 19 households (100.0%) falling below the poverty line.
| Children | Single Father | Single Mother |
| No Children | 121 (11.0%) | 312 (13.8%) |
| 1 or 2 Children | 285 (17.7%) | 765 (23.6%) |
| 3 or 4 Children | 22 (12.5%) | 651 (63.3%) |
| 5 or more Children | 0 (0.0%) | 19 (100.0%) |
| Total | 428 (14.8%) | 1,747 (26.7%) |
Income Below Poverty Among Married-Couple vs Single-Parent Households in Tippecanoe County
The poverty data for Tippecanoe County shows that 1,225 of the married-couple family households (4.1%) and 2,175 of the single-parent households (23.0%) are living below the poverty level. Within the married-couple family households, those with 5 or more children have the highest poverty rate, with 268 households (81.0%) falling below the poverty line. Among the single-parent households, those with 5 or more children have the highest poverty rate, with 19 household (65.5%) living below poverty.
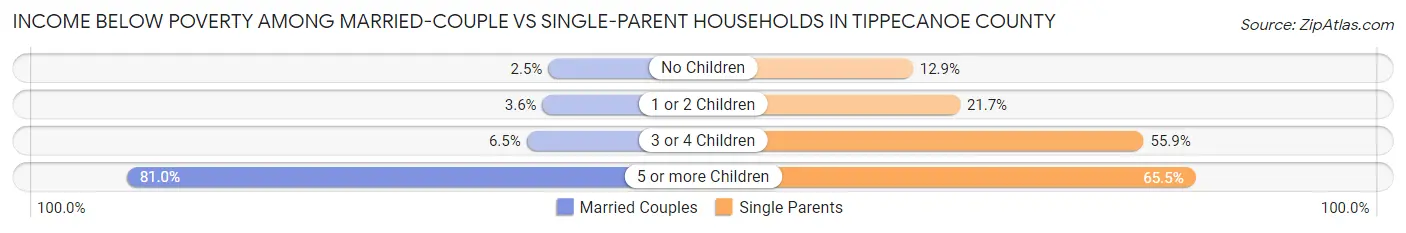
| Children | Married-Couple Families | Single-Parent Households |
| No Children | 419 (2.5%) | 433 (12.9%) |
| 1 or 2 Children | 334 (3.5%) | 1,050 (21.7%) |
| 3 or 4 Children | 204 (6.5%) | 673 (55.8%) |
| 5 or more Children | 268 (81.0%) | 19 (65.5%) |
| Total | 1,225 (4.1%) | 2,175 (23.0%) |
Employment Characteristics in Tippecanoe County
Employment by Class of Employer in Tippecanoe County
Among the 88,935 employed individuals in Tippecanoe County, private company employees (57,857 | 65.1%), state government employees (11,469 | 12.9%), and not-for-profit organizations (8,375 | 9.4%) make up the most common classes of employment.
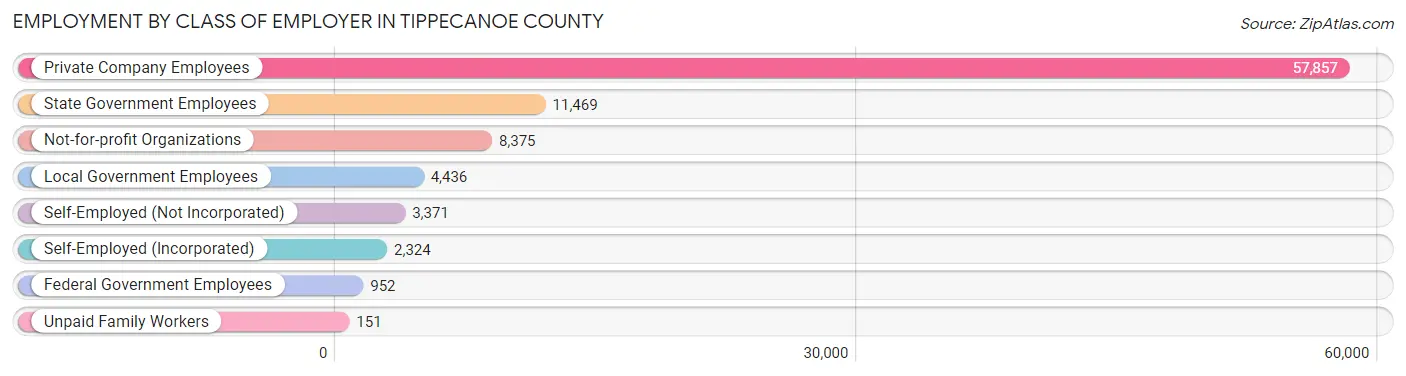
| Employer Class | # Employees | % Employees |
| Private Company Employees | 57,857 | 65.1% |
| Self-Employed (Incorporated) | 2,324 | 2.6% |
| Self-Employed (Not Incorporated) | 3,371 | 3.8% |
| Not-for-profit Organizations | 8,375 | 9.4% |
| Local Government Employees | 4,436 | 5.0% |
| State Government Employees | 11,469 | 12.9% |
| Federal Government Employees | 952 | 1.1% |
| Unpaid Family Workers | 151 | 0.2% |
| Total | 88,935 | 100.0% |
Employment Status by Age in Tippecanoe County
According to the labor force statistics for Tippecanoe County, out of the total population over 16 years of age (153,396), 62.1% or 95,259 individuals are in the labor force, with 3.6% or 3,429 of them unemployed. The age group with the highest labor force participation rate is 45 to 54 years, with 85.9% or 15,221 individuals in the labor force. Within the labor force, the 16 to 19 years age range has the highest percentage of unemployed individuals, with 10.0% or 690 of them being unemployed.
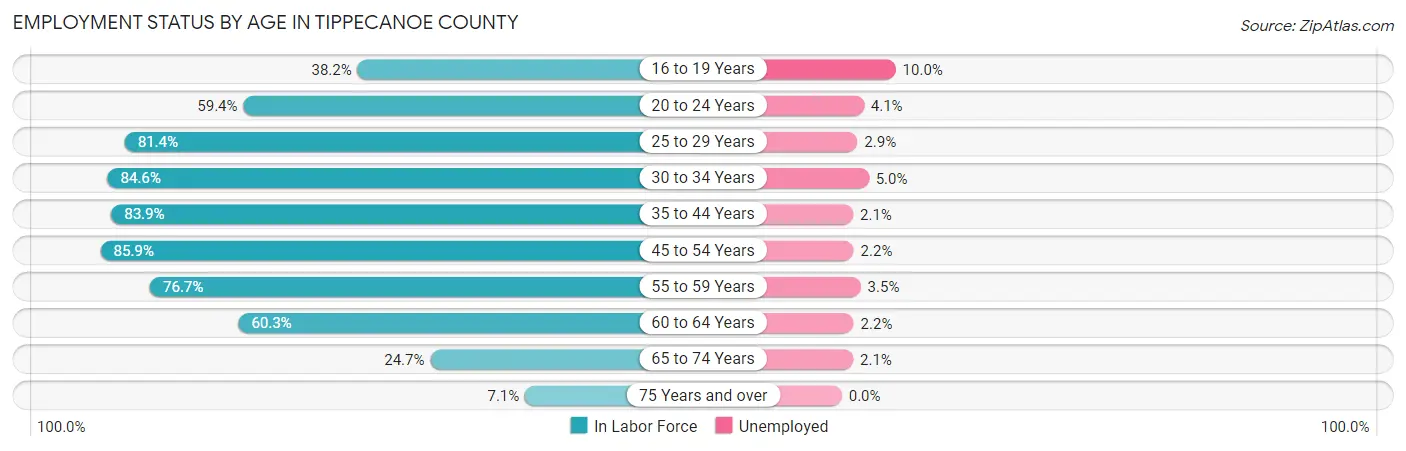
| Age Bracket | In Labor Force | Unemployed |
| 16 to 19 Years | 6,904 (38.2%) | 690 (10.0%) |
| 20 to 24 Years | 18,793 (59.4%) | 771 (4.1%) |
| 25 to 29 Years | 11,783 (81.4%) | 342 (2.9%) |
| 30 to 34 Years | 9,912 (84.6%) | 496 (5.0%) |
| 35 to 44 Years | 16,819 (83.9%) | 353 (2.1%) |
| 45 to 54 Years | 15,221 (85.9%) | 335 (2.2%) |
| 55 to 59 Years | 6,263 (76.7%) | 219 (3.5%) |
| 60 to 64 Years | 5,751 (60.3%) | 127 (2.2%) |
| 65 to 74 Years | 3,232 (24.7%) | 68 (2.1%) |
| 75 Years and over | 635 (7.1%) | 0 (0.0%) |
| Total | 95,259 (62.1%) | 3,429 (3.6%) |
Employment Status by Educational Attainment in Tippecanoe County
According to labor force statistics for Tippecanoe County, 80.5% of individuals (65,736) out of the total population between 25 and 64 years of age (81,660) are in the labor force, with 2.8% or 1,841 of them being unemployed. The group with the highest labor force participation rate are those with the educational attainment of bachelor's degree or higher, with 86.6% or 29,416 individuals in the labor force. Within the labor force, individuals with less than high school education have the highest percentage of unemployment, with 7.0% or 287 of them being unemployed.
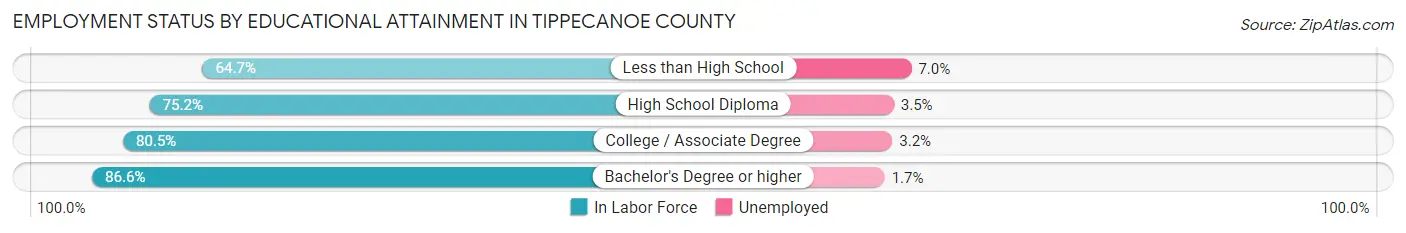
| Educational Attainment | In Labor Force | Unemployed |
| Less than High School | 4,104 (64.7%) | 444 (7.0%) |
| High School Diploma | 14,791 (75.2%) | 688 (3.5%) |
| College / Associate Degree | 17,452 (80.5%) | 694 (3.2%) |
| Bachelor's Degree or higher | 29,416 (86.6%) | 577 (1.7%) |
| Total | 65,736 (80.5%) | 2,286 (2.8%) |
Employment Occupations by Sex in Tippecanoe County
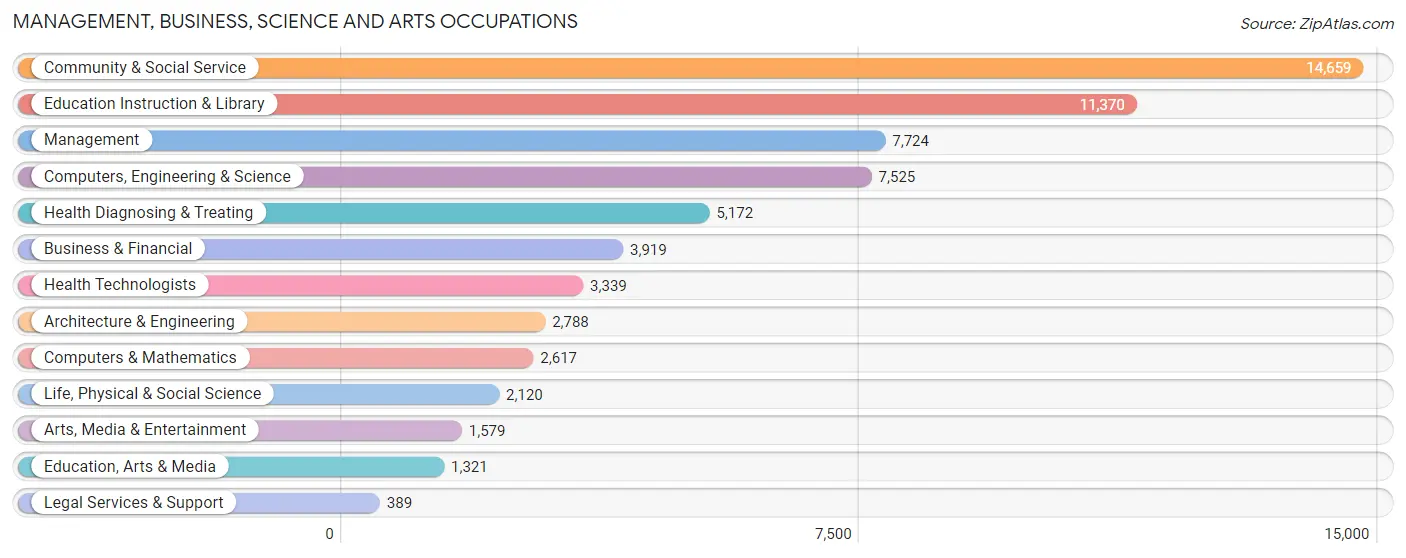
Management, Business, Science and Arts Occupations
The most common Management, Business, Science and Arts occupations in Tippecanoe County are Community & Social Service (14,659 | 16.0%), Education Instruction & Library (11,370 | 12.4%), Management (7,724 | 8.4%), Computers, Engineering & Science (7,525 | 8.2%), and Health Diagnosing & Treating (5,172 | 5.6%).
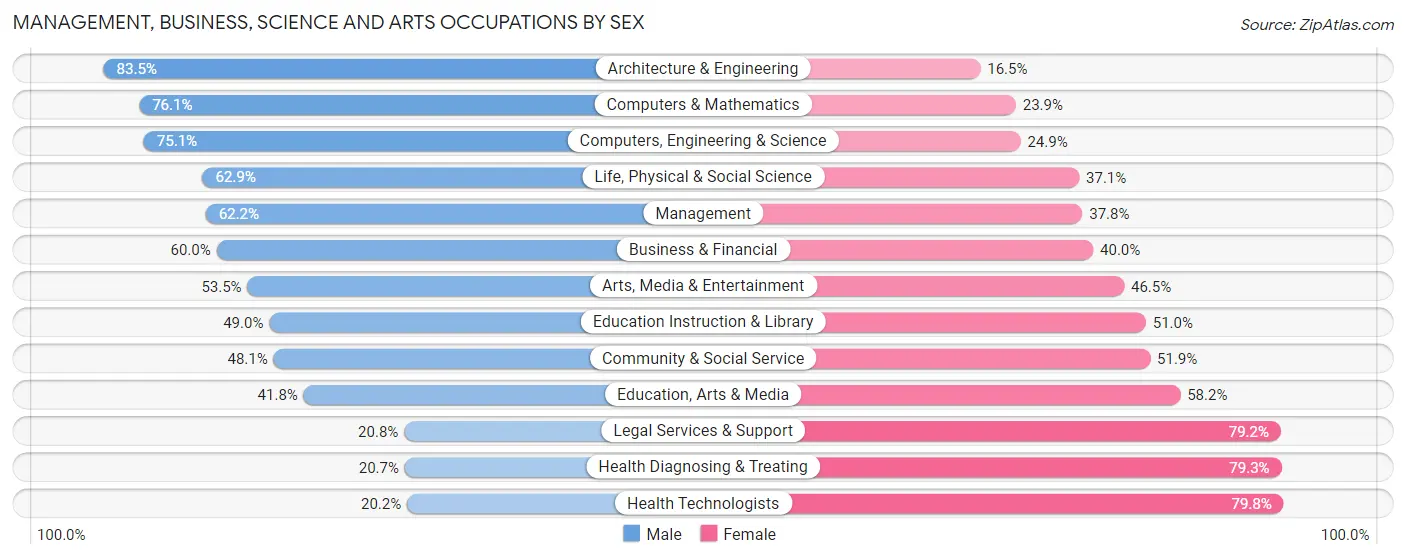
Management, Business, Science and Arts Occupations by Sex
Within the Management, Business, Science and Arts occupations in Tippecanoe County, the most male-oriented occupations are Architecture & Engineering (83.5%), Computers & Mathematics (76.1%), and Computers, Engineering & Science (75.1%), while the most female-oriented occupations are Health Technologists (79.8%), Health Diagnosing & Treating (79.3%), and Legal Services & Support (79.2%).
| Occupation | Male | Female |
| Management | 4,805 (62.2%) | 2,919 (37.8%) |
| Business & Financial | 2,350 (60.0%) | 1,569 (40.0%) |
| Computers, Engineering & Science | 5,652 (75.1%) | 1,873 (24.9%) |
| Computers & Mathematics | 1,991 (76.1%) | 626 (23.9%) |
| Architecture & Engineering | 2,328 (83.5%) | 460 (16.5%) |
| Life, Physical & Social Science | 1,333 (62.9%) | 787 (37.1%) |
| Community & Social Service | 7,046 (48.1%) | 7,613 (51.9%) |
| Education, Arts & Media | 552 (41.8%) | 769 (58.2%) |
| Legal Services & Support | 81 (20.8%) | 308 (79.2%) |
| Education Instruction & Library | 5,568 (49.0%) | 5,802 (51.0%) |
| Arts, Media & Entertainment | 845 (53.5%) | 734 (46.5%) |
| Health Diagnosing & Treating | 1,070 (20.7%) | 4,102 (79.3%) |
| Health Technologists | 675 (20.2%) | 2,664 (79.8%) |
| Total (Category) | 20,923 (53.6%) | 18,076 (46.4%) |
| Total (Overall) | 50,583 (55.1%) | 41,225 (44.9%) |
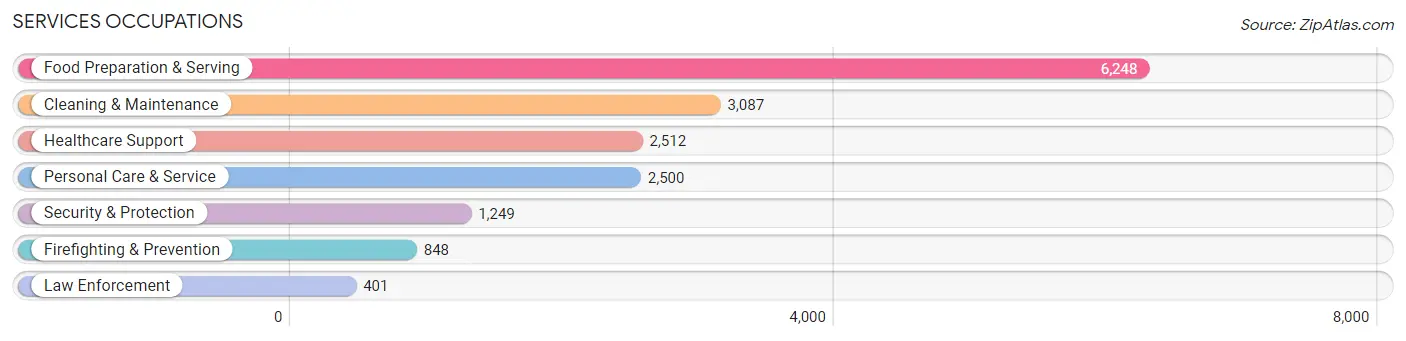
Services Occupations
The most common Services occupations in Tippecanoe County are Food Preparation & Serving (6,248 | 6.8%), Cleaning & Maintenance (3,087 | 3.4%), Healthcare Support (2,512 | 2.7%), Personal Care & Service (2,500 | 2.7%), and Security & Protection (1,249 | 1.4%).
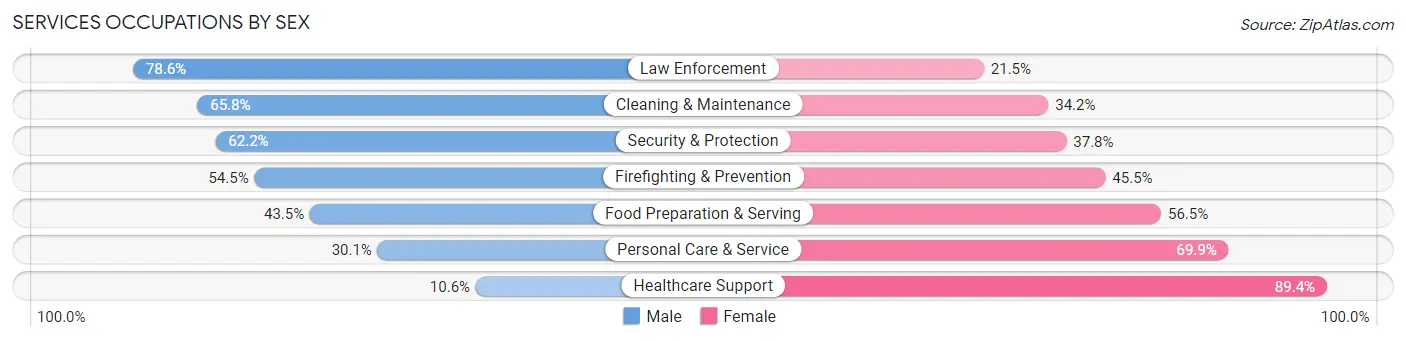
Services Occupations by Sex
Within the Services occupations in Tippecanoe County, the most male-oriented occupations are Law Enforcement (78.5%), Cleaning & Maintenance (65.8%), and Security & Protection (62.2%), while the most female-oriented occupations are Healthcare Support (89.4%), Personal Care & Service (69.9%), and Food Preparation & Serving (56.5%).
| Occupation | Male | Female |
| Healthcare Support | 267 (10.6%) | 2,245 (89.4%) |
| Security & Protection | 777 (62.2%) | 472 (37.8%) |
| Firefighting & Prevention | 462 (54.5%) | 386 (45.5%) |
| Law Enforcement | 315 (78.5%) | 86 (21.4%) |
| Food Preparation & Serving | 2,716 (43.5%) | 3,532 (56.5%) |
| Cleaning & Maintenance | 2,031 (65.8%) | 1,056 (34.2%) |
| Personal Care & Service | 752 (30.1%) | 1,748 (69.9%) |
| Total (Category) | 6,543 (41.9%) | 9,053 (58.1%) |
| Total (Overall) | 50,583 (55.1%) | 41,225 (44.9%) |
Sales and Office Occupations
The most common Sales and Office occupations in Tippecanoe County are Office & Administration (8,994 | 9.8%), and Sales & Related (6,758 | 7.4%).

Sales and Office Occupations by Sex
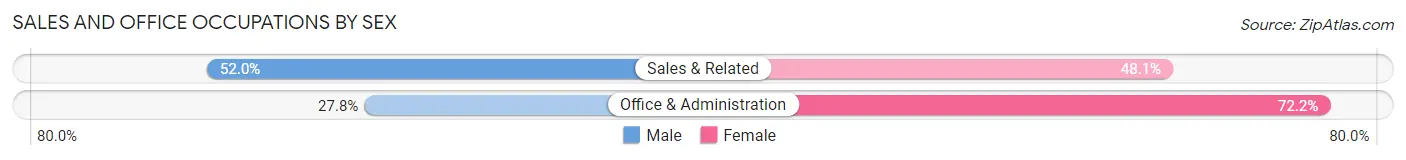
| Occupation | Male | Female |
| Sales & Related | 3,511 (51.9%) | 3,247 (48.0%) |
| Office & Administration | 2,497 (27.8%) | 6,497 (72.2%) |
| Total (Category) | 6,008 (38.1%) | 9,744 (61.9%) |
| Total (Overall) | 50,583 (55.1%) | 41,225 (44.9%) |
Natural Resources, Construction and Maintenance Occupations
The most common Natural Resources, Construction and Maintenance occupations in Tippecanoe County are Construction & Extraction (3,063 | 3.3%), Installation, Maintenance & Repair (2,396 | 2.6%), and Farming, Fishing & Forestry (232 | 0.3%).

Natural Resources, Construction and Maintenance Occupations by Sex
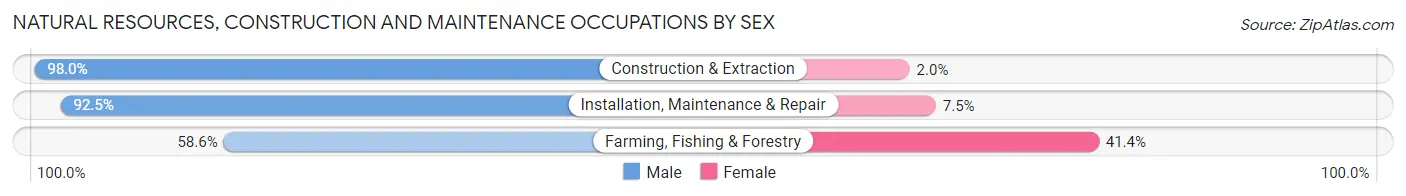
| Occupation | Male | Female |
| Farming, Fishing & Forestry | 136 (58.6%) | 96 (41.4%) |
| Construction & Extraction | 3,001 (98.0%) | 62 (2.0%) |
| Installation, Maintenance & Repair | 2,217 (92.5%) | 179 (7.5%) |
| Total (Category) | 5,354 (94.1%) | 337 (5.9%) |
| Total (Overall) | 50,583 (55.1%) | 41,225 (44.9%) |
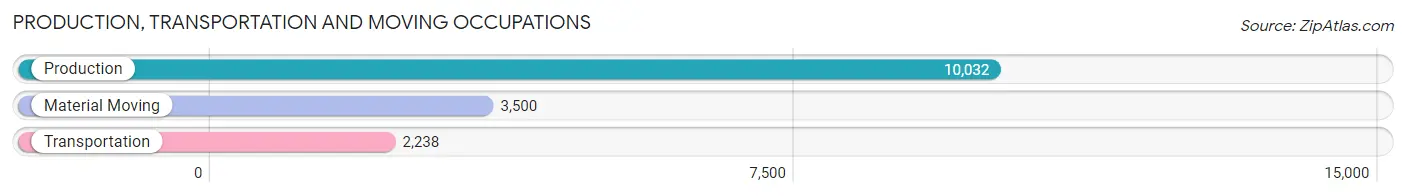
Production, Transportation and Moving Occupations
The most common Production, Transportation and Moving occupations in Tippecanoe County are Production (10,032 | 10.9%), Material Moving (3,500 | 3.8%), and Transportation (2,238 | 2.4%).
Production, Transportation and Moving Occupations by Sex
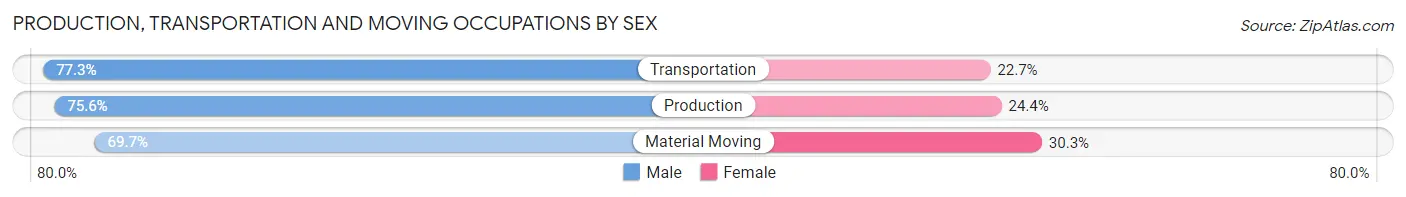
| Occupation | Male | Female |
| Production | 7,586 (75.6%) | 2,446 (24.4%) |
| Transportation | 1,729 (77.3%) | 509 (22.7%) |
| Material Moving | 2,440 (69.7%) | 1,060 (30.3%) |
| Total (Category) | 11,755 (74.5%) | 4,015 (25.5%) |
| Total (Overall) | 50,583 (55.1%) | 41,225 (44.9%) |
Employment Industries by Sex in Tippecanoe County
Employment Industries in Tippecanoe County
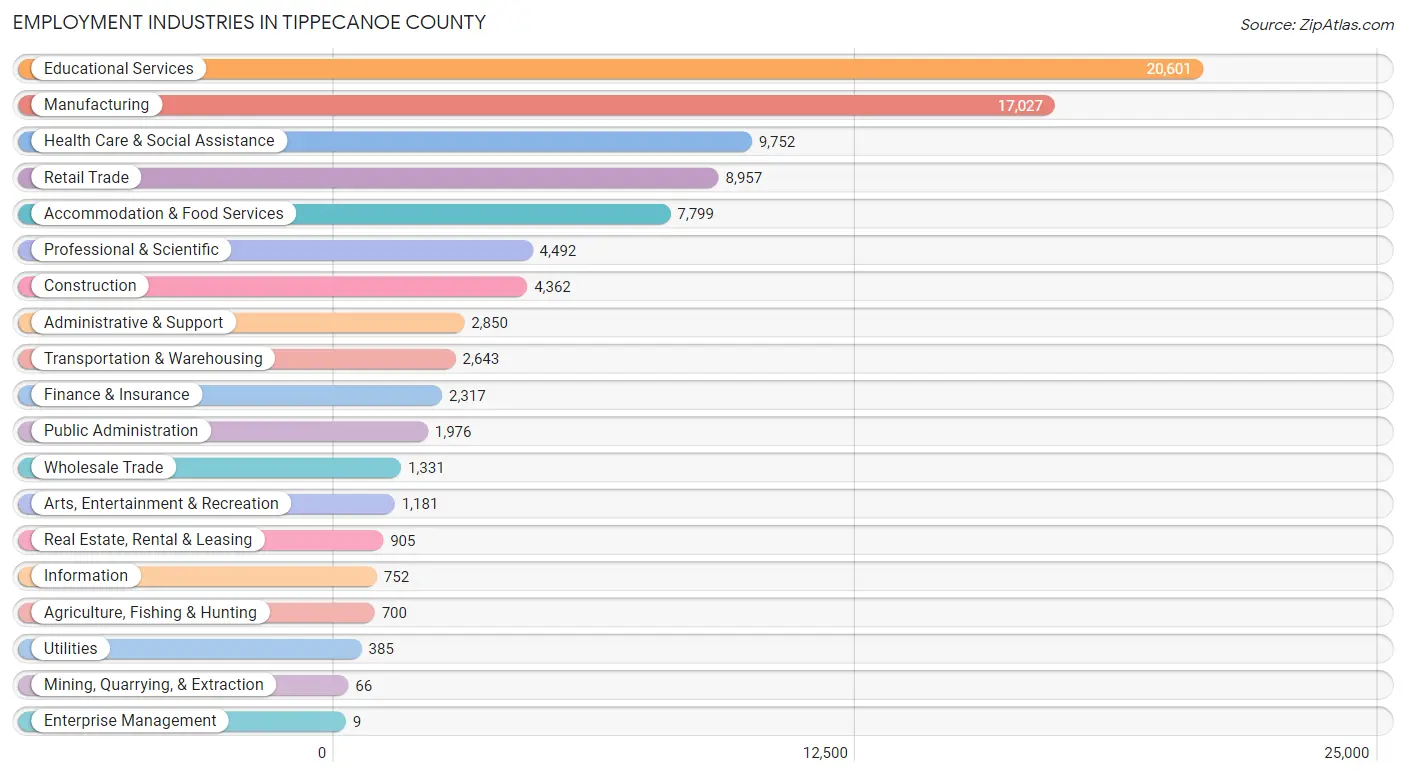
The major employment industries in Tippecanoe County include Educational Services (20,601 | 22.4%), Manufacturing (17,027 | 18.5%), Health Care & Social Assistance (9,752 | 10.6%), Retail Trade (8,957 | 9.8%), and Accommodation & Food Services (7,799 | 8.5%).
Employment Industries by Sex in Tippecanoe County
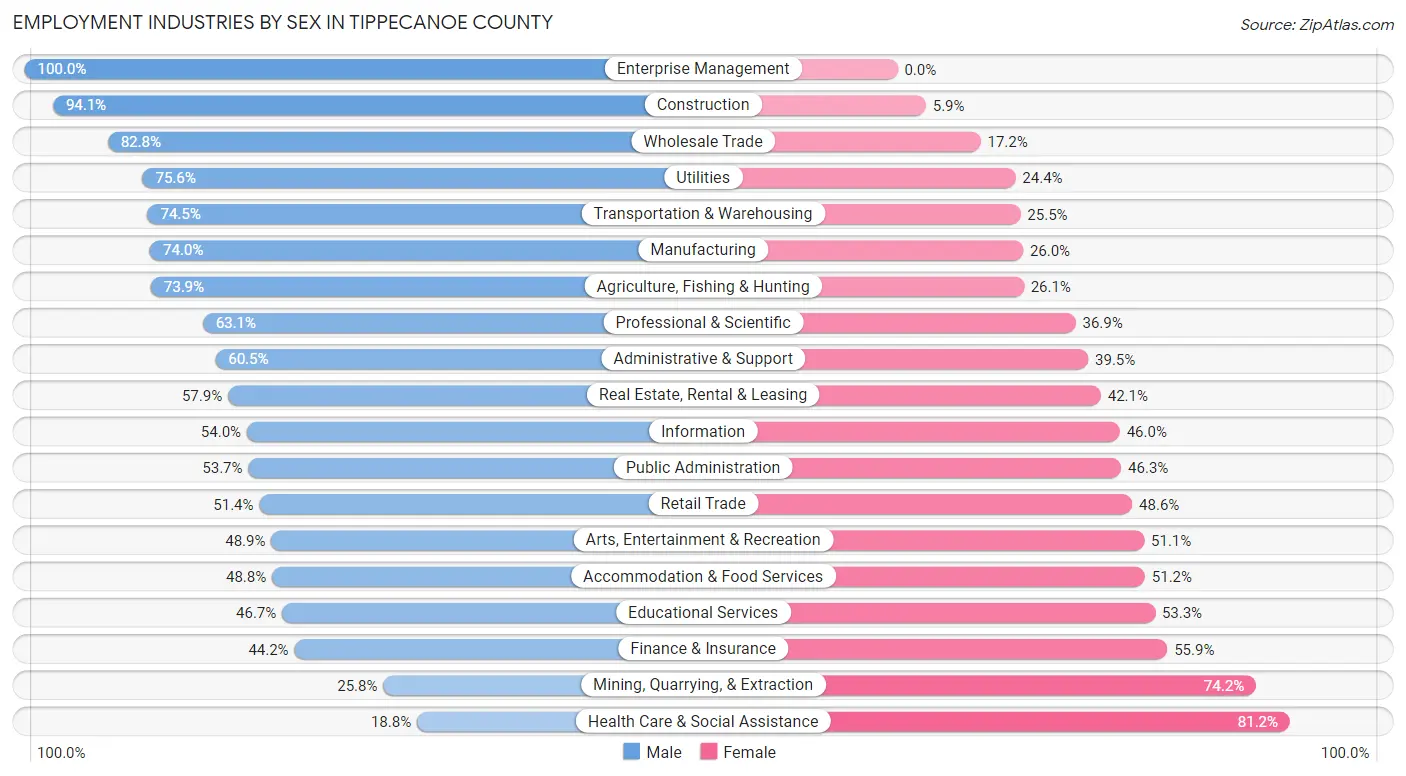
The Tippecanoe County industries that see more men than women are Enterprise Management (100.0%), Construction (94.1%), and Wholesale Trade (82.8%), whereas the industries that tend to have a higher number of women are Health Care & Social Assistance (81.2%), Mining, Quarrying, & Extraction (74.2%), and Finance & Insurance (55.8%).
| Industry | Male | Female |
| Agriculture, Fishing & Hunting | 517 (73.9%) | 183 (26.1%) |
| Mining, Quarrying, & Extraction | 17 (25.8%) | 49 (74.2%) |
| Construction | 4,106 (94.1%) | 256 (5.9%) |
| Manufacturing | 12,603 (74.0%) | 4,424 (26.0%) |
| Wholesale Trade | 1,102 (82.8%) | 229 (17.2%) |
| Retail Trade | 4,605 (51.4%) | 4,352 (48.6%) |
| Transportation & Warehousing | 1,970 (74.5%) | 673 (25.5%) |
| Utilities | 291 (75.6%) | 94 (24.4%) |
| Information | 406 (54.0%) | 346 (46.0%) |
| Finance & Insurance | 1,023 (44.2%) | 1,294 (55.8%) |
| Real Estate, Rental & Leasing | 524 (57.9%) | 381 (42.1%) |
| Professional & Scientific | 2,836 (63.1%) | 1,656 (36.9%) |
| Enterprise Management | 9 (100.0%) | 0 (0.0%) |
| Administrative & Support | 1,725 (60.5%) | 1,125 (39.5%) |
| Educational Services | 9,620 (46.7%) | 10,981 (53.3%) |
| Health Care & Social Assistance | 1,831 (18.8%) | 7,921 (81.2%) |
| Arts, Entertainment & Recreation | 578 (48.9%) | 603 (51.1%) |
| Accommodation & Food Services | 3,804 (48.8%) | 3,995 (51.2%) |
| Public Administration | 1,061 (53.7%) | 915 (46.3%) |
| Total | 50,583 (55.1%) | 41,225 (44.9%) |
Education in Tippecanoe County
School Enrollment in Tippecanoe County
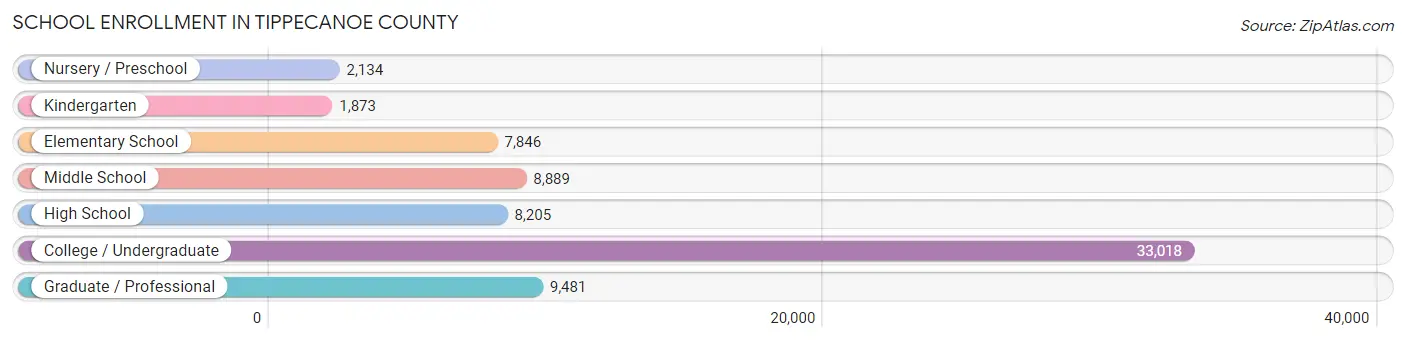
The most common levels of schooling among the 71,446 students in Tippecanoe County are college / undergraduate (33,018 | 46.2%), graduate / professional (9,481 | 13.3%), and middle school (8,889 | 12.4%).
| School Level | # Students | % Students |
| Nursery / Preschool | 2,134 | 3.0% |
| Kindergarten | 1,873 | 2.6% |
| Elementary School | 7,846 | 11.0% |
| Middle School | 8,889 | 12.4% |
| High School | 8,205 | 11.5% |
| College / Undergraduate | 33,018 | 46.2% |
| Graduate / Professional | 9,481 | 13.3% |
| Total | 71,446 | 100.0% |
School Enrollment by Age by Funding Source in Tippecanoe County
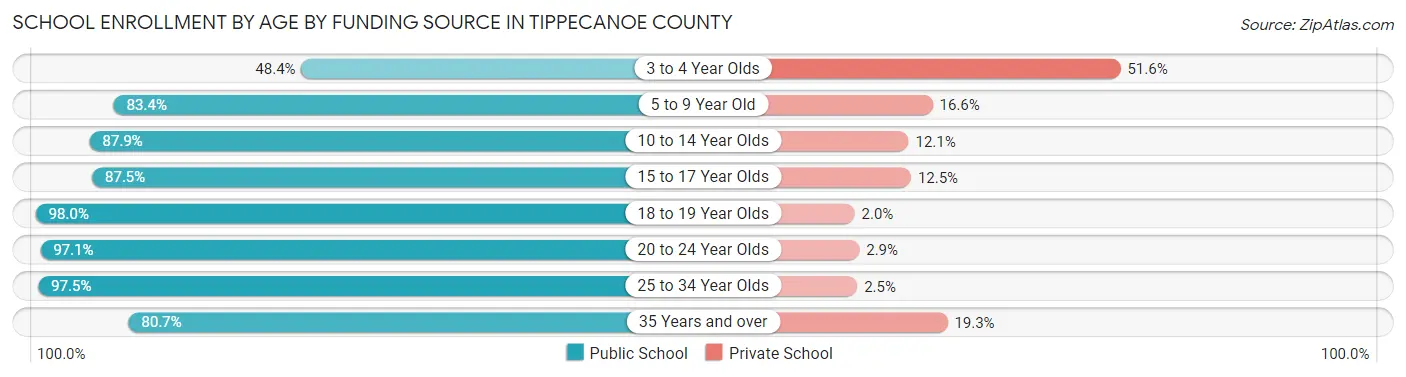
Out of a total of 71,446 students who are enrolled in schools in Tippecanoe County, 6,001 (8.4%) attend a private institution, while the remaining 65,445 (91.6%) are enrolled in public schools. The age group of 3 to 4 year olds has the highest likelihood of being enrolled in private schools, with 845 (51.6% in the age bracket) enrolled. Conversely, the age group of 18 to 19 year olds has the lowest likelihood of being enrolled in a private school, with 12,144 (98.0% in the age bracket) attending a public institution.
| Age Bracket | Public School | Private School |
| 3 to 4 Year Olds | 794 (48.4%) | 845 (51.6%) |
| 5 to 9 Year Old | 7,640 (83.4%) | 1,516 (16.6%) |
| 10 to 14 Year Olds | 9,634 (87.9%) | 1,324 (12.1%) |
| 15 to 17 Year Olds | 5,488 (87.5%) | 786 (12.5%) |
| 18 to 19 Year Olds | 12,144 (98.0%) | 251 (2.0%) |
| 20 to 24 Year Olds | 21,480 (97.1%) | 644 (2.9%) |
| 25 to 34 Year Olds | 6,306 (97.5%) | 163 (2.5%) |
| 35 Years and over | 1,961 (80.7%) | 470 (19.3%) |
| Total | 65,445 (91.6%) | 6,001 (8.4%) |
Educational Attainment by Field of Study in Tippecanoe County
Business (5,837 | 13.3%), science & technology (5,452 | 12.4%), engineering (5,355 | 12.2%), education (5,262 | 12.0%), and bio, nature & agricultural (4,537 | 10.3%) are the most common fields of study among 43,816 individuals in Tippecanoe County who have obtained a bachelor's degree or higher.
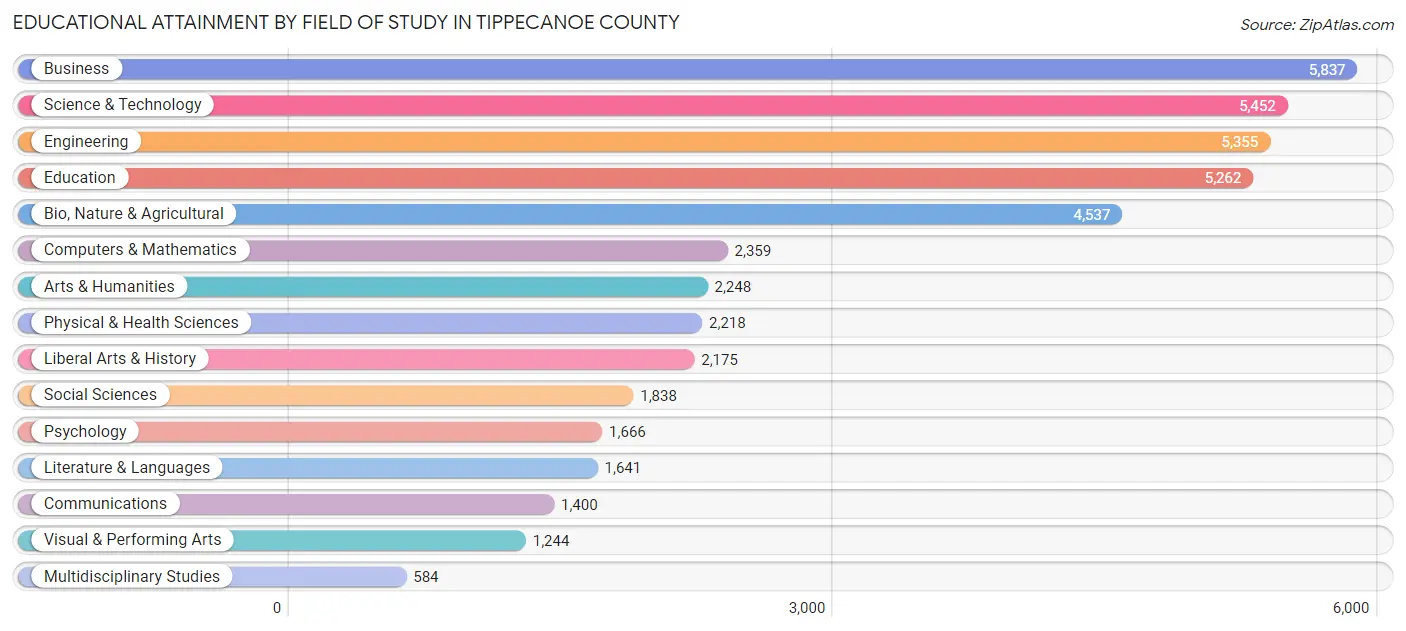
| Field of Study | # Graduates | % Graduates |
| Computers & Mathematics | 2,359 | 5.4% |
| Bio, Nature & Agricultural | 4,537 | 10.3% |
| Physical & Health Sciences | 2,218 | 5.1% |
| Psychology | 1,666 | 3.8% |
| Social Sciences | 1,838 | 4.2% |
| Engineering | 5,355 | 12.2% |
| Multidisciplinary Studies | 584 | 1.3% |
| Science & Technology | 5,452 | 12.4% |
| Business | 5,837 | 13.3% |
| Education | 5,262 | 12.0% |
| Literature & Languages | 1,641 | 3.7% |
| Liberal Arts & History | 2,175 | 5.0% |
| Visual & Performing Arts | 1,244 | 2.8% |
| Communications | 1,400 | 3.2% |
| Arts & Humanities | 2,248 | 5.1% |
| Total | 43,816 | 100.0% |
Transportation & Commute in Tippecanoe County
Vehicle Availability by Sex in Tippecanoe County
The most prevalent vehicle ownership categories in Tippecanoe County are males with 2 vehicles (21,021, accounting for 44.4%) and females with 2 vehicles (15,535, making up 55.7%).
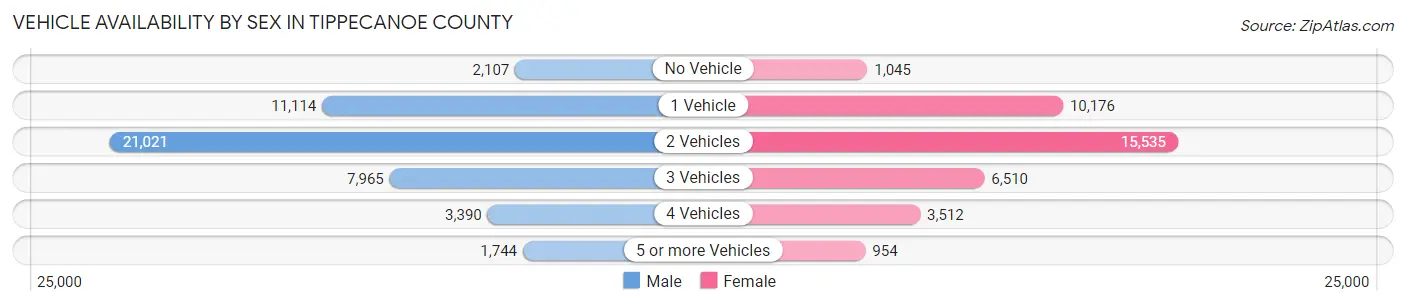
| Vehicles Available | Male | Female |
| No Vehicle | 2,107 (4.4%) | 1,045 (2.8%) |
| 1 Vehicle | 11,114 (23.5%) | 10,176 (27.0%) |
| 2 Vehicles | 21,021 (44.4%) | 15,535 (41.2%) |
| 3 Vehicles | 7,965 (16.8%) | 6,510 (17.2%) |
| 4 Vehicles | 3,390 (7.2%) | 3,512 (9.3%) |
| 5 or more Vehicles | 1,744 (3.7%) | 954 (2.5%) |
| Total | 47,341 (100.0%) | 37,732 (100.0%) |
Commute Time in Tippecanoe County
The most frequently occuring commute durations in Tippecanoe County are 15 to 19 minutes (21,677 commuters, 26.6%), 10 to 14 minutes (20,662 commuters, 25.4%), and 5 to 9 minutes (11,470 commuters, 14.1%).
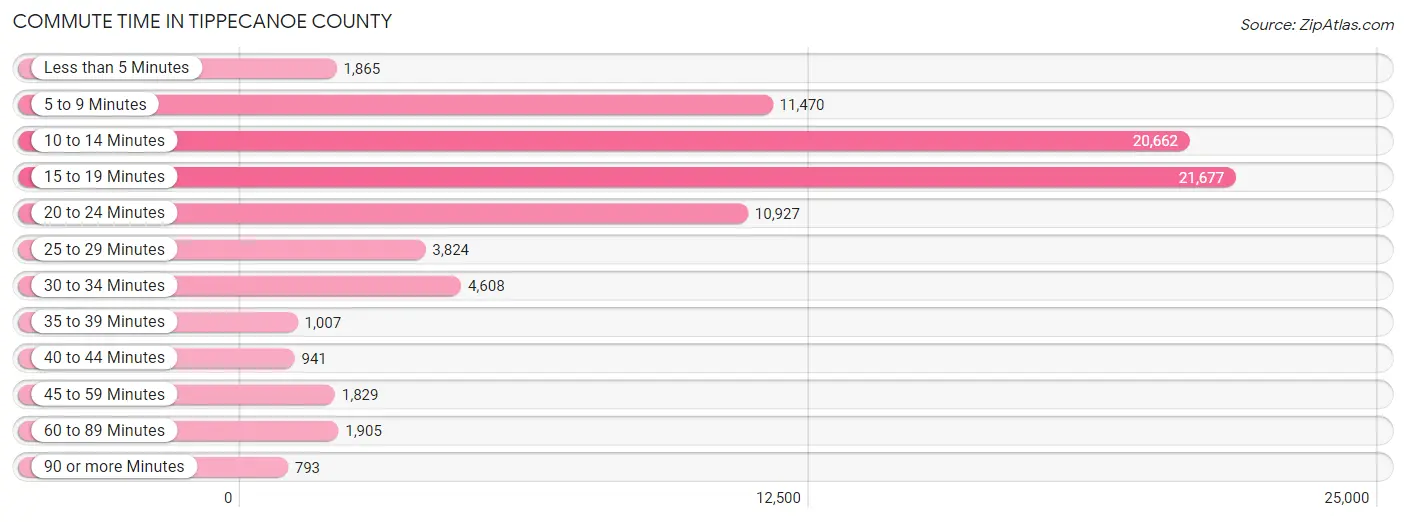
| Commute Time | # Commuters | % Commuters |
| Less than 5 Minutes | 1,865 | 2.3% |
| 5 to 9 Minutes | 11,470 | 14.1% |
| 10 to 14 Minutes | 20,662 | 25.4% |
| 15 to 19 Minutes | 21,677 | 26.6% |
| 20 to 24 Minutes | 10,927 | 13.4% |
| 25 to 29 Minutes | 3,824 | 4.7% |
| 30 to 34 Minutes | 4,608 | 5.7% |
| 35 to 39 Minutes | 1,007 | 1.2% |
| 40 to 44 Minutes | 941 | 1.1% |
| 45 to 59 Minutes | 1,829 | 2.2% |
| 60 to 89 Minutes | 1,905 | 2.3% |
| 90 or more Minutes | 793 | 1.0% |
Commute Time by Sex in Tippecanoe County
The most common commute times in Tippecanoe County are 10 to 14 minutes (11,905 commuters, 26.1%) for males and 15 to 19 minutes (9,796 commuters, 27.3%) for females.
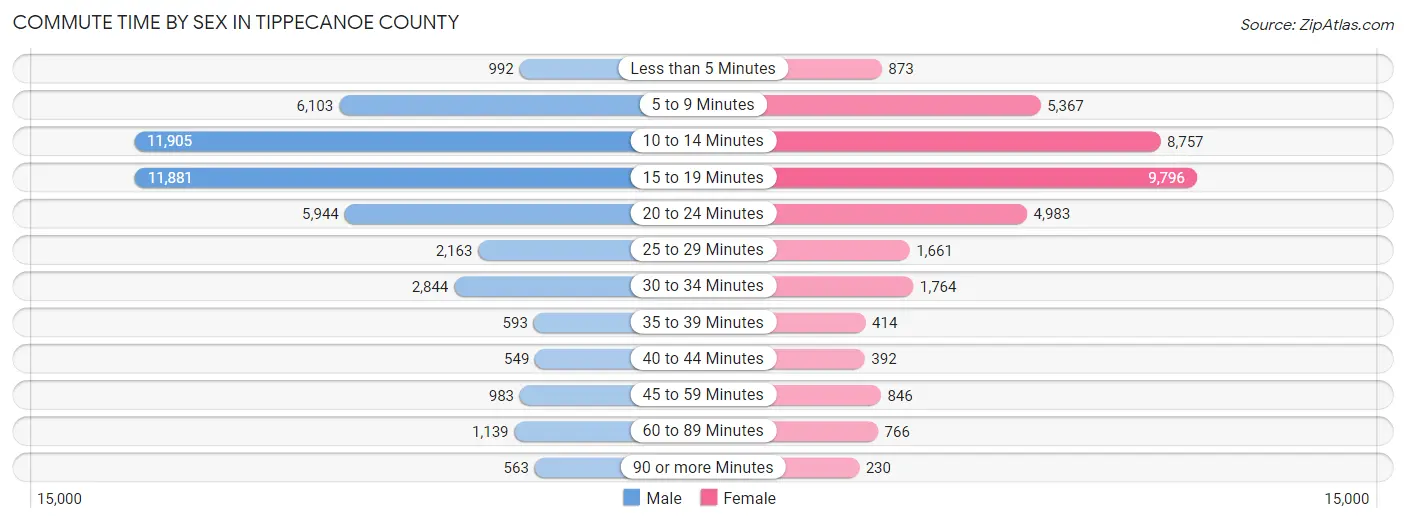
| Commute Time | Male | Female |
| Less than 5 Minutes | 992 (2.2%) | 873 (2.4%) |
| 5 to 9 Minutes | 6,103 (13.4%) | 5,367 (15.0%) |
| 10 to 14 Minutes | 11,905 (26.1%) | 8,757 (24.4%) |
| 15 to 19 Minutes | 11,881 (26.0%) | 9,796 (27.3%) |
| 20 to 24 Minutes | 5,944 (13.0%) | 4,983 (13.9%) |
| 25 to 29 Minutes | 2,163 (4.7%) | 1,661 (4.6%) |
| 30 to 34 Minutes | 2,844 (6.2%) | 1,764 (4.9%) |
| 35 to 39 Minutes | 593 (1.3%) | 414 (1.1%) |
| 40 to 44 Minutes | 549 (1.2%) | 392 (1.1%) |
| 45 to 59 Minutes | 983 (2.1%) | 846 (2.4%) |
| 60 to 89 Minutes | 1,139 (2.5%) | 766 (2.1%) |
| 90 or more Minutes | 563 (1.2%) | 230 (0.6%) |
Time of Departure to Work by Sex in Tippecanoe County
The most frequent times of departure to work in Tippecanoe County are 12:00 PM to 3:59 PM (5,316, 11.6%) for males and 7:30 AM to 7:59 AM (6,135, 17.1%) for females.
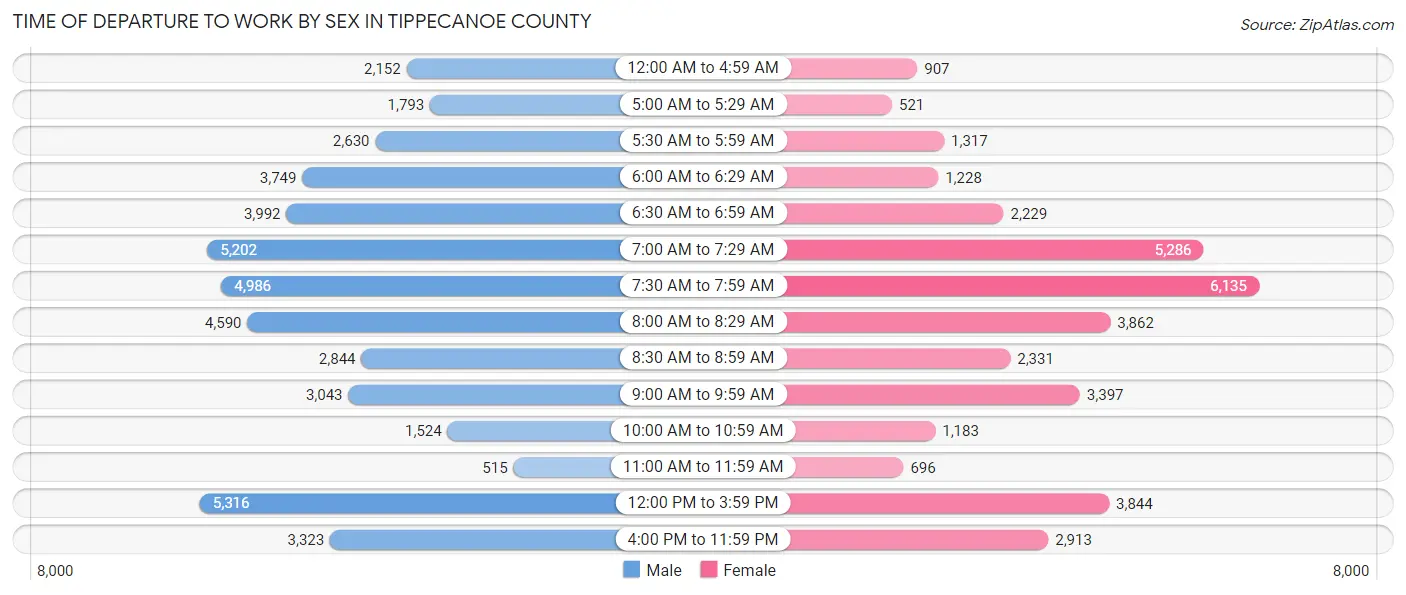
| Time of Departure | Male | Female |
| 12:00 AM to 4:59 AM | 2,152 (4.7%) | 907 (2.5%) |
| 5:00 AM to 5:29 AM | 1,793 (3.9%) | 521 (1.5%) |
| 5:30 AM to 5:59 AM | 2,630 (5.8%) | 1,317 (3.7%) |
| 6:00 AM to 6:29 AM | 3,749 (8.2%) | 1,228 (3.4%) |
| 6:30 AM to 6:59 AM | 3,992 (8.7%) | 2,229 (6.2%) |
| 7:00 AM to 7:29 AM | 5,202 (11.4%) | 5,286 (14.7%) |
| 7:30 AM to 7:59 AM | 4,986 (10.9%) | 6,135 (17.1%) |
| 8:00 AM to 8:29 AM | 4,590 (10.1%) | 3,862 (10.8%) |
| 8:30 AM to 8:59 AM | 2,844 (6.2%) | 2,331 (6.5%) |
| 9:00 AM to 9:59 AM | 3,043 (6.7%) | 3,397 (9.5%) |
| 10:00 AM to 10:59 AM | 1,524 (3.3%) | 1,183 (3.3%) |
| 11:00 AM to 11:59 AM | 515 (1.1%) | 696 (1.9%) |
| 12:00 PM to 3:59 PM | 5,316 (11.6%) | 3,844 (10.7%) |
| 4:00 PM to 11:59 PM | 3,323 (7.3%) | 2,913 (8.1%) |
| Total | 45,659 (100.0%) | 35,849 (100.0%) |
Housing Occupancy in Tippecanoe County
Occupancy by Ownership in Tippecanoe County
Of the total 73,327 dwellings in Tippecanoe County, owner-occupied units account for 38,817 (52.9%), while renter-occupied units make up 34,510 (47.1%).
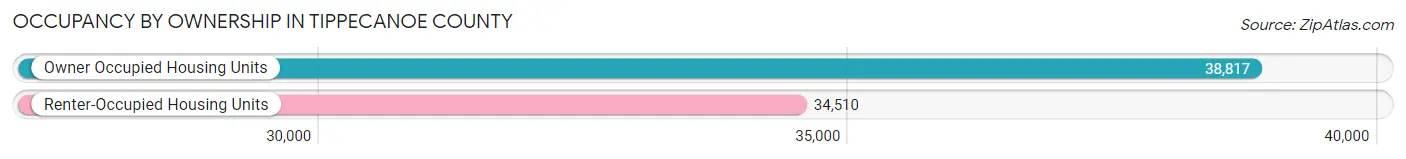
| Occupancy | # Housing Units | % Housing Units |
| Owner Occupied Housing Units | 38,817 | 52.9% |
| Renter-Occupied Housing Units | 34,510 | 47.1% |
| Total Occupied Housing Units | 73,327 | 100.0% |
Occupancy by Household Size in Tippecanoe County
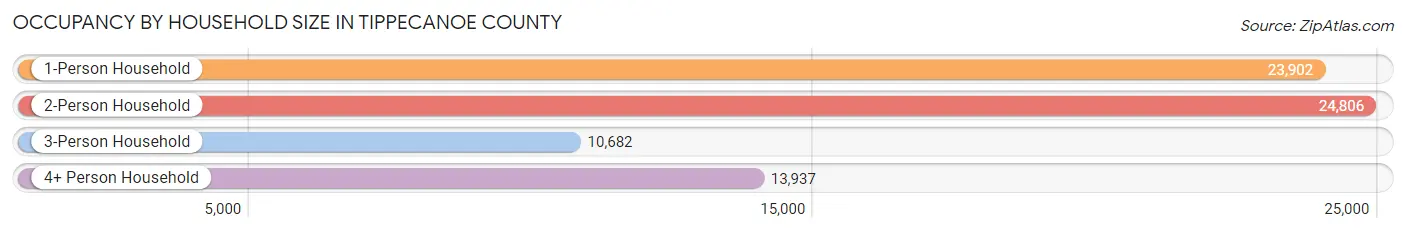
| Household Size | # Housing Units | % Housing Units |
| 1-Person Household | 23,902 | 32.6% |
| 2-Person Household | 24,806 | 33.8% |
| 3-Person Household | 10,682 | 14.6% |
| 4+ Person Household | 13,937 | 19.0% |
| Total Housing Units | 73,327 | 100.0% |
Occupancy by Ownership by Household Size in Tippecanoe County
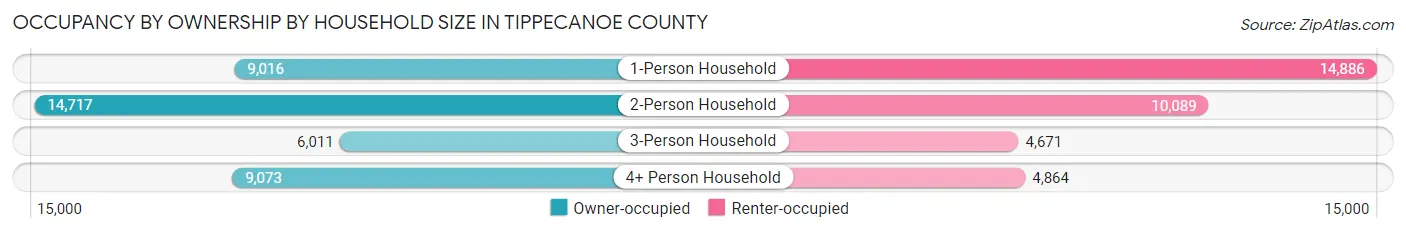
| Household Size | Owner-occupied | Renter-occupied |
| 1-Person Household | 9,016 (37.7%) | 14,886 (62.3%) |
| 2-Person Household | 14,717 (59.3%) | 10,089 (40.7%) |
| 3-Person Household | 6,011 (56.3%) | 4,671 (43.7%) |
| 4+ Person Household | 9,073 (65.1%) | 4,864 (34.9%) |
| Total Housing Units | 38,817 (52.9%) | 34,510 (47.1%) |
Occupancy by Educational Attainment in Tippecanoe County
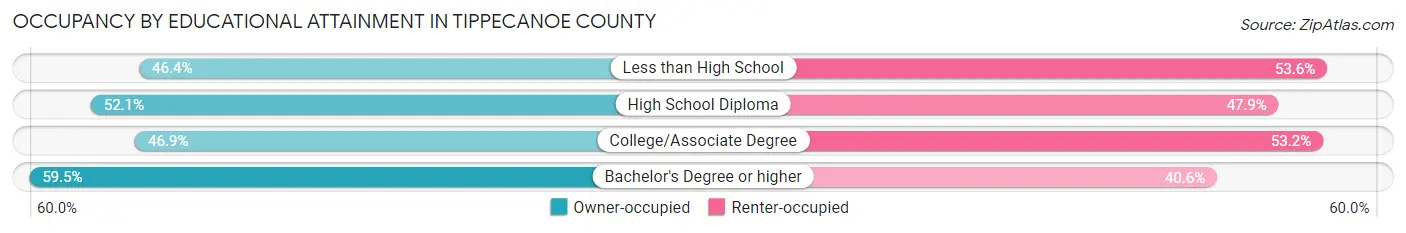
| Household Size | Owner-occupied | Renter-occupied |
| Less than High School | 1,819 (46.4%) | 2,104 (53.6%) |
| High School Diploma | 9,740 (52.1%) | 8,949 (47.9%) |
| College/Associate Degree | 10,757 (46.9%) | 12,203 (53.1%) |
| Bachelor's Degree or higher | 16,501 (59.5%) | 11,254 (40.6%) |
Occupancy by Age of Householder in Tippecanoe County
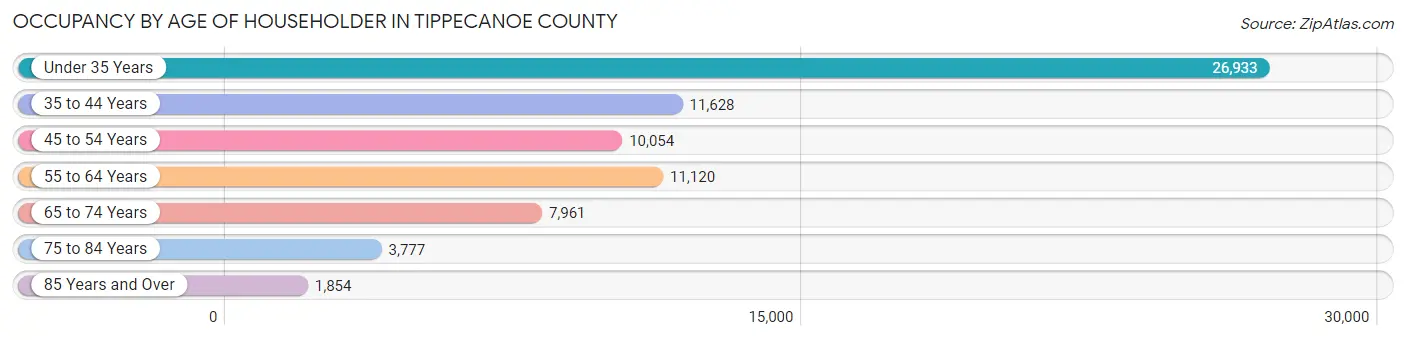
| Age Bracket | # Households | % Households |
| Under 35 Years | 26,933 | 36.7% |
| 35 to 44 Years | 11,628 | 15.9% |
| 45 to 54 Years | 10,054 | 13.7% |
| 55 to 64 Years | 11,120 | 15.2% |
| 65 to 74 Years | 7,961 | 10.9% |
| 75 to 84 Years | 3,777 | 5.1% |
| 85 Years and Over | 1,854 | 2.5% |
| Total | 73,327 | 100.0% |
Housing Finances in Tippecanoe County
Median Income by Occupancy in Tippecanoe County
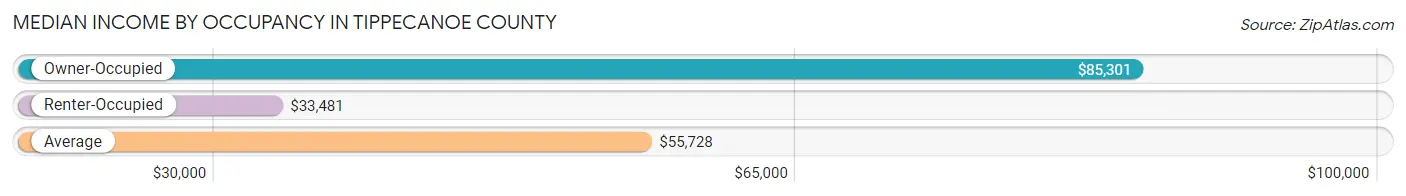
| Occupancy Type | # Households | Median Income |
| Owner-Occupied | 38,817 (52.9%) | $85,301 |
| Renter-Occupied | 34,510 (47.1%) | $33,481 |
| Average | 73,327 (100.0%) | $55,728 |
Occupancy by Householder Income Bracket in Tippecanoe County
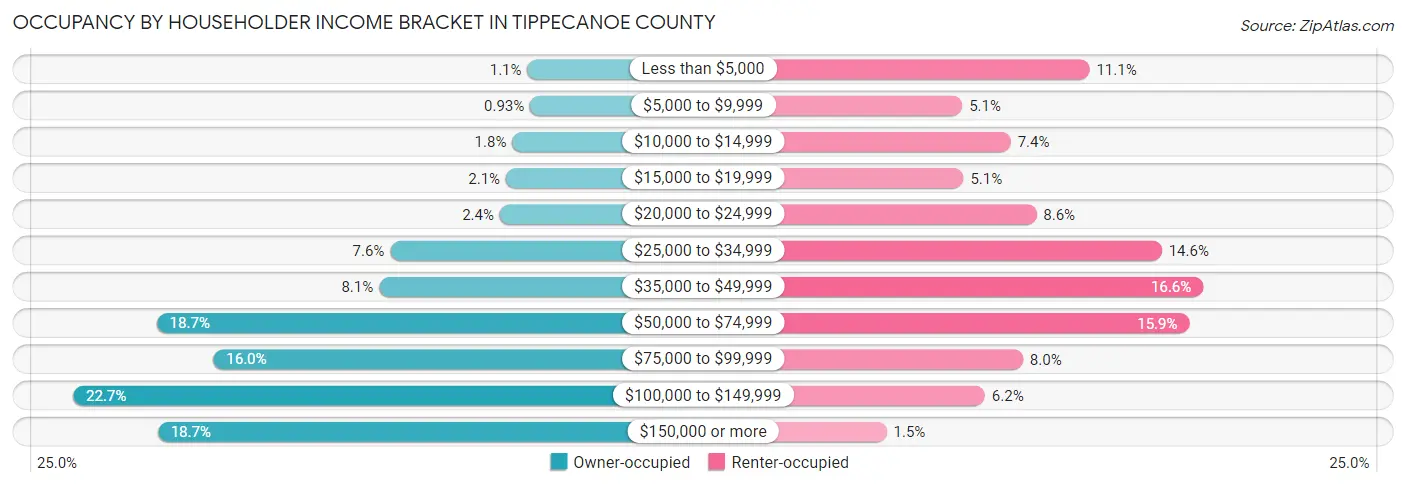
| Income Bracket | Owner-occupied | Renter-occupied |
| Less than $5,000 | 412 (1.1%) | 3,845 (11.1%) |
| $5,000 to $9,999 | 360 (0.9%) | 1,753 (5.1%) |
| $10,000 to $14,999 | 691 (1.8%) | 2,551 (7.4%) |
| $15,000 to $19,999 | 806 (2.1%) | 1,775 (5.1%) |
| $20,000 to $24,999 | 921 (2.4%) | 2,973 (8.6%) |
| $25,000 to $34,999 | 2,948 (7.6%) | 5,033 (14.6%) |
| $35,000 to $49,999 | 3,151 (8.1%) | 5,711 (16.6%) |
| $50,000 to $74,999 | 7,261 (18.7%) | 5,483 (15.9%) |
| $75,000 to $99,999 | 6,215 (16.0%) | 2,751 (8.0%) |
| $100,000 to $149,999 | 8,807 (22.7%) | 2,125 (6.2%) |
| $150,000 or more | 7,245 (18.7%) | 510 (1.5%) |
| Total | 38,817 (100.0%) | 34,510 (100.0%) |
Monthly Housing Cost Tiers in Tippecanoe County
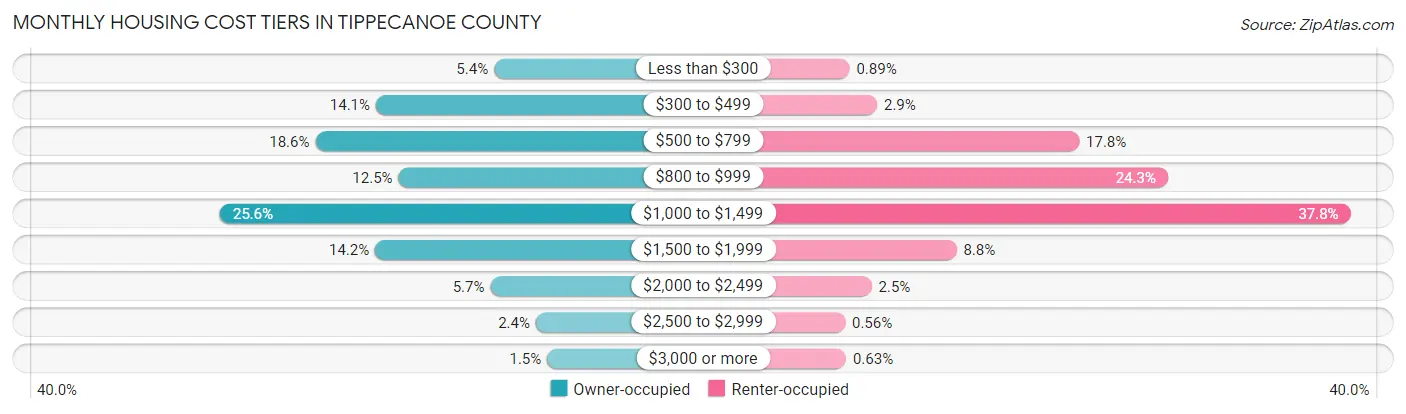
| Monthly Cost | Owner-occupied | Renter-occupied |
| Less than $300 | 2,107 (5.4%) | 307 (0.9%) |
| $300 to $499 | 5,483 (14.1%) | 1,009 (2.9%) |
| $500 to $799 | 7,216 (18.6%) | 6,142 (17.8%) |
| $800 to $999 | 4,841 (12.5%) | 8,395 (24.3%) |
| $1,000 to $1,499 | 9,946 (25.6%) | 13,039 (37.8%) |
| $1,500 to $1,999 | 5,507 (14.2%) | 3,026 (8.8%) |
| $2,000 to $2,499 | 2,213 (5.7%) | 869 (2.5%) |
| $2,500 to $2,999 | 914 (2.4%) | 193 (0.6%) |
| $3,000 or more | 590 (1.5%) | 218 (0.6%) |
| Total | 38,817 (100.0%) | 34,510 (100.0%) |
Physical Housing Characteristics in Tippecanoe County
Housing Structures in Tippecanoe County
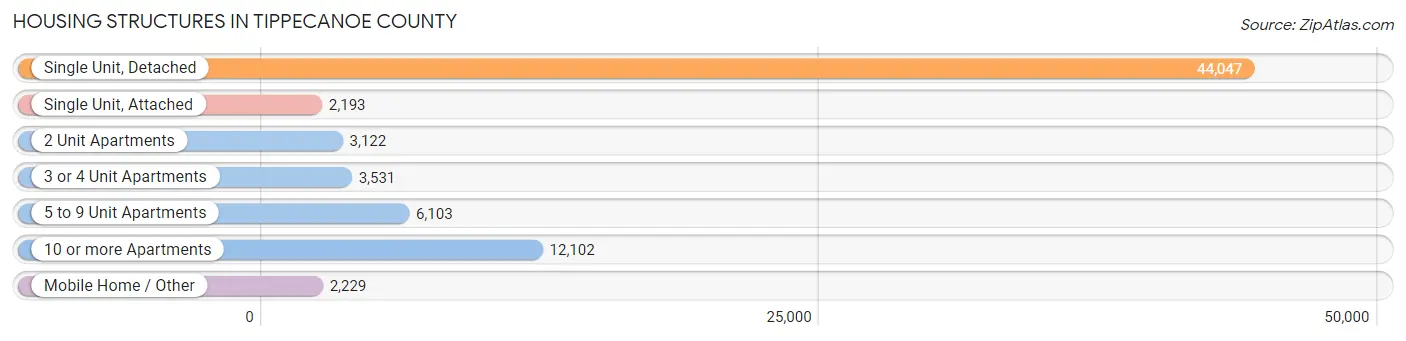
| Structure Type | # Housing Units | % Housing Units |
| Single Unit, Detached | 44,047 | 60.1% |
| Single Unit, Attached | 2,193 | 3.0% |
| 2 Unit Apartments | 3,122 | 4.3% |
| 3 or 4 Unit Apartments | 3,531 | 4.8% |
| 5 to 9 Unit Apartments | 6,103 | 8.3% |
| 10 or more Apartments | 12,102 | 16.5% |
| Mobile Home / Other | 2,229 | 3.0% |
| Total | 73,327 | 100.0% |
Housing Structures by Occupancy in Tippecanoe County
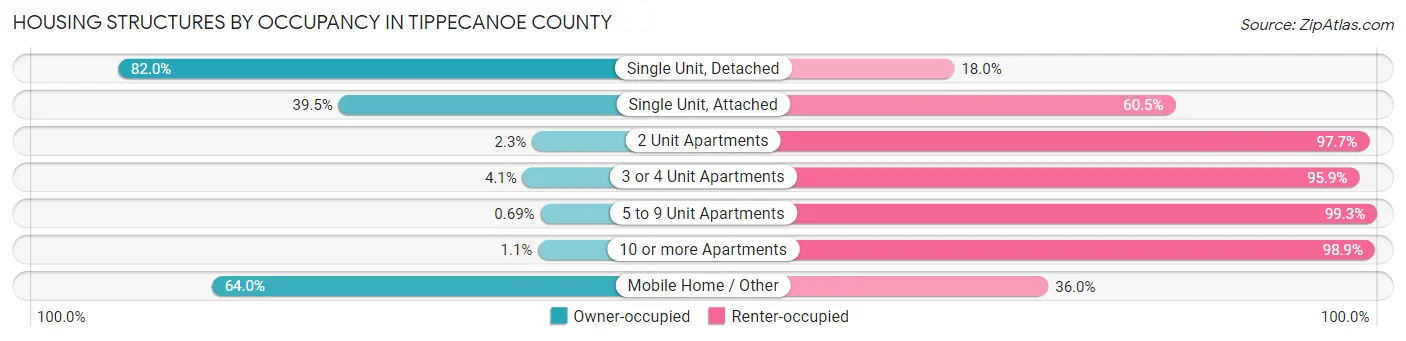
| Structure Type | Owner-occupied | Renter-occupied |
| Single Unit, Detached | 36,132 (82.0%) | 7,915 (18.0%) |
| Single Unit, Attached | 867 (39.5%) | 1,326 (60.5%) |
| 2 Unit Apartments | 71 (2.3%) | 3,051 (97.7%) |
| 3 or 4 Unit Apartments | 145 (4.1%) | 3,386 (95.9%) |
| 5 to 9 Unit Apartments | 42 (0.7%) | 6,061 (99.3%) |
| 10 or more Apartments | 134 (1.1%) | 11,968 (98.9%) |
| Mobile Home / Other | 1,426 (64.0%) | 803 (36.0%) |
| Total | 38,817 (52.9%) | 34,510 (47.1%) |
Housing Structures by Number of Rooms in Tippecanoe County
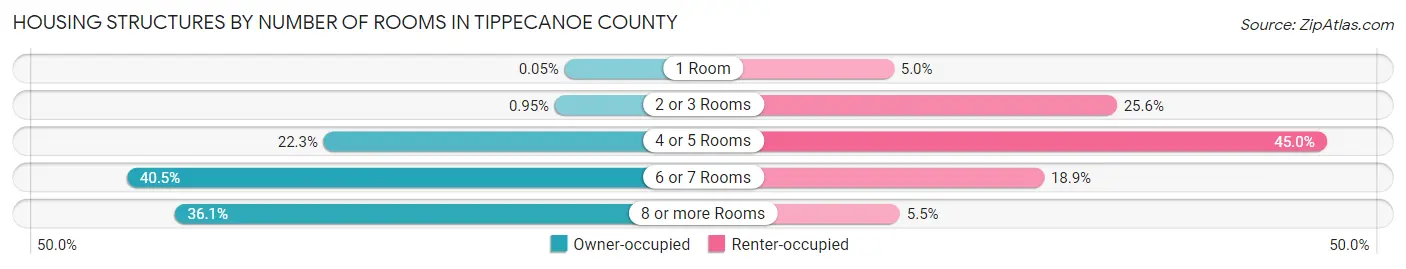
| Number of Rooms | Owner-occupied | Renter-occupied |
| 1 Room | 21 (0.1%) | 1,720 (5.0%) |
| 2 or 3 Rooms | 370 (0.9%) | 8,834 (25.6%) |
| 4 or 5 Rooms | 8,667 (22.3%) | 15,531 (45.0%) |
| 6 or 7 Rooms | 15,737 (40.5%) | 6,513 (18.9%) |
| 8 or more Rooms | 14,022 (36.1%) | 1,912 (5.5%) |
| Total | 38,817 (100.0%) | 34,510 (100.0%) |
Housing Structure by Heating Type in Tippecanoe County
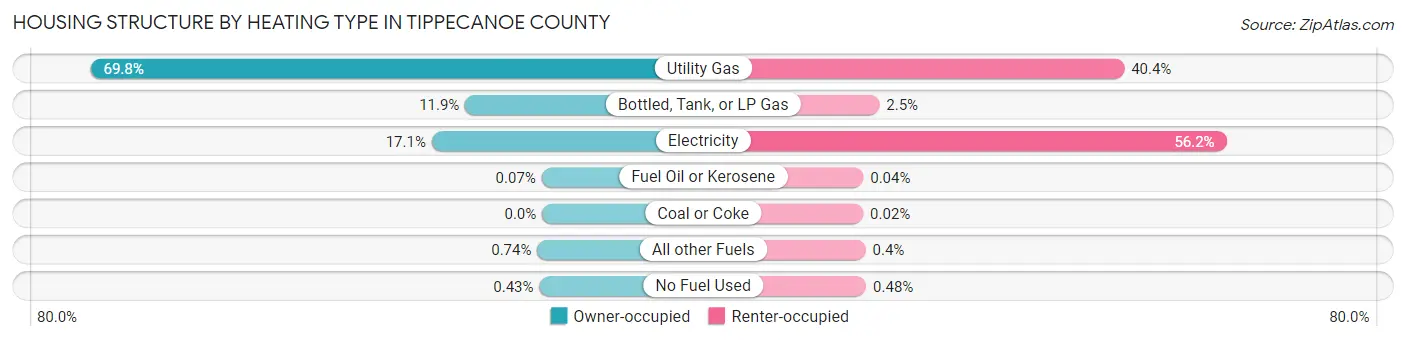
| Heating Type | Owner-occupied | Renter-occupied |
| Utility Gas | 27,095 (69.8%) | 13,930 (40.4%) |
| Bottled, Tank, or LP Gas | 4,617 (11.9%) | 871 (2.5%) |
| Electricity | 6,623 (17.1%) | 19,384 (56.2%) |
| Fuel Oil or Kerosene | 28 (0.1%) | 14 (0.0%) |
| Coal or Coke | 0 (0.0%) | 7 (0.0%) |
| All other Fuels | 286 (0.7%) | 138 (0.4%) |
| No Fuel Used | 168 (0.4%) | 166 (0.5%) |
| Total | 38,817 (100.0%) | 34,510 (100.0%) |
Household Vehicle Usage in Tippecanoe County
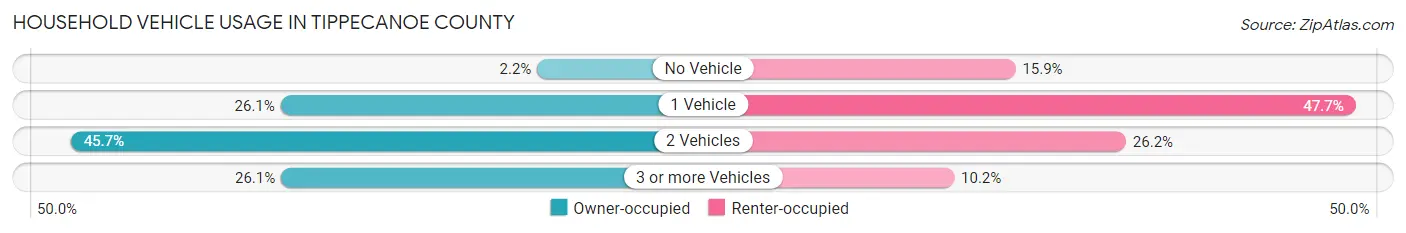
| Vehicles per Household | Owner-occupied | Renter-occupied |
| No Vehicle | 836 (2.1%) | 5,493 (15.9%) |
| 1 Vehicle | 10,132 (26.1%) | 16,449 (47.7%) |
| 2 Vehicles | 17,734 (45.7%) | 9,052 (26.2%) |
| 3 or more Vehicles | 10,115 (26.1%) | 3,516 (10.2%) |
| Total | 38,817 (100.0%) | 34,510 (100.0%) |
Real Estate & Mortgages in Tippecanoe County
Real Estate and Mortgage Overview in Tippecanoe County
| Characteristic | Without Mortgage | With Mortgage |
| Housing Units | 12,791 | 26,026 |
| Median Property Value | $187,300 | $204,500 |
| Median Household Income | $69,860 | $5,340 |
| Monthly Housing Costs | $460 | $583 |
| Real Estate Taxes | $1,231 | $560 |
Property Value by Mortgage Status in Tippecanoe County
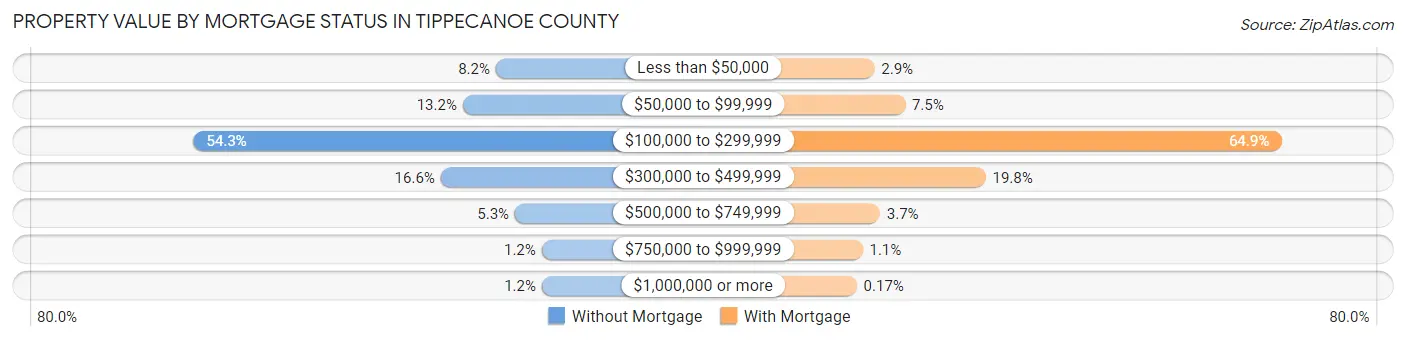
| Property Value | Without Mortgage | With Mortgage |
| Less than $50,000 | 1,049 (8.2%) | 748 (2.9%) |
| $50,000 to $99,999 | 1,694 (13.2%) | 1,961 (7.5%) |
| $100,000 to $299,999 | 6,942 (54.3%) | 16,881 (64.9%) |
| $300,000 to $499,999 | 2,123 (16.6%) | 5,155 (19.8%) |
| $500,000 to $749,999 | 675 (5.3%) | 962 (3.7%) |
| $750,000 to $999,999 | 156 (1.2%) | 275 (1.1%) |
| $1,000,000 or more | 152 (1.2%) | 44 (0.2%) |
| Total | 12,791 (100.0%) | 26,026 (100.0%) |
Household Income by Mortgage Status in Tippecanoe County
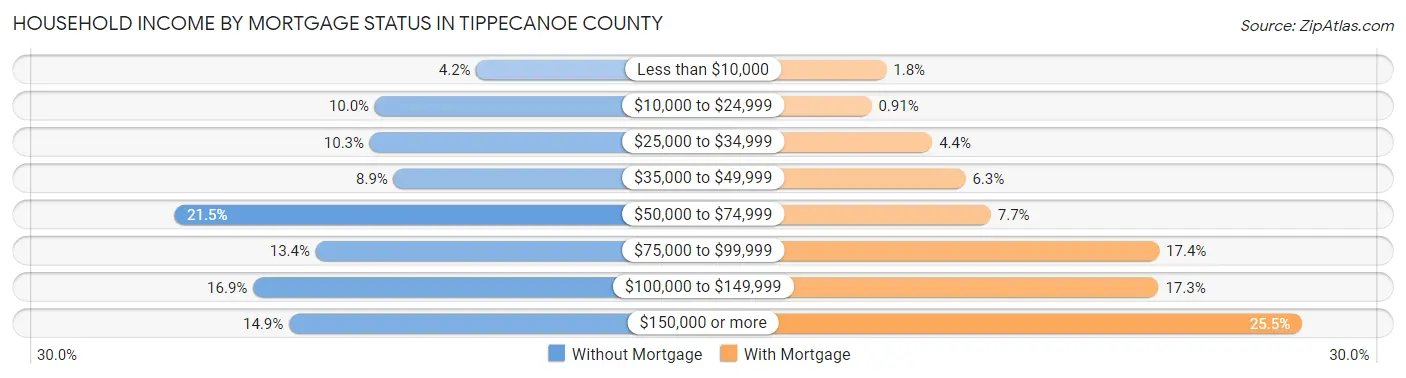
| Household Income | Without Mortgage | With Mortgage |
| Less than $10,000 | 535 (4.2%) | 459 (1.8%) |
| $10,000 to $24,999 | 1,277 (10.0%) | 237 (0.9%) |
| $25,000 to $34,999 | 1,313 (10.3%) | 1,141 (4.4%) |
| $35,000 to $49,999 | 1,140 (8.9%) | 1,635 (6.3%) |
| $50,000 to $74,999 | 2,745 (21.5%) | 2,011 (7.7%) |
| $75,000 to $99,999 | 1,709 (13.4%) | 4,516 (17.3%) |
| $100,000 to $149,999 | 2,167 (16.9%) | 4,506 (17.3%) |
| $150,000 or more | 1,905 (14.9%) | 6,640 (25.5%) |
| Total | 12,791 (100.0%) | 26,026 (100.0%) |
Property Value to Household Income Ratio in Tippecanoe County
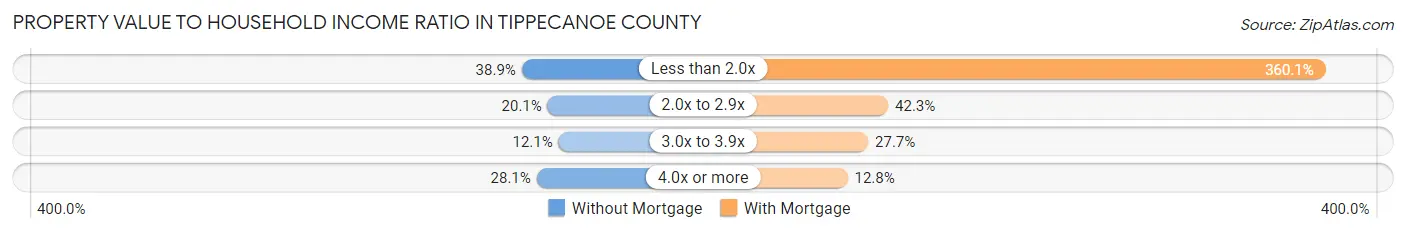
| Value-to-Income Ratio | Without Mortgage | With Mortgage |
| Less than 2.0x | 4,980 (38.9%) | 93,711 (360.1%) |
| 2.0x to 2.9x | 2,564 (20.1%) | 11,004 (42.3%) |
| 3.0x to 3.9x | 1,551 (12.1%) | 7,219 (27.7%) |
| 4.0x or more | 3,588 (28.1%) | 3,324 (12.8%) |
| Total | 12,791 (100.0%) | 26,026 (100.0%) |
Real Estate Taxes by Mortgage Status in Tippecanoe County
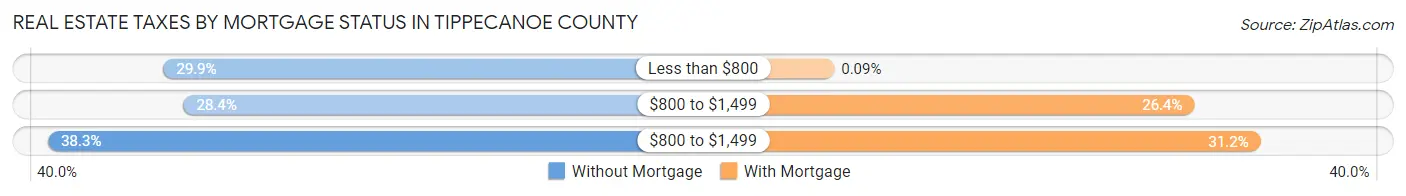
| Property Taxes | Without Mortgage | With Mortgage |
| Less than $800 | 3,819 (29.9%) | 23 (0.1%) |
| $800 to $1,499 | 3,631 (28.4%) | 6,867 (26.4%) |
| $800 to $1,499 | 4,898 (38.3%) | 8,127 (31.2%) |
| Total | 12,791 (100.0%) | 26,026 (100.0%) |
Health & Disability in Tippecanoe County
Health Insurance Coverage by Age in Tippecanoe County
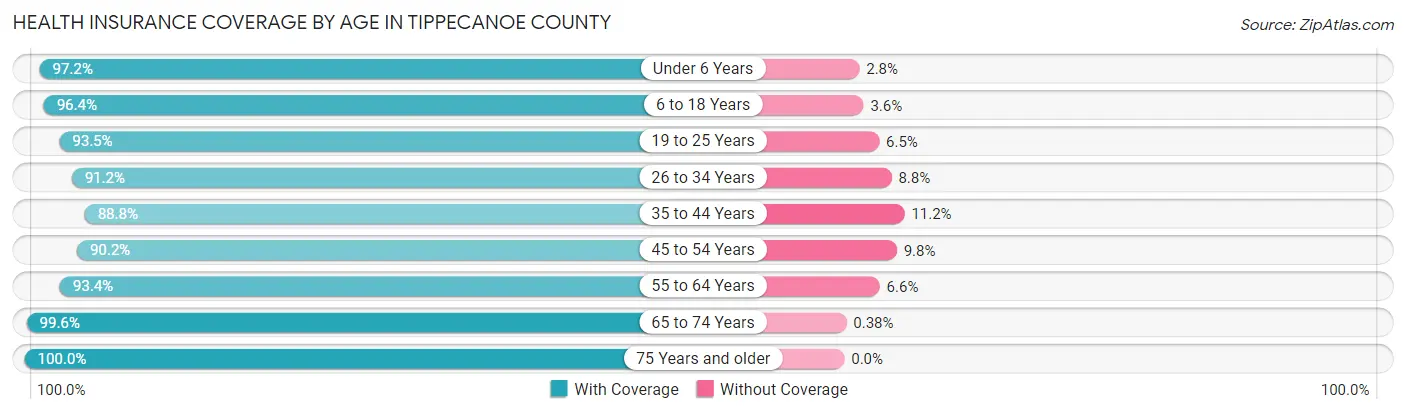
| Age Bracket | With Coverage | Without Coverage |
| Under 6 Years | 11,824 (97.2%) | 341 (2.8%) |
| 6 to 18 Years | 30,854 (96.4%) | 1,143 (3.6%) |
| 19 to 25 Years | 39,621 (93.5%) | 2,751 (6.5%) |
| 26 to 34 Years | 20,520 (91.2%) | 1,978 (8.8%) |
| 35 to 44 Years | 17,648 (88.8%) | 2,230 (11.2%) |
| 45 to 54 Years | 15,956 (90.2%) | 1,727 (9.8%) |
| 55 to 64 Years | 16,453 (93.4%) | 1,161 (6.6%) |
| 65 to 74 Years | 12,773 (99.6%) | 49 (0.4%) |
| 75 Years and older | 8,271 (100.0%) | 0 (0.0%) |
| Total | 173,920 (93.9%) | 11,380 (6.1%) |
Health Insurance Coverage by Citizenship Status in Tippecanoe County
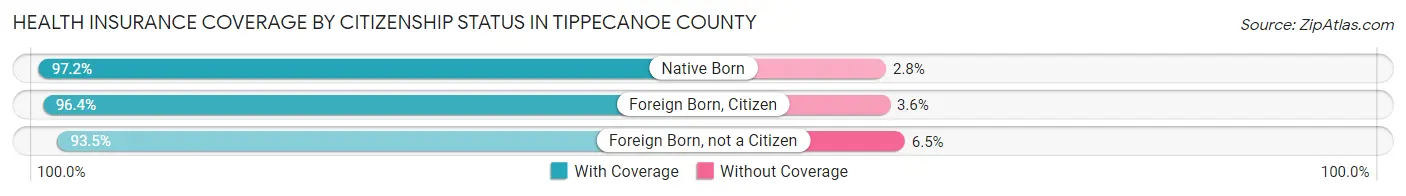
| Citizenship Status | With Coverage | Without Coverage |
| Native Born | 11,824 (97.2%) | 341 (2.8%) |
| Foreign Born, Citizen | 30,854 (96.4%) | 1,143 (3.6%) |
| Foreign Born, not a Citizen | 39,621 (93.5%) | 2,751 (6.5%) |
Health Insurance Coverage by Household Income in Tippecanoe County
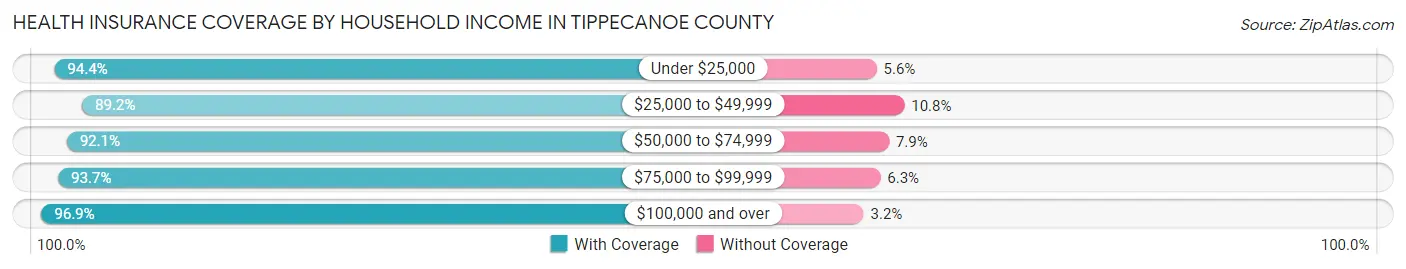
| Household Income | With Coverage | Without Coverage |
| Under $25,000 | 25,430 (94.4%) | 1,505 (5.6%) |
| $25,000 to $49,999 | 30,505 (89.2%) | 3,685 (10.8%) |
| $50,000 to $74,999 | 28,308 (92.1%) | 2,427 (7.9%) |
| $75,000 to $99,999 | 22,313 (93.7%) | 1,498 (6.3%) |
| $100,000 and over | 53,233 (96.9%) | 1,734 (3.2%) |
Public vs Private Health Insurance Coverage by Age in Tippecanoe County
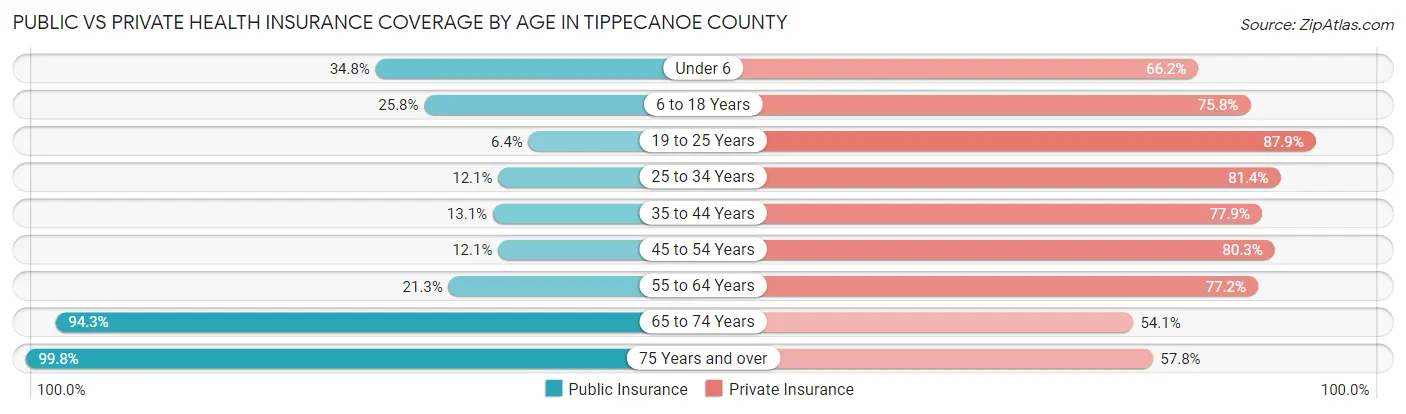
| Age Bracket | Public Insurance | Private Insurance |
| Under 6 | 4,237 (34.8%) | 8,049 (66.2%) |
| 6 to 18 Years | 8,254 (25.8%) | 24,252 (75.8%) |
| 19 to 25 Years | 2,728 (6.4%) | 37,262 (87.9%) |
| 25 to 34 Years | 2,715 (12.1%) | 18,313 (81.4%) |
| 35 to 44 Years | 2,600 (13.1%) | 15,493 (77.9%) |
| 45 to 54 Years | 2,138 (12.1%) | 14,204 (80.3%) |
| 55 to 64 Years | 3,751 (21.3%) | 13,602 (77.2%) |
| 65 to 74 Years | 12,089 (94.3%) | 6,942 (54.1%) |
| 75 Years and over | 8,258 (99.8%) | 4,784 (57.8%) |
| Total | 46,770 (25.2%) | 142,901 (77.1%) |
Disability Status by Sex by Age in Tippecanoe County
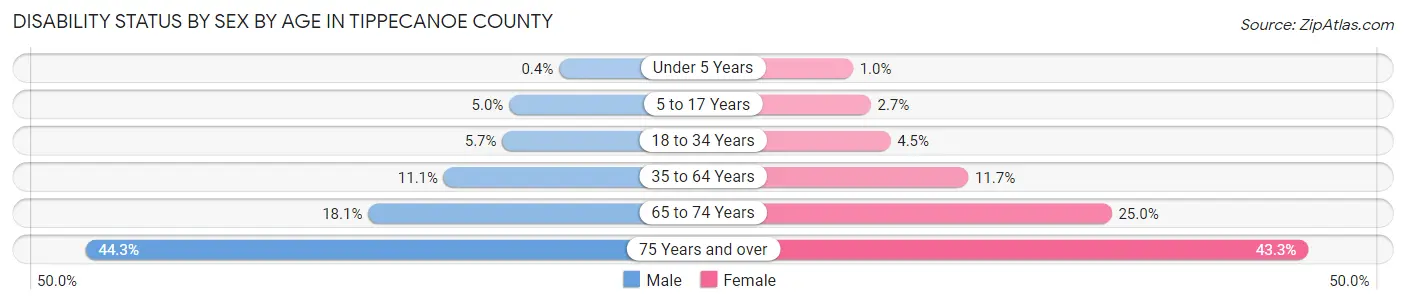
| Age Bracket | Male | Female |
| Under 5 Years | 21 (0.4%) | 51 (1.0%) |
| 5 to 17 Years | 704 (5.0%) | 359 (2.7%) |
| 18 to 34 Years | 2,204 (5.7%) | 1,453 (4.5%) |
| 35 to 64 Years | 3,062 (11.1%) | 3,228 (11.7%) |
| 65 to 74 Years | 1,082 (18.1%) | 1,714 (25.0%) |
| 75 Years and over | 1,555 (44.3%) | 2,062 (43.3%) |
Disability Class by Sex by Age in Tippecanoe County
Disability Class: Hearing Difficulty
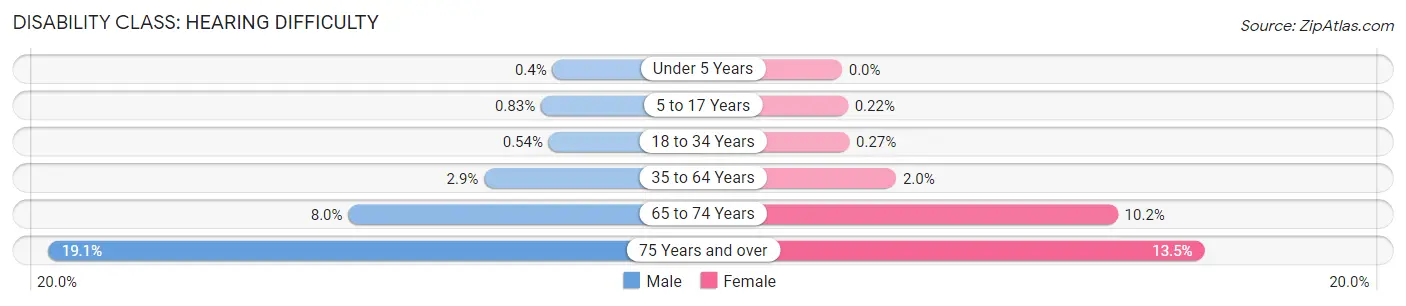
| Age Bracket | Male | Female |
| Under 5 Years | 21 (0.4%) | 0 (0.0%) |
| 5 to 17 Years | 116 (0.8%) | 30 (0.2%) |
| 18 to 34 Years | 212 (0.5%) | 87 (0.3%) |
| 35 to 64 Years | 812 (2.9%) | 554 (2.0%) |
| 65 to 74 Years | 477 (8.0%) | 701 (10.2%) |
| 75 Years and over | 670 (19.1%) | 641 (13.5%) |
Disability Class: Vision Difficulty
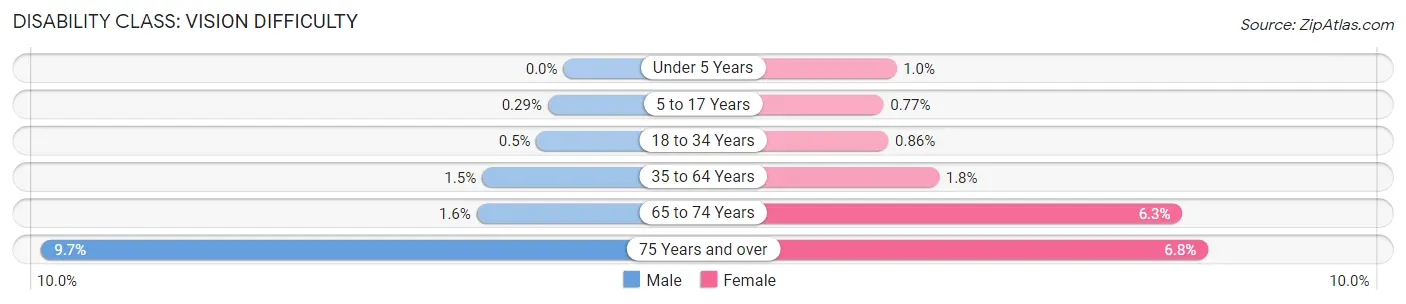
| Age Bracket | Male | Female |
| Under 5 Years | 0 (0.0%) | 51 (1.0%) |
| 5 to 17 Years | 40 (0.3%) | 103 (0.8%) |
| 18 to 34 Years | 195 (0.5%) | 278 (0.9%) |
| 35 to 64 Years | 417 (1.5%) | 496 (1.8%) |
| 65 to 74 Years | 96 (1.6%) | 433 (6.3%) |
| 75 Years and over | 340 (9.7%) | 324 (6.8%) |
Disability Class: Cognitive Difficulty
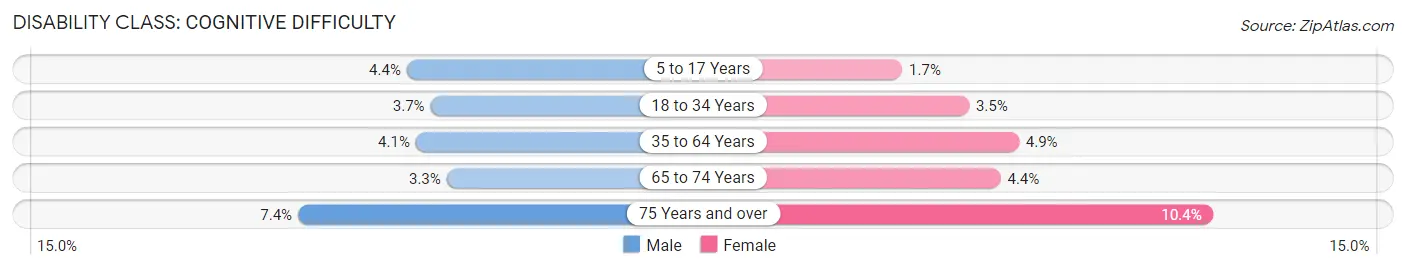
| Age Bracket | Male | Female |
| 5 to 17 Years | 610 (4.4%) | 226 (1.7%) |
| 18 to 34 Years | 1,440 (3.7%) | 1,144 (3.5%) |
| 35 to 64 Years | 1,136 (4.1%) | 1,358 (4.9%) |
| 65 to 74 Years | 194 (3.3%) | 303 (4.4%) |
| 75 Years and over | 259 (7.4%) | 493 (10.3%) |
Disability Class: Ambulatory Difficulty
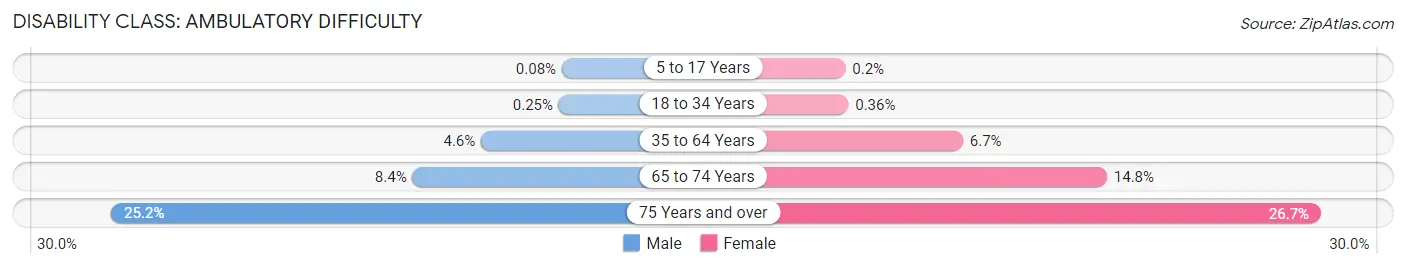
| Age Bracket | Male | Female |
| 5 to 17 Years | 11 (0.1%) | 27 (0.2%) |
| 18 to 34 Years | 97 (0.3%) | 115 (0.4%) |
| 35 to 64 Years | 1,264 (4.6%) | 1,857 (6.7%) |
| 65 to 74 Years | 502 (8.4%) | 1,011 (14.8%) |
| 75 Years and over | 883 (25.2%) | 1,271 (26.7%) |
Disability Class: Self-Care Difficulty
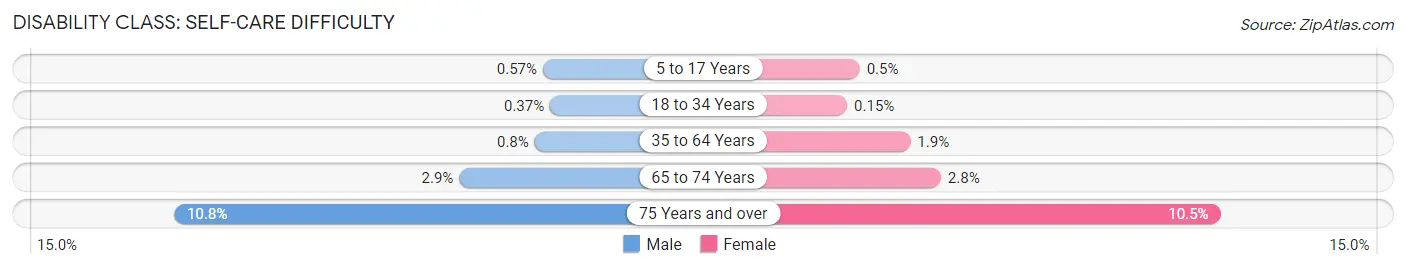
| Age Bracket | Male | Female |
| 5 to 17 Years | 80 (0.6%) | 67 (0.5%) |
| 18 to 34 Years | 143 (0.4%) | 50 (0.2%) |
| 35 to 64 Years | 221 (0.8%) | 525 (1.9%) |
| 65 to 74 Years | 173 (2.9%) | 189 (2.8%) |
| 75 Years and over | 380 (10.8%) | 502 (10.5%) |
Technology Access in Tippecanoe County
Computing Device Access in Tippecanoe County
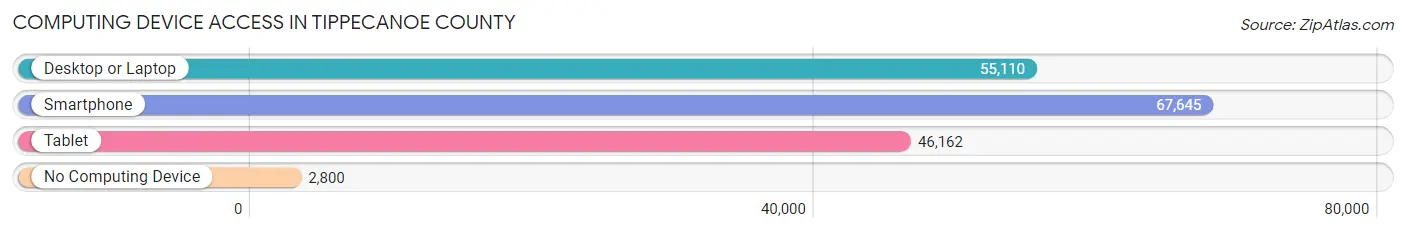
| Device Type | # Households | % Households |
| Desktop or Laptop | 55,110 | 75.2% |
| Smartphone | 67,645 | 92.2% |
| Tablet | 46,162 | 62.9% |
| No Computing Device | 2,800 | 3.8% |
| Total | 73,327 | 100.0% |
Internet Access in Tippecanoe County
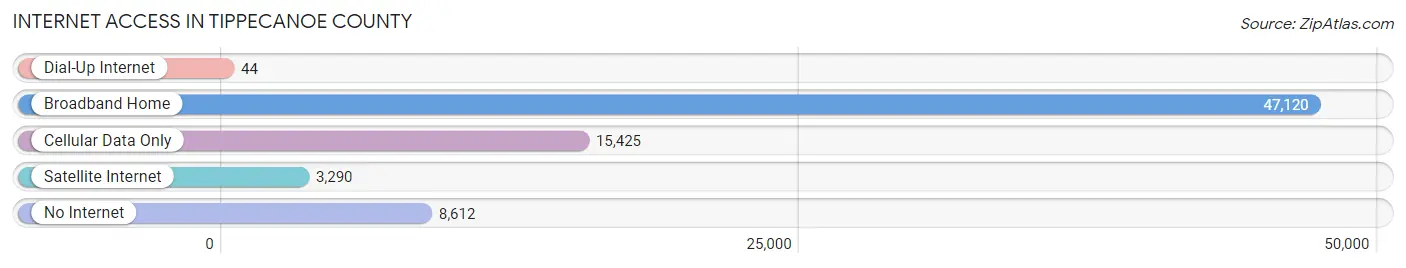
| Internet Type | # Households | % Households |
| Dial-Up Internet | 44 | 0.1% |
| Broadband Home | 47,120 | 64.3% |
| Cellular Data Only | 15,425 | 21.0% |
| Satellite Internet | 3,290 | 4.5% |
| No Internet | 8,612 | 11.7% |
| Total | 73,327 | 100.0% |
Tippecanoe County Summary
Tippecanoe County, Indiana is located in the west-central part of the state, and is part of the Lafayette-West Lafayette Metropolitan Statistical Area. It is bordered by White, Carroll, Clinton, Warren, Fountain, Montgomery, and Benton counties. The county seat is Lafayette, and the county was named for the Battle of Tippecanoe, which was fought in the area in 1811.
History
Tippecanoe County was formed in 1826 from parts of White, Carroll, and Warren counties. The county was named for the Battle of Tippecanoe, which was fought in the area in 1811. The battle was between the United States and a confederation of Native American tribes led by Tecumseh and his brother, the Prophet. The battle was a victory for the United States, and it helped to secure the area for white settlement.
The first settlers in the area were French fur traders, who established trading posts in the area in the late 1700s. The first permanent settlers arrived in the early 1800s, and the county was officially organized in 1826.
The county grew rapidly in the mid-1800s, and by 1860, the population had reached nearly 20,000. The county was an important center of the Underground Railroad, and many escaped slaves found refuge in the area.
During the Civil War, Tippecanoe County was a major center of Union support. The county was home to several Union regiments, and the Battle of Shiloh Church was fought in the county in 1862.
Geography
Tippecanoe County is located in the west-central part of Indiana, and is bordered by White, Carroll, Clinton, Warren, Fountain, Montgomery, and Benton counties. The county covers an area of 545 square miles, and is home to a population of over 170,000 people.
The county is located in the Tippecanoe River Valley, and is part of the Wabash River watershed. The county is mostly flat, with some rolling hills in the northern and western parts of the county. The highest point in the county is located in the northern part of the county, and is 890 feet above sea level.
The county is home to several state parks, including Prophetstown State Park, Tippecanoe River State Park, and Ouabache State Park. The county is also home to several lakes, including Lake Freeman, Lake Shafer, and Lake Wawasee.
Economy
Tippecanoe County has a diverse economy, with a mix of manufacturing, agriculture, and services. The county is home to several large employers, including Purdue University, Subaru of Indiana Automotive, and Wabash National Corporation.
The county is also home to several smaller employers, including several small manufacturing companies, agricultural businesses, and service-based businesses. The county is also home to several retail businesses, including several large shopping malls and several smaller retail stores.
Demographics
As of the 2010 census, Tippecanoe County had a population of 172,780. The population was spread out, with 24.3% under the age of 18, 11.7% from 18 to 24, 28.2% from 25 to 44, 22.2% from 45 to 64, and 13.6% who were 65 years of age or older. The median age was 34.3 years.
The racial makeup of the county was 87.2% White, 6.3% African American, 0.5% Native American, 2.7% Asian, 0.1% Pacific Islander, 1.3% from other races, and 2.0% from two or more races. Hispanic or Latino of any race were 4.2% of the population.
The median income for a household in the county was $50,945, and the median income for a family was $63,945. The per capita income for the county was $25,945. About 8.2% of families and 12.2% of the population were below the poverty line, including 16.2% of those under age 18 and 6.2% of those age 65 or over.
Common Questions
What is the Total Population of Tippecanoe County?
Total Population of Tippecanoe County is 186,955.
What is the Total Male Population of Tippecanoe County?
Total Male Population of Tippecanoe County is 96,158.
What is the Total Female Population of Tippecanoe County?
Total Female Population of Tippecanoe County is 90,797.
What is the Ratio of Males per 100 Females in Tippecanoe County?
There are 105.90 Males per 100 Females in Tippecanoe County.
What is the Ratio of Females per 100 Males in Tippecanoe County?
There are 94.42 Females per 100 Males in Tippecanoe County.
What is the Median Population Age in Tippecanoe County?
Median Population Age in Tippecanoe County is 28.4 Years.
What is the Average Family Size in Tippecanoe County
Average Family Size in Tippecanoe County is 3.0 People.
What is the Average Household Size in Tippecanoe County
Average Household Size in Tippecanoe County is 2.3 People.
What is Per Capita Income in Tippecanoe County?
Per Capita income in Tippecanoe County is $30,608.
What is the Median Family Income in Tippecanoe County?
Median Family Income in Tippecanoe County is $81,545.
What is the Median Household income in Tippecanoe County?
Median Household Income in Tippecanoe County is $55,728.
What is Income or Wage Gap in Tippecanoe County?
Income or Wage Gap in Tippecanoe County is 28.7%.
Women in Tippecanoe County earn 71.3 cents for every dollar earned by a man.
What is Family Income Deficit in Tippecanoe County?
Family Income Deficit in Tippecanoe County is $10,876.
Families that are below poverty line in Tippecanoe County earn $10,876 less on average than the poverty threshold level.
What is Inequality or Gini Index in Tippecanoe County?
Inequality or Gini Index in Tippecanoe County is 0.48.
How Large is the Labor Force in Tippecanoe County?
There are 95,259 People in the Labor Forcein in Tippecanoe County.
What is the Percentage of People in the Labor Force in Tippecanoe County?
62.1% of People are in the Labor Force in Tippecanoe County.
What is the Unemployment Rate in Tippecanoe County?
Unemployment Rate in Tippecanoe County is 3.6%.