Switzerland County, IN
Switzerland County Map
Switzerland County Overview
9,896
TOTAL POPULATION
5,046
MALE POPULATION
4,850
FEMALE POPULATION
104.04
MALES / 100 FEMALES
96.12
FEMALES / 100 MALES
40.8
MEDIAN AGE
3.3
AVG FAMILY SIZE
2.6
AVG HOUSEHOLD SIZE
$29,202
PER CAPITA INCOME
$74,387
AVG FAMILY INCOME
$66,525
AVG HOUSEHOLD INCOME
36.9%
WAGE / INCOME GAP [ % ]
63.1¢/ $1
WAGE / INCOME GAP [ $ ]
$8,471
FAMILY INCOME DEFICIT
0.38
INEQUALITY / GINI INDEX
4,603
LABOR FORCE [ PEOPLE ]
58.8%
PERCENT IN LABOR FORCE
4.4%
UNEMPLOYMENT RATE
Switzerland County Area Codes
Race in Switzerland County
The most populous races in Switzerland County are White / Caucasian (9,406 | 95.1%), Two or more Races (328 | 3.3%), and Hispanic or Latino (207 | 2.1%).

| Race | # Population | % Population |
| Asian | 2 | 0.0% |
| Black / African American | 30 | 0.3% |
| Hawaiian / Pacific | 42 | 0.4% |
| Hispanic or Latino | 207 | 2.1% |
| Native / Alaskan | 24 | 0.2% |
| White / Caucasian | 9,406 | 95.1% |
| Two or more Races | 328 | 3.3% |
| Some other Race | 64 | 0.6% |
| Total | 9,896 | 100.0% |
Ancestry in Switzerland County
The most populous ancestries reported in Switzerland County are German (2,635 | 26.6%), English (1,199 | 12.1%), Irish (1,127 | 11.4%), American (1,113 | 11.3%), and Scottish (214 | 2.2%), together accounting for 63.5% of all Switzerland County residents.

| Ancestry | # Population | % Population |
| American | 1,113 | 11.3% |
| Arab | 26 | 0.3% |
| Bhutanese | 2 | 0.0% |
| British | 92 | 0.9% |
| Canadian | 4 | 0.0% |
| Celtic | 1 | 0.0% |
| Central American | 42 | 0.4% |
| Central American Indian | 9 | 0.1% |
| Cherokee | 50 | 0.5% |
| Czech | 10 | 0.1% |
| Czechoslovakian | 6 | 0.1% |
| Dutch | 61 | 0.6% |
| English | 1,199 | 12.1% |
| European | 190 | 1.9% |
| French | 105 | 1.1% |
| French Canadian | 3 | 0.0% |
| German | 2,635 | 26.6% |
| Guamanian / Chamorro | 42 | 0.4% |
| Guatemalan | 42 | 0.4% |
| Hungarian | 42 | 0.4% |
| Indian (Asian) | 16 | 0.2% |
| Irish | 1,127 | 11.4% |
| Italian | 115 | 1.2% |
| Jordanian | 7 | 0.1% |
| Lebanese | 19 | 0.2% |
| Lumbee | 4 | 0.0% |
| Mexican | 88 | 0.9% |
| Norwegian | 41 | 0.4% |
| Polish | 31 | 0.3% |
| Scotch-Irish | 125 | 1.3% |
| Scottish | 214 | 2.2% |
| Spaniard | 5 | 0.1% |
| Spanish | 26 | 0.3% |
| Sri Lankan | 6 | 0.1% |
| Swedish | 3 | 0.0% |
| Swiss | 184 | 1.9% |
| Welsh | 38 | 0.4% | View All 37 Rows |
Immigrants in Switzerland County
The most numerous immigrant groups reported in Switzerland County came from Central America (137 | 1.4%), Latin America (137 | 1.4%), Guatemala (73 | 0.7%), Mexico (64 | 0.6%), and England (19 | 0.2%), together accounting for 4.3% of all Switzerland County residents.

| Immigration Origin | # Population | % Population |
| Asia | 2 | 0.0% |
| Canada | 4 | 0.0% |
| Central America | 137 | 1.4% |
| Eastern Asia | 2 | 0.0% |
| England | 19 | 0.2% |
| Europe | 19 | 0.2% |
| Guatemala | 73 | 0.7% |
| Japan | 2 | 0.0% |
| Latin America | 137 | 1.4% |
| Mexico | 64 | 0.6% |
| Northern Europe | 19 | 0.2% | View All 11 Rows |
Sex and Age in Switzerland County
Sex and Age in Switzerland County
The most populous age groups in Switzerland County are 60 to 64 Years (431 | 8.5%) for men and 55 to 59 Years (386 | 8.0%) for women.

| Age Bracket | Male | Female |
| Under 5 Years | 290 (5.8%) | 250 (5.1%) |
| 5 to 9 Years | 347 (6.9%) | 301 (6.2%) |
| 10 to 14 Years | 385 (7.6%) | 358 (7.4%) |
| 15 to 19 Years | 340 (6.7%) | 366 (7.5%) |
| 20 to 24 Years | 271 (5.4%) | 235 (4.9%) |
| 25 to 29 Years | 284 (5.6%) | 231 (4.8%) |
| 30 to 34 Years | 248 (4.9%) | 267 (5.5%) |
| 35 to 39 Years | 329 (6.5%) | 321 (6.6%) |
| 40 to 44 Years | 288 (5.7%) | 345 (7.1%) |
| 45 to 49 Years | 302 (6.0%) | 271 (5.6%) |
| 50 to 54 Years | 355 (7.0%) | 329 (6.8%) |
| 55 to 59 Years | 291 (5.8%) | 386 (8.0%) |
| 60 to 64 Years | 431 (8.5%) | 291 (6.0%) |
| 65 to 69 Years | 286 (5.7%) | 272 (5.6%) |
| 70 to 74 Years | 263 (5.2%) | 242 (5.0%) |
| 75 to 79 Years | 131 (2.6%) | 158 (3.3%) |
| 80 to 84 Years | 80 (1.6%) | 117 (2.4%) |
| 85 Years and over | 125 (2.5%) | 110 (2.3%) |
| Total | 5,046 (100.0%) | 4,850 (100.0%) |
Families and Households in Switzerland County
Median Family Size in Switzerland County
The median family size in Switzerland County is 3.26 persons per family, with married-couple families (1,643 | 69.2%) accounting for the largest median family size of 3.3 persons per family. On the other hand, single male/father families (356 | 15.0%) represent the smallest median family size with 3.12 persons per family.

| Family Type | # Families | Family Size |
| Married-Couple | 1,643 (69.2%) | 3.30 |
| Single Male/Father | 356 (15.0%) | 3.12 |
| Single Female/Mother | 374 (15.8%) | 3.21 |
| Total Families | 2,373 (100.0%) | 3.26 |
Median Household Size in Switzerland County
The median household size in Switzerland County is 2.59 persons per household, with single male/father households (356 | 9.4%) accounting for the largest median household size of 3.54 persons per household. non-family households (1,410 | 37.3%) represent the smallest median household size with 1.24 persons per household.

| Household Type | # Households | Household Size |
| Married-Couple | 1,643 (43.4%) | 3.35 |
| Single Male/Father | 356 (9.4%) | 3.54 |
| Single Female/Mother | 374 (9.9%) | 3.43 |
| Non-family | 1,410 (37.3%) | 1.24 |
| Total Households | 3,783 (100.0%) | 2.59 |
Household Size by Marriage Status in Switzerland County
Out of a total of 3,783 households in Switzerland County, 2,373 (62.7%) are family households, while 1,410 (37.3%) are nonfamily households. The most numerous type of family households are 2-person households, comprising 995, and the most common type of nonfamily households are 1-person households, comprising 1,116.

| Household Size | Family Households | Nonfamily Households |
| 1-Person Households | - | 1,116 (29.5%) |
| 2-Person Households | 995 (26.3%) | 286 (7.6%) |
| 3-Person Households | 553 (14.6%) | 8 (0.2%) |
| 4-Person Households | 486 (12.9%) | 0 (0.0%) |
| 5-Person Households | 158 (4.2%) | 0 (0.0%) |
| 6-Person Households | 110 (2.9%) | 0 (0.0%) |
| 7+ Person Households | 71 (1.9%) | 0 (0.0%) |
| Total | 2,373 (62.7%) | 1,410 (37.3%) |
Female Fertility in Switzerland County
Fertility by Age in Switzerland County
Average fertility rate in Switzerland County is 74.0 births per 1,000 women. Women in the age bracket of 20 to 34 years have the highest fertility rate with 165.0 births per 1,000 women. Women in the age bracket of 20 to 34 years acount for 79.1% of all women with births.

| Age Bracket | Women with Births | Births / 1,000 Women |
| 15 to 19 years | 0 (0.0%) | 0.0 |
| 20 to 34 years | 121 (79.1%) | 165.0 |
| 35 to 50 years | 32 (20.9%) | 33.0 |
| Total | 153 (100.0%) | 74.0 |
Fertility by Age by Marriage Status in Switzerland County
80.4% of women with births (153) in Switzerland County are married. The highest percentage of unmarried women with births falls into 20 to 34 years age bracket with 24.8% of them unmarried at the time of birth, while the lowest percentage of unmarried women with births belong to 35 to 50 years age bracket with 0.0% of them unmarried.
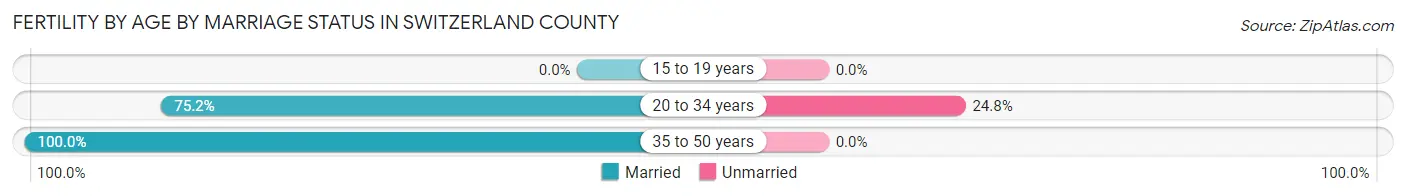
| Age Bracket | Married | Unmarried |
| 15 to 19 years | 0 (0.0%) | 0 (0.0%) |
| 20 to 34 years | 91 (75.2%) | 30 (24.8%) |
| 35 to 50 years | 32 (100.0%) | 0 (0.0%) |
| Total | 123 (80.4%) | 30 (19.6%) |
Fertility by Education in Switzerland County
Average fertility rate in Switzerland County is 74.0 births per 1,000 women. Women with the education attainment of bachelor's degree have the highest fertility rate of 205.0 births per 1,000 women, while women with the education attainment of less than high school have the lowest fertility at 36.0 births per 1,000 women. Women with the education attainment of bachelor's degree represent 29.4% of all women with births.

| Educational Attainment | Women with Births | Births / 1,000 Women |
| Less than High School | 22 (14.4%) | 36.0 |
| High School Diploma | 34 (22.2%) | 54.0 |
| College or Associate's Degree | 42 (27.5%) | 77.0 |
| Bachelor's Degree | 45 (29.4%) | 205.0 |
| Graduate Degree | 10 (6.5%) | 132.0 |
| Total | 153 (100.0%) | 74.0 |
Fertility by Education by Marriage Status in Switzerland County
19.6% of women with births in Switzerland County are unmarried. Women with the educational attainment of less than high school are most likely to be married with 100.0% of them married at childbirth, while women with the educational attainment of graduate degree are least likely to be married with 100.0% of them unmarried at childbirth.

| Educational Attainment | Married | Unmarried |
| Less than High School | 22 (100.0%) | 0 (0.0%) |
| High School Diploma | 14 (41.2%) | 20 (58.8%) |
| College or Associate's Degree | 42 (100.0%) | 0 (0.0%) |
| Bachelor's Degree | 45 (100.0%) | 0 (0.0%) |
| Graduate Degree | 0 (0.0%) | 10 (100.0%) |
| Total | 123 (80.4%) | 30 (19.6%) |
Income in Switzerland County
Income Overview in Switzerland County
Per Capita Income in Switzerland County is $29,202, while median incomes of families and households are $74,387 and $66,525 respectively.
| Characteristic | Number | Measure |
| Per Capita Income | 9,896 | $29,202 |
| Median Family Income | 2,373 | $74,387 |
| Mean Family Income | 2,373 | $84,649 |
| Median Household Income | 3,783 | $66,525 |
| Mean Household Income | 3,783 | $74,029 |
| Income Deficit | 2,373 | $8,471 |
| Wage / Income Gap (%) | 9,896 | 36.91% |
| Wage / Income Gap ($) | 9,896 | 63.09¢ per $1 |
| Gini / Inequality Index | 9,896 | 0.38 |
Earnings by Sex in Switzerland County
Average Earnings in Switzerland County are $37,209, $47,979 for men and $30,268 for women, a difference of 36.9%.

| Sex | Number | Average Earnings |
| Male | 2,656 (55.1%) | $47,979 |
| Female | 2,168 (44.9%) | $30,268 |
| Total | 4,824 (100.0%) | $37,209 |
Earnings by Sex by Income Bracket in Switzerland County
The most common earnings brackets in Switzerland County are $65,000 to $74,999 for men (373 | 14.0%) and $40,000 to $44,999 for women (207 | 9.6%).

| Income | Male | Female |
| $2,499 or less | 174 (6.6%) | 79 (3.6%) |
| $2,500 to $4,999 | 66 (2.5%) | 160 (7.4%) |
| $5,000 to $7,499 | 119 (4.5%) | 138 (6.4%) |
| $7,500 to $9,999 | 67 (2.5%) | 38 (1.8%) |
| $10,000 to $12,499 | 93 (3.5%) | 106 (4.9%) |
| $12,500 to $14,999 | 49 (1.8%) | 74 (3.4%) |
| $15,000 to $17,499 | 89 (3.4%) | 77 (3.5%) |
| $17,500 to $19,999 | 10 (0.4%) | 160 (7.4%) |
| $20,000 to $22,499 | 43 (1.6%) | 121 (5.6%) |
| $22,500 to $24,999 | 48 (1.8%) | 28 (1.3%) |
| $25,000 to $29,999 | 114 (4.3%) | 94 (4.3%) |
| $30,000 to $34,999 | 204 (7.7%) | 170 (7.8%) |
| $35,000 to $39,999 | 55 (2.1%) | 96 (4.4%) |
| $40,000 to $44,999 | 150 (5.7%) | 207 (9.6%) |
| $45,000 to $49,999 | 85 (3.2%) | 95 (4.4%) |
| $50,000 to $54,999 | 204 (7.7%) | 86 (4.0%) |
| $55,000 to $64,999 | 211 (7.9%) | 82 (3.8%) |
| $65,000 to $74,999 | 373 (14.0%) | 191 (8.8%) |
| $75,000 to $99,999 | 314 (11.8%) | 119 (5.5%) |
| $100,000+ | 188 (7.1%) | 47 (2.2%) |
| Total | 2,656 (100.0%) | 2,168 (100.0%) |
Earnings by Sex by Educational Attainment in Switzerland County
Average earnings in Switzerland County are $52,073 for men and $34,839 for women, a difference of 33.1%. Men with an educational attainment of high school diploma enjoy the highest average annual earnings of $52,847, while those with less than high school education earn the least with $49,028. Women with an educational attainment of graduate degree earn the most with the average annual earnings of $65,321, while those with high school diploma education have the smallest earnings of $28,750.
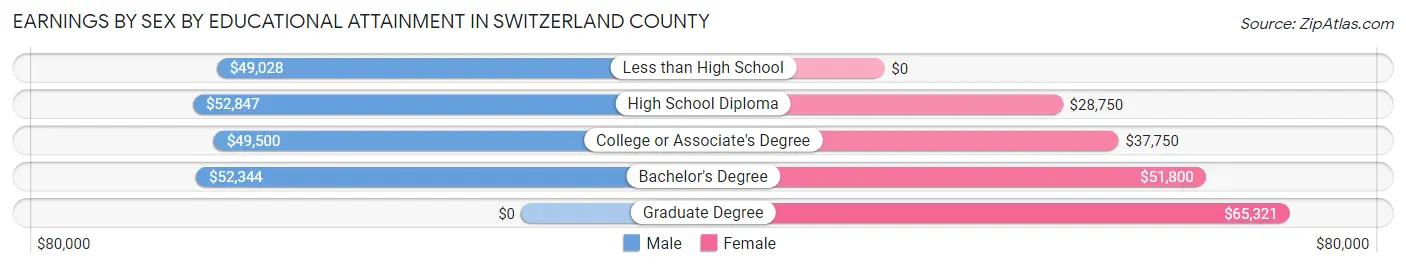
| Educational Attainment | Male Income | Female Income |
| Less than High School | $49,028 | $0 |
| High School Diploma | $52,847 | $28,750 |
| College or Associate's Degree | $49,500 | $37,750 |
| Bachelor's Degree | $52,344 | $51,800 |
| Graduate Degree | - | - |
| Total | $52,073 | $34,839 |
Family Income in Switzerland County
Family Income Brackets in Switzerland County
According to the Switzerland County family income data, there are 529 families falling into the $50,000 to $74,999 income range, which is the most common income bracket and makes up 22.3% of all families. Conversely, the less than $10,000 income bracket is the least frequent group with only 85 families (3.6%) belonging to this category.
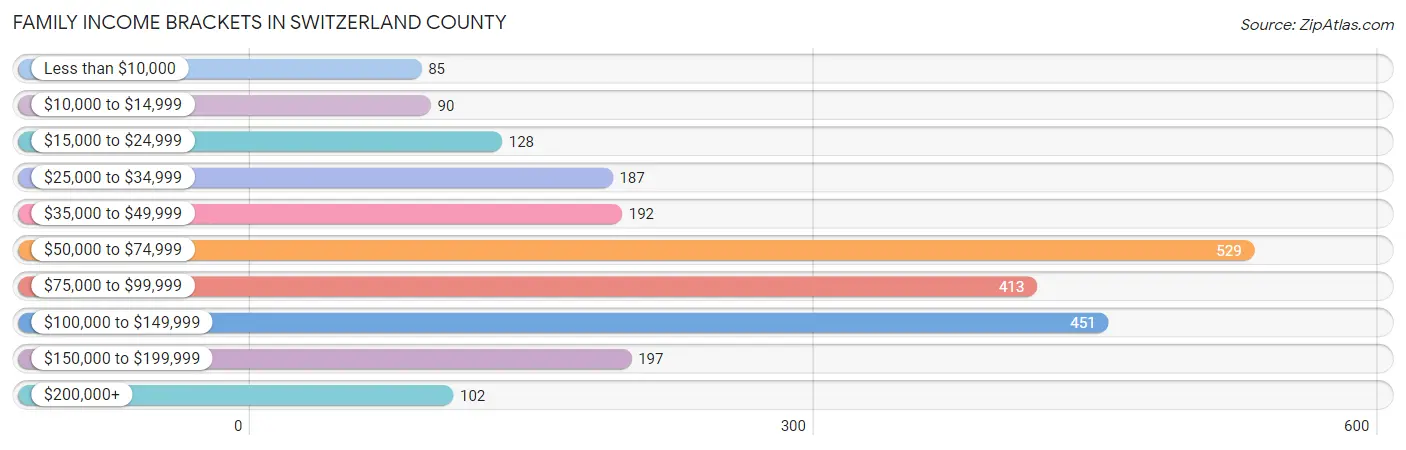
| Income Bracket | # Families | % Families |
| Less than $10,000 | 85 | 3.6% |
| $10,000 to $14,999 | 90 | 3.8% |
| $15,000 to $24,999 | 128 | 5.4% |
| $25,000 to $34,999 | 187 | 7.9% |
| $35,000 to $49,999 | 192 | 8.1% |
| $50,000 to $74,999 | 529 | 22.3% |
| $75,000 to $99,999 | 413 | 17.4% |
| $100,000 to $149,999 | 451 | 19.0% |
| $150,000 to $199,999 | 197 | 8.3% |
| $200,000+ | 102 | 4.3% |
Family Income by Famaliy Size in Switzerland County
7+ person families (71 | 3.0%) account for the highest median family income in Switzerland County with $160,380 per family, while 3-person families (484 | 20.4%) have the highest median income of $35,381 per family member.

| Income Bracket | # Families | Median Income |
| 2-Person Families | 1,118 (47.1%) | $61,810 |
| 3-Person Families | 484 (20.4%) | $106,143 |
| 4-Person Families | 491 (20.7%) | $74,196 |
| 5-Person Families | 139 (5.9%) | $80,474 |
| 6-Person Families | 70 (2.9%) | $96,250 |
| 7+ Person Families | 71 (3.0%) | $160,380 |
| Total | 2,373 (100.0%) | $74,387 |
Family Income by Number of Earners in Switzerland County
The median family income in Switzerland County is $74,387, with families comprising 3+ earners (256) having the highest median family income of $152,663, while families with no earners (331) have the lowest median family income of $36,458, accounting for 10.8% and 14.0% of families, respectively.
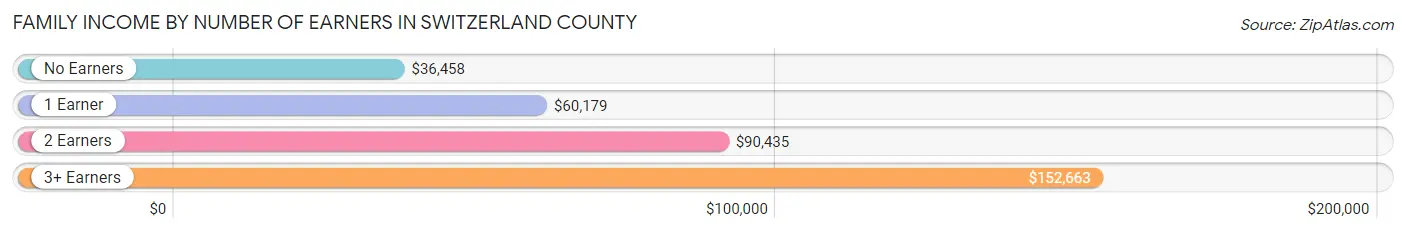
| Number of Earners | # Families | Median Income |
| No Earners | 331 (14.0%) | $36,458 |
| 1 Earner | 852 (35.9%) | $60,179 |
| 2 Earners | 934 (39.4%) | $90,435 |
| 3+ Earners | 256 (10.8%) | $152,663 |
| Total | 2,373 (100.0%) | $74,387 |
Household Income in Switzerland County
Household Income Brackets in Switzerland County
With 863 households falling in the category, the $50,000 to $74,999 income range is the most frequent in Switzerland County, accounting for 22.8% of all households. In contrast, only 110 households (2.9%) fall into the $200,000+ income bracket, making it the least populous group.

| Income Bracket | # Households | % Households |
| Less than $10,000 | 144 | 3.8% |
| $10,000 to $14,999 | 148 | 3.9% |
| $15,000 to $24,999 | 299 | 7.9% |
| $25,000 to $34,999 | 401 | 10.6% |
| $35,000 to $49,999 | 420 | 11.1% |
| $50,000 to $74,999 | 863 | 22.8% |
| $75,000 to $99,999 | 624 | 16.5% |
| $100,000 to $149,999 | 560 | 14.8% |
| $150,000 to $199,999 | 223 | 5.9% |
| $200,000+ | 110 | 2.9% |
Household Income by Householder Age in Switzerland County
The median household income in Switzerland County is $66,525, with the highest median household income of $74,552 found in the 45 to 64 years age bracket for the primary householder. A total of 1,558 households (41.2%) fall into this category. Meanwhile, the 15 to 24 years age bracket for the primary householder has the lowest median household income of $0, with 126 households (3.3%) in this group.
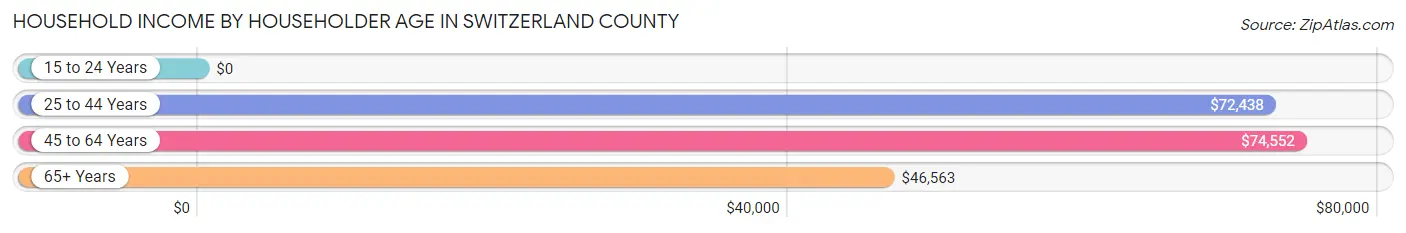
| Income Bracket | # Households | Median Income |
| 15 to 24 Years | 126 (3.3%) | $0 |
| 25 to 44 Years | 882 (23.3%) | $72,438 |
| 45 to 64 Years | 1,558 (41.2%) | $74,552 |
| 65+ Years | 1,217 (32.2%) | $46,563 |
| Total | 3,783 (100.0%) | $66,525 |
Poverty in Switzerland County
Income Below Poverty by Sex and Age in Switzerland County
With 16.7% poverty level for males and 16.5% for females among the residents of Switzerland County, 15 year old males and under 5 year old females are the most vulnerable to poverty, with 19 males (95.0%) and 74 females (29.6%) in their respective age groups living below the poverty level.

| Age Bracket | Male | Female |
| Under 5 Years | 77 (26.6%) | 74 (29.6%) |
| 5 Years | 37 (77.1%) | 4 (7.5%) |
| 6 to 11 Years | 80 (22.6%) | 53 (15.3%) |
| 12 to 14 Years | 57 (18.1%) | 69 (26.5%) |
| 15 Years | 19 (95.0%) | 26 (22.2%) |
| 16 and 17 Years | 96 (46.8%) | 35 (28.0%) |
| 18 to 24 Years | 74 (19.6%) | 50 (13.9%) |
| 25 to 34 Years | 114 (22.2%) | 120 (24.1%) |
| 35 to 44 Years | 57 (9.3%) | 153 (23.0%) |
| 45 to 54 Years | 26 (4.1%) | 56 (9.3%) |
| 55 to 64 Years | 163 (22.6%) | 81 (12.0%) |
| 65 to 74 Years | 4 (0.7%) | 14 (2.9%) |
| 75 Years and over | 28 (8.3%) | 57 (15.4%) |
| Total | 832 (16.7%) | 792 (16.5%) |
Income Above Poverty by Sex and Age in Switzerland County
According to the poverty statistics in Switzerland County, males aged 65 to 74 years and females aged 65 to 74 years are the age groups that are most secure financially, with 99.3% of males and 97.1% of females in these age groups living above the poverty line.

| Age Bracket | Male | Female |
| Under 5 Years | 213 (73.5%) | 176 (70.4%) |
| 5 Years | 11 (22.9%) | 49 (92.4%) |
| 6 to 11 Years | 274 (77.4%) | 293 (84.7%) |
| 12 to 14 Years | 257 (81.9%) | 191 (73.5%) |
| 15 Years | 1 (5.0%) | 91 (77.8%) |
| 16 and 17 Years | 109 (53.2%) | 90 (72.0%) |
| 18 to 24 Years | 303 (80.4%) | 309 (86.1%) |
| 25 to 34 Years | 400 (77.8%) | 378 (75.9%) |
| 35 to 44 Years | 554 (90.7%) | 513 (77.0%) |
| 45 to 54 Years | 616 (96.0%) | 544 (90.7%) |
| 55 to 64 Years | 559 (77.4%) | 596 (88.0%) |
| 65 to 74 Years | 545 (99.3%) | 463 (97.1%) |
| 75 Years and over | 308 (91.7%) | 312 (84.6%) |
| Total | 4,150 (83.3%) | 4,005 (83.5%) |
Income Below Poverty Among Married-Couple Families in Switzerland County
The poverty statistics for married-couple families in Switzerland County show that 8.8% or 145 of the total 1,643 families live below the poverty line. Families with 5 or more children have the highest poverty rate of 100.0%, comprising of 27 families. On the other hand, families with no children have the lowest poverty rate of 6.2%, which includes 58 families.

| Children | Above Poverty | Below Poverty |
| No Children | 875 (93.8%) | 58 (6.2%) |
| 1 or 2 Children | 532 (92.0%) | 46 (8.0%) |
| 3 or 4 Children | 91 (86.7%) | 14 (13.3%) |
| 5 or more Children | 0 (0.0%) | 27 (100.0%) |
| Total | 1,498 (91.2%) | 145 (8.8%) |
Income Below Poverty Among Single-Parent Households in Switzerland County
According to the poverty data in Switzerland County, 28.9% or 103 single-father households and 24.1% or 90 single-mother households are living below the poverty line. Among single-father households, those with no children have the highest poverty rate, with 63 households (36.4%) experiencing poverty. Likewise, among single-mother households, those with 3 or 4 children have the highest poverty rate, with 48 households (67.6%) falling below the poverty line.
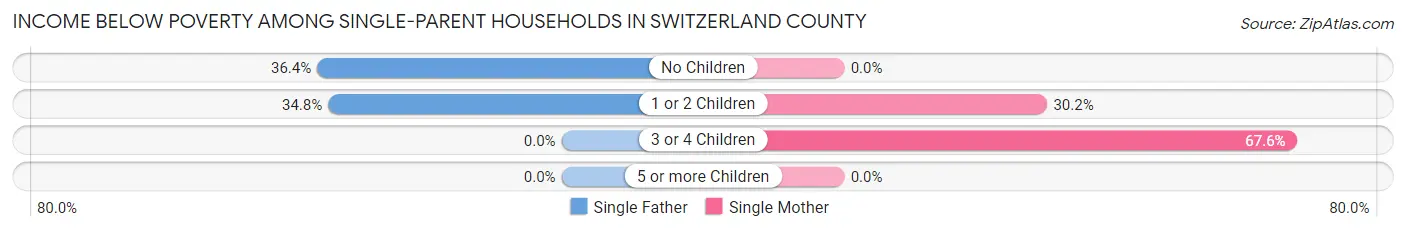
| Children | Single Father | Single Mother |
| No Children | 63 (36.4%) | 0 (0.0%) |
| 1 or 2 Children | 40 (34.8%) | 42 (30.2%) |
| 3 or 4 Children | 0 (0.0%) | 48 (67.6%) |
| 5 or more Children | 0 (0.0%) | 0 (0.0%) |
| Total | 103 (28.9%) | 90 (24.1%) |
Income Below Poverty Among Married-Couple vs Single-Parent Households in Switzerland County
The poverty data for Switzerland County shows that 145 of the married-couple family households (8.8%) and 193 of the single-parent households (26.4%) are living below the poverty level. Within the married-couple family households, those with 5 or more children have the highest poverty rate, with 27 households (100.0%) falling below the poverty line. Among the single-parent households, those with 3 or 4 children have the highest poverty rate, with 48 household (34.5%) living below poverty.
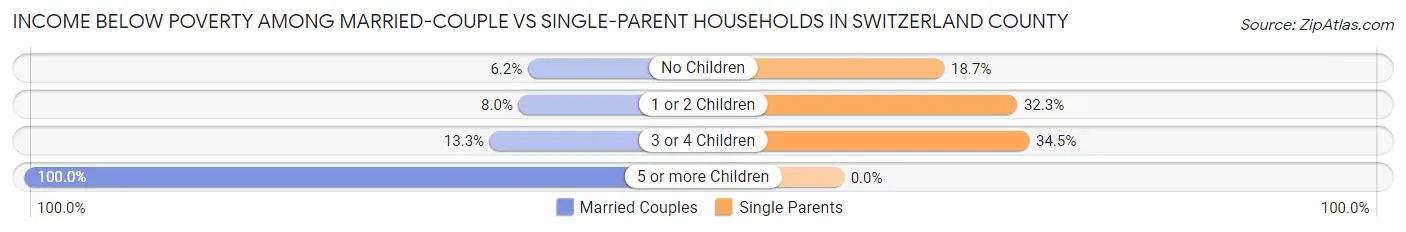
| Children | Married-Couple Families | Single-Parent Households |
| No Children | 58 (6.2%) | 63 (18.7%) |
| 1 or 2 Children | 46 (8.0%) | 82 (32.3%) |
| 3 or 4 Children | 14 (13.3%) | 48 (34.5%) |
| 5 or more Children | 27 (100.0%) | 0 (0.0%) |
| Total | 145 (8.8%) | 193 (26.4%) |
Employment Characteristics in Switzerland County
Employment by Class of Employer in Switzerland County
Among the 4,361 employed individuals in Switzerland County, private company employees (2,961 | 67.9%), local government employees (392 | 9.0%), and self-employed (not incorporated) (360 | 8.3%) make up the most common classes of employment.

| Employer Class | # Employees | % Employees |
| Private Company Employees | 2,961 | 67.9% |
| Self-Employed (Incorporated) | 150 | 3.4% |
| Self-Employed (Not Incorporated) | 360 | 8.3% |
| Not-for-profit Organizations | 350 | 8.0% |
| Local Government Employees | 392 | 9.0% |
| State Government Employees | 43 | 1.0% |
| Federal Government Employees | 95 | 2.2% |
| Unpaid Family Workers | 10 | 0.2% |
| Total | 4,361 | 100.0% |
Employment Status by Age in Switzerland County
According to the labor force statistics for Switzerland County, out of the total population over 16 years of age (7,828), 58.8% or 4,603 individuals are in the labor force, with 4.4% or 203 of them unemployed. The age group with the highest labor force participation rate is 25 to 29 years, with 80.2% or 413 individuals in the labor force. Within the labor force, the 16 to 19 years age range has the highest percentage of unemployed individuals, with 26.3% or 85 of them being unemployed.

| Age Bracket | In Labor Force | Unemployed |
| 16 to 19 Years | 323 (56.8%) | 85 (26.3%) |
| 20 to 24 Years | 402 (79.4%) | 27 (6.7%) |
| 25 to 29 Years | 413 (80.2%) | 20 (4.8%) |
| 30 to 34 Years | 337 (65.4%) | 16 (4.7%) |
| 35 to 44 Years | 990 (77.2%) | 25 (2.5%) |
| 45 to 54 Years | 991 (78.8%) | 19 (1.9%) |
| 55 to 59 Years | 441 (65.1%) | 7 (1.6%) |
| 60 to 64 Years | 422 (58.4%) | 0 (0.0%) |
| 65 to 74 Years | 249 (23.4%) | 4 (1.6%) |
| 75 Years and over | 33 (4.6%) | 0 (0.0%) |
| Total | 4,603 (58.8%) | 203 (4.4%) |
Employment Status by Educational Attainment in Switzerland County
According to labor force statistics for Switzerland County, 72.3% of individuals (3,593) out of the total population between 25 and 64 years of age (4,969) are in the labor force, with 2.4% or 86 of them being unemployed. The group with the highest labor force participation rate are those with the educational attainment of bachelor's degree or higher, with 83.2% or 479 individuals in the labor force. Within the labor force, individuals with high school diploma education have the highest percentage of unemployment, with 3.2% or 55 of them being unemployed.
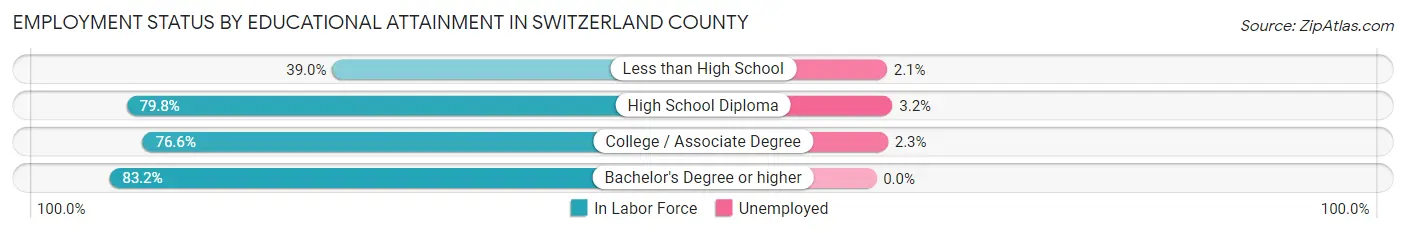
| Educational Attainment | In Labor Force | Unemployed |
| Less than High School | 333 (39.0%) | 18 (2.1%) |
| High School Diploma | 1,710 (79.8%) | 69 (3.2%) |
| College / Associate Degree | 1,070 (76.6%) | 32 (2.3%) |
| Bachelor's Degree or higher | 479 (83.2%) | 0 (0.0%) |
| Total | 3,593 (72.3%) | 119 (2.4%) |
Employment Occupations by Sex in Switzerland County
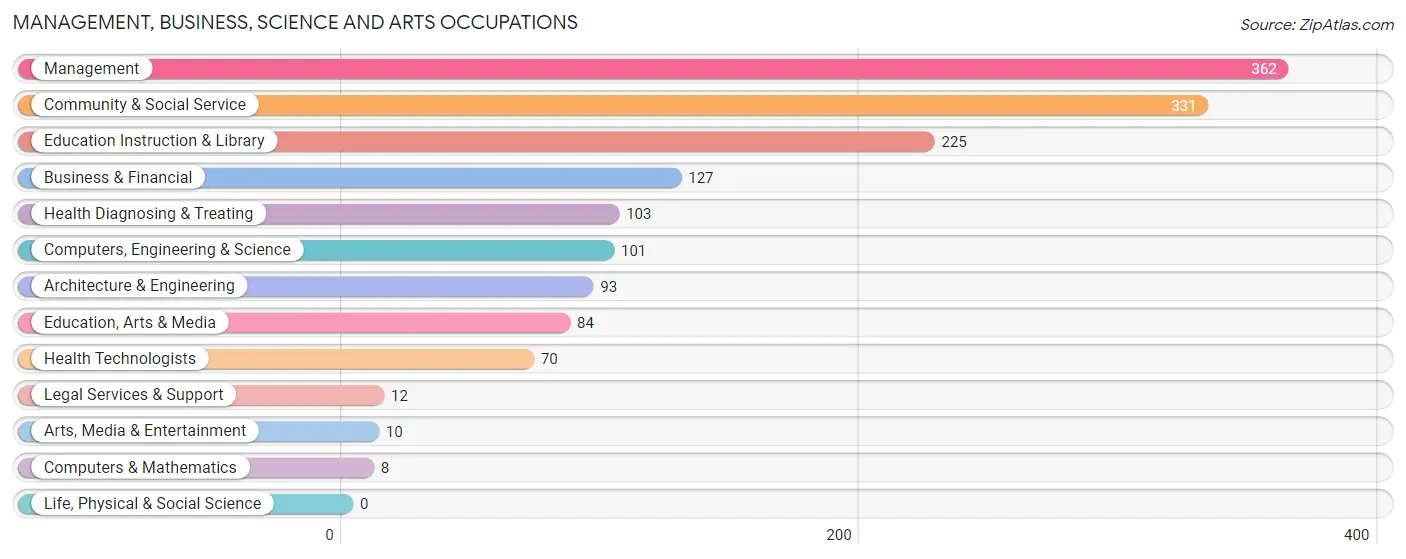
Management, Business, Science and Arts Occupations
The most common Management, Business, Science and Arts occupations in Switzerland County are Management (362 | 8.2%), Community & Social Service (331 | 7.5%), Education Instruction & Library (225 | 5.1%), Business & Financial (127 | 2.9%), and Health Diagnosing & Treating (103 | 2.3%).
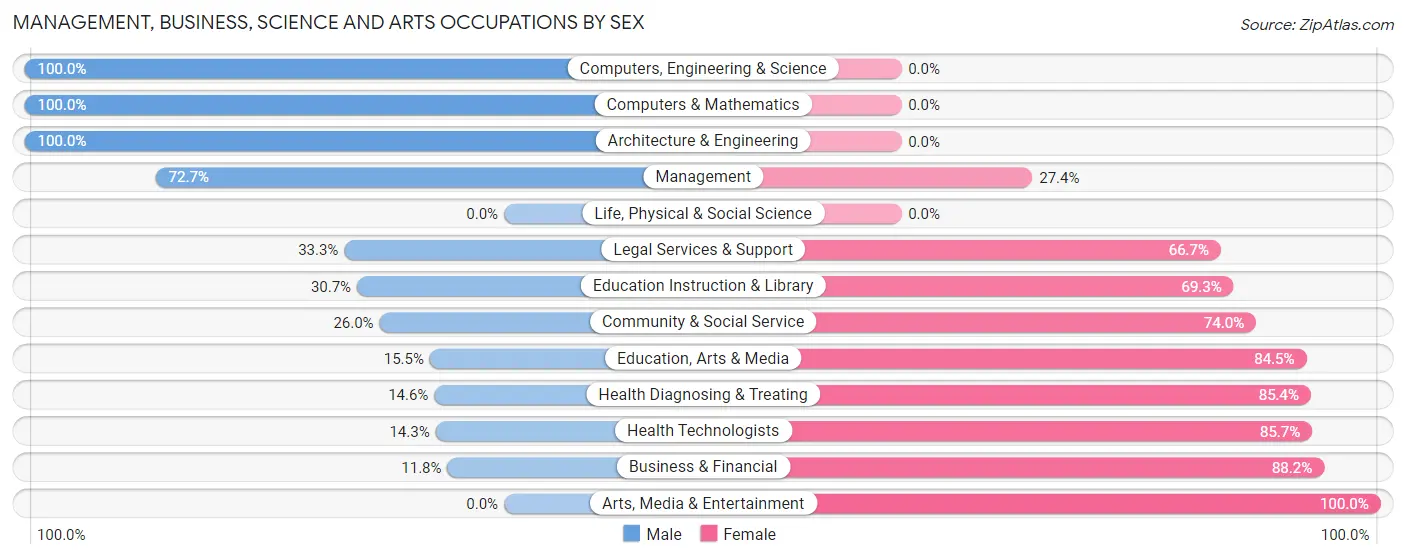
Management, Business, Science and Arts Occupations by Sex
Within the Management, Business, Science and Arts occupations in Switzerland County, the most male-oriented occupations are Computers, Engineering & Science (100.0%), Computers & Mathematics (100.0%), and Architecture & Engineering (100.0%), while the most female-oriented occupations are Arts, Media & Entertainment (100.0%), Business & Financial (88.2%), and Health Technologists (85.7%).
| Occupation | Male | Female |
| Management | 263 (72.7%) | 99 (27.4%) |
| Business & Financial | 15 (11.8%) | 112 (88.2%) |
| Computers, Engineering & Science | 101 (100.0%) | 0 (0.0%) |
| Computers & Mathematics | 8 (100.0%) | 0 (0.0%) |
| Architecture & Engineering | 93 (100.0%) | 0 (0.0%) |
| Life, Physical & Social Science | 0 (0.0%) | 0 (0.0%) |
| Community & Social Service | 86 (26.0%) | 245 (74.0%) |
| Education, Arts & Media | 13 (15.5%) | 71 (84.5%) |
| Legal Services & Support | 4 (33.3%) | 8 (66.7%) |
| Education Instruction & Library | 69 (30.7%) | 156 (69.3%) |
| Arts, Media & Entertainment | 0 (0.0%) | 10 (100.0%) |
| Health Diagnosing & Treating | 15 (14.6%) | 88 (85.4%) |
| Health Technologists | 10 (14.3%) | 60 (85.7%) |
| Total (Category) | 480 (46.9%) | 544 (53.1%) |
| Total (Overall) | 2,477 (56.3%) | 1,920 (43.7%) |
Services Occupations
The most common Services occupations in Switzerland County are Food Preparation & Serving (365 | 8.3%), Cleaning & Maintenance (197 | 4.5%), Personal Care & Service (190 | 4.3%), Healthcare Support (162 | 3.7%), and Security & Protection (59 | 1.3%).

Services Occupations by Sex
Within the Services occupations in Switzerland County, the most male-oriented occupations are Cleaning & Maintenance (75.6%), Law Enforcement (57.6%), and Security & Protection (52.5%), while the most female-oriented occupations are Healthcare Support (89.5%), Food Preparation & Serving (68.2%), and Personal Care & Service (66.8%).

| Occupation | Male | Female |
| Healthcare Support | 17 (10.5%) | 145 (89.5%) |
| Security & Protection | 31 (52.5%) | 28 (47.5%) |
| Firefighting & Prevention | 12 (46.2%) | 14 (53.8%) |
| Law Enforcement | 19 (57.6%) | 14 (42.4%) |
| Food Preparation & Serving | 116 (31.8%) | 249 (68.2%) |
| Cleaning & Maintenance | 149 (75.6%) | 48 (24.4%) |
| Personal Care & Service | 63 (33.2%) | 127 (66.8%) |
| Total (Category) | 376 (38.6%) | 597 (61.4%) |
| Total (Overall) | 2,477 (56.3%) | 1,920 (43.7%) |
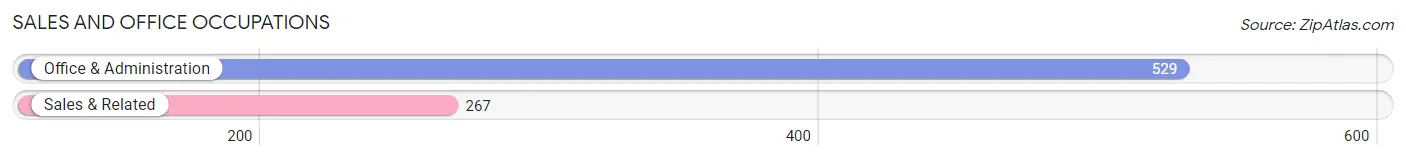
Sales and Office Occupations
The most common Sales and Office occupations in Switzerland County are Office & Administration (529 | 12.0%), and Sales & Related (267 | 6.1%).
Sales and Office Occupations by Sex

| Occupation | Male | Female |
| Sales & Related | 129 (48.3%) | 138 (51.7%) |
| Office & Administration | 155 (29.3%) | 374 (70.7%) |
| Total (Category) | 284 (35.7%) | 512 (64.3%) |
| Total (Overall) | 2,477 (56.3%) | 1,920 (43.7%) |
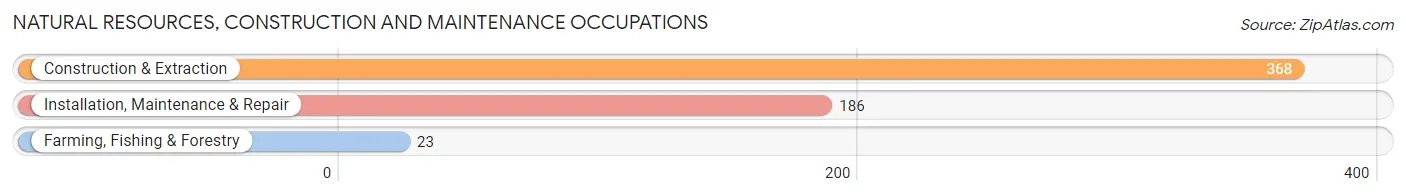
Natural Resources, Construction and Maintenance Occupations
The most common Natural Resources, Construction and Maintenance occupations in Switzerland County are Construction & Extraction (368 | 8.4%), Installation, Maintenance & Repair (186 | 4.2%), and Farming, Fishing & Forestry (23 | 0.5%).
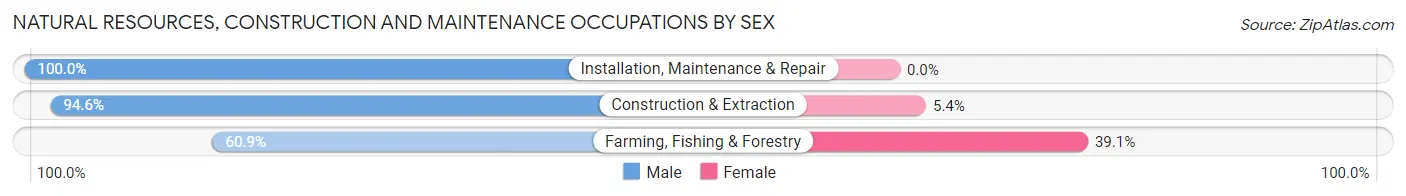
Natural Resources, Construction and Maintenance Occupations by Sex
| Occupation | Male | Female |
| Farming, Fishing & Forestry | 14 (60.9%) | 9 (39.1%) |
| Construction & Extraction | 348 (94.6%) | 20 (5.4%) |
| Installation, Maintenance & Repair | 186 (100.0%) | 0 (0.0%) |
| Total (Category) | 548 (95.0%) | 29 (5.0%) |
| Total (Overall) | 2,477 (56.3%) | 1,920 (43.7%) |
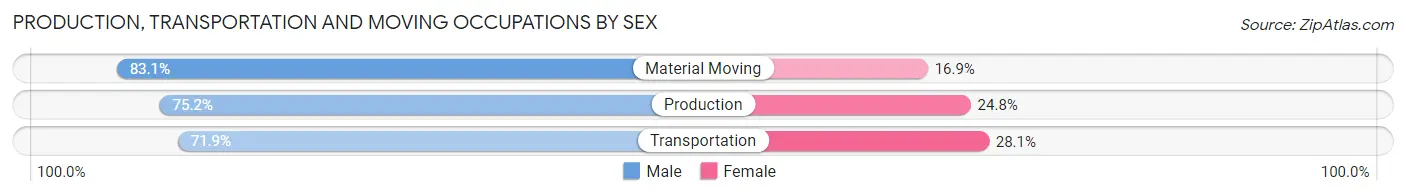
Production, Transportation and Moving Occupations
The most common Production, Transportation and Moving occupations in Switzerland County are Production (589 | 13.4%), Material Moving (278 | 6.3%), and Transportation (160 | 3.6%).

Production, Transportation and Moving Occupations by Sex
| Occupation | Male | Female |
| Production | 443 (75.2%) | 146 (24.8%) |
| Transportation | 115 (71.9%) | 45 (28.1%) |
| Material Moving | 231 (83.1%) | 47 (16.9%) |
| Total (Category) | 789 (76.8%) | 238 (23.2%) |
| Total (Overall) | 2,477 (56.3%) | 1,920 (43.7%) |
Employment Industries by Sex in Switzerland County
Employment Industries in Switzerland County
The major employment industries in Switzerland County include Manufacturing (1,089 | 24.8%), Arts, Entertainment & Recreation (520 | 11.8%), Construction (416 | 9.5%), Health Care & Social Assistance (331 | 7.5%), and Educational Services (322 | 7.3%).

Employment Industries by Sex in Switzerland County
The Switzerland County industries that see more men than women are Agriculture, Fishing & Hunting (100.0%), Construction (95.2%), and Transportation & Warehousing (91.4%), whereas the industries that tend to have a higher number of women are Information (100.0%), Finance & Insurance (92.7%), and Health Care & Social Assistance (87.0%).

| Industry | Male | Female |
| Agriculture, Fishing & Hunting | 130 (100.0%) | 0 (0.0%) |
| Mining, Quarrying, & Extraction | 0 (0.0%) | 0 (0.0%) |
| Construction | 396 (95.2%) | 20 (4.8%) |
| Manufacturing | 867 (79.6%) | 222 (20.4%) |
| Wholesale Trade | 21 (38.9%) | 33 (61.1%) |
| Retail Trade | 138 (47.7%) | 151 (52.2%) |
| Transportation & Warehousing | 170 (91.4%) | 16 (8.6%) |
| Utilities | 125 (83.9%) | 24 (16.1%) |
| Information | 0 (0.0%) | 5 (100.0%) |
| Finance & Insurance | 10 (7.3%) | 127 (92.7%) |
| Real Estate, Rental & Leasing | 8 (30.8%) | 18 (69.2%) |
| Professional & Scientific | 34 (40.0%) | 51 (60.0%) |
| Enterprise Management | 0 (0.0%) | 0 (0.0%) |
| Administrative & Support | 91 (71.1%) | 37 (28.9%) |
| Educational Services | 96 (29.8%) | 226 (70.2%) |
| Health Care & Social Assistance | 43 (13.0%) | 288 (87.0%) |
| Arts, Entertainment & Recreation | 134 (25.8%) | 386 (74.2%) |
| Accommodation & Food Services | 121 (40.9%) | 175 (59.1%) |
| Public Administration | 72 (50.3%) | 71 (49.6%) |
| Total | 2,477 (56.3%) | 1,920 (43.7%) |
Education in Switzerland County
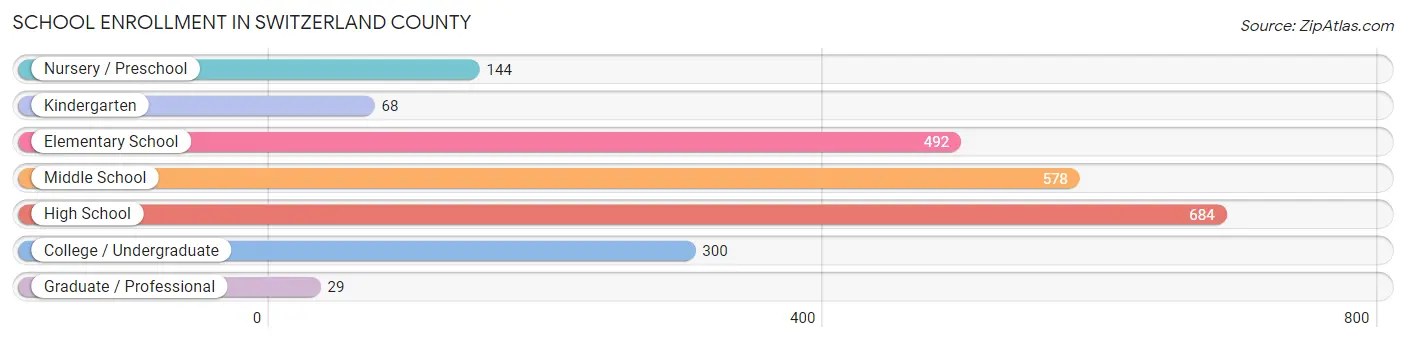
School Enrollment in Switzerland County
The most common levels of schooling among the 2,295 students in Switzerland County are high school (684 | 29.8%), middle school (578 | 25.2%), and elementary school (492 | 21.4%).
| School Level | # Students | % Students |
| Nursery / Preschool | 144 | 6.3% |
| Kindergarten | 68 | 3.0% |
| Elementary School | 492 | 21.4% |
| Middle School | 578 | 25.2% |
| High School | 684 | 29.8% |
| College / Undergraduate | 300 | 13.1% |
| Graduate / Professional | 29 | 1.3% |
| Total | 2,295 | 100.0% |
School Enrollment by Age by Funding Source in Switzerland County
Out of a total of 2,295 students who are enrolled in schools in Switzerland County, 275 (12.0%) attend a private institution, while the remaining 2,020 (88.0%) are enrolled in public schools. The age group of 3 to 4 year olds has the highest likelihood of being enrolled in private schools, with 26 (21.1% in the age bracket) enrolled. Conversely, the age group of 15 to 17 year olds has the lowest likelihood of being enrolled in a private school, with 445 (98.7% in the age bracket) attending a public institution.

| Age Bracket | Public School | Private School |
| 3 to 4 Year Olds | 97 (78.9%) | 26 (21.1%) |
| 5 to 9 Year Old | 464 (86.4%) | 73 (13.6%) |
| 10 to 14 Year Olds | 624 (84.2%) | 117 (15.8%) |
| 15 to 17 Year Olds | 445 (98.7%) | 6 (1.3%) |
| 18 to 19 Year Olds | 119 (93.0%) | 9 (7.0%) |
| 20 to 24 Year Olds | 148 (89.2%) | 18 (10.8%) |
| 25 to 34 Year Olds | 58 (80.6%) | 14 (19.4%) |
| 35 Years and over | 64 (83.1%) | 13 (16.9%) |
| Total | 2,020 (88.0%) | 275 (12.0%) |
Educational Attainment by Field of Study in Switzerland County
Education (161 | 20.3%), business (120 | 15.1%), liberal arts & history (105 | 13.2%), bio, nature & agricultural (90 | 11.3%), and science & technology (89 | 11.2%) are the most common fields of study among 794 individuals in Switzerland County who have obtained a bachelor's degree or higher.

| Field of Study | # Graduates | % Graduates |
| Computers & Mathematics | 8 | 1.0% |
| Bio, Nature & Agricultural | 90 | 11.3% |
| Physical & Health Sciences | 7 | 0.9% |
| Psychology | 33 | 4.2% |
| Social Sciences | 62 | 7.8% |
| Engineering | 19 | 2.4% |
| Multidisciplinary Studies | 3 | 0.4% |
| Science & Technology | 89 | 11.2% |
| Business | 120 | 15.1% |
| Education | 161 | 20.3% |
| Literature & Languages | 17 | 2.1% |
| Liberal Arts & History | 105 | 13.2% |
| Visual & Performing Arts | 14 | 1.8% |
| Communications | 31 | 3.9% |
| Arts & Humanities | 35 | 4.4% |
| Total | 794 | 100.0% |
Transportation & Commute in Switzerland County
Vehicle Availability by Sex in Switzerland County
The most prevalent vehicle ownership categories in Switzerland County are males with 2 vehicles (758, accounting for 30.6%) and females with 2 vehicles (625, making up 40.2%).
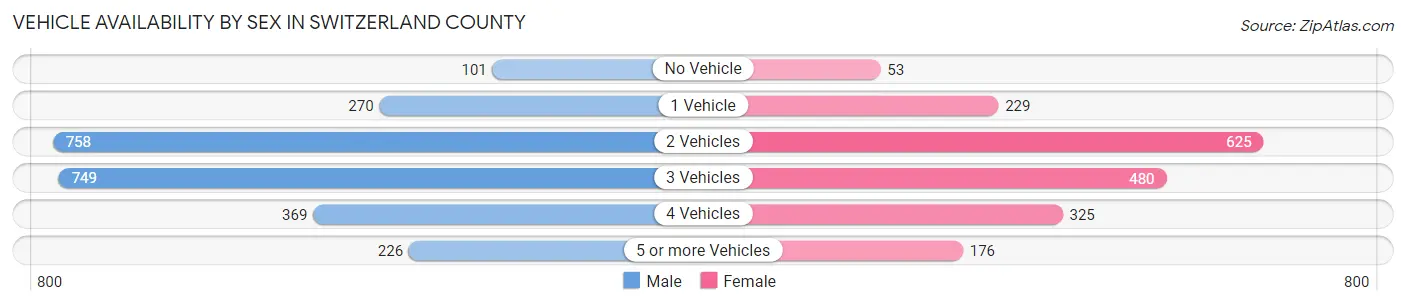
| Vehicles Available | Male | Female |
| No Vehicle | 101 (4.1%) | 53 (2.8%) |
| 1 Vehicle | 270 (10.9%) | 229 (12.1%) |
| 2 Vehicles | 758 (30.6%) | 625 (33.1%) |
| 3 Vehicles | 749 (30.3%) | 480 (25.4%) |
| 4 Vehicles | 369 (14.9%) | 325 (17.2%) |
| 5 or more Vehicles | 226 (9.1%) | 176 (9.3%) |
| Total | 2,473 (100.0%) | 1,888 (100.0%) |
Commute Time in Switzerland County
The most frequently occuring commute durations in Switzerland County are 30 to 34 minutes (585 commuters, 14.1%), 60 to 89 minutes (539 commuters, 13.0%), and 15 to 19 minutes (517 commuters, 12.4%).

| Commute Time | # Commuters | % Commuters |
| Less than 5 Minutes | 119 | 2.9% |
| 5 to 9 Minutes | 278 | 6.7% |
| 10 to 14 Minutes | 312 | 7.5% |
| 15 to 19 Minutes | 517 | 12.4% |
| 20 to 24 Minutes | 361 | 8.7% |
| 25 to 29 Minutes | 253 | 6.1% |
| 30 to 34 Minutes | 585 | 14.1% |
| 35 to 39 Minutes | 244 | 5.9% |
| 40 to 44 Minutes | 287 | 6.9% |
| 45 to 59 Minutes | 442 | 10.6% |
| 60 to 89 Minutes | 539 | 13.0% |
| 90 or more Minutes | 224 | 5.4% |
Commute Time by Sex in Switzerland County
The most common commute times in Switzerland County are 30 to 34 minutes (416 commuters, 17.4%) for males and 20 to 24 minutes (222 commuters, 12.5%) for females.
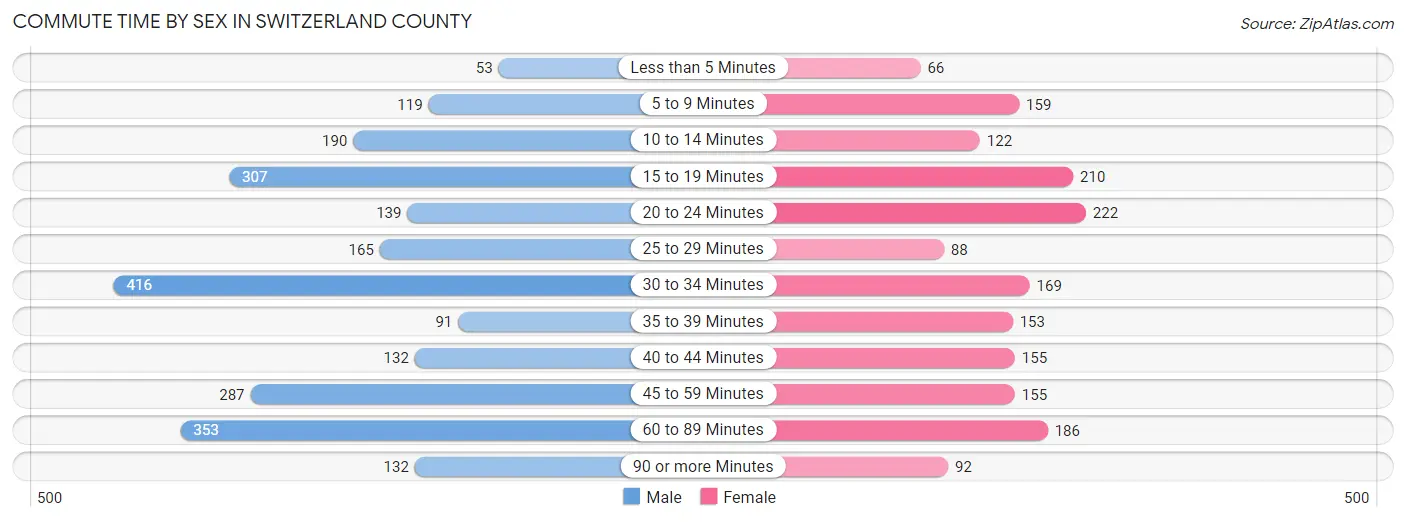
| Commute Time | Male | Female |
| Less than 5 Minutes | 53 (2.2%) | 66 (3.7%) |
| 5 to 9 Minutes | 119 (5.0%) | 159 (8.9%) |
| 10 to 14 Minutes | 190 (8.0%) | 122 (6.9%) |
| 15 to 19 Minutes | 307 (12.9%) | 210 (11.8%) |
| 20 to 24 Minutes | 139 (5.8%) | 222 (12.5%) |
| 25 to 29 Minutes | 165 (6.9%) | 88 (5.0%) |
| 30 to 34 Minutes | 416 (17.4%) | 169 (9.5%) |
| 35 to 39 Minutes | 91 (3.8%) | 153 (8.6%) |
| 40 to 44 Minutes | 132 (5.5%) | 155 (8.7%) |
| 45 to 59 Minutes | 287 (12.0%) | 155 (8.7%) |
| 60 to 89 Minutes | 353 (14.8%) | 186 (10.5%) |
| 90 or more Minutes | 132 (5.5%) | 92 (5.2%) |
Time of Departure to Work by Sex in Switzerland County
The most frequent times of departure to work in Switzerland County are 4:00 PM to 11:59 PM (366, 15.3%) for males and 7:30 AM to 7:59 AM (254, 14.3%) for females.

| Time of Departure | Male | Female |
| 12:00 AM to 4:59 AM | 135 (5.7%) | 118 (6.6%) |
| 5:00 AM to 5:29 AM | 302 (12.7%) | 141 (7.9%) |
| 5:30 AM to 5:59 AM | 233 (9.8%) | 166 (9.3%) |
| 6:00 AM to 6:29 AM | 294 (12.3%) | 194 (10.9%) |
| 6:30 AM to 6:59 AM | 220 (9.2%) | 94 (5.3%) |
| 7:00 AM to 7:29 AM | 297 (12.5%) | 153 (8.6%) |
| 7:30 AM to 7:59 AM | 110 (4.6%) | 254 (14.3%) |
| 8:00 AM to 8:29 AM | 203 (8.5%) | 95 (5.3%) |
| 8:30 AM to 8:59 AM | 19 (0.8%) | 38 (2.1%) |
| 9:00 AM to 9:59 AM | 46 (1.9%) | 52 (2.9%) |
| 10:00 AM to 10:59 AM | 14 (0.6%) | 32 (1.8%) |
| 11:00 AM to 11:59 AM | 19 (0.8%) | 83 (4.7%) |
| 12:00 PM to 3:59 PM | 126 (5.3%) | 144 (8.1%) |
| 4:00 PM to 11:59 PM | 366 (15.3%) | 213 (12.0%) |
| Total | 2,384 (100.0%) | 1,777 (100.0%) |
Housing Occupancy in Switzerland County
Occupancy by Ownership in Switzerland County
Of the total 3,783 dwellings in Switzerland County, owner-occupied units account for 3,003 (79.4%), while renter-occupied units make up 780 (20.6%).
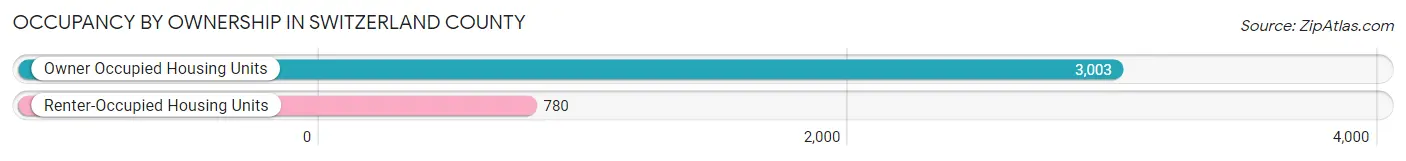
| Occupancy | # Housing Units | % Housing Units |
| Owner Occupied Housing Units | 3,003 | 79.4% |
| Renter-Occupied Housing Units | 780 | 20.6% |
| Total Occupied Housing Units | 3,783 | 100.0% |
Occupancy by Household Size in Switzerland County

| Household Size | # Housing Units | % Housing Units |
| 1-Person Household | 1,116 | 29.5% |
| 2-Person Household | 1,281 | 33.9% |
| 3-Person Household | 561 | 14.8% |
| 4+ Person Household | 825 | 21.8% |
| Total Housing Units | 3,783 | 100.0% |
Occupancy by Ownership by Household Size in Switzerland County
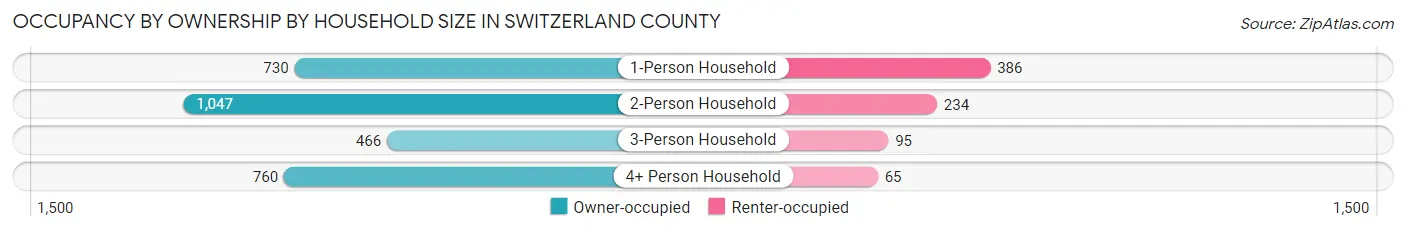
| Household Size | Owner-occupied | Renter-occupied |
| 1-Person Household | 730 (65.4%) | 386 (34.6%) |
| 2-Person Household | 1,047 (81.7%) | 234 (18.3%) |
| 3-Person Household | 466 (83.1%) | 95 (16.9%) |
| 4+ Person Household | 760 (92.1%) | 65 (7.9%) |
| Total Housing Units | 3,003 (79.4%) | 780 (20.6%) |
Occupancy by Educational Attainment in Switzerland County

| Household Size | Owner-occupied | Renter-occupied |
| Less than High School | 328 (71.6%) | 130 (28.4%) |
| High School Diploma | 1,513 (82.2%) | 327 (17.8%) |
| College/Associate Degree | 834 (74.9%) | 280 (25.1%) |
| Bachelor's Degree or higher | 328 (88.4%) | 43 (11.6%) |
Occupancy by Age of Householder in Switzerland County

| Age Bracket | # Households | % Households |
| Under 35 Years | 488 | 12.9% |
| 35 to 44 Years | 520 | 13.8% |
| 45 to 54 Years | 712 | 18.8% |
| 55 to 64 Years | 846 | 22.4% |
| 65 to 74 Years | 698 | 18.4% |
| 75 to 84 Years | 314 | 8.3% |
| 85 Years and Over | 205 | 5.4% |
| Total | 3,783 | 100.0% |
Housing Finances in Switzerland County
Median Income by Occupancy in Switzerland County

| Occupancy Type | # Households | Median Income |
| Owner-Occupied | 3,003 (79.4%) | $72,564 |
| Renter-Occupied | 780 (20.6%) | $29,280 |
| Average | 3,783 (100.0%) | $66,525 |
Occupancy by Householder Income Bracket in Switzerland County

| Income Bracket | Owner-occupied | Renter-occupied |
| Less than $5,000 | 23 (0.8%) | 38 (4.9%) |
| $5,000 to $9,999 | 0 (0.0%) | 83 (10.6%) |
| $10,000 to $14,999 | 117 (3.9%) | 29 (3.7%) |
| $15,000 to $19,999 | 94 (3.1%) | 106 (13.6%) |
| $20,000 to $24,999 | 46 (1.5%) | 52 (6.7%) |
| $25,000 to $34,999 | 287 (9.6%) | 114 (14.6%) |
| $35,000 to $49,999 | 278 (9.3%) | 141 (18.1%) |
| $50,000 to $74,999 | 789 (26.3%) | 73 (9.4%) |
| $75,000 to $99,999 | 555 (18.5%) | 69 (8.8%) |
| $100,000 to $149,999 | 486 (16.2%) | 72 (9.2%) |
| $150,000 or more | 328 (10.9%) | 3 (0.4%) |
| Total | 3,003 (100.0%) | 780 (100.0%) |
Monthly Housing Cost Tiers in Switzerland County

| Monthly Cost | Owner-occupied | Renter-occupied |
| Less than $300 | 188 (6.3%) | 83 (10.6%) |
| $300 to $499 | 610 (20.3%) | 102 (13.1%) |
| $500 to $799 | 534 (17.8%) | 281 (36.0%) |
| $800 to $999 | 322 (10.7%) | 58 (7.4%) |
| $1,000 to $1,499 | 743 (24.7%) | 125 (16.0%) |
| $1,500 to $1,999 | 347 (11.6%) | 0 (0.0%) |
| $2,000 to $2,499 | 162 (5.4%) | 5 (0.6%) |
| $2,500 to $2,999 | 71 (2.4%) | 0 (0.0%) |
| $3,000 or more | 26 (0.9%) | 3 (0.4%) |
| Total | 3,003 (100.0%) | 780 (100.0%) |
Physical Housing Characteristics in Switzerland County
Housing Structures in Switzerland County
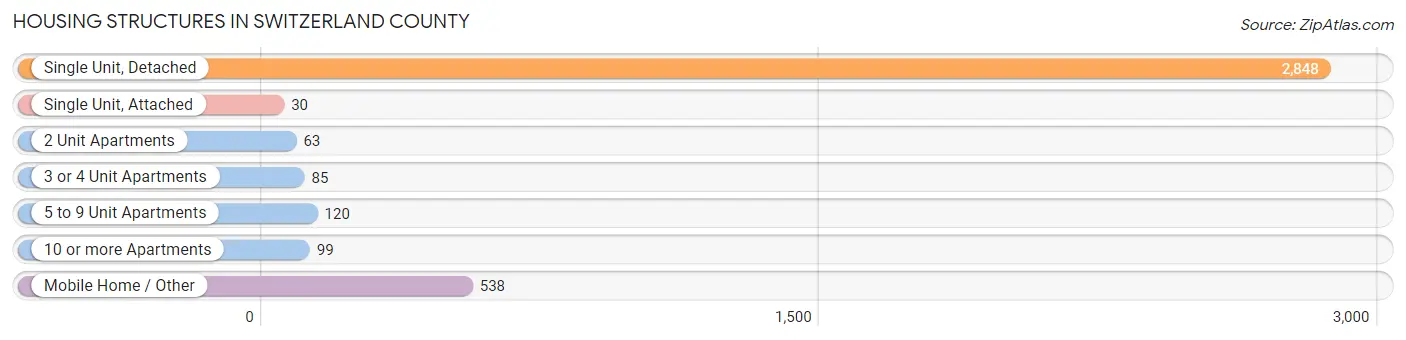
| Structure Type | # Housing Units | % Housing Units |
| Single Unit, Detached | 2,848 | 75.3% |
| Single Unit, Attached | 30 | 0.8% |
| 2 Unit Apartments | 63 | 1.7% |
| 3 or 4 Unit Apartments | 85 | 2.2% |
| 5 to 9 Unit Apartments | 120 | 3.2% |
| 10 or more Apartments | 99 | 2.6% |
| Mobile Home / Other | 538 | 14.2% |
| Total | 3,783 | 100.0% |
Housing Structures by Occupancy in Switzerland County
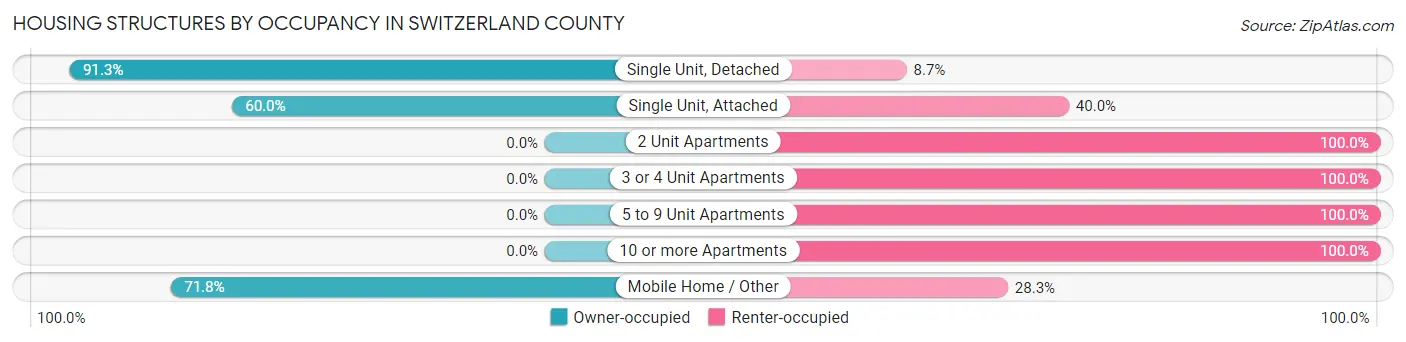
| Structure Type | Owner-occupied | Renter-occupied |
| Single Unit, Detached | 2,599 (91.3%) | 249 (8.7%) |
| Single Unit, Attached | 18 (60.0%) | 12 (40.0%) |
| 2 Unit Apartments | 0 (0.0%) | 63 (100.0%) |
| 3 or 4 Unit Apartments | 0 (0.0%) | 85 (100.0%) |
| 5 to 9 Unit Apartments | 0 (0.0%) | 120 (100.0%) |
| 10 or more Apartments | 0 (0.0%) | 99 (100.0%) |
| Mobile Home / Other | 386 (71.8%) | 152 (28.2%) |
| Total | 3,003 (79.4%) | 780 (20.6%) |
Housing Structures by Number of Rooms in Switzerland County

| Number of Rooms | Owner-occupied | Renter-occupied |
| 1 Room | 5 (0.2%) | 13 (1.7%) |
| 2 or 3 Rooms | 88 (2.9%) | 250 (32.1%) |
| 4 or 5 Rooms | 956 (31.8%) | 399 (51.1%) |
| 6 or 7 Rooms | 1,105 (36.8%) | 64 (8.2%) |
| 8 or more Rooms | 849 (28.3%) | 54 (6.9%) |
| Total | 3,003 (100.0%) | 780 (100.0%) |
Housing Structure by Heating Type in Switzerland County
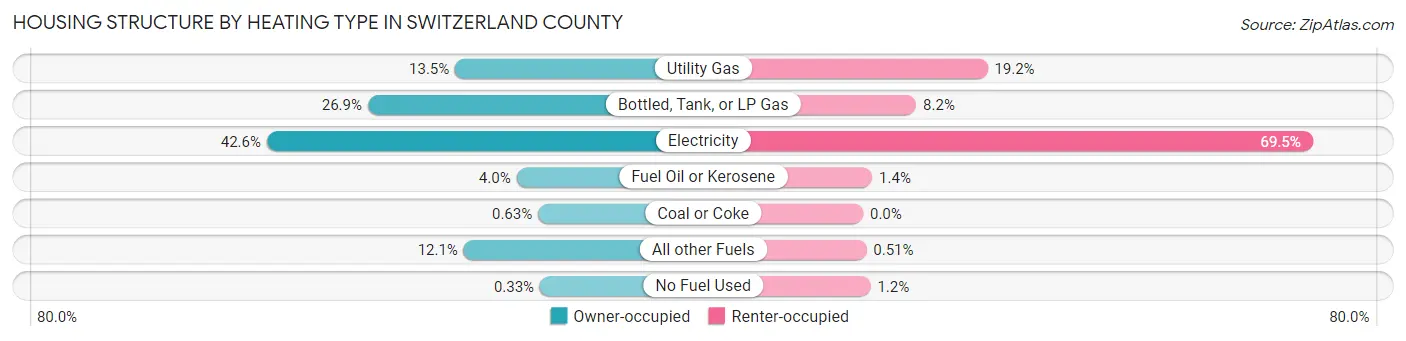
| Heating Type | Owner-occupied | Renter-occupied |
| Utility Gas | 404 (13.5%) | 150 (19.2%) |
| Bottled, Tank, or LP Gas | 809 (26.9%) | 64 (8.2%) |
| Electricity | 1,278 (42.6%) | 542 (69.5%) |
| Fuel Oil or Kerosene | 119 (4.0%) | 11 (1.4%) |
| Coal or Coke | 19 (0.6%) | 0 (0.0%) |
| All other Fuels | 364 (12.1%) | 4 (0.5%) |
| No Fuel Used | 10 (0.3%) | 9 (1.1%) |
| Total | 3,003 (100.0%) | 780 (100.0%) |
Household Vehicle Usage in Switzerland County
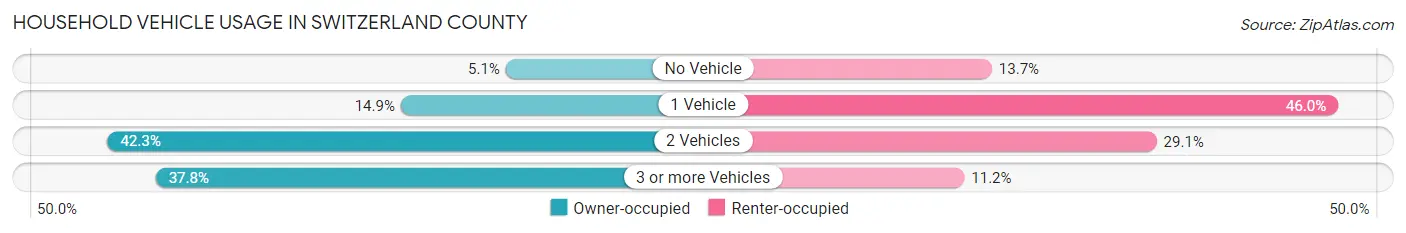
| Vehicles per Household | Owner-occupied | Renter-occupied |
| No Vehicle | 153 (5.1%) | 107 (13.7%) |
| 1 Vehicle | 447 (14.9%) | 359 (46.0%) |
| 2 Vehicles | 1,269 (42.3%) | 227 (29.1%) |
| 3 or more Vehicles | 1,134 (37.8%) | 87 (11.2%) |
| Total | 3,003 (100.0%) | 780 (100.0%) |
Real Estate & Mortgages in Switzerland County
Real Estate and Mortgage Overview in Switzerland County
| Characteristic | Without Mortgage | With Mortgage |
| Housing Units | 1,275 | 1,728 |
| Median Property Value | $132,900 | $181,800 |
| Median Household Income | $56,738 | $231 |
| Monthly Housing Costs | $465 | $26 |
| Real Estate Taxes | $602 | $55 |
Property Value by Mortgage Status in Switzerland County
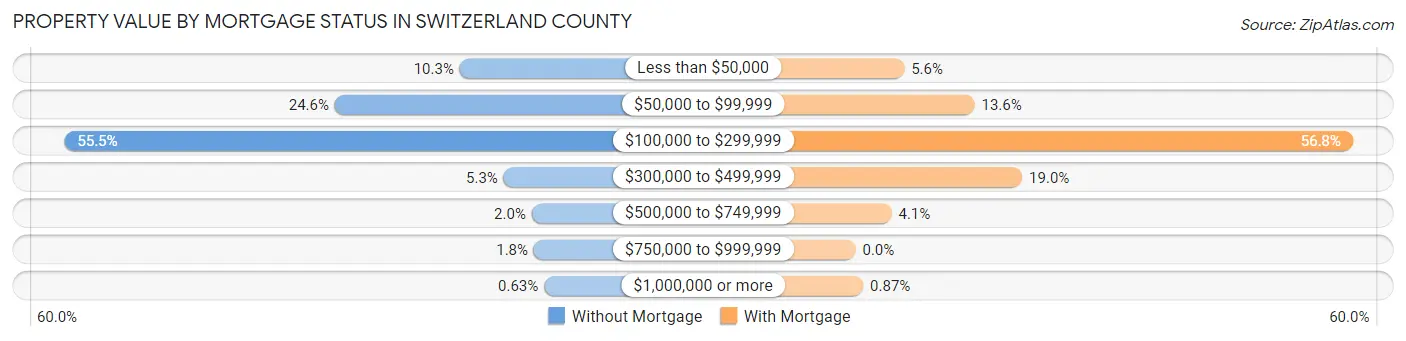
| Property Value | Without Mortgage | With Mortgage |
| Less than $50,000 | 131 (10.3%) | 96 (5.6%) |
| $50,000 to $99,999 | 313 (24.5%) | 235 (13.6%) |
| $100,000 to $299,999 | 707 (55.4%) | 982 (56.8%) |
| $300,000 to $499,999 | 67 (5.2%) | 329 (19.0%) |
| $500,000 to $749,999 | 26 (2.0%) | 71 (4.1%) |
| $750,000 to $999,999 | 23 (1.8%) | 0 (0.0%) |
| $1,000,000 or more | 8 (0.6%) | 15 (0.9%) |
| Total | 1,275 (100.0%) | 1,728 (100.0%) |
Household Income by Mortgage Status in Switzerland County

| Household Income | Without Mortgage | With Mortgage |
| Less than $10,000 | 23 (1.8%) | 22 (1.3%) |
| $10,000 to $24,999 | 165 (12.9%) | 0 (0.0%) |
| $25,000 to $34,999 | 212 (16.6%) | 92 (5.3%) |
| $35,000 to $49,999 | 128 (10.0%) | 75 (4.3%) |
| $50,000 to $74,999 | 455 (35.7%) | 150 (8.7%) |
| $75,000 to $99,999 | 132 (10.3%) | 334 (19.3%) |
| $100,000 to $149,999 | 63 (4.9%) | 423 (24.5%) |
| $150,000 or more | 97 (7.6%) | 423 (24.5%) |
| Total | 1,275 (100.0%) | 1,728 (100.0%) |
Property Value to Household Income Ratio in Switzerland County

| Value-to-Income Ratio | Without Mortgage | With Mortgage |
| Less than 2.0x | 498 (39.1%) | 90,299 (5,225.6%) |
| 2.0x to 2.9x | 225 (17.6%) | 710 (41.1%) |
| 3.0x to 3.9x | 134 (10.5%) | 454 (26.3%) |
| 4.0x or more | 410 (32.2%) | 227 (13.1%) |
| Total | 1,275 (100.0%) | 1,728 (100.0%) |
Real Estate Taxes by Mortgage Status in Switzerland County
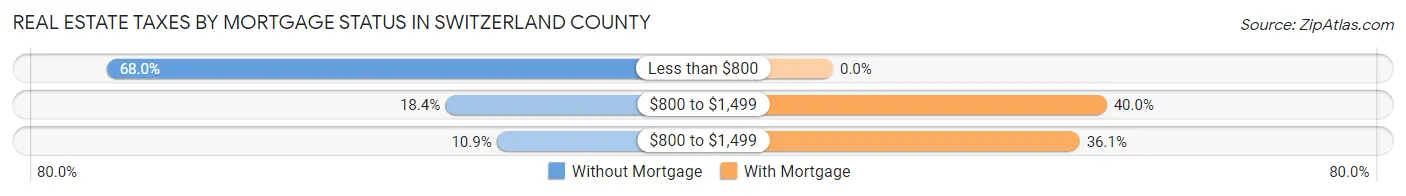
| Property Taxes | Without Mortgage | With Mortgage |
| Less than $800 | 867 (68.0%) | 0 (0.0%) |
| $800 to $1,499 | 235 (18.4%) | 691 (40.0%) |
| $800 to $1,499 | 139 (10.9%) | 623 (36.0%) |
| Total | 1,275 (100.0%) | 1,728 (100.0%) |
Health & Disability in Switzerland County
Health Insurance Coverage by Age in Switzerland County

| Age Bracket | With Coverage | Without Coverage |
| Under 6 Years | 603 (92.8%) | 47 (7.2%) |
| 6 to 18 Years | 1,593 (84.2%) | 299 (15.8%) |
| 19 to 25 Years | 542 (83.4%) | 108 (16.6%) |
| 26 to 34 Years | 790 (82.8%) | 164 (17.2%) |
| 35 to 44 Years | 987 (77.3%) | 290 (22.7%) |
| 45 to 54 Years | 1,152 (92.7%) | 90 (7.2%) |
| 55 to 64 Years | 1,128 (80.6%) | 271 (19.4%) |
| 65 to 74 Years | 1,016 (99.0%) | 10 (1.0%) |
| 75 Years and older | 705 (100.0%) | 0 (0.0%) |
| Total | 8,516 (86.9%) | 1,279 (13.1%) |
Health Insurance Coverage by Citizenship Status in Switzerland County

| Citizenship Status | With Coverage | Without Coverage |
| Native Born | 603 (92.8%) | 47 (7.2%) |
| Foreign Born, Citizen | 1,593 (84.2%) | 299 (15.8%) |
| Foreign Born, not a Citizen | 542 (83.4%) | 108 (16.6%) |
Health Insurance Coverage by Household Income in Switzerland County
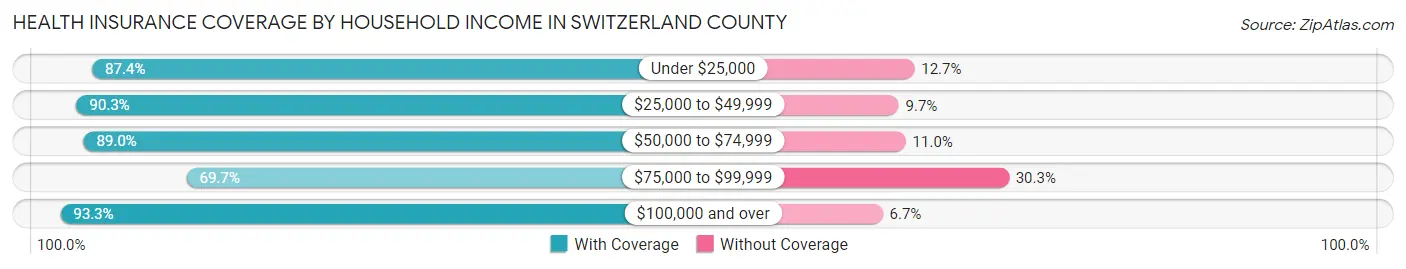
| Household Income | With Coverage | Without Coverage |
| Under $25,000 | 808 (87.4%) | 117 (12.7%) |
| $25,000 to $49,999 | 1,479 (90.3%) | 159 (9.7%) |
| $50,000 to $74,999 | 1,943 (89.0%) | 241 (11.0%) |
| $75,000 to $99,999 | 1,249 (69.7%) | 544 (30.3%) |
| $100,000 and over | 3,033 (93.3%) | 218 (6.7%) |
Public vs Private Health Insurance Coverage by Age in Switzerland County
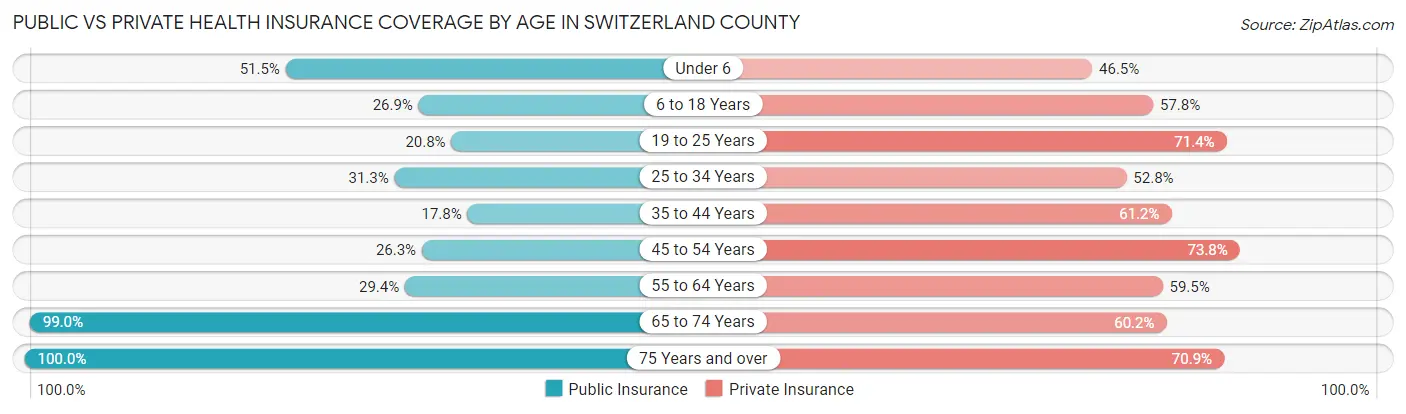
| Age Bracket | Public Insurance | Private Insurance |
| Under 6 | 335 (51.5%) | 302 (46.5%) |
| 6 to 18 Years | 508 (26.9%) | 1,093 (57.8%) |
| 19 to 25 Years | 135 (20.8%) | 464 (71.4%) |
| 25 to 34 Years | 299 (31.3%) | 504 (52.8%) |
| 35 to 44 Years | 227 (17.8%) | 781 (61.2%) |
| 45 to 54 Years | 326 (26.3%) | 917 (73.8%) |
| 55 to 64 Years | 411 (29.4%) | 833 (59.5%) |
| 65 to 74 Years | 1,016 (99.0%) | 618 (60.2%) |
| 75 Years and over | 705 (100.0%) | 500 (70.9%) |
| Total | 3,962 (40.5%) | 6,012 (61.4%) |
Disability Status by Sex by Age in Switzerland County
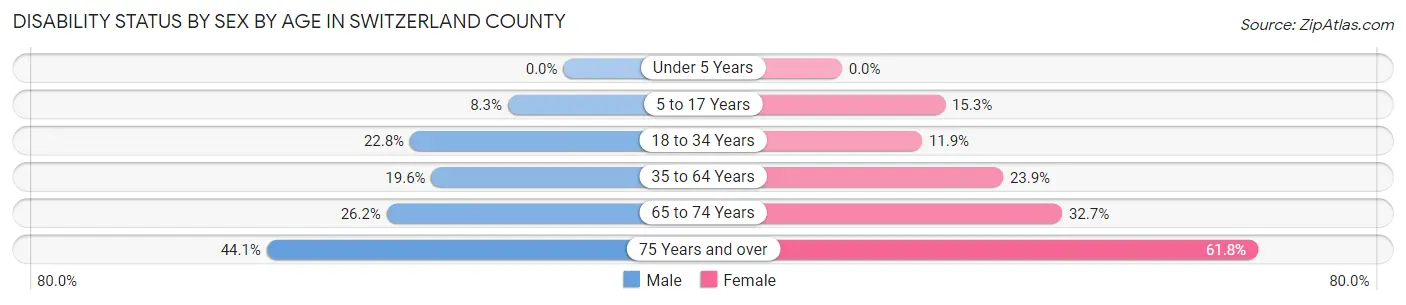
| Age Bracket | Male | Female |
| Under 5 Years | 0 (0.0%) | 0 (0.0%) |
| 5 to 17 Years | 79 (8.3%) | 138 (15.3%) |
| 18 to 34 Years | 203 (22.8%) | 102 (11.9%) |
| 35 to 64 Years | 387 (19.6%) | 465 (23.9%) |
| 65 to 74 Years | 144 (26.2%) | 156 (32.7%) |
| 75 Years and over | 148 (44.1%) | 228 (61.8%) |
Disability Class by Sex by Age in Switzerland County
Disability Class: Hearing Difficulty
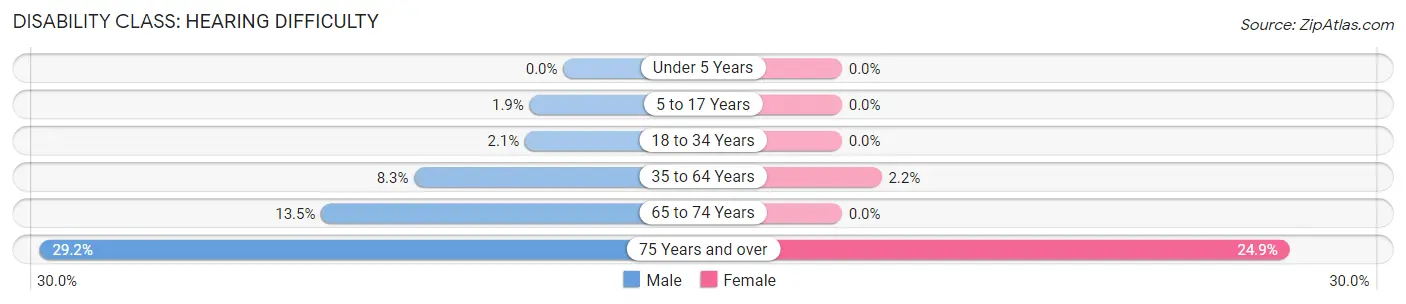
| Age Bracket | Male | Female |
| Under 5 Years | 0 (0.0%) | 0 (0.0%) |
| 5 to 17 Years | 18 (1.9%) | 0 (0.0%) |
| 18 to 34 Years | 19 (2.1%) | 0 (0.0%) |
| 35 to 64 Years | 164 (8.3%) | 43 (2.2%) |
| 65 to 74 Years | 74 (13.5%) | 0 (0.0%) |
| 75 Years and over | 98 (29.2%) | 92 (24.9%) |
Disability Class: Vision Difficulty
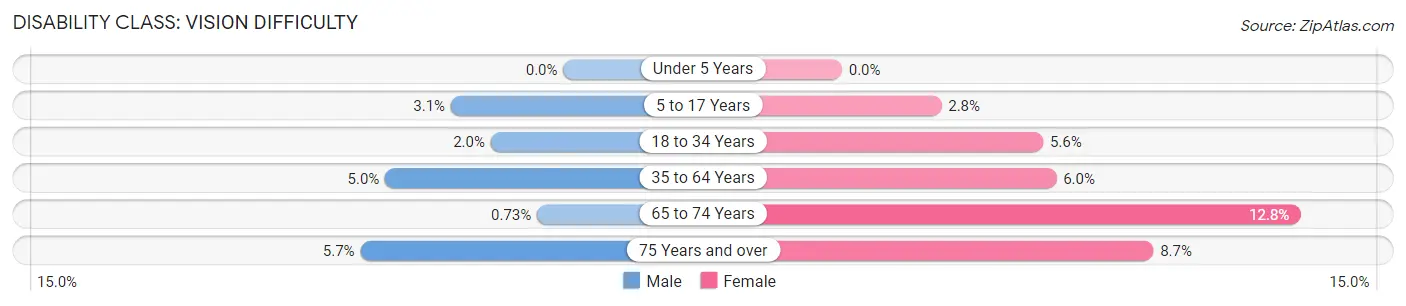
| Age Bracket | Male | Female |
| Under 5 Years | 0 (0.0%) | 0 (0.0%) |
| 5 to 17 Years | 30 (3.1%) | 25 (2.8%) |
| 18 to 34 Years | 18 (2.0%) | 48 (5.6%) |
| 35 to 64 Years | 98 (5.0%) | 116 (6.0%) |
| 65 to 74 Years | 4 (0.7%) | 61 (12.8%) |
| 75 Years and over | 19 (5.7%) | 32 (8.7%) |
Disability Class: Cognitive Difficulty
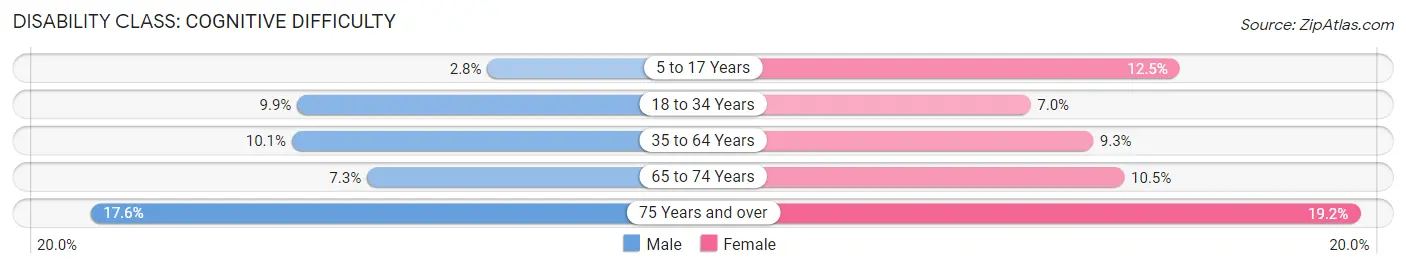
| Age Bracket | Male | Female |
| 5 to 17 Years | 27 (2.8%) | 113 (12.5%) |
| 18 to 34 Years | 88 (9.9%) | 60 (7.0%) |
| 35 to 64 Years | 199 (10.1%) | 181 (9.3%) |
| 65 to 74 Years | 40 (7.3%) | 50 (10.5%) |
| 75 Years and over | 59 (17.6%) | 71 (19.2%) |
Disability Class: Ambulatory Difficulty
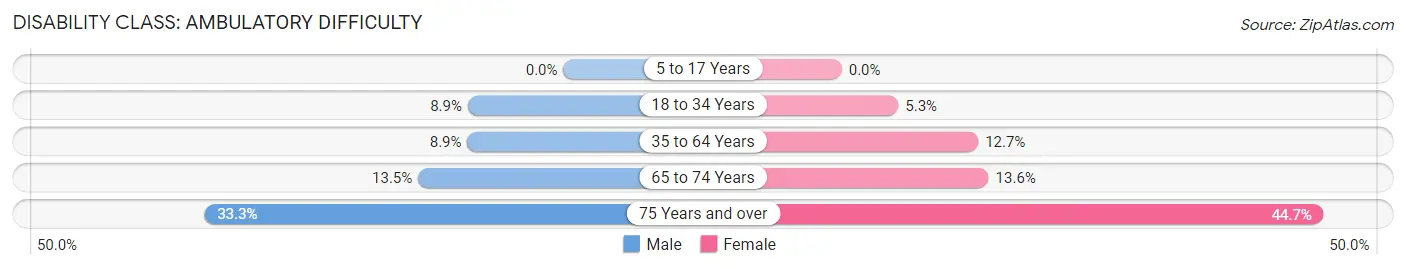
| Age Bracket | Male | Female |
| 5 to 17 Years | 0 (0.0%) | 0 (0.0%) |
| 18 to 34 Years | 79 (8.9%) | 45 (5.2%) |
| 35 to 64 Years | 176 (8.9%) | 246 (12.7%) |
| 65 to 74 Years | 74 (13.5%) | 65 (13.6%) |
| 75 Years and over | 112 (33.3%) | 165 (44.7%) |
Disability Class: Self-Care Difficulty

| Age Bracket | Male | Female |
| 5 to 17 Years | 0 (0.0%) | 0 (0.0%) |
| 18 to 34 Years | 48 (5.4%) | 24 (2.8%) |
| 35 to 64 Years | 63 (3.2%) | 44 (2.3%) |
| 65 to 74 Years | 10 (1.8%) | 18 (3.8%) |
| 75 Years and over | 15 (4.5%) | 37 (10.0%) |
Technology Access in Switzerland County
Computing Device Access in Switzerland County

| Device Type | # Households | % Households |
| Desktop or Laptop | 2,273 | 60.1% |
| Smartphone | 2,849 | 75.3% |
| Tablet | 1,686 | 44.6% |
| No Computing Device | 687 | 18.2% |
| Total | 3,783 | 100.0% |
Internet Access in Switzerland County
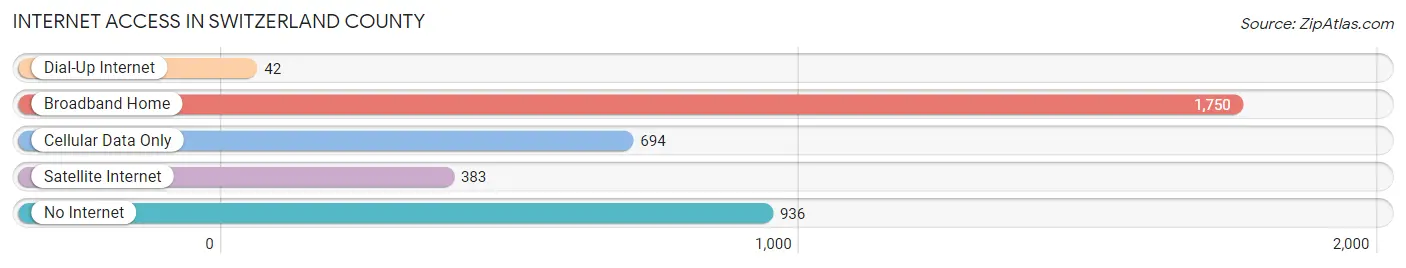
| Internet Type | # Households | % Households |
| Dial-Up Internet | 42 | 1.1% |
| Broadband Home | 1,750 | 46.3% |
| Cellular Data Only | 694 | 18.3% |
| Satellite Internet | 383 | 10.1% |
| No Internet | 936 | 24.7% |
| Total | 3,783 | 100.0% |
Switzerland County Summary
Switzerland County, Indiana is located in the southeastern corner of the state, along the Ohio River. It is bordered by Ohio to the east, Dearborn County to the north, Jefferson County to the west, and Ripley County to the south. The county seat is Vevay, and the county was named after the Swiss canton of the same name.
History
Switzerland County was formed in 1814 from parts of Dearborn and Ohio counties. The county was named after the Swiss canton of the same name, in honor of the many Swiss settlers who had come to the area. The first county seat was located in the town of Vevay, which was founded in 1802.
The county was an important center of the Underground Railroad, with many Quaker and Methodist families providing shelter and assistance to escaped slaves. The county was also home to the first African-American church in Indiana, the African Methodist Episcopal Church, which was founded in 1836.
Geography
Switzerland County is located in the southeastern corner of Indiana, along the Ohio River. It is bordered by Ohio to the east, Dearborn County to the north, Jefferson County to the west, and Ripley County to the south. The county has a total area of 246 square miles, of which 241 square miles is land and 5 square miles is water.
The county is mostly flat, with some rolling hills in the northern part of the county. The highest point in the county is located in the town of Florence, at an elevation of 845 feet. The county is drained by the Ohio River and its tributaries, including the East Fork of the Whitewater River, the West Fork of the Whitewater River, and the Patoka River.
Economy
The economy of Switzerland County is largely based on agriculture and tourism. The county is home to several wineries, including the Swiss Wine Festival, which is held annually in Vevay. The county is also home to several historic sites, including the Belterra Casino Resort and the Switzerland County Historical Museum.
The county is also home to several manufacturing companies, including the Swiss Valley Farms dairy processing plant and the Vevay Manufacturing Company. The county is also home to several small businesses, including restaurants, retail stores, and service providers.
Demographics
As of the 2010 census, Switzerland County had a population of 10,613. The racial makeup of the county was 97.3% White, 0.7% African American, 0.2% Native American, 0.3% Asian, 0.1% Pacific Islander, 0.4% from other races, and 1.0% from two or more races. Hispanic or Latino of any race were 1.3% of the population.
The median income for a household in the county was $41,945, and the median income for a family was $50,945. The per capita income for the county was $20,945. About 11.2% of families and 14.2% of the population were below the poverty line, including 19.2% of those under age 18 and 8.2% of those age 65 or over.
Common Questions
What is the Total Population of Switzerland County?
Total Population of Switzerland County is 9,896.
What is the Total Male Population of Switzerland County?
Total Male Population of Switzerland County is 5,046.
What is the Total Female Population of Switzerland County?
Total Female Population of Switzerland County is 4,850.
What is the Ratio of Males per 100 Females in Switzerland County?
There are 104.04 Males per 100 Females in Switzerland County.
What is the Ratio of Females per 100 Males in Switzerland County?
There are 96.12 Females per 100 Males in Switzerland County.
What is the Median Population Age in Switzerland County?
Median Population Age in Switzerland County is 40.8 Years.
What is the Average Family Size in Switzerland County
Average Family Size in Switzerland County is 3.3 People.
What is the Average Household Size in Switzerland County
Average Household Size in Switzerland County is 2.6 People.
What is Per Capita Income in Switzerland County?
Per Capita income in Switzerland County is $29,202.
What is the Median Family Income in Switzerland County?
Median Family Income in Switzerland County is $74,387.
What is the Median Household income in Switzerland County?
Median Household Income in Switzerland County is $66,525.
What is Income or Wage Gap in Switzerland County?
Income or Wage Gap in Switzerland County is 36.9%.
Women in Switzerland County earn 63.1 cents for every dollar earned by a man.
What is Family Income Deficit in Switzerland County?
Family Income Deficit in Switzerland County is $8,471.
Families that are below poverty line in Switzerland County earn $8,471 less on average than the poverty threshold level.
What is Inequality or Gini Index in Switzerland County?
Inequality or Gini Index in Switzerland County is 0.38.
How Large is the Labor Force in Switzerland County?
There are 4,603 People in the Labor Forcein in Switzerland County.
What is the Percentage of People in the Labor Force in Switzerland County?
58.8% of People are in the Labor Force in Switzerland County.
What is the Unemployment Rate in Switzerland County?
Unemployment Rate in Switzerland County is 4.4%.