Sullivan County, IN
Sullivan County Map

Sullivan County Overview
20,791
TOTAL POPULATION
11,140
MALE POPULATION
9,651
FEMALE POPULATION
115.43
MALES / 100 FEMALES
86.63
FEMALES / 100 MALES
40.9
MEDIAN AGE
2.9
AVG FAMILY SIZE
2.4
AVG HOUSEHOLD SIZE
$27,792
PER CAPITA INCOME
$70,981
AVG FAMILY INCOME
$54,556
AVG HOUSEHOLD INCOME
27.1%
WAGE / INCOME GAP [ % ]
72.9¢/ $1
WAGE / INCOME GAP [ $ ]
$12,093
FAMILY INCOME DEFICIT
0.41
INEQUALITY / GINI INDEX
9,408
LABOR FORCE [ PEOPLE ]
54.9%
PERCENT IN LABOR FORCE
5.0%
UNEMPLOYMENT RATE
Sullivan County Area Codes
Race in Sullivan County
The most populous races in Sullivan County are White / Caucasian (18,990 | 91.3%), Two or more Races (835 | 4.0%), and Black / African American (754 | 3.6%).

| Race | # Population | % Population |
| Asian | 23 | 0.1% |
| Black / African American | 754 | 3.6% |
| Hawaiian / Pacific | 6 | 0.0% |
| Hispanic or Latino | 374 | 1.8% |
| Native / Alaskan | 15 | 0.1% |
| White / Caucasian | 18,990 | 91.3% |
| Two or more Races | 835 | 4.0% |
| Some other Race | 168 | 0.8% |
| Total | 20,791 | 100.0% |
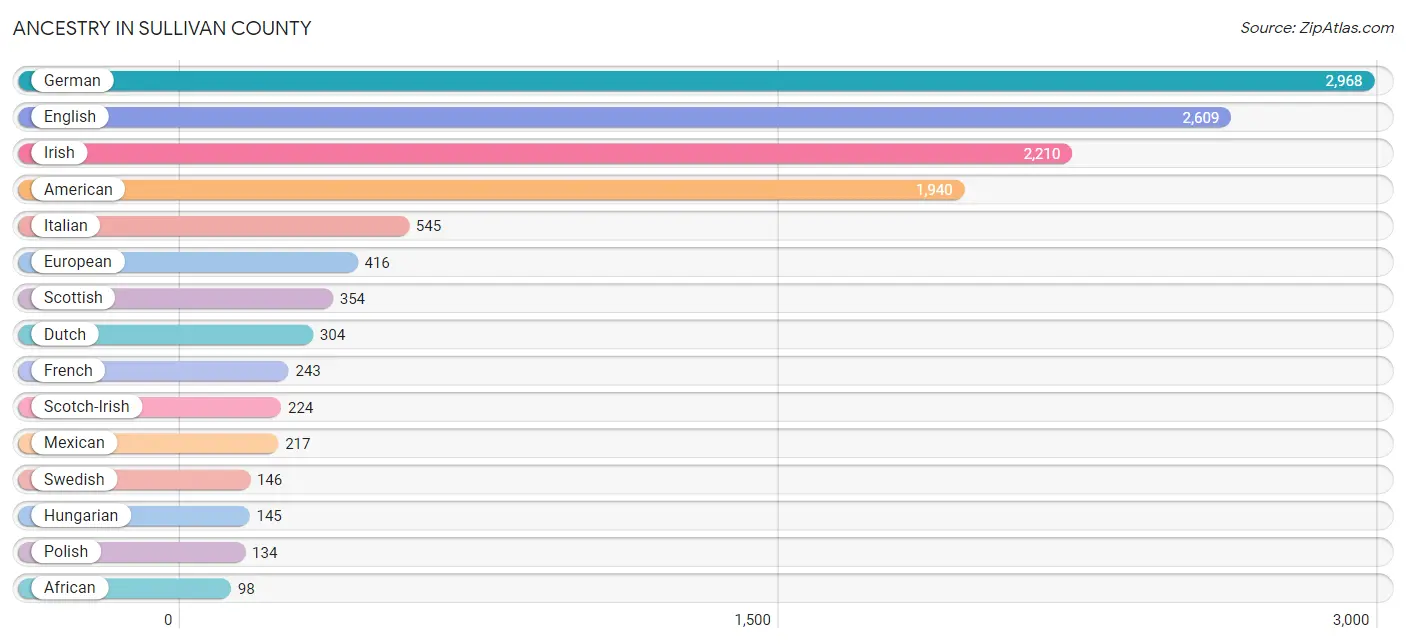
Ancestry in Sullivan County
The most populous ancestries reported in Sullivan County are German (2,968 | 14.3%), English (2,609 | 12.6%), Irish (2,210 | 10.6%), American (1,940 | 9.3%), and Italian (545 | 2.6%), together accounting for 49.4% of all Sullivan County residents.
| Ancestry | # Population | % Population |
| African | 98 | 0.5% |
| American | 1,940 | 9.3% |
| Arab | 11 | 0.1% |
| Austrian | 17 | 0.1% |
| Bangladeshi | 5 | 0.0% |
| Belizean | 18 | 0.1% |
| Blackfeet | 36 | 0.2% |
| British | 51 | 0.3% |
| Canadian | 4 | 0.0% |
| Central American | 12 | 0.1% |
| Cherokee | 54 | 0.3% |
| Chippewa | 4 | 0.0% |
| Colombian | 94 | 0.4% |
| Croatian | 8 | 0.0% |
| Czechoslovakian | 1 | 0.0% |
| Dutch | 304 | 1.5% |
| Eastern European | 15 | 0.1% |
| English | 2,609 | 12.6% |
| European | 416 | 2.0% |
| French | 243 | 1.2% |
| French Canadian | 14 | 0.1% |
| German | 2,968 | 14.3% |
| Greek | 34 | 0.2% |
| Guatemalan | 12 | 0.1% |
| Haitian | 30 | 0.1% |
| Hungarian | 145 | 0.7% |
| Irish | 2,210 | 10.6% |
| Iroquois | 2 | 0.0% |
| Italian | 545 | 2.6% |
| Jamaican | 6 | 0.0% |
| Korean | 18 | 0.1% |
| Lithuanian | 2 | 0.0% |
| Malaysian | 5 | 0.0% |
| Mexican | 217 | 1.0% |
| Native Hawaiian | 6 | 0.0% |
| Northern European | 16 | 0.1% |
| Norwegian | 22 | 0.1% |
| Polish | 134 | 0.6% |
| Portuguese | 28 | 0.1% |
| Puerto Rican | 19 | 0.1% |
| Romanian | 1 | 0.0% |
| Russian | 1 | 0.0% |
| Scandinavian | 15 | 0.1% |
| Scotch-Irish | 224 | 1.1% |
| Scottish | 354 | 1.7% |
| Serbian | 3 | 0.0% |
| Sioux | 9 | 0.0% |
| Slovak | 4 | 0.0% |
| South American | 94 | 0.4% |
| Spaniard | 15 | 0.1% |
| Spanish | 5 | 0.0% |
| Spanish American Indian | 6 | 0.0% |
| Sri Lankan | 19 | 0.1% |
| Subsaharan African | 98 | 0.5% |
| Swedish | 146 | 0.7% |
| Swiss | 37 | 0.2% |
| Syrian | 8 | 0.0% |
| Thai | 10 | 0.1% |
| Welsh | 90 | 0.4% | View All 59 Rows |
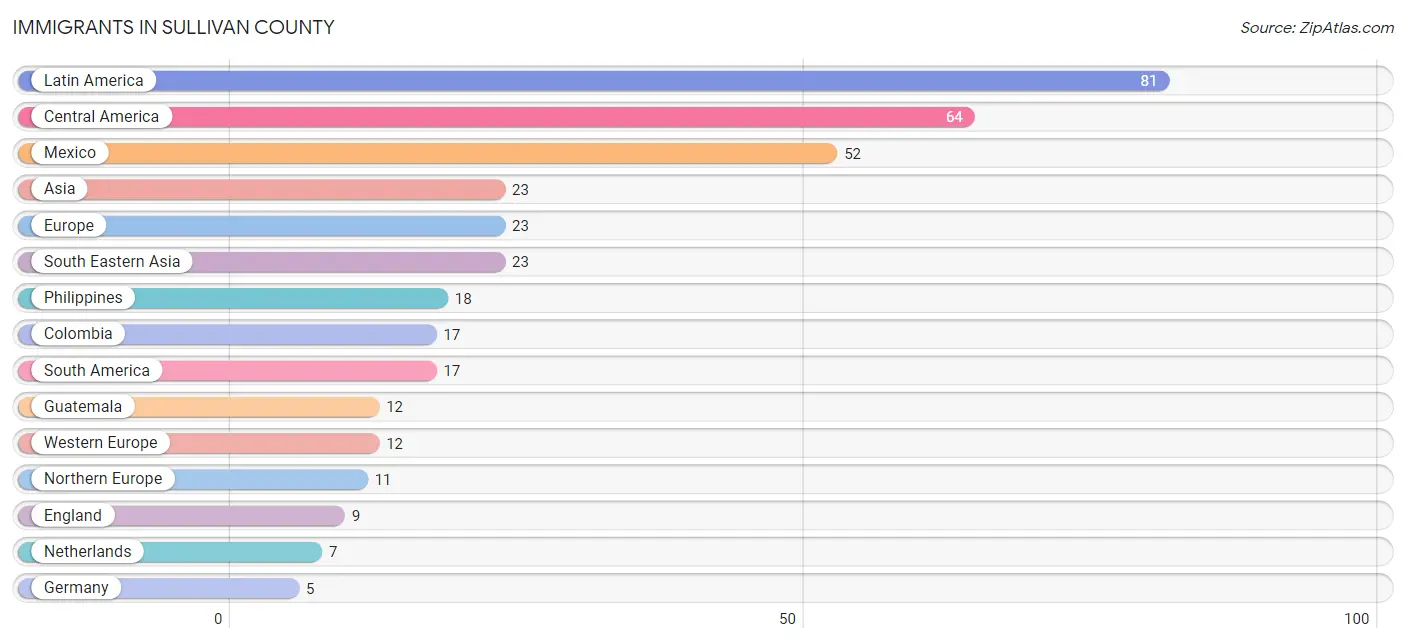
Immigrants in Sullivan County
The most numerous immigrant groups reported in Sullivan County came from Latin America (81 | 0.4%), Central America (64 | 0.3%), Mexico (52 | 0.3%), Asia (23 | 0.1%), and Europe (23 | 0.1%), together accounting for 1.2% of all Sullivan County residents.
| Immigration Origin | # Population | % Population |
| Asia | 23 | 0.1% |
| Canada | 4 | 0.0% |
| Central America | 64 | 0.3% |
| Colombia | 17 | 0.1% |
| England | 9 | 0.0% |
| Europe | 23 | 0.1% |
| Germany | 5 | 0.0% |
| Guatemala | 12 | 0.1% |
| Laos | 5 | 0.0% |
| Latin America | 81 | 0.4% |
| Mexico | 52 | 0.3% |
| Netherlands | 7 | 0.0% |
| Northern Europe | 11 | 0.1% |
| Philippines | 18 | 0.1% |
| Scotland | 2 | 0.0% |
| South America | 17 | 0.1% |
| South Eastern Asia | 23 | 0.1% |
| Western Europe | 12 | 0.1% | View All 18 Rows |
Sex and Age in Sullivan County
Sex and Age in Sullivan County
The most populous age groups in Sullivan County are 25 to 29 Years (897 | 8.1%) for men and 60 to 64 Years (734 | 7.6%) for women.

| Age Bracket | Male | Female |
| Under 5 Years | 595 (5.3%) | 513 (5.3%) |
| 5 to 9 Years | 505 (4.5%) | 559 (5.8%) |
| 10 to 14 Years | 631 (5.7%) | 650 (6.7%) |
| 15 to 19 Years | 575 (5.2%) | 502 (5.2%) |
| 20 to 24 Years | 743 (6.7%) | 546 (5.7%) |
| 25 to 29 Years | 897 (8.1%) | 586 (6.1%) |
| 30 to 34 Years | 808 (7.2%) | 542 (5.6%) |
| 35 to 39 Years | 811 (7.3%) | 630 (6.5%) |
| 40 to 44 Years | 806 (7.2%) | 502 (5.2%) |
| 45 to 49 Years | 846 (7.6%) | 611 (6.3%) |
| 50 to 54 Years | 762 (6.8%) | 617 (6.4%) |
| 55 to 59 Years | 709 (6.4%) | 599 (6.2%) |
| 60 to 64 Years | 722 (6.5%) | 734 (7.6%) |
| 65 to 69 Years | 684 (6.1%) | 633 (6.6%) |
| 70 to 74 Years | 421 (3.8%) | 506 (5.2%) |
| 75 to 79 Years | 337 (3.0%) | 402 (4.2%) |
| 80 to 84 Years | 108 (1.0%) | 286 (3.0%) |
| 85 Years and over | 180 (1.6%) | 233 (2.4%) |
| Total | 11,140 (100.0%) | 9,651 (100.0%) |
Families and Households in Sullivan County
Median Family Size in Sullivan County
The median family size in Sullivan County is 2.87 persons per family, with single male/father families (384 | 7.2%) accounting for the largest median family size of 3.29 persons per family. On the other hand, single female/mother families (974 | 18.3%) represent the smallest median family size with 2.63 persons per family.

| Family Type | # Families | Family Size |
| Married-Couple | 3,963 (74.5%) | 2.88 |
| Single Male/Father | 384 (7.2%) | 3.29 |
| Single Female/Mother | 974 (18.3%) | 2.63 |
| Total Families | 5,321 (100.0%) | 2.87 |
Median Household Size in Sullivan County
The median household size in Sullivan County is 2.43 persons per household, with single male/father households (384 | 5.0%) accounting for the largest median household size of 3.91 persons per household. non-family households (2,388 | 31.0%) represent the smallest median household size with 1.20 persons per household.

| Household Type | # Households | Household Size |
| Married-Couple | 3,963 (51.4%) | 2.89 |
| Single Male/Father | 384 (5.0%) | 3.91 |
| Single Female/Mother | 974 (12.6%) | 2.97 |
| Non-family | 2,388 (31.0%) | 1.20 |
| Total Households | 7,709 (100.0%) | 2.43 |
Household Size by Marriage Status in Sullivan County
Out of a total of 7,709 households in Sullivan County, 5,321 (69.0%) are family households, while 2,388 (31.0%) are nonfamily households. The most numerous type of family households are 2-person households, comprising 2,486, and the most common type of nonfamily households are 1-person households, comprising 1,993.

| Household Size | Family Households | Nonfamily Households |
| 1-Person Households | - | 1,993 (25.9%) |
| 2-Person Households | 2,486 (32.3%) | 350 (4.5%) |
| 3-Person Households | 980 (12.7%) | 17 (0.2%) |
| 4-Person Households | 972 (12.6%) | 28 (0.4%) |
| 5-Person Households | 758 (9.8%) | 0 (0.0%) |
| 6-Person Households | 62 (0.8%) | 0 (0.0%) |
| 7+ Person Households | 63 (0.8%) | 0 (0.0%) |
| Total | 5,321 (69.0%) | 2,388 (31.0%) |
Female Fertility in Sullivan County
Fertility by Age in Sullivan County
Average fertility rate in Sullivan County is 77.0 births per 1,000 women. Women in the age bracket of 20 to 34 years have the highest fertility rate with 167.0 births per 1,000 women. Women in the age bracket of 20 to 34 years acount for 90.9% of all women with births.

| Age Bracket | Women with Births | Births / 1,000 Women |
| 15 to 19 years | 9 (2.9%) | 18.0 |
| 20 to 34 years | 280 (90.9%) | 167.0 |
| 35 to 50 years | 19 (6.2%) | 10.0 |
| Total | 308 (100.0%) | 77.0 |
Fertility by Age by Marriage Status in Sullivan County
43.8% of women with births (308) in Sullivan County are married. The highest percentage of unmarried women with births falls into 15 to 19 years age bracket with 77.8% of them unmarried at the time of birth, while the lowest percentage of unmarried women with births belong to 35 to 50 years age bracket with 0.0% of them unmarried.

| Age Bracket | Married | Unmarried |
| 15 to 19 years | 2 (22.2%) | 7 (77.8%) |
| 20 to 34 years | 114 (40.7%) | 166 (59.3%) |
| 35 to 50 years | 19 (100.0%) | 0 (0.0%) |
| Total | 135 (43.8%) | 173 (56.2%) |
Fertility by Education in Sullivan County

| Educational Attainment | Women with Births | Births / 1,000 Women |
| Less than High School | 0 (0.0%) | 0.0 |
| High School Diploma | 94 (30.5%) | 100.0 |
| College or Associate's Degree | 159 (51.6%) | 89.0 |
| Bachelor's Degree | 55 (17.9%) | 89.0 |
| Graduate Degree | 0 (0.0%) | 0.0 |
| Total | 308 (100.0%) | 77.0 |
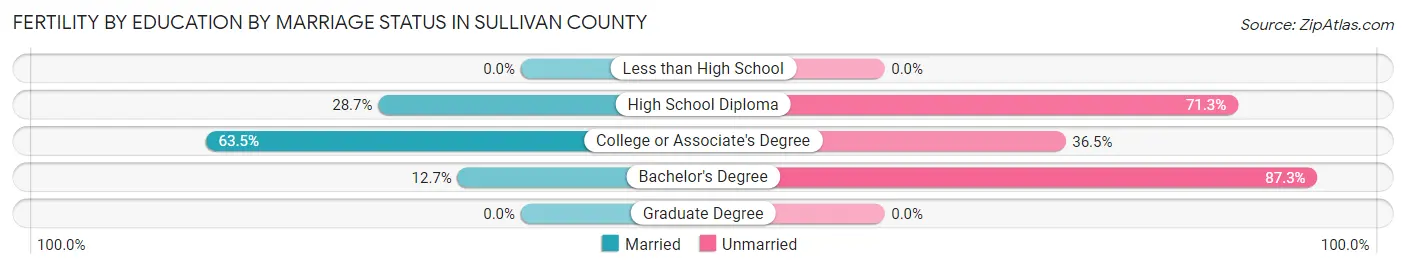
Fertility by Education by Marriage Status in Sullivan County
56.2% of women with births in Sullivan County are unmarried. Women with the educational attainment of college or associate's degree are most likely to be married with 63.5% of them married at childbirth, while women with the educational attainment of bachelor's degree are least likely to be married with 87.3% of them unmarried at childbirth.
| Educational Attainment | Married | Unmarried |
| Less than High School | 0 (0.0%) | 0 (0.0%) |
| High School Diploma | 27 (28.7%) | 67 (71.3%) |
| College or Associate's Degree | 101 (63.5%) | 58 (36.5%) |
| Bachelor's Degree | 7 (12.7%) | 48 (87.3%) |
| Graduate Degree | 0 (0.0%) | 0 (0.0%) |
| Total | 135 (43.8%) | 173 (56.2%) |
Income in Sullivan County
Income Overview in Sullivan County
Per Capita Income in Sullivan County is $27,792, while median incomes of families and households are $70,981 and $54,556 respectively.
| Characteristic | Number | Measure |
| Per Capita Income | 20,791 | $27,792 |
| Median Family Income | 5,321 | $70,981 |
| Mean Family Income | 5,321 | $78,997 |
| Median Household Income | 7,709 | $54,556 |
| Mean Household Income | 7,709 | $70,658 |
| Income Deficit | 5,321 | $12,093 |
| Wage / Income Gap (%) | 20,791 | 27.13% |
| Wage / Income Gap ($) | 20,791 | 72.87¢ per $1 |
| Gini / Inequality Index | 20,791 | 0.41 |
Earnings by Sex in Sullivan County
Average Earnings in Sullivan County are $32,795, $38,440 for men and $28,011 for women, a difference of 27.1%.

| Sex | Number | Average Earnings |
| Male | 6,159 (57.1%) | $38,440 |
| Female | 4,635 (42.9%) | $28,011 |
| Total | 10,794 (100.0%) | $32,795 |
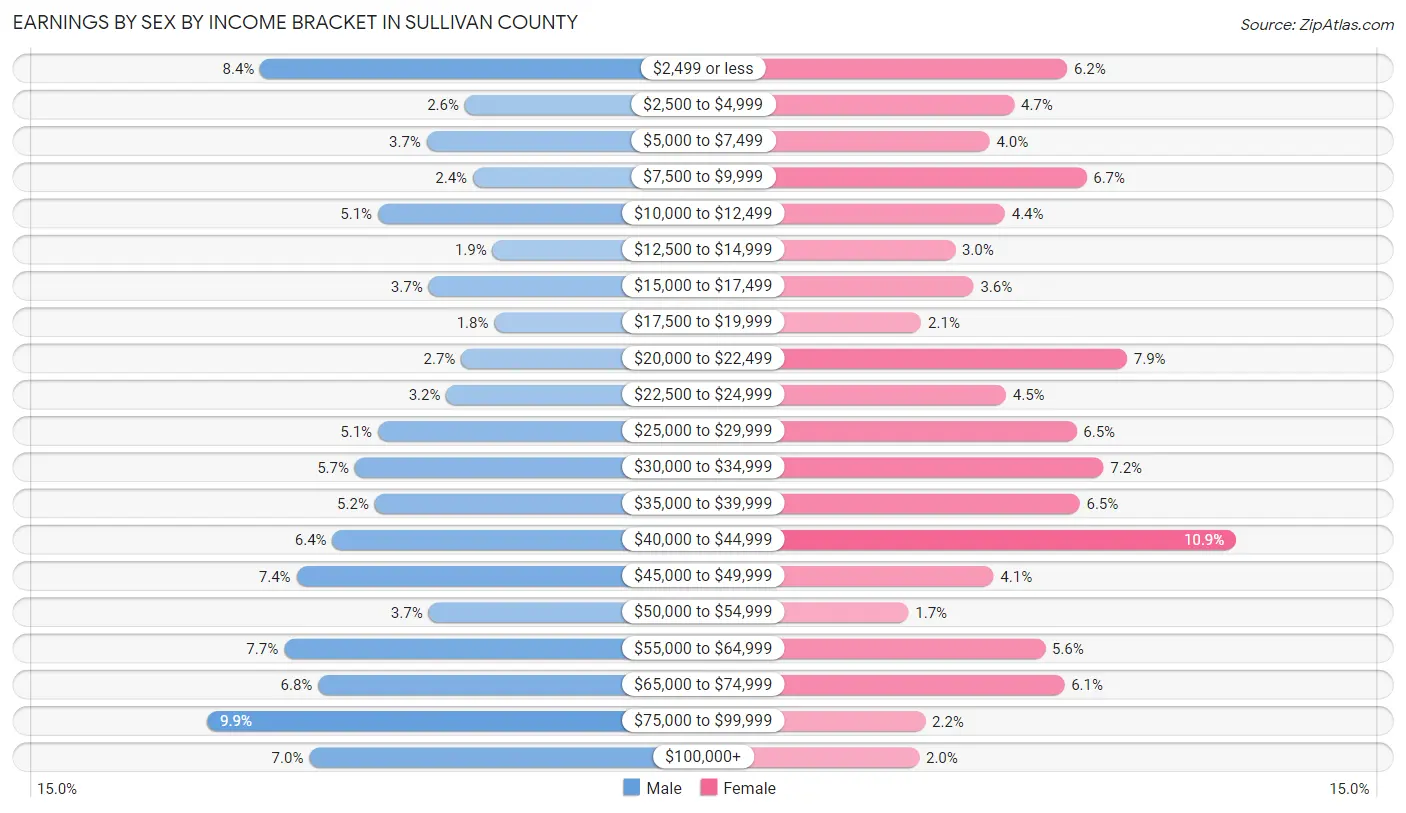
Earnings by Sex by Income Bracket in Sullivan County
The most common earnings brackets in Sullivan County are $75,000 to $99,999 for men (608 | 9.9%) and $40,000 to $44,999 for women (507 | 10.9%).
| Income | Male | Female |
| $2,499 or less | 516 (8.4%) | 287 (6.2%) |
| $2,500 to $4,999 | 162 (2.6%) | 218 (4.7%) |
| $5,000 to $7,499 | 228 (3.7%) | 186 (4.0%) |
| $7,500 to $9,999 | 148 (2.4%) | 312 (6.7%) |
| $10,000 to $12,499 | 312 (5.1%) | 206 (4.4%) |
| $12,500 to $14,999 | 114 (1.8%) | 141 (3.0%) |
| $15,000 to $17,499 | 225 (3.6%) | 165 (3.6%) |
| $17,500 to $19,999 | 111 (1.8%) | 97 (2.1%) |
| $20,000 to $22,499 | 168 (2.7%) | 365 (7.9%) |
| $22,500 to $24,999 | 194 (3.2%) | 207 (4.5%) |
| $25,000 to $29,999 | 312 (5.1%) | 299 (6.5%) |
| $30,000 to $34,999 | 352 (5.7%) | 334 (7.2%) |
| $35,000 to $39,999 | 318 (5.2%) | 303 (6.5%) |
| $40,000 to $44,999 | 391 (6.4%) | 507 (10.9%) |
| $45,000 to $49,999 | 453 (7.4%) | 191 (4.1%) |
| $50,000 to $54,999 | 225 (3.6%) | 80 (1.7%) |
| $55,000 to $64,999 | 475 (7.7%) | 258 (5.6%) |
| $65,000 to $74,999 | 416 (6.8%) | 283 (6.1%) |
| $75,000 to $99,999 | 608 (9.9%) | 102 (2.2%) |
| $100,000+ | 431 (7.0%) | 94 (2.0%) |
| Total | 6,159 (100.0%) | 4,635 (100.0%) |
Earnings by Sex by Educational Attainment in Sullivan County
Average earnings in Sullivan County are $42,236 for men and $31,077 for women, a difference of 26.4%. Men with an educational attainment of graduate degree enjoy the highest average annual earnings of $83,146, while those with less than high school education earn the least with $16,109. Women with an educational attainment of graduate degree earn the most with the average annual earnings of $70,288, while those with less than high school education have the smallest earnings of $8,880.
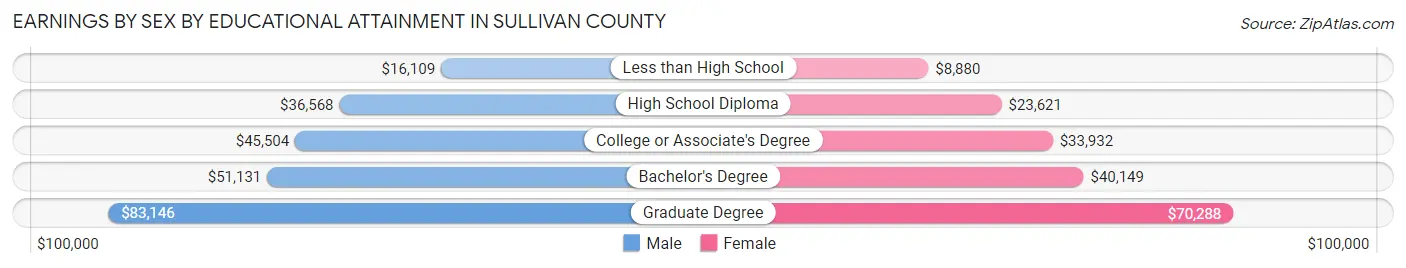
| Educational Attainment | Male Income | Female Income |
| Less than High School | $16,109 | $8,880 |
| High School Diploma | $36,568 | $23,621 |
| College or Associate's Degree | $45,504 | $33,932 |
| Bachelor's Degree | $51,131 | $40,149 |
| Graduate Degree | $83,146 | $70,288 |
| Total | $42,236 | $31,077 |
Family Income in Sullivan County
Family Income Brackets in Sullivan County
According to the Sullivan County family income data, there are 1,022 families falling into the $75,000 to $99,999 income range, which is the most common income bracket and makes up 19.2% of all families. Conversely, the $10,000 to $14,999 income bracket is the least frequent group with only 106 families (2.0%) belonging to this category.
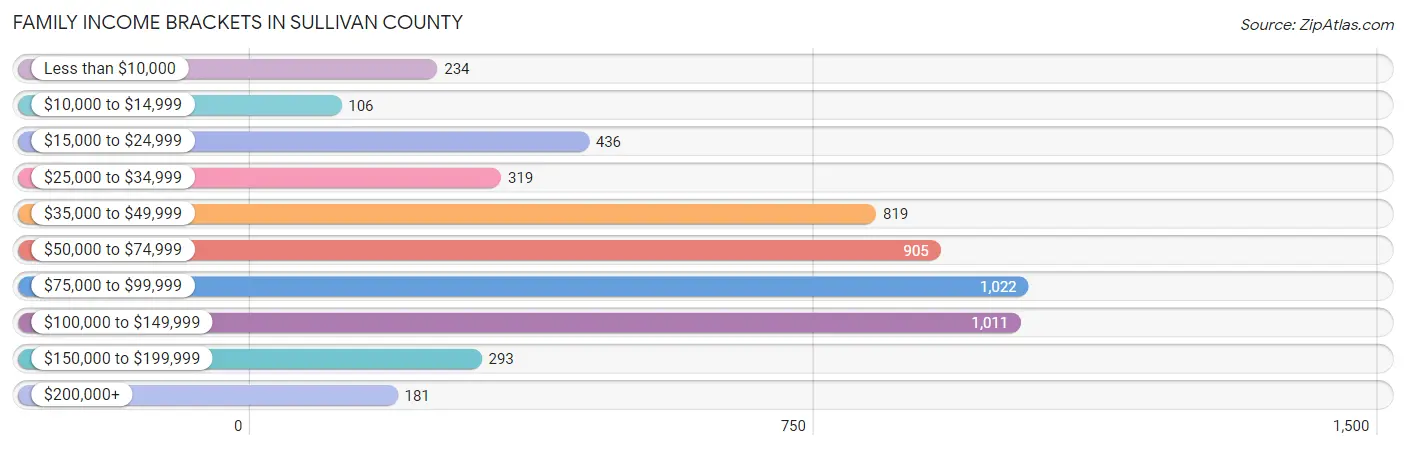
| Income Bracket | # Families | % Families |
| Less than $10,000 | 234 | 4.4% |
| $10,000 to $14,999 | 106 | 2.0% |
| $15,000 to $24,999 | 436 | 8.2% |
| $25,000 to $34,999 | 319 | 6.0% |
| $35,000 to $49,999 | 819 | 15.4% |
| $50,000 to $74,999 | 905 | 17.0% |
| $75,000 to $99,999 | 1,022 | 19.2% |
| $100,000 to $149,999 | 1,011 | 19.0% |
| $150,000 to $199,999 | 293 | 5.5% |
| $200,000+ | 181 | 3.4% |
Family Income by Famaliy Size in Sullivan County
7+ person families (26 | 0.5%) account for the highest median family income in Sullivan County with $121,250 per family, while 2-person families (2,726 | 51.2%) have the highest median income of $32,656 per family member.

| Income Bracket | # Families | Median Income |
| 2-Person Families | 2,726 (51.2%) | $65,313 |
| 3-Person Families | 878 (16.5%) | $51,923 |
| 4-Person Families | 960 (18.0%) | $81,625 |
| 5-Person Families | 683 (12.8%) | $83,260 |
| 6-Person Families | 48 (0.9%) | $83,000 |
| 7+ Person Families | 26 (0.5%) | $121,250 |
| Total | 5,321 (100.0%) | $70,981 |
Family Income by Number of Earners in Sullivan County
The median family income in Sullivan County is $70,981, with families comprising 3+ earners (493) having the highest median family income of $121,058, while families with no earners (998) have the lowest median family income of $38,393, accounting for 9.3% and 18.8% of families, respectively.

| Number of Earners | # Families | Median Income |
| No Earners | 998 (18.8%) | $38,393 |
| 1 Earner | 1,797 (33.8%) | $51,146 |
| 2 Earners | 2,033 (38.2%) | $84,900 |
| 3+ Earners | 493 (9.3%) | $121,058 |
| Total | 5,321 (100.0%) | $70,981 |
Household Income in Sullivan County
Household Income Brackets in Sullivan County
With 1,511 households falling in the category, the $50,000 to $74,999 income range is the most frequent in Sullivan County, accounting for 19.6% of all households. In contrast, only 231 households (3.0%) fall into the $200,000+ income bracket, making it the least populous group.

| Income Bracket | # Households | % Households |
| Less than $10,000 | 347 | 4.5% |
| $10,000 to $14,999 | 308 | 4.0% |
| $15,000 to $24,999 | 802 | 10.4% |
| $25,000 to $34,999 | 655 | 8.5% |
| $35,000 to $49,999 | 1,295 | 16.8% |
| $50,000 to $74,999 | 1,511 | 19.6% |
| $75,000 to $99,999 | 1,079 | 14.0% |
| $100,000 to $149,999 | 1,179 | 15.3% |
| $150,000 to $199,999 | 301 | 3.9% |
| $200,000+ | 231 | 3.0% |
Household Income by Householder Age in Sullivan County
The median household income in Sullivan County is $54,556, with the highest median household income of $74,854 found in the 45 to 64 years age bracket for the primary householder. A total of 2,861 households (37.1%) fall into this category. Meanwhile, the 15 to 24 years age bracket for the primary householder has the lowest median household income of $38,933, with 299 households (3.9%) in this group.

| Income Bracket | # Households | Median Income |
| 15 to 24 Years | 299 (3.9%) | $38,933 |
| 25 to 44 Years | 2,374 (30.8%) | $56,711 |
| 45 to 64 Years | 2,861 (37.1%) | $74,854 |
| 65+ Years | 2,175 (28.2%) | $44,886 |
| Total | 7,709 (100.0%) | $54,556 |
Poverty in Sullivan County
Income Below Poverty by Sex and Age in Sullivan County
With 10.6% poverty level for males and 13.7% for females among the residents of Sullivan County, under 5 year old males and 5 year old females are the most vulnerable to poverty, with 156 males (28.3%) and 29 females (40.8%) in their respective age groups living below the poverty level.
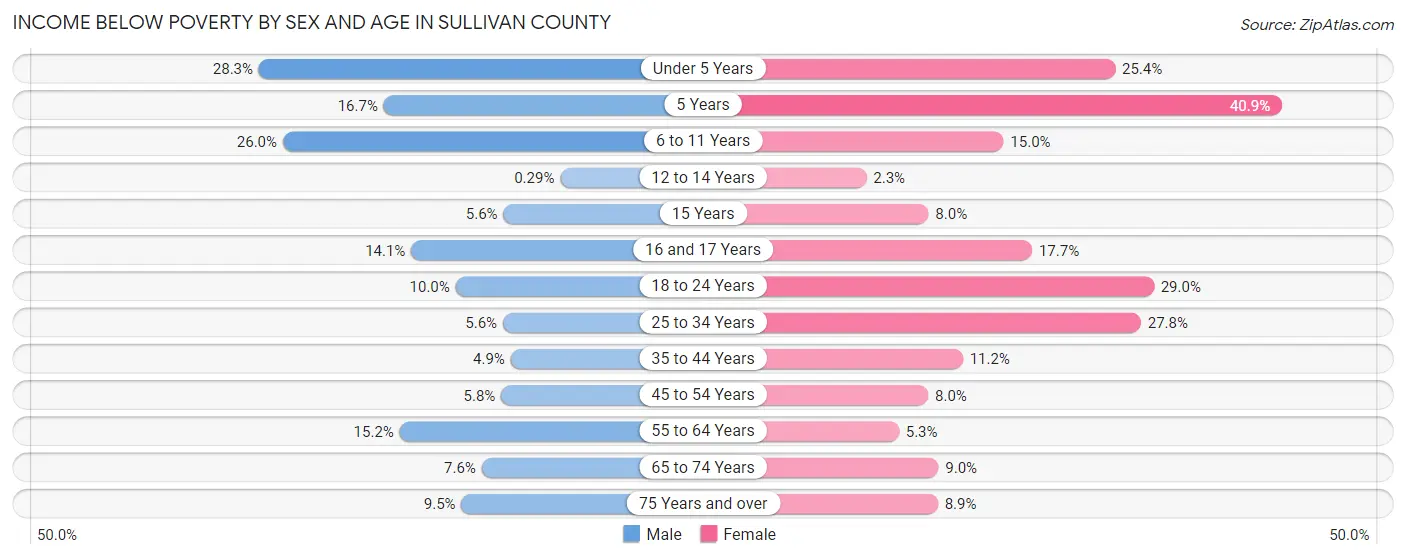
| Age Bracket | Male | Female |
| Under 5 Years | 156 (28.3%) | 123 (25.4%) |
| 5 Years | 22 (16.7%) | 29 (40.8%) |
| 6 to 11 Years | 165 (26.0%) | 96 (15.0%) |
| 12 to 14 Years | 1 (0.3%) | 10 (2.3%) |
| 15 Years | 5 (5.6%) | 9 (8.0%) |
| 16 and 17 Years | 36 (14.1%) | 39 (17.6%) |
| 18 to 24 Years | 84 (10.0%) | 207 (28.9%) |
| 25 to 34 Years | 70 (5.6%) | 313 (27.8%) |
| 35 to 44 Years | 55 (4.9%) | 127 (11.2%) |
| 45 to 54 Years | 68 (5.8%) | 98 (8.0%) |
| 55 to 64 Years | 170 (15.2%) | 70 (5.3%) |
| 65 to 74 Years | 77 (7.6%) | 102 (9.0%) |
| 75 Years and over | 54 (9.5%) | 77 (8.9%) |
| Total | 963 (10.6%) | 1,300 (13.7%) |
Income Above Poverty by Sex and Age in Sullivan County
According to the poverty statistics in Sullivan County, males aged 12 to 14 years and females aged 12 to 14 years are the age groups that are most secure financially, with 99.7% of males and 97.7% of females in these age groups living above the poverty line.

| Age Bracket | Male | Female |
| Under 5 Years | 396 (71.7%) | 362 (74.6%) |
| 5 Years | 110 (83.3%) | 42 (59.2%) |
| 6 to 11 Years | 469 (74.0%) | 544 (85.0%) |
| 12 to 14 Years | 347 (99.7%) | 429 (97.7%) |
| 15 Years | 85 (94.4%) | 103 (92.0%) |
| 16 and 17 Years | 219 (85.9%) | 182 (82.4%) |
| 18 to 24 Years | 756 (90.0%) | 508 (71.1%) |
| 25 to 34 Years | 1,178 (94.4%) | 815 (72.3%) |
| 35 to 44 Years | 1,070 (95.1%) | 1,005 (88.8%) |
| 45 to 54 Years | 1,111 (94.2%) | 1,125 (92.0%) |
| 55 to 64 Years | 949 (84.8%) | 1,253 (94.7%) |
| 65 to 74 Years | 939 (92.4%) | 1,037 (91.0%) |
| 75 Years and over | 517 (90.5%) | 788 (91.1%) |
| Total | 8,146 (89.4%) | 8,193 (86.3%) |
Income Below Poverty Among Married-Couple Families in Sullivan County
The poverty statistics for married-couple families in Sullivan County show that 2.5% or 98 of the total 3,963 families live below the poverty line. Families with 3 or 4 children have the highest poverty rate of 3.6%, comprising of 13 families. On the other hand, families with 5 or more children have the lowest poverty rate of 0.0%, which includes 0 families.
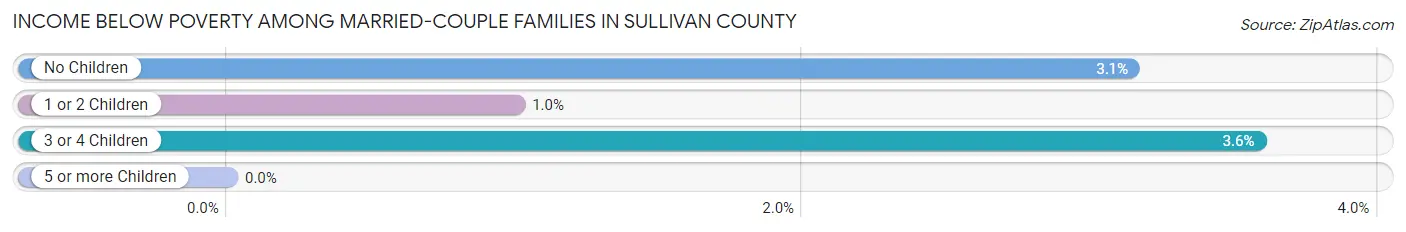
| Children | Above Poverty | Below Poverty |
| No Children | 2,222 (96.9%) | 72 (3.1%) |
| 1 or 2 Children | 1,289 (99.0%) | 13 (1.0%) |
| 3 or 4 Children | 350 (96.4%) | 13 (3.6%) |
| 5 or more Children | 4 (100.0%) | 0 (0.0%) |
| Total | 3,865 (97.5%) | 98 (2.5%) |
Income Below Poverty Among Single-Parent Households in Sullivan County
According to the poverty data in Sullivan County, 12.8% or 49 single-father households and 38.3% or 373 single-mother households are living below the poverty line. Among single-father households, those with no children have the highest poverty rate, with 25 households (18.9%) experiencing poverty. Likewise, among single-mother households, those with 3 or 4 children have the highest poverty rate, with 68 households (84.0%) falling below the poverty line.

| Children | Single Father | Single Mother |
| No Children | 25 (18.9%) | 26 (10.6%) |
| 1 or 2 Children | 14 (14.3%) | 279 (43.1%) |
| 3 or 4 Children | 10 (6.5%) | 68 (84.0%) |
| 5 or more Children | 0 (0.0%) | 0 (0.0%) |
| Total | 49 (12.8%) | 373 (38.3%) |
Income Below Poverty Among Married-Couple vs Single-Parent Households in Sullivan County
The poverty data for Sullivan County shows that 98 of the married-couple family households (2.5%) and 422 of the single-parent households (31.1%) are living below the poverty level. Within the married-couple family households, those with 3 or 4 children have the highest poverty rate, with 13 households (3.6%) falling below the poverty line. Among the single-parent households, those with 1 or 2 children have the highest poverty rate, with 293 household (39.3%) living below poverty.

| Children | Married-Couple Families | Single-Parent Households |
| No Children | 72 (3.1%) | 51 (13.5%) |
| 1 or 2 Children | 13 (1.0%) | 293 (39.3%) |
| 3 or 4 Children | 13 (3.6%) | 78 (33.2%) |
| 5 or more Children | 0 (0.0%) | 0 (0.0%) |
| Total | 98 (2.5%) | 422 (31.1%) |
Employment Characteristics in Sullivan County
Employment by Class of Employer in Sullivan County
Among the 8,694 employed individuals in Sullivan County, private company employees (5,981 | 68.8%), not-for-profit organizations (761 | 8.7%), and local government employees (619 | 7.1%) make up the most common classes of employment.

| Employer Class | # Employees | % Employees |
| Private Company Employees | 5,981 | 68.8% |
| Self-Employed (Incorporated) | 175 | 2.0% |
| Self-Employed (Not Incorporated) | 429 | 4.9% |
| Not-for-profit Organizations | 761 | 8.7% |
| Local Government Employees | 619 | 7.1% |
| State Government Employees | 577 | 6.6% |
| Federal Government Employees | 132 | 1.5% |
| Unpaid Family Workers | 20 | 0.2% |
| Total | 8,694 | 100.0% |
Employment Status by Age in Sullivan County
According to the labor force statistics for Sullivan County, out of the total population over 16 years of age (17,136), 54.9% or 9,408 individuals are in the labor force, with 5.0% or 470 of them unemployed. The age group with the highest labor force participation rate is 20 to 24 years, with 78.5% or 1,012 individuals in the labor force. Within the labor force, the 30 to 34 years age range has the highest percentage of unemployed individuals, with 13.5% or 123 of them being unemployed.

| Age Bracket | In Labor Force | Unemployed |
| 16 to 19 Years | 297 (33.9%) | 31 (10.4%) |
| 20 to 24 Years | 1,012 (78.5%) | 96 (9.5%) |
| 25 to 29 Years | 931 (62.8%) | 9 (1.0%) |
| 30 to 34 Years | 911 (67.5%) | 123 (13.5%) |
| 35 to 44 Years | 1,968 (71.6%) | 22 (1.1%) |
| 45 to 54 Years | 2,022 (71.3%) | 44 (2.2%) |
| 55 to 59 Years | 718 (54.9%) | 33 (4.6%) |
| 60 to 64 Years | 808 (55.5%) | 63 (7.8%) |
| 65 to 74 Years | 588 (26.2%) | 53 (9.0%) |
| 75 Years and over | 158 (10.2%) | 0 (0.0%) |
| Total | 9,408 (54.9%) | 470 (5.0%) |
Employment Status by Educational Attainment in Sullivan County
According to labor force statistics for Sullivan County, 65.8% of individuals (7,358) out of the total population between 25 and 64 years of age (11,182) are in the labor force, with 4.0% or 294 of them being unemployed. The group with the highest labor force participation rate are those with the educational attainment of college / associate degree, with 80.4% or 3,211 individuals in the labor force. Within the labor force, individuals with high school diploma education have the highest percentage of unemployment, with 5.7% or 150 of them being unemployed.

| Educational Attainment | In Labor Force | Unemployed |
| Less than High School | 347 (33.8%) | 50 (4.9%) |
| High School Diploma | 2,634 (56.5%) | 266 (5.7%) |
| College / Associate Degree | 3,211 (80.4%) | 152 (3.8%) |
| Bachelor's Degree or higher | 1,162 (77.5%) | 6 (0.4%) |
| Total | 7,358 (65.8%) | 447 (4.0%) |
Employment Occupations by Sex in Sullivan County
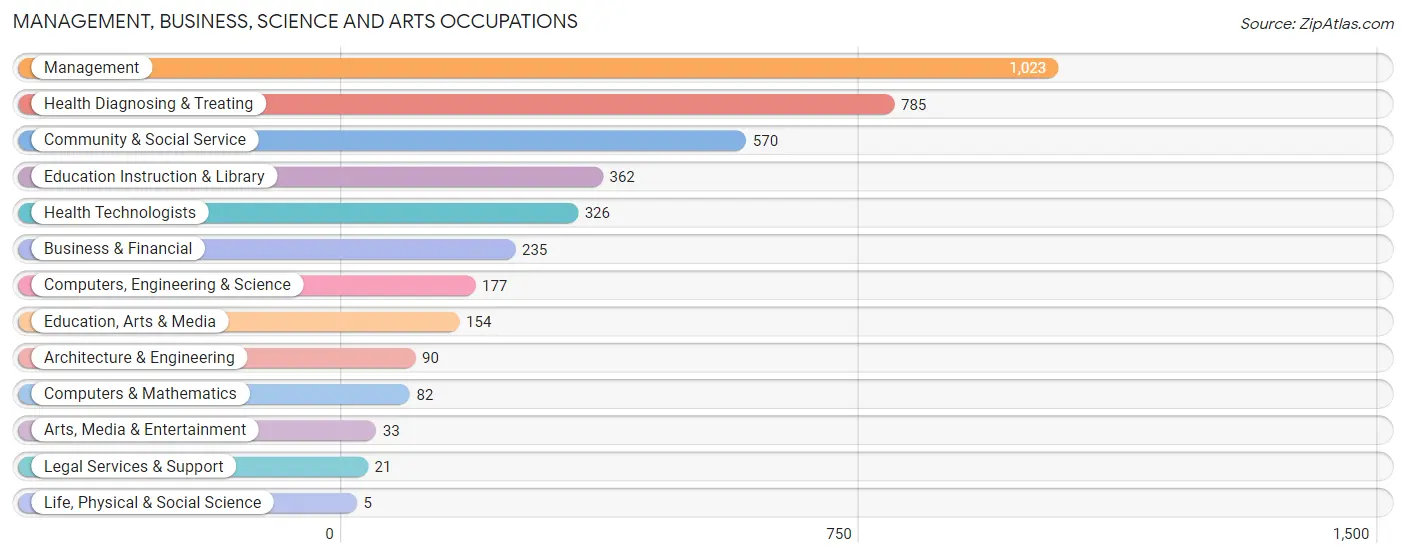
Management, Business, Science and Arts Occupations
The most common Management, Business, Science and Arts occupations in Sullivan County are Management (1,023 | 11.5%), Health Diagnosing & Treating (785 | 8.8%), Community & Social Service (570 | 6.4%), Education Instruction & Library (362 | 4.1%), and Health Technologists (326 | 3.6%).
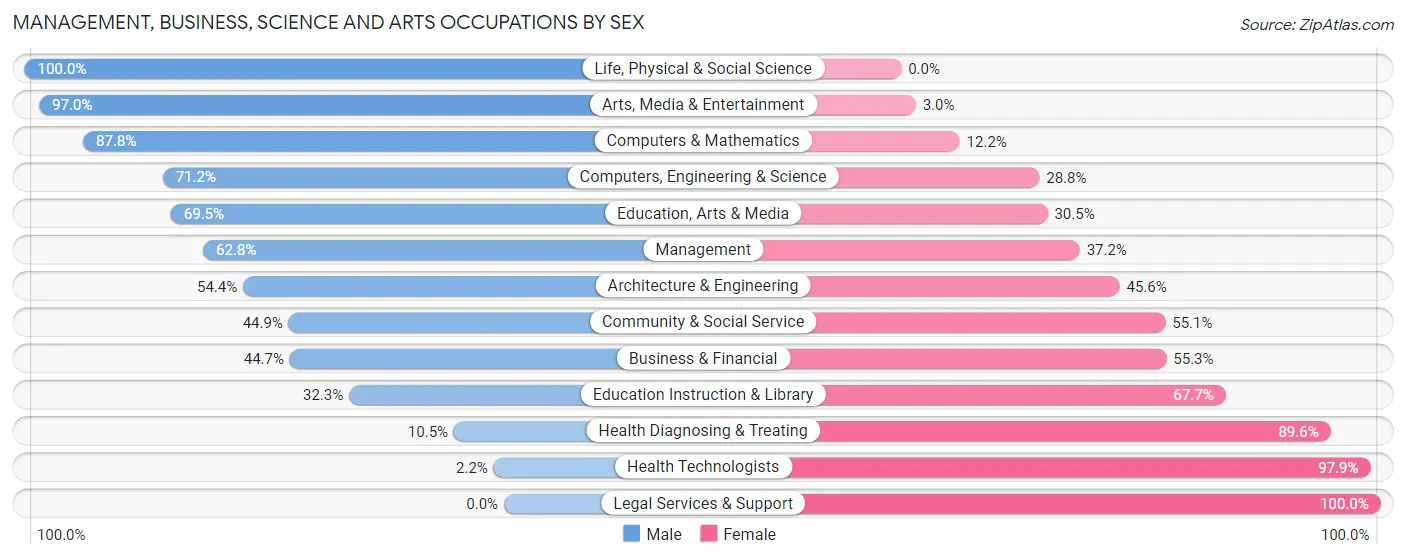
Management, Business, Science and Arts Occupations by Sex
Within the Management, Business, Science and Arts occupations in Sullivan County, the most male-oriented occupations are Life, Physical & Social Science (100.0%), Arts, Media & Entertainment (97.0%), and Computers & Mathematics (87.8%), while the most female-oriented occupations are Legal Services & Support (100.0%), Health Technologists (97.9%), and Health Diagnosing & Treating (89.5%).
| Occupation | Male | Female |
| Management | 642 (62.8%) | 381 (37.2%) |
| Business & Financial | 105 (44.7%) | 130 (55.3%) |
| Computers, Engineering & Science | 126 (71.2%) | 51 (28.8%) |
| Computers & Mathematics | 72 (87.8%) | 10 (12.2%) |
| Architecture & Engineering | 49 (54.4%) | 41 (45.6%) |
| Life, Physical & Social Science | 5 (100.0%) | 0 (0.0%) |
| Community & Social Service | 256 (44.9%) | 314 (55.1%) |
| Education, Arts & Media | 107 (69.5%) | 47 (30.5%) |
| Legal Services & Support | 0 (0.0%) | 21 (100.0%) |
| Education Instruction & Library | 117 (32.3%) | 245 (67.7%) |
| Arts, Media & Entertainment | 32 (97.0%) | 1 (3.0%) |
| Health Diagnosing & Treating | 82 (10.4%) | 703 (89.5%) |
| Health Technologists | 7 (2.1%) | 319 (97.9%) |
| Total (Category) | 1,211 (43.4%) | 1,579 (56.6%) |
| Total (Overall) | 4,745 (53.1%) | 4,193 (46.9%) |
Services Occupations
The most common Services occupations in Sullivan County are Security & Protection (610 | 6.8%), Law Enforcement (490 | 5.5%), Food Preparation & Serving (435 | 4.9%), Healthcare Support (357 | 4.0%), and Cleaning & Maintenance (330 | 3.7%).

Services Occupations by Sex
Within the Services occupations in Sullivan County, the most male-oriented occupations are Law Enforcement (76.1%), Security & Protection (72.6%), and Firefighting & Prevention (58.3%), while the most female-oriented occupations are Personal Care & Service (94.7%), Healthcare Support (85.2%), and Food Preparation & Serving (82.8%).

| Occupation | Male | Female |
| Healthcare Support | 53 (14.8%) | 304 (85.2%) |
| Security & Protection | 443 (72.6%) | 167 (27.4%) |
| Firefighting & Prevention | 70 (58.3%) | 50 (41.7%) |
| Law Enforcement | 373 (76.1%) | 117 (23.9%) |
| Food Preparation & Serving | 75 (17.2%) | 360 (82.8%) |
| Cleaning & Maintenance | 166 (50.3%) | 164 (49.7%) |
| Personal Care & Service | 5 (5.3%) | 89 (94.7%) |
| Total (Category) | 742 (40.6%) | 1,084 (59.4%) |
| Total (Overall) | 4,745 (53.1%) | 4,193 (46.9%) |
Sales and Office Occupations
The most common Sales and Office occupations in Sullivan County are Sales & Related (749 | 8.4%), and Office & Administration (704 | 7.9%).

Sales and Office Occupations by Sex

| Occupation | Male | Female |
| Sales & Related | 249 (33.2%) | 500 (66.8%) |
| Office & Administration | 125 (17.8%) | 579 (82.2%) |
| Total (Category) | 374 (25.7%) | 1,079 (74.3%) |
| Total (Overall) | 4,745 (53.1%) | 4,193 (46.9%) |
Natural Resources, Construction and Maintenance Occupations
The most common Natural Resources, Construction and Maintenance occupations in Sullivan County are Construction & Extraction (494 | 5.5%), Installation, Maintenance & Repair (481 | 5.4%), and Farming, Fishing & Forestry (25 | 0.3%).

Natural Resources, Construction and Maintenance Occupations by Sex
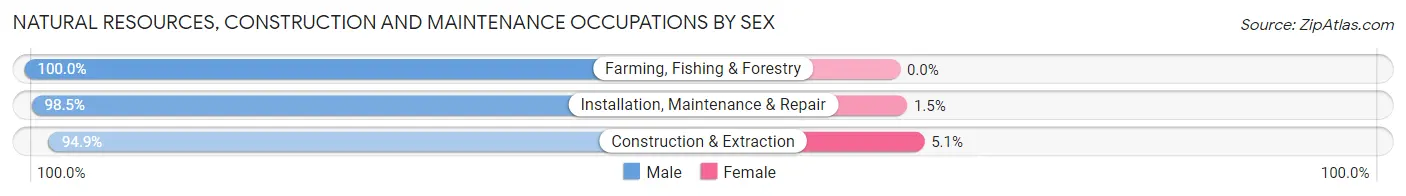
| Occupation | Male | Female |
| Farming, Fishing & Forestry | 25 (100.0%) | 0 (0.0%) |
| Construction & Extraction | 469 (94.9%) | 25 (5.1%) |
| Installation, Maintenance & Repair | 474 (98.5%) | 7 (1.5%) |
| Total (Category) | 968 (96.8%) | 32 (3.2%) |
| Total (Overall) | 4,745 (53.1%) | 4,193 (46.9%) |
Production, Transportation and Moving Occupations
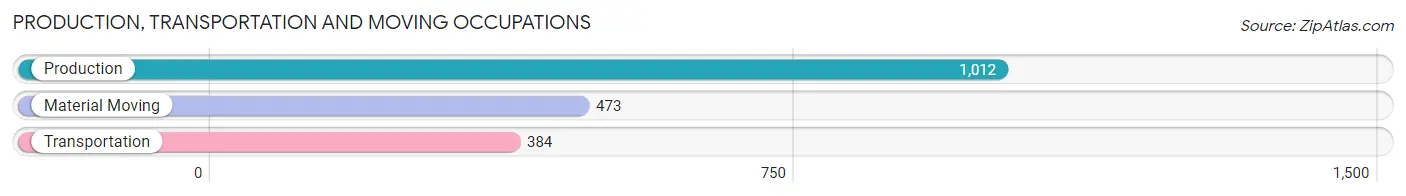
The most common Production, Transportation and Moving occupations in Sullivan County are Production (1,012 | 11.3%), Material Moving (473 | 5.3%), and Transportation (384 | 4.3%).
Production, Transportation and Moving Occupations by Sex
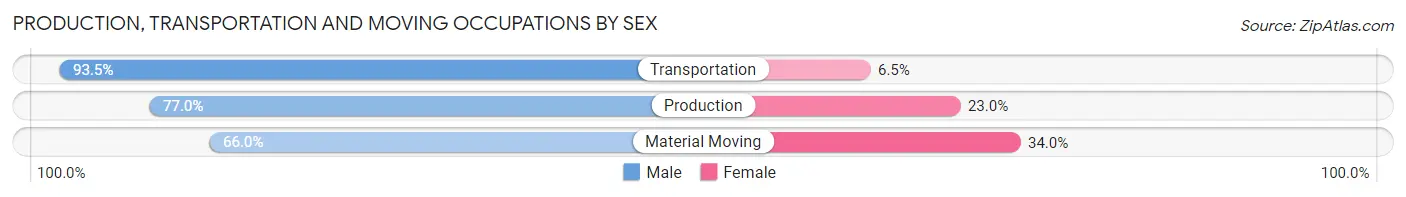
| Occupation | Male | Female |
| Production | 779 (77.0%) | 233 (23.0%) |
| Transportation | 359 (93.5%) | 25 (6.5%) |
| Material Moving | 312 (66.0%) | 161 (34.0%) |
| Total (Category) | 1,450 (77.6%) | 419 (22.4%) |
| Total (Overall) | 4,745 (53.1%) | 4,193 (46.9%) |
Employment Industries by Sex in Sullivan County
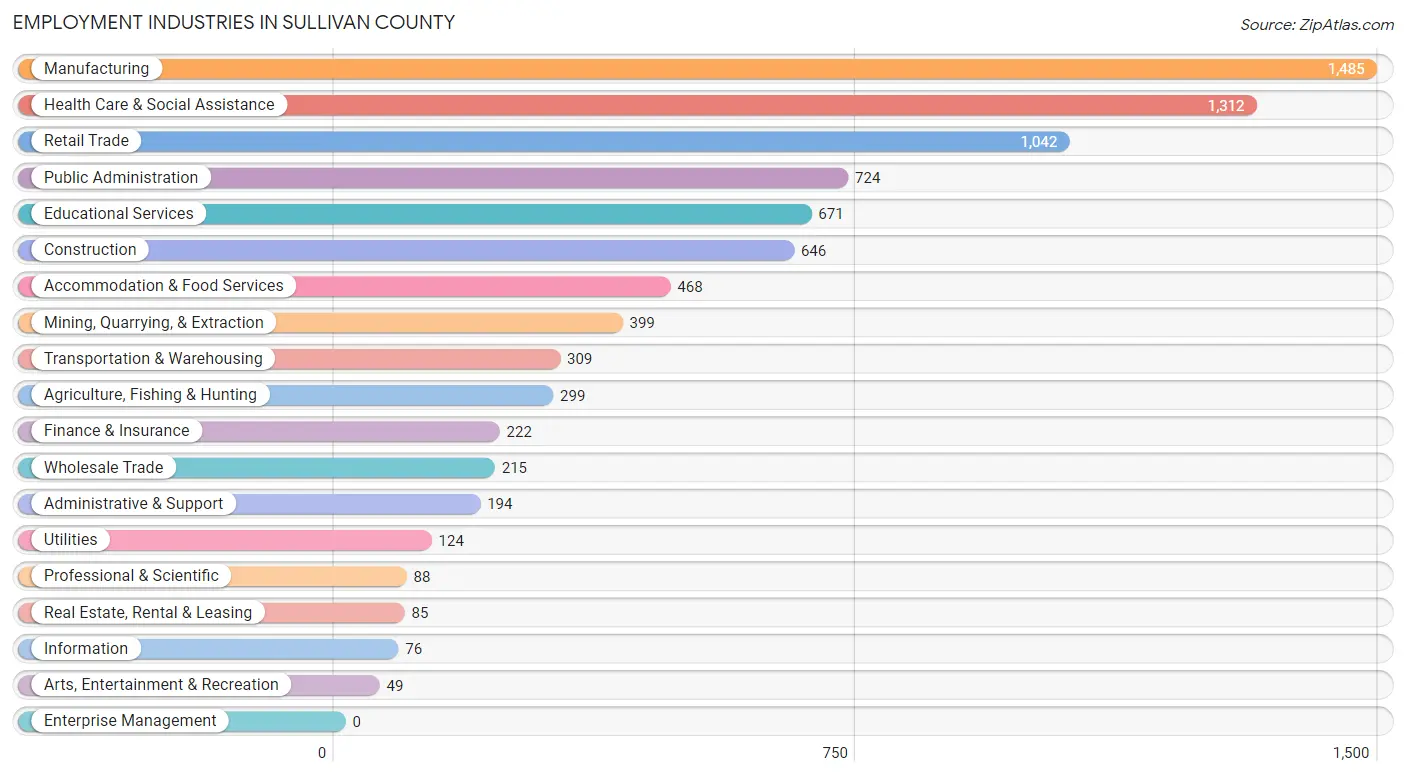
Employment Industries in Sullivan County
The major employment industries in Sullivan County include Manufacturing (1,485 | 16.6%), Health Care & Social Assistance (1,312 | 14.7%), Retail Trade (1,042 | 11.7%), Public Administration (724 | 8.1%), and Educational Services (671 | 7.5%).
Employment Industries by Sex in Sullivan County
The Sullivan County industries that see more men than women are Mining, Quarrying, & Extraction (97.5%), Agriculture, Fishing & Hunting (89.6%), and Utilities (87.1%), whereas the industries that tend to have a higher number of women are Health Care & Social Assistance (88.8%), Finance & Insurance (86.9%), and Accommodation & Food Services (80.1%).

| Industry | Male | Female |
| Agriculture, Fishing & Hunting | 268 (89.6%) | 31 (10.4%) |
| Mining, Quarrying, & Extraction | 389 (97.5%) | 10 (2.5%) |
| Construction | 482 (74.6%) | 164 (25.4%) |
| Manufacturing | 1,065 (71.7%) | 420 (28.3%) |
| Wholesale Trade | 172 (80.0%) | 43 (20.0%) |
| Retail Trade | 431 (41.4%) | 611 (58.6%) |
| Transportation & Warehousing | 252 (81.6%) | 57 (18.4%) |
| Utilities | 108 (87.1%) | 16 (12.9%) |
| Information | 43 (56.6%) | 33 (43.4%) |
| Finance & Insurance | 29 (13.1%) | 193 (86.9%) |
| Real Estate, Rental & Leasing | 56 (65.9%) | 29 (34.1%) |
| Professional & Scientific | 49 (55.7%) | 39 (44.3%) |
| Enterprise Management | 0 (0.0%) | 0 (0.0%) |
| Administrative & Support | 133 (68.6%) | 61 (31.4%) |
| Educational Services | 193 (28.8%) | 478 (71.2%) |
| Health Care & Social Assistance | 147 (11.2%) | 1,165 (88.8%) |
| Arts, Entertainment & Recreation | 11 (22.5%) | 38 (77.5%) |
| Accommodation & Food Services | 93 (19.9%) | 375 (80.1%) |
| Public Administration | 487 (67.3%) | 237 (32.7%) |
| Total | 4,745 (53.1%) | 4,193 (46.9%) |
Education in Sullivan County
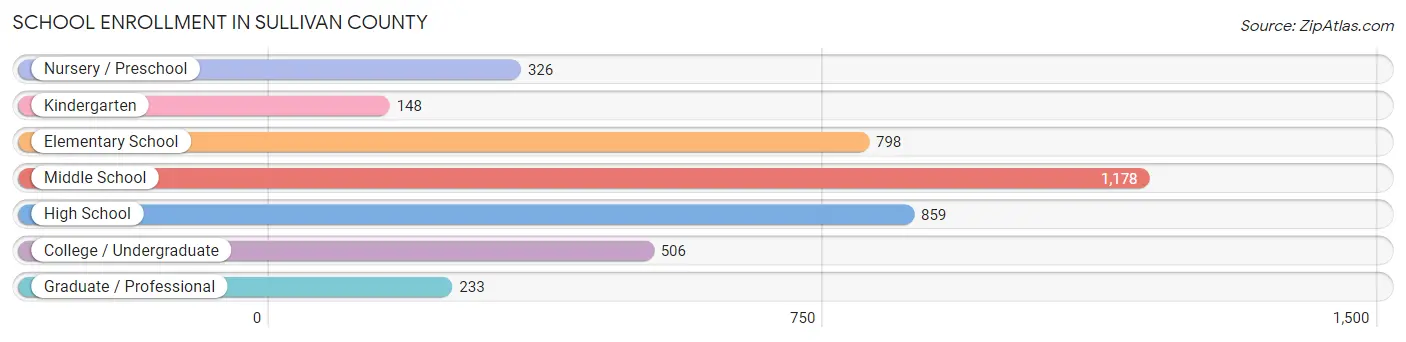
School Enrollment in Sullivan County
The most common levels of schooling among the 4,048 students in Sullivan County are middle school (1,178 | 29.1%), high school (859 | 21.2%), and elementary school (798 | 19.7%).
| School Level | # Students | % Students |
| Nursery / Preschool | 326 | 8.1% |
| Kindergarten | 148 | 3.7% |
| Elementary School | 798 | 19.7% |
| Middle School | 1,178 | 29.1% |
| High School | 859 | 21.2% |
| College / Undergraduate | 506 | 12.5% |
| Graduate / Professional | 233 | 5.8% |
| Total | 4,048 | 100.0% |
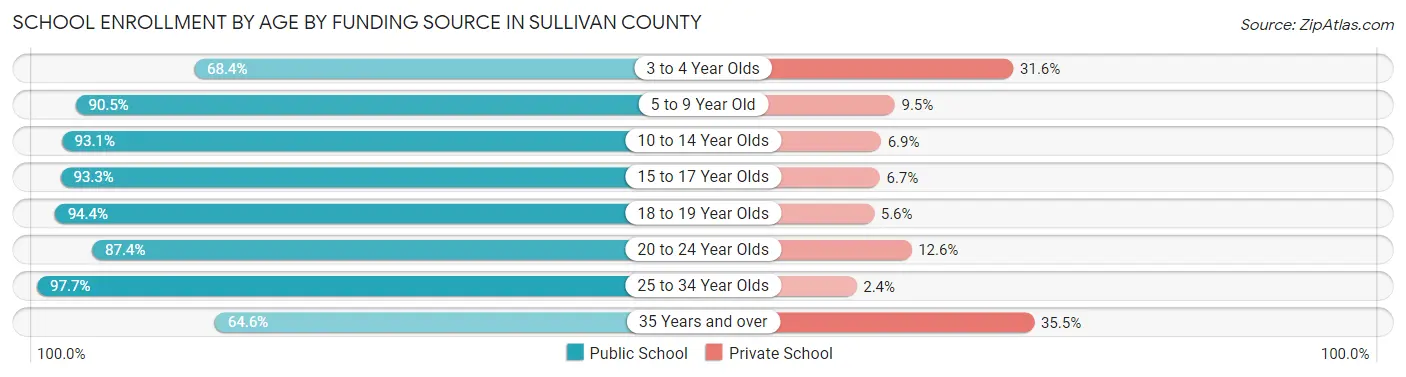
School Enrollment by Age by Funding Source in Sullivan County
Out of a total of 4,048 students who are enrolled in schools in Sullivan County, 417 (10.3%) attend a private institution, while the remaining 3,631 (89.7%) are enrolled in public schools. The age group of 35 years and over has the highest likelihood of being enrolled in private schools, with 78 (35.4% in the age bracket) enrolled. Conversely, the age group of 25 to 34 year olds has the lowest likelihood of being enrolled in a private school, with 208 (97.7% in the age bracket) attending a public institution.
| Age Bracket | Public School | Private School |
| 3 to 4 Year Olds | 154 (68.4%) | 71 (31.6%) |
| 5 to 9 Year Old | 869 (90.5%) | 91 (9.5%) |
| 10 to 14 Year Olds | 1,188 (93.1%) | 88 (6.9%) |
| 15 to 17 Year Olds | 629 (93.3%) | 45 (6.7%) |
| 18 to 19 Year Olds | 303 (94.4%) | 18 (5.6%) |
| 20 to 24 Year Olds | 139 (87.4%) | 20 (12.6%) |
| 25 to 34 Year Olds | 208 (97.7%) | 5 (2.4%) |
| 35 Years and over | 142 (64.5%) | 78 (35.4%) |
| Total | 3,631 (89.7%) | 417 (10.3%) |
Educational Attainment by Field of Study in Sullivan County
Education (427 | 19.5%), science & technology (366 | 16.7%), business (325 | 14.8%), arts & humanities (169 | 7.7%), and engineering (164 | 7.5%) are the most common fields of study among 2,189 individuals in Sullivan County who have obtained a bachelor's degree or higher.

| Field of Study | # Graduates | % Graduates |
| Computers & Mathematics | 30 | 1.4% |
| Bio, Nature & Agricultural | 72 | 3.3% |
| Physical & Health Sciences | 70 | 3.2% |
| Psychology | 132 | 6.0% |
| Social Sciences | 147 | 6.7% |
| Engineering | 164 | 7.5% |
| Multidisciplinary Studies | 13 | 0.6% |
| Science & Technology | 366 | 16.7% |
| Business | 325 | 14.8% |
| Education | 427 | 19.5% |
| Literature & Languages | 39 | 1.8% |
| Liberal Arts & History | 145 | 6.6% |
| Visual & Performing Arts | 64 | 2.9% |
| Communications | 26 | 1.2% |
| Arts & Humanities | 169 | 7.7% |
| Total | 2,189 | 100.0% |
Transportation & Commute in Sullivan County
Vehicle Availability by Sex in Sullivan County
The most prevalent vehicle ownership categories in Sullivan County are males with 2 vehicles (1,767, accounting for 37.7%) and females with 2 vehicles (1,213, making up 44.1%).
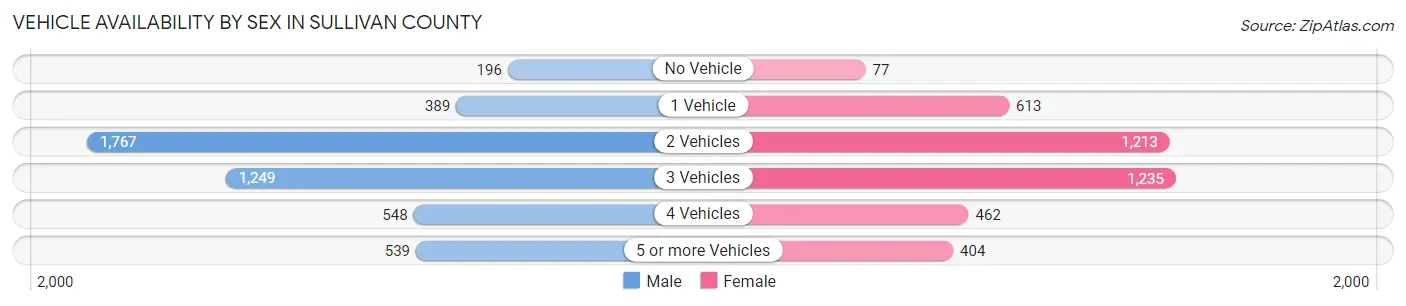
| Vehicles Available | Male | Female |
| No Vehicle | 196 (4.2%) | 77 (1.9%) |
| 1 Vehicle | 389 (8.3%) | 613 (15.3%) |
| 2 Vehicles | 1,767 (37.7%) | 1,213 (30.3%) |
| 3 Vehicles | 1,249 (26.6%) | 1,235 (30.8%) |
| 4 Vehicles | 548 (11.7%) | 462 (11.5%) |
| 5 or more Vehicles | 539 (11.5%) | 404 (10.1%) |
| Total | 4,688 (100.0%) | 4,004 (100.0%) |
Commute Time in Sullivan County
The most frequently occuring commute durations in Sullivan County are 5 to 9 minutes (1,325 commuters, 15.6%), 30 to 34 minutes (1,043 commuters, 12.3%), and 15 to 19 minutes (1,022 commuters, 12.0%).
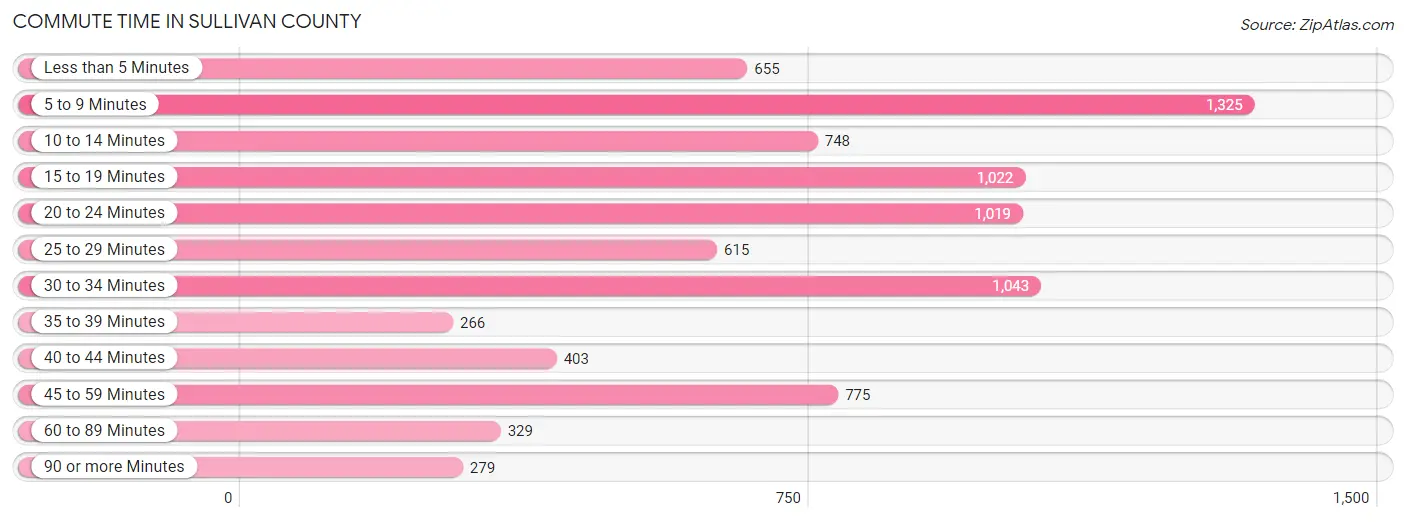
| Commute Time | # Commuters | % Commuters |
| Less than 5 Minutes | 655 | 7.7% |
| 5 to 9 Minutes | 1,325 | 15.6% |
| 10 to 14 Minutes | 748 | 8.8% |
| 15 to 19 Minutes | 1,022 | 12.0% |
| 20 to 24 Minutes | 1,019 | 12.0% |
| 25 to 29 Minutes | 615 | 7.2% |
| 30 to 34 Minutes | 1,043 | 12.3% |
| 35 to 39 Minutes | 266 | 3.1% |
| 40 to 44 Minutes | 403 | 4.8% |
| 45 to 59 Minutes | 775 | 9.1% |
| 60 to 89 Minutes | 329 | 3.9% |
| 90 or more Minutes | 279 | 3.3% |
Commute Time by Sex in Sullivan County
The most common commute times in Sullivan County are 30 to 34 minutes (627 commuters, 13.8%) for males and 5 to 9 minutes (742 commuters, 18.9%) for females.

| Commute Time | Male | Female |
| Less than 5 Minutes | 324 (7.1%) | 331 (8.4%) |
| 5 to 9 Minutes | 583 (12.8%) | 742 (18.9%) |
| 10 to 14 Minutes | 418 (9.2%) | 330 (8.4%) |
| 15 to 19 Minutes | 572 (12.6%) | 450 (11.5%) |
| 20 to 24 Minutes | 445 (9.8%) | 574 (14.6%) |
| 25 to 29 Minutes | 278 (6.1%) | 337 (8.6%) |
| 30 to 34 Minutes | 627 (13.8%) | 416 (10.6%) |
| 35 to 39 Minutes | 178 (3.9%) | 88 (2.2%) |
| 40 to 44 Minutes | 263 (5.8%) | 140 (3.6%) |
| 45 to 59 Minutes | 404 (8.9%) | 371 (9.5%) |
| 60 to 89 Minutes | 237 (5.2%) | 92 (2.4%) |
| 90 or more Minutes | 228 (5.0%) | 51 (1.3%) |
Time of Departure to Work by Sex in Sullivan County
The most frequent times of departure to work in Sullivan County are 7:00 AM to 7:29 AM (668, 14.7%) for males and 7:00 AM to 7:29 AM (654, 16.7%) for females.
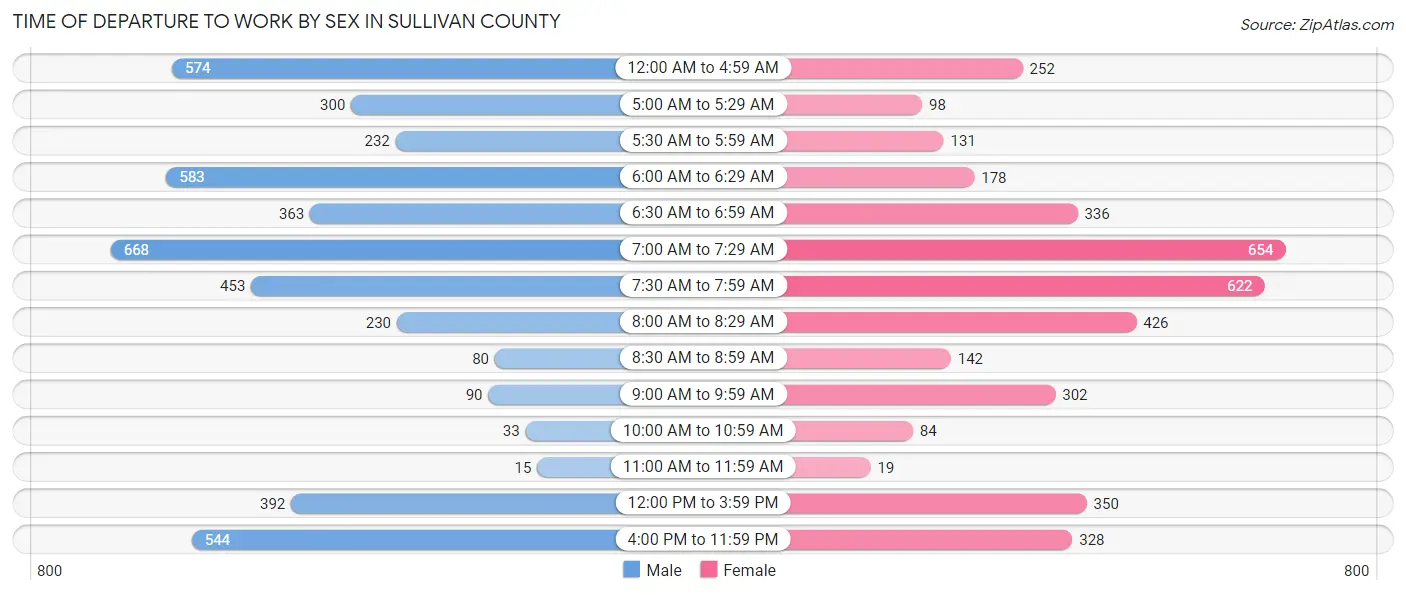
| Time of Departure | Male | Female |
| 12:00 AM to 4:59 AM | 574 (12.6%) | 252 (6.4%) |
| 5:00 AM to 5:29 AM | 300 (6.6%) | 98 (2.5%) |
| 5:30 AM to 5:59 AM | 232 (5.1%) | 131 (3.3%) |
| 6:00 AM to 6:29 AM | 583 (12.8%) | 178 (4.5%) |
| 6:30 AM to 6:59 AM | 363 (8.0%) | 336 (8.6%) |
| 7:00 AM to 7:29 AM | 668 (14.7%) | 654 (16.7%) |
| 7:30 AM to 7:59 AM | 453 (9.9%) | 622 (15.9%) |
| 8:00 AM to 8:29 AM | 230 (5.1%) | 426 (10.9%) |
| 8:30 AM to 8:59 AM | 80 (1.8%) | 142 (3.6%) |
| 9:00 AM to 9:59 AM | 90 (2.0%) | 302 (7.7%) |
| 10:00 AM to 10:59 AM | 33 (0.7%) | 84 (2.1%) |
| 11:00 AM to 11:59 AM | 15 (0.3%) | 19 (0.5%) |
| 12:00 PM to 3:59 PM | 392 (8.6%) | 350 (8.9%) |
| 4:00 PM to 11:59 PM | 544 (11.9%) | 328 (8.4%) |
| Total | 4,557 (100.0%) | 3,922 (100.0%) |
Housing Occupancy in Sullivan County
Occupancy by Ownership in Sullivan County
Of the total 7,709 dwellings in Sullivan County, owner-occupied units account for 5,853 (75.9%), while renter-occupied units make up 1,856 (24.1%).

| Occupancy | # Housing Units | % Housing Units |
| Owner Occupied Housing Units | 5,853 | 75.9% |
| Renter-Occupied Housing Units | 1,856 | 24.1% |
| Total Occupied Housing Units | 7,709 | 100.0% |
Occupancy by Household Size in Sullivan County

| Household Size | # Housing Units | % Housing Units |
| 1-Person Household | 1,993 | 25.9% |
| 2-Person Household | 2,836 | 36.8% |
| 3-Person Household | 997 | 12.9% |
| 4+ Person Household | 1,883 | 24.4% |
| Total Housing Units | 7,709 | 100.0% |
Occupancy by Ownership by Household Size in Sullivan County

| Household Size | Owner-occupied | Renter-occupied |
| 1-Person Household | 1,246 (62.5%) | 747 (37.5%) |
| 2-Person Household | 2,325 (82.0%) | 511 (18.0%) |
| 3-Person Household | 728 (73.0%) | 269 (27.0%) |
| 4+ Person Household | 1,554 (82.5%) | 329 (17.5%) |
| Total Housing Units | 5,853 (75.9%) | 1,856 (24.1%) |
Occupancy by Educational Attainment in Sullivan County
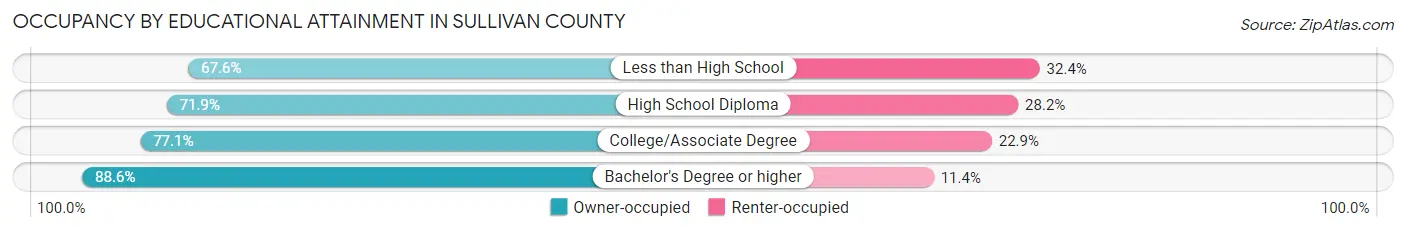
| Household Size | Owner-occupied | Renter-occupied |
| Less than High School | 490 (67.6%) | 235 (32.4%) |
| High School Diploma | 2,065 (71.9%) | 809 (28.1%) |
| College/Associate Degree | 2,296 (77.1%) | 683 (22.9%) |
| Bachelor's Degree or higher | 1,002 (88.6%) | 129 (11.4%) |
Occupancy by Age of Householder in Sullivan County

| Age Bracket | # Households | % Households |
| Under 35 Years | 1,426 | 18.5% |
| 35 to 44 Years | 1,247 | 16.2% |
| 45 to 54 Years | 1,341 | 17.4% |
| 55 to 64 Years | 1,520 | 19.7% |
| 65 to 74 Years | 1,165 | 15.1% |
| 75 to 84 Years | 730 | 9.5% |
| 85 Years and Over | 280 | 3.6% |
| Total | 7,709 | 100.0% |
Housing Finances in Sullivan County
Median Income by Occupancy in Sullivan County
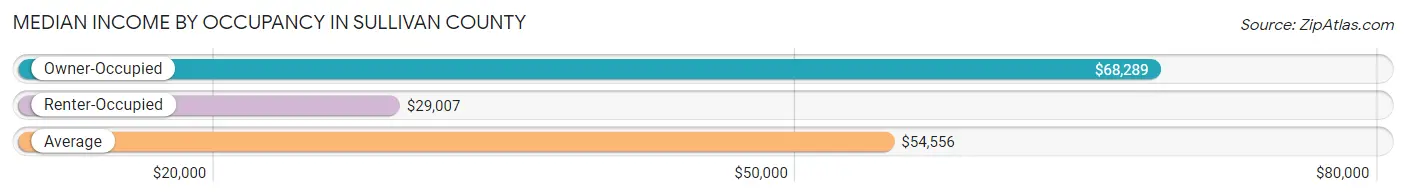
| Occupancy Type | # Households | Median Income |
| Owner-Occupied | 5,853 (75.9%) | $68,289 |
| Renter-Occupied | 1,856 (24.1%) | $29,007 |
| Average | 7,709 (100.0%) | $54,556 |
Occupancy by Householder Income Bracket in Sullivan County
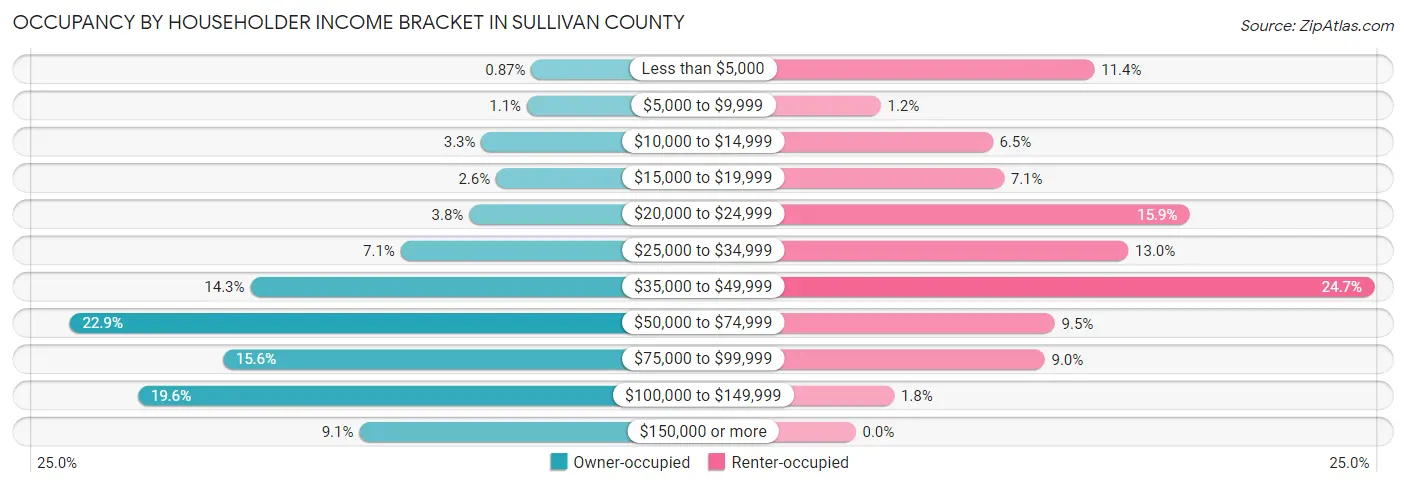
| Income Bracket | Owner-occupied | Renter-occupied |
| Less than $5,000 | 51 (0.9%) | 211 (11.4%) |
| $5,000 to $9,999 | 63 (1.1%) | 22 (1.2%) |
| $10,000 to $14,999 | 190 (3.3%) | 121 (6.5%) |
| $15,000 to $19,999 | 149 (2.5%) | 131 (7.1%) |
| $20,000 to $24,999 | 224 (3.8%) | 295 (15.9%) |
| $25,000 to $34,999 | 415 (7.1%) | 241 (13.0%) |
| $35,000 to $49,999 | 834 (14.2%) | 458 (24.7%) |
| $50,000 to $74,999 | 1,338 (22.9%) | 176 (9.5%) |
| $75,000 to $99,999 | 911 (15.6%) | 167 (9.0%) |
| $100,000 to $149,999 | 1,148 (19.6%) | 34 (1.8%) |
| $150,000 or more | 530 (9.1%) | 0 (0.0%) |
| Total | 5,853 (100.0%) | 1,856 (100.0%) |
Monthly Housing Cost Tiers in Sullivan County

| Monthly Cost | Owner-occupied | Renter-occupied |
| Less than $300 | 452 (7.7%) | 29 (1.6%) |
| $300 to $499 | 1,111 (19.0%) | 196 (10.6%) |
| $500 to $799 | 1,077 (18.4%) | 597 (32.2%) |
| $800 to $999 | 1,297 (22.2%) | 458 (24.7%) |
| $1,000 to $1,499 | 1,343 (23.0%) | 204 (11.0%) |
| $1,500 to $1,999 | 424 (7.2%) | 142 (7.6%) |
| $2,000 to $2,499 | 91 (1.5%) | 8 (0.4%) |
| $2,500 to $2,999 | 24 (0.4%) | 0 (0.0%) |
| $3,000 or more | 34 (0.6%) | 0 (0.0%) |
| Total | 5,853 (100.0%) | 1,856 (100.0%) |
Physical Housing Characteristics in Sullivan County
Housing Structures in Sullivan County

| Structure Type | # Housing Units | % Housing Units |
| Single Unit, Detached | 6,299 | 81.7% |
| Single Unit, Attached | 35 | 0.4% |
| 2 Unit Apartments | 261 | 3.4% |
| 3 or 4 Unit Apartments | 16 | 0.2% |
| 5 to 9 Unit Apartments | 170 | 2.2% |
| 10 or more Apartments | 200 | 2.6% |
| Mobile Home / Other | 728 | 9.4% |
| Total | 7,709 | 100.0% |
Housing Structures by Occupancy in Sullivan County
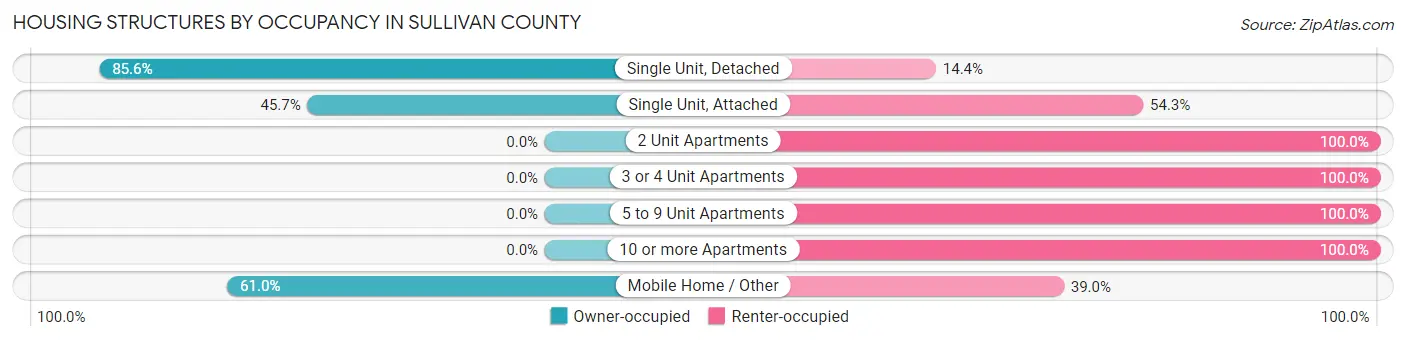
| Structure Type | Owner-occupied | Renter-occupied |
| Single Unit, Detached | 5,393 (85.6%) | 906 (14.4%) |
| Single Unit, Attached | 16 (45.7%) | 19 (54.3%) |
| 2 Unit Apartments | 0 (0.0%) | 261 (100.0%) |
| 3 or 4 Unit Apartments | 0 (0.0%) | 16 (100.0%) |
| 5 to 9 Unit Apartments | 0 (0.0%) | 170 (100.0%) |
| 10 or more Apartments | 0 (0.0%) | 200 (100.0%) |
| Mobile Home / Other | 444 (61.0%) | 284 (39.0%) |
| Total | 5,853 (75.9%) | 1,856 (24.1%) |
Housing Structures by Number of Rooms in Sullivan County
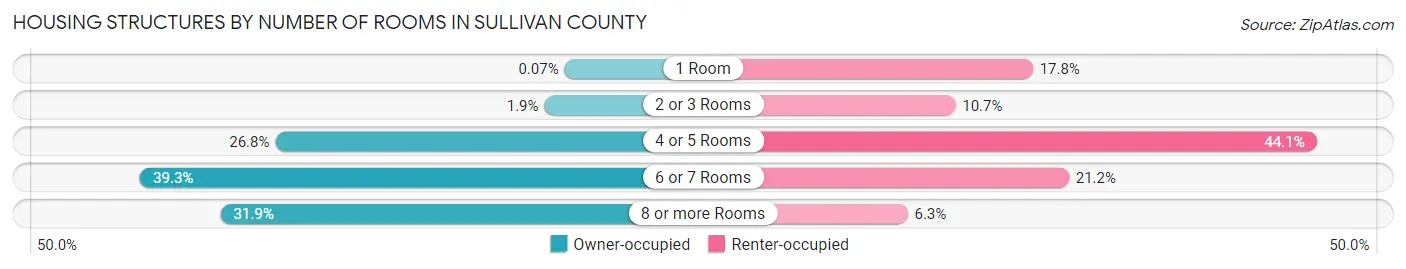
| Number of Rooms | Owner-occupied | Renter-occupied |
| 1 Room | 4 (0.1%) | 331 (17.8%) |
| 2 or 3 Rooms | 113 (1.9%) | 198 (10.7%) |
| 4 or 5 Rooms | 1,569 (26.8%) | 818 (44.1%) |
| 6 or 7 Rooms | 2,301 (39.3%) | 393 (21.2%) |
| 8 or more Rooms | 1,866 (31.9%) | 116 (6.2%) |
| Total | 5,853 (100.0%) | 1,856 (100.0%) |
Housing Structure by Heating Type in Sullivan County
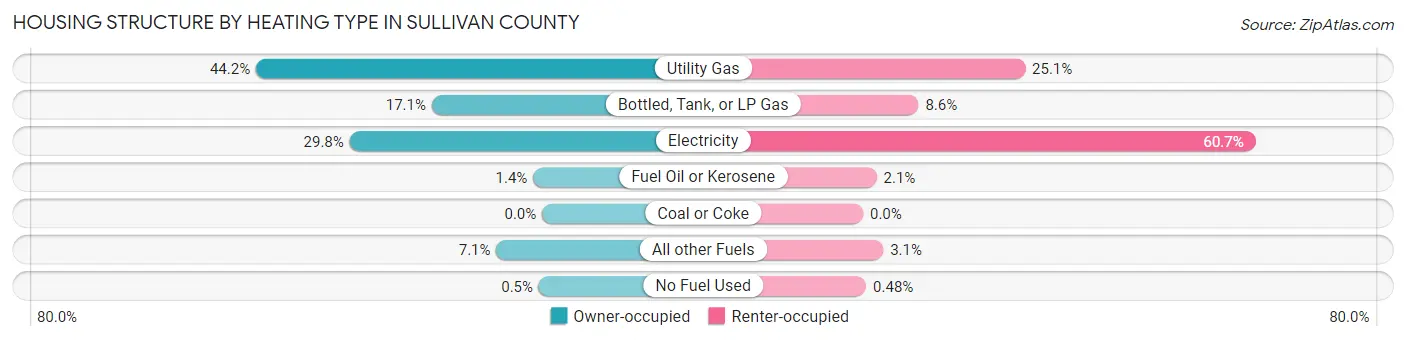
| Heating Type | Owner-occupied | Renter-occupied |
| Utility Gas | 2,589 (44.2%) | 465 (25.1%) |
| Bottled, Tank, or LP Gas | 998 (17.1%) | 159 (8.6%) |
| Electricity | 1,742 (29.8%) | 1,126 (60.7%) |
| Fuel Oil or Kerosene | 81 (1.4%) | 39 (2.1%) |
| Coal or Coke | 0 (0.0%) | 0 (0.0%) |
| All other Fuels | 414 (7.1%) | 58 (3.1%) |
| No Fuel Used | 29 (0.5%) | 9 (0.5%) |
| Total | 5,853 (100.0%) | 1,856 (100.0%) |
Household Vehicle Usage in Sullivan County

| Vehicles per Household | Owner-occupied | Renter-occupied |
| No Vehicle | 153 (2.6%) | 207 (11.2%) |
| 1 Vehicle | 1,017 (17.4%) | 965 (52.0%) |
| 2 Vehicles | 2,383 (40.7%) | 524 (28.2%) |
| 3 or more Vehicles | 2,300 (39.3%) | 160 (8.6%) |
| Total | 5,853 (100.0%) | 1,856 (100.0%) |
Real Estate & Mortgages in Sullivan County
Real Estate and Mortgage Overview in Sullivan County
| Characteristic | Without Mortgage | With Mortgage |
| Housing Units | 2,254 | 3,599 |
| Median Property Value | $95,100 | $125,700 |
| Median Household Income | $51,537 | $310 |
| Monthly Housing Costs | $446 | $31 |
| Real Estate Taxes | $755 | $253 |
Property Value by Mortgage Status in Sullivan County

| Property Value | Without Mortgage | With Mortgage |
| Less than $50,000 | 574 (25.5%) | 277 (7.7%) |
| $50,000 to $99,999 | 635 (28.2%) | 1,044 (29.0%) |
| $100,000 to $299,999 | 654 (29.0%) | 2,087 (58.0%) |
| $300,000 to $499,999 | 348 (15.4%) | 175 (4.9%) |
| $500,000 to $749,999 | 29 (1.3%) | 16 (0.4%) |
| $750,000 to $999,999 | 0 (0.0%) | 0 (0.0%) |
| $1,000,000 or more | 14 (0.6%) | 0 (0.0%) |
| Total | 2,254 (100.0%) | 3,599 (100.0%) |
Household Income by Mortgage Status in Sullivan County
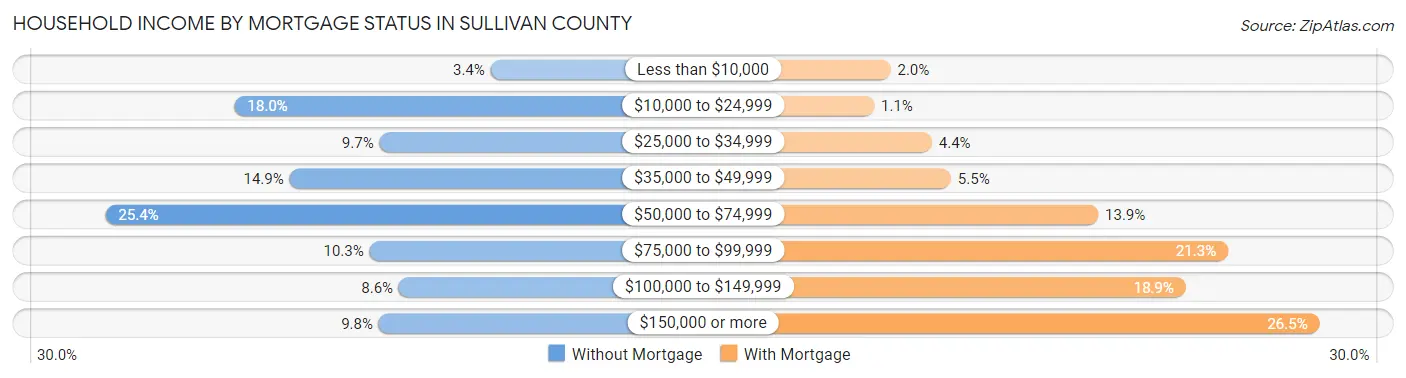
| Household Income | Without Mortgage | With Mortgage |
| Less than $10,000 | 76 (3.4%) | 72 (2.0%) |
| $10,000 to $24,999 | 406 (18.0%) | 38 (1.1%) |
| $25,000 to $34,999 | 219 (9.7%) | 157 (4.4%) |
| $35,000 to $49,999 | 335 (14.9%) | 196 (5.4%) |
| $50,000 to $74,999 | 572 (25.4%) | 499 (13.9%) |
| $75,000 to $99,999 | 232 (10.3%) | 766 (21.3%) |
| $100,000 to $149,999 | 194 (8.6%) | 679 (18.9%) |
| $150,000 or more | 220 (9.8%) | 954 (26.5%) |
| Total | 2,254 (100.0%) | 3,599 (100.0%) |
Property Value to Household Income Ratio in Sullivan County

| Value-to-Income Ratio | Without Mortgage | With Mortgage |
| Less than 2.0x | 1,119 (49.6%) | 82,074 (2,280.5%) |
| 2.0x to 2.9x | 354 (15.7%) | 2,250 (62.5%) |
| 3.0x to 3.9x | 273 (12.1%) | 653 (18.1%) |
| 4.0x or more | 502 (22.3%) | 354 (9.8%) |
| Total | 2,254 (100.0%) | 3,599 (100.0%) |
Real Estate Taxes by Mortgage Status in Sullivan County
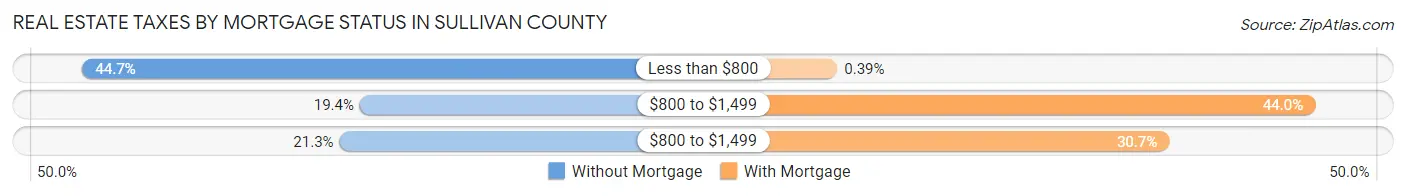
| Property Taxes | Without Mortgage | With Mortgage |
| Less than $800 | 1,008 (44.7%) | 14 (0.4%) |
| $800 to $1,499 | 437 (19.4%) | 1,584 (44.0%) |
| $800 to $1,499 | 479 (21.2%) | 1,105 (30.7%) |
| Total | 2,254 (100.0%) | 3,599 (100.0%) |
Health & Disability in Sullivan County
Health Insurance Coverage by Age in Sullivan County

| Age Bracket | With Coverage | Without Coverage |
| Under 6 Years | 1,299 (99.1%) | 12 (0.9%) |
| 6 to 18 Years | 2,542 (82.1%) | 555 (17.9%) |
| 19 to 25 Years | 1,415 (88.5%) | 183 (11.5%) |
| 26 to 34 Years | 1,877 (91.3%) | 179 (8.7%) |
| 35 to 44 Years | 1,975 (87.5%) | 282 (12.5%) |
| 45 to 54 Years | 2,184 (90.9%) | 218 (9.1%) |
| 55 to 64 Years | 2,220 (90.9%) | 222 (9.1%) |
| 65 to 74 Years | 2,148 (99.7%) | 7 (0.3%) |
| 75 Years and older | 1,432 (99.7%) | 4 (0.3%) |
| Total | 17,092 (91.1%) | 1,662 (8.9%) |
Health Insurance Coverage by Citizenship Status in Sullivan County
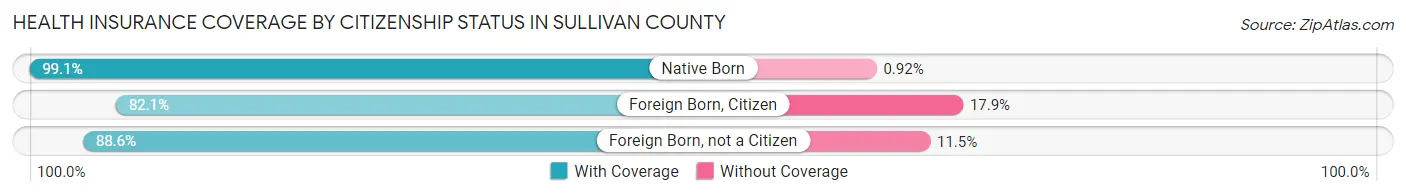
| Citizenship Status | With Coverage | Without Coverage |
| Native Born | 1,299 (99.1%) | 12 (0.9%) |
| Foreign Born, Citizen | 2,542 (82.1%) | 555 (17.9%) |
| Foreign Born, not a Citizen | 1,415 (88.5%) | 183 (11.5%) |
Health Insurance Coverage by Household Income in Sullivan County

| Household Income | With Coverage | Without Coverage |
| Under $25,000 | 2,365 (87.7%) | 331 (12.3%) |
| $25,000 to $49,999 | 3,598 (86.7%) | 551 (13.3%) |
| $50,000 to $74,999 | 3,186 (94.3%) | 192 (5.7%) |
| $75,000 to $99,999 | 2,787 (89.9%) | 314 (10.1%) |
| $100,000 and over | 5,132 (95.1%) | 266 (4.9%) |
Public vs Private Health Insurance Coverage by Age in Sullivan County
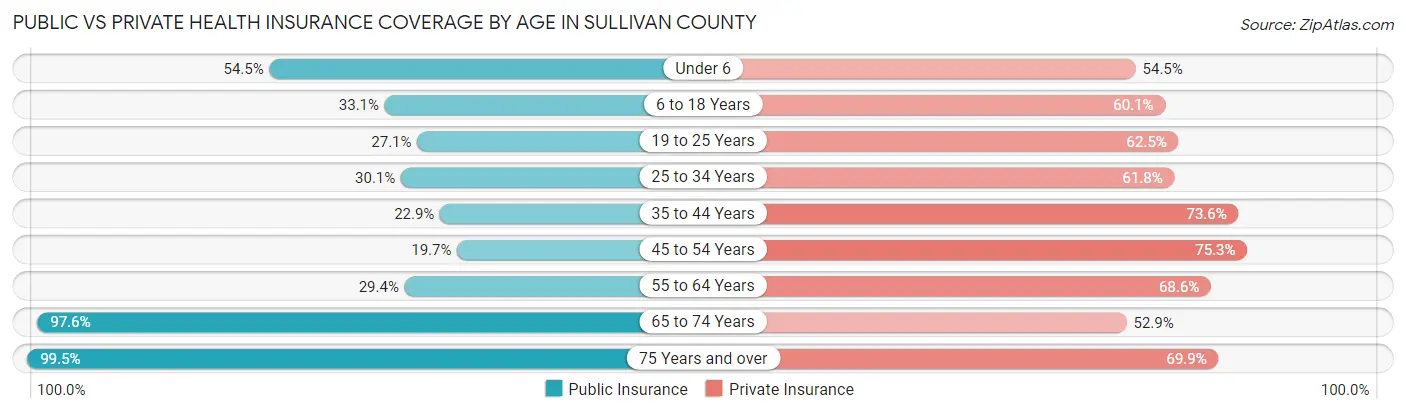
| Age Bracket | Public Insurance | Private Insurance |
| Under 6 | 715 (54.5%) | 715 (54.5%) |
| 6 to 18 Years | 1,026 (33.1%) | 1,860 (60.1%) |
| 19 to 25 Years | 433 (27.1%) | 999 (62.5%) |
| 25 to 34 Years | 619 (30.1%) | 1,270 (61.8%) |
| 35 to 44 Years | 516 (22.9%) | 1,662 (73.6%) |
| 45 to 54 Years | 473 (19.7%) | 1,808 (75.3%) |
| 55 to 64 Years | 719 (29.4%) | 1,674 (68.5%) |
| 65 to 74 Years | 2,104 (97.6%) | 1,139 (52.8%) |
| 75 Years and over | 1,429 (99.5%) | 1,004 (69.9%) |
| Total | 8,034 (42.8%) | 12,131 (64.7%) |
Disability Status by Sex by Age in Sullivan County
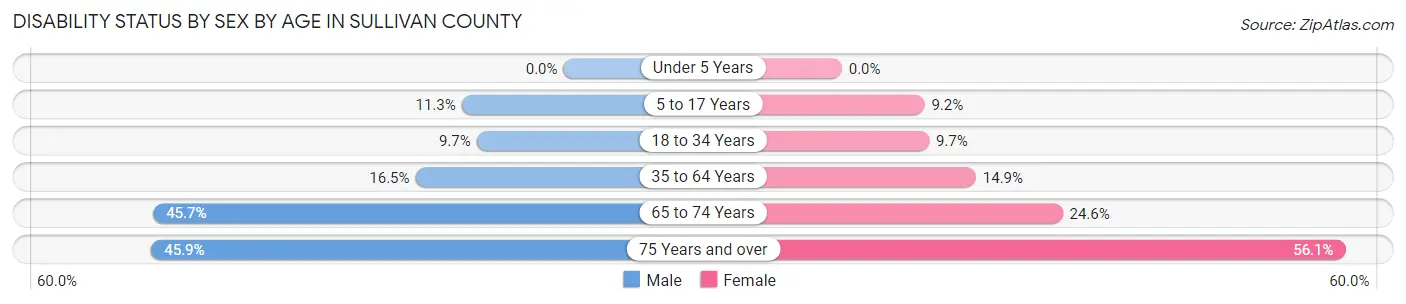
| Age Bracket | Male | Female |
| Under 5 Years | 0 (0.0%) | 0 (0.0%) |
| 5 to 17 Years | 168 (11.3%) | 142 (9.2%) |
| 18 to 34 Years | 202 (9.7%) | 179 (9.7%) |
| 35 to 64 Years | 564 (16.5%) | 549 (14.9%) |
| 65 to 74 Years | 464 (45.7%) | 280 (24.6%) |
| 75 Years and over | 262 (45.9%) | 485 (56.1%) |
Disability Class by Sex by Age in Sullivan County
Disability Class: Hearing Difficulty

| Age Bracket | Male | Female |
| Under 5 Years | 0 (0.0%) | 0 (0.0%) |
| 5 to 17 Years | 9 (0.6%) | 4 (0.3%) |
| 18 to 34 Years | 5 (0.2%) | 0 (0.0%) |
| 35 to 64 Years | 150 (4.4%) | 145 (3.9%) |
| 65 to 74 Years | 161 (15.9%) | 66 (5.8%) |
| 75 Years and over | 119 (20.8%) | 195 (22.5%) |
Disability Class: Vision Difficulty

| Age Bracket | Male | Female |
| Under 5 Years | 0 (0.0%) | 0 (0.0%) |
| 5 to 17 Years | 22 (1.5%) | 4 (0.3%) |
| 18 to 34 Years | 29 (1.4%) | 22 (1.2%) |
| 35 to 64 Years | 104 (3.0%) | 100 (2.7%) |
| 65 to 74 Years | 75 (7.4%) | 42 (3.7%) |
| 75 Years and over | 79 (13.8%) | 34 (3.9%) |
Disability Class: Cognitive Difficulty

| Age Bracket | Male | Female |
| 5 to 17 Years | 142 (9.6%) | 134 (8.7%) |
| 18 to 34 Years | 76 (3.6%) | 95 (5.1%) |
| 35 to 64 Years | 173 (5.1%) | 222 (6.0%) |
| 65 to 74 Years | 62 (6.1%) | 62 (5.4%) |
| 75 Years and over | 43 (7.5%) | 123 (14.2%) |
Disability Class: Ambulatory Difficulty

| Age Bracket | Male | Female |
| 5 to 17 Years | 5 (0.3%) | 11 (0.7%) |
| 18 to 34 Years | 39 (1.9%) | 17 (0.9%) |
| 35 to 64 Years | 323 (9.4%) | 362 (9.8%) |
| 65 to 74 Years | 249 (24.5%) | 152 (13.4%) |
| 75 Years and over | 170 (29.8%) | 350 (40.5%) |
Disability Class: Self-Care Difficulty

| Age Bracket | Male | Female |
| 5 to 17 Years | 31 (2.1%) | 44 (2.9%) |
| 18 to 34 Years | 42 (2.0%) | 17 (0.9%) |
| 35 to 64 Years | 122 (3.6%) | 60 (1.6%) |
| 65 to 74 Years | 24 (2.4%) | 63 (5.5%) |
| 75 Years and over | 33 (5.8%) | 93 (10.7%) |
Technology Access in Sullivan County
Computing Device Access in Sullivan County

| Device Type | # Households | % Households |
| Desktop or Laptop | 5,112 | 66.3% |
| Smartphone | 6,485 | 84.1% |
| Tablet | 4,405 | 57.1% |
| No Computing Device | 786 | 10.2% |
| Total | 7,709 | 100.0% |
Internet Access in Sullivan County
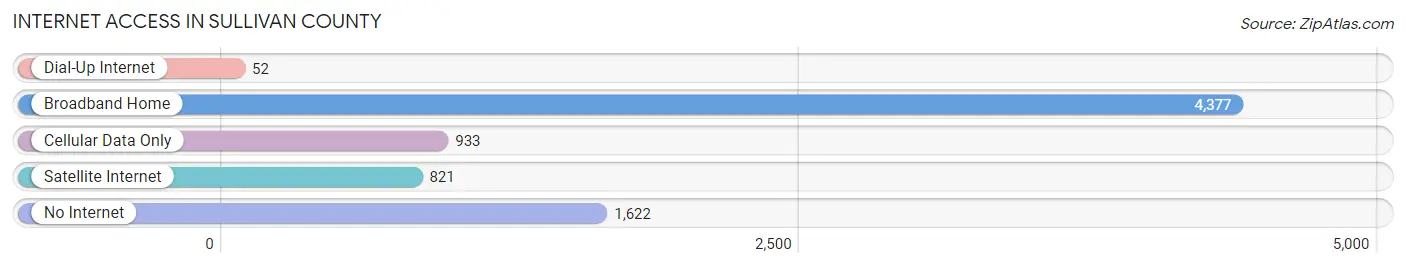
| Internet Type | # Households | % Households |
| Dial-Up Internet | 52 | 0.7% |
| Broadband Home | 4,377 | 56.8% |
| Cellular Data Only | 933 | 12.1% |
| Satellite Internet | 821 | 10.6% |
| No Internet | 1,622 | 21.0% |
| Total | 7,709 | 100.0% |
Sullivan County Summary
Sullivan County is located in the southwestern part of the state of Indiana, in the United States. It is bordered by Clay County to the north, Greene County to the east, Vigo County to the south, and Vermillion County to the west. The county seat is Sullivan, and the largest city is Sullivan. The county was established in 1817 and named for General John Sullivan, a Revolutionary War hero.
History
The area that is now Sullivan County was originally inhabited by the Miami, Potawatomi, and Shawnee Native American tribes. The first European settlers arrived in the area in the early 1800s. The county was officially established in 1817 and named for General John Sullivan, a Revolutionary War hero.
The county was largely agricultural in its early years, with the main crops being corn, wheat, and oats. The county also had a thriving timber industry, with the majority of the timber being used for railroad ties and other construction materials.
In the late 1800s, the county began to experience a period of industrial growth. The first coal mine opened in 1883, and by the early 1900s, the county was home to several coal mines. The coal industry provided jobs for many of the county’s residents and helped to fuel the local economy.
In the early 1900s, the county also experienced a period of population growth. The population increased from 8,000 in 1900 to over 10,000 by 1910. This growth was largely due to the influx of immigrants from Europe, particularly from Germany and Ireland.
Geography
Sullivan County is located in the southwestern part of the state of Indiana. It is bordered by Clay County to the north, Greene County to the east, Vigo County to the south, and Vermillion County to the west. The county has a total area of 441 square miles, of which 437 square miles is land and 4 square miles is water.
The county is mostly flat, with some rolling hills in the northern and eastern parts of the county. The Wabash River forms the western border of the county, and the White River forms the eastern border. The county is home to several small lakes, including Lake Sullivan, Lake Lemon, and Lake Monroe.
Economy
The economy of Sullivan County is largely based on agriculture and manufacturing. The county is home to several large farms, which produce corn, soybeans, wheat, and other crops. The county also has a thriving timber industry, with the majority of the timber being used for railroad ties and other construction materials.
The county is also home to several manufacturing companies, including a steel mill, a paper mill, and a plastics plant. The county also has a growing tourism industry, with several popular attractions, such as the Sullivan County Museum and the Sullivan County Historical Society.
Demographics
As of the 2010 census, the population of Sullivan County was 21,813. The racial makeup of the county was 95.3% White, 1.2% African American, 0.3% Native American, 0.4% Asian, 0.1% Pacific Islander, 1.3% from other races, and 1.4% from two or more races. Hispanic or Latino of any race were 3.2% of the population.
The median income for a household in the county was $41,945, and the median income for a family was $50,945. The per capita income for the county was $20,845. About 11.2% of families and 14.2% of the population were below the poverty line, including 19.2% of those under age 18 and 8.2% of those age 65 or over.
Common Questions
What is the Total Population of Sullivan County?
Total Population of Sullivan County is 20,791.
What is the Total Male Population of Sullivan County?
Total Male Population of Sullivan County is 11,140.
What is the Total Female Population of Sullivan County?
Total Female Population of Sullivan County is 9,651.
What is the Ratio of Males per 100 Females in Sullivan County?
There are 115.43 Males per 100 Females in Sullivan County.
What is the Ratio of Females per 100 Males in Sullivan County?
There are 86.63 Females per 100 Males in Sullivan County.
What is the Median Population Age in Sullivan County?
Median Population Age in Sullivan County is 40.9 Years.
What is the Average Family Size in Sullivan County
Average Family Size in Sullivan County is 2.9 People.
What is the Average Household Size in Sullivan County
Average Household Size in Sullivan County is 2.4 People.
What is Per Capita Income in Sullivan County?
Per Capita income in Sullivan County is $27,792.
What is the Median Family Income in Sullivan County?
Median Family Income in Sullivan County is $70,981.
What is the Median Household income in Sullivan County?
Median Household Income in Sullivan County is $54,556.
What is Income or Wage Gap in Sullivan County?
Income or Wage Gap in Sullivan County is 27.1%.
Women in Sullivan County earn 72.9 cents for every dollar earned by a man.
What is Family Income Deficit in Sullivan County?
Family Income Deficit in Sullivan County is $12,093.
Families that are below poverty line in Sullivan County earn $12,093 less on average than the poverty threshold level.
What is Inequality or Gini Index in Sullivan County?
Inequality or Gini Index in Sullivan County is 0.41.
How Large is the Labor Force in Sullivan County?
There are 9,408 People in the Labor Forcein in Sullivan County.
What is the Percentage of People in the Labor Force in Sullivan County?
54.9% of People are in the Labor Force in Sullivan County.
What is the Unemployment Rate in Sullivan County?
Unemployment Rate in Sullivan County is 5.0%.