Starke County, IN
Starke County Map
Starke County Overview
23,308
TOTAL POPULATION
11,724
MALE POPULATION
11,584
FEMALE POPULATION
101.21
MALES / 100 FEMALES
98.81
FEMALES / 100 MALES
41.7
MEDIAN AGE
3.3
AVG FAMILY SIZE
2.7
AVG HOUSEHOLD SIZE
$28,788
PER CAPITA INCOME
$73,212
AVG FAMILY INCOME
$59,916
AVG HOUSEHOLD INCOME
43.0%
WAGE / INCOME GAP [ % ]
57.0¢/ $1
WAGE / INCOME GAP [ $ ]
$8,342
FAMILY INCOME DEFICIT
0.43
INEQUALITY / GINI INDEX
9,956
LABOR FORCE [ PEOPLE ]
53.7%
PERCENT IN LABOR FORCE
4.0%
UNEMPLOYMENT RATE
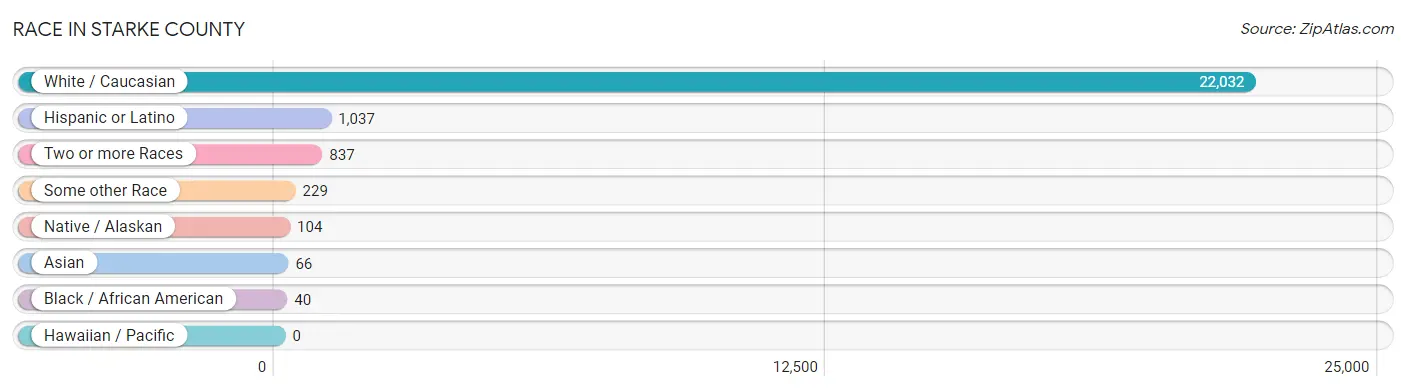
Race in Starke County
The most populous races in Starke County are White / Caucasian (22,032 | 94.5%), Hispanic or Latino (1,037 | 4.4%), and Two or more Races (837 | 3.6%).
| Race | # Population | % Population |
| Asian | 66 | 0.3% |
| Black / African American | 40 | 0.2% |
| Hawaiian / Pacific | 0 | 0.0% |
| Hispanic or Latino | 1,037 | 4.4% |
| Native / Alaskan | 104 | 0.4% |
| White / Caucasian | 22,032 | 94.5% |
| Two or more Races | 837 | 3.6% |
| Some other Race | 229 | 1.0% |
| Total | 23,308 | 100.0% |
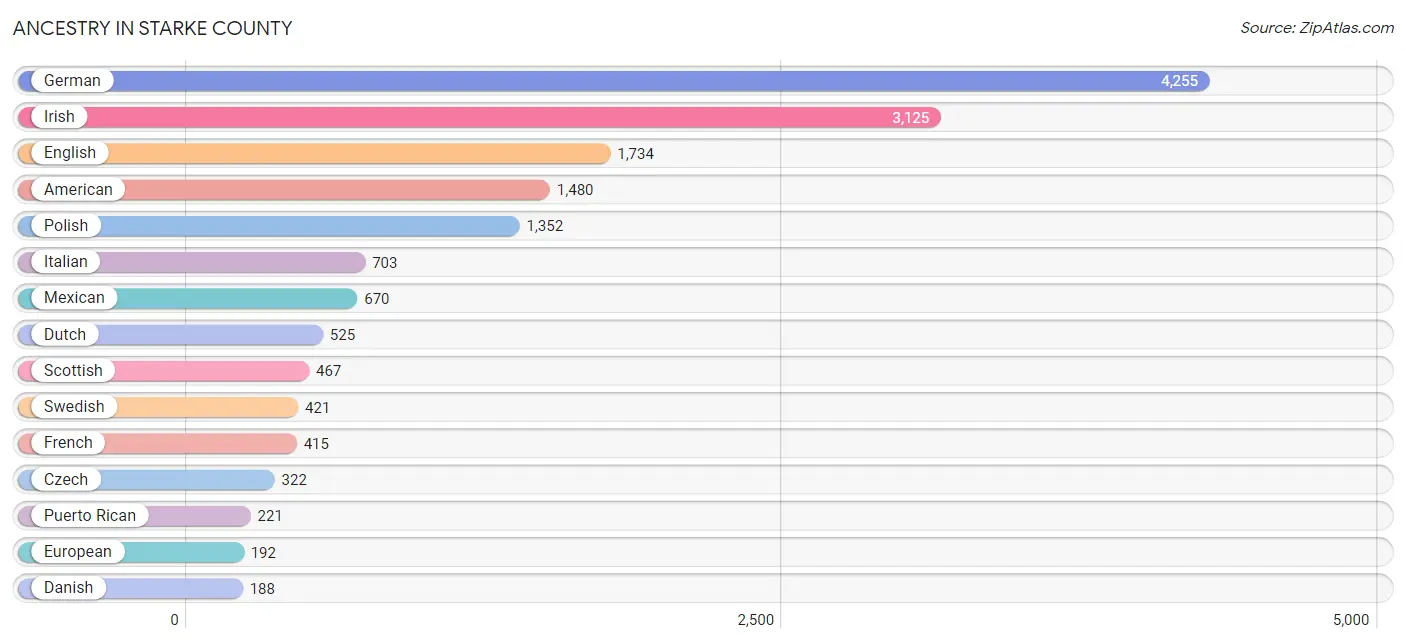
Ancestry in Starke County
The most populous ancestries reported in Starke County are German (4,255 | 18.3%), Irish (3,125 | 13.4%), English (1,734 | 7.4%), American (1,480 | 6.4%), and Polish (1,352 | 5.8%), together accounting for 51.3% of all Starke County residents.
| Ancestry | # Population | % Population |
| American | 1,480 | 6.4% |
| Arab | 3 | 0.0% |
| Assyrian / Chaldean / Syriac | 9 | 0.0% |
| Austrian | 111 | 0.5% |
| Belgian | 4 | 0.0% |
| Bhutanese | 10 | 0.0% |
| Blackfeet | 66 | 0.3% |
| British | 148 | 0.6% |
| Burmese | 8 | 0.0% |
| Central American | 74 | 0.3% |
| Cherokee | 119 | 0.5% |
| Chippewa | 33 | 0.1% |
| Croatian | 38 | 0.2% |
| Cuban | 27 | 0.1% |
| Czech | 322 | 1.4% |
| Czechoslovakian | 16 | 0.1% |
| Danish | 188 | 0.8% |
| Dutch | 525 | 2.2% |
| Eastern European | 54 | 0.2% |
| English | 1,734 | 7.4% |
| European | 192 | 0.8% |
| Finnish | 11 | 0.1% |
| French | 415 | 1.8% |
| French Canadian | 117 | 0.5% |
| German | 4,255 | 18.3% |
| Greek | 35 | 0.2% |
| Guatemalan | 74 | 0.3% |
| Hungarian | 110 | 0.5% |
| Indian (Asian) | 13 | 0.1% |
| Irish | 3,125 | 13.4% |
| Italian | 703 | 3.0% |
| Korean | 92 | 0.4% |
| Lithuanian | 117 | 0.5% |
| Mexican | 670 | 2.9% |
| Mexican American Indian | 4 | 0.0% |
| Norwegian | 96 | 0.4% |
| Pennsylvania German | 10 | 0.0% |
| Polish | 1,352 | 5.8% |
| Portuguese | 11 | 0.1% |
| Puerto Rican | 221 | 0.9% |
| Romanian | 184 | 0.8% |
| Russian | 12 | 0.1% |
| Scandinavian | 55 | 0.2% |
| Scotch-Irish | 121 | 0.5% |
| Scottish | 467 | 2.0% |
| Serbian | 27 | 0.1% |
| Slavic | 31 | 0.1% |
| Slovak | 56 | 0.2% |
| Slovene | 9 | 0.0% |
| Spaniard | 30 | 0.1% |
| Swedish | 421 | 1.8% |
| Swiss | 8 | 0.0% |
| Syrian | 3 | 0.0% |
| Ukrainian | 62 | 0.3% |
| Welsh | 156 | 0.7% |
| Yaqui | 11 | 0.1% |
| Yugoslavian | 9 | 0.0% | View All 57 Rows |
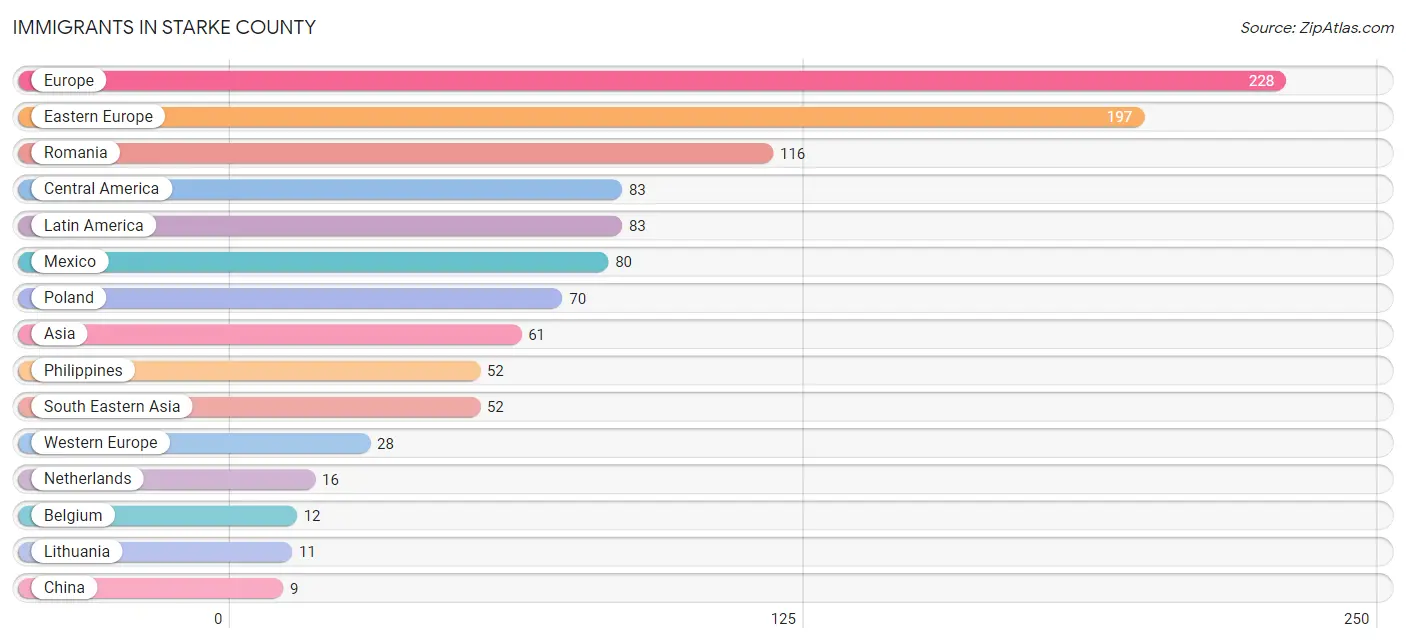
Immigrants in Starke County
The most numerous immigrant groups reported in Starke County came from Europe (228 | 1.0%), Eastern Europe (197 | 0.9%), Romania (116 | 0.5%), Central America (83 | 0.4%), and Latin America (83 | 0.4%), together accounting for 3.0% of all Starke County residents.
| Immigration Origin | # Population | % Population |
| Asia | 61 | 0.3% |
| Azores | 3 | 0.0% |
| Belgium | 12 | 0.1% |
| Central America | 83 | 0.4% |
| China | 9 | 0.0% |
| Eastern Asia | 9 | 0.0% |
| Eastern Europe | 197 | 0.9% |
| Europe | 228 | 1.0% |
| Guatemala | 3 | 0.0% |
| Latin America | 83 | 0.4% |
| Lithuania | 11 | 0.1% |
| Mexico | 80 | 0.3% |
| Netherlands | 16 | 0.1% |
| Philippines | 52 | 0.2% |
| Poland | 70 | 0.3% |
| Portugal | 3 | 0.0% |
| Romania | 116 | 0.5% |
| South Eastern Asia | 52 | 0.2% |
| Southern Europe | 3 | 0.0% |
| Western Europe | 28 | 0.1% | View All 20 Rows |
Sex and Age in Starke County
Sex and Age in Starke County
The most populous age groups in Starke County are 10 to 14 Years (912 | 7.8%) for men and 55 to 59 Years (915 | 7.9%) for women.
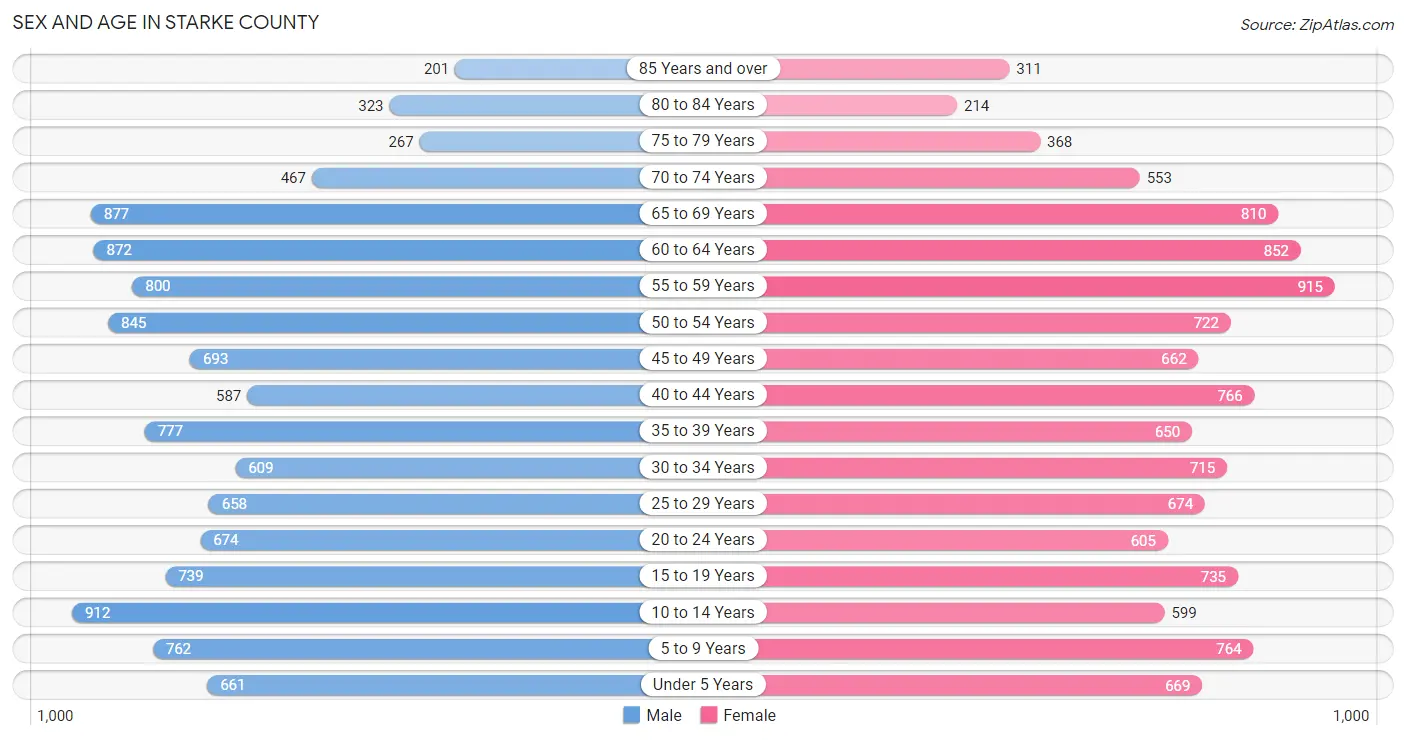
| Age Bracket | Male | Female |
| Under 5 Years | 661 (5.6%) | 669 (5.8%) |
| 5 to 9 Years | 762 (6.5%) | 764 (6.6%) |
| 10 to 14 Years | 912 (7.8%) | 599 (5.2%) |
| 15 to 19 Years | 739 (6.3%) | 735 (6.3%) |
| 20 to 24 Years | 674 (5.8%) | 605 (5.2%) |
| 25 to 29 Years | 658 (5.6%) | 674 (5.8%) |
| 30 to 34 Years | 609 (5.2%) | 715 (6.2%) |
| 35 to 39 Years | 777 (6.6%) | 650 (5.6%) |
| 40 to 44 Years | 587 (5.0%) | 766 (6.6%) |
| 45 to 49 Years | 693 (5.9%) | 662 (5.7%) |
| 50 to 54 Years | 845 (7.2%) | 722 (6.2%) |
| 55 to 59 Years | 800 (6.8%) | 915 (7.9%) |
| 60 to 64 Years | 872 (7.4%) | 852 (7.3%) |
| 65 to 69 Years | 877 (7.5%) | 810 (7.0%) |
| 70 to 74 Years | 467 (4.0%) | 553 (4.8%) |
| 75 to 79 Years | 267 (2.3%) | 368 (3.2%) |
| 80 to 84 Years | 323 (2.8%) | 214 (1.8%) |
| 85 Years and over | 201 (1.7%) | 311 (2.7%) |
| Total | 11,724 (100.0%) | 11,584 (100.0%) |
Families and Households in Starke County
Median Family Size in Starke County
The median family size in Starke County is 3.28 persons per family, with married-couple families (4,422 | 77.7%) accounting for the largest median family size of 3.29 persons per family. On the other hand, single male/father families (403 | 7.1%) represent the smallest median family size with 3.03 persons per family.
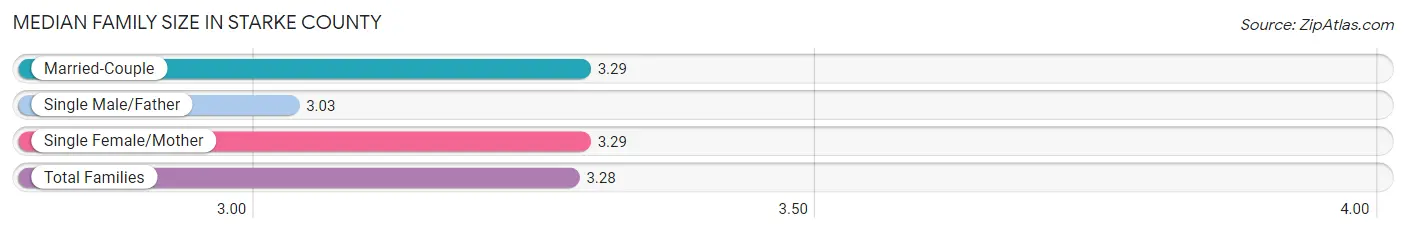
| Family Type | # Families | Family Size |
| Married-Couple | 4,422 (77.7%) | 3.29 |
| Single Male/Father | 403 (7.1%) | 3.03 |
| Single Female/Mother | 864 (15.2%) | 3.29 |
| Total Families | 5,689 (100.0%) | 3.28 |
Median Household Size in Starke County
The median household size in Starke County is 2.69 persons per household, with single male/father households (403 | 4.7%) accounting for the largest median household size of 3.81 persons per household. non-family households (2,958 | 34.2%) represent the smallest median household size with 1.31 persons per household.
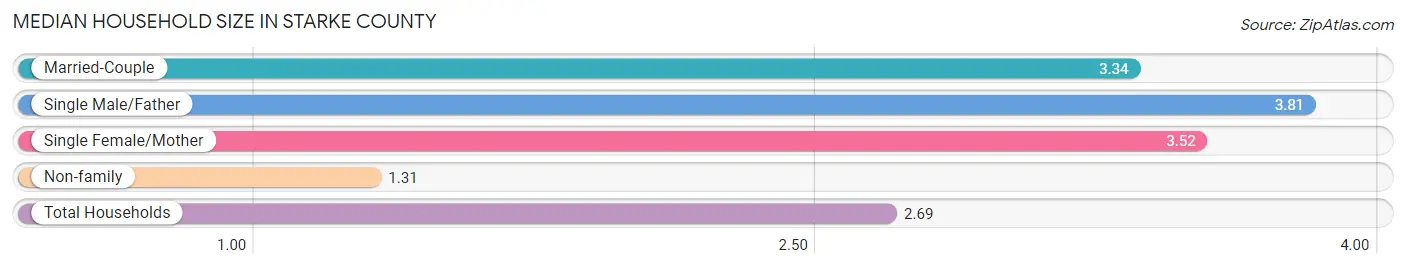
| Household Type | # Households | Household Size |
| Married-Couple | 4,422 (51.1%) | 3.34 |
| Single Male/Father | 403 (4.7%) | 3.81 |
| Single Female/Mother | 864 (10.0%) | 3.52 |
| Non-family | 2,958 (34.2%) | 1.31 |
| Total Households | 8,647 (100.0%) | 2.69 |
Household Size by Marriage Status in Starke County
Out of a total of 8,647 households in Starke County, 5,689 (65.8%) are family households, while 2,958 (34.2%) are nonfamily households. The most numerous type of family households are 2-person households, comprising 2,550, and the most common type of nonfamily households are 1-person households, comprising 2,396.

| Household Size | Family Households | Nonfamily Households |
| 1-Person Households | - | 2,396 (27.7%) |
| 2-Person Households | 2,550 (29.5%) | 451 (5.2%) |
| 3-Person Households | 1,215 (14.1%) | 24 (0.3%) |
| 4-Person Households | 1,027 (11.9%) | 65 (0.7%) |
| 5-Person Households | 508 (5.9%) | 22 (0.3%) |
| 6-Person Households | 192 (2.2%) | 0 (0.0%) |
| 7+ Person Households | 197 (2.3%) | 0 (0.0%) |
| Total | 5,689 (65.8%) | 2,958 (34.2%) |
Female Fertility in Starke County
Fertility by Age in Starke County
Average fertility rate in Starke County is 65.0 births per 1,000 women. Women in the age bracket of 20 to 34 years have the highest fertility rate with 110.0 births per 1,000 women. Women in the age bracket of 20 to 34 years acount for 68.5% of all women with births.
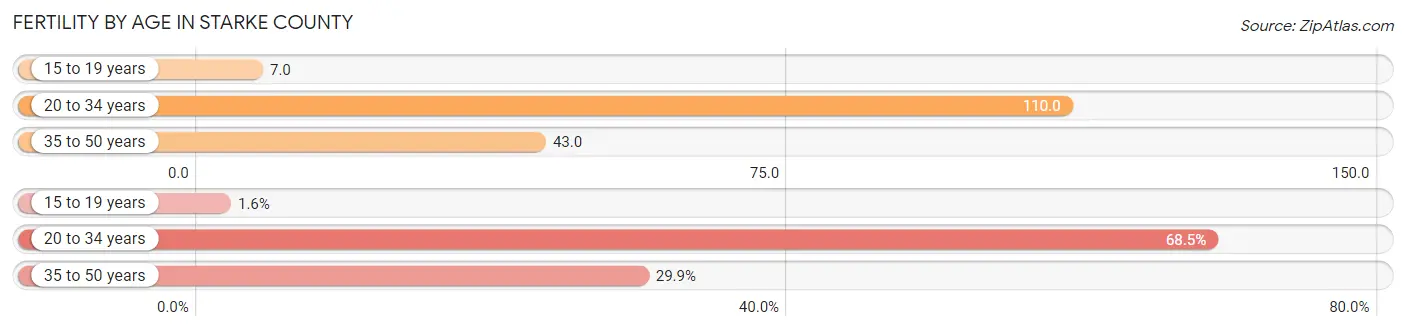
| Age Bracket | Women with Births | Births / 1,000 Women |
| 15 to 19 years | 5 (1.6%) | 7.0 |
| 20 to 34 years | 220 (68.5%) | 110.0 |
| 35 to 50 years | 96 (29.9%) | 43.0 |
| Total | 321 (100.0%) | 65.0 |
Fertility by Age by Marriage Status in Starke County
72.9% of women with births (321) in Starke County are married. The highest percentage of unmarried women with births falls into 20 to 34 years age bracket with 27.7% of them unmarried at the time of birth, while the lowest percentage of unmarried women with births belong to 15 to 19 years age bracket with 0.0% of them unmarried.
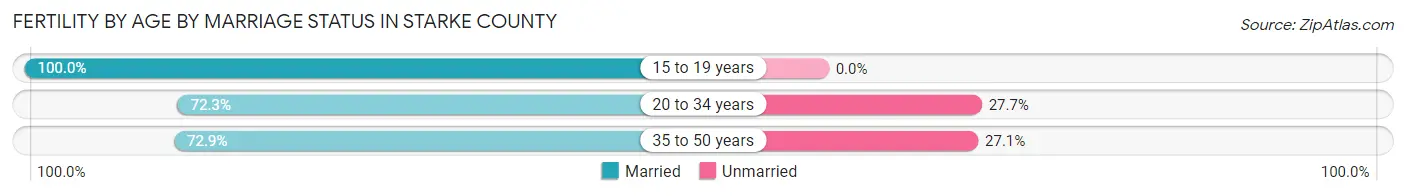
| Age Bracket | Married | Unmarried |
| 15 to 19 years | 5 (100.0%) | 0 (0.0%) |
| 20 to 34 years | 159 (72.3%) | 61 (27.7%) |
| 35 to 50 years | 70 (72.9%) | 26 (27.1%) |
| Total | 234 (72.9%) | 87 (27.1%) |
Fertility by Education in Starke County

| Educational Attainment | Women with Births | Births / 1,000 Women |
| Less than High School | 1 (0.3%) | 1.0 |
| High School Diploma | 72 (22.4%) | 52.0 |
| College or Associate's Degree | 201 (62.6%) | 118.0 |
| Bachelor's Degree | 47 (14.6%) | 78.0 |
| Graduate Degree | 0 (0.0%) | 0.0 |
| Total | 321 (100.0%) | 65.0 |
Fertility by Education by Marriage Status in Starke County
27.1% of women with births in Starke County are unmarried. Women with the educational attainment of bachelor's degree are most likely to be married with 100.0% of them married at childbirth, while women with the educational attainment of less than high school are least likely to be married with 100.0% of them unmarried at childbirth.
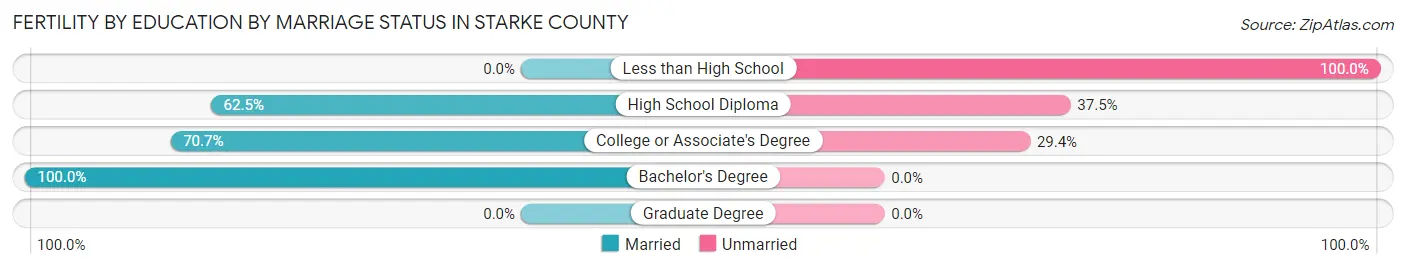
| Educational Attainment | Married | Unmarried |
| Less than High School | 0 (0.0%) | 1 (100.0%) |
| High School Diploma | 45 (62.5%) | 27 (37.5%) |
| College or Associate's Degree | 142 (70.7%) | 59 (29.3%) |
| Bachelor's Degree | 47 (100.0%) | 0 (0.0%) |
| Graduate Degree | 0 (0.0%) | 0 (0.0%) |
| Total | 234 (72.9%) | 87 (27.1%) |
Income in Starke County
Income Overview in Starke County
Per Capita Income in Starke County is $28,788, while median incomes of families and households are $73,212 and $59,916 respectively.
| Characteristic | Number | Measure |
| Per Capita Income | 23,308 | $28,788 |
| Median Family Income | 5,689 | $73,212 |
| Mean Family Income | 5,689 | $85,559 |
| Median Household Income | 8,647 | $59,916 |
| Mean Household Income | 8,647 | $74,265 |
| Income Deficit | 5,689 | $8,342 |
| Wage / Income Gap (%) | 23,308 | 43.03% |
| Wage / Income Gap ($) | 23,308 | 56.97¢ per $1 |
| Gini / Inequality Index | 23,308 | 0.43 |
Earnings by Sex in Starke County
Average Earnings in Starke County are $33,726, $44,063 for men and $25,102 for women, a difference of 43.0%.
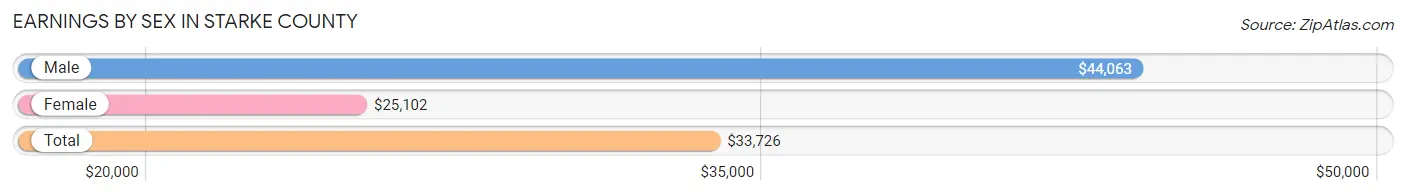
| Sex | Number | Average Earnings |
| Male | 5,631 (53.6%) | $44,063 |
| Female | 4,868 (46.4%) | $25,102 |
| Total | 10,499 (100.0%) | $33,726 |
Earnings by Sex by Income Bracket in Starke County
The most common earnings brackets in Starke County are $75,000 to $99,999 for men (728 | 12.9%) and $25,000 to $29,999 for women (401 | 8.2%).
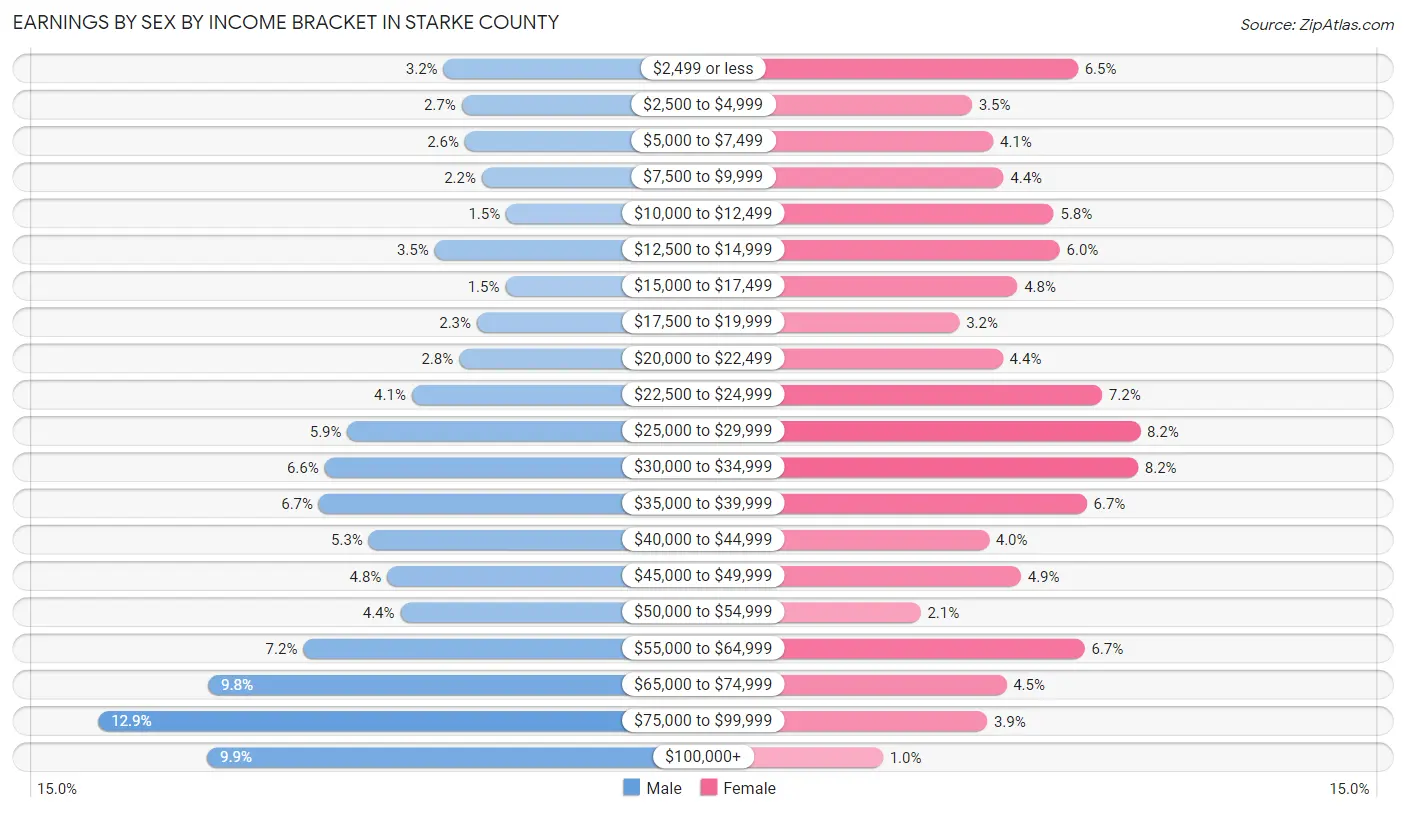
| Income | Male | Female |
| $2,499 or less | 182 (3.2%) | 316 (6.5%) |
| $2,500 to $4,999 | 153 (2.7%) | 171 (3.5%) |
| $5,000 to $7,499 | 148 (2.6%) | 200 (4.1%) |
| $7,500 to $9,999 | 121 (2.1%) | 214 (4.4%) |
| $10,000 to $12,499 | 83 (1.5%) | 283 (5.8%) |
| $12,500 to $14,999 | 196 (3.5%) | 291 (6.0%) |
| $15,000 to $17,499 | 84 (1.5%) | 233 (4.8%) |
| $17,500 to $19,999 | 129 (2.3%) | 154 (3.2%) |
| $20,000 to $22,499 | 157 (2.8%) | 213 (4.4%) |
| $22,500 to $24,999 | 232 (4.1%) | 349 (7.2%) |
| $25,000 to $29,999 | 334 (5.9%) | 401 (8.2%) |
| $30,000 to $34,999 | 370 (6.6%) | 398 (8.2%) |
| $35,000 to $39,999 | 379 (6.7%) | 328 (6.7%) |
| $40,000 to $44,999 | 300 (5.3%) | 194 (4.0%) |
| $45,000 to $49,999 | 271 (4.8%) | 238 (4.9%) |
| $50,000 to $54,999 | 250 (4.4%) | 101 (2.1%) |
| $55,000 to $64,999 | 404 (7.2%) | 325 (6.7%) |
| $65,000 to $74,999 | 554 (9.8%) | 218 (4.5%) |
| $75,000 to $99,999 | 728 (12.9%) | 192 (3.9%) |
| $100,000+ | 556 (9.9%) | 49 (1.0%) |
| Total | 5,631 (100.0%) | 4,868 (100.0%) |
Earnings by Sex by Educational Attainment in Starke County
Average earnings in Starke County are $51,259 for men and $27,706 for women, a difference of 46.0%. Men with an educational attainment of graduate degree enjoy the highest average annual earnings of $77,826, while those with less than high school education earn the least with $31,020. Women with an educational attainment of graduate degree earn the most with the average annual earnings of $60,977, while those with less than high school education have the smallest earnings of $14,405.

| Educational Attainment | Male Income | Female Income |
| Less than High School | $31,020 | $14,405 |
| High School Diploma | $44,836 | $26,493 |
| College or Associate's Degree | $56,209 | $24,779 |
| Bachelor's Degree | $68,327 | $45,060 |
| Graduate Degree | $77,826 | $60,977 |
| Total | $51,259 | $27,706 |
Family Income in Starke County
Family Income Brackets in Starke County
According to the Starke County family income data, there are 1,155 families falling into the $75,000 to $99,999 income range, which is the most common income bracket and makes up 20.3% of all families. Conversely, the less than $10,000 income bracket is the least frequent group with only 142 families (2.5%) belonging to this category.
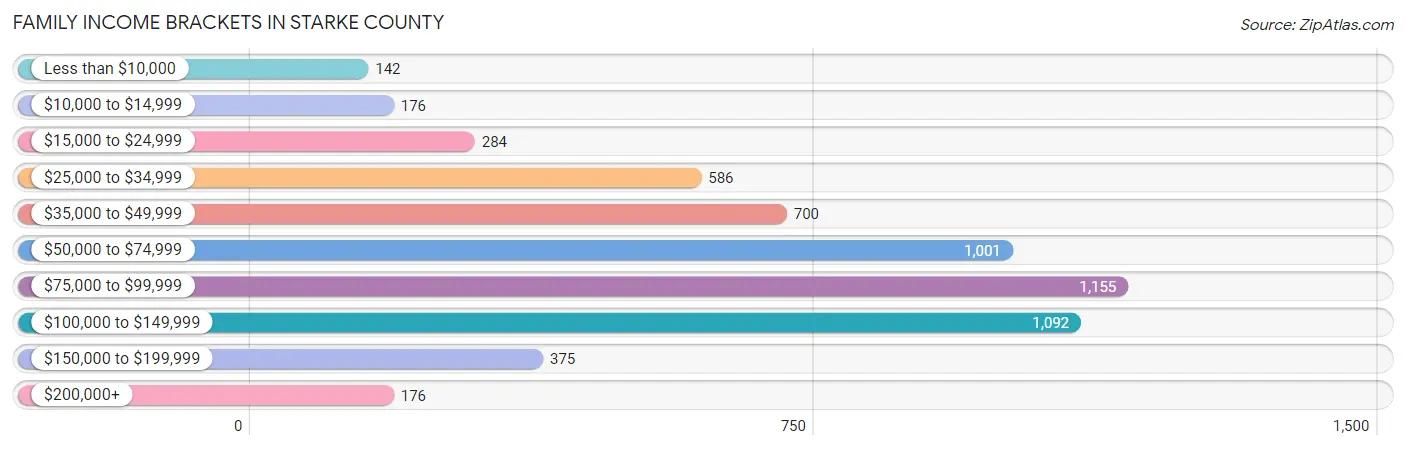
| Income Bracket | # Families | % Families |
| Less than $10,000 | 142 | 2.5% |
| $10,000 to $14,999 | 176 | 3.1% |
| $15,000 to $24,999 | 284 | 5.0% |
| $25,000 to $34,999 | 586 | 10.3% |
| $35,000 to $49,999 | 700 | 12.3% |
| $50,000 to $74,999 | 1,001 | 17.6% |
| $75,000 to $99,999 | 1,155 | 20.3% |
| $100,000 to $149,999 | 1,092 | 19.2% |
| $150,000 to $199,999 | 375 | 6.6% |
| $200,000+ | 176 | 3.1% |
Family Income by Famaliy Size in Starke County
5-person families (554 | 9.7%) account for the highest median family income in Starke County with $91,667 per family, while 2-person families (2,812 | 49.4%) have the highest median income of $30,096 per family member.

| Income Bracket | # Families | Median Income |
| 2-Person Families | 2,812 (49.4%) | $60,192 |
| 3-Person Families | 1,140 (20.0%) | $64,519 |
| 4-Person Families | 891 (15.7%) | $90,987 |
| 5-Person Families | 554 (9.7%) | $91,667 |
| 6-Person Families | 100 (1.8%) | $77,292 |
| 7+ Person Families | 192 (3.4%) | $85,455 |
| Total | 5,689 (100.0%) | $73,212 |
Family Income by Number of Earners in Starke County
The median family income in Starke County is $73,212, with families comprising 3+ earners (566) having the highest median family income of $123,636, while families with no earners (1,265) have the lowest median family income of $37,665, accounting for 10.0% and 22.2% of families, respectively.
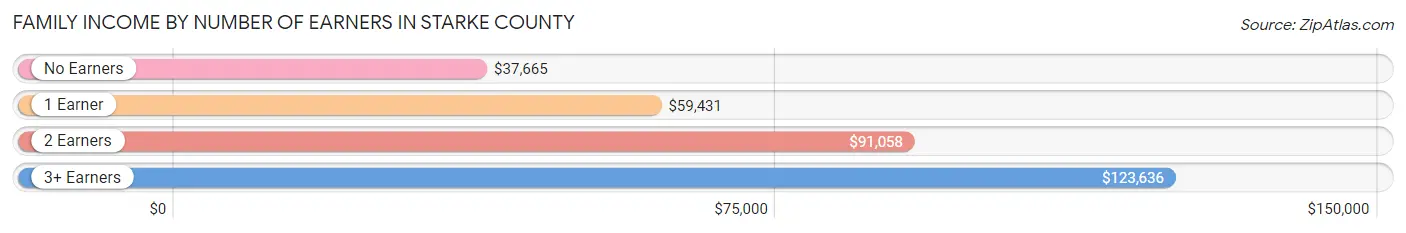
| Number of Earners | # Families | Median Income |
| No Earners | 1,265 (22.2%) | $37,665 |
| 1 Earner | 1,993 (35.0%) | $59,431 |
| 2 Earners | 1,865 (32.8%) | $91,058 |
| 3+ Earners | 566 (10.0%) | $123,636 |
| Total | 5,689 (100.0%) | $73,212 |
Household Income in Starke County
Household Income Brackets in Starke County
With 1,574 households falling in the category, the $50,000 to $74,999 income range is the most frequent in Starke County, accounting for 18.2% of all households. In contrast, only 208 households (2.4%) fall into the $200,000+ income bracket, making it the least populous group.
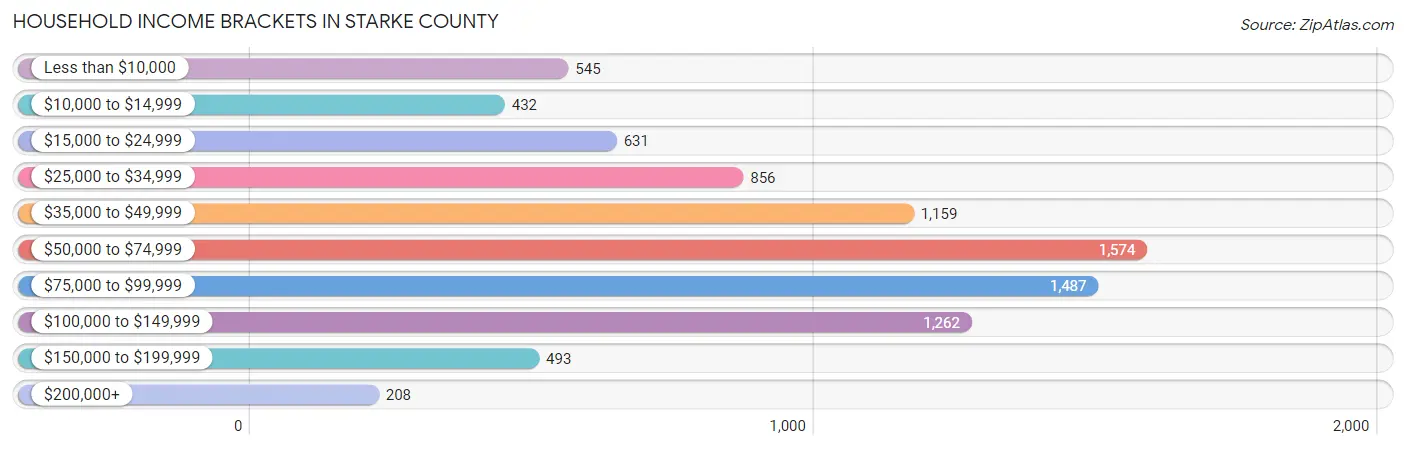
| Income Bracket | # Households | % Households |
| Less than $10,000 | 545 | 6.3% |
| $10,000 to $14,999 | 432 | 5.0% |
| $15,000 to $24,999 | 631 | 7.3% |
| $25,000 to $34,999 | 856 | 9.9% |
| $35,000 to $49,999 | 1,159 | 13.4% |
| $50,000 to $74,999 | 1,574 | 18.2% |
| $75,000 to $99,999 | 1,487 | 17.2% |
| $100,000 to $149,999 | 1,262 | 14.6% |
| $150,000 to $199,999 | 493 | 5.7% |
| $200,000+ | 208 | 2.4% |
Household Income by Householder Age in Starke County
The median household income in Starke County is $59,916, with the highest median household income of $76,431 found in the 45 to 64 years age bracket for the primary householder. A total of 3,417 households (39.5%) fall into this category. Meanwhile, the 65+ years age bracket for the primary householder has the lowest median household income of $39,767, with 2,798 households (32.4%) in this group.
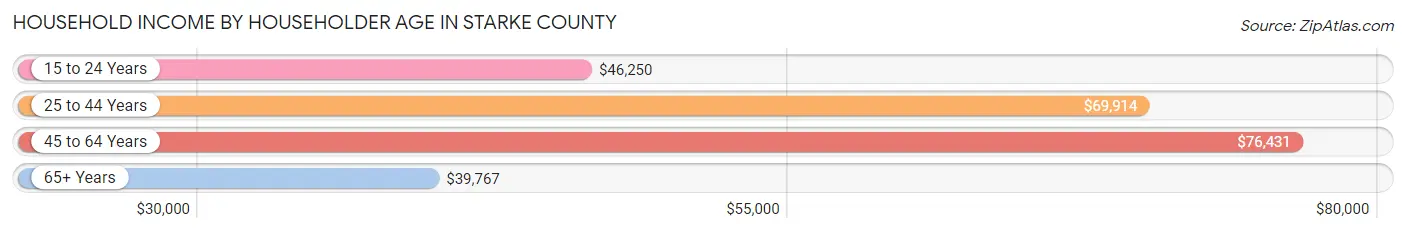
| Income Bracket | # Households | Median Income |
| 15 to 24 Years | 182 (2.1%) | $46,250 |
| 25 to 44 Years | 2,250 (26.0%) | $69,914 |
| 45 to 64 Years | 3,417 (39.5%) | $76,431 |
| 65+ Years | 2,798 (32.4%) | $39,767 |
| Total | 8,647 (100.0%) | $59,916 |
Poverty in Starke County
Income Below Poverty by Sex and Age in Starke County
With 10.2% poverty level for males and 17.0% for females among the residents of Starke County, 16 and 17 year old males and 45 to 54 year old females are the most vulnerable to poverty, with 70 males (20.2%) and 397 females (28.7%) in their respective age groups living below the poverty level.
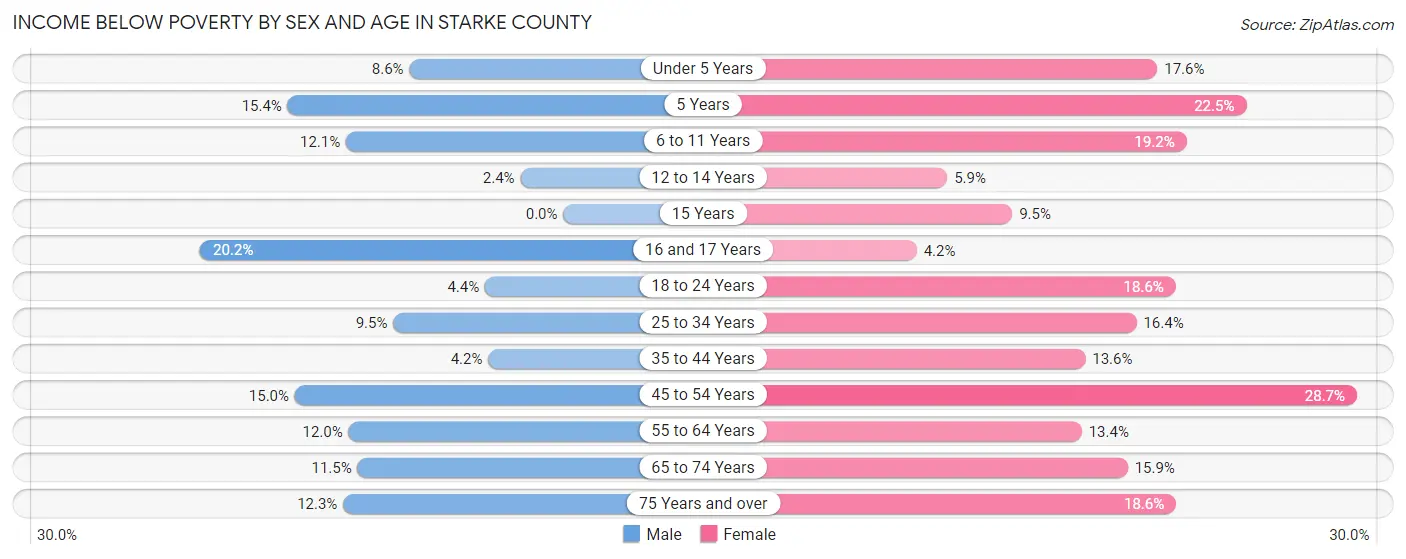
| Age Bracket | Male | Female |
| Under 5 Years | 54 (8.6%) | 113 (17.6%) |
| 5 Years | 33 (15.3%) | 34 (22.5%) |
| 6 to 11 Years | 127 (12.1%) | 159 (19.2%) |
| 12 to 14 Years | 9 (2.4%) | 20 (5.9%) |
| 15 Years | 0 (0.0%) | 26 (9.5%) |
| 16 and 17 Years | 70 (20.2%) | 9 (4.2%) |
| 18 to 24 Years | 41 (4.4%) | 158 (18.6%) |
| 25 to 34 Years | 120 (9.5%) | 228 (16.4%) |
| 35 to 44 Years | 57 (4.2%) | 192 (13.6%) |
| 45 to 54 Years | 230 (14.9%) | 397 (28.7%) |
| 55 to 64 Years | 200 (12.0%) | 236 (13.4%) |
| 65 to 74 Years | 154 (11.5%) | 217 (15.9%) |
| 75 Years and over | 97 (12.3%) | 163 (18.6%) |
| Total | 1,192 (10.2%) | 1,952 (17.0%) |
Income Above Poverty by Sex and Age in Starke County
According to the poverty statistics in Starke County, males aged 15 years and females aged 16 and 17 years are the age groups that are most secure financially, with 100.0% of males and 95.8% of females in these age groups living above the poverty line.
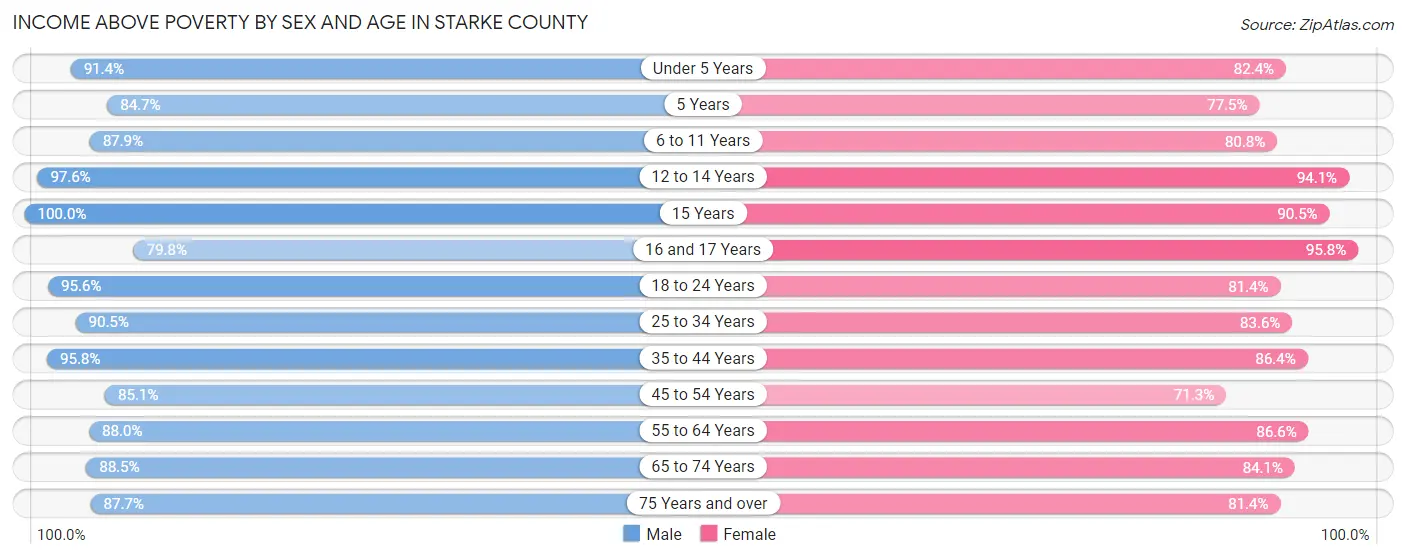
| Age Bracket | Male | Female |
| Under 5 Years | 576 (91.4%) | 530 (82.4%) |
| 5 Years | 182 (84.7%) | 117 (77.5%) |
| 6 to 11 Years | 923 (87.9%) | 669 (80.8%) |
| 12 to 14 Years | 367 (97.6%) | 321 (94.1%) |
| 15 Years | 127 (100.0%) | 248 (90.5%) |
| 16 and 17 Years | 276 (79.8%) | 207 (95.8%) |
| 18 to 24 Years | 899 (95.6%) | 692 (81.4%) |
| 25 to 34 Years | 1,147 (90.5%) | 1,161 (83.6%) |
| 35 to 44 Years | 1,307 (95.8%) | 1,224 (86.4%) |
| 45 to 54 Years | 1,308 (85.1%) | 987 (71.3%) |
| 55 to 64 Years | 1,472 (88.0%) | 1,531 (86.6%) |
| 65 to 74 Years | 1,190 (88.5%) | 1,146 (84.1%) |
| 75 Years and over | 694 (87.7%) | 713 (81.4%) |
| Total | 10,468 (89.8%) | 9,546 (83.0%) |
Income Below Poverty Among Married-Couple Families in Starke County
The poverty statistics for married-couple families in Starke County show that 3.6% or 159 of the total 4,422 families live below the poverty line. Families with 5 or more children have the highest poverty rate of 30.2%, comprising of 35 families. On the other hand, families with no children have the lowest poverty rate of 2.3%, which includes 60 families.
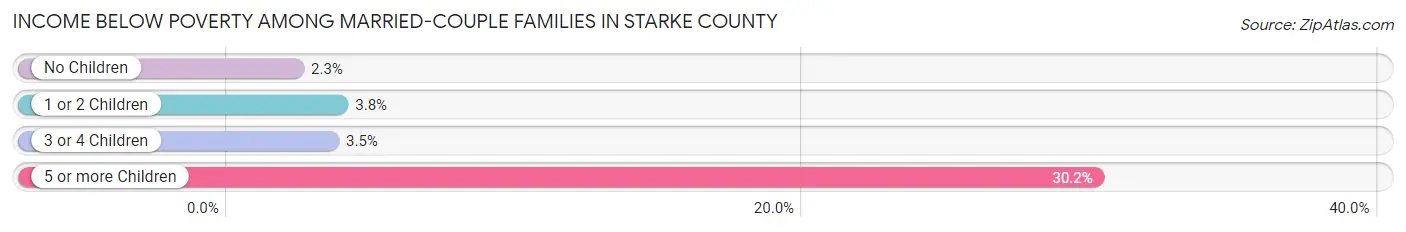
| Children | Above Poverty | Below Poverty |
| No Children | 2,547 (97.7%) | 60 (2.3%) |
| 1 or 2 Children | 1,251 (96.2%) | 50 (3.8%) |
| 3 or 4 Children | 384 (96.5%) | 14 (3.5%) |
| 5 or more Children | 81 (69.8%) | 35 (30.2%) |
| Total | 4,263 (96.4%) | 159 (3.6%) |
Income Below Poverty Among Single-Parent Households in Starke County
According to the poverty data in Starke County, 34.5% or 139 single-father households and 30.4% or 263 single-mother households are living below the poverty line. Among single-father households, those with 1 or 2 children have the highest poverty rate, with 127 households (62.6%) experiencing poverty. Likewise, among single-mother households, those with 1 or 2 children have the highest poverty rate, with 195 households (38.2%) falling below the poverty line.
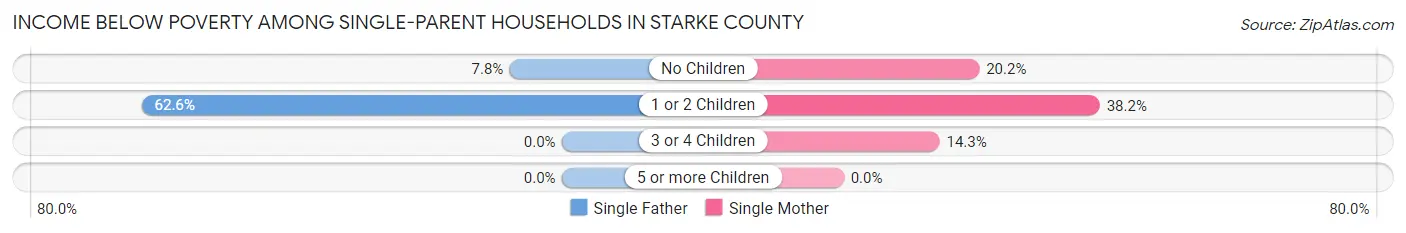
| Children | Single Father | Single Mother |
| No Children | 12 (7.8%) | 60 (20.2%) |
| 1 or 2 Children | 127 (62.6%) | 195 (38.2%) |
| 3 or 4 Children | 0 (0.0%) | 8 (14.3%) |
| 5 or more Children | 0 (0.0%) | 0 (0.0%) |
| Total | 139 (34.5%) | 263 (30.4%) |
Income Below Poverty Among Married-Couple vs Single-Parent Households in Starke County
The poverty data for Starke County shows that 159 of the married-couple family households (3.6%) and 402 of the single-parent households (31.7%) are living below the poverty level. Within the married-couple family households, those with 5 or more children have the highest poverty rate, with 35 households (30.2%) falling below the poverty line. Among the single-parent households, those with 1 or 2 children have the highest poverty rate, with 322 household (45.1%) living below poverty.
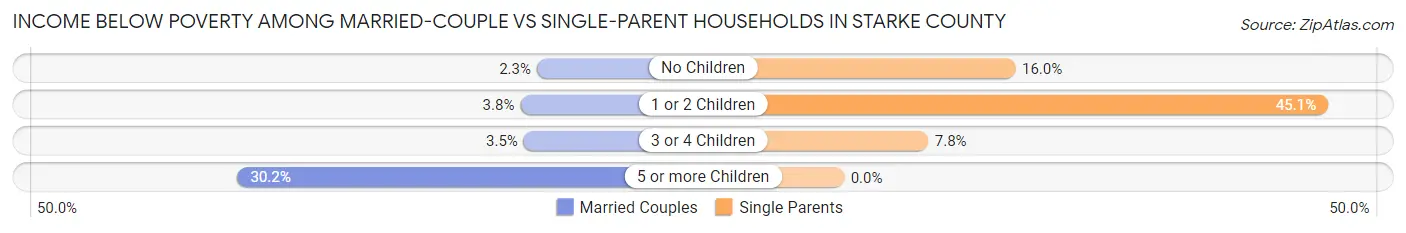
| Children | Married-Couple Families | Single-Parent Households |
| No Children | 60 (2.3%) | 72 (16.0%) |
| 1 or 2 Children | 50 (3.8%) | 322 (45.1%) |
| 3 or 4 Children | 14 (3.5%) | 8 (7.8%) |
| 5 or more Children | 35 (30.2%) | 0 (0.0%) |
| Total | 159 (3.6%) | 402 (31.7%) |
Employment Characteristics in Starke County
Employment by Class of Employer in Starke County
Among the 9,336 employed individuals in Starke County, private company employees (6,476 | 69.4%), not-for-profit organizations (1,022 | 11.0%), and local government employees (787 | 8.4%) make up the most common classes of employment.
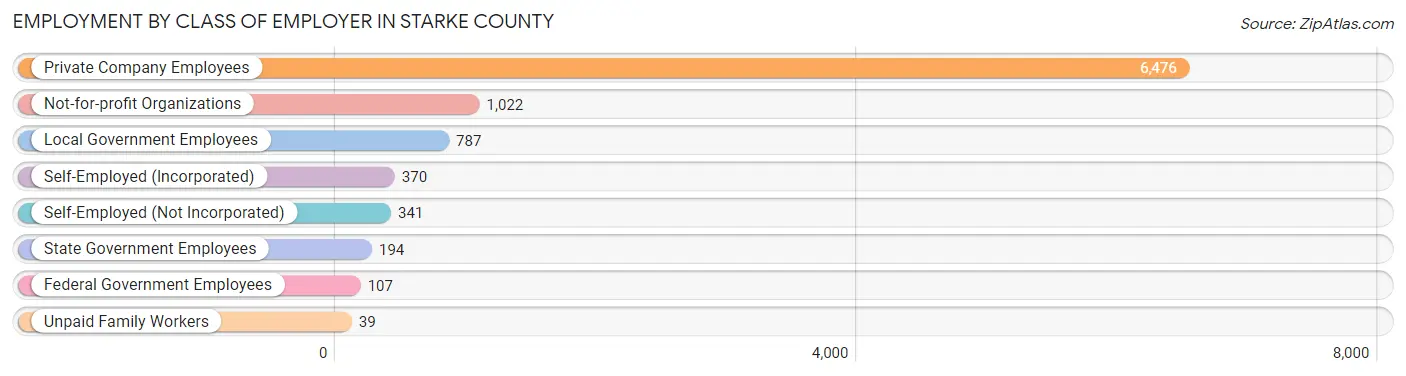
| Employer Class | # Employees | % Employees |
| Private Company Employees | 6,476 | 69.4% |
| Self-Employed (Incorporated) | 370 | 4.0% |
| Self-Employed (Not Incorporated) | 341 | 3.6% |
| Not-for-profit Organizations | 1,022 | 11.0% |
| Local Government Employees | 787 | 8.4% |
| State Government Employees | 194 | 2.1% |
| Federal Government Employees | 107 | 1.1% |
| Unpaid Family Workers | 39 | 0.4% |
| Total | 9,336 | 100.0% |
Employment Status by Age in Starke County
According to the labor force statistics for Starke County, out of the total population over 16 years of age (18,540), 53.7% or 9,956 individuals are in the labor force, with 4.0% or 398 of them unemployed. The age group with the highest labor force participation rate is 30 to 34 years, with 84.8% or 1,123 individuals in the labor force. Within the labor force, the 55 to 59 years age range has the highest percentage of unemployed individuals, with 7.7% or 60 of them being unemployed.
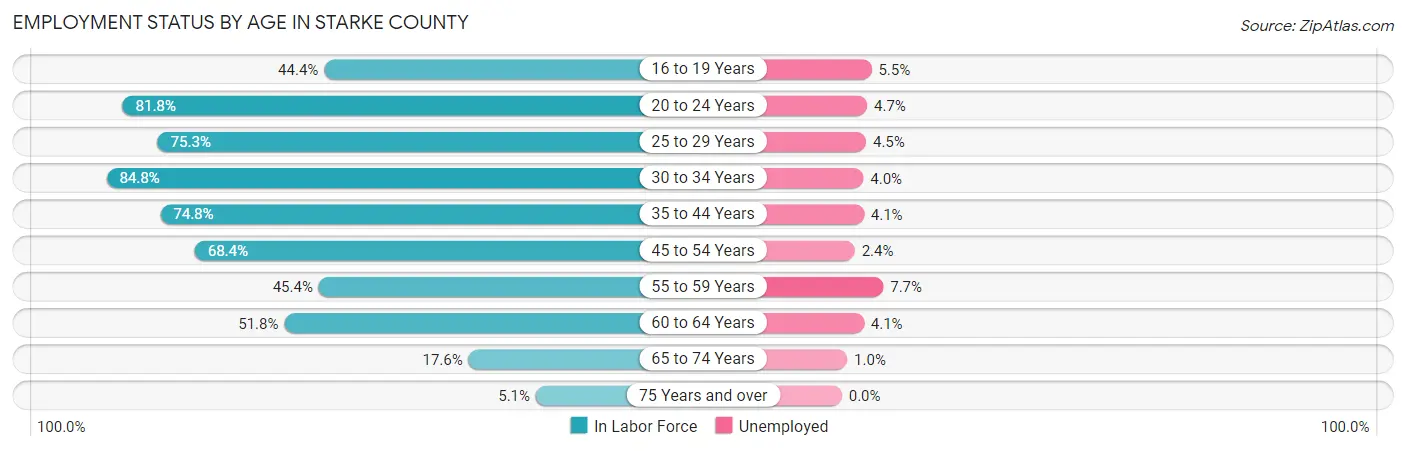
| Age Bracket | In Labor Force | Unemployed |
| 16 to 19 Years | 476 (44.4%) | 26 (5.5%) |
| 20 to 24 Years | 1,046 (81.8%) | 49 (4.7%) |
| 25 to 29 Years | 1,003 (75.3%) | 45 (4.5%) |
| 30 to 34 Years | 1,123 (84.8%) | 45 (4.0%) |
| 35 to 44 Years | 2,079 (74.8%) | 85 (4.1%) |
| 45 to 54 Years | 1,999 (68.4%) | 48 (2.4%) |
| 55 to 59 Years | 779 (45.4%) | 60 (7.7%) |
| 60 to 64 Years | 893 (51.8%) | 37 (4.1%) |
| 65 to 74 Years | 476 (17.6%) | 5 (1.0%) |
| 75 Years and over | 86 (5.1%) | 0 (0.0%) |
| Total | 9,956 (53.7%) | 398 (4.0%) |
Employment Status by Educational Attainment in Starke County
According to labor force statistics for Starke County, 66.8% of individuals (7,880) out of the total population between 25 and 64 years of age (11,797) are in the labor force, with 4.1% or 323 of them being unemployed. The group with the highest labor force participation rate are those with the educational attainment of bachelor's degree or higher, with 86.5% or 1,464 individuals in the labor force. Within the labor force, individuals with high school diploma education have the highest percentage of unemployment, with 5.1% or 154 of them being unemployed.

| Educational Attainment | In Labor Force | Unemployed |
| Less than High School | 753 (46.5%) | 26 (1.6%) |
| High School Diploma | 3,016 (63.3%) | 243 (5.1%) |
| College / Associate Degree | 2,646 (71.1%) | 175 (4.7%) |
| Bachelor's Degree or higher | 1,464 (86.5%) | 34 (2.0%) |
| Total | 7,880 (66.8%) | 484 (4.1%) |
Employment Occupations by Sex in Starke County
Management, Business, Science and Arts Occupations
The most common Management, Business, Science and Arts occupations in Starke County are Management (895 | 9.4%), Community & Social Service (800 | 8.4%), Health Diagnosing & Treating (622 | 6.5%), Education Instruction & Library (438 | 4.6%), and Health Technologists (304 | 3.2%).
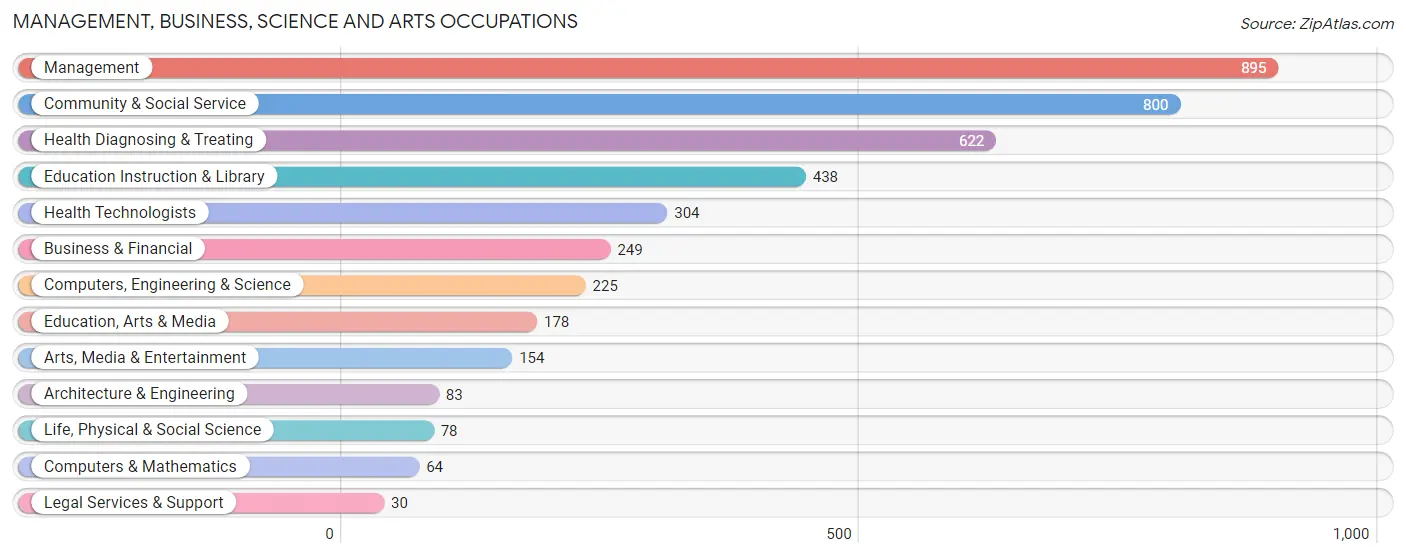
Management, Business, Science and Arts Occupations by Sex
Within the Management, Business, Science and Arts occupations in Starke County, the most male-oriented occupations are Architecture & Engineering (94.0%), Computers & Mathematics (92.2%), and Computers, Engineering & Science (92.0%), while the most female-oriented occupations are Health Diagnosing & Treating (89.9%), Health Technologists (86.2%), and Education Instruction & Library (80.6%).
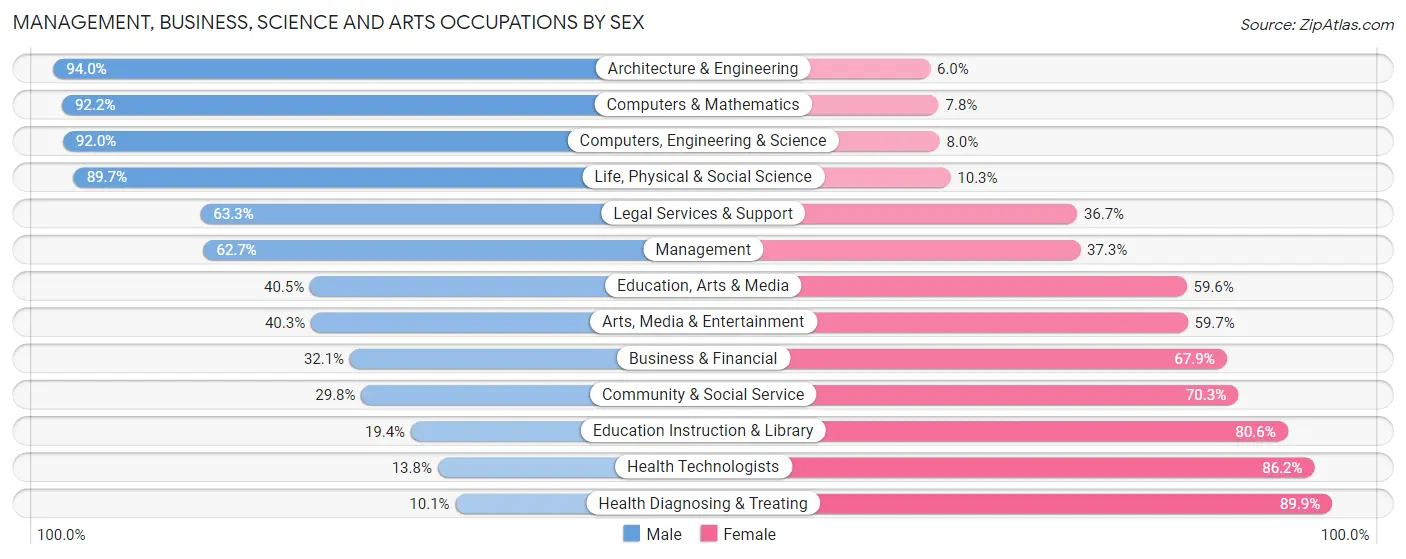
| Occupation | Male | Female |
| Management | 561 (62.7%) | 334 (37.3%) |
| Business & Financial | 80 (32.1%) | 169 (67.9%) |
| Computers, Engineering & Science | 207 (92.0%) | 18 (8.0%) |
| Computers & Mathematics | 59 (92.2%) | 5 (7.8%) |
| Architecture & Engineering | 78 (94.0%) | 5 (6.0%) |
| Life, Physical & Social Science | 70 (89.7%) | 8 (10.3%) |
| Community & Social Service | 238 (29.7%) | 562 (70.3%) |
| Education, Arts & Media | 72 (40.5%) | 106 (59.6%) |
| Legal Services & Support | 19 (63.3%) | 11 (36.7%) |
| Education Instruction & Library | 85 (19.4%) | 353 (80.6%) |
| Arts, Media & Entertainment | 62 (40.3%) | 92 (59.7%) |
| Health Diagnosing & Treating | 63 (10.1%) | 559 (89.9%) |
| Health Technologists | 42 (13.8%) | 262 (86.2%) |
| Total (Category) | 1,149 (41.2%) | 1,642 (58.8%) |
| Total (Overall) | 5,155 (53.9%) | 4,407 (46.1%) |
Services Occupations
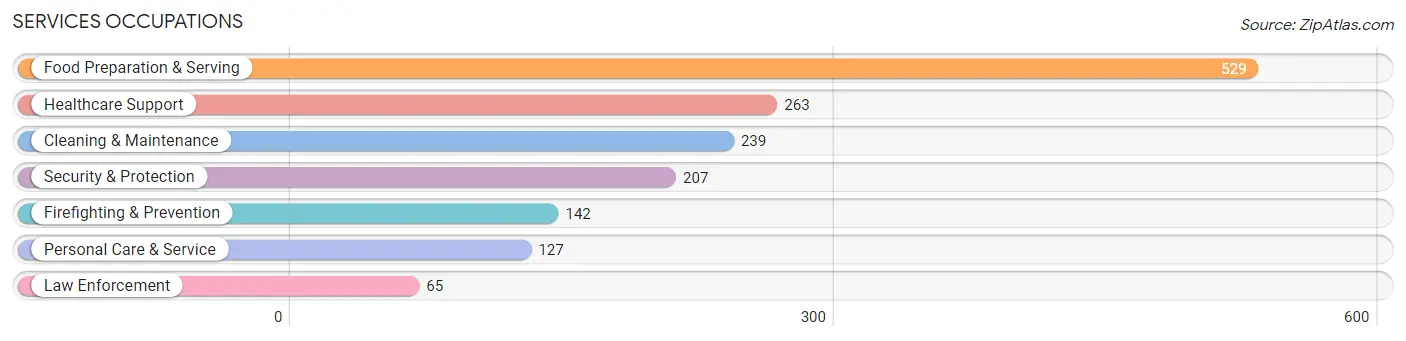
The most common Services occupations in Starke County are Food Preparation & Serving (529 | 5.5%), Healthcare Support (263 | 2.8%), Cleaning & Maintenance (239 | 2.5%), Security & Protection (207 | 2.2%), and Firefighting & Prevention (142 | 1.5%).
Services Occupations by Sex
Within the Services occupations in Starke County, the most male-oriented occupations are Cleaning & Maintenance (78.2%), Law Enforcement (69.2%), and Security & Protection (67.6%), while the most female-oriented occupations are Personal Care & Service (95.3%), Healthcare Support (89.7%), and Food Preparation & Serving (82.0%).
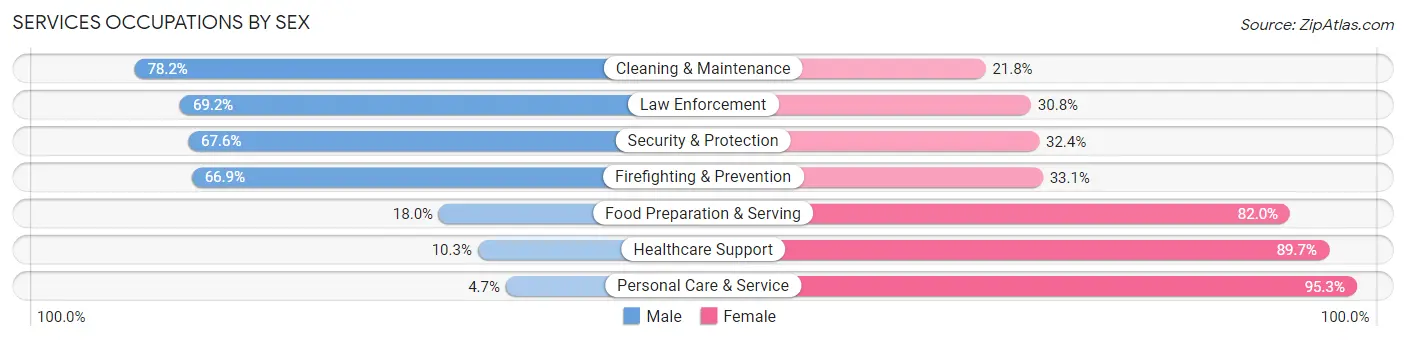
| Occupation | Male | Female |
| Healthcare Support | 27 (10.3%) | 236 (89.7%) |
| Security & Protection | 140 (67.6%) | 67 (32.4%) |
| Firefighting & Prevention | 95 (66.9%) | 47 (33.1%) |
| Law Enforcement | 45 (69.2%) | 20 (30.8%) |
| Food Preparation & Serving | 95 (18.0%) | 434 (82.0%) |
| Cleaning & Maintenance | 187 (78.2%) | 52 (21.8%) |
| Personal Care & Service | 6 (4.7%) | 121 (95.3%) |
| Total (Category) | 455 (33.3%) | 910 (66.7%) |
| Total (Overall) | 5,155 (53.9%) | 4,407 (46.1%) |
Sales and Office Occupations
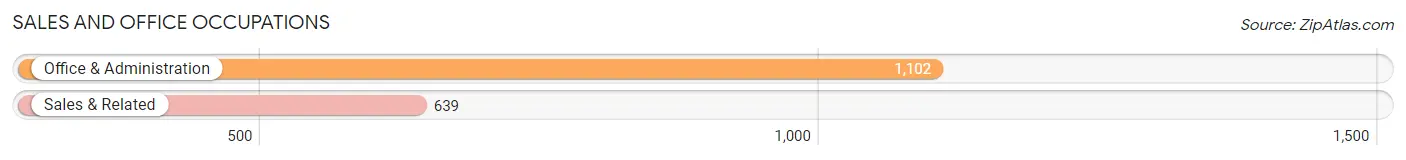
The most common Sales and Office occupations in Starke County are Office & Administration (1,102 | 11.5%), and Sales & Related (639 | 6.7%).
Sales and Office Occupations by Sex
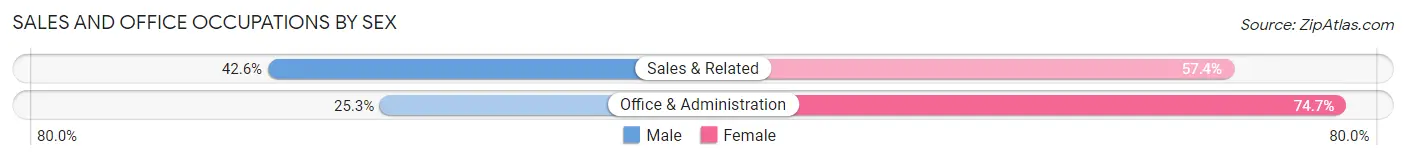
| Occupation | Male | Female |
| Sales & Related | 272 (42.6%) | 367 (57.4%) |
| Office & Administration | 279 (25.3%) | 823 (74.7%) |
| Total (Category) | 551 (31.7%) | 1,190 (68.3%) |
| Total (Overall) | 5,155 (53.9%) | 4,407 (46.1%) |
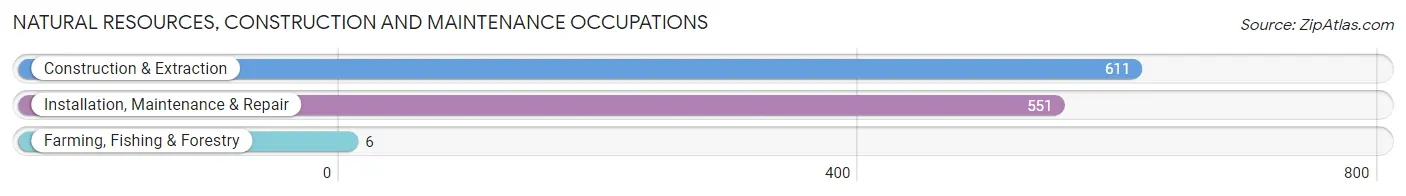
Natural Resources, Construction and Maintenance Occupations
The most common Natural Resources, Construction and Maintenance occupations in Starke County are Construction & Extraction (611 | 6.4%), Installation, Maintenance & Repair (551 | 5.8%), and Farming, Fishing & Forestry (6 | 0.1%).
Natural Resources, Construction and Maintenance Occupations by Sex
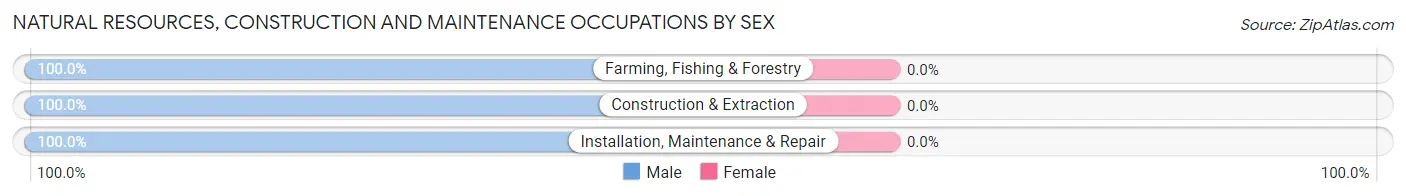
| Occupation | Male | Female |
| Farming, Fishing & Forestry | 6 (100.0%) | 0 (0.0%) |
| Construction & Extraction | 611 (100.0%) | 0 (0.0%) |
| Installation, Maintenance & Repair | 551 (100.0%) | 0 (0.0%) |
| Total (Category) | 1,168 (100.0%) | 0 (0.0%) |
| Total (Overall) | 5,155 (53.9%) | 4,407 (46.1%) |
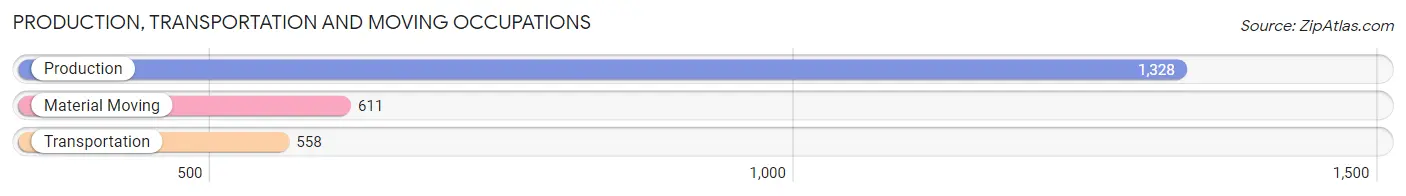
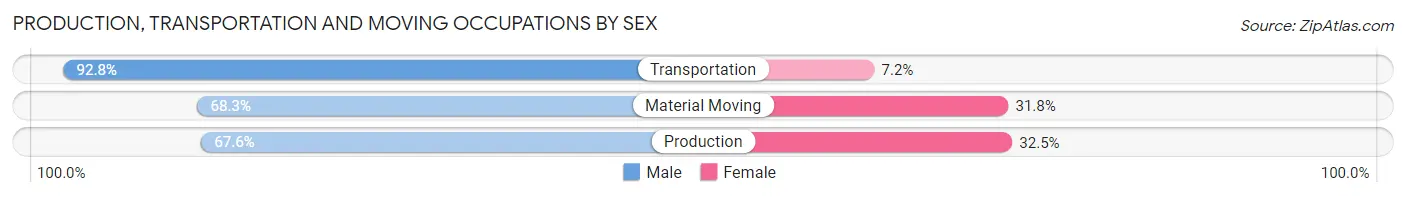
Production, Transportation and Moving Occupations
The most common Production, Transportation and Moving occupations in Starke County are Production (1,328 | 13.9%), Material Moving (611 | 6.4%), and Transportation (558 | 5.8%).
Production, Transportation and Moving Occupations by Sex
| Occupation | Male | Female |
| Production | 897 (67.5%) | 431 (32.5%) |
| Transportation | 518 (92.8%) | 40 (7.2%) |
| Material Moving | 417 (68.2%) | 194 (31.8%) |
| Total (Category) | 1,832 (73.4%) | 665 (26.6%) |
| Total (Overall) | 5,155 (53.9%) | 4,407 (46.1%) |
Employment Industries by Sex in Starke County
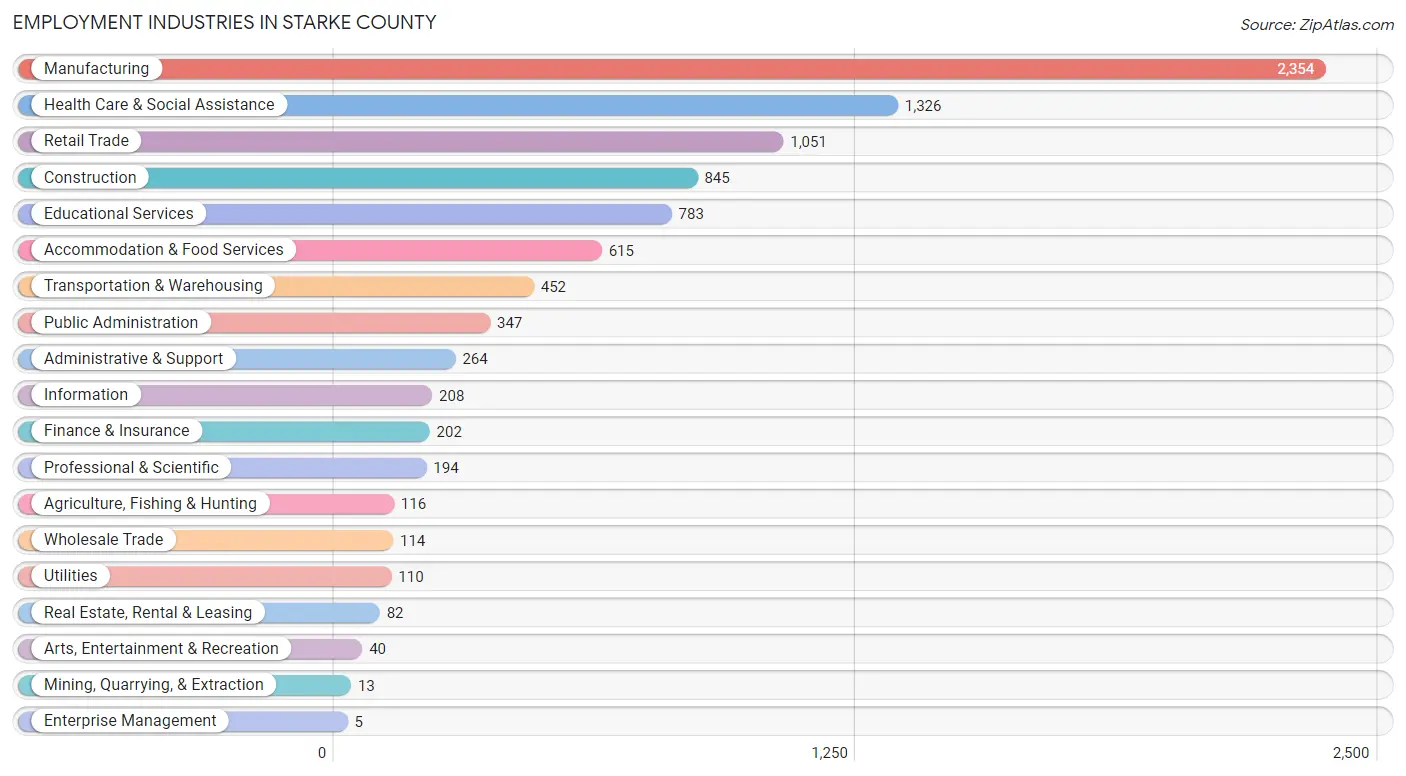
Employment Industries in Starke County
The major employment industries in Starke County include Manufacturing (2,354 | 24.6%), Health Care & Social Assistance (1,326 | 13.9%), Retail Trade (1,051 | 11.0%), Construction (845 | 8.8%), and Educational Services (783 | 8.2%).
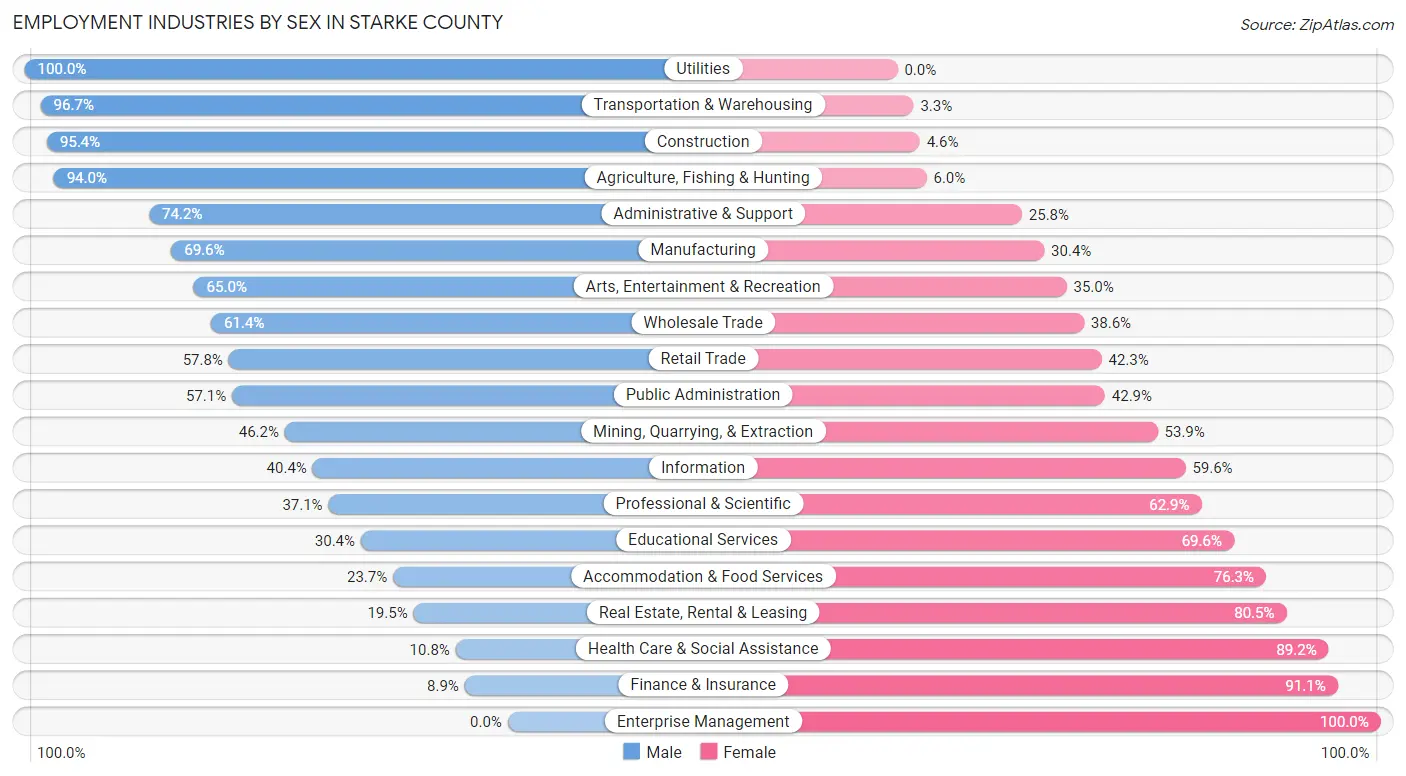
Employment Industries by Sex in Starke County
The Starke County industries that see more men than women are Utilities (100.0%), Transportation & Warehousing (96.7%), and Construction (95.4%), whereas the industries that tend to have a higher number of women are Enterprise Management (100.0%), Finance & Insurance (91.1%), and Health Care & Social Assistance (89.2%).
| Industry | Male | Female |
| Agriculture, Fishing & Hunting | 109 (94.0%) | 7 (6.0%) |
| Mining, Quarrying, & Extraction | 6 (46.2%) | 7 (53.8%) |
| Construction | 806 (95.4%) | 39 (4.6%) |
| Manufacturing | 1,639 (69.6%) | 715 (30.4%) |
| Wholesale Trade | 70 (61.4%) | 44 (38.6%) |
| Retail Trade | 607 (57.8%) | 444 (42.2%) |
| Transportation & Warehousing | 437 (96.7%) | 15 (3.3%) |
| Utilities | 110 (100.0%) | 0 (0.0%) |
| Information | 84 (40.4%) | 124 (59.6%) |
| Finance & Insurance | 18 (8.9%) | 184 (91.1%) |
| Real Estate, Rental & Leasing | 16 (19.5%) | 66 (80.5%) |
| Professional & Scientific | 72 (37.1%) | 122 (62.9%) |
| Enterprise Management | 0 (0.0%) | 5 (100.0%) |
| Administrative & Support | 196 (74.2%) | 68 (25.8%) |
| Educational Services | 238 (30.4%) | 545 (69.6%) |
| Health Care & Social Assistance | 143 (10.8%) | 1,183 (89.2%) |
| Arts, Entertainment & Recreation | 26 (65.0%) | 14 (35.0%) |
| Accommodation & Food Services | 146 (23.7%) | 469 (76.3%) |
| Public Administration | 198 (57.1%) | 149 (42.9%) |
| Total | 5,155 (53.9%) | 4,407 (46.1%) |
Education in Starke County
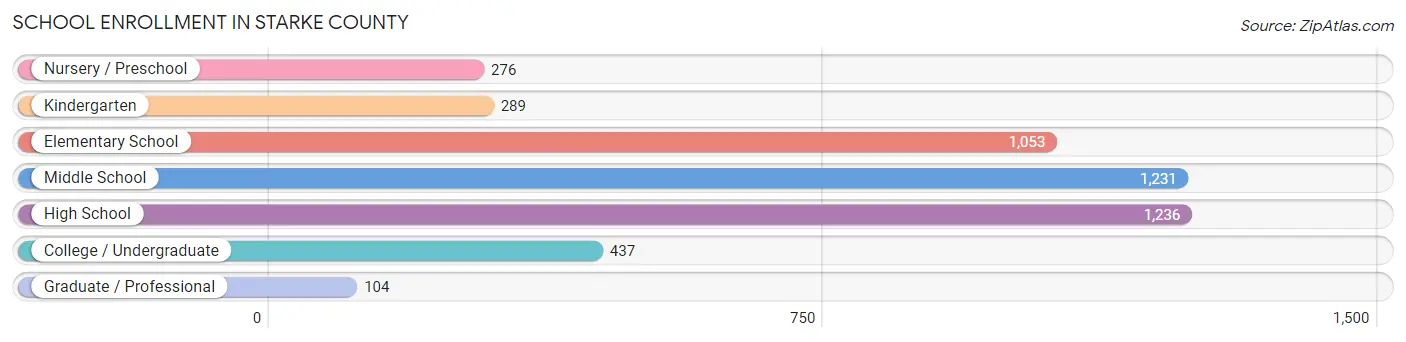
School Enrollment in Starke County
The most common levels of schooling among the 4,626 students in Starke County are high school (1,236 | 26.7%), middle school (1,231 | 26.6%), and elementary school (1,053 | 22.8%).
| School Level | # Students | % Students |
| Nursery / Preschool | 276 | 6.0% |
| Kindergarten | 289 | 6.2% |
| Elementary School | 1,053 | 22.8% |
| Middle School | 1,231 | 26.6% |
| High School | 1,236 | 26.7% |
| College / Undergraduate | 437 | 9.5% |
| Graduate / Professional | 104 | 2.2% |
| Total | 4,626 | 100.0% |
School Enrollment by Age by Funding Source in Starke County
Out of a total of 4,626 students who are enrolled in schools in Starke County, 897 (19.4%) attend a private institution, while the remaining 3,729 (80.6%) are enrolled in public schools. The age group of 20 to 24 year olds has the highest likelihood of being enrolled in private schools, with 86 (41.7% in the age bracket) enrolled. Conversely, the age group of 10 to 14 year olds has the lowest likelihood of being enrolled in a private school, with 1,295 (88.6% in the age bracket) attending a public institution.
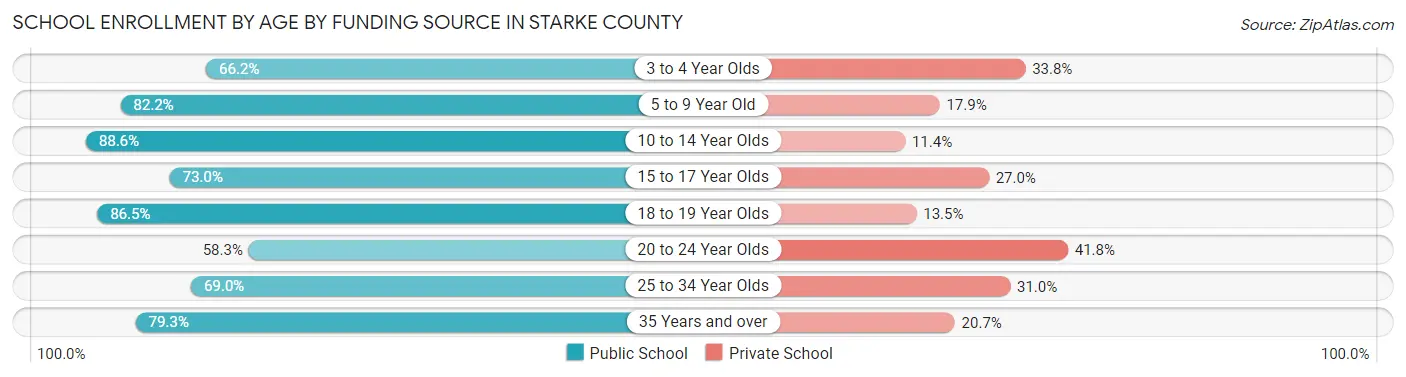
| Age Bracket | Public School | Private School |
| 3 to 4 Year Olds | 92 (66.2%) | 47 (33.8%) |
| 5 to 9 Year Old | 1,100 (82.2%) | 239 (17.8%) |
| 10 to 14 Year Olds | 1,295 (88.6%) | 167 (11.4%) |
| 15 to 17 Year Olds | 673 (73.0%) | 249 (27.0%) |
| 18 to 19 Year Olds | 230 (86.5%) | 36 (13.5%) |
| 20 to 24 Year Olds | 120 (58.3%) | 86 (41.7%) |
| 25 to 34 Year Olds | 98 (69.0%) | 44 (31.0%) |
| 35 Years and over | 119 (79.3%) | 31 (20.7%) |
| Total | 3,729 (80.6%) | 897 (19.4%) |
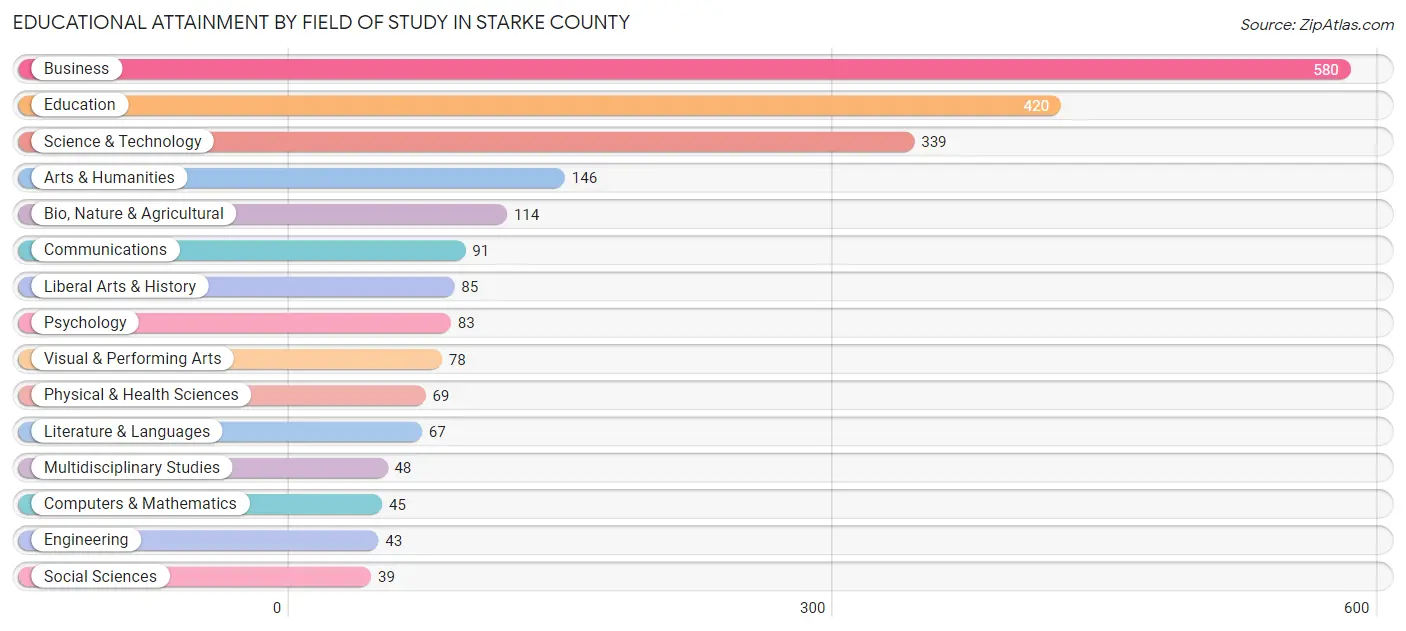
Educational Attainment by Field of Study in Starke County
Business (580 | 25.8%), education (420 | 18.7%), science & technology (339 | 15.1%), arts & humanities (146 | 6.5%), and bio, nature & agricultural (114 | 5.1%) are the most common fields of study among 2,247 individuals in Starke County who have obtained a bachelor's degree or higher.
| Field of Study | # Graduates | % Graduates |
| Computers & Mathematics | 45 | 2.0% |
| Bio, Nature & Agricultural | 114 | 5.1% |
| Physical & Health Sciences | 69 | 3.1% |
| Psychology | 83 | 3.7% |
| Social Sciences | 39 | 1.7% |
| Engineering | 43 | 1.9% |
| Multidisciplinary Studies | 48 | 2.1% |
| Science & Technology | 339 | 15.1% |
| Business | 580 | 25.8% |
| Education | 420 | 18.7% |
| Literature & Languages | 67 | 3.0% |
| Liberal Arts & History | 85 | 3.8% |
| Visual & Performing Arts | 78 | 3.5% |
| Communications | 91 | 4.1% |
| Arts & Humanities | 146 | 6.5% |
| Total | 2,247 | 100.0% |
Transportation & Commute in Starke County
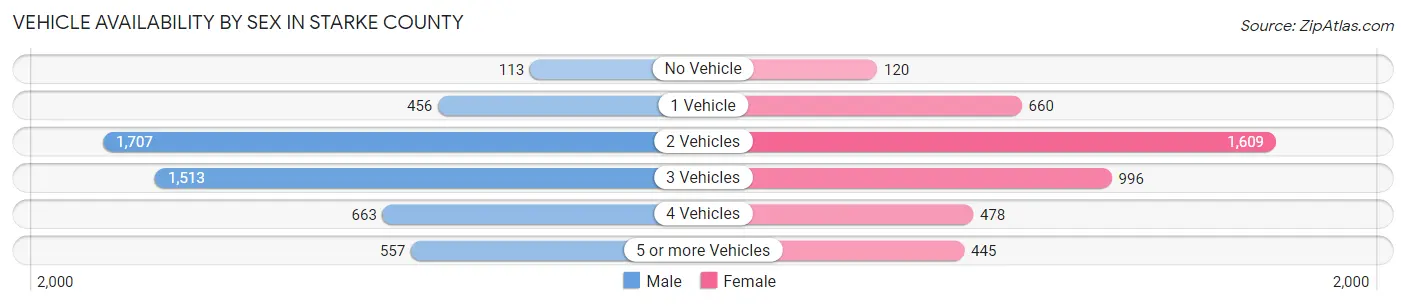
Vehicle Availability by Sex in Starke County
The most prevalent vehicle ownership categories in Starke County are males with 2 vehicles (1,707, accounting for 34.1%) and females with 2 vehicles (1,609, making up 39.6%).
| Vehicles Available | Male | Female |
| No Vehicle | 113 (2.3%) | 120 (2.8%) |
| 1 Vehicle | 456 (9.1%) | 660 (15.3%) |
| 2 Vehicles | 1,707 (34.1%) | 1,609 (37.3%) |
| 3 Vehicles | 1,513 (30.2%) | 996 (23.1%) |
| 4 Vehicles | 663 (13.2%) | 478 (11.1%) |
| 5 or more Vehicles | 557 (11.1%) | 445 (10.3%) |
| Total | 5,009 (100.0%) | 4,308 (100.0%) |
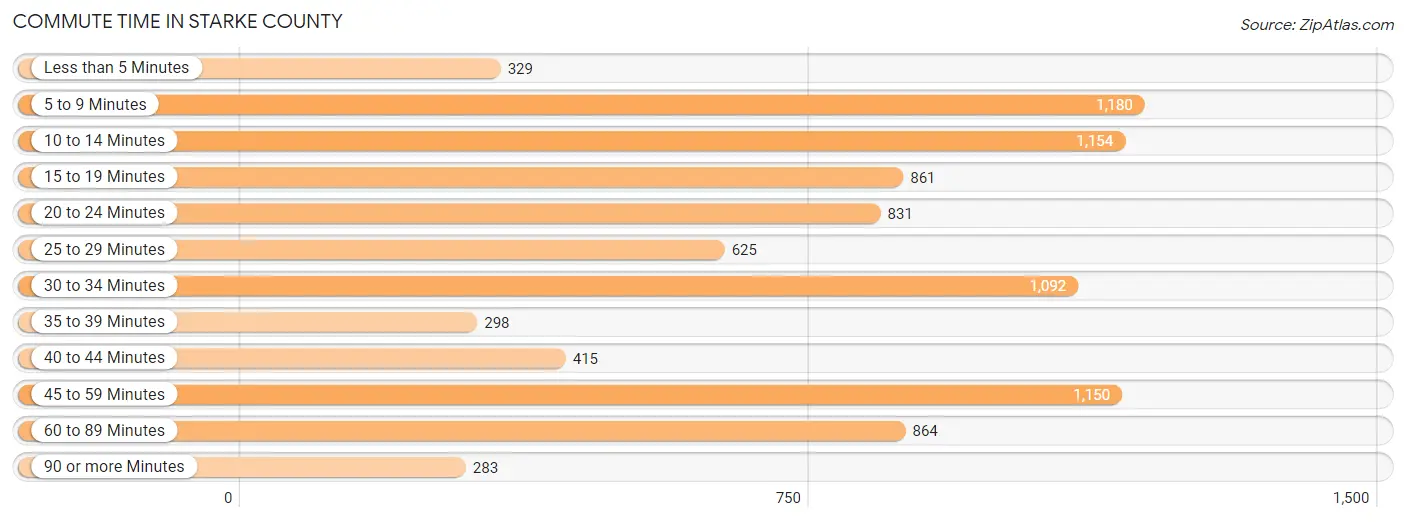
Commute Time in Starke County
The most frequently occuring commute durations in Starke County are 5 to 9 minutes (1,180 commuters, 13.0%), 10 to 14 minutes (1,154 commuters, 12.7%), and 45 to 59 minutes (1,150 commuters, 12.7%).
| Commute Time | # Commuters | % Commuters |
| Less than 5 Minutes | 329 | 3.6% |
| 5 to 9 Minutes | 1,180 | 13.0% |
| 10 to 14 Minutes | 1,154 | 12.7% |
| 15 to 19 Minutes | 861 | 9.5% |
| 20 to 24 Minutes | 831 | 9.1% |
| 25 to 29 Minutes | 625 | 6.9% |
| 30 to 34 Minutes | 1,092 | 12.0% |
| 35 to 39 Minutes | 298 | 3.3% |
| 40 to 44 Minutes | 415 | 4.6% |
| 45 to 59 Minutes | 1,150 | 12.7% |
| 60 to 89 Minutes | 864 | 9.5% |
| 90 or more Minutes | 283 | 3.1% |
Commute Time by Sex in Starke County
The most common commute times in Starke County are 45 to 59 minutes (723 commuters, 14.7%) for males and 10 to 14 minutes (674 commuters, 16.2%) for females.
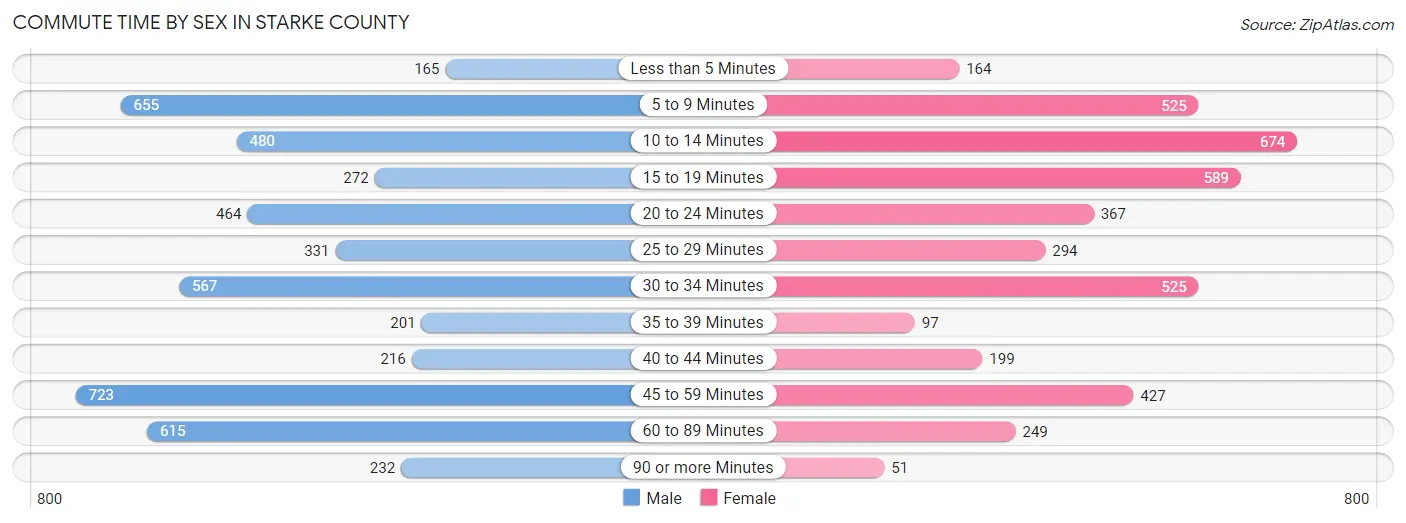
| Commute Time | Male | Female |
| Less than 5 Minutes | 165 (3.4%) | 164 (3.9%) |
| 5 to 9 Minutes | 655 (13.3%) | 525 (12.6%) |
| 10 to 14 Minutes | 480 (9.8%) | 674 (16.2%) |
| 15 to 19 Minutes | 272 (5.5%) | 589 (14.2%) |
| 20 to 24 Minutes | 464 (9.4%) | 367 (8.8%) |
| 25 to 29 Minutes | 331 (6.7%) | 294 (7.1%) |
| 30 to 34 Minutes | 567 (11.5%) | 525 (12.6%) |
| 35 to 39 Minutes | 201 (4.1%) | 97 (2.3%) |
| 40 to 44 Minutes | 216 (4.4%) | 199 (4.8%) |
| 45 to 59 Minutes | 723 (14.7%) | 427 (10.3%) |
| 60 to 89 Minutes | 615 (12.5%) | 249 (6.0%) |
| 90 or more Minutes | 232 (4.7%) | 51 (1.2%) |
Time of Departure to Work by Sex in Starke County
The most frequent times of departure to work in Starke County are 7:00 AM to 7:29 AM (652, 13.3%) for males and 7:00 AM to 7:29 AM (728, 17.5%) for females.
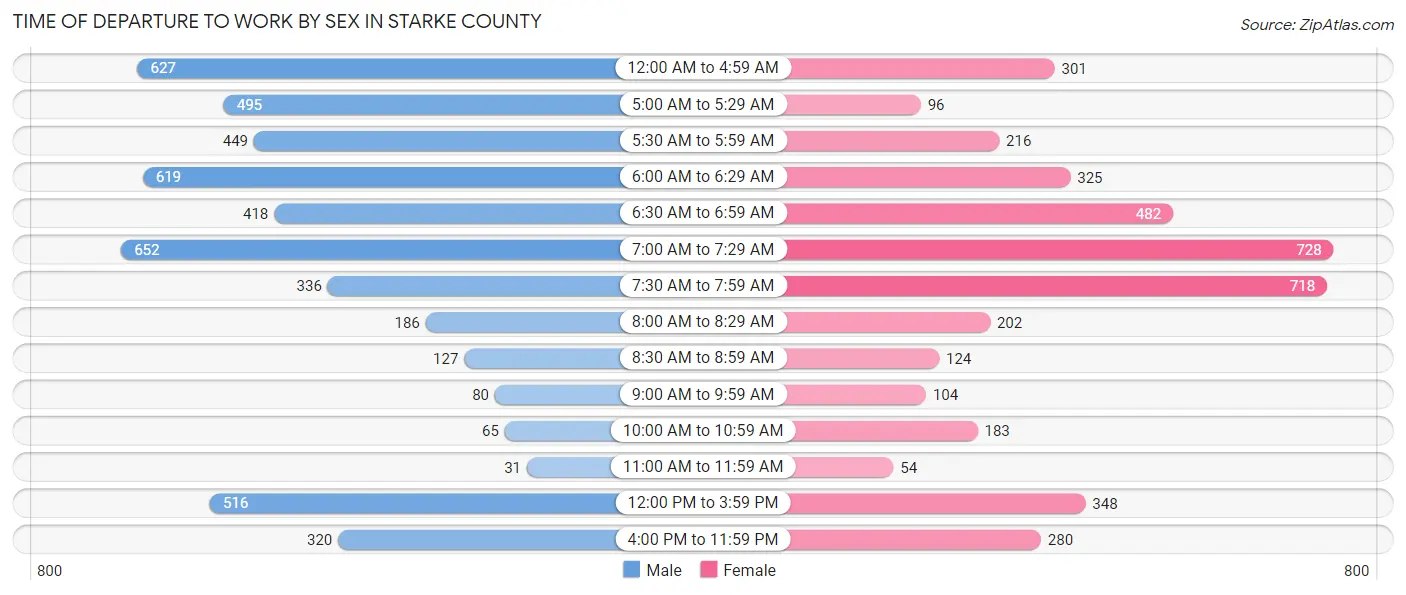
| Time of Departure | Male | Female |
| 12:00 AM to 4:59 AM | 627 (12.7%) | 301 (7.2%) |
| 5:00 AM to 5:29 AM | 495 (10.1%) | 96 (2.3%) |
| 5:30 AM to 5:59 AM | 449 (9.1%) | 216 (5.2%) |
| 6:00 AM to 6:29 AM | 619 (12.6%) | 325 (7.8%) |
| 6:30 AM to 6:59 AM | 418 (8.5%) | 482 (11.6%) |
| 7:00 AM to 7:29 AM | 652 (13.3%) | 728 (17.5%) |
| 7:30 AM to 7:59 AM | 336 (6.8%) | 718 (17.3%) |
| 8:00 AM to 8:29 AM | 186 (3.8%) | 202 (4.9%) |
| 8:30 AM to 8:59 AM | 127 (2.6%) | 124 (3.0%) |
| 9:00 AM to 9:59 AM | 80 (1.6%) | 104 (2.5%) |
| 10:00 AM to 10:59 AM | 65 (1.3%) | 183 (4.4%) |
| 11:00 AM to 11:59 AM | 31 (0.6%) | 54 (1.3%) |
| 12:00 PM to 3:59 PM | 516 (10.5%) | 348 (8.4%) |
| 4:00 PM to 11:59 PM | 320 (6.5%) | 280 (6.7%) |
| Total | 4,921 (100.0%) | 4,161 (100.0%) |
Housing Occupancy in Starke County
Occupancy by Ownership in Starke County
Of the total 8,647 dwellings in Starke County, owner-occupied units account for 7,256 (83.9%), while renter-occupied units make up 1,391 (16.1%).

| Occupancy | # Housing Units | % Housing Units |
| Owner Occupied Housing Units | 7,256 | 83.9% |
| Renter-Occupied Housing Units | 1,391 | 16.1% |
| Total Occupied Housing Units | 8,647 | 100.0% |
Occupancy by Household Size in Starke County
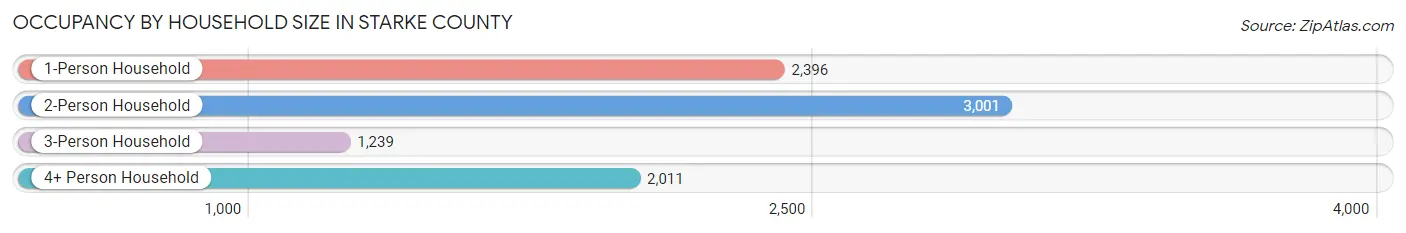
| Household Size | # Housing Units | % Housing Units |
| 1-Person Household | 2,396 | 27.7% |
| 2-Person Household | 3,001 | 34.7% |
| 3-Person Household | 1,239 | 14.3% |
| 4+ Person Household | 2,011 | 23.3% |
| Total Housing Units | 8,647 | 100.0% |
Occupancy by Ownership by Household Size in Starke County
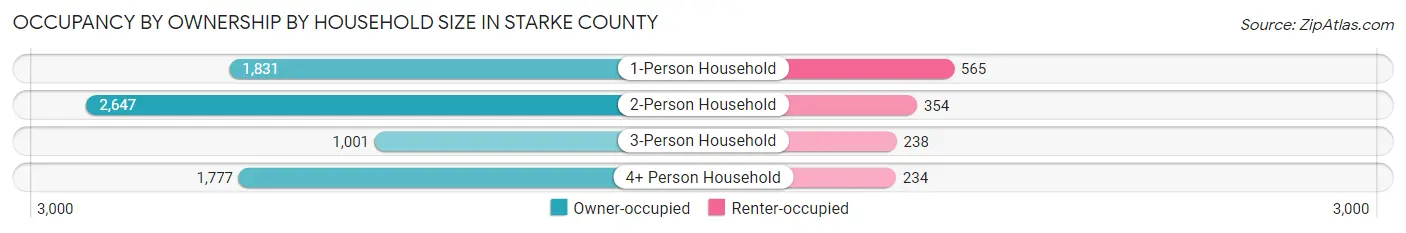
| Household Size | Owner-occupied | Renter-occupied |
| 1-Person Household | 1,831 (76.4%) | 565 (23.6%) |
| 2-Person Household | 2,647 (88.2%) | 354 (11.8%) |
| 3-Person Household | 1,001 (80.8%) | 238 (19.2%) |
| 4+ Person Household | 1,777 (88.4%) | 234 (11.6%) |
| Total Housing Units | 7,256 (83.9%) | 1,391 (16.1%) |
Occupancy by Educational Attainment in Starke County

| Household Size | Owner-occupied | Renter-occupied |
| Less than High School | 730 (77.7%) | 209 (22.3%) |
| High School Diploma | 3,094 (82.8%) | 641 (17.2%) |
| College/Associate Degree | 2,099 (83.5%) | 416 (16.5%) |
| Bachelor's Degree or higher | 1,333 (91.4%) | 125 (8.6%) |
Occupancy by Age of Householder in Starke County
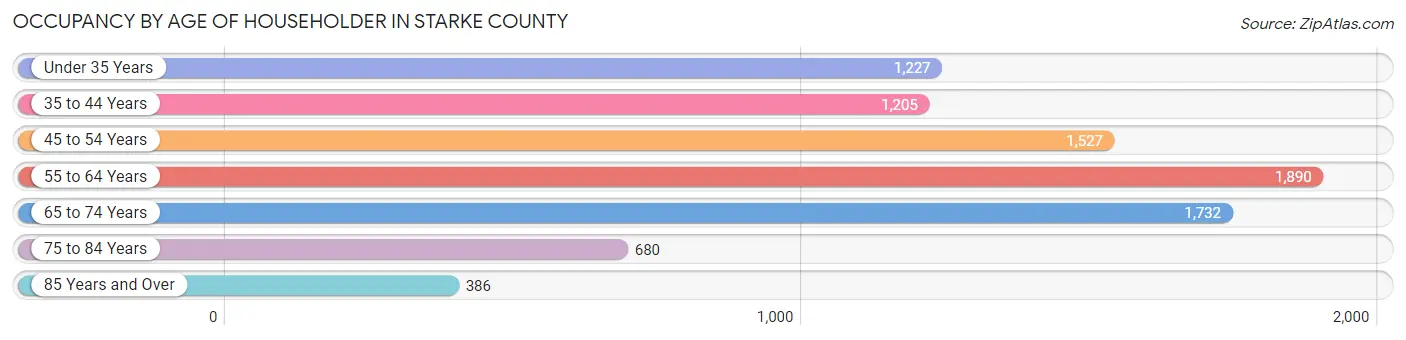
| Age Bracket | # Households | % Households |
| Under 35 Years | 1,227 | 14.2% |
| 35 to 44 Years | 1,205 | 13.9% |
| 45 to 54 Years | 1,527 | 17.7% |
| 55 to 64 Years | 1,890 | 21.9% |
| 65 to 74 Years | 1,732 | 20.0% |
| 75 to 84 Years | 680 | 7.9% |
| 85 Years and Over | 386 | 4.5% |
| Total | 8,647 | 100.0% |
Housing Finances in Starke County
Median Income by Occupancy in Starke County
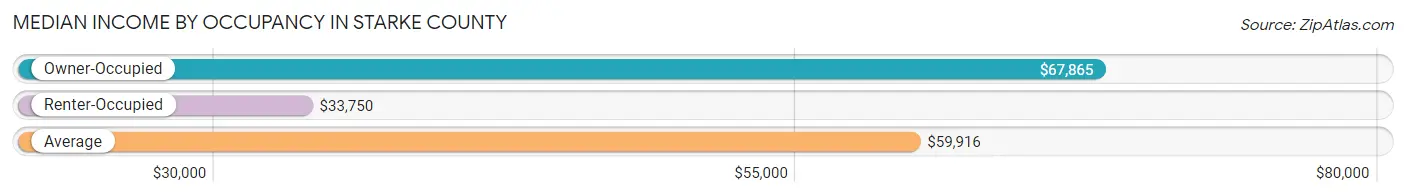
| Occupancy Type | # Households | Median Income |
| Owner-Occupied | 7,256 (83.9%) | $67,865 |
| Renter-Occupied | 1,391 (16.1%) | $33,750 |
| Average | 8,647 (100.0%) | $59,916 |
Occupancy by Householder Income Bracket in Starke County

| Income Bracket | Owner-occupied | Renter-occupied |
| Less than $5,000 | 286 (3.9%) | 104 (7.5%) |
| $5,000 to $9,999 | 118 (1.6%) | 33 (2.4%) |
| $10,000 to $14,999 | 220 (3.0%) | 215 (15.5%) |
| $15,000 to $19,999 | 209 (2.9%) | 91 (6.5%) |
| $20,000 to $24,999 | 178 (2.5%) | 153 (11.0%) |
| $25,000 to $34,999 | 732 (10.1%) | 121 (8.7%) |
| $35,000 to $49,999 | 918 (12.7%) | 245 (17.6%) |
| $50,000 to $74,999 | 1,333 (18.4%) | 245 (17.6%) |
| $75,000 to $99,999 | 1,446 (19.9%) | 38 (2.7%) |
| $100,000 to $149,999 | 1,150 (15.9%) | 110 (7.9%) |
| $150,000 or more | 666 (9.2%) | 36 (2.6%) |
| Total | 7,256 (100.0%) | 1,391 (100.0%) |
Monthly Housing Cost Tiers in Starke County

| Monthly Cost | Owner-occupied | Renter-occupied |
| Less than $300 | 678 (9.3%) | 105 (7.5%) |
| $300 to $499 | 1,272 (17.5%) | 202 (14.5%) |
| $500 to $799 | 1,727 (23.8%) | 487 (35.0%) |
| $800 to $999 | 1,002 (13.8%) | 218 (15.7%) |
| $1,000 to $1,499 | 1,730 (23.8%) | 216 (15.5%) |
| $1,500 to $1,999 | 531 (7.3%) | 5 (0.4%) |
| $2,000 to $2,499 | 239 (3.3%) | 9 (0.6%) |
| $2,500 to $2,999 | 24 (0.3%) | 0 (0.0%) |
| $3,000 or more | 53 (0.7%) | 0 (0.0%) |
| Total | 7,256 (100.0%) | 1,391 (100.0%) |
Physical Housing Characteristics in Starke County
Housing Structures in Starke County
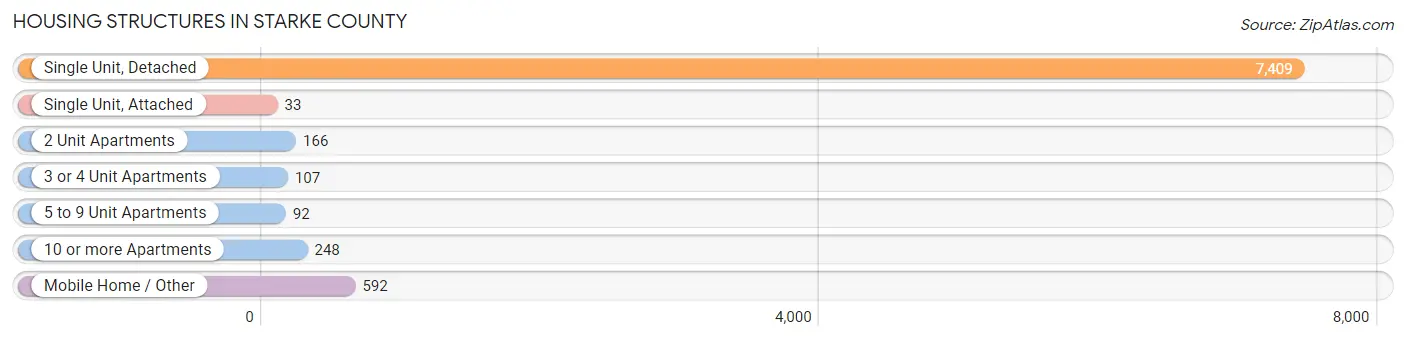
| Structure Type | # Housing Units | % Housing Units |
| Single Unit, Detached | 7,409 | 85.7% |
| Single Unit, Attached | 33 | 0.4% |
| 2 Unit Apartments | 166 | 1.9% |
| 3 or 4 Unit Apartments | 107 | 1.2% |
| 5 to 9 Unit Apartments | 92 | 1.1% |
| 10 or more Apartments | 248 | 2.9% |
| Mobile Home / Other | 592 | 6.9% |
| Total | 8,647 | 100.0% |
Housing Structures by Occupancy in Starke County
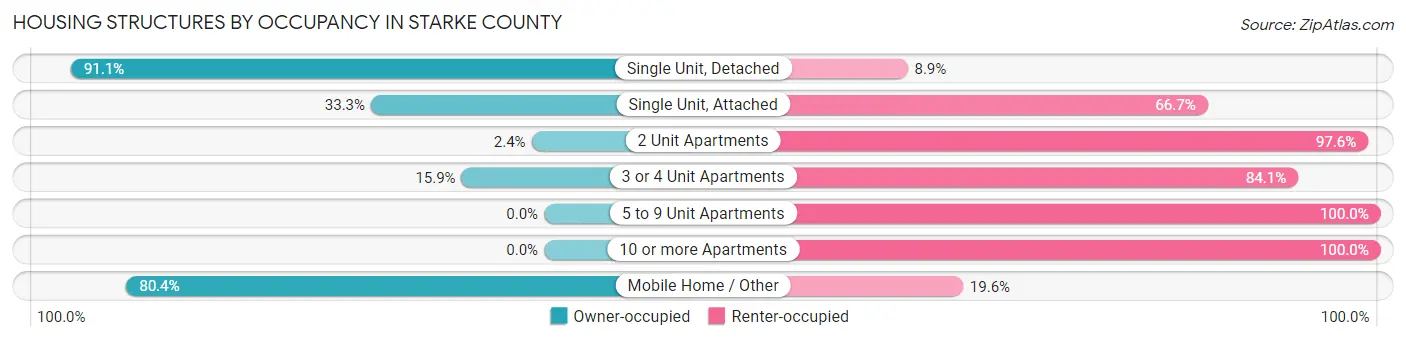
| Structure Type | Owner-occupied | Renter-occupied |
| Single Unit, Detached | 6,748 (91.1%) | 661 (8.9%) |
| Single Unit, Attached | 11 (33.3%) | 22 (66.7%) |
| 2 Unit Apartments | 4 (2.4%) | 162 (97.6%) |
| 3 or 4 Unit Apartments | 17 (15.9%) | 90 (84.1%) |
| 5 to 9 Unit Apartments | 0 (0.0%) | 92 (100.0%) |
| 10 or more Apartments | 0 (0.0%) | 248 (100.0%) |
| Mobile Home / Other | 476 (80.4%) | 116 (19.6%) |
| Total | 7,256 (83.9%) | 1,391 (16.1%) |
Housing Structures by Number of Rooms in Starke County
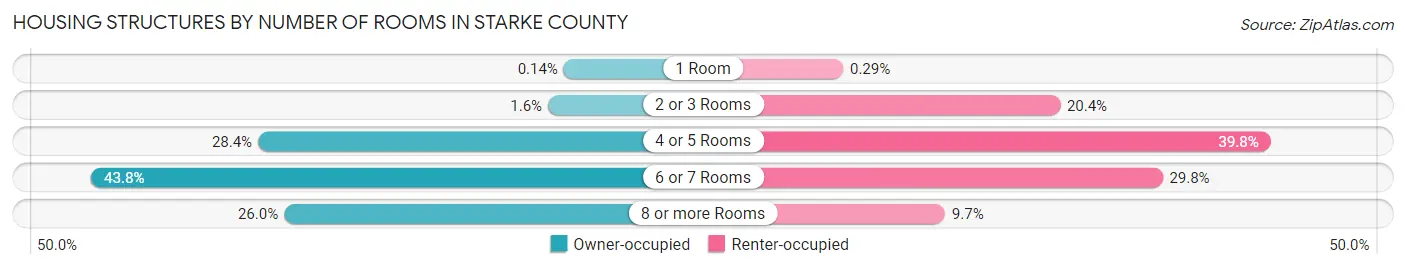
| Number of Rooms | Owner-occupied | Renter-occupied |
| 1 Room | 10 (0.1%) | 4 (0.3%) |
| 2 or 3 Rooms | 116 (1.6%) | 283 (20.3%) |
| 4 or 5 Rooms | 2,062 (28.4%) | 554 (39.8%) |
| 6 or 7 Rooms | 3,181 (43.8%) | 415 (29.8%) |
| 8 or more Rooms | 1,887 (26.0%) | 135 (9.7%) |
| Total | 7,256 (100.0%) | 1,391 (100.0%) |
Housing Structure by Heating Type in Starke County

| Heating Type | Owner-occupied | Renter-occupied |
| Utility Gas | 4,959 (68.3%) | 888 (63.8%) |
| Bottled, Tank, or LP Gas | 1,402 (19.3%) | 138 (9.9%) |
| Electricity | 487 (6.7%) | 315 (22.7%) |
| Fuel Oil or Kerosene | 8 (0.1%) | 0 (0.0%) |
| Coal or Coke | 0 (0.0%) | 0 (0.0%) |
| All other Fuels | 392 (5.4%) | 50 (3.6%) |
| No Fuel Used | 8 (0.1%) | 0 (0.0%) |
| Total | 7,256 (100.0%) | 1,391 (100.0%) |
Household Vehicle Usage in Starke County
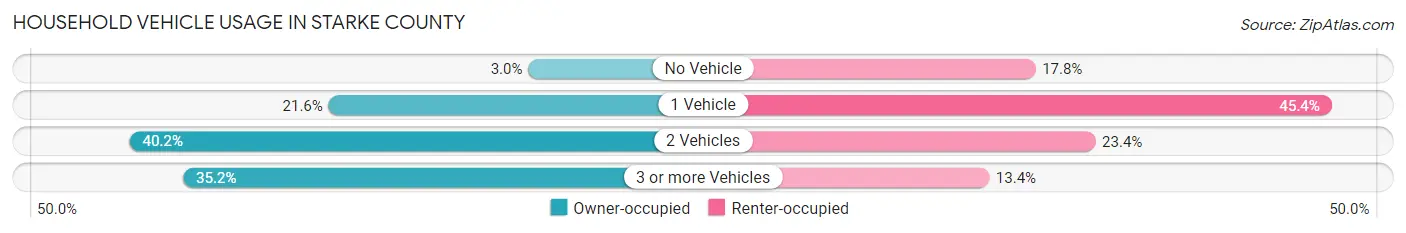
| Vehicles per Household | Owner-occupied | Renter-occupied |
| No Vehicle | 216 (3.0%) | 247 (17.8%) |
| 1 Vehicle | 1,569 (21.6%) | 632 (45.4%) |
| 2 Vehicles | 2,917 (40.2%) | 325 (23.4%) |
| 3 or more Vehicles | 2,554 (35.2%) | 187 (13.4%) |
| Total | 7,256 (100.0%) | 1,391 (100.0%) |
Real Estate & Mortgages in Starke County
Real Estate and Mortgage Overview in Starke County
| Characteristic | Without Mortgage | With Mortgage |
| Housing Units | 3,011 | 4,245 |
| Median Property Value | $137,200 | $147,600 |
| Median Household Income | $52,441 | $494 |
| Monthly Housing Costs | $443 | $53 |
| Real Estate Taxes | $837 | $138 |
Property Value by Mortgage Status in Starke County
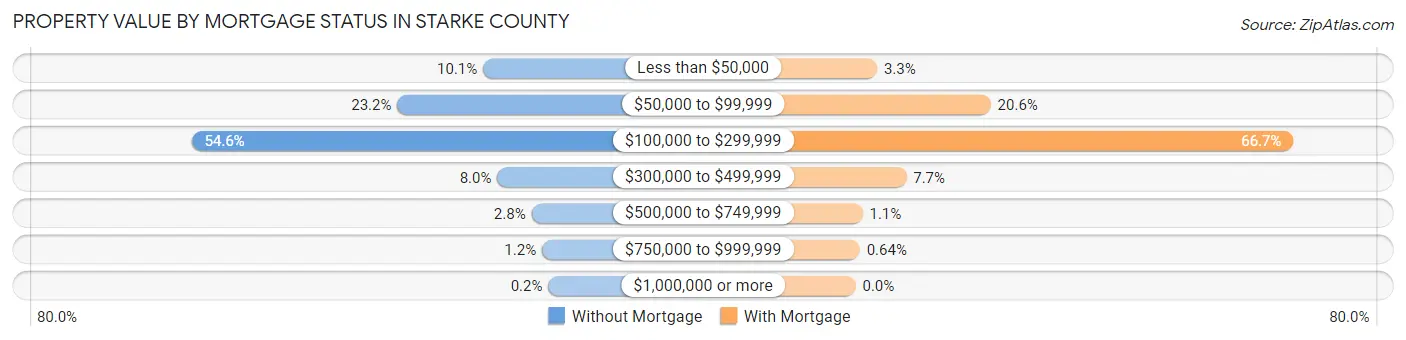
| Property Value | Without Mortgage | With Mortgage |
| Less than $50,000 | 305 (10.1%) | 139 (3.3%) |
| $50,000 to $99,999 | 699 (23.2%) | 874 (20.6%) |
| $100,000 to $299,999 | 1,643 (54.6%) | 2,832 (66.7%) |
| $300,000 to $499,999 | 240 (8.0%) | 328 (7.7%) |
| $500,000 to $749,999 | 83 (2.8%) | 45 (1.1%) |
| $750,000 to $999,999 | 35 (1.2%) | 27 (0.6%) |
| $1,000,000 or more | 6 (0.2%) | 0 (0.0%) |
| Total | 3,011 (100.0%) | 4,245 (100.0%) |
Household Income by Mortgage Status in Starke County
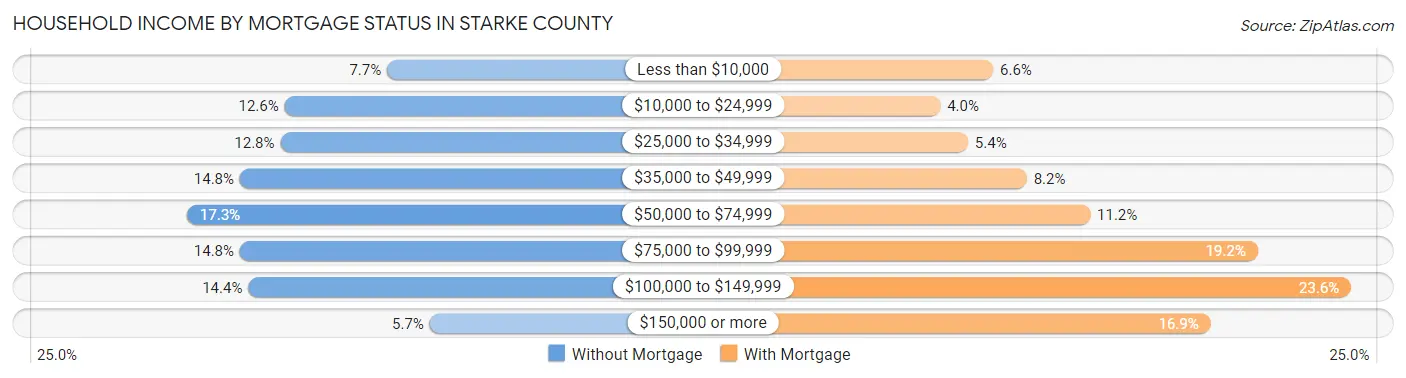
| Household Income | Without Mortgage | With Mortgage |
| Less than $10,000 | 233 (7.7%) | 278 (6.6%) |
| $10,000 to $24,999 | 380 (12.6%) | 171 (4.0%) |
| $25,000 to $34,999 | 386 (12.8%) | 227 (5.3%) |
| $35,000 to $49,999 | 444 (14.7%) | 346 (8.2%) |
| $50,000 to $74,999 | 520 (17.3%) | 474 (11.2%) |
| $75,000 to $99,999 | 444 (14.7%) | 813 (19.2%) |
| $100,000 to $149,999 | 432 (14.3%) | 1,002 (23.6%) |
| $150,000 or more | 172 (5.7%) | 718 (16.9%) |
| Total | 3,011 (100.0%) | 4,245 (100.0%) |
Property Value to Household Income Ratio in Starke County
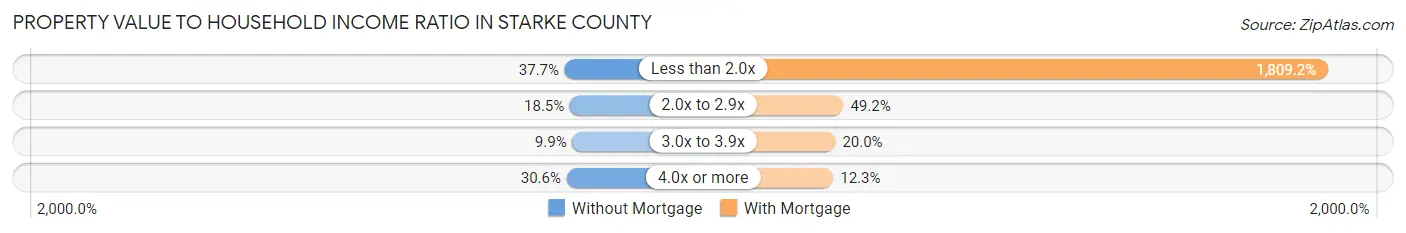
| Value-to-Income Ratio | Without Mortgage | With Mortgage |
| Less than 2.0x | 1,136 (37.7%) | 76,801 (1,809.2%) |
| 2.0x to 2.9x | 558 (18.5%) | 2,088 (49.2%) |
| 3.0x to 3.9x | 299 (9.9%) | 850 (20.0%) |
| 4.0x or more | 921 (30.6%) | 520 (12.2%) |
| Total | 3,011 (100.0%) | 4,245 (100.0%) |
Real Estate Taxes by Mortgage Status in Starke County
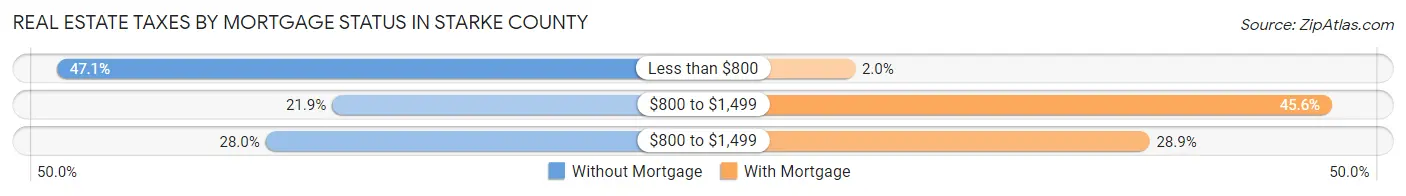
| Property Taxes | Without Mortgage | With Mortgage |
| Less than $800 | 1,417 (47.1%) | 85 (2.0%) |
| $800 to $1,499 | 660 (21.9%) | 1,934 (45.6%) |
| $800 to $1,499 | 843 (28.0%) | 1,227 (28.9%) |
| Total | 3,011 (100.0%) | 4,245 (100.0%) |
Health & Disability in Starke County
Health Insurance Coverage by Age in Starke County
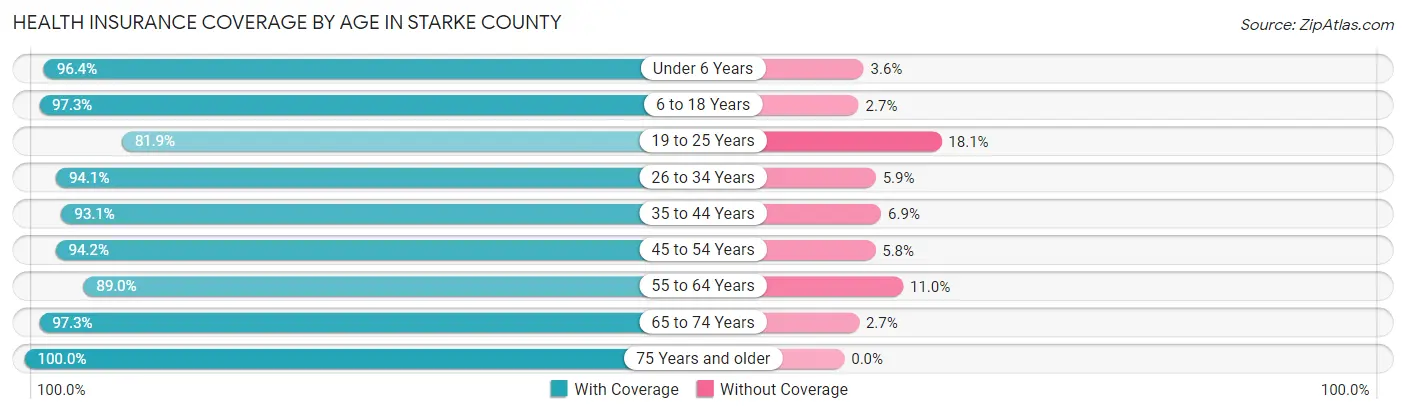
| Age Bracket | With Coverage | Without Coverage |
| Under 6 Years | 1,635 (96.4%) | 61 (3.6%) |
| 6 to 18 Years | 3,818 (97.3%) | 105 (2.7%) |
| 19 to 25 Years | 1,533 (81.9%) | 339 (18.1%) |
| 26 to 34 Years | 2,151 (94.1%) | 134 (5.9%) |
| 35 to 44 Years | 2,589 (93.1%) | 191 (6.9%) |
| 45 to 54 Years | 2,753 (94.2%) | 169 (5.8%) |
| 55 to 64 Years | 3,062 (89.0%) | 377 (11.0%) |
| 65 to 74 Years | 2,633 (97.3%) | 74 (2.7%) |
| 75 Years and older | 1,667 (100.0%) | 0 (0.0%) |
| Total | 21,841 (93.8%) | 1,450 (6.2%) |
Health Insurance Coverage by Citizenship Status in Starke County
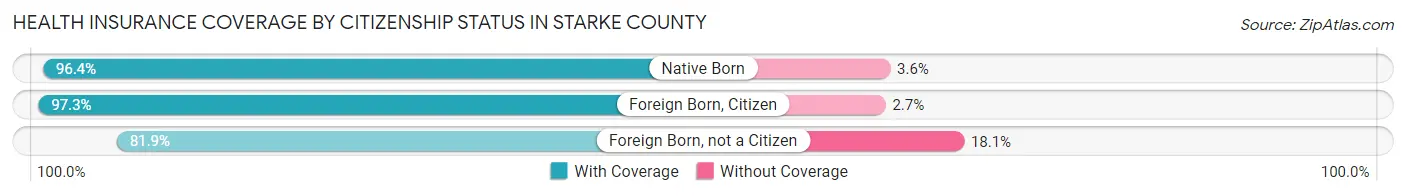
| Citizenship Status | With Coverage | Without Coverage |
| Native Born | 1,635 (96.4%) | 61 (3.6%) |
| Foreign Born, Citizen | 3,818 (97.3%) | 105 (2.7%) |
| Foreign Born, not a Citizen | 1,533 (81.9%) | 339 (18.1%) |
Health Insurance Coverage by Household Income in Starke County
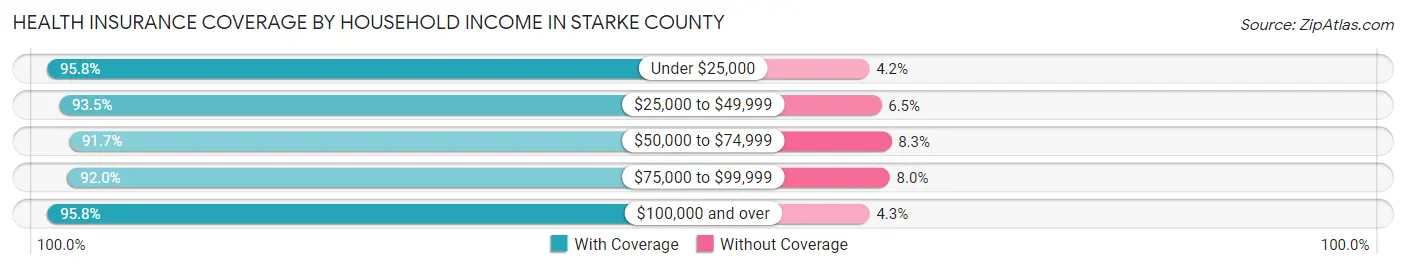
| Household Income | With Coverage | Without Coverage |
| Under $25,000 | 2,256 (95.8%) | 99 (4.2%) |
| $25,000 to $49,999 | 4,789 (93.5%) | 331 (6.5%) |
| $50,000 to $74,999 | 3,903 (91.7%) | 354 (8.3%) |
| $75,000 to $99,999 | 4,159 (92.0%) | 363 (8.0%) |
| $100,000 and over | 6,688 (95.8%) | 297 (4.3%) |
Public vs Private Health Insurance Coverage by Age in Starke County
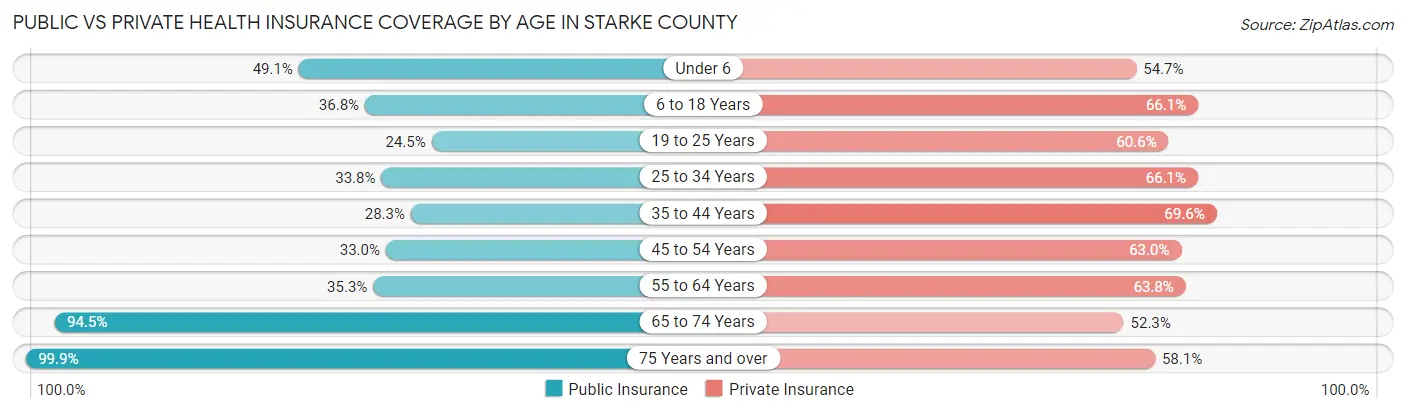
| Age Bracket | Public Insurance | Private Insurance |
| Under 6 | 833 (49.1%) | 927 (54.7%) |
| 6 to 18 Years | 1,445 (36.8%) | 2,594 (66.1%) |
| 19 to 25 Years | 458 (24.5%) | 1,135 (60.6%) |
| 25 to 34 Years | 772 (33.8%) | 1,510 (66.1%) |
| 35 to 44 Years | 787 (28.3%) | 1,934 (69.6%) |
| 45 to 54 Years | 963 (33.0%) | 1,841 (63.0%) |
| 55 to 64 Years | 1,214 (35.3%) | 2,195 (63.8%) |
| 65 to 74 Years | 2,559 (94.5%) | 1,416 (52.3%) |
| 75 Years and over | 1,665 (99.9%) | 969 (58.1%) |
| Total | 10,696 (45.9%) | 14,521 (62.4%) |
Disability Status by Sex by Age in Starke County
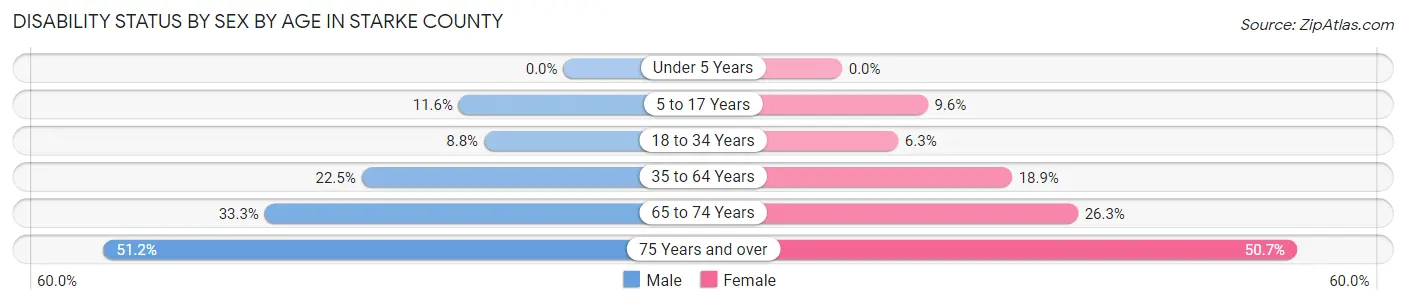
| Age Bracket | Male | Female |
| Under 5 Years | 0 (0.0%) | 0 (0.0%) |
| 5 to 17 Years | 250 (11.6%) | 177 (9.6%) |
| 18 to 34 Years | 195 (8.8%) | 140 (6.2%) |
| 35 to 64 Years | 1,028 (22.5%) | 864 (18.9%) |
| 65 to 74 Years | 447 (33.3%) | 358 (26.3%) |
| 75 Years and over | 405 (51.2%) | 444 (50.7%) |
Disability Class by Sex by Age in Starke County
Disability Class: Hearing Difficulty

| Age Bracket | Male | Female |
| Under 5 Years | 0 (0.0%) | 0 (0.0%) |
| 5 to 17 Years | 49 (2.3%) | 45 (2.4%) |
| 18 to 34 Years | 4 (0.2%) | 0 (0.0%) |
| 35 to 64 Years | 119 (2.6%) | 190 (4.2%) |
| 65 to 74 Years | 267 (19.9%) | 87 (6.4%) |
| 75 Years and over | 217 (27.4%) | 151 (17.2%) |
Disability Class: Vision Difficulty
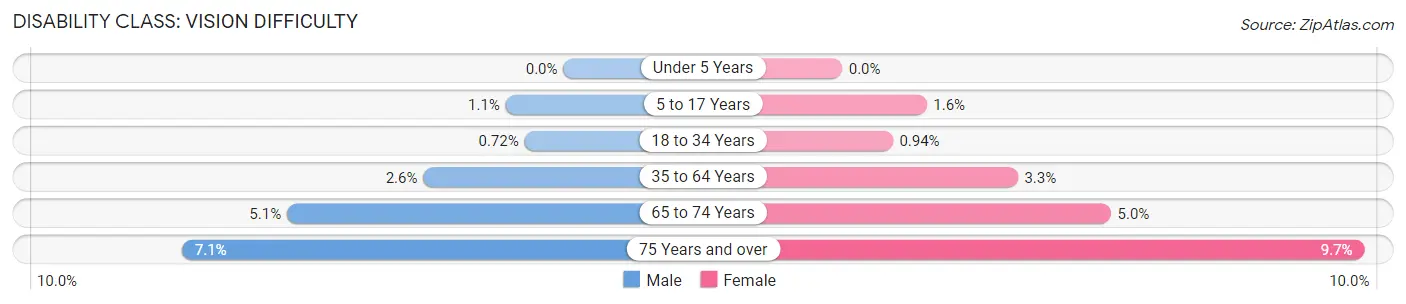
| Age Bracket | Male | Female |
| Under 5 Years | 0 (0.0%) | 0 (0.0%) |
| 5 to 17 Years | 23 (1.1%) | 29 (1.6%) |
| 18 to 34 Years | 16 (0.7%) | 21 (0.9%) |
| 35 to 64 Years | 119 (2.6%) | 149 (3.3%) |
| 65 to 74 Years | 69 (5.1%) | 68 (5.0%) |
| 75 Years and over | 56 (7.1%) | 85 (9.7%) |
Disability Class: Cognitive Difficulty
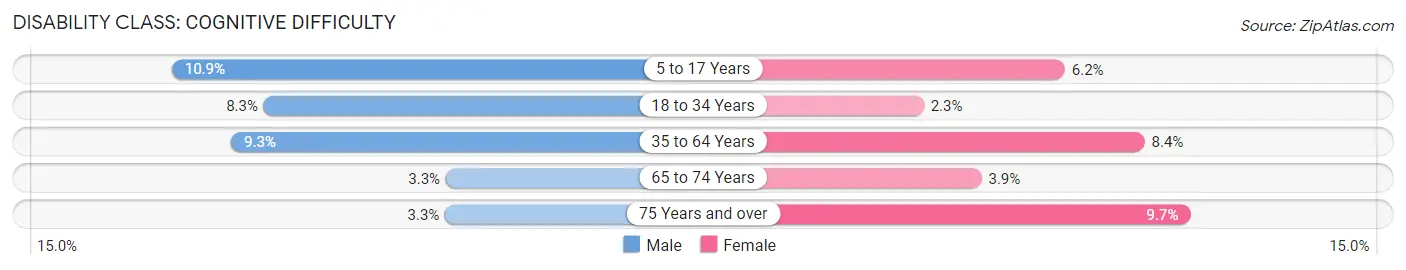
| Age Bracket | Male | Female |
| 5 to 17 Years | 234 (10.9%) | 115 (6.2%) |
| 18 to 34 Years | 184 (8.3%) | 51 (2.3%) |
| 35 to 64 Years | 423 (9.2%) | 385 (8.4%) |
| 65 to 74 Years | 44 (3.3%) | 53 (3.9%) |
| 75 Years and over | 26 (3.3%) | 85 (9.7%) |
Disability Class: Ambulatory Difficulty
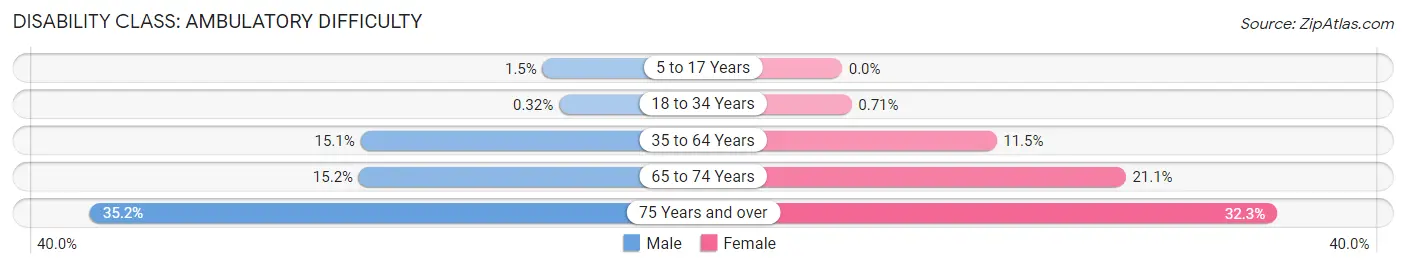
| Age Bracket | Male | Female |
| 5 to 17 Years | 33 (1.5%) | 0 (0.0%) |
| 18 to 34 Years | 7 (0.3%) | 16 (0.7%) |
| 35 to 64 Years | 689 (15.1%) | 524 (11.5%) |
| 65 to 74 Years | 204 (15.2%) | 287 (21.1%) |
| 75 Years and over | 278 (35.1%) | 283 (32.3%) |
Disability Class: Self-Care Difficulty
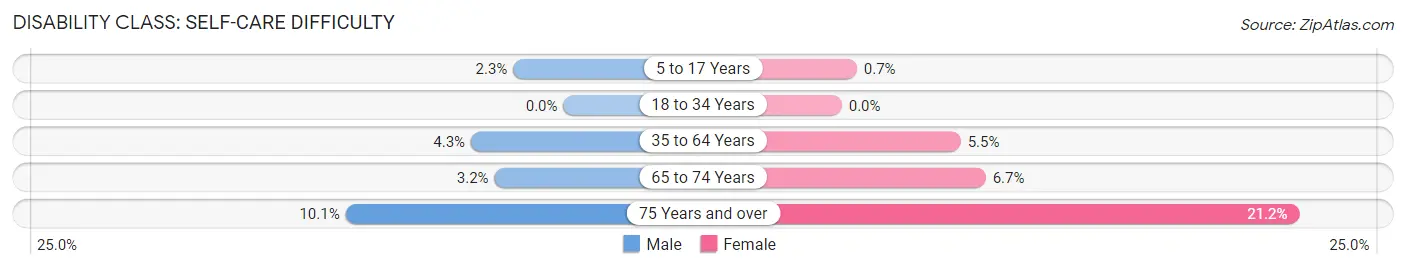
| Age Bracket | Male | Female |
| 5 to 17 Years | 50 (2.3%) | 13 (0.7%) |
| 18 to 34 Years | 0 (0.0%) | 0 (0.0%) |
| 35 to 64 Years | 196 (4.3%) | 252 (5.5%) |
| 65 to 74 Years | 43 (3.2%) | 91 (6.7%) |
| 75 Years and over | 80 (10.1%) | 186 (21.2%) |
Technology Access in Starke County
Computing Device Access in Starke County
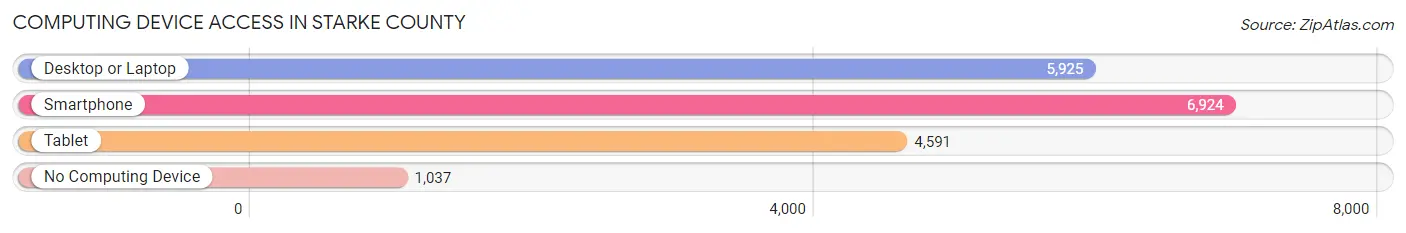
| Device Type | # Households | % Households |
| Desktop or Laptop | 5,925 | 68.5% |
| Smartphone | 6,924 | 80.1% |
| Tablet | 4,591 | 53.1% |
| No Computing Device | 1,037 | 12.0% |
| Total | 8,647 | 100.0% |
Internet Access in Starke County
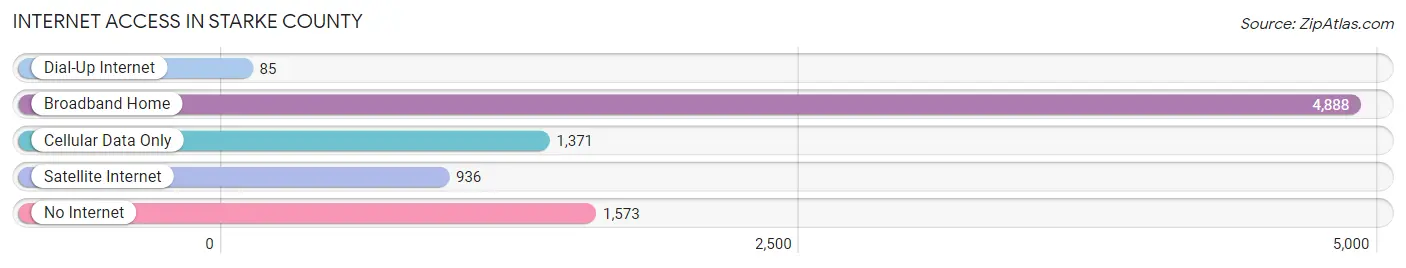
| Internet Type | # Households | % Households |
| Dial-Up Internet | 85 | 1.0% |
| Broadband Home | 4,888 | 56.5% |
| Cellular Data Only | 1,371 | 15.9% |
| Satellite Internet | 936 | 10.8% |
| No Internet | 1,573 | 18.2% |
| Total | 8,647 | 100.0% |
Starke County Summary
Starke County is located in the northern part of the state of Indiana, in the United States. It is bordered by LaPorte County to the north, St. Joseph County to the east, Marshall County to the south, and Pulaski County to the west. The county seat is Knox, Indiana. The county was established in 1835 and named for General John Stark, a Revolutionary War hero.
Geography
Starke County is located in the northern part of Indiana, in the United States. It is bordered by LaPorte County to the north, St. Joseph County to the east, Marshall County to the south, and Pulaski County to the west. The county has a total area of 441 square miles, of which 437 square miles is land and 4.2 square miles is water. The county is mostly flat, with some rolling hills in the northern part. The highest point in the county is located in the northwest corner, at an elevation of 890 feet.
The Kankakee River flows through the county, and there are several small lakes and ponds scattered throughout the area. The climate is generally humid continental, with hot summers and cold winters. The average annual temperature is around 50 degrees Fahrenheit, and the average annual precipitation is around 40 inches.
Demographics
As of the 2010 census, there were 23,456 people, 8,945 households, and 6,541 families residing in the county. The population density was 53 people per square mile. The racial makeup of the county was 97.3% White, 0.5% African American, 0.3% Native American, 0.3% Asian, 0.2% from other races, and 1.4% from two or more races. Hispanic or Latino of any race were 1.2% of the population.
The median income for a household in the county was $45,945, and the median income for a family was $54,945. The per capita income for the county was $21,945. About 8.3% of families and 10.7% of the population were below the poverty line, including 14.2% of those under age 18 and 8.2% of those age 65 or over.
Economy
The economy of Starke County is largely based on agriculture and manufacturing. The county is home to several large farms, which produce corn, soybeans, wheat, and other crops. The county is also home to several manufacturing companies, including a steel mill, a paper mill, and a plastics factory.
The county also has a growing tourism industry, with several attractions, such as the Starke County Historical Museum, the Starke County Courthouse, and the Starke County Fairgrounds. The county is also home to several wineries, which attract visitors from all over the state.
Conclusion
Starke County is a rural county located in the northern part of Indiana. It is bordered by LaPorte County to the north, St. Joseph County to the east, Marshall County to the south, and Pulaski County to the west. The county has a total area of 441 square miles, and the population was 23,456 as of the 2010 census. The economy of the county is largely based on agriculture and manufacturing, and the county also has a growing tourism industry.
Common Questions
What is the Total Population of Starke County?
Total Population of Starke County is 23,308.
What is the Total Male Population of Starke County?
Total Male Population of Starke County is 11,724.
What is the Total Female Population of Starke County?
Total Female Population of Starke County is 11,584.
What is the Ratio of Males per 100 Females in Starke County?
There are 101.21 Males per 100 Females in Starke County.
What is the Ratio of Females per 100 Males in Starke County?
There are 98.81 Females per 100 Males in Starke County.
What is the Median Population Age in Starke County?
Median Population Age in Starke County is 41.7 Years.
What is the Average Family Size in Starke County
Average Family Size in Starke County is 3.3 People.
What is the Average Household Size in Starke County
Average Household Size in Starke County is 2.7 People.
What is Per Capita Income in Starke County?
Per Capita income in Starke County is $28,788.
What is the Median Family Income in Starke County?
Median Family Income in Starke County is $73,212.
What is the Median Household income in Starke County?
Median Household Income in Starke County is $59,916.
What is Income or Wage Gap in Starke County?
Income or Wage Gap in Starke County is 43.0%.
Women in Starke County earn 57.0 cents for every dollar earned by a man.
What is Family Income Deficit in Starke County?
Family Income Deficit in Starke County is $8,342.
Families that are below poverty line in Starke County earn $8,342 less on average than the poverty threshold level.
What is Inequality or Gini Index in Starke County?
Inequality or Gini Index in Starke County is 0.43.
How Large is the Labor Force in Starke County?
There are 9,956 People in the Labor Forcein in Starke County.
What is the Percentage of People in the Labor Force in Starke County?
53.7% of People are in the Labor Force in Starke County.
What is the Unemployment Rate in Starke County?
Unemployment Rate in Starke County is 4.0%.