St. Joseph County, IN
St. Joseph County Map
St. Joseph County Overview
272,388
TOTAL POPULATION
133,435
MALE POPULATION
138,953
FEMALE POPULATION
96.03
MALES / 100 FEMALES
104.14
FEMALES / 100 MALES
36.7
MEDIAN AGE
3.1
AVG FAMILY SIZE
2.4
AVG HOUSEHOLD SIZE
$34,266
PER CAPITA INCOME
$80,842
AVG FAMILY INCOME
$61,877
AVG HOUSEHOLD INCOME
33.3%
WAGE / INCOME GAP [ % ]
66.7¢/ $1
WAGE / INCOME GAP [ $ ]
$11,025
FAMILY INCOME DEFICIT
0.47
INEQUALITY / GINI INDEX
137,844
LABOR FORCE [ PEOPLE ]
63.8%
PERCENT IN LABOR FORCE
4.8%
UNEMPLOYMENT RATE
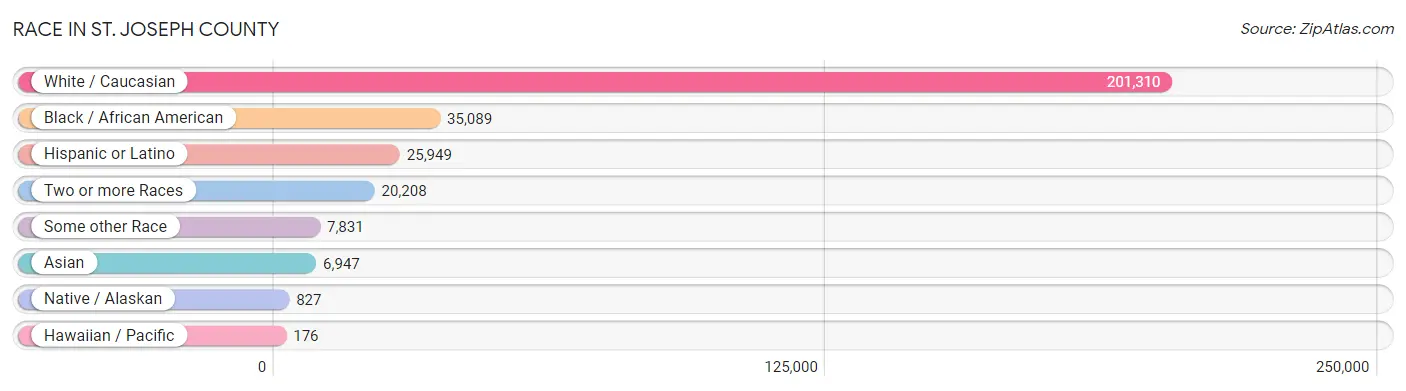
Race in St. Joseph County
The most populous races in St. Joseph County are White / Caucasian (201,310 | 73.9%), Black / African American (35,089 | 12.9%), and Hispanic or Latino (25,949 | 9.5%).
| Race | # Population | % Population |
| Asian | 6,947 | 2.5% |
| Black / African American | 35,089 | 12.9% |
| Hawaiian / Pacific | 176 | 0.1% |
| Hispanic or Latino | 25,949 | 9.5% |
| Native / Alaskan | 827 | 0.3% |
| White / Caucasian | 201,310 | 73.9% |
| Two or more Races | 20,208 | 7.4% |
| Some other Race | 7,831 | 2.9% |
| Total | 272,388 | 100.0% |
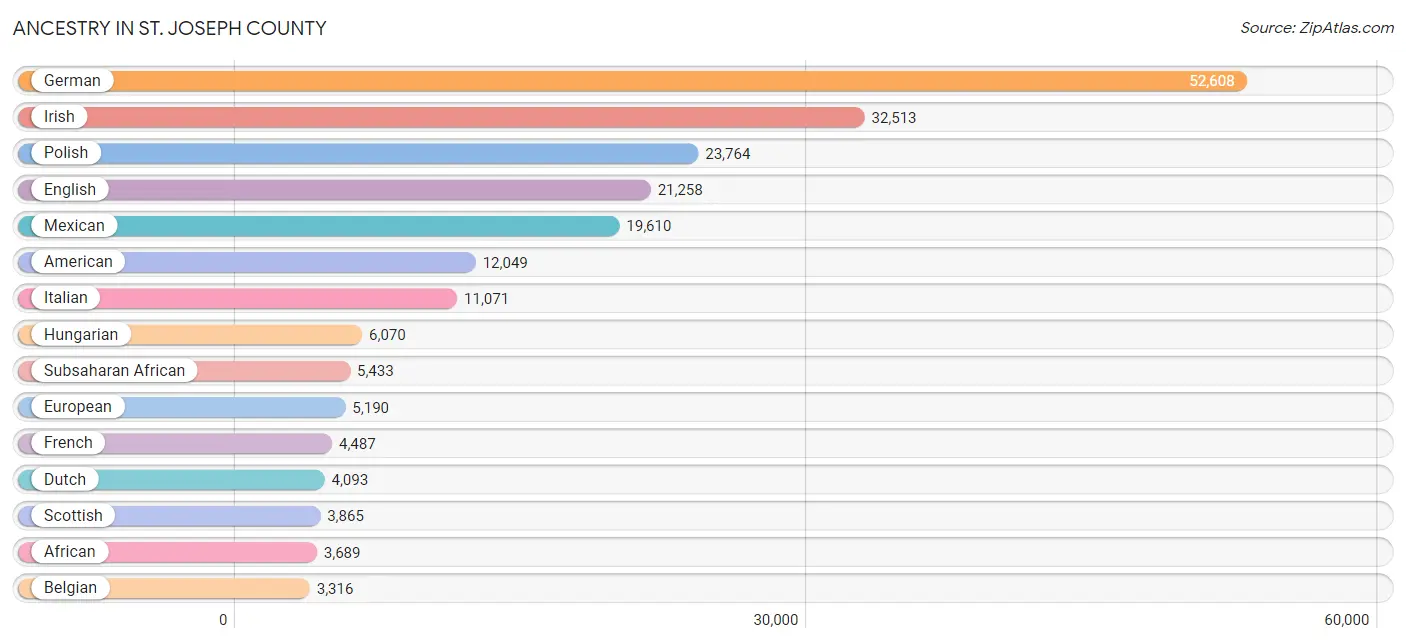
Ancestry in St. Joseph County
The most populous ancestries reported in St. Joseph County are German (52,608 | 19.3%), Irish (32,513 | 11.9%), Polish (23,764 | 8.7%), English (21,258 | 7.8%), and Mexican (19,610 | 7.2%), together accounting for 55.0% of all St. Joseph County residents.
| Ancestry | # Population | % Population |
| African | 3,689 | 1.3% |
| American | 12,049 | 4.4% |
| Apache | 70 | 0.0% |
| Arab | 1,581 | 0.6% |
| Arapaho | 7 | 0.0% |
| Argentinean | 91 | 0.0% |
| Armenian | 89 | 0.0% |
| Assyrian / Chaldean / Syriac | 120 | 0.0% |
| Australian | 58 | 0.0% |
| Austrian | 733 | 0.3% |
| Basque | 3 | 0.0% |
| Belgian | 3,316 | 1.2% |
| Bermudan | 6 | 0.0% |
| Bhutanese | 497 | 0.2% |
| Blackfeet | 11 | 0.0% |
| Brazilian | 221 | 0.1% |
| British | 1,188 | 0.4% |
| British West Indian | 1 | 0.0% |
| Bulgarian | 59 | 0.0% |
| Burmese | 1,024 | 0.4% |
| Cajun | 172 | 0.1% |
| Cambodian | 9 | 0.0% |
| Canadian | 598 | 0.2% |
| Cape Verdean | 11 | 0.0% |
| Carpatho Rusyn | 5 | 0.0% |
| Celtic | 19 | 0.0% |
| Central American | 725 | 0.3% |
| Central American Indian | 76 | 0.0% |
| Cherokee | 775 | 0.3% |
| Cheyenne | 34 | 0.0% |
| Chilean | 103 | 0.0% |
| Chippewa | 118 | 0.0% |
| Choctaw | 65 | 0.0% |
| Colombian | 257 | 0.1% |
| Costa Rican | 80 | 0.0% |
| Croatian | 671 | 0.3% |
| Crow | 26 | 0.0% |
| Cuban | 332 | 0.1% |
| Cypriot | 17 | 0.0% |
| Czech | 1,016 | 0.4% |
| Czechoslovakian | 210 | 0.1% |
| Danish | 485 | 0.2% |
| Delaware | 14 | 0.0% |
| Dominican | 67 | 0.0% |
| Dutch | 4,093 | 1.5% |
| Eastern European | 619 | 0.2% |
| Ecuadorian | 187 | 0.1% |
| Egyptian | 21 | 0.0% |
| English | 21,258 | 7.8% |
| Ethiopian | 57 | 0.0% |
| European | 5,190 | 1.9% |
| Finnish | 287 | 0.1% |
| French | 4,487 | 1.7% |
| French American Indian | 40 | 0.0% |
| French Canadian | 782 | 0.3% |
| German | 52,608 | 19.3% |
| Ghanaian | 79 | 0.0% |
| Greek | 999 | 0.4% |
| Guatemalan | 278 | 0.1% |
| Guyanese | 21 | 0.0% |
| Haitian | 47 | 0.0% |
| Honduran | 183 | 0.1% |
| Hungarian | 6,070 | 2.2% |
| Icelander | 16 | 0.0% |
| Indian (Asian) | 2,528 | 0.9% |
| Indonesian | 445 | 0.2% |
| Inupiat | 14 | 0.0% |
| Iranian | 109 | 0.0% |
| Iraqi | 93 | 0.0% |
| Irish | 32,513 | 11.9% |
| Iroquois | 87 | 0.0% |
| Israeli | 25 | 0.0% |
| Italian | 11,071 | 4.1% |
| Jamaican | 264 | 0.1% |
| Japanese | 59 | 0.0% |
| Jordanian | 80 | 0.0% |
| Kenyan | 760 | 0.3% |
| Korean | 1,400 | 0.5% |
| Laotian | 51 | 0.0% |
| Latvian | 18 | 0.0% |
| Lebanese | 927 | 0.3% |
| Liberian | 30 | 0.0% |
| Lithuanian | 596 | 0.2% |
| Luxembourger | 66 | 0.0% |
| Macedonian | 45 | 0.0% |
| Malaysian | 9 | 0.0% |
| Maltese | 72 | 0.0% |
| Mexican | 19,610 | 7.2% |
| Mexican American Indian | 401 | 0.2% |
| Moroccan | 17 | 0.0% |
| Native Hawaiian | 69 | 0.0% |
| Navajo | 11 | 0.0% |
| Nicaraguan | 5 | 0.0% |
| Nigerian | 118 | 0.0% |
| Northern European | 273 | 0.1% |
| Norwegian | 1,790 | 0.7% |
| Osage | 36 | 0.0% |
| Pakistani | 97 | 0.0% |
| Palestinian | 60 | 0.0% |
| Panamanian | 46 | 0.0% |
| Paraguayan | 19 | 0.0% |
| Pennsylvania German | 572 | 0.2% |
| Peruvian | 151 | 0.1% |
| Polish | 23,764 | 8.7% |
| Portuguese | 143 | 0.1% |
| Potawatomi | 86 | 0.0% |
| Pueblo | 4 | 0.0% |
| Puerto Rican | 1,616 | 0.6% |
| Romanian | 325 | 0.1% |
| Russian | 1,366 | 0.5% |
| Salvadoran | 133 | 0.1% |
| Samoan | 25 | 0.0% |
| Scandinavian | 730 | 0.3% |
| Scotch-Irish | 1,860 | 0.7% |
| Scottish | 3,865 | 1.4% |
| Seminole | 21 | 0.0% |
| Serbian | 534 | 0.2% |
| Sierra Leonean | 31 | 0.0% |
| Sioux | 126 | 0.1% |
| Slavic | 242 | 0.1% |
| Slovak | 435 | 0.2% |
| Slovene | 131 | 0.1% |
| South African | 23 | 0.0% |
| South American | 1,807 | 0.7% |
| South American Indian | 20 | 0.0% |
| Spaniard | 643 | 0.2% |
| Spanish | 344 | 0.1% |
| Spanish American Indian | 23 | 0.0% |
| Sri Lankan | 958 | 0.4% |
| Subsaharan African | 5,433 | 2.0% |
| Swedish | 2,933 | 1.1% |
| Swiss | 1,086 | 0.4% |
| Syrian | 170 | 0.1% |
| Thai | 1,611 | 0.6% |
| Tongan | 4 | 0.0% |
| Turkish | 100 | 0.0% |
| Ukrainian | 377 | 0.1% |
| Uruguayan | 11 | 0.0% |
| Venezuelan | 988 | 0.4% |
| Vietnamese | 77 | 0.0% |
| Welsh | 1,531 | 0.6% |
| Yugoslavian | 211 | 0.1% |
| Zimbabwean | 284 | 0.1% | View All 143 Rows |
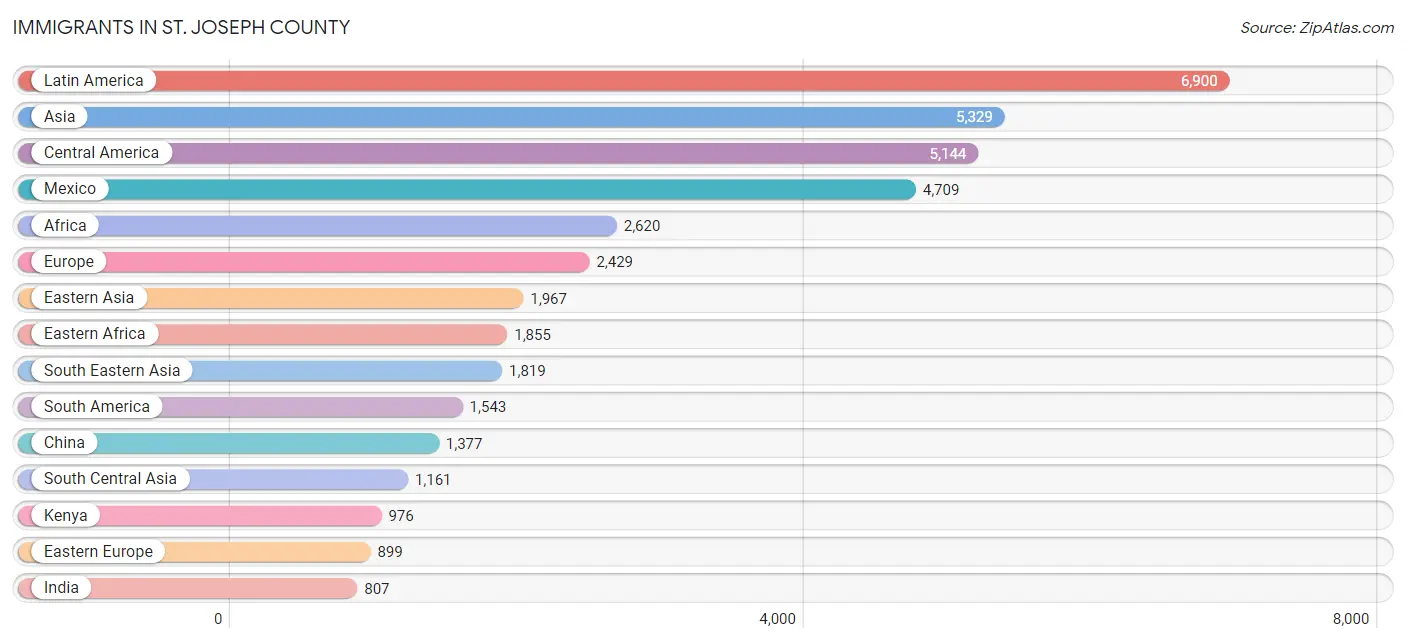
Immigrants in St. Joseph County
The most numerous immigrant groups reported in St. Joseph County came from Latin America (6,900 | 2.5%), Asia (5,329 | 2.0%), Central America (5,144 | 1.9%), Mexico (4,709 | 1.7%), and Africa (2,620 | 1.0%), together accounting for 9.1% of all St. Joseph County residents.
| Immigration Origin | # Population | % Population |
| Africa | 2,620 | 1.0% |
| Argentina | 79 | 0.0% |
| Asia | 5,329 | 2.0% |
| Australia | 20 | 0.0% |
| Austria | 3 | 0.0% |
| Bangladesh | 87 | 0.0% |
| Belarus | 8 | 0.0% |
| Belgium | 40 | 0.0% |
| Bolivia | 24 | 0.0% |
| Bosnia and Herzegovina | 73 | 0.0% |
| Brazil | 164 | 0.1% |
| Bulgaria | 36 | 0.0% |
| Cambodia | 39 | 0.0% |
| Canada | 585 | 0.2% |
| Caribbean | 213 | 0.1% |
| Central America | 5,144 | 1.9% |
| Chile | 74 | 0.0% |
| China | 1,377 | 0.5% |
| Colombia | 151 | 0.1% |
| Congo | 18 | 0.0% |
| Costa Rica | 100 | 0.0% |
| Croatia | 31 | 0.0% |
| Cuba | 29 | 0.0% |
| Denmark | 8 | 0.0% |
| Dominican Republic | 19 | 0.0% |
| Eastern Africa | 1,855 | 0.7% |
| Eastern Asia | 1,967 | 0.7% |
| Eastern Europe | 899 | 0.3% |
| Ecuador | 181 | 0.1% |
| Egypt | 51 | 0.0% |
| El Salvador | 46 | 0.0% |
| England | 110 | 0.0% |
| Ethiopia | 78 | 0.0% |
| Europe | 2,429 | 0.9% |
| France | 235 | 0.1% |
| Germany | 321 | 0.1% |
| Ghana | 210 | 0.1% |
| Greece | 222 | 0.1% |
| Guatemala | 122 | 0.0% |
| Guyana | 21 | 0.0% |
| Haiti | 52 | 0.0% |
| Honduras | 167 | 0.1% |
| Hong Kong | 42 | 0.0% |
| Hungary | 221 | 0.1% |
| India | 807 | 0.3% |
| Indonesia | 24 | 0.0% |
| Iran | 29 | 0.0% |
| Iraq | 11 | 0.0% |
| Ireland | 69 | 0.0% |
| Israel | 31 | 0.0% |
| Italy | 203 | 0.1% |
| Jamaica | 91 | 0.0% |
| Japan | 119 | 0.0% |
| Jordan | 18 | 0.0% |
| Kenya | 976 | 0.4% |
| Korea | 471 | 0.2% |
| Laos | 9 | 0.0% |
| Latin America | 6,900 | 2.5% |
| Lebanon | 169 | 0.1% |
| Liberia | 30 | 0.0% |
| Lithuania | 45 | 0.0% |
| Mexico | 4,709 | 1.7% |
| Middle Africa | 169 | 0.1% |
| Moldova | 5 | 0.0% |
| Morocco | 11 | 0.0% |
| Nepal | 7 | 0.0% |
| Netherlands | 34 | 0.0% |
| Nigeria | 104 | 0.0% |
| Northern Africa | 62 | 0.0% |
| Northern Europe | 438 | 0.2% |
| Norway | 34 | 0.0% |
| Oceania | 39 | 0.0% |
| Pakistan | 188 | 0.1% |
| Peru | 38 | 0.0% |
| Philippines | 623 | 0.2% |
| Poland | 274 | 0.1% |
| Romania | 55 | 0.0% |
| Russia | 75 | 0.0% |
| Scotland | 16 | 0.0% |
| Sierra Leone | 39 | 0.0% |
| Singapore | 5 | 0.0% |
| South Africa | 51 | 0.0% |
| South America | 1,543 | 0.6% |
| South Central Asia | 1,161 | 0.4% |
| South Eastern Asia | 1,819 | 0.7% |
| Southern Europe | 445 | 0.2% |
| Spain | 20 | 0.0% |
| Sri Lanka | 32 | 0.0% |
| Switzerland | 14 | 0.0% |
| Taiwan | 53 | 0.0% |
| Thailand | 179 | 0.1% |
| Turkey | 72 | 0.0% |
| Ukraine | 66 | 0.0% |
| Uruguay | 65 | 0.0% |
| Uzbekistan | 4 | 0.0% |
| Venezuela | 731 | 0.3% |
| Vietnam | 574 | 0.2% |
| Western Africa | 396 | 0.2% |
| Western Asia | 364 | 0.1% |
| Western Europe | 647 | 0.2% |
| Zaire | 151 | 0.1% |
| Zimbabwe | 313 | 0.1% | View All 102 Rows |
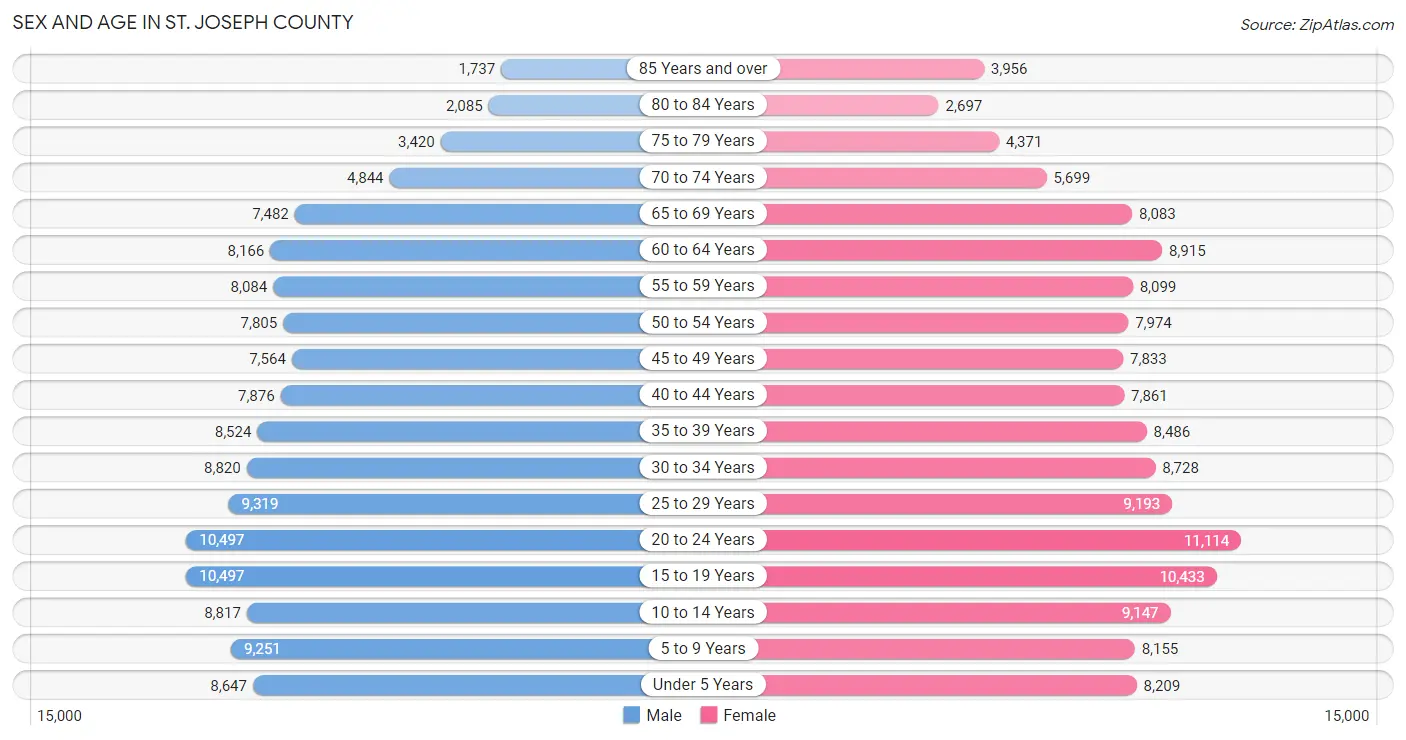
Sex and Age in St. Joseph County
Sex and Age in St. Joseph County
The most populous age groups in St. Joseph County are 15 to 19 Years (10,497 | 7.9%) for men and 20 to 24 Years (11,114 | 8.0%) for women.
| Age Bracket | Male | Female |
| Under 5 Years | 8,647 (6.5%) | 8,209 (5.9%) |
| 5 to 9 Years | 9,251 (6.9%) | 8,155 (5.9%) |
| 10 to 14 Years | 8,817 (6.6%) | 9,147 (6.6%) |
| 15 to 19 Years | 10,497 (7.9%) | 10,433 (7.5%) |
| 20 to 24 Years | 10,497 (7.9%) | 11,114 (8.0%) |
| 25 to 29 Years | 9,319 (7.0%) | 9,193 (6.6%) |
| 30 to 34 Years | 8,820 (6.6%) | 8,728 (6.3%) |
| 35 to 39 Years | 8,524 (6.4%) | 8,486 (6.1%) |
| 40 to 44 Years | 7,876 (5.9%) | 7,861 (5.7%) |
| 45 to 49 Years | 7,564 (5.7%) | 7,833 (5.6%) |
| 50 to 54 Years | 7,805 (5.9%) | 7,974 (5.7%) |
| 55 to 59 Years | 8,084 (6.1%) | 8,099 (5.8%) |
| 60 to 64 Years | 8,166 (6.1%) | 8,915 (6.4%) |
| 65 to 69 Years | 7,482 (5.6%) | 8,083 (5.8%) |
| 70 to 74 Years | 4,844 (3.6%) | 5,699 (4.1%) |
| 75 to 79 Years | 3,420 (2.6%) | 4,371 (3.2%) |
| 80 to 84 Years | 2,085 (1.6%) | 2,697 (1.9%) |
| 85 Years and over | 1,737 (1.3%) | 3,956 (2.9%) |
| Total | 133,435 (100.0%) | 138,953 (100.0%) |
Families and Households in St. Joseph County
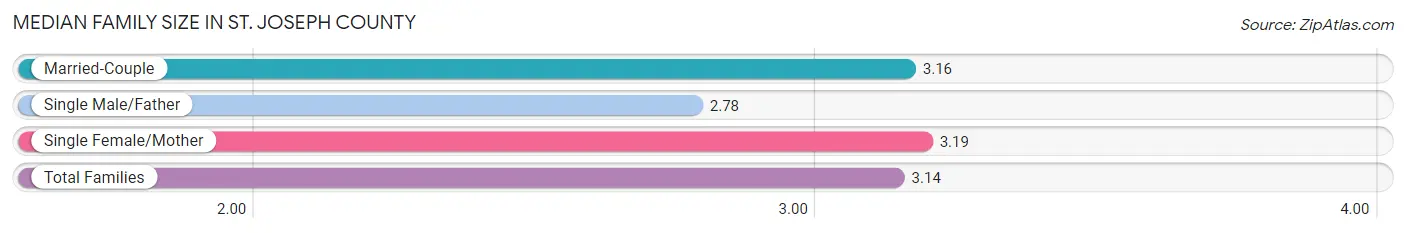
Median Family Size in St. Joseph County
The median family size in St. Joseph County is 3.14 persons per family, with single female/mother families (13,623 | 21.3%) accounting for the largest median family size of 3.19 persons per family. On the other hand, single male/father families (4,634 | 7.2%) represent the smallest median family size with 2.78 persons per family.
| Family Type | # Families | Family Size |
| Married-Couple | 45,653 (71.4%) | 3.16 |
| Single Male/Father | 4,634 (7.2%) | 2.78 |
| Single Female/Mother | 13,623 (21.3%) | 3.19 |
| Total Families | 63,910 (100.0%) | 3.14 |
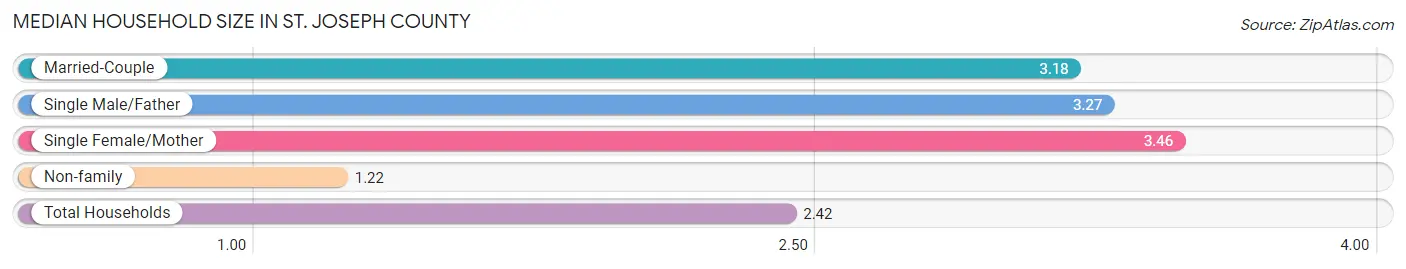
Median Household Size in St. Joseph County
The median household size in St. Joseph County is 2.42 persons per household, with single female/mother households (13,623 | 12.7%) accounting for the largest median household size of 3.46 persons per household. non-family households (43,556 | 40.5%) represent the smallest median household size with 1.22 persons per household.
| Household Type | # Households | Household Size |
| Married-Couple | 45,653 (42.5%) | 3.18 |
| Single Male/Father | 4,634 (4.3%) | 3.27 |
| Single Female/Mother | 13,623 (12.7%) | 3.46 |
| Non-family | 43,556 (40.5%) | 1.22 |
| Total Households | 107,466 (100.0%) | 2.42 |
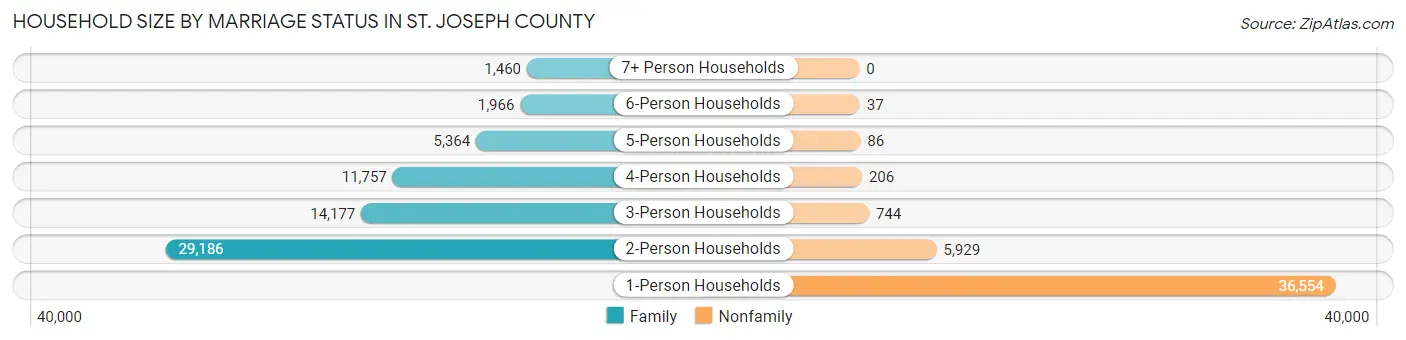
Household Size by Marriage Status in St. Joseph County
Out of a total of 107,466 households in St. Joseph County, 63,910 (59.5%) are family households, while 43,556 (40.5%) are nonfamily households. The most numerous type of family households are 2-person households, comprising 29,186, and the most common type of nonfamily households are 1-person households, comprising 36,554.
| Household Size | Family Households | Nonfamily Households |
| 1-Person Households | - | 36,554 (34.0%) |
| 2-Person Households | 29,186 (27.2%) | 5,929 (5.5%) |
| 3-Person Households | 14,177 (13.2%) | 744 (0.7%) |
| 4-Person Households | 11,757 (10.9%) | 206 (0.2%) |
| 5-Person Households | 5,364 (5.0%) | 86 (0.1%) |
| 6-Person Households | 1,966 (1.8%) | 37 (0.0%) |
| 7+ Person Households | 1,460 (1.4%) | 0 (0.0%) |
| Total | 63,910 (59.5%) | 43,556 (40.5%) |
Female Fertility in St. Joseph County
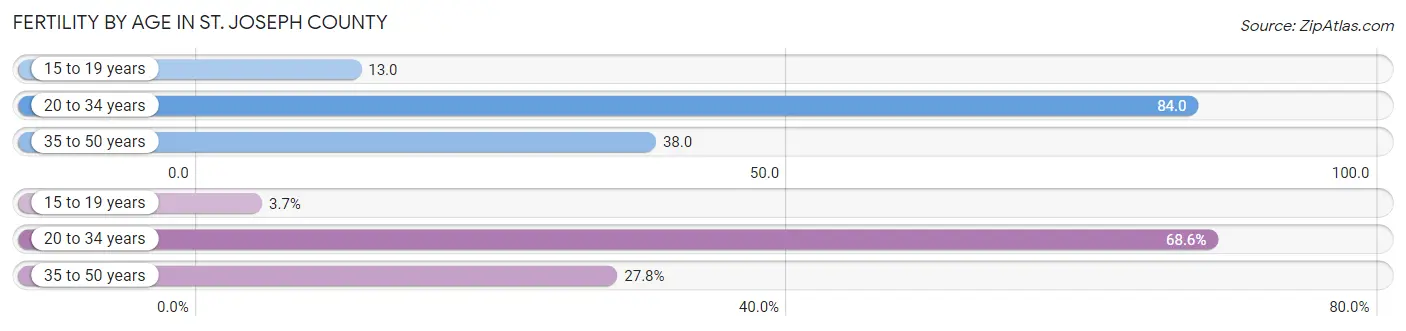
Fertility by Age in St. Joseph County
Average fertility rate in St. Joseph County is 55.0 births per 1,000 women. Women in the age bracket of 20 to 34 years have the highest fertility rate with 84.0 births per 1,000 women. Women in the age bracket of 20 to 34 years acount for 68.5% of all women with births.
| Age Bracket | Women with Births | Births / 1,000 Women |
| 15 to 19 years | 131 (3.7%) | 13.0 |
| 20 to 34 years | 2,448 (68.5%) | 84.0 |
| 35 to 50 years | 992 (27.8%) | 38.0 |
| Total | 3,571 (100.0%) | 55.0 |
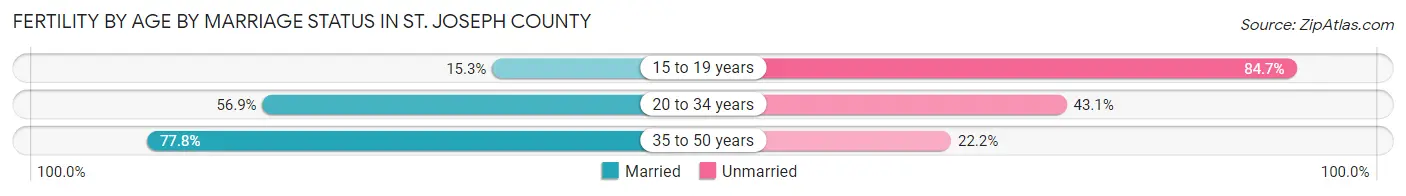
Fertility by Age by Marriage Status in St. Joseph County
61.2% of women with births (3,571) in St. Joseph County are married. The highest percentage of unmarried women with births falls into 15 to 19 years age bracket with 84.7% of them unmarried at the time of birth, while the lowest percentage of unmarried women with births belong to 35 to 50 years age bracket with 22.2% of them unmarried.
| Age Bracket | Married | Unmarried |
| 15 to 19 years | 20 (15.3%) | 111 (84.7%) |
| 20 to 34 years | 1,393 (56.9%) | 1,055 (43.1%) |
| 35 to 50 years | 772 (77.8%) | 220 (22.2%) |
| Total | 2,185 (61.2%) | 1,386 (38.8%) |
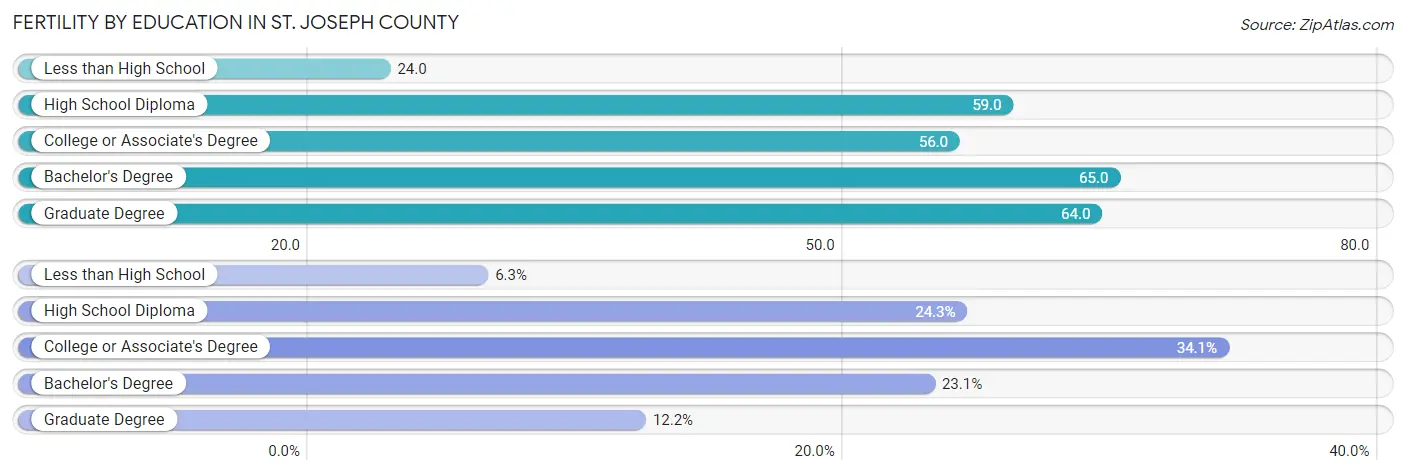
Fertility by Education in St. Joseph County
Average fertility rate in St. Joseph County is 55.0 births per 1,000 women. Women with the education attainment of bachelor's degree have the highest fertility rate of 65.0 births per 1,000 women, while women with the education attainment of less than high school have the lowest fertility at 24.0 births per 1,000 women. Women with the education attainment of college or associate's degree represent 34.1% of all women with births.
| Educational Attainment | Women with Births | Births / 1,000 Women |
| Less than High School | 226 (6.3%) | 24.0 |
| High School Diploma | 867 (24.3%) | 59.0 |
| College or Associate's Degree | 1,217 (34.1%) | 56.0 |
| Bachelor's Degree | 824 (23.1%) | 65.0 |
| Graduate Degree | 437 (12.2%) | 64.0 |
| Total | 3,571 (100.0%) | 55.0 |
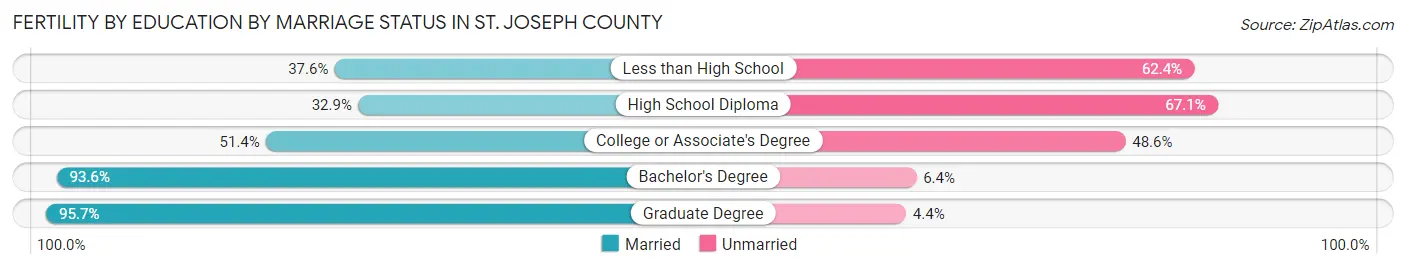
Fertility by Education by Marriage Status in St. Joseph County
38.8% of women with births in St. Joseph County are unmarried. Women with the educational attainment of graduate degree are most likely to be married with 95.7% of them married at childbirth, while women with the educational attainment of high school diploma are least likely to be married with 67.1% of them unmarried at childbirth.
| Educational Attainment | Married | Unmarried |
| Less than High School | 85 (37.6%) | 141 (62.4%) |
| High School Diploma | 285 (32.9%) | 582 (67.1%) |
| College or Associate's Degree | 626 (51.4%) | 591 (48.6%) |
| Bachelor's Degree | 771 (93.6%) | 53 (6.4%) |
| Graduate Degree | 418 (95.7%) | 19 (4.3%) |
| Total | 2,185 (61.2%) | 1,386 (38.8%) |
Income in St. Joseph County
Income Overview in St. Joseph County
Per Capita Income in St. Joseph County is $34,266, while median incomes of families and households are $80,842 and $61,877 respectively.
| Characteristic | Number | Measure |
| Per Capita Income | 272,388 | $34,266 |
| Median Family Income | 63,910 | $80,842 |
| Mean Family Income | 63,910 | $103,750 |
| Median Household Income | 107,466 | $61,877 |
| Mean Household Income | 107,466 | $84,995 |
| Income Deficit | 63,910 | $11,025 |
| Wage / Income Gap (%) | 272,388 | 33.34% |
| Wage / Income Gap ($) | 272,388 | 66.66¢ per $1 |
| Gini / Inequality Index | 272,388 | 0.47 |
Earnings by Sex in St. Joseph County
Average Earnings in St. Joseph County are $36,205, $44,115 for men and $29,407 for women, a difference of 33.3%.
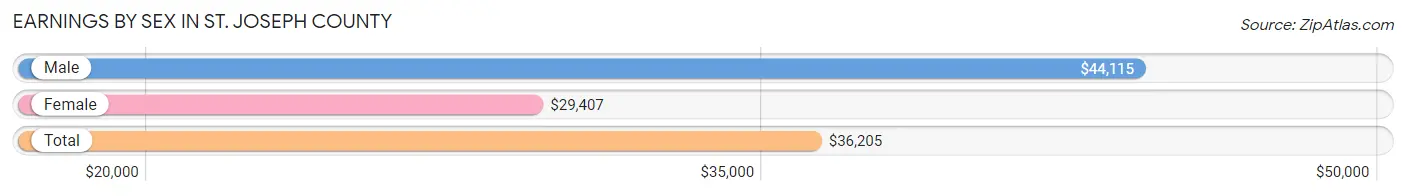
| Sex | Number | Average Earnings |
| Male | 76,447 (51.5%) | $44,115 |
| Female | 72,009 (48.5%) | $29,407 |
| Total | 148,456 (100.0%) | $36,205 |
Earnings by Sex by Income Bracket in St. Joseph County
The most common earnings brackets in St. Joseph County are $100,000+ for men (9,708 | 12.7%) and $2,499 or less for women (5,561 | 7.7%).
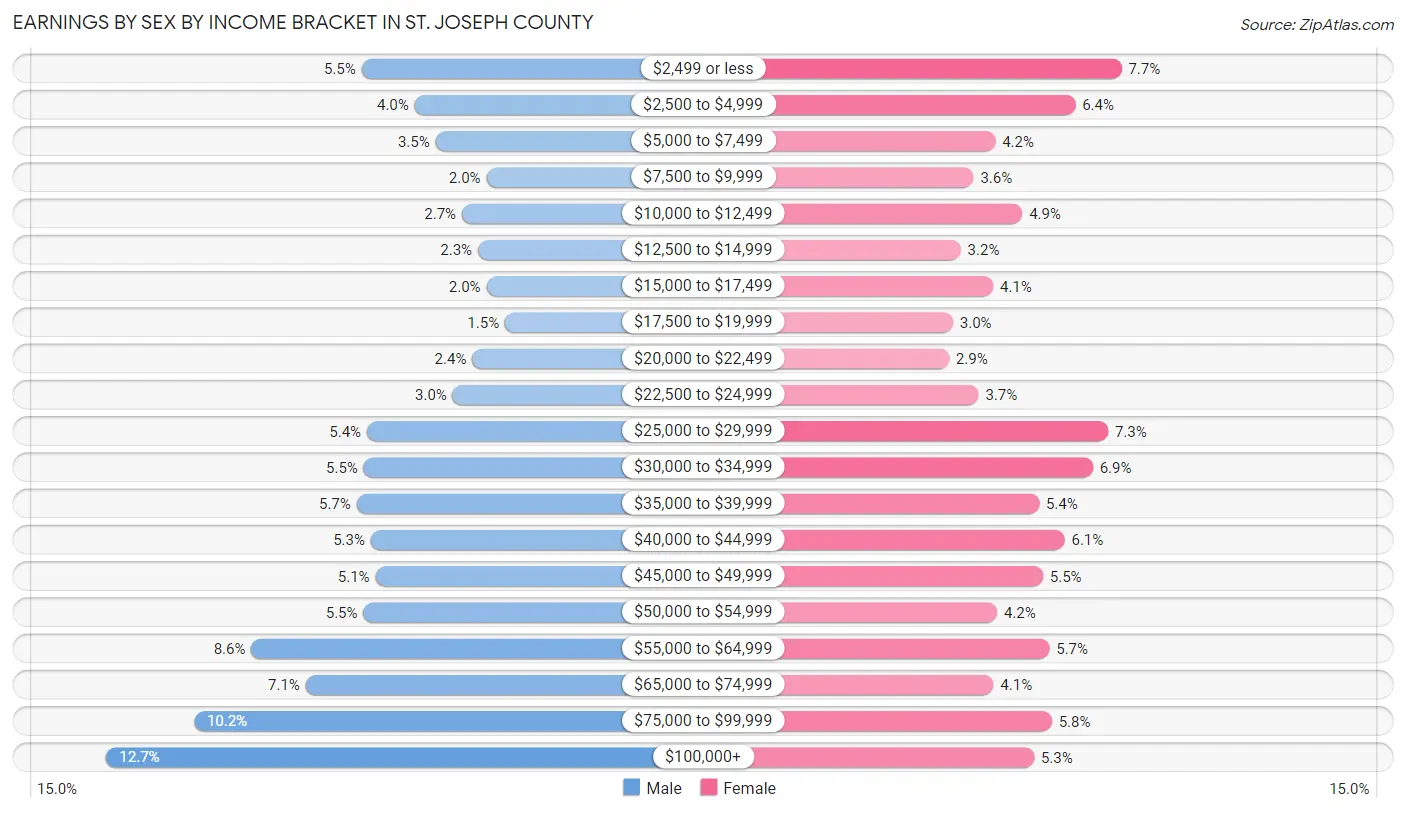
| Income | Male | Female |
| $2,499 or less | 4,230 (5.5%) | 5,561 (7.7%) |
| $2,500 to $4,999 | 3,085 (4.0%) | 4,625 (6.4%) |
| $5,000 to $7,499 | 2,634 (3.5%) | 3,003 (4.2%) |
| $7,500 to $9,999 | 1,546 (2.0%) | 2,564 (3.6%) |
| $10,000 to $12,499 | 2,074 (2.7%) | 3,552 (4.9%) |
| $12,500 to $14,999 | 1,725 (2.3%) | 2,302 (3.2%) |
| $15,000 to $17,499 | 1,547 (2.0%) | 2,961 (4.1%) |
| $17,500 to $19,999 | 1,144 (1.5%) | 2,144 (3.0%) |
| $20,000 to $22,499 | 1,853 (2.4%) | 2,069 (2.9%) |
| $22,500 to $24,999 | 2,270 (3.0%) | 2,663 (3.7%) |
| $25,000 to $29,999 | 4,111 (5.4%) | 5,288 (7.3%) |
| $30,000 to $34,999 | 4,185 (5.5%) | 4,974 (6.9%) |
| $35,000 to $39,999 | 4,337 (5.7%) | 3,886 (5.4%) |
| $40,000 to $44,999 | 4,032 (5.3%) | 4,409 (6.1%) |
| $45,000 to $49,999 | 3,927 (5.1%) | 3,969 (5.5%) |
| $50,000 to $54,999 | 4,186 (5.5%) | 3,039 (4.2%) |
| $55,000 to $64,999 | 6,598 (8.6%) | 4,099 (5.7%) |
| $65,000 to $74,999 | 5,425 (7.1%) | 2,964 (4.1%) |
| $75,000 to $99,999 | 7,830 (10.2%) | 4,149 (5.8%) |
| $100,000+ | 9,708 (12.7%) | 3,788 (5.3%) |
| Total | 76,447 (100.0%) | 72,009 (100.0%) |
Earnings by Sex by Educational Attainment in St. Joseph County
Average earnings in St. Joseph County are $51,874 for men and $35,489 for women, a difference of 31.6%. Men with an educational attainment of graduate degree enjoy the highest average annual earnings of $85,742, while those with less than high school education earn the least with $32,554. Women with an educational attainment of graduate degree earn the most with the average annual earnings of $59,452, while those with less than high school education have the smallest earnings of $24,167.
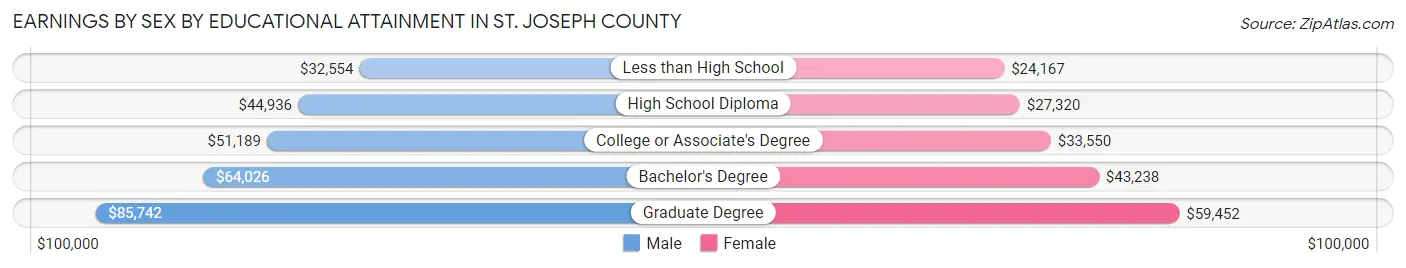
| Educational Attainment | Male Income | Female Income |
| Less than High School | $32,554 | $24,167 |
| High School Diploma | $44,936 | $27,320 |
| College or Associate's Degree | $51,189 | $33,550 |
| Bachelor's Degree | $64,026 | $43,238 |
| Graduate Degree | $85,742 | $59,452 |
| Total | $51,874 | $35,489 |
Family Income in St. Joseph County
Family Income Brackets in St. Joseph County
According to the St. Joseph County family income data, there are 12,910 families falling into the $100,000 to $149,999 income range, which is the most common income bracket and makes up 20.2% of all families. Conversely, the $10,000 to $14,999 income bracket is the least frequent group with only 1,470 families (2.3%) belonging to this category.
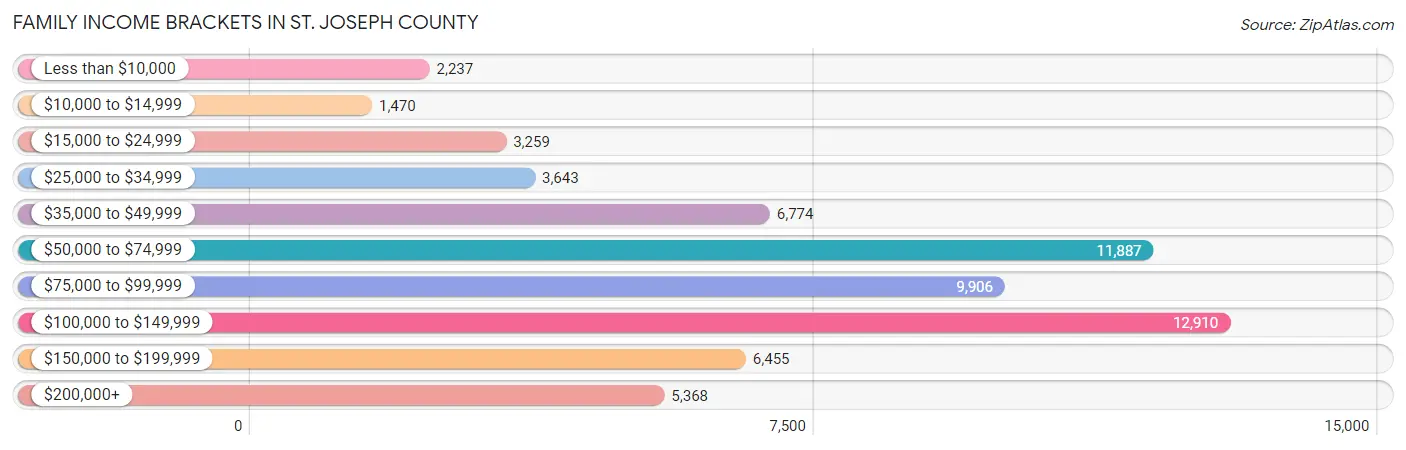
| Income Bracket | # Families | % Families |
| Less than $10,000 | 2,237 | 3.5% |
| $10,000 to $14,999 | 1,470 | 2.3% |
| $15,000 to $24,999 | 3,259 | 5.1% |
| $25,000 to $34,999 | 3,643 | 5.7% |
| $35,000 to $49,999 | 6,774 | 10.6% |
| $50,000 to $74,999 | 11,887 | 18.6% |
| $75,000 to $99,999 | 9,906 | 15.5% |
| $100,000 to $149,999 | 12,910 | 20.2% |
| $150,000 to $199,999 | 6,455 | 10.1% |
| $200,000+ | 5,368 | 8.4% |
Family Income by Famaliy Size in St. Joseph County
5-person families (4,693 | 7.3%) account for the highest median family income in St. Joseph County with $93,720 per family, while 2-person families (31,899 | 49.9%) have the highest median income of $36,174 per family member.
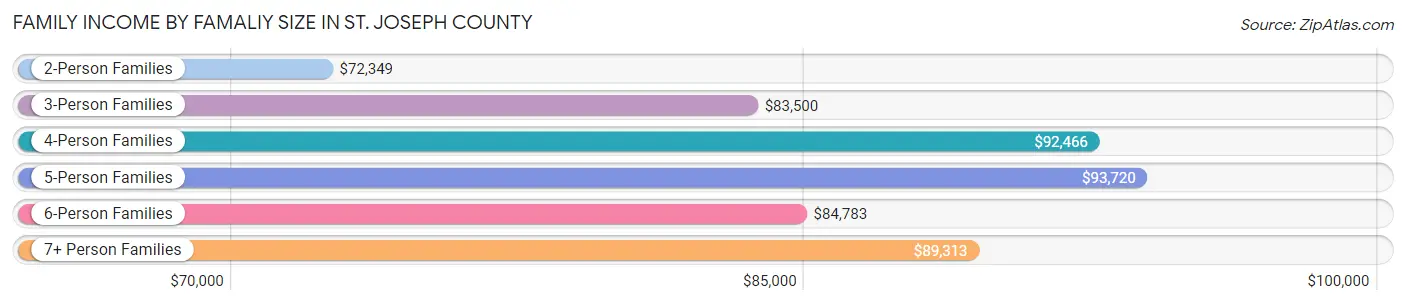
| Income Bracket | # Families | Median Income |
| 2-Person Families | 31,899 (49.9%) | $72,349 |
| 3-Person Families | 13,276 (20.8%) | $83,500 |
| 4-Person Families | 11,005 (17.2%) | $92,466 |
| 5-Person Families | 4,693 (7.3%) | $93,720 |
| 6-Person Families | 1,738 (2.7%) | $84,783 |
| 7+ Person Families | 1,299 (2.0%) | $89,313 |
| Total | 63,910 (100.0%) | $80,842 |
Family Income by Number of Earners in St. Joseph County
The median family income in St. Joseph County is $80,842, with families comprising 3+ earners (6,619) having the highest median family income of $134,382, while families with no earners (8,552) have the lowest median family income of $48,889, accounting for 10.4% and 13.4% of families, respectively.
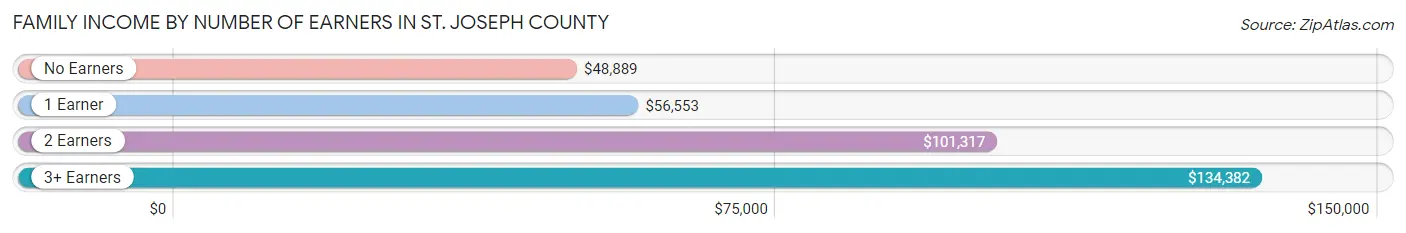
| Number of Earners | # Families | Median Income |
| No Earners | 8,552 (13.4%) | $48,889 |
| 1 Earner | 20,828 (32.6%) | $56,553 |
| 2 Earners | 27,911 (43.7%) | $101,317 |
| 3+ Earners | 6,619 (10.4%) | $134,382 |
| Total | 63,910 (100.0%) | $80,842 |
Household Income in St. Joseph County
Household Income Brackets in St. Joseph County
With 19,881 households falling in the category, the $50,000 to $74,999 income range is the most frequent in St. Joseph County, accounting for 18.5% of all households. In contrast, only 4,729 households (4.4%) fall into the $10,000 to $14,999 income bracket, making it the least populous group.
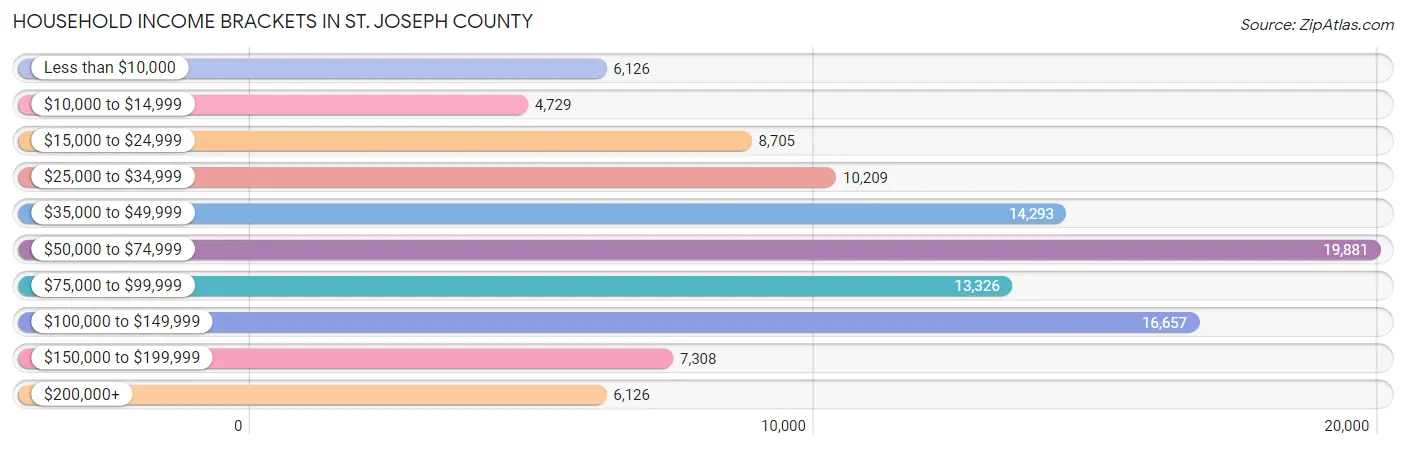
| Income Bracket | # Households | % Households |
| Less than $10,000 | 6,126 | 5.7% |
| $10,000 to $14,999 | 4,729 | 4.4% |
| $15,000 to $24,999 | 8,705 | 8.1% |
| $25,000 to $34,999 | 10,209 | 9.5% |
| $35,000 to $49,999 | 14,293 | 13.3% |
| $50,000 to $74,999 | 19,881 | 18.5% |
| $75,000 to $99,999 | 13,326 | 12.4% |
| $100,000 to $149,999 | 16,657 | 15.5% |
| $150,000 to $199,999 | 7,308 | 6.8% |
| $200,000+ | 6,126 | 5.7% |
Household Income by Householder Age in St. Joseph County
The median household income in St. Joseph County is $61,877, with the highest median household income of $77,803 found in the 45 to 64 years age bracket for the primary householder. A total of 37,684 households (35.1%) fall into this category. Meanwhile, the 15 to 24 years age bracket for the primary householder has the lowest median household income of $36,428, with 5,243 households (4.9%) in this group.
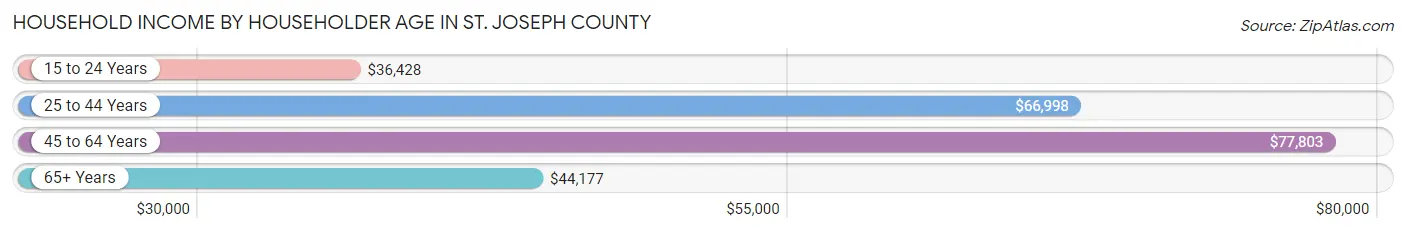
| Income Bracket | # Households | Median Income |
| 15 to 24 Years | 5,243 (4.9%) | $36,428 |
| 25 to 44 Years | 34,716 (32.3%) | $66,998 |
| 45 to 64 Years | 37,684 (35.1%) | $77,803 |
| 65+ Years | 29,823 (27.8%) | $44,177 |
| Total | 107,466 (100.0%) | $61,877 |
Poverty in St. Joseph County
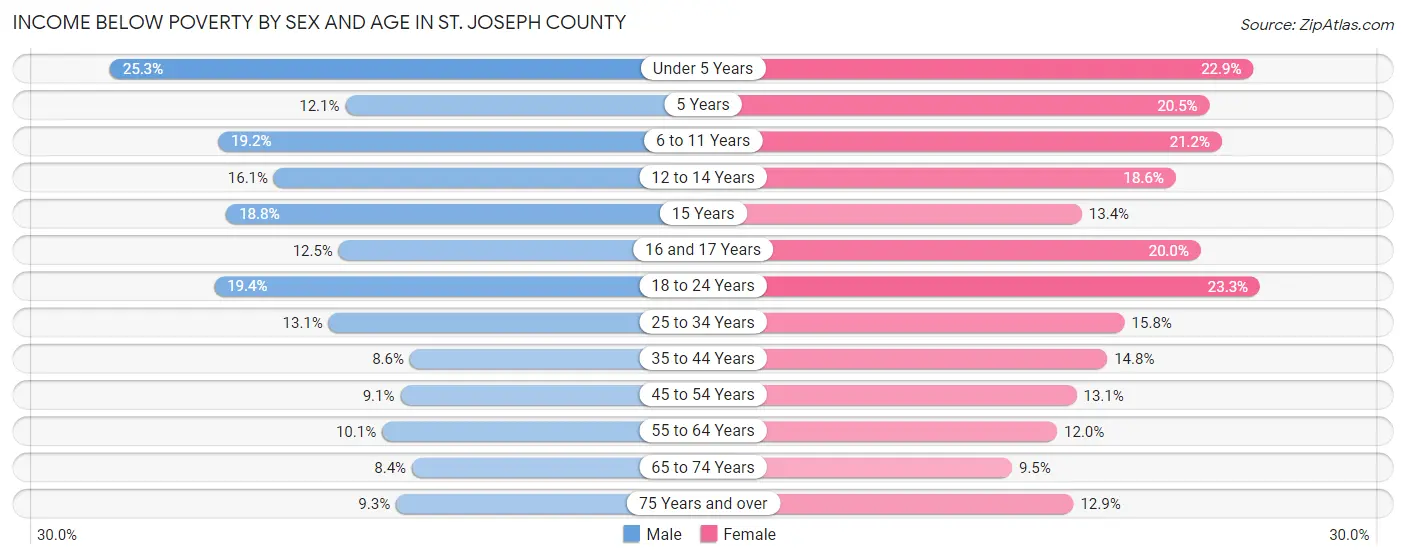
Income Below Poverty by Sex and Age in St. Joseph County
With 13.1% poverty level for males and 15.7% for females among the residents of St. Joseph County, under 5 year old males and 18 to 24 year old females are the most vulnerable to poverty, with 2,144 males (25.3%) and 2,679 females (23.3%) in their respective age groups living below the poverty level.
| Age Bracket | Male | Female |
| Under 5 Years | 2,144 (25.3%) | 1,845 (22.9%) |
| 5 Years | 258 (12.1%) | 357 (20.5%) |
| 6 to 11 Years | 1,992 (19.2%) | 2,085 (21.2%) |
| 12 to 14 Years | 835 (16.1%) | 991 (18.6%) |
| 15 Years | 391 (18.8%) | 270 (13.4%) |
| 16 and 17 Years | 444 (12.5%) | 640 (20.0%) |
| 18 to 24 Years | 2,281 (19.4%) | 2,679 (23.3%) |
| 25 to 34 Years | 2,340 (13.1%) | 2,819 (15.8%) |
| 35 to 44 Years | 1,371 (8.6%) | 2,413 (14.8%) |
| 45 to 54 Years | 1,384 (9.1%) | 2,061 (13.1%) |
| 55 to 64 Years | 1,626 (10.1%) | 2,030 (12.0%) |
| 65 to 74 Years | 1,027 (8.4%) | 1,285 (9.5%) |
| 75 Years and over | 650 (9.3%) | 1,328 (12.9%) |
| Total | 16,743 (13.1%) | 20,803 (15.7%) |
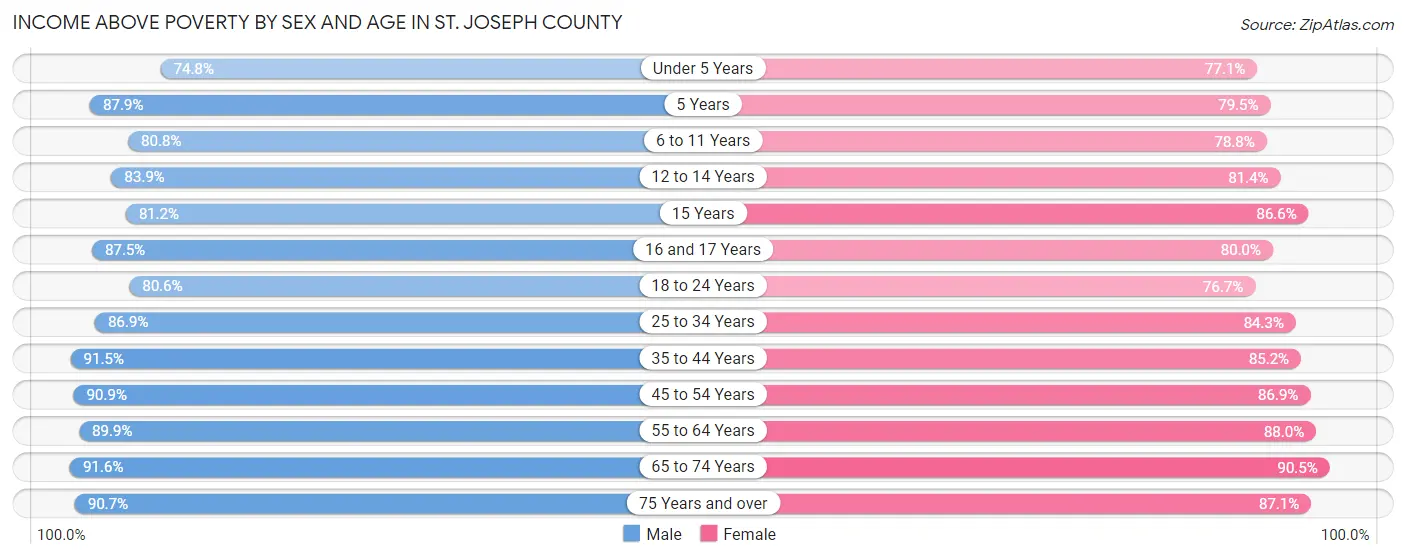
Income Above Poverty by Sex and Age in St. Joseph County
According to the poverty statistics in St. Joseph County, males aged 65 to 74 years and females aged 65 to 74 years are the age groups that are most secure financially, with 91.6% of males and 90.5% of females in these age groups living above the poverty line.
| Age Bracket | Male | Female |
| Under 5 Years | 6,348 (74.8%) | 6,208 (77.1%) |
| 5 Years | 1,867 (87.9%) | 1,387 (79.5%) |
| 6 to 11 Years | 8,372 (80.8%) | 7,767 (78.8%) |
| 12 to 14 Years | 4,346 (83.9%) | 4,340 (81.4%) |
| 15 Years | 1,692 (81.2%) | 1,749 (86.6%) |
| 16 and 17 Years | 3,104 (87.5%) | 2,561 (80.0%) |
| 18 to 24 Years | 9,451 (80.6%) | 8,829 (76.7%) |
| 25 to 34 Years | 15,562 (86.9%) | 15,075 (84.3%) |
| 35 to 44 Years | 14,669 (91.4%) | 13,911 (85.2%) |
| 45 to 54 Years | 13,853 (90.9%) | 13,706 (86.9%) |
| 55 to 64 Years | 14,476 (89.9%) | 14,895 (88.0%) |
| 65 to 74 Years | 11,155 (91.6%) | 12,273 (90.5%) |
| 75 Years and over | 6,327 (90.7%) | 8,967 (87.1%) |
| Total | 111,222 (86.9%) | 111,668 (84.3%) |
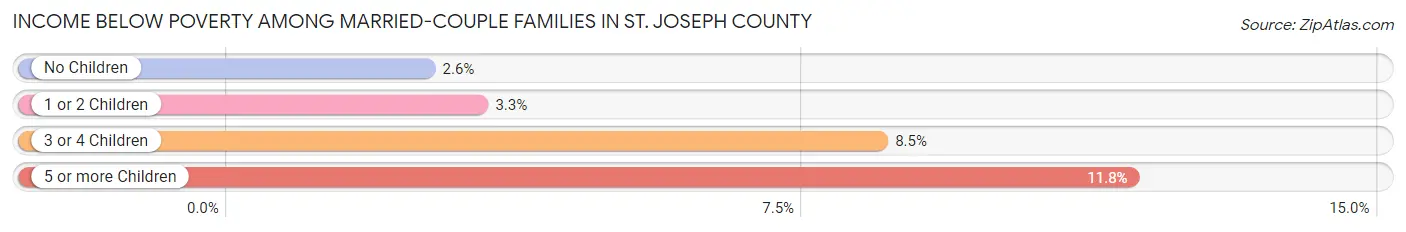
Income Below Poverty Among Married-Couple Families in St. Joseph County
The poverty statistics for married-couple families in St. Joseph County show that 3.5% or 1,576 of the total 45,653 families live below the poverty line. Families with 5 or more children have the highest poverty rate of 11.8%, comprising of 73 families. On the other hand, families with no children have the lowest poverty rate of 2.6%, which includes 710 families.
| Children | Above Poverty | Below Poverty |
| No Children | 26,775 (97.4%) | 710 (2.6%) |
| 1 or 2 Children | 12,905 (96.7%) | 436 (3.3%) |
| 3 or 4 Children | 3,850 (91.5%) | 357 (8.5%) |
| 5 or more Children | 547 (88.2%) | 73 (11.8%) |
| Total | 44,077 (96.6%) | 1,576 (3.5%) |
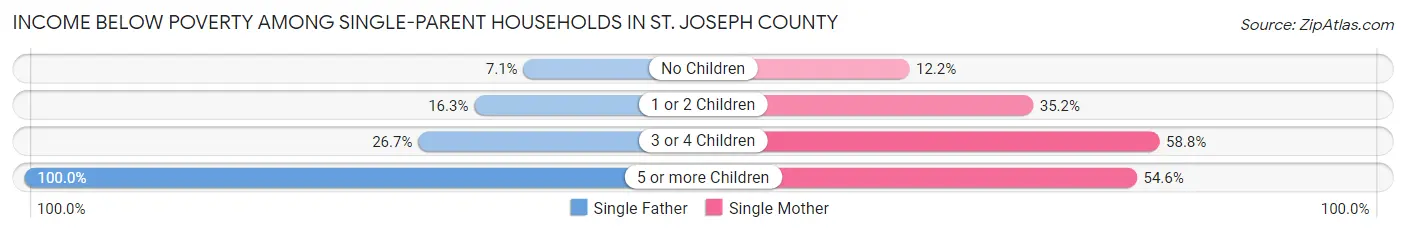
Income Below Poverty Among Single-Parent Households in St. Joseph County
According to the poverty data in St. Joseph County, 14.0% or 647 single-father households and 31.0% or 4,218 single-mother households are living below the poverty line. Among single-father households, those with 5 or more children have the highest poverty rate, with 37 households (100.0%) experiencing poverty. Likewise, among single-mother households, those with 3 or 4 children have the highest poverty rate, with 993 households (58.8%) falling below the poverty line.
| Children | Single Father | Single Mother |
| No Children | 136 (7.1%) | 533 (12.2%) |
| 1 or 2 Children | 375 (16.3%) | 2,608 (35.2%) |
| 3 or 4 Children | 99 (26.7%) | 993 (58.8%) |
| 5 or more Children | 37 (100.0%) | 84 (54.5%) |
| Total | 647 (14.0%) | 4,218 (31.0%) |
Income Below Poverty Among Married-Couple vs Single-Parent Households in St. Joseph County
The poverty data for St. Joseph County shows that 1,576 of the married-couple family households (3.5%) and 4,865 of the single-parent households (26.7%) are living below the poverty level. Within the married-couple family households, those with 5 or more children have the highest poverty rate, with 73 households (11.8%) falling below the poverty line. Among the single-parent households, those with 5 or more children have the highest poverty rate, with 121 household (63.3%) living below poverty.
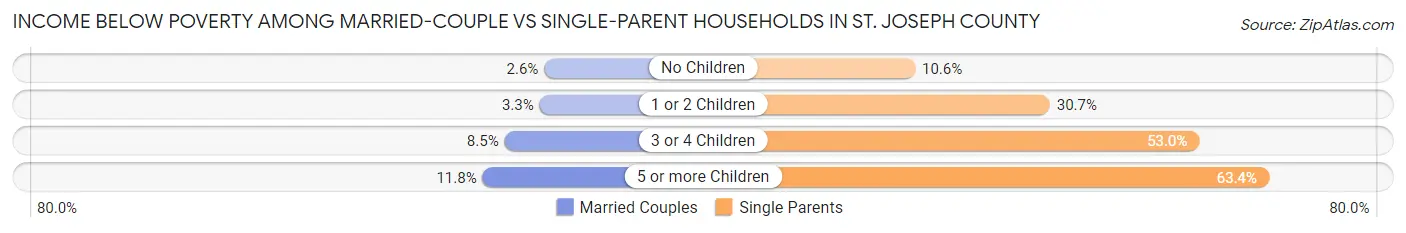
| Children | Married-Couple Families | Single-Parent Households |
| No Children | 710 (2.6%) | 669 (10.6%) |
| 1 or 2 Children | 436 (3.3%) | 2,983 (30.7%) |
| 3 or 4 Children | 357 (8.5%) | 1,092 (53.0%) |
| 5 or more Children | 73 (11.8%) | 121 (63.3%) |
| Total | 1,576 (3.5%) | 4,865 (26.7%) |
Employment Characteristics in St. Joseph County
Employment by Class of Employer in St. Joseph County
Among the 128,488 employed individuals in St. Joseph County, private company employees (88,290 | 68.7%), not-for-profit organizations (19,148 | 14.9%), and local government employees (7,789 | 6.1%) make up the most common classes of employment.
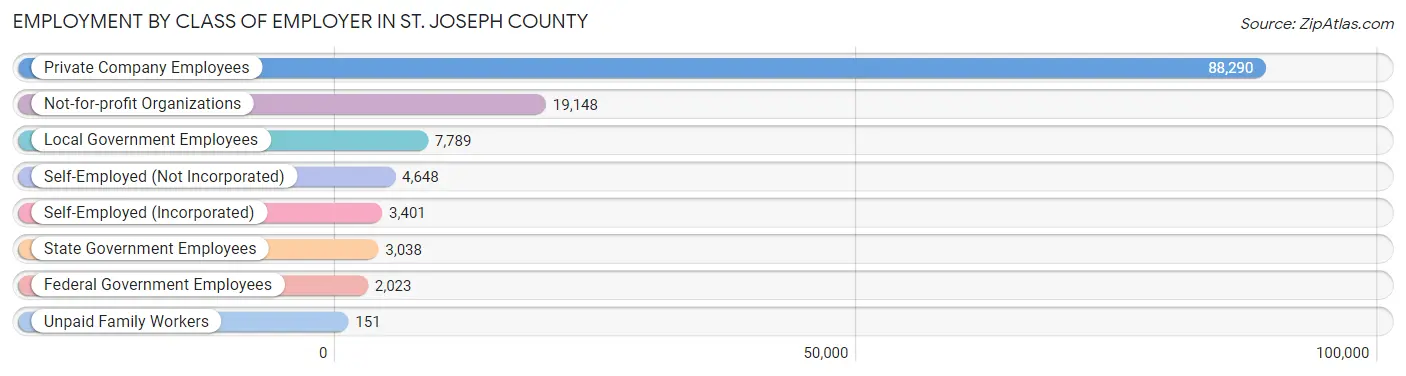
| Employer Class | # Employees | % Employees |
| Private Company Employees | 88,290 | 68.7% |
| Self-Employed (Incorporated) | 3,401 | 2.6% |
| Self-Employed (Not Incorporated) | 4,648 | 3.6% |
| Not-for-profit Organizations | 19,148 | 14.9% |
| Local Government Employees | 7,789 | 6.1% |
| State Government Employees | 3,038 | 2.4% |
| Federal Government Employees | 2,023 | 1.6% |
| Unpaid Family Workers | 151 | 0.1% |
| Total | 128,488 | 100.0% |
Employment Status by Age in St. Joseph County
According to the labor force statistics for St. Joseph County, out of the total population over 16 years of age (216,056), 63.8% or 137,844 individuals are in the labor force, with 4.8% or 6,617 of them unemployed. The age group with the highest labor force participation rate is 35 to 44 years, with 84.6% or 27,704 individuals in the labor force. Within the labor force, the 16 to 19 years age range has the highest percentage of unemployed individuals, with 14.2% or 1,044 of them being unemployed.
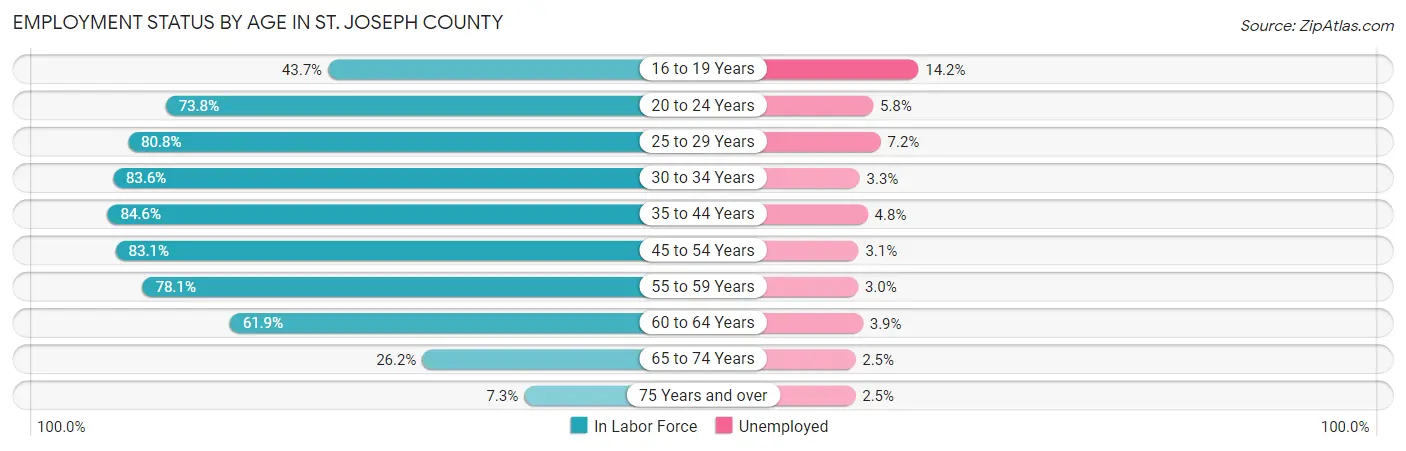
| Age Bracket | In Labor Force | Unemployed |
| 16 to 19 Years | 7,352 (43.7%) | 1,044 (14.2%) |
| 20 to 24 Years | 15,949 (73.8%) | 925 (5.8%) |
| 25 to 29 Years | 14,958 (80.8%) | 1,077 (7.2%) |
| 30 to 34 Years | 14,670 (83.6%) | 484 (3.3%) |
| 35 to 44 Years | 27,704 (84.6%) | 1,330 (4.8%) |
| 45 to 54 Years | 25,907 (83.1%) | 803 (3.1%) |
| 55 to 59 Years | 12,639 (78.1%) | 379 (3.0%) |
| 60 to 64 Years | 10,573 (61.9%) | 412 (3.9%) |
| 65 to 74 Years | 6,840 (26.2%) | 171 (2.5%) |
| 75 Years and over | 1,333 (7.3%) | 33 (2.5%) |
| Total | 137,844 (63.8%) | 6,617 (4.8%) |
Employment Status by Educational Attainment in St. Joseph County
According to labor force statistics for St. Joseph County, 79.9% of individuals (106,464) out of the total population between 25 and 64 years of age (133,247) are in the labor force, with 4.2% or 4,471 of them being unemployed. The group with the highest labor force participation rate are those with the educational attainment of bachelor's degree or higher, with 87.1% or 38,489 individuals in the labor force. Within the labor force, individuals with less than high school education have the highest percentage of unemployment, with 13.5% or 982 of them being unemployed.
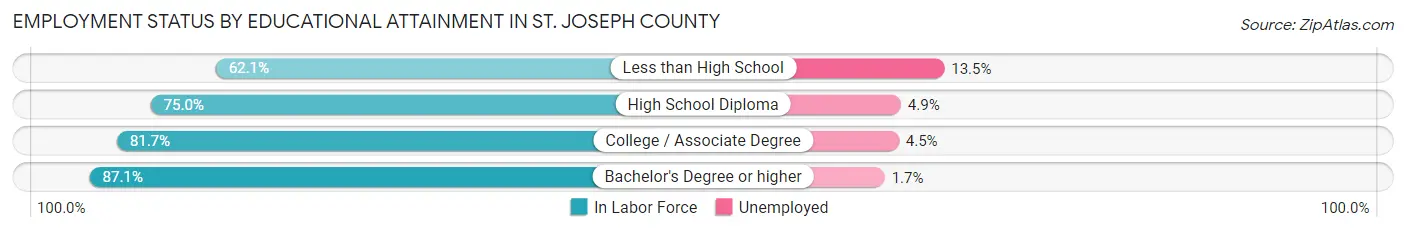
| Educational Attainment | In Labor Force | Unemployed |
| Less than High School | 7,275 (62.1%) | 1,582 (13.5%) |
| High School Diploma | 27,855 (75.0%) | 1,820 (4.9%) |
| College / Associate Degree | 32,846 (81.7%) | 1,809 (4.5%) |
| Bachelor's Degree or higher | 38,489 (87.1%) | 751 (1.7%) |
| Total | 106,464 (79.9%) | 5,596 (4.2%) |
Employment Occupations by Sex in St. Joseph County
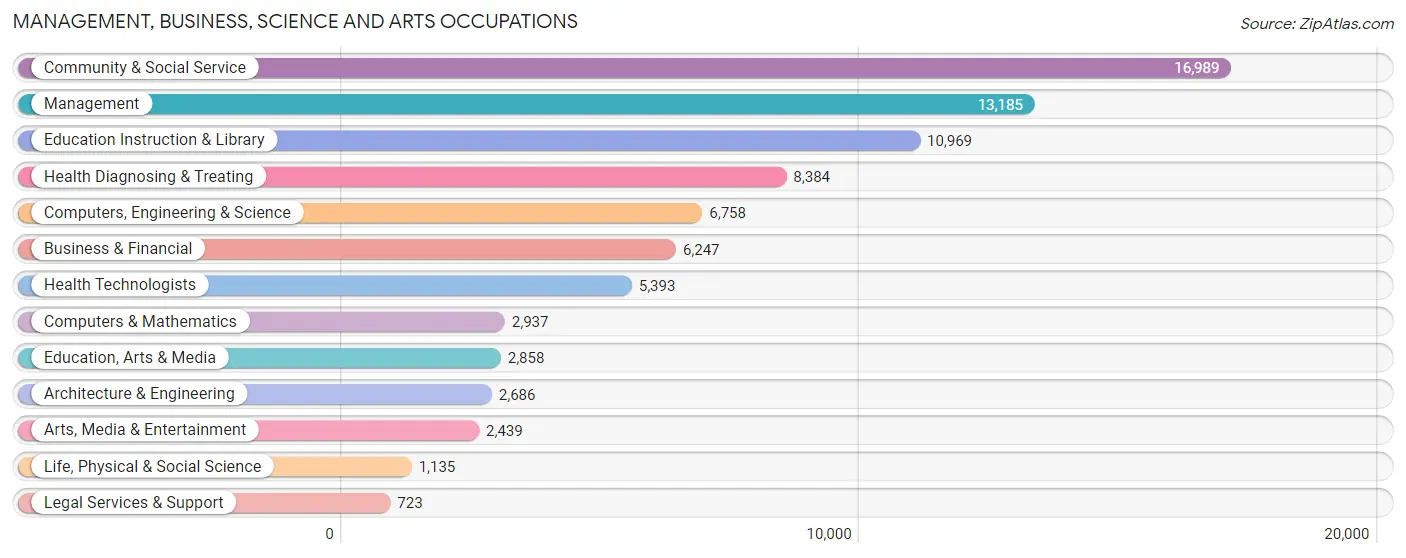
Management, Business, Science and Arts Occupations
The most common Management, Business, Science and Arts occupations in St. Joseph County are Community & Social Service (16,989 | 13.0%), Management (13,185 | 10.1%), Education Instruction & Library (10,969 | 8.4%), Health Diagnosing & Treating (8,384 | 6.4%), and Computers, Engineering & Science (6,758 | 5.1%).
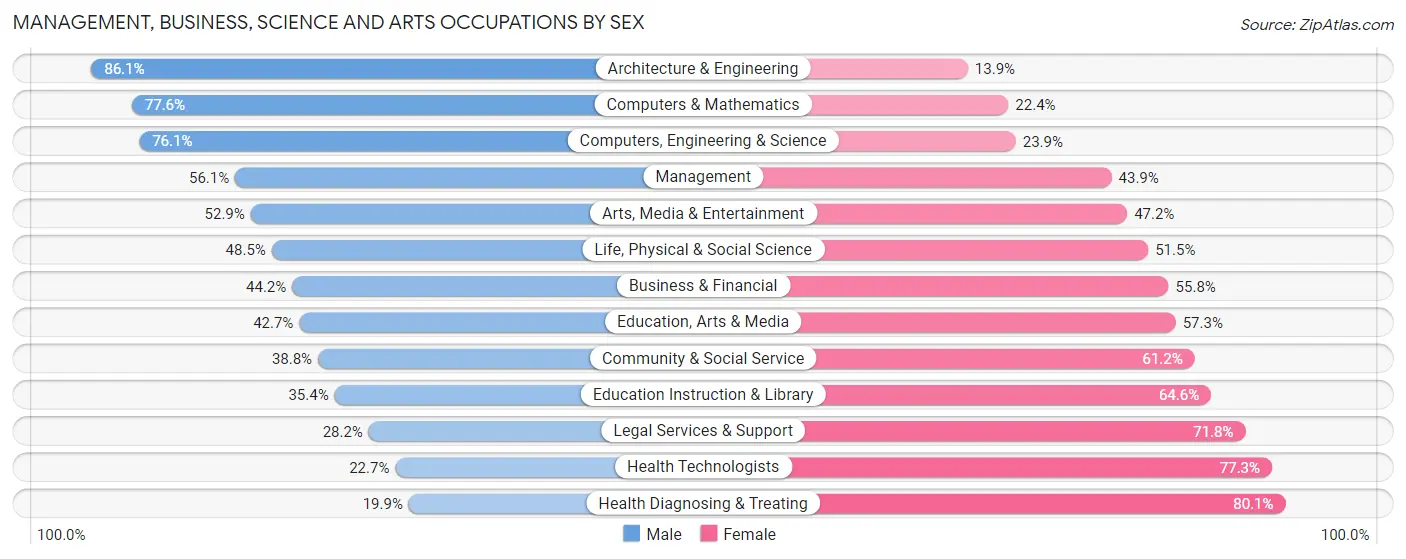
Management, Business, Science and Arts Occupations by Sex
Within the Management, Business, Science and Arts occupations in St. Joseph County, the most male-oriented occupations are Architecture & Engineering (86.1%), Computers & Mathematics (77.6%), and Computers, Engineering & Science (76.1%), while the most female-oriented occupations are Health Diagnosing & Treating (80.1%), Health Technologists (77.3%), and Legal Services & Support (71.8%).
| Occupation | Male | Female |
| Management | 7,397 (56.1%) | 5,788 (43.9%) |
| Business & Financial | 2,761 (44.2%) | 3,486 (55.8%) |
| Computers, Engineering & Science | 5,142 (76.1%) | 1,616 (23.9%) |
| Computers & Mathematics | 2,280 (77.6%) | 657 (22.4%) |
| Architecture & Engineering | 2,312 (86.1%) | 374 (13.9%) |
| Life, Physical & Social Science | 550 (48.5%) | 585 (51.5%) |
| Community & Social Service | 6,593 (38.8%) | 10,396 (61.2%) |
| Education, Arts & Media | 1,221 (42.7%) | 1,637 (57.3%) |
| Legal Services & Support | 204 (28.2%) | 519 (71.8%) |
| Education Instruction & Library | 3,879 (35.4%) | 7,090 (64.6%) |
| Arts, Media & Entertainment | 1,289 (52.8%) | 1,150 (47.1%) |
| Health Diagnosing & Treating | 1,666 (19.9%) | 6,718 (80.1%) |
| Health Technologists | 1,223 (22.7%) | 4,170 (77.3%) |
| Total (Category) | 23,559 (45.7%) | 28,004 (54.3%) |
| Total (Overall) | 67,919 (51.8%) | 63,251 (48.2%) |
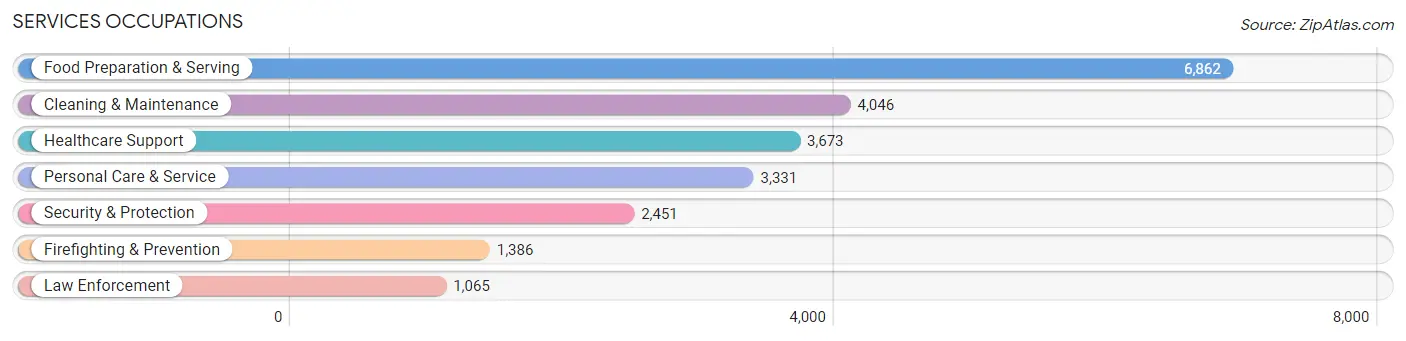
Services Occupations
The most common Services occupations in St. Joseph County are Food Preparation & Serving (6,862 | 5.2%), Cleaning & Maintenance (4,046 | 3.1%), Healthcare Support (3,673 | 2.8%), Personal Care & Service (3,331 | 2.5%), and Security & Protection (2,451 | 1.9%).
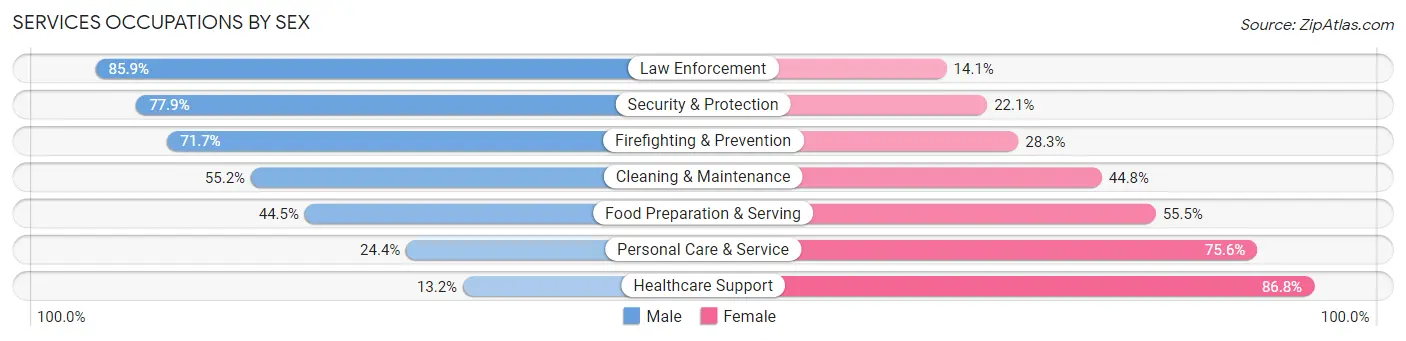
Services Occupations by Sex
Within the Services occupations in St. Joseph County, the most male-oriented occupations are Law Enforcement (85.9%), Security & Protection (77.9%), and Firefighting & Prevention (71.7%), while the most female-oriented occupations are Healthcare Support (86.8%), Personal Care & Service (75.6%), and Food Preparation & Serving (55.5%).
| Occupation | Male | Female |
| Healthcare Support | 485 (13.2%) | 3,188 (86.8%) |
| Security & Protection | 1,909 (77.9%) | 542 (22.1%) |
| Firefighting & Prevention | 994 (71.7%) | 392 (28.3%) |
| Law Enforcement | 915 (85.9%) | 150 (14.1%) |
| Food Preparation & Serving | 3,055 (44.5%) | 3,807 (55.5%) |
| Cleaning & Maintenance | 2,233 (55.2%) | 1,813 (44.8%) |
| Personal Care & Service | 814 (24.4%) | 2,517 (75.6%) |
| Total (Category) | 8,496 (41.7%) | 11,867 (58.3%) |
| Total (Overall) | 67,919 (51.8%) | 63,251 (48.2%) |
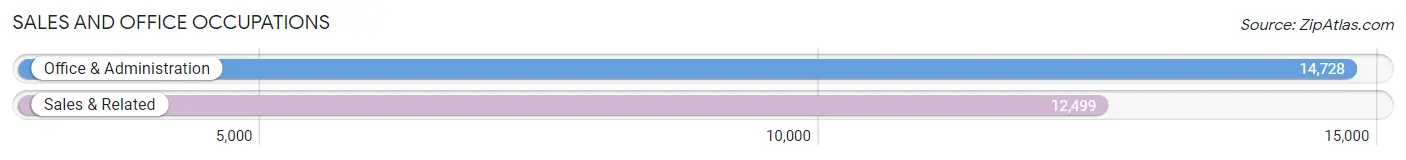
Sales and Office Occupations
The most common Sales and Office occupations in St. Joseph County are Office & Administration (14,728 | 11.2%), and Sales & Related (12,499 | 9.5%).
Sales and Office Occupations by Sex
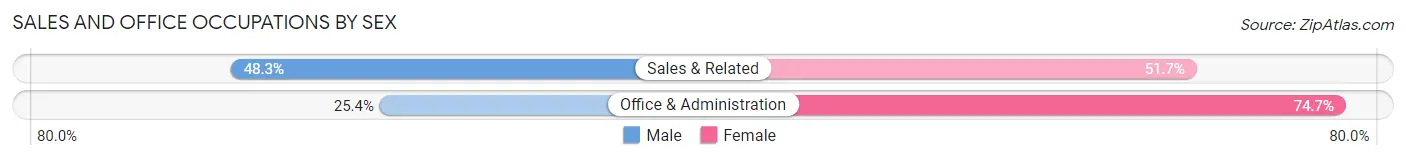
| Occupation | Male | Female |
| Sales & Related | 6,036 (48.3%) | 6,463 (51.7%) |
| Office & Administration | 3,733 (25.4%) | 10,995 (74.7%) |
| Total (Category) | 9,769 (35.9%) | 17,458 (64.1%) |
| Total (Overall) | 67,919 (51.8%) | 63,251 (48.2%) |
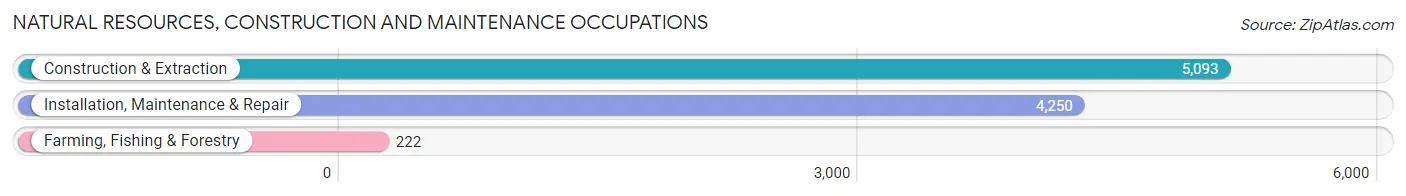
Natural Resources, Construction and Maintenance Occupations
The most common Natural Resources, Construction and Maintenance occupations in St. Joseph County are Construction & Extraction (5,093 | 3.9%), Installation, Maintenance & Repair (4,250 | 3.2%), and Farming, Fishing & Forestry (222 | 0.2%).
Natural Resources, Construction and Maintenance Occupations by Sex
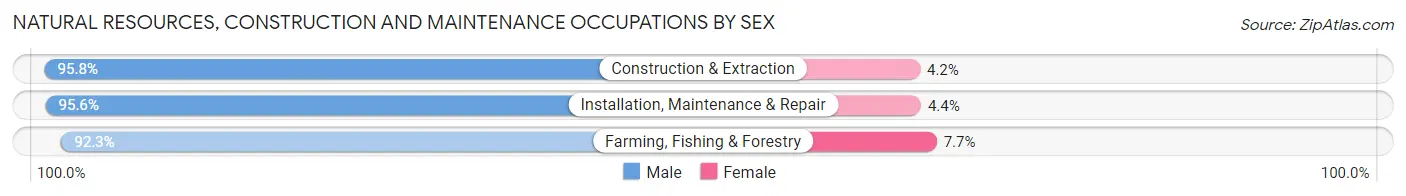
| Occupation | Male | Female |
| Farming, Fishing & Forestry | 205 (92.3%) | 17 (7.7%) |
| Construction & Extraction | 4,880 (95.8%) | 213 (4.2%) |
| Installation, Maintenance & Repair | 4,064 (95.6%) | 186 (4.4%) |
| Total (Category) | 9,149 (95.7%) | 416 (4.3%) |
| Total (Overall) | 67,919 (51.8%) | 63,251 (48.2%) |
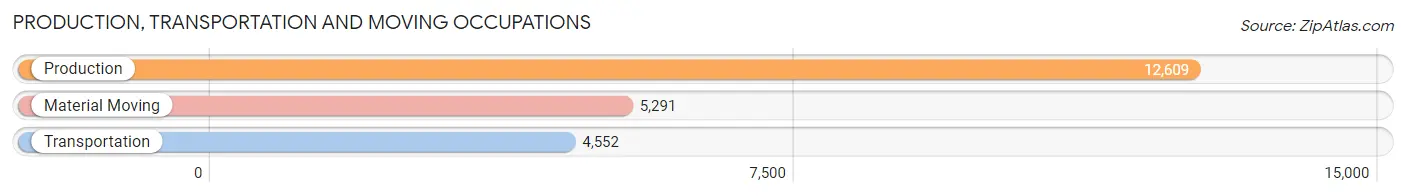
Production, Transportation and Moving Occupations
The most common Production, Transportation and Moving occupations in St. Joseph County are Production (12,609 | 9.6%), Material Moving (5,291 | 4.0%), and Transportation (4,552 | 3.5%).
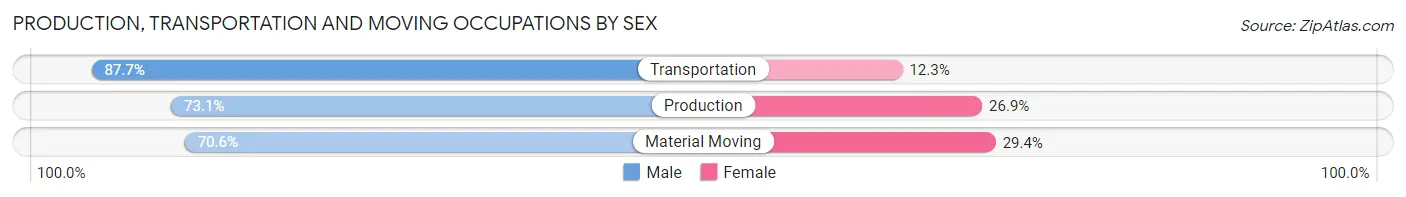
Production, Transportation and Moving Occupations by Sex
| Occupation | Male | Female |
| Production | 9,217 (73.1%) | 3,392 (26.9%) |
| Transportation | 3,993 (87.7%) | 559 (12.3%) |
| Material Moving | 3,736 (70.6%) | 1,555 (29.4%) |
| Total (Category) | 16,946 (75.5%) | 5,506 (24.5%) |
| Total (Overall) | 67,919 (51.8%) | 63,251 (48.2%) |
Employment Industries by Sex in St. Joseph County
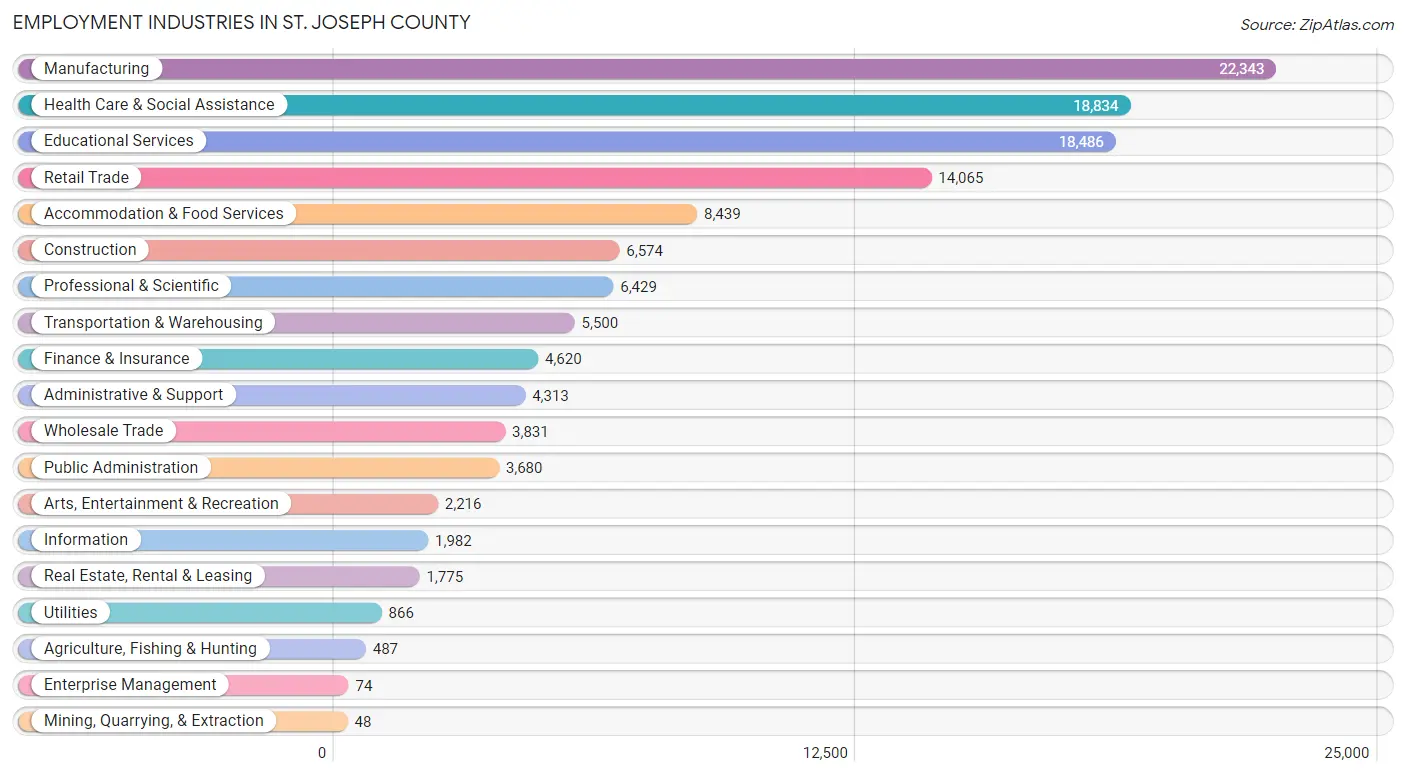
Employment Industries in St. Joseph County
The major employment industries in St. Joseph County include Manufacturing (22,343 | 17.0%), Health Care & Social Assistance (18,834 | 14.4%), Educational Services (18,486 | 14.1%), Retail Trade (14,065 | 10.7%), and Accommodation & Food Services (8,439 | 6.4%).
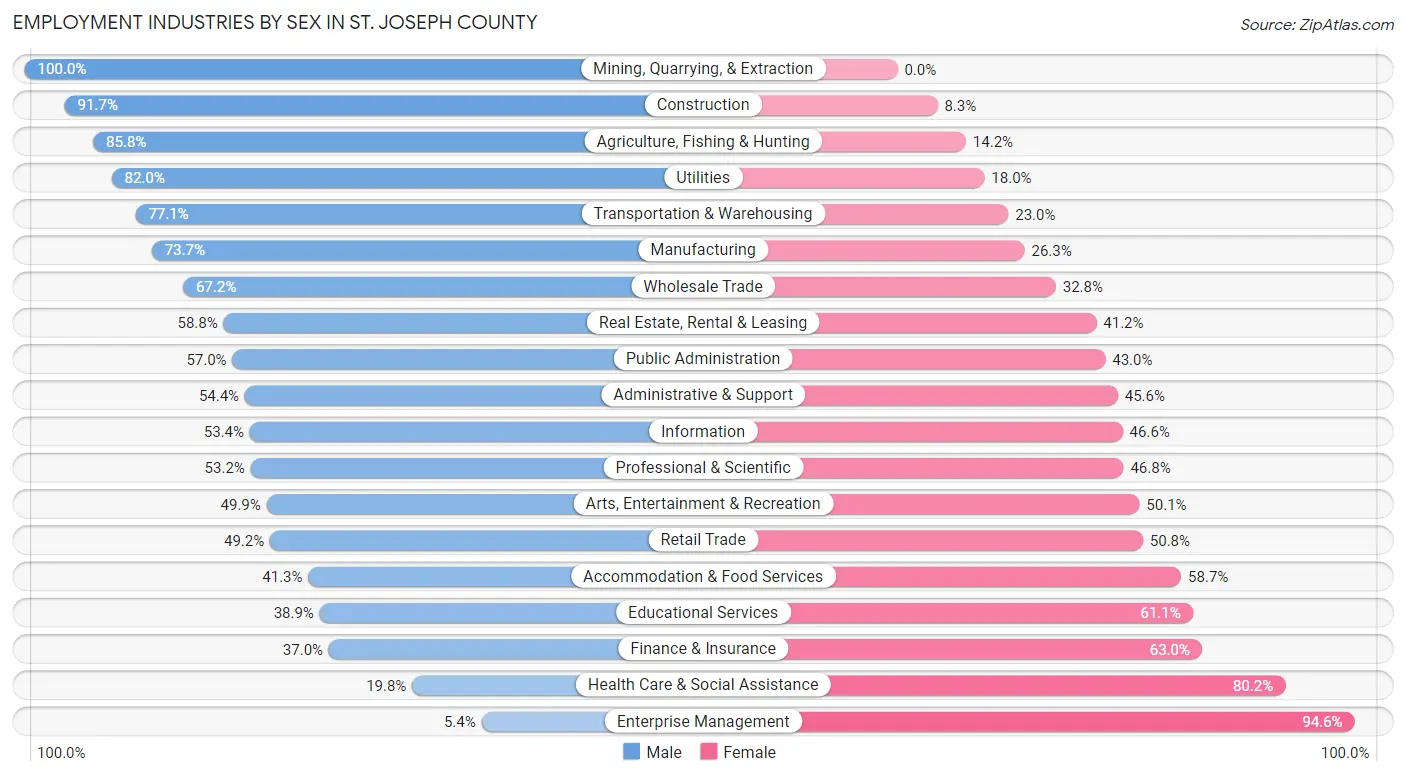
Employment Industries by Sex in St. Joseph County
The St. Joseph County industries that see more men than women are Mining, Quarrying, & Extraction (100.0%), Construction (91.7%), and Agriculture, Fishing & Hunting (85.8%), whereas the industries that tend to have a higher number of women are Enterprise Management (94.6%), Health Care & Social Assistance (80.2%), and Finance & Insurance (63.0%).
| Industry | Male | Female |
| Agriculture, Fishing & Hunting | 418 (85.8%) | 69 (14.2%) |
| Mining, Quarrying, & Extraction | 48 (100.0%) | 0 (0.0%) |
| Construction | 6,030 (91.7%) | 544 (8.3%) |
| Manufacturing | 16,463 (73.7%) | 5,880 (26.3%) |
| Wholesale Trade | 2,575 (67.2%) | 1,256 (32.8%) |
| Retail Trade | 6,920 (49.2%) | 7,145 (50.8%) |
| Transportation & Warehousing | 4,238 (77.0%) | 1,262 (23.0%) |
| Utilities | 710 (82.0%) | 156 (18.0%) |
| Information | 1,058 (53.4%) | 924 (46.6%) |
| Finance & Insurance | 1,710 (37.0%) | 2,910 (63.0%) |
| Real Estate, Rental & Leasing | 1,044 (58.8%) | 731 (41.2%) |
| Professional & Scientific | 3,421 (53.2%) | 3,008 (46.8%) |
| Enterprise Management | 4 (5.4%) | 70 (94.6%) |
| Administrative & Support | 2,346 (54.4%) | 1,967 (45.6%) |
| Educational Services | 7,195 (38.9%) | 11,291 (61.1%) |
| Health Care & Social Assistance | 3,723 (19.8%) | 15,111 (80.2%) |
| Arts, Entertainment & Recreation | 1,106 (49.9%) | 1,110 (50.1%) |
| Accommodation & Food Services | 3,483 (41.3%) | 4,956 (58.7%) |
| Public Administration | 2,097 (57.0%) | 1,583 (43.0%) |
| Total | 67,919 (51.8%) | 63,251 (48.2%) |
Education in St. Joseph County
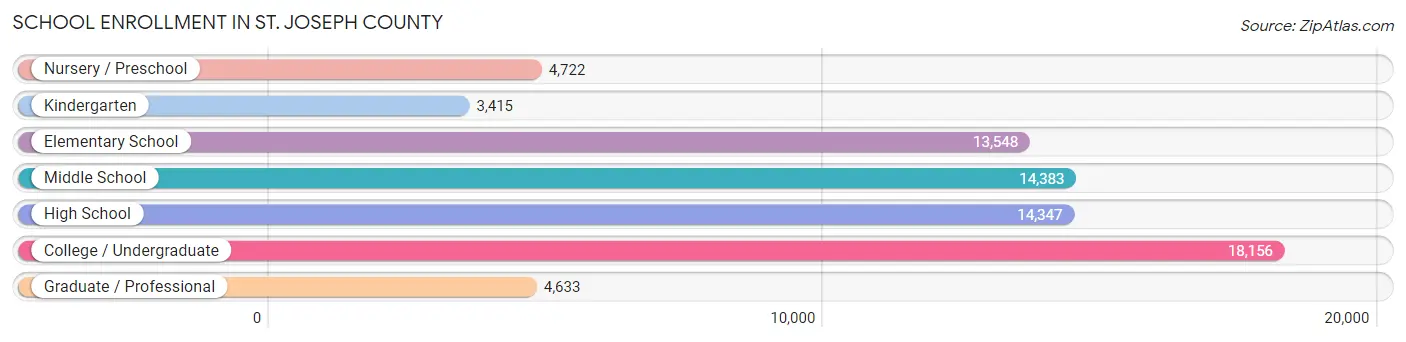
School Enrollment in St. Joseph County
The most common levels of schooling among the 73,204 students in St. Joseph County are college / undergraduate (18,156 | 24.8%), middle school (14,383 | 19.7%), and high school (14,347 | 19.6%).
| School Level | # Students | % Students |
| Nursery / Preschool | 4,722 | 6.5% |
| Kindergarten | 3,415 | 4.7% |
| Elementary School | 13,548 | 18.5% |
| Middle School | 14,383 | 19.7% |
| High School | 14,347 | 19.6% |
| College / Undergraduate | 18,156 | 24.8% |
| Graduate / Professional | 4,633 | 6.3% |
| Total | 73,204 | 100.0% |
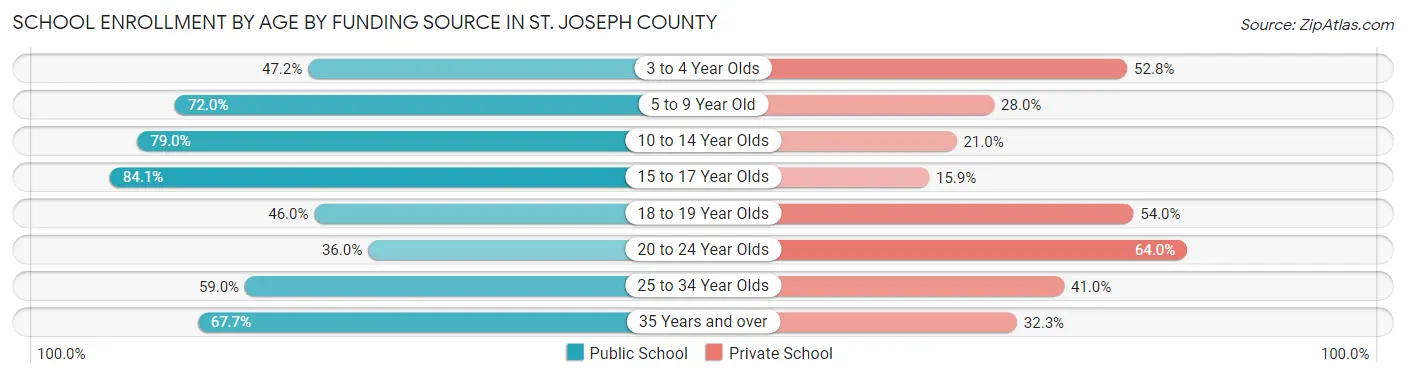
School Enrollment by Age by Funding Source in St. Joseph County
Out of a total of 73,204 students who are enrolled in schools in St. Joseph County, 25,329 (34.6%) attend a private institution, while the remaining 47,875 (65.4%) are enrolled in public schools. The age group of 20 to 24 year olds has the highest likelihood of being enrolled in private schools, with 6,722 (64.0% in the age bracket) enrolled. Conversely, the age group of 15 to 17 year olds has the lowest likelihood of being enrolled in a private school, with 8,893 (84.1% in the age bracket) attending a public institution.
| Age Bracket | Public School | Private School |
| 3 to 4 Year Olds | 1,552 (47.2%) | 1,736 (52.8%) |
| 5 to 9 Year Old | 11,651 (72.0%) | 4,537 (28.0%) |
| 10 to 14 Year Olds | 13,923 (79.0%) | 3,703 (21.0%) |
| 15 to 17 Year Olds | 8,893 (84.1%) | 1,681 (15.9%) |
| 18 to 19 Year Olds | 3,688 (46.0%) | 4,323 (54.0%) |
| 20 to 24 Year Olds | 3,788 (36.0%) | 6,722 (64.0%) |
| 25 to 34 Year Olds | 2,580 (59.0%) | 1,796 (41.0%) |
| 35 Years and over | 1,782 (67.7%) | 849 (32.3%) |
| Total | 47,875 (65.4%) | 25,329 (34.6%) |
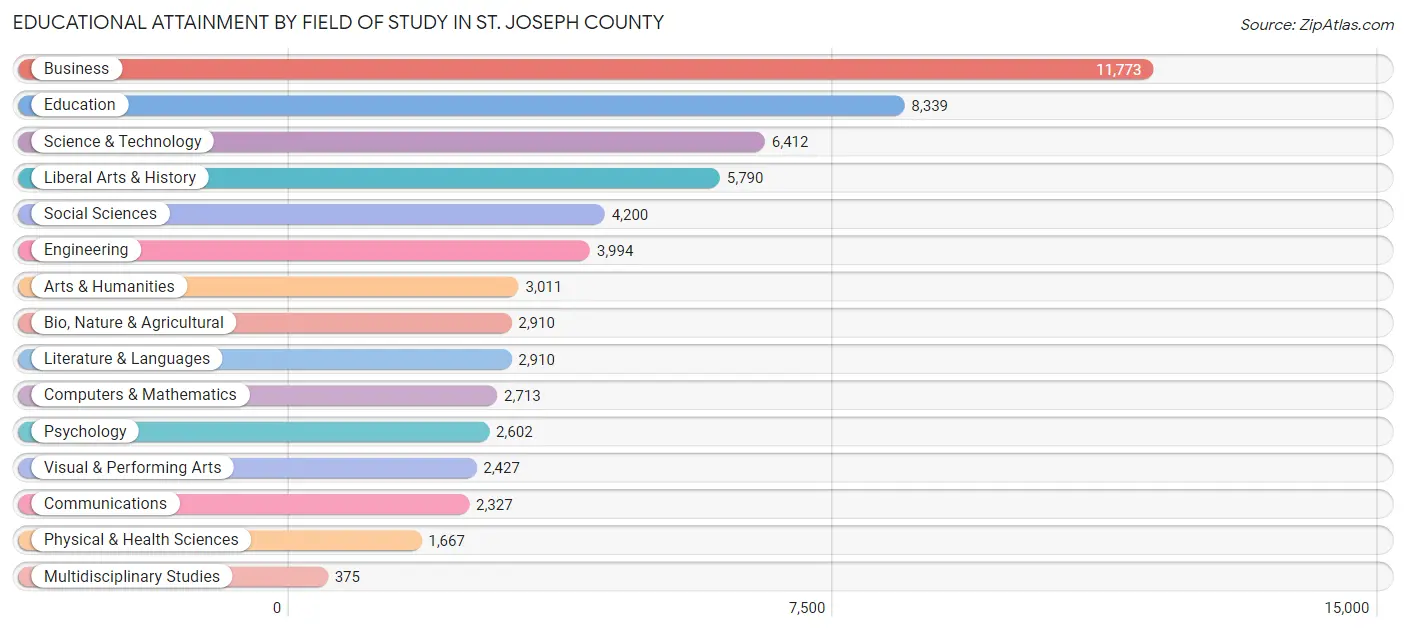
Educational Attainment by Field of Study in St. Joseph County
Business (11,773 | 19.2%), education (8,339 | 13.6%), science & technology (6,412 | 10.4%), liberal arts & history (5,790 | 9.4%), and social sciences (4,200 | 6.8%) are the most common fields of study among 61,450 individuals in St. Joseph County who have obtained a bachelor's degree or higher.
| Field of Study | # Graduates | % Graduates |
| Computers & Mathematics | 2,713 | 4.4% |
| Bio, Nature & Agricultural | 2,910 | 4.7% |
| Physical & Health Sciences | 1,667 | 2.7% |
| Psychology | 2,602 | 4.2% |
| Social Sciences | 4,200 | 6.8% |
| Engineering | 3,994 | 6.5% |
| Multidisciplinary Studies | 375 | 0.6% |
| Science & Technology | 6,412 | 10.4% |
| Business | 11,773 | 19.2% |
| Education | 8,339 | 13.6% |
| Literature & Languages | 2,910 | 4.7% |
| Liberal Arts & History | 5,790 | 9.4% |
| Visual & Performing Arts | 2,427 | 4.0% |
| Communications | 2,327 | 3.8% |
| Arts & Humanities | 3,011 | 4.9% |
| Total | 61,450 | 100.0% |
Transportation & Commute in St. Joseph County
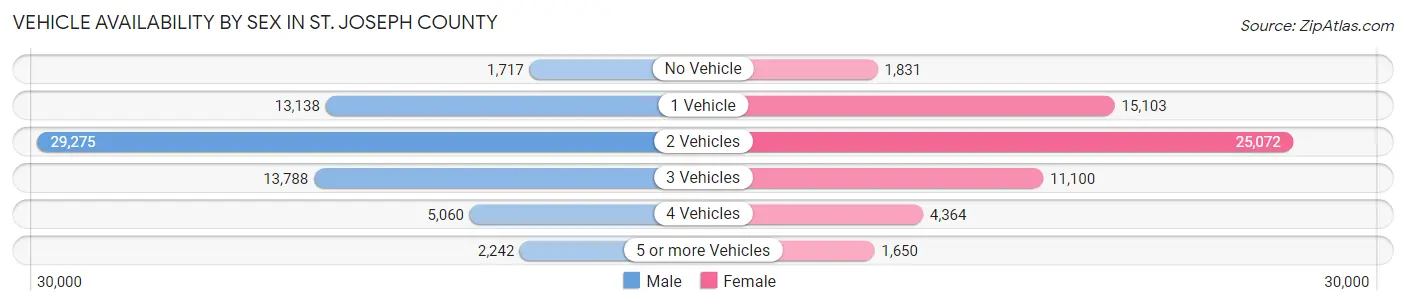
Vehicle Availability by Sex in St. Joseph County
The most prevalent vehicle ownership categories in St. Joseph County are males with 2 vehicles (29,275, accounting for 44.9%) and females with 2 vehicles (25,072, making up 49.5%).
| Vehicles Available | Male | Female |
| No Vehicle | 1,717 (2.6%) | 1,831 (3.1%) |
| 1 Vehicle | 13,138 (20.1%) | 15,103 (25.6%) |
| 2 Vehicles | 29,275 (44.9%) | 25,072 (42.4%) |
| 3 Vehicles | 13,788 (21.1%) | 11,100 (18.8%) |
| 4 Vehicles | 5,060 (7.8%) | 4,364 (7.4%) |
| 5 or more Vehicles | 2,242 (3.4%) | 1,650 (2.8%) |
| Total | 65,220 (100.0%) | 59,120 (100.0%) |
Commute Time in St. Joseph County
The most frequently occuring commute durations in St. Joseph County are 15 to 19 minutes (23,928 commuters, 20.3%), 20 to 24 minutes (20,582 commuters, 17.5%), and 10 to 14 minutes (19,396 commuters, 16.5%).
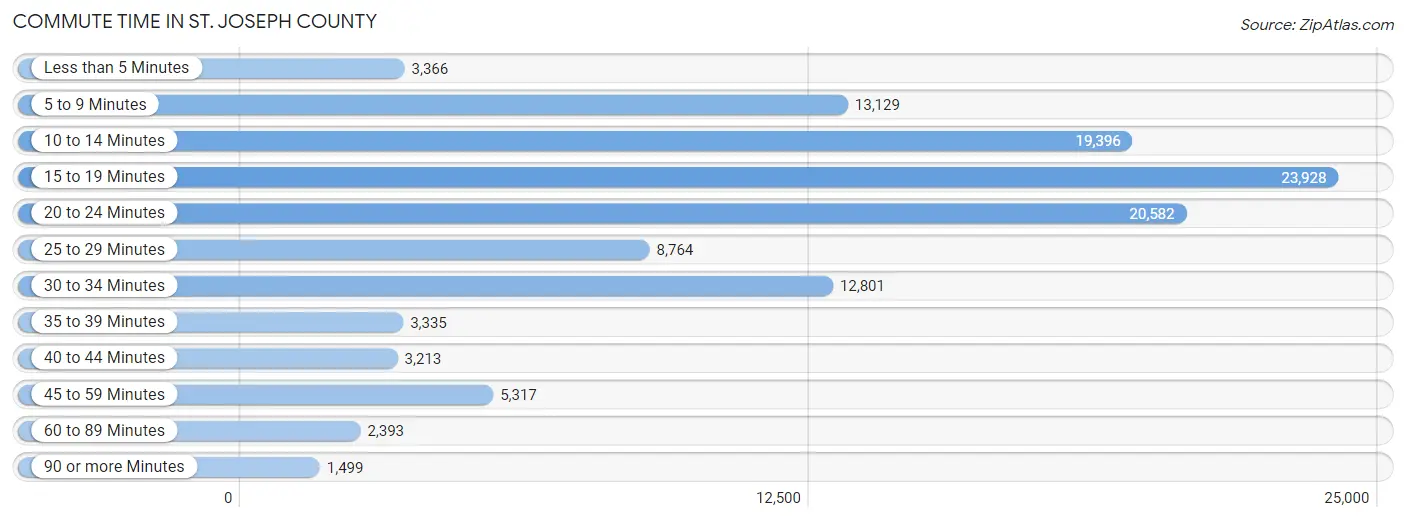
| Commute Time | # Commuters | % Commuters |
| Less than 5 Minutes | 3,366 | 2.9% |
| 5 to 9 Minutes | 13,129 | 11.2% |
| 10 to 14 Minutes | 19,396 | 16.5% |
| 15 to 19 Minutes | 23,928 | 20.3% |
| 20 to 24 Minutes | 20,582 | 17.5% |
| 25 to 29 Minutes | 8,764 | 7.4% |
| 30 to 34 Minutes | 12,801 | 10.9% |
| 35 to 39 Minutes | 3,335 | 2.8% |
| 40 to 44 Minutes | 3,213 | 2.7% |
| 45 to 59 Minutes | 5,317 | 4.5% |
| 60 to 89 Minutes | 2,393 | 2.0% |
| 90 or more Minutes | 1,499 | 1.3% |
Commute Time by Sex in St. Joseph County
The most common commute times in St. Joseph County are 15 to 19 minutes (11,323 commuters, 18.1%) for males and 15 to 19 minutes (12,605 commuters, 22.9%) for females.
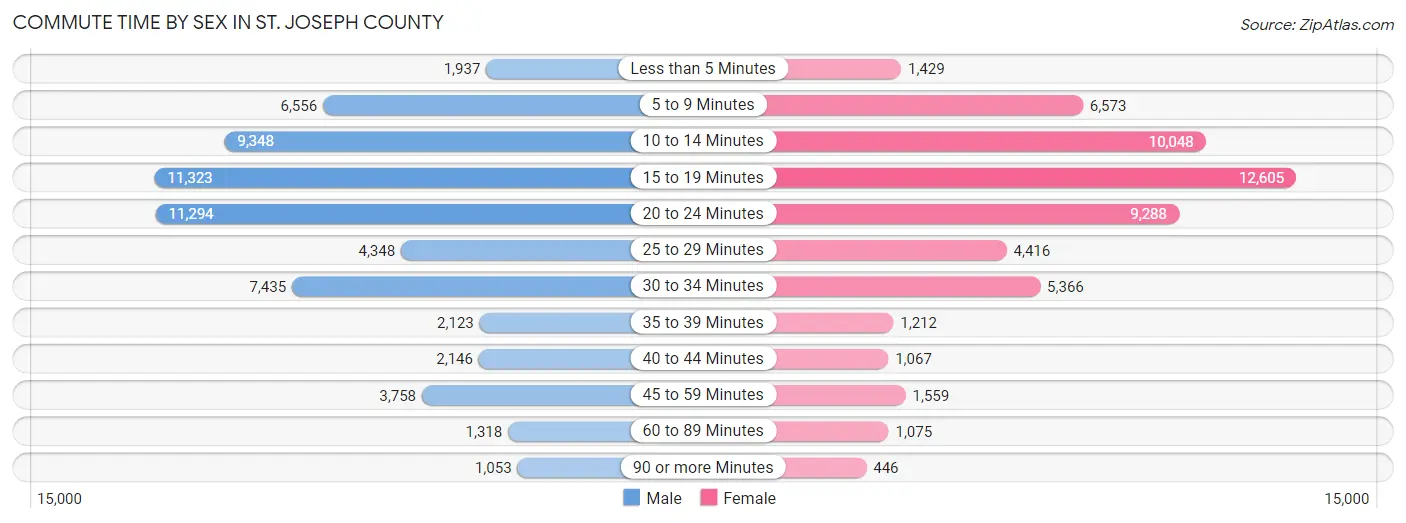
| Commute Time | Male | Female |
| Less than 5 Minutes | 1,937 (3.1%) | 1,429 (2.6%) |
| 5 to 9 Minutes | 6,556 (10.5%) | 6,573 (11.9%) |
| 10 to 14 Minutes | 9,348 (14.9%) | 10,048 (18.2%) |
| 15 to 19 Minutes | 11,323 (18.1%) | 12,605 (22.9%) |
| 20 to 24 Minutes | 11,294 (18.0%) | 9,288 (16.9%) |
| 25 to 29 Minutes | 4,348 (6.9%) | 4,416 (8.0%) |
| 30 to 34 Minutes | 7,435 (11.9%) | 5,366 (9.7%) |
| 35 to 39 Minutes | 2,123 (3.4%) | 1,212 (2.2%) |
| 40 to 44 Minutes | 2,146 (3.4%) | 1,067 (1.9%) |
| 45 to 59 Minutes | 3,758 (6.0%) | 1,559 (2.8%) |
| 60 to 89 Minutes | 1,318 (2.1%) | 1,075 (1.9%) |
| 90 or more Minutes | 1,053 (1.7%) | 446 (0.8%) |
Time of Departure to Work by Sex in St. Joseph County
The most frequent times of departure to work in St. Joseph County are 7:30 AM to 7:59 AM (8,029, 12.8%) for males and 7:30 AM to 7:59 AM (9,157, 16.6%) for females.
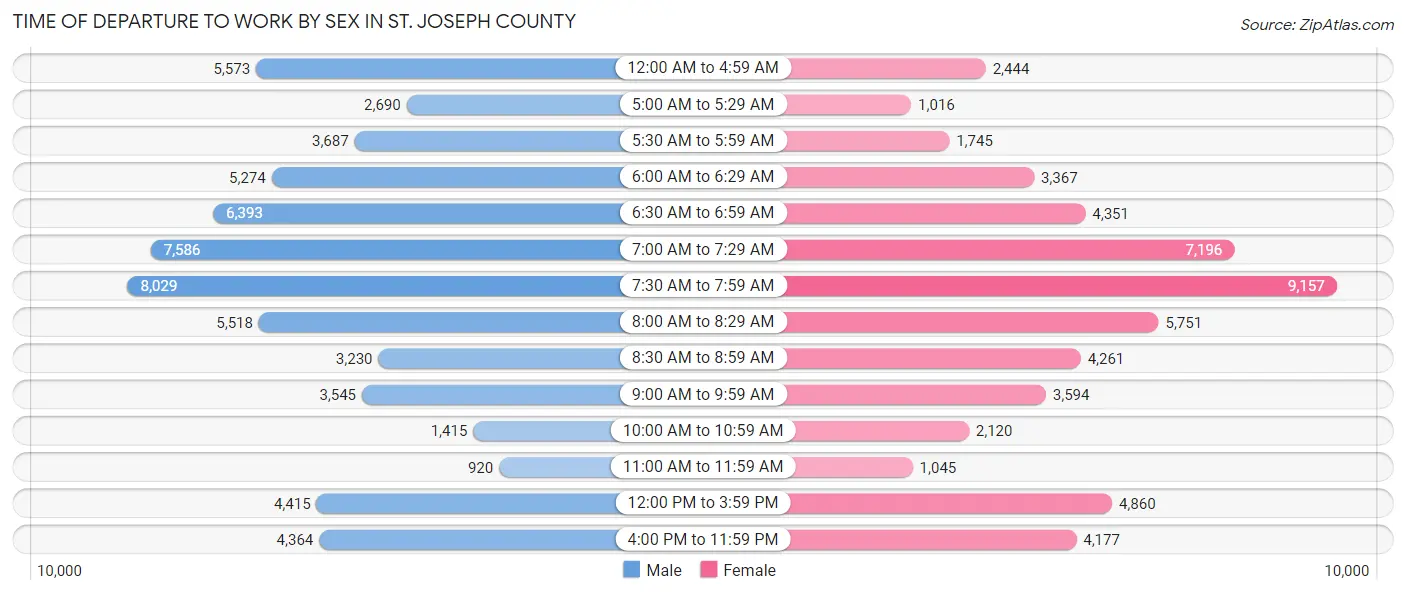
| Time of Departure | Male | Female |
| 12:00 AM to 4:59 AM | 5,573 (8.9%) | 2,444 (4.4%) |
| 5:00 AM to 5:29 AM | 2,690 (4.3%) | 1,016 (1.8%) |
| 5:30 AM to 5:59 AM | 3,687 (5.9%) | 1,745 (3.2%) |
| 6:00 AM to 6:29 AM | 5,274 (8.4%) | 3,367 (6.1%) |
| 6:30 AM to 6:59 AM | 6,393 (10.2%) | 4,351 (7.9%) |
| 7:00 AM to 7:29 AM | 7,586 (12.1%) | 7,196 (13.1%) |
| 7:30 AM to 7:59 AM | 8,029 (12.8%) | 9,157 (16.6%) |
| 8:00 AM to 8:29 AM | 5,518 (8.8%) | 5,751 (10.4%) |
| 8:30 AM to 8:59 AM | 3,230 (5.2%) | 4,261 (7.7%) |
| 9:00 AM to 9:59 AM | 3,545 (5.7%) | 3,594 (6.5%) |
| 10:00 AM to 10:59 AM | 1,415 (2.3%) | 2,120 (3.8%) |
| 11:00 AM to 11:59 AM | 920 (1.5%) | 1,045 (1.9%) |
| 12:00 PM to 3:59 PM | 4,415 (7.0%) | 4,860 (8.8%) |
| 4:00 PM to 11:59 PM | 4,364 (7.0%) | 4,177 (7.6%) |
| Total | 62,639 (100.0%) | 55,084 (100.0%) |
Housing Occupancy in St. Joseph County
Occupancy by Ownership in St. Joseph County
Of the total 107,466 dwellings in St. Joseph County, owner-occupied units account for 73,223 (68.1%), while renter-occupied units make up 34,243 (31.9%).
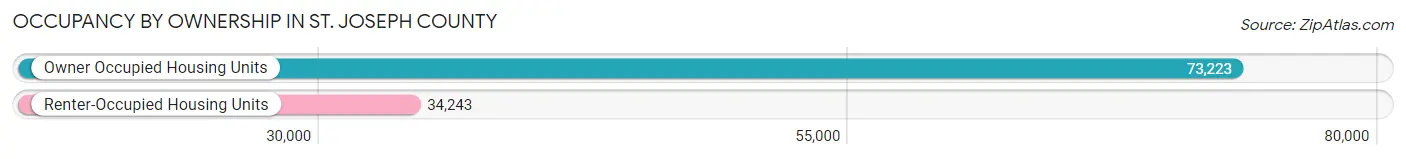
| Occupancy | # Housing Units | % Housing Units |
| Owner Occupied Housing Units | 73,223 | 68.1% |
| Renter-Occupied Housing Units | 34,243 | 31.9% |
| Total Occupied Housing Units | 107,466 | 100.0% |
Occupancy by Household Size in St. Joseph County
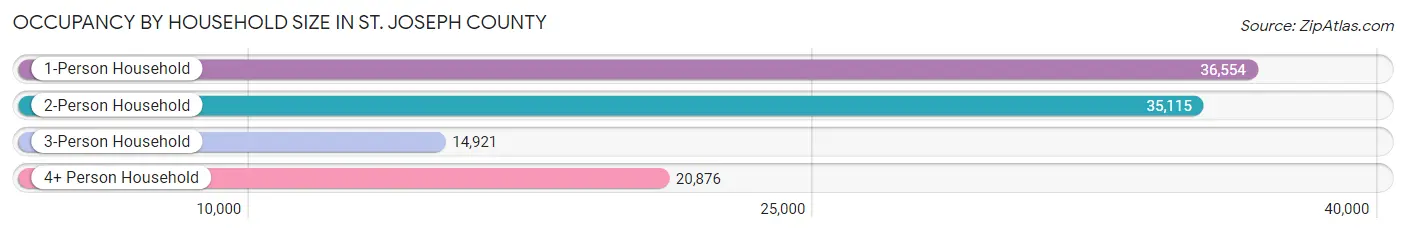
| Household Size | # Housing Units | % Housing Units |
| 1-Person Household | 36,554 | 34.0% |
| 2-Person Household | 35,115 | 32.7% |
| 3-Person Household | 14,921 | 13.9% |
| 4+ Person Household | 20,876 | 19.4% |
| Total Housing Units | 107,466 | 100.0% |
Occupancy by Ownership by Household Size in St. Joseph County
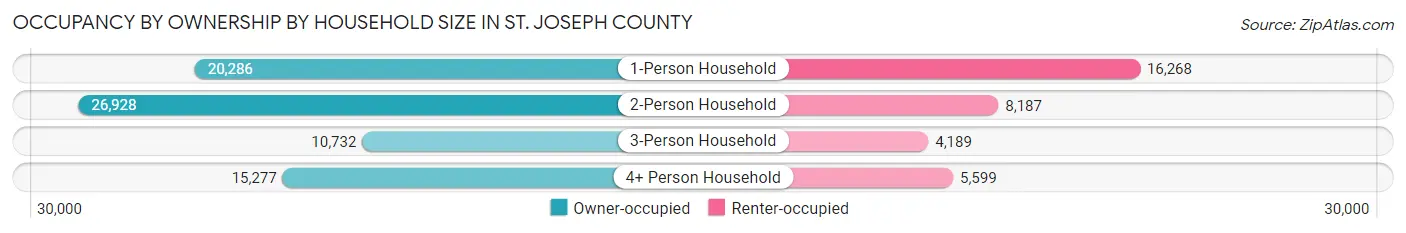
| Household Size | Owner-occupied | Renter-occupied |
| 1-Person Household | 20,286 (55.5%) | 16,268 (44.5%) |
| 2-Person Household | 26,928 (76.7%) | 8,187 (23.3%) |
| 3-Person Household | 10,732 (71.9%) | 4,189 (28.1%) |
| 4+ Person Household | 15,277 (73.2%) | 5,599 (26.8%) |
| Total Housing Units | 73,223 (68.1%) | 34,243 (31.9%) |
Occupancy by Educational Attainment in St. Joseph County
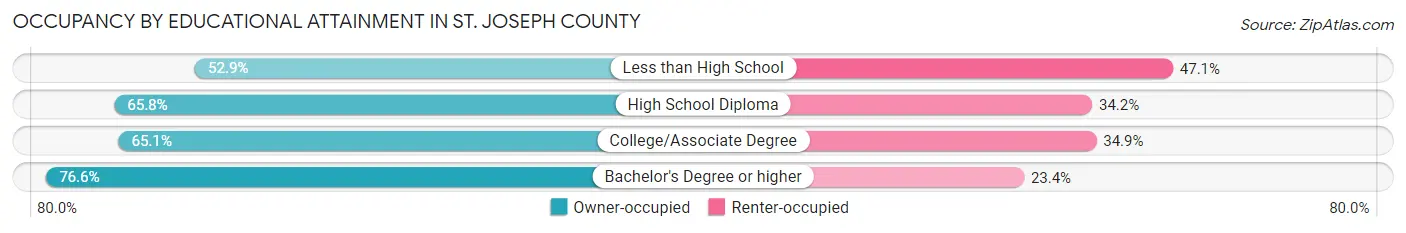
| Household Size | Owner-occupied | Renter-occupied |
| Less than High School | 4,457 (52.9%) | 3,962 (47.1%) |
| High School Diploma | 20,061 (65.8%) | 10,447 (34.2%) |
| College/Associate Degree | 21,375 (65.1%) | 11,465 (34.9%) |
| Bachelor's Degree or higher | 27,330 (76.6%) | 8,369 (23.4%) |
Occupancy by Age of Householder in St. Joseph County
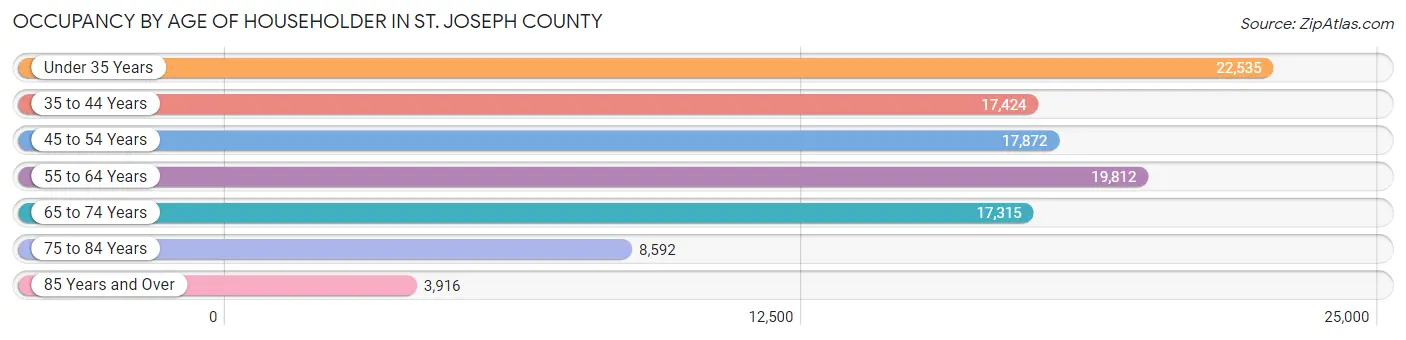
| Age Bracket | # Households | % Households |
| Under 35 Years | 22,535 | 21.0% |
| 35 to 44 Years | 17,424 | 16.2% |
| 45 to 54 Years | 17,872 | 16.6% |
| 55 to 64 Years | 19,812 | 18.4% |
| 65 to 74 Years | 17,315 | 16.1% |
| 75 to 84 Years | 8,592 | 8.0% |
| 85 Years and Over | 3,916 | 3.6% |
| Total | 107,466 | 100.0% |
Housing Finances in St. Joseph County
Median Income by Occupancy in St. Joseph County
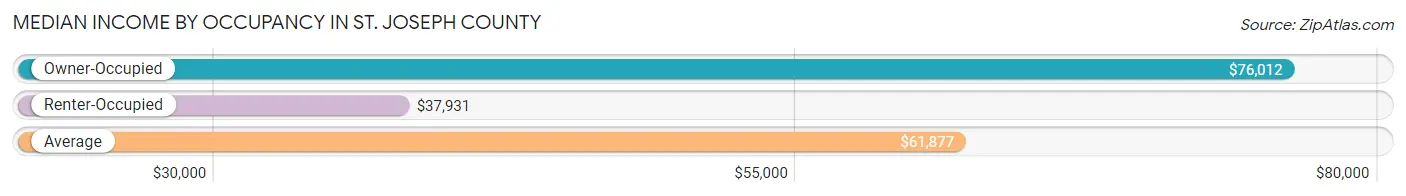
| Occupancy Type | # Households | Median Income |
| Owner-Occupied | 73,223 (68.1%) | $76,012 |
| Renter-Occupied | 34,243 (31.9%) | $37,931 |
| Average | 107,466 (100.0%) | $61,877 |
Occupancy by Householder Income Bracket in St. Joseph County
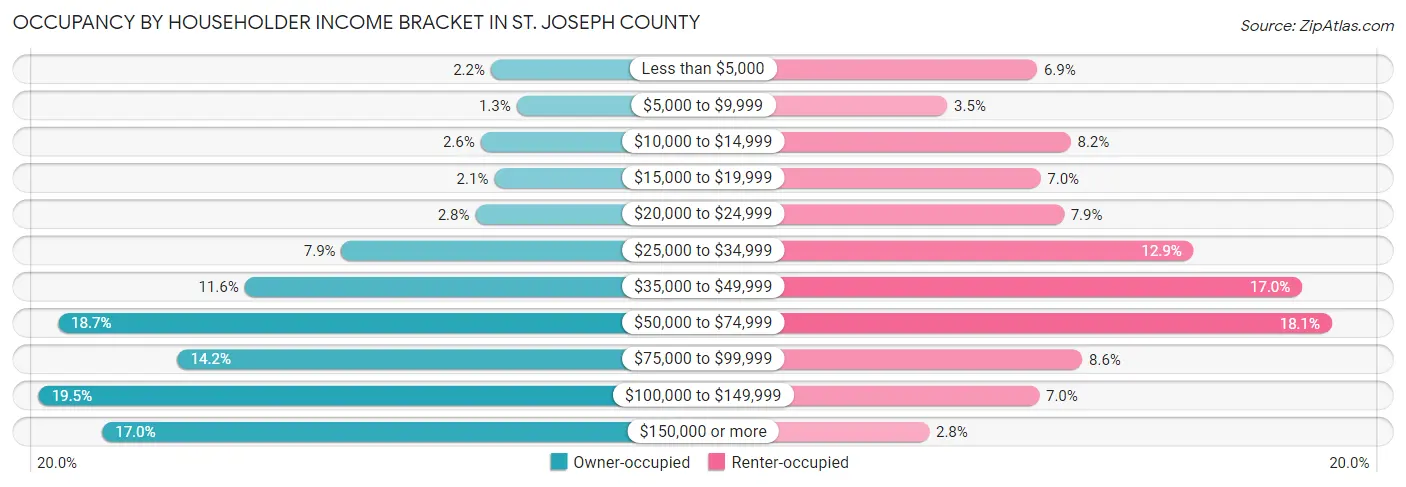
| Income Bracket | Owner-occupied | Renter-occupied |
| Less than $5,000 | 1,637 (2.2%) | 2,365 (6.9%) |
| $5,000 to $9,999 | 919 (1.3%) | 1,195 (3.5%) |
| $10,000 to $14,999 | 1,928 (2.6%) | 2,804 (8.2%) |
| $15,000 to $19,999 | 1,544 (2.1%) | 2,409 (7.0%) |
| $20,000 to $24,999 | 2,074 (2.8%) | 2,716 (7.9%) |
| $25,000 to $34,999 | 5,808 (7.9%) | 4,409 (12.9%) |
| $35,000 to $49,999 | 8,507 (11.6%) | 5,825 (17.0%) |
| $50,000 to $74,999 | 13,705 (18.7%) | 6,213 (18.1%) |
| $75,000 to $99,999 | 10,376 (14.2%) | 2,954 (8.6%) |
| $100,000 to $149,999 | 14,250 (19.5%) | 2,393 (7.0%) |
| $150,000 or more | 12,475 (17.0%) | 960 (2.8%) |
| Total | 73,223 (100.0%) | 34,243 (100.0%) |
Monthly Housing Cost Tiers in St. Joseph County
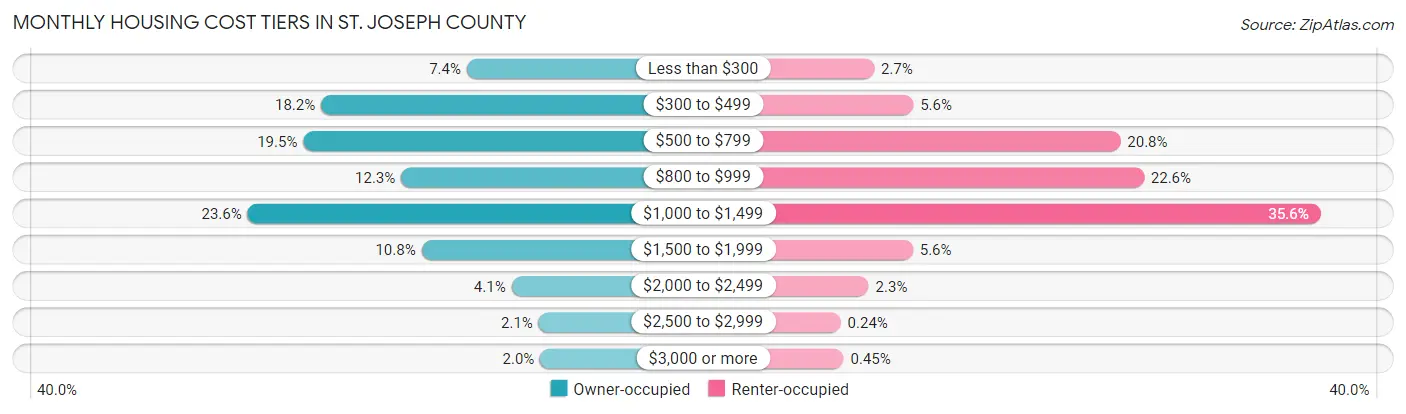
| Monthly Cost | Owner-occupied | Renter-occupied |
| Less than $300 | 5,442 (7.4%) | 920 (2.7%) |
| $300 to $499 | 13,302 (18.2%) | 1,911 (5.6%) |
| $500 to $799 | 14,263 (19.5%) | 7,137 (20.8%) |
| $800 to $999 | 8,982 (12.3%) | 7,729 (22.6%) |
| $1,000 to $1,499 | 17,265 (23.6%) | 12,182 (35.6%) |
| $1,500 to $1,999 | 7,883 (10.8%) | 1,900 (5.6%) |
| $2,000 to $2,499 | 3,033 (4.1%) | 786 (2.3%) |
| $2,500 to $2,999 | 1,569 (2.1%) | 83 (0.2%) |
| $3,000 or more | 1,484 (2.0%) | 155 (0.4%) |
| Total | 73,223 (100.0%) | 34,243 (100.0%) |
Physical Housing Characteristics in St. Joseph County
Housing Structures in St. Joseph County
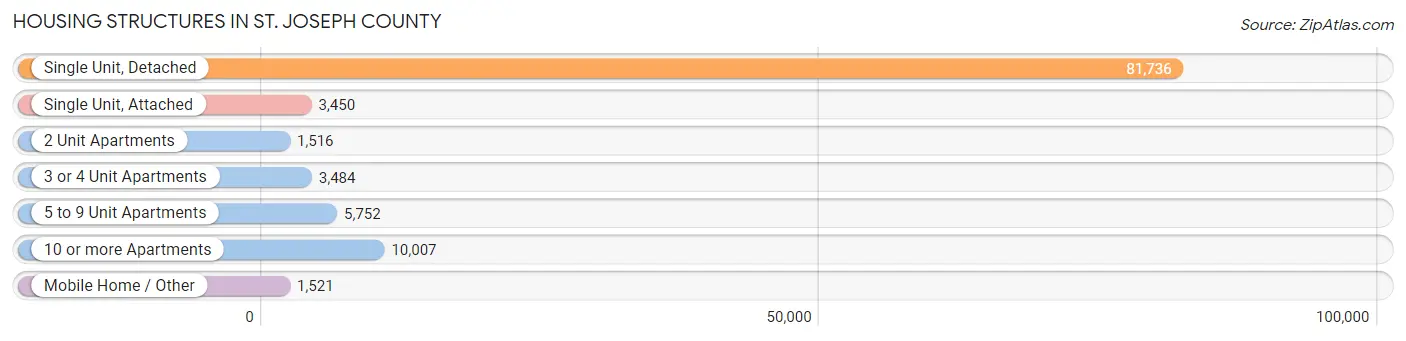
| Structure Type | # Housing Units | % Housing Units |
| Single Unit, Detached | 81,736 | 76.1% |
| Single Unit, Attached | 3,450 | 3.2% |
| 2 Unit Apartments | 1,516 | 1.4% |
| 3 or 4 Unit Apartments | 3,484 | 3.2% |
| 5 to 9 Unit Apartments | 5,752 | 5.3% |
| 10 or more Apartments | 10,007 | 9.3% |
| Mobile Home / Other | 1,521 | 1.4% |
| Total | 107,466 | 100.0% |
Housing Structures by Occupancy in St. Joseph County
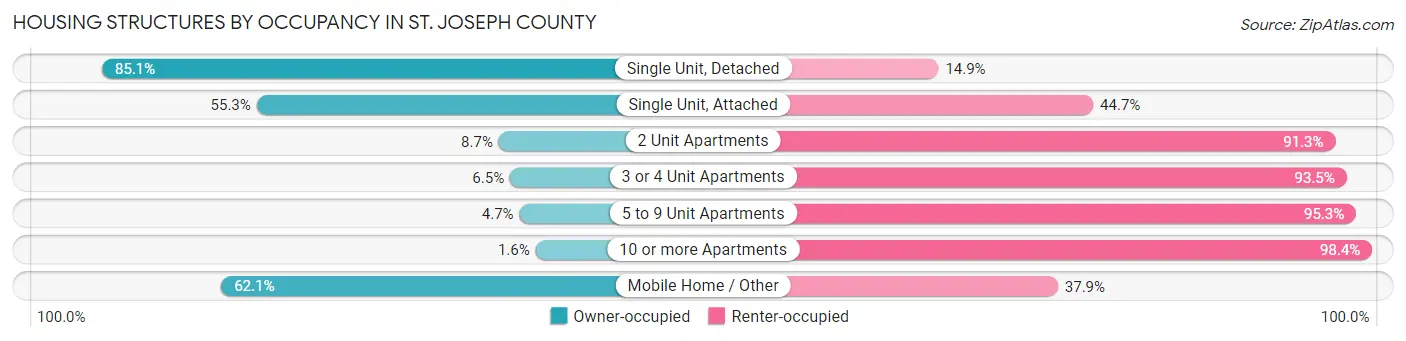
| Structure Type | Owner-occupied | Renter-occupied |
| Single Unit, Detached | 69,575 (85.1%) | 12,161 (14.9%) |
| Single Unit, Attached | 1,909 (55.3%) | 1,541 (44.7%) |
| 2 Unit Apartments | 132 (8.7%) | 1,384 (91.3%) |
| 3 or 4 Unit Apartments | 228 (6.5%) | 3,256 (93.5%) |
| 5 to 9 Unit Apartments | 272 (4.7%) | 5,480 (95.3%) |
| 10 or more Apartments | 162 (1.6%) | 9,845 (98.4%) |
| Mobile Home / Other | 945 (62.1%) | 576 (37.9%) |
| Total | 73,223 (68.1%) | 34,243 (31.9%) |
Housing Structures by Number of Rooms in St. Joseph County
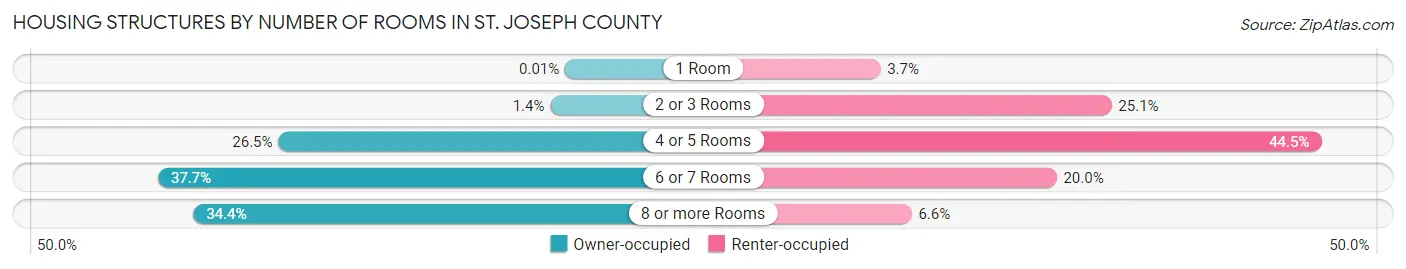
| Number of Rooms | Owner-occupied | Renter-occupied |
| 1 Room | 4 (0.0%) | 1,276 (3.7%) |
| 2 or 3 Rooms | 1,014 (1.4%) | 8,599 (25.1%) |
| 4 or 5 Rooms | 19,429 (26.5%) | 15,241 (44.5%) |
| 6 or 7 Rooms | 27,588 (37.7%) | 6,859 (20.0%) |
| 8 or more Rooms | 25,188 (34.4%) | 2,268 (6.6%) |
| Total | 73,223 (100.0%) | 34,243 (100.0%) |
Housing Structure by Heating Type in St. Joseph County
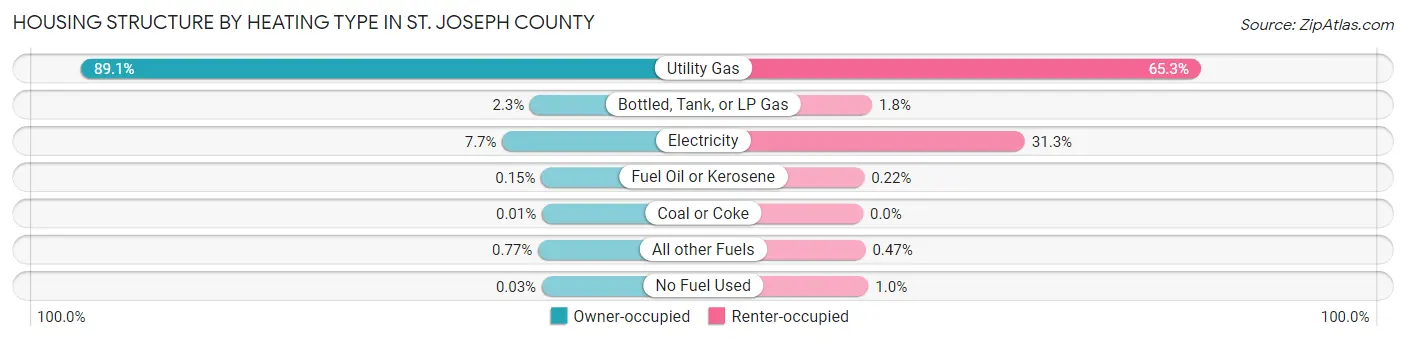
| Heating Type | Owner-occupied | Renter-occupied |
| Utility Gas | 65,211 (89.1%) | 22,342 (65.2%) |
| Bottled, Tank, or LP Gas | 1,692 (2.3%) | 601 (1.8%) |
| Electricity | 5,620 (7.7%) | 10,710 (31.3%) |
| Fuel Oil or Kerosene | 111 (0.2%) | 75 (0.2%) |
| Coal or Coke | 4 (0.0%) | 0 (0.0%) |
| All other Fuels | 563 (0.8%) | 160 (0.5%) |
| No Fuel Used | 22 (0.0%) | 355 (1.0%) |
| Total | 73,223 (100.0%) | 34,243 (100.0%) |
Household Vehicle Usage in St. Joseph County
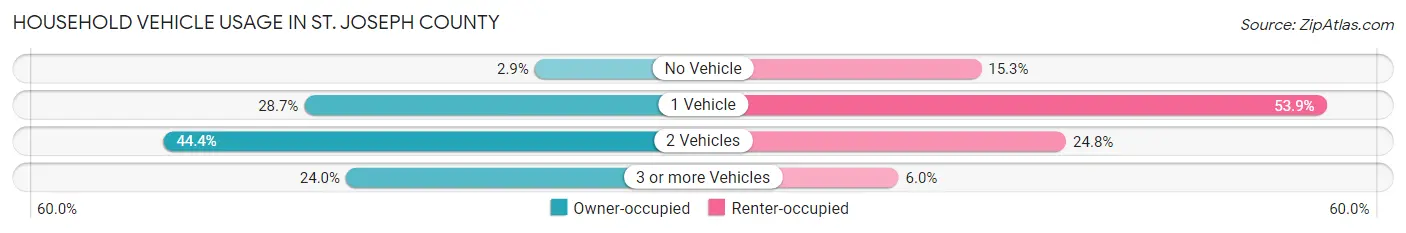
| Vehicles per Household | Owner-occupied | Renter-occupied |
| No Vehicle | 2,105 (2.9%) | 5,231 (15.3%) |
| 1 Vehicle | 21,001 (28.7%) | 18,468 (53.9%) |
| 2 Vehicles | 32,538 (44.4%) | 8,486 (24.8%) |
| 3 or more Vehicles | 17,579 (24.0%) | 2,058 (6.0%) |
| Total | 73,223 (100.0%) | 34,243 (100.0%) |
Real Estate & Mortgages in St. Joseph County
Real Estate and Mortgage Overview in St. Joseph County
| Characteristic | Without Mortgage | With Mortgage |
| Housing Units | 27,906 | 45,317 |
| Median Property Value | $149,900 | $174,100 |
| Median Household Income | $58,203 | $9,203 |
| Monthly Housing Costs | $435 | $1,428 |
| Real Estate Taxes | $1,351 | $1,153 |
Property Value by Mortgage Status in St. Joseph County
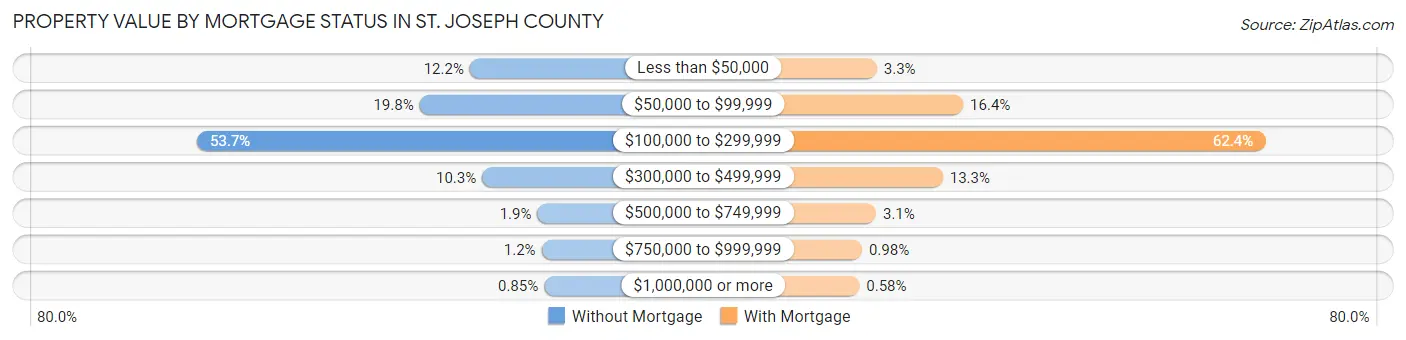
| Property Value | Without Mortgage | With Mortgage |
| Less than $50,000 | 3,397 (12.2%) | 1,474 (3.3%) |
| $50,000 to $99,999 | 5,534 (19.8%) | 7,431 (16.4%) |
| $100,000 to $299,999 | 14,994 (53.7%) | 28,273 (62.4%) |
| $300,000 to $499,999 | 2,873 (10.3%) | 6,022 (13.3%) |
| $500,000 to $749,999 | 524 (1.9%) | 1,412 (3.1%) |
| $750,000 to $999,999 | 346 (1.2%) | 443 (1.0%) |
| $1,000,000 or more | 238 (0.9%) | 262 (0.6%) |
| Total | 27,906 (100.0%) | 45,317 (100.0%) |
Household Income by Mortgage Status in St. Joseph County
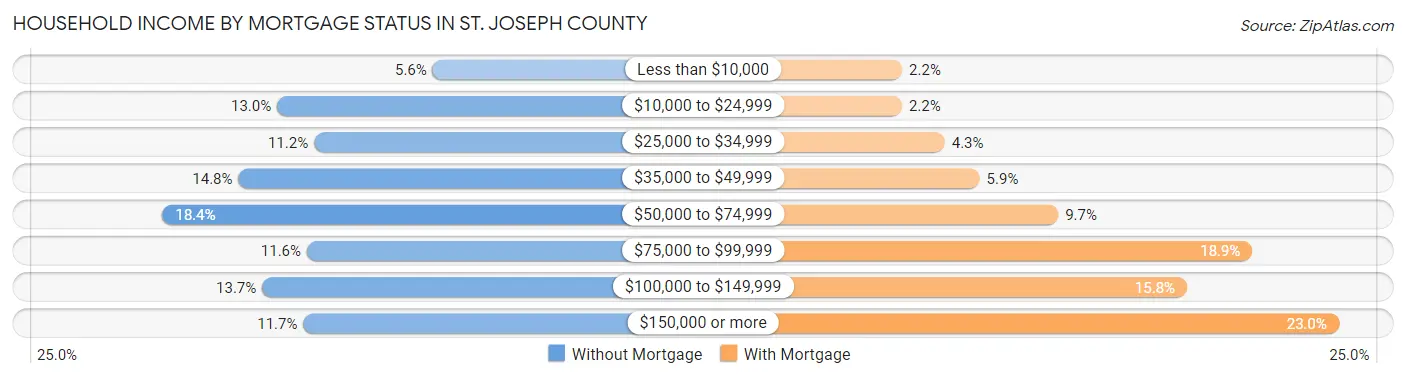
| Household Income | Without Mortgage | With Mortgage |
| Less than $10,000 | 1,553 (5.6%) | 1,004 (2.2%) |
| $10,000 to $24,999 | 3,621 (13.0%) | 1,003 (2.2%) |
| $25,000 to $34,999 | 3,132 (11.2%) | 1,925 (4.3%) |
| $35,000 to $49,999 | 4,135 (14.8%) | 2,676 (5.9%) |
| $50,000 to $74,999 | 5,145 (18.4%) | 4,372 (9.7%) |
| $75,000 to $99,999 | 3,227 (11.6%) | 8,560 (18.9%) |
| $100,000 to $149,999 | 3,821 (13.7%) | 7,149 (15.8%) |
| $150,000 or more | 3,272 (11.7%) | 10,429 (23.0%) |
| Total | 27,906 (100.0%) | 45,317 (100.0%) |
Property Value to Household Income Ratio in St. Joseph County
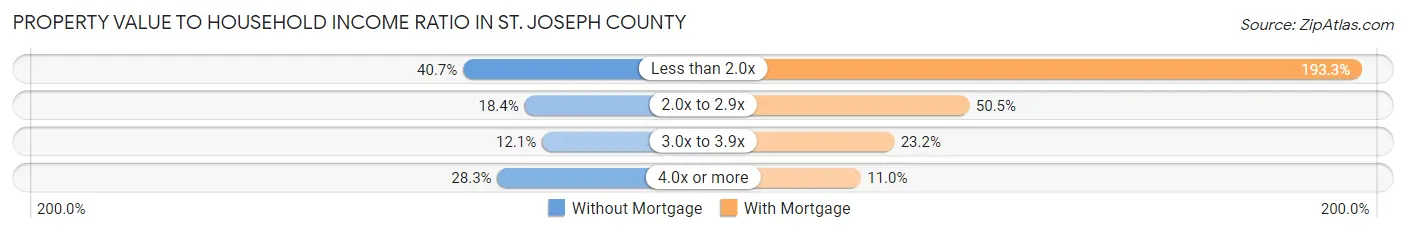
| Value-to-Income Ratio | Without Mortgage | With Mortgage |
| Less than 2.0x | 11,366 (40.7%) | 87,585 (193.3%) |
| 2.0x to 2.9x | 5,138 (18.4%) | 22,869 (50.5%) |
| 3.0x to 3.9x | 3,366 (12.1%) | 10,506 (23.2%) |
| 4.0x or more | 7,886 (28.3%) | 4,997 (11.0%) |
| Total | 27,906 (100.0%) | 45,317 (100.0%) |
Real Estate Taxes by Mortgage Status in St. Joseph County
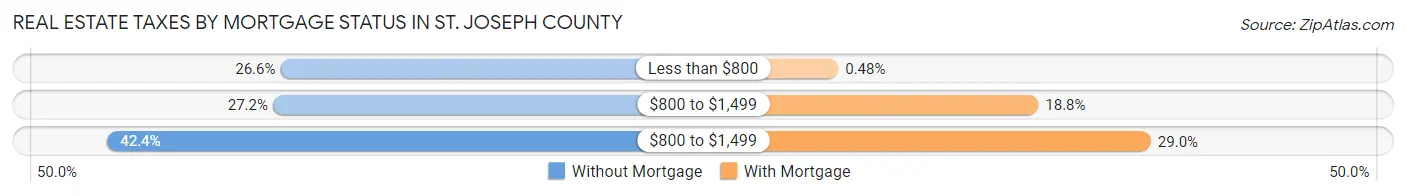
| Property Taxes | Without Mortgage | With Mortgage |
| Less than $800 | 7,412 (26.6%) | 218 (0.5%) |
| $800 to $1,499 | 7,601 (27.2%) | 8,495 (18.8%) |
| $800 to $1,499 | 11,842 (42.4%) | 13,154 (29.0%) |
| Total | 27,906 (100.0%) | 45,317 (100.0%) |
Health & Disability in St. Joseph County
Health Insurance Coverage by Age in St. Joseph County
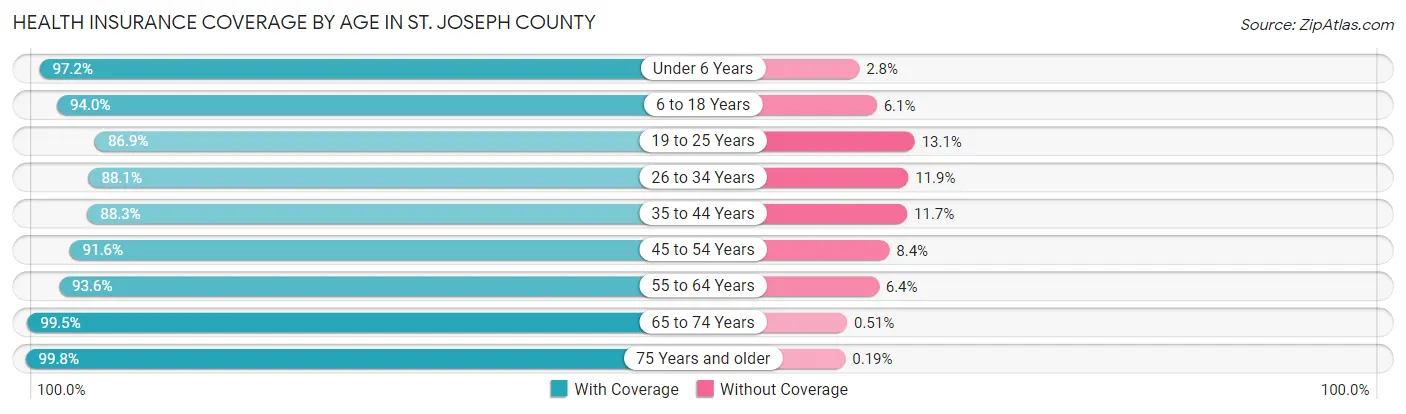
| Age Bracket | With Coverage | Without Coverage |
| Under 6 Years | 20,242 (97.2%) | 583 (2.8%) |
| 6 to 18 Years | 43,873 (94.0%) | 2,826 (6.0%) |
| 19 to 25 Years | 26,435 (86.9%) | 3,994 (13.1%) |
| 26 to 34 Years | 28,568 (88.1%) | 3,869 (11.9%) |
| 35 to 44 Years | 28,577 (88.3%) | 3,789 (11.7%) |
| 45 to 54 Years | 28,401 (91.6%) | 2,605 (8.4%) |
| 55 to 64 Years | 30,958 (93.6%) | 2,128 (6.4%) |
| 65 to 74 Years | 25,610 (99.5%) | 130 (0.5%) |
| 75 Years and older | 17,239 (99.8%) | 33 (0.2%) |
| Total | 249,903 (92.6%) | 19,957 (7.4%) |
Health Insurance Coverage by Citizenship Status in St. Joseph County
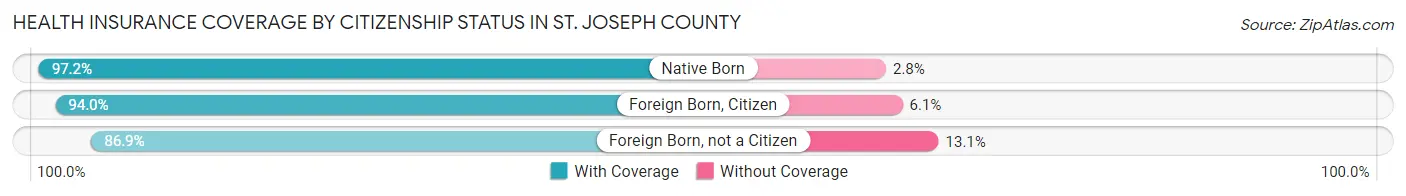
| Citizenship Status | With Coverage | Without Coverage |
| Native Born | 20,242 (97.2%) | 583 (2.8%) |
| Foreign Born, Citizen | 43,873 (94.0%) | 2,826 (6.0%) |
| Foreign Born, not a Citizen | 26,435 (86.9%) | 3,994 (13.1%) |
Health Insurance Coverage by Household Income in St. Joseph County
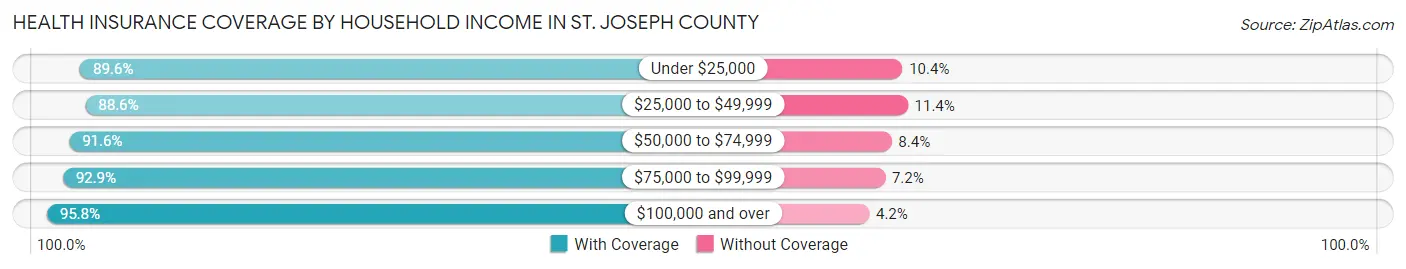
| Household Income | With Coverage | Without Coverage |
| Under $25,000 | 29,800 (89.6%) | 3,455 (10.4%) |
| $25,000 to $49,999 | 42,561 (88.6%) | 5,472 (11.4%) |
| $50,000 to $74,999 | 43,429 (91.6%) | 3,960 (8.4%) |
| $75,000 to $99,999 | 35,626 (92.8%) | 2,745 (7.1%) |
| $100,000 and over | 89,414 (95.8%) | 3,887 (4.2%) |
Public vs Private Health Insurance Coverage by Age in St. Joseph County
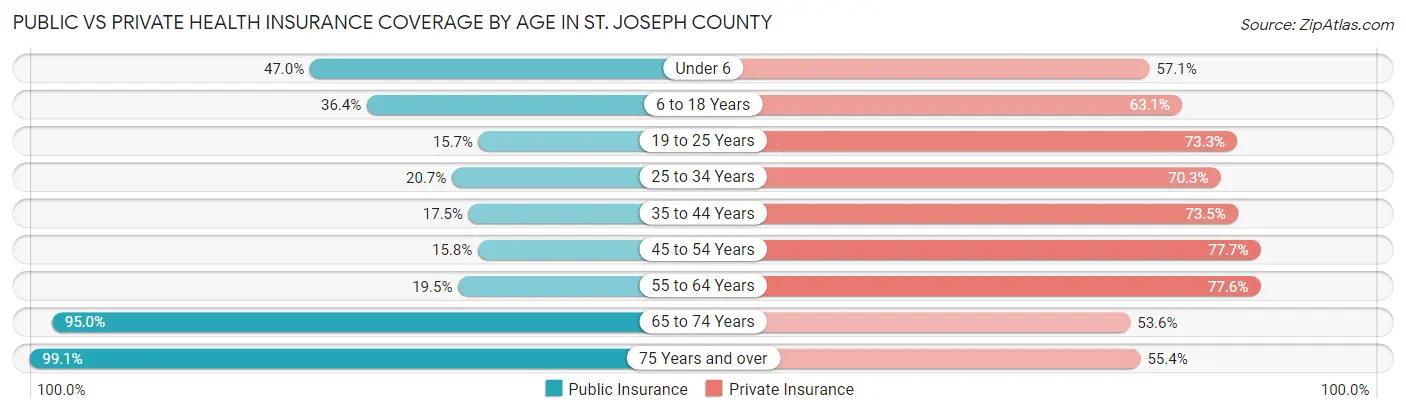
| Age Bracket | Public Insurance | Private Insurance |
| Under 6 | 9,791 (47.0%) | 11,894 (57.1%) |
| 6 to 18 Years | 17,016 (36.4%) | 29,470 (63.1%) |
| 19 to 25 Years | 4,772 (15.7%) | 22,318 (73.3%) |
| 25 to 34 Years | 6,698 (20.6%) | 22,786 (70.3%) |
| 35 to 44 Years | 5,677 (17.5%) | 23,777 (73.5%) |
| 45 to 54 Years | 4,910 (15.8%) | 24,082 (77.7%) |
| 55 to 64 Years | 6,455 (19.5%) | 25,687 (77.6%) |
| 65 to 74 Years | 24,440 (95.0%) | 13,784 (53.5%) |
| 75 Years and over | 17,118 (99.1%) | 9,575 (55.4%) |
| Total | 96,877 (35.9%) | 183,373 (67.9%) |
Disability Status by Sex by Age in St. Joseph County
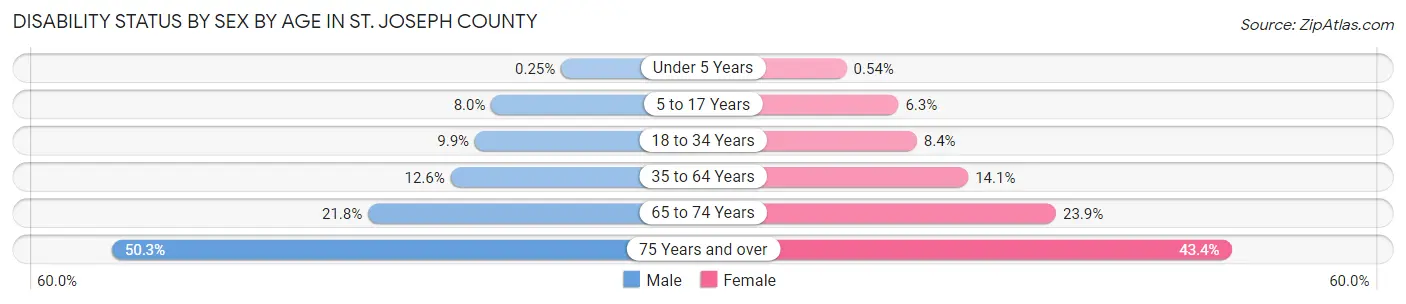
| Age Bracket | Male | Female |
| Under 5 Years | 22 (0.3%) | 44 (0.5%) |
| 5 to 17 Years | 1,899 (8.0%) | 1,422 (6.3%) |
| 18 to 34 Years | 3,264 (9.9%) | 2,856 (8.4%) |
| 35 to 64 Years | 5,960 (12.6%) | 6,904 (14.1%) |
| 65 to 74 Years | 2,649 (21.7%) | 3,235 (23.9%) |
| 75 Years and over | 3,508 (50.3%) | 4,467 (43.4%) |
Disability Class by Sex by Age in St. Joseph County
Disability Class: Hearing Difficulty
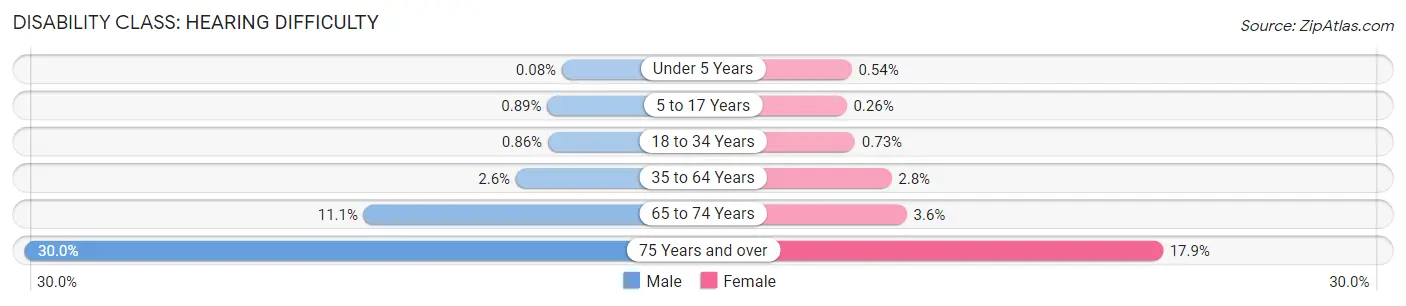
| Age Bracket | Male | Female |
| Under 5 Years | 7 (0.1%) | 44 (0.5%) |
| 5 to 17 Years | 212 (0.9%) | 59 (0.3%) |
| 18 to 34 Years | 284 (0.9%) | 248 (0.7%) |
| 35 to 64 Years | 1,251 (2.6%) | 1,354 (2.8%) |
| 65 to 74 Years | 1,354 (11.1%) | 490 (3.6%) |
| 75 Years and over | 2,091 (30.0%) | 1,840 (17.9%) |
Disability Class: Vision Difficulty
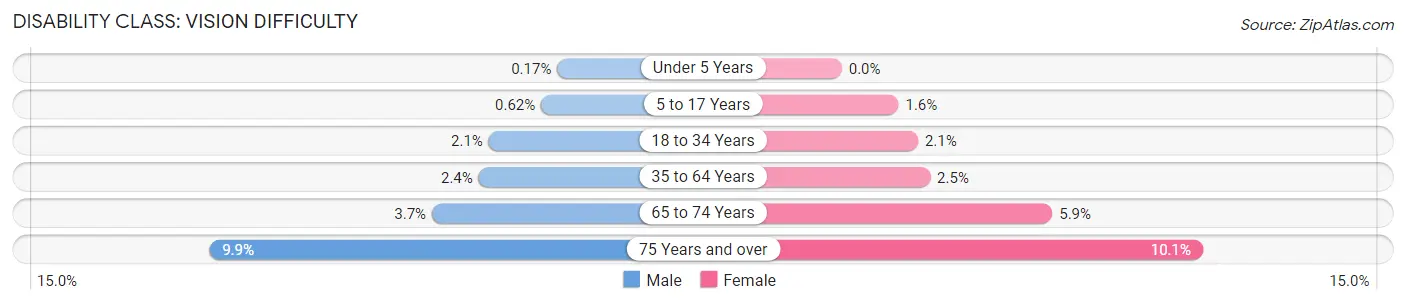
| Age Bracket | Male | Female |
| Under 5 Years | 15 (0.2%) | 0 (0.0%) |
| 5 to 17 Years | 146 (0.6%) | 356 (1.6%) |
| 18 to 34 Years | 689 (2.1%) | 726 (2.1%) |
| 35 to 64 Years | 1,118 (2.4%) | 1,206 (2.5%) |
| 65 to 74 Years | 446 (3.7%) | 795 (5.9%) |
| 75 Years and over | 688 (9.9%) | 1,035 (10.1%) |
Disability Class: Cognitive Difficulty
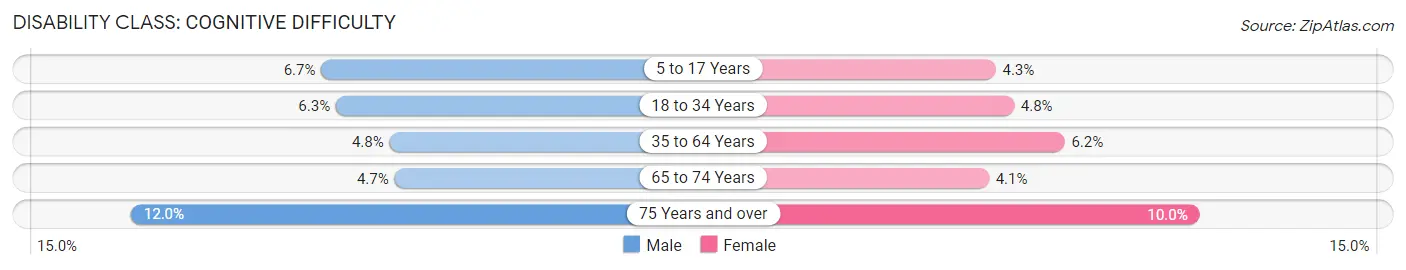
| Age Bracket | Male | Female |
| 5 to 17 Years | 1,597 (6.7%) | 964 (4.3%) |
| 18 to 34 Years | 2,097 (6.3%) | 1,639 (4.8%) |
| 35 to 64 Years | 2,298 (4.8%) | 3,039 (6.2%) |
| 65 to 74 Years | 572 (4.7%) | 554 (4.1%) |
| 75 Years and over | 840 (12.0%) | 1,025 (10.0%) |
Disability Class: Ambulatory Difficulty
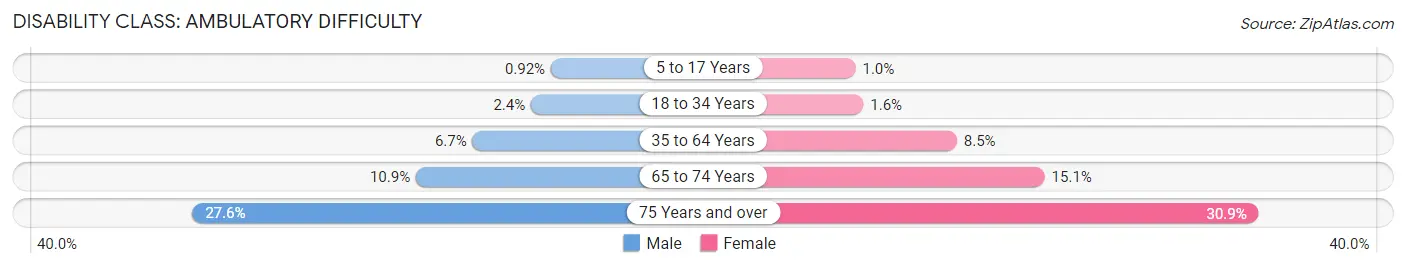
| Age Bracket | Male | Female |
| 5 to 17 Years | 218 (0.9%) | 229 (1.0%) |
| 18 to 34 Years | 795 (2.4%) | 546 (1.6%) |
| 35 to 64 Years | 3,197 (6.7%) | 4,185 (8.5%) |
| 65 to 74 Years | 1,333 (10.9%) | 2,042 (15.1%) |
| 75 Years and over | 1,922 (27.6%) | 3,185 (30.9%) |
Disability Class: Self-Care Difficulty
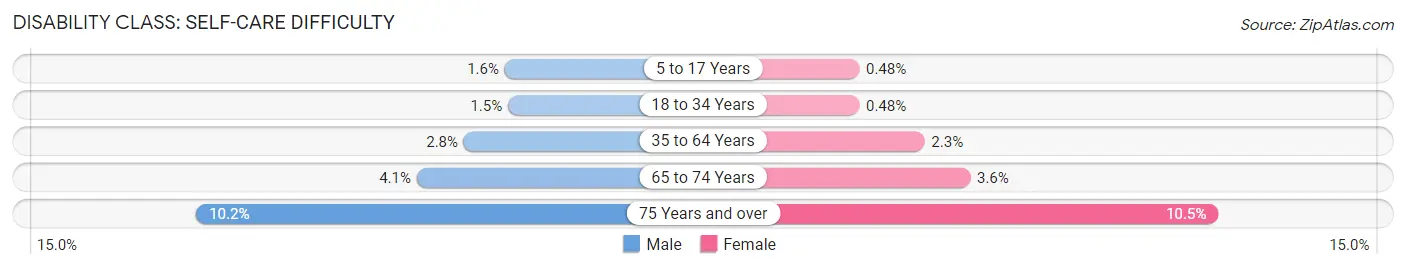
| Age Bracket | Male | Female |
| 5 to 17 Years | 386 (1.6%) | 109 (0.5%) |
| 18 to 34 Years | 511 (1.5%) | 164 (0.5%) |
| 35 to 64 Years | 1,315 (2.8%) | 1,128 (2.3%) |
| 65 to 74 Years | 497 (4.1%) | 484 (3.6%) |
| 75 Years and over | 713 (10.2%) | 1,079 (10.5%) |
Technology Access in St. Joseph County
Computing Device Access in St. Joseph County
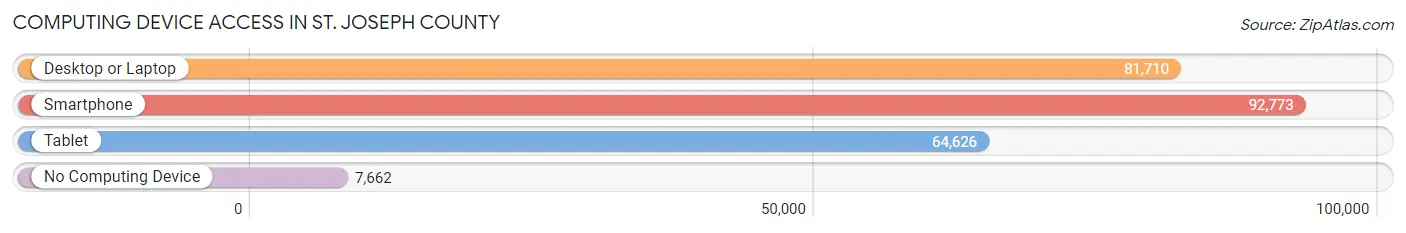
| Device Type | # Households | % Households |
| Desktop or Laptop | 81,710 | 76.0% |
| Smartphone | 92,773 | 86.3% |
| Tablet | 64,626 | 60.1% |
| No Computing Device | 7,662 | 7.1% |
| Total | 107,466 | 100.0% |
Internet Access in St. Joseph County
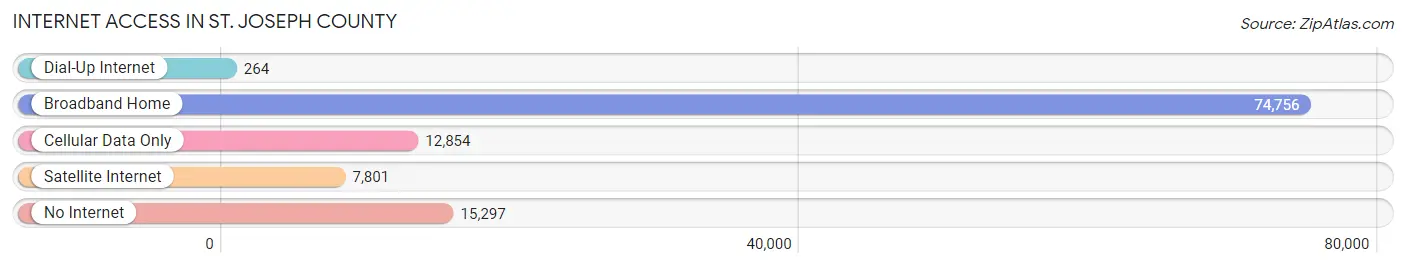
| Internet Type | # Households | % Households |
| Dial-Up Internet | 264 | 0.3% |
| Broadband Home | 74,756 | 69.6% |
| Cellular Data Only | 12,854 | 12.0% |
| Satellite Internet | 7,801 | 7.3% |
| No Internet | 15,297 | 14.2% |
| Total | 107,466 | 100.0% |
St. Joseph County Summary
St. Joseph County, Indiana is located in the northern part of the state and is part of the South Bend-Mishawaka metropolitan area. It is the fourth most populous county in Indiana, with a population of 266,931 in 2019. The county seat is South Bend, the largest city in the county. St. Joseph County is bordered by Elkhart County to the north, Marshall County to the east, LaPorte County to the west, and Starke and LaGrange counties to the south.
Geography
St. Joseph County is located in the northern part of Indiana, in the South Bend-Mishawaka metropolitan area. It is bordered by Elkhart County to the north, Marshall County to the east, LaPorte County to the west, and Starke and LaGrange counties to the south. The county covers an area of 545 square miles, with a population density of 488 people per square mile. The county is mostly flat, with some rolling hills in the northern part. The St. Joseph River runs through the county, and there are several small lakes and ponds.
Economy
St. Joseph County has a diverse economy, with a mix of manufacturing, healthcare, education, and service industries. The county is home to several large employers, including the University of Notre Dame, Memorial Hospital, and AM General. The county also has a strong agricultural sector, with corn, soybeans, and wheat being the main crops.
The county has a strong tourism industry, with several attractions, including the South Bend Chocolate Factory, the Studebaker National Museum, and the Potawatomi Zoo. The county also has several wineries and breweries, as well as a number of golf courses.
Demographics
As of 2019, St. Joseph County had a population of 266,931, making it the fourth most populous county in Indiana. The population is fairly evenly split between men and women, with 50.3% of the population being male and 49.7% being female. The median age of the population is 38.2 years, and the median household income is $60,945.
The racial makeup of the county is 87.2% White, 8.2% Black or African American, 1.2% Asian, 0.3% Native American, 0.1% Pacific Islander, and 2.9% from other races. The largest ancestry groups in the county are German (25.2%), Irish (17.2%), and Polish (13.2%).
Conclusion
St. Joseph County is a diverse county located in the northern part of Indiana. It is home to a mix of manufacturing, healthcare, education, and service industries, as well as a strong agricultural sector. The county has a population of 266,931, with a median age of 38.2 years and a median household income of $60,945. The racial makeup of the county is 87.2% White, 8.2% Black or African American, 1.2% Asian, 0.3% Native American, 0.1% Pacific Islander, and 2.9% from other races. The county also has a strong tourism industry, with several attractions, wineries, breweries, and golf courses.
Common Questions
What is the Total Population of St. Joseph County?
Total Population of St. Joseph County is 272,388.
What is the Total Male Population of St. Joseph County?
Total Male Population of St. Joseph County is 133,435.
What is the Total Female Population of St. Joseph County?
Total Female Population of St. Joseph County is 138,953.
What is the Ratio of Males per 100 Females in St. Joseph County?
There are 96.03 Males per 100 Females in St. Joseph County.
What is the Ratio of Females per 100 Males in St. Joseph County?
There are 104.14 Females per 100 Males in St. Joseph County.
What is the Median Population Age in St. Joseph County?
Median Population Age in St. Joseph County is 36.7 Years.
What is the Average Family Size in St. Joseph County
Average Family Size in St. Joseph County is 3.1 People.
What is the Average Household Size in St. Joseph County
Average Household Size in St. Joseph County is 2.4 People.
What is Per Capita Income in St. Joseph County?
Per Capita income in St. Joseph County is $34,266.
What is the Median Family Income in St. Joseph County?
Median Family Income in St. Joseph County is $80,842.
What is the Median Household income in St. Joseph County?
Median Household Income in St. Joseph County is $61,877.
What is Income or Wage Gap in St. Joseph County?
Income or Wage Gap in St. Joseph County is 33.3%.
Women in St. Joseph County earn 66.7 cents for every dollar earned by a man.
What is Family Income Deficit in St. Joseph County?
Family Income Deficit in St. Joseph County is $11,025.
Families that are below poverty line in St. Joseph County earn $11,025 less on average than the poverty threshold level.
What is Inequality or Gini Index in St. Joseph County?
Inequality or Gini Index in St. Joseph County is 0.47.
How Large is the Labor Force in St. Joseph County?
There are 137,844 People in the Labor Forcein in St. Joseph County.
What is the Percentage of People in the Labor Force in St. Joseph County?
63.8% of People are in the Labor Force in St. Joseph County.
What is the Unemployment Rate in St. Joseph County?
Unemployment Rate in St. Joseph County is 4.8%.