Ripley County, IN
Ripley County Map

Ripley County Overview
28,990
TOTAL POPULATION
14,424
MALE POPULATION
14,566
FEMALE POPULATION
99.03
MALES / 100 FEMALES
100.98
FEMALES / 100 MALES
40.8
MEDIAN AGE
3.1
AVG FAMILY SIZE
2.6
AVG HOUSEHOLD SIZE
$34,578
PER CAPITA INCOME
$91,229
AVG FAMILY INCOME
$70,285
AVG HOUSEHOLD INCOME
28.4%
WAGE / INCOME GAP [ % ]
71.6¢/ $1
WAGE / INCOME GAP [ $ ]
$9,750
FAMILY INCOME DEFICIT
0.44
INEQUALITY / GINI INDEX
15,144
LABOR FORCE [ PEOPLE ]
65.5%
PERCENT IN LABOR FORCE
3.3%
UNEMPLOYMENT RATE
Ripley County Area Codes
Race in Ripley County
The most populous races in Ripley County are White / Caucasian (27,758 | 95.8%), Two or more Races (647 | 2.2%), and Hispanic or Latino (533 | 1.8%).

| Race | # Population | % Population |
| Asian | 204 | 0.7% |
| Black / African American | 97 | 0.3% |
| Hawaiian / Pacific | 0 | 0.0% |
| Hispanic or Latino | 533 | 1.8% |
| Native / Alaskan | 0 | 0.0% |
| White / Caucasian | 27,758 | 95.8% |
| Two or more Races | 647 | 2.2% |
| Some other Race | 284 | 1.0% |
| Total | 28,990 | 100.0% |
Ancestry in Ripley County
The most populous ancestries reported in Ripley County are German (8,394 | 28.9%), American (2,999 | 10.3%), Irish (2,692 | 9.3%), English (2,464 | 8.5%), and European (724 | 2.5%), together accounting for 59.6% of all Ripley County residents.

| Ancestry | # Population | % Population |
| African | 26 | 0.1% |
| American | 2,999 | 10.3% |
| Arab | 3 | 0.0% |
| Armenian | 7 | 0.0% |
| Austrian | 2 | 0.0% |
| Belgian | 5 | 0.0% |
| Bhutanese | 22 | 0.1% |
| Blackfeet | 6 | 0.0% |
| British | 92 | 0.3% |
| Bulgarian | 22 | 0.1% |
| Burmese | 146 | 0.5% |
| Canadian | 7 | 0.0% |
| Central American | 107 | 0.4% |
| Cherokee | 83 | 0.3% |
| Cheyenne | 4 | 0.0% |
| Creek | 10 | 0.0% |
| Cuban | 46 | 0.2% |
| Dutch | 148 | 0.5% |
| Eastern European | 73 | 0.3% |
| English | 2,464 | 8.5% |
| European | 724 | 2.5% |
| French | 545 | 1.9% |
| French Canadian | 9 | 0.0% |
| German | 8,394 | 28.9% |
| Greek | 40 | 0.1% |
| Guatemalan | 12 | 0.0% |
| Honduran | 43 | 0.2% |
| Hungarian | 13 | 0.0% |
| Indian (Asian) | 64 | 0.2% |
| Irish | 2,692 | 9.3% |
| Italian | 557 | 1.9% |
| Korean | 126 | 0.4% |
| Lebanese | 3 | 0.0% |
| Lithuanian | 34 | 0.1% |
| Macedonian | 27 | 0.1% |
| Mexican | 319 | 1.1% |
| Northern European | 8 | 0.0% |
| Norwegian | 23 | 0.1% |
| Pakistani | 84 | 0.3% |
| Panamanian | 8 | 0.0% |
| Pennsylvania German | 33 | 0.1% |
| Polish | 326 | 1.1% |
| Portuguese | 2 | 0.0% |
| Puerto Rican | 51 | 0.2% |
| Romanian | 9 | 0.0% |
| Salvadoran | 44 | 0.2% |
| Scandinavian | 11 | 0.0% |
| Scotch-Irish | 162 | 0.6% |
| Scottish | 452 | 1.6% |
| South American | 10 | 0.0% |
| Sri Lankan | 46 | 0.2% |
| Subsaharan African | 26 | 0.1% |
| Swedish | 30 | 0.1% |
| Swiss | 77 | 0.3% |
| Thai | 5 | 0.0% |
| Venezuelan | 10 | 0.0% |
| Welsh | 74 | 0.3% | View All 57 Rows |
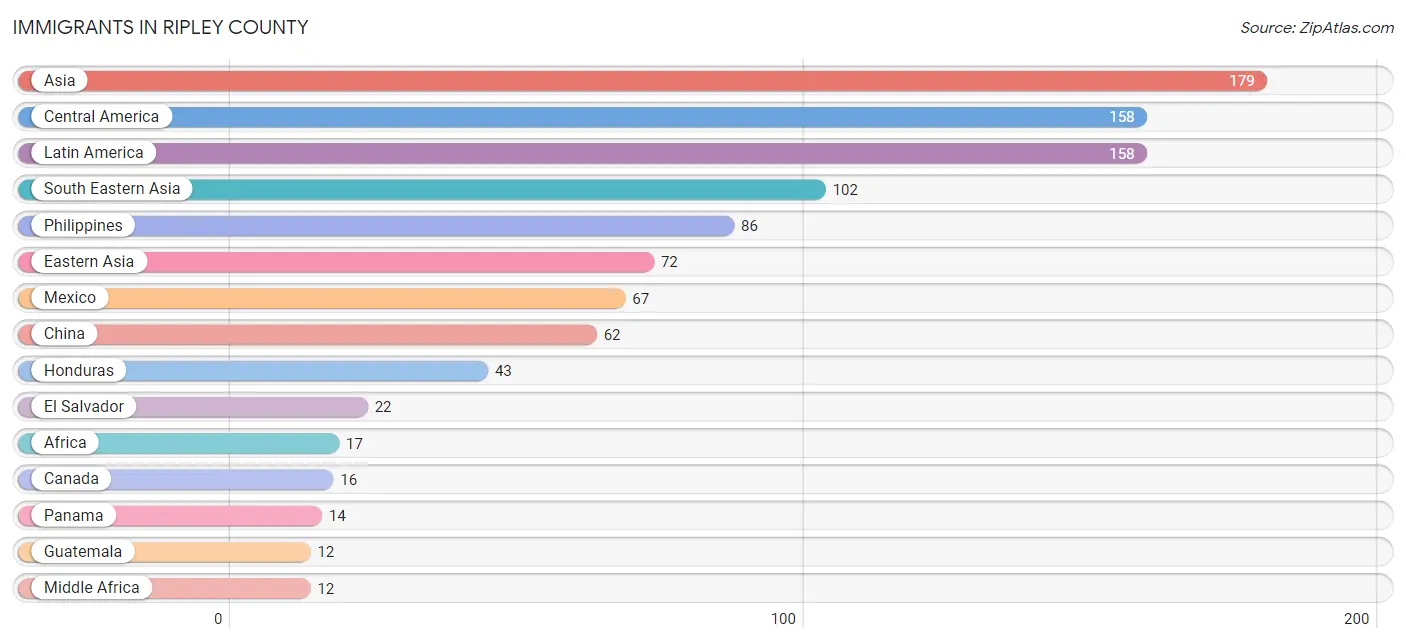
Immigrants in Ripley County
The most numerous immigrant groups reported in Ripley County came from Asia (179 | 0.6%), Central America (158 | 0.5%), Latin America (158 | 0.5%), South Eastern Asia (102 | 0.4%), and Philippines (86 | 0.3%), together accounting for 2.4% of all Ripley County residents.
| Immigration Origin | # Population | % Population |
| Africa | 17 | 0.1% |
| Asia | 179 | 0.6% |
| Belgium | 5 | 0.0% |
| Canada | 16 | 0.1% |
| Central America | 158 | 0.5% |
| China | 62 | 0.2% |
| Eastern Asia | 72 | 0.3% |
| El Salvador | 22 | 0.1% |
| England | 1 | 0.0% |
| Europe | 6 | 0.0% |
| Guatemala | 12 | 0.0% |
| Honduras | 43 | 0.2% |
| India | 5 | 0.0% |
| Korea | 10 | 0.0% |
| Latin America | 158 | 0.5% |
| Mexico | 67 | 0.2% |
| Middle Africa | 12 | 0.0% |
| Northern Europe | 1 | 0.0% |
| Panama | 14 | 0.1% |
| Philippines | 86 | 0.3% |
| South Central Asia | 5 | 0.0% |
| South Eastern Asia | 102 | 0.4% |
| Western Europe | 5 | 0.0% |
| Zaire | 12 | 0.0% | View All 24 Rows |
Sex and Age in Ripley County
Sex and Age in Ripley County
The most populous age groups in Ripley County are 10 to 14 Years (1,216 | 8.4%) for men and 10 to 14 Years (1,036 | 7.1%) for women.

| Age Bracket | Male | Female |
| Under 5 Years | 907 (6.3%) | 840 (5.8%) |
| 5 to 9 Years | 781 (5.4%) | 728 (5.0%) |
| 10 to 14 Years | 1,216 (8.4%) | 1,036 (7.1%) |
| 15 to 19 Years | 1,099 (7.6%) | 933 (6.4%) |
| 20 to 24 Years | 920 (6.4%) | 792 (5.4%) |
| 25 to 29 Years | 855 (5.9%) | 867 (5.9%) |
| 30 to 34 Years | 785 (5.4%) | 731 (5.0%) |
| 35 to 39 Years | 812 (5.6%) | 870 (6.0%) |
| 40 to 44 Years | 854 (5.9%) | 789 (5.4%) |
| 45 to 49 Years | 873 (6.0%) | 954 (6.6%) |
| 50 to 54 Years | 989 (6.9%) | 1,026 (7.0%) |
| 55 to 59 Years | 1,003 (7.0%) | 1,035 (7.1%) |
| 60 to 64 Years | 958 (6.6%) | 1,007 (6.9%) |
| 65 to 69 Years | 887 (6.1%) | 850 (5.8%) |
| 70 to 74 Years | 578 (4.0%) | 779 (5.3%) |
| 75 to 79 Years | 439 (3.0%) | 435 (3.0%) |
| 80 to 84 Years | 319 (2.2%) | 486 (3.3%) |
| 85 Years and over | 149 (1.0%) | 408 (2.8%) |
| Total | 14,424 (100.0%) | 14,566 (100.0%) |
Families and Households in Ripley County
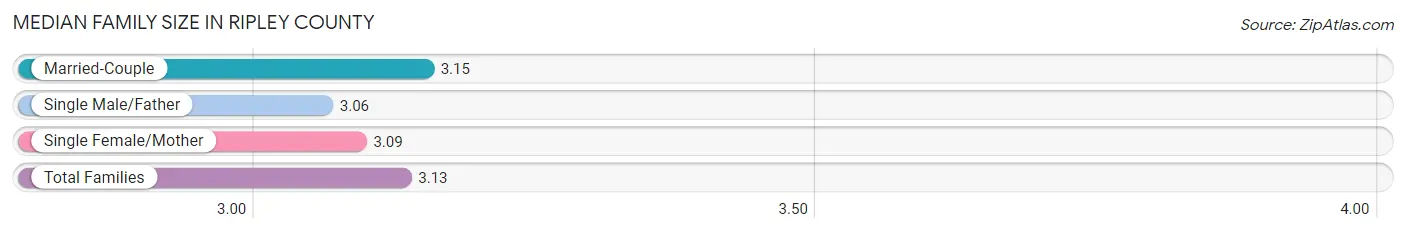
Median Family Size in Ripley County
The median family size in Ripley County is 3.13 persons per family, with married-couple families (5,931 | 78.7%) accounting for the largest median family size of 3.15 persons per family. On the other hand, single male/father families (604 | 8.0%) represent the smallest median family size with 3.06 persons per family.
| Family Type | # Families | Family Size |
| Married-Couple | 5,931 (78.7%) | 3.15 |
| Single Male/Father | 604 (8.0%) | 3.06 |
| Single Female/Mother | 999 (13.3%) | 3.09 |
| Total Families | 7,534 (100.0%) | 3.13 |
Median Household Size in Ripley County
The median household size in Ripley County is 2.56 persons per household, with single male/father households (604 | 5.4%) accounting for the largest median household size of 3.58 persons per household. non-family households (3,580 | 32.2%) represent the smallest median household size with 1.19 persons per household.

| Household Type | # Households | Household Size |
| Married-Couple | 5,931 (53.4%) | 3.17 |
| Single Male/Father | 604 (5.4%) | 3.58 |
| Single Female/Mother | 999 (9.0%) | 3.26 |
| Non-family | 3,580 (32.2%) | 1.19 |
| Total Households | 11,114 (100.0%) | 2.56 |
Household Size by Marriage Status in Ripley County
Out of a total of 11,114 households in Ripley County, 7,534 (67.8%) are family households, while 3,580 (32.2%) are nonfamily households. The most numerous type of family households are 2-person households, comprising 3,826, and the most common type of nonfamily households are 1-person households, comprising 2,966.

| Household Size | Family Households | Nonfamily Households |
| 1-Person Households | - | 2,966 (26.7%) |
| 2-Person Households | 3,826 (34.4%) | 583 (5.2%) |
| 3-Person Households | 1,405 (12.6%) | 17 (0.2%) |
| 4-Person Households | 1,242 (11.2%) | 4 (0.0%) |
| 5-Person Households | 712 (6.4%) | 10 (0.1%) |
| 6-Person Households | 267 (2.4%) | 0 (0.0%) |
| 7+ Person Households | 82 (0.7%) | 0 (0.0%) |
| Total | 7,534 (67.8%) | 3,580 (32.2%) |
Female Fertility in Ripley County
Fertility by Age in Ripley County
Average fertility rate in Ripley County is 61.0 births per 1,000 women. Women in the age bracket of 20 to 34 years have the highest fertility rate with 135.0 births per 1,000 women. Women in the age bracket of 20 to 34 years acount for 86.8% of all women with births.

| Age Bracket | Women with Births | Births / 1,000 Women |
| 15 to 19 years | 0 (0.0%) | 0.0 |
| 20 to 34 years | 323 (86.8%) | 135.0 |
| 35 to 50 years | 49 (13.2%) | 18.0 |
| Total | 372 (100.0%) | 61.0 |
Fertility by Age by Marriage Status in Ripley County
84.4% of women with births (372) in Ripley County are married. The highest percentage of unmarried women with births falls into 20 to 34 years age bracket with 15.8% of them unmarried at the time of birth, while the lowest percentage of unmarried women with births belong to 35 to 50 years age bracket with 14.3% of them unmarried.

| Age Bracket | Married | Unmarried |
| 15 to 19 years | 0 (0.0%) | 0 (0.0%) |
| 20 to 34 years | 272 (84.2%) | 51 (15.8%) |
| 35 to 50 years | 42 (85.7%) | 7 (14.3%) |
| Total | 314 (84.4%) | 58 (15.6%) |
Fertility by Education in Ripley County
Average fertility rate in Ripley County is 61.0 births per 1,000 women. Women with the education attainment of high school diploma have the highest fertility rate of 86.0 births per 1,000 women, while women with the education attainment of less than high school have the lowest fertility at 6.0 births per 1,000 women. Women with the education attainment of high school diploma represent 46.0% of all women with births.

| Educational Attainment | Women with Births | Births / 1,000 Women |
| Less than High School | 6 (1.6%) | 6.0 |
| High School Diploma | 171 (46.0%) | 86.0 |
| College or Associate's Degree | 150 (40.3%) | 80.0 |
| Bachelor's Degree | 22 (5.9%) | 29.0 |
| Graduate Degree | 23 (6.2%) | 48.0 |
| Total | 372 (100.0%) | 61.0 |
Fertility by Education by Marriage Status in Ripley County
15.6% of women with births in Ripley County are unmarried. Women with the educational attainment of bachelor's degree are most likely to be married with 100.0% of them married at childbirth, while women with the educational attainment of less than high school are least likely to be married with 66.7% of them unmarried at childbirth.

| Educational Attainment | Married | Unmarried |
| Less than High School | 2 (33.3%) | 4 (66.7%) |
| High School Diploma | 124 (72.5%) | 47 (27.5%) |
| College or Associate's Degree | 143 (95.3%) | 7 (4.7%) |
| Bachelor's Degree | 22 (100.0%) | 0 (0.0%) |
| Graduate Degree | 23 (100.0%) | 0 (0.0%) |
| Total | 314 (84.4%) | 58 (15.6%) |
Income in Ripley County
Income Overview in Ripley County
Per Capita Income in Ripley County is $34,578, while median incomes of families and households are $91,229 and $70,285 respectively.
| Characteristic | Number | Measure |
| Per Capita Income | 28,990 | $34,578 |
| Median Family Income | 7,534 | $91,229 |
| Mean Family Income | 7,534 | $105,657 |
| Median Household Income | 11,114 | $70,285 |
| Mean Household Income | 11,114 | $88,962 |
| Income Deficit | 7,534 | $9,750 |
| Wage / Income Gap (%) | 28,990 | 28.35% |
| Wage / Income Gap ($) | 28,990 | 71.65¢ per $1 |
| Gini / Inequality Index | 28,990 | 0.44 |
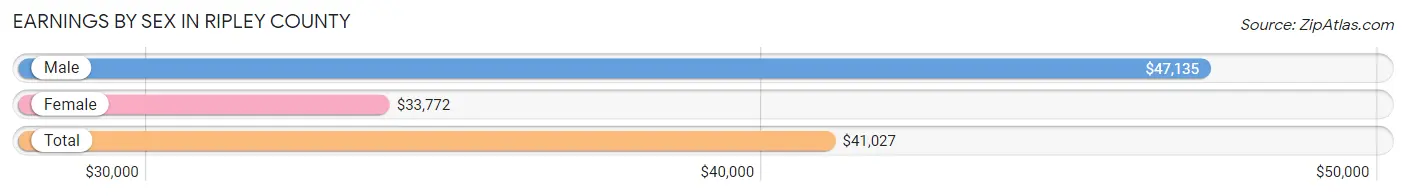
Earnings by Sex in Ripley County
Average Earnings in Ripley County are $41,027, $47,135 for men and $33,772 for women, a difference of 28.3%.
| Sex | Number | Average Earnings |
| Male | 8,208 (52.0%) | $47,135 |
| Female | 7,582 (48.0%) | $33,772 |
| Total | 15,790 (100.0%) | $41,027 |
Earnings by Sex by Income Bracket in Ripley County
The most common earnings brackets in Ripley County are $75,000 to $99,999 for men (1,181 | 14.4%) and $30,000 to $34,999 for women (710 | 9.4%).

| Income | Male | Female |
| $2,499 or less | 429 (5.2%) | 431 (5.7%) |
| $2,500 to $4,999 | 85 (1.0%) | 247 (3.3%) |
| $5,000 to $7,499 | 340 (4.1%) | 267 (3.5%) |
| $7,500 to $9,999 | 281 (3.4%) | 406 (5.3%) |
| $10,000 to $12,499 | 180 (2.2%) | 139 (1.8%) |
| $12,500 to $14,999 | 92 (1.1%) | 257 (3.4%) |
| $15,000 to $17,499 | 106 (1.3%) | 283 (3.7%) |
| $17,500 to $19,999 | 87 (1.1%) | 269 (3.5%) |
| $20,000 to $22,499 | 255 (3.1%) | 261 (3.4%) |
| $22,500 to $24,999 | 177 (2.2%) | 322 (4.3%) |
| $25,000 to $29,999 | 330 (4.0%) | 364 (4.8%) |
| $30,000 to $34,999 | 410 (5.0%) | 710 (9.4%) |
| $35,000 to $39,999 | 357 (4.3%) | 511 (6.7%) |
| $40,000 to $44,999 | 548 (6.7%) | 603 (8.0%) |
| $45,000 to $49,999 | 731 (8.9%) | 443 (5.8%) |
| $50,000 to $54,999 | 471 (5.7%) | 481 (6.3%) |
| $55,000 to $64,999 | 840 (10.2%) | 479 (6.3%) |
| $65,000 to $74,999 | 482 (5.9%) | 444 (5.9%) |
| $75,000 to $99,999 | 1,181 (14.4%) | 381 (5.0%) |
| $100,000+ | 826 (10.1%) | 284 (3.7%) |
| Total | 8,208 (100.0%) | 7,582 (100.0%) |
Earnings by Sex by Educational Attainment in Ripley County
Average earnings in Ripley County are $53,906 for men and $38,055 for women, a difference of 29.4%. Men with an educational attainment of graduate degree enjoy the highest average annual earnings of $110,515, while those with less than high school education earn the least with $35,592. Women with an educational attainment of graduate degree earn the most with the average annual earnings of $70,357, while those with less than high school education have the smallest earnings of $23,214.

| Educational Attainment | Male Income | Female Income |
| Less than High School | $35,592 | $23,214 |
| High School Diploma | $49,787 | $30,899 |
| College or Associate's Degree | $53,404 | $37,960 |
| Bachelor's Degree | $75,000 | $47,667 |
| Graduate Degree | $110,515 | $70,357 |
| Total | $53,906 | $38,055 |
Family Income in Ripley County
Family Income Brackets in Ripley County
According to the Ripley County family income data, there are 2,042 families falling into the $100,000 to $149,999 income range, which is the most common income bracket and makes up 27.1% of all families. Conversely, the $10,000 to $14,999 income bracket is the least frequent group with only 60 families (0.8%) belonging to this category.

| Income Bracket | # Families | % Families |
| Less than $10,000 | 316 | 4.2% |
| $10,000 to $14,999 | 60 | 0.8% |
| $15,000 to $24,999 | 301 | 4.0% |
| $25,000 to $34,999 | 301 | 4.0% |
| $35,000 to $49,999 | 671 | 8.9% |
| $50,000 to $74,999 | 1,431 | 19.0% |
| $75,000 to $99,999 | 1,153 | 15.3% |
| $100,000 to $149,999 | 2,042 | 27.1% |
| $150,000 to $199,999 | 768 | 10.2% |
| $200,000+ | 490 | 6.5% |
Family Income by Famaliy Size in Ripley County
7+ person families (77 | 1.0%) account for the highest median family income in Ripley County with $137,266 per family, while 2-person families (3,958 | 52.5%) have the highest median income of $38,203 per family member.

| Income Bracket | # Families | Median Income |
| 2-Person Families | 3,958 (52.5%) | $76,406 |
| 3-Person Families | 1,485 (19.7%) | $104,648 |
| 4-Person Families | 1,175 (15.6%) | $105,313 |
| 5-Person Families | 626 (8.3%) | $95,909 |
| 6-Person Families | 213 (2.8%) | $104,028 |
| 7+ Person Families | 77 (1.0%) | $137,266 |
| Total | 7,534 (100.0%) | $91,229 |
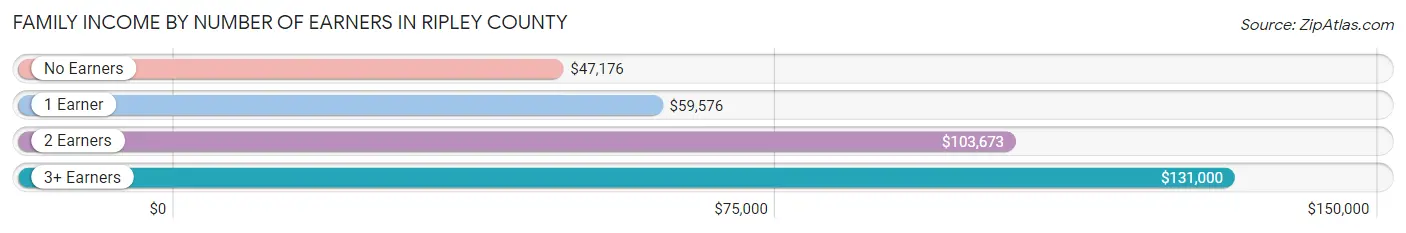
Family Income by Number of Earners in Ripley County
The median family income in Ripley County is $91,229, with families comprising 3+ earners (994) having the highest median family income of $131,000, while families with no earners (1,070) have the lowest median family income of $47,176, accounting for 13.2% and 14.2% of families, respectively.
| Number of Earners | # Families | Median Income |
| No Earners | 1,070 (14.2%) | $47,176 |
| 1 Earner | 1,877 (24.9%) | $59,576 |
| 2 Earners | 3,593 (47.7%) | $103,673 |
| 3+ Earners | 994 (13.2%) | $131,000 |
| Total | 7,534 (100.0%) | $91,229 |
Household Income in Ripley County
Household Income Brackets in Ripley County
With 2,278 households falling in the category, the $100,000 to $149,999 income range is the most frequent in Ripley County, accounting for 20.5% of all households. In contrast, only 500 households (4.5%) fall into the $10,000 to $14,999 income bracket, making it the least populous group.

| Income Bracket | # Households | % Households |
| Less than $10,000 | 578 | 5.2% |
| $10,000 to $14,999 | 500 | 4.5% |
| $15,000 to $24,999 | 800 | 7.2% |
| $25,000 to $34,999 | 811 | 7.3% |
| $35,000 to $49,999 | 1,256 | 11.3% |
| $50,000 to $74,999 | 1,956 | 17.6% |
| $75,000 to $99,999 | 1,523 | 13.7% |
| $100,000 to $149,999 | 2,278 | 20.5% |
| $150,000 to $199,999 | 845 | 7.6% |
| $200,000+ | 545 | 4.9% |
Household Income by Householder Age in Ripley County
The median household income in Ripley County is $70,285, with the highest median household income of $92,574 found in the 45 to 64 years age bracket for the primary householder. A total of 4,506 households (40.5%) fall into this category. Meanwhile, the 15 to 24 years age bracket for the primary householder has the lowest median household income of $36,979, with 483 households (4.3%) in this group.

| Income Bracket | # Households | Median Income |
| 15 to 24 Years | 483 (4.3%) | $36,979 |
| 25 to 44 Years | 3,013 (27.1%) | $83,301 |
| 45 to 64 Years | 4,506 (40.5%) | $92,574 |
| 65+ Years | 3,112 (28.0%) | $44,167 |
| Total | 11,114 (100.0%) | $70,285 |
Poverty in Ripley County
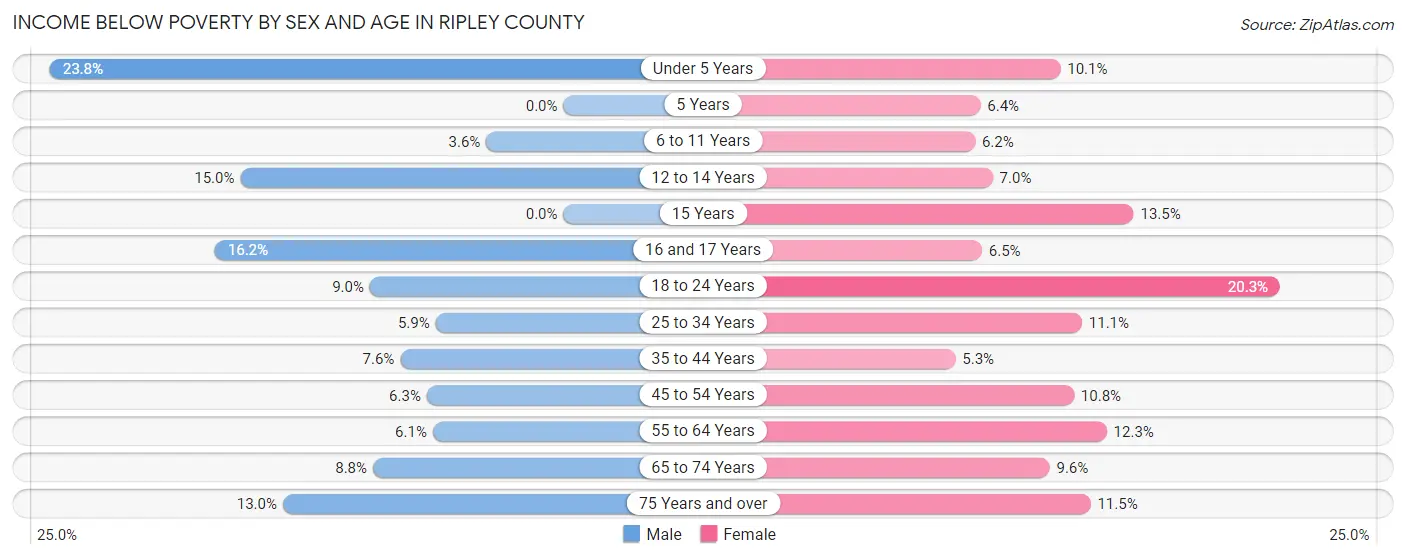
Income Below Poverty by Sex and Age in Ripley County
With 8.8% poverty level for males and 10.4% for females among the residents of Ripley County, under 5 year old males and 18 to 24 year old females are the most vulnerable to poverty, with 213 males (23.8%) and 221 females (20.3%) in their respective age groups living below the poverty level.
| Age Bracket | Male | Female |
| Under 5 Years | 213 (23.8%) | 81 (10.1%) |
| 5 Years | 0 (0.0%) | 9 (6.4%) |
| 6 to 11 Years | 42 (3.6%) | 57 (6.2%) |
| 12 to 14 Years | 107 (15.0%) | 49 (7.0%) |
| 15 Years | 0 (0.0%) | 26 (13.5%) |
| 16 and 17 Years | 81 (16.2%) | 29 (6.5%) |
| 18 to 24 Years | 120 (9.0%) | 221 (20.3%) |
| 25 to 34 Years | 95 (5.9%) | 178 (11.1%) |
| 35 to 44 Years | 125 (7.6%) | 87 (5.3%) |
| 45 to 54 Years | 117 (6.3%) | 213 (10.8%) |
| 55 to 64 Years | 115 (6.1%) | 250 (12.3%) |
| 65 to 74 Years | 127 (8.8%) | 150 (9.6%) |
| 75 Years and over | 110 (13.0%) | 136 (11.5%) |
| Total | 1,252 (8.8%) | 1,486 (10.4%) |
Income Above Poverty by Sex and Age in Ripley County
According to the poverty statistics in Ripley County, males aged 5 years and females aged 35 to 44 years are the age groups that are most secure financially, with 100.0% of males and 94.7% of females in these age groups living above the poverty line.

| Age Bracket | Male | Female |
| Under 5 Years | 681 (76.2%) | 718 (89.9%) |
| 5 Years | 106 (100.0%) | 131 (93.6%) |
| 6 to 11 Years | 1,131 (96.4%) | 865 (93.8%) |
| 12 to 14 Years | 607 (85.0%) | 651 (93.0%) |
| 15 Years | 169 (100.0%) | 166 (86.5%) |
| 16 and 17 Years | 420 (83.8%) | 417 (93.5%) |
| 18 to 24 Years | 1,216 (91.0%) | 866 (79.7%) |
| 25 to 34 Years | 1,506 (94.1%) | 1,420 (88.9%) |
| 35 to 44 Years | 1,526 (92.4%) | 1,565 (94.7%) |
| 45 to 54 Years | 1,728 (93.7%) | 1,764 (89.2%) |
| 55 to 64 Years | 1,783 (93.9%) | 1,784 (87.7%) |
| 65 to 74 Years | 1,310 (91.2%) | 1,406 (90.4%) |
| 75 Years and over | 735 (87.0%) | 1,043 (88.5%) |
| Total | 12,918 (91.2%) | 12,796 (89.6%) |
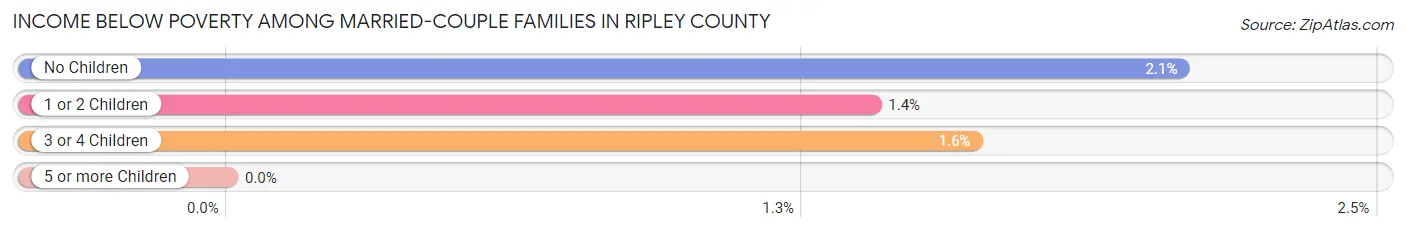
Income Below Poverty Among Married-Couple Families in Ripley County
The poverty statistics for married-couple families in Ripley County show that 1.8% or 109 of the total 5,931 families live below the poverty line. Families with no children have the highest poverty rate of 2.1%, comprising of 78 families. On the other hand, families with 5 or more children have the lowest poverty rate of 0.0%, which includes 0 families.
| Children | Above Poverty | Below Poverty |
| No Children | 3,695 (97.9%) | 78 (2.1%) |
| 1 or 2 Children | 1,548 (98.6%) | 22 (1.4%) |
| 3 or 4 Children | 547 (98.4%) | 9 (1.6%) |
| 5 or more Children | 32 (100.0%) | 0 (0.0%) |
| Total | 5,822 (98.2%) | 109 (1.8%) |
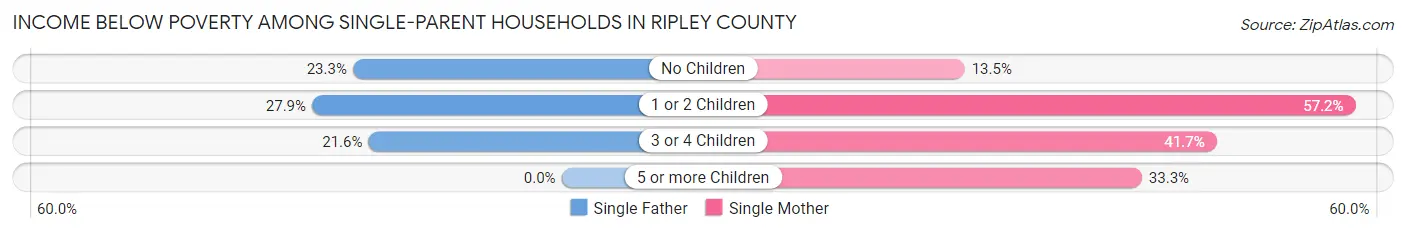
Income Below Poverty Among Single-Parent Households in Ripley County
According to the poverty data in Ripley County, 25.2% or 152 single-father households and 36.5% or 365 single-mother households are living below the poverty line. Among single-father households, those with 1 or 2 children have the highest poverty rate, with 77 households (27.9%) experiencing poverty. Likewise, among single-mother households, those with 1 or 2 children have the highest poverty rate, with 247 households (57.2%) falling below the poverty line.
| Children | Single Father | Single Mother |
| No Children | 56 (23.3%) | 56 (13.5%) |
| 1 or 2 Children | 77 (27.9%) | 247 (57.2%) |
| 3 or 4 Children | 19 (21.6%) | 55 (41.7%) |
| 5 or more Children | 0 (0.0%) | 7 (33.3%) |
| Total | 152 (25.2%) | 365 (36.5%) |
Income Below Poverty Among Married-Couple vs Single-Parent Households in Ripley County
The poverty data for Ripley County shows that 109 of the married-couple family households (1.8%) and 517 of the single-parent households (32.3%) are living below the poverty level. Within the married-couple family households, those with no children have the highest poverty rate, with 78 households (2.1%) falling below the poverty line. Among the single-parent households, those with 1 or 2 children have the highest poverty rate, with 324 household (45.8%) living below poverty.

| Children | Married-Couple Families | Single-Parent Households |
| No Children | 78 (2.1%) | 112 (17.1%) |
| 1 or 2 Children | 22 (1.4%) | 324 (45.8%) |
| 3 or 4 Children | 9 (1.6%) | 74 (33.6%) |
| 5 or more Children | 0 (0.0%) | 7 (33.3%) |
| Total | 109 (1.8%) | 517 (32.3%) |
Employment Characteristics in Ripley County
Employment by Class of Employer in Ripley County
Among the 14,452 employed individuals in Ripley County, private company employees (10,036 | 69.4%), not-for-profit organizations (1,125 | 7.8%), and local government employees (1,059 | 7.3%) make up the most common classes of employment.

| Employer Class | # Employees | % Employees |
| Private Company Employees | 10,036 | 69.4% |
| Self-Employed (Incorporated) | 604 | 4.2% |
| Self-Employed (Not Incorporated) | 996 | 6.9% |
| Not-for-profit Organizations | 1,125 | 7.8% |
| Local Government Employees | 1,059 | 7.3% |
| State Government Employees | 409 | 2.8% |
| Federal Government Employees | 130 | 0.9% |
| Unpaid Family Workers | 93 | 0.6% |
| Total | 14,452 | 100.0% |
Employment Status by Age in Ripley County
According to the labor force statistics for Ripley County, out of the total population over 16 years of age (23,121), 65.5% or 15,144 individuals are in the labor force, with 3.3% or 500 of them unemployed. The age group with the highest labor force participation rate is 35 to 44 years, with 90.5% or 3,009 individuals in the labor force. Within the labor force, the 16 to 19 years age range has the highest percentage of unemployed individuals, with 14.7% or 143 of them being unemployed.

| Age Bracket | In Labor Force | Unemployed |
| 16 to 19 Years | 976 (58.4%) | 143 (14.7%) |
| 20 to 24 Years | 1,513 (88.4%) | 61 (4.0%) |
| 25 to 29 Years | 1,441 (83.7%) | 138 (9.6%) |
| 30 to 34 Years | 1,267 (83.6%) | 41 (3.2%) |
| 35 to 44 Years | 3,009 (90.5%) | 48 (1.6%) |
| 45 to 54 Years | 3,116 (81.1%) | 37 (1.2%) |
| 55 to 59 Years | 1,425 (69.9%) | 19 (1.3%) |
| 60 to 64 Years | 1,226 (62.4%) | 11 (0.9%) |
| 65 to 74 Years | 987 (31.9%) | 11 (1.1%) |
| 75 Years and over | 183 (8.2%) | 0 (0.0%) |
| Total | 15,144 (65.5%) | 500 (3.3%) |
Employment Status by Educational Attainment in Ripley County
According to labor force statistics for Ripley County, 79.7% of individuals (11,483) out of the total population between 25 and 64 years of age (14,408) are in the labor force, with 2.5% or 287 of them being unemployed. The group with the highest labor force participation rate are those with the educational attainment of bachelor's degree or higher, with 86.2% or 2,521 individuals in the labor force. Within the labor force, individuals with less than high school education have the highest percentage of unemployment, with 5.1% or 31 of them being unemployed.

| Educational Attainment | In Labor Force | Unemployed |
| Less than High School | 610 (56.1%) | 55 (5.1%) |
| High School Diploma | 4,515 (77.8%) | 186 (3.2%) |
| College / Associate Degree | 3,835 (83.5%) | 106 (2.3%) |
| Bachelor's Degree or higher | 2,521 (86.2%) | 35 (1.2%) |
| Total | 11,483 (79.7%) | 360 (2.5%) |
Employment Occupations by Sex in Ripley County
Management, Business, Science and Arts Occupations
The most common Management, Business, Science and Arts occupations in Ripley County are Management (1,309 | 8.9%), Community & Social Service (1,144 | 7.8%), Health Diagnosing & Treating (917 | 6.3%), Education Instruction & Library (775 | 5.3%), and Health Technologists (613 | 4.2%).

Management, Business, Science and Arts Occupations by Sex
Within the Management, Business, Science and Arts occupations in Ripley County, the most male-oriented occupations are Architecture & Engineering (95.5%), Computers, Engineering & Science (78.3%), and Computers & Mathematics (72.5%), while the most female-oriented occupations are Health Diagnosing & Treating (86.5%), Education, Arts & Media (85.5%), and Health Technologists (82.1%).
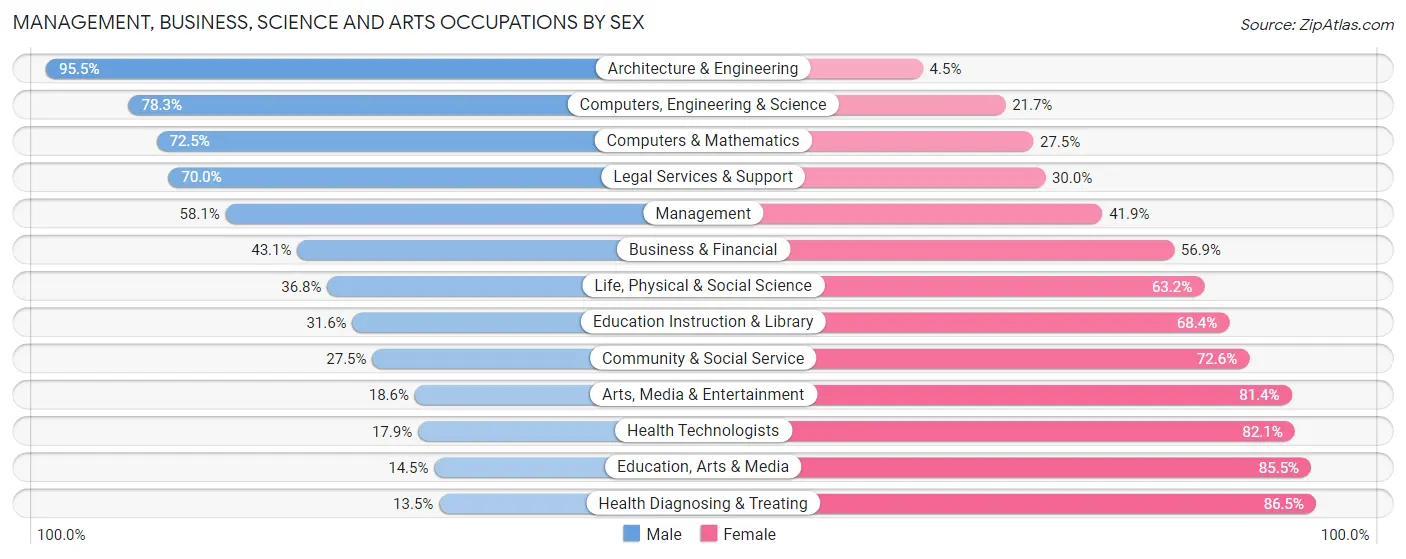
| Occupation | Male | Female |
| Management | 760 (58.1%) | 549 (41.9%) |
| Business & Financial | 213 (43.1%) | 281 (56.9%) |
| Computers, Engineering & Science | 350 (78.3%) | 97 (21.7%) |
| Computers & Mathematics | 137 (72.5%) | 52 (27.5%) |
| Architecture & Engineering | 192 (95.5%) | 9 (4.5%) |
| Life, Physical & Social Science | 21 (36.8%) | 36 (63.2%) |
| Community & Social Service | 314 (27.5%) | 830 (72.6%) |
| Education, Arts & Media | 17 (14.5%) | 100 (85.5%) |
| Legal Services & Support | 7 (70.0%) | 3 (30.0%) |
| Education Instruction & Library | 245 (31.6%) | 530 (68.4%) |
| Arts, Media & Entertainment | 45 (18.6%) | 197 (81.4%) |
| Health Diagnosing & Treating | 124 (13.5%) | 793 (86.5%) |
| Health Technologists | 110 (17.9%) | 503 (82.1%) |
| Total (Category) | 1,761 (40.8%) | 2,550 (59.2%) |
| Total (Overall) | 7,671 (52.4%) | 6,957 (47.6%) |
Services Occupations
The most common Services occupations in Ripley County are Food Preparation & Serving (789 | 5.4%), Healthcare Support (479 | 3.3%), Personal Care & Service (428 | 2.9%), Cleaning & Maintenance (354 | 2.4%), and Security & Protection (289 | 2.0%).

Services Occupations by Sex
Within the Services occupations in Ripley County, the most male-oriented occupations are Law Enforcement (93.6%), Security & Protection (67.8%), and Cleaning & Maintenance (52.8%), while the most female-oriented occupations are Healthcare Support (86.4%), Personal Care & Service (74.5%), and Food Preparation & Serving (59.3%).

| Occupation | Male | Female |
| Healthcare Support | 65 (13.6%) | 414 (86.4%) |
| Security & Protection | 196 (67.8%) | 93 (32.2%) |
| Firefighting & Prevention | 93 (52.0%) | 86 (48.0%) |
| Law Enforcement | 103 (93.6%) | 7 (6.4%) |
| Food Preparation & Serving | 321 (40.7%) | 468 (59.3%) |
| Cleaning & Maintenance | 187 (52.8%) | 167 (47.2%) |
| Personal Care & Service | 109 (25.5%) | 319 (74.5%) |
| Total (Category) | 878 (37.5%) | 1,461 (62.5%) |
| Total (Overall) | 7,671 (52.4%) | 6,957 (47.6%) |
Sales and Office Occupations
The most common Sales and Office occupations in Ripley County are Office & Administration (1,638 | 11.2%), and Sales & Related (859 | 5.9%).
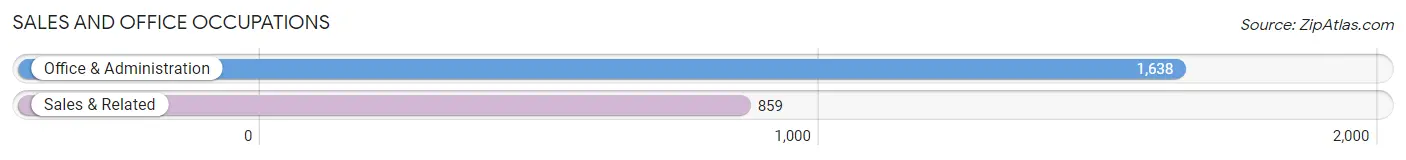
Sales and Office Occupations by Sex

| Occupation | Male | Female |
| Sales & Related | 423 (49.2%) | 436 (50.8%) |
| Office & Administration | 277 (16.9%) | 1,361 (83.1%) |
| Total (Category) | 700 (28.0%) | 1,797 (72.0%) |
| Total (Overall) | 7,671 (52.4%) | 6,957 (47.6%) |
Natural Resources, Construction and Maintenance Occupations
The most common Natural Resources, Construction and Maintenance occupations in Ripley County are Construction & Extraction (1,185 | 8.1%), Installation, Maintenance & Repair (562 | 3.8%), and Farming, Fishing & Forestry (163 | 1.1%).

Natural Resources, Construction and Maintenance Occupations by Sex

| Occupation | Male | Female |
| Farming, Fishing & Forestry | 78 (47.8%) | 85 (52.1%) |
| Construction & Extraction | 1,185 (100.0%) | 0 (0.0%) |
| Installation, Maintenance & Repair | 562 (100.0%) | 0 (0.0%) |
| Total (Category) | 1,825 (95.6%) | 85 (4.4%) |
| Total (Overall) | 7,671 (52.4%) | 6,957 (47.6%) |
Production, Transportation and Moving Occupations
The most common Production, Transportation and Moving occupations in Ripley County are Production (2,101 | 14.4%), Transportation (740 | 5.1%), and Material Moving (730 | 5.0%).

Production, Transportation and Moving Occupations by Sex

| Occupation | Male | Female |
| Production | 1,324 (63.0%) | 777 (37.0%) |
| Transportation | 608 (82.2%) | 132 (17.8%) |
| Material Moving | 575 (78.8%) | 155 (21.2%) |
| Total (Category) | 2,507 (70.2%) | 1,064 (29.8%) |
| Total (Overall) | 7,671 (52.4%) | 6,957 (47.6%) |
Employment Industries by Sex in Ripley County
Employment Industries in Ripley County
The major employment industries in Ripley County include Manufacturing (3,461 | 23.7%), Health Care & Social Assistance (2,004 | 13.7%), Retail Trade (1,400 | 9.6%), Construction (1,302 | 8.9%), and Educational Services (1,212 | 8.3%).

Employment Industries by Sex in Ripley County
The Ripley County industries that see more men than women are Construction (97.0%), Mining, Quarrying, & Extraction (87.8%), and Transportation & Warehousing (74.8%), whereas the industries that tend to have a higher number of women are Enterprise Management (100.0%), Health Care & Social Assistance (86.3%), and Finance & Insurance (84.5%).

| Industry | Male | Female |
| Agriculture, Fishing & Hunting | 248 (73.4%) | 90 (26.6%) |
| Mining, Quarrying, & Extraction | 130 (87.8%) | 18 (12.2%) |
| Construction | 1,263 (97.0%) | 39 (3.0%) |
| Manufacturing | 2,193 (63.4%) | 1,268 (36.6%) |
| Wholesale Trade | 125 (61.3%) | 79 (38.7%) |
| Retail Trade | 799 (57.1%) | 601 (42.9%) |
| Transportation & Warehousing | 598 (74.8%) | 202 (25.3%) |
| Utilities | 164 (63.3%) | 95 (36.7%) |
| Information | 27 (40.3%) | 40 (59.7%) |
| Finance & Insurance | 72 (15.5%) | 391 (84.5%) |
| Real Estate, Rental & Leasing | 46 (44.7%) | 57 (55.3%) |
| Professional & Scientific | 163 (34.6%) | 308 (65.4%) |
| Enterprise Management | 0 (0.0%) | 41 (100.0%) |
| Administrative & Support | 176 (73.0%) | 65 (27.0%) |
| Educational Services | 342 (28.2%) | 870 (71.8%) |
| Health Care & Social Assistance | 274 (13.7%) | 1,730 (86.3%) |
| Arts, Entertainment & Recreation | 283 (69.7%) | 123 (30.3%) |
| Accommodation & Food Services | 316 (37.2%) | 533 (62.8%) |
| Public Administration | 196 (54.9%) | 161 (45.1%) |
| Total | 7,671 (52.4%) | 6,957 (47.6%) |
Education in Ripley County
School Enrollment in Ripley County
The most common levels of schooling among the 6,148 students in Ripley County are high school (1,911 | 31.1%), middle school (1,700 | 27.7%), and elementary school (1,344 | 21.9%).
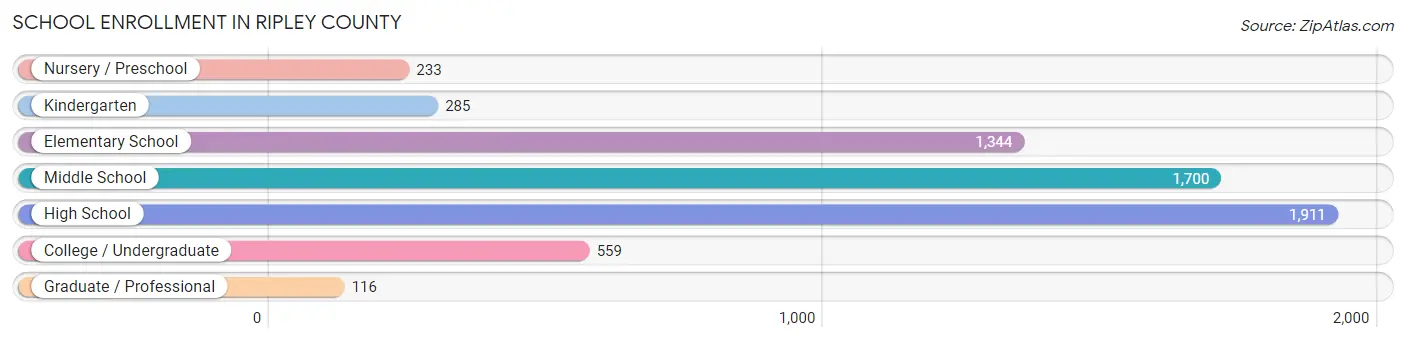
| School Level | # Students | % Students |
| Nursery / Preschool | 233 | 3.8% |
| Kindergarten | 285 | 4.6% |
| Elementary School | 1,344 | 21.9% |
| Middle School | 1,700 | 27.7% |
| High School | 1,911 | 31.1% |
| College / Undergraduate | 559 | 9.1% |
| Graduate / Professional | 116 | 1.9% |
| Total | 6,148 | 100.0% |
School Enrollment by Age by Funding Source in Ripley County
Out of a total of 6,148 students who are enrolled in schools in Ripley County, 842 (13.7%) attend a private institution, while the remaining 5,306 (86.3%) are enrolled in public schools. The age group of 3 to 4 year olds has the highest likelihood of being enrolled in private schools, with 48 (42.9% in the age bracket) enrolled. Conversely, the age group of 15 to 17 year olds has the lowest likelihood of being enrolled in a private school, with 1,198 (92.4% in the age bracket) attending a public institution.
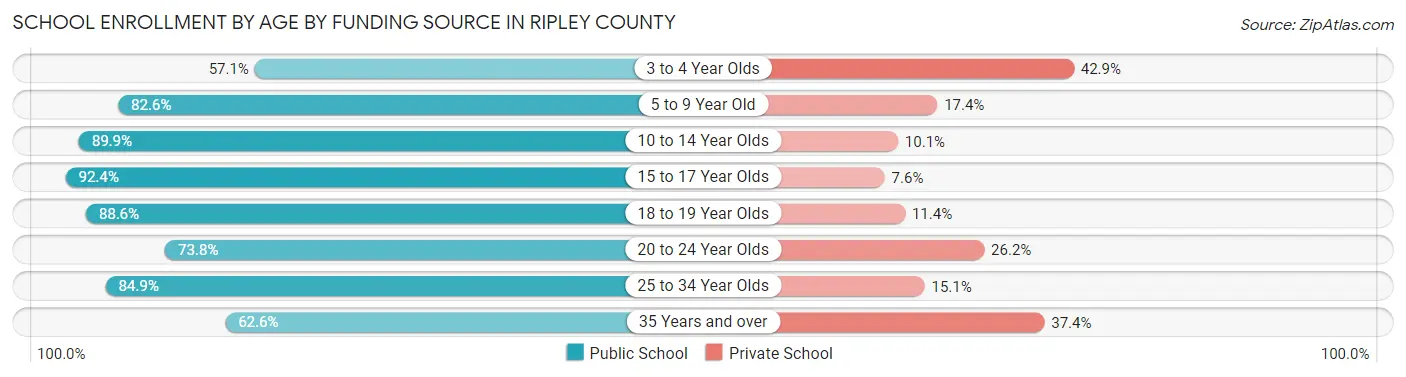
| Age Bracket | Public School | Private School |
| 3 to 4 Year Olds | 64 (57.1%) | 48 (42.9%) |
| 5 to 9 Year Old | 1,195 (82.6%) | 252 (17.4%) |
| 10 to 14 Year Olds | 2,003 (89.9%) | 225 (10.1%) |
| 15 to 17 Year Olds | 1,198 (92.4%) | 99 (7.6%) |
| 18 to 19 Year Olds | 411 (88.6%) | 53 (11.4%) |
| 20 to 24 Year Olds | 189 (73.8%) | 67 (26.2%) |
| 25 to 34 Year Olds | 124 (84.9%) | 22 (15.1%) |
| 35 Years and over | 124 (62.6%) | 74 (37.4%) |
| Total | 5,306 (86.3%) | 842 (13.7%) |
Educational Attainment by Field of Study in Ripley County
Education (835 | 20.5%), business (592 | 14.5%), science & technology (560 | 13.8%), arts & humanities (355 | 8.7%), and bio, nature & agricultural (344 | 8.5%) are the most common fields of study among 4,069 individuals in Ripley County who have obtained a bachelor's degree or higher.

| Field of Study | # Graduates | % Graduates |
| Computers & Mathematics | 117 | 2.9% |
| Bio, Nature & Agricultural | 344 | 8.5% |
| Physical & Health Sciences | 178 | 4.4% |
| Psychology | 157 | 3.9% |
| Social Sciences | 137 | 3.4% |
| Engineering | 192 | 4.7% |
| Multidisciplinary Studies | 46 | 1.1% |
| Science & Technology | 560 | 13.8% |
| Business | 592 | 14.5% |
| Education | 835 | 20.5% |
| Literature & Languages | 55 | 1.3% |
| Liberal Arts & History | 164 | 4.0% |
| Visual & Performing Arts | 209 | 5.1% |
| Communications | 128 | 3.2% |
| Arts & Humanities | 355 | 8.7% |
| Total | 4,069 | 100.0% |
Transportation & Commute in Ripley County
Vehicle Availability by Sex in Ripley County
The most prevalent vehicle ownership categories in Ripley County are males with 2 vehicles (2,531, accounting for 33.3%) and females with 2 vehicles (2,398, making up 36.9%).
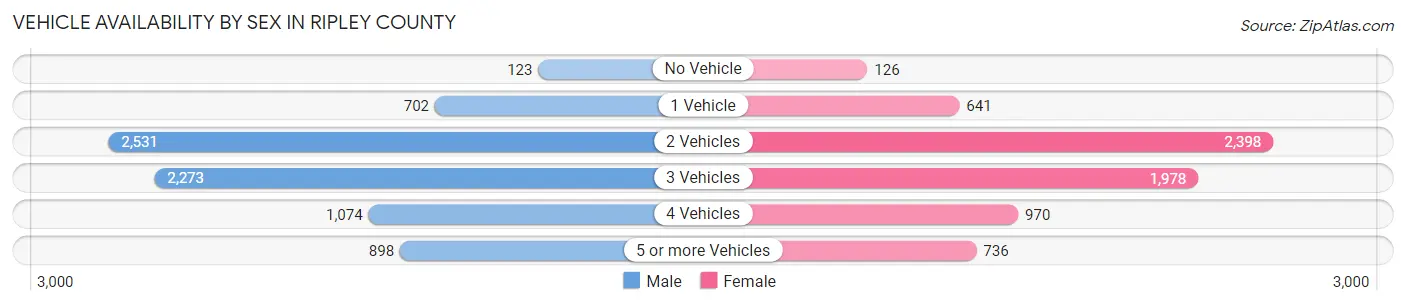
| Vehicles Available | Male | Female |
| No Vehicle | 123 (1.6%) | 126 (1.8%) |
| 1 Vehicle | 702 (9.2%) | 641 (9.4%) |
| 2 Vehicles | 2,531 (33.3%) | 2,398 (35.0%) |
| 3 Vehicles | 2,273 (29.9%) | 1,978 (28.9%) |
| 4 Vehicles | 1,074 (14.1%) | 970 (14.2%) |
| 5 or more Vehicles | 898 (11.8%) | 736 (10.7%) |
| Total | 7,601 (100.0%) | 6,849 (100.0%) |
Commute Time in Ripley County
The most frequently occuring commute durations in Ripley County are 5 to 9 minutes (2,093 commuters, 15.3%), 10 to 14 minutes (1,735 commuters, 12.7%), and 30 to 34 minutes (1,592 commuters, 11.6%).

| Commute Time | # Commuters | % Commuters |
| Less than 5 Minutes | 915 | 6.7% |
| 5 to 9 Minutes | 2,093 | 15.3% |
| 10 to 14 Minutes | 1,735 | 12.7% |
| 15 to 19 Minutes | 1,125 | 8.2% |
| 20 to 24 Minutes | 1,521 | 11.1% |
| 25 to 29 Minutes | 808 | 5.9% |
| 30 to 34 Minutes | 1,592 | 11.6% |
| 35 to 39 Minutes | 520 | 3.8% |
| 40 to 44 Minutes | 485 | 3.5% |
| 45 to 59 Minutes | 1,283 | 9.4% |
| 60 to 89 Minutes | 1,197 | 8.7% |
| 90 or more Minutes | 428 | 3.1% |
Commute Time by Sex in Ripley County
The most common commute times in Ripley County are 30 to 34 minutes (1,026 commuters, 14.1%) for males and 5 to 9 minutes (1,276 commuters, 19.9%) for females.
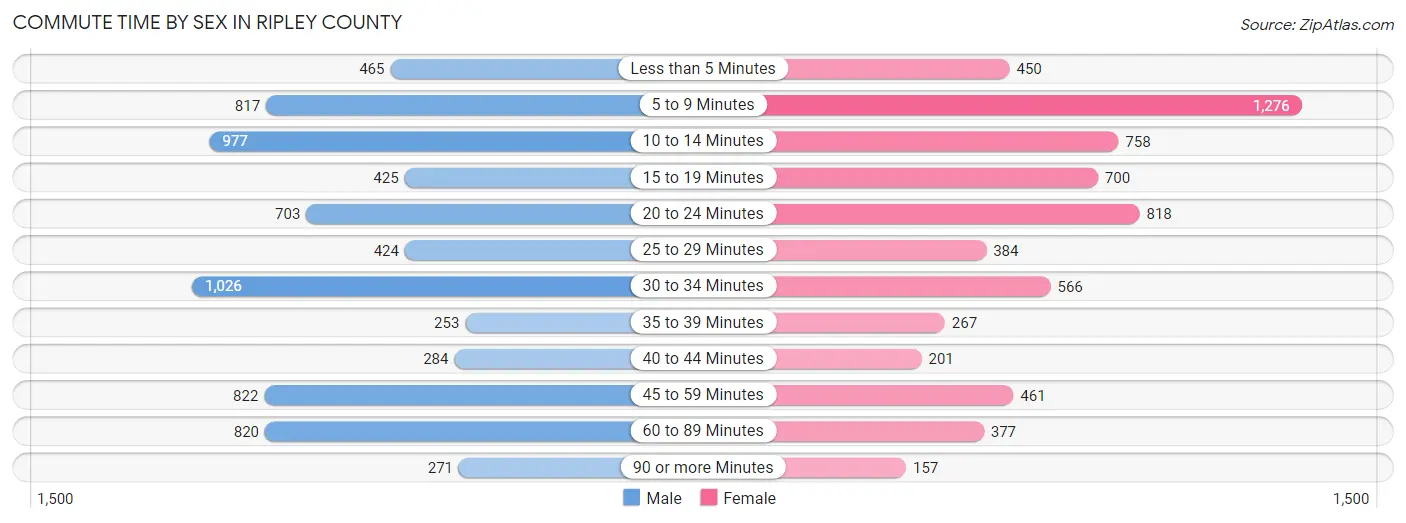
| Commute Time | Male | Female |
| Less than 5 Minutes | 465 (6.4%) | 450 (7.0%) |
| 5 to 9 Minutes | 817 (11.2%) | 1,276 (19.9%) |
| 10 to 14 Minutes | 977 (13.4%) | 758 (11.8%) |
| 15 to 19 Minutes | 425 (5.8%) | 700 (10.9%) |
| 20 to 24 Minutes | 703 (9.7%) | 818 (12.8%) |
| 25 to 29 Minutes | 424 (5.8%) | 384 (6.0%) |
| 30 to 34 Minutes | 1,026 (14.1%) | 566 (8.8%) |
| 35 to 39 Minutes | 253 (3.5%) | 267 (4.2%) |
| 40 to 44 Minutes | 284 (3.9%) | 201 (3.1%) |
| 45 to 59 Minutes | 822 (11.3%) | 461 (7.2%) |
| 60 to 89 Minutes | 820 (11.3%) | 377 (5.9%) |
| 90 or more Minutes | 271 (3.7%) | 157 (2.5%) |
Time of Departure to Work by Sex in Ripley County
The most frequent times of departure to work in Ripley County are 7:00 AM to 7:29 AM (981, 13.5%) for males and 7:00 AM to 7:29 AM (1,100, 17.2%) for females.

| Time of Departure | Male | Female |
| 12:00 AM to 4:59 AM | 702 (9.6%) | 324 (5.1%) |
| 5:00 AM to 5:29 AM | 837 (11.5%) | 290 (4.5%) |
| 5:30 AM to 5:59 AM | 794 (10.9%) | 496 (7.7%) |
| 6:00 AM to 6:29 AM | 656 (9.0%) | 518 (8.1%) |
| 6:30 AM to 6:59 AM | 434 (6.0%) | 605 (9.4%) |
| 7:00 AM to 7:29 AM | 981 (13.5%) | 1,100 (17.2%) |
| 7:30 AM to 7:59 AM | 646 (8.9%) | 979 (15.3%) |
| 8:00 AM to 8:29 AM | 354 (4.9%) | 467 (7.3%) |
| 8:30 AM to 8:59 AM | 156 (2.1%) | 168 (2.6%) |
| 9:00 AM to 9:59 AM | 188 (2.6%) | 461 (7.2%) |
| 10:00 AM to 10:59 AM | 17 (0.2%) | 170 (2.6%) |
| 11:00 AM to 11:59 AM | 42 (0.6%) | 54 (0.8%) |
| 12:00 PM to 3:59 PM | 904 (12.4%) | 447 (7.0%) |
| 4:00 PM to 11:59 PM | 576 (7.9%) | 336 (5.2%) |
| Total | 7,287 (100.0%) | 6,415 (100.0%) |
Housing Occupancy in Ripley County
Occupancy by Ownership in Ripley County
Of the total 11,114 dwellings in Ripley County, owner-occupied units account for 8,577 (77.2%), while renter-occupied units make up 2,537 (22.8%).

| Occupancy | # Housing Units | % Housing Units |
| Owner Occupied Housing Units | 8,577 | 77.2% |
| Renter-Occupied Housing Units | 2,537 | 22.8% |
| Total Occupied Housing Units | 11,114 | 100.0% |
Occupancy by Household Size in Ripley County
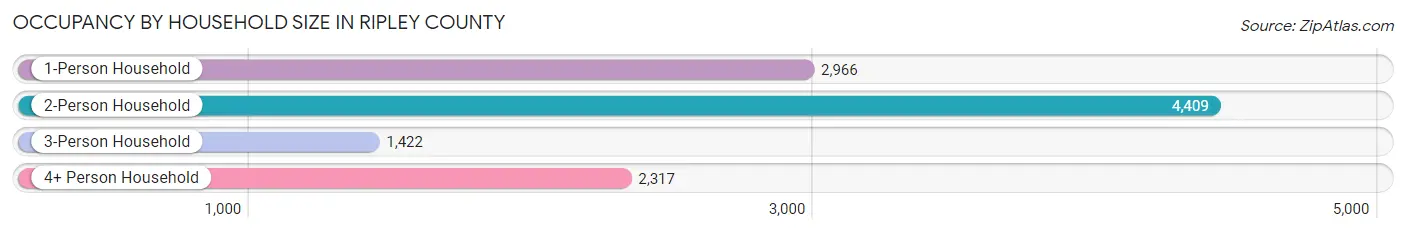
| Household Size | # Housing Units | % Housing Units |
| 1-Person Household | 2,966 | 26.7% |
| 2-Person Household | 4,409 | 39.7% |
| 3-Person Household | 1,422 | 12.8% |
| 4+ Person Household | 2,317 | 20.8% |
| Total Housing Units | 11,114 | 100.0% |
Occupancy by Ownership by Household Size in Ripley County
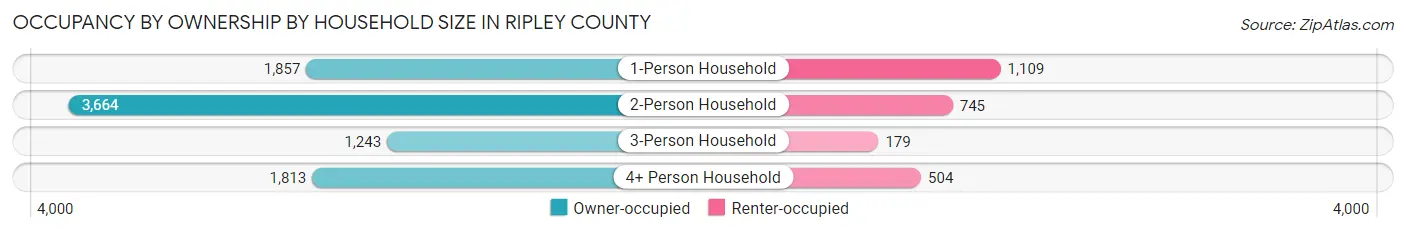
| Household Size | Owner-occupied | Renter-occupied |
| 1-Person Household | 1,857 (62.6%) | 1,109 (37.4%) |
| 2-Person Household | 3,664 (83.1%) | 745 (16.9%) |
| 3-Person Household | 1,243 (87.4%) | 179 (12.6%) |
| 4+ Person Household | 1,813 (78.2%) | 504 (21.7%) |
| Total Housing Units | 8,577 (77.2%) | 2,537 (22.8%) |
Occupancy by Educational Attainment in Ripley County

| Household Size | Owner-occupied | Renter-occupied |
| Less than High School | 441 (54.6%) | 366 (45.4%) |
| High School Diploma | 3,363 (75.5%) | 1,090 (24.5%) |
| College/Associate Degree | 2,823 (80.7%) | 677 (19.3%) |
| Bachelor's Degree or higher | 1,950 (82.8%) | 404 (17.2%) |
Occupancy by Age of Householder in Ripley County

| Age Bracket | # Households | % Households |
| Under 35 Years | 1,827 | 16.4% |
| 35 to 44 Years | 1,669 | 15.0% |
| 45 to 54 Years | 2,232 | 20.1% |
| 55 to 64 Years | 2,274 | 20.5% |
| 65 to 74 Years | 1,753 | 15.8% |
| 75 to 84 Years | 1,058 | 9.5% |
| 85 Years and Over | 301 | 2.7% |
| Total | 11,114 | 100.0% |
Housing Finances in Ripley County
Median Income by Occupancy in Ripley County

| Occupancy Type | # Households | Median Income |
| Owner-Occupied | 8,577 (77.2%) | $82,666 |
| Renter-Occupied | 2,537 (22.8%) | $36,191 |
| Average | 11,114 (100.0%) | $70,285 |
Occupancy by Householder Income Bracket in Ripley County

| Income Bracket | Owner-occupied | Renter-occupied |
| Less than $5,000 | 95 (1.1%) | 203 (8.0%) |
| $5,000 to $9,999 | 72 (0.8%) | 211 (8.3%) |
| $10,000 to $14,999 | 189 (2.2%) | 313 (12.3%) |
| $15,000 to $19,999 | 282 (3.3%) | 163 (6.4%) |
| $20,000 to $24,999 | 232 (2.7%) | 127 (5.0%) |
| $25,000 to $34,999 | 593 (6.9%) | 221 (8.7%) |
| $35,000 to $49,999 | 903 (10.5%) | 356 (14.0%) |
| $50,000 to $74,999 | 1,537 (17.9%) | 418 (16.5%) |
| $75,000 to $99,999 | 1,343 (15.7%) | 182 (7.2%) |
| $100,000 to $149,999 | 2,156 (25.1%) | 126 (5.0%) |
| $150,000 or more | 1,175 (13.7%) | 217 (8.6%) |
| Total | 8,577 (100.0%) | 2,537 (100.0%) |
Monthly Housing Cost Tiers in Ripley County

| Monthly Cost | Owner-occupied | Renter-occupied |
| Less than $300 | 477 (5.6%) | 148 (5.8%) |
| $300 to $499 | 1,403 (16.4%) | 444 (17.5%) |
| $500 to $799 | 1,766 (20.6%) | 635 (25.0%) |
| $800 to $999 | 1,069 (12.5%) | 448 (17.7%) |
| $1,000 to $1,499 | 2,203 (25.7%) | 432 (17.0%) |
| $1,500 to $1,999 | 1,178 (13.7%) | 76 (3.0%) |
| $2,000 to $2,499 | 284 (3.3%) | 4 (0.2%) |
| $2,500 to $2,999 | 144 (1.7%) | 0 (0.0%) |
| $3,000 or more | 53 (0.6%) | 0 (0.0%) |
| Total | 8,577 (100.0%) | 2,537 (100.0%) |
Physical Housing Characteristics in Ripley County
Housing Structures in Ripley County

| Structure Type | # Housing Units | % Housing Units |
| Single Unit, Detached | 8,793 | 79.1% |
| Single Unit, Attached | 195 | 1.8% |
| 2 Unit Apartments | 422 | 3.8% |
| 3 or 4 Unit Apartments | 159 | 1.4% |
| 5 to 9 Unit Apartments | 163 | 1.5% |
| 10 or more Apartments | 515 | 4.6% |
| Mobile Home / Other | 867 | 7.8% |
| Total | 11,114 | 100.0% |
Housing Structures by Occupancy in Ripley County

| Structure Type | Owner-occupied | Renter-occupied |
| Single Unit, Detached | 7,927 (90.1%) | 866 (9.9%) |
| Single Unit, Attached | 88 (45.1%) | 107 (54.9%) |
| 2 Unit Apartments | 6 (1.4%) | 416 (98.6%) |
| 3 or 4 Unit Apartments | 0 (0.0%) | 159 (100.0%) |
| 5 to 9 Unit Apartments | 0 (0.0%) | 163 (100.0%) |
| 10 or more Apartments | 0 (0.0%) | 515 (100.0%) |
| Mobile Home / Other | 556 (64.1%) | 311 (35.9%) |
| Total | 8,577 (77.2%) | 2,537 (22.8%) |
Housing Structures by Number of Rooms in Ripley County
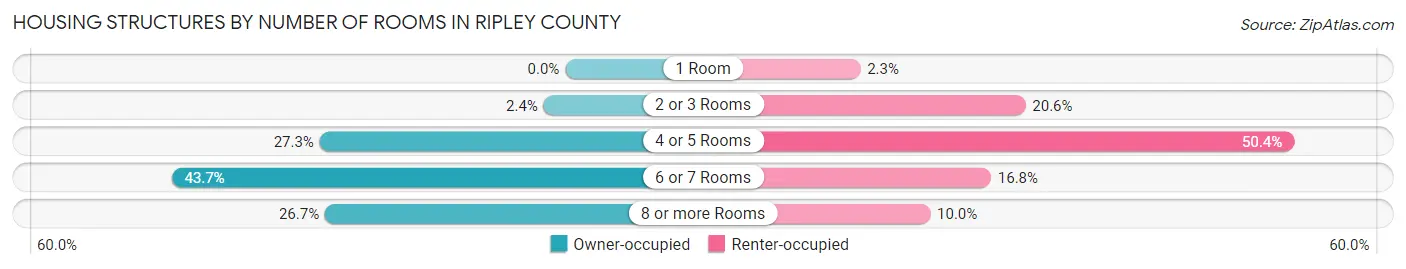
| Number of Rooms | Owner-occupied | Renter-occupied |
| 1 Room | 0 (0.0%) | 57 (2.2%) |
| 2 or 3 Rooms | 205 (2.4%) | 522 (20.6%) |
| 4 or 5 Rooms | 2,337 (27.3%) | 1,279 (50.4%) |
| 6 or 7 Rooms | 3,748 (43.7%) | 425 (16.8%) |
| 8 or more Rooms | 2,287 (26.7%) | 254 (10.0%) |
| Total | 8,577 (100.0%) | 2,537 (100.0%) |
Housing Structure by Heating Type in Ripley County
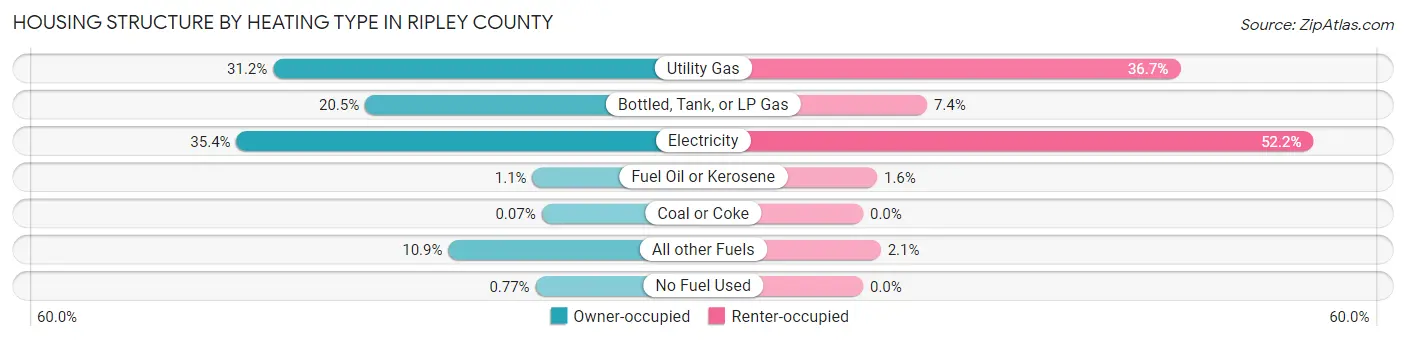
| Heating Type | Owner-occupied | Renter-occupied |
| Utility Gas | 2,675 (31.2%) | 932 (36.7%) |
| Bottled, Tank, or LP Gas | 1,761 (20.5%) | 188 (7.4%) |
| Electricity | 3,040 (35.4%) | 1,324 (52.2%) |
| Fuel Oil or Kerosene | 96 (1.1%) | 41 (1.6%) |
| Coal or Coke | 6 (0.1%) | 0 (0.0%) |
| All other Fuels | 933 (10.9%) | 52 (2.1%) |
| No Fuel Used | 66 (0.8%) | 0 (0.0%) |
| Total | 8,577 (100.0%) | 2,537 (100.0%) |
Household Vehicle Usage in Ripley County

| Vehicles per Household | Owner-occupied | Renter-occupied |
| No Vehicle | 282 (3.3%) | 247 (9.7%) |
| 1 Vehicle | 1,222 (14.2%) | 1,042 (41.1%) |
| 2 Vehicles | 3,359 (39.2%) | 838 (33.0%) |
| 3 or more Vehicles | 3,714 (43.3%) | 410 (16.2%) |
| Total | 8,577 (100.0%) | 2,537 (100.0%) |
Real Estate & Mortgages in Ripley County
Real Estate and Mortgage Overview in Ripley County
| Characteristic | Without Mortgage | With Mortgage |
| Housing Units | 3,409 | 5,168 |
| Median Property Value | $202,700 | $180,900 |
| Median Household Income | $70,223 | $755 |
| Monthly Housing Costs | $483 | $53 |
| Real Estate Taxes | $1,157 | $62 |
Property Value by Mortgage Status in Ripley County
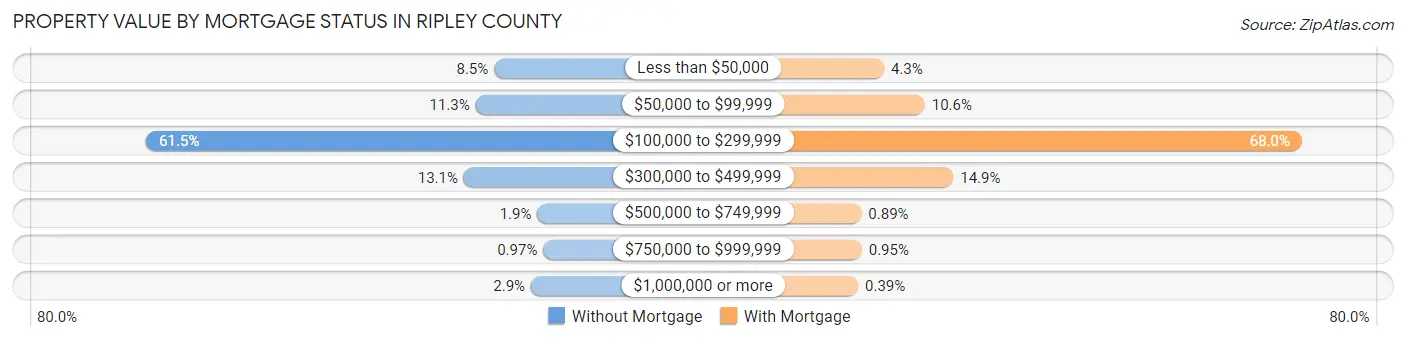
| Property Value | Without Mortgage | With Mortgage |
| Less than $50,000 | 288 (8.5%) | 224 (4.3%) |
| $50,000 to $99,999 | 385 (11.3%) | 545 (10.5%) |
| $100,000 to $299,999 | 2,096 (61.5%) | 3,514 (68.0%) |
| $300,000 to $499,999 | 446 (13.1%) | 770 (14.9%) |
| $500,000 to $749,999 | 64 (1.9%) | 46 (0.9%) |
| $750,000 to $999,999 | 33 (1.0%) | 49 (0.9%) |
| $1,000,000 or more | 97 (2.9%) | 20 (0.4%) |
| Total | 3,409 (100.0%) | 5,168 (100.0%) |
Household Income by Mortgage Status in Ripley County

| Household Income | Without Mortgage | With Mortgage |
| Less than $10,000 | 82 (2.4%) | 178 (3.4%) |
| $10,000 to $24,999 | 376 (11.0%) | 85 (1.6%) |
| $25,000 to $34,999 | 350 (10.3%) | 327 (6.3%) |
| $35,000 to $49,999 | 390 (11.4%) | 243 (4.7%) |
| $50,000 to $74,999 | 623 (18.3%) | 513 (9.9%) |
| $75,000 to $99,999 | 344 (10.1%) | 914 (17.7%) |
| $100,000 to $149,999 | 824 (24.2%) | 999 (19.3%) |
| $150,000 or more | 420 (12.3%) | 1,332 (25.8%) |
| Total | 3,409 (100.0%) | 5,168 (100.0%) |
Property Value to Household Income Ratio in Ripley County

| Value-to-Income Ratio | Without Mortgage | With Mortgage |
| Less than 2.0x | 1,151 (33.8%) | 89,364 (1,729.2%) |
| 2.0x to 2.9x | 741 (21.7%) | 2,177 (42.1%) |
| 3.0x to 3.9x | 526 (15.4%) | 1,416 (27.4%) |
| 4.0x or more | 967 (28.4%) | 715 (13.8%) |
| Total | 3,409 (100.0%) | 5,168 (100.0%) |
Real Estate Taxes by Mortgage Status in Ripley County

| Property Taxes | Without Mortgage | With Mortgage |
| Less than $800 | 964 (28.3%) | 0 (0.0%) |
| $800 to $1,499 | 1,226 (36.0%) | 1,627 (31.5%) |
| $800 to $1,499 | 1,044 (30.6%) | 2,106 (40.7%) |
| Total | 3,409 (100.0%) | 5,168 (100.0%) |
Health & Disability in Ripley County
Health Insurance Coverage by Age in Ripley County

| Age Bracket | With Coverage | Without Coverage |
| Under 6 Years | 1,897 (95.0%) | 100 (5.0%) |
| 6 to 18 Years | 4,883 (93.0%) | 367 (7.0%) |
| 19 to 25 Years | 2,172 (96.2%) | 86 (3.8%) |
| 26 to 34 Years | 2,306 (78.8%) | 621 (21.2%) |
| 35 to 44 Years | 2,960 (89.6%) | 343 (10.4%) |
| 45 to 54 Years | 3,452 (90.3%) | 370 (9.7%) |
| 55 to 64 Years | 3,693 (93.9%) | 239 (6.1%) |
| 65 to 74 Years | 2,991 (99.9%) | 2 (0.1%) |
| 75 Years and older | 2,019 (99.8%) | 5 (0.3%) |
| Total | 26,373 (92.5%) | 2,133 (7.5%) |
Health Insurance Coverage by Citizenship Status in Ripley County

| Citizenship Status | With Coverage | Without Coverage |
| Native Born | 1,897 (95.0%) | 100 (5.0%) |
| Foreign Born, Citizen | 4,883 (93.0%) | 367 (7.0%) |
| Foreign Born, not a Citizen | 2,172 (96.2%) | 86 (3.8%) |
Health Insurance Coverage by Household Income in Ripley County

| Household Income | With Coverage | Without Coverage |
| Under $25,000 | 2,569 (94.5%) | 150 (5.5%) |
| $25,000 to $49,999 | 3,547 (90.7%) | 362 (9.3%) |
| $50,000 to $74,999 | 4,823 (91.0%) | 477 (9.0%) |
| $75,000 to $99,999 | 3,905 (95.2%) | 197 (4.8%) |
| $100,000 and over | 11,483 (92.4%) | 947 (7.6%) |
Public vs Private Health Insurance Coverage by Age in Ripley County
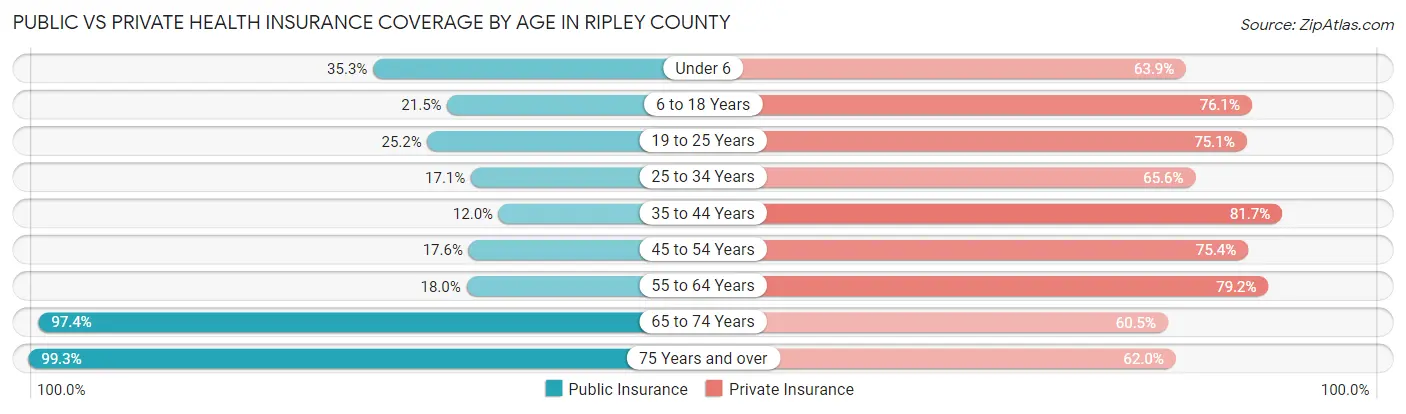
| Age Bracket | Public Insurance | Private Insurance |
| Under 6 | 705 (35.3%) | 1,276 (63.9%) |
| 6 to 18 Years | 1,130 (21.5%) | 3,995 (76.1%) |
| 19 to 25 Years | 569 (25.2%) | 1,696 (75.1%) |
| 25 to 34 Years | 501 (17.1%) | 1,920 (65.6%) |
| 35 to 44 Years | 395 (12.0%) | 2,699 (81.7%) |
| 45 to 54 Years | 671 (17.6%) | 2,882 (75.4%) |
| 55 to 64 Years | 706 (18.0%) | 3,113 (79.2%) |
| 65 to 74 Years | 2,916 (97.4%) | 1,811 (60.5%) |
| 75 Years and over | 2,010 (99.3%) | 1,254 (62.0%) |
| Total | 9,603 (33.7%) | 20,646 (72.4%) |
Disability Status by Sex by Age in Ripley County

| Age Bracket | Male | Female |
| Under 5 Years | 4 (0.4%) | 0 (0.0%) |
| 5 to 17 Years | 45 (1.7%) | 34 (1.4%) |
| 18 to 34 Years | 289 (9.9%) | 189 (7.0%) |
| 35 to 64 Years | 676 (12.5%) | 992 (17.5%) |
| 65 to 74 Years | 355 (24.7%) | 356 (22.9%) |
| 75 Years and over | 394 (46.6%) | 558 (47.3%) |
Disability Class by Sex by Age in Ripley County
Disability Class: Hearing Difficulty

| Age Bracket | Male | Female |
| Under 5 Years | 4 (0.4%) | 0 (0.0%) |
| 5 to 17 Years | 0 (0.0%) | 7 (0.3%) |
| 18 to 34 Years | 43 (1.5%) | 23 (0.9%) |
| 35 to 64 Years | 135 (2.5%) | 159 (2.8%) |
| 65 to 74 Years | 271 (18.9%) | 113 (7.3%) |
| 75 Years and over | 265 (31.4%) | 104 (8.8%) |
Disability Class: Vision Difficulty

| Age Bracket | Male | Female |
| Under 5 Years | 0 (0.0%) | 0 (0.0%) |
| 5 to 17 Years | 0 (0.0%) | 13 (0.5%) |
| 18 to 34 Years | 27 (0.9%) | 33 (1.2%) |
| 35 to 64 Years | 135 (2.5%) | 286 (5.1%) |
| 65 to 74 Years | 29 (2.0%) | 95 (6.1%) |
| 75 Years and over | 122 (14.4%) | 143 (12.1%) |
Disability Class: Cognitive Difficulty

| Age Bracket | Male | Female |
| 5 to 17 Years | 45 (1.7%) | 10 (0.4%) |
| 18 to 34 Years | 206 (7.0%) | 122 (4.5%) |
| 35 to 64 Years | 283 (5.2%) | 321 (5.7%) |
| 65 to 74 Years | 38 (2.6%) | 119 (7.6%) |
| 75 Years and over | 51 (6.0%) | 90 (7.6%) |
Disability Class: Ambulatory Difficulty

| Age Bracket | Male | Female |
| 5 to 17 Years | 0 (0.0%) | 10 (0.4%) |
| 18 to 34 Years | 49 (1.7%) | 30 (1.1%) |
| 35 to 64 Years | 371 (6.9%) | 437 (7.7%) |
| 65 to 74 Years | 79 (5.5%) | 246 (15.8%) |
| 75 Years and over | 196 (23.2%) | 373 (31.6%) |
Disability Class: Self-Care Difficulty
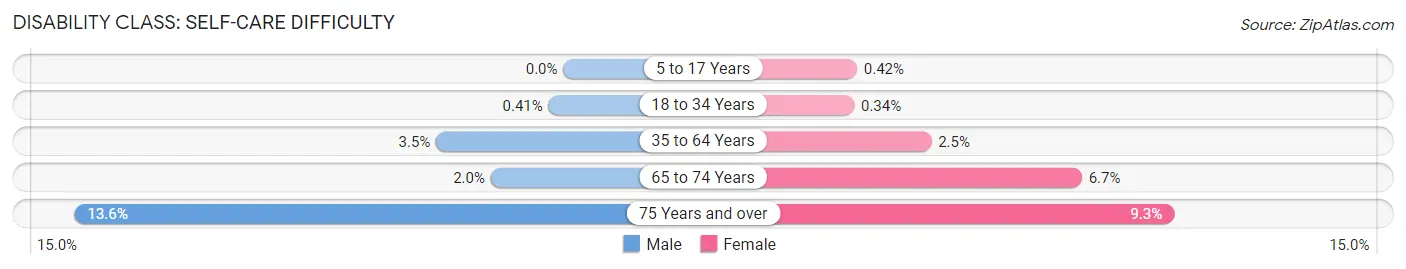
| Age Bracket | Male | Female |
| 5 to 17 Years | 0 (0.0%) | 10 (0.4%) |
| 18 to 34 Years | 12 (0.4%) | 9 (0.3%) |
| 35 to 64 Years | 191 (3.5%) | 141 (2.5%) |
| 65 to 74 Years | 29 (2.0%) | 104 (6.7%) |
| 75 Years and over | 115 (13.6%) | 109 (9.2%) |
Technology Access in Ripley County
Computing Device Access in Ripley County
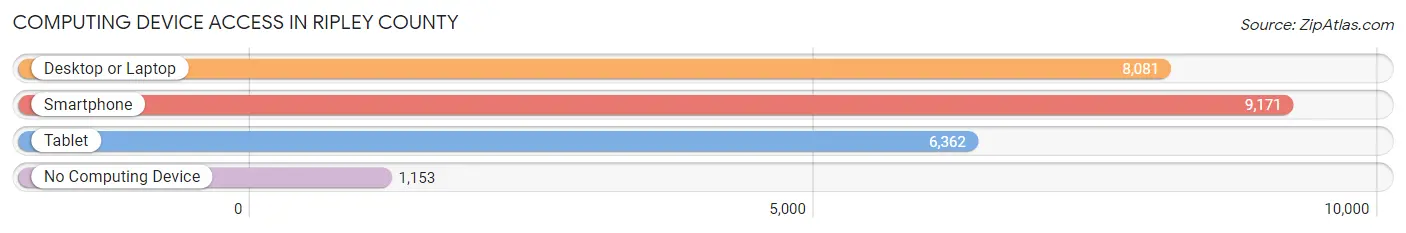
| Device Type | # Households | % Households |
| Desktop or Laptop | 8,081 | 72.7% |
| Smartphone | 9,171 | 82.5% |
| Tablet | 6,362 | 57.2% |
| No Computing Device | 1,153 | 10.4% |
| Total | 11,114 | 100.0% |
Internet Access in Ripley County
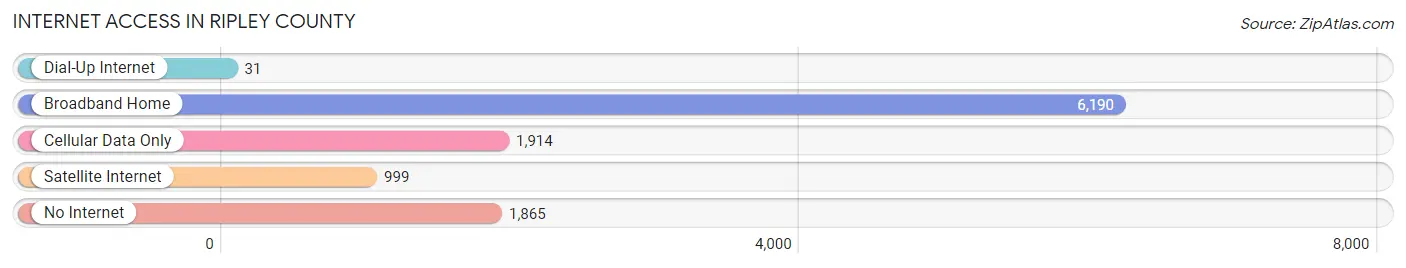
| Internet Type | # Households | % Households |
| Dial-Up Internet | 31 | 0.3% |
| Broadband Home | 6,190 | 55.7% |
| Cellular Data Only | 1,914 | 17.2% |
| Satellite Internet | 999 | 9.0% |
| No Internet | 1,865 | 16.8% |
| Total | 11,114 | 100.0% |
Ripley County Summary
Ripley County is located in the southeastern corner of Indiana, and is part of the Cincinnati metropolitan area. It is bordered by Dearborn County to the north, Ohio to the east, Switzerland County to the south, and Franklin and Decatur counties to the west. The county seat is Versailles, and the largest city is Batesville. The county was established in 1818 and named for General Eleazer Wheelock Ripley, a hero of the War of 1812.
Geography
Ripley County covers an area of 437 square miles, of which 434 square miles is land and 3 square miles is water. The county is located in the Central Till Plains region of Indiana, and is characterized by rolling hills and valleys. The highest point in the county is located in the northwest corner, at an elevation of 1,000 feet. The county is drained by the East Fork of the White River, which flows through the center of the county.
The county is home to several state parks and recreation areas, including Versailles State Park, which is located in the northern part of the county and features a lake, campgrounds, and trails. Other parks in the county include the Whitewater Memorial State Park, which is located in the eastern part of the county and features a lake, campgrounds, and trails, and the Versailles State Fish and Wildlife Area, which is located in the western part of the county and features a lake, campgrounds, and trails.
Economy
Ripley County has a diverse economy, with a mix of manufacturing, agriculture, and services. The county’s largest employers are Batesville Casket Company, which manufactures caskets and other funeral products, and Batesville Tool and Die, which manufactures tools and dies for the automotive industry. Other major employers in the county include Batesville Products, which manufactures plastic products, and Batesville Memorial Hospital, which provides healthcare services.
Agriculture is also an important part of the county’s economy, with corn, soybeans, and wheat being the primary crops. Livestock production is also important, with beef cattle, dairy cattle, and hogs being the primary animals raised.
Demographics
As of the 2010 census, Ripley County had a population of 28,818. The population was spread out with 24.3% under the age of 18, 8.2% from 18 to 24, 28.2% from 25 to 44, 24.7% from 45 to 64, and 14.6% who were 65 years of age or older. The median age was 37.5 years.
The racial makeup of the county was 97.2% White, 0.7% African American, 0.2% Native American, 0.4% Asian, 0.1% Pacific Islander, 0.4% from other races, and 1.0% from two or more races. Hispanic or Latino of any race were 1.3% of the population.
The median income for a household in the county was $45,845, and the median income for a family was $54,845. The per capita income for the county was $21,845. About 8.2% of families and 11.2% of the population were below the poverty line, including 15.2% of those under age 18 and 8.2% of those age 65 or over.
Common Questions
What is the Total Population of Ripley County?
Total Population of Ripley County is 28,990.
What is the Total Male Population of Ripley County?
Total Male Population of Ripley County is 14,424.
What is the Total Female Population of Ripley County?
Total Female Population of Ripley County is 14,566.
What is the Ratio of Males per 100 Females in Ripley County?
There are 99.03 Males per 100 Females in Ripley County.
What is the Ratio of Females per 100 Males in Ripley County?
There are 100.98 Females per 100 Males in Ripley County.
What is the Median Population Age in Ripley County?
Median Population Age in Ripley County is 40.8 Years.
What is the Average Family Size in Ripley County
Average Family Size in Ripley County is 3.1 People.
What is the Average Household Size in Ripley County
Average Household Size in Ripley County is 2.6 People.
What is Per Capita Income in Ripley County?
Per Capita income in Ripley County is $34,578.
What is the Median Family Income in Ripley County?
Median Family Income in Ripley County is $91,229.
What is the Median Household income in Ripley County?
Median Household Income in Ripley County is $70,285.
What is Income or Wage Gap in Ripley County?
Income or Wage Gap in Ripley County is 28.4%.
Women in Ripley County earn 71.6 cents for every dollar earned by a man.
What is Family Income Deficit in Ripley County?
Family Income Deficit in Ripley County is $9,750.
Families that are below poverty line in Ripley County earn $9,750 less on average than the poverty threshold level.
What is Inequality or Gini Index in Ripley County?
Inequality or Gini Index in Ripley County is 0.44.
How Large is the Labor Force in Ripley County?
There are 15,144 People in the Labor Forcein in Ripley County.
What is the Percentage of People in the Labor Force in Ripley County?
65.5% of People are in the Labor Force in Ripley County.
What is the Unemployment Rate in Ripley County?
Unemployment Rate in Ripley County is 3.3%.