Randolph County, IN
Randolph County Map
Randolph County Overview
24,586
TOTAL POPULATION
12,318
MALE POPULATION
12,268
FEMALE POPULATION
100.41
MALES / 100 FEMALES
99.59
FEMALES / 100 MALES
42.8
MEDIAN AGE
3.0
AVG FAMILY SIZE
2.4
AVG HOUSEHOLD SIZE
$30,253
PER CAPITA INCOME
$71,450
AVG FAMILY INCOME
$59,674
AVG HOUSEHOLD INCOME
31.5%
WAGE / INCOME GAP [ % ]
68.5¢/ $1
WAGE / INCOME GAP [ $ ]
$11,289
FAMILY INCOME DEFICIT
0.42
INEQUALITY / GINI INDEX
11,764
LABOR FORCE [ PEOPLE ]
60.2%
PERCENT IN LABOR FORCE
5.6%
UNEMPLOYMENT RATE
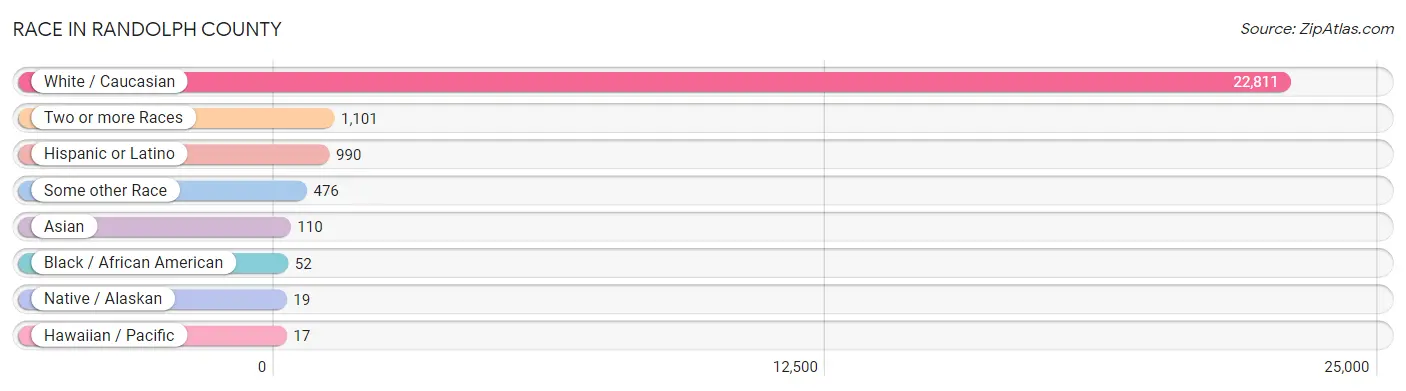
Race in Randolph County
The most populous races in Randolph County are White / Caucasian (22,811 | 92.8%), Two or more Races (1,101 | 4.5%), and Hispanic or Latino (990 | 4.0%).
| Race | # Population | % Population |
| Asian | 110 | 0.4% |
| Black / African American | 52 | 0.2% |
| Hawaiian / Pacific | 17 | 0.1% |
| Hispanic or Latino | 990 | 4.0% |
| Native / Alaskan | 19 | 0.1% |
| White / Caucasian | 22,811 | 92.8% |
| Two or more Races | 1,101 | 4.5% |
| Some other Race | 476 | 1.9% |
| Total | 24,586 | 100.0% |
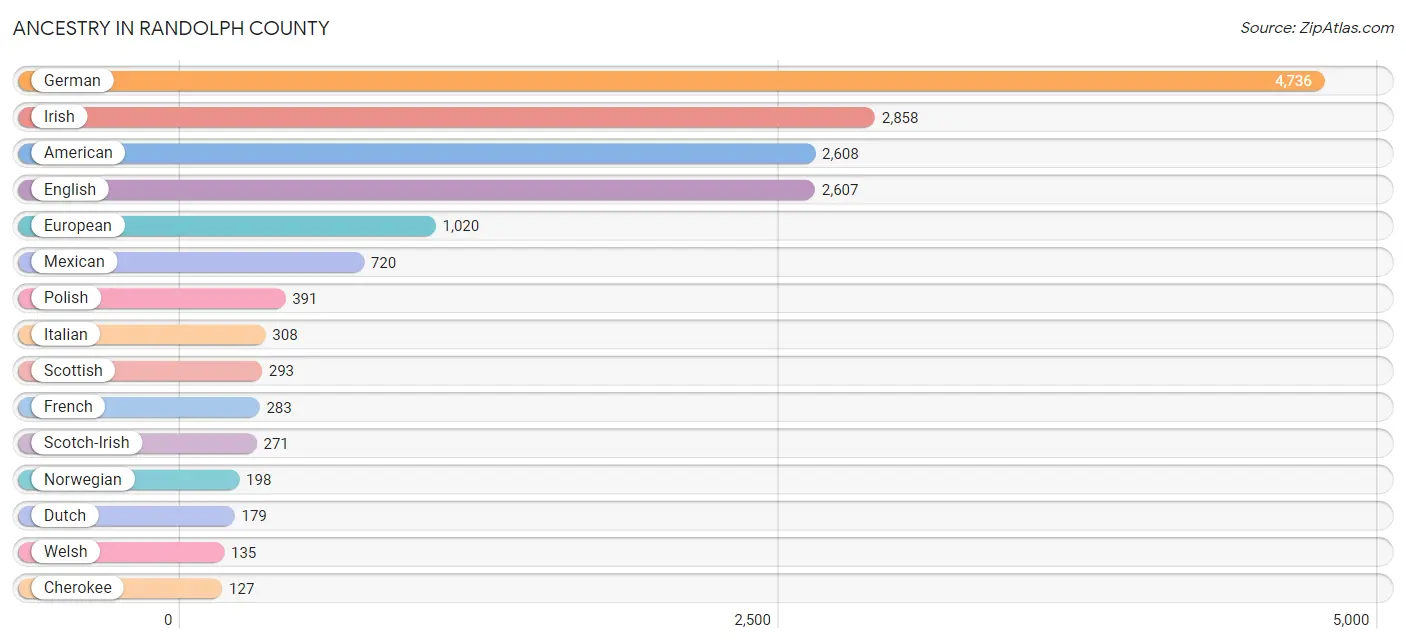
Ancestry in Randolph County
The most populous ancestries reported in Randolph County are German (4,736 | 19.3%), Irish (2,858 | 11.6%), American (2,608 | 10.6%), English (2,607 | 10.6%), and European (1,020 | 4.2%), together accounting for 56.2% of all Randolph County residents.
| Ancestry | # Population | % Population |
| African | 2 | 0.0% |
| Alaska Native | 3 | 0.0% |
| American | 2,608 | 10.6% |
| Apache | 6 | 0.0% |
| Arab | 4 | 0.0% |
| Australian | 1 | 0.0% |
| Belgian | 4 | 0.0% |
| Bhutanese | 11 | 0.0% |
| Blackfeet | 19 | 0.1% |
| British | 100 | 0.4% |
| Bulgarian | 3 | 0.0% |
| Burmese | 29 | 0.1% |
| Canadian | 1 | 0.0% |
| Central American | 88 | 0.4% |
| Cherokee | 127 | 0.5% |
| Chippewa | 6 | 0.0% |
| Colombian | 6 | 0.0% |
| Czech | 106 | 0.4% |
| Danish | 10 | 0.0% |
| Dutch | 179 | 0.7% |
| Eastern European | 2 | 0.0% |
| English | 2,607 | 10.6% |
| European | 1,020 | 4.2% |
| Finnish | 13 | 0.1% |
| French | 283 | 1.1% |
| French Canadian | 26 | 0.1% |
| German | 4,736 | 19.3% |
| German Russian | 2 | 0.0% |
| Greek | 7 | 0.0% |
| Guatemalan | 16 | 0.1% |
| Indian (Asian) | 2 | 0.0% |
| Irish | 2,858 | 11.6% |
| Italian | 308 | 1.3% |
| Jamaican | 11 | 0.0% |
| Laotian | 81 | 0.3% |
| Lithuanian | 9 | 0.0% |
| Marshallese | 4 | 0.0% |
| Mexican | 720 | 2.9% |
| Native Hawaiian | 17 | 0.1% |
| Nigerian | 7 | 0.0% |
| Northern European | 5 | 0.0% |
| Norwegian | 198 | 0.8% |
| Pennsylvania German | 34 | 0.1% |
| Polish | 391 | 1.6% |
| Portuguese | 7 | 0.0% |
| Puerto Rican | 69 | 0.3% |
| Romanian | 30 | 0.1% |
| Russian | 66 | 0.3% |
| Salvadoran | 72 | 0.3% |
| Scandinavian | 12 | 0.1% |
| Scotch-Irish | 271 | 1.1% |
| Scottish | 293 | 1.2% |
| Sioux | 22 | 0.1% |
| Slovene | 47 | 0.2% |
| South African | 17 | 0.1% |
| South American | 6 | 0.0% |
| Spaniard | 90 | 0.4% |
| Spanish | 10 | 0.0% |
| Subsaharan African | 26 | 0.1% |
| Swedish | 95 | 0.4% |
| Swiss | 52 | 0.2% |
| Syrian | 4 | 0.0% |
| Thai | 7 | 0.0% |
| Welsh | 135 | 0.5% | View All 64 Rows |
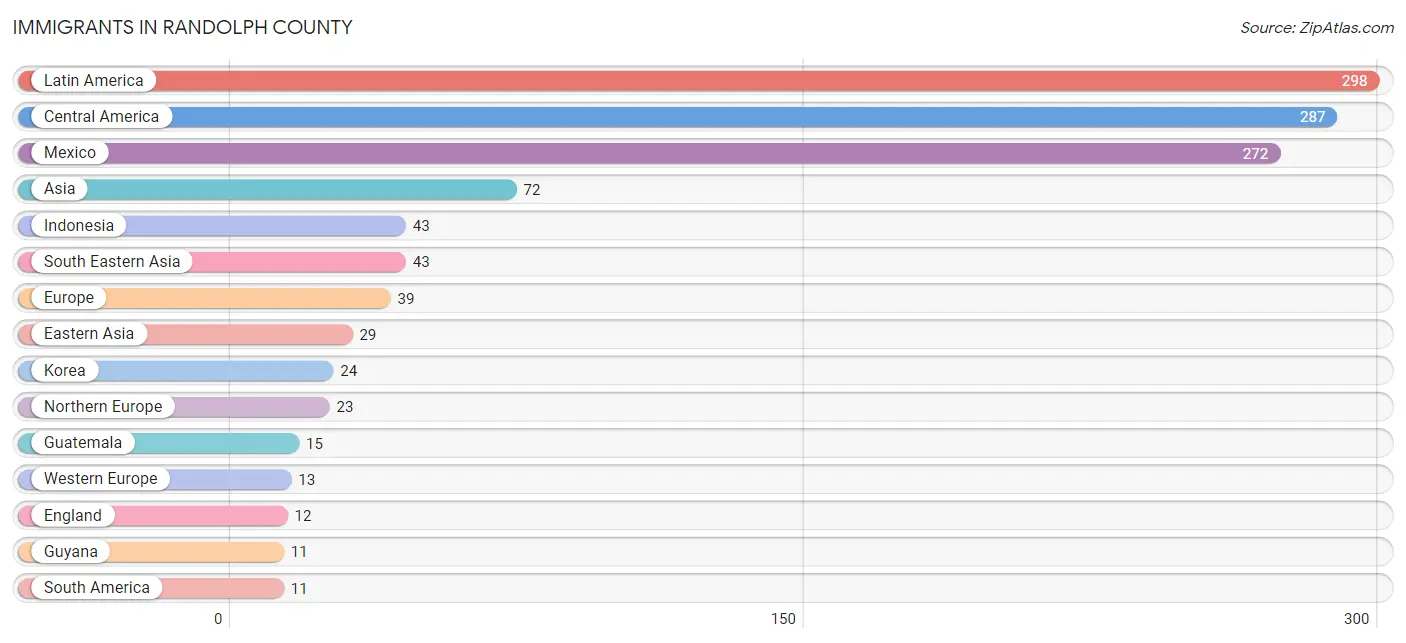
Immigrants in Randolph County
The most numerous immigrant groups reported in Randolph County came from Latin America (298 | 1.2%), Central America (287 | 1.2%), Mexico (272 | 1.1%), Asia (72 | 0.3%), and Indonesia (43 | 0.2%), together accounting for 4.0% of all Randolph County residents.
| Immigration Origin | # Population | % Population |
| Africa | 8 | 0.0% |
| Asia | 72 | 0.3% |
| Bulgaria | 3 | 0.0% |
| Canada | 5 | 0.0% |
| Central America | 287 | 1.2% |
| China | 5 | 0.0% |
| Eastern Asia | 29 | 0.1% |
| Eastern Europe | 3 | 0.0% |
| England | 12 | 0.1% |
| Europe | 39 | 0.2% |
| France | 4 | 0.0% |
| Guatemala | 15 | 0.1% |
| Guyana | 11 | 0.0% |
| Indonesia | 43 | 0.2% |
| Korea | 24 | 0.1% |
| Latin America | 298 | 1.2% |
| Mexico | 272 | 1.1% |
| Netherlands | 9 | 0.0% |
| Northern Europe | 23 | 0.1% |
| South Africa | 8 | 0.0% |
| South America | 11 | 0.0% |
| South Eastern Asia | 43 | 0.2% |
| Sweden | 11 | 0.0% |
| Western Europe | 13 | 0.1% | View All 24 Rows |
Sex and Age in Randolph County
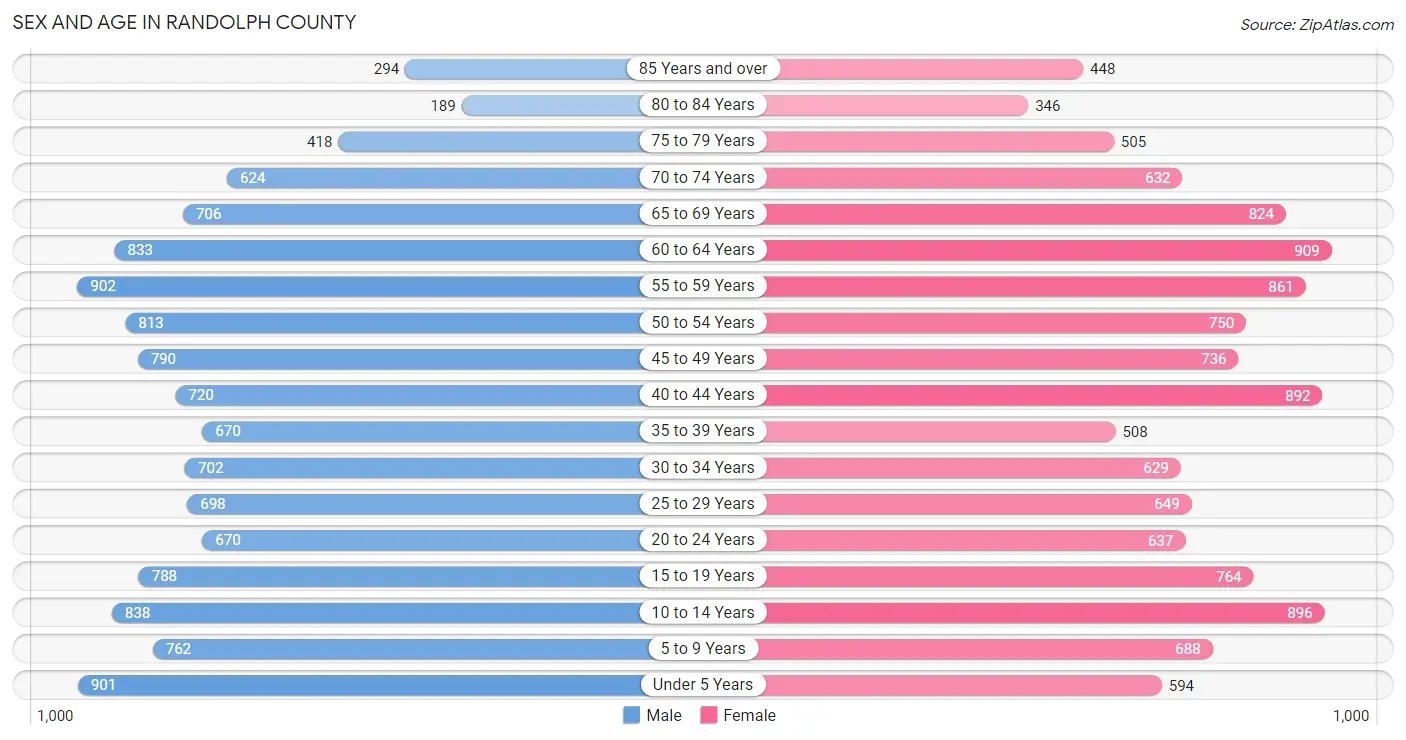
Sex and Age in Randolph County
The most populous age groups in Randolph County are 55 to 59 Years (902 | 7.3%) for men and 60 to 64 Years (909 | 7.4%) for women.
| Age Bracket | Male | Female |
| Under 5 Years | 901 (7.3%) | 594 (4.8%) |
| 5 to 9 Years | 762 (6.2%) | 688 (5.6%) |
| 10 to 14 Years | 838 (6.8%) | 896 (7.3%) |
| 15 to 19 Years | 788 (6.4%) | 764 (6.2%) |
| 20 to 24 Years | 670 (5.4%) | 637 (5.2%) |
| 25 to 29 Years | 698 (5.7%) | 649 (5.3%) |
| 30 to 34 Years | 702 (5.7%) | 629 (5.1%) |
| 35 to 39 Years | 670 (5.4%) | 508 (4.1%) |
| 40 to 44 Years | 720 (5.9%) | 892 (7.3%) |
| 45 to 49 Years | 790 (6.4%) | 736 (6.0%) |
| 50 to 54 Years | 813 (6.6%) | 750 (6.1%) |
| 55 to 59 Years | 902 (7.3%) | 861 (7.0%) |
| 60 to 64 Years | 833 (6.8%) | 909 (7.4%) |
| 65 to 69 Years | 706 (5.7%) | 824 (6.7%) |
| 70 to 74 Years | 624 (5.1%) | 632 (5.1%) |
| 75 to 79 Years | 418 (3.4%) | 505 (4.1%) |
| 80 to 84 Years | 189 (1.5%) | 346 (2.8%) |
| 85 Years and over | 294 (2.4%) | 448 (3.6%) |
| Total | 12,318 (100.0%) | 12,268 (100.0%) |
Families and Households in Randolph County
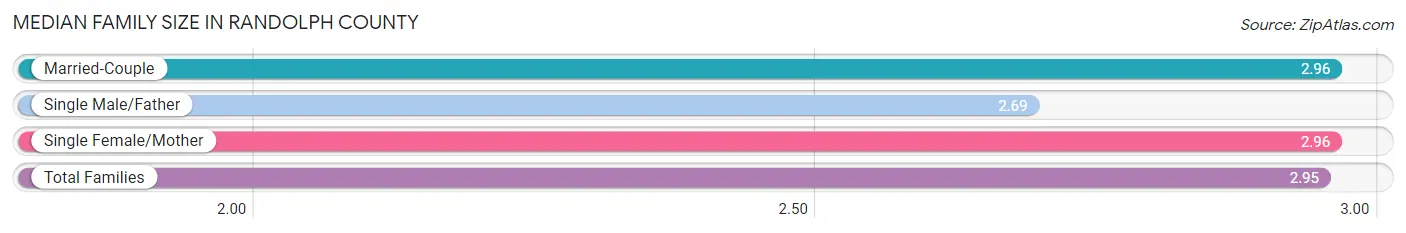
Median Family Size in Randolph County
The median family size in Randolph County is 2.95 persons per family, with married-couple families (4,905 | 76.0%) accounting for the largest median family size of 2.96 persons per family. On the other hand, single male/father families (433 | 6.7%) represent the smallest median family size with 2.69 persons per family.
| Family Type | # Families | Family Size |
| Married-Couple | 4,905 (76.0%) | 2.96 |
| Single Male/Father | 433 (6.7%) | 2.69 |
| Single Female/Mother | 1,119 (17.3%) | 2.96 |
| Total Families | 6,457 (100.0%) | 2.95 |
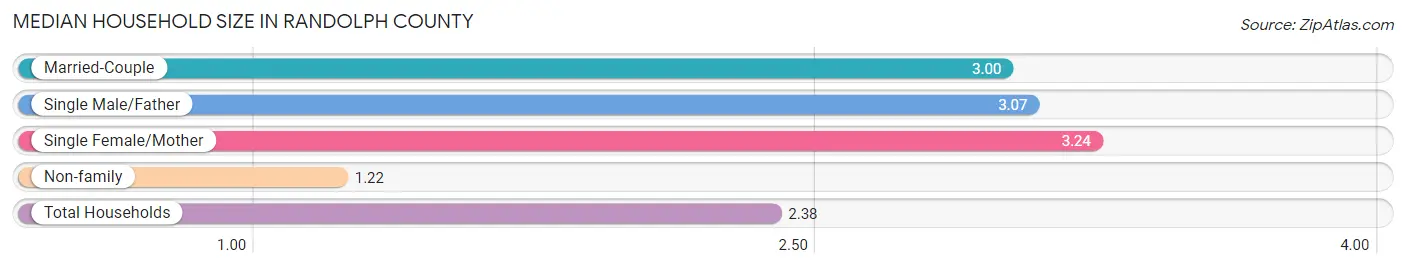
Median Household Size in Randolph County
The median household size in Randolph County is 2.38 persons per household, with single female/mother households (1,119 | 11.0%) accounting for the largest median household size of 3.24 persons per household. non-family households (3,734 | 36.6%) represent the smallest median household size with 1.22 persons per household.
| Household Type | # Households | Household Size |
| Married-Couple | 4,905 (48.1%) | 3.00 |
| Single Male/Father | 433 (4.3%) | 3.07 |
| Single Female/Mother | 1,119 (11.0%) | 3.24 |
| Non-family | 3,734 (36.6%) | 1.22 |
| Total Households | 10,191 (100.0%) | 2.38 |
Household Size by Marriage Status in Randolph County
Out of a total of 10,191 households in Randolph County, 6,457 (63.4%) are family households, while 3,734 (36.6%) are nonfamily households. The most numerous type of family households are 2-person households, comprising 3,171, and the most common type of nonfamily households are 1-person households, comprising 3,081.

| Household Size | Family Households | Nonfamily Households |
| 1-Person Households | - | 3,081 (30.2%) |
| 2-Person Households | 3,171 (31.1%) | 584 (5.7%) |
| 3-Person Households | 1,213 (11.9%) | 41 (0.4%) |
| 4-Person Households | 1,215 (11.9%) | 28 (0.3%) |
| 5-Person Households | 582 (5.7%) | 0 (0.0%) |
| 6-Person Households | 140 (1.4%) | 0 (0.0%) |
| 7+ Person Households | 136 (1.3%) | 0 (0.0%) |
| Total | 6,457 (63.4%) | 3,734 (36.6%) |
Female Fertility in Randolph County
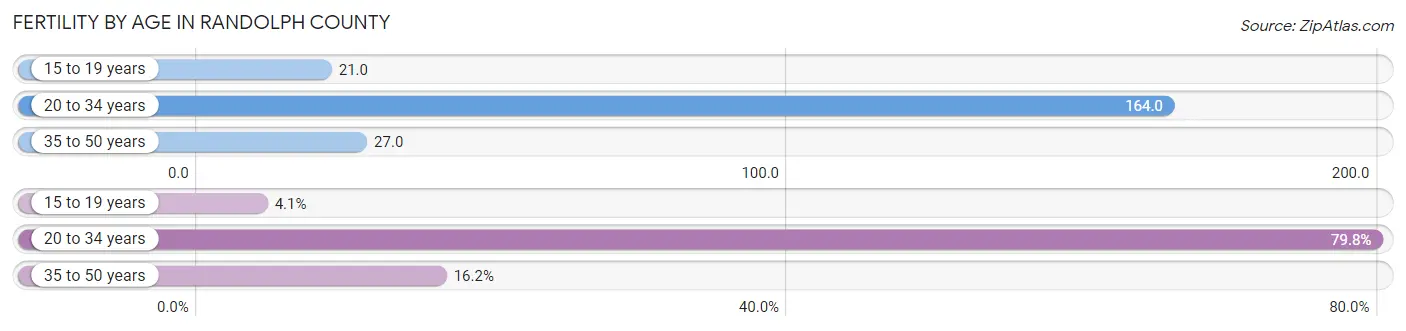
Fertility by Age in Randolph County
Average fertility rate in Randolph County is 78.0 births per 1,000 women. Women in the age bracket of 20 to 34 years have the highest fertility rate with 164.0 births per 1,000 women. Women in the age bracket of 20 to 34 years acount for 79.7% of all women with births.
| Age Bracket | Women with Births | Births / 1,000 Women |
| 15 to 19 years | 16 (4.1%) | 21.0 |
| 20 to 34 years | 315 (79.7%) | 164.0 |
| 35 to 50 years | 64 (16.2%) | 27.0 |
| Total | 395 (100.0%) | 78.0 |
Fertility by Age by Marriage Status in Randolph County
67.3% of women with births (395) in Randolph County are married. The highest percentage of unmarried women with births falls into 35 to 50 years age bracket with 65.6% of them unmarried at the time of birth, while the lowest percentage of unmarried women with births belong to 15 to 19 years age bracket with 18.8% of them unmarried.
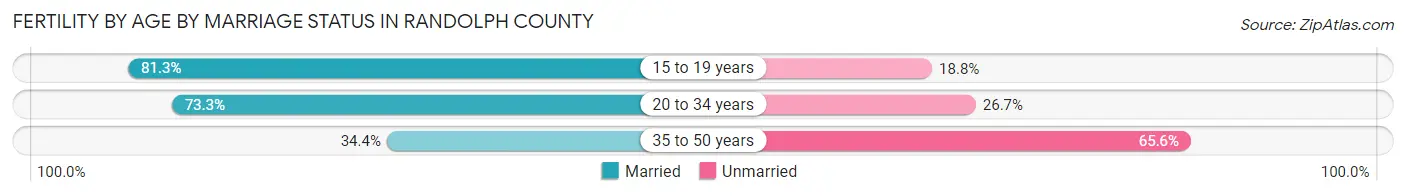
| Age Bracket | Married | Unmarried |
| 15 to 19 years | 13 (81.2%) | 3 (18.8%) |
| 20 to 34 years | 231 (73.3%) | 84 (26.7%) |
| 35 to 50 years | 22 (34.4%) | 42 (65.6%) |
| Total | 266 (67.3%) | 129 (32.7%) |
Fertility by Education in Randolph County
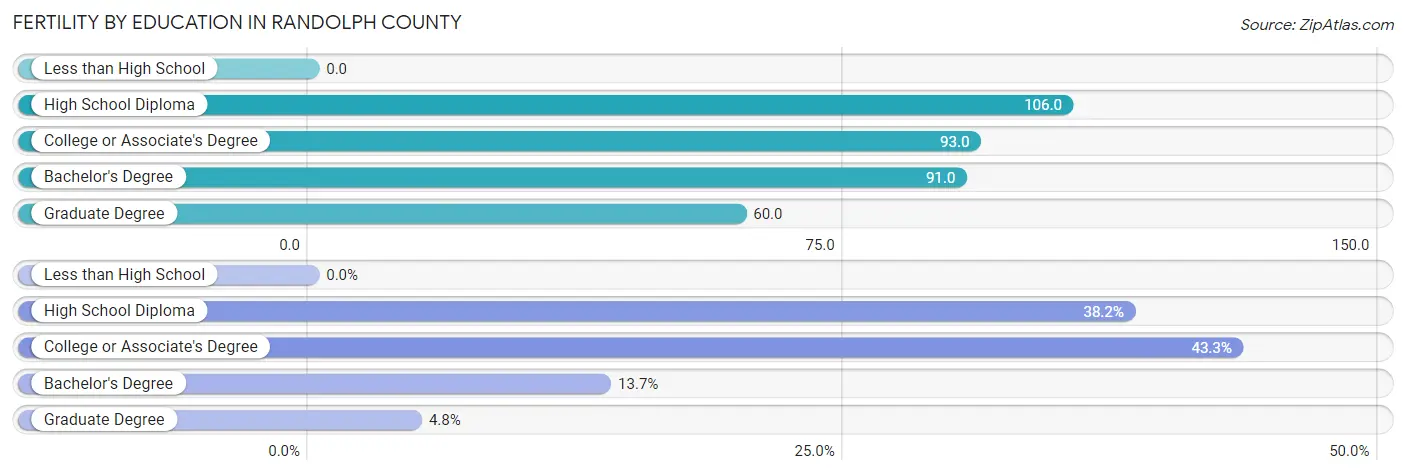
| Educational Attainment | Women with Births | Births / 1,000 Women |
| Less than High School | 0 (0.0%) | 0.0 |
| High School Diploma | 151 (38.2%) | 106.0 |
| College or Associate's Degree | 171 (43.3%) | 93.0 |
| Bachelor's Degree | 54 (13.7%) | 91.0 |
| Graduate Degree | 19 (4.8%) | 60.0 |
| Total | 395 (100.0%) | 78.0 |
Fertility by Education by Marriage Status in Randolph County
32.7% of women with births in Randolph County are unmarried. Women with the educational attainment of graduate degree are most likely to be married with 100.0% of them married at childbirth, while women with the educational attainment of college or associate's degree are least likely to be married with 51.5% of them unmarried at childbirth.
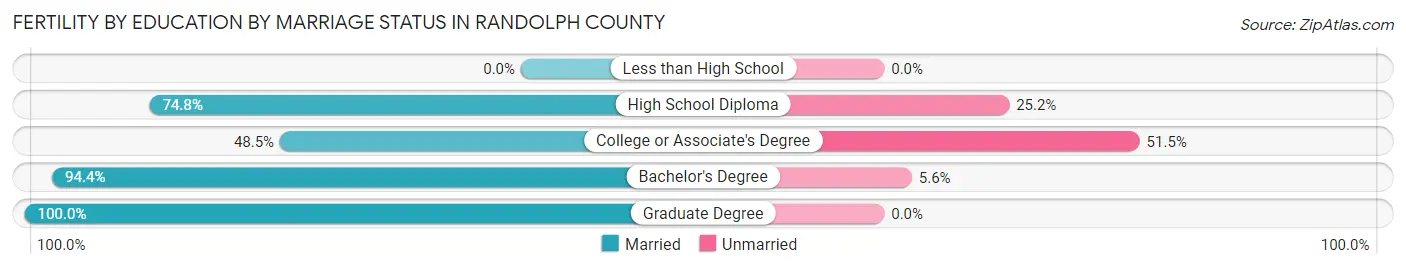
| Educational Attainment | Married | Unmarried |
| Less than High School | 0 (0.0%) | 0 (0.0%) |
| High School Diploma | 113 (74.8%) | 38 (25.2%) |
| College or Associate's Degree | 83 (48.5%) | 88 (51.5%) |
| Bachelor's Degree | 51 (94.4%) | 3 (5.6%) |
| Graduate Degree | 19 (100.0%) | 0 (0.0%) |
| Total | 266 (67.3%) | 129 (32.7%) |
Income in Randolph County
Income Overview in Randolph County
Per Capita Income in Randolph County is $30,253, while median incomes of families and households are $71,450 and $59,674 respectively.
| Characteristic | Number | Measure |
| Per Capita Income | 24,586 | $30,253 |
| Median Family Income | 6,457 | $71,450 |
| Mean Family Income | 6,457 | $84,541 |
| Median Household Income | 10,191 | $59,674 |
| Mean Household Income | 10,191 | $71,761 |
| Income Deficit | 6,457 | $11,289 |
| Wage / Income Gap (%) | 24,586 | 31.50% |
| Wage / Income Gap ($) | 24,586 | 68.50¢ per $1 |
| Gini / Inequality Index | 24,586 | 0.42 |
Earnings by Sex in Randolph County
Average Earnings in Randolph County are $36,613, $43,730 for men and $29,954 for women, a difference of 31.5%.
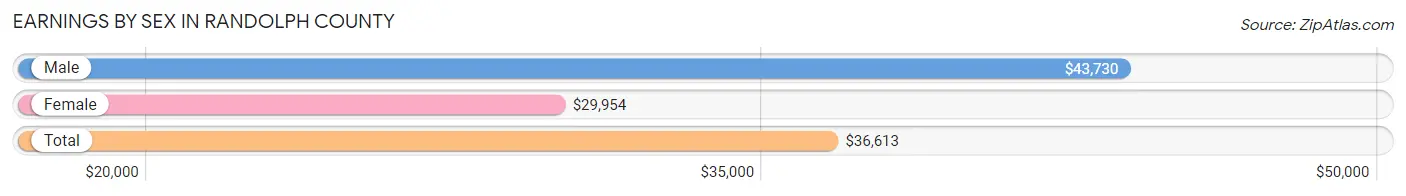
| Sex | Number | Average Earnings |
| Male | 6,479 (53.2%) | $43,730 |
| Female | 5,704 (46.8%) | $29,954 |
| Total | 12,183 (100.0%) | $36,613 |
Earnings by Sex by Income Bracket in Randolph County
The most common earnings brackets in Randolph County are $55,000 to $64,999 for men (635 | 9.8%) and $25,000 to $29,999 for women (562 | 9.9%).
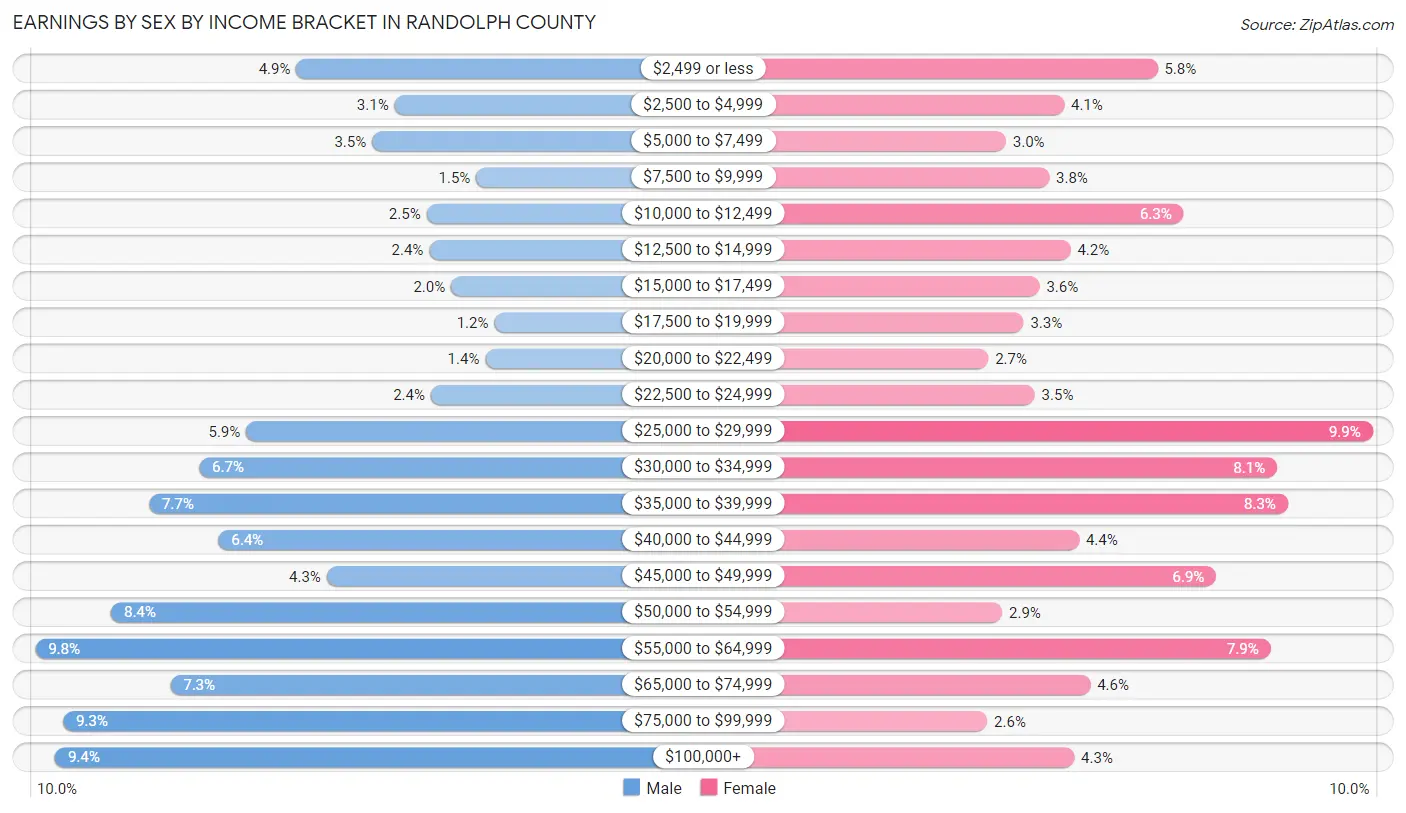
| Income | Male | Female |
| $2,499 or less | 318 (4.9%) | 332 (5.8%) |
| $2,500 to $4,999 | 199 (3.1%) | 232 (4.1%) |
| $5,000 to $7,499 | 226 (3.5%) | 170 (3.0%) |
| $7,500 to $9,999 | 100 (1.5%) | 216 (3.8%) |
| $10,000 to $12,499 | 160 (2.5%) | 360 (6.3%) |
| $12,500 to $14,999 | 157 (2.4%) | 239 (4.2%) |
| $15,000 to $17,499 | 130 (2.0%) | 206 (3.6%) |
| $17,500 to $19,999 | 78 (1.2%) | 189 (3.3%) |
| $20,000 to $22,499 | 89 (1.4%) | 151 (2.6%) |
| $22,500 to $24,999 | 155 (2.4%) | 201 (3.5%) |
| $25,000 to $29,999 | 379 (5.9%) | 562 (9.9%) |
| $30,000 to $34,999 | 436 (6.7%) | 460 (8.1%) |
| $35,000 to $39,999 | 497 (7.7%) | 471 (8.3%) |
| $40,000 to $44,999 | 413 (6.4%) | 248 (4.3%) |
| $45,000 to $49,999 | 281 (4.3%) | 395 (6.9%) |
| $50,000 to $54,999 | 543 (8.4%) | 166 (2.9%) |
| $55,000 to $64,999 | 635 (9.8%) | 453 (7.9%) |
| $65,000 to $74,999 | 471 (7.3%) | 260 (4.6%) |
| $75,000 to $99,999 | 601 (9.3%) | 150 (2.6%) |
| $100,000+ | 611 (9.4%) | 243 (4.3%) |
| Total | 6,479 (100.0%) | 5,704 (100.0%) |
Earnings by Sex by Educational Attainment in Randolph County
Average earnings in Randolph County are $49,674 for men and $34,203 for women, a difference of 31.1%. Men with an educational attainment of bachelor's degree enjoy the highest average annual earnings of $71,923, while those with less than high school education earn the least with $31,944. Women with an educational attainment of graduate degree earn the most with the average annual earnings of $62,357, while those with less than high school education have the smallest earnings of $19,091.
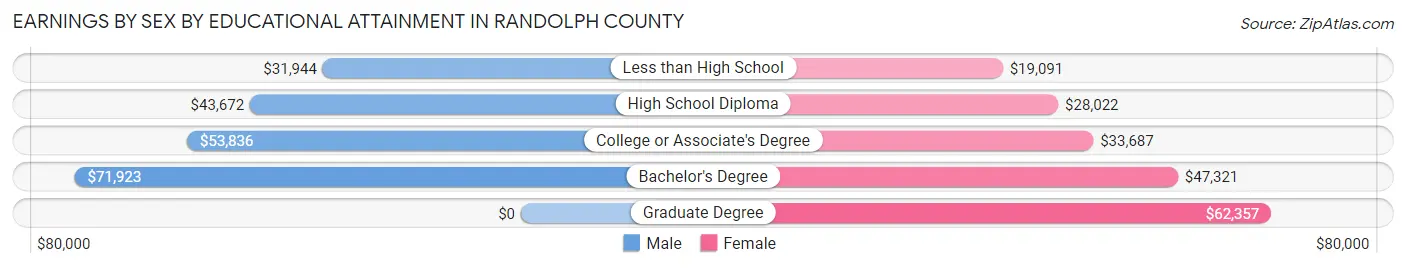
| Educational Attainment | Male Income | Female Income |
| Less than High School | $31,944 | $19,091 |
| High School Diploma | $43,672 | $28,022 |
| College or Associate's Degree | $53,836 | $33,687 |
| Bachelor's Degree | $71,923 | $47,321 |
| Graduate Degree | - | - |
| Total | $49,674 | $34,203 |
Family Income in Randolph County
Family Income Brackets in Randolph County
According to the Randolph County family income data, there are 1,388 families falling into the $50,000 to $74,999 income range, which is the most common income bracket and makes up 21.5% of all families. Conversely, the $10,000 to $14,999 income bracket is the least frequent group with only 161 families (2.5%) belonging to this category.
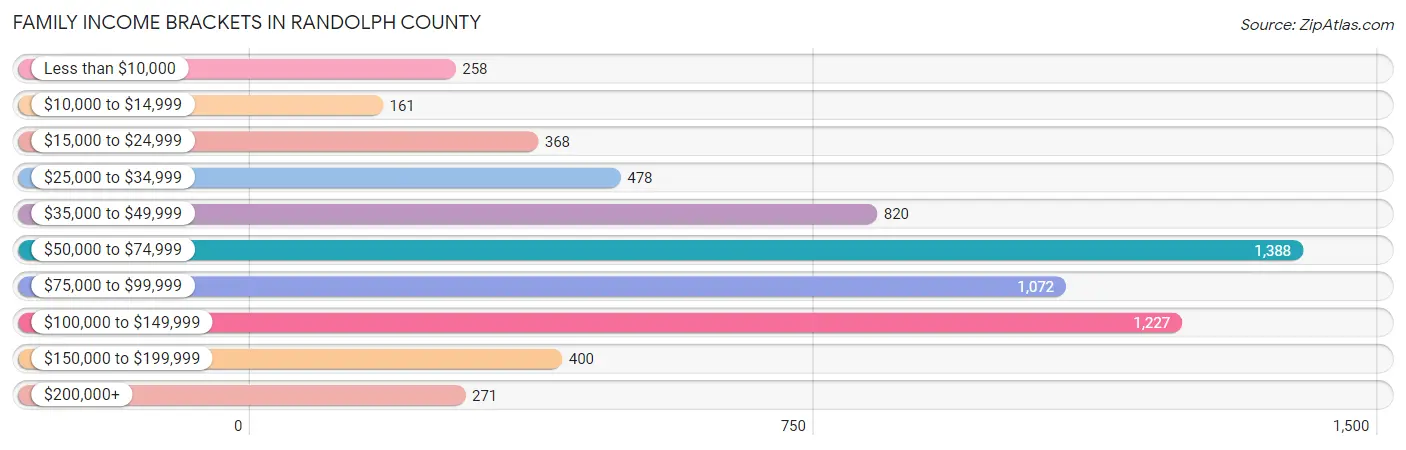
| Income Bracket | # Families | % Families |
| Less than $10,000 | 258 | 4.0% |
| $10,000 to $14,999 | 161 | 2.5% |
| $15,000 to $24,999 | 368 | 5.7% |
| $25,000 to $34,999 | 478 | 7.4% |
| $35,000 to $49,999 | 820 | 12.7% |
| $50,000 to $74,999 | 1,388 | 21.5% |
| $75,000 to $99,999 | 1,072 | 16.6% |
| $100,000 to $149,999 | 1,227 | 19.0% |
| $150,000 to $199,999 | 400 | 6.2% |
| $200,000+ | 271 | 4.2% |
Family Income by Famaliy Size in Randolph County
7+ person families (136 | 2.1%) account for the highest median family income in Randolph County with $92,298 per family, while 2-person families (3,344 | 51.8%) have the highest median income of $30,750 per family member.
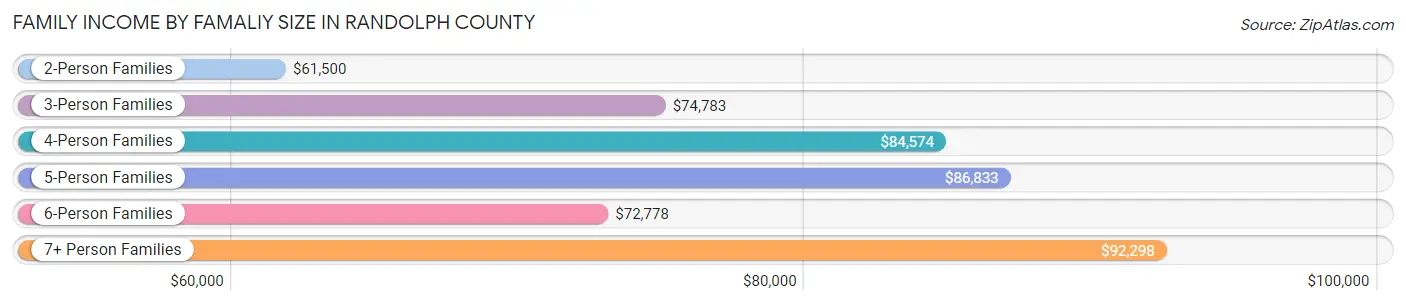
| Income Bracket | # Families | Median Income |
| 2-Person Families | 3,344 (51.8%) | $61,500 |
| 3-Person Families | 1,190 (18.4%) | $74,783 |
| 4-Person Families | 1,175 (18.2%) | $84,574 |
| 5-Person Families | 494 (7.6%) | $86,833 |
| 6-Person Families | 118 (1.8%) | $72,778 |
| 7+ Person Families | 136 (2.1%) | $92,298 |
| Total | 6,457 (100.0%) | $71,450 |
Family Income by Number of Earners in Randolph County
The median family income in Randolph County is $71,450, with families comprising 3+ earners (704) having the highest median family income of $115,667, while families with no earners (1,231) have the lowest median family income of $36,836, accounting for 10.9% and 19.1% of families, respectively.
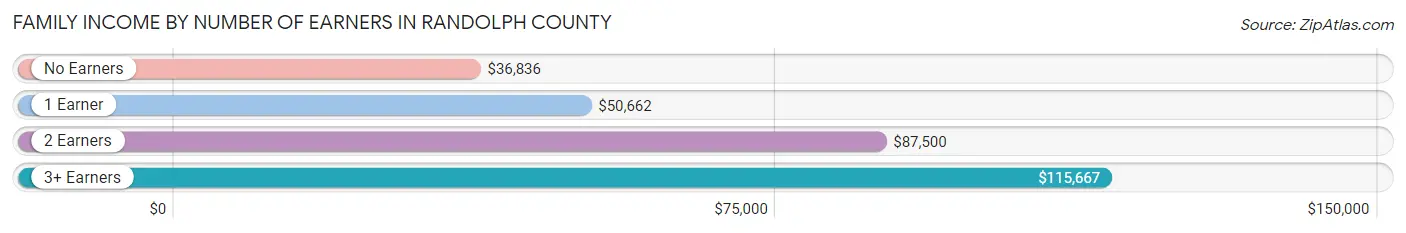
| Number of Earners | # Families | Median Income |
| No Earners | 1,231 (19.1%) | $36,836 |
| 1 Earner | 2,048 (31.7%) | $50,662 |
| 2 Earners | 2,474 (38.3%) | $87,500 |
| 3+ Earners | 704 (10.9%) | $115,667 |
| Total | 6,457 (100.0%) | $71,450 |
Household Income in Randolph County
Household Income Brackets in Randolph County
With 2,140 households falling in the category, the $50,000 to $74,999 income range is the most frequent in Randolph County, accounting for 21.0% of all households. In contrast, only 316 households (3.1%) fall into the $200,000+ income bracket, making it the least populous group.
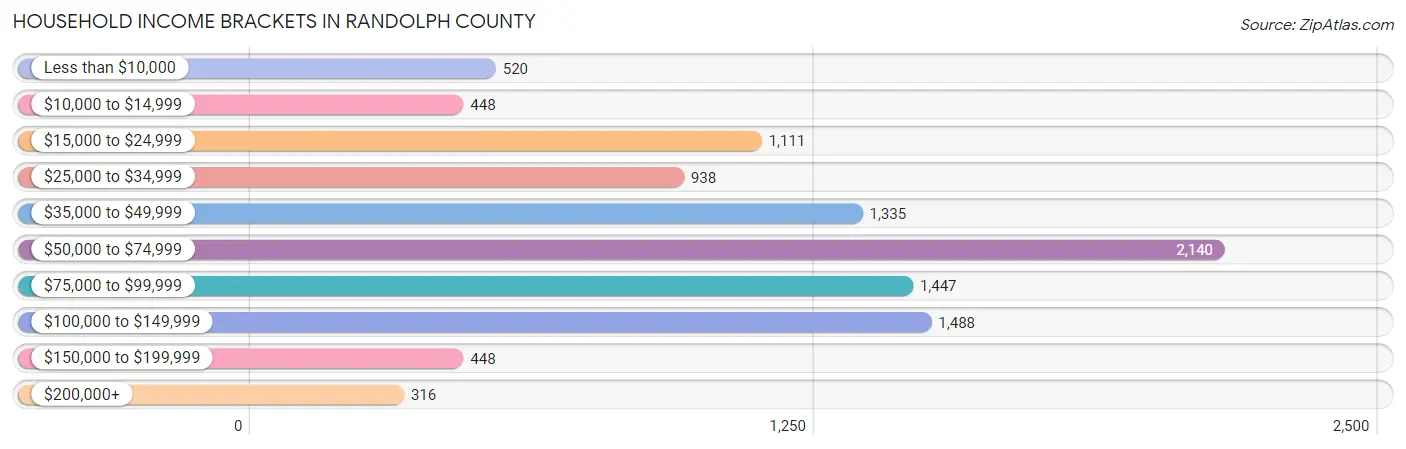
| Income Bracket | # Households | % Households |
| Less than $10,000 | 520 | 5.1% |
| $10,000 to $14,999 | 448 | 4.4% |
| $15,000 to $24,999 | 1,111 | 10.9% |
| $25,000 to $34,999 | 938 | 9.2% |
| $35,000 to $49,999 | 1,335 | 13.1% |
| $50,000 to $74,999 | 2,140 | 21.0% |
| $75,000 to $99,999 | 1,447 | 14.2% |
| $100,000 to $149,999 | 1,488 | 14.6% |
| $150,000 to $199,999 | 448 | 4.4% |
| $200,000+ | 316 | 3.1% |
Household Income by Householder Age in Randolph County
The median household income in Randolph County is $59,674, with the highest median household income of $69,538 found in the 25 to 44 years age bracket for the primary householder. A total of 2,748 households (27.0%) fall into this category. Meanwhile, the 15 to 24 years age bracket for the primary householder has the lowest median household income of $38,710, with 332 households (3.3%) in this group.

| Income Bracket | # Households | Median Income |
| 15 to 24 Years | 332 (3.3%) | $38,710 |
| 25 to 44 Years | 2,748 (27.0%) | $69,538 |
| 45 to 64 Years | 3,883 (38.1%) | $67,145 |
| 65+ Years | 3,228 (31.7%) | $44,492 |
| Total | 10,191 (100.0%) | $59,674 |
Poverty in Randolph County
Income Below Poverty by Sex and Age in Randolph County
With 11.4% poverty level for males and 14.7% for females among the residents of Randolph County, under 5 year old males and 5 year old females are the most vulnerable to poverty, with 234 males (29.8%) and 29 females (51.8%) in their respective age groups living below the poverty level.
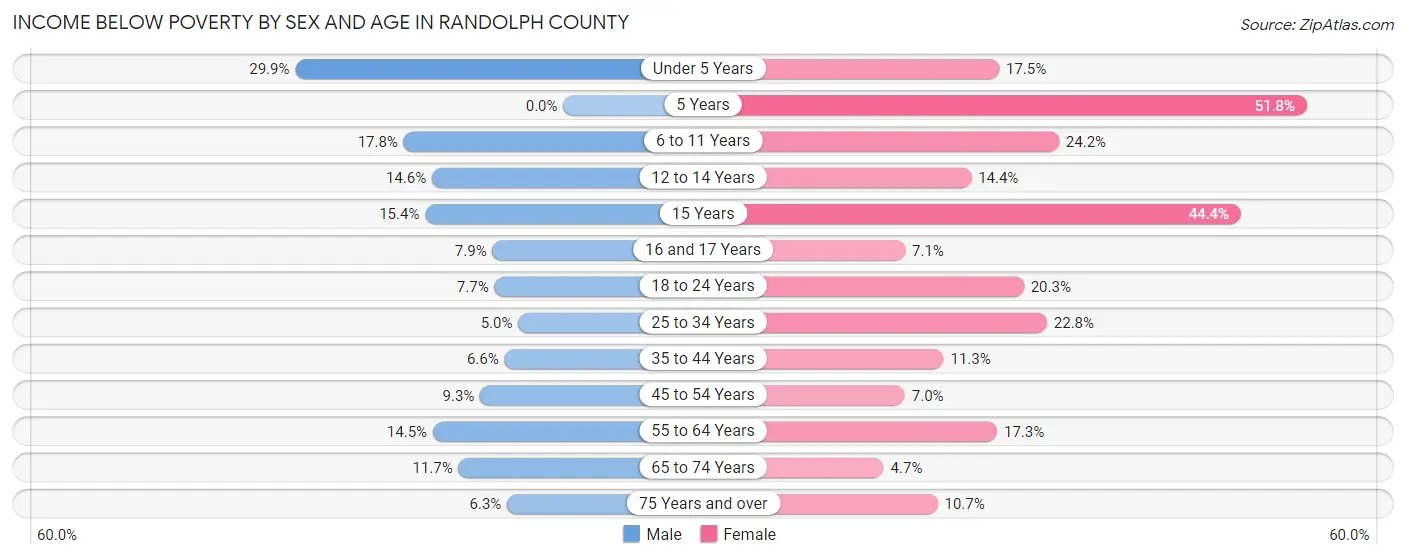
| Age Bracket | Male | Female |
| Under 5 Years | 234 (29.8%) | 104 (17.5%) |
| 5 Years | 0 (0.0%) | 29 (51.8%) |
| 6 to 11 Years | 179 (17.8%) | 214 (24.2%) |
| 12 to 14 Years | 66 (14.6%) | 85 (14.4%) |
| 15 Years | 30 (15.4%) | 76 (44.4%) |
| 16 and 17 Years | 24 (7.9%) | 22 (7.0%) |
| 18 to 24 Years | 73 (7.7%) | 186 (20.3%) |
| 25 to 34 Years | 69 (5.0%) | 291 (22.8%) |
| 35 to 44 Years | 90 (6.6%) | 158 (11.3%) |
| 45 to 54 Years | 147 (9.3%) | 104 (7.0%) |
| 55 to 64 Years | 251 (14.5%) | 306 (17.3%) |
| 65 to 74 Years | 155 (11.7%) | 66 (4.7%) |
| 75 Years and over | 53 (6.3%) | 122 (10.7%) |
| Total | 1,371 (11.4%) | 1,763 (14.7%) |
Income Above Poverty by Sex and Age in Randolph County
According to the poverty statistics in Randolph County, males aged 5 years and females aged 65 to 74 years are the age groups that are most secure financially, with 100.0% of males and 95.3% of females in these age groups living above the poverty line.
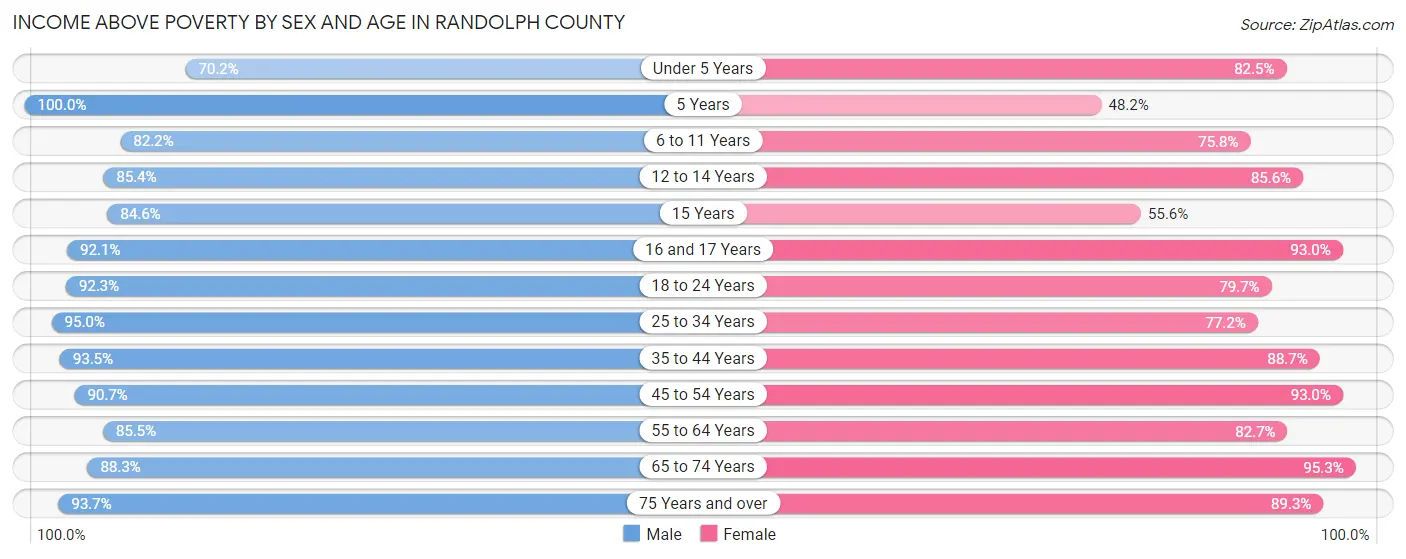
| Age Bracket | Male | Female |
| Under 5 Years | 550 (70.2%) | 490 (82.5%) |
| 5 Years | 104 (100.0%) | 27 (48.2%) |
| 6 to 11 Years | 828 (82.2%) | 671 (75.8%) |
| 12 to 14 Years | 385 (85.4%) | 505 (85.6%) |
| 15 Years | 165 (84.6%) | 95 (55.6%) |
| 16 and 17 Years | 280 (92.1%) | 290 (92.9%) |
| 18 to 24 Years | 879 (92.3%) | 732 (79.7%) |
| 25 to 34 Years | 1,306 (95.0%) | 983 (77.2%) |
| 35 to 44 Years | 1,284 (93.4%) | 1,237 (88.7%) |
| 45 to 54 Years | 1,440 (90.7%) | 1,377 (93.0%) |
| 55 to 64 Years | 1,476 (85.5%) | 1,464 (82.7%) |
| 65 to 74 Years | 1,173 (88.3%) | 1,350 (95.3%) |
| 75 Years and over | 794 (93.7%) | 1,023 (89.3%) |
| Total | 10,664 (88.6%) | 10,244 (85.3%) |
Income Below Poverty Among Married-Couple Families in Randolph County
The poverty statistics for married-couple families in Randolph County show that 4.2% or 208 of the total 4,905 families live below the poverty line. Families with 5 or more children have the highest poverty rate of 100.0%, comprising of 3 families. On the other hand, families with 1 or 2 children have the lowest poverty rate of 1.9%, which includes 27 families.
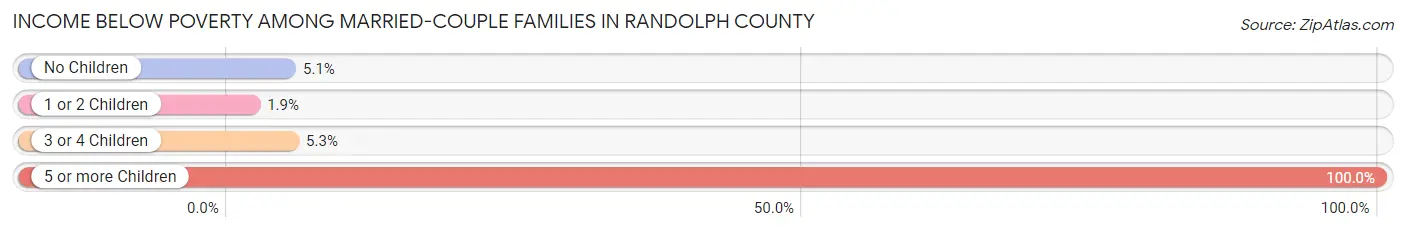
| Children | Above Poverty | Below Poverty |
| No Children | 2,895 (95.0%) | 154 (5.1%) |
| 1 or 2 Children | 1,375 (98.1%) | 27 (1.9%) |
| 3 or 4 Children | 427 (94.7%) | 24 (5.3%) |
| 5 or more Children | 0 (0.0%) | 3 (100.0%) |
| Total | 4,697 (95.8%) | 208 (4.2%) |
Income Below Poverty Among Single-Parent Households in Randolph County
According to the poverty data in Randolph County, 19.6% or 85 single-father households and 33.1% or 370 single-mother households are living below the poverty line. Among single-father households, those with 3 or 4 children have the highest poverty rate, with 32 households (76.2%) experiencing poverty. Likewise, among single-mother households, those with 5 or more children have the highest poverty rate, with 8 households (80.0%) falling below the poverty line.

| Children | Single Father | Single Mother |
| No Children | 5 (3.7%) | 17 (4.4%) |
| 1 or 2 Children | 48 (18.7%) | 235 (43.0%) |
| 3 or 4 Children | 32 (76.2%) | 110 (62.5%) |
| 5 or more Children | 0 (0.0%) | 8 (80.0%) |
| Total | 85 (19.6%) | 370 (33.1%) |
Income Below Poverty Among Married-Couple vs Single-Parent Households in Randolph County
The poverty data for Randolph County shows that 208 of the married-couple family households (4.2%) and 455 of the single-parent households (29.3%) are living below the poverty level. Within the married-couple family households, those with 5 or more children have the highest poverty rate, with 3 households (100.0%) falling below the poverty line. Among the single-parent households, those with 5 or more children have the highest poverty rate, with 8 household (80.0%) living below poverty.
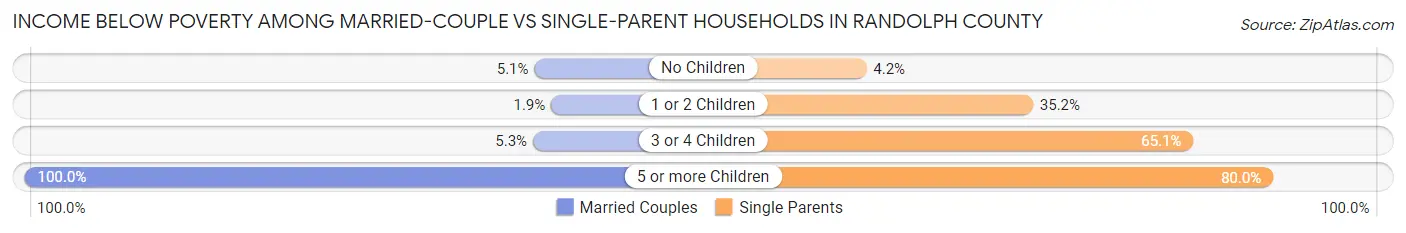
| Children | Married-Couple Families | Single-Parent Households |
| No Children | 154 (5.1%) | 22 (4.2%) |
| 1 or 2 Children | 27 (1.9%) | 283 (35.2%) |
| 3 or 4 Children | 24 (5.3%) | 142 (65.1%) |
| 5 or more Children | 3 (100.0%) | 8 (80.0%) |
| Total | 208 (4.2%) | 455 (29.3%) |
Employment Characteristics in Randolph County
Employment by Class of Employer in Randolph County
Among the 10,613 employed individuals in Randolph County, private company employees (7,380 | 69.5%), local government employees (983 | 9.3%), and not-for-profit organizations (847 | 8.0%) make up the most common classes of employment.
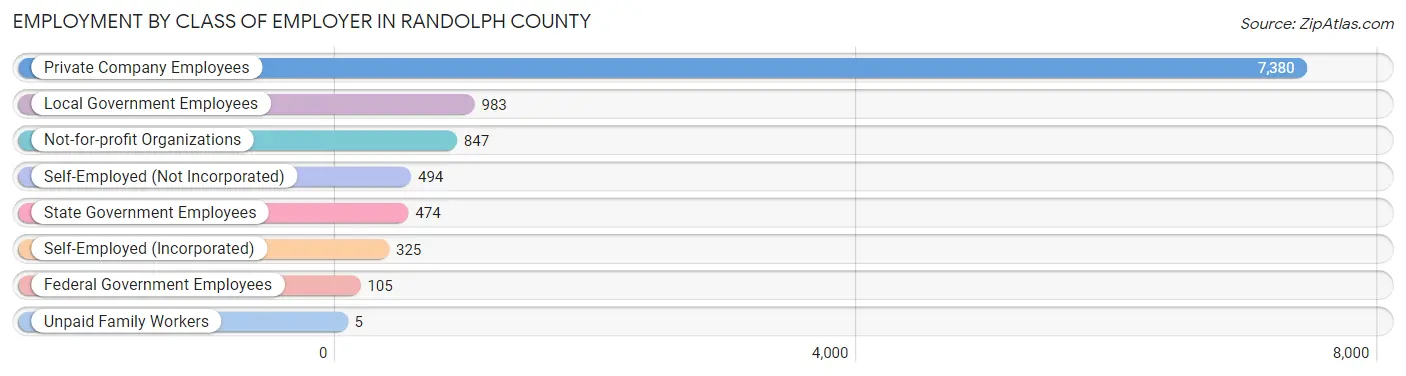
| Employer Class | # Employees | % Employees |
| Private Company Employees | 7,380 | 69.5% |
| Self-Employed (Incorporated) | 325 | 3.1% |
| Self-Employed (Not Incorporated) | 494 | 4.6% |
| Not-for-profit Organizations | 847 | 8.0% |
| Local Government Employees | 983 | 9.3% |
| State Government Employees | 474 | 4.5% |
| Federal Government Employees | 105 | 1.0% |
| Unpaid Family Workers | 5 | 0.1% |
| Total | 10,613 | 100.0% |
Employment Status by Age in Randolph County
According to the labor force statistics for Randolph County, out of the total population over 16 years of age (19,541), 60.2% or 11,764 individuals are in the labor force, with 5.6% or 659 of them unemployed. The age group with the highest labor force participation rate is 35 to 44 years, with 85.2% or 2,377 individuals in the labor force. Within the labor force, the 20 to 24 years age range has the highest percentage of unemployed individuals, with 13.2% or 147 of them being unemployed.
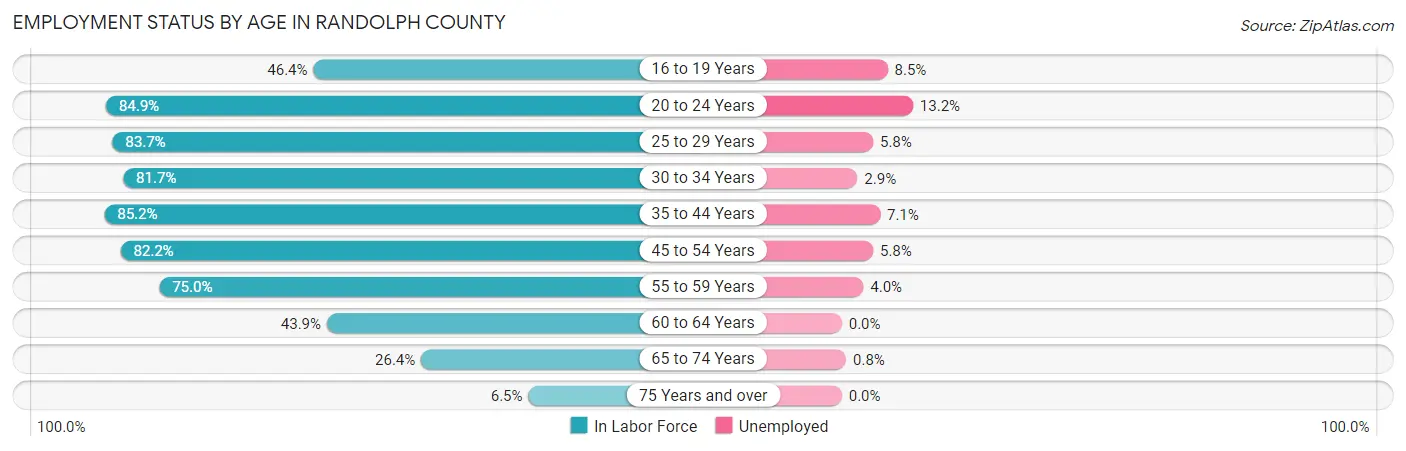
| Age Bracket | In Labor Force | Unemployed |
| 16 to 19 Years | 550 (46.4%) | 47 (8.5%) |
| 20 to 24 Years | 1,110 (84.9%) | 147 (13.2%) |
| 25 to 29 Years | 1,127 (83.7%) | 65 (5.8%) |
| 30 to 34 Years | 1,087 (81.7%) | 32 (2.9%) |
| 35 to 44 Years | 2,377 (85.2%) | 169 (7.1%) |
| 45 to 54 Years | 2,539 (82.2%) | 147 (5.8%) |
| 55 to 59 Years | 1,322 (75.0%) | 53 (4.0%) |
| 60 to 64 Years | 765 (43.9%) | 0 (0.0%) |
| 65 to 74 Years | 736 (26.4%) | 6 (0.8%) |
| 75 Years and over | 143 (6.5%) | 0 (0.0%) |
| Total | 11,764 (60.2%) | 659 (5.6%) |
Employment Status by Educational Attainment in Randolph County
According to labor force statistics for Randolph County, 76.4% of individuals (9,215) out of the total population between 25 and 64 years of age (12,062) are in the labor force, with 5.0% or 461 of them being unemployed. The group with the highest labor force participation rate are those with the educational attainment of bachelor's degree or higher, with 88.4% or 1,675 individuals in the labor force. Within the labor force, individuals with less than high school education have the highest percentage of unemployment, with 12.3% or 62 of them being unemployed.
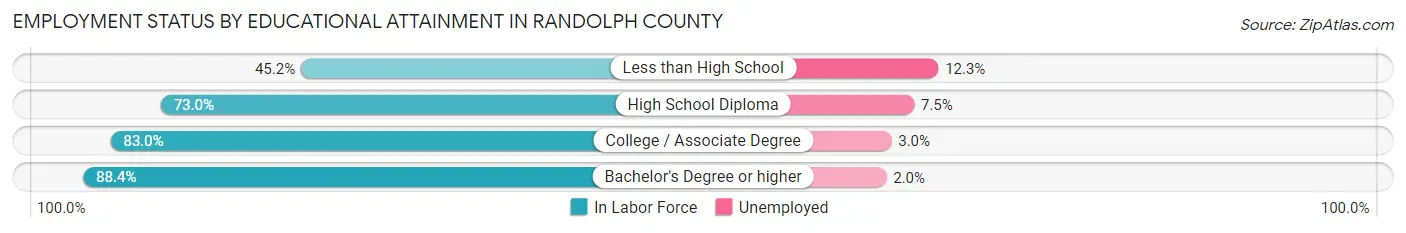
| Educational Attainment | In Labor Force | Unemployed |
| Less than High School | 503 (45.2%) | 137 (12.3%) |
| High School Diploma | 3,490 (73.0%) | 359 (7.5%) |
| College / Associate Degree | 3,547 (83.0%) | 128 (3.0%) |
| Bachelor's Degree or higher | 1,675 (88.4%) | 38 (2.0%) |
| Total | 9,215 (76.4%) | 603 (5.0%) |
Employment Occupations by Sex in Randolph County
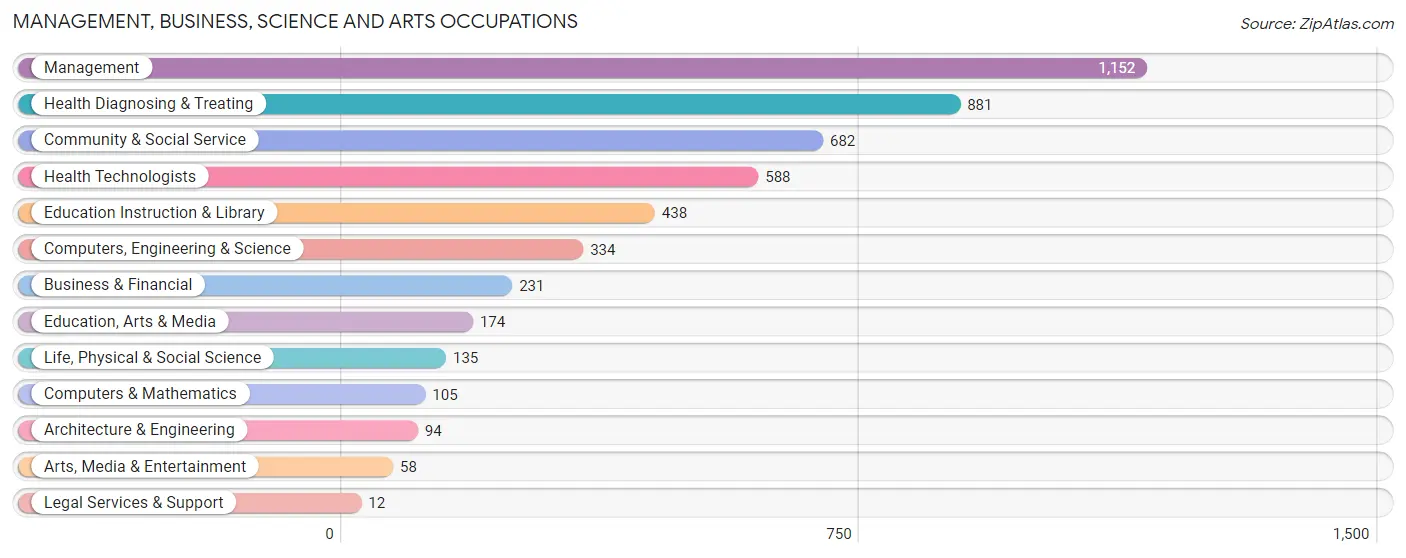
Management, Business, Science and Arts Occupations
The most common Management, Business, Science and Arts occupations in Randolph County are Management (1,152 | 10.4%), Health Diagnosing & Treating (881 | 8.0%), Community & Social Service (682 | 6.2%), Health Technologists (588 | 5.3%), and Education Instruction & Library (438 | 4.0%).
Management, Business, Science and Arts Occupations by Sex
Within the Management, Business, Science and Arts occupations in Randolph County, the most male-oriented occupations are Architecture & Engineering (97.9%), Computers & Mathematics (79.0%), and Computers, Engineering & Science (75.4%), while the most female-oriented occupations are Legal Services & Support (100.0%), Health Diagnosing & Treating (89.1%), and Health Technologists (88.3%).

| Occupation | Male | Female |
| Management | 763 (66.2%) | 389 (33.8%) |
| Business & Financial | 73 (31.6%) | 158 (68.4%) |
| Computers, Engineering & Science | 252 (75.4%) | 82 (24.5%) |
| Computers & Mathematics | 83 (79.0%) | 22 (20.9%) |
| Architecture & Engineering | 92 (97.9%) | 2 (2.1%) |
| Life, Physical & Social Science | 77 (57.0%) | 58 (43.0%) |
| Community & Social Service | 169 (24.8%) | 513 (75.2%) |
| Education, Arts & Media | 63 (36.2%) | 111 (63.8%) |
| Legal Services & Support | 0 (0.0%) | 12 (100.0%) |
| Education Instruction & Library | 97 (22.2%) | 341 (77.8%) |
| Arts, Media & Entertainment | 9 (15.5%) | 49 (84.5%) |
| Health Diagnosing & Treating | 96 (10.9%) | 785 (89.1%) |
| Health Technologists | 69 (11.7%) | 519 (88.3%) |
| Total (Category) | 1,353 (41.2%) | 1,927 (58.8%) |
| Total (Overall) | 5,786 (52.2%) | 5,289 (47.8%) |
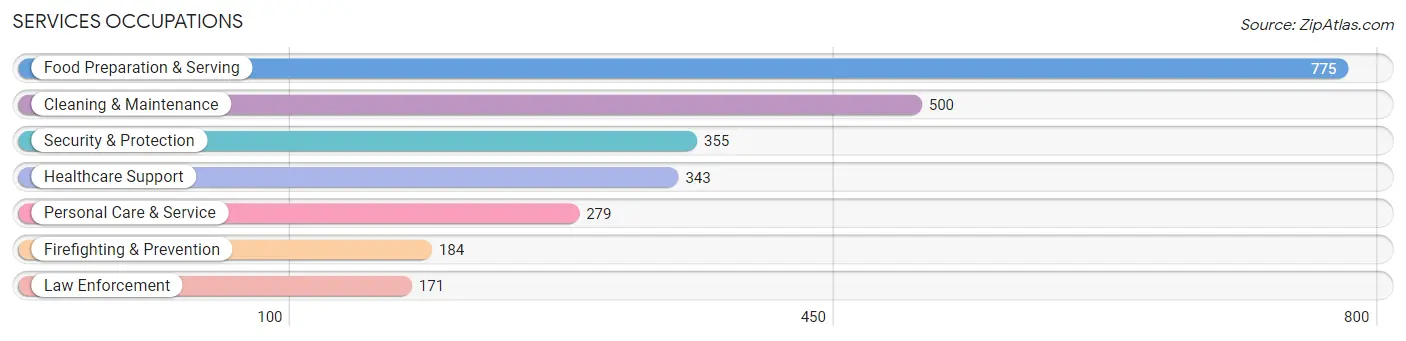
Services Occupations
The most common Services occupations in Randolph County are Food Preparation & Serving (775 | 7.0%), Cleaning & Maintenance (500 | 4.5%), Security & Protection (355 | 3.2%), Healthcare Support (343 | 3.1%), and Personal Care & Service (279 | 2.5%).
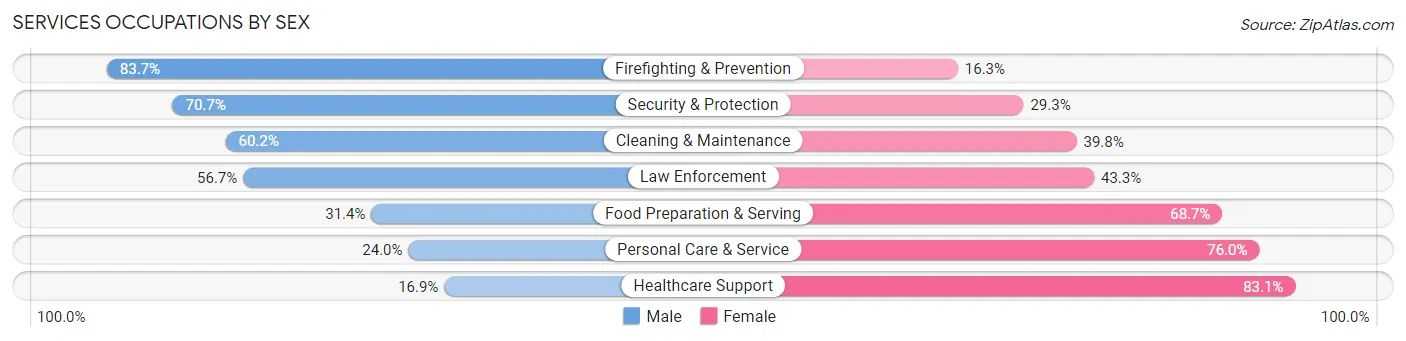
Services Occupations by Sex
Within the Services occupations in Randolph County, the most male-oriented occupations are Firefighting & Prevention (83.7%), Security & Protection (70.7%), and Cleaning & Maintenance (60.2%), while the most female-oriented occupations are Healthcare Support (83.1%), Personal Care & Service (76.0%), and Food Preparation & Serving (68.6%).
| Occupation | Male | Female |
| Healthcare Support | 58 (16.9%) | 285 (83.1%) |
| Security & Protection | 251 (70.7%) | 104 (29.3%) |
| Firefighting & Prevention | 154 (83.7%) | 30 (16.3%) |
| Law Enforcement | 97 (56.7%) | 74 (43.3%) |
| Food Preparation & Serving | 243 (31.4%) | 532 (68.6%) |
| Cleaning & Maintenance | 301 (60.2%) | 199 (39.8%) |
| Personal Care & Service | 67 (24.0%) | 212 (76.0%) |
| Total (Category) | 920 (40.8%) | 1,332 (59.2%) |
| Total (Overall) | 5,786 (52.2%) | 5,289 (47.8%) |
Sales and Office Occupations
The most common Sales and Office occupations in Randolph County are Office & Administration (963 | 8.7%), and Sales & Related (682 | 6.2%).
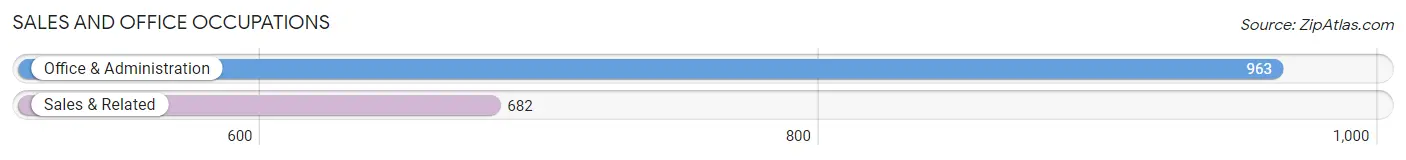
Sales and Office Occupations by Sex
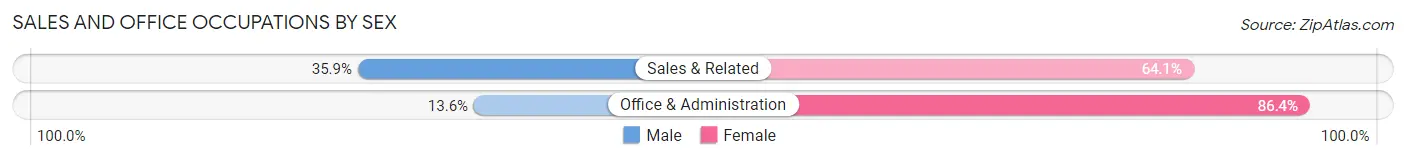
| Occupation | Male | Female |
| Sales & Related | 245 (35.9%) | 437 (64.1%) |
| Office & Administration | 131 (13.6%) | 832 (86.4%) |
| Total (Category) | 376 (22.9%) | 1,269 (77.1%) |
| Total (Overall) | 5,786 (52.2%) | 5,289 (47.8%) |
Natural Resources, Construction and Maintenance Occupations
The most common Natural Resources, Construction and Maintenance occupations in Randolph County are Construction & Extraction (624 | 5.6%), Installation, Maintenance & Repair (448 | 4.1%), and Farming, Fishing & Forestry (163 | 1.5%).

Natural Resources, Construction and Maintenance Occupations by Sex
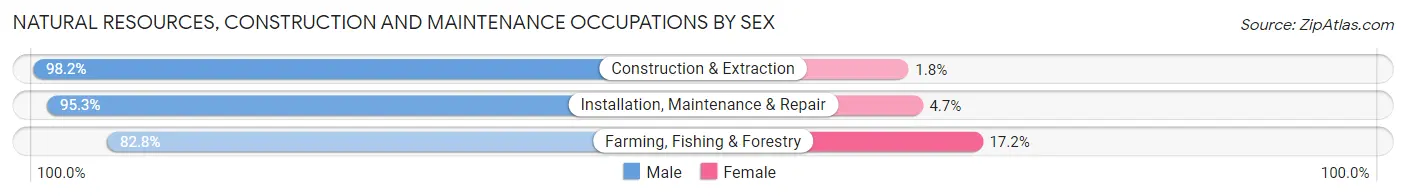
| Occupation | Male | Female |
| Farming, Fishing & Forestry | 135 (82.8%) | 28 (17.2%) |
| Construction & Extraction | 613 (98.2%) | 11 (1.8%) |
| Installation, Maintenance & Repair | 427 (95.3%) | 21 (4.7%) |
| Total (Category) | 1,175 (95.1%) | 60 (4.9%) |
| Total (Overall) | 5,786 (52.2%) | 5,289 (47.8%) |
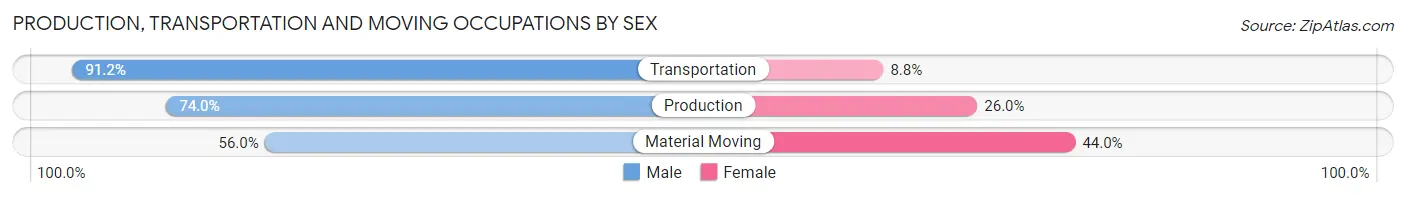
Production, Transportation and Moving Occupations
The most common Production, Transportation and Moving occupations in Randolph County are Production (1,683 | 15.2%), Material Moving (502 | 4.5%), and Transportation (478 | 4.3%).
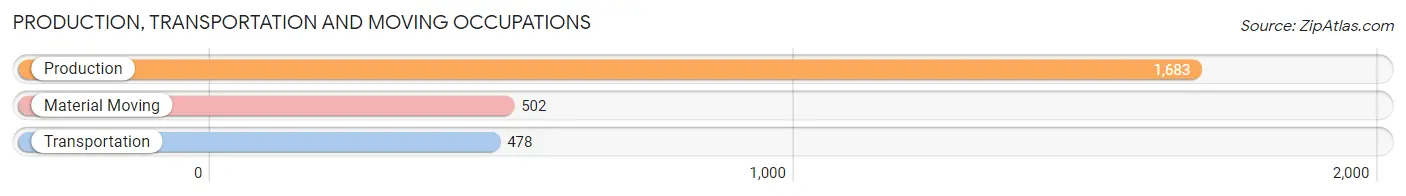
Production, Transportation and Moving Occupations by Sex
| Occupation | Male | Female |
| Production | 1,245 (74.0%) | 438 (26.0%) |
| Transportation | 436 (91.2%) | 42 (8.8%) |
| Material Moving | 281 (56.0%) | 221 (44.0%) |
| Total (Category) | 1,962 (73.7%) | 701 (26.3%) |
| Total (Overall) | 5,786 (52.2%) | 5,289 (47.8%) |
Employment Industries by Sex in Randolph County
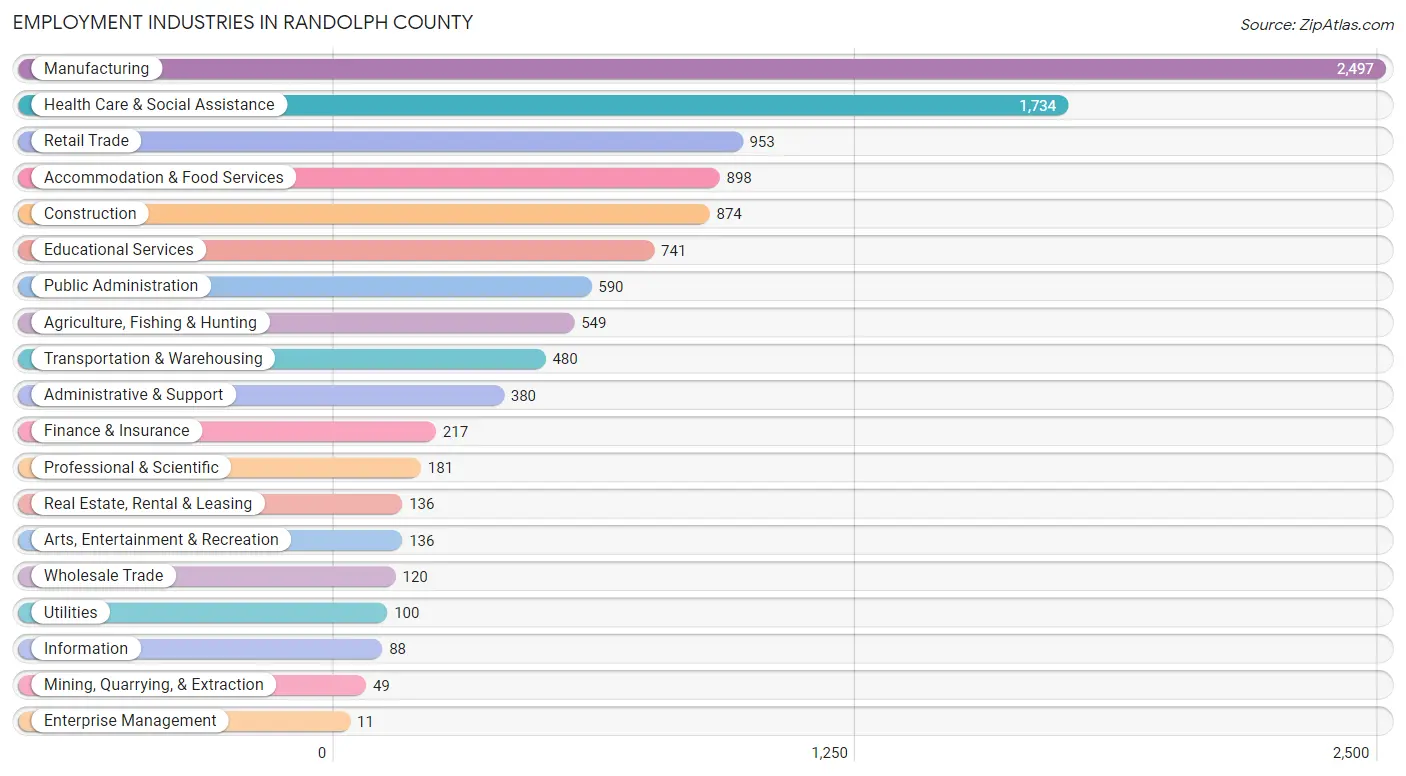
Employment Industries in Randolph County
The major employment industries in Randolph County include Manufacturing (2,497 | 22.6%), Health Care & Social Assistance (1,734 | 15.7%), Retail Trade (953 | 8.6%), Accommodation & Food Services (898 | 8.1%), and Construction (874 | 7.9%).
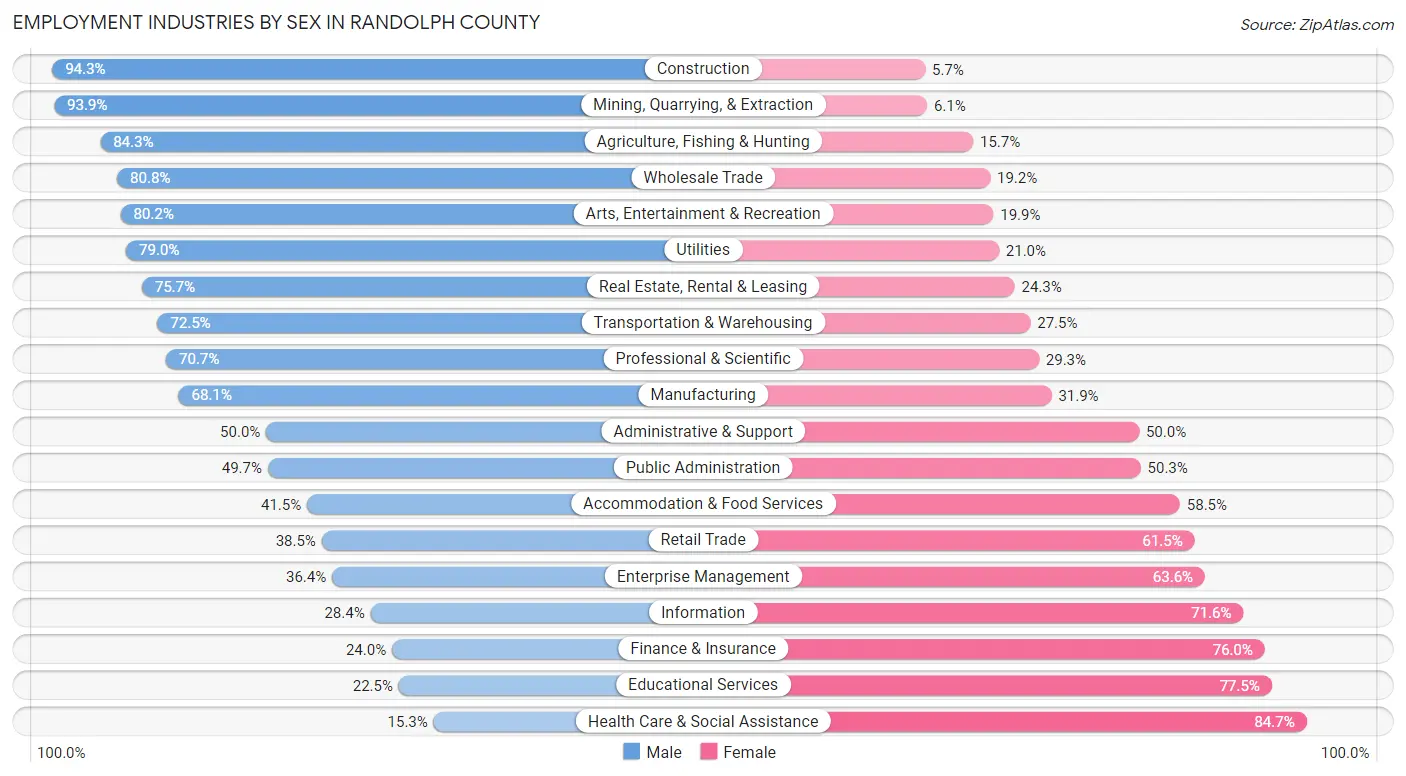
Employment Industries by Sex in Randolph County
The Randolph County industries that see more men than women are Construction (94.3%), Mining, Quarrying, & Extraction (93.9%), and Agriculture, Fishing & Hunting (84.3%), whereas the industries that tend to have a higher number of women are Health Care & Social Assistance (84.7%), Educational Services (77.5%), and Finance & Insurance (76.0%).
| Industry | Male | Female |
| Agriculture, Fishing & Hunting | 463 (84.3%) | 86 (15.7%) |
| Mining, Quarrying, & Extraction | 46 (93.9%) | 3 (6.1%) |
| Construction | 824 (94.3%) | 50 (5.7%) |
| Manufacturing | 1,701 (68.1%) | 796 (31.9%) |
| Wholesale Trade | 97 (80.8%) | 23 (19.2%) |
| Retail Trade | 367 (38.5%) | 586 (61.5%) |
| Transportation & Warehousing | 348 (72.5%) | 132 (27.5%) |
| Utilities | 79 (79.0%) | 21 (21.0%) |
| Information | 25 (28.4%) | 63 (71.6%) |
| Finance & Insurance | 52 (24.0%) | 165 (76.0%) |
| Real Estate, Rental & Leasing | 103 (75.7%) | 33 (24.3%) |
| Professional & Scientific | 128 (70.7%) | 53 (29.3%) |
| Enterprise Management | 4 (36.4%) | 7 (63.6%) |
| Administrative & Support | 190 (50.0%) | 190 (50.0%) |
| Educational Services | 167 (22.5%) | 574 (77.5%) |
| Health Care & Social Assistance | 266 (15.3%) | 1,468 (84.7%) |
| Arts, Entertainment & Recreation | 109 (80.1%) | 27 (19.9%) |
| Accommodation & Food Services | 373 (41.5%) | 525 (58.5%) |
| Public Administration | 293 (49.7%) | 297 (50.3%) |
| Total | 5,786 (52.2%) | 5,289 (47.8%) |
Education in Randolph County
School Enrollment in Randolph County
The most common levels of schooling among the 5,270 students in Randolph County are middle school (1,343 | 25.5%), high school (1,333 | 25.3%), and elementary school (1,282 | 24.3%).

| School Level | # Students | % Students |
| Nursery / Preschool | 249 | 4.7% |
| Kindergarten | 222 | 4.2% |
| Elementary School | 1,282 | 24.3% |
| Middle School | 1,343 | 25.5% |
| High School | 1,333 | 25.3% |
| College / Undergraduate | 628 | 11.9% |
| Graduate / Professional | 213 | 4.0% |
| Total | 5,270 | 100.0% |
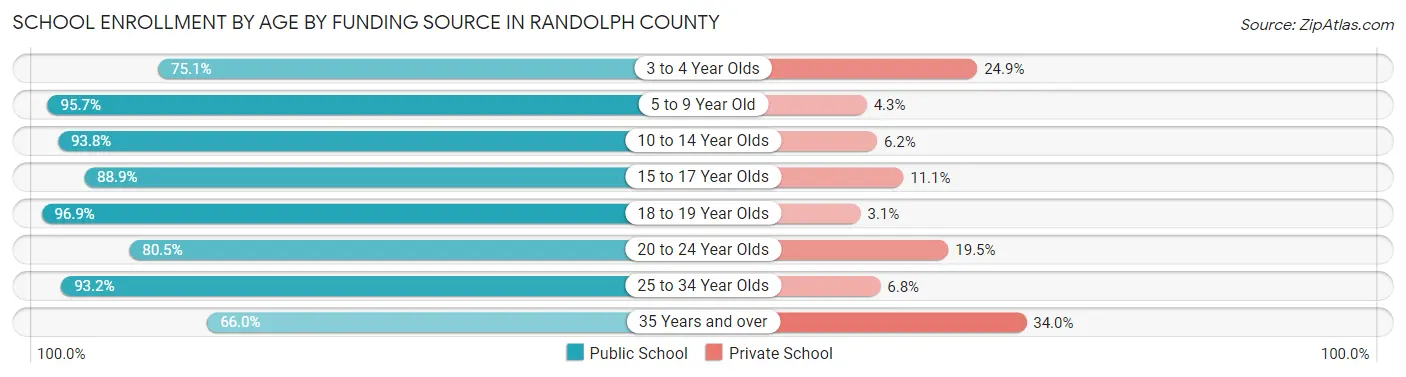
School Enrollment by Age by Funding Source in Randolph County
Out of a total of 5,270 students who are enrolled in schools in Randolph County, 474 (9.0%) attend a private institution, while the remaining 4,796 (91.0%) are enrolled in public schools. The age group of 35 years and over has the highest likelihood of being enrolled in private schools, with 83 (34.0% in the age bracket) enrolled. Conversely, the age group of 18 to 19 year olds has the lowest likelihood of being enrolled in a private school, with 370 (96.9% in the age bracket) attending a public institution.
| Age Bracket | Public School | Private School |
| 3 to 4 Year Olds | 163 (75.1%) | 54 (24.9%) |
| 5 to 9 Year Old | 1,294 (95.7%) | 58 (4.3%) |
| 10 to 14 Year Olds | 1,523 (93.8%) | 101 (6.2%) |
| 15 to 17 Year Olds | 865 (88.9%) | 108 (11.1%) |
| 18 to 19 Year Olds | 370 (96.9%) | 12 (3.1%) |
| 20 to 24 Year Olds | 161 (80.5%) | 39 (19.5%) |
| 25 to 34 Year Olds | 259 (93.2%) | 19 (6.8%) |
| 35 Years and over | 161 (66.0%) | 83 (34.0%) |
| Total | 4,796 (91.0%) | 474 (9.0%) |
Educational Attainment by Field of Study in Randolph County
Science & technology (619 | 22.6%), education (536 | 19.5%), business (372 | 13.6%), arts & humanities (218 | 7.9%), and computers & mathematics (196 | 7.1%) are the most common fields of study among 2,745 individuals in Randolph County who have obtained a bachelor's degree or higher.
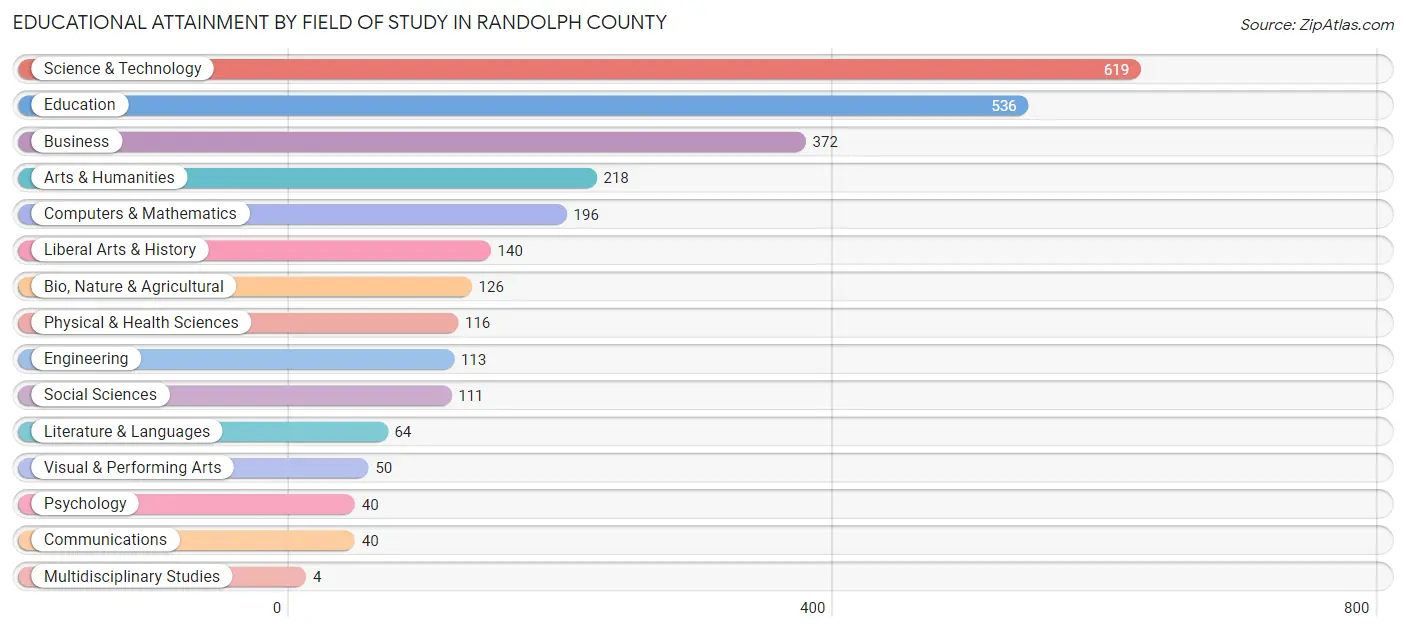
| Field of Study | # Graduates | % Graduates |
| Computers & Mathematics | 196 | 7.1% |
| Bio, Nature & Agricultural | 126 | 4.6% |
| Physical & Health Sciences | 116 | 4.2% |
| Psychology | 40 | 1.5% |
| Social Sciences | 111 | 4.0% |
| Engineering | 113 | 4.1% |
| Multidisciplinary Studies | 4 | 0.2% |
| Science & Technology | 619 | 22.6% |
| Business | 372 | 13.6% |
| Education | 536 | 19.5% |
| Literature & Languages | 64 | 2.3% |
| Liberal Arts & History | 140 | 5.1% |
| Visual & Performing Arts | 50 | 1.8% |
| Communications | 40 | 1.5% |
| Arts & Humanities | 218 | 7.9% |
| Total | 2,745 | 100.0% |
Transportation & Commute in Randolph County
Vehicle Availability by Sex in Randolph County
The most prevalent vehicle ownership categories in Randolph County are males with 2 vehicles (2,528, accounting for 44.9%) and females with 2 vehicles (1,975, making up 50.8%).
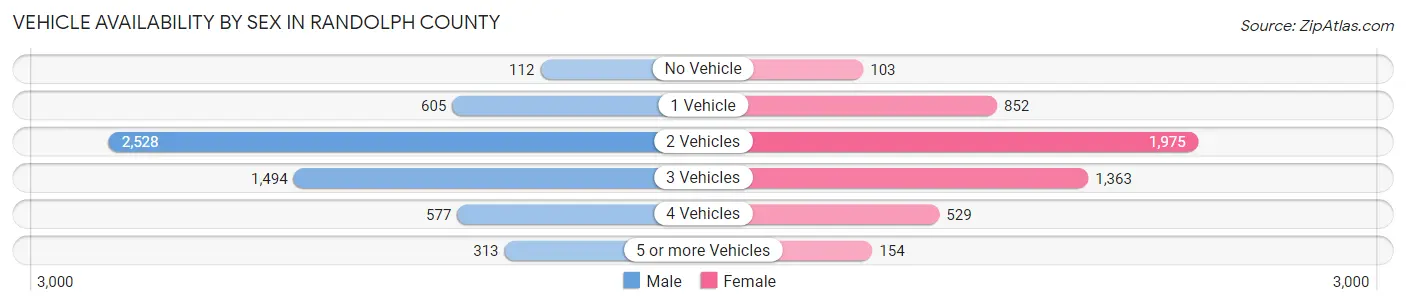
| Vehicles Available | Male | Female |
| No Vehicle | 112 (2.0%) | 103 (2.1%) |
| 1 Vehicle | 605 (10.7%) | 852 (17.1%) |
| 2 Vehicles | 2,528 (44.9%) | 1,975 (39.7%) |
| 3 Vehicles | 1,494 (26.5%) | 1,363 (27.4%) |
| 4 Vehicles | 577 (10.2%) | 529 (10.6%) |
| 5 or more Vehicles | 313 (5.6%) | 154 (3.1%) |
| Total | 5,629 (100.0%) | 4,976 (100.0%) |
Commute Time in Randolph County
The most frequently occuring commute durations in Randolph County are 5 to 9 minutes (1,647 commuters, 15.9%), 10 to 14 minutes (1,329 commuters, 12.8%), and 20 to 24 minutes (1,322 commuters, 12.8%).
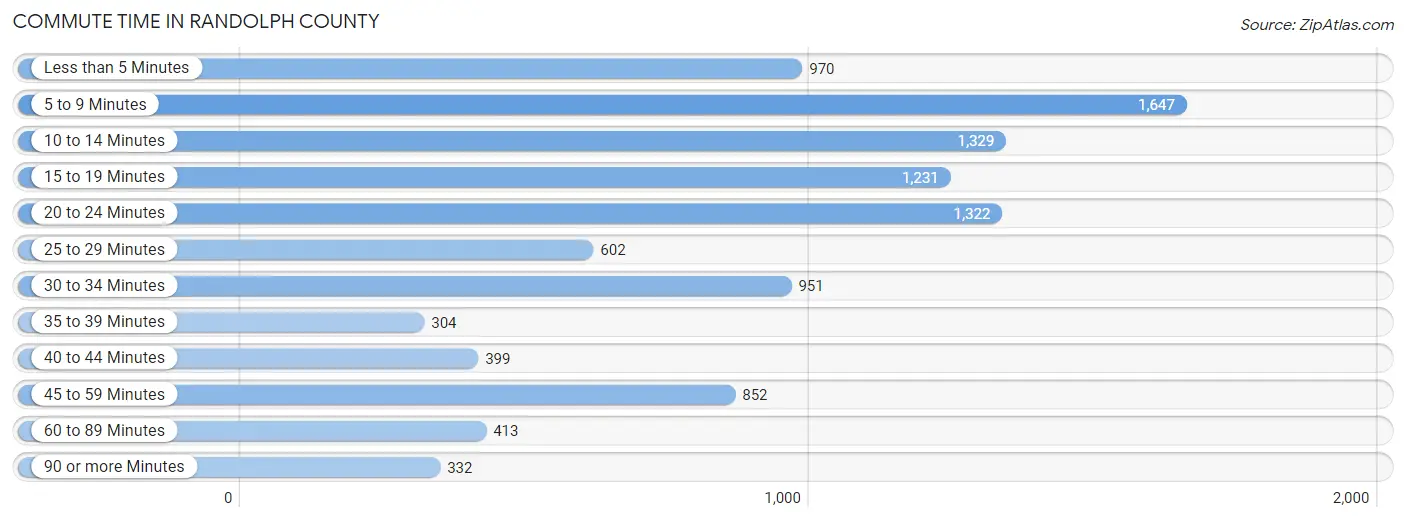
| Commute Time | # Commuters | % Commuters |
| Less than 5 Minutes | 970 | 9.4% |
| 5 to 9 Minutes | 1,647 | 15.9% |
| 10 to 14 Minutes | 1,329 | 12.8% |
| 15 to 19 Minutes | 1,231 | 11.9% |
| 20 to 24 Minutes | 1,322 | 12.8% |
| 25 to 29 Minutes | 602 | 5.8% |
| 30 to 34 Minutes | 951 | 9.2% |
| 35 to 39 Minutes | 304 | 2.9% |
| 40 to 44 Minutes | 399 | 3.8% |
| 45 to 59 Minutes | 852 | 8.2% |
| 60 to 89 Minutes | 413 | 4.0% |
| 90 or more Minutes | 332 | 3.2% |
Commute Time by Sex in Randolph County
The most common commute times in Randolph County are 5 to 9 minutes (912 commuters, 16.7%) for males and 10 to 14 minutes (765 commuters, 15.7%) for females.

| Commute Time | Male | Female |
| Less than 5 Minutes | 460 (8.4%) | 510 (10.4%) |
| 5 to 9 Minutes | 912 (16.7%) | 735 (15.1%) |
| 10 to 14 Minutes | 564 (10.3%) | 765 (15.7%) |
| 15 to 19 Minutes | 597 (10.9%) | 634 (13.0%) |
| 20 to 24 Minutes | 776 (14.2%) | 546 (11.2%) |
| 25 to 29 Minutes | 267 (4.9%) | 335 (6.9%) |
| 30 to 34 Minutes | 471 (8.6%) | 480 (9.8%) |
| 35 to 39 Minutes | 144 (2.6%) | 160 (3.3%) |
| 40 to 44 Minutes | 171 (3.1%) | 228 (4.7%) |
| 45 to 59 Minutes | 563 (10.3%) | 289 (5.9%) |
| 60 to 89 Minutes | 325 (5.9%) | 88 (1.8%) |
| 90 or more Minutes | 223 (4.1%) | 109 (2.2%) |
Time of Departure to Work by Sex in Randolph County
The most frequent times of departure to work in Randolph County are 6:30 AM to 6:59 AM (780, 14.2%) for males and 7:30 AM to 7:59 AM (794, 16.3%) for females.
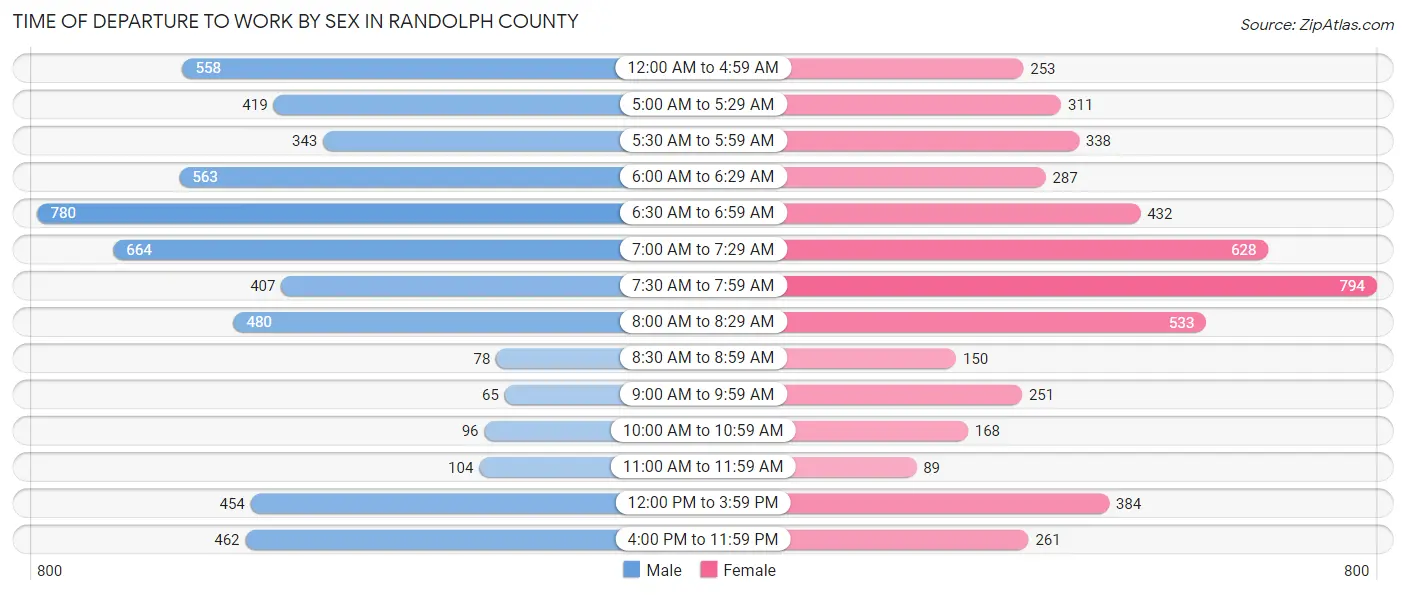
| Time of Departure | Male | Female |
| 12:00 AM to 4:59 AM | 558 (10.2%) | 253 (5.2%) |
| 5:00 AM to 5:29 AM | 419 (7.7%) | 311 (6.4%) |
| 5:30 AM to 5:59 AM | 343 (6.3%) | 338 (6.9%) |
| 6:00 AM to 6:29 AM | 563 (10.3%) | 287 (5.9%) |
| 6:30 AM to 6:59 AM | 780 (14.2%) | 432 (8.8%) |
| 7:00 AM to 7:29 AM | 664 (12.1%) | 628 (12.9%) |
| 7:30 AM to 7:59 AM | 407 (7.4%) | 794 (16.3%) |
| 8:00 AM to 8:29 AM | 480 (8.8%) | 533 (10.9%) |
| 8:30 AM to 8:59 AM | 78 (1.4%) | 150 (3.1%) |
| 9:00 AM to 9:59 AM | 65 (1.2%) | 251 (5.1%) |
| 10:00 AM to 10:59 AM | 96 (1.8%) | 168 (3.4%) |
| 11:00 AM to 11:59 AM | 104 (1.9%) | 89 (1.8%) |
| 12:00 PM to 3:59 PM | 454 (8.3%) | 384 (7.9%) |
| 4:00 PM to 11:59 PM | 462 (8.4%) | 261 (5.3%) |
| Total | 5,473 (100.0%) | 4,879 (100.0%) |
Housing Occupancy in Randolph County
Occupancy by Ownership in Randolph County
Of the total 10,191 dwellings in Randolph County, owner-occupied units account for 7,778 (76.3%), while renter-occupied units make up 2,413 (23.7%).
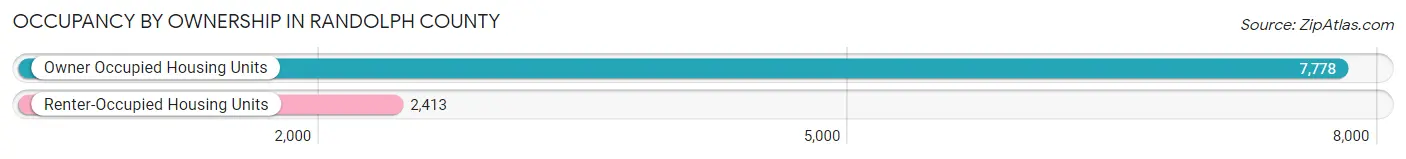
| Occupancy | # Housing Units | % Housing Units |
| Owner Occupied Housing Units | 7,778 | 76.3% |
| Renter-Occupied Housing Units | 2,413 | 23.7% |
| Total Occupied Housing Units | 10,191 | 100.0% |
Occupancy by Household Size in Randolph County

| Household Size | # Housing Units | % Housing Units |
| 1-Person Household | 3,081 | 30.2% |
| 2-Person Household | 3,755 | 36.8% |
| 3-Person Household | 1,254 | 12.3% |
| 4+ Person Household | 2,101 | 20.6% |
| Total Housing Units | 10,191 | 100.0% |
Occupancy by Ownership by Household Size in Randolph County
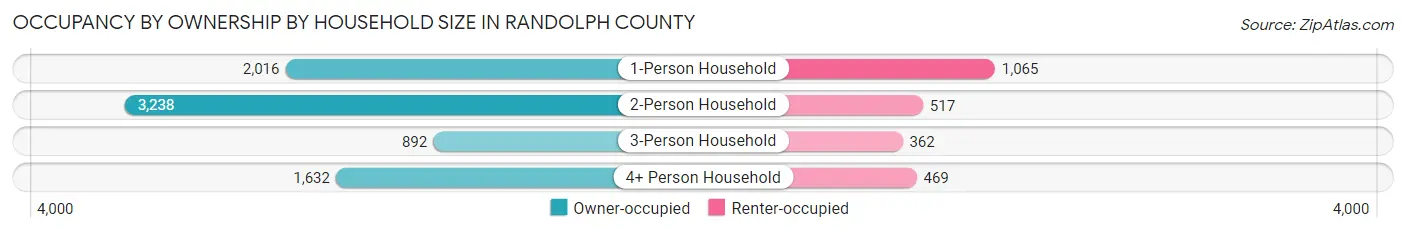
| Household Size | Owner-occupied | Renter-occupied |
| 1-Person Household | 2,016 (65.4%) | 1,065 (34.6%) |
| 2-Person Household | 3,238 (86.2%) | 517 (13.8%) |
| 3-Person Household | 892 (71.1%) | 362 (28.9%) |
| 4+ Person Household | 1,632 (77.7%) | 469 (22.3%) |
| Total Housing Units | 7,778 (76.3%) | 2,413 (23.7%) |
Occupancy by Educational Attainment in Randolph County

| Household Size | Owner-occupied | Renter-occupied |
| Less than High School | 597 (60.4%) | 392 (39.6%) |
| High School Diploma | 2,989 (72.7%) | 1,122 (27.3%) |
| College/Associate Degree | 2,799 (78.0%) | 787 (22.0%) |
| Bachelor's Degree or higher | 1,393 (92.6%) | 112 (7.4%) |
Occupancy by Age of Householder in Randolph County
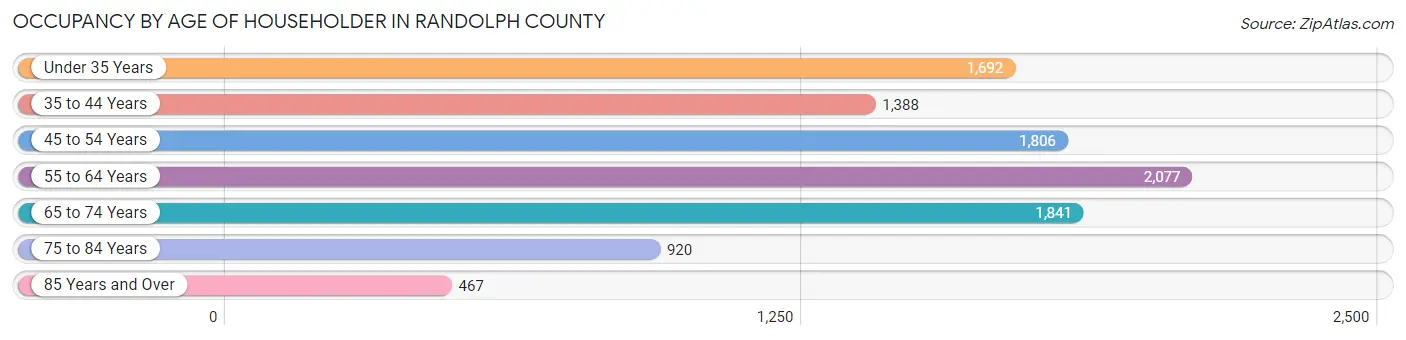
| Age Bracket | # Households | % Households |
| Under 35 Years | 1,692 | 16.6% |
| 35 to 44 Years | 1,388 | 13.6% |
| 45 to 54 Years | 1,806 | 17.7% |
| 55 to 64 Years | 2,077 | 20.4% |
| 65 to 74 Years | 1,841 | 18.1% |
| 75 to 84 Years | 920 | 9.0% |
| 85 Years and Over | 467 | 4.6% |
| Total | 10,191 | 100.0% |
Housing Finances in Randolph County
Median Income by Occupancy in Randolph County
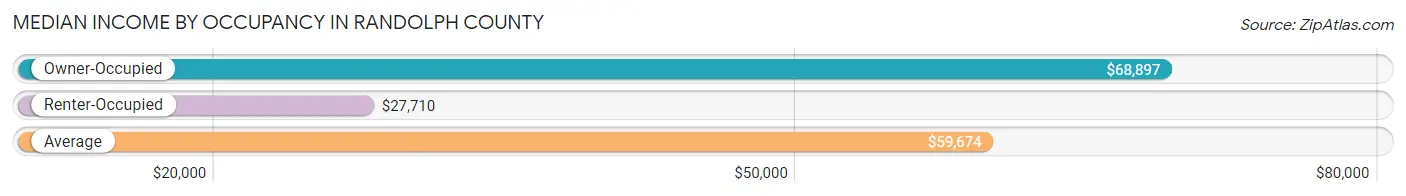
| Occupancy Type | # Households | Median Income |
| Owner-Occupied | 7,778 (76.3%) | $68,897 |
| Renter-Occupied | 2,413 (23.7%) | $27,710 |
| Average | 10,191 (100.0%) | $59,674 |
Occupancy by Householder Income Bracket in Randolph County

| Income Bracket | Owner-occupied | Renter-occupied |
| Less than $5,000 | 123 (1.6%) | 183 (7.6%) |
| $5,000 to $9,999 | 134 (1.7%) | 76 (3.2%) |
| $10,000 to $14,999 | 98 (1.3%) | 353 (14.6%) |
| $15,000 to $19,999 | 235 (3.0%) | 306 (12.7%) |
| $20,000 to $24,999 | 348 (4.5%) | 223 (9.2%) |
| $25,000 to $34,999 | 633 (8.1%) | 309 (12.8%) |
| $35,000 to $49,999 | 1,004 (12.9%) | 328 (13.6%) |
| $50,000 to $74,999 | 1,779 (22.9%) | 358 (14.8%) |
| $75,000 to $99,999 | 1,314 (16.9%) | 130 (5.4%) |
| $100,000 to $149,999 | 1,386 (17.8%) | 105 (4.3%) |
| $150,000 or more | 724 (9.3%) | 42 (1.7%) |
| Total | 7,778 (100.0%) | 2,413 (100.0%) |
Monthly Housing Cost Tiers in Randolph County
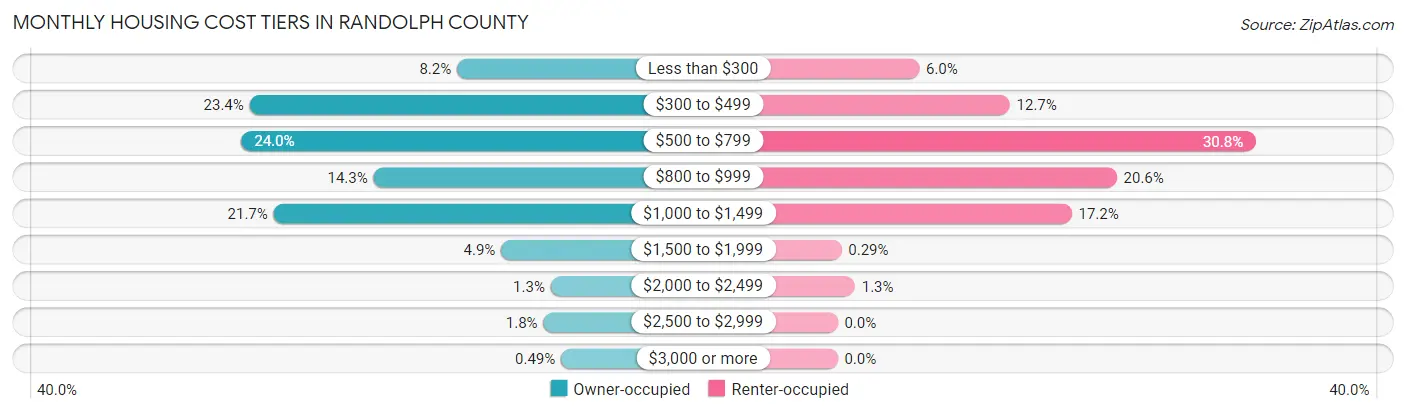
| Monthly Cost | Owner-occupied | Renter-occupied |
| Less than $300 | 634 (8.2%) | 145 (6.0%) |
| $300 to $499 | 1,822 (23.4%) | 306 (12.7%) |
| $500 to $799 | 1,870 (24.0%) | 742 (30.7%) |
| $800 to $999 | 1,112 (14.3%) | 496 (20.6%) |
| $1,000 to $1,499 | 1,685 (21.7%) | 416 (17.2%) |
| $1,500 to $1,999 | 381 (4.9%) | 7 (0.3%) |
| $2,000 to $2,499 | 97 (1.3%) | 31 (1.3%) |
| $2,500 to $2,999 | 139 (1.8%) | 0 (0.0%) |
| $3,000 or more | 38 (0.5%) | 0 (0.0%) |
| Total | 7,778 (100.0%) | 2,413 (100.0%) |
Physical Housing Characteristics in Randolph County
Housing Structures in Randolph County
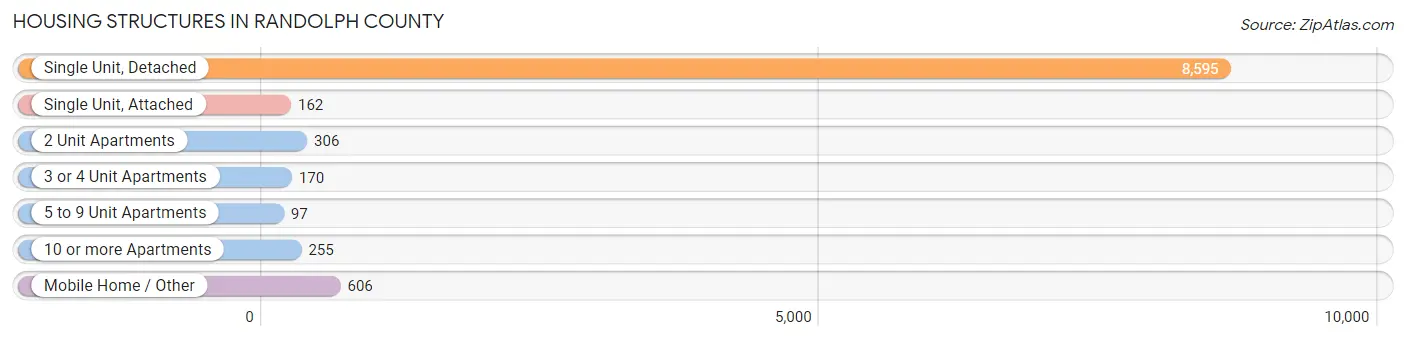
| Structure Type | # Housing Units | % Housing Units |
| Single Unit, Detached | 8,595 | 84.3% |
| Single Unit, Attached | 162 | 1.6% |
| 2 Unit Apartments | 306 | 3.0% |
| 3 or 4 Unit Apartments | 170 | 1.7% |
| 5 to 9 Unit Apartments | 97 | 0.9% |
| 10 or more Apartments | 255 | 2.5% |
| Mobile Home / Other | 606 | 5.9% |
| Total | 10,191 | 100.0% |
Housing Structures by Occupancy in Randolph County
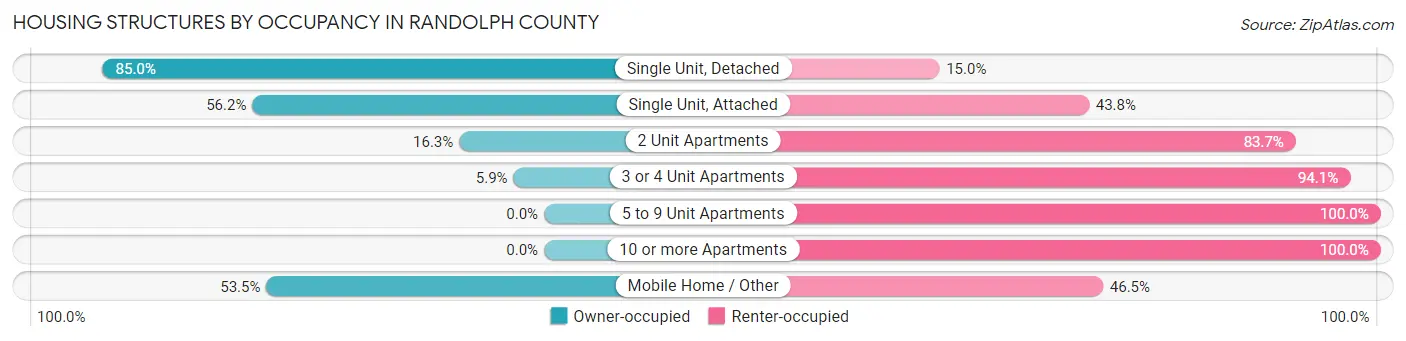
| Structure Type | Owner-occupied | Renter-occupied |
| Single Unit, Detached | 7,303 (85.0%) | 1,292 (15.0%) |
| Single Unit, Attached | 91 (56.2%) | 71 (43.8%) |
| 2 Unit Apartments | 50 (16.3%) | 256 (83.7%) |
| 3 or 4 Unit Apartments | 10 (5.9%) | 160 (94.1%) |
| 5 to 9 Unit Apartments | 0 (0.0%) | 97 (100.0%) |
| 10 or more Apartments | 0 (0.0%) | 255 (100.0%) |
| Mobile Home / Other | 324 (53.5%) | 282 (46.5%) |
| Total | 7,778 (76.3%) | 2,413 (23.7%) |
Housing Structures by Number of Rooms in Randolph County
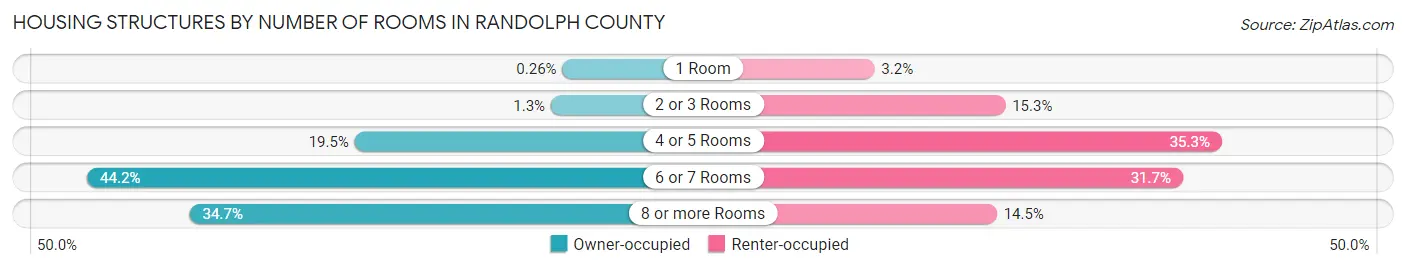
| Number of Rooms | Owner-occupied | Renter-occupied |
| 1 Room | 20 (0.3%) | 77 (3.2%) |
| 2 or 3 Rooms | 103 (1.3%) | 369 (15.3%) |
| 4 or 5 Rooms | 1,514 (19.5%) | 852 (35.3%) |
| 6 or 7 Rooms | 3,439 (44.2%) | 765 (31.7%) |
| 8 or more Rooms | 2,702 (34.7%) | 350 (14.5%) |
| Total | 7,778 (100.0%) | 2,413 (100.0%) |
Housing Structure by Heating Type in Randolph County
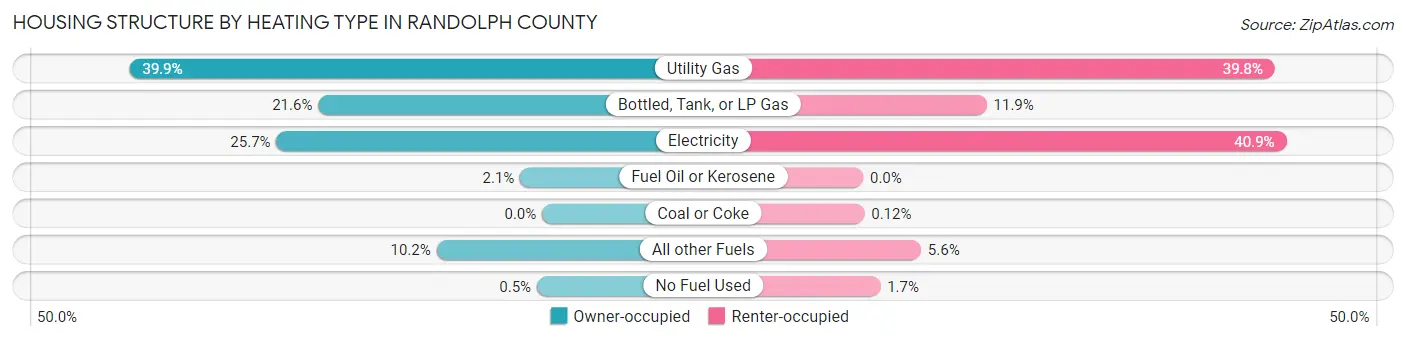
| Heating Type | Owner-occupied | Renter-occupied |
| Utility Gas | 3,102 (39.9%) | 960 (39.8%) |
| Bottled, Tank, or LP Gas | 1,682 (21.6%) | 288 (11.9%) |
| Electricity | 1,997 (25.7%) | 987 (40.9%) |
| Fuel Oil or Kerosene | 165 (2.1%) | 0 (0.0%) |
| Coal or Coke | 0 (0.0%) | 3 (0.1%) |
| All other Fuels | 793 (10.2%) | 135 (5.6%) |
| No Fuel Used | 39 (0.5%) | 40 (1.7%) |
| Total | 7,778 (100.0%) | 2,413 (100.0%) |
Household Vehicle Usage in Randolph County

| Vehicles per Household | Owner-occupied | Renter-occupied |
| No Vehicle | 203 (2.6%) | 356 (14.7%) |
| 1 Vehicle | 1,779 (22.9%) | 1,054 (43.7%) |
| 2 Vehicles | 3,114 (40.0%) | 739 (30.6%) |
| 3 or more Vehicles | 2,682 (34.5%) | 264 (10.9%) |
| Total | 7,778 (100.0%) | 2,413 (100.0%) |
Real Estate & Mortgages in Randolph County
Real Estate and Mortgage Overview in Randolph County
| Characteristic | Without Mortgage | With Mortgage |
| Housing Units | 3,478 | 4,300 |
| Median Property Value | $93,300 | $103,900 |
| Median Household Income | $57,469 | $492 |
| Monthly Housing Costs | $431 | $38 |
| Real Estate Taxes | $847 | $75 |
Property Value by Mortgage Status in Randolph County
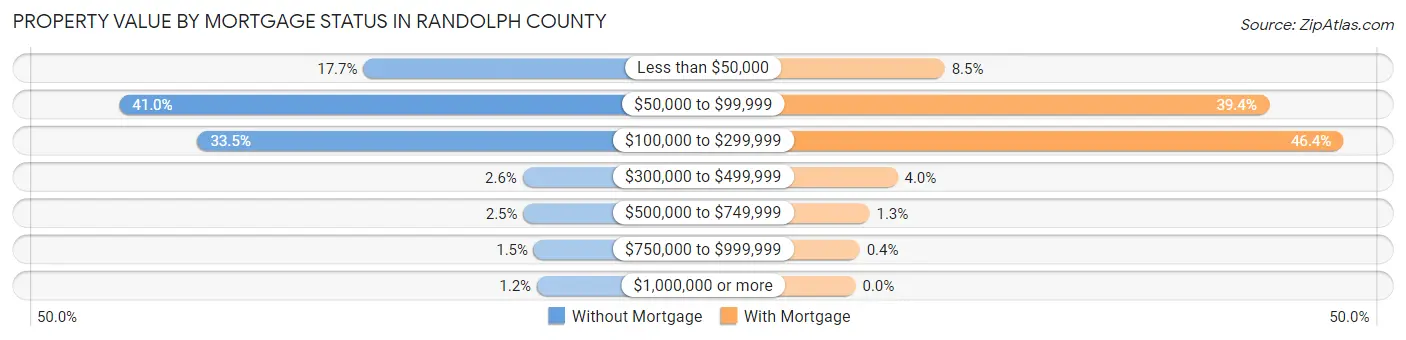
| Property Value | Without Mortgage | With Mortgage |
| Less than $50,000 | 617 (17.7%) | 365 (8.5%) |
| $50,000 to $99,999 | 1,425 (41.0%) | 1,692 (39.4%) |
| $100,000 to $299,999 | 1,166 (33.5%) | 1,997 (46.4%) |
| $300,000 to $499,999 | 89 (2.6%) | 172 (4.0%) |
| $500,000 to $749,999 | 87 (2.5%) | 57 (1.3%) |
| $750,000 to $999,999 | 52 (1.5%) | 17 (0.4%) |
| $1,000,000 or more | 42 (1.2%) | 0 (0.0%) |
| Total | 3,478 (100.0%) | 4,300 (100.0%) |
Household Income by Mortgage Status in Randolph County
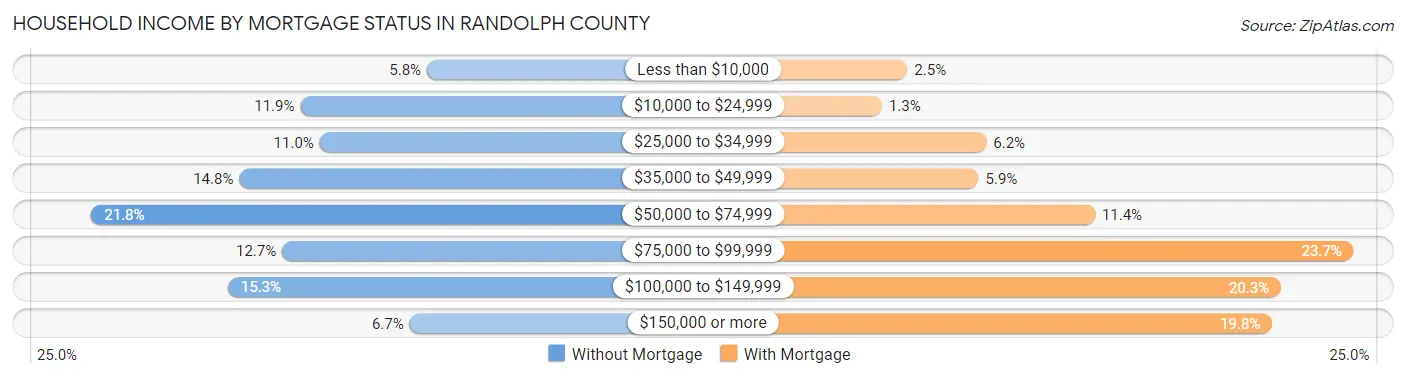
| Household Income | Without Mortgage | With Mortgage |
| Less than $10,000 | 203 (5.8%) | 106 (2.5%) |
| $10,000 to $24,999 | 413 (11.9%) | 54 (1.3%) |
| $25,000 to $34,999 | 381 (11.0%) | 268 (6.2%) |
| $35,000 to $49,999 | 514 (14.8%) | 252 (5.9%) |
| $50,000 to $74,999 | 759 (21.8%) | 490 (11.4%) |
| $75,000 to $99,999 | 443 (12.7%) | 1,020 (23.7%) |
| $100,000 to $149,999 | 533 (15.3%) | 871 (20.3%) |
| $150,000 or more | 232 (6.7%) | 853 (19.8%) |
| Total | 3,478 (100.0%) | 4,300 (100.0%) |
Property Value to Household Income Ratio in Randolph County
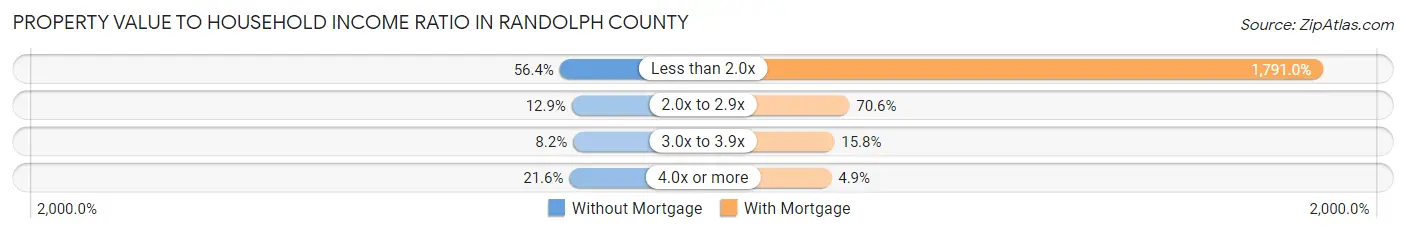
| Value-to-Income Ratio | Without Mortgage | With Mortgage |
| Less than 2.0x | 1,960 (56.4%) | 77,012 (1,791.0%) |
| 2.0x to 2.9x | 448 (12.9%) | 3,034 (70.6%) |
| 3.0x to 3.9x | 285 (8.2%) | 679 (15.8%) |
| 4.0x or more | 751 (21.6%) | 211 (4.9%) |
| Total | 3,478 (100.0%) | 4,300 (100.0%) |
Real Estate Taxes by Mortgage Status in Randolph County
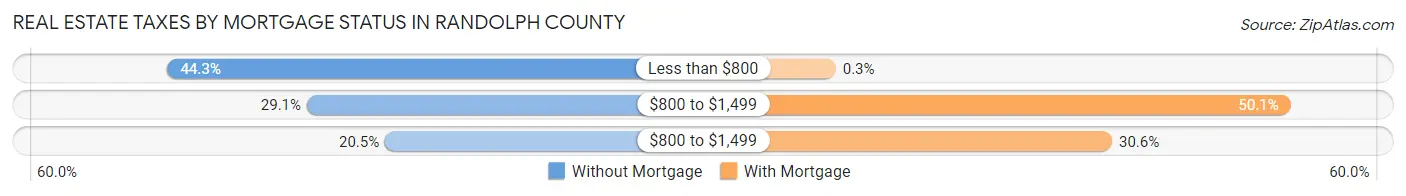
| Property Taxes | Without Mortgage | With Mortgage |
| Less than $800 | 1,542 (44.3%) | 13 (0.3%) |
| $800 to $1,499 | 1,011 (29.1%) | 2,156 (50.1%) |
| $800 to $1,499 | 713 (20.5%) | 1,315 (30.6%) |
| Total | 3,478 (100.0%) | 4,300 (100.0%) |
Health & Disability in Randolph County
Health Insurance Coverage by Age in Randolph County
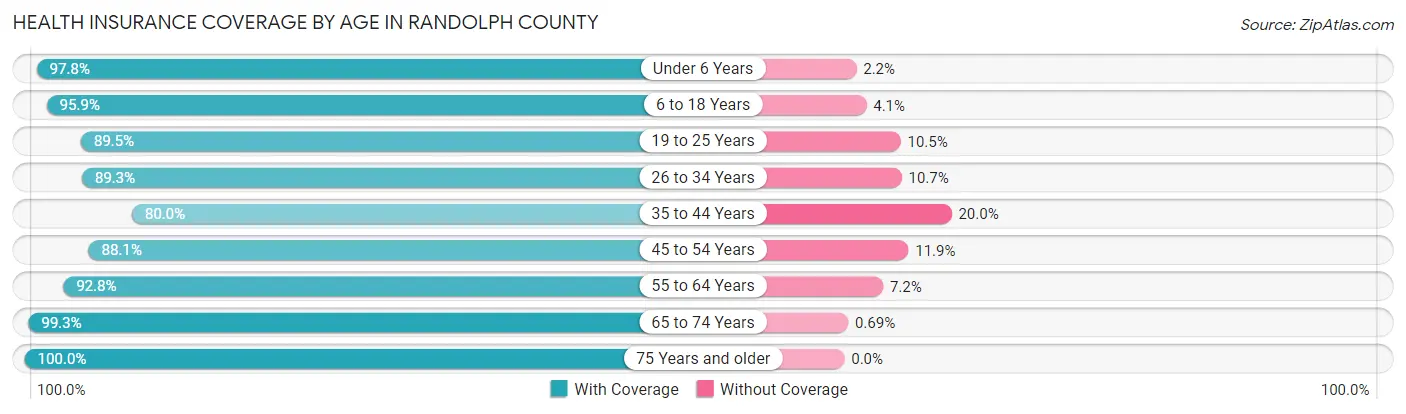
| Age Bracket | With Coverage | Without Coverage |
| Under 6 Years | 1,621 (97.8%) | 37 (2.2%) |
| 6 to 18 Years | 4,165 (95.9%) | 178 (4.1%) |
| 19 to 25 Years | 1,545 (89.5%) | 181 (10.5%) |
| 26 to 34 Years | 2,184 (89.3%) | 261 (10.7%) |
| 35 to 44 Years | 2,213 (80.0%) | 553 (20.0%) |
| 45 to 54 Years | 2,695 (88.1%) | 365 (11.9%) |
| 55 to 64 Years | 3,245 (92.8%) | 252 (7.2%) |
| 65 to 74 Years | 2,725 (99.3%) | 19 (0.7%) |
| 75 Years and older | 1,992 (100.0%) | 0 (0.0%) |
| Total | 22,385 (92.4%) | 1,846 (7.6%) |
Health Insurance Coverage by Citizenship Status in Randolph County
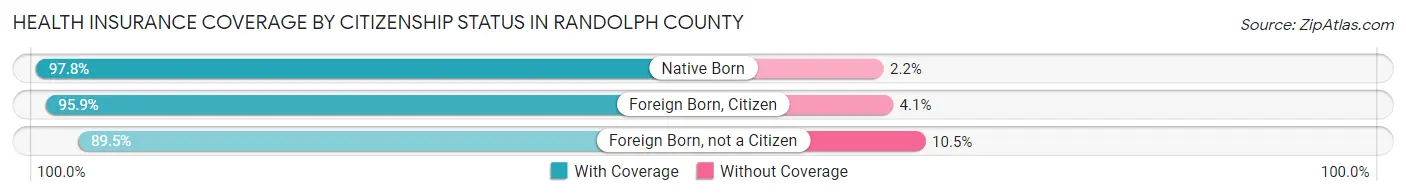
| Citizenship Status | With Coverage | Without Coverage |
| Native Born | 1,621 (97.8%) | 37 (2.2%) |
| Foreign Born, Citizen | 4,165 (95.9%) | 178 (4.1%) |
| Foreign Born, not a Citizen | 1,545 (89.5%) | 181 (10.5%) |
Health Insurance Coverage by Household Income in Randolph County
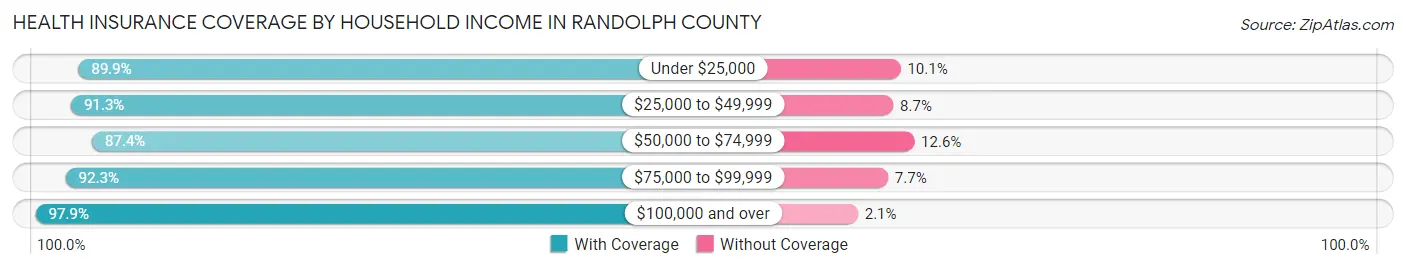
| Household Income | With Coverage | Without Coverage |
| Under $25,000 | 2,976 (89.9%) | 333 (10.1%) |
| $25,000 to $49,999 | 4,150 (91.3%) | 395 (8.7%) |
| $50,000 to $74,999 | 4,472 (87.4%) | 646 (12.6%) |
| $75,000 to $99,999 | 3,942 (92.3%) | 329 (7.7%) |
| $100,000 and over | 6,814 (97.9%) | 143 (2.1%) |
Public vs Private Health Insurance Coverage by Age in Randolph County
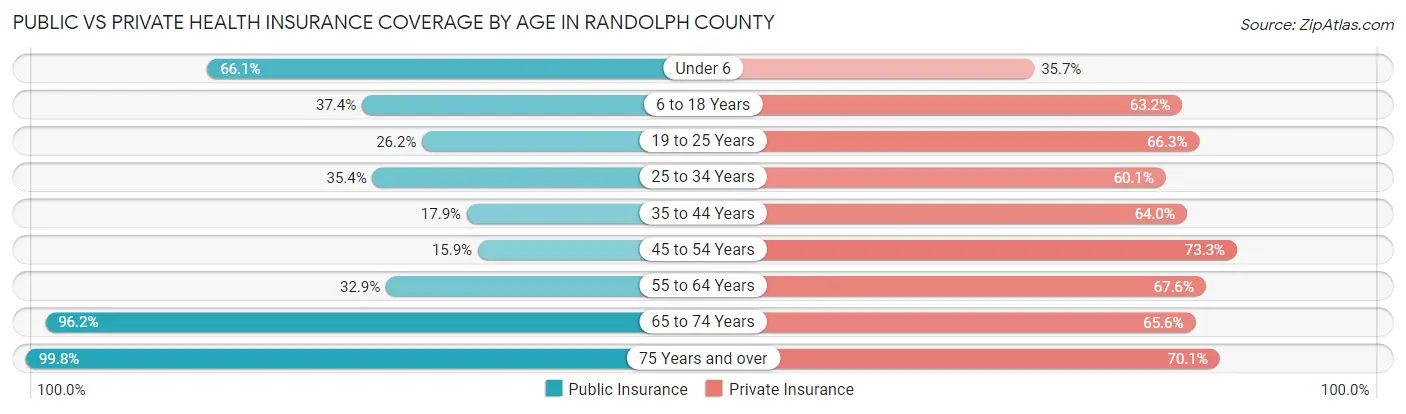
| Age Bracket | Public Insurance | Private Insurance |
| Under 6 | 1,096 (66.1%) | 592 (35.7%) |
| 6 to 18 Years | 1,623 (37.4%) | 2,743 (63.2%) |
| 19 to 25 Years | 452 (26.2%) | 1,145 (66.3%) |
| 25 to 34 Years | 866 (35.4%) | 1,470 (60.1%) |
| 35 to 44 Years | 495 (17.9%) | 1,771 (64.0%) |
| 45 to 54 Years | 485 (15.9%) | 2,244 (73.3%) |
| 55 to 64 Years | 1,151 (32.9%) | 2,363 (67.6%) |
| 65 to 74 Years | 2,639 (96.2%) | 1,800 (65.6%) |
| 75 Years and over | 1,987 (99.8%) | 1,397 (70.1%) |
| Total | 10,794 (44.6%) | 15,525 (64.1%) |
Disability Status by Sex by Age in Randolph County
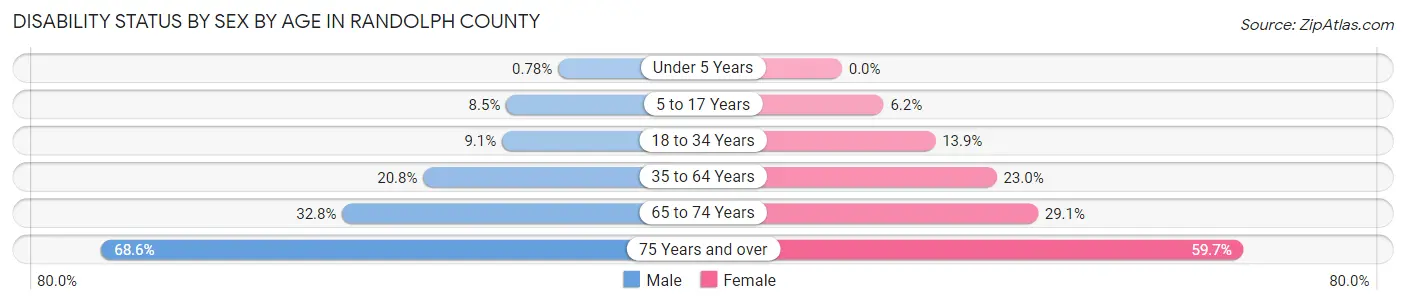
| Age Bracket | Male | Female |
| Under 5 Years | 7 (0.8%) | 0 (0.0%) |
| 5 to 17 Years | 178 (8.5%) | 128 (6.2%) |
| 18 to 34 Years | 211 (9.1%) | 304 (13.9%) |
| 35 to 64 Years | 973 (20.8%) | 1,067 (23.0%) |
| 65 to 74 Years | 436 (32.8%) | 412 (29.1%) |
| 75 Years and over | 581 (68.6%) | 683 (59.7%) |
Disability Class by Sex by Age in Randolph County
Disability Class: Hearing Difficulty
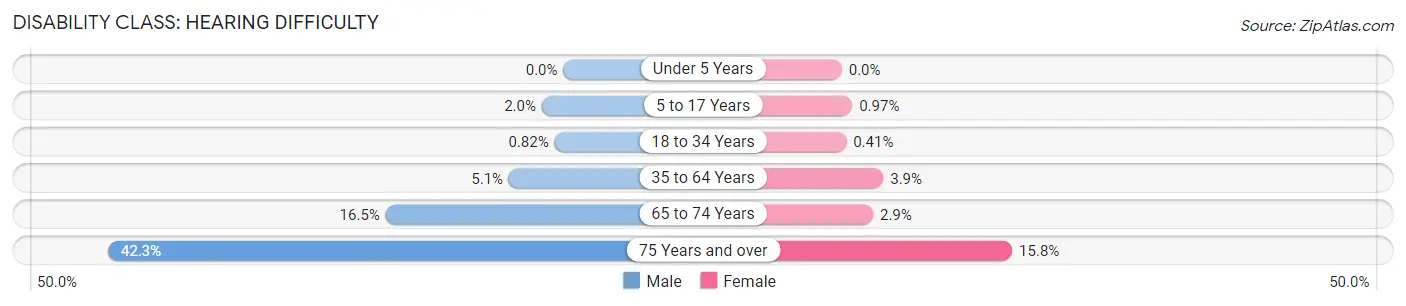
| Age Bracket | Male | Female |
| Under 5 Years | 0 (0.0%) | 0 (0.0%) |
| 5 to 17 Years | 42 (2.0%) | 20 (1.0%) |
| 18 to 34 Years | 19 (0.8%) | 9 (0.4%) |
| 35 to 64 Years | 236 (5.1%) | 179 (3.8%) |
| 65 to 74 Years | 219 (16.5%) | 41 (2.9%) |
| 75 Years and over | 358 (42.3%) | 181 (15.8%) |
Disability Class: Vision Difficulty
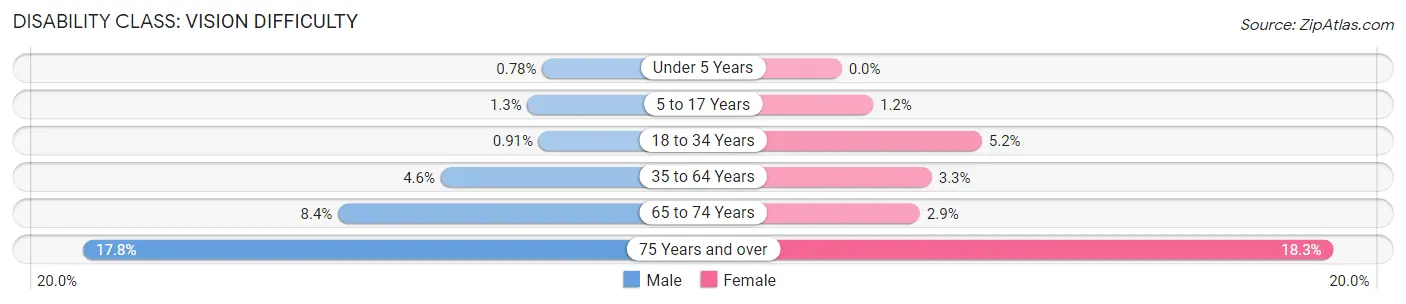
| Age Bracket | Male | Female |
| Under 5 Years | 7 (0.8%) | 0 (0.0%) |
| 5 to 17 Years | 28 (1.3%) | 24 (1.2%) |
| 18 to 34 Years | 21 (0.9%) | 114 (5.2%) |
| 35 to 64 Years | 213 (4.5%) | 155 (3.3%) |
| 65 to 74 Years | 111 (8.4%) | 41 (2.9%) |
| 75 Years and over | 151 (17.8%) | 209 (18.2%) |
Disability Class: Cognitive Difficulty
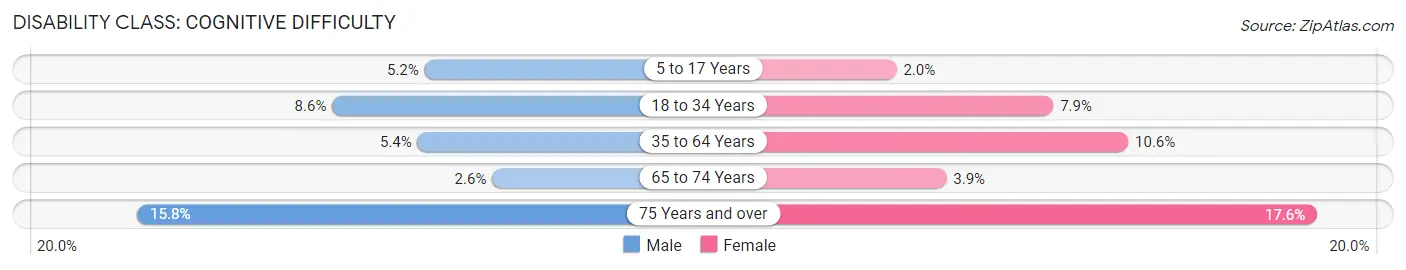
| Age Bracket | Male | Female |
| 5 to 17 Years | 108 (5.1%) | 42 (2.0%) |
| 18 to 34 Years | 199 (8.6%) | 172 (7.9%) |
| 35 to 64 Years | 253 (5.4%) | 494 (10.6%) |
| 65 to 74 Years | 35 (2.6%) | 55 (3.9%) |
| 75 Years and over | 134 (15.8%) | 202 (17.6%) |
Disability Class: Ambulatory Difficulty

| Age Bracket | Male | Female |
| 5 to 17 Years | 30 (1.4%) | 50 (2.4%) |
| 18 to 34 Years | 0 (0.0%) | 27 (1.2%) |
| 35 to 64 Years | 609 (13.0%) | 698 (15.0%) |
| 65 to 74 Years | 218 (16.4%) | 369 (26.1%) |
| 75 Years and over | 304 (35.9%) | 557 (48.6%) |
Disability Class: Self-Care Difficulty
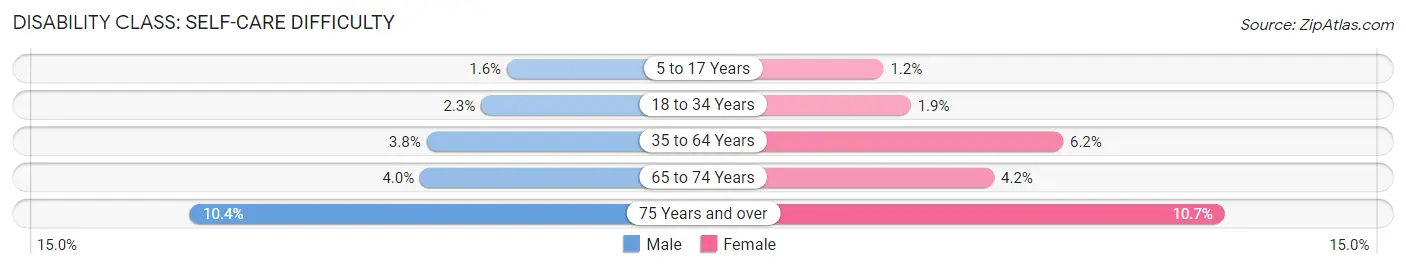
| Age Bracket | Male | Female |
| 5 to 17 Years | 33 (1.6%) | 24 (1.2%) |
| 18 to 34 Years | 53 (2.3%) | 42 (1.9%) |
| 35 to 64 Years | 178 (3.8%) | 286 (6.2%) |
| 65 to 74 Years | 53 (4.0%) | 60 (4.2%) |
| 75 Years and over | 88 (10.4%) | 122 (10.7%) |
Technology Access in Randolph County
Computing Device Access in Randolph County
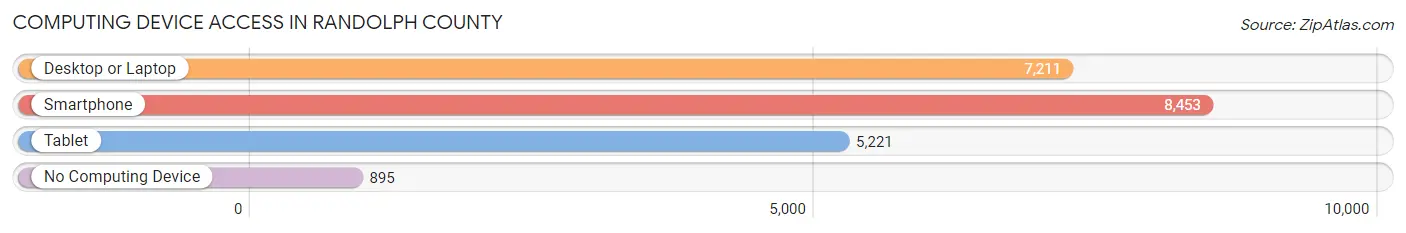
| Device Type | # Households | % Households |
| Desktop or Laptop | 7,211 | 70.8% |
| Smartphone | 8,453 | 83.0% |
| Tablet | 5,221 | 51.2% |
| No Computing Device | 895 | 8.8% |
| Total | 10,191 | 100.0% |
Internet Access in Randolph County
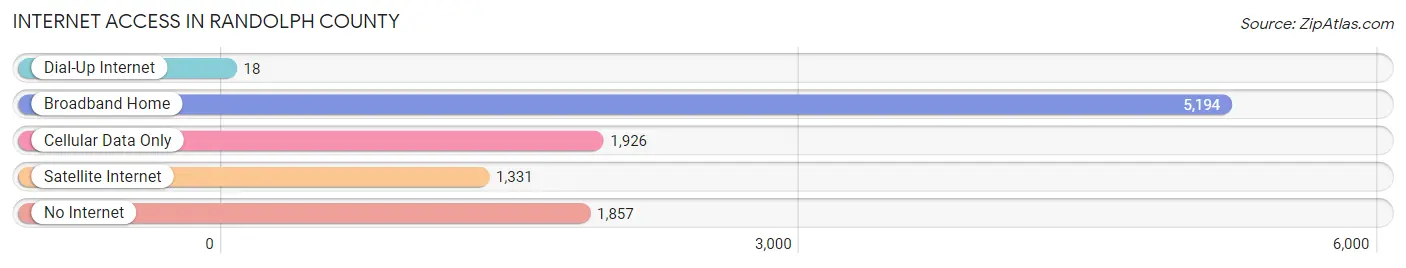
| Internet Type | # Households | % Households |
| Dial-Up Internet | 18 | 0.2% |
| Broadband Home | 5,194 | 51.0% |
| Cellular Data Only | 1,926 | 18.9% |
| Satellite Internet | 1,331 | 13.1% |
| No Internet | 1,857 | 18.2% |
| Total | 10,191 | 100.0% |
Randolph County Summary
Randolph County, Indiana is located in the east central part of the state, and is part of the Muncie-Marion-Anderson metropolitan statistical area. The county was established in 1818 and named after Revolutionary War hero, Edmund Randolph. The county seat is Winchester, and the population was 26,171 in the 2010 census.
Geography
Randolph County is located in the east central part of Indiana, and is bordered by Delaware, Jay, Blackford, Grant, and Wayne counties. The county has a total area of 437 square miles, of which 434 square miles is land and 3 square miles is water. The county is mostly flat, with some rolling hills in the northern part. The White River flows through the county, and there are several small lakes and ponds. The climate is humid continental, with hot summers and cold winters.
Economy
The economy of Randolph County is largely based on agriculture and manufacturing. The county is home to several large farms, and the main crops are corn, soybeans, and wheat. There are also several small businesses in the county, including restaurants, retail stores, and service providers. The county is also home to several manufacturing companies, including a steel mill, a paper mill, and a plastics factory.
Demographics
As of the 2010 census, there were 26,171 people, 10,093 households, and 7,072 families living in Randolph County. The population density was 60 people per square mile. The racial makeup of the county was 97.3% White, 0.7% African American, 0.3% Native American, 0.3% Asian, 0.2% from other races, and 1.2% from two or more races. Hispanic or Latino of any race were 1.2% of the population.
The median income for a household in the county was $41,945, and the median income for a family was $50,945. The per capita income for the county was $20,845. About 11.2% of families and 14.2% of the population were below the poverty line, including 19.2% of those under age 18 and 8.2% of those age 65 or over.
Conclusion
Randolph County, Indiana is a rural county located in the east central part of the state. The county is largely agricultural, with some manufacturing and small businesses. The population is mostly white, with a small percentage of African Americans, Native Americans, and other races. The median income for a household in the county is slightly below the state average, and there is a higher than average poverty rate.
Common Questions
What is the Total Population of Randolph County?
Total Population of Randolph County is 24,586.
What is the Total Male Population of Randolph County?
Total Male Population of Randolph County is 12,318.
What is the Total Female Population of Randolph County?
Total Female Population of Randolph County is 12,268.
What is the Ratio of Males per 100 Females in Randolph County?
There are 100.41 Males per 100 Females in Randolph County.
What is the Ratio of Females per 100 Males in Randolph County?
There are 99.59 Females per 100 Males in Randolph County.
What is the Median Population Age in Randolph County?
Median Population Age in Randolph County is 42.8 Years.
What is the Average Family Size in Randolph County
Average Family Size in Randolph County is 3.0 People.
What is the Average Household Size in Randolph County
Average Household Size in Randolph County is 2.4 People.
What is Per Capita Income in Randolph County?
Per Capita income in Randolph County is $30,253.
What is the Median Family Income in Randolph County?
Median Family Income in Randolph County is $71,450.
What is the Median Household income in Randolph County?
Median Household Income in Randolph County is $59,674.
What is Income or Wage Gap in Randolph County?
Income or Wage Gap in Randolph County is 31.5%.
Women in Randolph County earn 68.5 cents for every dollar earned by a man.
What is Family Income Deficit in Randolph County?
Family Income Deficit in Randolph County is $11,289.
Families that are below poverty line in Randolph County earn $11,289 less on average than the poverty threshold level.
What is Inequality or Gini Index in Randolph County?
Inequality or Gini Index in Randolph County is 0.42.
How Large is the Labor Force in Randolph County?
There are 11,764 People in the Labor Forcein in Randolph County.
What is the Percentage of People in the Labor Force in Randolph County?
60.2% of People are in the Labor Force in Randolph County.
What is the Unemployment Rate in Randolph County?
Unemployment Rate in Randolph County is 5.6%.