Putnam County, IN
Putnam County Map

Putnam County Overview
36,942
TOTAL POPULATION
19,430
MALE POPULATION
17,512
FEMALE POPULATION
110.95
MALES / 100 FEMALES
90.13
FEMALES / 100 MALES
38.4
MEDIAN AGE
2.8
AVG FAMILY SIZE
2.3
AVG HOUSEHOLD SIZE
$31,015
PER CAPITA INCOME
$84,209
AVG FAMILY INCOME
$70,609
AVG HOUSEHOLD INCOME
41.8%
WAGE / INCOME GAP [ % ]
58.2¢/ $1
WAGE / INCOME GAP [ $ ]
$9,454
FAMILY INCOME DEFICIT
0.38
INEQUALITY / GINI INDEX
17,237
LABOR FORCE [ PEOPLE ]
56.2%
PERCENT IN LABOR FORCE
2.8%
UNEMPLOYMENT RATE
Putnam County Area Codes
Race in Putnam County
The most populous races in Putnam County are White / Caucasian (34,188 | 92.5%), Asian (986 | 2.7%), and Black / African American (984 | 2.7%).

| Race | # Population | % Population |
| Asian | 986 | 2.7% |
| Black / African American | 984 | 2.7% |
| Hawaiian / Pacific | 0 | 0.0% |
| Hispanic or Latino | 764 | 2.1% |
| Native / Alaskan | 42 | 0.1% |
| White / Caucasian | 34,188 | 92.5% |
| Two or more Races | 606 | 1.6% |
| Some other Race | 136 | 0.4% |
| Total | 36,942 | 100.0% |
Ancestry in Putnam County
The most populous ancestries reported in Putnam County are German (5,143 | 13.9%), American (3,828 | 10.4%), English (3,480 | 9.4%), Irish (2,803 | 7.6%), and European (1,068 | 2.9%), together accounting for 44.2% of all Putnam County residents.

| Ancestry | # Population | % Population |
| African | 166 | 0.4% |
| American | 3,828 | 10.4% |
| Apache | 15 | 0.0% |
| Arab | 30 | 0.1% |
| Austrian | 34 | 0.1% |
| Belgian | 5 | 0.0% |
| Bhutanese | 131 | 0.4% |
| Blackfeet | 27 | 0.1% |
| Bolivian | 7 | 0.0% |
| Brazilian | 60 | 0.2% |
| British | 183 | 0.5% |
| Burmese | 235 | 0.6% |
| Canadian | 49 | 0.1% |
| Central American | 23 | 0.1% |
| Cherokee | 102 | 0.3% |
| Croatian | 37 | 0.1% |
| Czech | 14 | 0.0% |
| Czechoslovakian | 38 | 0.1% |
| Danish | 6 | 0.0% |
| Dutch | 472 | 1.3% |
| Eastern European | 85 | 0.2% |
| English | 3,480 | 9.4% |
| European | 1,068 | 2.9% |
| Finnish | 8 | 0.0% |
| French | 425 | 1.1% |
| French Canadian | 117 | 0.3% |
| German | 5,143 | 13.9% |
| German Russian | 1 | 0.0% |
| Greek | 55 | 0.2% |
| Haitian | 6 | 0.0% |
| Honduran | 13 | 0.0% |
| Hungarian | 77 | 0.2% |
| Indian (Asian) | 313 | 0.9% |
| Irish | 2,803 | 7.6% |
| Iroquois | 5 | 0.0% |
| Italian | 835 | 2.3% |
| Jamaican | 10 | 0.0% |
| Korean | 15 | 0.0% |
| Lebanese | 8 | 0.0% |
| Lithuanian | 18 | 0.1% |
| Luxembourger | 9 | 0.0% |
| Maltese | 12 | 0.0% |
| Mexican | 340 | 0.9% |
| Northern European | 53 | 0.1% |
| Norwegian | 33 | 0.1% |
| Polish | 318 | 0.9% |
| Portuguese | 9 | 0.0% |
| Puerto Rican | 201 | 0.5% |
| Romanian | 31 | 0.1% |
| Russian | 17 | 0.1% |
| Salvadoran | 10 | 0.0% |
| Scandinavian | 148 | 0.4% |
| Scotch-Irish | 380 | 1.0% |
| Scottish | 753 | 2.0% |
| Serbian | 4 | 0.0% |
| Sioux | 28 | 0.1% |
| Slavic | 9 | 0.0% |
| Slovene | 26 | 0.1% |
| South American | 7 | 0.0% |
| Sri Lankan | 70 | 0.2% |
| Subsaharan African | 166 | 0.4% |
| Swedish | 403 | 1.1% |
| Swiss | 49 | 0.1% |
| Syrian | 22 | 0.1% |
| Thai | 194 | 0.5% |
| Ukrainian | 29 | 0.1% |
| Welsh | 226 | 0.6% |
| Yugoslavian | 18 | 0.1% | View All 68 Rows |
Immigrants in Putnam County
The most numerous immigrant groups reported in Putnam County came from Asia (587 | 1.6%), Eastern Asia (326 | 0.9%), China (224 | 0.6%), South Central Asia (198 | 0.5%), and Latin America (184 | 0.5%), together accounting for 4.1% of all Putnam County residents.

| Immigration Origin | # Population | % Population |
| Asia | 587 | 1.6% |
| Bolivia | 7 | 0.0% |
| Brazil | 30 | 0.1% |
| Canada | 33 | 0.1% |
| Caribbean | 10 | 0.0% |
| Central America | 137 | 0.4% |
| China | 224 | 0.6% |
| Croatia | 38 | 0.1% |
| Czechoslovakia | 8 | 0.0% |
| Denmark | 6 | 0.0% |
| Eastern Asia | 326 | 0.9% |
| Eastern Europe | 95 | 0.3% |
| El Salvador | 10 | 0.0% |
| Europe | 163 | 0.4% |
| France | 19 | 0.1% |
| Germany | 20 | 0.1% |
| Honduras | 13 | 0.0% |
| India | 128 | 0.4% |
| Jamaica | 10 | 0.0% |
| Japan | 102 | 0.3% |
| Latin America | 184 | 0.5% |
| Mexico | 114 | 0.3% |
| Nepal | 38 | 0.1% |
| Netherlands | 15 | 0.0% |
| Northern Europe | 14 | 0.0% |
| Pakistan | 32 | 0.1% |
| Philippines | 10 | 0.0% |
| Poland | 27 | 0.1% |
| South America | 37 | 0.1% |
| South Central Asia | 198 | 0.5% |
| South Eastern Asia | 63 | 0.2% |
| Ukraine | 22 | 0.1% |
| Vietnam | 53 | 0.1% |
| Western Europe | 54 | 0.2% | View All 34 Rows |
Sex and Age in Putnam County
Sex and Age in Putnam County
The most populous age groups in Putnam County are 20 to 24 Years (1,708 | 8.8%) for men and 20 to 24 Years (1,587 | 9.1%) for women.

| Age Bracket | Male | Female |
| Under 5 Years | 852 (4.4%) | 846 (4.8%) |
| 5 to 9 Years | 998 (5.1%) | 887 (5.1%) |
| 10 to 14 Years | 1,235 (6.4%) | 1,130 (6.5%) |
| 15 to 19 Years | 1,523 (7.8%) | 1,334 (7.6%) |
| 20 to 24 Years | 1,708 (8.8%) | 1,587 (9.1%) |
| 25 to 29 Years | 1,392 (7.2%) | 1,011 (5.8%) |
| 30 to 34 Years | 1,251 (6.4%) | 991 (5.7%) |
| 35 to 39 Years | 1,324 (6.8%) | 1,052 (6.0%) |
| 40 to 44 Years | 1,093 (5.6%) | 800 (4.6%) |
| 45 to 49 Years | 1,119 (5.8%) | 1,012 (5.8%) |
| 50 to 54 Years | 1,421 (7.3%) | 1,135 (6.5%) |
| 55 to 59 Years | 1,228 (6.3%) | 1,067 (6.1%) |
| 60 to 64 Years | 1,337 (6.9%) | 1,316 (7.5%) |
| 65 to 69 Years | 1,097 (5.7%) | 988 (5.6%) |
| 70 to 74 Years | 700 (3.6%) | 852 (4.9%) |
| 75 to 79 Years | 389 (2.0%) | 683 (3.9%) |
| 80 to 84 Years | 377 (1.9%) | 443 (2.5%) |
| 85 Years and over | 386 (2.0%) | 378 (2.2%) |
| Total | 19,430 (100.0%) | 17,512 (100.0%) |
Families and Households in Putnam County
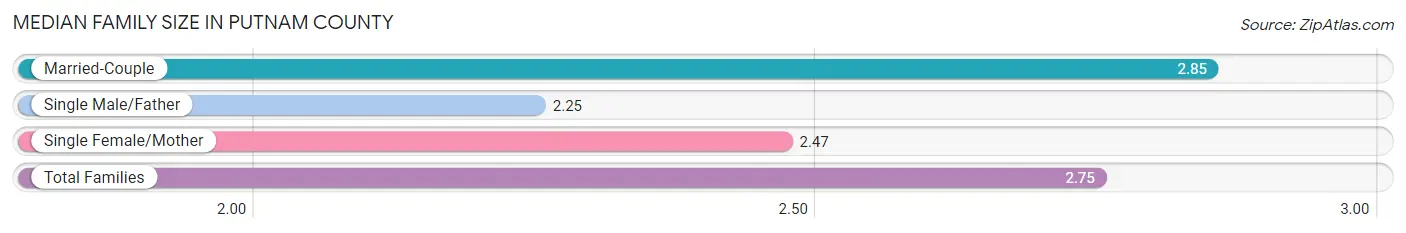
Median Family Size in Putnam County
The median family size in Putnam County is 2.75 persons per family, with married-couple families (7,528 | 79.4%) accounting for the largest median family size of 2.85 persons per family. On the other hand, single male/father families (816 | 8.6%) represent the smallest median family size with 2.25 persons per family.
| Family Type | # Families | Family Size |
| Married-Couple | 7,528 (79.4%) | 2.85 |
| Single Male/Father | 816 (8.6%) | 2.25 |
| Single Female/Mother | 1,139 (12.0%) | 2.47 |
| Total Families | 9,483 (100.0%) | 2.75 |
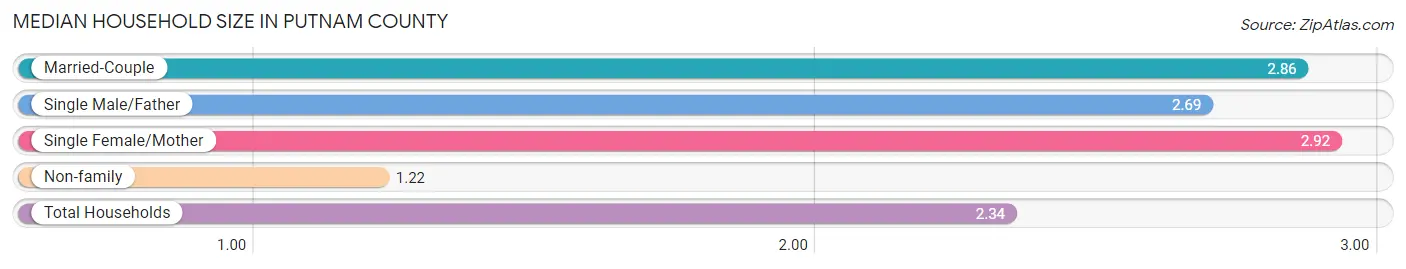
Median Household Size in Putnam County
The median household size in Putnam County is 2.34 persons per household, with single female/mother households (1,139 | 8.3%) accounting for the largest median household size of 2.92 persons per household. non-family households (4,325 | 31.3%) represent the smallest median household size with 1.22 persons per household.
| Household Type | # Households | Household Size |
| Married-Couple | 7,528 (54.5%) | 2.86 |
| Single Male/Father | 816 (5.9%) | 2.69 |
| Single Female/Mother | 1,139 (8.3%) | 2.92 |
| Non-family | 4,325 (31.3%) | 1.22 |
| Total Households | 13,808 (100.0%) | 2.34 |
Household Size by Marriage Status in Putnam County
Out of a total of 13,808 households in Putnam County, 9,483 (68.7%) are family households, while 4,325 (31.3%) are nonfamily households. The most numerous type of family households are 2-person households, comprising 4,634, and the most common type of nonfamily households are 1-person households, comprising 3,570.

| Household Size | Family Households | Nonfamily Households |
| 1-Person Households | - | 3,570 (25.9%) |
| 2-Person Households | 4,634 (33.6%) | 629 (4.6%) |
| 3-Person Households | 1,870 (13.5%) | 35 (0.3%) |
| 4-Person Households | 1,507 (10.9%) | 55 (0.4%) |
| 5-Person Households | 927 (6.7%) | 22 (0.2%) |
| 6-Person Households | 370 (2.7%) | 0 (0.0%) |
| 7+ Person Households | 175 (1.3%) | 14 (0.1%) |
| Total | 9,483 (68.7%) | 4,325 (31.3%) |
Female Fertility in Putnam County
Fertility by Age in Putnam County
Average fertility rate in Putnam County is 31.0 births per 1,000 women. Women in the age bracket of 20 to 34 years have the highest fertility rate with 55.0 births per 1,000 women. Women in the age bracket of 20 to 34 years acount for 79.0% of all women with births.

| Age Bracket | Women with Births | Births / 1,000 Women |
| 15 to 19 years | 0 (0.0%) | 0.0 |
| 20 to 34 years | 196 (79.0%) | 55.0 |
| 35 to 50 years | 52 (21.0%) | 17.0 |
| Total | 248 (100.0%) | 31.0 |
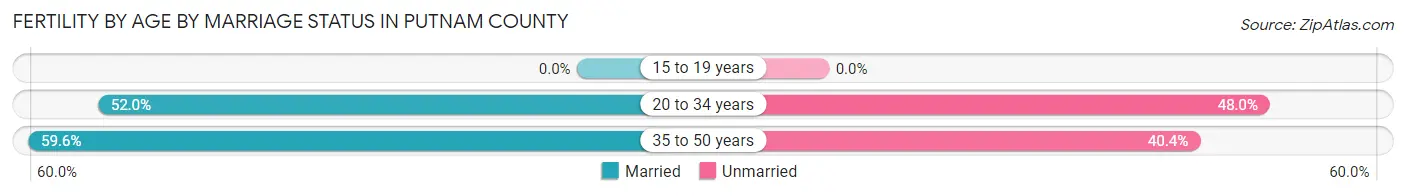
Fertility by Age by Marriage Status in Putnam County
53.6% of women with births (248) in Putnam County are married. The highest percentage of unmarried women with births falls into 20 to 34 years age bracket with 48.0% of them unmarried at the time of birth, while the lowest percentage of unmarried women with births belong to 35 to 50 years age bracket with 40.4% of them unmarried.
| Age Bracket | Married | Unmarried |
| 15 to 19 years | 0 (0.0%) | 0 (0.0%) |
| 20 to 34 years | 102 (52.0%) | 94 (48.0%) |
| 35 to 50 years | 31 (59.6%) | 21 (40.4%) |
| Total | 133 (53.6%) | 115 (46.4%) |
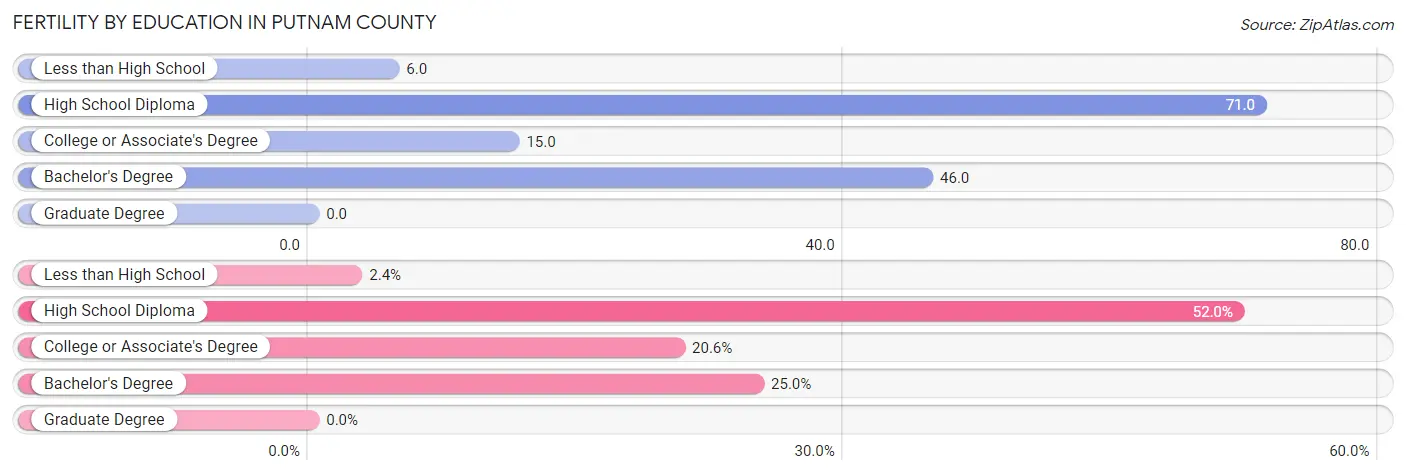
Fertility by Education in Putnam County
| Educational Attainment | Women with Births | Births / 1,000 Women |
| Less than High School | 6 (2.4%) | 6.0 |
| High School Diploma | 129 (52.0%) | 71.0 |
| College or Associate's Degree | 51 (20.6%) | 15.0 |
| Bachelor's Degree | 62 (25.0%) | 46.0 |
| Graduate Degree | 0 (0.0%) | 0.0 |
| Total | 248 (100.0%) | 31.0 |
Fertility by Education by Marriage Status in Putnam County
46.4% of women with births in Putnam County are unmarried. Women with the educational attainment of less than high school are most likely to be married with 100.0% of them married at childbirth, while women with the educational attainment of high school diploma are least likely to be married with 72.9% of them unmarried at childbirth.
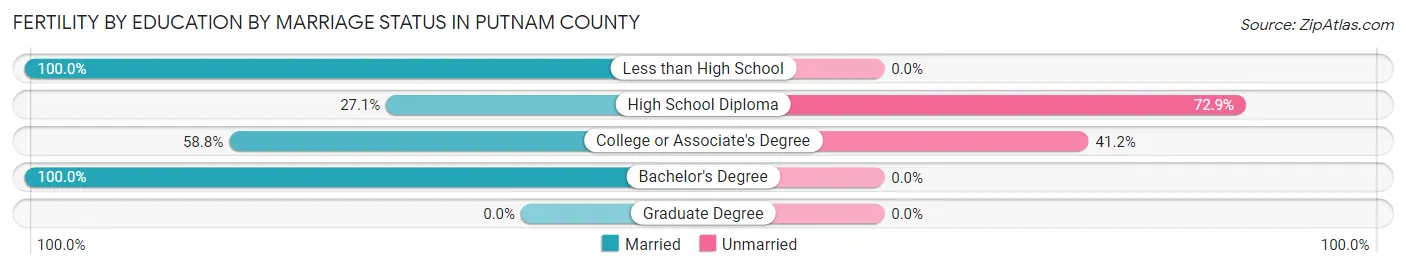
| Educational Attainment | Married | Unmarried |
| Less than High School | 6 (100.0%) | 0 (0.0%) |
| High School Diploma | 35 (27.1%) | 94 (72.9%) |
| College or Associate's Degree | 30 (58.8%) | 21 (41.2%) |
| Bachelor's Degree | 62 (100.0%) | 0 (0.0%) |
| Graduate Degree | 0 (0.0%) | 0 (0.0%) |
| Total | 133 (53.6%) | 115 (46.4%) |
Income in Putnam County
Income Overview in Putnam County
Per Capita Income in Putnam County is $31,015, while median incomes of families and households are $84,209 and $70,609 respectively.
| Characteristic | Number | Measure |
| Per Capita Income | 36,942 | $31,015 |
| Median Family Income | 9,483 | $84,209 |
| Mean Family Income | 9,483 | $95,371 |
| Median Household Income | 13,808 | $70,609 |
| Mean Household Income | 13,808 | $82,803 |
| Income Deficit | 9,483 | $9,454 |
| Wage / Income Gap (%) | 36,942 | 41.85% |
| Wage / Income Gap ($) | 36,942 | 58.15¢ per $1 |
| Gini / Inequality Index | 36,942 | 0.38 |
Earnings by Sex in Putnam County
Average Earnings in Putnam County are $37,616, $47,957 for men and $27,889 for women, a difference of 41.8%.

| Sex | Number | Average Earnings |
| Male | 10,567 (53.6%) | $47,957 |
| Female | 9,159 (46.4%) | $27,889 |
| Total | 19,726 (100.0%) | $37,616 |
Earnings by Sex by Income Bracket in Putnam County
The most common earnings brackets in Putnam County are $100,000+ for men (1,335 | 12.6%) and $2,499 or less for women (937 | 10.2%).

| Income | Male | Female |
| $2,499 or less | 439 (4.2%) | 937 (10.2%) |
| $2,500 to $4,999 | 375 (3.5%) | 698 (7.6%) |
| $5,000 to $7,499 | 413 (3.9%) | 493 (5.4%) |
| $7,500 to $9,999 | 254 (2.4%) | 262 (2.9%) |
| $10,000 to $12,499 | 179 (1.7%) | 386 (4.2%) |
| $12,500 to $14,999 | 134 (1.3%) | 339 (3.7%) |
| $15,000 to $17,499 | 237 (2.2%) | 189 (2.1%) |
| $17,500 to $19,999 | 138 (1.3%) | 163 (1.8%) |
| $20,000 to $22,499 | 263 (2.5%) | 397 (4.3%) |
| $22,500 to $24,999 | 523 (5.0%) | 400 (4.4%) |
| $25,000 to $29,999 | 313 (3.0%) | 617 (6.7%) |
| $30,000 to $34,999 | 581 (5.5%) | 697 (7.6%) |
| $35,000 to $39,999 | 310 (2.9%) | 597 (6.5%) |
| $40,000 to $44,999 | 625 (5.9%) | 490 (5.3%) |
| $45,000 to $49,999 | 725 (6.9%) | 289 (3.2%) |
| $50,000 to $54,999 | 591 (5.6%) | 356 (3.9%) |
| $55,000 to $64,999 | 1,039 (9.8%) | 538 (5.9%) |
| $65,000 to $74,999 | 866 (8.2%) | 316 (3.5%) |
| $75,000 to $99,999 | 1,227 (11.6%) | 585 (6.4%) |
| $100,000+ | 1,335 (12.6%) | 410 (4.5%) |
| Total | 10,567 (100.0%) | 9,159 (100.0%) |
Earnings by Sex by Educational Attainment in Putnam County
Average earnings in Putnam County are $54,792 for men and $34,900 for women, a difference of 36.3%. Men with an educational attainment of graduate degree enjoy the highest average annual earnings of $75,104, while those with less than high school education earn the least with $37,292. Women with an educational attainment of graduate degree earn the most with the average annual earnings of $53,929, while those with college or associate's degree education have the smallest earnings of $29,535.

| Educational Attainment | Male Income | Female Income |
| Less than High School | $37,292 | $30,625 |
| High School Diploma | $48,739 | $31,230 |
| College or Associate's Degree | $55,840 | $29,535 |
| Bachelor's Degree | $72,083 | $48,417 |
| Graduate Degree | $75,104 | $53,929 |
| Total | $54,792 | $34,900 |
Family Income in Putnam County
Family Income Brackets in Putnam County
According to the Putnam County family income data, there are 2,153 families falling into the $100,000 to $149,999 income range, which is the most common income bracket and makes up 22.7% of all families. Conversely, the $10,000 to $14,999 income bracket is the least frequent group with only 142 families (1.5%) belonging to this category.

| Income Bracket | # Families | % Families |
| Less than $10,000 | 161 | 1.7% |
| $10,000 to $14,999 | 142 | 1.5% |
| $15,000 to $24,999 | 303 | 3.2% |
| $25,000 to $34,999 | 541 | 5.7% |
| $35,000 to $49,999 | 1,166 | 12.3% |
| $50,000 to $74,999 | 1,792 | 18.9% |
| $75,000 to $99,999 | 1,650 | 17.4% |
| $100,000 to $149,999 | 2,153 | 22.7% |
| $150,000 to $199,999 | 1,110 | 11.7% |
| $200,000+ | 493 | 5.2% |
Family Income by Famaliy Size in Putnam County
4-person families (1,558 | 16.4%) account for the highest median family income in Putnam County with $105,833 per family, while 2-person families (4,978 | 52.5%) have the highest median income of $37,252 per family member.

| Income Bracket | # Families | Median Income |
| 2-Person Families | 4,978 (52.5%) | $74,505 |
| 3-Person Families | 1,788 (18.9%) | $85,556 |
| 4-Person Families | 1,558 (16.4%) | $105,833 |
| 5-Person Families | 726 (7.7%) | $87,000 |
| 6-Person Families | 323 (3.4%) | $67,961 |
| 7+ Person Families | 110 (1.2%) | $0 |
| Total | 9,483 (100.0%) | $84,209 |
Family Income by Number of Earners in Putnam County
The median family income in Putnam County is $84,209, with families comprising 3+ earners (1,004) having the highest median family income of $142,115, while families with no earners (1,622) have the lowest median family income of $46,806, accounting for 10.6% and 17.1% of families, respectively.
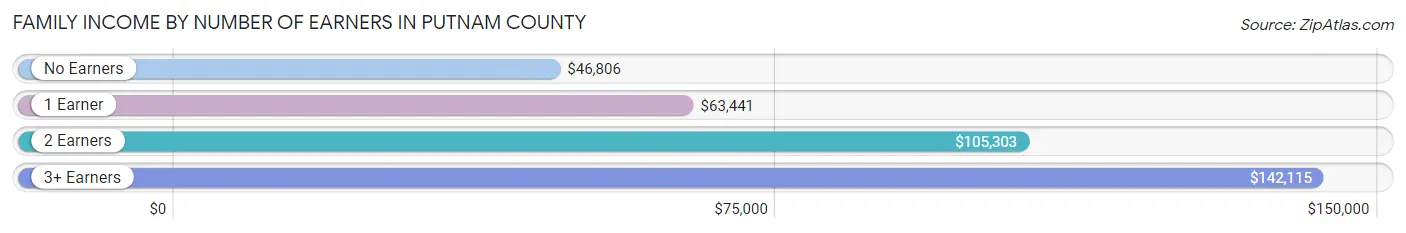
| Number of Earners | # Families | Median Income |
| No Earners | 1,622 (17.1%) | $46,806 |
| 1 Earner | 3,363 (35.5%) | $63,441 |
| 2 Earners | 3,494 (36.8%) | $105,303 |
| 3+ Earners | 1,004 (10.6%) | $142,115 |
| Total | 9,483 (100.0%) | $84,209 |
Household Income in Putnam County
Household Income Brackets in Putnam County
With 2,444 households falling in the category, the $50,000 to $74,999 income range is the most frequent in Putnam County, accounting for 17.7% of all households. In contrast, only 400 households (2.9%) fall into the $10,000 to $14,999 income bracket, making it the least populous group.

| Income Bracket | # Households | % Households |
| Less than $10,000 | 469 | 3.4% |
| $10,000 to $14,999 | 400 | 2.9% |
| $15,000 to $24,999 | 980 | 7.1% |
| $25,000 to $34,999 | 1,146 | 8.3% |
| $35,000 to $49,999 | 1,809 | 13.1% |
| $50,000 to $74,999 | 2,444 | 17.7% |
| $75,000 to $99,999 | 2,375 | 17.2% |
| $100,000 to $149,999 | 2,389 | 17.3% |
| $150,000 to $199,999 | 1,270 | 9.2% |
| $200,000+ | 525 | 3.8% |
Household Income by Householder Age in Putnam County
The median household income in Putnam County is $70,609, with the highest median household income of $92,160 found in the 45 to 64 years age bracket for the primary householder. A total of 5,102 households (36.9%) fall into this category. Meanwhile, the 15 to 24 years age bracket for the primary householder has the lowest median household income of $36,838, with 426 households (3.1%) in this group.

| Income Bracket | # Households | Median Income |
| 15 to 24 Years | 426 (3.1%) | $36,838 |
| 25 to 44 Years | 4,396 (31.8%) | $72,375 |
| 45 to 64 Years | 5,102 (36.9%) | $92,160 |
| 65+ Years | 3,884 (28.1%) | $51,120 |
| Total | 13,808 (100.0%) | $70,609 |
Poverty in Putnam County
Income Below Poverty by Sex and Age in Putnam County
With 7.8% poverty level for males and 10.1% for females among the residents of Putnam County, 15 year old males and 16 and 17 year old females are the most vulnerable to poverty, with 35 males (20.0%) and 93 females (21.4%) in their respective age groups living below the poverty level.

| Age Bracket | Male | Female |
| Under 5 Years | 123 (14.4%) | 146 (18.3%) |
| 5 Years | 0 (0.0%) | 25 (16.0%) |
| 6 to 11 Years | 122 (9.8%) | 76 (7.1%) |
| 12 to 14 Years | 105 (13.4%) | 18 (2.5%) |
| 15 Years | 35 (20.0%) | 1 (0.7%) |
| 16 and 17 Years | 60 (11.0%) | 93 (21.4%) |
| 18 to 24 Years | 208 (15.4%) | 178 (18.8%) |
| 25 to 34 Years | 16 (0.8%) | 373 (18.6%) |
| 35 to 44 Years | 45 (2.6%) | 157 (8.5%) |
| 45 to 54 Years | 216 (9.7%) | 93 (4.4%) |
| 55 to 64 Years | 192 (7.9%) | 159 (6.7%) |
| 65 to 74 Years | 111 (6.3%) | 110 (6.1%) |
| 75 Years and over | 42 (4.1%) | 165 (11.7%) |
| Total | 1,275 (7.8%) | 1,594 (10.1%) |
Income Above Poverty by Sex and Age in Putnam County
According to the poverty statistics in Putnam County, males aged 5 years and females aged 15 years are the age groups that are most secure financially, with 100.0% of males and 99.3% of females in these age groups living above the poverty line.

| Age Bracket | Male | Female |
| Under 5 Years | 729 (85.6%) | 651 (81.7%) |
| 5 Years | 125 (100.0%) | 131 (84.0%) |
| 6 to 11 Years | 1,123 (90.2%) | 990 (92.9%) |
| 12 to 14 Years | 678 (86.6%) | 716 (97.6%) |
| 15 Years | 140 (80.0%) | 148 (99.3%) |
| 16 and 17 Years | 485 (89.0%) | 342 (78.6%) |
| 18 to 24 Years | 1,144 (84.6%) | 767 (81.2%) |
| 25 to 34 Years | 2,090 (99.2%) | 1,628 (81.4%) |
| 35 to 44 Years | 1,655 (97.4%) | 1,695 (91.5%) |
| 45 to 54 Years | 2,022 (90.3%) | 2,038 (95.6%) |
| 55 to 64 Years | 2,241 (92.1%) | 2,212 (93.3%) |
| 65 to 74 Years | 1,639 (93.7%) | 1,699 (93.9%) |
| 75 Years and over | 980 (95.9%) | 1,246 (88.3%) |
| Total | 15,051 (92.2%) | 14,263 (89.9%) |
Income Below Poverty Among Married-Couple Families in Putnam County
The poverty statistics for married-couple families in Putnam County show that 1.7% or 128 of the total 7,528 families live below the poverty line. Families with no children have the highest poverty rate of 2.1%, comprising of 103 families. On the other hand, families with 3 or 4 children have the lowest poverty rate of 0.0%, which includes 0 families.

| Children | Above Poverty | Below Poverty |
| No Children | 4,768 (97.9%) | 103 (2.1%) |
| 1 or 2 Children | 1,930 (98.7%) | 25 (1.3%) |
| 3 or 4 Children | 672 (100.0%) | 0 (0.0%) |
| 5 or more Children | 30 (100.0%) | 0 (0.0%) |
| Total | 7,400 (98.3%) | 128 (1.7%) |
Income Below Poverty Among Single-Parent Households in Putnam County
According to the poverty data in Putnam County, 7.5% or 61 single-father households and 29.9% or 341 single-mother households are living below the poverty line. Among single-father households, those with 3 or 4 children have the highest poverty rate, with 24 households (21.2%) experiencing poverty. Likewise, among single-mother households, those with 3 or 4 children have the highest poverty rate, with 117 households (55.4%) falling below the poverty line.
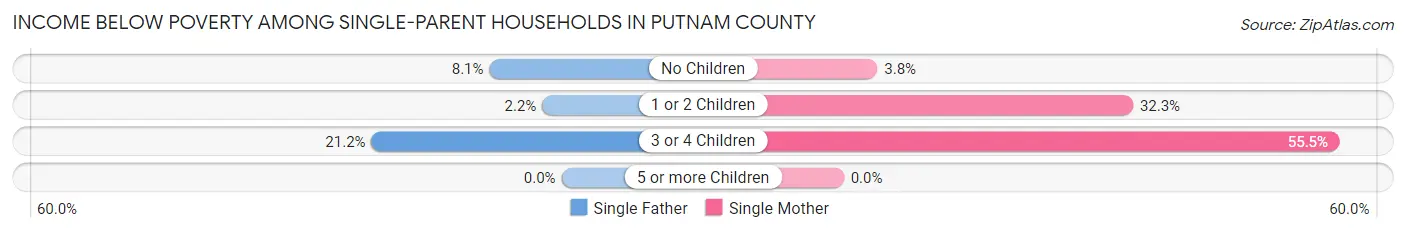
| Children | Single Father | Single Mother |
| No Children | 30 (8.1%) | 10 (3.8%) |
| 1 or 2 Children | 7 (2.2%) | 214 (32.3%) |
| 3 or 4 Children | 24 (21.2%) | 117 (55.4%) |
| 5 or more Children | 0 (0.0%) | 0 (0.0%) |
| Total | 61 (7.5%) | 341 (29.9%) |
Income Below Poverty Among Married-Couple vs Single-Parent Households in Putnam County
The poverty data for Putnam County shows that 128 of the married-couple family households (1.7%) and 402 of the single-parent households (20.6%) are living below the poverty level. Within the married-couple family households, those with no children have the highest poverty rate, with 103 households (2.1%) falling below the poverty line. Among the single-parent households, those with 3 or 4 children have the highest poverty rate, with 141 household (43.5%) living below poverty.
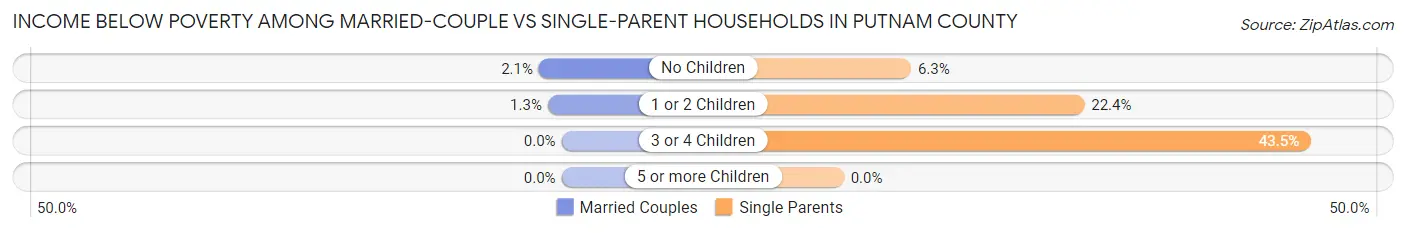
| Children | Married-Couple Families | Single-Parent Households |
| No Children | 103 (2.1%) | 40 (6.3%) |
| 1 or 2 Children | 25 (1.3%) | 221 (22.4%) |
| 3 or 4 Children | 0 (0.0%) | 141 (43.5%) |
| 5 or more Children | 0 (0.0%) | 0 (0.0%) |
| Total | 128 (1.7%) | 402 (20.6%) |
Employment Characteristics in Putnam County
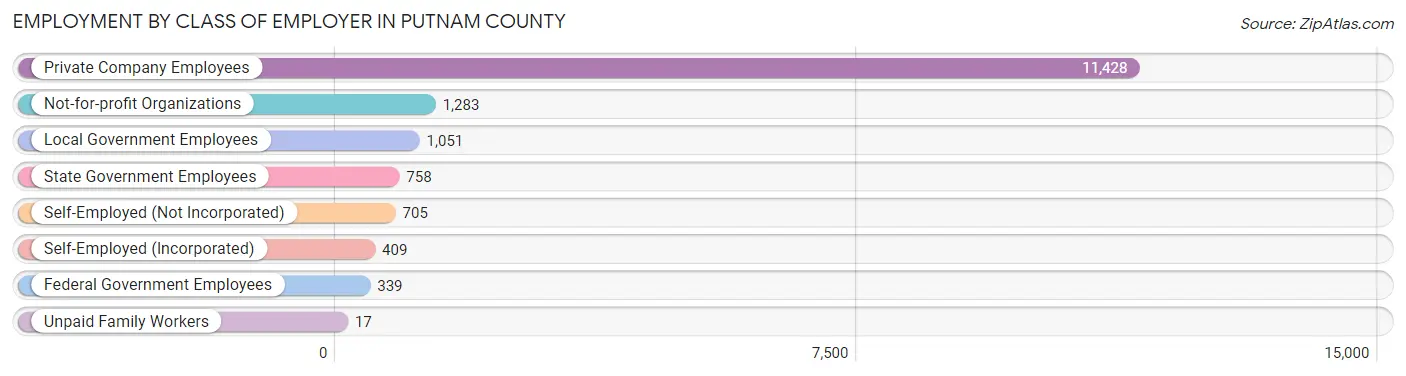
Employment by Class of Employer in Putnam County
Among the 15,990 employed individuals in Putnam County, private company employees (11,428 | 71.5%), not-for-profit organizations (1,283 | 8.0%), and local government employees (1,051 | 6.6%) make up the most common classes of employment.
| Employer Class | # Employees | % Employees |
| Private Company Employees | 11,428 | 71.5% |
| Self-Employed (Incorporated) | 409 | 2.6% |
| Self-Employed (Not Incorporated) | 705 | 4.4% |
| Not-for-profit Organizations | 1,283 | 8.0% |
| Local Government Employees | 1,051 | 6.6% |
| State Government Employees | 758 | 4.7% |
| Federal Government Employees | 339 | 2.1% |
| Unpaid Family Workers | 17 | 0.1% |
| Total | 15,990 | 100.0% |
Employment Status by Age in Putnam County
According to the labor force statistics for Putnam County, out of the total population over 16 years of age (30,670), 56.2% or 17,237 individuals are in the labor force, with 2.8% or 483 of them unemployed. The age group with the highest labor force participation rate is 25 to 29 years, with 80.4% or 1,932 individuals in the labor force. Within the labor force, the 45 to 54 years age range has the highest percentage of unemployed individuals, with 6.7% or 248 of them being unemployed.

| Age Bracket | In Labor Force | Unemployed |
| 16 to 19 Years | 821 (32.4%) | 37 (4.5%) |
| 20 to 24 Years | 1,868 (56.7%) | 78 (4.2%) |
| 25 to 29 Years | 1,932 (80.4%) | 25 (1.3%) |
| 30 to 34 Years | 1,800 (80.3%) | 59 (3.3%) |
| 35 to 44 Years | 2,882 (67.5%) | 37 (1.3%) |
| 45 to 54 Years | 3,698 (78.9%) | 248 (6.7%) |
| 55 to 59 Years | 1,627 (70.9%) | 0 (0.0%) |
| 60 to 64 Years | 1,661 (62.6%) | 0 (0.0%) |
| 65 to 74 Years | 807 (22.2%) | 0 (0.0%) |
| 75 Years and over | 149 (5.6%) | 0 (0.0%) |
| Total | 17,237 (56.2%) | 483 (2.8%) |
Employment Status by Educational Attainment in Putnam County
According to labor force statistics for Putnam County, 73.3% of individuals (13,596) out of the total population between 25 and 64 years of age (18,549) are in the labor force, with 2.7% or 367 of them being unemployed. The group with the highest labor force participation rate are those with the educational attainment of bachelor's degree or higher, with 87.1% or 3,221 individuals in the labor force. Within the labor force, individuals with less than high school education have the highest percentage of unemployment, with 10.8% or 96 of them being unemployed.

| Educational Attainment | In Labor Force | Unemployed |
| Less than High School | 889 (55.5%) | 173 (10.8%) |
| High School Diploma | 4,402 (64.3%) | 103 (1.5%) |
| College / Associate Degree | 5,091 (79.5%) | 256 (4.0%) |
| Bachelor's Degree or higher | 3,221 (87.1%) | 7 (0.2%) |
| Total | 13,596 (73.3%) | 501 (2.7%) |
Employment Occupations by Sex in Putnam County
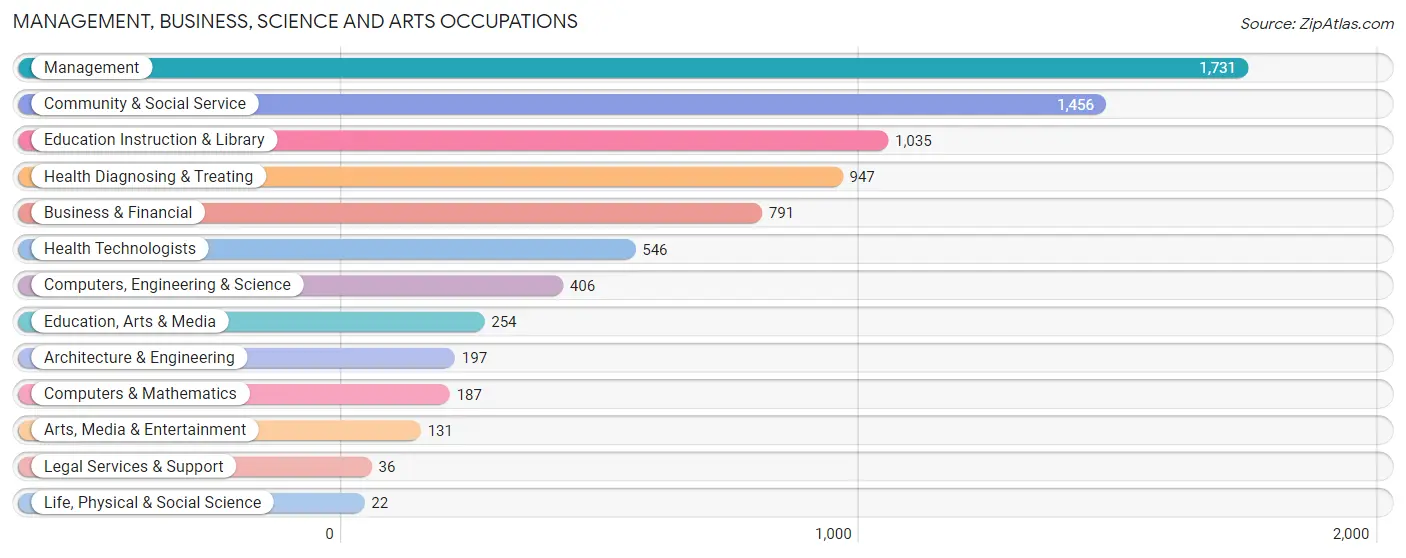
Management, Business, Science and Arts Occupations
The most common Management, Business, Science and Arts occupations in Putnam County are Management (1,731 | 10.3%), Community & Social Service (1,456 | 8.7%), Education Instruction & Library (1,035 | 6.2%), Health Diagnosing & Treating (947 | 5.7%), and Business & Financial (791 | 4.7%).
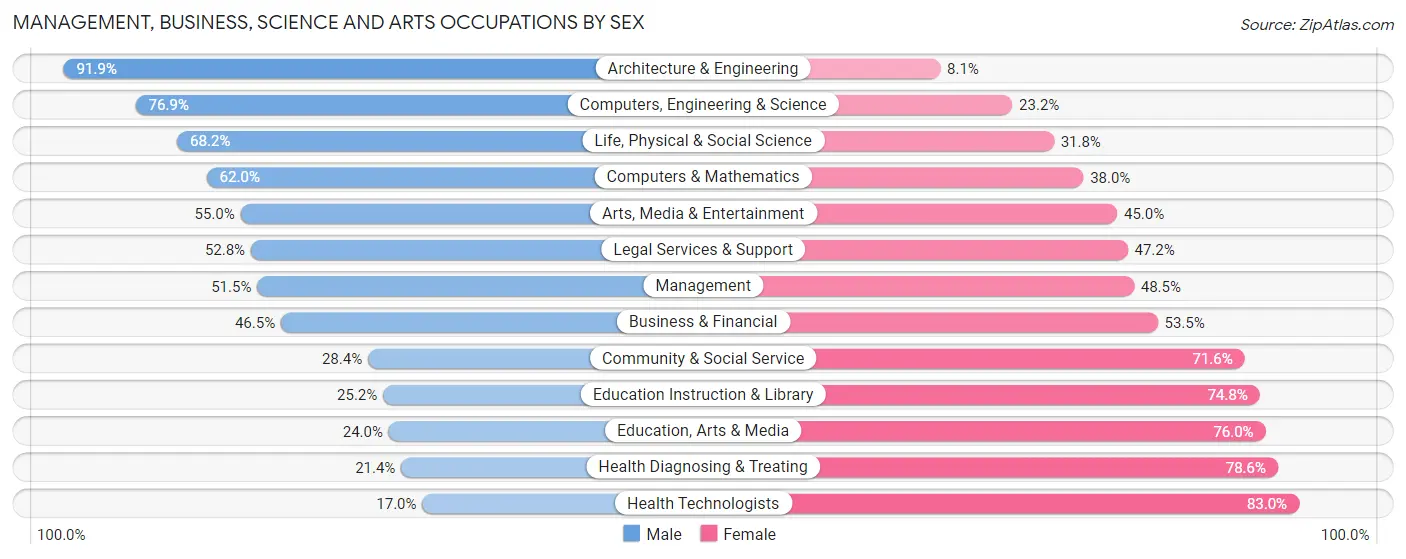
Management, Business, Science and Arts Occupations by Sex
Within the Management, Business, Science and Arts occupations in Putnam County, the most male-oriented occupations are Architecture & Engineering (91.9%), Computers, Engineering & Science (76.8%), and Life, Physical & Social Science (68.2%), while the most female-oriented occupations are Health Technologists (83.0%), Health Diagnosing & Treating (78.6%), and Education, Arts & Media (76.0%).
| Occupation | Male | Female |
| Management | 891 (51.5%) | 840 (48.5%) |
| Business & Financial | 368 (46.5%) | 423 (53.5%) |
| Computers, Engineering & Science | 312 (76.8%) | 94 (23.2%) |
| Computers & Mathematics | 116 (62.0%) | 71 (38.0%) |
| Architecture & Engineering | 181 (91.9%) | 16 (8.1%) |
| Life, Physical & Social Science | 15 (68.2%) | 7 (31.8%) |
| Community & Social Service | 413 (28.4%) | 1,043 (71.6%) |
| Education, Arts & Media | 61 (24.0%) | 193 (76.0%) |
| Legal Services & Support | 19 (52.8%) | 17 (47.2%) |
| Education Instruction & Library | 261 (25.2%) | 774 (74.8%) |
| Arts, Media & Entertainment | 72 (55.0%) | 59 (45.0%) |
| Health Diagnosing & Treating | 203 (21.4%) | 744 (78.6%) |
| Health Technologists | 93 (17.0%) | 453 (83.0%) |
| Total (Category) | 2,187 (41.0%) | 3,144 (59.0%) |
| Total (Overall) | 8,849 (52.9%) | 7,879 (47.1%) |
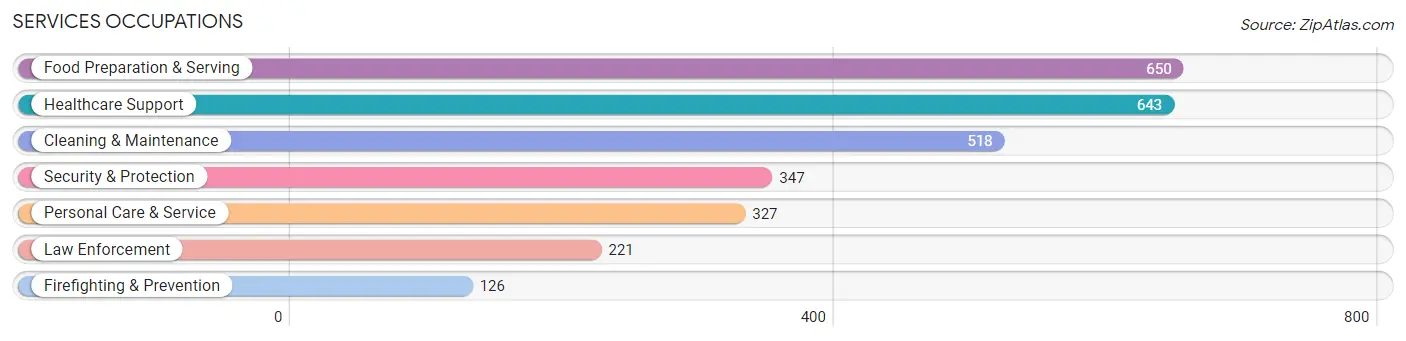
Services Occupations
The most common Services occupations in Putnam County are Food Preparation & Serving (650 | 3.9%), Healthcare Support (643 | 3.8%), Cleaning & Maintenance (518 | 3.1%), Security & Protection (347 | 2.1%), and Personal Care & Service (327 | 1.9%).
Services Occupations by Sex
Within the Services occupations in Putnam County, the most male-oriented occupations are Law Enforcement (71.0%), Security & Protection (70.6%), and Firefighting & Prevention (69.8%), while the most female-oriented occupations are Healthcare Support (92.1%), Personal Care & Service (91.4%), and Food Preparation & Serving (72.6%).
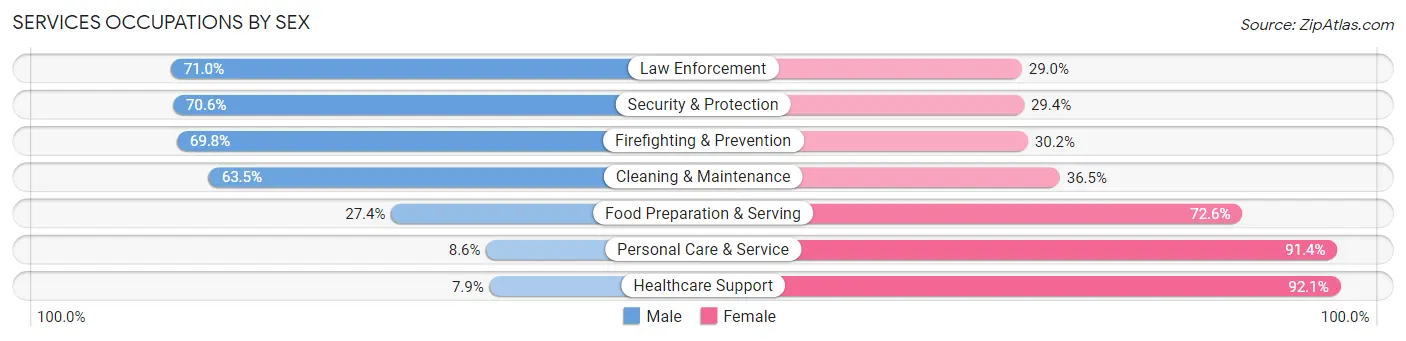
| Occupation | Male | Female |
| Healthcare Support | 51 (7.9%) | 592 (92.1%) |
| Security & Protection | 245 (70.6%) | 102 (29.4%) |
| Firefighting & Prevention | 88 (69.8%) | 38 (30.2%) |
| Law Enforcement | 157 (71.0%) | 64 (29.0%) |
| Food Preparation & Serving | 178 (27.4%) | 472 (72.6%) |
| Cleaning & Maintenance | 329 (63.5%) | 189 (36.5%) |
| Personal Care & Service | 28 (8.6%) | 299 (91.4%) |
| Total (Category) | 831 (33.4%) | 1,654 (66.6%) |
| Total (Overall) | 8,849 (52.9%) | 7,879 (47.1%) |
Sales and Office Occupations
The most common Sales and Office occupations in Putnam County are Office & Administration (1,793 | 10.7%), and Sales & Related (1,287 | 7.7%).

Sales and Office Occupations by Sex

| Occupation | Male | Female |
| Sales & Related | 482 (37.4%) | 805 (62.5%) |
| Office & Administration | 546 (30.4%) | 1,247 (69.6%) |
| Total (Category) | 1,028 (33.4%) | 2,052 (66.6%) |
| Total (Overall) | 8,849 (52.9%) | 7,879 (47.1%) |
Natural Resources, Construction and Maintenance Occupations
The most common Natural Resources, Construction and Maintenance occupations in Putnam County are Construction & Extraction (955 | 5.7%), Installation, Maintenance & Repair (811 | 4.9%), and Farming, Fishing & Forestry (49 | 0.3%).

Natural Resources, Construction and Maintenance Occupations by Sex

| Occupation | Male | Female |
| Farming, Fishing & Forestry | 49 (100.0%) | 0 (0.0%) |
| Construction & Extraction | 927 (97.1%) | 28 (2.9%) |
| Installation, Maintenance & Repair | 796 (98.2%) | 15 (1.8%) |
| Total (Category) | 1,772 (97.6%) | 43 (2.4%) |
| Total (Overall) | 8,849 (52.9%) | 7,879 (47.1%) |
Production, Transportation and Moving Occupations
The most common Production, Transportation and Moving occupations in Putnam County are Production (1,788 | 10.7%), Material Moving (1,318 | 7.9%), and Transportation (911 | 5.4%).

Production, Transportation and Moving Occupations by Sex

| Occupation | Male | Female |
| Production | 1,373 (76.8%) | 415 (23.2%) |
| Transportation | 808 (88.7%) | 103 (11.3%) |
| Material Moving | 850 (64.5%) | 468 (35.5%) |
| Total (Category) | 3,031 (75.4%) | 986 (24.5%) |
| Total (Overall) | 8,849 (52.9%) | 7,879 (47.1%) |
Employment Industries by Sex in Putnam County
Employment Industries in Putnam County
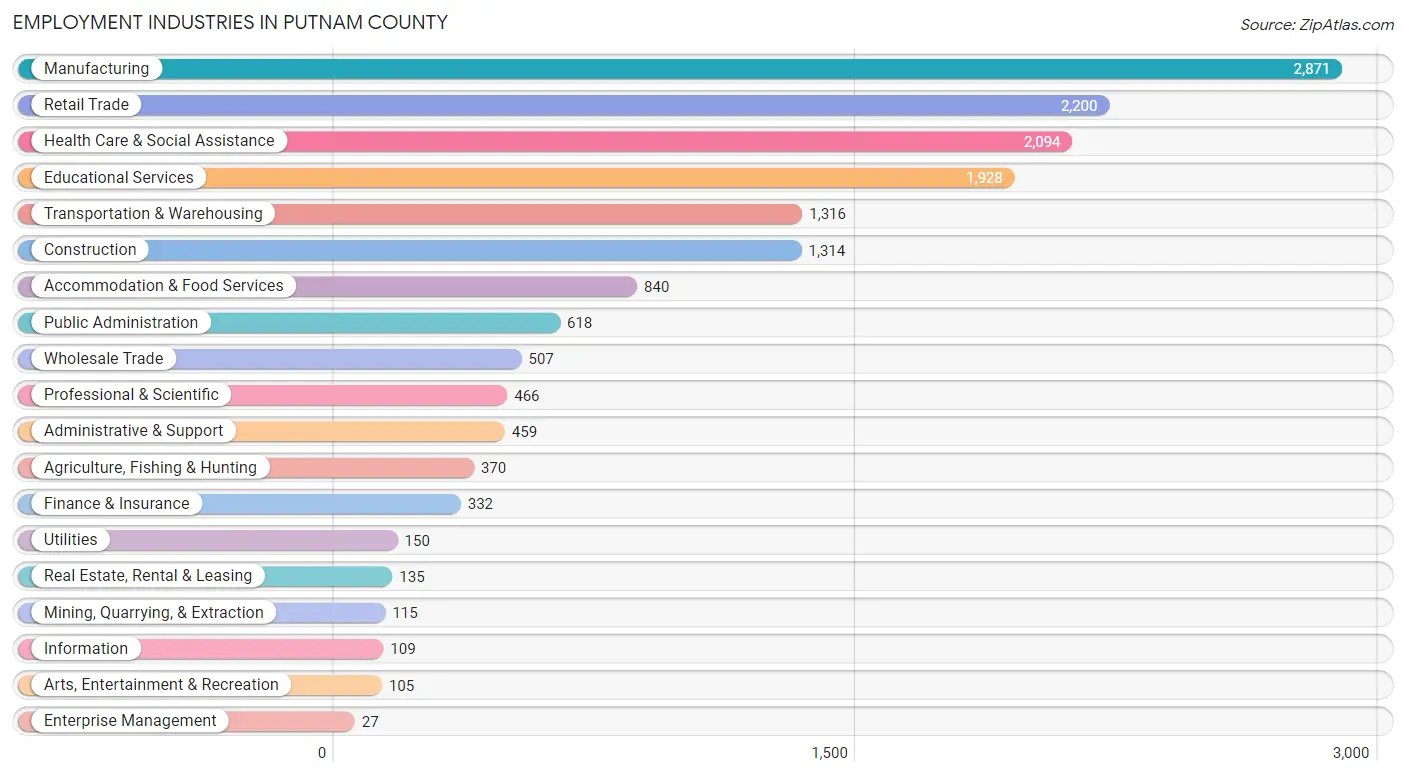
The major employment industries in Putnam County include Manufacturing (2,871 | 17.2%), Retail Trade (2,200 | 13.2%), Health Care & Social Assistance (2,094 | 12.5%), Educational Services (1,928 | 11.5%), and Transportation & Warehousing (1,316 | 7.9%).
Employment Industries by Sex in Putnam County
The Putnam County industries that see more men than women are Mining, Quarrying, & Extraction (100.0%), Enterprise Management (100.0%), and Construction (92.8%), whereas the industries that tend to have a higher number of women are Health Care & Social Assistance (85.4%), Finance & Insurance (76.2%), and Accommodation & Food Services (76.1%).
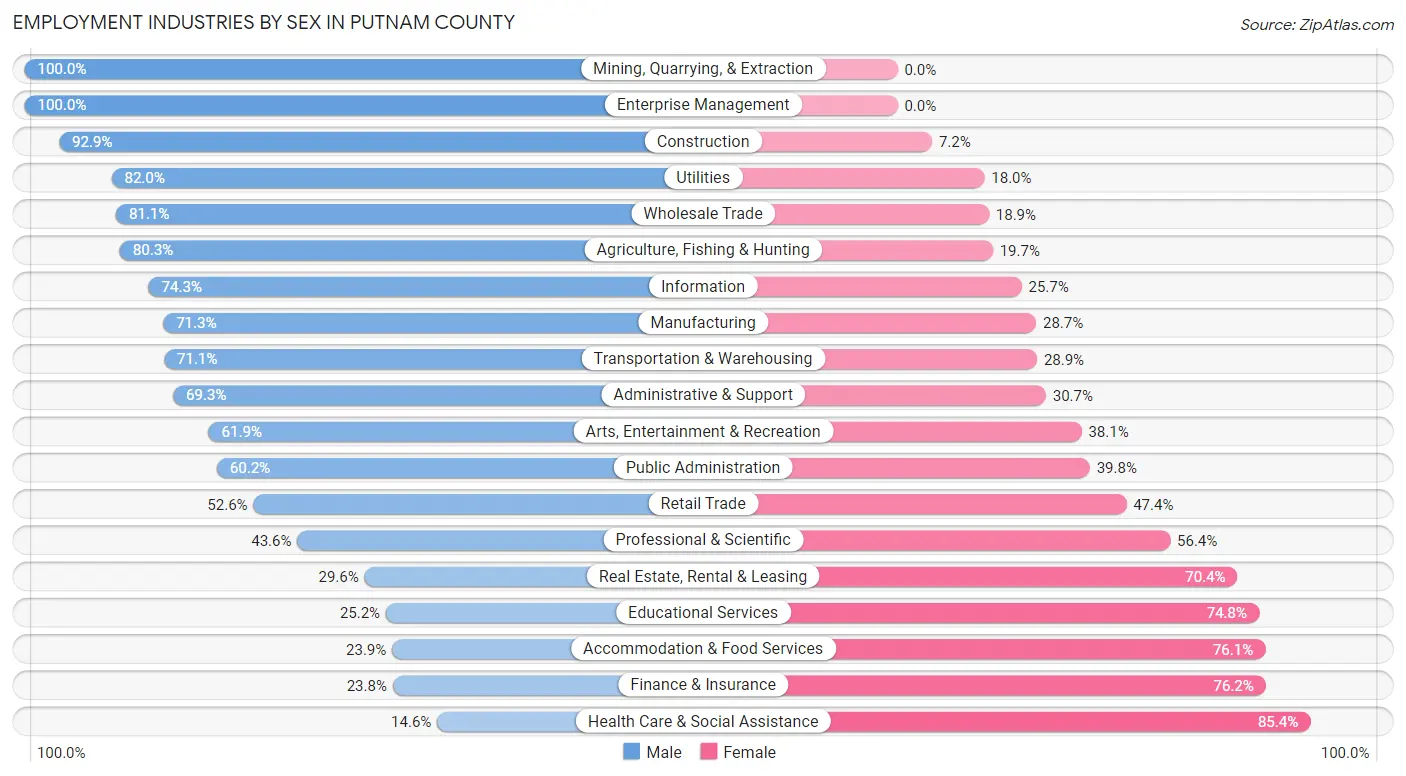
| Industry | Male | Female |
| Agriculture, Fishing & Hunting | 297 (80.3%) | 73 (19.7%) |
| Mining, Quarrying, & Extraction | 115 (100.0%) | 0 (0.0%) |
| Construction | 1,220 (92.8%) | 94 (7.1%) |
| Manufacturing | 2,047 (71.3%) | 824 (28.7%) |
| Wholesale Trade | 411 (81.1%) | 96 (18.9%) |
| Retail Trade | 1,158 (52.6%) | 1,042 (47.4%) |
| Transportation & Warehousing | 936 (71.1%) | 380 (28.9%) |
| Utilities | 123 (82.0%) | 27 (18.0%) |
| Information | 81 (74.3%) | 28 (25.7%) |
| Finance & Insurance | 79 (23.8%) | 253 (76.2%) |
| Real Estate, Rental & Leasing | 40 (29.6%) | 95 (70.4%) |
| Professional & Scientific | 203 (43.6%) | 263 (56.4%) |
| Enterprise Management | 27 (100.0%) | 0 (0.0%) |
| Administrative & Support | 318 (69.3%) | 141 (30.7%) |
| Educational Services | 486 (25.2%) | 1,442 (74.8%) |
| Health Care & Social Assistance | 306 (14.6%) | 1,788 (85.4%) |
| Arts, Entertainment & Recreation | 65 (61.9%) | 40 (38.1%) |
| Accommodation & Food Services | 201 (23.9%) | 639 (76.1%) |
| Public Administration | 372 (60.2%) | 246 (39.8%) |
| Total | 8,849 (52.9%) | 7,879 (47.1%) |
Education in Putnam County
School Enrollment in Putnam County
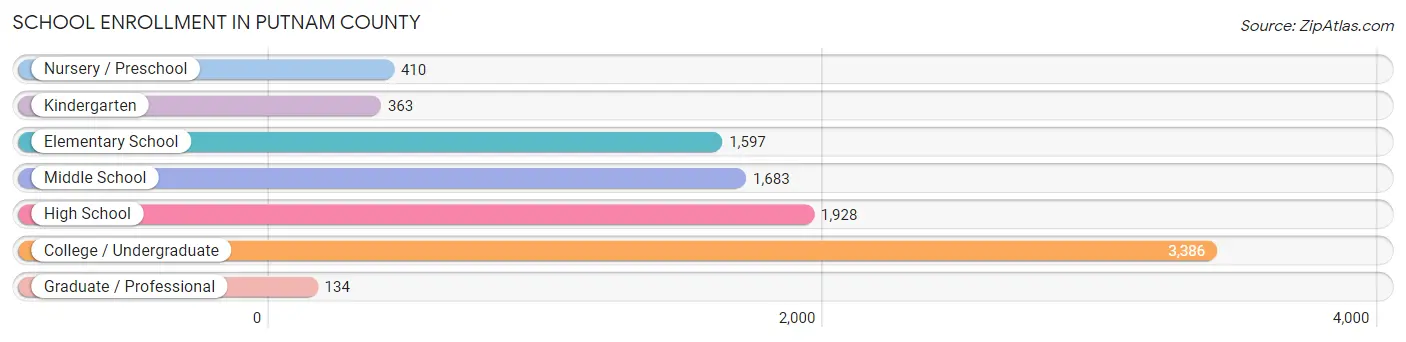
The most common levels of schooling among the 9,501 students in Putnam County are college / undergraduate (3,386 | 35.6%), high school (1,928 | 20.3%), and middle school (1,683 | 17.7%).
| School Level | # Students | % Students |
| Nursery / Preschool | 410 | 4.3% |
| Kindergarten | 363 | 3.8% |
| Elementary School | 1,597 | 16.8% |
| Middle School | 1,683 | 17.7% |
| High School | 1,928 | 20.3% |
| College / Undergraduate | 3,386 | 35.6% |
| Graduate / Professional | 134 | 1.4% |
| Total | 9,501 | 100.0% |
School Enrollment by Age by Funding Source in Putnam County
Out of a total of 9,501 students who are enrolled in schools in Putnam County, 2,822 (29.7%) attend a private institution, while the remaining 6,679 (70.3%) are enrolled in public schools. The age group of 20 to 24 year olds has the highest likelihood of being enrolled in private schools, with 1,415 (74.6% in the age bracket) enrolled. Conversely, the age group of 25 to 34 year olds has the lowest likelihood of being enrolled in a private school, with 340 (95.0% in the age bracket) attending a public institution.
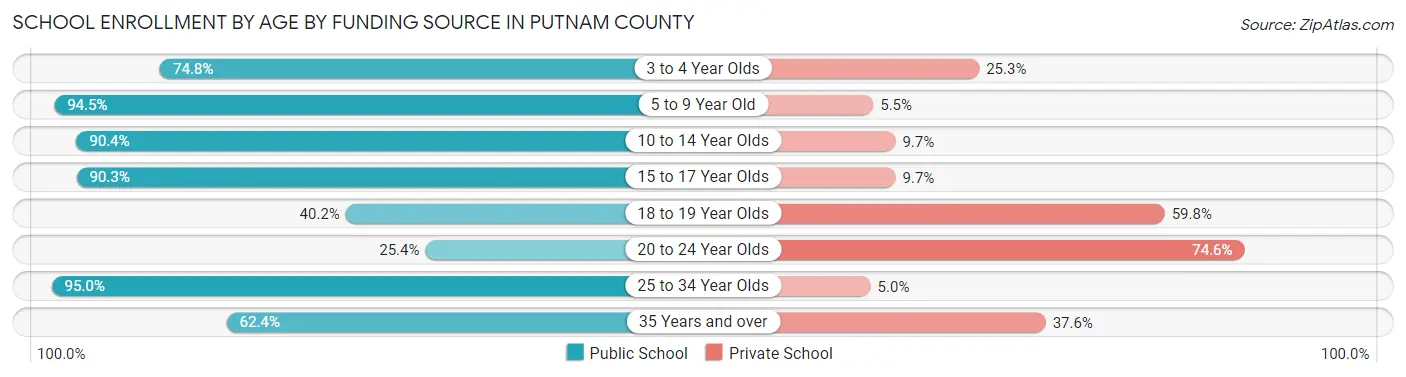
| Age Bracket | Public School | Private School |
| 3 to 4 Year Olds | 225 (74.8%) | 76 (25.3%) |
| 5 to 9 Year Old | 1,728 (94.5%) | 101 (5.5%) |
| 10 to 14 Year Olds | 2,069 (90.3%) | 221 (9.7%) |
| 15 to 17 Year Olds | 1,149 (90.3%) | 123 (9.7%) |
| 18 to 19 Year Olds | 513 (40.2%) | 763 (59.8%) |
| 20 to 24 Year Olds | 481 (25.4%) | 1,415 (74.6%) |
| 25 to 34 Year Olds | 340 (95.0%) | 18 (5.0%) |
| 35 Years and over | 174 (62.4%) | 105 (37.6%) |
| Total | 6,679 (70.3%) | 2,822 (29.7%) |
Educational Attainment by Field of Study in Putnam County
Education (1,020 | 19.5%), business (965 | 18.5%), science & technology (593 | 11.4%), liberal arts & history (350 | 6.7%), and engineering (348 | 6.7%) are the most common fields of study among 5,225 individuals in Putnam County who have obtained a bachelor's degree or higher.

| Field of Study | # Graduates | % Graduates |
| Computers & Mathematics | 117 | 2.2% |
| Bio, Nature & Agricultural | 322 | 6.2% |
| Physical & Health Sciences | 169 | 3.2% |
| Psychology | 240 | 4.6% |
| Social Sciences | 326 | 6.2% |
| Engineering | 348 | 6.7% |
| Multidisciplinary Studies | 26 | 0.5% |
| Science & Technology | 593 | 11.4% |
| Business | 965 | 18.5% |
| Education | 1,020 | 19.5% |
| Literature & Languages | 193 | 3.7% |
| Liberal Arts & History | 350 | 6.7% |
| Visual & Performing Arts | 215 | 4.1% |
| Communications | 111 | 2.1% |
| Arts & Humanities | 230 | 4.4% |
| Total | 5,225 | 100.0% |
Transportation & Commute in Putnam County
Vehicle Availability by Sex in Putnam County
The most prevalent vehicle ownership categories in Putnam County are males with 2 vehicles (3,234, accounting for 40.2%) and females with 2 vehicles (2,586, making up 45.3%).

| Vehicles Available | Male | Female |
| No Vehicle | 50 (0.6%) | 156 (2.2%) |
| 1 Vehicle | 1,263 (15.7%) | 1,071 (15.0%) |
| 2 Vehicles | 3,234 (40.2%) | 2,586 (36.2%) |
| 3 Vehicles | 1,756 (21.8%) | 1,746 (24.5%) |
| 4 Vehicles | 884 (11.0%) | 918 (12.9%) |
| 5 or more Vehicles | 864 (10.7%) | 656 (9.2%) |
| Total | 8,051 (100.0%) | 7,133 (100.0%) |
Commute Time in Putnam County
The most frequently occuring commute durations in Putnam County are 5 to 9 minutes (2,015 commuters, 14.0%), 10 to 14 minutes (1,998 commuters, 13.9%), and 15 to 19 minutes (1,809 commuters, 12.6%).

| Commute Time | # Commuters | % Commuters |
| Less than 5 Minutes | 591 | 4.1% |
| 5 to 9 Minutes | 2,015 | 14.0% |
| 10 to 14 Minutes | 1,998 | 13.9% |
| 15 to 19 Minutes | 1,809 | 12.6% |
| 20 to 24 Minutes | 1,689 | 11.7% |
| 25 to 29 Minutes | 632 | 4.4% |
| 30 to 34 Minutes | 1,363 | 9.5% |
| 35 to 39 Minutes | 500 | 3.5% |
| 40 to 44 Minutes | 478 | 3.3% |
| 45 to 59 Minutes | 1,630 | 11.3% |
| 60 to 89 Minutes | 1,414 | 9.8% |
| 90 or more Minutes | 286 | 2.0% |
Commute Time by Sex in Putnam County
The most common commute times in Putnam County are 5 to 9 minutes (1,148 commuters, 14.9%) for males and 10 to 14 minutes (1,175 commuters, 17.5%) for females.

| Commute Time | Male | Female |
| Less than 5 Minutes | 311 (4.0%) | 280 (4.2%) |
| 5 to 9 Minutes | 1,148 (14.9%) | 867 (12.9%) |
| 10 to 14 Minutes | 823 (10.7%) | 1,175 (17.5%) |
| 15 to 19 Minutes | 737 (9.6%) | 1,072 (16.0%) |
| 20 to 24 Minutes | 778 (10.1%) | 911 (13.6%) |
| 25 to 29 Minutes | 294 (3.8%) | 338 (5.0%) |
| 30 to 34 Minutes | 764 (9.9%) | 599 (8.9%) |
| 35 to 39 Minutes | 248 (3.2%) | 252 (3.7%) |
| 40 to 44 Minutes | 308 (4.0%) | 170 (2.5%) |
| 45 to 59 Minutes | 1,056 (13.7%) | 574 (8.6%) |
| 60 to 89 Minutes | 1,032 (13.4%) | 382 (5.7%) |
| 90 or more Minutes | 192 (2.5%) | 94 (1.4%) |
Time of Departure to Work by Sex in Putnam County
The most frequent times of departure to work in Putnam County are 6:00 AM to 6:29 AM (1,148, 14.9%) for males and 7:00 AM to 7:29 AM (808, 12.0%) for females.
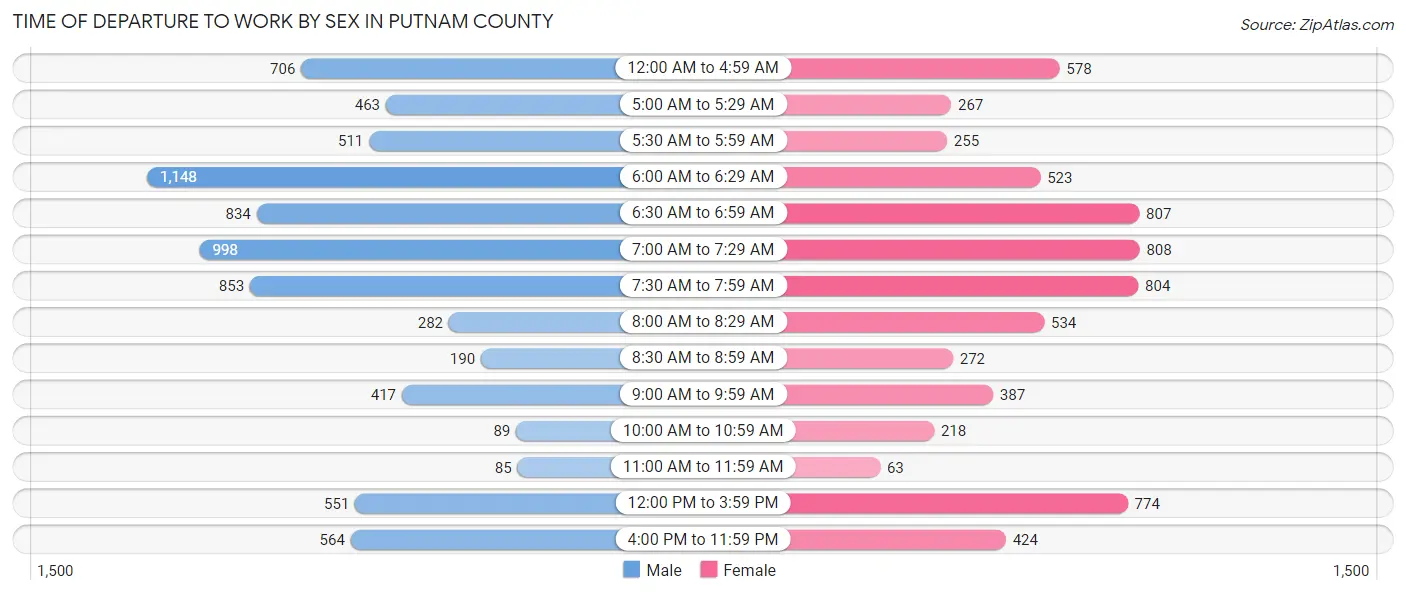
| Time of Departure | Male | Female |
| 12:00 AM to 4:59 AM | 706 (9.2%) | 578 (8.6%) |
| 5:00 AM to 5:29 AM | 463 (6.0%) | 267 (4.0%) |
| 5:30 AM to 5:59 AM | 511 (6.6%) | 255 (3.8%) |
| 6:00 AM to 6:29 AM | 1,148 (14.9%) | 523 (7.8%) |
| 6:30 AM to 6:59 AM | 834 (10.8%) | 807 (12.0%) |
| 7:00 AM to 7:29 AM | 998 (13.0%) | 808 (12.0%) |
| 7:30 AM to 7:59 AM | 853 (11.1%) | 804 (12.0%) |
| 8:00 AM to 8:29 AM | 282 (3.7%) | 534 (8.0%) |
| 8:30 AM to 8:59 AM | 190 (2.5%) | 272 (4.1%) |
| 9:00 AM to 9:59 AM | 417 (5.4%) | 387 (5.8%) |
| 10:00 AM to 10:59 AM | 89 (1.2%) | 218 (3.3%) |
| 11:00 AM to 11:59 AM | 85 (1.1%) | 63 (0.9%) |
| 12:00 PM to 3:59 PM | 551 (7.2%) | 774 (11.5%) |
| 4:00 PM to 11:59 PM | 564 (7.3%) | 424 (6.3%) |
| Total | 7,691 (100.0%) | 6,714 (100.0%) |
Housing Occupancy in Putnam County
Occupancy by Ownership in Putnam County
Of the total 13,808 dwellings in Putnam County, owner-occupied units account for 10,211 (74.0%), while renter-occupied units make up 3,597 (26.1%).
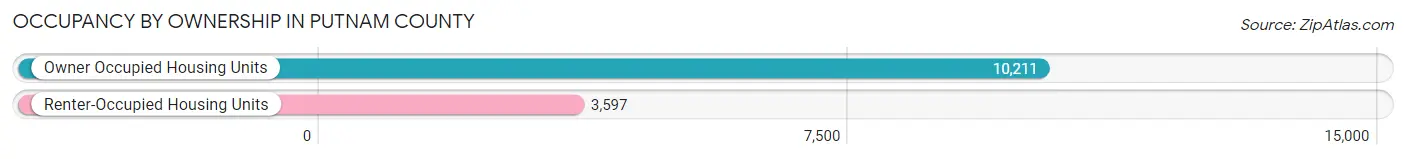
| Occupancy | # Housing Units | % Housing Units |
| Owner Occupied Housing Units | 10,211 | 74.0% |
| Renter-Occupied Housing Units | 3,597 | 26.1% |
| Total Occupied Housing Units | 13,808 | 100.0% |
Occupancy by Household Size in Putnam County
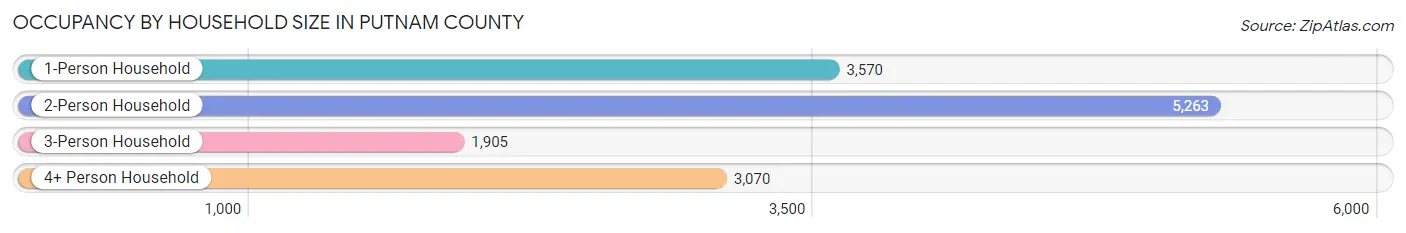
| Household Size | # Housing Units | % Housing Units |
| 1-Person Household | 3,570 | 25.9% |
| 2-Person Household | 5,263 | 38.1% |
| 3-Person Household | 1,905 | 13.8% |
| 4+ Person Household | 3,070 | 22.2% |
| Total Housing Units | 13,808 | 100.0% |
Occupancy by Ownership by Household Size in Putnam County

| Household Size | Owner-occupied | Renter-occupied |
| 1-Person Household | 2,055 (57.6%) | 1,515 (42.4%) |
| 2-Person Household | 4,285 (81.4%) | 978 (18.6%) |
| 3-Person Household | 1,453 (76.3%) | 452 (23.7%) |
| 4+ Person Household | 2,418 (78.8%) | 652 (21.2%) |
| Total Housing Units | 10,211 (74.0%) | 3,597 (26.1%) |
Occupancy by Educational Attainment in Putnam County
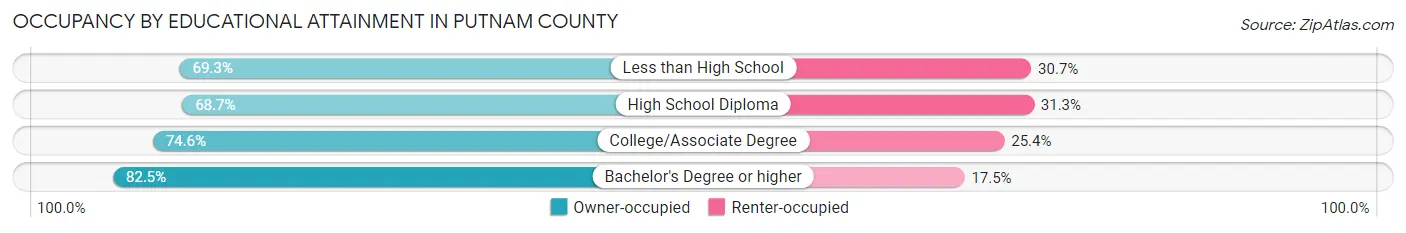
| Household Size | Owner-occupied | Renter-occupied |
| Less than High School | 762 (69.3%) | 338 (30.7%) |
| High School Diploma | 3,232 (68.7%) | 1,470 (31.3%) |
| College/Associate Degree | 3,661 (74.6%) | 1,247 (25.4%) |
| Bachelor's Degree or higher | 2,556 (82.5%) | 542 (17.5%) |
Occupancy by Age of Householder in Putnam County

| Age Bracket | # Households | % Households |
| Under 35 Years | 2,985 | 21.6% |
| 35 to 44 Years | 1,837 | 13.3% |
| 45 to 54 Years | 2,447 | 17.7% |
| 55 to 64 Years | 2,655 | 19.2% |
| 65 to 74 Years | 2,361 | 17.1% |
| 75 to 84 Years | 1,123 | 8.1% |
| 85 Years and Over | 400 | 2.9% |
| Total | 13,808 | 100.0% |
Housing Finances in Putnam County
Median Income by Occupancy in Putnam County

| Occupancy Type | # Households | Median Income |
| Owner-Occupied | 10,211 (74.0%) | $82,649 |
| Renter-Occupied | 3,597 (26.1%) | $42,802 |
| Average | 13,808 (100.0%) | $70,609 |
Occupancy by Householder Income Bracket in Putnam County

| Income Bracket | Owner-occupied | Renter-occupied |
| Less than $5,000 | 295 (2.9%) | 70 (1.9%) |
| $5,000 to $9,999 | 34 (0.3%) | 70 (1.9%) |
| $10,000 to $14,999 | 250 (2.5%) | 144 (4.0%) |
| $15,000 to $19,999 | 148 (1.5%) | 142 (4.0%) |
| $20,000 to $24,999 | 309 (3.0%) | 387 (10.8%) |
| $25,000 to $34,999 | 503 (4.9%) | 638 (17.7%) |
| $35,000 to $49,999 | 1,128 (11.1%) | 677 (18.8%) |
| $50,000 to $74,999 | 1,726 (16.9%) | 716 (19.9%) |
| $75,000 to $99,999 | 1,988 (19.5%) | 389 (10.8%) |
| $100,000 to $149,999 | 2,145 (21.0%) | 246 (6.8%) |
| $150,000 or more | 1,685 (16.5%) | 118 (3.3%) |
| Total | 10,211 (100.0%) | 3,597 (100.0%) |
Monthly Housing Cost Tiers in Putnam County

| Monthly Cost | Owner-occupied | Renter-occupied |
| Less than $300 | 672 (6.6%) | 156 (4.3%) |
| $300 to $499 | 1,592 (15.6%) | 164 (4.6%) |
| $500 to $799 | 1,582 (15.5%) | 1,033 (28.7%) |
| $800 to $999 | 1,253 (12.3%) | 950 (26.4%) |
| $1,000 to $1,499 | 2,672 (26.2%) | 1,060 (29.5%) |
| $1,500 to $1,999 | 1,612 (15.8%) | 90 (2.5%) |
| $2,000 to $2,499 | 488 (4.8%) | 9 (0.3%) |
| $2,500 to $2,999 | 125 (1.2%) | 0 (0.0%) |
| $3,000 or more | 215 (2.1%) | 10 (0.3%) |
| Total | 10,211 (100.0%) | 3,597 (100.0%) |
Physical Housing Characteristics in Putnam County
Housing Structures in Putnam County

| Structure Type | # Housing Units | % Housing Units |
| Single Unit, Detached | 11,182 | 81.0% |
| Single Unit, Attached | 179 | 1.3% |
| 2 Unit Apartments | 270 | 2.0% |
| 3 or 4 Unit Apartments | 436 | 3.2% |
| 5 to 9 Unit Apartments | 351 | 2.5% |
| 10 or more Apartments | 438 | 3.2% |
| Mobile Home / Other | 952 | 6.9% |
| Total | 13,808 | 100.0% |
Housing Structures by Occupancy in Putnam County
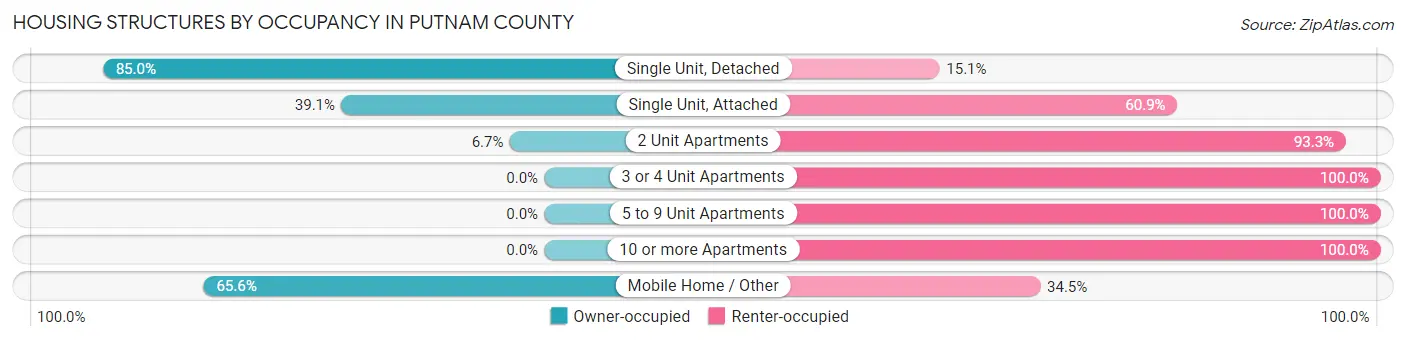
| Structure Type | Owner-occupied | Renter-occupied |
| Single Unit, Detached | 9,499 (85.0%) | 1,683 (15.0%) |
| Single Unit, Attached | 70 (39.1%) | 109 (60.9%) |
| 2 Unit Apartments | 18 (6.7%) | 252 (93.3%) |
| 3 or 4 Unit Apartments | 0 (0.0%) | 436 (100.0%) |
| 5 to 9 Unit Apartments | 0 (0.0%) | 351 (100.0%) |
| 10 or more Apartments | 0 (0.0%) | 438 (100.0%) |
| Mobile Home / Other | 624 (65.5%) | 328 (34.4%) |
| Total | 10,211 (74.0%) | 3,597 (26.1%) |
Housing Structures by Number of Rooms in Putnam County

| Number of Rooms | Owner-occupied | Renter-occupied |
| 1 Room | 0 (0.0%) | 69 (1.9%) |
| 2 or 3 Rooms | 135 (1.3%) | 749 (20.8%) |
| 4 or 5 Rooms | 2,461 (24.1%) | 1,879 (52.2%) |
| 6 or 7 Rooms | 4,077 (39.9%) | 740 (20.6%) |
| 8 or more Rooms | 3,538 (34.6%) | 160 (4.4%) |
| Total | 10,211 (100.0%) | 3,597 (100.0%) |
Housing Structure by Heating Type in Putnam County

| Heating Type | Owner-occupied | Renter-occupied |
| Utility Gas | 2,275 (22.3%) | 1,325 (36.8%) |
| Bottled, Tank, or LP Gas | 2,940 (28.8%) | 546 (15.2%) |
| Electricity | 3,649 (35.7%) | 1,624 (45.2%) |
| Fuel Oil or Kerosene | 557 (5.4%) | 22 (0.6%) |
| Coal or Coke | 0 (0.0%) | 0 (0.0%) |
| All other Fuels | 670 (6.6%) | 40 (1.1%) |
| No Fuel Used | 120 (1.2%) | 40 (1.1%) |
| Total | 10,211 (100.0%) | 3,597 (100.0%) |
Household Vehicle Usage in Putnam County

| Vehicles per Household | Owner-occupied | Renter-occupied |
| No Vehicle | 218 (2.1%) | 323 (9.0%) |
| 1 Vehicle | 2,167 (21.2%) | 1,787 (49.7%) |
| 2 Vehicles | 4,154 (40.7%) | 906 (25.2%) |
| 3 or more Vehicles | 3,672 (36.0%) | 581 (16.2%) |
| Total | 10,211 (100.0%) | 3,597 (100.0%) |
Real Estate & Mortgages in Putnam County
Real Estate and Mortgage Overview in Putnam County
| Characteristic | Without Mortgage | With Mortgage |
| Housing Units | 3,556 | 6,655 |
| Median Property Value | $137,400 | $202,100 |
| Median Household Income | $58,962 | $1,288 |
| Monthly Housing Costs | $446 | $208 |
| Real Estate Taxes | $805 | $138 |
Property Value by Mortgage Status in Putnam County

| Property Value | Without Mortgage | With Mortgage |
| Less than $50,000 | 424 (11.9%) | 238 (3.6%) |
| $50,000 to $99,999 | 633 (17.8%) | 460 (6.9%) |
| $100,000 to $299,999 | 1,988 (55.9%) | 4,428 (66.5%) |
| $300,000 to $499,999 | 294 (8.3%) | 1,264 (19.0%) |
| $500,000 to $749,999 | 79 (2.2%) | 111 (1.7%) |
| $750,000 to $999,999 | 44 (1.2%) | 154 (2.3%) |
| $1,000,000 or more | 94 (2.6%) | 0 (0.0%) |
| Total | 3,556 (100.0%) | 6,655 (100.0%) |
Household Income by Mortgage Status in Putnam County

| Household Income | Without Mortgage | With Mortgage |
| Less than $10,000 | 180 (5.1%) | 74 (1.1%) |
| $10,000 to $24,999 | 493 (13.9%) | 149 (2.2%) |
| $25,000 to $34,999 | 282 (7.9%) | 214 (3.2%) |
| $35,000 to $49,999 | 627 (17.6%) | 221 (3.3%) |
| $50,000 to $74,999 | 499 (14.0%) | 501 (7.5%) |
| $75,000 to $99,999 | 551 (15.5%) | 1,227 (18.4%) |
| $100,000 to $149,999 | 527 (14.8%) | 1,437 (21.6%) |
| $150,000 or more | 397 (11.2%) | 1,618 (24.3%) |
| Total | 3,556 (100.0%) | 6,655 (100.0%) |
Property Value to Household Income Ratio in Putnam County

| Value-to-Income Ratio | Without Mortgage | With Mortgage |
| Less than 2.0x | 1,551 (43.6%) | 92,175 (1,385.1%) |
| 2.0x to 2.9x | 512 (14.4%) | 3,069 (46.1%) |
| 3.0x to 3.9x | 453 (12.7%) | 1,529 (23.0%) |
| 4.0x or more | 965 (27.1%) | 912 (13.7%) |
| Total | 3,556 (100.0%) | 6,655 (100.0%) |
Real Estate Taxes by Mortgage Status in Putnam County
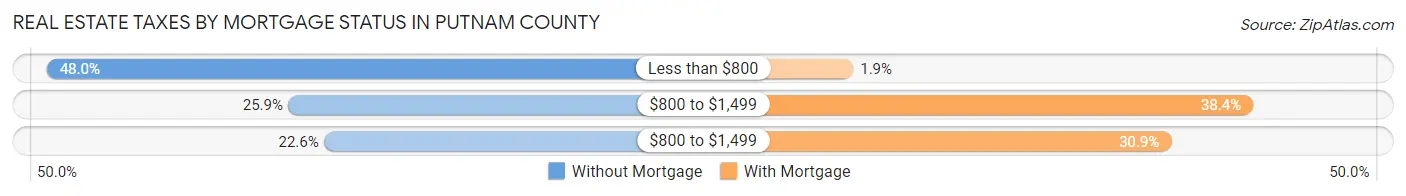
| Property Taxes | Without Mortgage | With Mortgage |
| Less than $800 | 1,706 (48.0%) | 123 (1.8%) |
| $800 to $1,499 | 920 (25.9%) | 2,552 (38.4%) |
| $800 to $1,499 | 804 (22.6%) | 2,055 (30.9%) |
| Total | 3,556 (100.0%) | 6,655 (100.0%) |
Health & Disability in Putnam County
Health Insurance Coverage by Age in Putnam County
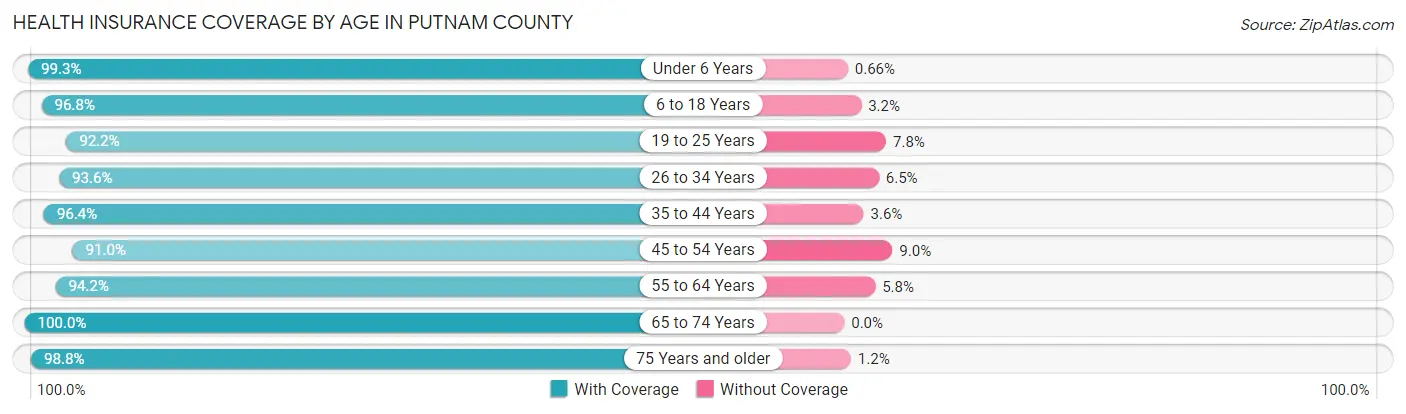
| Age Bracket | With Coverage | Without Coverage |
| Under 6 Years | 1,966 (99.3%) | 13 (0.7%) |
| 6 to 18 Years | 5,697 (96.8%) | 186 (3.2%) |
| 19 to 25 Years | 4,109 (92.2%) | 347 (7.8%) |
| 26 to 34 Years | 3,306 (93.5%) | 228 (6.5%) |
| 35 to 44 Years | 3,424 (96.4%) | 128 (3.6%) |
| 45 to 54 Years | 3,977 (91.0%) | 392 (9.0%) |
| 55 to 64 Years | 4,527 (94.2%) | 277 (5.8%) |
| 65 to 74 Years | 3,559 (100.0%) | 0 (0.0%) |
| 75 Years and older | 2,403 (98.8%) | 30 (1.2%) |
| Total | 32,968 (95.4%) | 1,601 (4.6%) |
Health Insurance Coverage by Citizenship Status in Putnam County
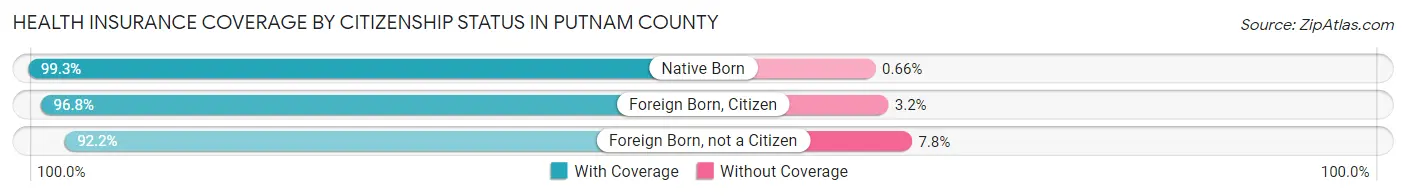
| Citizenship Status | With Coverage | Without Coverage |
| Native Born | 1,966 (99.3%) | 13 (0.7%) |
| Foreign Born, Citizen | 5,697 (96.8%) | 186 (3.2%) |
| Foreign Born, not a Citizen | 4,109 (92.2%) | 347 (7.8%) |
Health Insurance Coverage by Household Income in Putnam County

| Household Income | With Coverage | Without Coverage |
| Under $25,000 | 2,322 (93.4%) | 164 (6.6%) |
| $25,000 to $49,999 | 5,063 (91.1%) | 496 (8.9%) |
| $50,000 to $74,999 | 5,538 (94.8%) | 304 (5.2%) |
| $75,000 to $99,999 | 5,610 (97.5%) | 146 (2.5%) |
| $100,000 and over | 12,305 (97.1%) | 365 (2.9%) |
Public vs Private Health Insurance Coverage by Age in Putnam County
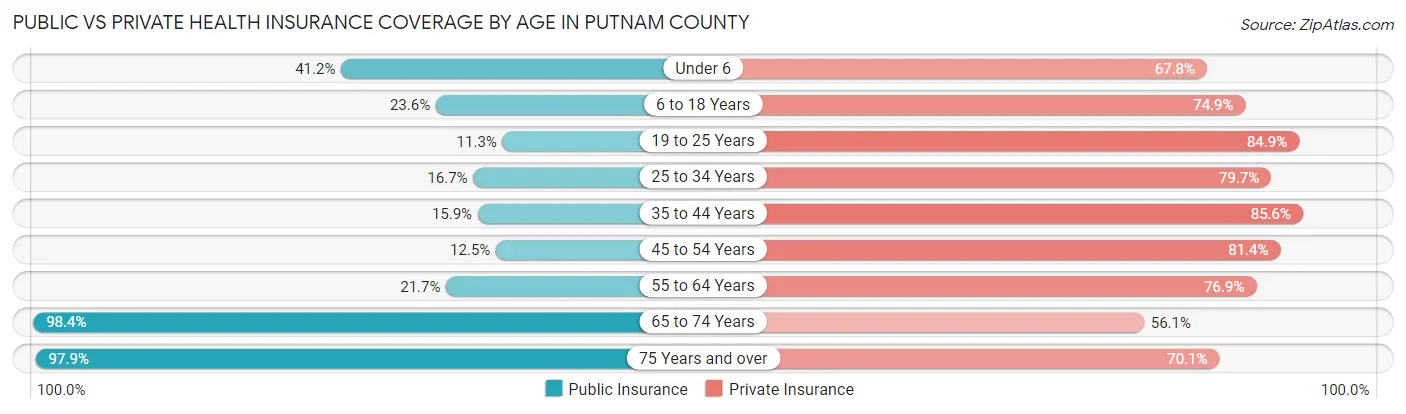
| Age Bracket | Public Insurance | Private Insurance |
| Under 6 | 816 (41.2%) | 1,341 (67.8%) |
| 6 to 18 Years | 1,391 (23.6%) | 4,406 (74.9%) |
| 19 to 25 Years | 502 (11.3%) | 3,781 (84.9%) |
| 25 to 34 Years | 590 (16.7%) | 2,816 (79.7%) |
| 35 to 44 Years | 563 (15.9%) | 3,039 (85.6%) |
| 45 to 54 Years | 545 (12.5%) | 3,556 (81.4%) |
| 55 to 64 Years | 1,044 (21.7%) | 3,695 (76.9%) |
| 65 to 74 Years | 3,502 (98.4%) | 1,995 (56.1%) |
| 75 Years and over | 2,383 (97.9%) | 1,705 (70.1%) |
| Total | 11,336 (32.8%) | 26,334 (76.2%) |
Disability Status by Sex by Age in Putnam County

| Age Bracket | Male | Female |
| Under 5 Years | 0 (0.0%) | 0 (0.0%) |
| 5 to 17 Years | 366 (12.4%) | 59 (2.3%) |
| 18 to 34 Years | 307 (7.2%) | 244 (5.6%) |
| 35 to 64 Years | 1,025 (16.1%) | 905 (14.2%) |
| 65 to 74 Years | 592 (33.8%) | 417 (23.1%) |
| 75 Years and over | 500 (48.9%) | 549 (38.9%) |
Disability Class by Sex by Age in Putnam County
Disability Class: Hearing Difficulty
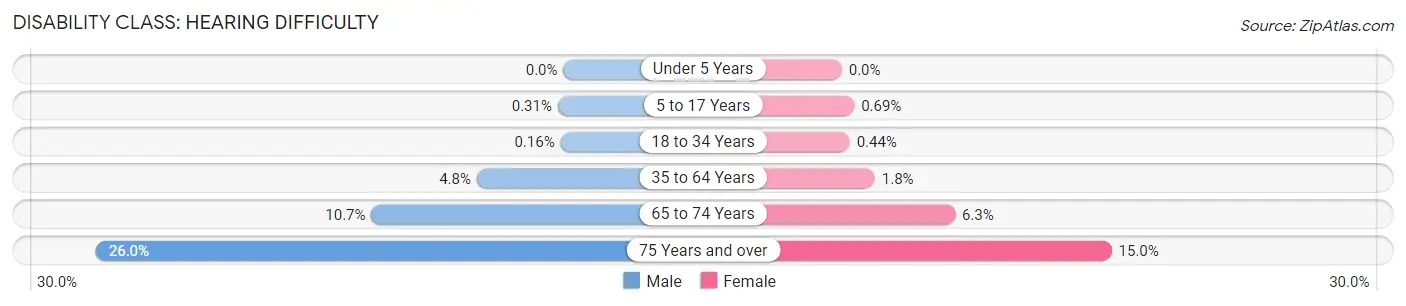
| Age Bracket | Male | Female |
| Under 5 Years | 0 (0.0%) | 0 (0.0%) |
| 5 to 17 Years | 9 (0.3%) | 18 (0.7%) |
| 18 to 34 Years | 7 (0.2%) | 19 (0.4%) |
| 35 to 64 Years | 307 (4.8%) | 117 (1.8%) |
| 65 to 74 Years | 187 (10.7%) | 114 (6.3%) |
| 75 Years and over | 266 (26.0%) | 212 (15.0%) |
Disability Class: Vision Difficulty

| Age Bracket | Male | Female |
| Under 5 Years | 0 (0.0%) | 0 (0.0%) |
| 5 to 17 Years | 13 (0.4%) | 0 (0.0%) |
| 18 to 34 Years | 44 (1.0%) | 3 (0.1%) |
| 35 to 64 Years | 325 (5.1%) | 85 (1.3%) |
| 65 to 74 Years | 49 (2.8%) | 71 (3.9%) |
| 75 Years and over | 59 (5.8%) | 91 (6.5%) |
Disability Class: Cognitive Difficulty

| Age Bracket | Male | Female |
| 5 to 17 Years | 366 (12.4%) | 41 (1.6%) |
| 18 to 34 Years | 234 (5.5%) | 124 (2.9%) |
| 35 to 64 Years | 219 (3.4%) | 465 (7.3%) |
| 65 to 74 Years | 112 (6.4%) | 161 (8.9%) |
| 75 Years and over | 99 (9.7%) | 189 (13.4%) |
Disability Class: Ambulatory Difficulty

| Age Bracket | Male | Female |
| 5 to 17 Years | 13 (0.4%) | 17 (0.6%) |
| 18 to 34 Years | 16 (0.4%) | 81 (1.9%) |
| 35 to 64 Years | 582 (9.1%) | 441 (6.9%) |
| 65 to 74 Years | 296 (16.9%) | 234 (12.9%) |
| 75 Years and over | 268 (26.2%) | 384 (27.2%) |
Disability Class: Self-Care Difficulty

| Age Bracket | Male | Female |
| 5 to 17 Years | 0 (0.0%) | 17 (0.6%) |
| 18 to 34 Years | 19 (0.4%) | 4 (0.1%) |
| 35 to 64 Years | 101 (1.6%) | 140 (2.2%) |
| 65 to 74 Years | 121 (6.9%) | 66 (3.6%) |
| 75 Years and over | 101 (9.9%) | 147 (10.4%) |
Technology Access in Putnam County
Computing Device Access in Putnam County
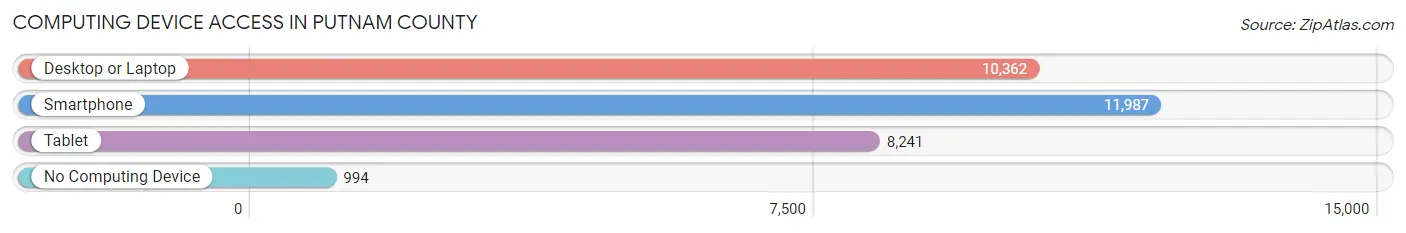
| Device Type | # Households | % Households |
| Desktop or Laptop | 10,362 | 75.0% |
| Smartphone | 11,987 | 86.8% |
| Tablet | 8,241 | 59.7% |
| No Computing Device | 994 | 7.2% |
| Total | 13,808 | 100.0% |
Internet Access in Putnam County

| Internet Type | # Households | % Households |
| Dial-Up Internet | 69 | 0.5% |
| Broadband Home | 9,222 | 66.8% |
| Cellular Data Only | 1,881 | 13.6% |
| Satellite Internet | 1,029 | 7.4% |
| No Internet | 2,022 | 14.6% |
| Total | 13,808 | 100.0% |
Putnam County Summary
Putnam County is located in the west-central part of the state of Indiana, in the United States. It is part of the Wabash Valley region and is bordered by Clay, Owen, Parke, Montgomery, Hendricks, and Morgan counties. The county seat is Greencastle, and the largest city is Cloverdale. The county was established in 1822 and named for Israel Putnam, a hero of the American Revolutionary War.
Geography
Putnam County is located in the west-central part of Indiana, in the United States. It is part of the Wabash Valley region and is bordered by Clay, Owen, Parke, Montgomery, Hendricks, and Morgan counties. The county has a total area of 437 square miles, of which 434 square miles is land and 3 square miles is water. The terrain is generally flat, with some rolling hills in the northern part of the county. The county is drained by the Big Walnut Creek, which flows through the center of the county.
The county is home to several state parks, including Shades State Park, Turkey Run State Park, and Raccoon State Recreation Area. The county also contains several lakes, including Lake Freeman, Lake Shafer, and Lake Lemon.
Demographics
As of the 2010 United States Census, there were 37,963 people, 14,845 households, and 10,541 families residing in the county. The population density was 87.3 inhabitants per square mile (33.7/km2). There were 16,541 housing units at an average density of 37.9 per square mile (14.6/km2). The racial makeup of the county was 97.3% white, 0.6% black or African American, 0.3% Asian, 0.2% American Indian, 0.3% from other races, and 1.3% from two or more races. Those of Hispanic or Latino origin made up 1.2% of the population. In terms of ancestry, 28.7% were German, 15.2% were American, 13.7% were Irish, and 11.2% were English.
Of the 14,845 households, 33.2% had children under the age of 18 living with them, 56.2% were married couples living together, 9.7% had a female householder with no husband present, 29.7% were non-families, and 24.7% of all households were made up of individuals. The average household size was 2.53 and the average family size was 3.01. The median age was 39.2 years.
Economy
The economy of Putnam County is largely based on agriculture and manufacturing. The county is home to several large agricultural operations, including hog farms, dairy farms, and grain farms. The county is also home to several manufacturing companies, including a steel mill, a paper mill, and a plastics factory.
The county is also home to several educational institutions, including DePauw University, Ivy Tech Community College, and the Putnam County Public Library. The county is also home to several tourist attractions, including the Putnam County Museum, the Putnam County Fairgrounds, and the Putnam County Park.
In terms of employment, the largest sectors in the county are manufacturing (20.2%), educational services (14.2%), health care and social assistance (13.2%), retail trade (11.2%), and accommodation and food services (9.2%). The median household income in the county is $50,945, and the median family income is $62,917. The per capita income in the county is $25,845.
Conclusion
Putnam County is a rural county located in the west-central part of Indiana. It is part of the Wabash Valley region and is bordered by Clay, Owen, Parke, Montgomery, Hendricks, and Morgan counties. The county has a total area of 437 square miles, of which 434 square miles is land and 3 square miles is water. The county is home to several state parks, lakes, and tourist attractions. The population of the county is 37,963, and the median household income is $50,945. The economy of the county is largely based on agriculture and manufacturing, and the largest sectors in the county are manufacturing, educational services, health care and social assistance, retail trade, and accommodation and food services.
Common Questions
What is the Total Population of Putnam County?
Total Population of Putnam County is 36,942.
What is the Total Male Population of Putnam County?
Total Male Population of Putnam County is 19,430.
What is the Total Female Population of Putnam County?
Total Female Population of Putnam County is 17,512.
What is the Ratio of Males per 100 Females in Putnam County?
There are 110.95 Males per 100 Females in Putnam County.
What is the Ratio of Females per 100 Males in Putnam County?
There are 90.13 Females per 100 Males in Putnam County.
What is the Median Population Age in Putnam County?
Median Population Age in Putnam County is 38.4 Years.
What is the Average Family Size in Putnam County
Average Family Size in Putnam County is 2.8 People.
What is the Average Household Size in Putnam County
Average Household Size in Putnam County is 2.3 People.
What is Per Capita Income in Putnam County?
Per Capita income in Putnam County is $31,015.
What is the Median Family Income in Putnam County?
Median Family Income in Putnam County is $84,209.
What is the Median Household income in Putnam County?
Median Household Income in Putnam County is $70,609.
What is Income or Wage Gap in Putnam County?
Income or Wage Gap in Putnam County is 41.8%.
Women in Putnam County earn 58.2 cents for every dollar earned by a man.
What is Family Income Deficit in Putnam County?
Family Income Deficit in Putnam County is $9,454.
Families that are below poverty line in Putnam County earn $9,454 less on average than the poverty threshold level.
What is Inequality or Gini Index in Putnam County?
Inequality or Gini Index in Putnam County is 0.38.
How Large is the Labor Force in Putnam County?
There are 17,237 People in the Labor Forcein in Putnam County.
What is the Percentage of People in the Labor Force in Putnam County?
56.2% of People are in the Labor Force in Putnam County.
What is the Unemployment Rate in Putnam County?
Unemployment Rate in Putnam County is 2.8%.