Pulaski County, IN
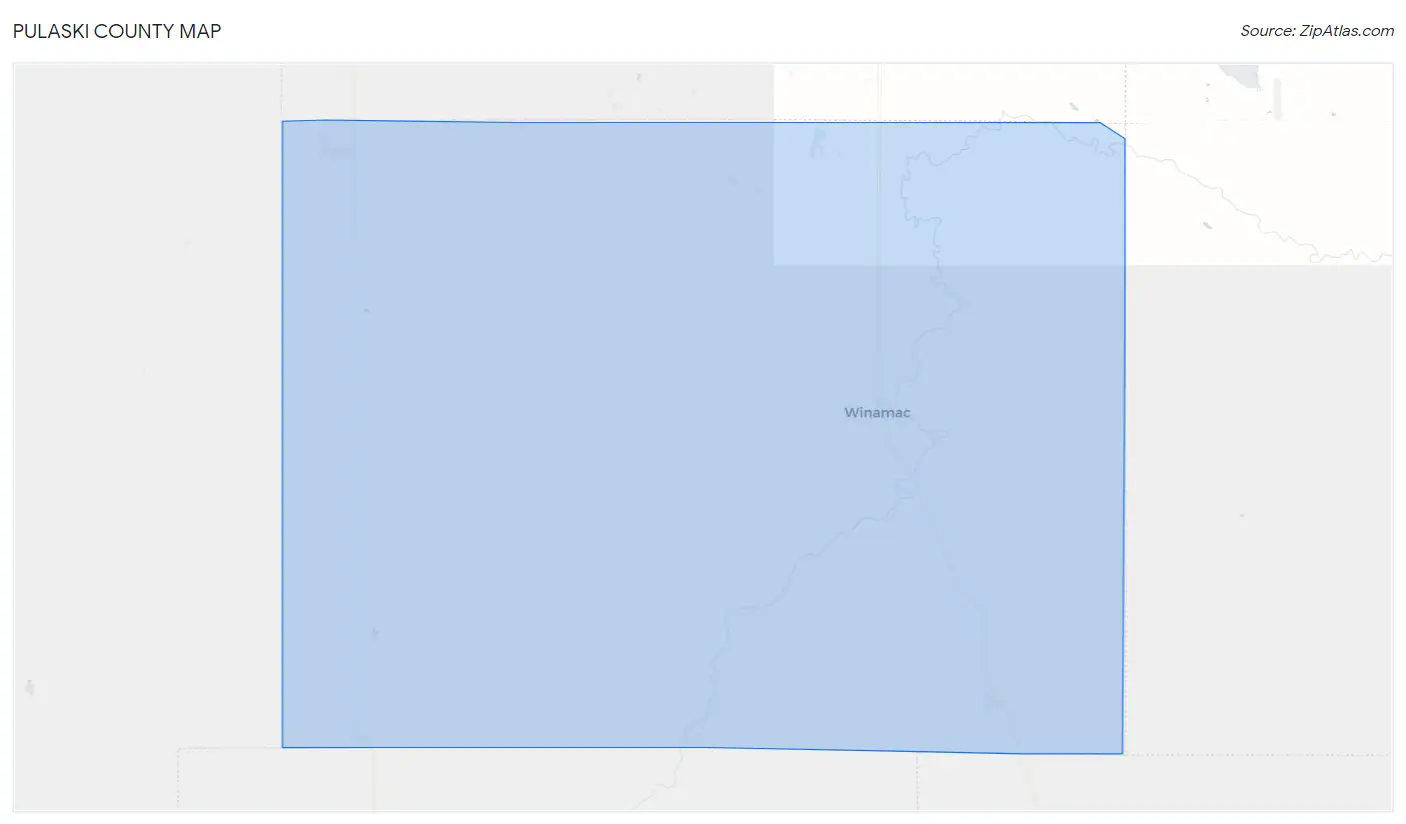
Pulaski County Map
Pulaski County Overview
12,498
TOTAL POPULATION
6,255
MALE POPULATION
6,243
FEMALE POPULATION
100.19
MALES / 100 FEMALES
99.81
FEMALES / 100 MALES
41.9
MEDIAN AGE
3.2
AVG FAMILY SIZE
2.6
AVG HOUSEHOLD SIZE
$30,068
PER CAPITA INCOME
$73,444
AVG FAMILY INCOME
$56,823
AVG HOUSEHOLD INCOME
35.9%
WAGE / INCOME GAP [ % ]
64.1¢/ $1
WAGE / INCOME GAP [ $ ]
$11,117
FAMILY INCOME DEFICIT
0.43
INEQUALITY / GINI INDEX
6,227
LABOR FORCE [ PEOPLE ]
61.9%
PERCENT IN LABOR FORCE
3.8%
UNEMPLOYMENT RATE
Race in Pulaski County
The most populous races in Pulaski County are White / Caucasian (11,634 | 93.1%), Two or more Races (488 | 3.9%), and Hispanic or Latino (422 | 3.4%).

| Race | # Population | % Population |
| Asian | 32 | 0.3% |
| Black / African American | 24 | 0.2% |
| Hawaiian / Pacific | 35 | 0.3% |
| Hispanic or Latino | 422 | 3.4% |
| Native / Alaskan | 10 | 0.1% |
| White / Caucasian | 11,634 | 93.1% |
| Two or more Races | 488 | 3.9% |
| Some other Race | 275 | 2.2% |
| Total | 12,498 | 100.0% |
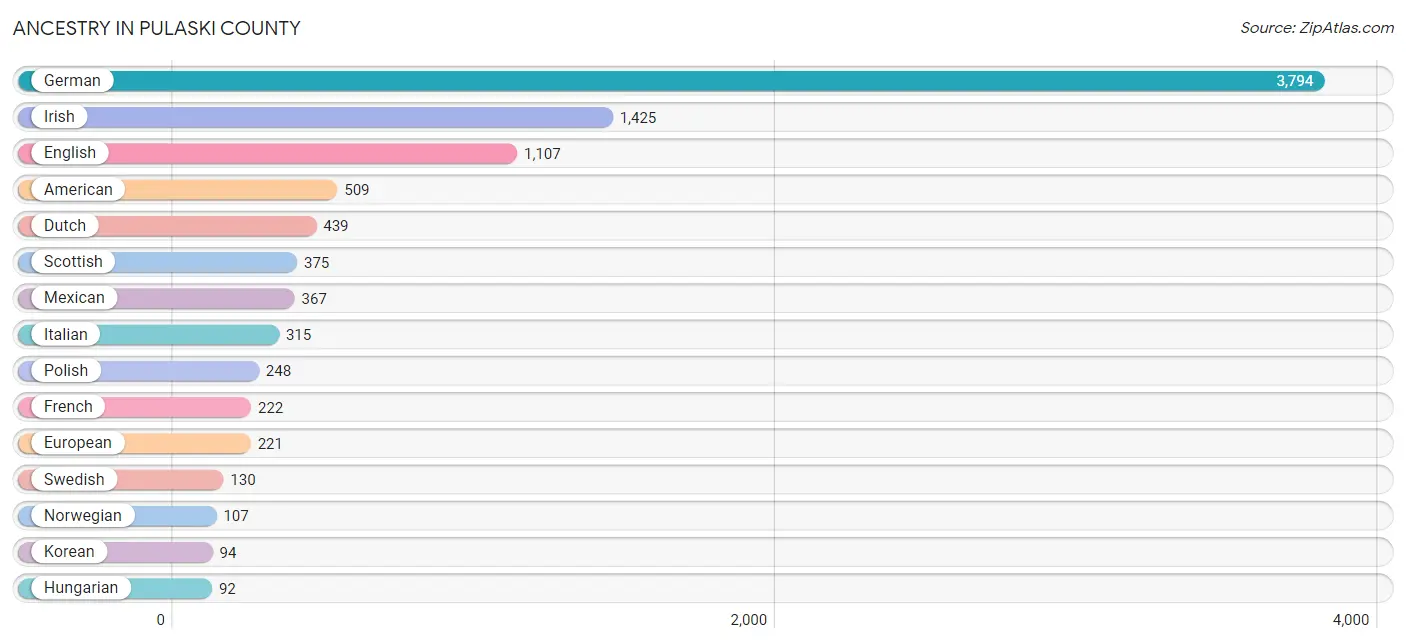
Ancestry in Pulaski County
The most populous ancestries reported in Pulaski County are German (3,794 | 30.4%), Irish (1,425 | 11.4%), English (1,107 | 8.9%), American (509 | 4.1%), and Dutch (439 | 3.5%), together accounting for 58.2% of all Pulaski County residents.
| Ancestry | # Population | % Population |
| African | 6 | 0.1% |
| American | 509 | 4.1% |
| Apache | 12 | 0.1% |
| Austrian | 10 | 0.1% |
| Belgian | 26 | 0.2% |
| British | 72 | 0.6% |
| Cajun | 6 | 0.1% |
| Canadian | 38 | 0.3% |
| Central American | 5 | 0.0% |
| Cherokee | 10 | 0.1% |
| Chippewa | 5 | 0.0% |
| Czech | 24 | 0.2% |
| Dutch | 439 | 3.5% |
| Eastern European | 15 | 0.1% |
| English | 1,107 | 8.9% |
| European | 221 | 1.8% |
| Fijian | 35 | 0.3% |
| French | 222 | 1.8% |
| French American Indian | 6 | 0.1% |
| French Canadian | 5 | 0.0% |
| German | 3,794 | 30.4% |
| German Russian | 18 | 0.1% |
| Greek | 18 | 0.1% |
| Guatemalan | 4 | 0.0% |
| Hungarian | 92 | 0.7% |
| Irish | 1,425 | 11.4% |
| Italian | 315 | 2.5% |
| Korean | 94 | 0.7% |
| Lithuanian | 60 | 0.5% |
| Mexican | 367 | 2.9% |
| Mexican American Indian | 10 | 0.1% |
| Northern European | 30 | 0.2% |
| Norwegian | 107 | 0.9% |
| Polish | 248 | 2.0% |
| Portuguese | 24 | 0.2% |
| Puerto Rican | 50 | 0.4% |
| Russian | 5 | 0.0% |
| Salvadoran | 1 | 0.0% |
| Scandinavian | 20 | 0.2% |
| Scotch-Irish | 67 | 0.5% |
| Scottish | 375 | 3.0% |
| Serbian | 15 | 0.1% |
| Slavic | 12 | 0.1% |
| Slovak | 5 | 0.0% |
| Subsaharan African | 6 | 0.1% |
| Swedish | 130 | 1.0% |
| Swiss | 54 | 0.4% |
| Ukrainian | 7 | 0.1% |
| Welsh | 22 | 0.2% | View All 49 Rows |
Immigrants in Pulaski County
The most numerous immigrant groups reported in Pulaski County came from Central America (132 | 1.1%), Latin America (132 | 1.1%), Mexico (128 | 1.0%), Europe (48 | 0.4%), and Canada (36 | 0.3%), together accounting for 3.8% of all Pulaski County residents.

| Immigration Origin | # Population | % Population |
| Asia | 32 | 0.3% |
| Canada | 36 | 0.3% |
| Central America | 132 | 1.1% |
| China | 15 | 0.1% |
| Eastern Asia | 15 | 0.1% |
| Eastern Europe | 13 | 0.1% |
| England | 4 | 0.0% |
| Europe | 48 | 0.4% |
| Germany | 16 | 0.1% |
| Greece | 6 | 0.1% |
| Guatemala | 4 | 0.0% |
| Latin America | 132 | 1.1% |
| Mexico | 128 | 1.0% |
| Northern Europe | 13 | 0.1% |
| Norway | 9 | 0.1% |
| Oceania | 35 | 0.3% |
| Philippines | 17 | 0.1% |
| Romania | 5 | 0.0% |
| Russia | 8 | 0.1% |
| South Eastern Asia | 17 | 0.1% |
| Southern Europe | 6 | 0.1% |
| Western Europe | 16 | 0.1% | View All 22 Rows |
Sex and Age in Pulaski County
Sex and Age in Pulaski County
The most populous age groups in Pulaski County are 60 to 64 Years (512 | 8.2%) for men and 15 to 19 Years (540 | 8.6%) for women.

| Age Bracket | Male | Female |
| Under 5 Years | 313 (5.0%) | 339 (5.4%) |
| 5 to 9 Years | 391 (6.2%) | 279 (4.5%) |
| 10 to 14 Years | 452 (7.2%) | 416 (6.7%) |
| 15 to 19 Years | 375 (6.0%) | 540 (8.6%) |
| 20 to 24 Years | 411 (6.6%) | 286 (4.6%) |
| 25 to 29 Years | 379 (6.1%) | 385 (6.2%) |
| 30 to 34 Years | 342 (5.5%) | 321 (5.1%) |
| 35 to 39 Years | 457 (7.3%) | 374 (6.0%) |
| 40 to 44 Years | 253 (4.0%) | 289 (4.6%) |
| 45 to 49 Years | 368 (5.9%) | 347 (5.6%) |
| 50 to 54 Years | 367 (5.9%) | 408 (6.5%) |
| 55 to 59 Years | 409 (6.5%) | 523 (8.4%) |
| 60 to 64 Years | 512 (8.2%) | 375 (6.0%) |
| 65 to 69 Years | 317 (5.1%) | 466 (7.5%) |
| 70 to 74 Years | 427 (6.8%) | 258 (4.1%) |
| 75 to 79 Years | 286 (4.6%) | 340 (5.4%) |
| 80 to 84 Years | 84 (1.3%) | 174 (2.8%) |
| 85 Years and over | 112 (1.8%) | 123 (2.0%) |
| Total | 6,255 (100.0%) | 6,243 (100.0%) |
Families and Households in Pulaski County
Median Family Size in Pulaski County
The median family size in Pulaski County is 3.24 persons per family, with single female/mother families (481 | 15.8%) accounting for the largest median family size of 3.49 persons per family. On the other hand, single male/father families (293 | 9.6%) represent the smallest median family size with 3.13 persons per family.

| Family Type | # Families | Family Size |
| Married-Couple | 2,273 (74.6%) | 3.20 |
| Single Male/Father | 293 (9.6%) | 3.13 |
| Single Female/Mother | 481 (15.8%) | 3.49 |
| Total Families | 3,047 (100.0%) | 3.24 |
Median Household Size in Pulaski County
The median household size in Pulaski County is 2.57 persons per household, with single female/mother households (481 | 10.0%) accounting for the largest median household size of 3.74 persons per household. non-family households (1,748 | 36.4%) represent the smallest median household size with 1.20 persons per household.

| Household Type | # Households | Household Size |
| Married-Couple | 2,273 (47.4%) | 3.26 |
| Single Male/Father | 293 (6.1%) | 3.48 |
| Single Female/Mother | 481 (10.0%) | 3.74 |
| Non-family | 1,748 (36.4%) | 1.20 |
| Total Households | 4,795 (100.0%) | 2.57 |
Household Size by Marriage Status in Pulaski County
Out of a total of 4,795 households in Pulaski County, 3,047 (63.5%) are family households, while 1,748 (36.4%) are nonfamily households. The most numerous type of family households are 2-person households, comprising 1,476, and the most common type of nonfamily households are 1-person households, comprising 1,553.

| Household Size | Family Households | Nonfamily Households |
| 1-Person Households | - | 1,553 (32.4%) |
| 2-Person Households | 1,476 (30.8%) | 177 (3.7%) |
| 3-Person Households | 850 (17.7%) | 7 (0.2%) |
| 4-Person Households | 365 (7.6%) | 0 (0.0%) |
| 5-Person Households | 184 (3.8%) | 11 (0.2%) |
| 6-Person Households | 121 (2.5%) | 0 (0.0%) |
| 7+ Person Households | 51 (1.1%) | 0 (0.0%) |
| Total | 3,047 (63.5%) | 1,748 (36.4%) |
Female Fertility in Pulaski County
Fertility by Age in Pulaski County
Average fertility rate in Pulaski County is 41.0 births per 1,000 women. Women in the age bracket of 20 to 34 years have the highest fertility rate with 110.0 births per 1,000 women. Women in the age bracket of 20 to 34 years acount for 100.0% of all women with births.

| Age Bracket | Women with Births | Births / 1,000 Women |
| 15 to 19 years | 0 (0.0%) | 0.0 |
| 20 to 34 years | 109 (100.0%) | 110.0 |
| 35 to 50 years | 0 (0.0%) | 0.0 |
| Total | 109 (100.0%) | 41.0 |
Fertility by Age by Marriage Status in Pulaski County
80.7% of women with births (109) in Pulaski County are married. The highest percentage of unmarried women with births falls into 20 to 34 years age bracket with 19.3% of them unmarried at the time of birth, while the lowest percentage of unmarried women with births belong to 20 to 34 years age bracket with 19.3% of them unmarried.

| Age Bracket | Married | Unmarried |
| 15 to 19 years | 0 (0.0%) | 0 (0.0%) |
| 20 to 34 years | 88 (80.7%) | 21 (19.3%) |
| 35 to 50 years | 0 (0.0%) | 0 (0.0%) |
| Total | 88 (80.7%) | 21 (19.3%) |
Fertility by Education in Pulaski County
Average fertility rate in Pulaski County is 41.0 births per 1,000 women. Women with the education attainment of high school diploma have the highest fertility rate of 79.0 births per 1,000 women, while women with the education attainment of less than high school have the lowest fertility at 6.0 births per 1,000 women. Women with the education attainment of high school diploma represent 52.3% of all women with births.
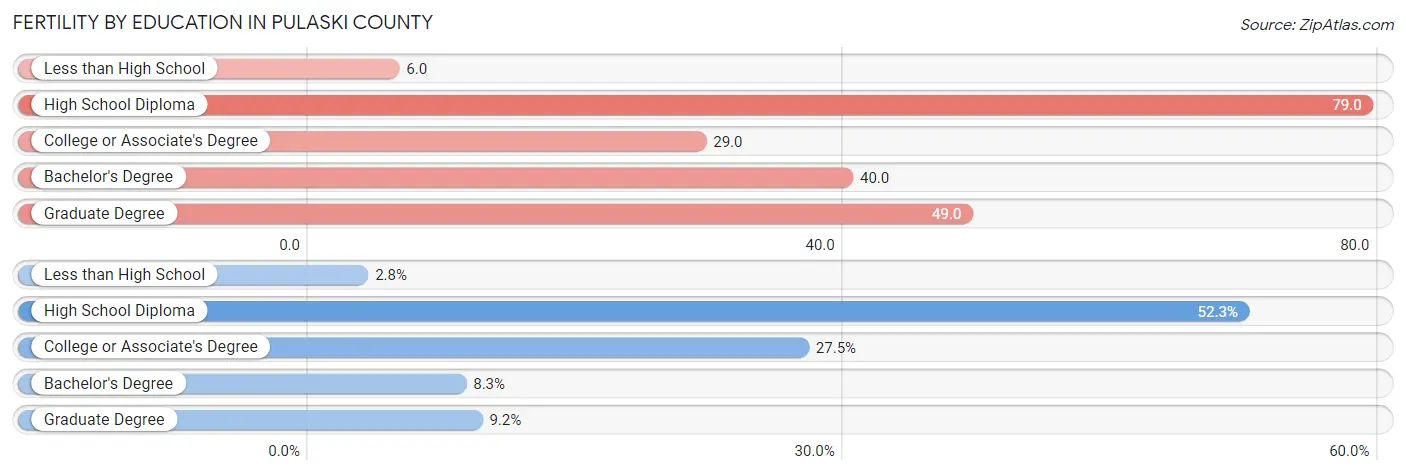
| Educational Attainment | Women with Births | Births / 1,000 Women |
| Less than High School | 3 (2.8%) | 6.0 |
| High School Diploma | 57 (52.3%) | 79.0 |
| College or Associate's Degree | 30 (27.5%) | 29.0 |
| Bachelor's Degree | 9 (8.3%) | 40.0 |
| Graduate Degree | 10 (9.2%) | 49.0 |
| Total | 109 (100.0%) | 41.0 |
Fertility by Education by Marriage Status in Pulaski County
19.3% of women with births in Pulaski County are unmarried. Women with the educational attainment of less than high school are most likely to be married with 100.0% of them married at childbirth, while women with the educational attainment of high school diploma are least likely to be married with 36.8% of them unmarried at childbirth.

| Educational Attainment | Married | Unmarried |
| Less than High School | 3 (100.0%) | 0 (0.0%) |
| High School Diploma | 36 (63.2%) | 21 (36.8%) |
| College or Associate's Degree | 30 (100.0%) | 0 (0.0%) |
| Bachelor's Degree | 9 (100.0%) | 0 (0.0%) |
| Graduate Degree | 10 (100.0%) | 0 (0.0%) |
| Total | 88 (80.7%) | 21 (19.3%) |
Income in Pulaski County
Income Overview in Pulaski County
Per Capita Income in Pulaski County is $30,068, while median incomes of families and households are $73,444 and $56,823 respectively.
| Characteristic | Number | Measure |
| Per Capita Income | 12,498 | $30,068 |
| Median Family Income | 3,047 | $73,444 |
| Mean Family Income | 3,047 | $89,988 |
| Median Household Income | 4,795 | $56,823 |
| Mean Household Income | 4,795 | $73,330 |
| Income Deficit | 3,047 | $11,117 |
| Wage / Income Gap (%) | 12,498 | 35.90% |
| Wage / Income Gap ($) | 12,498 | 64.10¢ per $1 |
| Gini / Inequality Index | 12,498 | 0.43 |
Earnings by Sex in Pulaski County
Average Earnings in Pulaski County are $33,720, $41,503 for men and $26,604 for women, a difference of 35.9%.

| Sex | Number | Average Earnings |
| Male | 3,635 (54.5%) | $41,503 |
| Female | 3,038 (45.5%) | $26,604 |
| Total | 6,673 (100.0%) | $33,720 |
Earnings by Sex by Income Bracket in Pulaski County
The most common earnings brackets in Pulaski County are $75,000 to $99,999 for men (365 | 10.0%) and $30,000 to $34,999 for women (330 | 10.9%).
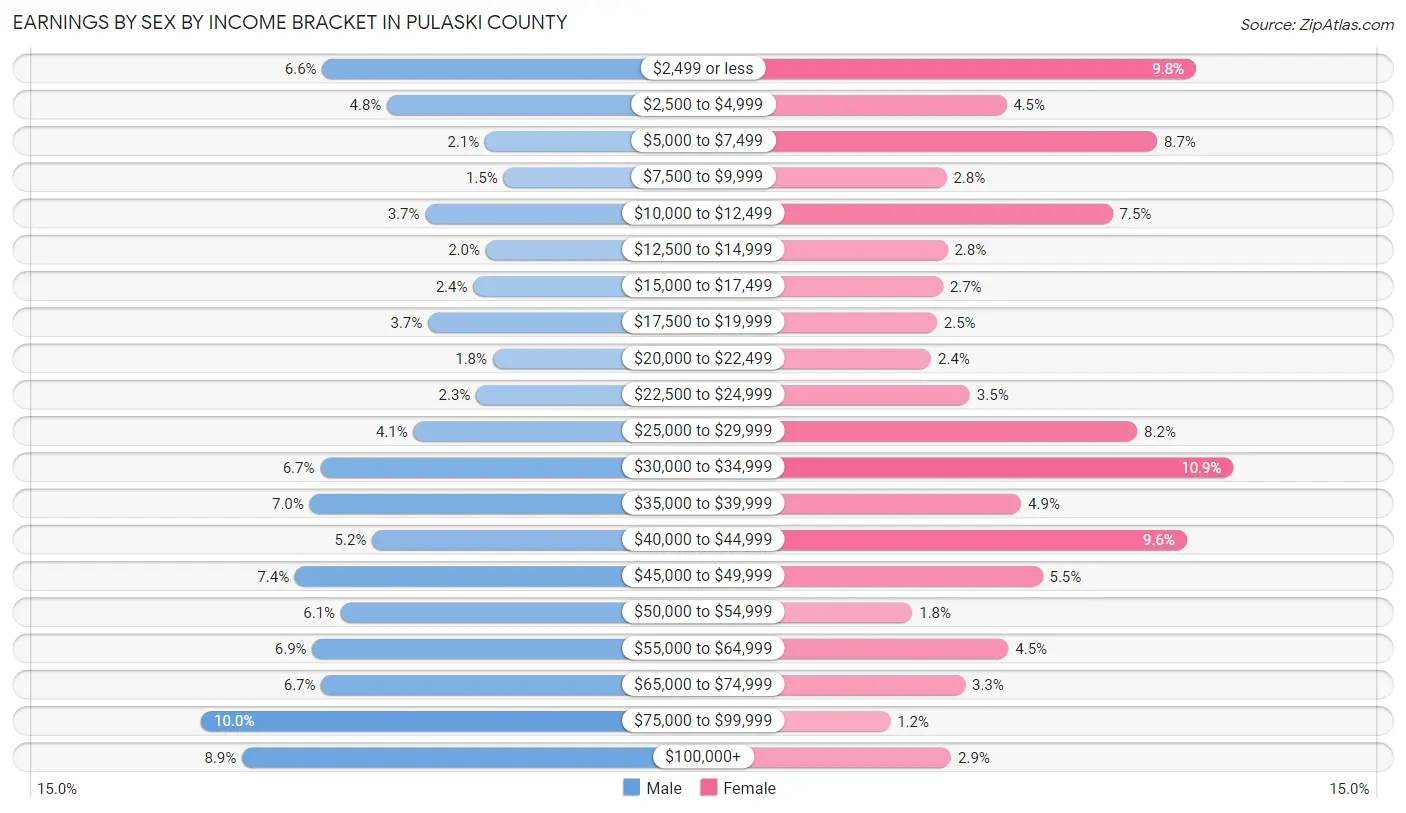
| Income | Male | Female |
| $2,499 or less | 241 (6.6%) | 298 (9.8%) |
| $2,500 to $4,999 | 175 (4.8%) | 136 (4.5%) |
| $5,000 to $7,499 | 75 (2.1%) | 265 (8.7%) |
| $7,500 to $9,999 | 56 (1.5%) | 85 (2.8%) |
| $10,000 to $12,499 | 136 (3.7%) | 227 (7.5%) |
| $12,500 to $14,999 | 74 (2.0%) | 86 (2.8%) |
| $15,000 to $17,499 | 87 (2.4%) | 82 (2.7%) |
| $17,500 to $19,999 | 133 (3.7%) | 77 (2.5%) |
| $20,000 to $22,499 | 67 (1.8%) | 72 (2.4%) |
| $22,500 to $24,999 | 84 (2.3%) | 105 (3.5%) |
| $25,000 to $29,999 | 148 (4.1%) | 248 (8.2%) |
| $30,000 to $34,999 | 243 (6.7%) | 330 (10.9%) |
| $35,000 to $39,999 | 254 (7.0%) | 149 (4.9%) |
| $40,000 to $44,999 | 190 (5.2%) | 290 (9.6%) |
| $45,000 to $49,999 | 269 (7.4%) | 167 (5.5%) |
| $50,000 to $54,999 | 222 (6.1%) | 56 (1.8%) |
| $55,000 to $64,999 | 251 (6.9%) | 138 (4.5%) |
| $65,000 to $74,999 | 242 (6.7%) | 101 (3.3%) |
| $75,000 to $99,999 | 365 (10.0%) | 37 (1.2%) |
| $100,000+ | 323 (8.9%) | 89 (2.9%) |
| Total | 3,635 (100.0%) | 3,038 (100.0%) |
Earnings by Sex by Educational Attainment in Pulaski County
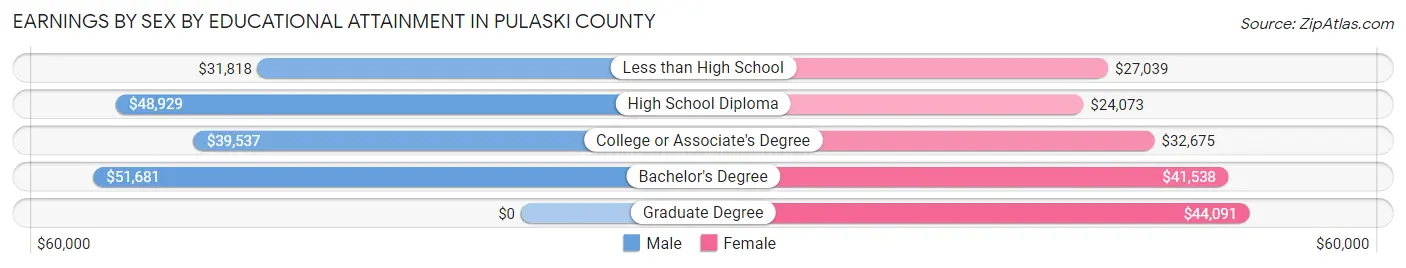
Average earnings in Pulaski County are $46,173 for men and $32,543 for women, a difference of 29.5%. Men with an educational attainment of bachelor's degree enjoy the highest average annual earnings of $51,681, while those with less than high school education earn the least with $31,818. Women with an educational attainment of graduate degree earn the most with the average annual earnings of $44,091, while those with high school diploma education have the smallest earnings of $24,073.
| Educational Attainment | Male Income | Female Income |
| Less than High School | $31,818 | $27,039 |
| High School Diploma | $48,929 | $24,073 |
| College or Associate's Degree | $39,537 | $32,675 |
| Bachelor's Degree | $51,681 | $41,538 |
| Graduate Degree | - | - |
| Total | $46,173 | $32,543 |
Family Income in Pulaski County
Family Income Brackets in Pulaski County
According to the Pulaski County family income data, there are 765 families falling into the $50,000 to $74,999 income range, which is the most common income bracket and makes up 25.1% of all families. Conversely, the $10,000 to $14,999 income bracket is the least frequent group with only 52 families (1.7%) belonging to this category.

| Income Bracket | # Families | % Families |
| Less than $10,000 | 94 | 3.1% |
| $10,000 to $14,999 | 52 | 1.7% |
| $15,000 to $24,999 | 119 | 3.9% |
| $25,000 to $34,999 | 149 | 4.9% |
| $35,000 to $49,999 | 375 | 12.3% |
| $50,000 to $74,999 | 765 | 25.1% |
| $75,000 to $99,999 | 503 | 16.5% |
| $100,000 to $149,999 | 512 | 16.8% |
| $150,000 to $199,999 | 244 | 8.0% |
| $200,000+ | 232 | 7.6% |
Family Income by Famaliy Size in Pulaski County
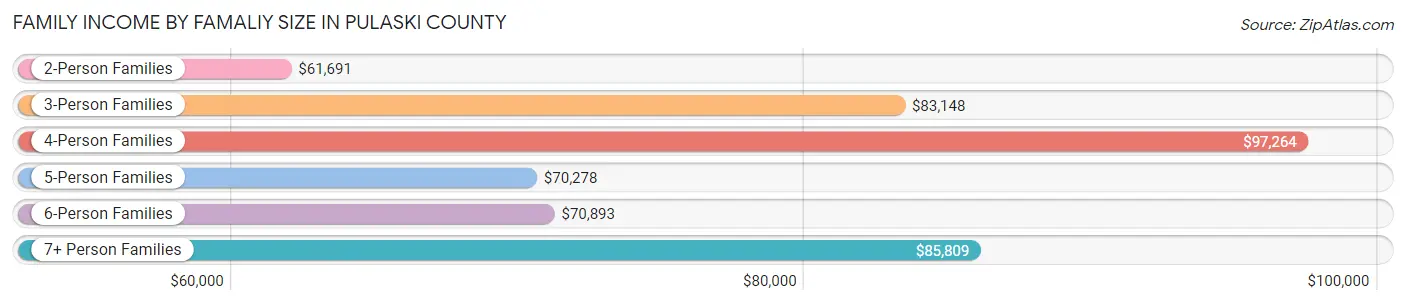
4-person families (341 | 11.2%) account for the highest median family income in Pulaski County with $97,264 per family, while 2-person families (1,581 | 51.9%) have the highest median income of $30,846 per family member.
| Income Bracket | # Families | Median Income |
| 2-Person Families | 1,581 (51.9%) | $61,691 |
| 3-Person Families | 784 (25.7%) | $83,148 |
| 4-Person Families | 341 (11.2%) | $97,264 |
| 5-Person Families | 230 (7.5%) | $70,278 |
| 6-Person Families | 60 (2.0%) | $70,893 |
| 7+ Person Families | 51 (1.7%) | $85,809 |
| Total | 3,047 (100.0%) | $73,444 |
Family Income by Number of Earners in Pulaski County
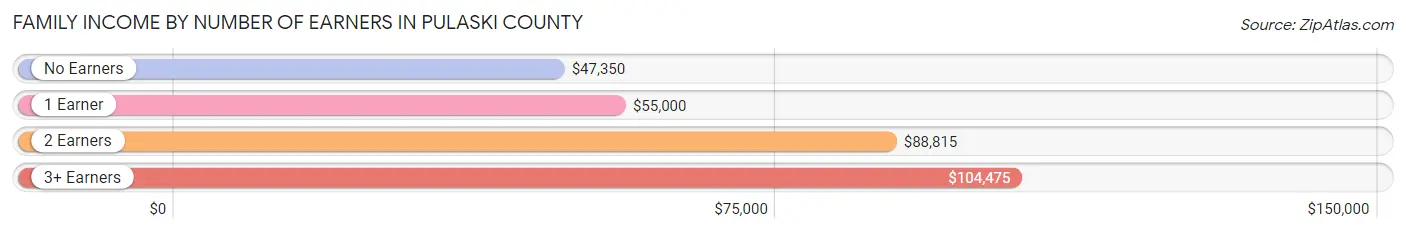
The median family income in Pulaski County is $73,444, with families comprising 3+ earners (339) having the highest median family income of $104,475, while families with no earners (439) have the lowest median family income of $47,350, accounting for 11.1% and 14.4% of families, respectively.
| Number of Earners | # Families | Median Income |
| No Earners | 439 (14.4%) | $47,350 |
| 1 Earner | 948 (31.1%) | $55,000 |
| 2 Earners | 1,321 (43.3%) | $88,815 |
| 3+ Earners | 339 (11.1%) | $104,475 |
| Total | 3,047 (100.0%) | $73,444 |
Household Income in Pulaski County
Household Income Brackets in Pulaski County
With 1,021 households falling in the category, the $50,000 to $74,999 income range is the most frequent in Pulaski County, accounting for 21.3% of all households. In contrast, only 235 households (4.9%) fall into the less than $10,000 income bracket, making it the least populous group.

| Income Bracket | # Households | % Households |
| Less than $10,000 | 235 | 4.9% |
| $10,000 to $14,999 | 269 | 5.6% |
| $15,000 to $24,999 | 350 | 7.3% |
| $25,000 to $34,999 | 503 | 10.5% |
| $35,000 to $49,999 | 657 | 13.7% |
| $50,000 to $74,999 | 1,021 | 21.3% |
| $75,000 to $99,999 | 667 | 13.9% |
| $100,000 to $149,999 | 614 | 12.8% |
| $150,000 to $199,999 | 245 | 5.1% |
| $200,000+ | 240 | 5.0% |
Household Income by Householder Age in Pulaski County
The median household income in Pulaski County is $56,823, with the highest median household income of $65,245 found in the 25 to 44 years age bracket for the primary householder. A total of 1,193 households (24.9%) fall into this category. Meanwhile, the 65+ years age bracket for the primary householder has the lowest median household income of $43,665, with 1,639 households (34.2%) in this group.

| Income Bracket | # Households | Median Income |
| 15 to 24 Years | 42 (0.9%) | $48,750 |
| 25 to 44 Years | 1,193 (24.9%) | $65,245 |
| 45 to 64 Years | 1,921 (40.1%) | $58,194 |
| 65+ Years | 1,639 (34.2%) | $43,665 |
| Total | 4,795 (100.0%) | $56,823 |
Poverty in Pulaski County
Income Below Poverty by Sex and Age in Pulaski County
With 10.1% poverty level for males and 15.3% for females among the residents of Pulaski County, under 5 year old males and 18 to 24 year old females are the most vulnerable to poverty, with 135 males (43.1%) and 187 females (33.2%) in their respective age groups living below the poverty level.

| Age Bracket | Male | Female |
| Under 5 Years | 135 (43.1%) | 45 (13.5%) |
| 5 Years | 0 (0.0%) | 6 (8.2%) |
| 6 to 11 Years | 74 (14.7%) | 22 (7.1%) |
| 12 to 14 Years | 24 (9.2%) | 32 (10.6%) |
| 15 Years | 12 (7.4%) | 19 (22.4%) |
| 16 and 17 Years | 2 (2.4%) | 19 (10.7%) |
| 18 to 24 Years | 31 (5.7%) | 187 (33.2%) |
| 25 to 34 Years | 60 (8.7%) | 73 (10.3%) |
| 35 to 44 Years | 77 (11.0%) | 128 (19.3%) |
| 45 to 54 Years | 42 (5.8%) | 119 (15.8%) |
| 55 to 64 Years | 104 (11.4%) | 102 (11.4%) |
| 65 to 74 Years | 21 (2.9%) | 73 (10.1%) |
| 75 Years and over | 36 (7.7%) | 123 (20.9%) |
| Total | 618 (10.1%) | 948 (15.3%) |
Income Above Poverty by Sex and Age in Pulaski County
According to the poverty statistics in Pulaski County, males aged 5 years and females aged 6 to 11 years are the age groups that are most secure financially, with 100.0% of males and 92.9% of females in these age groups living above the poverty line.

| Age Bracket | Male | Female |
| Under 5 Years | 178 (56.9%) | 288 (86.5%) |
| 5 Years | 8 (100.0%) | 67 (91.8%) |
| 6 to 11 Years | 430 (85.3%) | 287 (92.9%) |
| 12 to 14 Years | 236 (90.8%) | 269 (89.4%) |
| 15 Years | 151 (92.6%) | 66 (77.6%) |
| 16 and 17 Years | 80 (97.6%) | 158 (89.3%) |
| 18 to 24 Years | 510 (94.3%) | 377 (66.8%) |
| 25 to 34 Years | 629 (91.3%) | 633 (89.7%) |
| 35 to 44 Years | 621 (89.0%) | 535 (80.7%) |
| 45 to 54 Years | 681 (94.2%) | 636 (84.2%) |
| 55 to 64 Years | 811 (88.6%) | 796 (88.6%) |
| 65 to 74 Years | 712 (97.1%) | 650 (89.9%) |
| 75 Years and over | 433 (92.3%) | 465 (79.1%) |
| Total | 5,480 (89.9%) | 5,227 (84.7%) |
Income Below Poverty Among Married-Couple Families in Pulaski County
The poverty statistics for married-couple families in Pulaski County show that 5.3% or 121 of the total 2,273 families live below the poverty line. Families with 5 or more children have the highest poverty rate of 31.4%, comprising of 16 families. On the other hand, families with 3 or 4 children have the lowest poverty rate of 2.0%, which includes 3 families.

| Children | Above Poverty | Below Poverty |
| No Children | 1,405 (95.8%) | 61 (4.2%) |
| 1 or 2 Children | 568 (93.3%) | 41 (6.7%) |
| 3 or 4 Children | 144 (98.0%) | 3 (2.0%) |
| 5 or more Children | 35 (68.6%) | 16 (31.4%) |
| Total | 2,152 (94.7%) | 121 (5.3%) |
Income Below Poverty Among Single-Parent Households in Pulaski County
According to the poverty data in Pulaski County, 13.7% or 40 single-father households and 13.5% or 65 single-mother households are living below the poverty line. Among single-father households, those with 1 or 2 children have the highest poverty rate, with 40 households (36.0%) experiencing poverty. Likewise, among single-mother households, those with 1 or 2 children have the highest poverty rate, with 43 households (21.8%) falling below the poverty line.

| Children | Single Father | Single Mother |
| No Children | 0 (0.0%) | 19 (8.6%) |
| 1 or 2 Children | 40 (36.0%) | 43 (21.8%) |
| 3 or 4 Children | 0 (0.0%) | 3 (4.7%) |
| 5 or more Children | 0 (0.0%) | 0 (0.0%) |
| Total | 40 (13.7%) | 65 (13.5%) |
Income Below Poverty Among Married-Couple vs Single-Parent Households in Pulaski County
The poverty data for Pulaski County shows that 121 of the married-couple family households (5.3%) and 105 of the single-parent households (13.6%) are living below the poverty level. Within the married-couple family households, those with 5 or more children have the highest poverty rate, with 16 households (31.4%) falling below the poverty line. Among the single-parent households, those with 1 or 2 children have the highest poverty rate, with 83 household (27.0%) living below poverty.
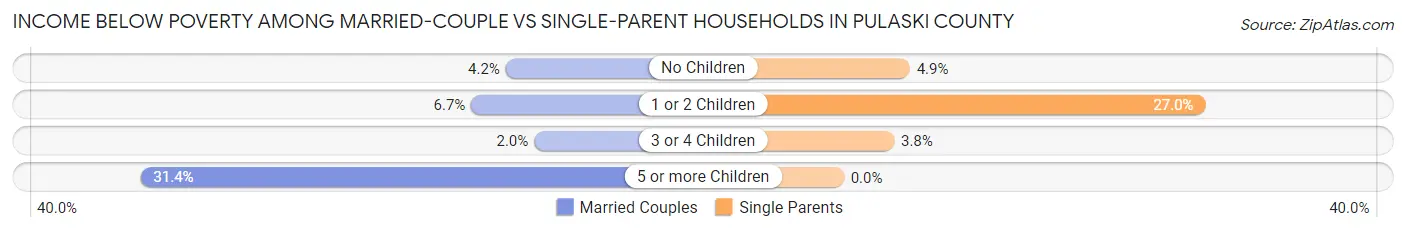
| Children | Married-Couple Families | Single-Parent Households |
| No Children | 61 (4.2%) | 19 (4.9%) |
| 1 or 2 Children | 41 (6.7%) | 83 (27.0%) |
| 3 or 4 Children | 3 (2.0%) | 3 (3.7%) |
| 5 or more Children | 16 (31.4%) | 0 (0.0%) |
| Total | 121 (5.3%) | 105 (13.6%) |
Employment Characteristics in Pulaski County
Employment by Class of Employer in Pulaski County
Among the 5,849 employed individuals in Pulaski County, private company employees (3,757 | 64.2%), not-for-profit organizations (687 | 11.7%), and local government employees (415 | 7.1%) make up the most common classes of employment.

| Employer Class | # Employees | % Employees |
| Private Company Employees | 3,757 | 64.2% |
| Self-Employed (Incorporated) | 397 | 6.8% |
| Self-Employed (Not Incorporated) | 314 | 5.4% |
| Not-for-profit Organizations | 687 | 11.7% |
| Local Government Employees | 415 | 7.1% |
| State Government Employees | 253 | 4.3% |
| Federal Government Employees | 13 | 0.2% |
| Unpaid Family Workers | 13 | 0.2% |
| Total | 5,849 | 100.0% |
Employment Status by Age in Pulaski County
According to the labor force statistics for Pulaski County, out of the total population over 16 years of age (10,060), 61.9% or 6,227 individuals are in the labor force, with 3.8% or 237 of them unemployed. The age group with the highest labor force participation rate is 25 to 29 years, with 88.9% or 679 individuals in the labor force. Within the labor force, the 25 to 29 years age range has the highest percentage of unemployed individuals, with 12.4% or 84 of them being unemployed.

| Age Bracket | In Labor Force | Unemployed |
| 16 to 19 Years | 342 (51.3%) | 7 (2.0%) |
| 20 to 24 Years | 606 (86.9%) | 40 (6.6%) |
| 25 to 29 Years | 679 (88.9%) | 84 (12.4%) |
| 30 to 34 Years | 546 (82.4%) | 8 (1.5%) |
| 35 to 44 Years | 1,153 (84.0%) | 36 (3.1%) |
| 45 to 54 Years | 1,202 (80.7%) | 22 (1.8%) |
| 55 to 59 Years | 582 (62.4%) | 19 (3.3%) |
| 60 to 64 Years | 439 (49.5%) | 8 (1.8%) |
| 65 to 74 Years | 465 (31.7%) | 11 (2.4%) |
| 75 Years and over | 207 (18.5%) | 0 (0.0%) |
| Total | 6,227 (61.9%) | 237 (3.8%) |
Employment Status by Educational Attainment in Pulaski County
According to labor force statistics for Pulaski County, 75.3% of individuals (4,600) out of the total population between 25 and 64 years of age (6,109) are in the labor force, with 3.8% or 175 of them being unemployed. The group with the highest labor force participation rate are those with the educational attainment of bachelor's degree or higher, with 89.9% or 807 individuals in the labor force. Within the labor force, individuals with less than high school education have the highest percentage of unemployment, with 14.5% or 60 of them being unemployed.
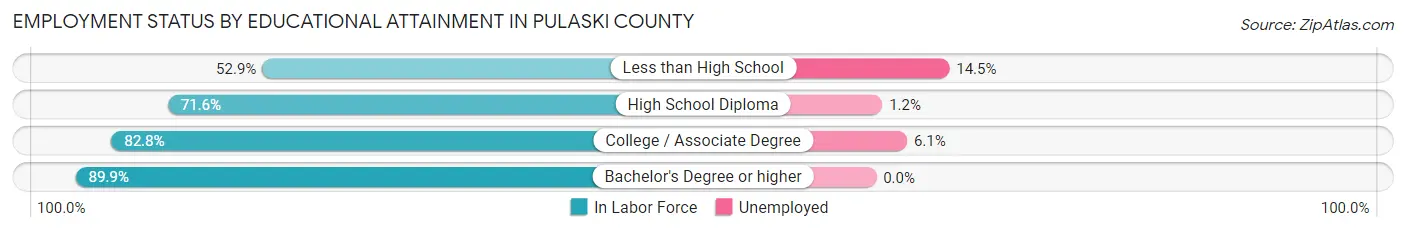
| Educational Attainment | In Labor Force | Unemployed |
| Less than High School | 413 (52.9%) | 113 (14.5%) |
| High School Diploma | 1,829 (71.6%) | 31 (1.2%) |
| College / Associate Degree | 1,553 (82.8%) | 114 (6.1%) |
| Bachelor's Degree or higher | 807 (89.9%) | 0 (0.0%) |
| Total | 4,600 (75.3%) | 232 (3.8%) |
Employment Occupations by Sex in Pulaski County
Management, Business, Science and Arts Occupations
The most common Management, Business, Science and Arts occupations in Pulaski County are Management (654 | 10.9%), Health Diagnosing & Treating (371 | 6.2%), Community & Social Service (346 | 5.8%), Education Instruction & Library (220 | 3.7%), and Health Technologists (214 | 3.6%).

Management, Business, Science and Arts Occupations by Sex
Within the Management, Business, Science and Arts occupations in Pulaski County, the most male-oriented occupations are Architecture & Engineering (100.0%), Arts, Media & Entertainment (81.8%), and Management (79.8%), while the most female-oriented occupations are Life, Physical & Social Science (100.0%), Legal Services & Support (100.0%), and Health Technologists (98.1%).

| Occupation | Male | Female |
| Management | 522 (79.8%) | 132 (20.2%) |
| Business & Financial | 32 (29.1%) | 78 (70.9%) |
| Computers, Engineering & Science | 78 (48.1%) | 84 (51.8%) |
| Computers & Mathematics | 46 (43.8%) | 59 (56.2%) |
| Architecture & Engineering | 32 (100.0%) | 0 (0.0%) |
| Life, Physical & Social Science | 0 (0.0%) | 25 (100.0%) |
| Community & Social Service | 119 (34.4%) | 227 (65.6%) |
| Education, Arts & Media | 47 (62.7%) | 28 (37.3%) |
| Legal Services & Support | 0 (0.0%) | 29 (100.0%) |
| Education Instruction & Library | 54 (24.5%) | 166 (75.4%) |
| Arts, Media & Entertainment | 18 (81.8%) | 4 (18.2%) |
| Health Diagnosing & Treating | 9 (2.4%) | 362 (97.6%) |
| Health Technologists | 4 (1.9%) | 210 (98.1%) |
| Total (Category) | 760 (46.3%) | 883 (53.7%) |
| Total (Overall) | 3,128 (52.2%) | 2,860 (47.8%) |
Services Occupations
The most common Services occupations in Pulaski County are Healthcare Support (337 | 5.6%), Food Preparation & Serving (286 | 4.8%), Cleaning & Maintenance (136 | 2.3%), Personal Care & Service (87 | 1.5%), and Security & Protection (54 | 0.9%).

Services Occupations by Sex
Within the Services occupations in Pulaski County, the most male-oriented occupations are Security & Protection (85.2%), Law Enforcement (85.2%), and Cleaning & Maintenance (72.1%), while the most female-oriented occupations are Healthcare Support (100.0%), Personal Care & Service (96.6%), and Food Preparation & Serving (64.0%).

| Occupation | Male | Female |
| Healthcare Support | 0 (0.0%) | 337 (100.0%) |
| Security & Protection | 46 (85.2%) | 8 (14.8%) |
| Firefighting & Prevention | 0 (0.0%) | 0 (0.0%) |
| Law Enforcement | 46 (85.2%) | 8 (14.8%) |
| Food Preparation & Serving | 103 (36.0%) | 183 (64.0%) |
| Cleaning & Maintenance | 98 (72.1%) | 38 (27.9%) |
| Personal Care & Service | 3 (3.5%) | 84 (96.6%) |
| Total (Category) | 250 (27.8%) | 650 (72.2%) |
| Total (Overall) | 3,128 (52.2%) | 2,860 (47.8%) |
Sales and Office Occupations
The most common Sales and Office occupations in Pulaski County are Office & Administration (630 | 10.5%), and Sales & Related (609 | 10.2%).
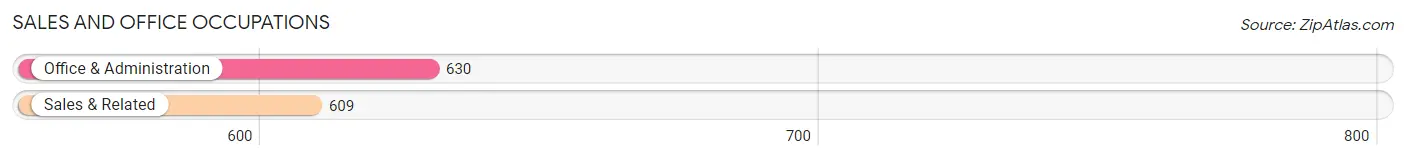
Sales and Office Occupations by Sex

| Occupation | Male | Female |
| Sales & Related | 181 (29.7%) | 428 (70.3%) |
| Office & Administration | 89 (14.1%) | 541 (85.9%) |
| Total (Category) | 270 (21.8%) | 969 (78.2%) |
| Total (Overall) | 3,128 (52.2%) | 2,860 (47.8%) |
Natural Resources, Construction and Maintenance Occupations
The most common Natural Resources, Construction and Maintenance occupations in Pulaski County are Construction & Extraction (256 | 4.3%), Installation, Maintenance & Repair (239 | 4.0%), and Farming, Fishing & Forestry (161 | 2.7%).
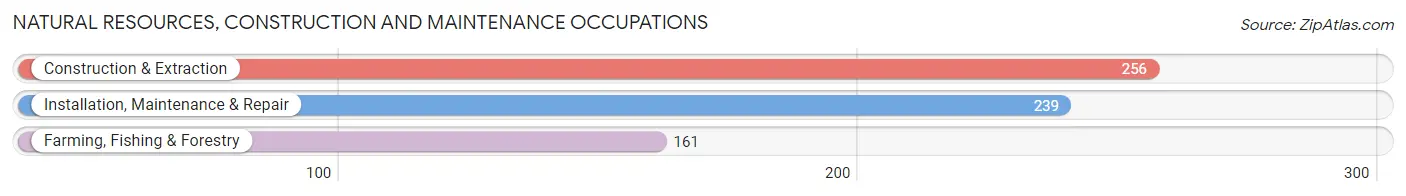
Natural Resources, Construction and Maintenance Occupations by Sex

| Occupation | Male | Female |
| Farming, Fishing & Forestry | 85 (52.8%) | 76 (47.2%) |
| Construction & Extraction | 256 (100.0%) | 0 (0.0%) |
| Installation, Maintenance & Repair | 236 (98.7%) | 3 (1.3%) |
| Total (Category) | 577 (88.0%) | 79 (12.0%) |
| Total (Overall) | 3,128 (52.2%) | 2,860 (47.8%) |
Production, Transportation and Moving Occupations
The most common Production, Transportation and Moving occupations in Pulaski County are Production (821 | 13.7%), Material Moving (424 | 7.1%), and Transportation (305 | 5.1%).

Production, Transportation and Moving Occupations by Sex

| Occupation | Male | Female |
| Production | 742 (90.4%) | 79 (9.6%) |
| Transportation | 236 (77.4%) | 69 (22.6%) |
| Material Moving | 293 (69.1%) | 131 (30.9%) |
| Total (Category) | 1,271 (82.0%) | 279 (18.0%) |
| Total (Overall) | 3,128 (52.2%) | 2,860 (47.8%) |
Employment Industries by Sex in Pulaski County
Employment Industries in Pulaski County
The major employment industries in Pulaski County include Manufacturing (1,396 | 23.3%), Health Care & Social Assistance (1,031 | 17.2%), Retail Trade (729 | 12.2%), Educational Services (446 | 7.4%), and Agriculture, Fishing & Hunting (429 | 7.2%).

Employment Industries by Sex in Pulaski County
The Pulaski County industries that see more men than women are Construction (96.1%), Transportation & Warehousing (87.8%), and Utilities (82.9%), whereas the industries that tend to have a higher number of women are Health Care & Social Assistance (95.6%), Finance & Insurance (94.8%), and Information (73.9%).
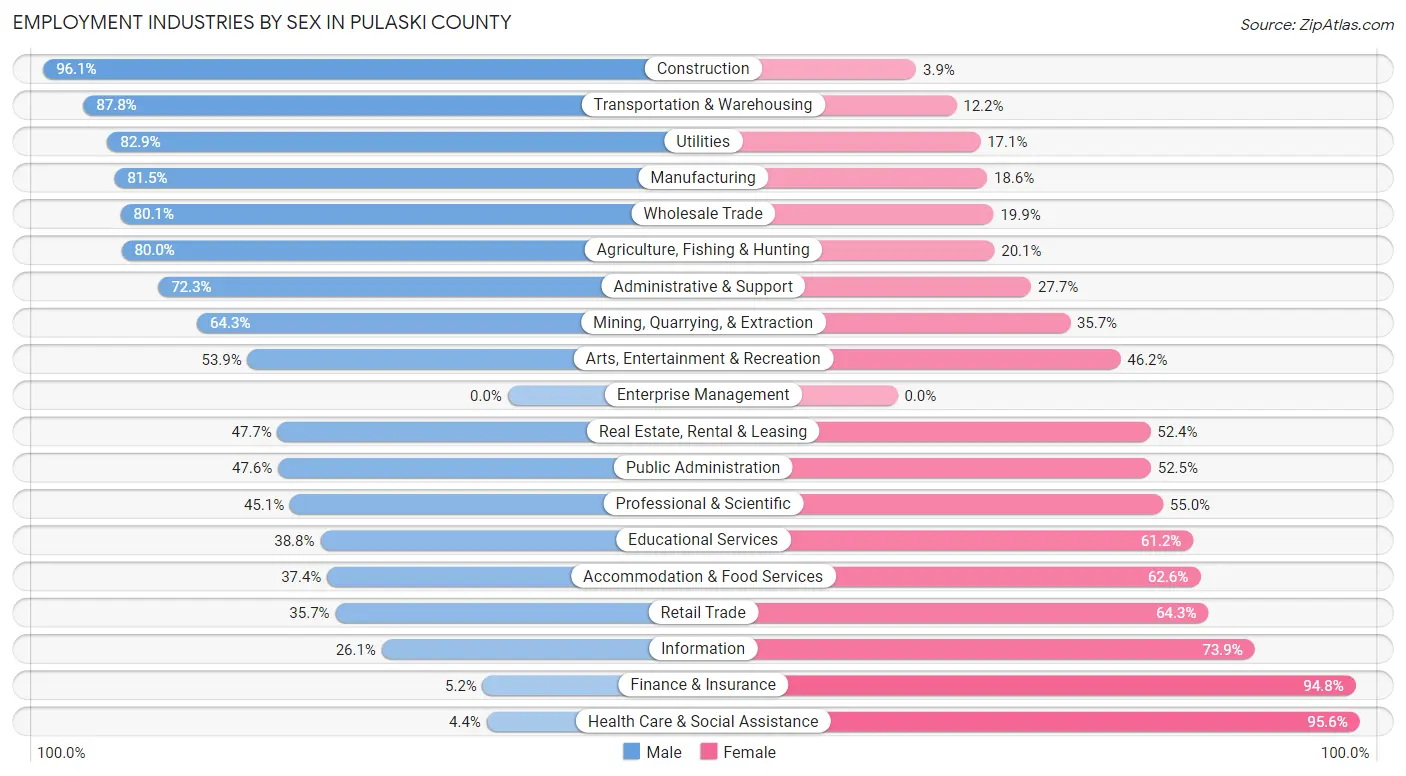
| Industry | Male | Female |
| Agriculture, Fishing & Hunting | 343 (79.9%) | 86 (20.1%) |
| Mining, Quarrying, & Extraction | 9 (64.3%) | 5 (35.7%) |
| Construction | 374 (96.1%) | 15 (3.9%) |
| Manufacturing | 1,137 (81.5%) | 259 (18.5%) |
| Wholesale Trade | 129 (80.1%) | 32 (19.9%) |
| Retail Trade | 260 (35.7%) | 469 (64.3%) |
| Transportation & Warehousing | 137 (87.8%) | 19 (12.2%) |
| Utilities | 29 (82.9%) | 6 (17.1%) |
| Information | 6 (26.1%) | 17 (73.9%) |
| Finance & Insurance | 7 (5.2%) | 128 (94.8%) |
| Real Estate, Rental & Leasing | 71 (47.6%) | 78 (52.3%) |
| Professional & Scientific | 50 (45.1%) | 61 (54.9%) |
| Enterprise Management | 0 (0.0%) | 0 (0.0%) |
| Administrative & Support | 34 (72.3%) | 13 (27.7%) |
| Educational Services | 173 (38.8%) | 273 (61.2%) |
| Health Care & Social Assistance | 45 (4.4%) | 986 (95.6%) |
| Arts, Entertainment & Recreation | 35 (53.8%) | 30 (46.2%) |
| Accommodation & Food Services | 111 (37.4%) | 186 (62.6%) |
| Public Administration | 97 (47.5%) | 107 (52.4%) |
| Total | 3,128 (52.2%) | 2,860 (47.8%) |
Education in Pulaski County
School Enrollment in Pulaski County
The most common levels of schooling among the 2,759 students in Pulaski County are high school (696 | 25.2%), middle school (675 | 24.5%), and elementary school (647 | 23.4%).

| School Level | # Students | % Students |
| Nursery / Preschool | 105 | 3.8% |
| Kindergarten | 117 | 4.2% |
| Elementary School | 647 | 23.4% |
| Middle School | 675 | 24.5% |
| High School | 696 | 25.2% |
| College / Undergraduate | 496 | 18.0% |
| Graduate / Professional | 23 | 0.8% |
| Total | 2,759 | 100.0% |
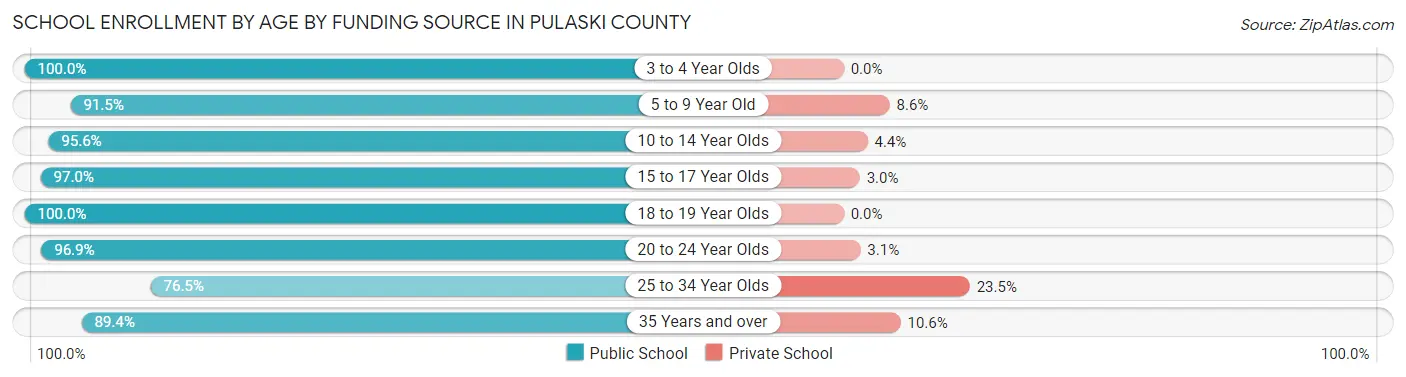
School Enrollment by Age by Funding Source in Pulaski County
Out of a total of 2,759 students who are enrolled in schools in Pulaski County, 163 (5.9%) attend a private institution, while the remaining 2,596 (94.1%) are enrolled in public schools. The age group of 25 to 34 year olds has the highest likelihood of being enrolled in private schools, with 31 (23.5% in the age bracket) enrolled. Conversely, the age group of 3 to 4 year olds has the lowest likelihood of being enrolled in a private school, with 85 (100.0% in the age bracket) attending a public institution.
| Age Bracket | Public School | Private School |
| 3 to 4 Year Olds | 85 (100.0%) | 0 (0.0%) |
| 5 to 9 Year Old | 599 (91.4%) | 56 (8.6%) |
| 10 to 14 Year Olds | 817 (95.6%) | 38 (4.4%) |
| 15 to 17 Year Olds | 486 (97.0%) | 15 (3.0%) |
| 18 to 19 Year Olds | 188 (100.0%) | 0 (0.0%) |
| 20 to 24 Year Olds | 186 (96.9%) | 6 (3.1%) |
| 25 to 34 Year Olds | 101 (76.5%) | 31 (23.5%) |
| 35 Years and over | 135 (89.4%) | 16 (10.6%) |
| Total | 2,596 (94.1%) | 163 (5.9%) |
Educational Attainment by Field of Study in Pulaski County
Education (258 | 20.1%), business (205 | 15.9%), science & technology (202 | 15.7%), liberal arts & history (118 | 9.2%), and arts & humanities (95 | 7.4%) are the most common fields of study among 1,287 individuals in Pulaski County who have obtained a bachelor's degree or higher.

| Field of Study | # Graduates | % Graduates |
| Computers & Mathematics | 74 | 5.8% |
| Bio, Nature & Agricultural | 69 | 5.4% |
| Physical & Health Sciences | 42 | 3.3% |
| Psychology | 17 | 1.3% |
| Social Sciences | 74 | 5.8% |
| Engineering | 76 | 5.9% |
| Multidisciplinary Studies | 0 | 0.0% |
| Science & Technology | 202 | 15.7% |
| Business | 205 | 15.9% |
| Education | 258 | 20.1% |
| Literature & Languages | 34 | 2.6% |
| Liberal Arts & History | 118 | 9.2% |
| Visual & Performing Arts | 9 | 0.7% |
| Communications | 14 | 1.1% |
| Arts & Humanities | 95 | 7.4% |
| Total | 1,287 | 100.0% |
Transportation & Commute in Pulaski County
Vehicle Availability by Sex in Pulaski County
The most prevalent vehicle ownership categories in Pulaski County are males with 2 vehicles (1,104, accounting for 36.1%) and females with 2 vehicles (1,187, making up 39.7%).

| Vehicles Available | Male | Female |
| No Vehicle | 155 (5.1%) | 27 (1.0%) |
| 1 Vehicle | 285 (9.3%) | 341 (12.3%) |
| 2 Vehicles | 1,104 (36.1%) | 1,187 (42.7%) |
| 3 Vehicles | 953 (31.2%) | 793 (28.5%) |
| 4 Vehicles | 271 (8.9%) | 177 (6.4%) |
| 5 or more Vehicles | 288 (9.4%) | 257 (9.2%) |
| Total | 3,056 (100.0%) | 2,782 (100.0%) |
Commute Time in Pulaski County
The most frequently occuring commute durations in Pulaski County are 15 to 19 minutes (795 commuters, 14.3%), 5 to 9 minutes (760 commuters, 13.7%), and 45 to 59 minutes (676 commuters, 12.2%).

| Commute Time | # Commuters | % Commuters |
| Less than 5 Minutes | 535 | 9.7% |
| 5 to 9 Minutes | 760 | 13.7% |
| 10 to 14 Minutes | 587 | 10.6% |
| 15 to 19 Minutes | 795 | 14.3% |
| 20 to 24 Minutes | 354 | 6.4% |
| 25 to 29 Minutes | 560 | 10.1% |
| 30 to 34 Minutes | 368 | 6.6% |
| 35 to 39 Minutes | 277 | 5.0% |
| 40 to 44 Minutes | 108 | 1.9% |
| 45 to 59 Minutes | 676 | 12.2% |
| 60 to 89 Minutes | 346 | 6.2% |
| 90 or more Minutes | 175 | 3.2% |
Commute Time by Sex in Pulaski County
The most common commute times in Pulaski County are 15 to 19 minutes (389 commuters, 13.8%) for males and 5 to 9 minutes (413 commuters, 15.2%) for females.

| Commute Time | Male | Female |
| Less than 5 Minutes | 308 (10.9%) | 227 (8.4%) |
| 5 to 9 Minutes | 347 (12.3%) | 413 (15.2%) |
| 10 to 14 Minutes | 373 (13.2%) | 214 (7.9%) |
| 15 to 19 Minutes | 389 (13.8%) | 406 (14.9%) |
| 20 to 24 Minutes | 203 (7.2%) | 151 (5.6%) |
| 25 to 29 Minutes | 150 (5.3%) | 410 (15.1%) |
| 30 to 34 Minutes | 167 (5.9%) | 201 (7.4%) |
| 35 to 39 Minutes | 163 (5.8%) | 114 (4.2%) |
| 40 to 44 Minutes | 71 (2.5%) | 37 (1.4%) |
| 45 to 59 Minutes | 344 (12.2%) | 332 (12.2%) |
| 60 to 89 Minutes | 183 (6.5%) | 163 (6.0%) |
| 90 or more Minutes | 127 (4.5%) | 48 (1.8%) |
Time of Departure to Work by Sex in Pulaski County
The most frequent times of departure to work in Pulaski County are 7:00 AM to 7:29 AM (488, 17.3%) for males and 7:30 AM to 7:59 AM (492, 18.1%) for females.

| Time of Departure | Male | Female |
| 12:00 AM to 4:59 AM | 321 (11.4%) | 163 (6.0%) |
| 5:00 AM to 5:29 AM | 223 (7.9%) | 247 (9.1%) |
| 5:30 AM to 5:59 AM | 277 (9.8%) | 212 (7.8%) |
| 6:00 AM to 6:29 AM | 331 (11.7%) | 80 (2.9%) |
| 6:30 AM to 6:59 AM | 358 (12.7%) | 199 (7.3%) |
| 7:00 AM to 7:29 AM | 488 (17.3%) | 415 (15.3%) |
| 7:30 AM to 7:59 AM | 206 (7.3%) | 492 (18.1%) |
| 8:00 AM to 8:29 AM | 128 (4.5%) | 168 (6.2%) |
| 8:30 AM to 8:59 AM | 29 (1.0%) | 92 (3.4%) |
| 9:00 AM to 9:59 AM | 15 (0.5%) | 176 (6.5%) |
| 10:00 AM to 10:59 AM | 18 (0.6%) | 154 (5.7%) |
| 11:00 AM to 11:59 AM | 35 (1.2%) | 14 (0.5%) |
| 12:00 PM to 3:59 PM | 182 (6.4%) | 192 (7.1%) |
| 4:00 PM to 11:59 PM | 214 (7.6%) | 112 (4.1%) |
| Total | 2,825 (100.0%) | 2,716 (100.0%) |
Housing Occupancy in Pulaski County
Occupancy by Ownership in Pulaski County
Of the total 4,795 dwellings in Pulaski County, owner-occupied units account for 3,680 (76.7%), while renter-occupied units make up 1,115 (23.3%).

| Occupancy | # Housing Units | % Housing Units |
| Owner Occupied Housing Units | 3,680 | 76.7% |
| Renter-Occupied Housing Units | 1,115 | 23.3% |
| Total Occupied Housing Units | 4,795 | 100.0% |
Occupancy by Household Size in Pulaski County
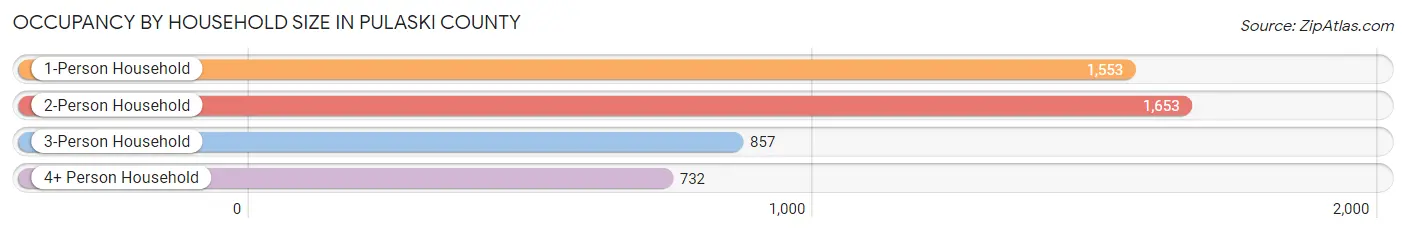
| Household Size | # Housing Units | % Housing Units |
| 1-Person Household | 1,553 | 32.4% |
| 2-Person Household | 1,653 | 34.5% |
| 3-Person Household | 857 | 17.9% |
| 4+ Person Household | 732 | 15.3% |
| Total Housing Units | 4,795 | 100.0% |
Occupancy by Ownership by Household Size in Pulaski County
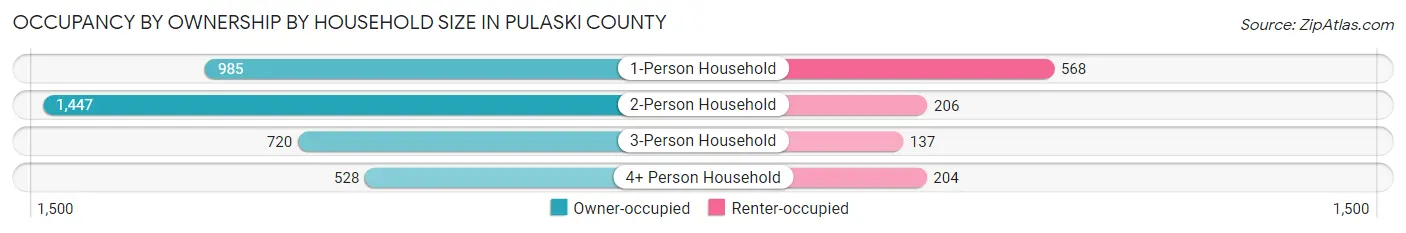
| Household Size | Owner-occupied | Renter-occupied |
| 1-Person Household | 985 (63.4%) | 568 (36.6%) |
| 2-Person Household | 1,447 (87.5%) | 206 (12.5%) |
| 3-Person Household | 720 (84.0%) | 137 (16.0%) |
| 4+ Person Household | 528 (72.1%) | 204 (27.9%) |
| Total Housing Units | 3,680 (76.7%) | 1,115 (23.3%) |
Occupancy by Educational Attainment in Pulaski County
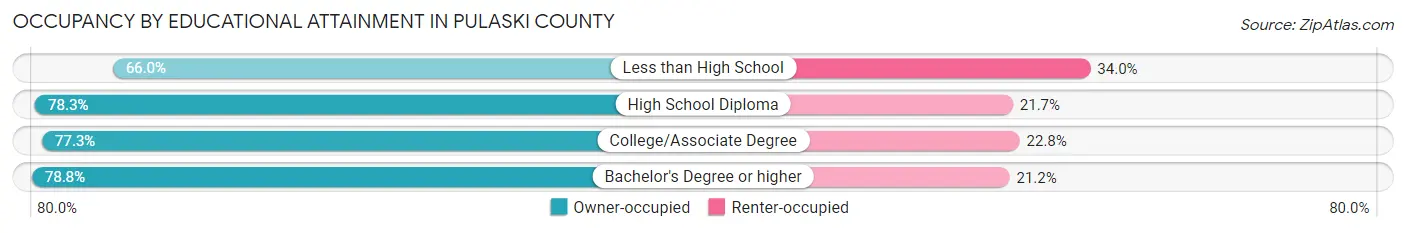
| Household Size | Owner-occupied | Renter-occupied |
| Less than High School | 338 (66.0%) | 174 (34.0%) |
| High School Diploma | 1,633 (78.3%) | 452 (21.7%) |
| College/Associate Degree | 1,165 (77.2%) | 343 (22.8%) |
| Bachelor's Degree or higher | 544 (78.8%) | 146 (21.2%) |
Occupancy by Age of Householder in Pulaski County
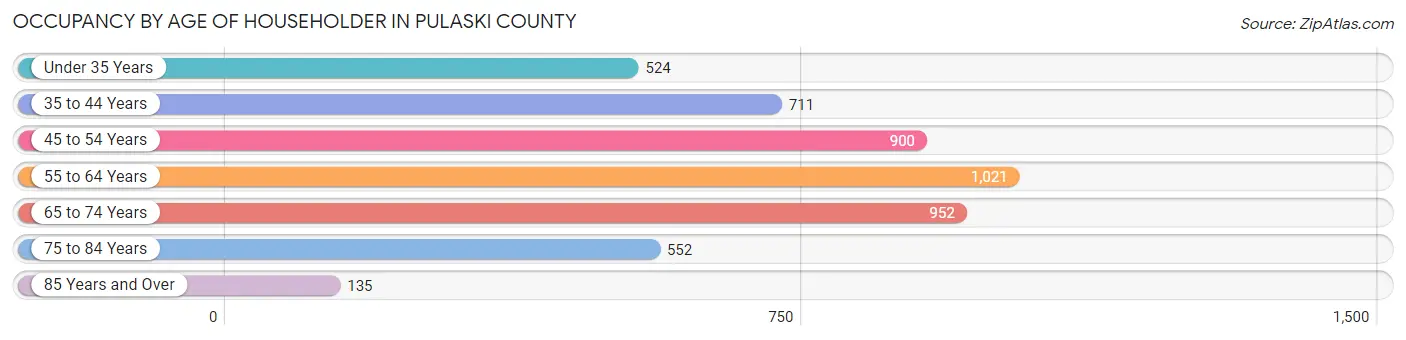
| Age Bracket | # Households | % Households |
| Under 35 Years | 524 | 10.9% |
| 35 to 44 Years | 711 | 14.8% |
| 45 to 54 Years | 900 | 18.8% |
| 55 to 64 Years | 1,021 | 21.3% |
| 65 to 74 Years | 952 | 19.9% |
| 75 to 84 Years | 552 | 11.5% |
| 85 Years and Over | 135 | 2.8% |
| Total | 4,795 | 100.0% |
Housing Finances in Pulaski County
Median Income by Occupancy in Pulaski County
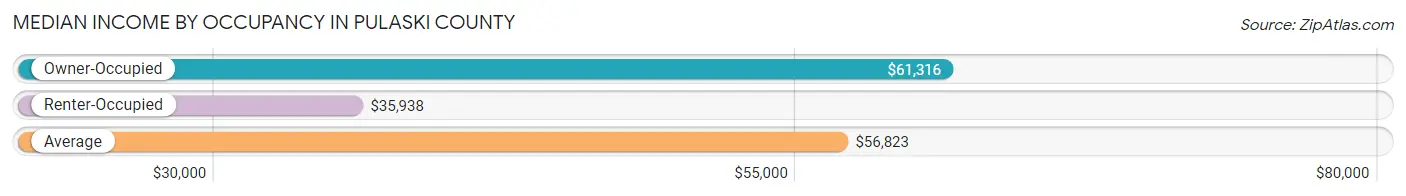
| Occupancy Type | # Households | Median Income |
| Owner-Occupied | 3,680 (76.7%) | $61,316 |
| Renter-Occupied | 1,115 (23.3%) | $35,938 |
| Average | 4,795 (100.0%) | $56,823 |
Occupancy by Householder Income Bracket in Pulaski County
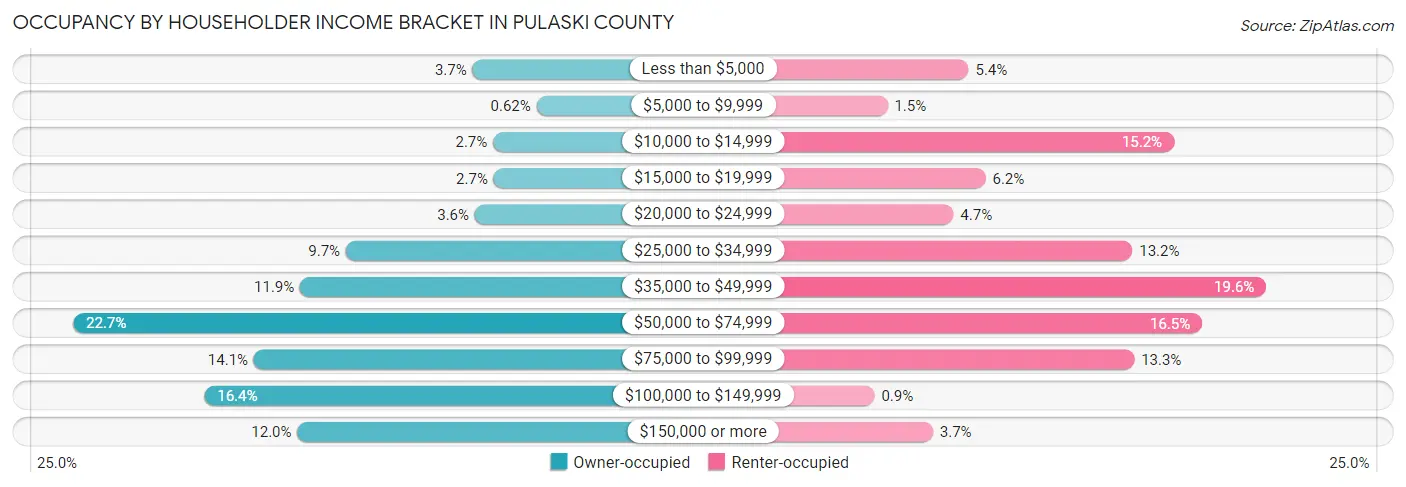
| Income Bracket | Owner-occupied | Renter-occupied |
| Less than $5,000 | 135 (3.7%) | 60 (5.4%) |
| $5,000 to $9,999 | 23 (0.6%) | 17 (1.5%) |
| $10,000 to $14,999 | 99 (2.7%) | 169 (15.2%) |
| $15,000 to $19,999 | 98 (2.7%) | 69 (6.2%) |
| $20,000 to $24,999 | 131 (3.6%) | 52 (4.7%) |
| $25,000 to $34,999 | 357 (9.7%) | 147 (13.2%) |
| $35,000 to $49,999 | 437 (11.9%) | 218 (19.6%) |
| $50,000 to $74,999 | 835 (22.7%) | 184 (16.5%) |
| $75,000 to $99,999 | 518 (14.1%) | 148 (13.3%) |
| $100,000 to $149,999 | 605 (16.4%) | 10 (0.9%) |
| $150,000 or more | 442 (12.0%) | 41 (3.7%) |
| Total | 3,680 (100.0%) | 1,115 (100.0%) |
Monthly Housing Cost Tiers in Pulaski County
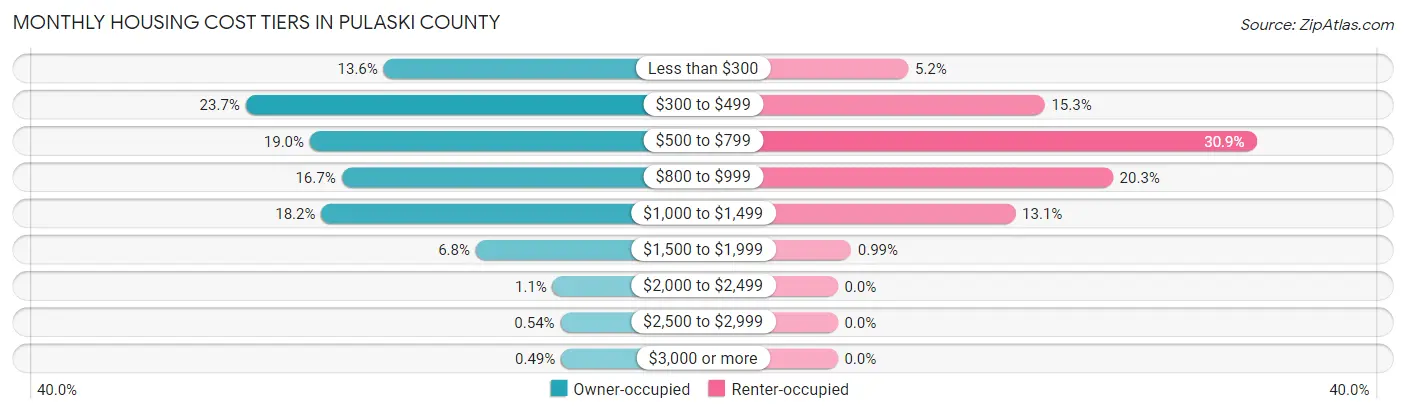
| Monthly Cost | Owner-occupied | Renter-occupied |
| Less than $300 | 499 (13.6%) | 58 (5.2%) |
| $300 to $499 | 873 (23.7%) | 170 (15.2%) |
| $500 to $799 | 699 (19.0%) | 344 (30.8%) |
| $800 to $999 | 613 (16.7%) | 226 (20.3%) |
| $1,000 to $1,499 | 668 (18.1%) | 146 (13.1%) |
| $1,500 to $1,999 | 249 (6.8%) | 11 (1.0%) |
| $2,000 to $2,499 | 41 (1.1%) | 0 (0.0%) |
| $2,500 to $2,999 | 20 (0.5%) | 0 (0.0%) |
| $3,000 or more | 18 (0.5%) | 0 (0.0%) |
| Total | 3,680 (100.0%) | 1,115 (100.0%) |
Physical Housing Characteristics in Pulaski County
Housing Structures in Pulaski County

| Structure Type | # Housing Units | % Housing Units |
| Single Unit, Detached | 3,925 | 81.9% |
| Single Unit, Attached | 11 | 0.2% |
| 2 Unit Apartments | 83 | 1.7% |
| 3 or 4 Unit Apartments | 41 | 0.9% |
| 5 to 9 Unit Apartments | 26 | 0.5% |
| 10 or more Apartments | 142 | 3.0% |
| Mobile Home / Other | 567 | 11.8% |
| Total | 4,795 | 100.0% |
Housing Structures by Occupancy in Pulaski County

| Structure Type | Owner-occupied | Renter-occupied |
| Single Unit, Detached | 3,235 (82.4%) | 690 (17.6%) |
| Single Unit, Attached | 3 (27.3%) | 8 (72.7%) |
| 2 Unit Apartments | 24 (28.9%) | 59 (71.1%) |
| 3 or 4 Unit Apartments | 0 (0.0%) | 41 (100.0%) |
| 5 to 9 Unit Apartments | 0 (0.0%) | 26 (100.0%) |
| 10 or more Apartments | 0 (0.0%) | 142 (100.0%) |
| Mobile Home / Other | 418 (73.7%) | 149 (26.3%) |
| Total | 3,680 (76.7%) | 1,115 (23.3%) |
Housing Structures by Number of Rooms in Pulaski County

| Number of Rooms | Owner-occupied | Renter-occupied |
| 1 Room | 23 (0.6%) | 0 (0.0%) |
| 2 or 3 Rooms | 121 (3.3%) | 185 (16.6%) |
| 4 or 5 Rooms | 1,001 (27.2%) | 537 (48.2%) |
| 6 or 7 Rooms | 1,388 (37.7%) | 269 (24.1%) |
| 8 or more Rooms | 1,147 (31.2%) | 124 (11.1%) |
| Total | 3,680 (100.0%) | 1,115 (100.0%) |
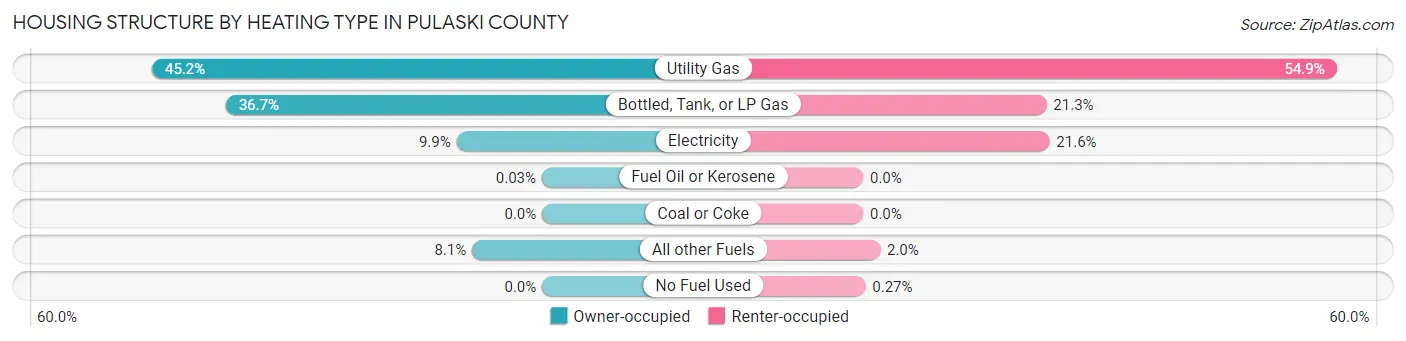
Housing Structure by Heating Type in Pulaski County
| Heating Type | Owner-occupied | Renter-occupied |
| Utility Gas | 1,665 (45.2%) | 612 (54.9%) |
| Bottled, Tank, or LP Gas | 1,350 (36.7%) | 237 (21.3%) |
| Electricity | 365 (9.9%) | 241 (21.6%) |
| Fuel Oil or Kerosene | 1 (0.0%) | 0 (0.0%) |
| Coal or Coke | 0 (0.0%) | 0 (0.0%) |
| All other Fuels | 299 (8.1%) | 22 (2.0%) |
| No Fuel Used | 0 (0.0%) | 3 (0.3%) |
| Total | 3,680 (100.0%) | 1,115 (100.0%) |
Household Vehicle Usage in Pulaski County

| Vehicles per Household | Owner-occupied | Renter-occupied |
| No Vehicle | 54 (1.5%) | 284 (25.5%) |
| 1 Vehicle | 732 (19.9%) | 358 (32.1%) |
| 2 Vehicles | 1,584 (43.0%) | 268 (24.0%) |
| 3 or more Vehicles | 1,310 (35.6%) | 205 (18.4%) |
| Total | 3,680 (100.0%) | 1,115 (100.0%) |
Real Estate & Mortgages in Pulaski County
Real Estate and Mortgage Overview in Pulaski County
| Characteristic | Without Mortgage | With Mortgage |
| Housing Units | 1,802 | 1,878 |
| Median Property Value | $128,300 | $134,400 |
| Median Household Income | $55,714 | $179 |
| Monthly Housing Costs | $368 | $18 |
| Real Estate Taxes | $518 | $21 |
Property Value by Mortgage Status in Pulaski County

| Property Value | Without Mortgage | With Mortgage |
| Less than $50,000 | 314 (17.4%) | 42 (2.2%) |
| $50,000 to $99,999 | 443 (24.6%) | 559 (29.8%) |
| $100,000 to $299,999 | 925 (51.3%) | 1,166 (62.1%) |
| $300,000 to $499,999 | 75 (4.2%) | 86 (4.6%) |
| $500,000 to $749,999 | 16 (0.9%) | 0 (0.0%) |
| $750,000 to $999,999 | 0 (0.0%) | 2 (0.1%) |
| $1,000,000 or more | 29 (1.6%) | 23 (1.2%) |
| Total | 1,802 (100.0%) | 1,878 (100.0%) |
Household Income by Mortgage Status in Pulaski County

| Household Income | Without Mortgage | With Mortgage |
| Less than $10,000 | 128 (7.1%) | 14 (0.7%) |
| $10,000 to $24,999 | 215 (11.9%) | 30 (1.6%) |
| $25,000 to $34,999 | 239 (13.3%) | 113 (6.0%) |
| $35,000 to $49,999 | 212 (11.8%) | 118 (6.3%) |
| $50,000 to $74,999 | 349 (19.4%) | 225 (12.0%) |
| $75,000 to $99,999 | 195 (10.8%) | 486 (25.9%) |
| $100,000 to $149,999 | 201 (11.2%) | 323 (17.2%) |
| $150,000 or more | 263 (14.6%) | 404 (21.5%) |
| Total | 1,802 (100.0%) | 1,878 (100.0%) |
Property Value to Household Income Ratio in Pulaski County

| Value-to-Income Ratio | Without Mortgage | With Mortgage |
| Less than 2.0x | 914 (50.7%) | 73,207 (3,898.1%) |
| 2.0x to 2.9x | 205 (11.4%) | 1,032 (54.9%) |
| 3.0x to 3.9x | 200 (11.1%) | 451 (24.0%) |
| 4.0x or more | 464 (25.8%) | 178 (9.5%) |
| Total | 1,802 (100.0%) | 1,878 (100.0%) |
Real Estate Taxes by Mortgage Status in Pulaski County
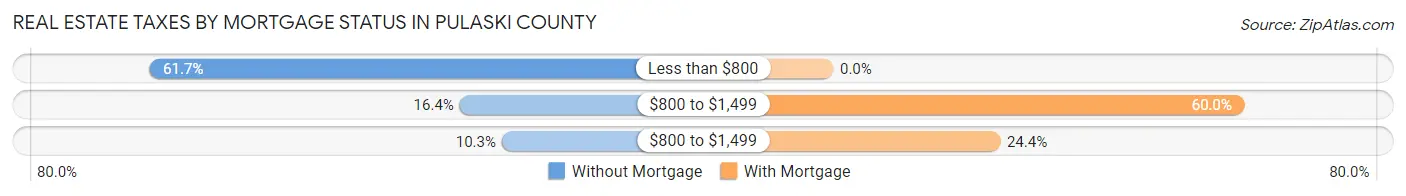
| Property Taxes | Without Mortgage | With Mortgage |
| Less than $800 | 1,111 (61.7%) | 0 (0.0%) |
| $800 to $1,499 | 296 (16.4%) | 1,127 (60.0%) |
| $800 to $1,499 | 185 (10.3%) | 458 (24.4%) |
| Total | 1,802 (100.0%) | 1,878 (100.0%) |
Health & Disability in Pulaski County
Health Insurance Coverage by Age in Pulaski County

| Age Bracket | With Coverage | Without Coverage |
| Under 6 Years | 711 (97.0%) | 22 (3.0%) |
| 6 to 18 Years | 2,207 (97.9%) | 48 (2.1%) |
| 19 to 25 Years | 713 (75.2%) | 235 (24.8%) |
| 26 to 34 Years | 1,024 (81.2%) | 237 (18.8%) |
| 35 to 44 Years | 1,288 (94.6%) | 73 (5.4%) |
| 45 to 54 Years | 1,265 (85.6%) | 213 (14.4%) |
| 55 to 64 Years | 1,696 (93.5%) | 117 (6.5%) |
| 65 to 74 Years | 1,456 (100.0%) | 0 (0.0%) |
| 75 Years and older | 1,049 (99.2%) | 8 (0.8%) |
| Total | 11,409 (92.3%) | 953 (7.7%) |
Health Insurance Coverage by Citizenship Status in Pulaski County

| Citizenship Status | With Coverage | Without Coverage |
| Native Born | 711 (97.0%) | 22 (3.0%) |
| Foreign Born, Citizen | 2,207 (97.9%) | 48 (2.1%) |
| Foreign Born, not a Citizen | 713 (75.2%) | 235 (24.8%) |
Health Insurance Coverage by Household Income in Pulaski County
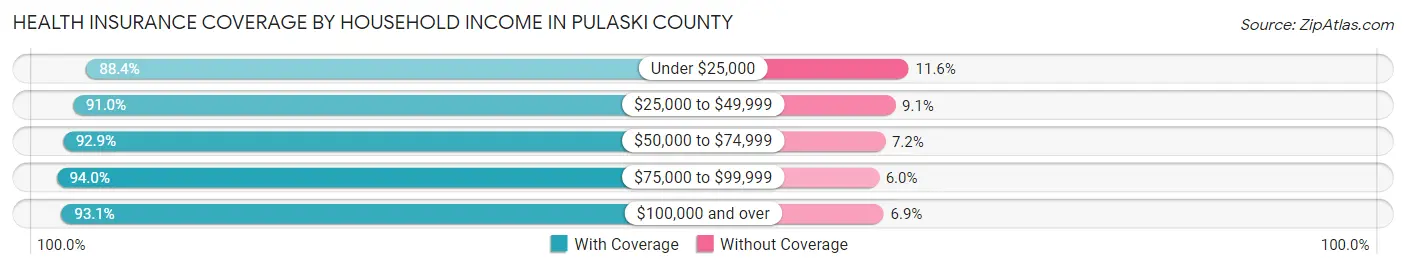
| Household Income | With Coverage | Without Coverage |
| Under $25,000 | 1,161 (88.4%) | 152 (11.6%) |
| $25,000 to $49,999 | 2,261 (90.9%) | 225 (9.0%) |
| $50,000 to $74,999 | 2,635 (92.8%) | 203 (7.1%) |
| $75,000 to $99,999 | 2,060 (94.0%) | 131 (6.0%) |
| $100,000 and over | 3,267 (93.1%) | 242 (6.9%) |
Public vs Private Health Insurance Coverage by Age in Pulaski County

| Age Bracket | Public Insurance | Private Insurance |
| Under 6 | 374 (51.0%) | 369 (50.3%) |
| 6 to 18 Years | 644 (28.6%) | 1,612 (71.5%) |
| 19 to 25 Years | 135 (14.2%) | 616 (65.0%) |
| 25 to 34 Years | 192 (15.2%) | 850 (67.4%) |
| 35 to 44 Years | 335 (24.6%) | 974 (71.6%) |
| 45 to 54 Years | 234 (15.8%) | 1,056 (71.5%) |
| 55 to 64 Years | 607 (33.5%) | 1,236 (68.2%) |
| 65 to 74 Years | 1,385 (95.1%) | 747 (51.3%) |
| 75 Years and over | 1,039 (98.3%) | 786 (74.4%) |
| Total | 4,945 (40.0%) | 8,246 (66.7%) |
Disability Status by Sex by Age in Pulaski County

| Age Bracket | Male | Female |
| Under 5 Years | 0 (0.0%) | 0 (0.0%) |
| 5 to 17 Years | 35 (3.2%) | 88 (9.2%) |
| 18 to 34 Years | 104 (8.5%) | 29 (2.3%) |
| 35 to 64 Years | 401 (17.2%) | 593 (25.6%) |
| 65 to 74 Years | 156 (21.3%) | 243 (33.6%) |
| 75 Years and over | 313 (66.7%) | 211 (35.9%) |
Disability Class by Sex by Age in Pulaski County
Disability Class: Hearing Difficulty
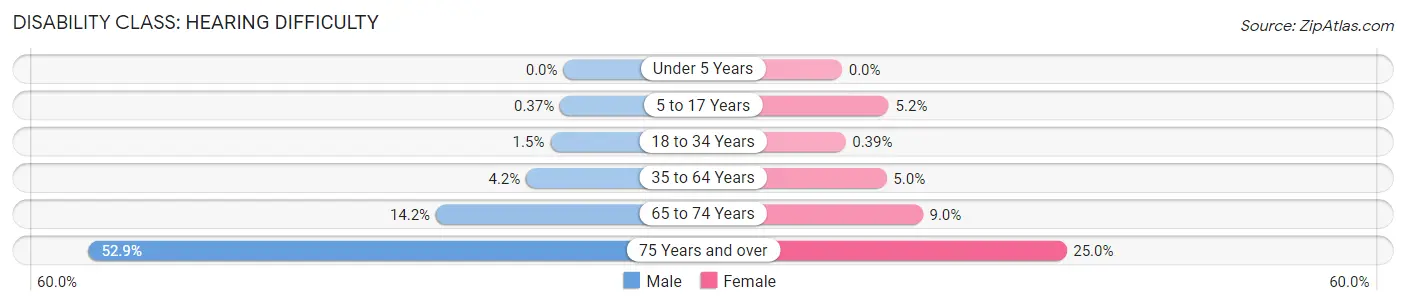
| Age Bracket | Male | Female |
| Under 5 Years | 0 (0.0%) | 0 (0.0%) |
| 5 to 17 Years | 4 (0.4%) | 50 (5.2%) |
| 18 to 34 Years | 18 (1.5%) | 5 (0.4%) |
| 35 to 64 Years | 97 (4.2%) | 115 (5.0%) |
| 65 to 74 Years | 104 (14.2%) | 65 (9.0%) |
| 75 Years and over | 248 (52.9%) | 147 (25.0%) |
Disability Class: Vision Difficulty

| Age Bracket | Male | Female |
| Under 5 Years | 0 (0.0%) | 0 (0.0%) |
| 5 to 17 Years | 5 (0.5%) | 12 (1.3%) |
| 18 to 34 Years | 3 (0.2%) | 0 (0.0%) |
| 35 to 64 Years | 110 (4.7%) | 72 (3.1%) |
| 65 to 74 Years | 30 (4.1%) | 24 (3.3%) |
| 75 Years and over | 34 (7.2%) | 98 (16.7%) |
Disability Class: Cognitive Difficulty
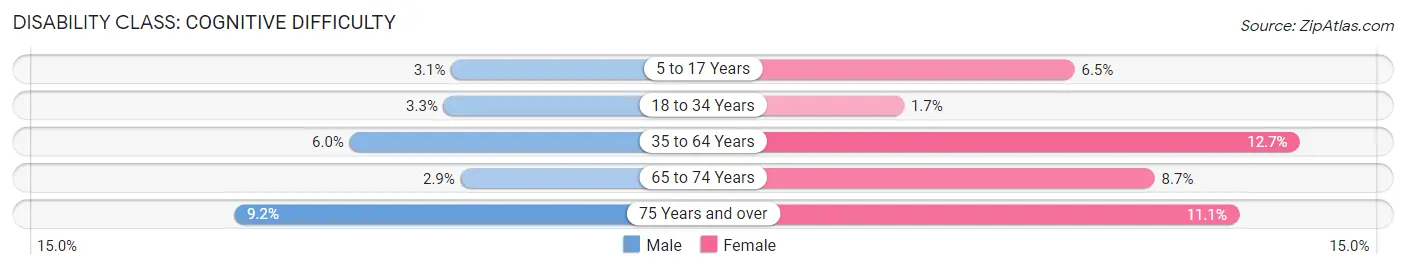
| Age Bracket | Male | Female |
| 5 to 17 Years | 34 (3.1%) | 62 (6.5%) |
| 18 to 34 Years | 41 (3.3%) | 22 (1.7%) |
| 35 to 64 Years | 139 (5.9%) | 295 (12.7%) |
| 65 to 74 Years | 21 (2.9%) | 63 (8.7%) |
| 75 Years and over | 43 (9.2%) | 65 (11.1%) |
Disability Class: Ambulatory Difficulty

| Age Bracket | Male | Female |
| 5 to 17 Years | 7 (0.6%) | 7 (0.7%) |
| 18 to 34 Years | 65 (5.3%) | 8 (0.6%) |
| 35 to 64 Years | 226 (9.7%) | 337 (14.5%) |
| 65 to 74 Years | 72 (9.8%) | 171 (23.6%) |
| 75 Years and over | 62 (13.2%) | 110 (18.7%) |
Disability Class: Self-Care Difficulty

| Age Bracket | Male | Female |
| 5 to 17 Years | 14 (1.3%) | 7 (0.7%) |
| 18 to 34 Years | 23 (1.9%) | 0 (0.0%) |
| 35 to 64 Years | 41 (1.8%) | 114 (4.9%) |
| 65 to 74 Years | 22 (3.0%) | 36 (5.0%) |
| 75 Years and over | 26 (5.5%) | 12 (2.0%) |
Technology Access in Pulaski County
Computing Device Access in Pulaski County

| Device Type | # Households | % Households |
| Desktop or Laptop | 3,487 | 72.7% |
| Smartphone | 3,832 | 79.9% |
| Tablet | 2,694 | 56.2% |
| No Computing Device | 450 | 9.4% |
| Total | 4,795 | 100.0% |
Internet Access in Pulaski County

| Internet Type | # Households | % Households |
| Dial-Up Internet | 7 | 0.2% |
| Broadband Home | 2,946 | 61.4% |
| Cellular Data Only | 809 | 16.9% |
| Satellite Internet | 355 | 7.4% |
| No Internet | 705 | 14.7% |
| Total | 4,795 | 100.0% |
Pulaski County Summary
Pulaski County, Indiana is located in the northern part of the state, in the Tippecanoe River Valley. It is bordered by Fulton, Cass, White, Jasper, and Starke counties. The county seat is Winamac, and the largest city is Monterey. The county was established in 1835 and named after Polish patriot Kazimierz Pułaski.
Geography
Pulaski County is located in the northern part of Indiana, in the Tippecanoe River Valley. It is bordered by Fulton, Cass, White, Jasper, and Starke counties. The county has a total area of 441 square miles, of which 437 square miles is land and 4.2 square miles is water. The terrain is mostly flat, with some rolling hills in the northern part of the county. The highest point in the county is located in the northwest corner, at an elevation of 890 feet.
The Tippecanoe River runs through the county, and there are several small lakes and ponds scattered throughout. The climate is humid continental, with hot summers and cold winters. The average annual temperature is around 50 degrees Fahrenheit, and the average annual precipitation is around 40 inches.
Demographics
As of the 2010 census, there were 13,402 people, 5,093 households, and 3,541 families living in Pulaski County. The population density was 30.5 people per square mile. The racial makeup of the county was 97.2% White, 0.5% African American, 0.3% Native American, 0.2% Asian, 0.1% Pacific Islander, 0.7% from other races, and 0.9% from two or more races. Hispanic or Latino of any race were 1.7% of the population.
The median income for a household in the county was $41,945, and the median income for a family was $50,945. The per capita income for the county was $20,845. About 11.2% of families and 14.2% of the population were below the poverty line, including 19.2% of those under age 18 and 8.2% of those age 65 or over.
Economy
The economy of Pulaski County is largely based on agriculture. The county is home to several large farms, and the main crops grown are corn, soybeans, and wheat. The county also has a large dairy industry, and there are several small businesses in the area.
The county is also home to several manufacturing companies, including a steel mill, a paper mill, and a plastics plant. The county is also home to several small businesses, including restaurants, retail stores, and service providers.
History
Pulaski County was established in 1835 and named after Polish patriot Kazimierz Pułaski. The county was originally part of the Potawatomi Nation, and the first settlers arrived in the area in the early 1800s. The county was largely agricultural, and the main crops grown were corn, wheat, and hay.
The county was also home to several small towns, including Winamac, Monterey, and Francesville. The county was also home to several Native American tribes, including the Potawatomi, Miami, and Shawnee.
In the late 1800s, the county began to industrialize, and several manufacturing companies were established in the area. The county also became a popular tourist destination, and several resorts were built in the area.
Today, Pulaski County is still largely agricultural, but it is also home to several manufacturing companies and small businesses. The county is also home to several tourist attractions, including the Tippecanoe River State Park and the Winamac Fish Hatchery.
Common Questions
What is the Total Population of Pulaski County?
Total Population of Pulaski County is 12,498.
What is the Total Male Population of Pulaski County?
Total Male Population of Pulaski County is 6,255.
What is the Total Female Population of Pulaski County?
Total Female Population of Pulaski County is 6,243.
What is the Ratio of Males per 100 Females in Pulaski County?
There are 100.19 Males per 100 Females in Pulaski County.
What is the Ratio of Females per 100 Males in Pulaski County?
There are 99.81 Females per 100 Males in Pulaski County.
What is the Median Population Age in Pulaski County?
Median Population Age in Pulaski County is 41.9 Years.
What is the Average Family Size in Pulaski County
Average Family Size in Pulaski County is 3.2 People.
What is the Average Household Size in Pulaski County
Average Household Size in Pulaski County is 2.6 People.
What is Per Capita Income in Pulaski County?
Per Capita income in Pulaski County is $30,068.
What is the Median Family Income in Pulaski County?
Median Family Income in Pulaski County is $73,444.
What is the Median Household income in Pulaski County?
Median Household Income in Pulaski County is $56,823.
What is Income or Wage Gap in Pulaski County?
Income or Wage Gap in Pulaski County is 35.9%.
Women in Pulaski County earn 64.1 cents for every dollar earned by a man.
What is Family Income Deficit in Pulaski County?
Family Income Deficit in Pulaski County is $11,117.
Families that are below poverty line in Pulaski County earn $11,117 less on average than the poverty threshold level.
What is Inequality or Gini Index in Pulaski County?
Inequality or Gini Index in Pulaski County is 0.43.
How Large is the Labor Force in Pulaski County?
There are 6,227 People in the Labor Forcein in Pulaski County.
What is the Percentage of People in the Labor Force in Pulaski County?
61.9% of People are in the Labor Force in Pulaski County.
What is the Unemployment Rate in Pulaski County?
Unemployment Rate in Pulaski County is 3.8%.