Porter County, IN
Porter County Map

Porter County Overview
173,355
TOTAL POPULATION
86,060
MALE POPULATION
87,295
FEMALE POPULATION
98.59
MALES / 100 FEMALES
101.44
FEMALES / 100 MALES
40.1
MEDIAN AGE
3.0
AVG FAMILY SIZE
2.5
AVG HOUSEHOLD SIZE
$40,792
PER CAPITA INCOME
$98,081
AVG FAMILY INCOME
$82,915
AVG HOUSEHOLD INCOME
43.8%
WAGE / INCOME GAP [ % ]
56.2¢/ $1
WAGE / INCOME GAP [ $ ]
$10,032
FAMILY INCOME DEFICIT
0.43
INEQUALITY / GINI INDEX
87,314
LABOR FORCE [ PEOPLE ]
62.1%
PERCENT IN LABOR FORCE
4.2%
UNEMPLOYMENT RATE
Porter County Area Codes
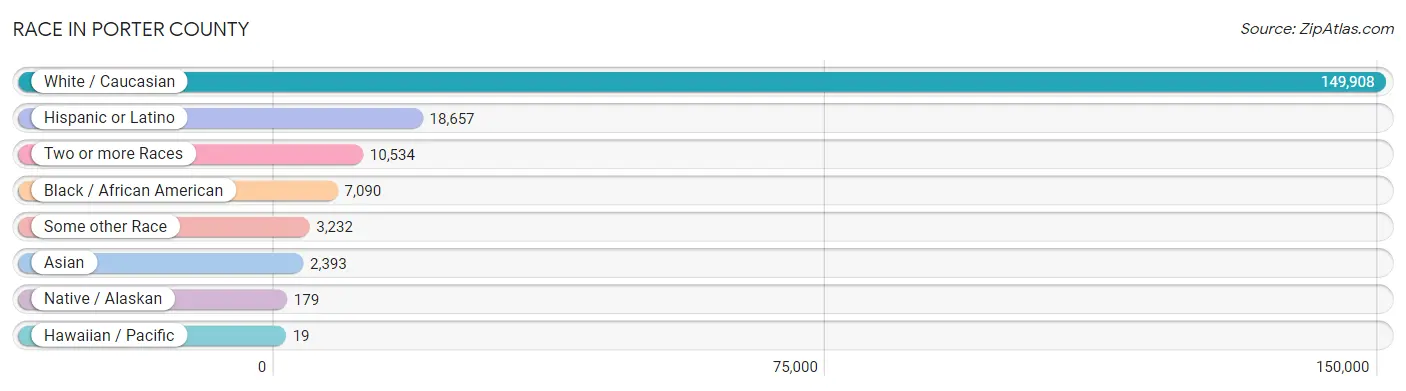
Race in Porter County
The most populous races in Porter County are White / Caucasian (149,908 | 86.5%), Hispanic or Latino (18,657 | 10.8%), and Two or more Races (10,534 | 6.1%).
| Race | # Population | % Population |
| Asian | 2,393 | 1.4% |
| Black / African American | 7,090 | 4.1% |
| Hawaiian / Pacific | 19 | 0.0% |
| Hispanic or Latino | 18,657 | 10.8% |
| Native / Alaskan | 179 | 0.1% |
| White / Caucasian | 149,908 | 86.5% |
| Two or more Races | 10,534 | 6.1% |
| Some other Race | 3,232 | 1.9% |
| Total | 173,355 | 100.0% |
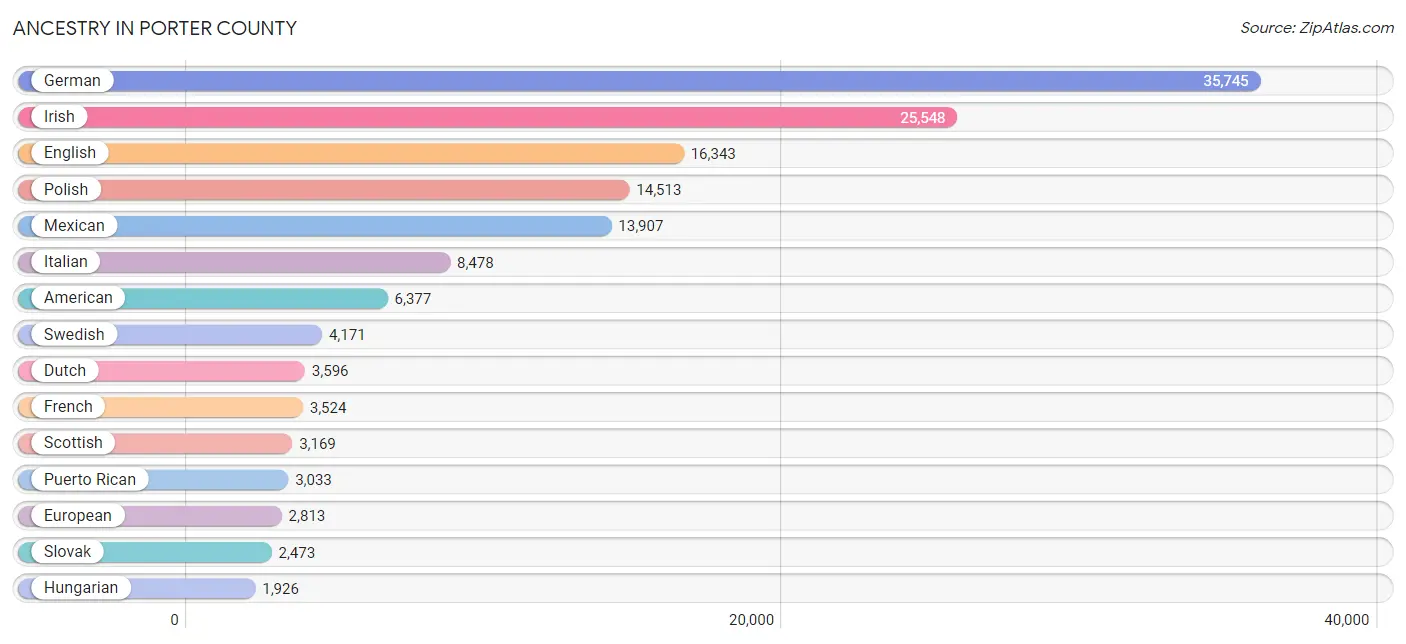
Ancestry in Porter County
The most populous ancestries reported in Porter County are German (35,745 | 20.6%), Irish (25,548 | 14.7%), English (16,343 | 9.4%), Polish (14,513 | 8.4%), and Mexican (13,907 | 8.0%), together accounting for 61.2% of all Porter County residents.
| Ancestry | # Population | % Population |
| African | 271 | 0.2% |
| Albanian | 26 | 0.0% |
| American | 6,377 | 3.7% |
| Apache | 30 | 0.0% |
| Arab | 391 | 0.2% |
| Argentinean | 19 | 0.0% |
| Armenian | 35 | 0.0% |
| Assyrian / Chaldean / Syriac | 7 | 0.0% |
| Australian | 4 | 0.0% |
| Austrian | 256 | 0.2% |
| Bahamian | 7 | 0.0% |
| Belgian | 177 | 0.1% |
| Bhutanese | 271 | 0.2% |
| Blackfeet | 57 | 0.0% |
| Bolivian | 11 | 0.0% |
| Brazilian | 91 | 0.1% |
| British | 941 | 0.5% |
| Bulgarian | 498 | 0.3% |
| Burmese | 319 | 0.2% |
| Cambodian | 15 | 0.0% |
| Canadian | 279 | 0.2% |
| Central American | 315 | 0.2% |
| Central American Indian | 83 | 0.1% |
| Cherokee | 403 | 0.2% |
| Chippewa | 33 | 0.0% |
| Choctaw | 78 | 0.0% |
| Colombian | 43 | 0.0% |
| Costa Rican | 15 | 0.0% |
| Creek | 33 | 0.0% |
| Croatian | 1,329 | 0.8% |
| Cuban | 148 | 0.1% |
| Czech | 1,542 | 0.9% |
| Czechoslovakian | 272 | 0.2% |
| Danish | 591 | 0.3% |
| Dominican | 98 | 0.1% |
| Dutch | 3,596 | 2.1% |
| Eastern European | 693 | 0.4% |
| Egyptian | 7 | 0.0% |
| English | 16,343 | 9.4% |
| European | 2,813 | 1.6% |
| Finnish | 359 | 0.2% |
| French | 3,524 | 2.0% |
| French Canadian | 556 | 0.3% |
| German | 35,745 | 20.6% |
| Greek | 1,780 | 1.0% |
| Guamanian / Chamorro | 81 | 0.1% |
| Guatemalan | 142 | 0.1% |
| Honduran | 121 | 0.1% |
| Hungarian | 1,926 | 1.1% |
| Indian (Asian) | 927 | 0.5% |
| Indonesian | 2 | 0.0% |
| Iranian | 7 | 0.0% |
| Irish | 25,548 | 14.7% |
| Iroquois | 22 | 0.0% |
| Italian | 8,478 | 4.9% |
| Jamaican | 28 | 0.0% |
| Japanese | 22 | 0.0% |
| Jordanian | 48 | 0.0% |
| Korean | 714 | 0.4% |
| Laotian | 15 | 0.0% |
| Latvian | 3 | 0.0% |
| Lebanese | 79 | 0.1% |
| Lithuanian | 810 | 0.5% |
| Luxembourger | 50 | 0.0% |
| Macedonian | 355 | 0.2% |
| Mexican | 13,907 | 8.0% |
| Mexican American Indian | 66 | 0.0% |
| Native Hawaiian | 42 | 0.0% |
| Navajo | 5 | 0.0% |
| Nicaraguan | 14 | 0.0% |
| Nigerian | 139 | 0.1% |
| Northern European | 60 | 0.0% |
| Norwegian | 1,584 | 0.9% |
| Osage | 2 | 0.0% |
| Paiute | 8 | 0.0% |
| Pakistani | 82 | 0.1% |
| Palestinian | 53 | 0.0% |
| Panamanian | 14 | 0.0% |
| Pennsylvania German | 35 | 0.0% |
| Peruvian | 129 | 0.1% |
| Polish | 14,513 | 8.4% |
| Portuguese | 114 | 0.1% |
| Puerto Rican | 3,033 | 1.8% |
| Romanian | 365 | 0.2% |
| Russian | 1,020 | 0.6% |
| Salvadoran | 9 | 0.0% |
| Scandinavian | 322 | 0.2% |
| Scotch-Irish | 1,327 | 0.8% |
| Scottish | 3,169 | 1.8% |
| Serbian | 1,421 | 0.8% |
| Sioux | 9 | 0.0% |
| Slavic | 120 | 0.1% |
| Slovak | 2,473 | 1.4% |
| Slovene | 93 | 0.1% |
| South American | 240 | 0.1% |
| Spaniard | 242 | 0.1% |
| Spanish | 365 | 0.2% |
| Sri Lankan | 166 | 0.1% |
| Subsaharan African | 495 | 0.3% |
| Swedish | 4,171 | 2.4% |
| Swiss | 491 | 0.3% |
| Syrian | 184 | 0.1% |
| Thai | 800 | 0.5% |
| Tongan | 39 | 0.0% |
| Turkish | 42 | 0.0% |
| Ugandan | 5 | 0.0% |
| Ukrainian | 448 | 0.3% |
| Venezuelan | 38 | 0.0% |
| Welsh | 706 | 0.4% |
| West Indian | 23 | 0.0% |
| Yugoslavian | 156 | 0.1% | View All 111 Rows |
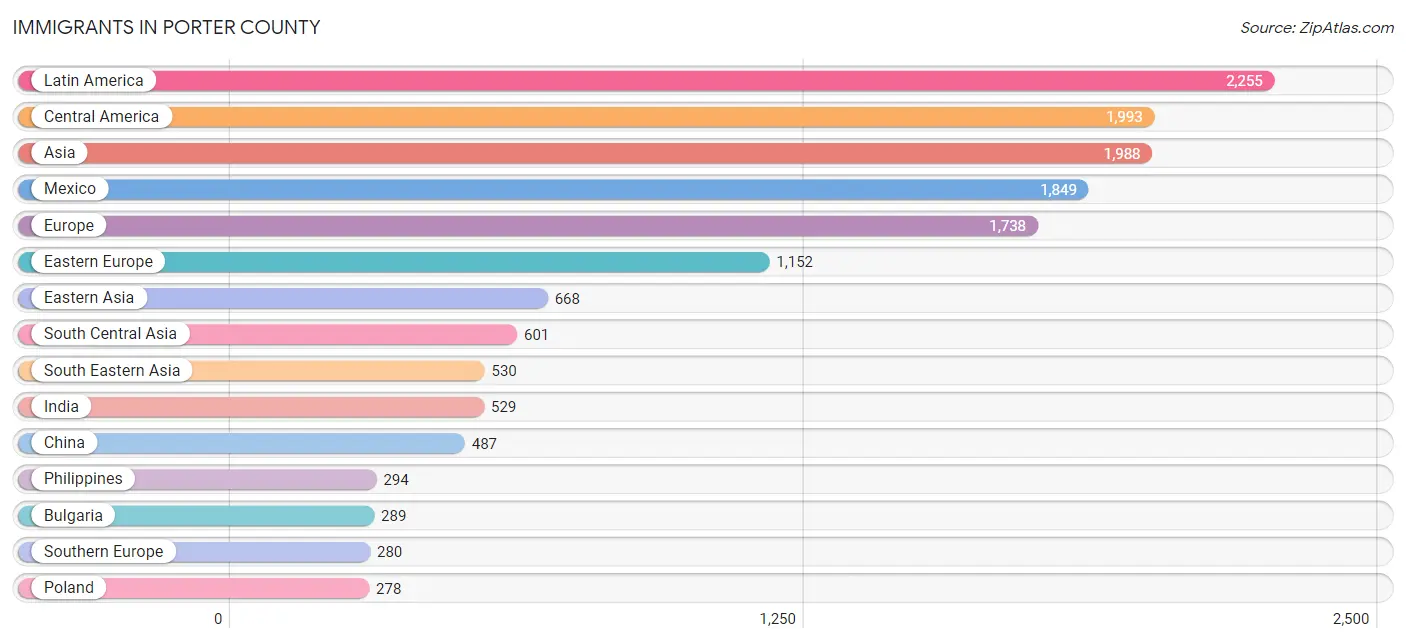
Immigrants in Porter County
The most numerous immigrant groups reported in Porter County came from Latin America (2,255 | 1.3%), Central America (1,993 | 1.1%), Asia (1,988 | 1.1%), Mexico (1,849 | 1.1%), and Europe (1,738 | 1.0%), together accounting for 5.7% of all Porter County residents.
| Immigration Origin | # Population | % Population |
| Africa | 105 | 0.1% |
| Argentina | 3 | 0.0% |
| Asia | 1,988 | 1.1% |
| Austria | 9 | 0.0% |
| Belgium | 45 | 0.0% |
| Bolivia | 11 | 0.0% |
| Bosnia and Herzegovina | 18 | 0.0% |
| Brazil | 54 | 0.0% |
| Bulgaria | 289 | 0.2% |
| Cambodia | 5 | 0.0% |
| Canada | 247 | 0.1% |
| Caribbean | 57 | 0.0% |
| Central America | 1,993 | 1.1% |
| China | 487 | 0.3% |
| Colombia | 13 | 0.0% |
| Croatia | 11 | 0.0% |
| Czechoslovakia | 10 | 0.0% |
| Dominican Republic | 14 | 0.0% |
| Eastern Africa | 14 | 0.0% |
| Eastern Asia | 668 | 0.4% |
| Eastern Europe | 1,152 | 0.7% |
| Egypt | 7 | 0.0% |
| El Salvador | 9 | 0.0% |
| England | 73 | 0.0% |
| Europe | 1,738 | 1.0% |
| France | 29 | 0.0% |
| Germany | 48 | 0.0% |
| Greece | 69 | 0.0% |
| Guatemala | 78 | 0.0% |
| Guyana | 4 | 0.0% |
| Honduras | 2 | 0.0% |
| Hong Kong | 65 | 0.0% |
| Hungary | 56 | 0.0% |
| India | 529 | 0.3% |
| Indonesia | 58 | 0.0% |
| Iran | 7 | 0.0% |
| Ireland | 2 | 0.0% |
| Italy | 116 | 0.1% |
| Jamaica | 43 | 0.0% |
| Japan | 40 | 0.0% |
| Jordan | 16 | 0.0% |
| Kazakhstan | 18 | 0.0% |
| Korea | 141 | 0.1% |
| Latin America | 2,255 | 1.3% |
| Lithuania | 45 | 0.0% |
| Malaysia | 14 | 0.0% |
| Mexico | 1,849 | 1.1% |
| Moldova | 12 | 0.0% |
| Netherlands | 6 | 0.0% |
| Nicaragua | 14 | 0.0% |
| Nigeria | 34 | 0.0% |
| North Macedonia | 18 | 0.0% |
| Northern Africa | 7 | 0.0% |
| Northern Europe | 167 | 0.1% |
| Oceania | 21 | 0.0% |
| Pakistan | 47 | 0.0% |
| Panama | 41 | 0.0% |
| Peru | 120 | 0.1% |
| Philippines | 294 | 0.2% |
| Poland | 278 | 0.2% |
| Romania | 34 | 0.0% |
| Russia | 55 | 0.0% |
| Saudi Arabia | 19 | 0.0% |
| Serbia | 66 | 0.0% |
| Singapore | 23 | 0.0% |
| South America | 205 | 0.1% |
| South Central Asia | 601 | 0.4% |
| South Eastern Asia | 530 | 0.3% |
| Southern Europe | 280 | 0.2% |
| Spain | 35 | 0.0% |
| Sweden | 4 | 0.0% |
| Syria | 103 | 0.1% |
| Thailand | 45 | 0.0% |
| Turkey | 42 | 0.0% |
| Uganda | 14 | 0.0% |
| Vietnam | 39 | 0.0% |
| Western Africa | 84 | 0.1% |
| Western Asia | 183 | 0.1% |
| Western Europe | 139 | 0.1% | View All 79 Rows |
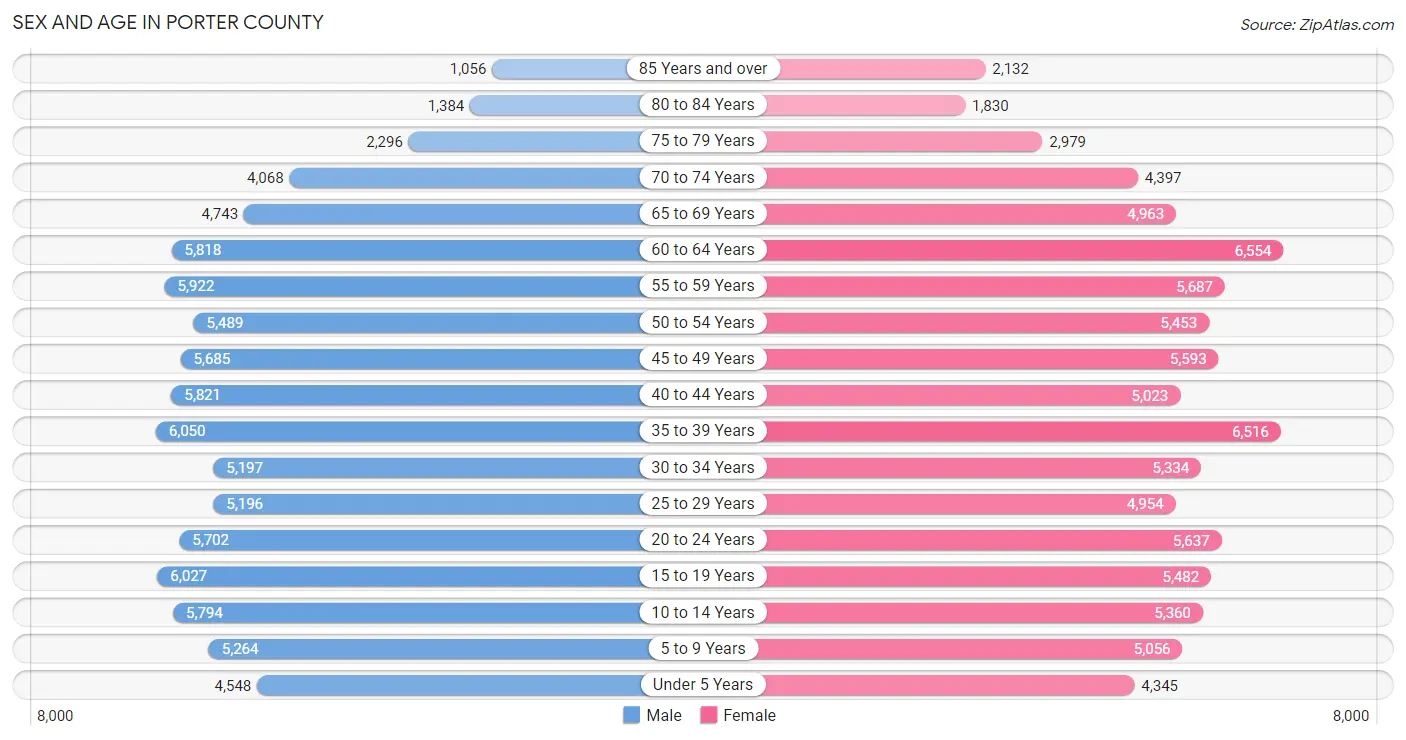
Sex and Age in Porter County
Sex and Age in Porter County
The most populous age groups in Porter County are 35 to 39 Years (6,050 | 7.0%) for men and 60 to 64 Years (6,554 | 7.5%) for women.
| Age Bracket | Male | Female |
| Under 5 Years | 4,548 (5.3%) | 4,345 (5.0%) |
| 5 to 9 Years | 5,264 (6.1%) | 5,056 (5.8%) |
| 10 to 14 Years | 5,794 (6.7%) | 5,360 (6.1%) |
| 15 to 19 Years | 6,027 (7.0%) | 5,482 (6.3%) |
| 20 to 24 Years | 5,702 (6.6%) | 5,637 (6.5%) |
| 25 to 29 Years | 5,196 (6.0%) | 4,954 (5.7%) |
| 30 to 34 Years | 5,197 (6.0%) | 5,334 (6.1%) |
| 35 to 39 Years | 6,050 (7.0%) | 6,516 (7.5%) |
| 40 to 44 Years | 5,821 (6.8%) | 5,023 (5.8%) |
| 45 to 49 Years | 5,685 (6.6%) | 5,593 (6.4%) |
| 50 to 54 Years | 5,489 (6.4%) | 5,453 (6.2%) |
| 55 to 59 Years | 5,922 (6.9%) | 5,687 (6.5%) |
| 60 to 64 Years | 5,818 (6.8%) | 6,554 (7.5%) |
| 65 to 69 Years | 4,743 (5.5%) | 4,963 (5.7%) |
| 70 to 74 Years | 4,068 (4.7%) | 4,397 (5.0%) |
| 75 to 79 Years | 2,296 (2.7%) | 2,979 (3.4%) |
| 80 to 84 Years | 1,384 (1.6%) | 1,830 (2.1%) |
| 85 Years and over | 1,056 (1.2%) | 2,132 (2.4%) |
| Total | 86,060 (100.0%) | 87,295 (100.0%) |
Families and Households in Porter County
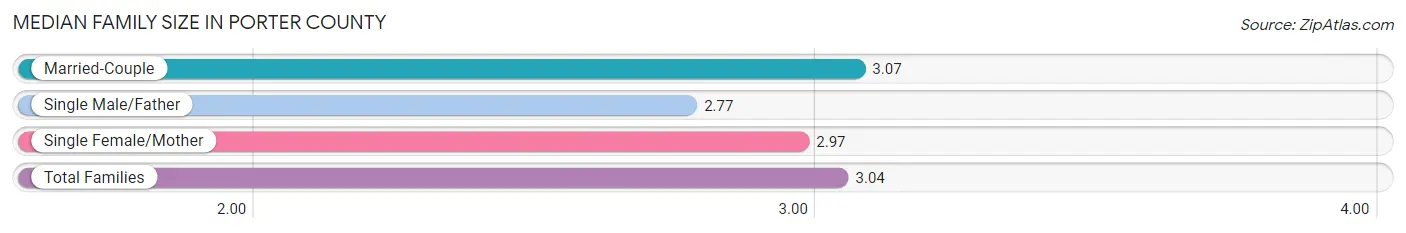
Median Family Size in Porter County
The median family size in Porter County is 3.04 persons per family, with married-couple families (36,263 | 79.7%) accounting for the largest median family size of 3.07 persons per family. On the other hand, single male/father families (3,132 | 6.9%) represent the smallest median family size with 2.77 persons per family.
| Family Type | # Families | Family Size |
| Married-Couple | 36,263 (79.7%) | 3.07 |
| Single Male/Father | 3,132 (6.9%) | 2.77 |
| Single Female/Mother | 6,111 (13.4%) | 2.97 |
| Total Families | 45,506 (100.0%) | 3.04 |
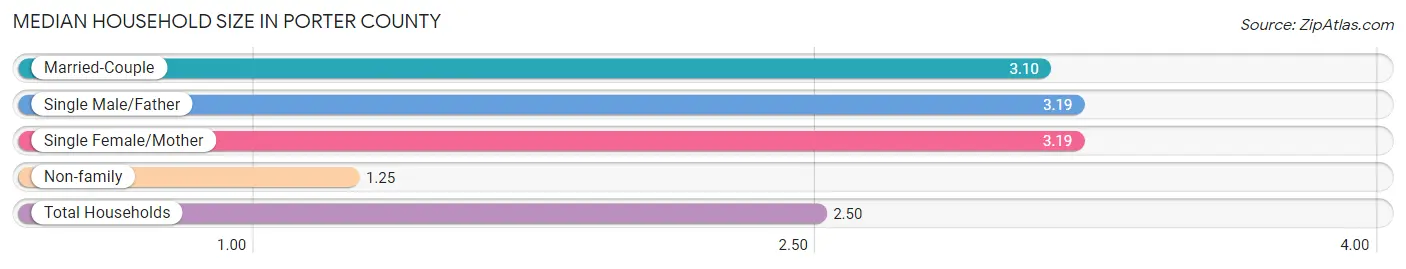
Median Household Size in Porter County
The median household size in Porter County is 2.50 persons per household, with single male/father households (3,132 | 4.6%) accounting for the largest median household size of 3.19 persons per household. non-family households (22,439 | 33.0%) represent the smallest median household size with 1.25 persons per household.
| Household Type | # Households | Household Size |
| Married-Couple | 36,263 (53.4%) | 3.10 |
| Single Male/Father | 3,132 (4.6%) | 3.19 |
| Single Female/Mother | 6,111 (9.0%) | 3.19 |
| Non-family | 22,439 (33.0%) | 1.25 |
| Total Households | 67,945 (100.0%) | 2.50 |
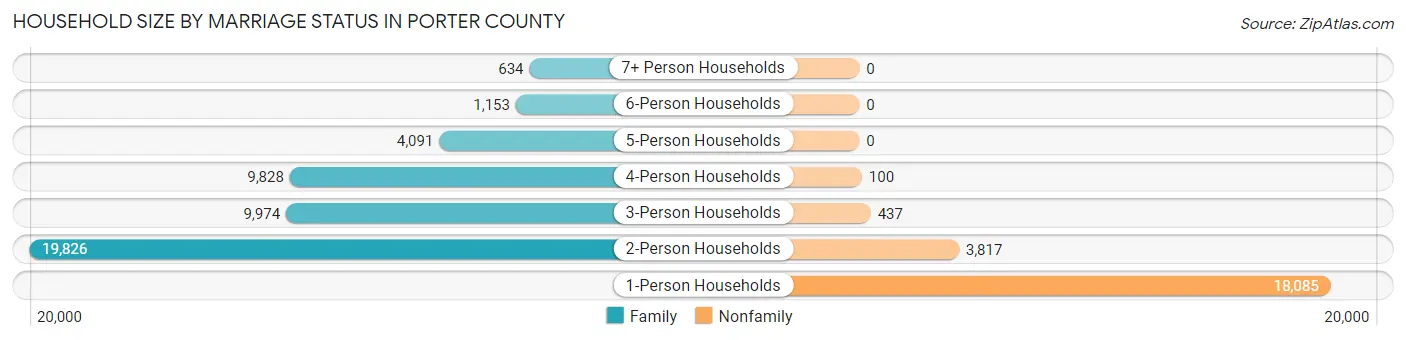
Household Size by Marriage Status in Porter County
Out of a total of 67,945 households in Porter County, 45,506 (67.0%) are family households, while 22,439 (33.0%) are nonfamily households. The most numerous type of family households are 2-person households, comprising 19,826, and the most common type of nonfamily households are 1-person households, comprising 18,085.
| Household Size | Family Households | Nonfamily Households |
| 1-Person Households | - | 18,085 (26.6%) |
| 2-Person Households | 19,826 (29.2%) | 3,817 (5.6%) |
| 3-Person Households | 9,974 (14.7%) | 437 (0.6%) |
| 4-Person Households | 9,828 (14.5%) | 100 (0.2%) |
| 5-Person Households | 4,091 (6.0%) | 0 (0.0%) |
| 6-Person Households | 1,153 (1.7%) | 0 (0.0%) |
| 7+ Person Households | 634 (0.9%) | 0 (0.0%) |
| Total | 45,506 (67.0%) | 22,439 (33.0%) |
Female Fertility in Porter County
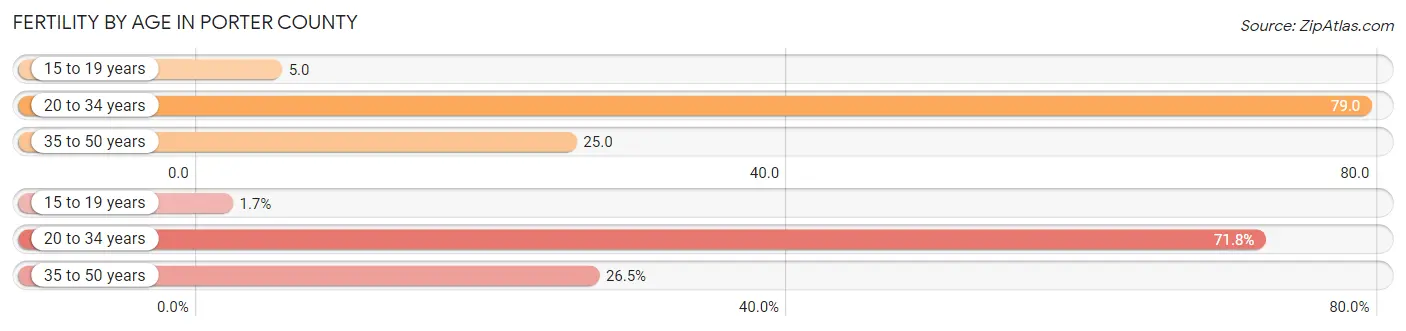
Fertility by Age in Porter County
Average fertility rate in Porter County is 44.0 births per 1,000 women. Women in the age bracket of 20 to 34 years have the highest fertility rate with 79.0 births per 1,000 women. Women in the age bracket of 20 to 34 years acount for 71.8% of all women with births.
| Age Bracket | Women with Births | Births / 1,000 Women |
| 15 to 19 years | 29 (1.7%) | 5.0 |
| 20 to 34 years | 1,256 (71.8%) | 79.0 |
| 35 to 50 years | 464 (26.5%) | 25.0 |
| Total | 1,749 (100.0%) | 44.0 |
Fertility by Age by Marriage Status in Porter County
81.0% of women with births (1,749) in Porter County are married. The highest percentage of unmarried women with births falls into 20 to 34 years age bracket with 24.6% of them unmarried at the time of birth, while the lowest percentage of unmarried women with births belong to 35 to 50 years age bracket with 4.1% of them unmarried.
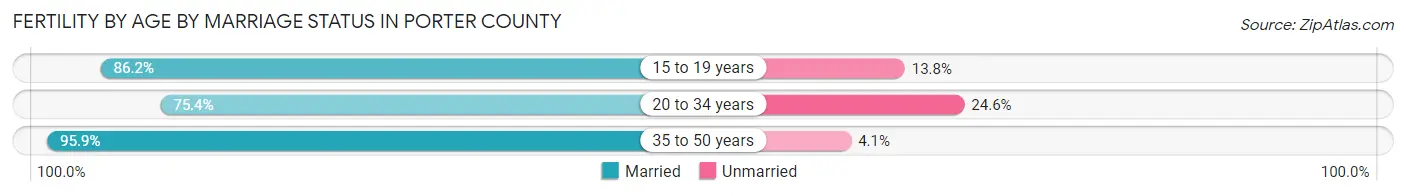
| Age Bracket | Married | Unmarried |
| 15 to 19 years | 25 (86.2%) | 4 (13.8%) |
| 20 to 34 years | 947 (75.4%) | 309 (24.6%) |
| 35 to 50 years | 445 (95.9%) | 19 (4.1%) |
| Total | 1,417 (81.0%) | 332 (19.0%) |
Fertility by Education in Porter County
Average fertility rate in Porter County is 44.0 births per 1,000 women. Women with the education attainment of graduate degree have the highest fertility rate of 83.0 births per 1,000 women, while women with the education attainment of less than high school have the lowest fertility at 27.0 births per 1,000 women. Women with the education attainment of college or associate's degree represent 25.8% of all women with births.
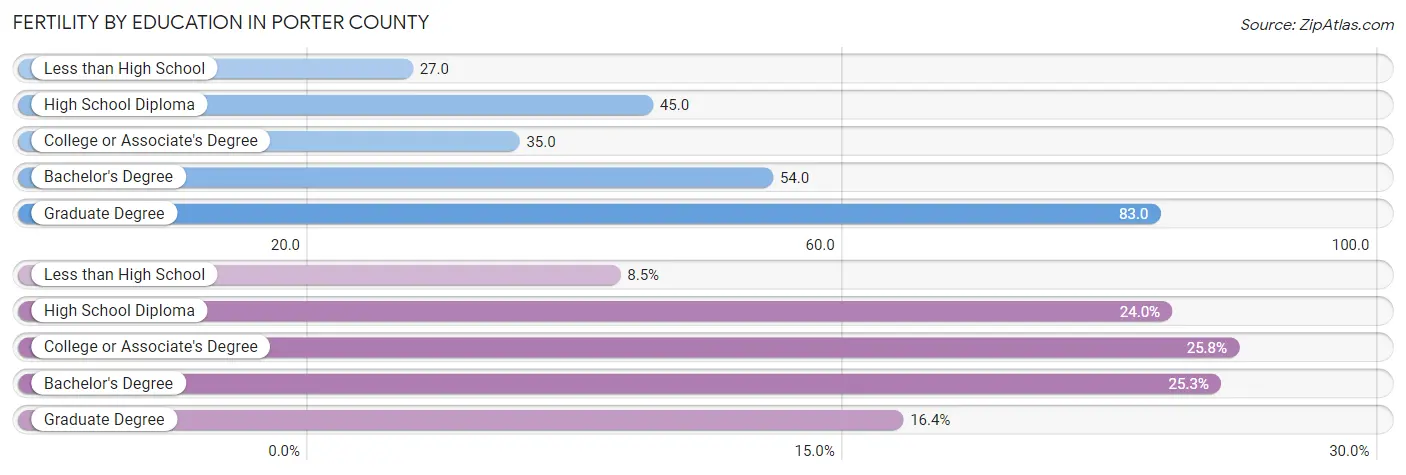
| Educational Attainment | Women with Births | Births / 1,000 Women |
| Less than High School | 148 (8.5%) | 27.0 |
| High School Diploma | 419 (24.0%) | 45.0 |
| College or Associate's Degree | 452 (25.8%) | 35.0 |
| Bachelor's Degree | 443 (25.3%) | 54.0 |
| Graduate Degree | 287 (16.4%) | 83.0 |
| Total | 1,749 (100.0%) | 44.0 |
Fertility by Education by Marriage Status in Porter County
19.0% of women with births in Porter County are unmarried. Women with the educational attainment of graduate degree are most likely to be married with 100.0% of them married at childbirth, while women with the educational attainment of less than high school are least likely to be married with 44.6% of them unmarried at childbirth.
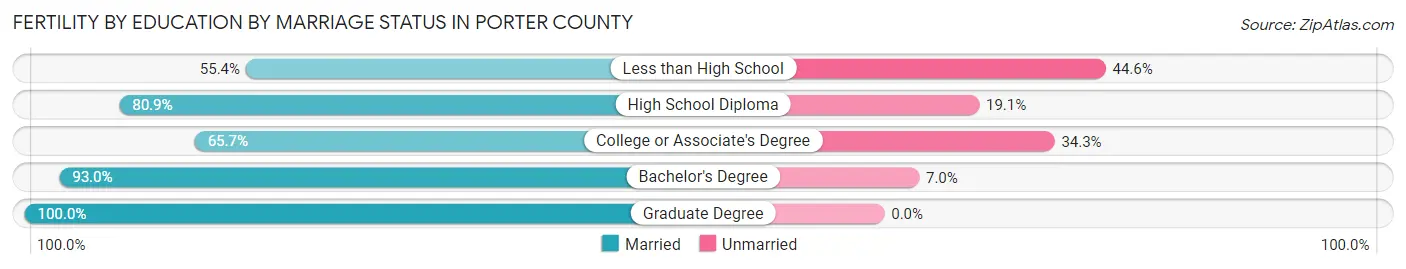
| Educational Attainment | Married | Unmarried |
| Less than High School | 82 (55.4%) | 66 (44.6%) |
| High School Diploma | 339 (80.9%) | 80 (19.1%) |
| College or Associate's Degree | 297 (65.7%) | 155 (34.3%) |
| Bachelor's Degree | 412 (93.0%) | 31 (7.0%) |
| Graduate Degree | 287 (100.0%) | 0 (0.0%) |
| Total | 1,417 (81.0%) | 332 (19.0%) |
Income in Porter County
Income Overview in Porter County
Per Capita Income in Porter County is $40,792, while median incomes of families and households are $98,081 and $82,915 respectively.
| Characteristic | Number | Measure |
| Per Capita Income | 173,355 | $40,792 |
| Median Family Income | 45,506 | $98,081 |
| Mean Family Income | 45,506 | $117,276 |
| Median Household Income | 67,945 | $82,915 |
| Mean Household Income | 67,945 | $102,269 |
| Income Deficit | 45,506 | $10,032 |
| Wage / Income Gap (%) | 173,355 | 43.79% |
| Wage / Income Gap ($) | 173,355 | 56.21¢ per $1 |
| Gini / Inequality Index | 173,355 | 0.43 |
Earnings by Sex in Porter County
Average Earnings in Porter County are $44,257, $58,683 for men and $32,987 for women, a difference of 43.8%.
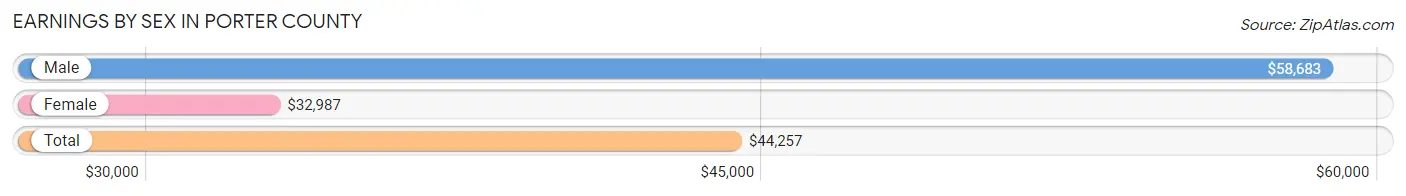
| Sex | Number | Average Earnings |
| Male | 49,391 (53.7%) | $58,683 |
| Female | 42,612 (46.3%) | $32,987 |
| Total | 92,003 (100.0%) | $44,257 |
Earnings by Sex by Income Bracket in Porter County
The most common earnings brackets in Porter County are $100,000+ for men (11,649 | 23.6%) and $75,000 to $99,999 for women (3,308 | 7.8%).
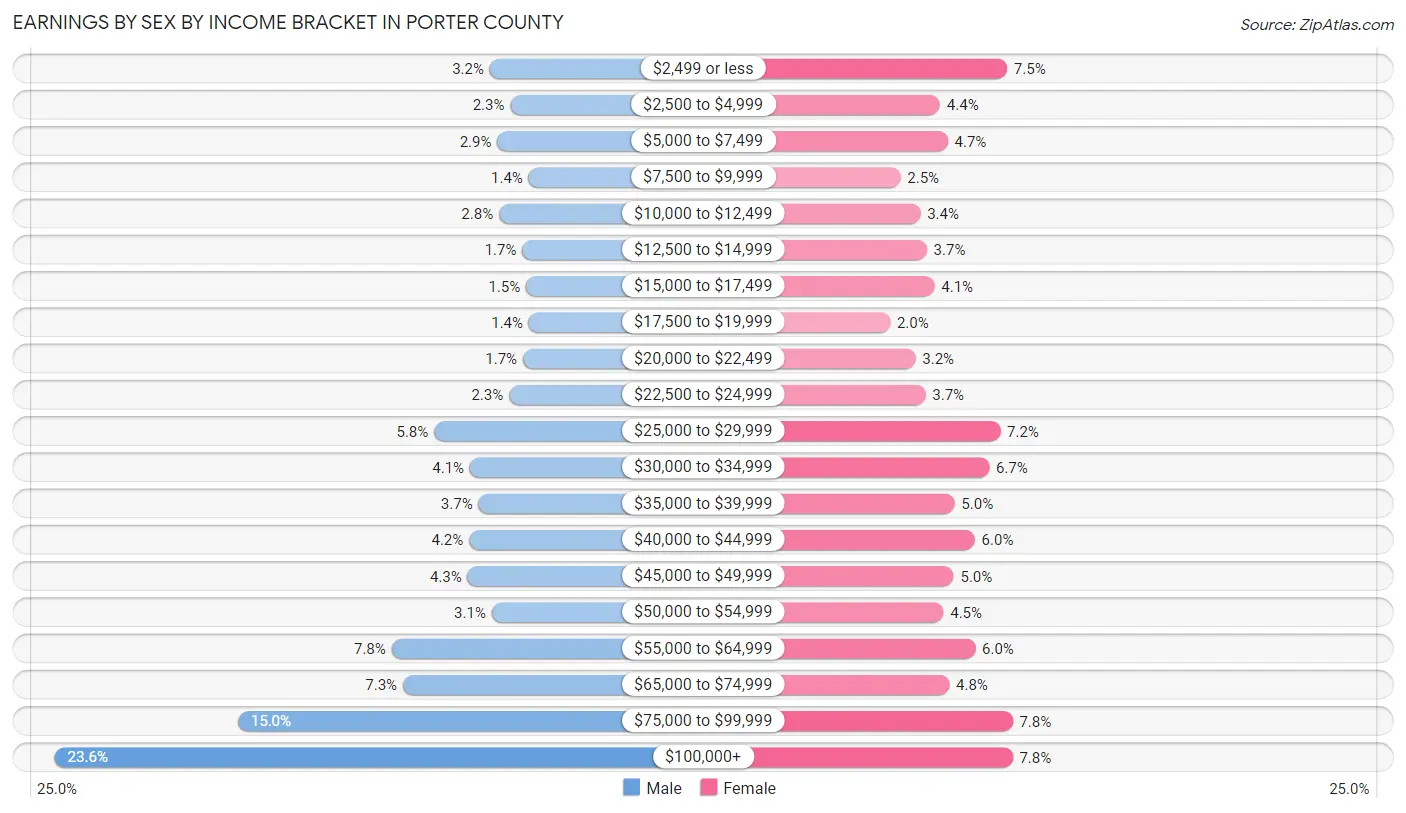
| Income | Male | Female |
| $2,499 or less | 1,587 (3.2%) | 3,195 (7.5%) |
| $2,500 to $4,999 | 1,112 (2.2%) | 1,860 (4.4%) |
| $5,000 to $7,499 | 1,415 (2.9%) | 2,012 (4.7%) |
| $7,500 to $9,999 | 689 (1.4%) | 1,070 (2.5%) |
| $10,000 to $12,499 | 1,374 (2.8%) | 1,467 (3.4%) |
| $12,500 to $14,999 | 837 (1.7%) | 1,595 (3.7%) |
| $15,000 to $17,499 | 745 (1.5%) | 1,748 (4.1%) |
| $17,500 to $19,999 | 680 (1.4%) | 860 (2.0%) |
| $20,000 to $22,499 | 822 (1.7%) | 1,366 (3.2%) |
| $22,500 to $24,999 | 1,139 (2.3%) | 1,569 (3.7%) |
| $25,000 to $29,999 | 2,877 (5.8%) | 3,060 (7.2%) |
| $30,000 to $34,999 | 2,046 (4.1%) | 2,838 (6.7%) |
| $35,000 to $39,999 | 1,847 (3.7%) | 2,148 (5.0%) |
| $40,000 to $44,999 | 2,063 (4.2%) | 2,552 (6.0%) |
| $45,000 to $49,999 | 2,099 (4.3%) | 2,132 (5.0%) |
| $50,000 to $54,999 | 1,542 (3.1%) | 1,925 (4.5%) |
| $55,000 to $64,999 | 3,858 (7.8%) | 2,560 (6.0%) |
| $65,000 to $74,999 | 3,596 (7.3%) | 2,042 (4.8%) |
| $75,000 to $99,999 | 7,414 (15.0%) | 3,308 (7.8%) |
| $100,000+ | 11,649 (23.6%) | 3,305 (7.8%) |
| Total | 49,391 (100.0%) | 42,612 (100.0%) |
Earnings by Sex by Educational Attainment in Porter County
Average earnings in Porter County are $68,374 for men and $38,404 for women, a difference of 43.8%. Men with an educational attainment of graduate degree enjoy the highest average annual earnings of $91,886, while those with less than high school education earn the least with $45,633. Women with an educational attainment of graduate degree earn the most with the average annual earnings of $69,775, while those with less than high school education have the smallest earnings of $15,256.
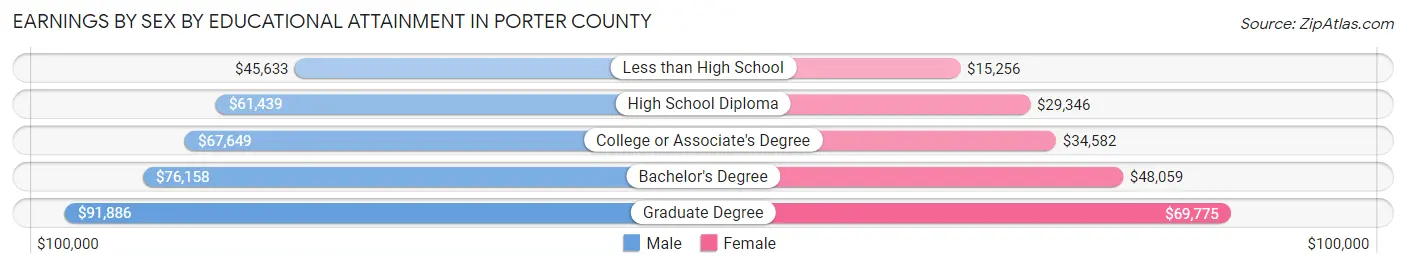
| Educational Attainment | Male Income | Female Income |
| Less than High School | $45,633 | $15,256 |
| High School Diploma | $61,439 | $29,346 |
| College or Associate's Degree | $67,649 | $34,582 |
| Bachelor's Degree | $76,158 | $48,059 |
| Graduate Degree | $91,886 | $69,775 |
| Total | $68,374 | $38,404 |
Family Income in Porter County
Family Income Brackets in Porter County
According to the Porter County family income data, there are 11,103 families falling into the $100,000 to $149,999 income range, which is the most common income bracket and makes up 24.4% of all families. Conversely, the $10,000 to $14,999 income bracket is the least frequent group with only 546 families (1.2%) belonging to this category.
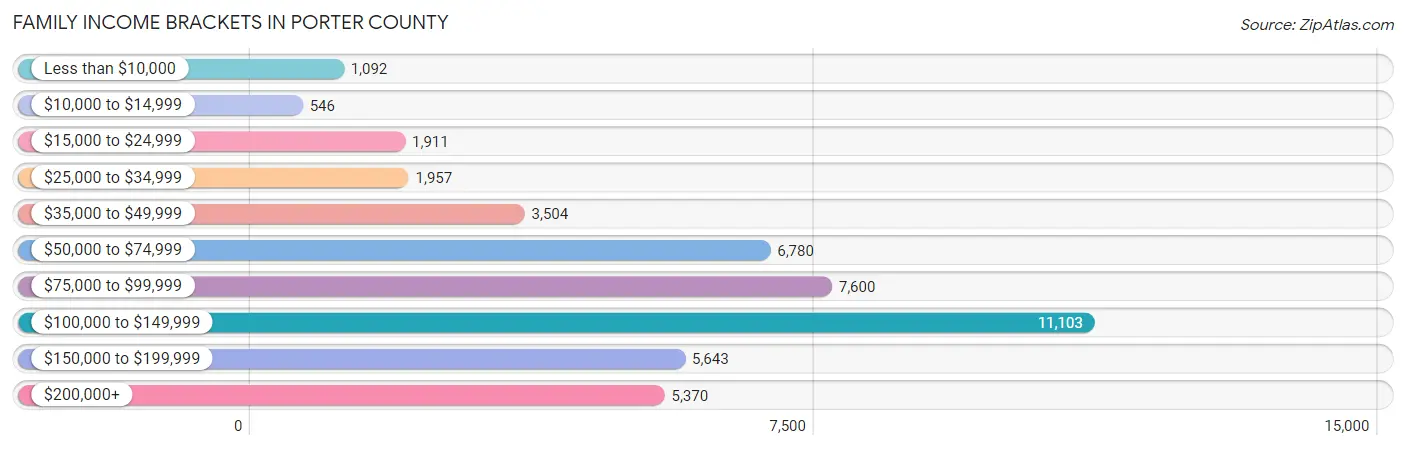
| Income Bracket | # Families | % Families |
| Less than $10,000 | 1,092 | 2.4% |
| $10,000 to $14,999 | 546 | 1.2% |
| $15,000 to $24,999 | 1,911 | 4.2% |
| $25,000 to $34,999 | 1,957 | 4.3% |
| $35,000 to $49,999 | 3,504 | 7.7% |
| $50,000 to $74,999 | 6,780 | 14.9% |
| $75,000 to $99,999 | 7,600 | 16.7% |
| $100,000 to $149,999 | 11,103 | 24.4% |
| $150,000 to $199,999 | 5,643 | 12.4% |
| $200,000+ | 5,370 | 11.8% |
Family Income by Famaliy Size in Porter County
5-person families (3,723 | 8.2%) account for the highest median family income in Porter County with $122,026 per family, while 2-person families (20,925 | 46.0%) have the highest median income of $42,237 per family member.
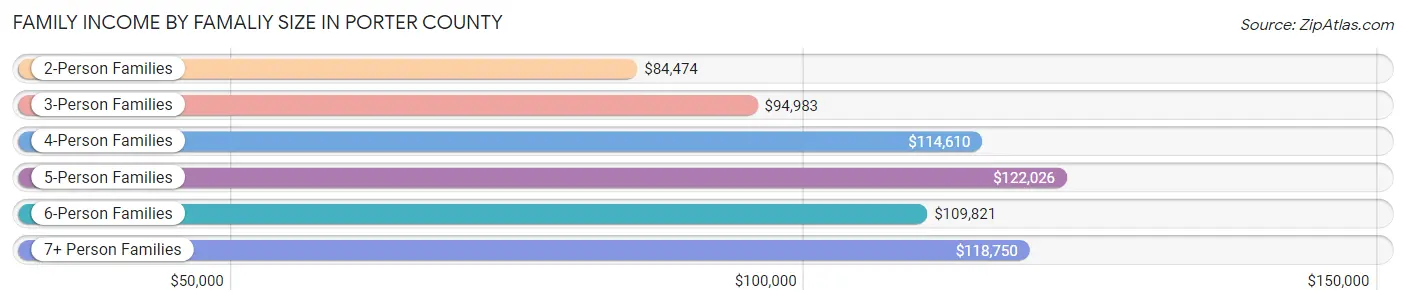
| Income Bracket | # Families | Median Income |
| 2-Person Families | 20,925 (46.0%) | $84,474 |
| 3-Person Families | 9,928 (21.8%) | $94,983 |
| 4-Person Families | 9,375 (20.6%) | $114,610 |
| 5-Person Families | 3,723 (8.2%) | $122,026 |
| 6-Person Families | 1,036 (2.3%) | $109,821 |
| 7+ Person Families | 519 (1.1%) | $118,750 |
| Total | 45,506 (100.0%) | $98,081 |
Family Income by Number of Earners in Porter County
The median family income in Porter County is $98,081, with families comprising 3+ earners (4,790) having the highest median family income of $157,402, while families with no earners (7,593) have the lowest median family income of $56,098, accounting for 10.5% and 16.7% of families, respectively.
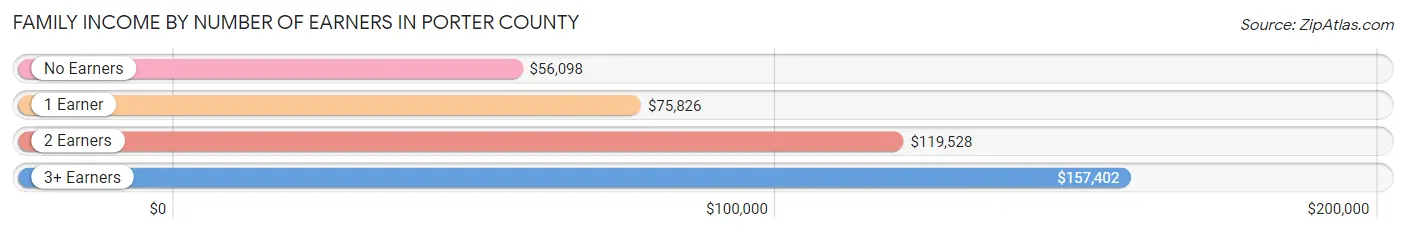
| Number of Earners | # Families | Median Income |
| No Earners | 7,593 (16.7%) | $56,098 |
| 1 Earner | 13,995 (30.7%) | $75,826 |
| 2 Earners | 19,128 (42.0%) | $119,528 |
| 3+ Earners | 4,790 (10.5%) | $157,402 |
| Total | 45,506 (100.0%) | $98,081 |
Household Income in Porter County
Household Income Brackets in Porter County
With 14,268 households falling in the category, the $100,000 to $149,999 income range is the most frequent in Porter County, accounting for 21.0% of all households. In contrast, only 1,495 households (2.2%) fall into the $10,000 to $14,999 income bracket, making it the least populous group.
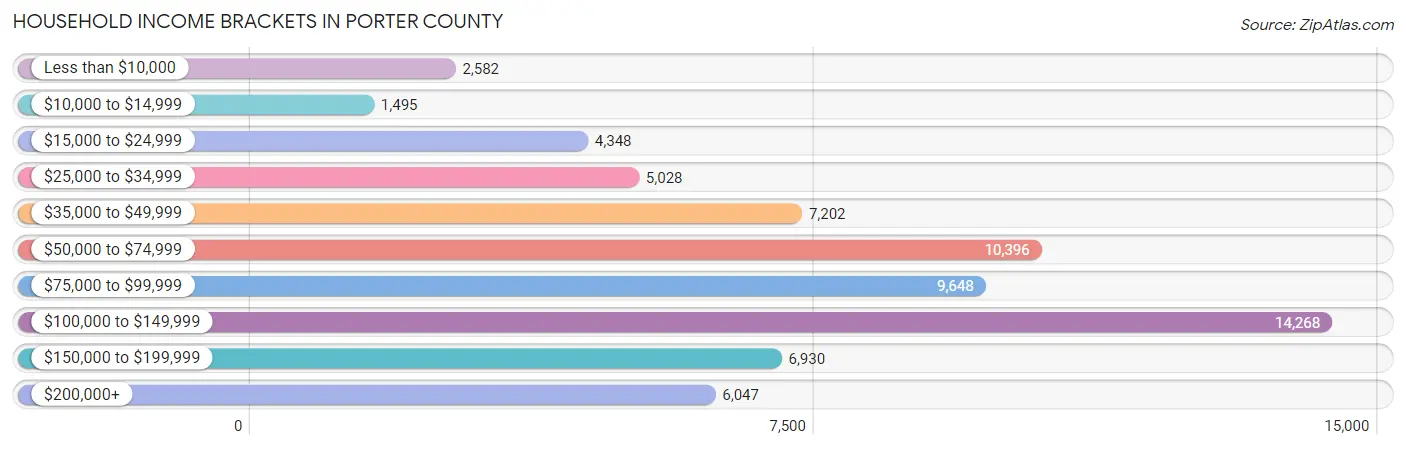
| Income Bracket | # Households | % Households |
| Less than $10,000 | 2,582 | 3.8% |
| $10,000 to $14,999 | 1,495 | 2.2% |
| $15,000 to $24,999 | 4,348 | 6.4% |
| $25,000 to $34,999 | 5,028 | 7.4% |
| $35,000 to $49,999 | 7,202 | 10.6% |
| $50,000 to $74,999 | 10,396 | 15.3% |
| $75,000 to $99,999 | 9,648 | 14.2% |
| $100,000 to $149,999 | 14,268 | 21.0% |
| $150,000 to $199,999 | 6,930 | 10.2% |
| $200,000+ | 6,047 | 8.9% |
Household Income by Householder Age in Porter County
The median household income in Porter County is $82,915, with the highest median household income of $98,405 found in the 45 to 64 years age bracket for the primary householder. A total of 26,442 households (38.9%) fall into this category. Meanwhile, the 15 to 24 years age bracket for the primary householder has the lowest median household income of $39,110, with 2,280 households (3.4%) in this group.
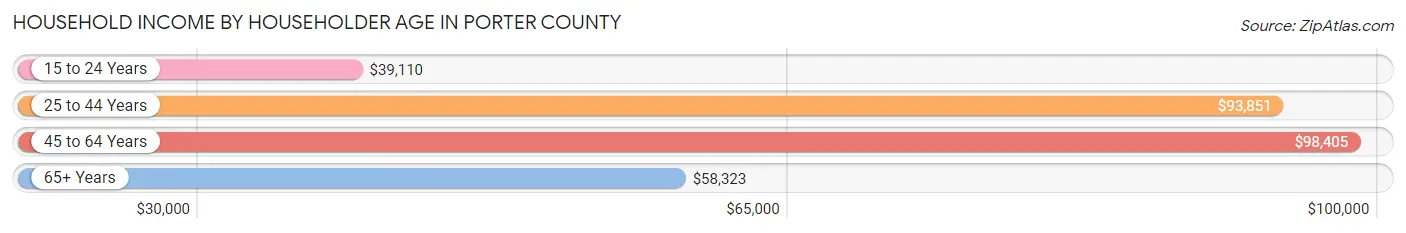
| Income Bracket | # Households | Median Income |
| 15 to 24 Years | 2,280 (3.4%) | $39,110 |
| 25 to 44 Years | 21,189 (31.2%) | $93,851 |
| 45 to 64 Years | 26,442 (38.9%) | $98,405 |
| 65+ Years | 18,034 (26.5%) | $58,323 |
| Total | 67,945 (100.0%) | $82,915 |
Poverty in Porter County
Income Below Poverty by Sex and Age in Porter County
With 8.0% poverty level for males and 10.6% for females among the residents of Porter County, 15 year old males and 18 to 24 year old females are the most vulnerable to poverty, with 162 males (15.1%) and 1,301 females (19.8%) in their respective age groups living below the poverty level.
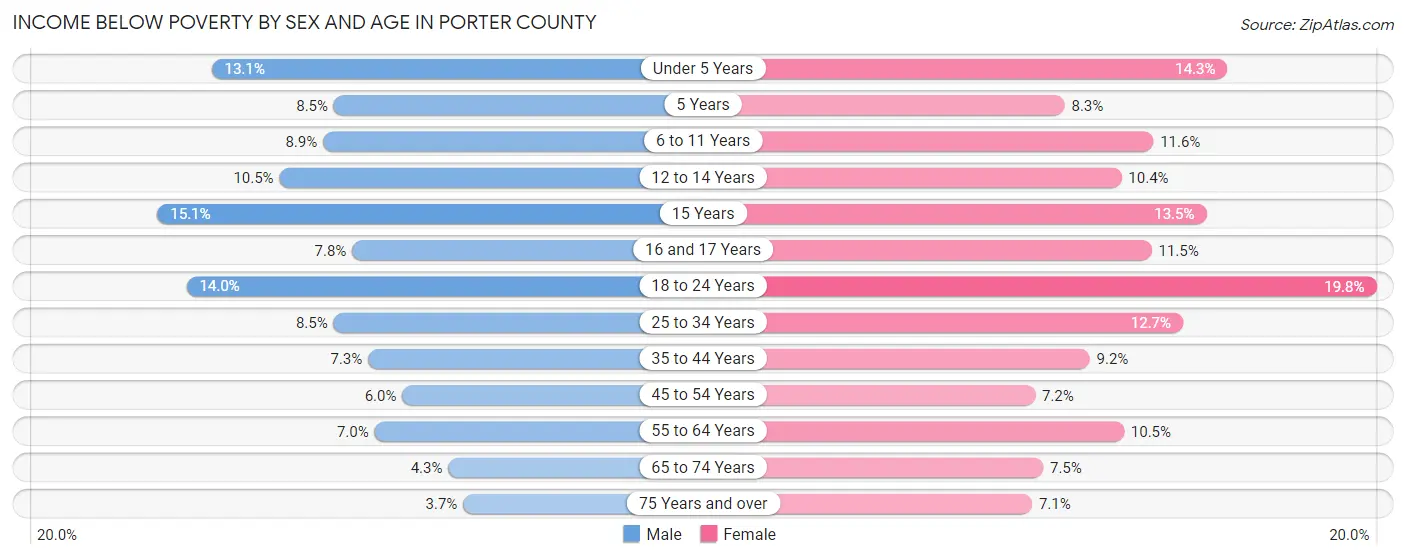
| Age Bracket | Male | Female |
| Under 5 Years | 565 (13.1%) | 618 (14.3%) |
| 5 Years | 84 (8.5%) | 73 (8.3%) |
| 6 to 11 Years | 552 (8.9%) | 734 (11.6%) |
| 12 to 14 Years | 391 (10.5%) | 324 (10.4%) |
| 15 Years | 162 (15.1%) | 177 (13.5%) |
| 16 and 17 Years | 201 (7.8%) | 248 (11.5%) |
| 18 to 24 Years | 1,036 (14.0%) | 1,301 (19.8%) |
| 25 to 34 Years | 878 (8.5%) | 1,301 (12.7%) |
| 35 to 44 Years | 856 (7.2%) | 1,061 (9.2%) |
| 45 to 54 Years | 665 (6.0%) | 788 (7.2%) |
| 55 to 64 Years | 813 (7.0%) | 1,277 (10.5%) |
| 65 to 74 Years | 370 (4.3%) | 689 (7.5%) |
| 75 Years and over | 167 (3.7%) | 448 (7.1%) |
| Total | 6,740 (8.0%) | 9,039 (10.6%) |
Income Above Poverty by Sex and Age in Porter County
According to the poverty statistics in Porter County, males aged 75 years and over and females aged 75 years and over are the age groups that are most secure financially, with 96.3% of males and 92.9% of females in these age groups living above the poverty line.
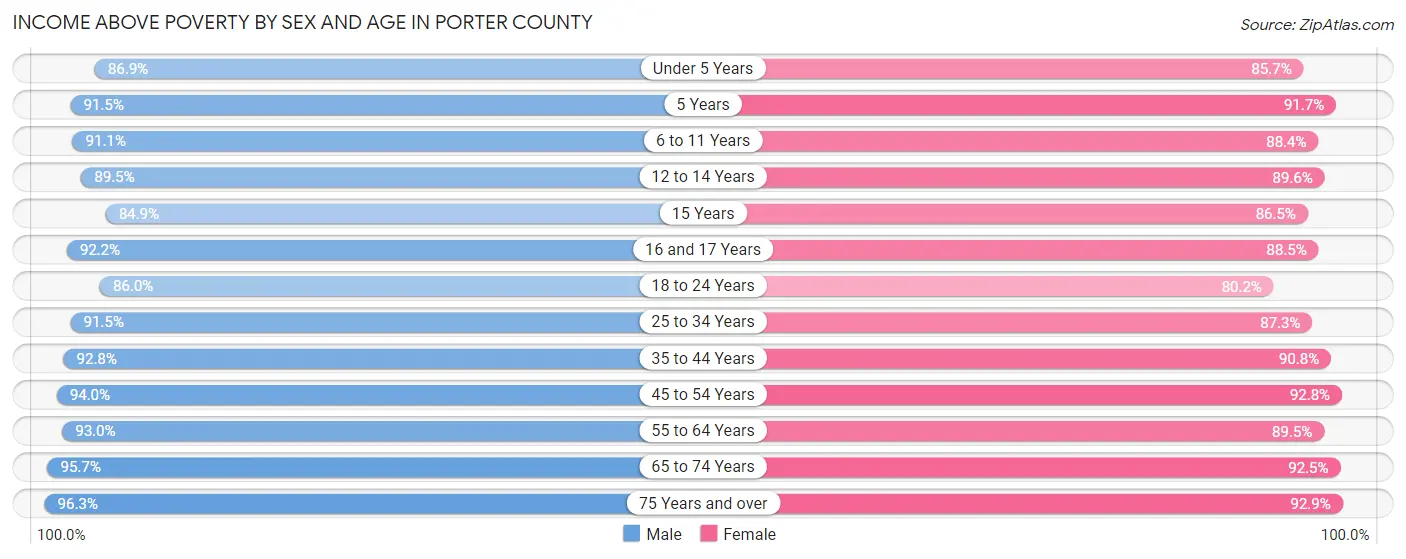
| Age Bracket | Male | Female |
| Under 5 Years | 3,762 (86.9%) | 3,700 (85.7%) |
| 5 Years | 902 (91.5%) | 810 (91.7%) |
| 6 to 11 Years | 5,633 (91.1%) | 5,613 (88.4%) |
| 12 to 14 Years | 3,320 (89.5%) | 2,798 (89.6%) |
| 15 Years | 913 (84.9%) | 1,131 (86.5%) |
| 16 and 17 Years | 2,362 (92.2%) | 1,908 (88.5%) |
| 18 to 24 Years | 6,368 (86.0%) | 5,257 (80.2%) |
| 25 to 34 Years | 9,416 (91.5%) | 8,979 (87.3%) |
| 35 to 44 Years | 10,955 (92.7%) | 10,472 (90.8%) |
| 45 to 54 Years | 10,463 (94.0%) | 10,208 (92.8%) |
| 55 to 64 Years | 10,786 (93.0%) | 10,921 (89.5%) |
| 65 to 74 Years | 8,295 (95.7%) | 8,539 (92.5%) |
| 75 Years and over | 4,326 (96.3%) | 5,900 (92.9%) |
| Total | 77,501 (92.0%) | 76,236 (89.4%) |
Income Below Poverty Among Married-Couple Families in Porter County
The poverty statistics for married-couple families in Porter County show that 3.0% or 1,102 of the total 36,263 families live below the poverty line. Families with 3 or 4 children have the highest poverty rate of 7.9%, comprising of 233 families. On the other hand, families with 5 or more children have the lowest poverty rate of 0.0%, which includes 0 families.
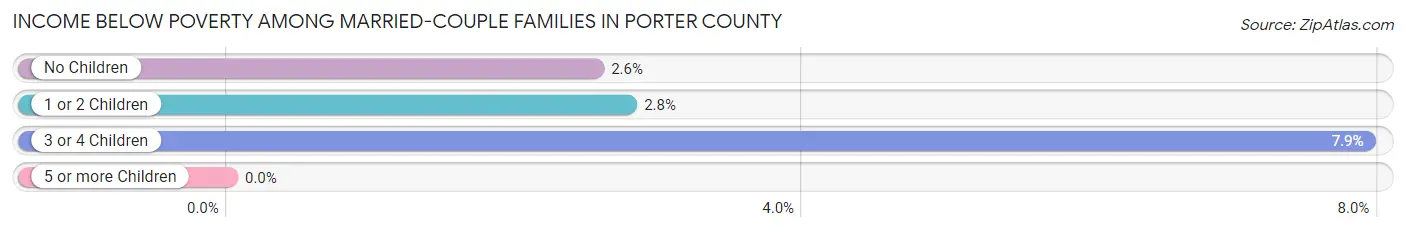
| Children | Above Poverty | Below Poverty |
| No Children | 20,676 (97.5%) | 540 (2.5%) |
| 1 or 2 Children | 11,525 (97.2%) | 329 (2.8%) |
| 3 or 4 Children | 2,710 (92.1%) | 233 (7.9%) |
| 5 or more Children | 250 (100.0%) | 0 (0.0%) |
| Total | 35,161 (97.0%) | 1,102 (3.0%) |
Income Below Poverty Among Single-Parent Households in Porter County
According to the poverty data in Porter County, 15.0% or 469 single-father households and 27.3% or 1,666 single-mother households are living below the poverty line. Among single-father households, those with 3 or 4 children have the highest poverty rate, with 67 households (21.3%) experiencing poverty. Likewise, among single-mother households, those with 3 or 4 children have the highest poverty rate, with 312 households (50.4%) falling below the poverty line.
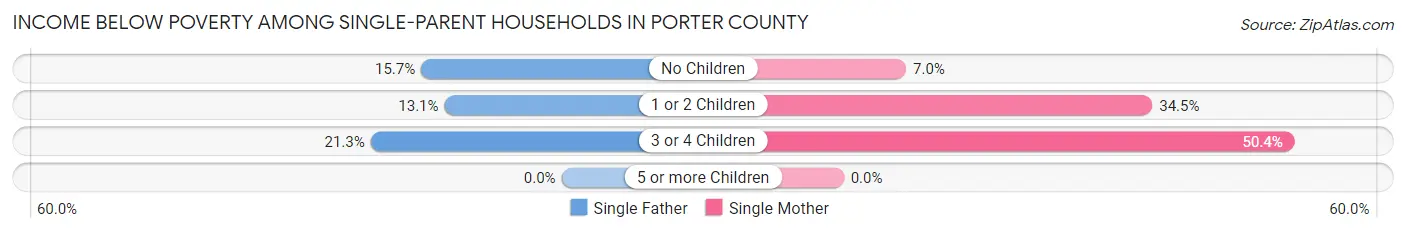
| Children | Single Father | Single Mother |
| No Children | 200 (15.7%) | 137 (7.0%) |
| 1 or 2 Children | 202 (13.1%) | 1,217 (34.5%) |
| 3 or 4 Children | 67 (21.3%) | 312 (50.4%) |
| 5 or more Children | 0 (0.0%) | 0 (0.0%) |
| Total | 469 (15.0%) | 1,666 (27.3%) |
Income Below Poverty Among Married-Couple vs Single-Parent Households in Porter County
The poverty data for Porter County shows that 1,102 of the married-couple family households (3.0%) and 2,135 of the single-parent households (23.1%) are living below the poverty level. Within the married-couple family households, those with 3 or 4 children have the highest poverty rate, with 233 households (7.9%) falling below the poverty line. Among the single-parent households, those with 3 or 4 children have the highest poverty rate, with 379 household (40.6%) living below poverty.
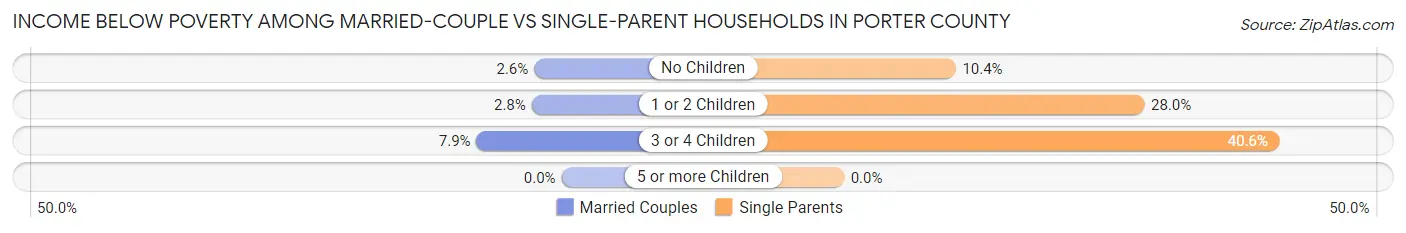
| Children | Married-Couple Families | Single-Parent Households |
| No Children | 540 (2.5%) | 337 (10.4%) |
| 1 or 2 Children | 329 (2.8%) | 1,419 (28.0%) |
| 3 or 4 Children | 233 (7.9%) | 379 (40.6%) |
| 5 or more Children | 0 (0.0%) | 0 (0.0%) |
| Total | 1,102 (3.0%) | 2,135 (23.1%) |
Employment Characteristics in Porter County
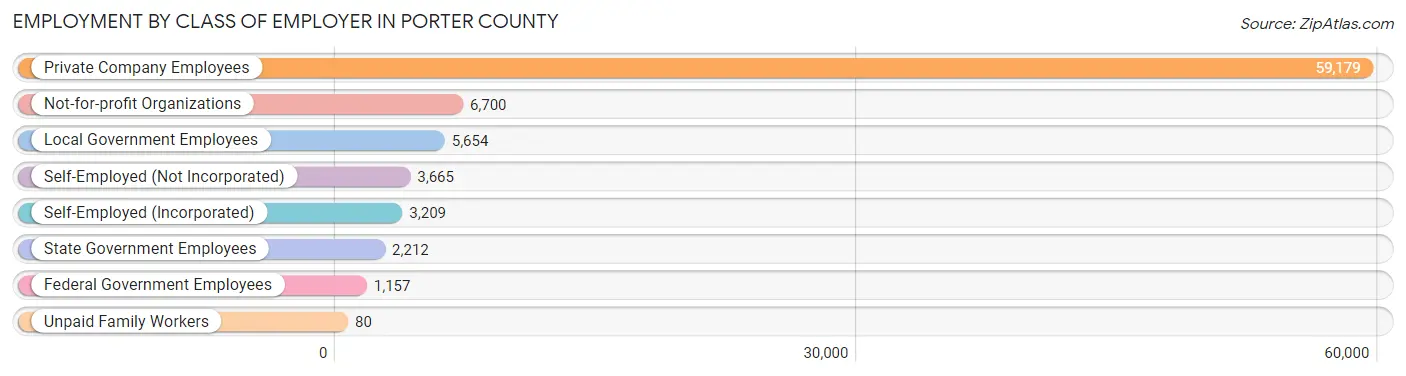
Employment by Class of Employer in Porter County
Among the 81,856 employed individuals in Porter County, private company employees (59,179 | 72.3%), not-for-profit organizations (6,700 | 8.2%), and local government employees (5,654 | 6.9%) make up the most common classes of employment.
| Employer Class | # Employees | % Employees |
| Private Company Employees | 59,179 | 72.3% |
| Self-Employed (Incorporated) | 3,209 | 3.9% |
| Self-Employed (Not Incorporated) | 3,665 | 4.5% |
| Not-for-profit Organizations | 6,700 | 8.2% |
| Local Government Employees | 5,654 | 6.9% |
| State Government Employees | 2,212 | 2.7% |
| Federal Government Employees | 1,157 | 1.4% |
| Unpaid Family Workers | 80 | 0.1% |
| Total | 81,856 | 100.0% |
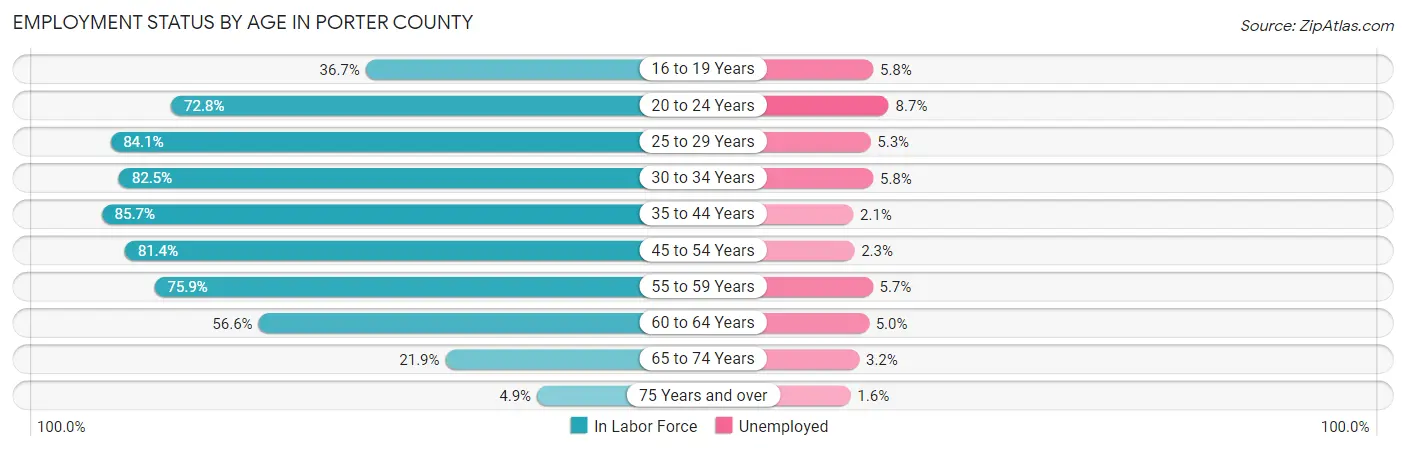
Employment Status by Age in Porter County
According to the labor force statistics for Porter County, out of the total population over 16 years of age (140,602), 62.1% or 87,314 individuals are in the labor force, with 4.2% or 3,667 of them unemployed. The age group with the highest labor force participation rate is 35 to 44 years, with 85.7% or 20,062 individuals in the labor force. Within the labor force, the 20 to 24 years age range has the highest percentage of unemployed individuals, with 8.7% or 718 of them being unemployed.
| Age Bracket | In Labor Force | Unemployed |
| 16 to 19 Years | 3,348 (36.7%) | 194 (5.8%) |
| 20 to 24 Years | 8,255 (72.8%) | 718 (8.7%) |
| 25 to 29 Years | 8,536 (84.1%) | 452 (5.3%) |
| 30 to 34 Years | 8,688 (82.5%) | 504 (5.8%) |
| 35 to 44 Years | 20,062 (85.7%) | 421 (2.1%) |
| 45 to 54 Years | 18,087 (81.4%) | 416 (2.3%) |
| 55 to 59 Years | 8,811 (75.9%) | 502 (5.7%) |
| 60 to 64 Years | 7,003 (56.6%) | 350 (5.0%) |
| 65 to 74 Years | 3,979 (21.9%) | 127 (3.2%) |
| 75 Years and over | 572 (4.9%) | 9 (1.6%) |
| Total | 87,314 (62.1%) | 3,667 (4.2%) |
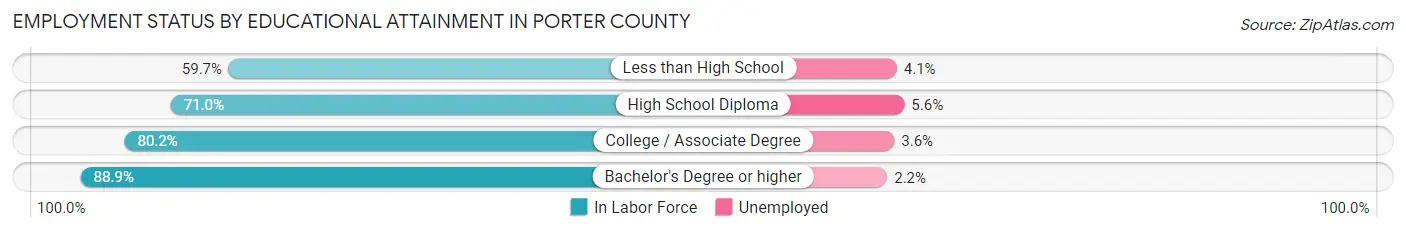
Employment Status by Educational Attainment in Porter County
According to labor force statistics for Porter County, 78.8% of individuals (71,150) out of the total population between 25 and 64 years of age (90,292) are in the labor force, with 3.7% or 2,633 of them being unemployed. The group with the highest labor force participation rate are those with the educational attainment of bachelor's degree or higher, with 88.9% or 25,016 individuals in the labor force. Within the labor force, individuals with high school diploma education have the highest percentage of unemployment, with 5.6% or 1,173 of them being unemployed.
| Educational Attainment | In Labor Force | Unemployed |
| Less than High School | 2,827 (59.7%) | 194 (4.1%) |
| High School Diploma | 20,951 (71.0%) | 1,653 (5.6%) |
| College / Associate Degree | 22,383 (80.2%) | 1,005 (3.6%) |
| Bachelor's Degree or higher | 25,016 (88.9%) | 619 (2.2%) |
| Total | 71,150 (78.8%) | 3,341 (3.7%) |
Employment Occupations by Sex in Porter County
Management, Business, Science and Arts Occupations
The most common Management, Business, Science and Arts occupations in Porter County are Community & Social Service (9,649 | 11.6%), Management (9,450 | 11.3%), Health Diagnosing & Treating (6,069 | 7.3%), Education Instruction & Library (5,319 | 6.4%), and Health Technologists (4,268 | 5.1%).
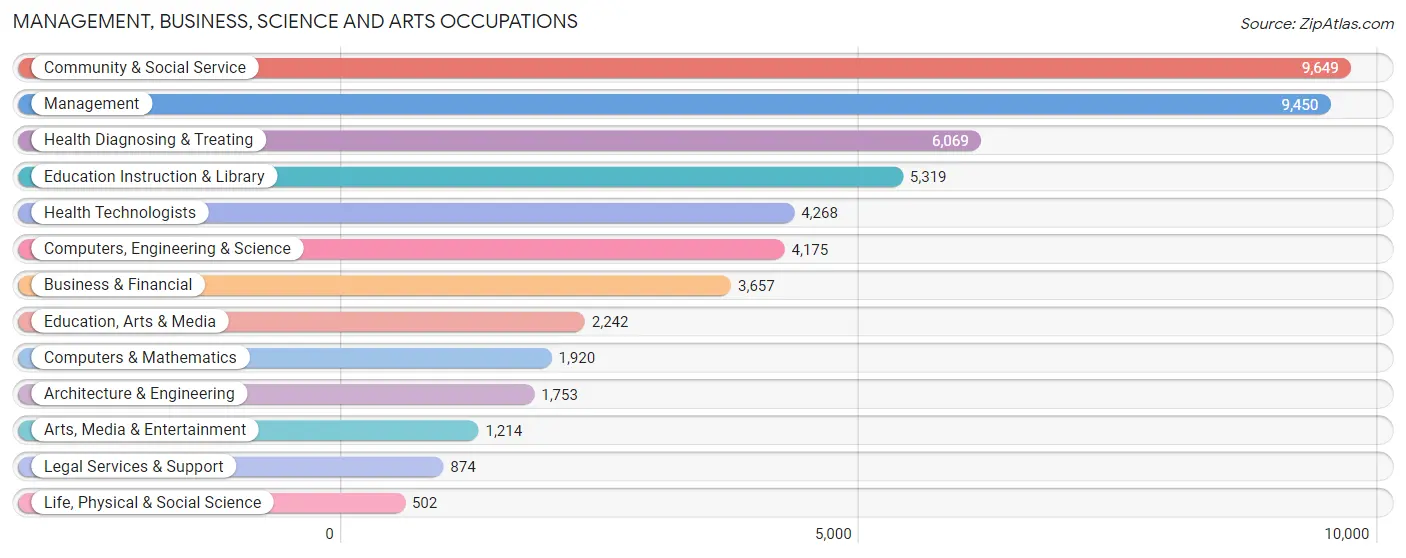
Management, Business, Science and Arts Occupations by Sex
Within the Management, Business, Science and Arts occupations in Porter County, the most male-oriented occupations are Architecture & Engineering (86.1%), Computers, Engineering & Science (67.4%), and Management (60.2%), while the most female-oriented occupations are Health Diagnosing & Treating (80.9%), Health Technologists (79.0%), and Education Instruction & Library (76.4%).
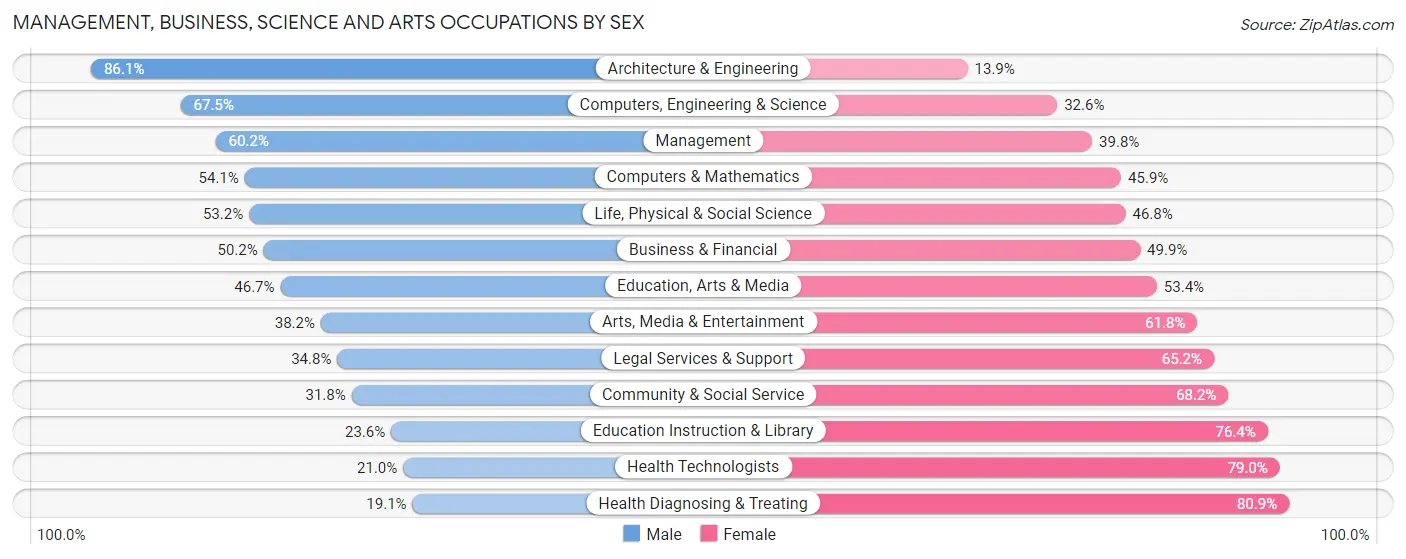
| Occupation | Male | Female |
| Management | 5,685 (60.2%) | 3,765 (39.8%) |
| Business & Financial | 1,834 (50.1%) | 1,823 (49.8%) |
| Computers, Engineering & Science | 2,816 (67.4%) | 1,359 (32.6%) |
| Computers & Mathematics | 1,039 (54.1%) | 881 (45.9%) |
| Architecture & Engineering | 1,510 (86.1%) | 243 (13.9%) |
| Life, Physical & Social Science | 267 (53.2%) | 235 (46.8%) |
| Community & Social Service | 3,067 (31.8%) | 6,582 (68.2%) |
| Education, Arts & Media | 1,046 (46.7%) | 1,196 (53.3%) |
| Legal Services & Support | 304 (34.8%) | 570 (65.2%) |
| Education Instruction & Library | 1,253 (23.6%) | 4,066 (76.4%) |
| Arts, Media & Entertainment | 464 (38.2%) | 750 (61.8%) |
| Health Diagnosing & Treating | 1,159 (19.1%) | 4,910 (80.9%) |
| Health Technologists | 898 (21.0%) | 3,370 (79.0%) |
| Total (Category) | 14,561 (44.1%) | 18,439 (55.9%) |
| Total (Overall) | 45,212 (54.1%) | 38,365 (45.9%) |
Services Occupations
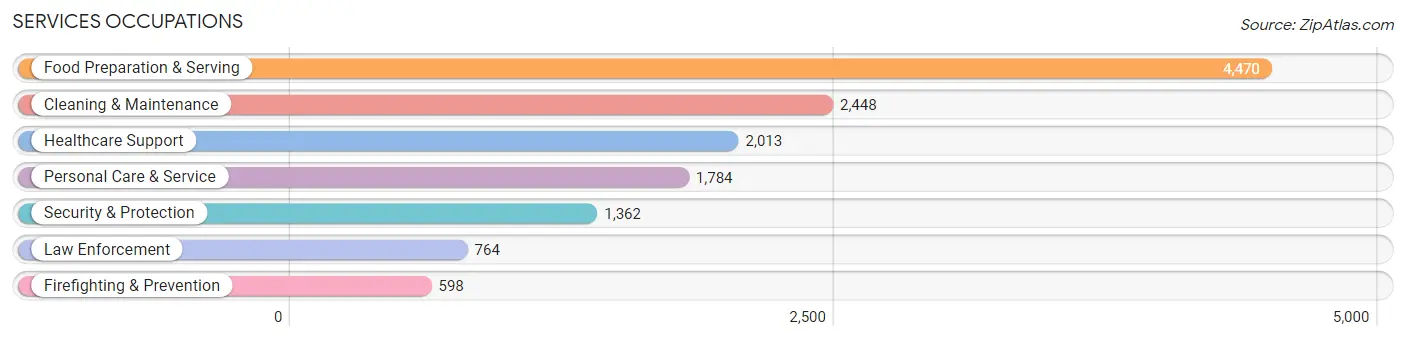
The most common Services occupations in Porter County are Food Preparation & Serving (4,470 | 5.3%), Cleaning & Maintenance (2,448 | 2.9%), Healthcare Support (2,013 | 2.4%), Personal Care & Service (1,784 | 2.1%), and Security & Protection (1,362 | 1.6%).
Services Occupations by Sex
Within the Services occupations in Porter County, the most male-oriented occupations are Law Enforcement (89.1%), Security & Protection (88.1%), and Firefighting & Prevention (86.8%), while the most female-oriented occupations are Healthcare Support (94.6%), Personal Care & Service (86.3%), and Food Preparation & Serving (52.3%).
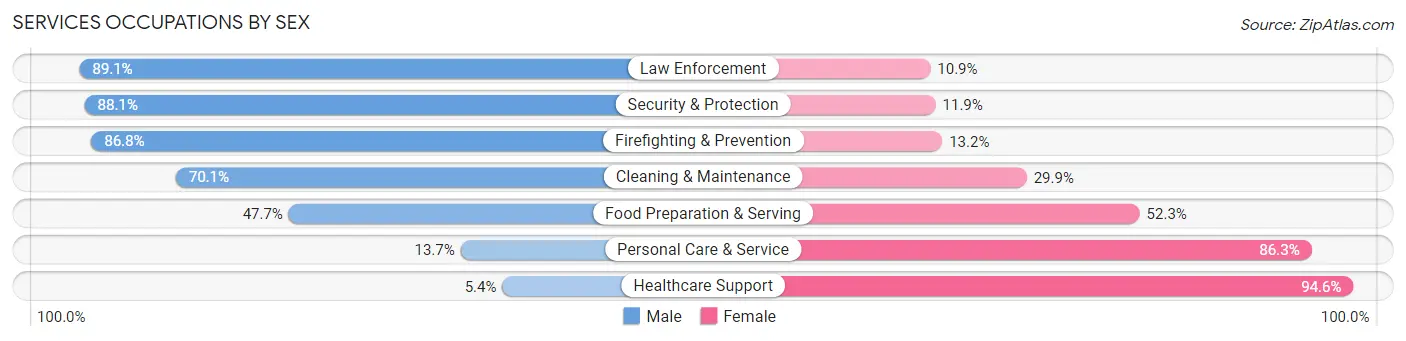
| Occupation | Male | Female |
| Healthcare Support | 109 (5.4%) | 1,904 (94.6%) |
| Security & Protection | 1,200 (88.1%) | 162 (11.9%) |
| Firefighting & Prevention | 519 (86.8%) | 79 (13.2%) |
| Law Enforcement | 681 (89.1%) | 83 (10.9%) |
| Food Preparation & Serving | 2,132 (47.7%) | 2,338 (52.3%) |
| Cleaning & Maintenance | 1,715 (70.1%) | 733 (29.9%) |
| Personal Care & Service | 244 (13.7%) | 1,540 (86.3%) |
| Total (Category) | 5,400 (44.7%) | 6,677 (55.3%) |
| Total (Overall) | 45,212 (54.1%) | 38,365 (45.9%) |
Sales and Office Occupations
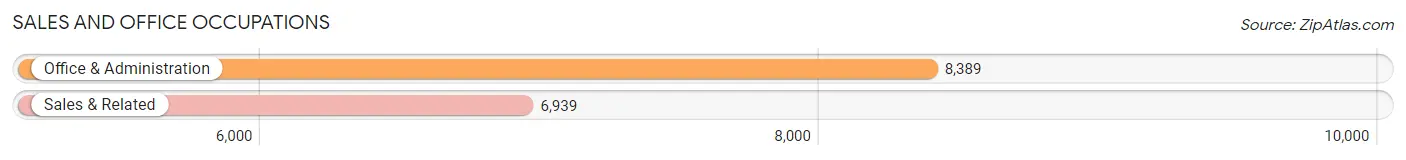
The most common Sales and Office occupations in Porter County are Office & Administration (8,389 | 10.0%), and Sales & Related (6,939 | 8.3%).
Sales and Office Occupations by Sex
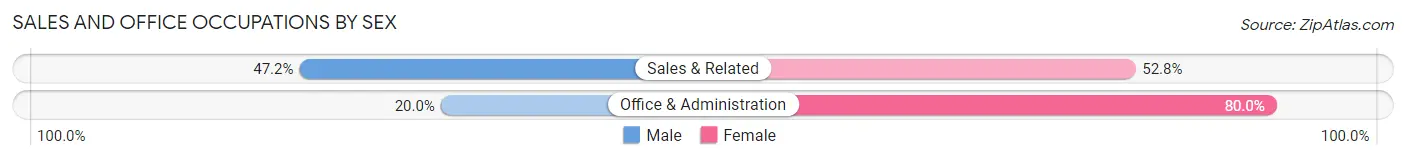
| Occupation | Male | Female |
| Sales & Related | 3,273 (47.2%) | 3,666 (52.8%) |
| Office & Administration | 1,676 (20.0%) | 6,713 (80.0%) |
| Total (Category) | 4,949 (32.3%) | 10,379 (67.7%) |
| Total (Overall) | 45,212 (54.1%) | 38,365 (45.9%) |
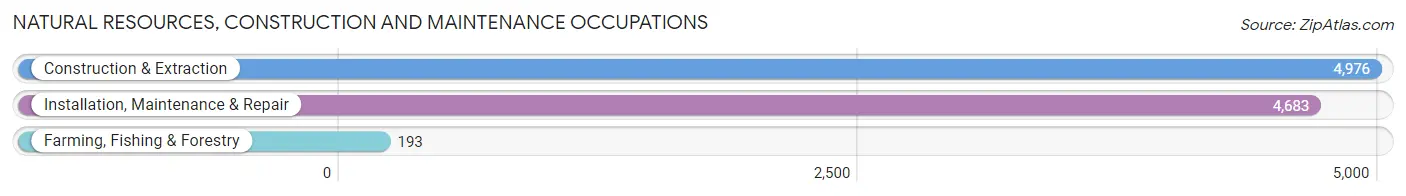
Natural Resources, Construction and Maintenance Occupations
The most common Natural Resources, Construction and Maintenance occupations in Porter County are Construction & Extraction (4,976 | 5.9%), Installation, Maintenance & Repair (4,683 | 5.6%), and Farming, Fishing & Forestry (193 | 0.2%).
Natural Resources, Construction and Maintenance Occupations by Sex
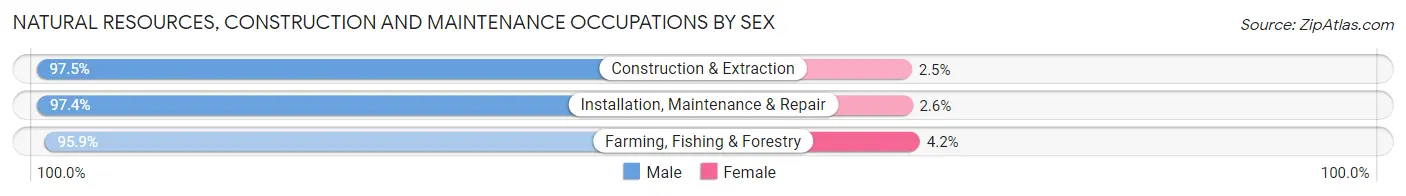
| Occupation | Male | Female |
| Farming, Fishing & Forestry | 185 (95.9%) | 8 (4.2%) |
| Construction & Extraction | 4,853 (97.5%) | 123 (2.5%) |
| Installation, Maintenance & Repair | 4,561 (97.4%) | 122 (2.6%) |
| Total (Category) | 9,599 (97.4%) | 253 (2.6%) |
| Total (Overall) | 45,212 (54.1%) | 38,365 (45.9%) |
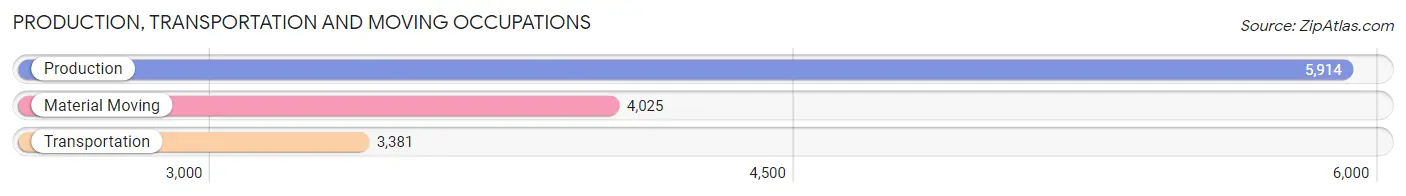
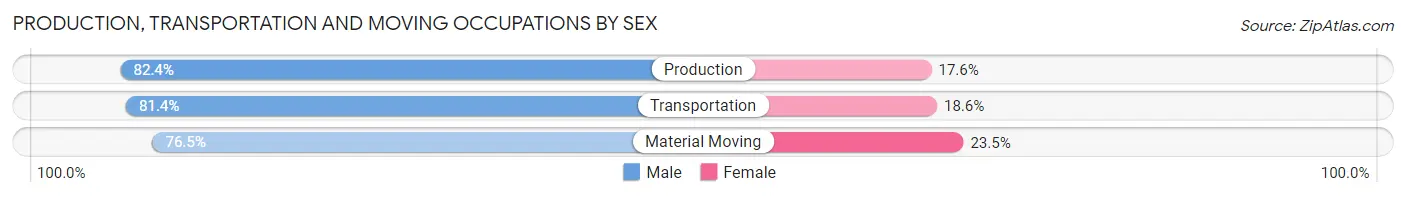
Production, Transportation and Moving Occupations
The most common Production, Transportation and Moving occupations in Porter County are Production (5,914 | 7.1%), Material Moving (4,025 | 4.8%), and Transportation (3,381 | 4.1%).
Production, Transportation and Moving Occupations by Sex
| Occupation | Male | Female |
| Production | 4,872 (82.4%) | 1,042 (17.6%) |
| Transportation | 2,751 (81.4%) | 630 (18.6%) |
| Material Moving | 3,080 (76.5%) | 945 (23.5%) |
| Total (Category) | 10,703 (80.3%) | 2,617 (19.7%) |
| Total (Overall) | 45,212 (54.1%) | 38,365 (45.9%) |
Employment Industries by Sex in Porter County
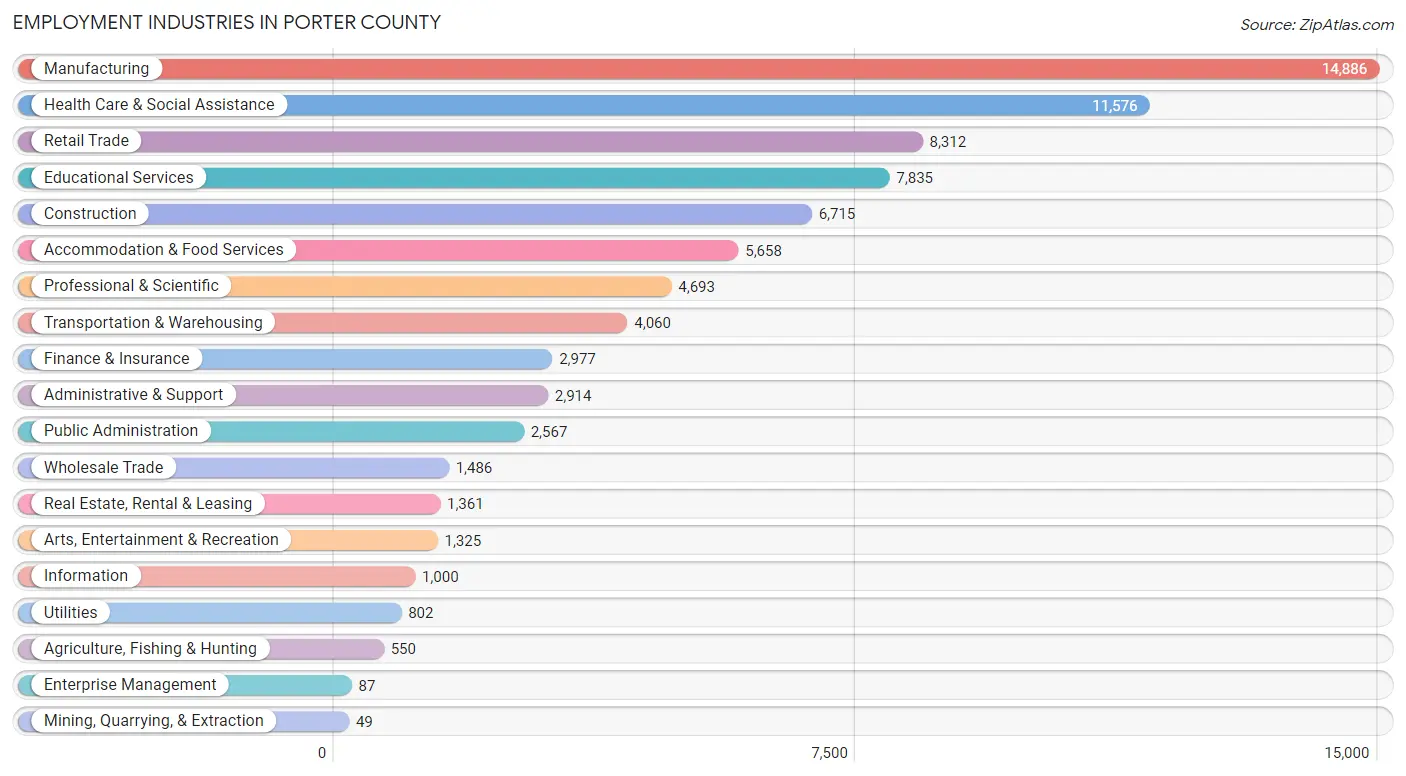
Employment Industries in Porter County
The major employment industries in Porter County include Manufacturing (14,886 | 17.8%), Health Care & Social Assistance (11,576 | 13.9%), Retail Trade (8,312 | 10.0%), Educational Services (7,835 | 9.4%), and Construction (6,715 | 8.0%).
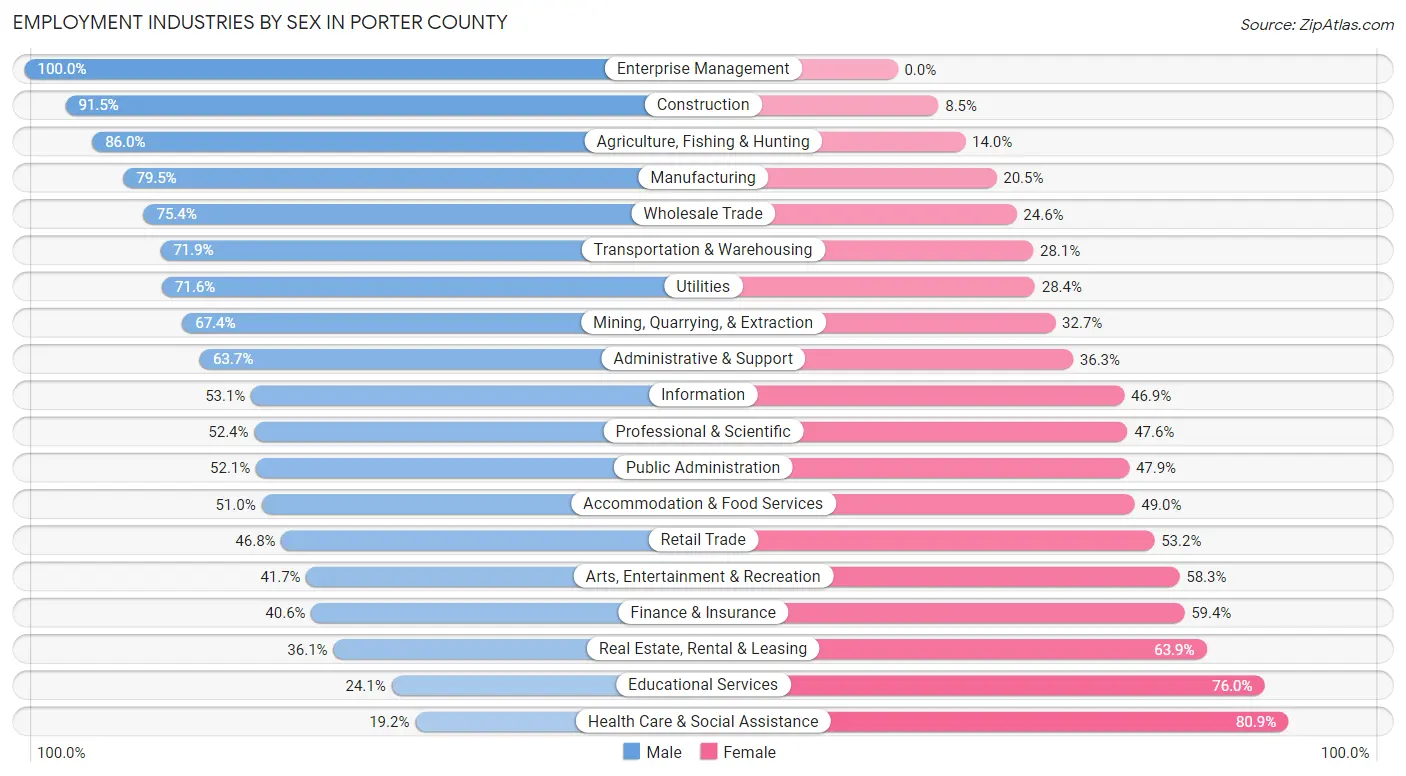
Employment Industries by Sex in Porter County
The Porter County industries that see more men than women are Enterprise Management (100.0%), Construction (91.5%), and Agriculture, Fishing & Hunting (86.0%), whereas the industries that tend to have a higher number of women are Health Care & Social Assistance (80.8%), Educational Services (75.9%), and Real Estate, Rental & Leasing (63.9%).
| Industry | Male | Female |
| Agriculture, Fishing & Hunting | 473 (86.0%) | 77 (14.0%) |
| Mining, Quarrying, & Extraction | 33 (67.3%) | 16 (32.7%) |
| Construction | 6,147 (91.5%) | 568 (8.5%) |
| Manufacturing | 11,840 (79.5%) | 3,046 (20.5%) |
| Wholesale Trade | 1,120 (75.4%) | 366 (24.6%) |
| Retail Trade | 3,893 (46.8%) | 4,419 (53.2%) |
| Transportation & Warehousing | 2,920 (71.9%) | 1,140 (28.1%) |
| Utilities | 574 (71.6%) | 228 (28.4%) |
| Information | 531 (53.1%) | 469 (46.9%) |
| Finance & Insurance | 1,210 (40.6%) | 1,767 (59.4%) |
| Real Estate, Rental & Leasing | 491 (36.1%) | 870 (63.9%) |
| Professional & Scientific | 2,461 (52.4%) | 2,232 (47.6%) |
| Enterprise Management | 87 (100.0%) | 0 (0.0%) |
| Administrative & Support | 1,856 (63.7%) | 1,058 (36.3%) |
| Educational Services | 1,884 (24.0%) | 5,951 (75.9%) |
| Health Care & Social Assistance | 2,217 (19.2%) | 9,359 (80.8%) |
| Arts, Entertainment & Recreation | 552 (41.7%) | 773 (58.3%) |
| Accommodation & Food Services | 2,884 (51.0%) | 2,774 (49.0%) |
| Public Administration | 1,337 (52.1%) | 1,230 (47.9%) |
| Total | 45,212 (54.1%) | 38,365 (45.9%) |
Education in Porter County
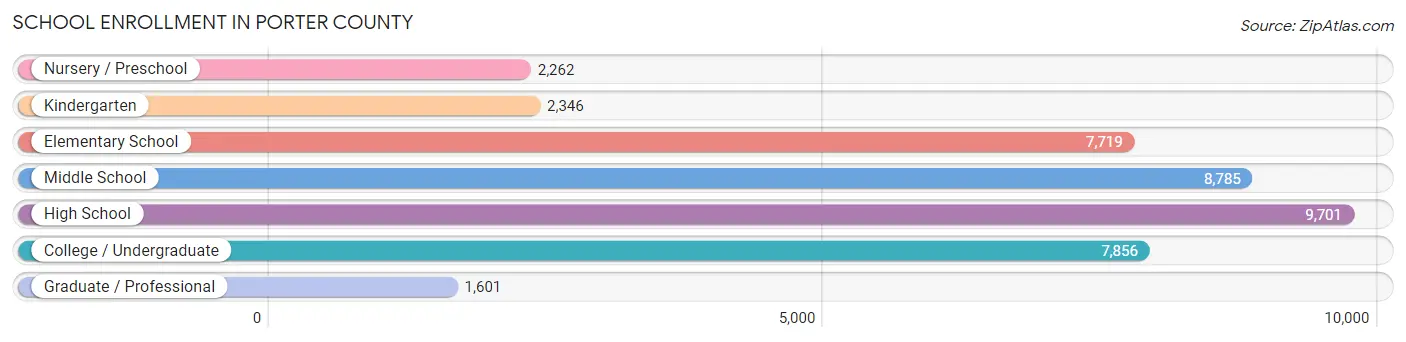
School Enrollment in Porter County
The most common levels of schooling among the 40,270 students in Porter County are high school (9,701 | 24.1%), middle school (8,785 | 21.8%), and college / undergraduate (7,856 | 19.5%).
| School Level | # Students | % Students |
| Nursery / Preschool | 2,262 | 5.6% |
| Kindergarten | 2,346 | 5.8% |
| Elementary School | 7,719 | 19.2% |
| Middle School | 8,785 | 21.8% |
| High School | 9,701 | 24.1% |
| College / Undergraduate | 7,856 | 19.5% |
| Graduate / Professional | 1,601 | 4.0% |
| Total | 40,270 | 100.0% |
School Enrollment by Age by Funding Source in Porter County
Out of a total of 40,270 students who are enrolled in schools in Porter County, 7,128 (17.7%) attend a private institution, while the remaining 33,142 (82.3%) are enrolled in public schools. The age group of 20 to 24 year olds has the highest likelihood of being enrolled in private schools, with 2,489 (61.0% in the age bracket) enrolled. Conversely, the age group of 15 to 17 year olds has the lowest likelihood of being enrolled in a private school, with 6,531 (93.5% in the age bracket) attending a public institution.
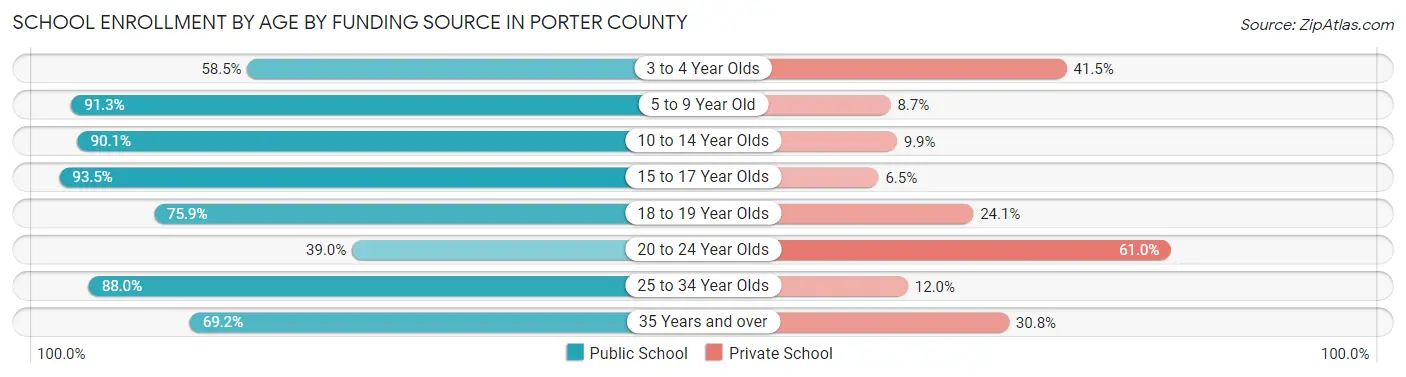
| Age Bracket | Public School | Private School |
| 3 to 4 Year Olds | 951 (58.5%) | 675 (41.5%) |
| 5 to 9 Year Old | 8,635 (91.3%) | 824 (8.7%) |
| 10 to 14 Year Olds | 9,938 (90.1%) | 1,091 (9.9%) |
| 15 to 17 Year Olds | 6,531 (93.5%) | 453 (6.5%) |
| 18 to 19 Year Olds | 2,314 (75.9%) | 736 (24.1%) |
| 20 to 24 Year Olds | 1,591 (39.0%) | 2,489 (61.0%) |
| 25 to 34 Year Olds | 1,708 (88.0%) | 232 (12.0%) |
| 35 Years and over | 1,455 (69.2%) | 647 (30.8%) |
| Total | 33,142 (82.3%) | 7,128 (17.7%) |
Educational Attainment by Field of Study in Porter County
Business (7,167 | 18.5%), education (5,850 | 15.1%), science & technology (3,949 | 10.2%), engineering (3,156 | 8.2%), and social sciences (2,504 | 6.5%) are the most common fields of study among 38,733 individuals in Porter County who have obtained a bachelor's degree or higher.
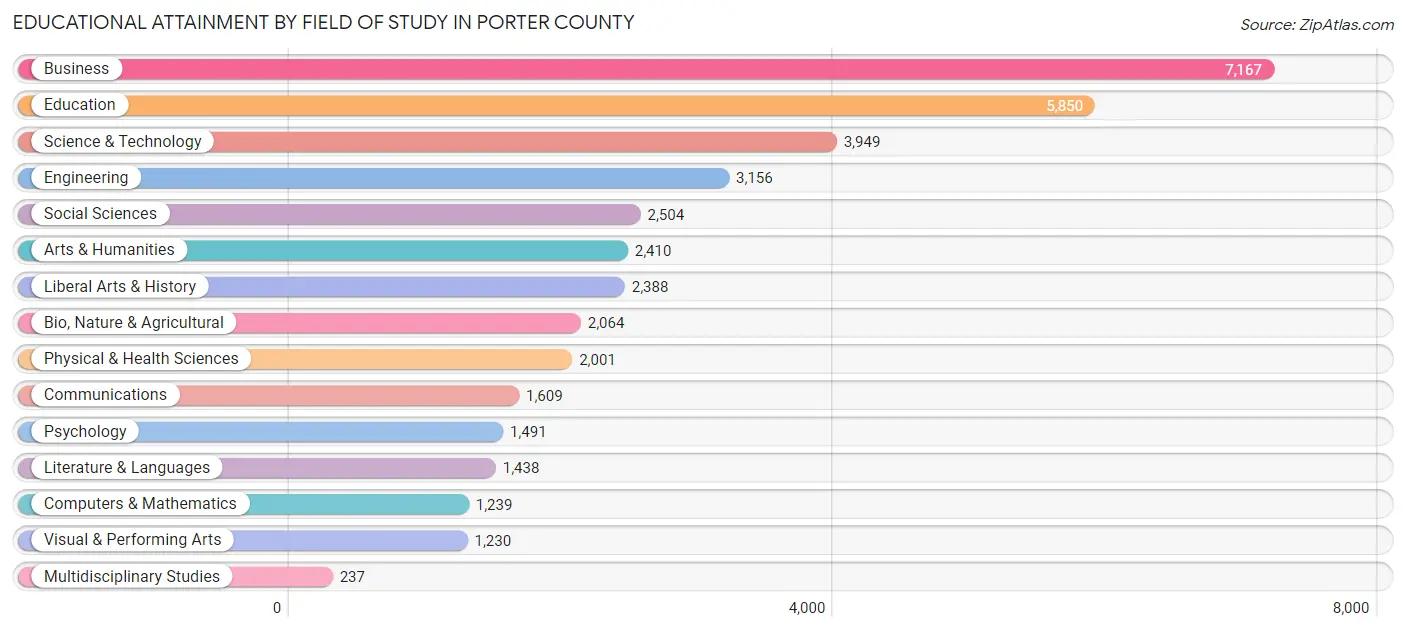
| Field of Study | # Graduates | % Graduates |
| Computers & Mathematics | 1,239 | 3.2% |
| Bio, Nature & Agricultural | 2,064 | 5.3% |
| Physical & Health Sciences | 2,001 | 5.2% |
| Psychology | 1,491 | 3.8% |
| Social Sciences | 2,504 | 6.5% |
| Engineering | 3,156 | 8.2% |
| Multidisciplinary Studies | 237 | 0.6% |
| Science & Technology | 3,949 | 10.2% |
| Business | 7,167 | 18.5% |
| Education | 5,850 | 15.1% |
| Literature & Languages | 1,438 | 3.7% |
| Liberal Arts & History | 2,388 | 6.2% |
| Visual & Performing Arts | 1,230 | 3.2% |
| Communications | 1,609 | 4.2% |
| Arts & Humanities | 2,410 | 6.2% |
| Total | 38,733 | 100.0% |
Transportation & Commute in Porter County
Vehicle Availability by Sex in Porter County
The most prevalent vehicle ownership categories in Porter County are males with 2 vehicles (19,246, accounting for 43.5%) and females with 2 vehicles (16,075, making up 52.4%).
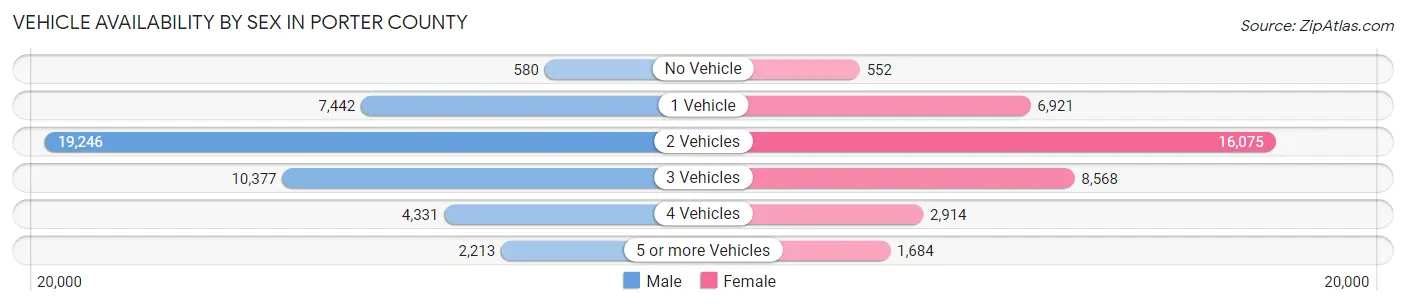
| Vehicles Available | Male | Female |
| No Vehicle | 580 (1.3%) | 552 (1.5%) |
| 1 Vehicle | 7,442 (16.8%) | 6,921 (18.9%) |
| 2 Vehicles | 19,246 (43.5%) | 16,075 (43.8%) |
| 3 Vehicles | 10,377 (23.5%) | 8,568 (23.3%) |
| 4 Vehicles | 4,331 (9.8%) | 2,914 (7.9%) |
| 5 or more Vehicles | 2,213 (5.0%) | 1,684 (4.6%) |
| Total | 44,189 (100.0%) | 36,714 (100.0%) |
Commute Time in Porter County
The most frequently occuring commute durations in Porter County are 30 to 34 minutes (11,115 commuters, 14.7%), 10 to 14 minutes (10,005 commuters, 13.3%), and 20 to 24 minutes (9,847 commuters, 13.0%).
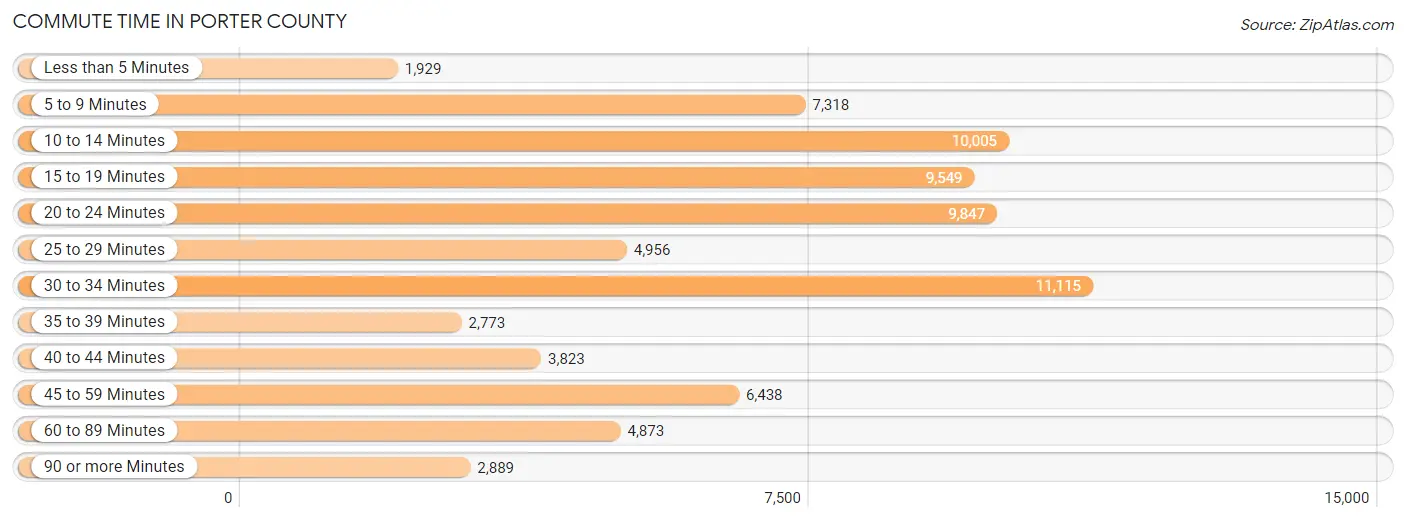
| Commute Time | # Commuters | % Commuters |
| Less than 5 Minutes | 1,929 | 2.5% |
| 5 to 9 Minutes | 7,318 | 9.7% |
| 10 to 14 Minutes | 10,005 | 13.3% |
| 15 to 19 Minutes | 9,549 | 12.7% |
| 20 to 24 Minutes | 9,847 | 13.0% |
| 25 to 29 Minutes | 4,956 | 6.6% |
| 30 to 34 Minutes | 11,115 | 14.7% |
| 35 to 39 Minutes | 2,773 | 3.7% |
| 40 to 44 Minutes | 3,823 | 5.1% |
| 45 to 59 Minutes | 6,438 | 8.5% |
| 60 to 89 Minutes | 4,873 | 6.5% |
| 90 or more Minutes | 2,889 | 3.8% |
Commute Time by Sex in Porter County
The most common commute times in Porter County are 30 to 34 minutes (5,667 commuters, 13.7%) for males and 30 to 34 minutes (5,448 commuters, 16.0%) for females.
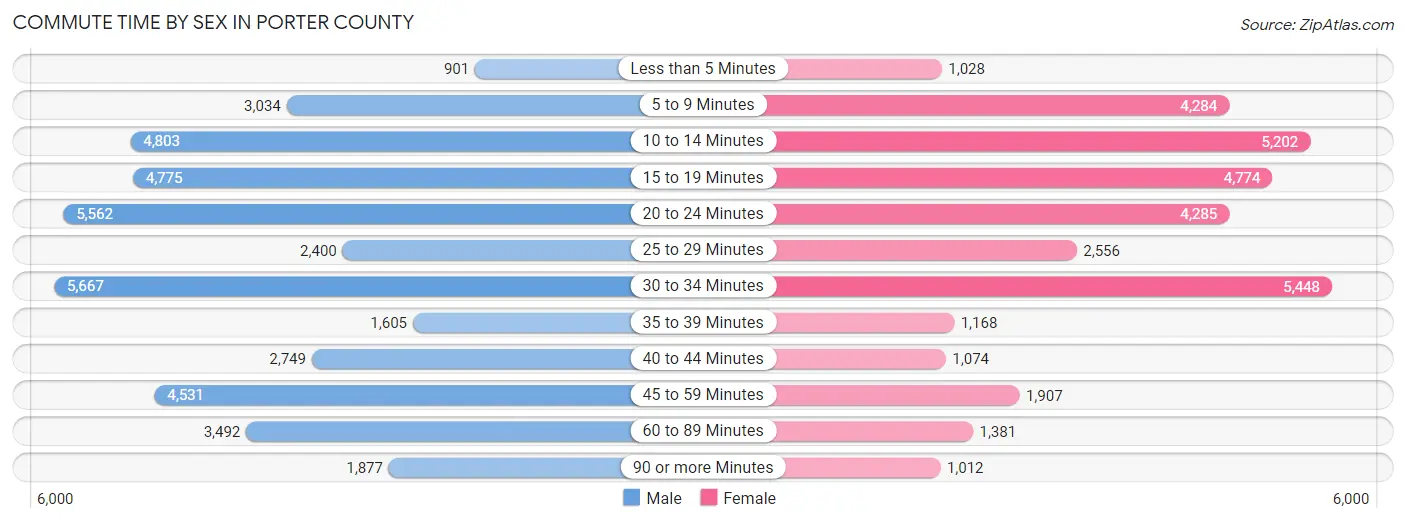
| Commute Time | Male | Female |
| Less than 5 Minutes | 901 (2.2%) | 1,028 (3.0%) |
| 5 to 9 Minutes | 3,034 (7.3%) | 4,284 (12.6%) |
| 10 to 14 Minutes | 4,803 (11.6%) | 5,202 (15.2%) |
| 15 to 19 Minutes | 4,775 (11.5%) | 4,774 (14.0%) |
| 20 to 24 Minutes | 5,562 (13.4%) | 4,285 (12.6%) |
| 25 to 29 Minutes | 2,400 (5.8%) | 2,556 (7.5%) |
| 30 to 34 Minutes | 5,667 (13.7%) | 5,448 (16.0%) |
| 35 to 39 Minutes | 1,605 (3.9%) | 1,168 (3.4%) |
| 40 to 44 Minutes | 2,749 (6.6%) | 1,074 (3.2%) |
| 45 to 59 Minutes | 4,531 (11.0%) | 1,907 (5.6%) |
| 60 to 89 Minutes | 3,492 (8.4%) | 1,381 (4.1%) |
| 90 or more Minutes | 1,877 (4.5%) | 1,012 (3.0%) |
Time of Departure to Work by Sex in Porter County
The most frequent times of departure to work in Porter County are 6:00 AM to 6:29 AM (5,490, 13.3%) for males and 7:00 AM to 7:29 AM (5,802, 17.0%) for females.
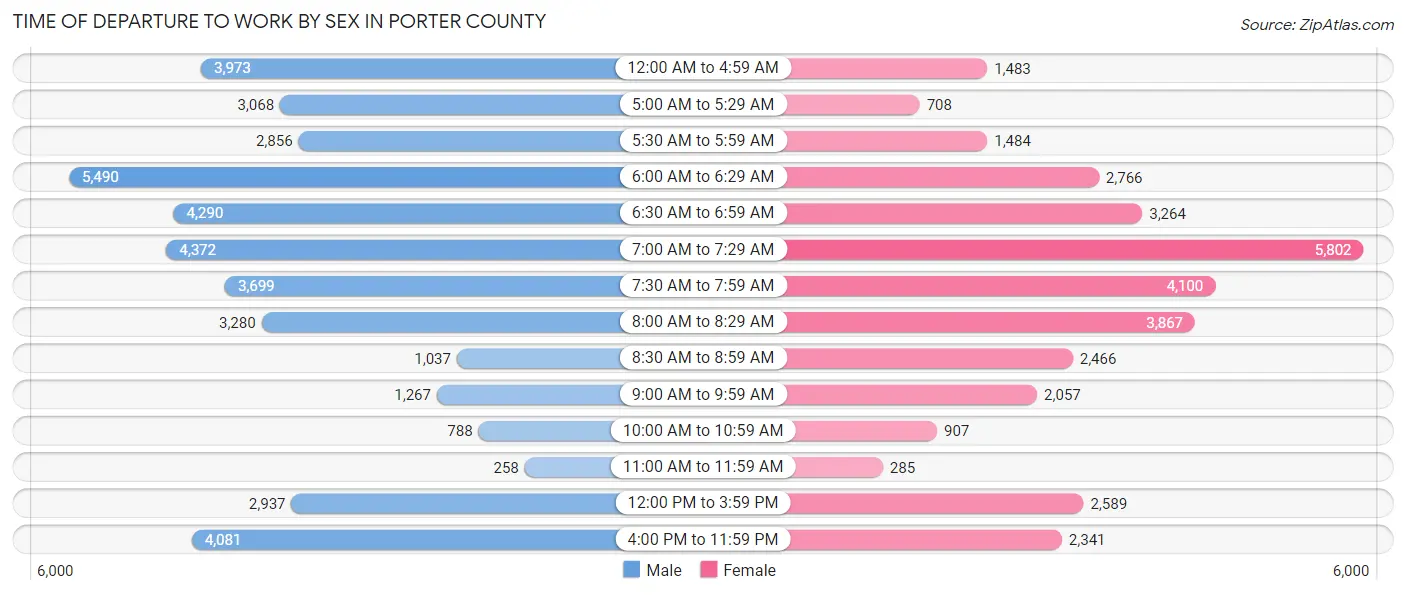
| Time of Departure | Male | Female |
| 12:00 AM to 4:59 AM | 3,973 (9.6%) | 1,483 (4.3%) |
| 5:00 AM to 5:29 AM | 3,068 (7.4%) | 708 (2.1%) |
| 5:30 AM to 5:59 AM | 2,856 (6.9%) | 1,484 (4.3%) |
| 6:00 AM to 6:29 AM | 5,490 (13.3%) | 2,766 (8.1%) |
| 6:30 AM to 6:59 AM | 4,290 (10.4%) | 3,264 (9.6%) |
| 7:00 AM to 7:29 AM | 4,372 (10.6%) | 5,802 (17.0%) |
| 7:30 AM to 7:59 AM | 3,699 (8.9%) | 4,100 (12.0%) |
| 8:00 AM to 8:29 AM | 3,280 (7.9%) | 3,867 (11.3%) |
| 8:30 AM to 8:59 AM | 1,037 (2.5%) | 2,466 (7.2%) |
| 9:00 AM to 9:59 AM | 1,267 (3.1%) | 2,057 (6.0%) |
| 10:00 AM to 10:59 AM | 788 (1.9%) | 907 (2.7%) |
| 11:00 AM to 11:59 AM | 258 (0.6%) | 285 (0.8%) |
| 12:00 PM to 3:59 PM | 2,937 (7.1%) | 2,589 (7.6%) |
| 4:00 PM to 11:59 PM | 4,081 (9.9%) | 2,341 (6.9%) |
| Total | 41,396 (100.0%) | 34,119 (100.0%) |
Housing Occupancy in Porter County
Occupancy by Ownership in Porter County
Of the total 67,945 dwellings in Porter County, owner-occupied units account for 52,320 (77.0%), while renter-occupied units make up 15,625 (23.0%).
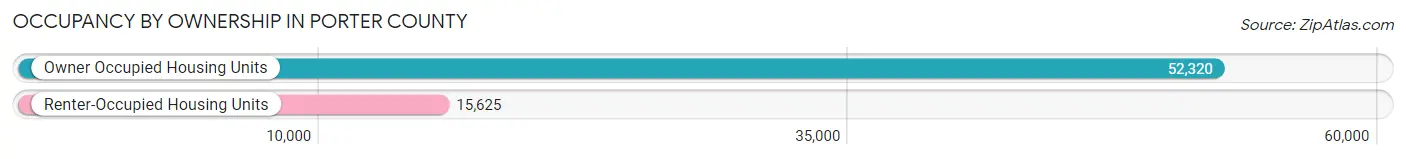
| Occupancy | # Housing Units | % Housing Units |
| Owner Occupied Housing Units | 52,320 | 77.0% |
| Renter-Occupied Housing Units | 15,625 | 23.0% |
| Total Occupied Housing Units | 67,945 | 100.0% |
Occupancy by Household Size in Porter County
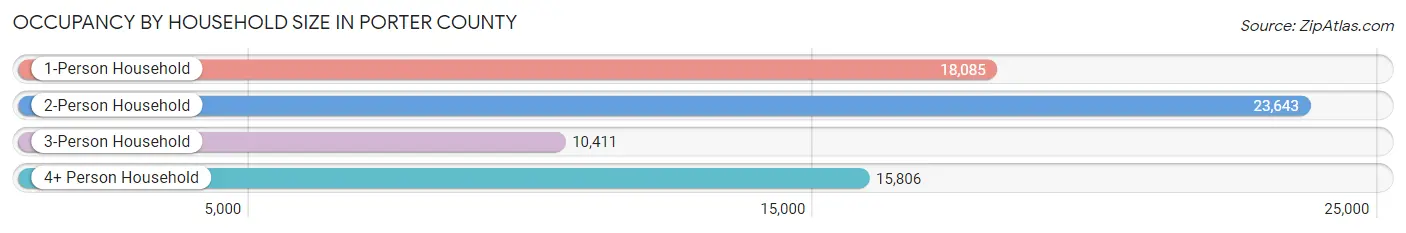
| Household Size | # Housing Units | % Housing Units |
| 1-Person Household | 18,085 | 26.6% |
| 2-Person Household | 23,643 | 34.8% |
| 3-Person Household | 10,411 | 15.3% |
| 4+ Person Household | 15,806 | 23.3% |
| Total Housing Units | 67,945 | 100.0% |
Occupancy by Ownership by Household Size in Porter County
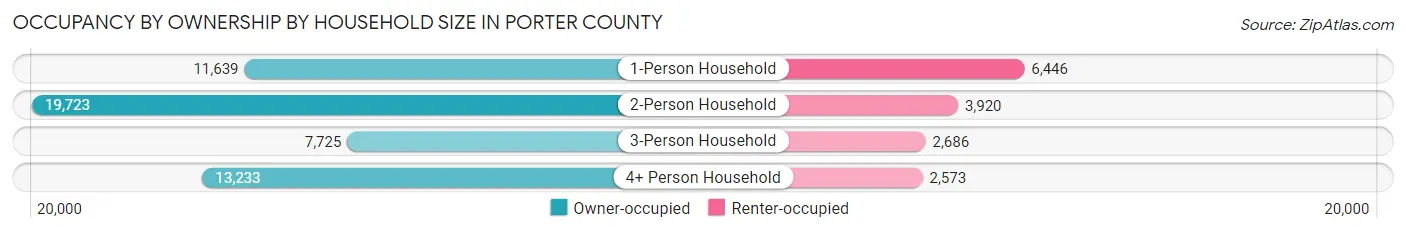
| Household Size | Owner-occupied | Renter-occupied |
| 1-Person Household | 11,639 (64.4%) | 6,446 (35.6%) |
| 2-Person Household | 19,723 (83.4%) | 3,920 (16.6%) |
| 3-Person Household | 7,725 (74.2%) | 2,686 (25.8%) |
| 4+ Person Household | 13,233 (83.7%) | 2,573 (16.3%) |
| Total Housing Units | 52,320 (77.0%) | 15,625 (23.0%) |
Occupancy by Educational Attainment in Porter County
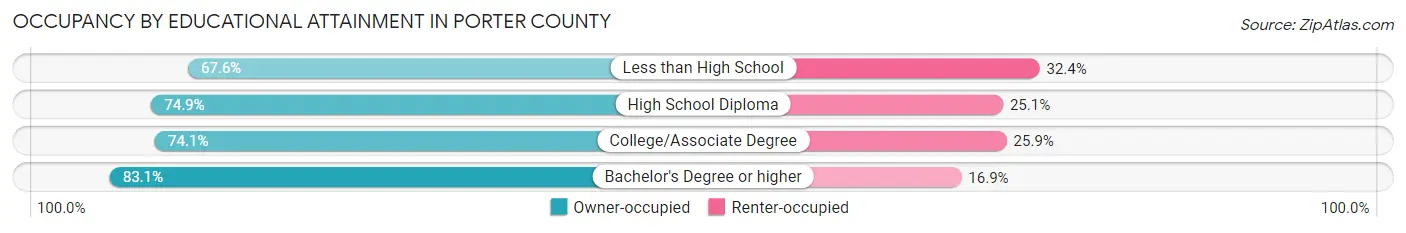
| Household Size | Owner-occupied | Renter-occupied |
| Less than High School | 2,008 (67.6%) | 962 (32.4%) |
| High School Diploma | 16,577 (74.9%) | 5,567 (25.1%) |
| College/Associate Degree | 15,348 (74.1%) | 5,357 (25.9%) |
| Bachelor's Degree or higher | 18,387 (83.1%) | 3,739 (16.9%) |
Occupancy by Age of Householder in Porter County
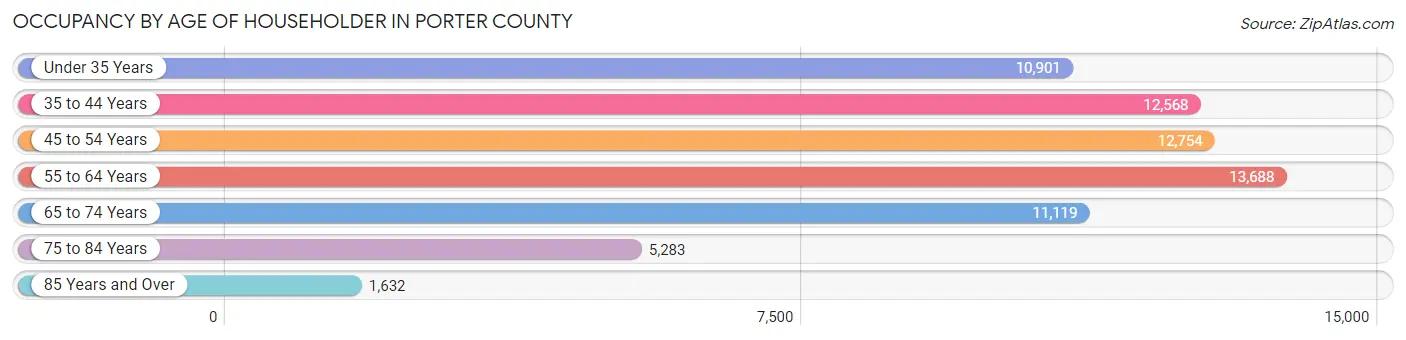
| Age Bracket | # Households | % Households |
| Under 35 Years | 10,901 | 16.0% |
| 35 to 44 Years | 12,568 | 18.5% |
| 45 to 54 Years | 12,754 | 18.8% |
| 55 to 64 Years | 13,688 | 20.2% |
| 65 to 74 Years | 11,119 | 16.4% |
| 75 to 84 Years | 5,283 | 7.8% |
| 85 Years and Over | 1,632 | 2.4% |
| Total | 67,945 | 100.0% |
Housing Finances in Porter County
Median Income by Occupancy in Porter County
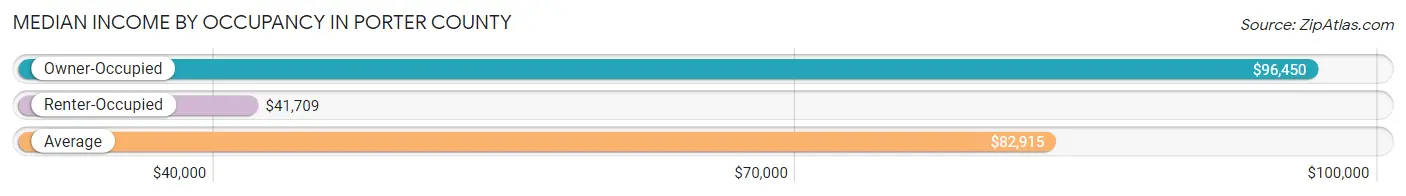
| Occupancy Type | # Households | Median Income |
| Owner-Occupied | 52,320 (77.0%) | $96,450 |
| Renter-Occupied | 15,625 (23.0%) | $41,709 |
| Average | 67,945 (100.0%) | $82,915 |
Occupancy by Householder Income Bracket in Porter County
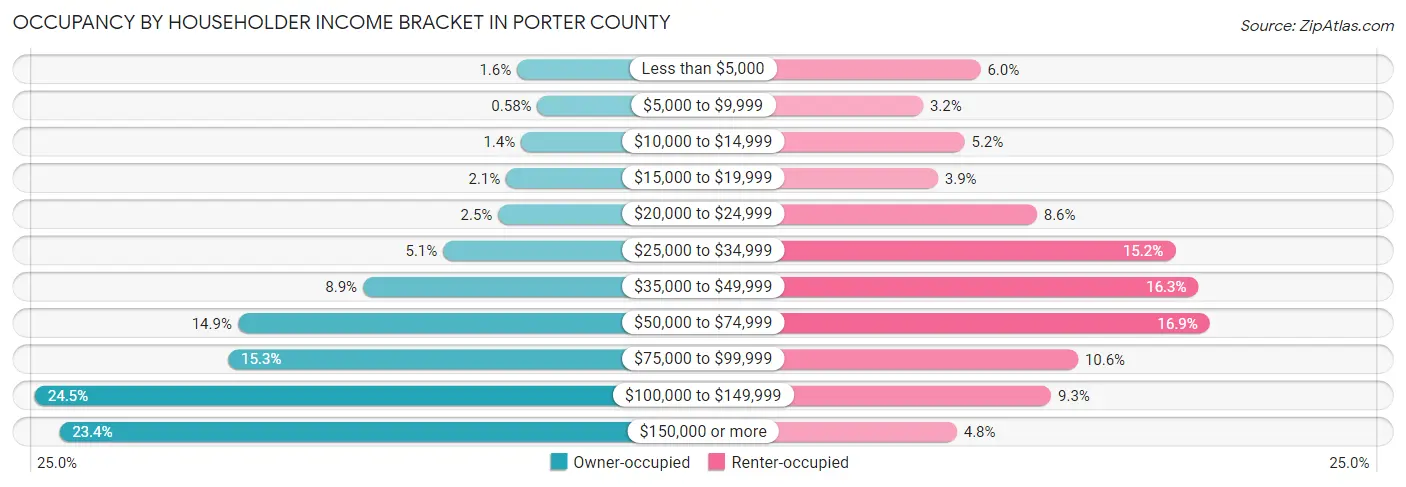
| Income Bracket | Owner-occupied | Renter-occupied |
| Less than $5,000 | 813 (1.5%) | 929 (5.9%) |
| $5,000 to $9,999 | 304 (0.6%) | 502 (3.2%) |
| $10,000 to $14,999 | 712 (1.4%) | 811 (5.2%) |
| $15,000 to $19,999 | 1,084 (2.1%) | 613 (3.9%) |
| $20,000 to $24,999 | 1,283 (2.5%) | 1,348 (8.6%) |
| $25,000 to $34,999 | 2,653 (5.1%) | 2,377 (15.2%) |
| $35,000 to $49,999 | 4,652 (8.9%) | 2,550 (16.3%) |
| $50,000 to $74,999 | 7,770 (14.8%) | 2,634 (16.9%) |
| $75,000 to $99,999 | 8,009 (15.3%) | 1,654 (10.6%) |
| $100,000 to $149,999 | 12,825 (24.5%) | 1,454 (9.3%) |
| $150,000 or more | 12,215 (23.4%) | 753 (4.8%) |
| Total | 52,320 (100.0%) | 15,625 (100.0%) |
Monthly Housing Cost Tiers in Porter County
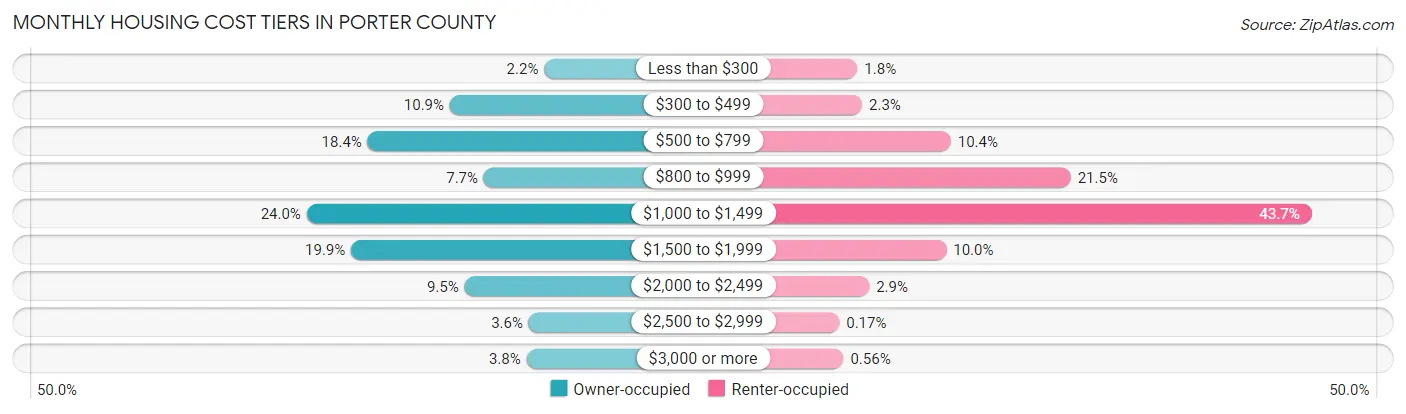
| Monthly Cost | Owner-occupied | Renter-occupied |
| Less than $300 | 1,130 (2.2%) | 288 (1.8%) |
| $300 to $499 | 5,678 (10.8%) | 355 (2.3%) |
| $500 to $799 | 9,638 (18.4%) | 1,631 (10.4%) |
| $800 to $999 | 4,041 (7.7%) | 3,356 (21.5%) |
| $1,000 to $1,499 | 12,575 (24.0%) | 6,821 (43.6%) |
| $1,500 to $1,999 | 10,433 (19.9%) | 1,565 (10.0%) |
| $2,000 to $2,499 | 4,970 (9.5%) | 458 (2.9%) |
| $2,500 to $2,999 | 1,872 (3.6%) | 27 (0.2%) |
| $3,000 or more | 1,983 (3.8%) | 87 (0.6%) |
| Total | 52,320 (100.0%) | 15,625 (100.0%) |
Physical Housing Characteristics in Porter County
Housing Structures in Porter County
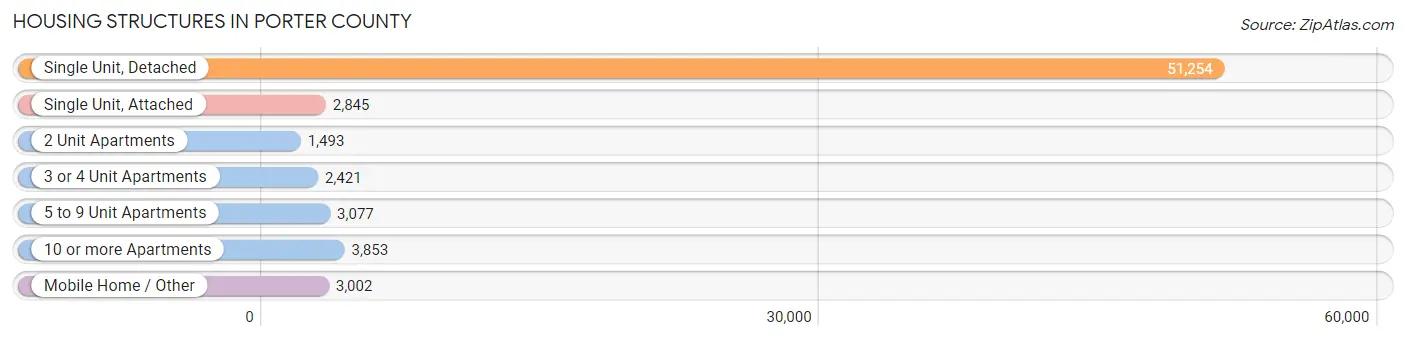
| Structure Type | # Housing Units | % Housing Units |
| Single Unit, Detached | 51,254 | 75.4% |
| Single Unit, Attached | 2,845 | 4.2% |
| 2 Unit Apartments | 1,493 | 2.2% |
| 3 or 4 Unit Apartments | 2,421 | 3.6% |
| 5 to 9 Unit Apartments | 3,077 | 4.5% |
| 10 or more Apartments | 3,853 | 5.7% |
| Mobile Home / Other | 3,002 | 4.4% |
| Total | 67,945 | 100.0% |
Housing Structures by Occupancy in Porter County
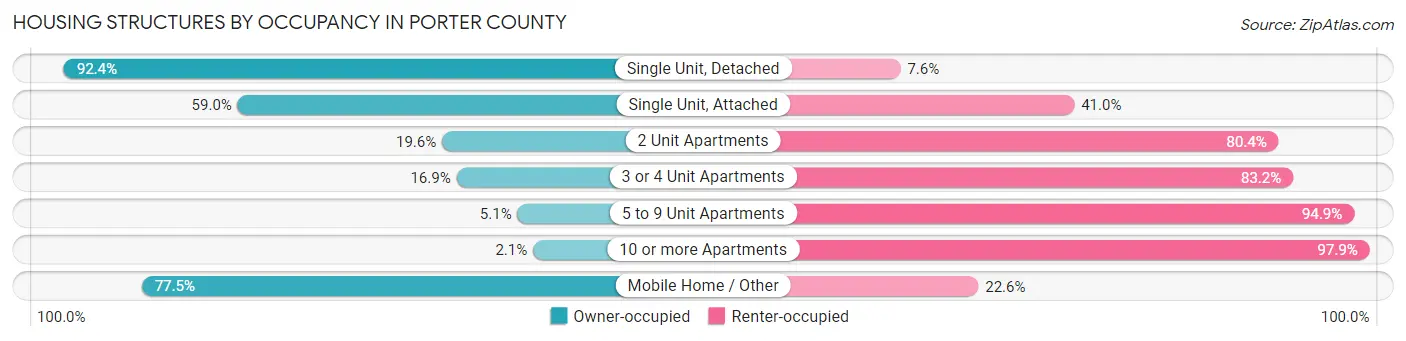
| Structure Type | Owner-occupied | Renter-occupied |
| Single Unit, Detached | 47,378 (92.4%) | 3,876 (7.6%) |
| Single Unit, Attached | 1,678 (59.0%) | 1,167 (41.0%) |
| 2 Unit Apartments | 293 (19.6%) | 1,200 (80.4%) |
| 3 or 4 Unit Apartments | 408 (16.9%) | 2,013 (83.2%) |
| 5 to 9 Unit Apartments | 157 (5.1%) | 2,920 (94.9%) |
| 10 or more Apartments | 81 (2.1%) | 3,772 (97.9%) |
| Mobile Home / Other | 2,325 (77.4%) | 677 (22.6%) |
| Total | 52,320 (77.0%) | 15,625 (23.0%) |
Housing Structures by Number of Rooms in Porter County
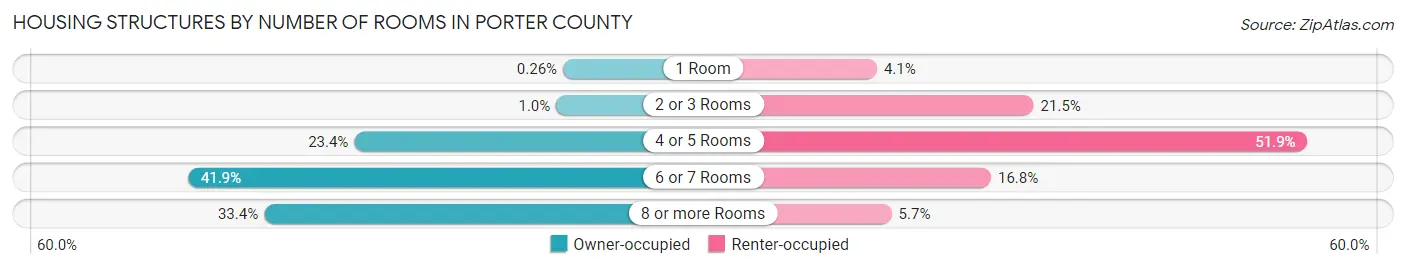
| Number of Rooms | Owner-occupied | Renter-occupied |
| 1 Room | 138 (0.3%) | 642 (4.1%) |
| 2 or 3 Rooms | 527 (1.0%) | 3,360 (21.5%) |
| 4 or 5 Rooms | 12,251 (23.4%) | 8,106 (51.9%) |
| 6 or 7 Rooms | 21,913 (41.9%) | 2,620 (16.8%) |
| 8 or more Rooms | 17,491 (33.4%) | 897 (5.7%) |
| Total | 52,320 (100.0%) | 15,625 (100.0%) |
Housing Structure by Heating Type in Porter County
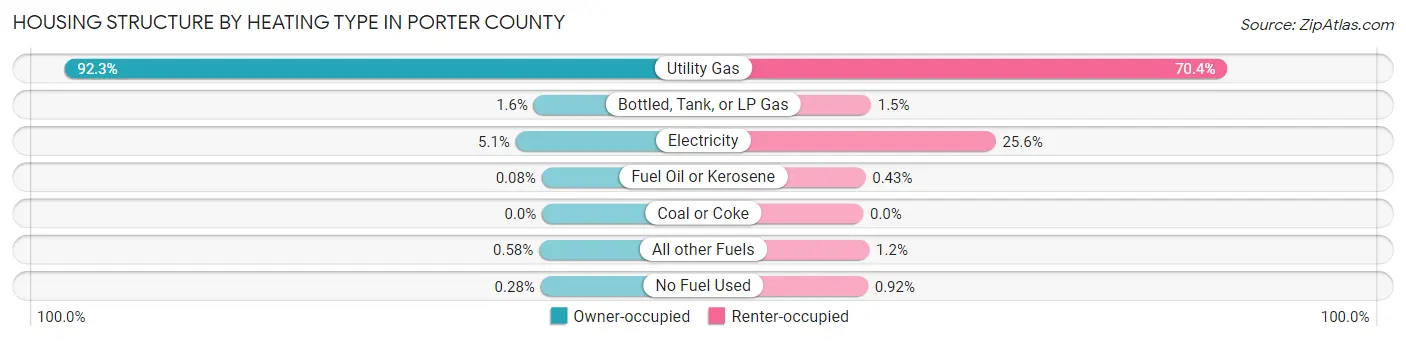
| Heating Type | Owner-occupied | Renter-occupied |
| Utility Gas | 48,309 (92.3%) | 10,996 (70.4%) |
| Bottled, Tank, or LP Gas | 843 (1.6%) | 234 (1.5%) |
| Electricity | 2,676 (5.1%) | 3,999 (25.6%) |
| Fuel Oil or Kerosene | 43 (0.1%) | 67 (0.4%) |
| Coal or Coke | 0 (0.0%) | 0 (0.0%) |
| All other Fuels | 305 (0.6%) | 185 (1.2%) |
| No Fuel Used | 144 (0.3%) | 144 (0.9%) |
| Total | 52,320 (100.0%) | 15,625 (100.0%) |
Household Vehicle Usage in Porter County
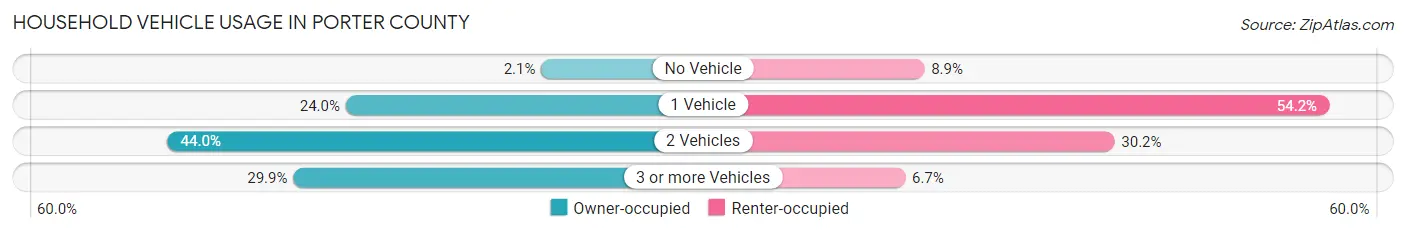
| Vehicles per Household | Owner-occupied | Renter-occupied |
| No Vehicle | 1,107 (2.1%) | 1,387 (8.9%) |
| 1 Vehicle | 12,567 (24.0%) | 8,471 (54.2%) |
| 2 Vehicles | 23,004 (44.0%) | 4,715 (30.2%) |
| 3 or more Vehicles | 15,642 (29.9%) | 1,052 (6.7%) |
| Total | 52,320 (100.0%) | 15,625 (100.0%) |
Real Estate & Mortgages in Porter County
Real Estate and Mortgage Overview in Porter County
| Characteristic | Without Mortgage | With Mortgage |
| Housing Units | 17,542 | 34,778 |
| Median Property Value | $219,800 | $251,700 |
| Median Household Income | $68,609 | $9,774 |
| Monthly Housing Costs | $557 | $1,929 |
| Real Estate Taxes | $1,922 | $410 |
Property Value by Mortgage Status in Porter County
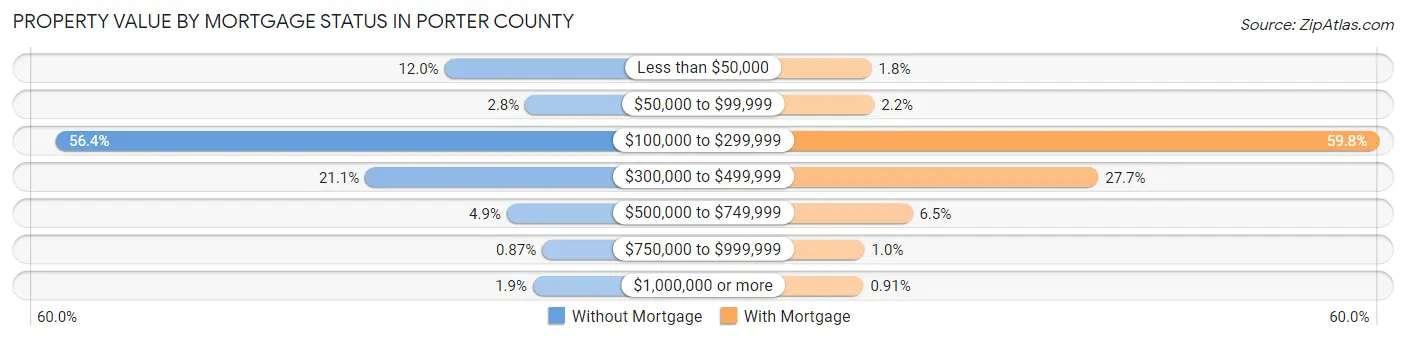
| Property Value | Without Mortgage | With Mortgage |
| Less than $50,000 | 2,108 (12.0%) | 639 (1.8%) |
| $50,000 to $99,999 | 491 (2.8%) | 749 (2.1%) |
| $100,000 to $299,999 | 9,894 (56.4%) | 20,807 (59.8%) |
| $300,000 to $499,999 | 3,701 (21.1%) | 9,646 (27.7%) |
| $500,000 to $749,999 | 860 (4.9%) | 2,260 (6.5%) |
| $750,000 to $999,999 | 152 (0.9%) | 361 (1.0%) |
| $1,000,000 or more | 336 (1.9%) | 316 (0.9%) |
| Total | 17,542 (100.0%) | 34,778 (100.0%) |
Household Income by Mortgage Status in Porter County
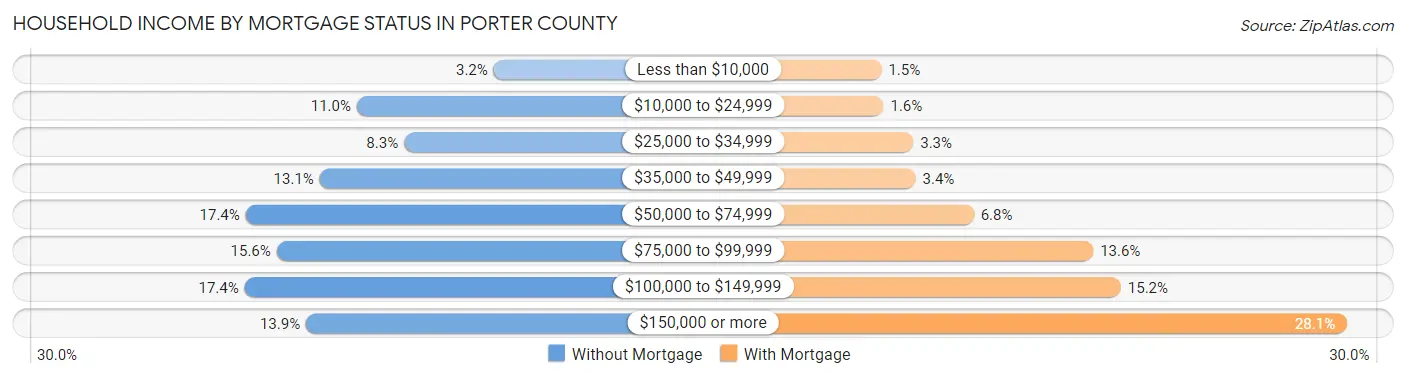
| Household Income | Without Mortgage | With Mortgage |
| Less than $10,000 | 561 (3.2%) | 515 (1.5%) |
| $10,000 to $24,999 | 1,933 (11.0%) | 556 (1.6%) |
| $25,000 to $34,999 | 1,460 (8.3%) | 1,146 (3.3%) |
| $35,000 to $49,999 | 2,305 (13.1%) | 1,193 (3.4%) |
| $50,000 to $74,999 | 3,047 (17.4%) | 2,347 (6.8%) |
| $75,000 to $99,999 | 2,737 (15.6%) | 4,723 (13.6%) |
| $100,000 to $149,999 | 3,058 (17.4%) | 5,272 (15.2%) |
| $150,000 or more | 2,441 (13.9%) | 9,767 (28.1%) |
| Total | 17,542 (100.0%) | 34,778 (100.0%) |
Property Value to Household Income Ratio in Porter County
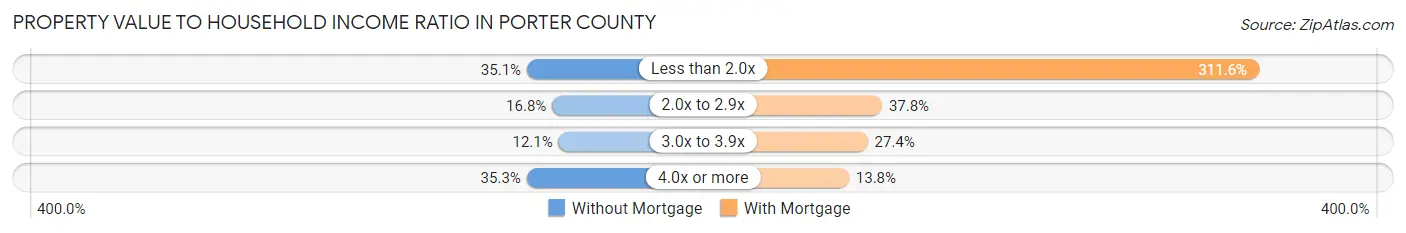
| Value-to-Income Ratio | Without Mortgage | With Mortgage |
| Less than 2.0x | 6,159 (35.1%) | 108,374 (311.6%) |
| 2.0x to 2.9x | 2,939 (16.8%) | 13,143 (37.8%) |
| 3.0x to 3.9x | 2,127 (12.1%) | 9,523 (27.4%) |
| 4.0x or more | 6,189 (35.3%) | 4,781 (13.8%) |
| Total | 17,542 (100.0%) | 34,778 (100.0%) |
Real Estate Taxes by Mortgage Status in Porter County
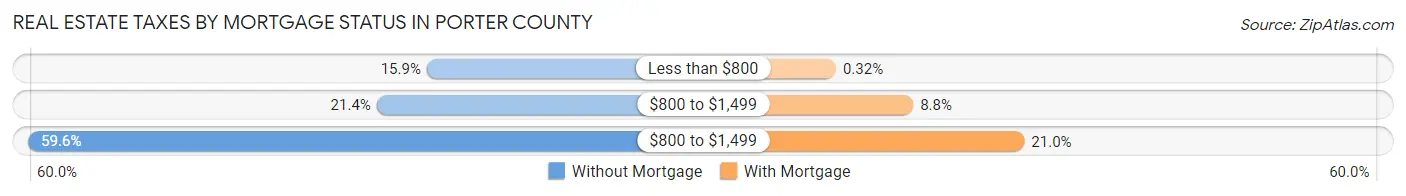
| Property Taxes | Without Mortgage | With Mortgage |
| Less than $800 | 2,794 (15.9%) | 112 (0.3%) |
| $800 to $1,499 | 3,758 (21.4%) | 3,057 (8.8%) |
| $800 to $1,499 | 10,457 (59.6%) | 7,293 (21.0%) |
| Total | 17,542 (100.0%) | 34,778 (100.0%) |
Health & Disability in Porter County
Health Insurance Coverage by Age in Porter County
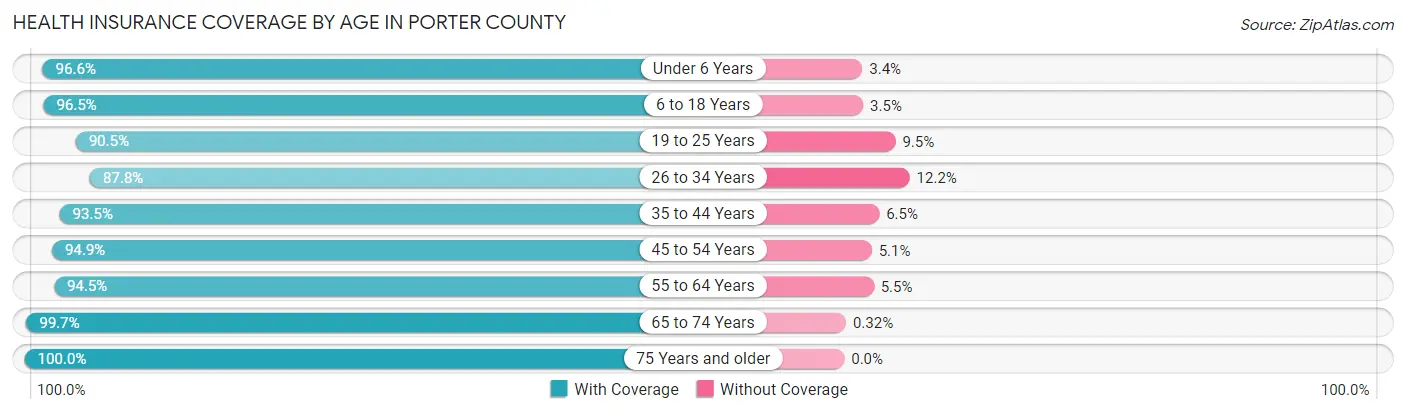
| Age Bracket | With Coverage | Without Coverage |
| Under 6 Years | 10,414 (96.6%) | 363 (3.4%) |
| 6 to 18 Years | 27,878 (96.5%) | 1,018 (3.5%) |
| 19 to 25 Years | 14,059 (90.5%) | 1,482 (9.5%) |
| 26 to 34 Years | 16,251 (87.8%) | 2,256 (12.2%) |
| 35 to 44 Years | 21,814 (93.5%) | 1,518 (6.5%) |
| 45 to 54 Years | 20,979 (94.9%) | 1,130 (5.1%) |
| 55 to 64 Years | 22,492 (94.5%) | 1,305 (5.5%) |
| 65 to 74 Years | 17,836 (99.7%) | 57 (0.3%) |
| 75 Years and older | 10,841 (100.0%) | 0 (0.0%) |
| Total | 162,564 (94.7%) | 9,129 (5.3%) |
Health Insurance Coverage by Citizenship Status in Porter County
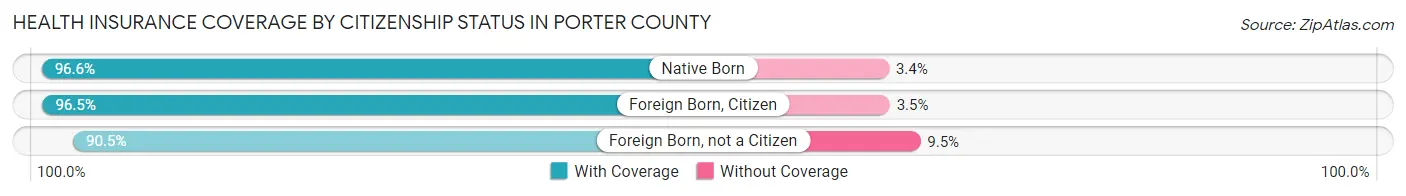
| Citizenship Status | With Coverage | Without Coverage |
| Native Born | 10,414 (96.6%) | 363 (3.4%) |
| Foreign Born, Citizen | 27,878 (96.5%) | 1,018 (3.5%) |
| Foreign Born, not a Citizen | 14,059 (90.5%) | 1,482 (9.5%) |
Health Insurance Coverage by Household Income in Porter County
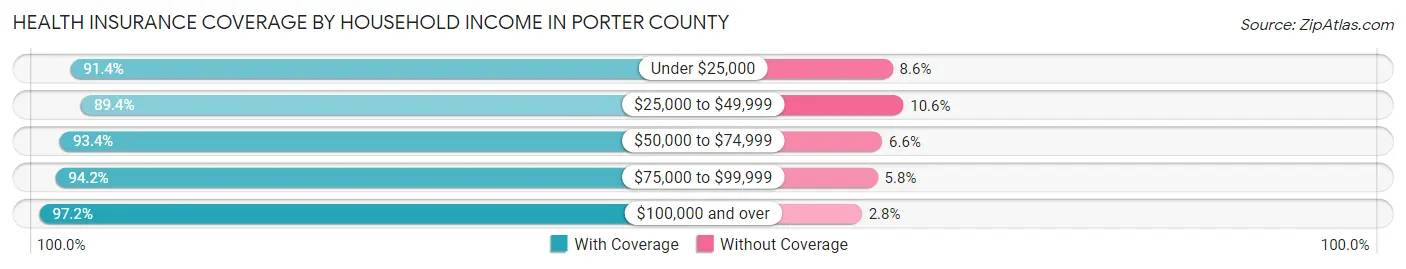
| Household Income | With Coverage | Without Coverage |
| Under $25,000 | 13,273 (91.4%) | 1,247 (8.6%) |
| $25,000 to $49,999 | 20,338 (89.4%) | 2,408 (10.6%) |
| $50,000 to $74,999 | 22,452 (93.4%) | 1,594 (6.6%) |
| $75,000 to $99,999 | 23,888 (94.2%) | 1,465 (5.8%) |
| $100,000 and over | 80,596 (97.2%) | 2,324 (2.8%) |
Public vs Private Health Insurance Coverage by Age in Porter County
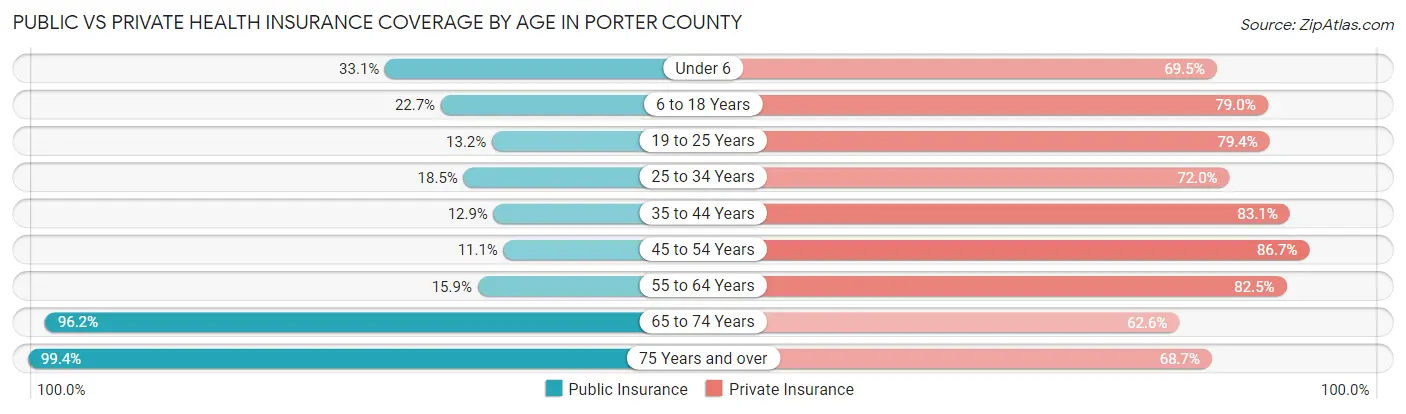
| Age Bracket | Public Insurance | Private Insurance |
| Under 6 | 3,565 (33.1%) | 7,494 (69.5%) |
| 6 to 18 Years | 6,566 (22.7%) | 22,832 (79.0%) |
| 19 to 25 Years | 2,055 (13.2%) | 12,339 (79.4%) |
| 25 to 34 Years | 3,424 (18.5%) | 13,315 (72.0%) |
| 35 to 44 Years | 3,016 (12.9%) | 19,391 (83.1%) |
| 45 to 54 Years | 2,448 (11.1%) | 19,178 (86.7%) |
| 55 to 64 Years | 3,781 (15.9%) | 19,637 (82.5%) |
| 65 to 74 Years | 17,219 (96.2%) | 11,204 (62.6%) |
| 75 Years and over | 10,774 (99.4%) | 7,445 (68.7%) |
| Total | 52,848 (30.8%) | 132,835 (77.4%) |
Disability Status by Sex by Age in Porter County
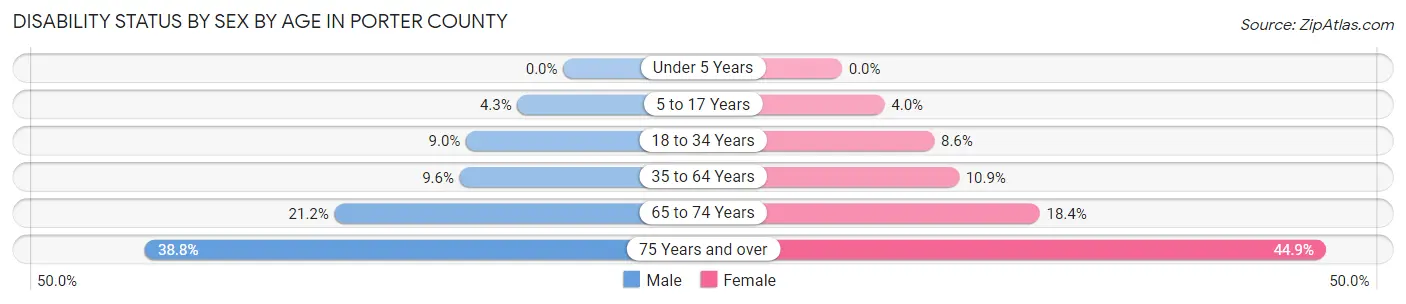
| Age Bracket | Male | Female |
| Under 5 Years | 0 (0.0%) | 0 (0.0%) |
| 5 to 17 Years | 625 (4.3%) | 549 (4.0%) |
| 18 to 34 Years | 1,653 (9.0%) | 1,533 (8.6%) |
| 35 to 64 Years | 3,315 (9.6%) | 3,769 (10.8%) |
| 65 to 74 Years | 1,840 (21.2%) | 1,693 (18.3%) |
| 75 Years and over | 1,744 (38.8%) | 2,851 (44.9%) |
Disability Class by Sex by Age in Porter County
Disability Class: Hearing Difficulty
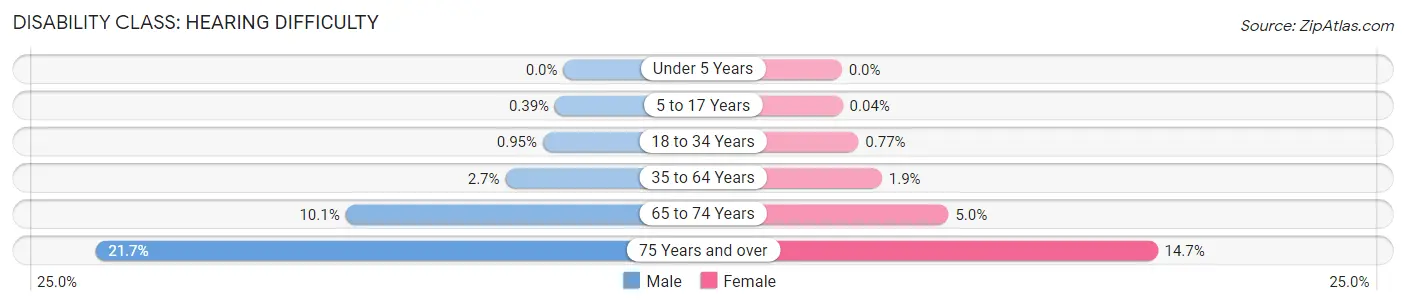
| Age Bracket | Male | Female |
| Under 5 Years | 0 (0.0%) | 0 (0.0%) |
| 5 to 17 Years | 58 (0.4%) | 5 (0.0%) |
| 18 to 34 Years | 175 (0.9%) | 137 (0.8%) |
| 35 to 64 Years | 928 (2.7%) | 646 (1.9%) |
| 65 to 74 Years | 876 (10.1%) | 457 (5.0%) |
| 75 Years and over | 976 (21.7%) | 930 (14.6%) |
Disability Class: Vision Difficulty
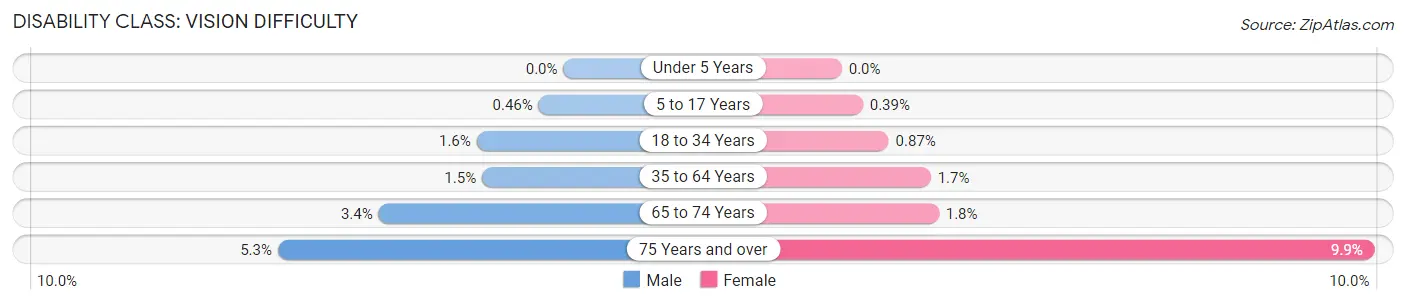
| Age Bracket | Male | Female |
| Under 5 Years | 0 (0.0%) | 0 (0.0%) |
| 5 to 17 Years | 68 (0.5%) | 54 (0.4%) |
| 18 to 34 Years | 296 (1.6%) | 155 (0.9%) |
| 35 to 64 Years | 522 (1.5%) | 573 (1.7%) |
| 65 to 74 Years | 297 (3.4%) | 166 (1.8%) |
| 75 Years and over | 238 (5.3%) | 628 (9.9%) |
Disability Class: Cognitive Difficulty
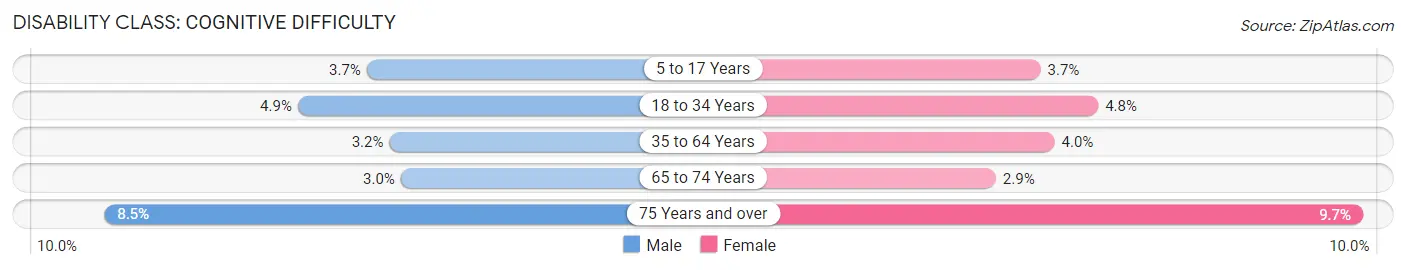
| Age Bracket | Male | Female |
| 5 to 17 Years | 537 (3.6%) | 513 (3.7%) |
| 18 to 34 Years | 903 (4.9%) | 852 (4.8%) |
| 35 to 64 Years | 1,114 (3.2%) | 1,371 (4.0%) |
| 65 to 74 Years | 262 (3.0%) | 264 (2.9%) |
| 75 Years and over | 383 (8.5%) | 614 (9.7%) |
Disability Class: Ambulatory Difficulty
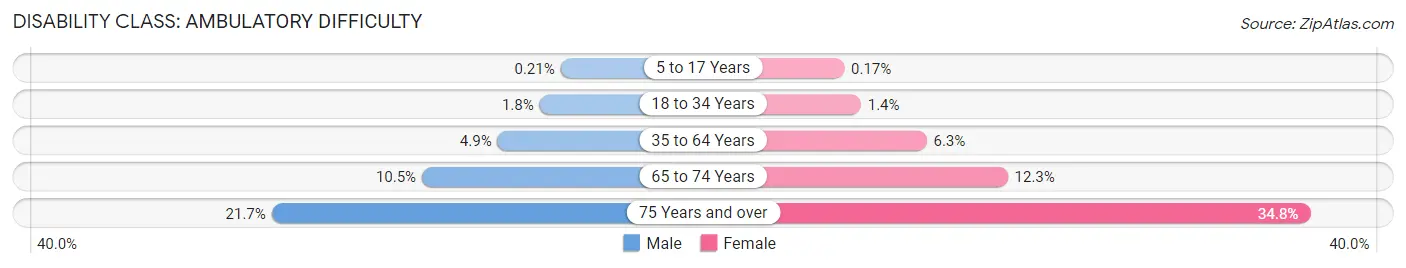
| Age Bracket | Male | Female |
| 5 to 17 Years | 31 (0.2%) | 24 (0.2%) |
| 18 to 34 Years | 324 (1.8%) | 252 (1.4%) |
| 35 to 64 Years | 1,688 (4.9%) | 2,184 (6.3%) |
| 65 to 74 Years | 910 (10.5%) | 1,136 (12.3%) |
| 75 Years and over | 973 (21.7%) | 2,207 (34.8%) |
Disability Class: Self-Care Difficulty
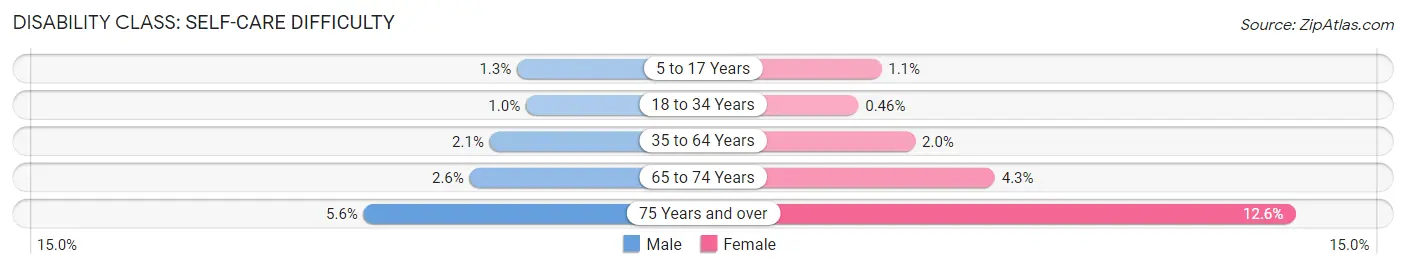
| Age Bracket | Male | Female |
| 5 to 17 Years | 190 (1.3%) | 153 (1.1%) |
| 18 to 34 Years | 191 (1.0%) | 83 (0.5%) |
| 35 to 64 Years | 709 (2.1%) | 709 (2.0%) |
| 65 to 74 Years | 226 (2.6%) | 393 (4.3%) |
| 75 Years and over | 250 (5.6%) | 801 (12.6%) |
Technology Access in Porter County
Computing Device Access in Porter County
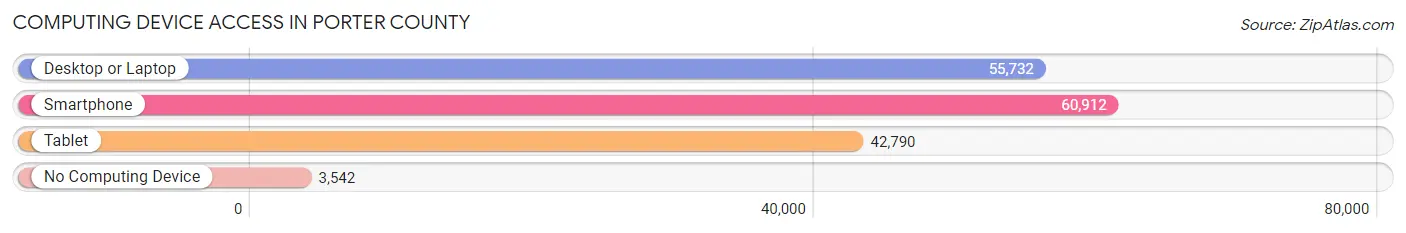
| Device Type | # Households | % Households |
| Desktop or Laptop | 55,732 | 82.0% |
| Smartphone | 60,912 | 89.6% |
| Tablet | 42,790 | 63.0% |
| No Computing Device | 3,542 | 5.2% |
| Total | 67,945 | 100.0% |
Internet Access in Porter County
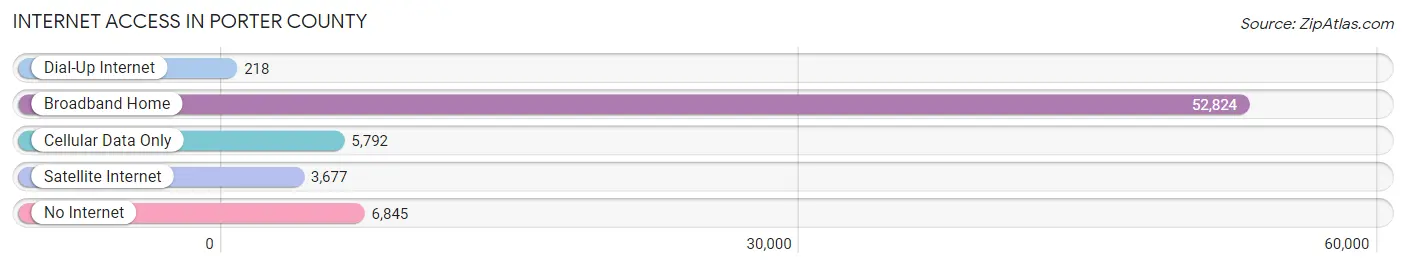
| Internet Type | # Households | % Households |
| Dial-Up Internet | 218 | 0.3% |
| Broadband Home | 52,824 | 77.7% |
| Cellular Data Only | 5,792 | 8.5% |
| Satellite Internet | 3,677 | 5.4% |
| No Internet | 6,845 | 10.1% |
| Total | 67,945 | 100.0% |
Porter County Summary
Porter County is a county located in the U.S. state of Indiana. As of the 2010 census, the population was 164,343. The county seat is Valparaiso. It is the third-most populous county in Indiana, after Marion and Lake counties. Porter County is included in the Northwest Indiana region of the Chicago metropolitan area.
History
Porter County was formed in 1836 from a portion of LaPorte County. It was named for Capt. David Porter, an officer in the War of 1812. The county seat was originally located in Valparaiso, but was moved to Porterville in 1837. In 1856, the county seat was moved back to Valparaiso.
The county was home to several Native American tribes, including the Potawatomi, Miami, and Kickapoo. The first non-Native American settlers arrived in the early 1830s. The county was organized in 1836 and the first county courthouse was built in 1837.
Geography
Porter County is located in the northwest corner of Indiana, along the Illinois border. It is bordered by Lake County to the east, LaPorte County to the south, and Jasper and Newton counties to the west. The Kankakee River forms the northern border of the county.
The county has a total area of 521 square miles, of which 517 square miles is land and 4.2 square miles is water. The highest point in the county is located in the Kankakee River Valley, at an elevation of 810 feet.
Economy
Porter County has a diverse economy, with a mix of manufacturing, agriculture, and service industries. The county is home to several large employers, including the U.S. Steel plant in Portage, the BP refinery in Whiting, and the ArcelorMittal steel mill in Burns Harbor.
Agriculture is an important part of the county's economy, with corn, soybeans, and wheat being the primary crops. Livestock production is also important, with dairy and beef cattle being the primary animals raised.
The county is also home to several tourist attractions, including the Indiana Dunes National Lakeshore, the Indiana Dunes State Park, and the Porter County Fairgrounds.
Demographics
As of the 2010 census, there were 164,343 people, 63,945 households, and 43,945 families residing in the county. The population density was 317.7 people per square mile. There were 68,945 housing units at an average density of 133.7 per square mile.
The racial makeup of the county was 87.3% White, 6.7% African American, 0.4% Native American, 1.7% Asian, 0.1% Pacific Islander, 1.7% from other races, and 2.1% from two or more races. Hispanic or Latino of any race were 5.2% of the population.
The median income for a household in the county was $50,945, and the median income for a family was $62,945. The per capita income for the county was $25,945. About 6.7% of families and 9.2% of the population were below the poverty line, including 12.2% of those under age 18 and 6.2% of those age 65 or over.
Common Questions
What is the Total Population of Porter County?
Total Population of Porter County is 173,355.
What is the Total Male Population of Porter County?
Total Male Population of Porter County is 86,060.
What is the Total Female Population of Porter County?
Total Female Population of Porter County is 87,295.
What is the Ratio of Males per 100 Females in Porter County?
There are 98.59 Males per 100 Females in Porter County.
What is the Ratio of Females per 100 Males in Porter County?
There are 101.44 Females per 100 Males in Porter County.
What is the Median Population Age in Porter County?
Median Population Age in Porter County is 40.1 Years.
What is the Average Family Size in Porter County
Average Family Size in Porter County is 3.0 People.
What is the Average Household Size in Porter County
Average Household Size in Porter County is 2.5 People.
What is Per Capita Income in Porter County?
Per Capita income in Porter County is $40,792.
What is the Median Family Income in Porter County?
Median Family Income in Porter County is $98,081.
What is the Median Household income in Porter County?
Median Household Income in Porter County is $82,915.
What is Income or Wage Gap in Porter County?
Income or Wage Gap in Porter County is 43.8%.
Women in Porter County earn 56.2 cents for every dollar earned by a man.
What is Family Income Deficit in Porter County?
Family Income Deficit in Porter County is $10,032.
Families that are below poverty line in Porter County earn $10,032 less on average than the poverty threshold level.
What is Inequality or Gini Index in Porter County?
Inequality or Gini Index in Porter County is 0.43.
How Large is the Labor Force in Porter County?
There are 87,314 People in the Labor Forcein in Porter County.
What is the Percentage of People in the Labor Force in Porter County?
62.1% of People are in the Labor Force in Porter County.
What is the Unemployment Rate in Porter County?
Unemployment Rate in Porter County is 4.2%.